Embed Size (px)
Citation preview

How Beams Work, IStatics and Strength of Materials

Beams work by transferring transverse loads along their length to their supports primarily by resisting a force called internal bending moment.
HOW BEAMS WORK

joistsclosely spaced beams supporting �oors and roofs
lintelsbeams over masonry wall openings
spandrel beamssupporting exterior walls and sometimes the �oors
stringersbridge beams parallel to the roadway
�oor beamslarge beams perpendicular to the roadway that transfer loads from the stringers to the supporting trusses or girders
girderlarge beam into which other beams are framed
BEAM TYPES : FUNCTIONAL DISTINCTION
“transfer beam/girder”
spandrel
lintel

BENDING OVERVIEW
What are the forces the member must resist? Primarily “bending,” which is a combination of:
1) A “force couple” of tension and compression2) Shear (vertical and horizontal)3) Torsion4) Bearing
Factors that in�uence beam strength
GEOMETRY1) length (”span”) of beam2) depth of beam3) shape of cross section
MATERIAL1) modulus of elasticity2) failure/yield stress
DESIGN FACTORS1) Internal Bending Moment2) Horizontal Shear3) Vertical Shear4) Bearing5) Torsion6) Loading conditions7) Support and bracing conditions
BEAM THEORY
Transfer transverse loads to supports...
L = “span” of the beam
P
d = “depth” of the beam
BEAM THEORY
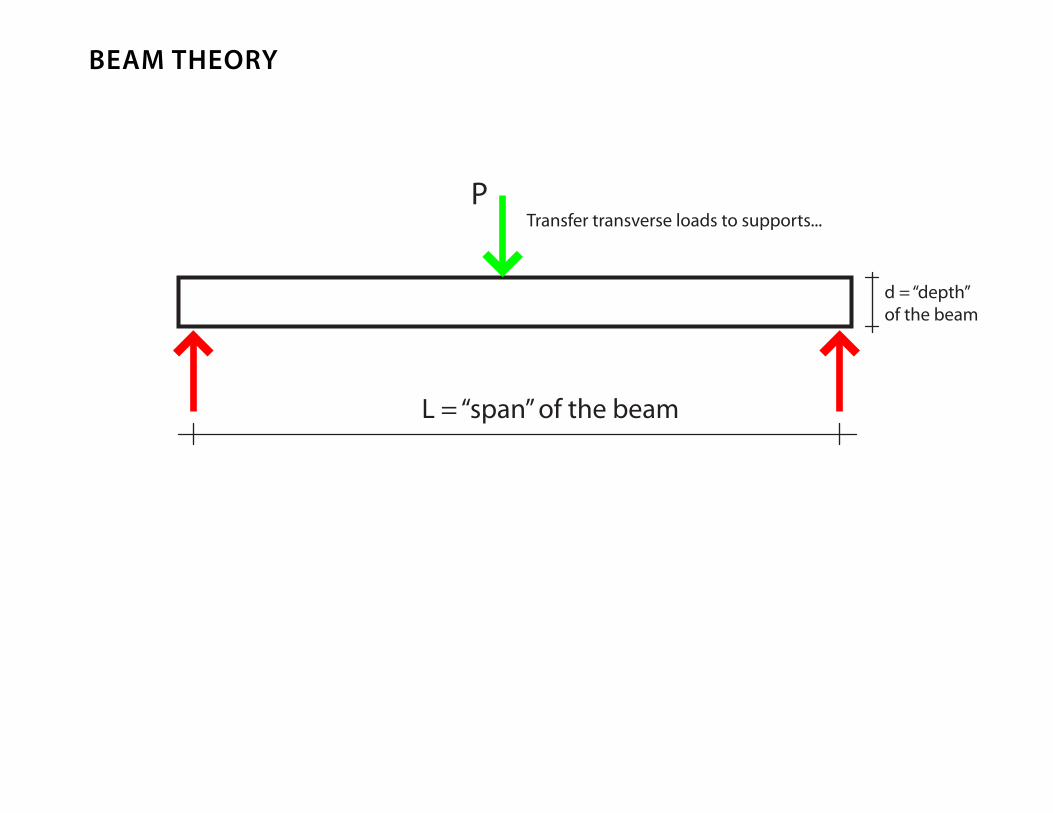
neutral axis
Section rotates
One model of describing beam action is to divide the beam into segments and discuss the motion of a single segment as the beam deforms.
As we observe the deformation of a single segment, we notice that the top side of each segment is squeezed and the bottom side spreads.
Take a simply supported beam under load...
Because, for the elastic range of the material, stress and strain are directly related, we can conclude that where deformation (strain) is present, the analogous stress is also present. Thus, the top is in compression, and the bottom in tension.
Compressive stressesNeutral axis = no tensile or compressive stresses
Tensile stresses
BEAM THEORY
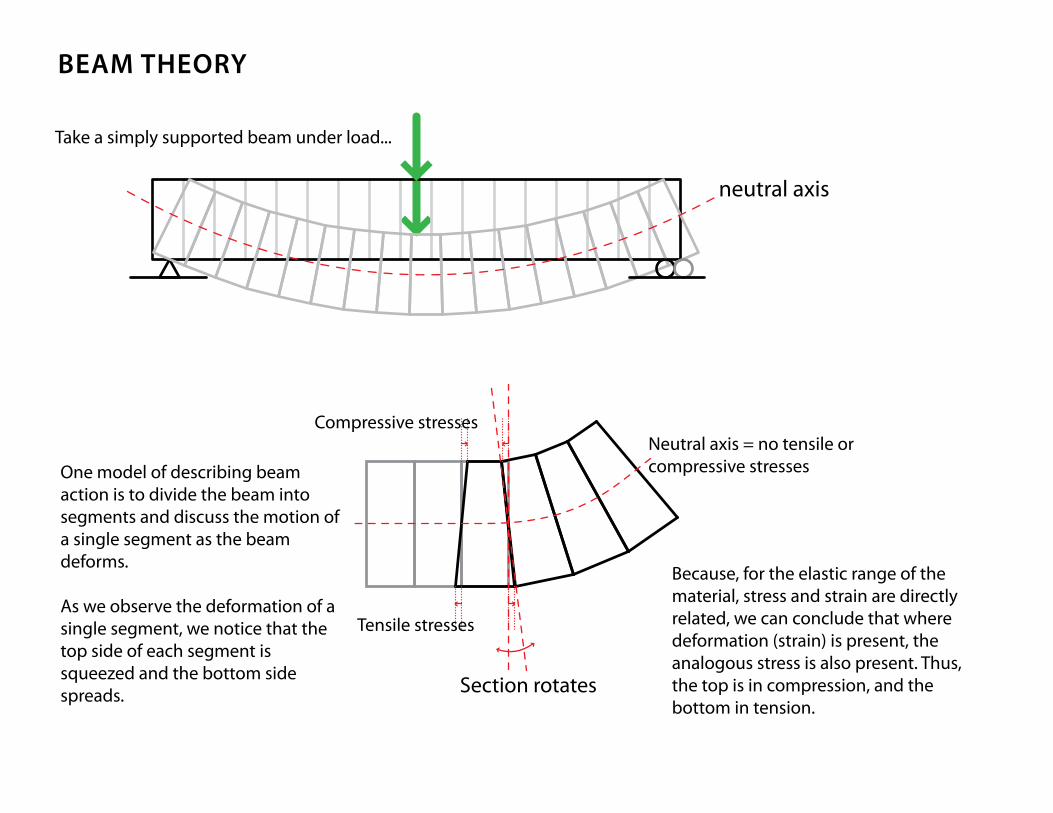
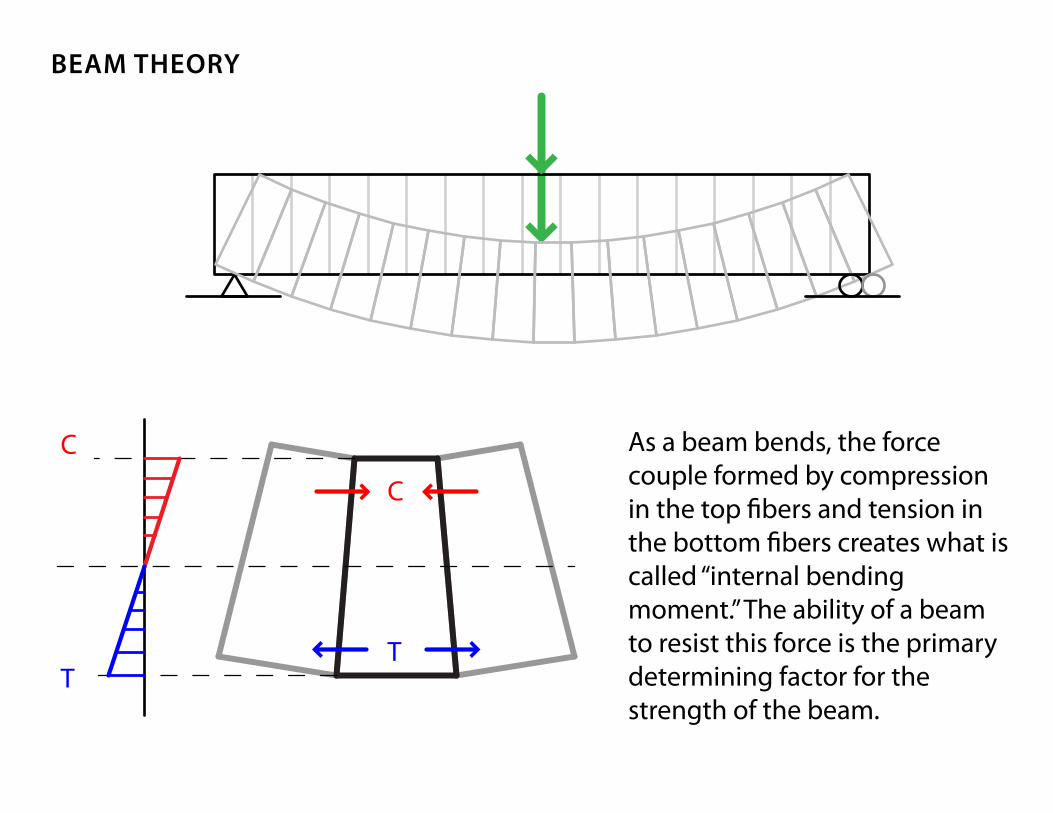
C
T
C
T
As a beam bends, the force couple formed by compression in the top �bers and tension in the bottom �bers creates what is called “internal bending moment.” The ability of a beam to resist this force is the primary determining factor for the strength of the beam.
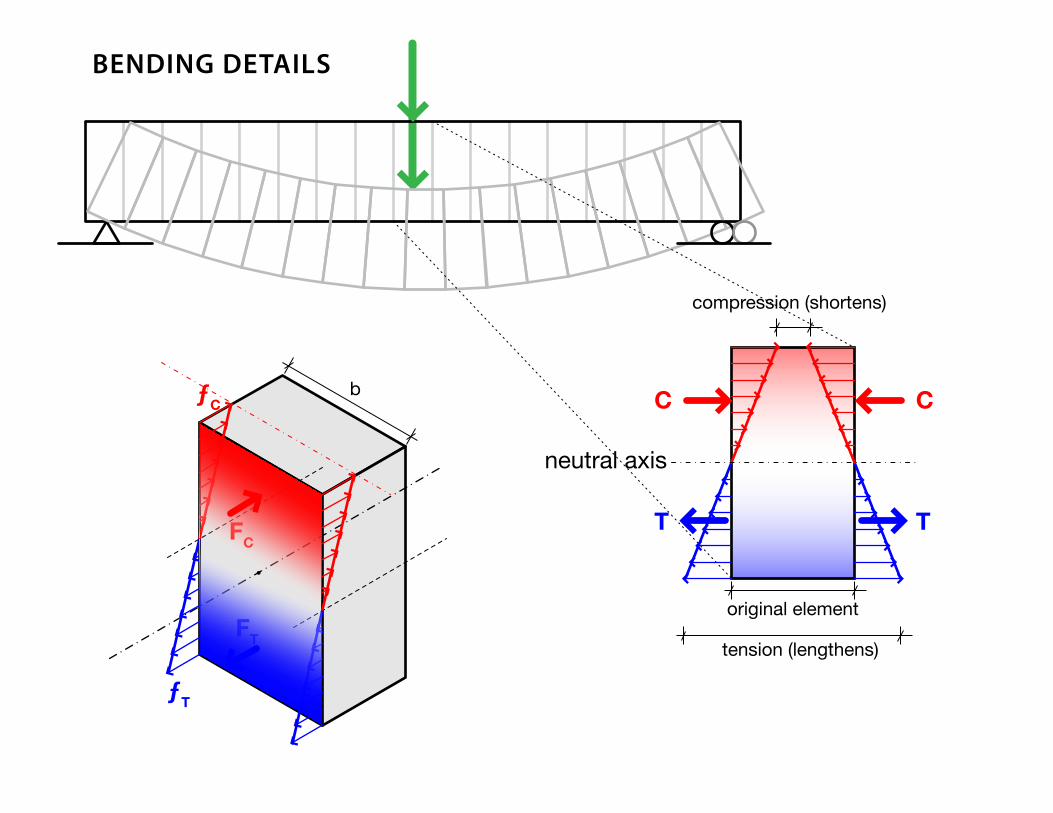
BENDING DETAILS
original element
tension (lengthens)
compression (shortens)
neutral axis
TT
CCb
FT
ƒT
FC
ƒC

INTERNAL SHEARvertical shear
PV
P
vertical shear
horizontal shear

MODES OF FAILURE
“compression �ange”
“tension �ange”
Lateral buckling occurs when the compression �ange buckles like a column. The e�ect is the beam twisting on its axis.
What are the modes of failure for each one of those forces?
1) Bending failure (local buckling, tension failure)2) Shear (horizontal shear failure)3) Torsion (lateral buckling)4) Bearing failure (at support or point loads)

30’ span
V
500 lbs
500 lbs
-500 lbs
500 lbs
d
SHEAR AND MOMENT DIAGRAMS
M
7500 ft·lb
1000 lbsGraphic representations of the magnitudes of internal forces (vertical shear and internal bend-ing moment) along the length of a beam.

30’ span
V
500 lbs
500 lbs
500 lbs
d
500 lbs
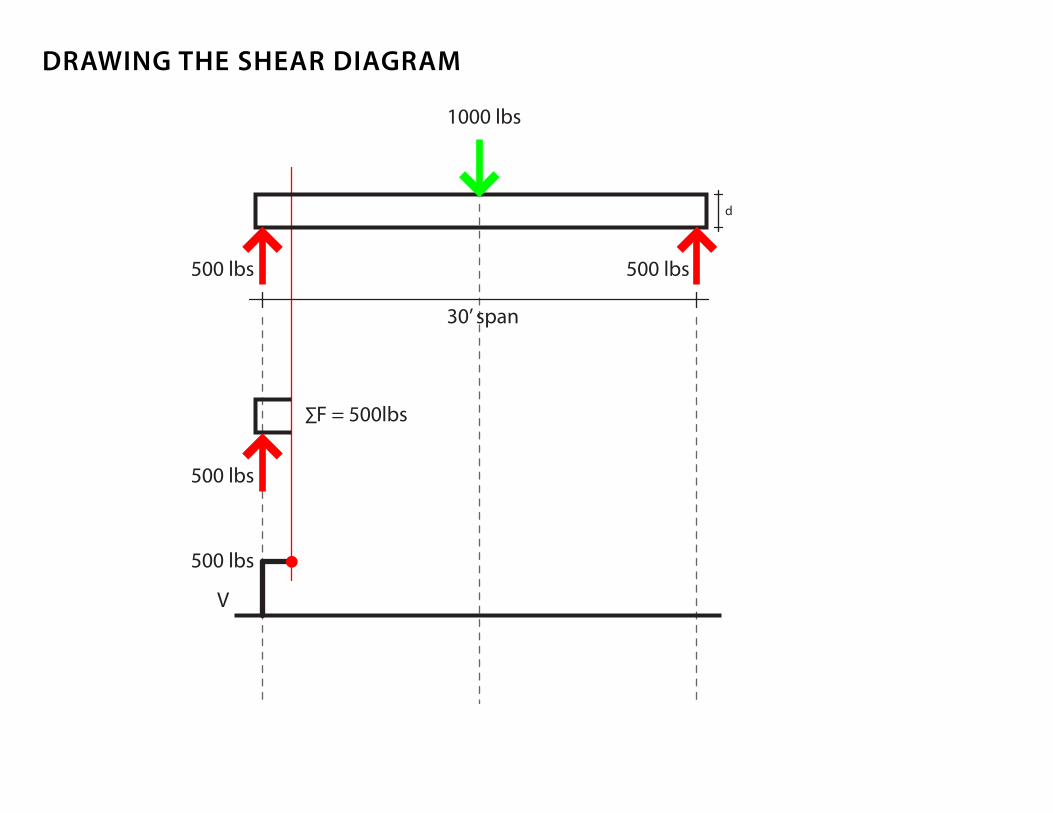
∑F = 500lbs
1000 lbs
DRAWING THE SHEAR DIAGRAM
∑F = 500lbs
30’ span
V
500 lbs
500 lbs
500 lbs
d
500 lbs
1000 lbs
DRAWING THE SHEAR DIAGRAM
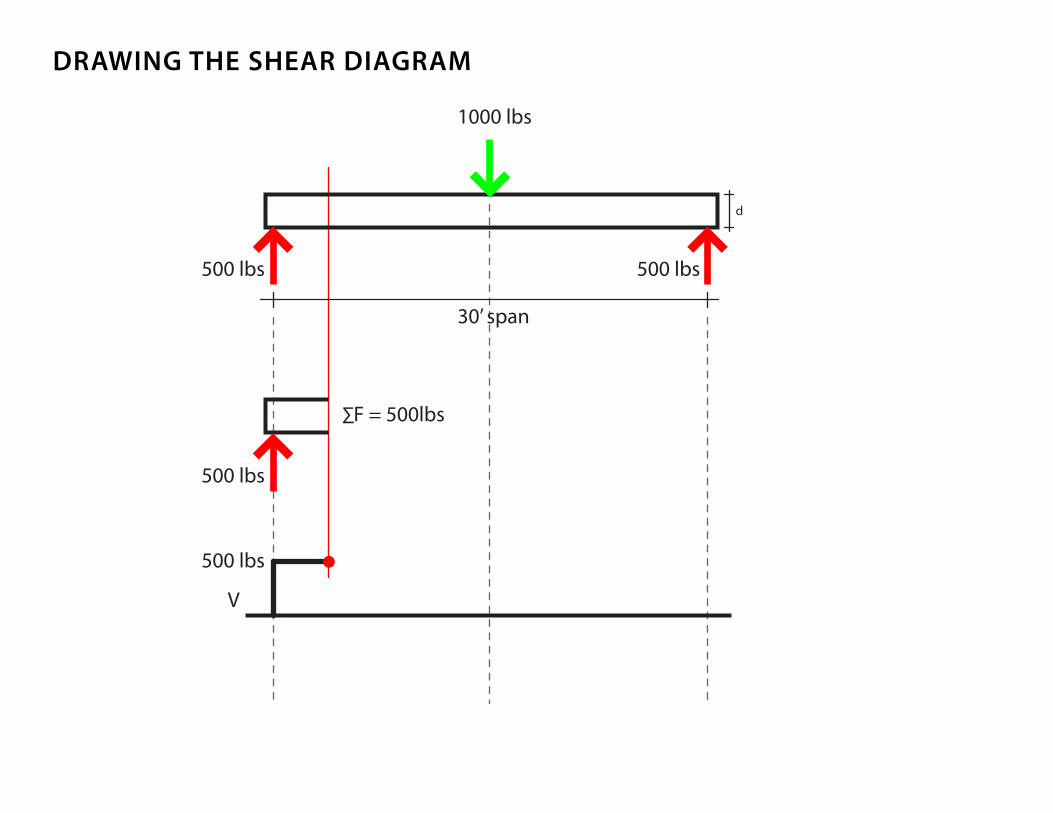
∑F = 500lbs
30’ span
V
500 lbs
500 lbs
500 lbs
d
500 lbs
1000 lbs
DRAWING THE SHEAR DIAGRAM

∑F = 500lbs
30’ span
V
500 lbs
500 lbs
500 lbs
d
500 lbs
1000 lbs
DRAWING THE SHEAR DIAGRAM

∑F = -500lbs
30’ span
V
500 lbs
500 lbs
-500 lbs
500 lbs
d
500 lbs
-1000 lbs
DRAWING THE SHEAR DIAGRAM

∑F = -500lbs
30’ span
V
500 lbs
500 lbs
-500 lbs
500 lbs
d
500 lbs
-1000 lbs
DRAWING THE SHEAR DIAGRAM

∑F = 0
30’ span
V
500 lbs
500 lbs
0 lbs
500 lbs
d
500 lbs 500 lbs
-1000 lbs
DRAWING THE SHEAR DIAGRAM

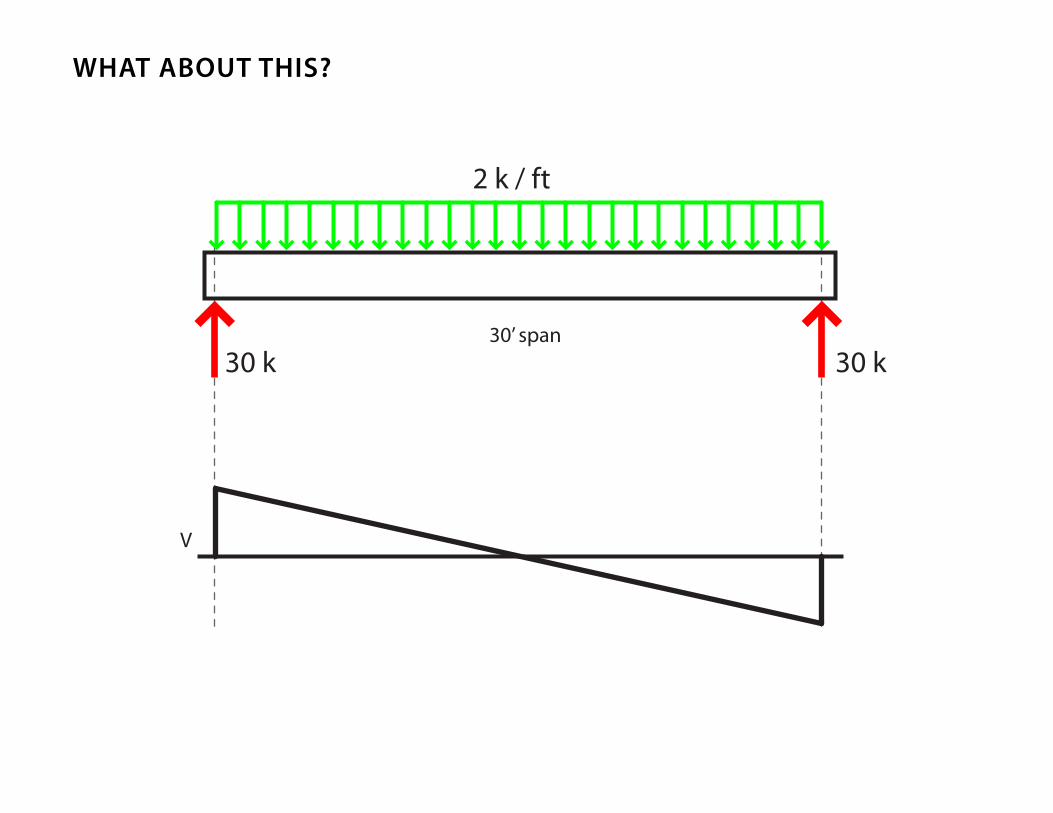
30’ span
2 k / ft
V
WHAT ABOUT THIS?
?
30’ span
2 k / ft
30 k 30 k
V
WHAT ABOUT THIS?

500 lbs 2’
M = Fd
DRAWING THE MOMENT DIAGRAM
30’ span
2’
V
500 lbs
500 lbs
-500 lbs
500 lbs
d
MM = Fd = 500·2’ = 1000 ft·lb
1000 lbs
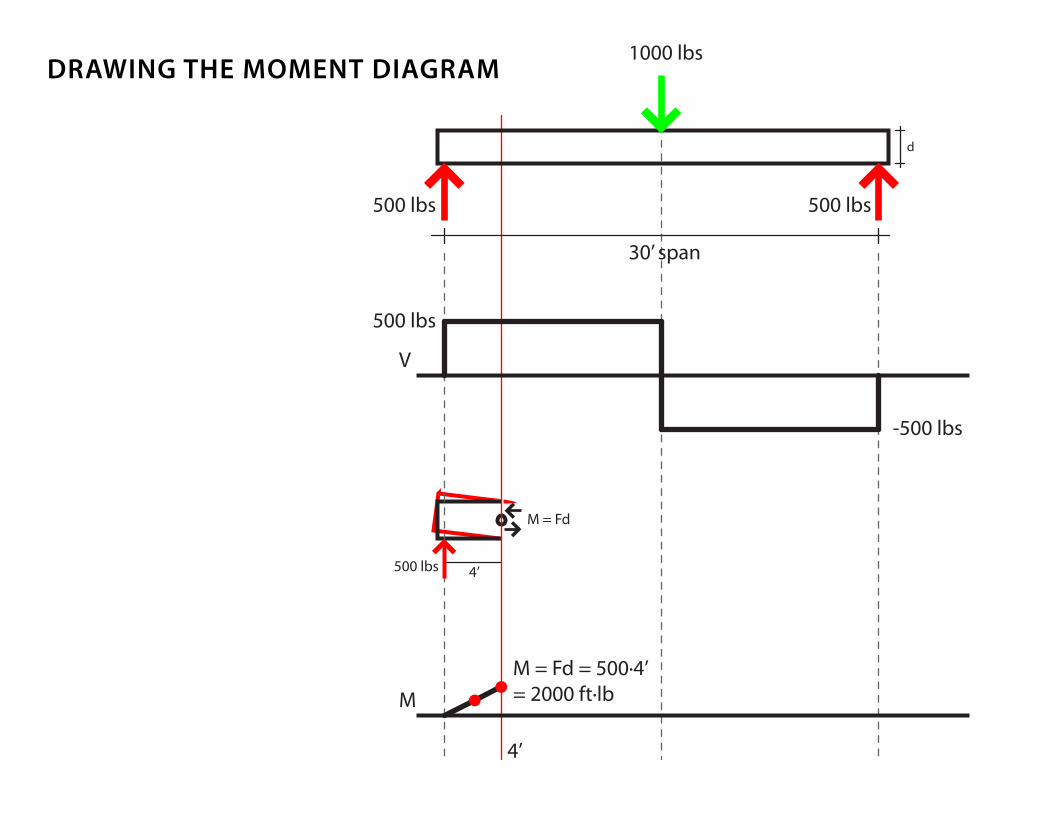
500 lbs 4’
M = Fd
DRAWING THE MOMENT DIAGRAM
30’ span
4’
V
500 lbs
500 lbs
-500 lbs
500 lbs
d
MM = Fd = 500·4’ = 2000 ft·lb
1000 lbs

500 lbs 15’
M = Fd
DRAWING THE MOMENT DIAGRAM
30’ span
15’
V
500 lbs
500 lbs
-500 lbs
500 lbs
d
M
M = Fd = 500·15’ = 7500 ft·lb
1000 lbs
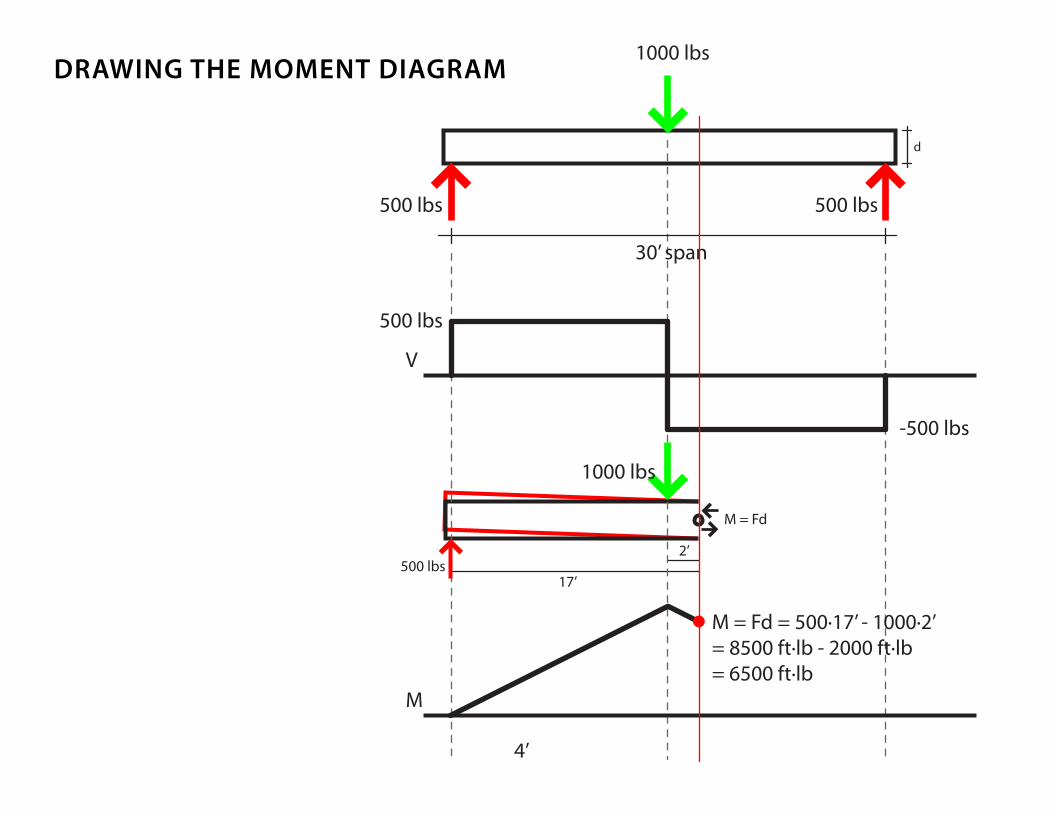
500 lbs17’
2’
M = Fd
DRAWING THE MOMENT DIAGRAM
30’ span
4’
V
500 lbs
500 lbs
-500 lbs
500 lbs
d
M
M = Fd = 500·17’ - 1000·2’ = 8500 ft·lb - 2000 ft·lb = 6500 ft·lb
1000 lbs
1000 lbs

30’ span
V
500 lbs
500 lbs
-500 lbs
500 lbs
d
FINAL SHEAR AND MOMENT DIAGRAMS
M
7500 ft·lb
1000 lbs

?
30’ span
2 k / ft
30 k 30 k
V
M
WHAT ABOUT THIS?

30’ span
2 k / ft
30 k 30 k
V
M
WHAT ABOUT THIS?

V
M
RULES FOR DRAWING SHEAR AND MOMENT DIAGRAMS
The value of the shear diagram is the slope of the moment diagram at that point.
Point loads make the shear diagram jump up or down.
The shear diagram is �at when there is no increase in load from left to right.
The moment diagram �attens out where the shear diagram is 0.
Uniformly distributed loads make parabolas in the moment diagram and downward sloping lines in the shear diagram.
Point loads make peaks in the moment diagram.
rise
run
Generally draw from left to right.
Start by drawing the free body diagram of the beam, with all loads and reactions. Drop lines at each.
Always draw the complete shear diagram �rst.