Embed Size (px)
Citation preview

How bad is it? The Student Loan Default Crisis in
Perspective
October 7, 2013
L O U I S V I L L E . E D U
New Car or Debtor’s Prison?
How bad is it?

L O U I S V I L L E . E D U
Knowledge Survey
1) Most of the US population holds a student loan.
2) Among student loan holders, 40% owe less than $10,000.
3) Among student loan holders, student loan debt has increased faster than
other forms of debt (e.g., mortgages, credit cards) in the past 7 years.
4) Young (under 35) bachelor's degree holders, with relatively low incomes
and little wealth hold most of the student loan debt.
5) Young (under 35), bachelor's degree holders, with relatively high incomes
and little wealth pay a significantly greater proportion of their household
income to repay student loans today than they did almost 20 years ago,
How bad is it?

L O U I S V I L L E . E D U
Knowledge Survey
6) Under 40% of student loan holders in the 2005 cohort of college entrants
were in successful repayment in 2011.
7) Most student loan holders do not default on their loans.
8) Earning a credential has no effect on likelihood of repayment outcomes
(such as delinquency or default).
9) Women borrow more in student loans than men.
10) College is still worth it in terms of economic payoffs.
How bad is it?

L O U I S V I L L E . E D U
Debt
How bad is it?

L O U I S V I L L E . E D U
Non-mortgage Debt Balances
How bad is it?
Source: FRBNY Consumer Credit Panel/Equifaxhttp://www.newyorkfed.org/householdcredit/
L O U I S V I L L E . E D U
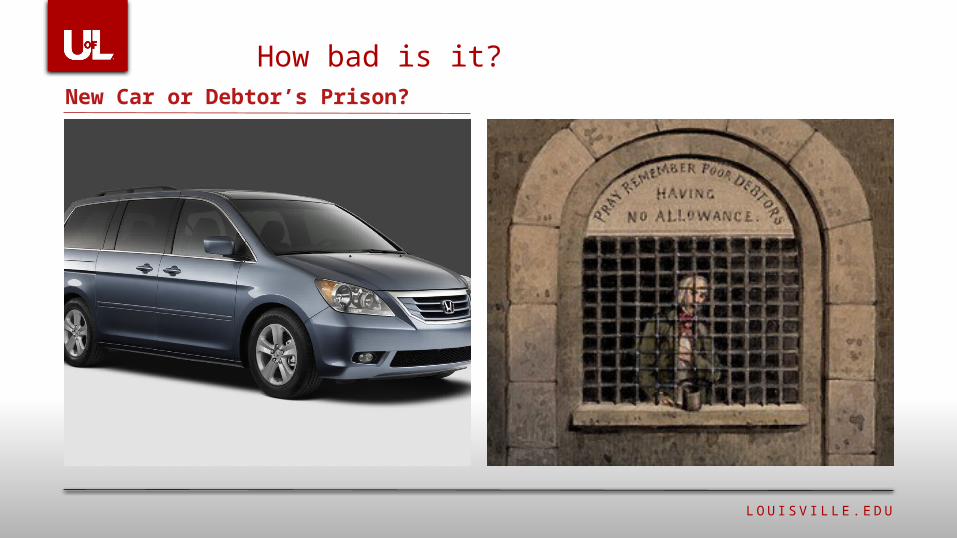
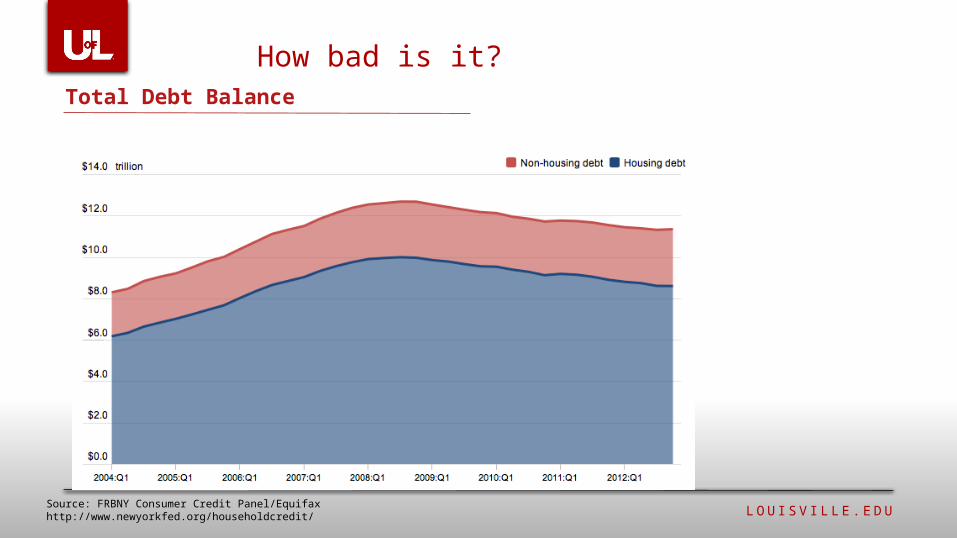
Total Debt Balance
How bad is it?
Source: FRBNY Consumer Credit Panel/Equifaxhttp://www.newyorkfed.org/householdcredit/
L O U I S V I L L E . E D U
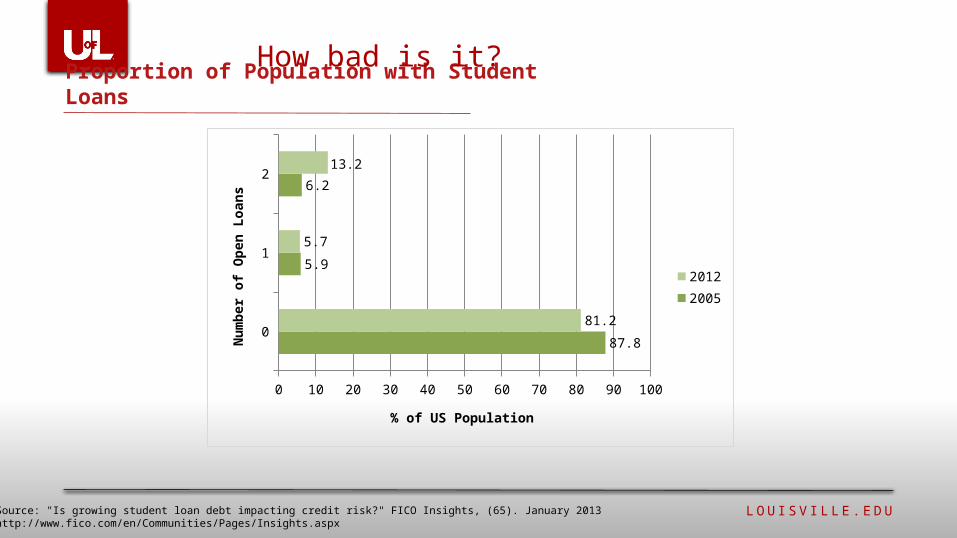
Proportion of Population with Student Loans
How bad is it?
0
1
2
0 10 20 30 40 50 60 70 80 90 100
87.8
5.9
6.2
81.2
5.7
13.2
20122005
% of US Population
Num
ber o
f Ope
n Lo
ans
Source: "Is growing student loan debt impacting credit risk?" FICO Insights, (65). January 2013 http://www.fico.com/en/Communities/Pages/Insights.aspx

L O U I S V I L L E . E D U
Comparison of Average Consumer Debt
How bad is it?
Debt 2005 2012 Change
Student loan $17,233 $27,253 58%
Credit card $5,815 $5,101 -12%
Mortgage $44,864 $49,545 10%
Auto $5,828 $5,729 -2%
All other $5,841 $4,629 -21%
Note: Among US consumers with at least one open student loanSource: "Is growing student loan debt impacting credit risk?" FICO Insights, (65).January 2013 http://www.fico.com/en/Communities/Pages/Insights.aspx

L O U I S V I L L E . E D U
Distribution of Student Loan Borrowing, Q4 2012
How bad is it?
Source: FRBNY Consumer Credit Panel/Equifaxhttp://www.newyorkfed.org/householdcredit/

L O U I S V I L L E . E D U
Median Debt
How bad is it?
Source: Pew Research Center tabulations of Survey of Consumer Finances data

L O U I S V I L L E . E D U
Share Having Debt
How bad is it?
Source: Pew Research Center tabulations of Survey of Consumer Finances data

L O U I S V I L L E . E D U
Repayment Outcomes
How bad is it?

L O U I S V I L L E . E D U
Repayment Outcomes
How bad is it?
Payment Outcome % Category %Repayment without event 37 37Deferment only (in-school enrollment) 7 23Deferment only (economic hardship) 4Forbearance only 6Forbearance and deferment 6 Delinquency only 5 26Delinquency and deferment 5Delinquency and forbearance 8Delinquency with deferment/forbearance 8 Default 15 15
Source: Institute for Higher Education Policy, "Delingquecy: The Untold Story of Student Loan Borrowing" (March 2011) http://www.ihep.org/assets/files/publications/a-f/Delinquency-The_Untold_Story_FINAL_March_2011.pdf

L O U I S V I L L E . E D U
Proportion of Consumers 90 days late on payment
How bad is it?
Credit Obligation
October 2005-2007
October 2010-2012
Change
Auto finance 6.6 7.6 15.2%Bankcard 14.4 4.2 -70.8%Mortgage 5.3 11.7 120.8%Student loan 17.0 25.1 47.6%
Note: Among US consumers with at least one open student loanSource: "Is growing student loan debt impacting credit risk?" FICO Insights, (65).January 2013 http://www.fico.com/en/Communities/Pages/Insights.aspx

L O U I S V I L L E . E D U
Repayment Outcome by Credential Status
How bad is it?
Payment Outcome No credential Credential All borrowersTimely repayment 26 48 35
Deferment/forbearance without delinquency
15 14 15
Delinquency without default 33 22 28Default 26 16 21
Source: Institute for Higher Education Policy, "Delingquecy: The Untold Story of Student Loan Borrowing" (March 2011) http://www.ihep.org/assets/files/publications/a-f/Delinquency-The_Untold_Story_FINAL_March_2011.pdf

L O U I S V I L L E . E D U
Repayment Outcomes by Institution Type
How bad is it?
Payment OutcomePublic 4yr Private 4yr Public 2yr Proprietary 2yr Proprietary 4yr
Timely repayment 45 53 24 32 35Deferment/forbearance, but not delinquent 21 20 16 5 12
Delinquent, but not defaulted 24 20 36 27 29
Default 10 8 24 36 24

L O U I S V I L L E . E D U
We lack information on other differences
• Race/ethnicity• Students of color likely to borrow more, are less likely to graduate, and face higher
unemployment rates than white peers (Source: Center for American Progress)
• About 27% of African American had debt of $30,500 or higher compared to 16% of white peers in 2010 (Source: College Board Policy & Advocacy Center)
• Gender: American Association of University Women report in 2009 found• Women and men tend to borrow the same amount• Men tend to earn more than women• In 2009 47% of women were paying 8% of their salary to repay student debt
compared to 39% of men• 20% of women were paying 15% of their salary to repay student debt compared to
15% of men
How bad is it?

L O U I S V I L L E . E D U
Three Points to Consider
How bad is it?

L O U I S V I L L E . E D U
% of Total Aid in Grants & Loans
How bad is it?
_x0005_9
0-91
_x0005_9
2-93
_x0005_9
4-95
_x0005_9
6-97
_x0005_9
8-99
_x0005_0
0-01
_x0005_0
2-03
_x0005_0
4-05
_x0005_0
6-07
_x0005_0
8-09
_x0005_1
0-110%
10%
20%
30%
40%
50%
60%
70%
80%
90%
100%
50%
41%GrantsLoans
Source: College Board "Trends in Student Aid" (2012), Table 4

L O U I S V I L L E . E D U
Shifts in Funding Higher Education
How bad is it?
Sources: Center on Budget Policy & Priorities, “Recent deep state higher education cuts may harm students and the economy for years to come” (March 19, 2013)http://www.cbpp.org/cms/?fa=view&id=3927;
Column1 2007-2008 2012-2013 ChangeState appropriations for higher education $87,172,406,161 $70,361,814,675.0 -19%FTE enrollment at public college & universities 10,271,685 11,471,488 12%State appropriations per FTE student 8,487 6,134 -28%

L O U I S V I L L E . E D U
Tuition revenue as % of total educational revenue, FY 1987-FY 2012
How bad is it?
Source: Center on Budget Policy & Priorities, “Recent deep state higher education cuts may harm students and the economy for years to come” (March 19, 2013)http://www.cbpp.org/cms/?fa=view&id=3927

L O U I S V I L L E . E D U
Employment by Highest Education
How bad is it?
Source: “The College Advantage: Weathering the Economic Storm” (August, 15, 2012)http://cew.georgetown.edu/collegeadvantage/

L O U I S V I L L E . E D U
The ‘crisis’ crisis in higher education
Burnbaum & Shushok studied claims of crisis swirling around higher
education a decade ago
• Looked at periodicals from 1970-1994
• Concerns about college finances occurred every year & accounted for 27%
of claims of crisis
How bad is it?
L O U I S V I L L E . E D U
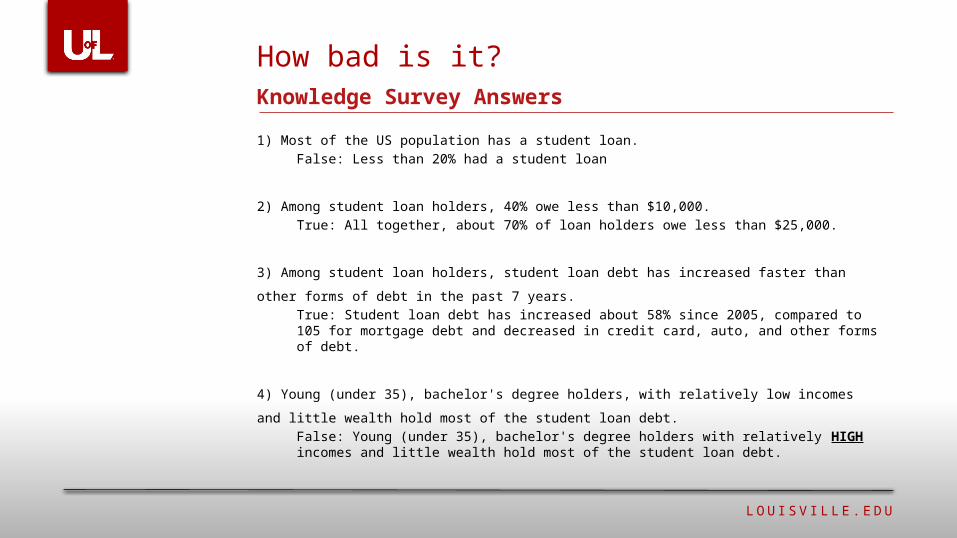
Knowledge Survey Answers
1) Most of the US population has a student loan.False: Less than 20% had a student loan
2) Among student loan holders, 40% owe less than $10,000.True: All together, about 70% of loan holders owe less than $25,000.
3) Among student loan holders, student loan debt has increased faster than other
forms of debt in the past 7 years.True: Student loan debt has increased about 58% since 2005, compared to 105 for mortgage debt and decreased in credit card, auto, and other forms of debt.
4) Young (under 35), bachelor's degree holders, with relatively low incomes and little
wealth hold most of the student loan debt.False: Young (under 35), bachelor's degree holders with relatively HIGH incomes and little wealth hold most of the student loan debt.
How bad is it?

L O U I S V I L L E . E D U
Knowledge Survey Answers
5) Young (under 35), bachelor's degree holders, with relatively high incomes
and little wealth pay a significantly greater proportion of their household
income to repay student loans today than they did almost 20 years ago,True
6) Under 40% of student loan holders in the 2005 cohort of college entrants
were in repayment without event in 2011.True: 37% of student loan holders were in repayment without event.
7) Most student loan holders do not default on their loans.True: Only 15% of the 2005 cohort of students were in default.
How bad is it?

L O U I S V I L L E . E D U
Knowledge Survey Answers
8) Earning a credential has no effect on likelihood of repayment outcomes
(such as delinquency or default).False: Students who completed a credential were more likely to be in timely repayment than students who did not earn a credential.
9) Women borrow more in student loans than men.False: Women and men borrow about the same, but women tend to earn less and therefore must devote more of their salary to repayment of student loans.
10) College is still worth it in terms of economic payoffs.True
How bad is it?

L O U I S V I L L E . E D U
Appended Slides
How bad is it?

L O U I S V I L L E . E D U
Loan Balances, by Age Group
How bad is it?
Source: FRBNY Consumer Credit Panel/Equifaxhttp://www.newyorkfed.org/householdcredit/

L O U I S V I L L E . E D U
Prevalence of Student Borrowing
How bad is it?
Source: FRBNY Consumer Credit Panel/Equifaxhttp://www.newyorkfed.org/householdcredit/

L O U I S V I L L E . E D U
Distribution of Aggregate Student Loan Debt Outstanding
How bad is it?
Source: Pew Research Center tabulations of Survey of Consumer Finances data

L O U I S V I L L E . E D U
% Borrowers 90+ Days Delinquent
How bad is it?
Source: FRBNY Consumer Credit Panel/Equifaxhttp://www.newyorkfed.org/householdcredit/

L O U I S V I L L E . E D U
Ratio of Student Loan Debt to Household Income
How bad is it?
Source: Pew Research Center tabulations of Survey of Consumer Finances data

L O U I S V I L L E . E D U
Student Loan Debt as Share of all Household Debt
How bad is it?
Source: Pew Research Center tabulations of Survey of Consumer Finances data