Embed Size (px)
Citation preview
How Authoritarian Survival Strategies Affect Civil War Onset
By
John Knowlton Paine, Jr.
A dissertation submitted in partial satisfaction of the
requirements for the degree of
Doctor of Philosophy
in
Political Science
in the
Graduate Division
of the
University of California, Berkeley
Committee in charge:Professor Robert L. Powell, Chair
Professor Leonardo R. ArriolaProfessor Peter L. Lorentzen
Professor Ross Levine
Spring 2015

text
Abstract
How Authoritarian Survival Strategies Affect Civil War Onset
by
John Knowlton Paine, Jr.
Doctor of Philosophy in Political Science
University of California, Berkeley
Professor Robert L. Powell, Chair
This dissertation studies causes of civil war from a game theoretic perspective. It aims to under-stand not only how authoritarian leaders can strategically mitigate prospects for civil war, but alsowhy authoritarian rulers may pursue activities that increase conflict propensity—despite the largeadverse welfare consequences of civil wars. Each essay focuses primarily on one particular authori-tarian survival strategy: building military capacity, extracting resources from society, and excludingthreatening ethnic groups from power at the center. The dissertation applies these strategic consid-erations to engage two major debates in comparative politics: how each of oil wealth and inter-ethnicrelationships affect prospects for fighting. The first essay argues that although oil wealth exertscertain effects that increase incentives for rebel groups to fight to control the capital, oil wealth alsoincreases government revenues and exerts an overall effect of decreasing center-seeking civil warpropensity. The second essay focuses on a different aspect of oil production, showing how local oilwealth facilitates government territorial encroachment and increases incentives to fight a separatistcivil war for oil-rich ethnic minority groups. The third essay extends the focus on inter-ethnicbargaining by showing ethnic groups organized as pre-colonial kingdoms in Sub-Saharan Africaundermined inter-ethnic institution building and increased incentives for ethnopolitical exclusion,civil wars, and military coups after independence.
1
Contents
1 Rethinking the Conflict “Resource Curse”: How Oil Wealth Prevents Center-Seeking Civil Wars 31.1 Introduction . . . . . . . . . . . . . . . . . . . . . . . . . . . . . . . . . . . . . . . . . 41.2 Foundational Assumptions Linking Oil and Center-Seeking
Civil Wars . . . . . . . . . . . . . . . . . . . . . . . . . . . . . . . . . . . . . . . . . . 61.2.1 Assumption #1: Governments Possess Oil Revenues . . . . . . . . . . . . . . 71.2.2 Assumption #2: Oil Provides a Large Revenue Base and Raises Income . . . 81.2.3 Assumption #3: Governments Use Oil Revenues Strategically . . . . . . . . . 91.2.4 Assumption #4: Oil Raises the Prize of Winning . . . . . . . . . . . . . . . . 101.2.5 Assumption #5: Oil Exerts a Relative State Weakness Effect . . . . . . . . . 101.2.6 Assumption #6: The Location of Oil Reserves is Less Important for Center-
Seeking than Separatist Civil Wars . . . . . . . . . . . . . . . . . . . . . . . . 121.2.7 Summarizing the Assumptions . . . . . . . . . . . . . . . . . . . . . . . . . . 13
1.3 A Unified Theory of Oil and Center-Seeking Civil WarOnset . . . . . . . . . . . . . . . . . . . . . . . . . . . . . . . . . . . . . . . . . . . . 141.3.1 Setup . . . . . . . . . . . . . . . . . . . . . . . . . . . . . . . . . . . . . . . . 141.3.2 Equilibrium Analysis . . . . . . . . . . . . . . . . . . . . . . . . . . . . . . . . 16
1.4 Main Result #1: How Oil Prevents Center-Seeking Civil Wars . . . . . . . . . . . . 191.5 Main Result #2: Distinguishing the “Relative” Conflict
Resource Curse Hypothesis . . . . . . . . . . . . . . . . . . . . . . . . . . . . . . . . 221.6 Empirical Evidence . . . . . . . . . . . . . . . . . . . . . . . . . . . . . . . . . . . . . 24
1.6.1 Results from Existing Models:Implications of Conflating Overall and Relative Effects . . . . . . . . . . . . . 25
1.6.2 Results from Modified Models: Consistent Negative Correlation . . . . . . . . 261.7 Conclusion . . . . . . . . . . . . . . . . . . . . . . . . . . . . . . . . . . . . . . . . . 291.8 References . . . . . . . . . . . . . . . . . . . . . . . . . . . . . . . . . . . . . . . . . . 30
2 Irreconcilable Grievances? Why Oil-Rich Ethnic Minority Groups Fight Sepa-ratist Civil Wars 622.1 Introduction . . . . . . . . . . . . . . . . . . . . . . . . . . . . . . . . . . . . . . . . . 632.2 A Model of Taxation, Bargaining, and Separatist Civil
Wars . . . . . . . . . . . . . . . . . . . . . . . . . . . . . . . . . . . . . . . . . . . . . 652.3 Equilibrium Analysis . . . . . . . . . . . . . . . . . . . . . . . . . . . . . . . . . . . . 67
2.3.1 Bargaining Phase . . . . . . . . . . . . . . . . . . . . . . . . . . . . . . . . . . 67
i
2.3.2 Labor Allocation . . . . . . . . . . . . . . . . . . . . . . . . . . . . . . . . . . 682.3.3 Prospects for Fighting as a Function of the Tax Rate . . . . . . . . . . . . . . 692.3.4 Tax Rate . . . . . . . . . . . . . . . . . . . . . . . . . . . . . . . . . . . . . . 70
2.4 Local Oil Wealth, Territorial Encroachment, andIncentives to Secede . . . . . . . . . . . . . . . . . . . . . . . . . . . . . . . . . . . . 72
2.5 Why the Government Chooses Not to Alleviate Grievances . . . . . . . . . . . . . . 752.6 The Conditional Conflict Resource Curse and
Different Types of Civil Wars . . . . . . . . . . . . . . . . . . . . . . . . . . . . . . . 772.6.1 The Conditional Resource Curse for Separatist Civil Wars . . . . . . . . . . . 772.6.2 Distinguishing Mechanisms for Separatist and Center-Seeking Civil Wars . . 782.6.3 Generating Hypotheses . . . . . . . . . . . . . . . . . . . . . . . . . . . . . . 80
2.7 Statistical Results . . . . . . . . . . . . . . . . . . . . . . . . . . . . . . . . . . . . . 802.8 Conclusion . . . . . . . . . . . . . . . . . . . . . . . . . . . . . . . . . . . . . . . . . 852.9 References . . . . . . . . . . . . . . . . . . . . . . . . . . . . . . . . . . . . . . . . . . 86
3 Pre-Colonial Kingdoms and the Coup-Civil War Nexus in Sub-Saharan Africa 903.1 Introduction . . . . . . . . . . . . . . . . . . . . . . . . . . . . . . . . . . . . . . . . . 913.2 Modeling the Tradeoff Between Ethnic Inclusion and
Exclusion . . . . . . . . . . . . . . . . . . . . . . . . . . . . . . . . . . . . . . . . . . 923.2.1 Setup . . . . . . . . . . . . . . . . . . . . . . . . . . . . . . . . . . . . . . . . 933.2.2 Model Analysis . . . . . . . . . . . . . . . . . . . . . . . . . . . . . . . . . . . 97
3.3 Applying the Formal Model: Pre-Colonial Kingdoms and the Coup-Civil War Nexusin SSA . . . . . . . . . . . . . . . . . . . . . . . . . . . . . . . . . . . . . . . . . . . . 1013.3.1 Defining Kingdoms . . . . . . . . . . . . . . . . . . . . . . . . . . . . . . . . . 1023.3.2 How PCK Groups Undermined Inter-Ethnic Commitment Ability
Prior to Independence . . . . . . . . . . . . . . . . . . . . . . . . . . . . . . . 1023.3.3 How Weak Inter-Ethnic Commitment Ability Caused Political
Violence After Independence . . . . . . . . . . . . . . . . . . . . . . . . . . . 1053.3.4 Hypotheses . . . . . . . . . . . . . . . . . . . . . . . . . . . . . . . . . . . . . 106
3.4 Data and Research Design . . . . . . . . . . . . . . . . . . . . . . . . . . . . . . . . . 1073.4.1 Unit of Analysis and Time Period . . . . . . . . . . . . . . . . . . . . . . . . 1073.4.2 Main Explanatory Variable: Pre-Colonial Kingdoms . . . . . . . . . . . . . . 1083.4.3 Dependent Variables . . . . . . . . . . . . . . . . . . . . . . . . . . . . . . . . 1093.4.4 Research Design and Control Variables . . . . . . . . . . . . . . . . . . . . . . 110
3.5 Empirical Evidence . . . . . . . . . . . . . . . . . . . . . . . . . . . . . . . . . . . . . 1113.6 Conclusion . . . . . . . . . . . . . . . . . . . . . . . . . . . . . . . . . . . . . . . . . 1163.7 References . . . . . . . . . . . . . . . . . . . . . . . . . . . . . . . . . . . . . . . . . . 117
ii
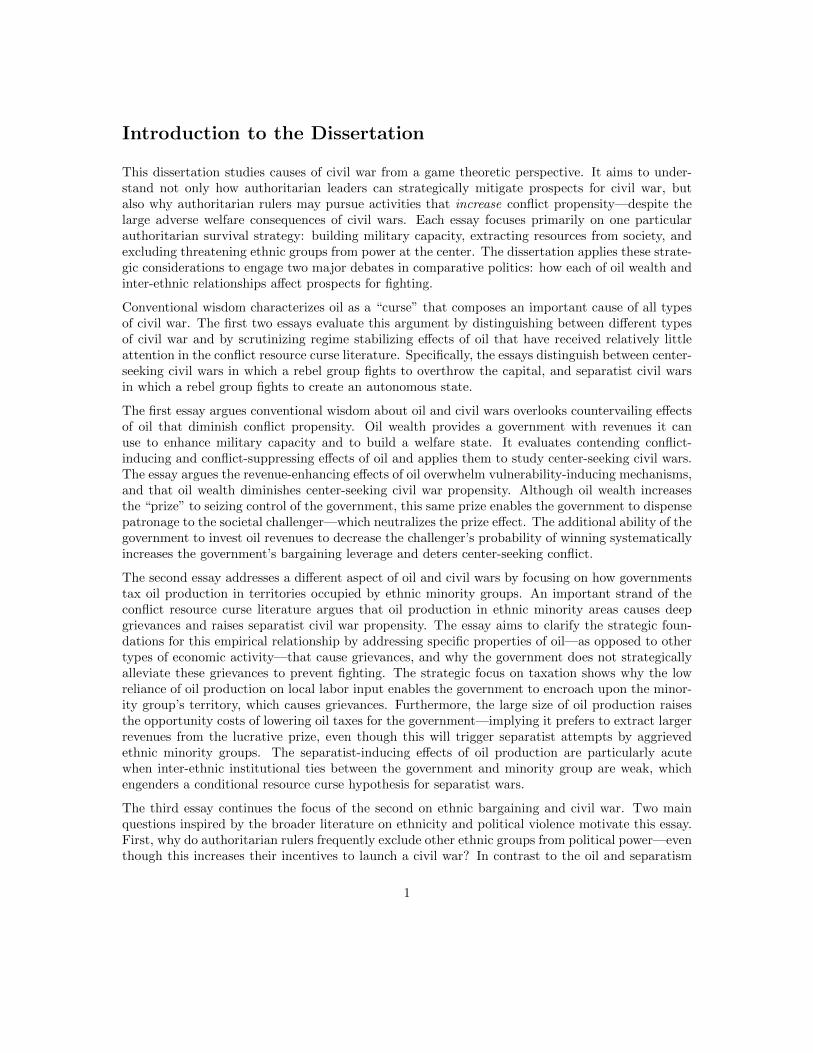
Introduction to the Dissertation
This dissertation studies causes of civil war from a game theoretic perspective. It aims to under-stand not only how authoritarian leaders can strategically mitigate prospects for civil war, butalso why authoritarian rulers may pursue activities that increase conflict propensity—despite thelarge adverse welfare consequences of civil wars. Each essay focuses primarily on one particularauthoritarian survival strategy: building military capacity, extracting resources from society, andexcluding threatening ethnic groups from power at the center. The dissertation applies these strate-gic considerations to engage two major debates in comparative politics: how each of oil wealth andinter-ethnic relationships affect prospects for fighting.
Conventional wisdom characterizes oil as a “curse” that composes an important cause of all typesof civil war. The first two essays evaluate this argument by distinguishing between different typesof civil war and by scrutinizing regime stabilizing effects of oil that have received relatively littleattention in the conflict resource curse literature. Specifically, the essays distinguish between center-seeking civil wars in which a rebel group fights to overthrow the capital, and separatist civil warsin which a rebel group fights to create an autonomous state.
The first essay argues conventional wisdom about oil and civil wars overlooks countervailing effectsof oil that diminish conflict propensity. Oil wealth provides a government with revenues it canuse to enhance military capacity and to build a welfare state. It evaluates contending conflict-inducing and conflict-suppressing effects of oil and applies them to study center-seeking civil wars.The essay argues the revenue-enhancing effects of oil overwhelm vulnerability-inducing mechanisms,and that oil wealth diminishes center-seeking civil war propensity. Although oil wealth increasesthe “prize” to seizing control of the government, this same prize enables the government to dispensepatronage to the societal challenger—which neutralizes the prize effect. The additional ability of thegovernment to invest oil revenues to decrease the challenger’s probability of winning systematicallyincreases the government’s bargaining leverage and deters center-seeking conflict.
The second essay addresses a different aspect of oil and civil wars by focusing on how governmentstax oil production in territories occupied by ethnic minority groups. An important strand of theconflict resource curse literature argues that oil production in ethnic minority areas causes deepgrievances and raises separatist civil war propensity. The essay aims to clarify the strategic foun-dations for this empirical relationship by addressing specific properties of oil—as opposed to othertypes of economic activity—that cause grievances, and why the government does not strategicallyalleviate these grievances to prevent fighting. The strategic focus on taxation shows why the lowreliance of oil production on local labor input enables the government to encroach upon the minor-ity group’s territory, which causes grievances. Furthermore, the large size of oil production raisesthe opportunity costs of lowering oil taxes for the government—implying it prefers to extract largerrevenues from the lucrative prize, even though this will trigger separatist attempts by aggrievedethnic minority groups. The separatist-inducing effects of oil production are particularly acutewhen inter-ethnic institutional ties between the government and minority group are weak, whichengenders a conditional resource curse hypothesis for separatist wars.
The third essay continues the focus of the second on ethnic bargaining and civil war. Two mainquestions inspired by the broader literature on ethnicity and political violence motivate this essay.First, why do authoritarian rulers frequently exclude other ethnic groups from political power—eventhough this increases their incentives to launch a civil war? In contrast to the oil and separatism
1
model, this essay shows why a government will sometimes pursue a policy that increases civil warpropensity not to enrich itself, but instead to guard against internal security threats. As the secondquestion, what historical factors explain variance in ethnopolitical exclusion choices? The essayargues that ethnic groups organized as pre-colonial kingdoms (PCK) in Sub-Saharan Africa under-mined inter-ethnic institutional ties and created animosities through reinforcing historical channels.This caused a tradeoff for political leaders after independence: inter-ethnic ruling coalitions thatincluded PCK groups were at high risk for military coups, whereas excluding groups to mitigatecoup risk raised civil war risk. The higher rates of ethnopolitical exclusion and of political violencein these countries resulted from these inter-ethnic tensions.
Comparing arguments from the two essays on oil politics shows the revenue-enhancing effects of oil—in particular, the effect of oil on boosting coercive capacity—strongly decrease conflict propensity,whereas the taxation-induced territorial encroachment effect strongly increases conflict propensity.The essays discuss why these mechanisms are of differential importance for center-seeking andseparatist civil wars. And whereas these essays follow the existing conflict resource curse literatureby focusing on challengers outside the government, the third essay extends the second essay’s focuson ethnic bargaining to focus on internal security threats.
The essays also provide empirical evidence to test the novel implications of each formal model. Theoil and center-seeking paper uses standard cross-national regression models from the literature,and shows how a seemingly minor specification change implied by the formal model produces newempirical findings about center-seeking civil wars. The formal model also implies that cross-nationaldata is not relevant for testing theories about oil and separatist civil wars. Combined with thefocus of the oil and separatist civil war essay on inter-ethnic relationships, this explains why thesecond essay uses ethnic group-level data to test its core implications. Furthermore, the theoreticalanalysis compares differential implications for separatist and center-seeking civil wars, which guidesthe empirical tests. Finally, the third essay includes results from an original dataset on pre-colonialkingdoms, which facilitates a broader goal of collecting historical data useful for studying causes ofmodern political violence.
2
Chapter 1
Rethinking the Conflict “ResourceCurse”: How Oil Wealth PreventsCenter-Seeking Civil Wars
Abstract
A broad literature on how oil wealth affects civil war onset argues oil production engen-ders violent contests to capture a valuable prize from vulnerable governments. However,research linking oil wealth to durable authoritarian regimes argues oil-rich governmentsdeter societal challenges by strategically allocating enormous revenues to enhance mili-tary capacity and provide patronage. This article presents a formal model that jointlyevaluates how these competing mechanisms affect incentives for center-seeking civil wars.Incorporating the revenue-enhancing effects of oil to study conflict yields two key im-plications. First, oil-generated revenues should strengthen the government and exertan overall effect that decreases center-seeking civil war propensity. Second, existingevidence may appear to consistently support a conflict resource curse because it tests ahypothesis about relative effects rather than the more relevant hypothesis about over-all effects. Revised statistical results demonstrate a consistently negative associationbetween oil wealth and center-seeking civil war onset.
3
1.1 Introduction
Following decades of scholarly research on the political effects of natural resource wealth—frequentlyfocused specifically on oil production—the multi-faceted effects of “black gold” remain of intenseinterest. Resembling a broader pattern of characterizing oil wealth as a “curse,” an influentialperspective in the enormous international relations literature on causes of civil war contends thatoil production frequently encourages rebel groups to initiate civil wars against vulnerable govern-ments.1 Existing arguments about oil span a wide spectrum of general mechanisms posited to causecivil conflict. Regarding material incentives to fight, expectations of capturing “unimaginably” highrents from oil revenues have provided one of the strongest “economic motive[s] for civil war in thepast half-century” because the state becomes a lucrative prize.2 Regarding opportunities to fight,because resource-rich rulers do not have to build strong ties with society to raise revenues,3 oil-rich governments tend to have weak bureaucratic institutions relative to their country’s per capitaincome level. This relative state weakness mechanism enables fights for the prize4—a problemexacerbated when rebels can loot and bunker oil to finance their insurgency.5 These prominentarguments that oil wealth motivates and provides opportunities for violent rebellions against vul-nerable governments underpin existing cross-national regression evidence that consistently supportsa conflict resource curse.6
Comparative politics research on authoritarian regime survival, however, provides a compellingalternative hypothesis.7 Although this related literature also characterizes oil as a curse, the mech-anisms that undergird anti-democratization hypotheses are incompatible with vulnerability-basedconflict resource curse arguments. Oil-rich governments are hypothesized to prevent democrati-zation by strategically investing enormous revenues in military capacity and by building generouswelfare states. The hypothesis that oil wealth enhances the coercive apparatus is conventional wis-dom among Middle East and North Africa scholars,8 and “rentier” spending effects have attractedeven wider attention.9
Juxtaposing divergent theoretical conclusions from these related resource curse literatures raisestwo key questions for evaluating a widely discussed cause of civil wars. How do revenue-enhancingand government vulnerability effects impact rebels’ overall incentives to attack an oil-rich govern-ment? And, if revenue-enhancing effects are theoretically relevant, why do existing statistical resultsconsistently uphold a conflict resource curse?
This article addresses these questions by first distinguishing between two types of civil war, center-seeking civil wars to control the capital and separatist civil wars to create an autonomous govern-
1Major academic contributions include Collier and Hoeffler 2004; Fearon and Laitin 2003; Fearon 2005; Hegre andSambanis 2006; Ross 2004, 2012; Lei and Michaels 2014. According to Google Scholar these articles have a combinedcitation count of 12,427 (accessed 5/4/15). Ross 2013 reviews this voluminous literature.
2Laitin 2007, 22. Prize-based arguments derive mainly from economic theories of conflict (Garfinkel and Skaperdas2006), which provided the original theoretical insights linking oil wealth to civil wars according to Ross 2013, 13.
3Tilly 1992, 207-8, 210, 218; Chaudhry 1997; Karl 1997.4Fearon and Laitin 2003, 81; Fearon 2005.5Collier and Hoeffler 2004; Ross 2012, 147-53.6Footnote 1 presents the most influential studies supporting a conflict resource curse. Cotet and Tsui 2013 provide
dissenting results.7Ross 2001, 332-7 provides an extensive review.8Gause 1994; Bellin 2004, 148; Lynch 2012, 41.9Colgan 2014, 5 provides numerous recent citations.
4
ment. The analysis focuses mainly on center-seeking wars because the motivating theoretical puzzleof strengthening versus vulnerability mechanisms directly impacts this type of civil war, whereasthe within-country location of oil reserves should be more important for determining separatist civilwars. Focusing on one type of civil war at a time therefore provides needed theoretical and empiricalclarifications for conflict resource curse debates. To preview the distinction elaborated upon below,the oil prize will not motivate secession if a potential rebel group’s region does not contain any oilreserves—whereas seizing the center would yield the prize—and the deterrence effect of oil-fundedgovernment militaries will be less effective against separatist insurgencies fought in the peripherythan against attacks on the capital. This theoretical consideration also implies that widely usedcountry-level oil income measures—which do not take oil location into account—only provide validtests for hypotheses about oil and center-seeking wars.10
To evaluate the conflict resource curse applied to center-seeking civil wars,11 this article first presentsa game-theoretic model that extends bargaining models of conflict originally developed to explaininternational warfare12 that have subsequently been used to study regime transitions13 and civilwars.14 This framework requires researchers to think how stimuli—such as oil—affect not onlythe individual calculus of governments or of societal challengers, but also how they affect strate-gic interactions between these actors. The formal model unifies competing oil vulnerability andrevenue-enhancing mechanisms into a joint theoretical framework. In each period of an infinitehorizon game, a challenger is stochastically chosen to be either strong or weak. After learningthe challenger’s strength, a government allocates its per-period revenues—which consist of oil andnon-oil revenues—among personal consumption, armament, and a patronage offer to a challenger.The challenger either accepts the offer or fights to control the government. The model incorporatesoil’s revenue-enhancing effects by assuming the government controls and strategically allocates oilrevenues—an empirically grounded contrast to oil looting theories. Oil generates a state prize effectby increasing the challenger’s expected gains from winning a fight. Finally, the model capturesthe relative state weakness mechanism by assuming, for a fixed amount of revenues, bureaucraticcapacity decreases in the percentage of revenues that derive from oil.
The first main formal theoretical result explains why oil-generated revenues dominate vulnerabilityeffects and decrease the probability of center-seeking civil wars. Although oil enhances the prizeof capturing the state, the government strategically spends oil revenues on military capacity—which lowers the challenger’s probability of winning a fight—and on patronage, which increases thechallenger’s utility to accepting an offer. Building military capacity partially counteracts the prizeeffect by decreasing the challenger’s probability of winning. The coercive possibilities afforded byoil decrease incentives to attack the government.
Although this finding provides needed insights for resolving competing theoretical claims, it alsoraises a new puzzle: why does existing cross-national regression evidence consistently support aconflict resource curse? Not only do conventional regression specifications usually aggregate center-seeking and separatist civil wars, they also test a relative conflict resource curse hypothesis but do
10Research that has disaggregated categories of civil war does not agree which type should exhibit a strongerresource curse. As examples from published research, Buhaug 2006 argues the conflict resource curse should applymore strongly for center-seeking than separatist civil wars whereas Sorens 2011 argues the opposite.
11The conclusion discusses implications for separatist civil wars and for regime transitions.12Fearon 1995; Powell 1999.13Acemoglu and Robinson 2006.14Fearon 2004; Powell 2012.
5
not assess the overall effects of oil on conflict. To understand this distinction, it is useful to comparethe first main theoretical finding to a relative resource curse hypothesis implied by the relative stateweakness assumption: oil is less effective at preventing center-seeking civil war than other types ofrevenue. Thus, although the model predicts that more oil exerts a negative overall effect on theprobability of center-seeking civil war onset because oil raises revenues, when hypothetically fixingthe amount of government revenues and raising the percentage that derives from oil—i.e., evaluatingthe effect of oil relative to other revenue sources—more oil should raise conflict propensity.
Distinguishing the overall and relative effects of oil provides the second main result from the modeland carries an important empirical implication. The widespread empirical practice of regressing civilwar onset on oil wealth while controlling for per capita income only tests the second hypothesis aboutrelative effects. Controlling for income inhibits inferring the overall effects of oil because holdingincome fixed posits an implausible counterfactual claim for oil-rich countries: they would haveachieved the same level of income per capita—and, related, their governments would have developedother lucrative revenue sources—even had they not become major oil producers. Because large-scale oil production tends to raise both income per capita and government revenues by considerableamounts, controlling for income holds fixed the crucial revenue-enhancing channel through whichoil should decrease incentives for societal challenges according to authoritarian stability research.Furthermore, the post-treatment bias induced by controlling for income should engender upwardlybiased regression estimates—meaning oil appears to be more of a curse than it actually is.
Regression evidence demonstrates the empirical relevance of this specification alteration for cross-national data analysis—which has provided the empirical foundation for the conflict resource cursehypothesis. One set of regressions uses the same statistical models as much existing researchand demonstrates that simply omitting the income control removes the strong positive correlationbetween oil wealth and center-seeking civil war onset.15 Furthermore, statistical models that in-troduce additional justified modifications demonstrate a consistent negative association between oiland center-seeking conflict.
To advance these considerations, the paper begins by presenting six foundational assumptions tosubstantively ground the formal model. The next section sets up and solves the model, followed bysections presenting the two main theoretical results and empirical evidence. The conclusion discusseshow implications from the formal model should help to reconcile broader arguments for and againsta “resource curse.” The appendices provide supporting theoretical and empirical results.
1.2 Foundational Assumptions Linking Oil and Center-SeekingCivil Wars
The divergent implications of oil-authoritarianism and oil-conflict research demonstrate many ex-isting arguments about oil are mutually inconsistent.16 This observation highlights the need fora theoretical framework that jointly examines opposing arguments. Directly comparing positionsfrom different oil literatures provides foundational assumptions that substantively ground the for-mal model. This discussion emphasizes the need to scrutinize how oil revenues affect the calculus
15Appendix C.4 shows this implication also applies to separatist civil wars.16Smith 2004; Basedau and Lay 2009; Morrison 2012; Colgan 2014 make a similar allegation.
6
of both governments—as in research on oil and authoritarianism—and challengers, the predomi-nant theme of the oil-civil war literature. The sixth assumption distinguishes center-seeking andseparatist civil wars.
1.2.1 Assumption #1: Governments Possess Oil Revenues
Key attributes of oil production heavily favor a government over rebel groups, an observation thatcorresponds with assumptions from oil and authoritarianism research. In contrast, oil and civil warresearch often focuses on how oil funds insurgencies,17 or assumes all participants in a spoils contestface the same budget constraint (economic theories of conflict).
Oil production requires large capital investments, a crucial feature of oil that favors governmentsover challengers.18 Ross shows the capital-to-labor ratio is considerably higher in the oil andgas industry than in any other major U.S. industry operating overseas.19 Similarly, Alnaswaristates, “Foreign capital and technology had to be called upon to develop oil resources since capitalrequirements for developing, producing, transporting, refining, and finally marketing oil productswere well beyond the capabilities of [developing] countries.”20 Compared to natural resources suchas alluvial diamonds and drugs that require little capital to extract, oil is a “less lootable resource”21
that “is easily controlled by the central government.”22
Empirically, rebel groups have almost never accessed oil revenues to fund start-up costs for chal-lenging a government because of impediments to directly accessing oil wealth during peacetime.Among Ross’ review of cases, only Congo-Brazzaville in the 1990s exhibits this phenomenon in anoil-rich country that experienced a civil war.23 In this exceptional case, rebel leader and formerpresident Denis Sassou-Nguesso promised to restore French oil company Elf Aquitaine’s monopolyover Congo’s oil if he regained power, in return for assistance. However, cases in which internationalactors provide a “booty futures” market are rare—a failed coup attempt in Equatorial Guinea in2004 and Libya in 2013 provide two other known cases—because international oil companies andtheir host governments favor incumbents over challengers to prevent costly disruptions to oil pro-duction. For example, distinct states arose on the periphery of the Arabian peninsula becauseBritish oil companies needed a designated ruler with which to sign concessions.24 The British navymilitarily supported these new incumbents.25
Rebels have greater opportunities to disrupt or to profit from oil production during ongoing civilwars. Bombing pipelines provides one disruptive option. In extreme circumstances a rebel groupmay halt oil production entirely by deterring international oil companies from remaining in thecountry, as during the Second Sudanese Civil War. Rebels may also be able to steal government-produced oil, as in Nigeria and Iraq during the 2000s.26 The Islamic State rebel group in Iraq and
17Collier and Hoeffler, 2004; Ross 2012, 151-3.18Gause 1994, 42.19Ross 2012, 46.20Alnaswari 1994, 1.21Humphreys 2005, 523.22Colgan 2013, 4.23Ross 2004; Ross 2012, 174-8.24Zahlan 1989.25Macris 2010.26Ross 2012, 170-3; Burns and Semple 2006.
7
Syria provides an extreme example of rebels looting oil. By gaining military control over existingoil fields and refineries, by the summer of 2014 they had achieved resources exceeding that “of anyother terrorist group in history.”27
However, these examples provide rare exceptions rather than the norm. Focusing instead on dom-inant trends, even during ongoing conflicts governments control the overwhelming majority of oilproduction. This undergirds Colgan’s argument that rebels rarely militarily defeat oil-rich gov-ernments because oil revenues provide the government with funds to win a war.28 In almost allcircumstances, even a rebel group that controls oil-rich territory faces great difficulties to extractoil and construct a national distribution system to reap profits29—factors related to high capitalcosts, foreign assistance needs, and the tendency for international actors to support incumbents.The Islamic State partially overcame these difficulties by using smuggling routes established duringthe post-2003 Iraq state collapse. However, its oil fields still have produced at far below capacityrates30—especially after U.S. bombing campaigns began in 2014.31
The stylized fact about government ownership also critiques the empirical relevance of economictheories of conflict. These models conceptualize wars as a contest. Each side invests in arms toincrease its probability of winning a fight for the prize. A larger prize induces actors to devotemore resources to fighting. However, the conventional assumption that every actor faces the samebudget constraint contrasts with the stylized fact that an oil-rich government has a much largerbudget than the challenger to spend on the contest. Instead, the standard contest model setupmay be illuminating for natural resources more easily looted than oil, especially when the state hascollapsed. For example, Olsson and Fors use this framework to explain how gold, diamonds, andcoltan affected the civil war that began in the Democratic Republic of the Congo in 1997.32
1.2.2 Assumption #2: Oil Provides a Large Revenue Base and RaisesIncome
Not only does oil provide government revenues, it often provides a large revenue base. Ross lists the“exceptionally large size” of oil revenues as a central characteristic of oil production and providessupporting cross-national evidence.33 Oil revenues are also large even compared to rents from othernatural resources. In Haber and Menaldo’s dataset on oil, natural gas, coal, and metals income fora global sample of countries, oil and natural gas composed 90% of all global resource income from1960 to 2006.34 Furthermore, in 76% of country-years with more than $500 in resource income percapita in this global sample, at least half the income came from oil and gas. “The global trade ofoil generates revenues that are somewhere between ten and a hundred times larger than the nextlargest natural resource.”35
27Dilanian 2014.28Colgan 2014, 6 provides examples in which government revenues vastly exceeded rebel funds despite rebel leaders
engaging in oil looting for private profit.29Fearon 2005, 500.30al-Khatteeb 2014.31Meichtry and Schechner 2015.32Olsson and Fors 2004.33Ross 2012, 27-33.34Haber and Menaldo 2011.35Colgan 2013, 12.
8
Evidence connecting oil wealth to large revenue bases complements the recent rethinking of theeconomic development resource curse. Alexeev and Conrad demonstrate oil-abundant countrieshave considerably higher per capita incomes than oil-poor countries.36 Their evidence overturnedearlier conventional wisdom (e.g., Sachs and Warner) based on studying economic growth ratesduring an unrepresentative period in world history.37 Although it is puzzling that oil-rich statesperformed so poorly during the 1970s and 1980s, most major oil producers had already becomewealthy from commercial oil production prior to this period38—a simple albeit powerful observationthat research prior to Alexeev and Conrad’s had overlooked. Furthermore, their evidence also rejectsa weaker version of the resource curse proposed in earlier work: oil may boost economic growth, butonly in countries with strong pre-oil institutions.39 Alexeev and Conrad’s evidence instead suggests“countries with weaker institutions benefit more from natural resources.”40
Large revenues and high per capita income in major oil producers are especially striking in contrastto bleak economic prospects faced by many oil-rich countries prior to discovering large oil reserves.Modern states did not exist in the Arabian peninsula prior to oil discoveries, and the region wasone of the poorest in the world. “The pearling industry was vital to the pre-war economies . . . [and]suffered an almost total collapse after the Wall Street crash of 1929 . . . It would have been almostimpossible to overcome this crisis had the strange hand of fate not intervened: the oil companiesarrived in search of concessions.”41 As examples, Qatar is now one of the world’s richest countries,but in 1942 the king mortgaged his house to pay off “public” debts and in 1949 the country hadonly six public employees.42 Before Libya discovered oil, “the country’s major revenue sources weresales of scrap metal left behind by the belligerents during [World War II], sales of esparto grass,and rent from military bases leased by the United States and Great Britain . . . 80 percent of thecountry’s population still lived at subsistence level in the hinterland.”43
1.2.3 Assumption #3: Governments Use Oil Revenues Strategically
A core premise of oil and authoritarianism research is that oil-rich governments strategically usetheir large revenue streams to decrease incentives for societal challenges. This contrasts with thecore idea behind the state prize argument: oil-rich governments provide easy targets for preda-tion. More generally, most work on oil and conflict devotes little attention to strategic governmentchoices.44 Consequently, existing theories often imply oil wealth raises civil war frequency by im-posing unsatisfying limitations on the government’s assumed range of strategic options.
As one example of a crucial strategic consideration, the model below assumes the government canbargain with the challenger. This assumption is standard in models of international warfare45 andpolitical regime transitions,46 but not in economics of conflict models. A key result from Besley and
36Alexeev and Conrad 2009.37Sachs and Warner 1997. Ross 2012, 196 provides a concurrent argument to Alexeev and Conrad’s.38Alexeev and Conrad 2009, 587.39Mehlum et al. 2006; Robinson et al. 2006.40Alexeev and Conrad 2009, 591.41Zahlan 1989, 22.42Crystal 1995, 117, 129.43Vandewalle 1999, 46.44Colgan 2014, 7 makes a similar claim.45Fearon 1995; Powell 1999.46Acemoglu and Robinson 2006.
9
Persson exemplifies why it is important to assume governments can bargain.47 They improve uponstandard contest function models by assuming only the government can access natural resourcewealth. But even though natural resource revenues strengthen the government’s coercive capacity,the model still predicts more resource rents raise the probability of violence.48 Because theirmodel does not allow the government to make offers to the challenger, the challenger can onlyaccess natural resource wealth by fighting. More generally, economic theories of conflict face theshortcoming that, “There is typically no decision to fight: arming and fighting are one and thesame. This prediction of ever-present conflict is unsatisfying since political competition over powerand resources is ubiquitous while violent conflict is not.”49
As another example of government strategy in the model presented here, the government caninvest oil revenues in military capacity—consistent with existing evidence that links oil wealth tohigher levels of military spending.50 However, because most oil and conflict research does notclosely scrutinize strategic government choices, the idea that governments can invest oil revenuesin coercive capacity is largely absent.
1.2.4 Assumption #4: Oil Raises the Prize of Winning
Although economics of conflict models do not incorporate certain key features of oil wealth, theydo highlight the important effect that oil increases the value of capturing the state. Actors in thesemodels fight because there is a lucrative prize.51 Fearon summarizes the logic succinctly by stating“scholars in the civil war literature routinely ‘explain’ the association between oil production (orother natural resources) and civil war by arguing that these increase the value of winning.”52
The prize effect is an important omission from oil and authoritarianism research. Indeed, if as-sumptions #1 through #3 are valid, it is difficult to comprehend how oil wealth could fail to raisevalue of winning for a rebel group. Thus, whereas the oil-civil war literature tends to understatethe conflict-depressing effects of oil, oil-authoritarianism research does not carefully evaluate thiscrucial channel through which oil may increase conflict propensity.
1.2.5 Assumption #5: Oil Exerts a Relative State Weakness Effect
Until recently, it was widely believed that oil wealth systematically weakened governance institu-tions. However, recent findings reject this argument and focus on a similar issue as discussed in theintroduction: earlier analyses concluded oil weakens institutions only because they controlled forper capita income. Instead, existing evidence supports a relative state weakness hypothesis: relativeto other revenue sources, oil revenues are not as effective at boosting institutional quality.
47Besley and Persson 2011, ch. 4.48Besley and Persson 2011, 184.49Blattman and Miguel 2010, 11.50Wright et al. 2013, 15-17. Colgan 2014, 5 provides additional citations. Gause 1994, 66-68 provides data on the
enormous military expenditures by Arabian peninsula monarchies, including large increases following the 1973 oilboom.
51E.g., Garfinkel and Skaperdas 2006.52Fearon 2008, 8.
10
Alexeev and Conrad, Ross, and Kennedy and Tiede incorporate different measures of institutionalquality and reach a similar conclusion: there is no evidence that oil wealth systematically weakensgovernance institutions.53 Kennedy and Tiede consider the widest range of institutional measuresand instead reach the opposite conclusion that “oil has a net positive effect on governance.”54
Menaldo concurs with this evidence and argues that oil wealth tends to improve institutional qual-ity by “endowing a government with a laboratory in which it can ‘learn how to tax’ ” and bycreating positive spillovers for other aspects of state capacity.55 In a qualitative study that exem-plifies rethinking the state weakness effect, Hertog provides evidence that “problems of bureaucraticfragmentation and low regulatory power were apparent in the modern Saudi state right from itsinception.”56 He explicitly contrasts his framework with Chaudhry’s earlier influential argumentthat the 1970s oil boom led caused Saudi state to dismantle a highly coherent bureaucracy.57
Instead, these newer statistical studies show earlier research provided evidence of a “relative” in-stitutional resource curse because, by controlling for per capita income, they compared oil-richcountries to oil-poor countries with similar levels of income per capita.58 This alternative hypothe-sis about relative effects finds considerable substantive support. It appears uncontroversial to assertthat oil-rich states have weaker bureaucratic capacity than oil-poor countries with comparable levelsof income per capita, a frequently used proxy for state capacity. Considerable research shows gov-ernments face arduous hurdles to extract direct tax revenues.59 Therefore, oil-poor states have toimprove bureaucratic capacity to achieve higher development levels. In contrast, bureaucratic gov-ernment did not exist in countries like Oman, Qatar, or the United Arab Emirates prior to the 1973oil boom. Bureaucracies in these countries were created solely to distribute oil rents to society.60
Furthermore, by associating with international oil companies, poor countries that discover oil canextract their resource without having to build industrial capacity of their own and without havingto penetrate society. In direct contrast to countries that derive large revenue streams from directtaxes, weak states often produce larger amounts of oil because of pressing fiscal needs.61
Providing additional substantive grounding for a relative state weakness claim, Fearon and Laitin’sinfluential conflict resource curse hypothesis also assumes oil exerts a relative—but not overall—effect on weakening institutional quality.62 However, as discussed with the second main result of themodel, their relative state weakness hypothesis is widely misinterpreted as concerning the overalleffects of oil on institutions.
53Alexeev and Conrad 2009; Ross 2012, 208-215; Kennedy and Tiede 2013.54Kennedy and Tiede 2013, 760. They group their measures into three categories: rule of law, government efficiency,
and public goods provision. Ross examines a measure of government effectiveness and corruption and Alexeev andConrad analyze rule of law.
55Menaldo 2014, ch. 4, pg. 11.56Hertog 2010, 39.57Chaudhry 1997.58The discussion accompanying the second main result of the model details the problems this causes.59E.g., Herbst 2000.60Gause 1994, 63.61Haber and Menaldo 2011, 2; Menaldo 2014, ch. 3.62Fearon and Laitin 2003, 81.
11
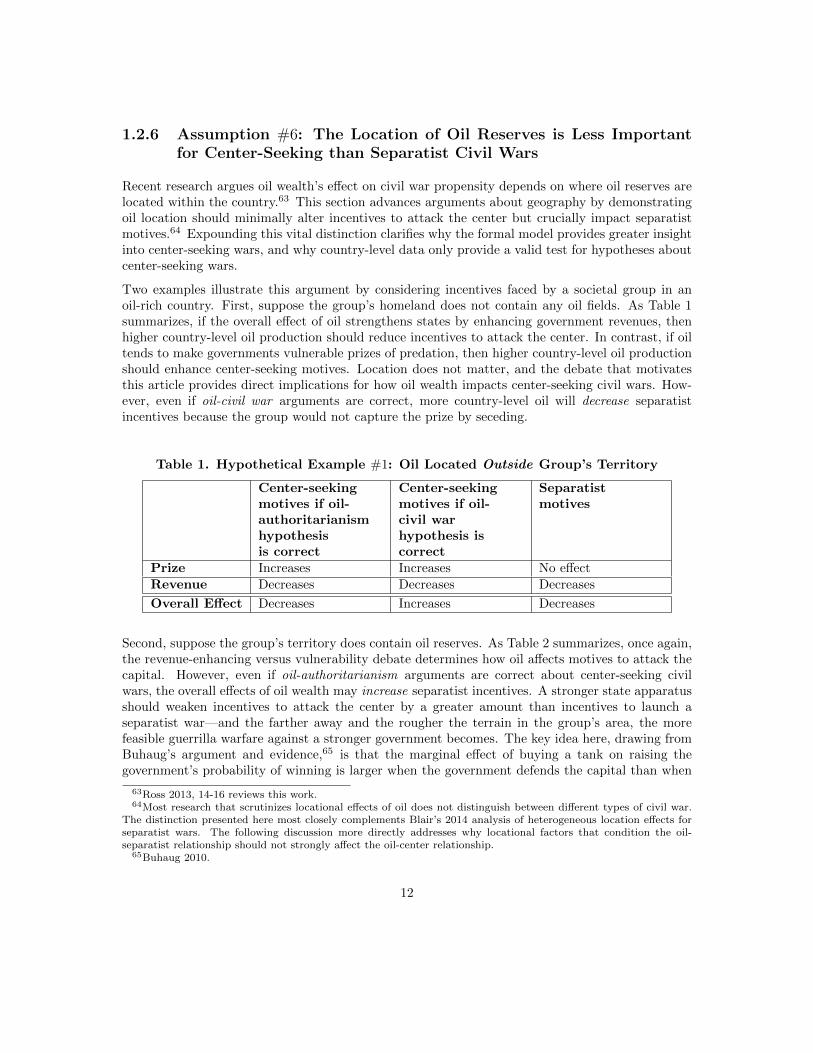
1.2.6 Assumption #6: The Location of Oil Reserves is Less Importantfor Center-Seeking than Separatist Civil Wars
Recent research argues oil wealth’s effect on civil war propensity depends on where oil reserves arelocated within the country.63 This section advances arguments about geography by demonstratingoil location should minimally alter incentives to attack the center but crucially impact separatistmotives.64 Expounding this vital distinction clarifies why the formal model provides greater insightinto center-seeking wars, and why country-level data only provide a valid test for hypotheses aboutcenter-seeking wars.
Two examples illustrate this argument by considering incentives faced by a societal group in anoil-rich country. First, suppose the group’s homeland does not contain any oil fields. As Table 1summarizes, if the overall effect of oil strengthens states by enhancing government revenues, thenhigher country-level oil production should reduce incentives to attack the center. In contrast, if oiltends to make governments vulnerable prizes of predation, then higher country-level oil productionshould enhance center-seeking motives. Location does not matter, and the debate that motivatesthis article provides direct implications for how oil wealth impacts center-seeking civil wars. How-ever, even if oil-civil war arguments are correct, more country-level oil will decrease separatistincentives because the group would not capture the prize by seceding.
Table 1. Hypothetical Example #1: Oil Located Outside Group’s Territory
Center-seekingmotives if oil-authoritarianismhypothesisis correct
Center-seekingmotives if oil-civil warhypothesis iscorrect
Separatistmotives
Prize Increases Increases No effectRevenue Decreases Decreases Decreases
Overall Effect Decreases Increases Decreases
Second, suppose the group’s territory does contain oil reserves. As Table 2 summarizes, once again,the revenue-enhancing versus vulnerability debate determines how oil affects motives to attack thecapital. However, even if oil-authoritarianism arguments are correct about center-seeking civilwars, the overall effects of oil wealth may increase separatist incentives. A stronger state apparatusshould weaken incentives to attack the center by a greater amount than incentives to launch aseparatist war—and the farther away and the rougher the terrain in the group’s area, the morefeasible guerrilla warfare against a stronger government becomes. The key idea here, drawing fromBuhaug’s argument and evidence,65 is that the marginal effect of buying a tank on raising thegovernment’s probability of winning is larger when the government defends the capital than when
63Ross 2013, 14-16 reviews this work.64Most research that scrutinizes locational effects of oil does not distinguish between different types of civil war.
The distinction presented here most closely complements Blair’s 2014 analysis of heterogeneous location effects forseparatist wars. The following discussion more directly addresses why locational factors that condition the oil-separatist relationship should not strongly affect the oil-center relationship.
65Buhaug 2010.
12
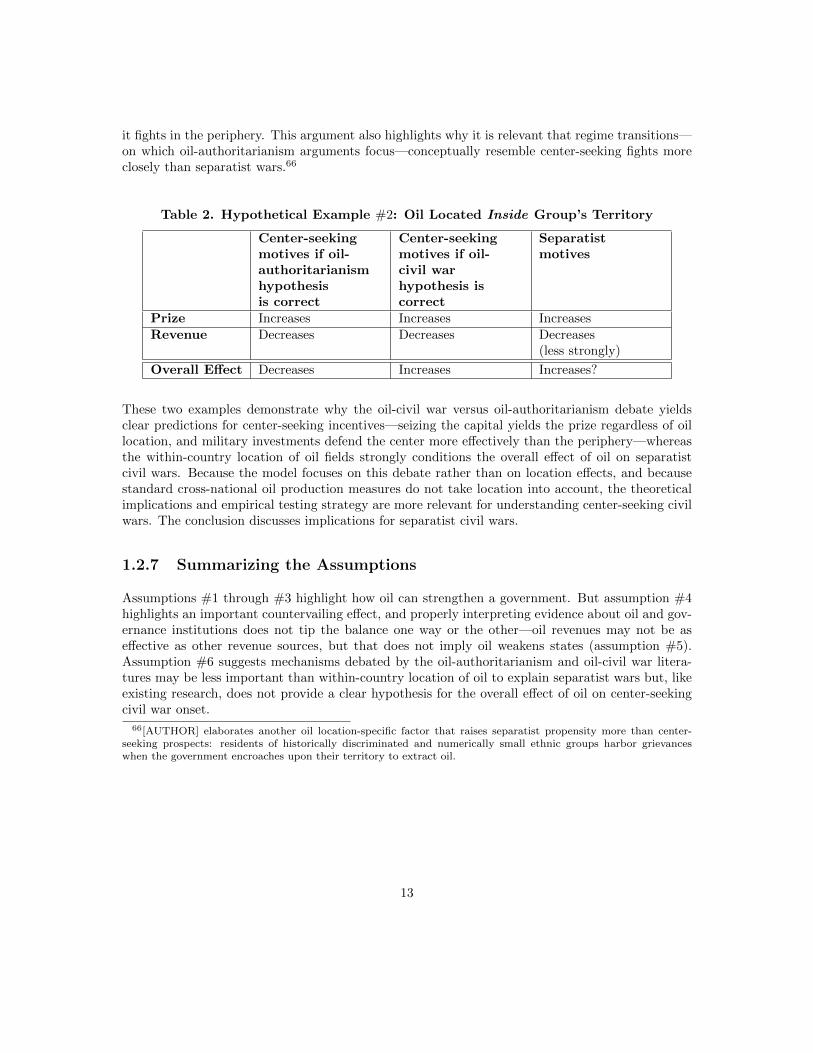
it fights in the periphery. This argument also highlights why it is relevant that regime transitions—on which oil-authoritarianism arguments focus—conceptually resemble center-seeking fights moreclosely than separatist wars.66
Table 2. Hypothetical Example #2: Oil Located Inside Group’s Territory
Center-seekingmotives if oil-authoritarianismhypothesisis correct
Center-seekingmotives if oil-civil warhypothesis iscorrect
Separatistmotives
Prize Increases Increases IncreasesRevenue Decreases Decreases Decreases
(less strongly)
Overall Effect Decreases Increases Increases?
These two examples demonstrate why the oil-civil war versus oil-authoritarianism debate yieldsclear predictions for center-seeking incentives—seizing the capital yields the prize regardless of oillocation, and military investments defend the center more effectively than the periphery—whereasthe within-country location of oil fields strongly conditions the overall effect of oil on separatistcivil wars. Because the model focuses on this debate rather than on location effects, and becausestandard cross-national oil production measures do not take location into account, the theoreticalimplications and empirical testing strategy are more relevant for understanding center-seeking civilwars. The conclusion discusses implications for separatist civil wars.
1.2.7 Summarizing the Assumptions
Assumptions #1 through #3 highlight how oil can strengthen a government. But assumption #4highlights an important countervailing effect, and properly interpreting evidence about oil and gov-ernance institutions does not tip the balance one way or the other—oil revenues may not be aseffective as other revenue sources, but that does not imply oil weakens states (assumption #5).Assumption #6 suggests mechanisms debated by the oil-authoritarianism and oil-civil war litera-tures may be less important than within-country location of oil to explain separatist wars but, likeexisting research, does not provide a clear hypothesis for the overall effect of oil on center-seekingcivil war onset.
66[AUTHOR] elaborates another oil location-specific factor that raises separatist propensity more than center-seeking prospects: residents of historically discriminated and numerically small ethnic groups harbor grievanceswhen the government encroaches upon their territory to extract oil.
13
1.3 A Unified Theory of Oil and Center-Seeking Civil WarOnset
The formal model incorporates these assumptions to provide a unified framework for evaluating howthe competing effects of oil wealth affect overall incentives to initiate a center-seeking civil war. Thissection presents and solves the model, and the next two sections present the main findings.
1.3.1 Setup
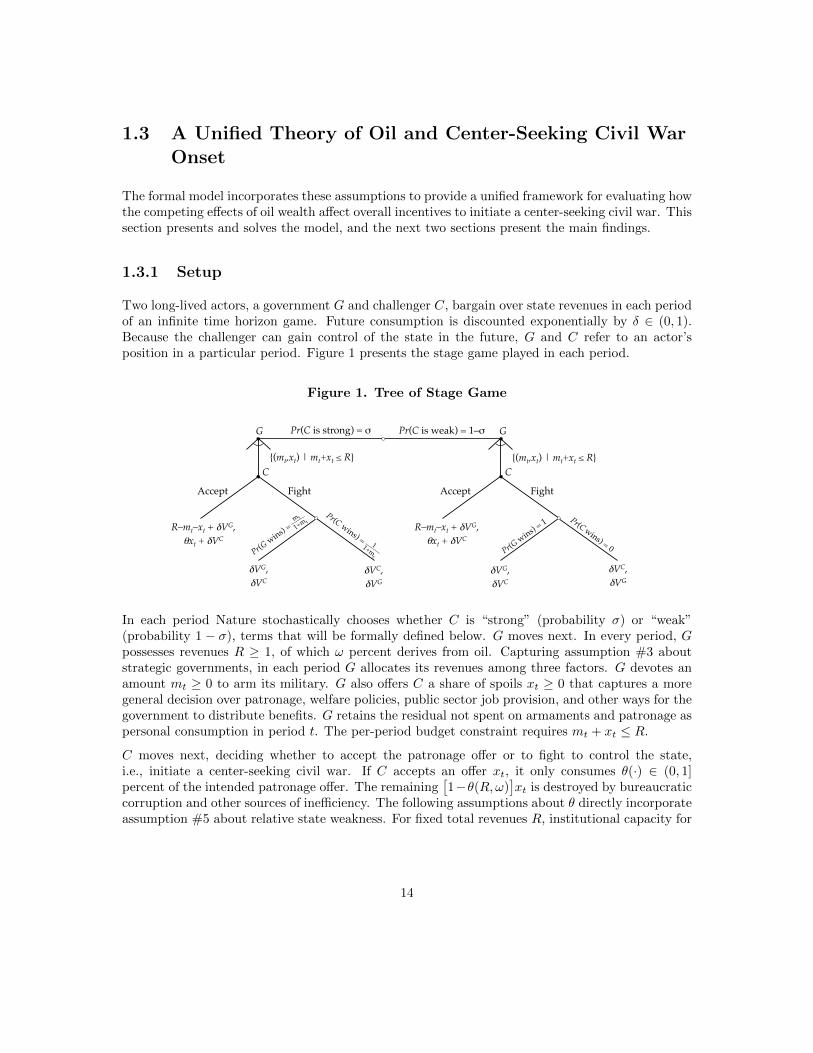
Two long-lived actors, a government G and challenger C, bargain over state revenues in each periodof an infinite time horizon game. Future consumption is discounted exponentially by δ ∈ (0, 1).Because the challenger can gain control of the state in the future, G and C refer to an actor’sposition in a particular period. Figure 1 presents the stage game played in each period.
Figure 1. Tree of Stage Game
R–mt–xt + δVG,!
θxt + δVC!
δVG,!
δVC!
Pr(C is strong) = σ G
C
Accept Fight
R–mt–xt + δVG,!
θxt + δVC!
G
C
Accept Fight
Pr(C is weak) = 1–σ
δVG,!
δVC!δVC,!
δVG!
δVC,!
δVG!
{(mt,xt) | mt+xt ≤ R}!
{(mt,xt) | mt+xt ≤ R}!
In each period Nature stochastically chooses whether C is “strong” (probability σ) or “weak”(probability 1 − σ), terms that will be formally defined below. G moves next. In every period, Gpossesses revenues R ≥ 1, of which ω percent derives from oil. Capturing assumption #3 aboutstrategic governments, in each period G allocates its revenues among three factors. G devotes anamount mt ≥ 0 to arm its military. G also offers C a share of spoils xt ≥ 0 that captures a moregeneral decision over patronage, welfare policies, public sector job provision, and other ways for thegovernment to distribute benefits. G retains the residual not spent on armaments and patronage aspersonal consumption in period t. The per-period budget constraint requires mt + xt ≤ R.
C moves next, deciding whether to accept the patronage offer or to fight to control the state,i.e., initiate a center-seeking civil war. If C accepts an offer xt, it only consumes θ(·) ∈ (0, 1]percent of the intended patronage offer. The remaining
[1−θ(R,ω)
]xt is destroyed by bureaucratic
corruption and other sources of inefficiency. The following assumptions about θ directly incorporateassumption #5 about relative state weakness. For fixed total revenues R, institutional capacity for
14
distributing patronage is assumed to decrease in the percentage of revenue that derives from oil.67
Formally, θω < 0. Additionally, institutional capacity is assumed to increase in total revenues,meaning θR > 0. Therefore, by assumption, increases in non-oil revenues raise institutional qualityby lowering ω and raising R. However, increases in oil revenues exert an ambiguous effect oninstitutional quality because more oil raises both ω and R—consistent with assumption #5. Below,the dependence of θ on other parameters will be suppressed when it does not create confusion.
Therefore, if C accepts, in period t the challenger consumes θxt and G consumes the remainingrevenues R −mt − xt. The game then moves to the next period with the same players as govern-ment and challenger. Each player has a linear utility function, and Figure 1 denotes the futurecontinuation values for each player as V G and V C , respectively.
If instead C fights, its probability of winning a center-seeking civil war depends on its contem-poraneous strength. If C is weak, it wins a fight with probability 0 regardless of G’s militaryspending. If C is strong, it wins a fight with probability 1
1+mt. The most natural interpretation
of this assumption is that in strong periods C has an exogenous arms endowment normalized to 1and each side wins a war with probability directly proportional to its share of arms. C becomes thegovernment in period t+ 1 if it wins the war and remains as challenger otherwise. The incumbentgovernment remains in control of the state in period t + 1 with complementary probability mt
1+mtand becomes the challenger if it loses. Neither player consumes in the period of a fight, but a wardoes not alter future revenues.
Two assumptions about C’s option to fight require closer scrutiny. First, the amount of oil revenuesdoes not affect C’s armaments. As established with assumption #1, this captures an overwhelmingempirical trend rather than artificially assumes away a generally relevant conflict-inducing effect ofoil. To motivate this argument, suppose instead G and C each choose armament spending fromseparate endowments. As long as G’s revenues are sufficiently larger, C will optimally spend all itsrevenues to participate in the contest. This corner solution produces identical implications as thesimplifying assumption here that C inherits an exogenous armament endowment. Certainly, if Ccontrolled a large enough percentage of the oil revenues, the findings below would not hold becausemore oil could unambiguously raise the probability of fighting. However, the discussion accompa-nying assumption #1 implies the current setup of the model has stronger empirical foundationsthan this alternative.
Second, many prominent formal theories of civil wars also model stochastic shifts in the distributionof power.68 One plausible microfoundation for this assumption is that societal groups are onlyoccasionally able to solve collective action problems and effectively challenge the government.69
This is natural if we conceptualize the challenger not necessarily as an established rebel group,
67The parameter θ can be thought of as a production function for translating patronage spending into output.Assuming relative state weakness captures that Qatar’s nascent bureaucracy in the 1970s was less effective at trans-lating oil revenues into coveted goods than a bureaucracy in an oil-poor country that had achieved similarly largerevenue streams.
The discussion accompanying assumption #5 also demonstrates why the relevant considerations about institutionalquality—from the perspective of the existing literature—concern the government’s ability to provide valuable servicesfor its population (e.g., Kennedy and Tiede’s 2013 categories of rule of law, government efficiency, and public goodsprovision) rather than affect its ability to translate revenues into coercive capacity. However, if an additionalinstitutional parameter conceptually similar to θ were assumed to impact G’s probability of winning, the findingsbelow would be qualitatively unaltered.
68Fearon 2004; Powell 2012.69Acemoglu and Robinson 2006, 123-128.
15
but instead as a societal actor that occasionally faces opportunities to coerce the government.For example, Iraq’s defeat in the 1991 Gulf War provided a temporary coordination device fordiscontented Shi’a in the south to organize insurgencies known collectively as the Intifida. Similarly,the electoral defeat of incumbent president Denis Nguesso-Sassou in the Republic of Congo in 1992dramatically boosted the ability of a challenger to confront the new government—for as long asNguesso-Sassou could effectively organize his supporters.
A final notable assumption highlights an important scope condition. The model assumes the govern-ment cannot commit to future promises. As shown below, G will only deliver patronage paymentscommensurate to the challenger’s contemporaneous expected utility from fighting. This builds on,for example, Blattman and Miguel’s contention that, “The most intriguing theories of civil warfocus on the cases where credible commitments to peace or redistribution cannot be made evenwith complete information.”70 Walter also discusses the prominence of commitment problem ex-planations for civil wars.71 The no commitment assumption highlights the model’s relevance forstudying weakly institutionalized environments. That is, it provides an appropriate setting forstudying the effects of oil in a country like Saudi Arabia, but not Norway—which was already arich, consolidated democracy prior to discovering oil.
1.3.2 Equilibrium Analysis
Two steps solve for the existence of a Markov Perfect Equilibrium (MPE) that does not involvefighting along the equilibrium path of play, which is shown to be unique when one exists. Afterpresenting the government’s full constrained optimization problem, I first solve for the optimalarmament and patronage offer allocation while assuming these choices satisfy the budget constraint(Lemma 1). The Markov assumption requires the government to choose one level of arms (m∗s)and patronage (x∗s) in each strong period and another level of arms (m∗w) and patronage (x∗w) ineach weak period,72 as well as for the challenger to choose its action based only on whether it isstrong or weak in the current period and on the government’s current-period armaments and offer.Second, I examine conditions under which the armament and patronage offer pair from Lemma 1will be feasible, given the per-period budget constraint (Lemma 2). These two lemmas engender theequilibrium strategy profile (Proposition 1). Concomitant with solving for a peaceful equilibrium,all one-step deviations considered below assume the future path of play is peaceful. Appendix Aproves these results.
As a preliminary result, any equilibrium features (m∗w, x∗w) = (0, 0). Because the government always
prevails over a weak challenger regardless of its arms investment, C accepts any offer. Therefore,G does not arm and sets the patronage offer to 0, meaning C consumes 0 in weak periods. Tominimize notation, (m∗, x∗) will refer to the equilibrium armament and offer pair in a period thechallenger is strong.
To solve for G’s optimal offer in a period C is strong, I first assume an equilibrium allocation(m∗, x∗) exists that will be chosen in all future periods and solve for optimal current-period choices
70Blattman and Miguel 2010, 13.71Walter 2009.72As Appendix A discusses, the following solves for a modified MPE in which G is restricted to considering
Markovian deviations when setting m∗s . Appendix A also discusses the consequences of relaxing this assumption.
16
(mt, xt). I then set the current-period choices equal to the equilibrium terms to solve for theequilibrium amounts.
C’s expected lifetime utility to accepting an offer in a strong period is E[UC(accept | strong)] =θxt + δV C because C consumes θxt in the current period and the expected continuation value ofthe challenger in the future, V C . Because in equilibrium C will consume θx∗ in the σ percentageof future periods it is strong and nothing when weak, V C = σθx∗
1−δ . C’s expected lifetime utility to
fighting is E[UC(fight | strong)] = δ[
11+mt
V G + mt1+mt
V C]
because no consumption occurs in the
fighting period, and if C wins it receives the future continuation value for the government whereaslosing yields the challenger’s future continuation value. This expected utility of fighting termspecifies a one-step deviation from the proposed equilibrium strategy profile because it assumesfuture play is peaceful. Because the government consumes R in periods the challenger is weak
and R − m∗ − x∗ in periods the challenger is strong, V G = R−σ(m∗+x∗)1−δ . Combining terms and
simplifying produces E[UC(fight | strong)] = δ(1−δ)(1+mt)
[R− σ(m∗ + x∗) +mtσθx
∗].
These two expected utility terms for C show how the oil-authoritarianism and oil-civil war mecha-nisms enter the model. The revenue-generating effects of oil (assumption #2) loosen G’s per-periodbudget constraint xt + mt ≤ R (but does not affect the challenger’s budget; assumption #1) byenabling higher levels of military capacity investments and patronage offers (assumption #3). Oilexhibits a prize effect by raising R in the function for C’s expected utility to fighting (assumption#4). Finally, oil engenders relative state weakness because θω < 0 (assumption #5). Within-country oil location does not alter these considerations (assumption #6).
Conditional on mt, G will optimally choose xt to make C indifferent between accepting and fighting
as long as the offer is non-negative: xt = max{
0, δ(1−δ)(1+mt)θ
[R − σ
(m∗ + (1 + θ)x∗
)]}. G
solves the following program in a period C is strong to maximize lifetime utility in a peacefulequilibrium:
maxmt,xt
iiR−mt − xt +δ
1− δ
{R− σ
[mt + x∗(mt)
]}(1)
s.t. (C1) xt ≥ δ(1−δ)(1+mt)θ
{R− σ
[mt + (1 + θ) · x∗(mt)
]}spa (C2) xt ≥ 0spa (C3) mt ≥ 0spa (C4) R ≥ mt + xt,
where x∗(·) is the optimal patronage offer for a given level of military spending. The first twoconstraints require G to make a high enough offer that C will accept, and for this amount tobe non-negative. The third constraint requires non-negative armaments and the fourth requiressatisfying the per-period budget constraint.
I first assume C4 does not bind. Lemma 1 analyzes G’s optimal allocation assuming G can affordthe desired armament amount and patronage offer.
17
Lemma 1. Assuming it is possible for G to buy off C, there is a unique optimal arma-ment and patronage choice. Formally, define (m∗, x∗) as the argument that maximizesEquation 1 subject to C1, C2, and C3. (m∗, x∗) exists and is unique.
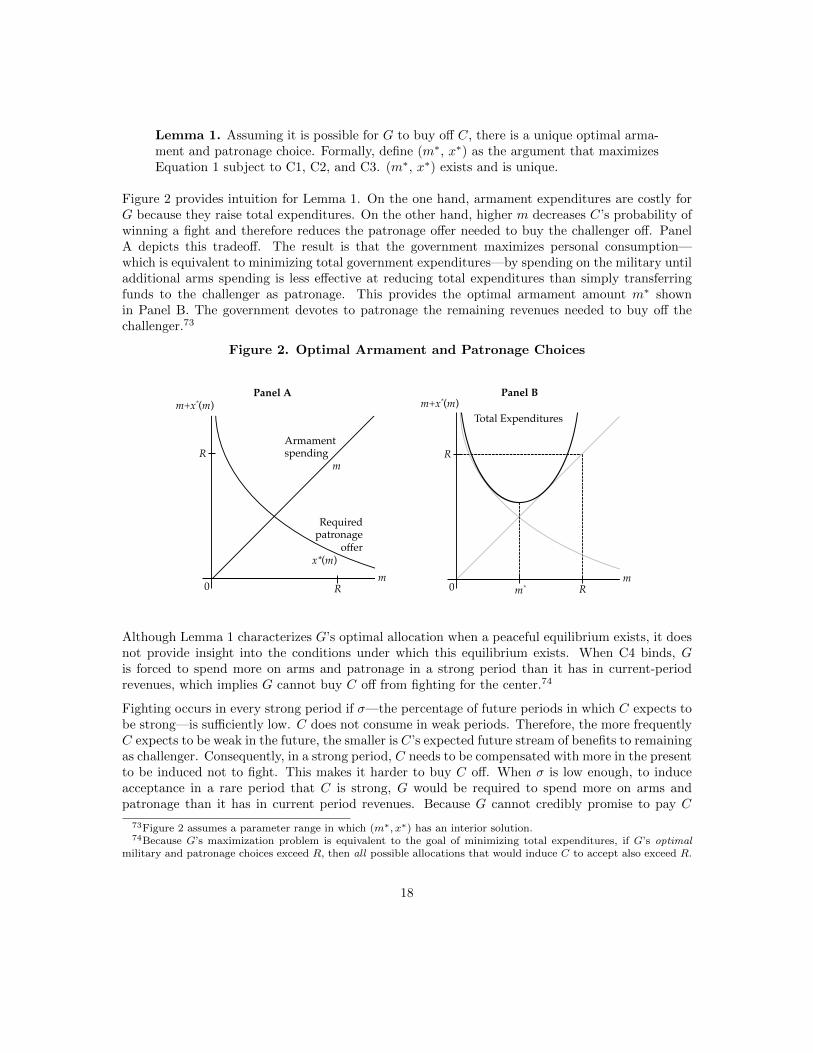
Figure 2 provides intuition for Lemma 1. On the one hand, armament expenditures are costly forG because they raise total expenditures. On the other hand, higher m decreases C’s probability ofwinning a fight and therefore reduces the patronage offer needed to buy the challenger off. PanelA depicts this tradeoff. The result is that the government maximizes personal consumption—which is equivalent to minimizing total government expenditures—by spending on the military untiladditional arms spending is less effective at reducing total expenditures than simply transferringfunds to the challenger as patronage. This provides the optimal armament amount m∗ shownin Panel B. The government devotes to patronage the remaining revenues needed to buy off thechallenger.73
Figure 2. Optimal Armament and Patronage Choices
R!
R!
0!m!
Armament spending! m!
Required patronage !
offer!x*(m)!
R!
R!
0! m*!
m+x*(m)!
m!
Total Expenditures!m+x*(m)!
Panel A! Panel B!
Although Lemma 1 characterizes G’s optimal allocation when a peaceful equilibrium exists, it doesnot provide insight into the conditions under which this equilibrium exists. When C4 binds, Gis forced to spend more on arms and patronage in a strong period than it has in current-periodrevenues, which implies G cannot buy C off from fighting for the center.74
Fighting occurs in every strong period if σ—the percentage of future periods in which C expects tobe strong—is sufficiently low. C does not consume in weak periods. Therefore, the more frequentlyC expects to be weak in the future, the smaller is C’s expected future stream of benefits to remainingas challenger. Consequently, in a strong period, C needs to be compensated with more in the presentto be induced not to fight. This makes it harder to buy C off. When σ is low enough, to induceacceptance in a rare period that C is strong, G would be required to spend more on arms andpatronage than it has in current period revenues. Because G cannot credibly promise to pay C
73Figure 2 assumes a parameter range in which (m∗, x∗) has an interior solution.74Because G’s maximization problem is equivalent to the goal of minimizing total expenditures, if G’s optimal
military and patronage choices exceed R, then all possible allocations that would induce C to accept also exceed R.
18
more than 0 in a weak period, and because G cannot borrow across periods, when σ is low enoughC will fight in response to any offer in a strong period. Lemma 2 characterizes a threshold σ suchthat m∗(σ) + x∗(σ) = R, meaning fighting occurs if σ < σ. When this is the case, the benefitsfrom possibly gaining control of the state in the future outweigh the lost consumption from fighting,considering the low future benefits to remaining as challenger.
Lemma 2. If C is sufficiently patient, there exists a unique value of σ, denoted σ, suchthat G will not be able to buy off C in a strong period if σ < σ. If C is not sufficientlypatient, G will able to buy off C in a strong period regardless of other parameter values.Formally, if δ > δ2 (for δ2 defined in the proof), there exists a unique value σ such thatm∗ + x∗ > R when σ < σ, and m∗ + x∗ < R when σ > σ. If δ < δ2, m∗ + x∗ < R forall σ because σ < 0.
The final consideration for a peaceful equilibrium requires establishing that if σ > σ, G chooses toallocate arms and patronage to induce acceptance from C. Because by assumption fighting destroysall consumption in the current period, whereas G consumes R −m∗ − x∗ (which by definition isstrictly greater than 0 if σ > σ) if C accepts, G would receive strictly lower utility in the currentperiod if a fight occurred. Furthermore, the best possible outcome is that G wins the fight—whichyields the same future continuation value, V G, that G would have received for sure had it boughtC off. Therefore, G also receives strictly lower utility in future periods.75 G’s strict preference tobuy off C when possible is consistent with a large literature that studies the “inefficiency puzzle”in international warfare.76
Combining Lemmas 1 and 2 characterizes strategies in a peaceful equilibrium and the conditionsunder which a peaceful MPE exists. Furthermore, if a peaceful MPE exists, it is unique.
Proposition 1. If σ > σ, in every strong period G chooses (mt, xt) = (m∗, x∗). C
accepts any offer xt ≥ δ(1−δ)(1+mt)θ
[R − σ
(m∗ + (1 + θ)x∗
)]and fights otherwise. In
every weak period, G chooses (mt, xt) = (0, 0) and C accepts any offer. If σ < σ, apeaceful equilibrium does not exist.
1.4 Main Result #1: How Oil Prevents Center-Seeking CivilWars
Flipping the logic of conventional conflict resource curse arguments, oil-generated revenues strengthenthe government and decrease the probability of center-seeking civil wars. Although oil enhances theprize of capturing the state, the government strategically spends oil-generated revenues on military
75Strictly speaking, the assumed order of moves does not allow G to make a low enough offer to induce C to fightin a weak period (because C will accept any offer) nor in a strong period if δ < δ2. However, granting G an explicitchoice to arm and fight, rather than to arm and make an offer, would not change equilibrium actions for the reasonsjust discussed.
76Fearon 1995; Powell 1999.
19
capacity—which lowers the challenger’s probability of winning a fight—and on patronage, whichincreases the challenger’s utility to accepting an offer.
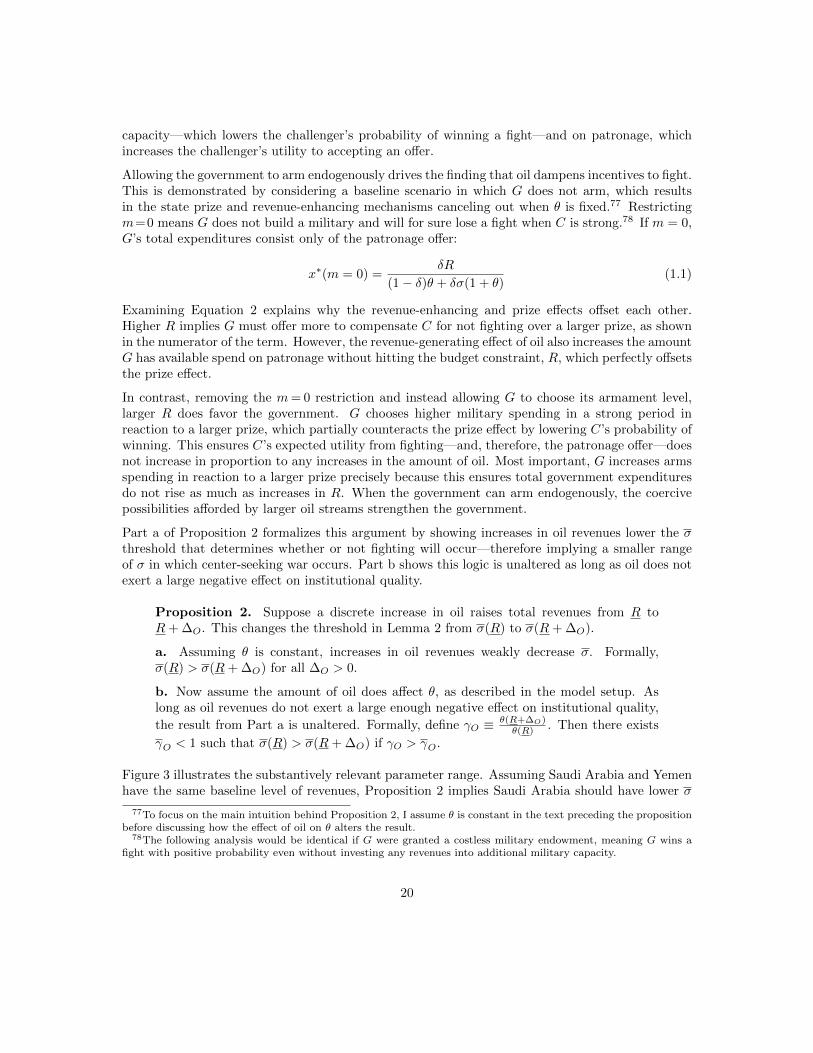
Allowing the government to arm endogenously drives the finding that oil dampens incentives to fight.This is demonstrated by considering a baseline scenario in which G does not arm, which resultsin the state prize and revenue-enhancing mechanisms canceling out when θ is fixed.77 Restrictingm=0 means G does not build a military and will for sure lose a fight when C is strong.78 If m = 0,G’s total expenditures consist only of the patronage offer:
x∗(m = 0) =δR
(1− δ)θ + δσ(1 + θ)(1.1)
Examining Equation 2 explains why the revenue-enhancing and prize effects offset each other.Higher R implies G must offer more to compensate C for not fighting over a larger prize, as shownin the numerator of the term. However, the revenue-generating effect of oil also increases the amountG has available spend on patronage without hitting the budget constraint, R, which perfectly offsetsthe prize effect.
In contrast, removing the m= 0 restriction and instead allowing G to choose its armament level,larger R does favor the government. G chooses higher military spending in a strong period inreaction to a larger prize, which partially counteracts the prize effect by lowering C’s probability ofwinning. This ensures C’s expected utility from fighting—and, therefore, the patronage offer—doesnot increase in proportion to any increases in the amount of oil. Most important, G increases armsspending in reaction to a larger prize precisely because this ensures total government expendituresdo not rise as much as increases in R. When the government can arm endogenously, the coercivepossibilities afforded by larger oil streams strengthen the government.
Part a of Proposition 2 formalizes this argument by showing increases in oil revenues lower the σthreshold that determines whether or not fighting will occur—therefore implying a smaller rangeof σ in which center-seeking war occurs. Part b shows this logic is unaltered as long as oil does notexert a large negative effect on institutional quality.
Proposition 2. Suppose a discrete increase in oil raises total revenues from R toR+ ∆O. This changes the threshold in Lemma 2 from σ(R) to σ(R+ ∆O).
a. Assuming θ is constant, increases in oil revenues weakly decrease σ. Formally,σ(R) > σ(R+ ∆O) for all ∆O > 0.
b. Now assume the amount of oil does affect θ, as described in the model setup. Aslong as oil revenues do not exert a large enough negative effect on institutional quality,
the result from Part a is unaltered. Formally, define γO ≡ θ(R+∆O)θ(R) . Then there exists
γO < 1 such that σ(R) > σ(R+ ∆O) if γO > γO.
Figure 3 illustrates the substantively relevant parameter range. Assuming Saudi Arabia and Yemenhave the same baseline level of revenues, Proposition 2 implies Saudi Arabia should have lower σ
77To focus on the main intuition behind Proposition 2, I assume θ is constant in the text preceding the propositionbefore discussing how the effect of oil on θ alters the result.
78The following analysis would be identical if G were granted a costless military endowment, meaning G wins afight with positive probability even without investing any revenues into additional military capacity.
20
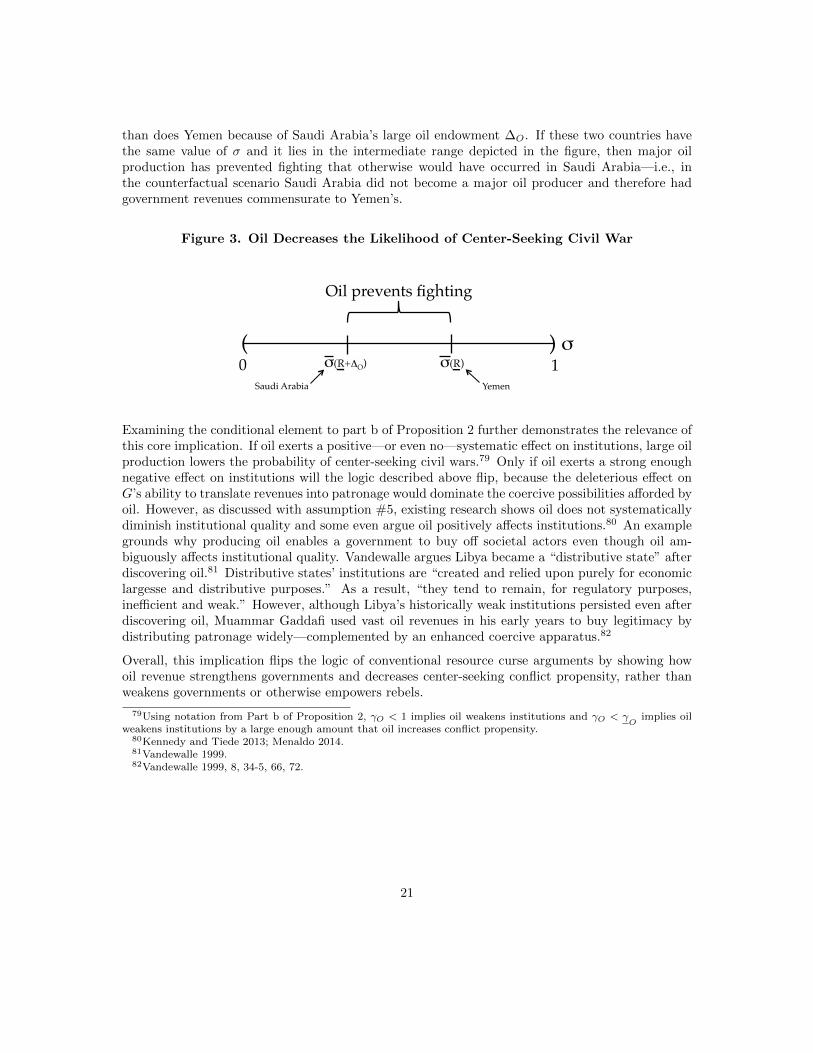
than does Yemen because of Saudi Arabia’s large oil endowment ∆O. If these two countries havethe same value of σ and it lies in the intermediate range depicted in the figure, then major oilproduction has prevented fighting that otherwise would have occurred in Saudi Arabia—i.e., inthe counterfactual scenario Saudi Arabia did not become a major oil producer and therefore hadgovernment revenues commensurate to Yemen’s.
Figure 3. Oil Decreases the Likelihood of Center-Seeking Civil War
0! σ(R+ΔO)! σ(R)! 1!σ!( )
Oil prevents fighting!
Saudi Arabia! Yemen!
Examining the conditional element to part b of Proposition 2 further demonstrates the relevance ofthis core implication. If oil exerts a positive—or even no—systematic effect on institutions, large oilproduction lowers the probability of center-seeking civil wars.79 Only if oil exerts a strong enoughnegative effect on institutions will the logic described above flip, because the deleterious effect onG’s ability to translate revenues into patronage would dominate the coercive possibilities afforded byoil. However, as discussed with assumption #5, existing research shows oil does not systematicallydiminish institutional quality and some even argue oil positively affects institutions.80 An examplegrounds why producing oil enables a government to buy off societal actors even though oil am-biguously affects institutional quality. Vandewalle argues Libya became a “distributive state” afterdiscovering oil.81 Distributive states’ institutions are “created and relied upon purely for economiclargesse and distributive purposes.” As a result, “they tend to remain, for regulatory purposes,inefficient and weak.” However, although Libya’s historically weak institutions persisted even afterdiscovering oil, Muammar Gaddafi used vast oil revenues in his early years to buy legitimacy bydistributing patronage widely—complemented by an enhanced coercive apparatus.82
Overall, this implication flips the logic of conventional resource curse arguments by showing howoil revenue strengthens governments and decreases center-seeking conflict propensity, rather thanweakens governments or otherwise empowers rebels.
79Using notation from Part b of Proposition 2, γO < 1 implies oil weakens institutions and γO < γO
implies oilweakens institutions by a large enough amount that oil increases conflict propensity.
80Kennedy and Tiede 2013; Menaldo 2014.81Vandewalle 1999.82Vandewalle 1999, 8, 34-5, 66, 72.
21
1.5 Main Result #2: Distinguishing the “Relative” ConflictResource Curse Hypothesis
If theoretical reasoning suggests oil exerts an overall effect that depresses propensity for an impor-tant type of civil war, why does existing regression evidence consistently support a conflict resourcecurse? An important reason is that most empirical work tests a relative conflict resource cursehypothesis—by including per capita income as a covariate—but does not assess the overall effectsof oil on conflict. As a preliminary result, Proposition 3 shows large enough increases in non-oilrevenues also decrease the probability of center-seeking civil wars.83
Proposition 3. Suppose a discrete increase in non-oil revenues raises total revenuesfrom R to R+ ∆N . This changes the threshold in Lemma 2 from σ(R) to σ(R+ ∆N ).Increases in non-oil revenues weakly decrease σ. Formally, σ(R) > σ(R + ∆N ) for all∆N > 0.
Proposition 3 closely resembles Proposition 2, and similar conclusions drawn about oil in the pre-vious section also apply to other revenues. Increases in non-oil revenues also lower the σ thresholdneeded to prevent fighting and therefore lower the probability of center-seeking civil war.
The key difference is that non-oil revenues reduce σ by a larger amount. This relative conflictresource curse finding follows directly from the relative state weakness assumption. If we comparetwo countries with the same amount of revenues, the relative state weakness assumption implies thecountry that receives a higher percentage of these revenues from oil will have lower θ. The loweris θ, the less able is G to make attractive patronage offers to C. This implies a larger range of σvalues that are low enough for fighting to occur in equilibrium. Therefore, the probability of center-seeking civil war increases when hypothetically fixing the total amount of government revenuesand increasing the percentage that derives from oil. Proposition 4 summarizes this relative conflictresource curse result.
Proposition 4. Comparing equal-sized increases in oil revenues and non-oil revenues,center-seeking civil war will be less likely after the non-oil revenue increase; althoughtotal government revenues are the same under either intervention, ω is lower after theincrease in non-oil revenues. Formally, for ∆O=∆N , σ(R+ ∆O) > σ(R+ ∆N ).
Figure 4 provides an illustrative example. Even though South Korea and Saudi Arabia have com-parable levels of income per capita—which is closely associated with government revenues—SouthKorea’s government is funded by non-oil revenues whereas Saudi Arabia’s is funded primarily byoil revenues. Proposition 4 implies a country with South Korea’s parameter values is less likely toexperience center-seeking civil wars than a country with Saudi Arabia’s parameter values.
83As discussed in the conclusion, the implications from this section about conflating overall and relative effects arealso relevant for separatist civil wars.
22
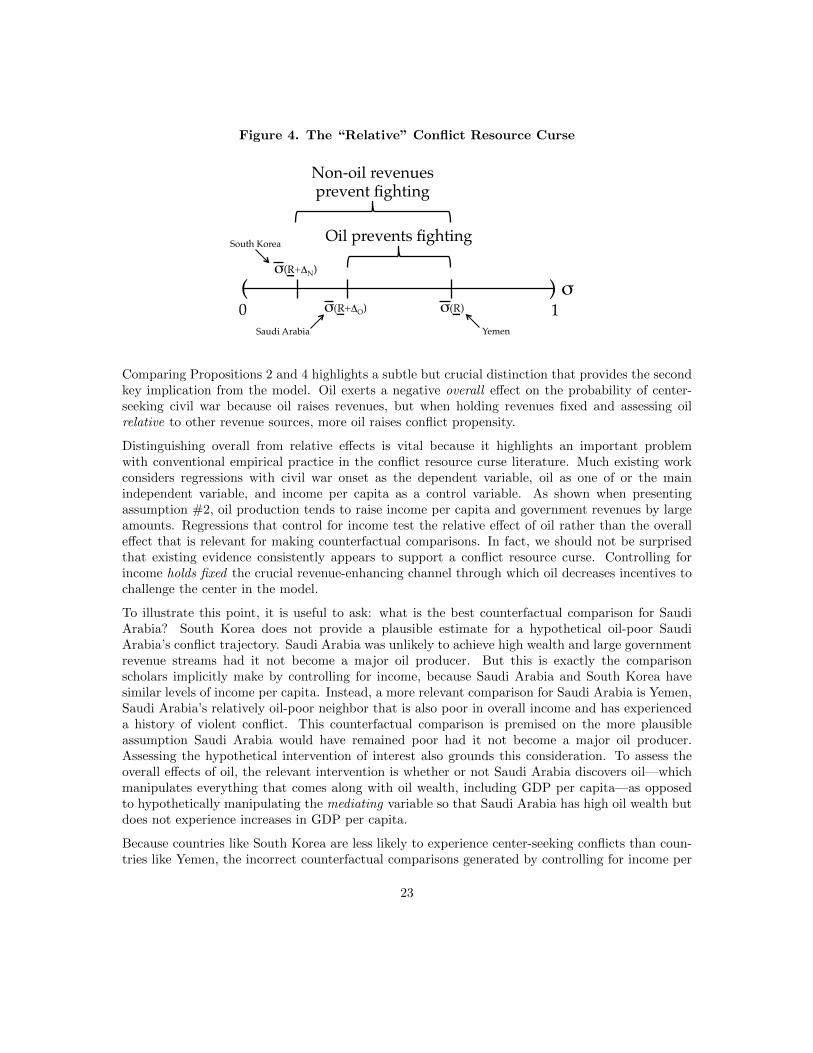
Figure 4. The “Relative” Conflict Resource Curse
0! σ(R+ΔO)! σ(R)! 1!σ!( )
Oil prevents fighting!
σ(R+ΔN)!
Non-oil revenues prevent fighting!
South Korea!
Saudi Arabia! Yemen!
Comparing Propositions 2 and 4 highlights a subtle but crucial distinction that provides the secondkey implication from the model. Oil exerts a negative overall effect on the probability of center-seeking civil war because oil raises revenues, but when holding revenues fixed and assessing oilrelative to other revenue sources, more oil raises conflict propensity.
Distinguishing overall from relative effects is vital because it highlights an important problemwith conventional empirical practice in the conflict resource curse literature. Much existing workconsiders regressions with civil war onset as the dependent variable, oil as one of or the mainindependent variable, and income per capita as a control variable. As shown when presentingassumption #2, oil production tends to raise income per capita and government revenues by largeamounts. Regressions that control for income test the relative effect of oil rather than the overalleffect that is relevant for making counterfactual comparisons. In fact, we should not be surprisedthat existing evidence consistently appears to support a conflict resource curse. Controlling forincome holds fixed the crucial revenue-enhancing channel through which oil decreases incentives tochallenge the center in the model.
To illustrate this point, it is useful to ask: what is the best counterfactual comparison for SaudiArabia? South Korea does not provide a plausible estimate for a hypothetical oil-poor SaudiArabia’s conflict trajectory. Saudi Arabia was unlikely to achieve high wealth and large governmentrevenue streams had it not become a major oil producer. But this is exactly the comparisonscholars implicitly make by controlling for income, because Saudi Arabia and South Korea havesimilar levels of income per capita. Instead, a more relevant comparison for Saudi Arabia is Yemen,Saudi Arabia’s relatively oil-poor neighbor that is also poor in overall income and has experienceda history of violent conflict. This counterfactual comparison is premised on the more plausibleassumption Saudi Arabia would have remained poor had it not become a major oil producer.Assessing the hypothetical intervention of interest also grounds this consideration. To assess theoverall effects of oil, the relevant intervention is whether or not Saudi Arabia discovers oil—whichmanipulates everything that comes along with oil wealth, including GDP per capita—as opposedto hypothetically manipulating the mediating variable so that Saudi Arabia has high oil wealth butdoes not experience increases in GDP per capita.
Because countries like South Korea are less likely to experience center-seeking conflicts than coun-tries like Yemen, the incorrect counterfactual comparisons generated by controlling for income per
23
capita should cause estimates of how oil impacts conflict to be upwardly biased—that is, make oilseem like more of a curse than it actually is when the goal is to assess the overall effects of oil.More technically, controlling for income likely induces large and positive post-treatment bias in theregression estimates.
There is, of course, nothing wrong with studying the effect of oil relative to other revenue sources.The key problem is instead that most existing work conflates the overall and relative resourcecurse hypotheses. Widespread misinterpretation of Fearon and Laitin’s influential so-called “stateweakness” hypothesis exemplifies this concern.84 Fearon and Laitin study the effect of oil withina general model on causes of civil wars. They hypothesize that given the amount of revenue, agovernment is better off receiving these revenues from income taxes than from oil because incometaxes correspond with higher levels of bureaucratic capacity. This is a relative state weaknessargument, and does not imply oil-rich states would have developed large income tax bases had theynot become oil-rich. However, this widely cited argument is almost universally interpreted as: oilexerts an overall effect on weakening governance institutions and raising the probability of civilwar.85 Comparing Propositions 2 and 4 from the model demonstrates the important problem withwhat otherwise may appear to be a minor discrepancy.
1.6 Empirical Evidence
In addition to informing influential debates about how the contending effects of oil affect incentivesto initiate a center-seeking civil war, the main results from the model also imply an importantspecification alteration for cross-national regressions, which have provided the empirical foundationfor the conflict resource curse hypothesis. One set of regressions below uses the same statisticalmodels as much existing research and demonstrates that simply omitting the income control removesa strong positive correlation between oil wealth and center-seeking civil war onset. Furthermore,statistical models that introduce additional justified modifications demonstrate a consistent negativeassociation between oil and center-seeking conflict, and some of the correlations achieve conventionallevels of statistical significance. Overall, the results are more consistent with oil and authoritarianstability implications than oil and civil war arguments—which is striking because they are producedby statistical models similar to the ones that have underpinned the conflict resource curse in existingresearch.
Despite voluminous scholarship on oil and conflict, less research has empirically examined the effectsof oil on center-seeking civil wars specifically. Three contributions that do, however, reach similarconclusions as the broader oil-civil war literature. Buhaug, Wimmer et al., and Ross all find astrong positive effect of oil on center-seeking civil war onset (measured using UCDP/PRIO) inspecifications that control for income per capita.86 Buhaug also includes robustness checks usingFearon’s civil war measure and finds a positive but insignificant effect of oil wealth. These resultsprovide the most direct basis of comparison for the findings presented below.
84Fearon and Laitin 2003, 81; Fearon and Laitin 2006, 2.85Appendix E provides numerous citations.86Buhaug 2006, 700; Wimmer et al. 2009, 333; Ross 2012, 182-3.
24
1.6.1 Results from Existing Models:Implications of Conflating Overall and Relative Effects
The first set of results replicate statistical models from Ross—which closely resemble those from thebroader conflict resource literature—and compare specifications that include a per capita incomecontrol to those that do not.87 Annual log oil income per capita (lagged one year) is used to measureoil wealth. I use two civil war datasets to code onsets, UCDP/PRIO and Fearon. For both, I onlyinclude center-seeking civil wars. Ross’ dataset also provides additional covariates including annuallog total per capita income (lagged one year), a set of region dummies, and control variables fromFearon and Laitin: log population, ethnic fractionalization, religious fractionalization, log of percentmountainous terrain, a dummy for noncontiguous states, a dummy for new states, Polity, Politysquared, and political instability.88 The data range from 1960 to 2006 with broad global coverage.The logistic regression models include temporal dependence controls and cluster standard errors bycountry.
Panel A of Table 3 uses UCDP/PRIO data to measure center-seeking civil war onset and Panel Buses Fearon’s data. Odd-numbered columns control for per capita income whereas even-numberedcolumns do not. To make the paired specifications directly comparable, the even-numbered columnsexclude observations missing per capita income data. The five sets of paired specifications drawfrom the full-sample robustness checks in Ross.89 Columns 1 and 2 estimate a core model thatadditionally controls for population. Columns 3 and 4 add the Fearon and Laitin controls to thecore model. Columns 5 and 6 add region dummies to the core model. Columns 7 and 8 estimatethe core model but exclude countries from the Middle East and North Africa. Columns 9 and 10estimate the core model but exclude Iraq and Iran, whose “colonial histories . . . arguably makethem special cases and unusually prone to conflict.”90
87Ross 2012.88Fearon and Laitin 2003.89Ross 2012, 185.90Ross 2012, 185.
25
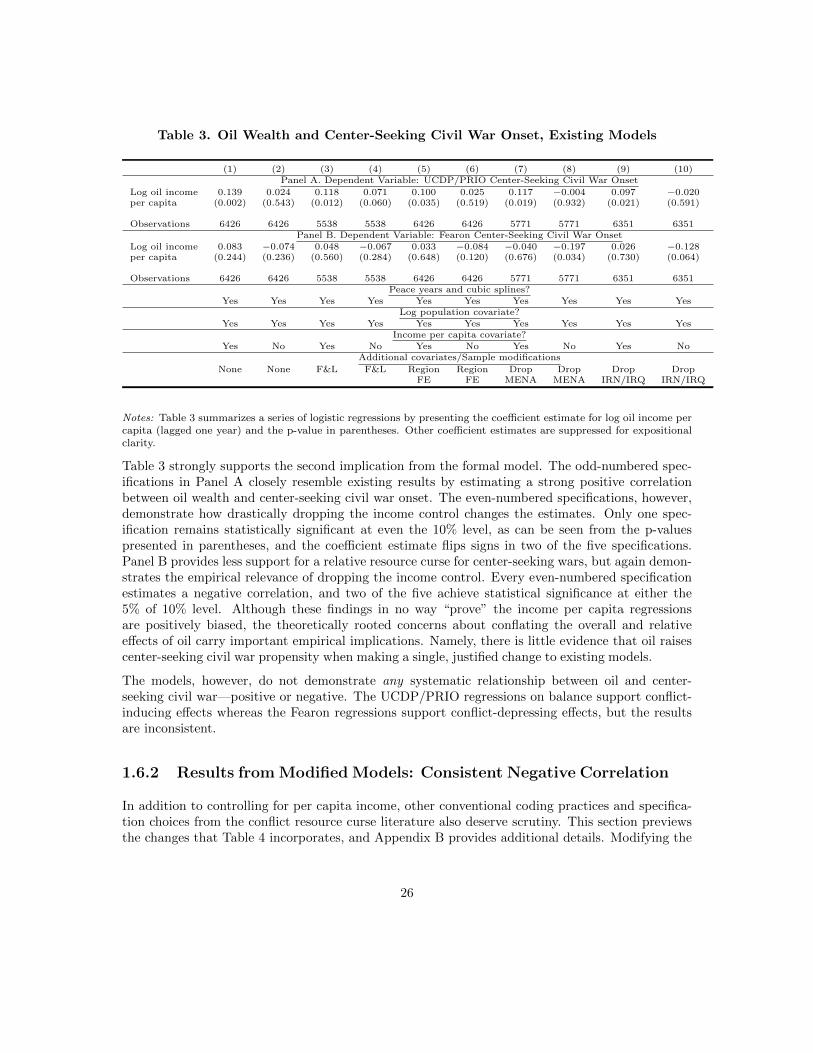
Table 3. Oil Wealth and Center-Seeking Civil War Onset, Existing Models
(1) (2) (3) (4) (5) (6) (7) (8) (9) (10)Panel A. Dependent Variable: UCDP/PRIO Center-Seeking Civil War Onset
Log oil income 0.139 0.024 0.118 0.071 0.100 0.025 0.117 −0.004 0.097 −0.020per capita (0.002) (0.543) (0.012) (0.060) (0.035) (0.519) (0.019) (0.932) (0.021) (0.591)
Observations 6426 6426 5538 5538 6426 6426 5771 5771 6351 6351Panel B. Dependent Variable: Fearon Center-Seeking Civil War Onset
Log oil income 0.083 −0.074 0.048 −0.067 0.033 −0.084 −0.040 −0.197 0.026 −0.128per capita (0.244) (0.236) (0.560) (0.284) (0.648) (0.120) (0.676) (0.034) (0.730) (0.064)
Observations 6426 6426 5538 5538 6426 6426 5771 5771 6351 6351Peace years and cubic splines?
Yes Yes Yes Yes Yes Yes Yes Yes Yes YesLog population covariate?
Yes Yes Yes Yes Yes Yes Yes Yes Yes YesIncome per capita covariate?
Yes No Yes No Yes No Yes No Yes NoAdditional covariates/Sample modifications
None None F&L F&L Region Region Drop Drop Drop DropFE FE MENA MENA IRN/IRQ IRN/IRQ
Notes: Table 3 summarizes a series of logistic regressions by presenting the coefficient estimate for log oil income percapita (lagged one year) and the p-value in parentheses. Other coefficient estimates are suppressed for expositionalclarity.
Table 3 strongly supports the second implication from the formal model. The odd-numbered spec-ifications in Panel A closely resemble existing results by estimating a strong positive correlationbetween oil wealth and center-seeking civil war onset. The even-numbered specifications, however,demonstrate how drastically dropping the income control changes the estimates. Only one spec-ification remains statistically significant at even the 10% level, as can be seen from the p-valuespresented in parentheses, and the coefficient estimate flips signs in two of the five specifications.Panel B provides less support for a relative resource curse for center-seeking wars, but again demon-strates the empirical relevance of dropping the income control. Every even-numbered specificationestimates a negative correlation, and two of the five achieve statistical significance at either the5% of 10% level. Although these findings in no way “prove” the income per capita regressionsare positively biased, the theoretically rooted concerns about conflating the overall and relativeeffects of oil carry important empirical implications. Namely, there is little evidence that oil raisescenter-seeking civil war propensity when making a single, justified change to existing models.
The models, however, do not demonstrate any systematic relationship between oil and center-seeking civil war—positive or negative. The UCDP/PRIO regressions on balance support conflict-inducing effects whereas the Fearon regressions support conflict-depressing effects, but the resultsare inconsistent.
1.6.2 Results from Modified Models: Consistent Negative Correlation
In addition to controlling for per capita income, other conventional coding practices and specifica-tion choices from the conflict resource curse literature also deserve scrutiny. This section previewsthe changes that Table 4 incorporates, and Appendix B provides additional details. Modifying the
26
statistical models from Table 3 demonstrates stronger support for implications from authoritarian-ism research than for a center-seeking conflict resource curse.
Of the following, the most consequential revision addresses how conflict incidence data from theUCDP/PRIO Armed Conflict Database is translated into civil war onsets, as Appendix B.1 dis-cusses. The UCDP/PRIO dataset codes whether or not a particular government-rebel interactionproduces at least 25 battle deaths in a given year but does not explicitly code when distinct civilwars start or end.91 Most empirical work uses a two-year lapse rule to code conflict onset. If aparticular government-rebel dyad crosses the 25 death threshold, but is followed by at least twoyears in which the annual battle death toll remains under 25, then any future years with at least 25battle deaths are coded as a new civil war. As Fearon and Laitin assert, however, this onset rule issomewhat arbitrary and tends to overcount onsets for long-running conflicts that periodically exceedthe 25 death threshold.92 I have revised UCDP/PRIO center-seeking onset years using Fearon andLaitin’s more systematic procedure for coding conflict initiation and termination.93 Additionally, Ido not count coup attempts with large death tolls as center-seeking civil wars for reasons discussedin Appendix B.1.
Existing results also usually include cases that fall outside the scope of conflict resource cursehypotheses, as Appendix B.2 details. The formal model presented here assumes a weakly insti-tutionalized environment—as implicitly do most theories in the conflict resource curse literature.Excluding OECD members therefore removes countries that are largely irrelevant for the hypothesis.Furthermore, it is also appropriate to exclude occupied countries (whether colonized or otherwiseforcibly controlled) because conflicts in these countries usually revolve around overthrowing the oc-cupying country, which is very different in nature from a civil war. Finally, Appendix B.3 discussesadditional minor changes.
The Table 4 specifications correspond to those from Table 3 but incorporate these changes. Theoil coefficient estimate is negative in every specification without the income control. Furthermore,many of the correlations in even-numbered specifications achieve conventional levels of statisticalsignificance. The models also estimate a sizable conflict-depressing effect for oil. In Column 2 ofPanel A, for example, increasing annual oil income per capita from $0 to $1,000 predicts a decreasein center-seeking civil war propensity of 37%.
91Other applied research has acknowledged this issue. For example, when discussing how to code repeat civil wars,Walter (2014, 9) states the Armed Conflict Database “does not provide any scheme for identifying when exactly civilwars begin and end and, therefore, does not define an episode of civil war” [emphasis in original].
92Fearon and Laitin 2013, 25.93Fearon and Laitin 2003, 76, fn. 4.
27
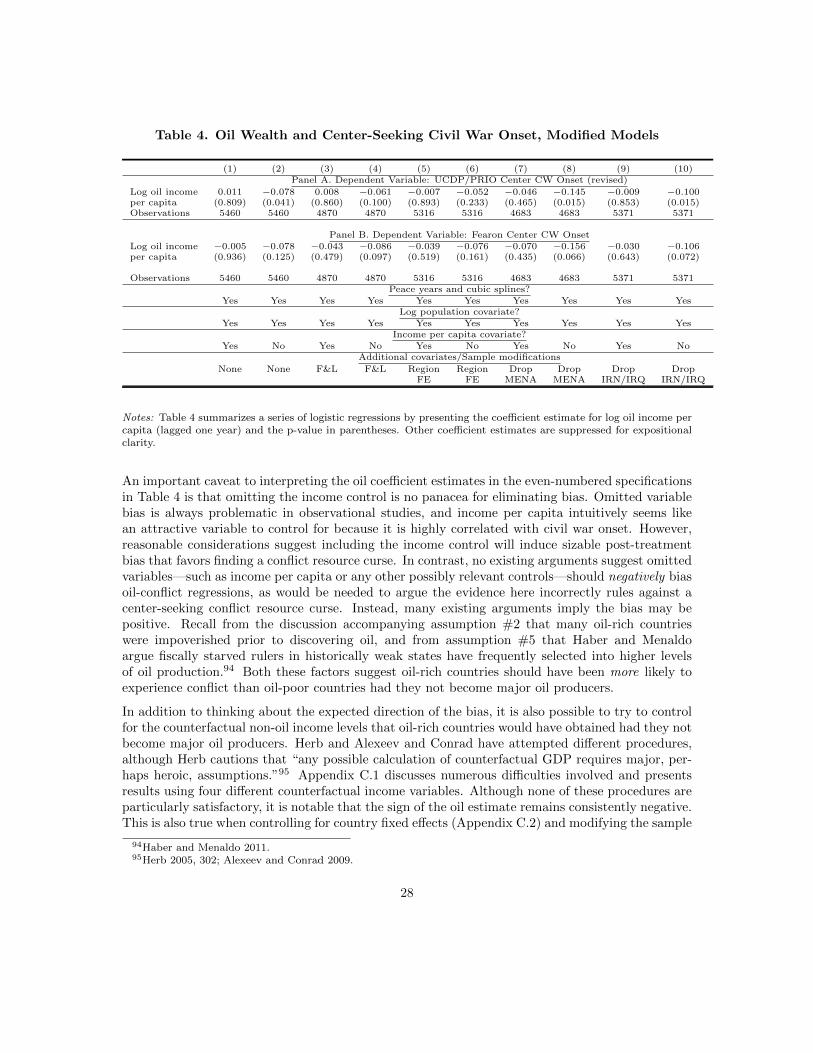
Table 4. Oil Wealth and Center-Seeking Civil War Onset, Modified Models
(1) (2) (3) (4) (5) (6) (7) (8) (9) (10)Panel A. Dependent Variable: UCDP/PRIO Center CW Onset (revised)
Log oil income 0.011 −0.078 0.008 −0.061 −0.007 −0.052 −0.046 −0.145 −0.009 −0.100per capita (0.809) (0.041) (0.860) (0.100) (0.893) (0.233) (0.465) (0.015) (0.853) (0.015)Observations 5460 5460 4870 4870 5316 5316 4683 4683 5371 5371
Panel B. Dependent Variable: Fearon Center CW OnsetLog oil income −0.005 −0.078 −0.043 −0.086 −0.039 −0.076 −0.070 −0.156 −0.030 −0.106per capita (0.936) (0.125) (0.479) (0.097) (0.519) (0.161) (0.435) (0.066) (0.643) (0.072)
Observations 5460 5460 4870 4870 5316 5316 4683 4683 5371 5371Peace years and cubic splines?
Yes Yes Yes Yes Yes Yes Yes Yes Yes YesLog population covariate?
Yes Yes Yes Yes Yes Yes Yes Yes Yes YesIncome per capita covariate?
Yes No Yes No Yes No Yes No Yes NoAdditional covariates/Sample modifications
None None F&L F&L Region Region Drop Drop Drop DropFE FE MENA MENA IRN/IRQ IRN/IRQ
Notes: Table 4 summarizes a series of logistic regressions by presenting the coefficient estimate for log oil income percapita (lagged one year) and the p-value in parentheses. Other coefficient estimates are suppressed for expositionalclarity.
An important caveat to interpreting the oil coefficient estimates in the even-numbered specificationsin Table 4 is that omitting the income control is no panacea for eliminating bias. Omitted variablebias is always problematic in observational studies, and income per capita intuitively seems likean attractive variable to control for because it is highly correlated with civil war onset. However,reasonable considerations suggest including the income control will induce sizable post-treatmentbias that favors finding a conflict resource curse. In contrast, no existing arguments suggest omittedvariables—such as income per capita or any other possibly relevant controls—should negatively biasoil-conflict regressions, as would be needed to argue the evidence here incorrectly rules against acenter-seeking conflict resource curse. Instead, many existing arguments imply the bias may bepositive. Recall from the discussion accompanying assumption #2 that many oil-rich countrieswere impoverished prior to discovering oil, and from assumption #5 that Haber and Menaldoargue fiscally starved rulers in historically weak states have frequently selected into higher levelsof oil production.94 Both these factors suggest oil-rich countries should have been more likely toexperience conflict than oil-poor countries had they not become major oil producers.
In addition to thinking about the expected direction of the bias, it is also possible to try to controlfor the counterfactual non-oil income levels that oil-rich countries would have obtained had they notbecome major oil producers. Herb and Alexeev and Conrad have attempted different procedures,although Herb cautions that “any possible calculation of counterfactual GDP requires major, per-haps heroic, assumptions.”95 Appendix C.1 discusses numerous difficulties involved and presentsresults using four different counterfactual income variables. Although none of these procedures areparticularly satisfactory, it is notable that the sign of the oil estimate remains consistently negative.This is also true when controlling for country fixed effects (Appendix C.2) and modifying the sample
94Haber and Menaldo 2011.95Herb 2005, 302; Alexeev and Conrad 2009.
28
in additional ways suggested by Ross (Appendix C.3).96 Finally, Appendix D provides qualitativeevidence. Supporting the absence of statistical evidence for a center-seeking conflict resource curse,the cases show that appealing to oil can explain less than a handful of major center-seeking civilwar onsets.
1.7 Conclusion
This article presented a game theoretic model explaining why oil wealth should decrease center-seeking civil war propensity. The theoretical framework jointly evaluated oil’s revenue-enhancingand vulnerability effects to explain why mechanisms proposed by oil-authoritarianism researchshould dominate mechanisms from the oil-civil war literature. The model analysis also distinguishedbetween the overall and relative effects of oil, which suggested the widespread empirical practiceof controlling for per capita income should yield upwardly biased oil-conflict estimates. Usingimplications from the formal model to revise conventional statistical models in the conflict resourcecurse literature provided evidence more consistent with authoritarian stability arguments than witha center-seeking conflict resource curse.
The formal model presented here incorporated distinctive aspects of oil production to extend conflictbargaining games originally developed to explain international warfare. This theoretical approachcarries broad implications for studying the “resource curse” debated by scholars across internationalrelations and comparative politics. The model not only provides insight into competing resourcecurse arguments and applies them to studying center-seeking civil wars, but also delivers theoreticaland empirical implications for oil and separatist civil wars. This article argued the within-countrylocation of oil reserves should strongly affect prospects for separatist wars but not center-seekingwars. Regarding separatist wars, other conflict resource curse theories argue oil production in eth-nic minority areas causes deep grievances and raises separatist civil war propensity because thegovernment redistributes wealth away from the ethnic group’s territory.97 However, revisiting Ta-ble 2, although the revenue-enhancing effects of oil may work less effectively when the governmentfights away from the capital, this does not imply oil wealth should strongly impede government-challenger bargaining. Furthermore, existing contributions often do not clearly answer questionsabout why oil—as opposed to other sources of revenue—causes such strong grievances, nor whatprevents the government from strategically reducing these grievances to facilitate peaceful bargain-ing. These questions motivate [AUTHOR]’s extension of the framework presented here to study oiland separatist civil wars.
An additional implication from distinguishing the heterogeneous effects of oil location on differenttypes of civil wars is that country-level oil income measures should only be relevant for testingtheories about center-seeking wars, whereas oil-separatism theories should instead be tested withsubnational data. Because location conditions whether oil should increase or decrease separatistcivil war propensity, there should not be any clear trends in country-level data. Appendix SectionC.4 shows this implication is indeed validated when replicating Tables 3 and 4 for either separatistwars only or all types of civil wars. These additional empirical results also demonstrate the broader
96Ross 2012, 154.97Sorens 2011, 574-5; Ross 2012, 151-2.
29
importance of the formal model’s implication about post-treatment bias induced by controlling forincome per capita for evaluating the conflict resource curse.
This article has also shown how seemingly disparate resource curse debates—about conflict, au-thoritarianism, and even economic development (see assumption #2)—can inform each other. Theimplications from the formal model might therefore also help reconcile competing empirical find-ings about oil and democracy. Alternative theories presented in critiques of earlier conclusionsthat oil hinders democracy do not focus on how governments can strategically combine coercionand patronage to reduce incentives for violent rebellions or pro-democracy movements.98 However,the scope conditions from the model appear relevant for explaining why highly uncompetitive andoil-rich authoritarian regimes rarely democratize—because oil revenues can be used to deter andbuy off popular protests.99
Considering these additional applications to separatist civil wars and democratization, using thetheoretical approach pursued here in future work should help narrow the differences between broadarguments for and against an oil curse.
1.8 References
Acemoglu, Daron and James A. Robinson. 2006. Economic Origins of Dictatorship and Democracy.Cambridge University Press: New York.
al-Khatteeb, Luay. 2014. “How Iraq’s black market in oil funds ISIS.” CNN.http://edition.cnn.com/2014/08/18/business/al-khatteeb-isis-oil-iraq/index.html.
Alexeev, Michael and Robert Conrad. 2009. “The Elusive Curse of Oil.” The Review of Economicsand Statistics, 91(3): 586-598.
Alnasrawi, Abbas. 1994. The Economy of Iraq: Oil, Wars, Destruction of Development andProspects, 1950-2010. Greenwood Press: Westport, CT.
Basedau, Matthias and Jann Lay. 2009. “Resource Curse or Rentier Peace? The AmbiguousEffects of Oil Wealth and Oil Dependence on Violent Conflict.” Journal of Peace Research, 46(6):757-776.
Bellin, Eva. 2004. “The Robustness of Authoritarianism in the Middle East: Exceptionalism inComparative Perspective.” Comparative Politics, 36(2): 139-157.
Besley, Timothy and Torsten Persson. 2011. Pillars of Prosperity: The Political Economics ofDevelopment Clusters. Princeton University Press: Princeton.
Blair, Graeme. 2014. “On the Geography of Assets and Citizens How Proximity to Oil ProductionShapes Political Order.” Ph.D. Dissertation, Princeton University, Department of Politics.
Blattman, Christopher and Edward Miguel. 2010. “Civil War.” Journal of Economic Literature,48(1): 3-57.
98Menaldo 2014; Brooks and Kurtz 2015.99Some existing empirical results support this conditional oil-democracy hypothesis, e.g., Wiens et al. 2014.
30
Brooks, Sarah and Marcus Kurtz. 2015. “Oil and Democracy: Endogenous Natural Resourcesand the Political ‘Resource Curse.”’ Working paper, Department of Political Science, Ohio StateUniversity.
Buhaug, Halvard. 2006. “Relative Capability and Rebel Objective in Civil War.” Journal of PeaceResearch, 43(6): 691-708.
Buhaug, Halvard. 2010. “Dude, Where’s My Conflict? LSG, Relative Strength, and the Locationof Civil War.” Conflict Management and Peace Science, 27(2): 107-128.
Burns, John F. and Kirk Semple. 2006. “U.S. Finds Iraq Insurgency Has Funds to Sustain Itself.”New York Times, November 26, 2006. http://www.nytimes.com/2006/11/26/world/middleeast/26insurgency.html?pagewanted=all& r=0.
Chaudhry, Kiren Aziz. 1997. The Price of Wealth: Economies and Institutions in the Middle East.Cornell University Press: Ithaca.
Colgan, Jeff D. 2013. Petro-Aggression: When Oil Causes War. Cambridge University Press: NewYork.
Colgan, Jeff D. 2014. “Oil, Domestic Conflict, and Opportunities for Democratization.” Journalof Peace Research, forthcoming.
Collier, Paul and Anke Hoeffler. 2004. “Greed and grievance in civil war.” Oxford EconomicPapers, 56(4): 563-595.
Cotet, Anca M. and Kevin K. Tsui. 2013. “Oil and Conflict: What Does the Cross CountryEvidence Really Show?” American Economic Journal: Macroeconomics, 5(1): 49-80.
Crystal, Jill. 1995. Oil and Politics in the Gulf: Rulers and Merchants in Kuwait and Qatar.Cambridge University Press: New York.
Dilanian, Ken. 2014. “ISIS Became the Richest Terrorist Group Ever By Raising Money Like aMafia.” Business Insider, September 14, 2014. http://www.businessinsider.com/isis-became-the-richest-terrorist-group-ever-by-raising-money-like-a-mafia-2014-9.
Fearon, James D. 1995. “Rationalist Explanations for War.” International Organization, 49(3):379-414.
Fearon, James D. 2004. “Why do some civil wars last so much longer than others?” Journal ofPeace Research, 41(3): 275-301.
Fearon, James D. 2005. “Primary Commodity Exports and Civil War.” Journal of Conflict Reso-lution, 49(4): 483-507.
Fearon, James D. 2008. “Economic Development, Insurgency, and Civil War.” In Ed. ElhananHelpman Institutions and Economic Performance, Harvard University Press: Cambridge.
Fearon, James D. and David D. Laitin. 2003. “Ethnicity, Insurgency, and Civil War.” AmericanPolitical Science Review, 97(1): 75-90.
Fearon, James D. and David D. Laitin. 2006. “Random Narrative: Iraq.”
Fearon, James D. and David D. Laitin. 2013. “How Persistent is Armed Conflict?” Paper preparedfor APSA 2012.
31
Garfinkel, Michelle R. and Stergios Skaperdas. 2006. “Economics of Conflict: An Overview.”Prepared for Handbook of Defense Economics, Vol. 2.
Gause, F. Gregory. 1994. Oil Monarchies: Domestic and Security Challenges in the Arab GulfStates. Council on Foreign Relations: New York.
Haber, Stephen and Victor Menaldo. 2011. “Do Natural Resources Fuel Authoritarianism? AReappraisal of the Resource Curse.” American Political Science Review, 105(1): 1-26.
Hegre, Havard and Nicholas Sambanis. 2006. “Sensitivity Analysis of Empirical Results on CivilWar Onset.” Journal of Conflict Resolution, 50(4): 508-535.
Herb, Michael. 2005. “No Representation Without Taxation? Rents, Development, and Democ-racy.” Comparative Politics, 37(3): 297-316.
Herbst, Jeffrey. 2000. States and Power in Africa: Comparative Lessons in Authority and Control.Princeton University Press: New Jersey.
Hertog, Steffen. 2010. Princes, Brokers, and Bureaucrats: Oil and the State in Saudi Arabia.Cornell University Press: Ithaca, NY.
Humphreys, Macartan. 2005. “Natural Resources, Conflict, and Conflict Resolution: Uncoveringthe Mechanisms.” Journal of Conflict Resolution, 49(4): 508-537.
Karl, Terry Lynn. 1997. The Paradox of Plenty: Oil Booms and Petro-States. California UniversityPress: Berkeley.
Kennedy, Ryan and Lydia Tiede. 2013. “Economic Development Assumptions and the ElusiveCurse of Oil.” International Studies Quarterly, 57: 760-771.
Laitin, David D. 2007. Nations, States, and Violence. Oxford University Press: New York.
Lei, Yu-Hsiang and Guy Michaels. 2014. “Do giant oilfields fuel internal armed conflicts?” Journalof Development Economics, 110: 139-157.
Lynch, Marc. 2012. The Arab Uprising: The Unfinished Revolutions of the New Middle East.Public Affairs.
Macris, Jeffrey R. 2010. The Politics and Security of the Gulf: Anglo-American Hegemony and theShaping of a Region. Routledge: London.
Mehlum, Halvor, Karl Moene, and Ragnar Torvik. 2006. “Institutions and the Resource Curse.”Economic Journal, 116: 1-20.
Meichtry, Stacy and Sam Schechner. 2015. “Airstrikes, Oil Prices Hit Islamic State’s Funding.”Wall Street Journal, Feb. 25, 2015. http://www.wsj.com/articles/airstrikes-oil-prices-hit-islamic-states-funding-1425054098.
Menaldo, Victor. 2014. “From Institutions Curse to Resource Blessing.” Working book manuscript.
Morrison, Kevin M. 2012. “Oil, Conflict, and Stability.” Working Paper.
Olsson, Ola and Heather Congdon Fors. 2004. “Congo: The Prize of Predation.” Journal of PeaceResearch, 41(3): 321-336.
Powell, Robert. 1999. In the Shadow of Power. Princeton University Press: New Jersey.
32
Powell, Robert. 2012. “Persistent Fighting and Shifting Power.” American Journal of PoliticalScience.
PRIO. 2014. “Data on Armed Conflict.” http://www.prio.no/Data/Armed-Conflict.
Robinson, James A., Ragnar Torvik, and Thierry Verdier. 2006. “Political Foundations of theResource Curse.” Journal of Development Economics, 79(2): 447-468.
Ross, Michael L. 2001. “Does Oil Hinder Democracy?” World Politics, 53: 325-361.
Ross, Michael L. 2004. “How Do Natural Resources Influence Civil War? Evidence from ThirteenCases.” International Organization, 58: 35-67.
Ross, Michael L. 2012. The Oil Curse: How Petroleum Wealth Shapes the Development of Nations.Princeton University Press: Princeton.
Ross, Michael L. 2013. “The Politics of the Resource Curse: A Review.” Forthcoming in theHandbook on the Politics of Development.
Sachs, Jeffrey. D. and Andrew. M. Warner. 1997. “Natural resource abundance and economicgrowth.” Cambridge, MA: Center for International Development and Harvard Institute for Inter-national Development.
Smith, Benjamin. 2004. “Oil Wealth and Regime Survival in the Developing World, 1960-1999.”American Journal of Political Science, 48(2): 232-246.
Sorens, Jason. 2011. “Mineral Production, Territory, and Ethnic Rebellion: The Role of RebelConstituencies.” Journal of Peace Research, 48(5): 571-585.
Tilly, Charles. 1992. Coercion, Capital, and European States: AD 990-1992. Blackwell: Cambridge,MA.
Vandewalle, Dirk. 1999. Libya Since Independence: Oil and State-Building. Cornell UniversityPress: Ithaca.
Walter, Barbara F. 2009. “Bargaining Failure and Civil War.” Annual Review of Political Science,12: 243-61.
Walter, Barbara F. 2014. “Why Bad Governance Leads to Repeat Civil War.” Journal of ConflictResolution, forthcoming.
Wiens, David, Paul Poast, and William Roberts Clark. 2014. “The Political Resource Curse: AnEmpirical Re-evaluation.” Political Research Quarterly, forthcoming.
Wimmer, Andreas, Lars-Erik Cederman, and Brian Min. 2009. “Ethnic politics and armed conflict.A configurational analysis of a new global dataset.” American Sociological Review, 74(2): 316-337.
Wright, Joseph, Erica Frantz, and Barbara Geddes. 2013. “Oil and Autocratic Regime Survival.”British Journal of Political Science, forthcoming.
Zahlan, Rosemarie Said. 1989. The Making of the Modern Gulf States. Unwin Hyman: Lon-don.
33
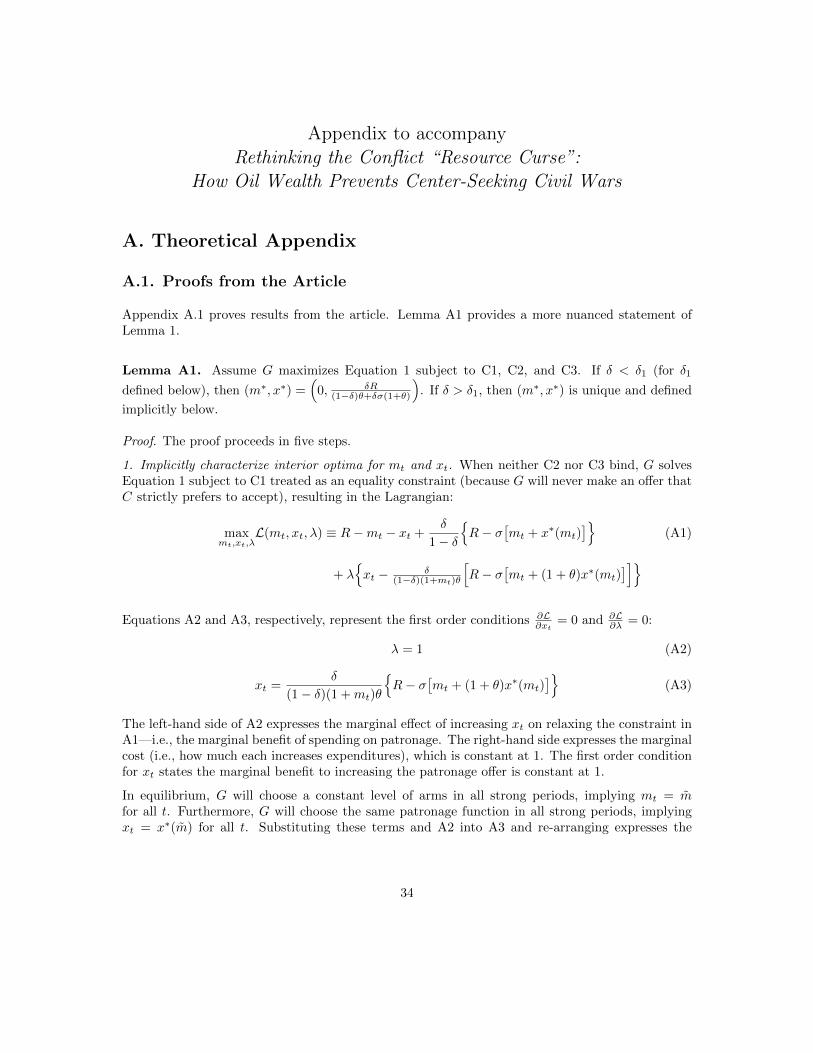
Appendix to accompanyRethinking the Conflict “Resource Curse”:
How Oil Wealth Prevents Center-Seeking Civil Wars
A. Theoretical Appendix
A.1. Proofs from the Article
Appendix A.1 proves results from the article. Lemma A1 provides a more nuanced statement ofLemma 1.
Lemma A1. Assume G maximizes Equation 1 subject to C1, C2, and C3. If δ < δ1 (for δ1
defined below), then (m∗, x∗) =(
0, δR(1−δ)θ+δσ(1+θ)
). If δ > δ1, then (m∗, x∗) is unique and defined
implicitly below.
Proof. The proof proceeds in five steps.
1. Implicitly characterize interior optima for mt and xt. When neither C2 nor C3 bind, G solvesEquation 1 subject to C1 treated as an equality constraint (because G will never make an offer thatC strictly prefers to accept), resulting in the Lagrangian:
maxmt,xt,λ
L(mt, xt, λ) ≡ R−mt − xt +δ
1− δ
{R− σ
[mt + x∗(mt)
]}(A1)
spacespacespacespacespacespacespi+ λ{xt − δ
(1−δ)(1+mt)θ
[R− σ
[mt + (1 + θ)x∗(mt)
]]}Equations A2 and A3, respectively, represent the first order conditions ∂L
∂xt= 0 and ∂L
∂λ = 0:
λ = 1 (A2)
xt =δ
(1− δ)(1 +mt)θ
{R− σ
[mt + (1 + θ)x∗(mt)
]}(A3)
The left-hand side of A2 expresses the marginal effect of increasing xt on relaxing the constraint inA1—i.e., the marginal benefit of spending on patronage. The right-hand side expresses the marginalcost (i.e., how much each increases expenditures), which is constant at 1. The first order conditionfor xt states the marginal benefit to increasing the patronage offer is constant at 1.
In equilibrium, G will choose a constant level of arms in all strong periods, implying mt = mfor all t. Furthermore, G will choose the same patronage function in all strong periods, implyingxt = x∗(m) for all t. Substituting these terms and A2 into A3 and re-arranging expresses the
34
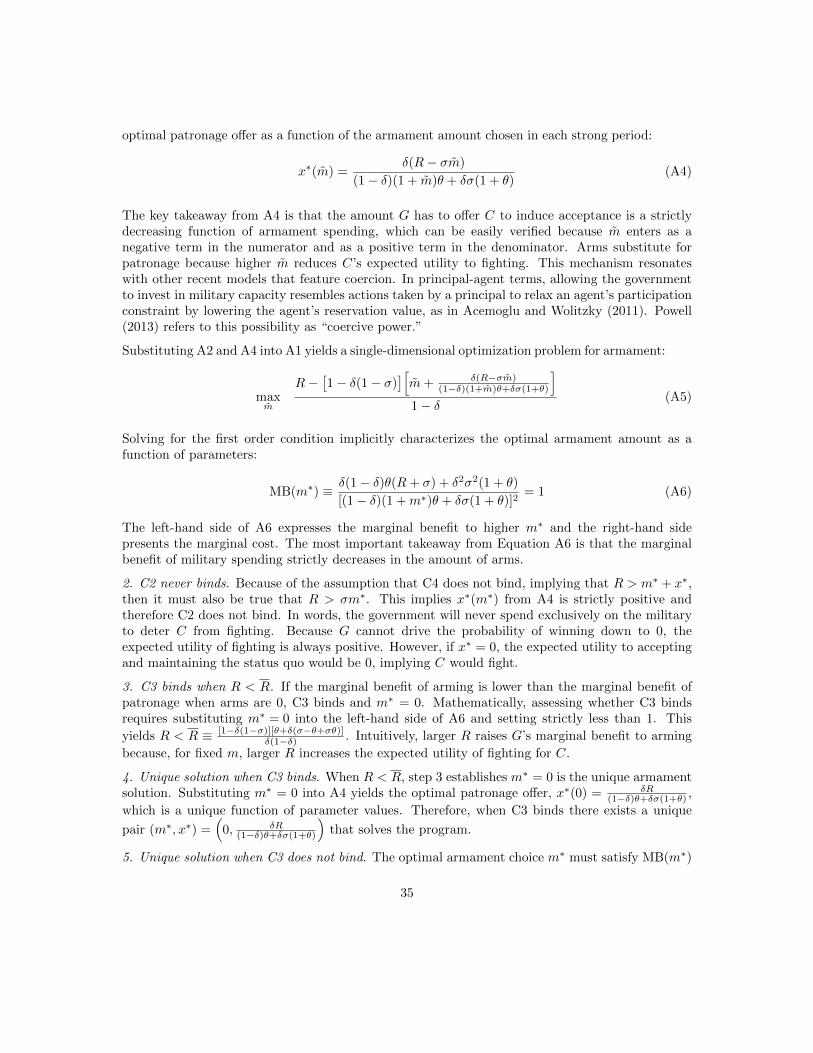
optimal patronage offer as a function of the armament amount chosen in each strong period:
x∗(m) =δ(R− σm)
(1− δ)(1 + m)θ + δσ(1 + θ)(A4)
The key takeaway from A4 is that the amount G has to offer C to induce acceptance is a strictlydecreasing function of armament spending, which can be easily verified because m enters as anegative term in the numerator and as a positive term in the denominator. Arms substitute forpatronage because higher m reduces C’s expected utility to fighting. This mechanism resonateswith other recent models that feature coercion. In principal-agent terms, allowing the governmentto invest in military capacity resembles actions taken by a principal to relax an agent’s participationconstraint by lowering the agent’s reservation value, as in Acemoglu and Wolitzky (2011). Powell(2013) refers to this possibility as “coercive power.”
Substituting A2 and A4 into A1 yields a single-dimensional optimization problem for armament:
maxmspR−
[1− δ(1− σ)
][m+ δ(R−σm)
(1−δ)(1+m)θ+δσ(1+θ)
]1− δ
(A5)
Solving for the first order condition implicitly characterizes the optimal armament amount as afunction of parameters:
MB(m∗) ≡ δ(1− δ)θ(R+ σ) + δ2σ2(1 + θ)
[(1− δ)(1 +m∗)θ + δσ(1 + θ)]2= 1 (A6)
The left-hand side of A6 expresses the marginal benefit to higher m∗ and the right-hand sidepresents the marginal cost. The most important takeaway from Equation A6 is that the marginalbenefit of military spending strictly decreases in the amount of arms.
2. C2 never binds. Because of the assumption that C4 does not bind, implying that R > m∗ + x∗,then it must also be true that R > σm∗. This implies x∗(m∗) from A4 is strictly positive andtherefore C2 does not bind. In words, the government will never spend exclusively on the militaryto deter C from fighting. Because G cannot drive the probability of winning down to 0, theexpected utility of fighting is always positive. However, if x∗ = 0, the expected utility to acceptingand maintaining the status quo would be 0, implying C would fight.
3. C3 binds when R < R. If the marginal benefit of arming is lower than the marginal benefit ofpatronage when arms are 0, C3 binds and m∗ = 0. Mathematically, assessing whether C3 bindsrequires substituting m∗ = 0 into the left-hand side of A6 and setting strictly less than 1. This
yields R < R ≡ [1−δ(1−σ)][θ+δ(σ−θ+σθ)]δ(1−δ) . Intuitively, larger R raises G’s marginal benefit to arming
because, for fixed m, larger R increases the expected utility of fighting for C.
4. Unique solution when C3 binds. When R < R, step 3 establishes m∗ = 0 is the unique armamentsolution. Substituting m∗ = 0 into A4 yields the optimal patronage offer, x∗(0) = δR
(1−δ)θ+δσ(1+θ) ,
which is a unique function of parameter values. Therefore, when C3 binds there exists a unique
pair (m∗, x∗) =(
0, δR(1−δ)θ+δσ(1+θ)
)that solves the program.
5. Unique solution when C3 does not bind. The optimal armament choice m∗ must satisfy MB(m∗)
35
= 1. Applying the intermediate value theorem establishes that if R > R there exists at least onem∗ ∈ (0, m) (for m defined below) that satisfies MB(m∗) = 1.
• Step 3 implies MB(0) > 1 if R > R.
• Because MB(m) strictly decreases in m and limm→∞
MB(m) = 0, for all parameter values there
exists a finite m such that MB(m)<1.
• MB(m) is a continuous function.
The strict monotonicity of MB(m) in m implies m∗ is unique. Finally, because x∗(m∗) is strictlymonotonic in m∗, there exists a unique pair (m∗, x∗) that solves the program. �
Proof of Lemma 2. The proof proceeds in five steps.
1. Show ddσ (m∗ + x∗) < 0. This result will be used in several of the following steps. Intuitively,
total expenditures decrease in σ because higher σ raises the utility of the status quo for C, thereforerequiring G to spend less to buy off C. Mathematically, because G minimizes m∗+x∗ with respectto σ, the constrained envelope theorem impliesddσ (mt + xt)|(mt,xt)=(m∗,x∗) =∂∂σ (mt+xt)|(mt,xt)=(m∗,x∗) +λ ∂
∂σ
{δ
(1−δ)(1+mt)θ
[R−σ
(m∗+(1+θ)x∗
)]−xt
}|(mt,xt)=(m∗,x∗). That
is, we only need to assess the direct effects of σ on the constrained expenditure function. After
substituting in Equation A2 for λ, this sum of derivatives reduces to − δ[m∗+(1+θ)x∗]
(1−δ)(1+m∗)θ , a strictlynegative term.
2. Fighting never occurs when δ < δ1. Step 1 implies total government expenditures reach theirupper bound when σ = 0, i.e., C is strong in the current period but will never be strong in the
future. Solving Equations A4 and A6 when σ = 0 shows G must spend a total of 2√
δR(1−δ)θ − 1
to buy C off. This amount is less than R when δ < δ1 ≡ (R+1)2
θ(R2+1)+4R(1+θ) because C is impatient
enough that it prefers to accept the offer and consume in the current period rather than fight, eventhough C foregoes consumption in all future periods because it will never be strong again.
3. When δ > δ1, there exists at least one value of σ—defined as σ—such that m∗ + x∗ = R ifσ = σ. Applying the intermediate value theorem establishes the set σ ≡ {σ | m∗ + x∗ = R} isnon-empty.
• By definition of δ2, m∗ + x∗ > R when σ=0 and δ > δ1.
• The following shows m∗+x∗ < R when σ=1 and δ > δ2. Substituting σ=1 into Equation A4,
adding m∗ to this term, and setting strictly less than R yields m∗+ δ(R−m∗)(1−δ)(1+m∗)θ+δ(1+θ) < R.
Subtracting m∗ from both sides, dividing by R −m∗, and rearranging leads to (1 − δ)(1 +m∗)θ + δσ > 0, a true statement.
• Because the implicit characterizations of both x∗ and m∗ are each continuous functions of σ,their sum is also continuous in σ.
4. σ is unique. Suppose not, and {σ | m∗+ x∗ = R} contains two or more elements. By definition,if σ1 ∈ {σ | m∗ + x∗ = R}, then m∗(σ1) + x∗(σ1) = R. However, because step 1 shows m∗ + x∗ is
36
a strictly monotonic function of σ, m∗(σ2) + x∗(σ2) 6= R for anyσ2 ∈ {σ | m∗ + x∗ = R} (assuming σ2 6= σ1), providing a contradiction.
5. m∗ + x∗ < R if σ > σ and m∗ + x∗ > R if σ < σ. This also follows from step 1, specifically,that m∗ + x∗ is a strictly decreasing function of σ.
Proof of Proposition 1. Follows directly from Lemmas 1 and 2 and the discussion in the text ofwhy G will always buy C off if possible.
Proof of Proposition 2. This is easiest to establish by showing total expenditures relative to per-
period revenues decrease if R > R. ddR
(m∗+x∗
R
)=
ddR (m∗+x∗)R−(m∗+x∗)
R2 . Applying the envelope
theorem to A5 solves ddR (m∗ + x∗) because if R exerts a particular-signed effect on the military
expenditure choice that maximizes R−[1−δ(1−σ)][m+x∗(m)]1−δ , it will exert the same-signed effect on the
choice that minimizes m + x∗(m). ddR (m∗ + x∗) = δ
(1−δ)(1+m∗)θ+δσ(1+θ) . The entire term equalsδR
(1−δ)(1+m∗)θ+δσ(1+θ)−(m∗+x∗)
R2 , which achieves its maximum point at R = R, i.e., where m∗ = 0.
Because m∗+x∗
R is strictly concave in R, this implies ddR
(m∗+x∗
R
)is negative if R > R. Therefore,
for all R > 0, more revenue either decreases or has no effect on center-seeking civil war propensity.Applying the intermediate value theorem demonstrates that even if θR < 0, this same result holdsas long as θR is not too large in magnitude. �
Proof of Proposition 3. The proof strategy is identical to that in Proposition 2. �
Proof of Proposition 4. For ∆ = ∆O = ∆N , by assumption θ is higher when revenues equalR + ∆N than R + ∆O because the increase in non-oil revenues exerts a larger positive effect onω. To prove the claim it suffices to show ∂
∂θ (m∗ + x∗) < 0, i.e., higher θ reduces the likeli-hood that total equilibrium expenditures exceed R. Applying the envelope theorem to A5 willprovide the solution because if θ exerts a particular-signed effect on the military expenditure
choice that maximizes R−[1−δ(1−σ)][m+x∗(m)]1−δ , it will exert the same-signed effect on the choice
that minimizes m + x∗(m). By the envelope theorem, ddθ
(m + δ(R−σm)
(1−δ)(1+m)θ+δσ(1+θ)
)∣∣∣m=m∗
=
∂∂θ
(m + δ(R−σm)
(1−δ)(1+m)θ+δσ(1+θ)
)∣∣∣m=m∗
< 0. The strict negativity can be easily verified because θ
enters only as a negative term in the denominator of the second term within the parentheses.�
A.2. Comparison to Unrestricted MPE
As stated in the text, I solve the model using a modification of Markov Perfect Equilibrium in whichG can only consider Markovian deviations from the level of m∗s posited in the strategy profile, i.e.,if G changes mt in a particular strong period, G internalizes the effects of changing armamentexpenditures in the current period choice in all periods. If G could consider any possible deviation,A1 would be replaced by:
37
maxmt,xt,λ
L(mt, xt, λ) ≡ R−mt − xt +δ
1− δ(R− σ(m∗ + x∗)
)(A7)
spacespacespacespacespacespacespi+ λ{xt − δ
(1−δ)(1+mt)θ
[R− σ
(m∗ + (1 + θ)x∗
)]}The difference from A1 is that in A7, the equilibrium level of armament expenditures m∗ posited inthe strategy profile will be chosen in future periods even if G deviates to a different military spendingamount in the current period. Regarding incentives, the difference is that in the modified MPE(A1), G internalizes the effect of higher military spending in all periods, whereas in the unrestrictedMPE (A7), G overspends on the military because it does not internalize the effect of higher militaryspending in the future. Another way of stating this difference is that in the unrestricted MPE, thecurrent-period G faces a commitment problem with any future-period governments: its utility ina peaceful equilibrium would be higher (and the probability of fighting would be lower) if G couldcommit not to overspend on the military in the present, but deviating to higher military spendingis profitable if G does not internalize the higher future costs. Imposing the restriction from the texteliminates this feature of the unrestricted MPE.
Regarding the substantive questions from the article, the unrestricted MPE may induce a parameterrange in which increases in revenues raise center-seeking civil war propensity if R is small. Thisresult follows directly from G’s overspending on the military when not restricted to Markoviandeviations. Figure A1 illustrates this argument for a constant θ by plotting government expendituresas a percentage of per-period revenues (vertical axes) as a function of per-period revenues (horizontalaxes). The bottom panel presents separate lines for m
R and xR whereas the top panel plots m+x
R .The gray curves capture optimal choices defined by A1 (restricted MPE) whereas the black solidcurves capture optimal choices defined by A7 (unrestricted MPE).
38
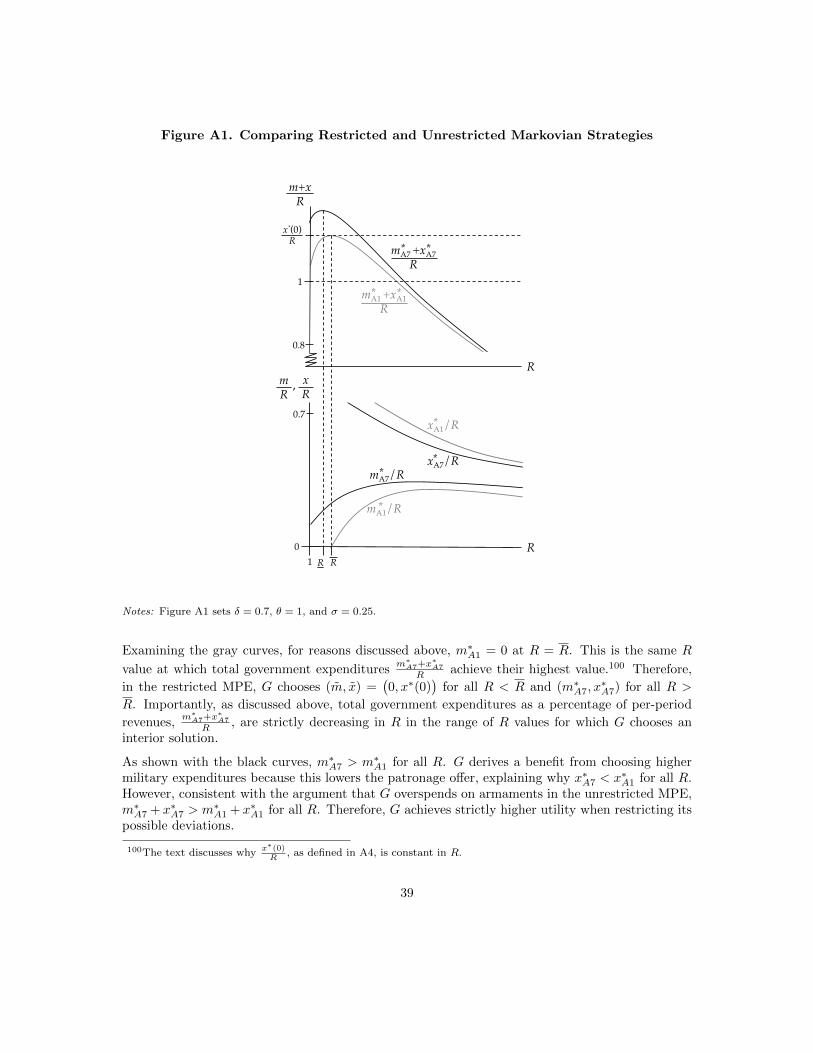
Figure A1. Comparing Restricted and Unrestricted Markovian Strategies
R!
R
R
m+x!R!
m!R!
x!R!
,
1!
mA7/R!*!
mA1/R!*!
xA1/R!*!
xA7/R!*!
mA7 +xA7!R!
*! *!
mA1 +xA1!R!
*! *!
x*(0)!R!
1!0!
0.8!
R!
0.7!
Notes: Figure A1 sets δ = 0.7, θ = 1, and σ = 0.25.
Examining the gray curves, for reasons discussed above, m∗A1 = 0 at R = R. This is the same R
value at which total government expendituresm∗A7+x∗A7
R achieve their highest value.100 Therefore,
in the restricted MPE, G chooses (m, x) =(0, x∗(0)
)for all R < R and (m∗A7, x
∗A7) for all R >
R. Importantly, as discussed above, total government expenditures as a percentage of per-period
revenues,m∗A7+x∗A7
R , are strictly decreasing in R in the range of R values for which G chooses aninterior solution.
As shown with the black curves, m∗A7 > m∗A1 for all R. G derives a benefit from choosing highermilitary expenditures because this lowers the patronage offer, explaining why x∗A7 < x∗A1 for all R.However, consistent with the argument that G overspends on armaments in the unrestricted MPE,m∗A7 + x∗A7 > m∗A1 + x∗A1 for all R. Therefore, G achieves strictly higher utility when restricting itspossible deviations.
100The text discusses whyx∗(0)
R, as defined in A4, is constant in R.
39
When R ∈ (1, R),m∗A7+x∗A7
R increases in R, which highlights the existence of a parameter rangein which increases in revenues raise center-seeking civil war propensity. This parameter range isstrange in the sense that G would improve its utility if it commit to set military expenditures to0 in every strong period—i.e., granting the government an additional choice variable decreases itsutility in the unrestricted MPE.
The existence of this parameter range does not alter the main conclusions from the article for atleast three reasons. First, it appears more reasonable to focus attention on the restricted Markovianstrategies because these provide incentives for behavior more consistent with G being able to useits two choice variables to maximize utility. Second, this parameter range only exists when R issmall and we consider small increases in R. Therefore, this parameter range is not relevant eitherfor countries that have discovered their first major oil fields or for established oil-rich countries thatexperience an additional change in revenues. Empirically, commercial oil fields tend to producelarge windfalls for governments (assumption #2), implying that countries starting with low R willachieve revenues greater than R after the oil discovery—implying the revenue increase diminishescenter-seeking civil war propensity even when A7 characterizes the equilibrium. Furthermore, foroil-rich governments that already have revenues exceeding R, any sized increase in revenues willreduce prospects for violence. Third, this puzzling parameter range exists for any type of revenues,not just oil. Therefore, arguing that this parameter range strongly underpins the conflict resourcecurse is equivalent to arguing that governments collecting high levels of income taxes may, in somecircumstances, also be more susceptible to center-seeking civil war than governments with lowerincome tax revenues.
B. Data Details for Table 4
B.1. Coding Center-Seeking UCDP/PRIO Onsets
The coding procedure for UCDP/PRIO data used in Table 4 departs in two major ways fromconventional codings of center-seeking civil war onsets. First, it does not count military coups withlarge death tolls as civil wars. Second, it does not follow the widely used two-year lapse rule forcoding onsets. These choices are consequential. Nineteen of the 36 (53%) center-seeking civil waronsets in country-years producing at least $100 of oil income per capita—as coded by conventionalprocedures—are either coup attempts or a continuation of an existing civil war. Below, “oil-richcountry-years” refers to country-years producing at least $100 of per capita oil income.
Table B1 shows that seven UCDP/PRIO civil wars in oil-rich country-years are coup attempts,but involved a high enough number of deaths to meet UCDP/PRIO’s civil war criteria. Resultsthat exclude UCDP/PRIO coup attempts should be favored for two reasons. First, consistent withthe broader literature on oil and civil wars, the formal model in this article implicitly assumes thegovernment has perfect control over its military and derives implications for an interaction betweena government and a non-state challenger. Civil wars and coup attempts are distinct phenomena,which is why work such as Wimmer, Min, and Cederman (2009) distinguishes between them.Second, the UCDP/PRIO database only includes coup attempts with a sufficiently high death toll.This means that results including UCDP/PRIO coups implicitly provide insight into how oil wealthaffects coup attempts that create high death tolls—but not other coup attempts. At the very least,
40
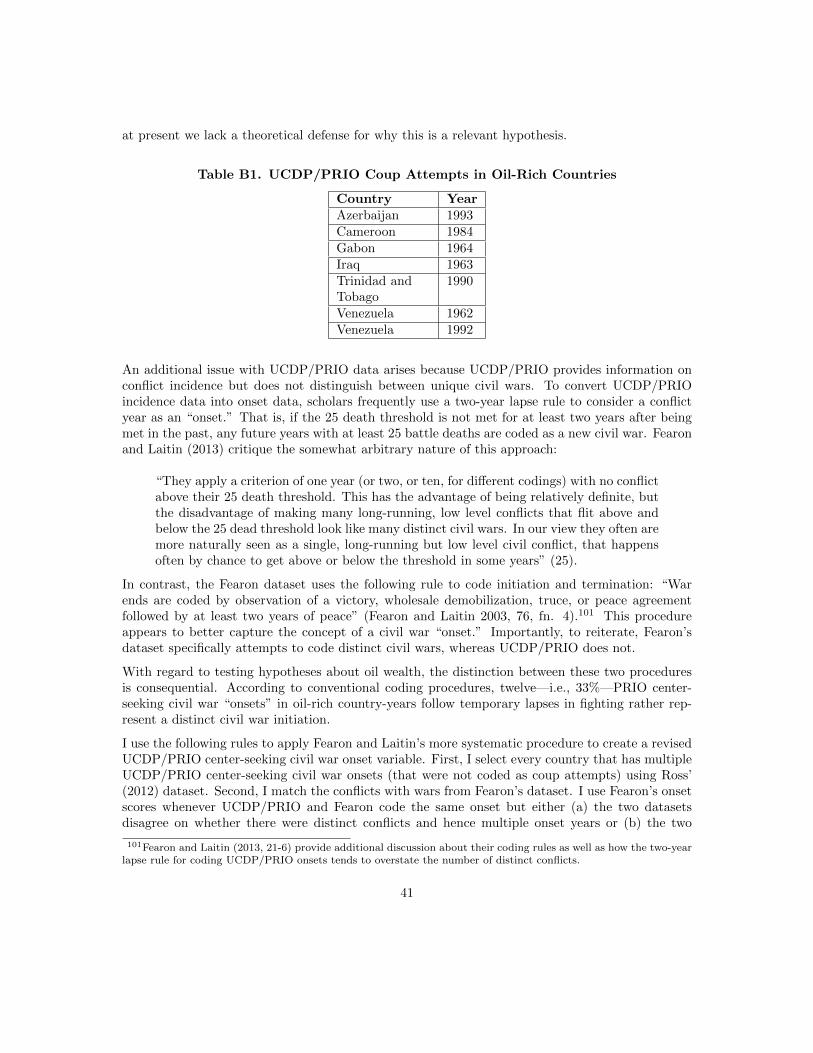
at present we lack a theoretical defense for why this is a relevant hypothesis.
Table B1. UCDP/PRIO Coup Attempts in Oil-Rich Countries
Country YearAzerbaijan 1993Cameroon 1984Gabon 1964Iraq 1963Trinidad andTobago
1990
Venezuela 1962Venezuela 1992
An additional issue with UCDP/PRIO data arises because UCDP/PRIO provides information onconflict incidence but does not distinguish between unique civil wars. To convert UCDP/PRIOincidence data into onset data, scholars frequently use a two-year lapse rule to consider a conflictyear as an “onset.” That is, if the 25 death threshold is not met for at least two years after beingmet in the past, any future years with at least 25 battle deaths are coded as a new civil war. Fearonand Laitin (2013) critique the somewhat arbitrary nature of this approach:
“They apply a criterion of one year (or two, or ten, for different codings) with no conflictabove their 25 death threshold. This has the advantage of being relatively definite, butthe disadvantage of making many long-running, low level conflicts that flit above andbelow the 25 dead threshold look like many distinct civil wars. In our view they often aremore naturally seen as a single, long-running but low level civil conflict, that happensoften by chance to get above or below the threshold in some years” (25).
In contrast, the Fearon dataset uses the following rule to code initiation and termination: “Warends are coded by observation of a victory, wholesale demobilization, truce, or peace agreementfollowed by at least two years of peace” (Fearon and Laitin 2003, 76, fn. 4).101 This procedureappears to better capture the concept of a civil war “onset.” Importantly, to reiterate, Fearon’sdataset specifically attempts to code distinct civil wars, whereas UCDP/PRIO does not.
With regard to testing hypotheses about oil wealth, the distinction between these two proceduresis consequential. According to conventional coding procedures, twelve—i.e., 33%—PRIO center-seeking civil war “onsets” in oil-rich country-years follow temporary lapses in fighting rather rep-resent a distinct civil war initiation.
I use the following rules to apply Fearon and Laitin’s more systematic procedure to create a revisedUCDP/PRIO center-seeking civil war onset variable. First, I select every country that has multipleUCDP/PRIO center-seeking civil war onsets (that were not coded as coup attempts) using Ross’(2012) dataset. Second, I match the conflicts with wars from Fearon’s dataset. I use Fearon’s onsetscores whenever UCDP/PRIO and Fearon code the same onset but either (a) the two datasetsdisagree on whether there were distinct conflicts and hence multiple onset years or (b) the two
101Fearon and Laitin (2013, 21-6) provide additional discussion about their coding rules as well as how the two-yearlapse rule for coding UCDP/PRIO onsets tends to overstate the number of distinct conflicts.
41
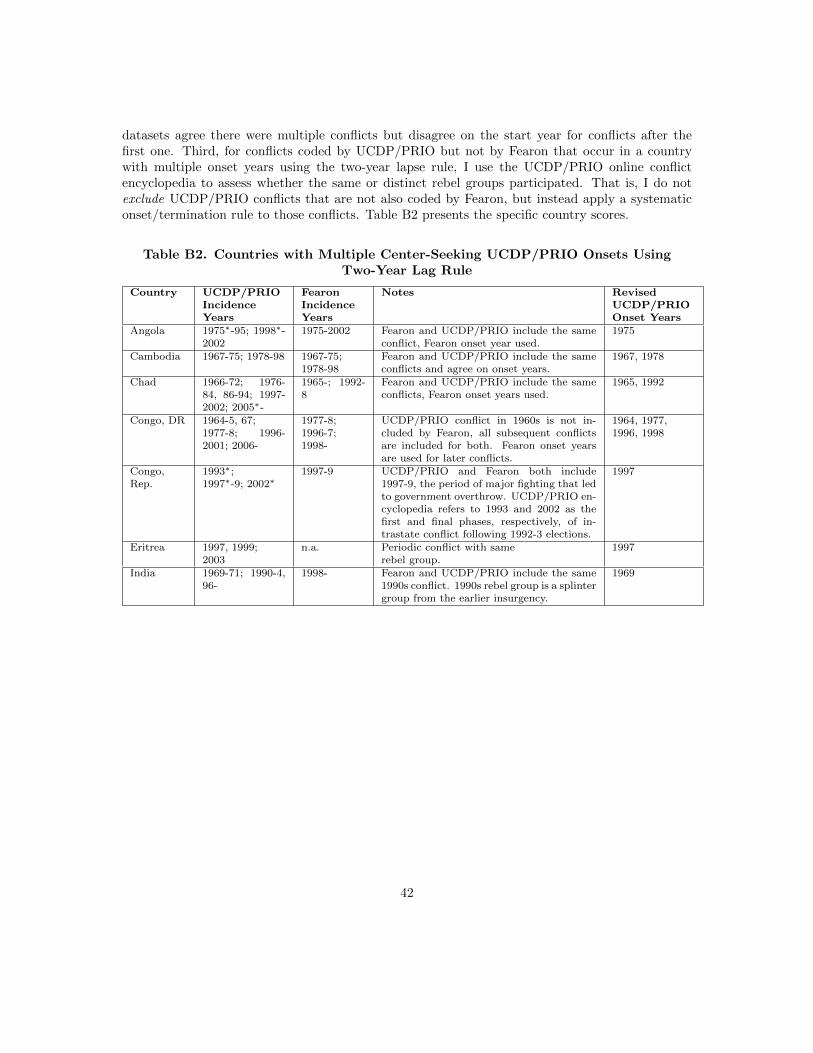
datasets agree there were multiple conflicts but disagree on the start year for conflicts after thefirst one. Third, for conflicts coded by UCDP/PRIO but not by Fearon that occur in a countrywith multiple onset years using the two-year lapse rule, I use the UCDP/PRIO online conflictencyclopedia to assess whether the same or distinct rebel groups participated. That is, I do notexclude UCDP/PRIO conflicts that are not also coded by Fearon, but instead apply a systematiconset/termination rule to those conflicts. Table B2 presents the specific country scores.
Table B2. Countries with Multiple Center-Seeking UCDP/PRIO Onsets UsingTwo-Year Lag Rule
Country UCDP/PRIOIncidenceYears
FearonIncidenceYears
Notes RevisedUCDP/PRIOOnset Years
Angola 1975∗-95; 1998∗-2002
1975-2002 Fearon and UCDP/PRIO include the sameconflict, Fearon onset year used.
1975
Cambodia 1967-75; 1978-98 1967-75;1978-98
Fearon and UCDP/PRIO include the sameconflicts and agree on onset years.
1967, 1978
Chad 1966-72; 1976-84, 86-94; 1997-2002; 2005∗-
1965-; 1992-8
Fearon and UCDP/PRIO include the sameconflicts, Fearon onset years used.
1965, 1992
Congo, DR 1964-5, 67;1977-8; 1996-2001; 2006-
1977-8;1996-7;1998-
UCDP/PRIO conflict in 1960s is not in-cluded by Fearon, all subsequent conflictsare included for both. Fearon onset yearsare used for later conflicts.
1964, 1977,1996, 1998
Congo,Rep.
1993∗;1997∗-9; 2002∗
1997-9 UCDP/PRIO and Fearon both include1997-9, the period of major fighting that ledto government overthrow. UCDP/PRIO en-cyclopedia refers to 1993 and 2002 as thefirst and final phases, respectively, of in-trastate conflict following 1992-3 elections.
1997
Eritrea 1997, 1999;2003
n.a. Periodic conflict with samerebel group.
1997
India 1969-71; 1990-4,96-
1998- Fearon and UCDP/PRIO include the same1990s conflict. 1990s rebel group is a splintergroup from the earlier insurgency.
1969
42
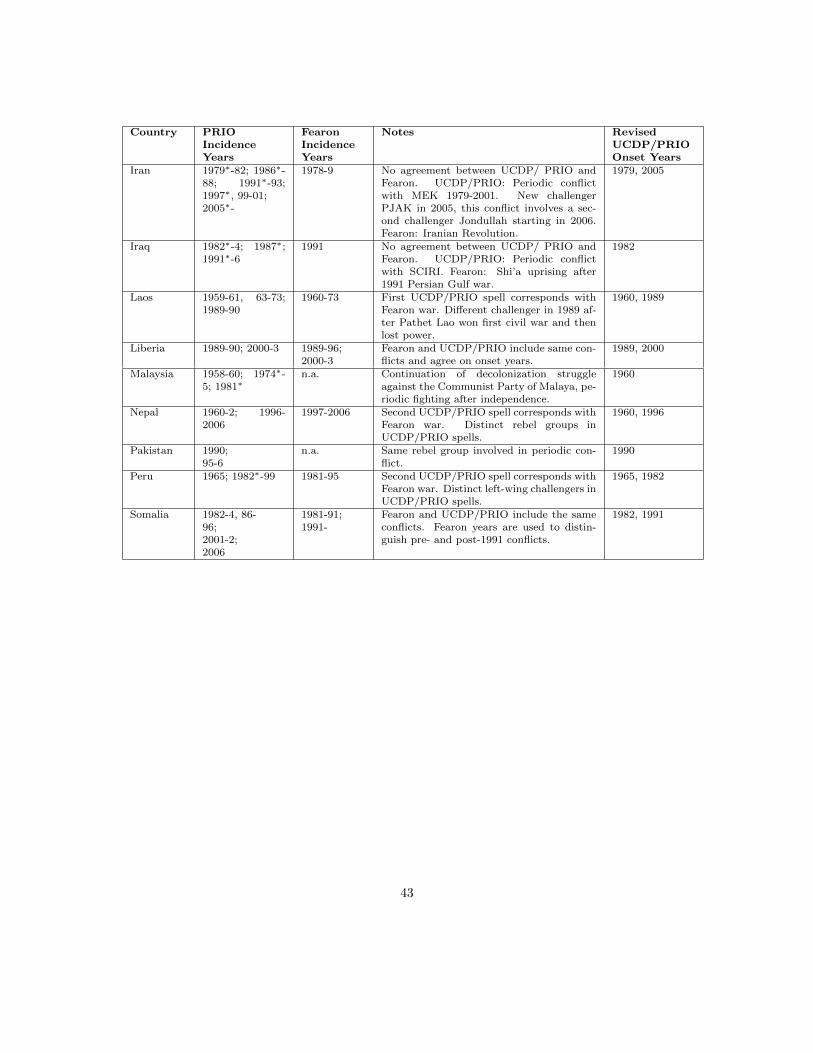
Country PRIOIncidenceYears
FearonIncidenceYears
Notes RevisedUCDP/PRIOOnset Years
Iran 1979∗-82; 1986∗-88; 1991∗-93;1997∗, 99-01;2005∗-
1978-9 No agreement between UCDP/ PRIO andFearon. UCDP/PRIO: Periodic conflictwith MEK 1979-2001. New challengerPJAK in 2005, this conflict involves a sec-ond challenger Jondullah starting in 2006.Fearon: Iranian Revolution.
1979, 2005
Iraq 1982∗-4; 1987∗;1991∗-6
1991 No agreement between UCDP/ PRIO andFearon. UCDP/PRIO: Periodic conflictwith SCIRI. Fearon: Shi’a uprising after1991 Persian Gulf war.
1982
Laos 1959-61, 63-73;1989-90
1960-73 First UCDP/PRIO spell corresponds withFearon war. Different challenger in 1989 af-ter Pathet Lao won first civil war and thenlost power.
1960, 1989
Liberia 1989-90; 2000-3 1989-96;2000-3
Fearon and UCDP/PRIO include same con-flicts and agree on onset years.
1989, 2000
Malaysia 1958-60; 1974∗-5; 1981∗
n.a. Continuation of decolonization struggleagainst the Communist Party of Malaya, pe-riodic fighting after independence.
1960
Nepal 1960-2; 1996-2006
1997-2006 Second UCDP/PRIO spell corresponds withFearon war. Distinct rebel groups inUCDP/PRIO spells.
1960, 1996
Pakistan 1990;95-6
n.a. Same rebel group involved in periodic con-flict.
1990
Peru 1965; 1982∗-99 1981-95 Second UCDP/PRIO spell corresponds withFearon war. Distinct left-wing challengers inUCDP/PRIO spells.
1965, 1982
Somalia 1982-4, 86-96;2001-2;2006
1981-91;1991-
Fearon and UCDP/PRIO include the sameconflicts. Fearon years are used to distin-guish pre- and post-1991 conflicts.
1982, 1991
43
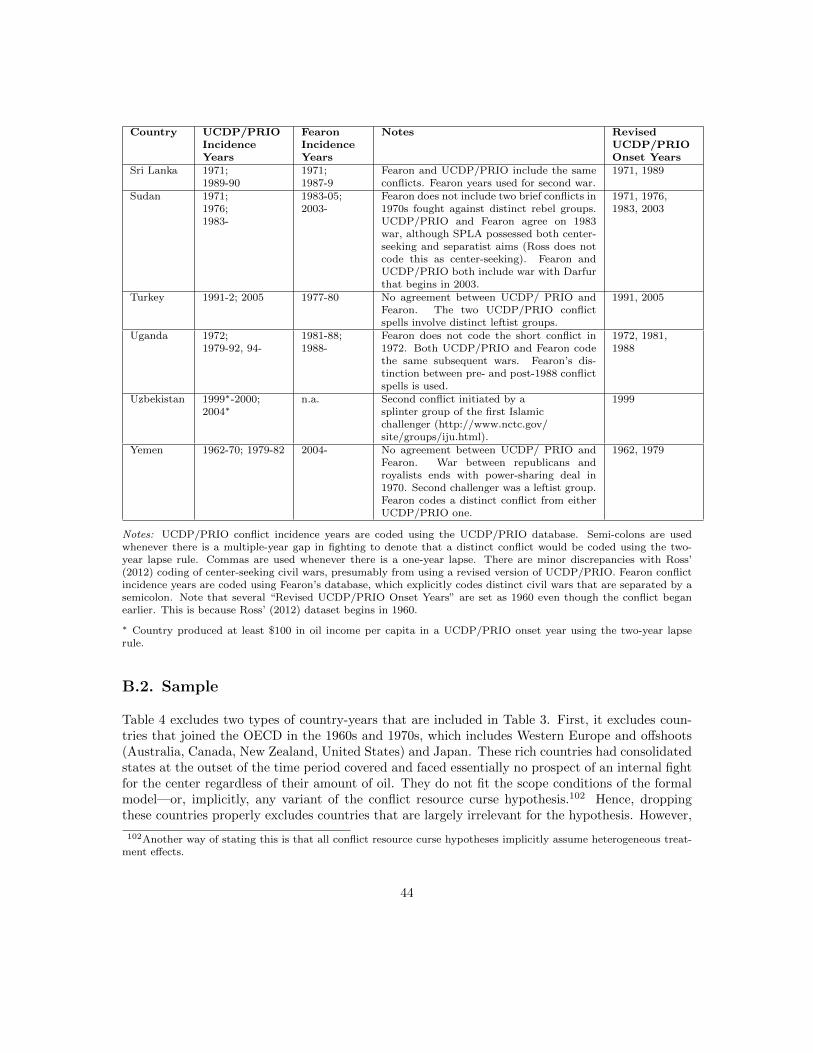
Country UCDP/PRIOIncidenceYears
FearonIncidenceYears
Notes RevisedUCDP/PRIOOnset Years
Sri Lanka 1971;1989-90
1971;1987-9
Fearon and UCDP/PRIO include the sameconflicts. Fearon years used for second war.
1971, 1989
Sudan 1971;1976;1983-
1983-05;2003-
Fearon does not include two brief conflicts in1970s fought against distinct rebel groups.UCDP/PRIO and Fearon agree on 1983war, although SPLA possessed both center-seeking and separatist aims (Ross does notcode this as center-seeking). Fearon andUCDP/PRIO both include war with Darfurthat begins in 2003.
1971, 1976,1983, 2003
Turkey 1991-2; 2005 1977-80 No agreement between UCDP/ PRIO andFearon. The two UCDP/PRIO conflictspells involve distinct leftist groups.
1991, 2005
Uganda 1972;1979-92, 94-
1981-88;1988-
Fearon does not code the short conflict in1972. Both UCDP/PRIO and Fearon codethe same subsequent wars. Fearon’s dis-tinction between pre- and post-1988 conflictspells is used.
1972, 1981,1988
Uzbekistan 1999∗-2000;2004∗
n.a. Second conflict initiated by asplinter group of the first Islamicchallenger (http://www.nctc.gov/site/groups/iju.html).
1999
Yemen 1962-70; 1979-82 2004- No agreement between UCDP/ PRIO andFearon. War between republicans androyalists ends with power-sharing deal in1970. Second challenger was a leftist group.Fearon codes a distinct conflict from eitherUCDP/PRIO one.
1962, 1979
Notes: UCDP/PRIO conflict incidence years are coded using the UCDP/PRIO database. Semi-colons are usedwhenever there is a multiple-year gap in fighting to denote that a distinct conflict would be coded using the two-year lapse rule. Commas are used whenever there is a one-year lapse. There are minor discrepancies with Ross’(2012) coding of center-seeking civil wars, presumably from using a revised version of UCDP/PRIO. Fearon conflictincidence years are coded using Fearon’s database, which explicitly codes distinct civil wars that are separated by asemicolon. Note that several “Revised UCDP/PRIO Onset Years” are set as 1960 even though the conflict beganearlier. This is because Ross’ (2012) dataset begins in 1960.
∗ Country produced at least $100 in oil income per capita in a UCDP/PRIO onset year using the two-year lapserule.
B.2. Sample
Table 4 excludes two types of country-years that are included in Table 3. First, it excludes coun-tries that joined the OECD in the 1960s and 1970s, which includes Western Europe and offshoots(Australia, Canada, New Zealand, United States) and Japan. These rich countries had consolidatedstates at the outset of the time period covered and faced essentially no prospect of an internal fightfor the center regardless of their amount of oil. They do not fit the scope conditions of the formalmodel—or, implicitly, any variant of the conflict resource curse hypothesis.102 Hence, droppingthese countries properly excludes countries that are largely irrelevant for the hypothesis. However,
102Another way of stating this is that all conflict resource curse hypotheses implicitly assume heterogeneous treat-ment effects.
44
more recent OECD members—such as South Korea—are included for the duration of the samplebecause of the possibility that their successful late development was endogenous to not having oil.This corresponds directly with dropping all country-years with OECD=1 in Ross’ dataset. Forexample, his variable codes New Zealand as OECD=1 in all years despite New Zealand not joiningthe OECD until 1973, and codes South Korea as OECD=0 in all years despite South Korea joiningthe OECD in 1996.
Second, Table 4 excludes non-sovereign countries. Specifically, never colonized countries and formerWestern European colonies achieving independence before 1960 are included in all years. Countriesthat gained independence after 1960 are included starting from their year of independence. FormerSoviet republics are included from 1991 onward. Non-Soviet former Eastern bloc countries andMongolia are included starting in 1990. Former Yugoslavian countries are included from their yearof independence onward. Albania, USSR/Russia, and Yugoslavia/Serbia would be included forthe entire period, however, they are effectively dropped for most of the Cold War period becauseof missing income data. Occupied territories as coded by Geddes, Wright, and Frantz (2014) areexcluded: Afghanistan 2001-, Bosnia and Herzegovina 1996-, Dominican Republic 1965-6, Iraq2003-, and Lebanon 1976-2005.
The impetus behind excluding non-sovereign states is that conflicts in these countries usually revolvearound overthrowing the occupying country, which is very different in nature from a civil war.
B.3. Additional Modifications
Imputing Missing Income Data
Ross’ (2012) per capita income variable is missing for 500 of the 5555 observations in the coresample. As described in his book and in his STATA replication data, he uses World DevelopmentIndicators data when available and data from Penn World Table 6.2 when not. Fortunately, PennWorld Table 6.2 does contain rgdpch data for 270 of the 500 missing observations. Using data for2005 and 2006 from Penn World Table 7.1 yields an additional 4 data points.
An additional 131 data points are imputed. Imputing missing income data will undoubtedly in-troduce some measurement error, although this appears better than the alternative of dropping alarge number of country-years. Many countries lack income data in early years in the dataset. Toaddress this, I imputed income data from the first measured year backwards up to 10 years. In sum,these additions to Ross’ (2012) dataset recover 405 of the 500 country-years that were originallymissing income data.
Excluding/Modifying Other Post-Treatment Covariates
Rather than control for annual population data, to avoid post-treatment issues that arise becauseoil booms tend to raise population (e.g., Cotet and Tsui 2010), I instead control for log populationmeasured in 1950. Note that the issue of controlling for pre-oil population—in which the goal is todistinguish the effect of oil from the effect of what population would have been had the country notdiscovered oil—is distinct from the issue of dividing oil income by annual population to generate anoil income per capita variable. For the purpose of assessing the effects of the oil income per capita
45
“treatment,” the issue of how much per capita oil income a country would have had if oil had notraised population is not relevant because one consequence of gaining the oil treatment is, indeed,raising population.
Additionally, Columns 3 and 4 in Table 4 exclude three of Fearon and Laitin’s covariates becausethey are post-treatment: Polity, Polity squared, and political instability.
Recoding 1960 Civil War Onsets
Five center-seeking wars coded as 1960 onsets in Ross’ (2012) dataset are implicitly dropped becausethe dataset begins in 1960 and oil income per capita is lagged one year in the regressions. Thesefive civil wars are recoded to begin in 1961.
Coding Region Dummies
Ross (2012) includes region dummies for the Middle East and North Africa, Sub-Saharan Africa,Latin America, and East Asia. This yields a somewhat heterogeneous basis region of EasternEuropean and former Soviet states, South Asia, and Mediterranean and Pacific islands. To minimizeheterogeneity in the basis region I include additional dummies for Eastern European and formerSoviet states, and South Asia.
C. Additional Empirical Results
C.1. Controlling for Counterfactual Non-Oil Income
The key comparative statics prediction from Proposition 2 about the effects of increases in oil rev-enues is premised on holding non-oil revenues fixed. Implementing this control using statisticalmodeling, however, is extremely difficult. Controlling for factual income per capita data inducespost-treatment bias, and constructing counterfactual income measures poses severe concerns. Oneauthor who has attempted this task acknowledges “any possible calculation of counterfactual GDPrequires major, perhaps heroic, assumptions” (Herb 2005, 302). There are two important impedi-ments to accurately estimating counterfactual non-oil income per capita data for oil-rich countries.The first is that we have only scant income per capita data prior to initial oil discoveries for mostmajor oil producers. This poses difficulties for estimating a country’s pre-oil income per capita.The second is that even with such data, it would still be extremely difficult to estimate how thesecountries’ economies would have evolved over time had they not become major oil producers.This poses difficulties for estimating an oil-rich country’s annual counterfactual non-oil income percapita. Given the issues raised below, there is no reason to believe that regressions controlling forcounterfactual non-oil income will produce stronger insights than regressions that entirely omit anincome control.
Even acknowledging these caveats, however, the results do not support a center-seeking conflictresource curse when controlling for different counterfactual non-oil income estimates. The first twoprocedures estimate pre-oil income—meaning for each country the same non-oil income estimate
46
is used in every year—and the last two procedures estimate annual counterfactual non-oil income,meaning each country-year has a unique income estimate. All these results use the coding modi-fications described in Appendix B. The five columns in Tables C1 through C4 correspond to theodd-numbered specifications from Table 4 except the different counterfactual income per capitavariables described below replace the per capita income variable in Table 4.
Providing one possibility for estimating pre-oil income, Angus Maddison provides the most com-prehensive estimates available for historical income per capita. Although some data points go backas far as 0 CE, the global sample only becomes broad starting in 1950. By this date, many majoroil-producers had already begun oil production and had achieved considerably higher incomes percapita than would have been imaginable had they not been major oil producers (see Table 1 fromAlexeev and Conrad 2009, 587). Unfortunately, the next most recent year that has any degree ofcoverage for the non-European world, 1913, still has considerable missing data (only 30% of thecountries from the core sample have data). However, because this variable is truly pre-oil for almostevery country, it may be useful to consider how controlling for this initial income estimate impactsthe results after imputing missing data. One possible procedure is, for each country/colony withmissing 1913 data, to set its income equal to the lowest income value among countries/colonies inits geographic region. The idea here is that countries with missing data are, on average, more likelyto be poor. Table C1 shows the negative correlation remains relatively strong after controlling forimputed 1913 income per capita.
47
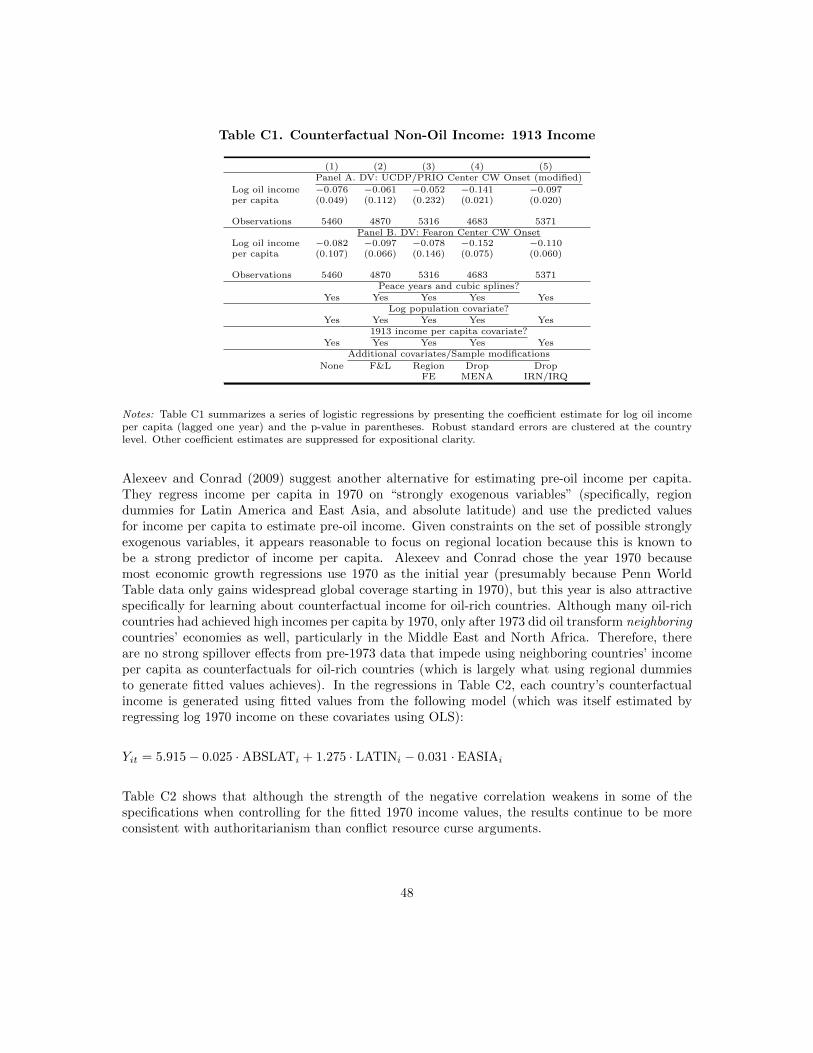
Table C1. Counterfactual Non-Oil Income: 1913 Income
(1) (2) (3) (4) (5)Panel A. DV: UCDP/PRIO Center CW Onset (modified)
Log oil income −0.076 −0.061 −0.052 −0.141 −0.097per capita (0.049) (0.112) (0.232) (0.021) (0.020)
Observations 5460 4870 5316 4683 5371Panel B. DV: Fearon Center CW Onset
Log oil income −0.082 −0.097 −0.078 −0.152 −0.110per capita (0.107) (0.066) (0.146) (0.075) (0.060)
Observations 5460 4870 5316 4683 5371Peace years and cubic splines?
Yes Yes Yes Yes YesLog population covariate?
Yes Yes Yes Yes Yes1913 income per capita covariate?
Yes Yes Yes Yes YesAdditional covariates/Sample modifications
None F&L Region Drop DropFE MENA IRN/IRQ
Notes: Table C1 summarizes a series of logistic regressions by presenting the coefficient estimate for log oil incomeper capita (lagged one year) and the p-value in parentheses. Robust standard errors are clustered at the countrylevel. Other coefficient estimates are suppressed for expositional clarity.
Alexeev and Conrad (2009) suggest another alternative for estimating pre-oil income per capita.They regress income per capita in 1970 on “strongly exogenous variables” (specifically, regiondummies for Latin America and East Asia, and absolute latitude) and use the predicted valuesfor income per capita to estimate pre-oil income. Given constraints on the set of possible stronglyexogenous variables, it appears reasonable to focus on regional location because this is known tobe a strong predictor of income per capita. Alexeev and Conrad chose the year 1970 becausemost economic growth regressions use 1970 as the initial year (presumably because Penn WorldTable data only gains widespread global coverage starting in 1970), but this year is also attractivespecifically for learning about counterfactual income for oil-rich countries. Although many oil-richcountries had achieved high incomes per capita by 1970, only after 1973 did oil transform neighboringcountries’ economies as well, particularly in the Middle East and North Africa. Therefore, thereare no strong spillover effects from pre-1973 data that impede using neighboring countries’ incomeper capita as counterfactuals for oil-rich countries (which is largely what using regional dummiesto generate fitted values achieves). In the regressions in Table C2, each country’s counterfactualincome is generated using fitted values from the following model (which was itself estimated byregressing log 1970 income on these covariates using OLS):
Yit = 5.915− 0.025 ·ABSLATi + 1.275 · LATINi − 0.031 · EASIAi
Table C2 shows that although the strength of the negative correlation weakens in some of thespecifications when controlling for the fitted 1970 income values, the results continue to be moreconsistent with authoritarianism than conflict resource curse arguments.
48
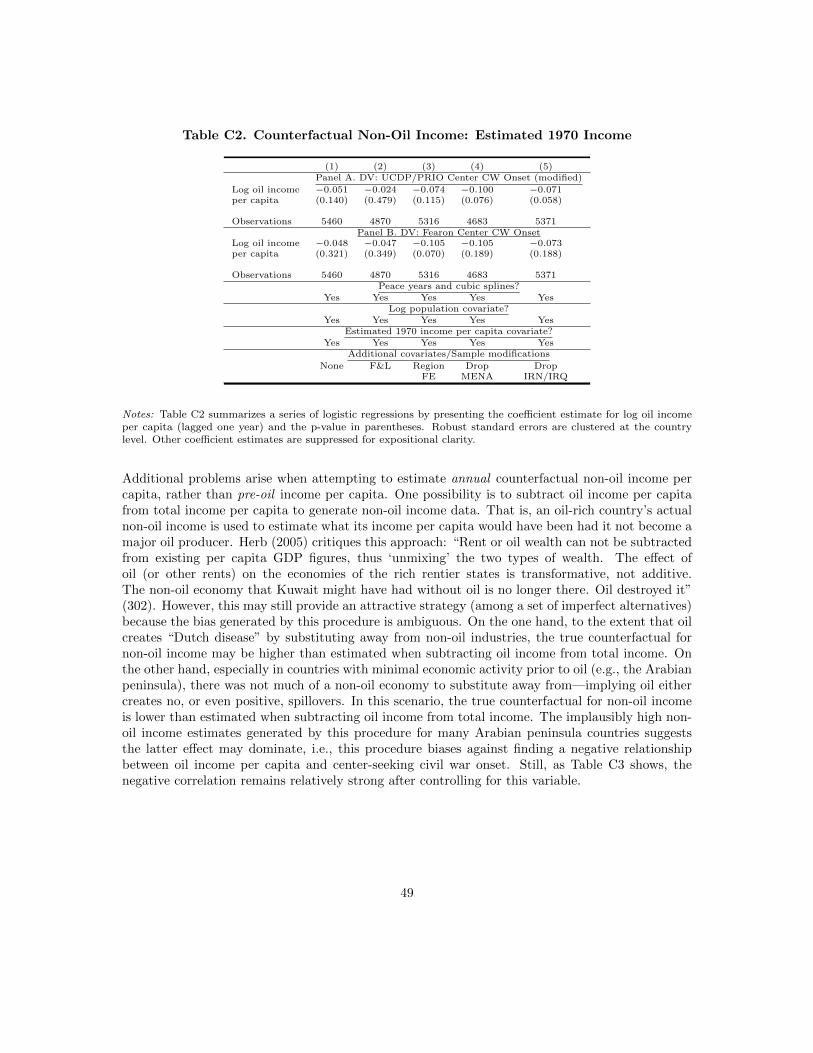
Table C2. Counterfactual Non-Oil Income: Estimated 1970 Income
(1) (2) (3) (4) (5)Panel A. DV: UCDP/PRIO Center CW Onset (modified)
Log oil income −0.051 −0.024 −0.074 −0.100 −0.071per capita (0.140) (0.479) (0.115) (0.076) (0.058)
Observations 5460 4870 5316 4683 5371Panel B. DV: Fearon Center CW Onset
Log oil income −0.048 −0.047 −0.105 −0.105 −0.073per capita (0.321) (0.349) (0.070) (0.189) (0.188)
Observations 5460 4870 5316 4683 5371Peace years and cubic splines?
Yes Yes Yes Yes YesLog population covariate?
Yes Yes Yes Yes YesEstimated 1970 income per capita covariate?
Yes Yes Yes Yes YesAdditional covariates/Sample modifications
None F&L Region Drop DropFE MENA IRN/IRQ
Notes: Table C2 summarizes a series of logistic regressions by presenting the coefficient estimate for log oil incomeper capita (lagged one year) and the p-value in parentheses. Robust standard errors are clustered at the countrylevel. Other coefficient estimates are suppressed for expositional clarity.
Additional problems arise when attempting to estimate annual counterfactual non-oil income percapita, rather than pre-oil income per capita. One possibility is to subtract oil income per capitafrom total income per capita to generate non-oil income data. That is, an oil-rich country’s actualnon-oil income is used to estimate what its income per capita would have been had it not become amajor oil producer. Herb (2005) critiques this approach: “Rent or oil wealth can not be subtractedfrom existing per capita GDP figures, thus ‘unmixing’ the two types of wealth. The effect ofoil (or other rents) on the economies of the rich rentier states is transformative, not additive.The non-oil economy that Kuwait might have had without oil is no longer there. Oil destroyed it”(302). However, this may still provide an attractive strategy (among a set of imperfect alternatives)because the bias generated by this procedure is ambiguous. On the one hand, to the extent that oilcreates “Dutch disease” by substituting away from non-oil industries, the true counterfactual fornon-oil income may be higher than estimated when subtracting oil income from total income. Onthe other hand, especially in countries with minimal economic activity prior to oil (e.g., the Arabianpeninsula), there was not much of a non-oil economy to substitute away from—implying oil eithercreates no, or even positive, spillovers. In this scenario, the true counterfactual for non-oil incomeis lower than estimated when subtracting oil income from total income. The implausibly high non-oil income estimates generated by this procedure for many Arabian peninsula countries suggeststhe latter effect may dominate, i.e., this procedure biases against finding a negative relationshipbetween oil income per capita and center-seeking civil war onset. Still, as Table C3 shows, thenegative correlation remains relatively strong after controlling for this variable.
49
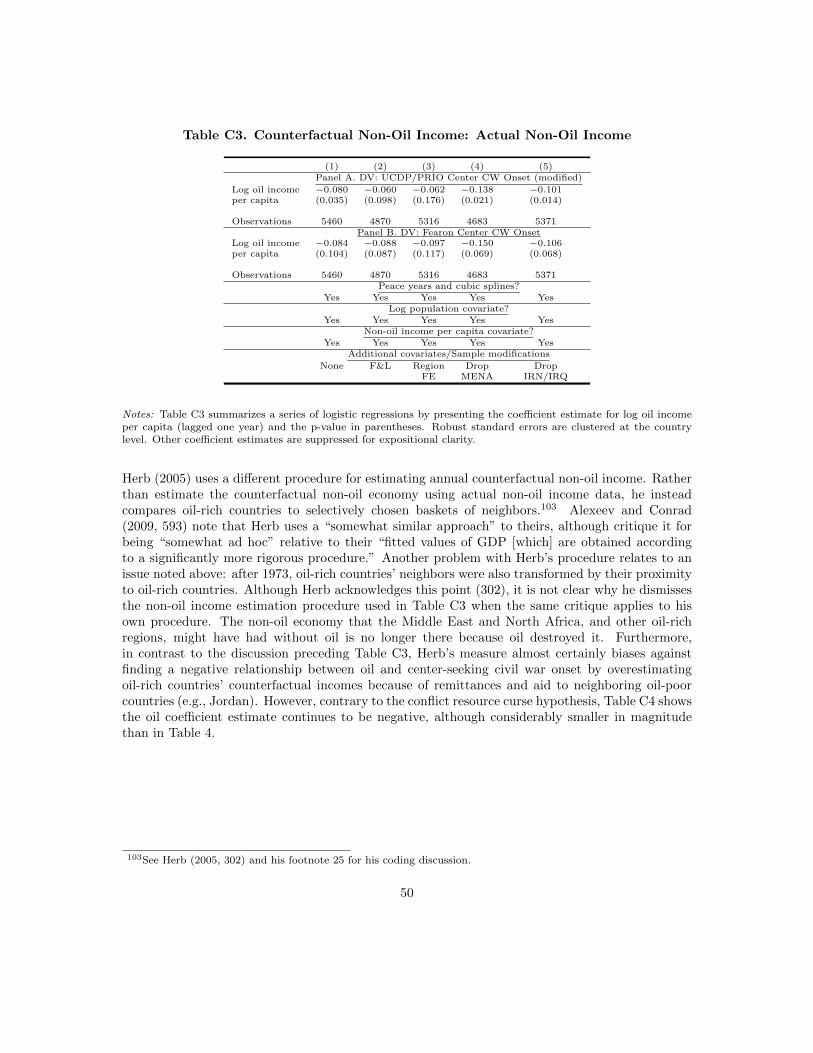
Table C3. Counterfactual Non-Oil Income: Actual Non-Oil Income
(1) (2) (3) (4) (5)Panel A. DV: UCDP/PRIO Center CW Onset (modified)
Log oil income −0.080 −0.060 −0.062 −0.138 −0.101per capita (0.035) (0.098) (0.176) (0.021) (0.014)
Observations 5460 4870 5316 4683 5371Panel B. DV: Fearon Center CW Onset
Log oil income −0.084 −0.088 −0.097 −0.150 −0.106per capita (0.104) (0.087) (0.117) (0.069) (0.068)
Observations 5460 4870 5316 4683 5371Peace years and cubic splines?
Yes Yes Yes Yes YesLog population covariate?
Yes Yes Yes Yes YesNon-oil income per capita covariate?
Yes Yes Yes Yes YesAdditional covariates/Sample modifications
None F&L Region Drop DropFE MENA IRN/IRQ
Notes: Table C3 summarizes a series of logistic regressions by presenting the coefficient estimate for log oil incomeper capita (lagged one year) and the p-value in parentheses. Robust standard errors are clustered at the countrylevel. Other coefficient estimates are suppressed for expositional clarity.
Herb (2005) uses a different procedure for estimating annual counterfactual non-oil income. Ratherthan estimate the counterfactual non-oil economy using actual non-oil income data, he insteadcompares oil-rich countries to selectively chosen baskets of neighbors.103 Alexeev and Conrad(2009, 593) note that Herb uses a “somewhat similar approach” to theirs, although critique it forbeing “somewhat ad hoc” relative to their “fitted values of GDP [which] are obtained accordingto a significantly more rigorous procedure.” Another problem with Herb’s procedure relates to anissue noted above: after 1973, oil-rich countries’ neighbors were also transformed by their proximityto oil-rich countries. Although Herb acknowledges this point (302), it is not clear why he dismissesthe non-oil income estimation procedure used in Table C3 when the same critique applies to hisown procedure. The non-oil economy that the Middle East and North Africa, and other oil-richregions, might have had without oil is no longer there because oil destroyed it. Furthermore,in contrast to the discussion preceding Table C3, Herb’s measure almost certainly biases againstfinding a negative relationship between oil and center-seeking civil war onset by overestimatingoil-rich countries’ counterfactual incomes because of remittances and aid to neighboring oil-poorcountries (e.g., Jordan). However, contrary to the conflict resource curse hypothesis, Table C4 showsthe oil coefficient estimate continues to be negative, although considerably smaller in magnitudethan in Table 4.
103See Herb (2005, 302) and his footnote 25 for his coding discussion.
50
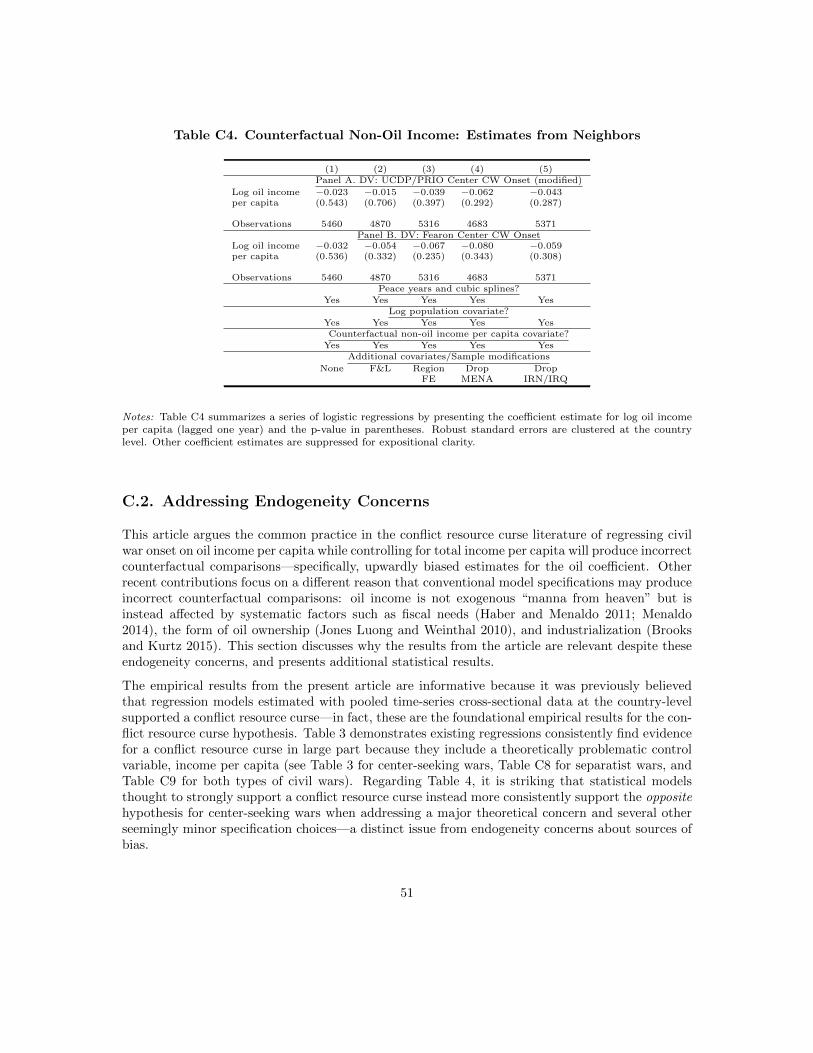
Table C4. Counterfactual Non-Oil Income: Estimates from Neighbors
(1) (2) (3) (4) (5)Panel A. DV: UCDP/PRIO Center CW Onset (modified)
Log oil income −0.023 −0.015 −0.039 −0.062 −0.043per capita (0.543) (0.706) (0.397) (0.292) (0.287)
Observations 5460 4870 5316 4683 5371Panel B. DV: Fearon Center CW Onset
Log oil income −0.032 −0.054 −0.067 −0.080 −0.059per capita (0.536) (0.332) (0.235) (0.343) (0.308)
Observations 5460 4870 5316 4683 5371Peace years and cubic splines?
Yes Yes Yes Yes YesLog population covariate?
Yes Yes Yes Yes YesCounterfactual non-oil income per capita covariate?
Yes Yes Yes Yes YesAdditional covariates/Sample modifications
None F&L Region Drop DropFE MENA IRN/IRQ
Notes: Table C4 summarizes a series of logistic regressions by presenting the coefficient estimate for log oil incomeper capita (lagged one year) and the p-value in parentheses. Robust standard errors are clustered at the countrylevel. Other coefficient estimates are suppressed for expositional clarity.
C.2. Addressing Endogeneity Concerns
This article argues the common practice in the conflict resource curse literature of regressing civilwar onset on oil income per capita while controlling for total income per capita will produce incorrectcounterfactual comparisons—specifically, upwardly biased estimates for the oil coefficient. Otherrecent contributions focus on a different reason that conventional model specifications may produceincorrect counterfactual comparisons: oil income is not exogenous “manna from heaven” but isinstead affected by systematic factors such as fiscal needs (Haber and Menaldo 2011; Menaldo2014), the form of oil ownership (Jones Luong and Weinthal 2010), and industrialization (Brooksand Kurtz 2015). This section discusses why the results from the article are relevant despite theseendogeneity concerns, and presents additional statistical results.
The empirical results from the present article are informative because it was previously believedthat regression models estimated with pooled time-series cross-sectional data at the country-levelsupported a conflict resource curse—in fact, these are the foundational empirical results for the con-flict resource curse hypothesis. Table 3 demonstrates existing regressions consistently find evidencefor a conflict resource curse in large part because they include a theoretically problematic controlvariable, income per capita (see Table 3 for center-seeking wars, Table C8 for separatist wars, andTable C9 for both types of civil wars). Regarding Table 4, it is striking that statistical modelsthought to strongly support a conflict resource curse instead more consistently support the oppositehypothesis for center-seeking wars when addressing a major theoretical concern and several otherseemingly minor specification choices—a distinct issue from endogeneity concerns about sources ofbias.
51
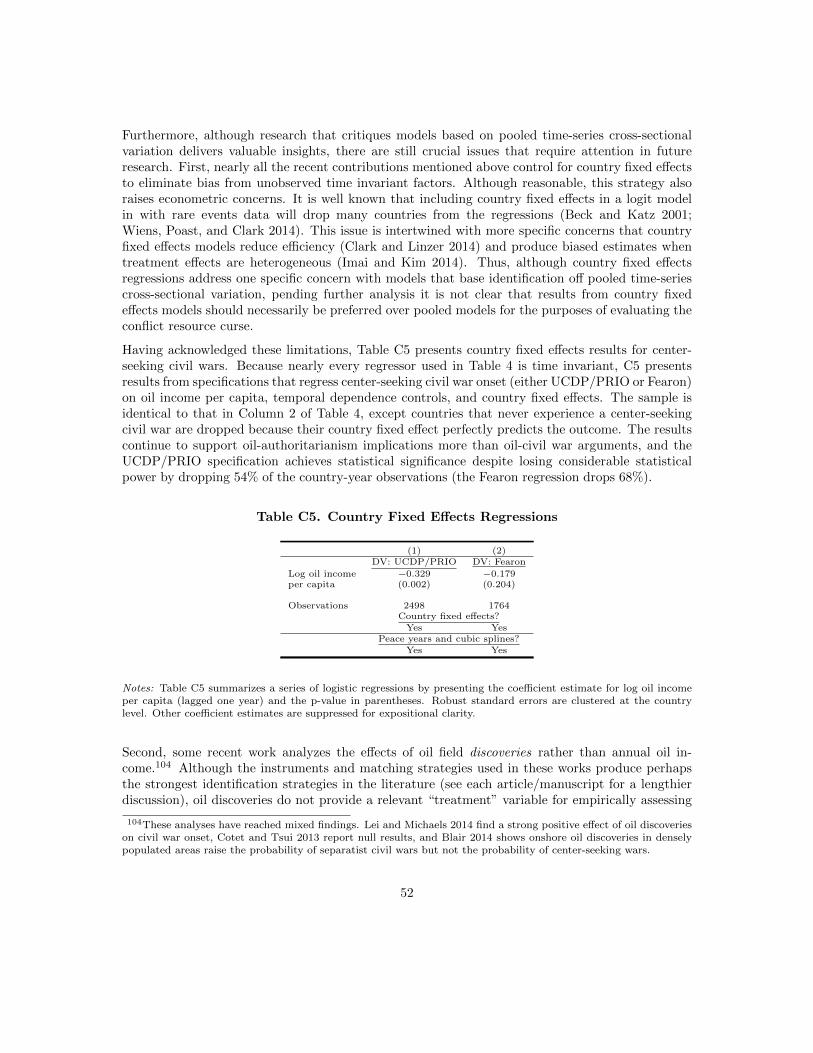
Furthermore, although research that critiques models based on pooled time-series cross-sectionalvariation delivers valuable insights, there are still crucial issues that require attention in futureresearch. First, nearly all the recent contributions mentioned above control for country fixed effectsto eliminate bias from unobserved time invariant factors. Although reasonable, this strategy alsoraises econometric concerns. It is well known that including country fixed effects in a logit modelin with rare events data will drop many countries from the regressions (Beck and Katz 2001;Wiens, Poast, and Clark 2014). This issue is intertwined with more specific concerns that countryfixed effects models reduce efficiency (Clark and Linzer 2014) and produce biased estimates whentreatment effects are heterogeneous (Imai and Kim 2014). Thus, although country fixed effectsregressions address one specific concern with models that base identification off pooled time-seriescross-sectional variation, pending further analysis it is not clear that results from country fixedeffects models should necessarily be preferred over pooled models for the purposes of evaluating theconflict resource curse.
Having acknowledged these limitations, Table C5 presents country fixed effects results for center-seeking civil wars. Because nearly every regressor used in Table 4 is time invariant, C5 presentsresults from specifications that regress center-seeking civil war onset (either UCDP/PRIO or Fearon)on oil income per capita, temporal dependence controls, and country fixed effects. The sample isidentical to that in Column 2 of Table 4, except countries that never experience a center-seekingcivil war are dropped because their country fixed effect perfectly predicts the outcome. The resultscontinue to support oil-authoritarianism implications more than oil-civil war arguments, and theUCDP/PRIO specification achieves statistical significance despite losing considerable statisticalpower by dropping 54% of the country-year observations (the Fearon regression drops 68%).
Table C5. Country Fixed Effects Regressions
(1) (2)DV: UCDP/PRIO DV: Fearon
Log oil income −0.329 −0.179per capita (0.002) (0.204)
Observations 2498 1764Country fixed effects?
Yes YesPeace years and cubic splines?
Yes Yes
Notes: Table C5 summarizes a series of logistic regressions by presenting the coefficient estimate for log oil incomeper capita (lagged one year) and the p-value in parentheses. Robust standard errors are clustered at the countrylevel. Other coefficient estimates are suppressed for expositional clarity.
Second, some recent work analyzes the effects of oil field discoveries rather than annual oil in-come.104 Although the instruments and matching strategies used in these works produce perhapsthe strongest identification strategies in the literature (see each article/manuscript for a lengthierdiscussion), oil discoveries do not provide a relevant “treatment” variable for empirically assessing
104These analyses have reached mixed findings. Lei and Michaels 2014 find a strong positive effect of oil discoverieson civil war onset, Cotet and Tsui 2013 report null results, and Blair 2014 shows onshore oil discoveries in denselypopulated areas raise the probability of separatist civil wars but not the probability of center-seeking wars.
52
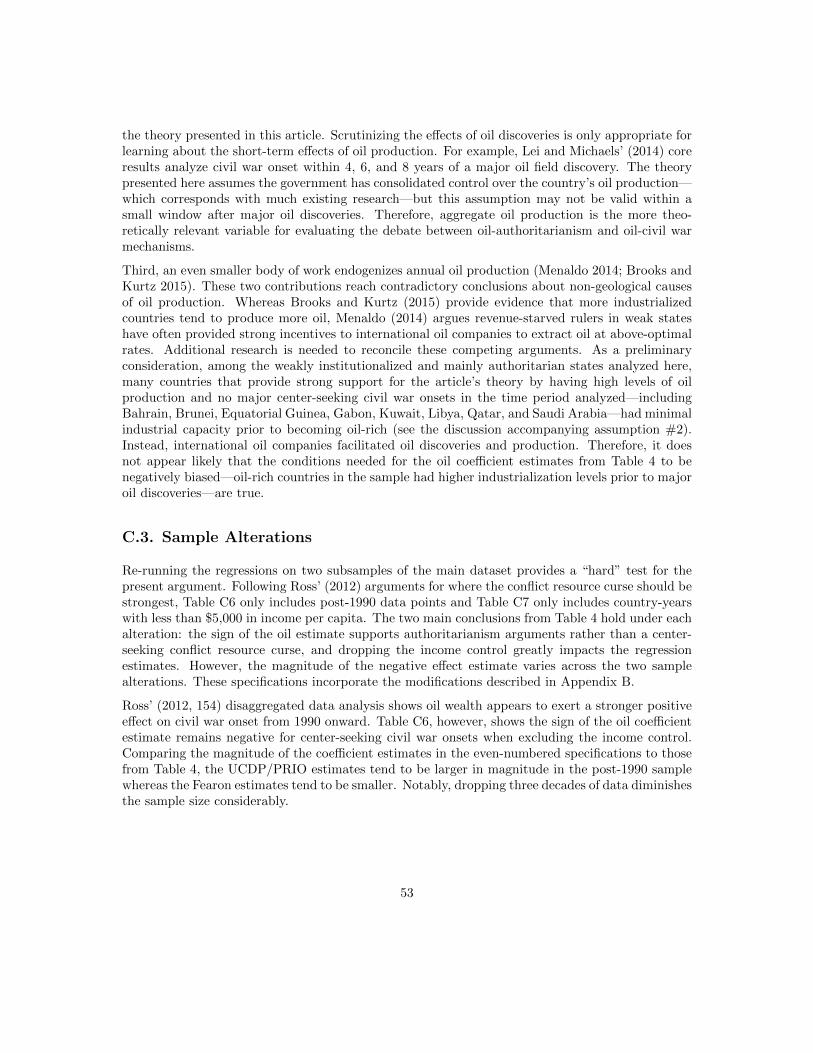
the theory presented in this article. Scrutinizing the effects of oil discoveries is only appropriate forlearning about the short-term effects of oil production. For example, Lei and Michaels’ (2014) coreresults analyze civil war onset within 4, 6, and 8 years of a major oil field discovery. The theorypresented here assumes the government has consolidated control over the country’s oil production—which corresponds with much existing research—but this assumption may not be valid within asmall window after major oil discoveries. Therefore, aggregate oil production is the more theo-retically relevant variable for evaluating the debate between oil-authoritarianism and oil-civil warmechanisms.
Third, an even smaller body of work endogenizes annual oil production (Menaldo 2014; Brooks andKurtz 2015). These two contributions reach contradictory conclusions about non-geological causesof oil production. Whereas Brooks and Kurtz (2015) provide evidence that more industrializedcountries tend to produce more oil, Menaldo (2014) argues revenue-starved rulers in weak stateshave often provided strong incentives to international oil companies to extract oil at above-optimalrates. Additional research is needed to reconcile these competing arguments. As a preliminaryconsideration, among the weakly institutionalized and mainly authoritarian states analyzed here,many countries that provide strong support for the article’s theory by having high levels of oilproduction and no major center-seeking civil war onsets in the time period analyzed—includingBahrain, Brunei, Equatorial Guinea, Gabon, Kuwait, Libya, Qatar, and Saudi Arabia—had minimalindustrial capacity prior to becoming oil-rich (see the discussion accompanying assumption #2).Instead, international oil companies facilitated oil discoveries and production. Therefore, it doesnot appear likely that the conditions needed for the oil coefficient estimates from Table 4 to benegatively biased—oil-rich countries in the sample had higher industrialization levels prior to majoroil discoveries—are true.
C.3. Sample Alterations
Re-running the regressions on two subsamples of the main dataset provides a “hard” test for thepresent argument. Following Ross’ (2012) arguments for where the conflict resource curse should bestrongest, Table C6 only includes post-1990 data points and Table C7 only includes country-yearswith less than $5,000 in income per capita. The two main conclusions from Table 4 hold under eachalteration: the sign of the oil estimate supports authoritarianism arguments rather than a center-seeking conflict resource curse, and dropping the income control greatly impacts the regressionestimates. However, the magnitude of the negative effect estimate varies across the two samplealterations. These specifications incorporate the modifications described in Appendix B.
Ross’ (2012, 154) disaggregated data analysis shows oil wealth appears to exert a stronger positiveeffect on civil war onset from 1990 onward. Table C6, however, shows the sign of the oil coefficientestimate remains negative for center-seeking civil war onsets when excluding the income control.Comparing the magnitude of the coefficient estimates in the even-numbered specifications to thosefrom Table 4, the UCDP/PRIO estimates tend to be larger in magnitude in the post-1990 samplewhereas the Fearon estimates tend to be smaller. Notably, dropping three decades of data diminishesthe sample size considerably.
53
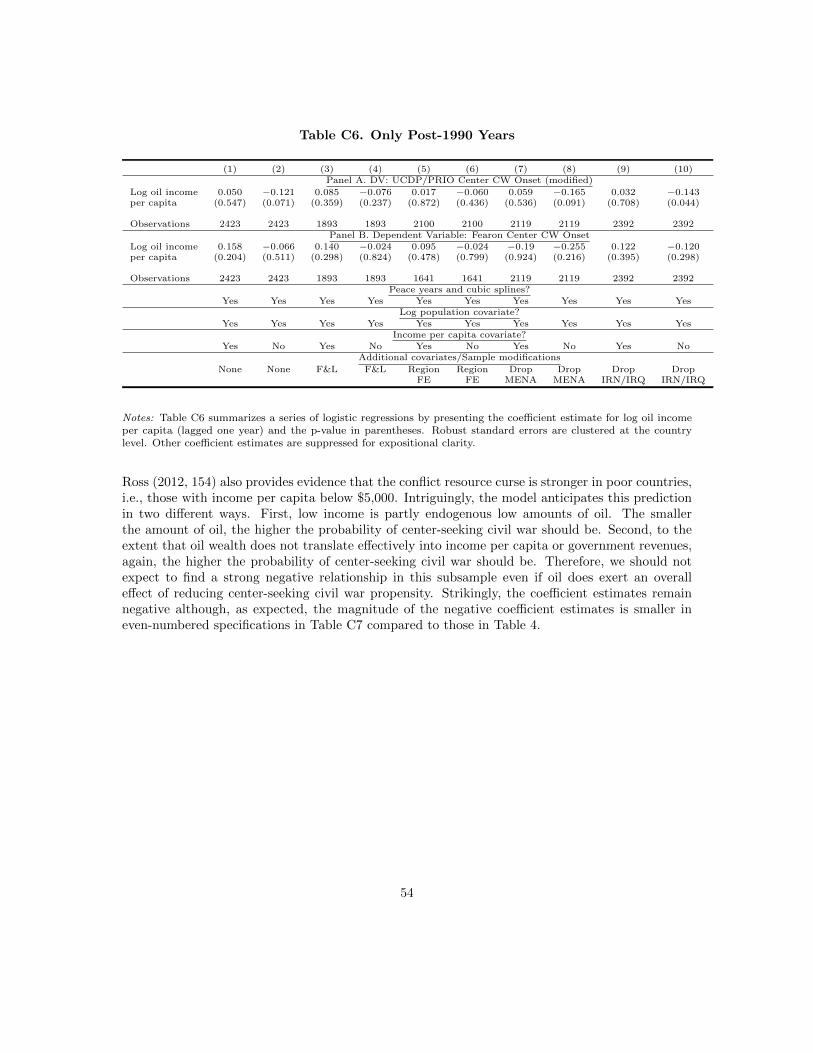
Table C6. Only Post-1990 Years
(1) (2) (3) (4) (5) (6) (7) (8) (9) (10)Panel A. DV: UCDP/PRIO Center CW Onset (modified)
Log oil income 0.050 −0.121 0.085 −0.076 0.017 −0.060 0.059 −0.165 0.032 −0.143per capita (0.547) (0.071) (0.359) (0.237) (0.872) (0.436) (0.536) (0.091) (0.708) (0.044)
Observations 2423 2423 1893 1893 2100 2100 2119 2119 2392 2392Panel B. Dependent Variable: Fearon Center CW Onset
Log oil income 0.158 −0.066 0.140 −0.024 0.095 −0.024 −0.19 −0.255 0.122 −0.120per capita (0.204) (0.511) (0.298) (0.824) (0.478) (0.799) (0.924) (0.216) (0.395) (0.298)
Observations 2423 2423 1893 1893 1641 1641 2119 2119 2392 2392Peace years and cubic splines?
Yes Yes Yes Yes Yes Yes Yes Yes Yes YesLog population covariate?
Yes Yes Yes Yes Yes Yes Yes Yes Yes YesIncome per capita covariate?
Yes No Yes No Yes No Yes No Yes NoAdditional covariates/Sample modifications
None None F&L F&L Region Region Drop Drop Drop DropFE FE MENA MENA IRN/IRQ IRN/IRQ
Notes: Table C6 summarizes a series of logistic regressions by presenting the coefficient estimate for log oil incomeper capita (lagged one year) and the p-value in parentheses. Robust standard errors are clustered at the countrylevel. Other coefficient estimates are suppressed for expositional clarity.
Ross (2012, 154) also provides evidence that the conflict resource curse is stronger in poor countries,i.e., those with income per capita below $5,000. Intriguingly, the model anticipates this predictionin two different ways. First, low income is partly endogenous low amounts of oil. The smallerthe amount of oil, the higher the probability of center-seeking civil war should be. Second, to theextent that oil wealth does not translate effectively into income per capita or government revenues,again, the higher the probability of center-seeking civil war should be. Therefore, we should notexpect to find a strong negative relationship in this subsample even if oil does exert an overalleffect of reducing center-seeking civil war propensity. Strikingly, the coefficient estimates remainnegative although, as expected, the magnitude of the negative coefficient estimates is smaller ineven-numbered specifications in Table C7 compared to those in Table 4.
54
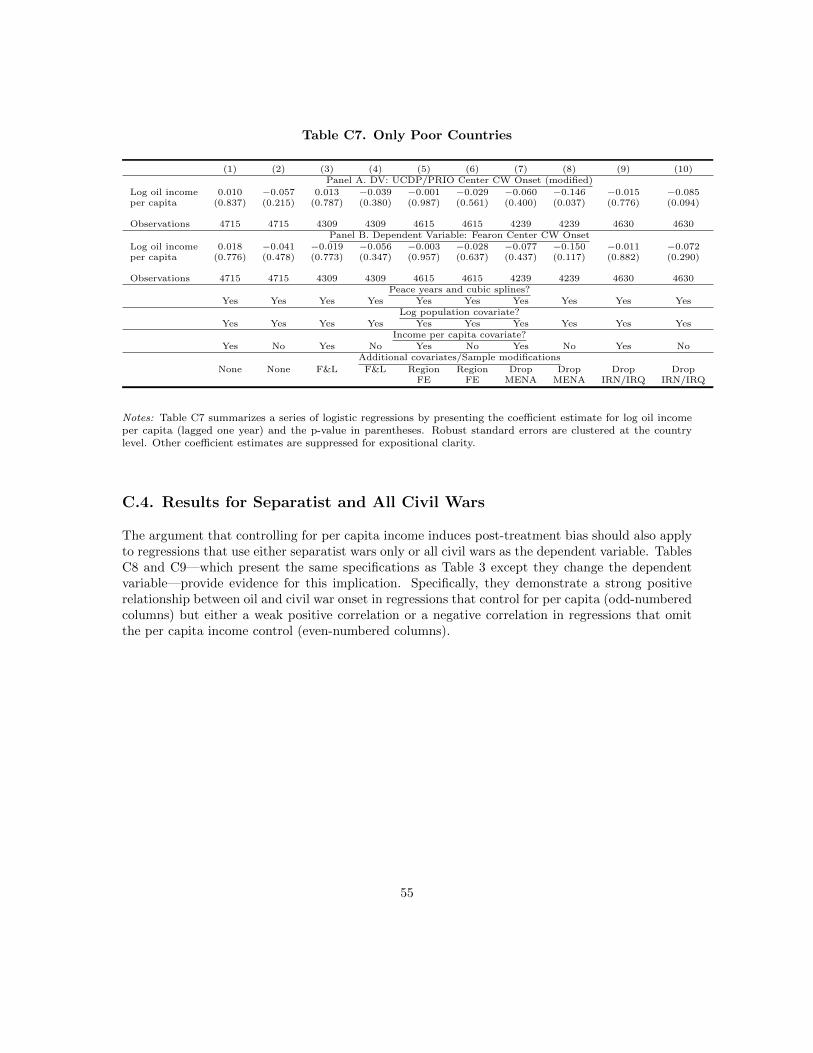
Table C7. Only Poor Countries
(1) (2) (3) (4) (5) (6) (7) (8) (9) (10)Panel A. DV: UCDP/PRIO Center CW Onset (modified)
Log oil income 0.010 −0.057 0.013 −0.039 −0.001 −0.029 −0.060 −0.146 −0.015 −0.085per capita (0.837) (0.215) (0.787) (0.380) (0.987) (0.561) (0.400) (0.037) (0.776) (0.094)
Observations 4715 4715 4309 4309 4615 4615 4239 4239 4630 4630Panel B. Dependent Variable: Fearon Center CW Onset
Log oil income 0.018 −0.041 −0.019 −0.056 −0.003 −0.028 −0.077 −0.150 −0.011 −0.072per capita (0.776) (0.478) (0.773) (0.347) (0.957) (0.637) (0.437) (0.117) (0.882) (0.290)
Observations 4715 4715 4309 4309 4615 4615 4239 4239 4630 4630Peace years and cubic splines?
Yes Yes Yes Yes Yes Yes Yes Yes Yes YesLog population covariate?
Yes Yes Yes Yes Yes Yes Yes Yes Yes YesIncome per capita covariate?
Yes No Yes No Yes No Yes No Yes NoAdditional covariates/Sample modifications
None None F&L F&L Region Region Drop Drop Drop DropFE FE MENA MENA IRN/IRQ IRN/IRQ
Notes: Table C7 summarizes a series of logistic regressions by presenting the coefficient estimate for log oil incomeper capita (lagged one year) and the p-value in parentheses. Robust standard errors are clustered at the countrylevel. Other coefficient estimates are suppressed for expositional clarity.
C.4. Results for Separatist and All Civil Wars
The argument that controlling for per capita income induces post-treatment bias should also applyto regressions that use either separatist wars only or all civil wars as the dependent variable. TablesC8 and C9—which present the same specifications as Table 3 except they change the dependentvariable—provide evidence for this implication. Specifically, they demonstrate a strong positiverelationship between oil and civil war onset in regressions that control for per capita (odd-numberedcolumns) but either a weak positive correlation or a negative correlation in regressions that omitthe per capita income control (even-numbered columns).
55
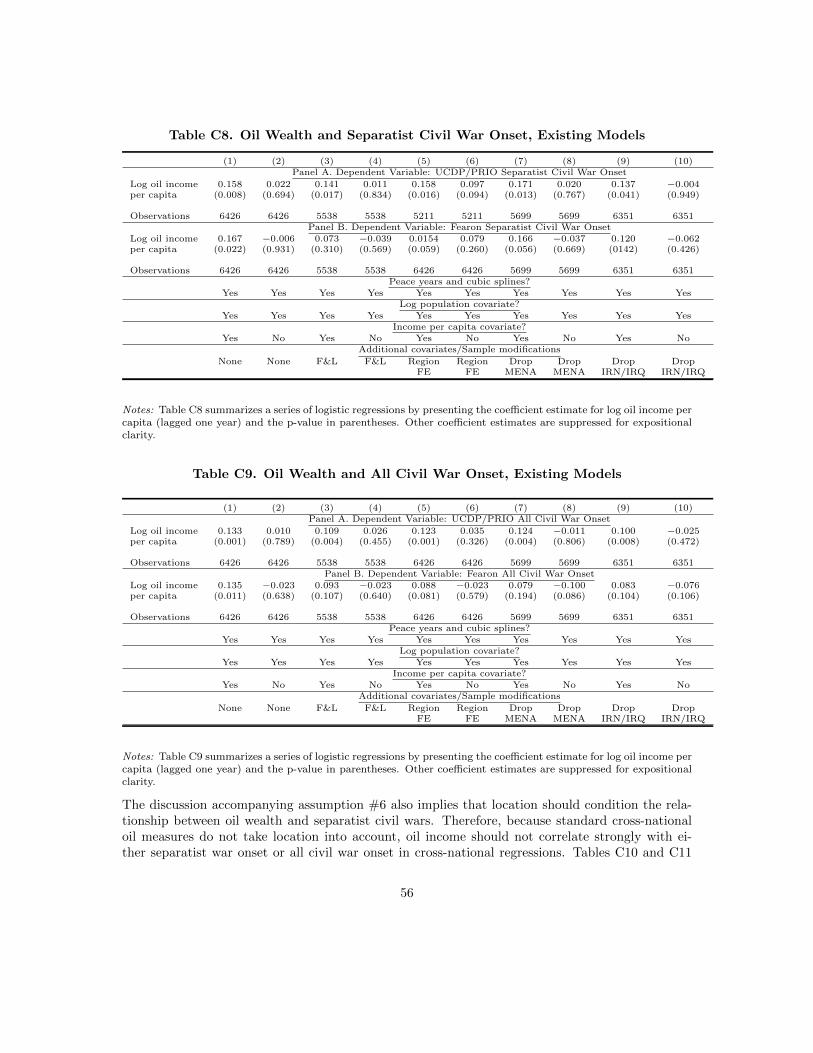
Table C8. Oil Wealth and Separatist Civil War Onset, Existing Models
(1) (2) (3) (4) (5) (6) (7) (8) (9) (10)Panel A. Dependent Variable: UCDP/PRIO Separatist Civil War Onset
Log oil income 0.158 0.022 0.141 0.011 0.158 0.097 0.171 0.020 0.137 −0.004per capita (0.008) (0.694) (0.017) (0.834) (0.016) (0.094) (0.013) (0.767) (0.041) (0.949)
Observations 6426 6426 5538 5538 5211 5211 5699 5699 6351 6351Panel B. Dependent Variable: Fearon Separatist Civil War Onset
Log oil income 0.167 −0.006 0.073 −0.039 0.0154 0.079 0.166 −0.037 0.120 −0.062per capita (0.022) (0.931) (0.310) (0.569) (0.059) (0.260) (0.056) (0.669) (0142) (0.426)
Observations 6426 6426 5538 5538 6426 6426 5699 5699 6351 6351Peace years and cubic splines?
Yes Yes Yes Yes Yes Yes Yes Yes Yes YesLog population covariate?
Yes Yes Yes Yes Yes Yes Yes Yes Yes YesIncome per capita covariate?
Yes No Yes No Yes No Yes No Yes NoAdditional covariates/Sample modifications
None None F&L F&L Region Region Drop Drop Drop DropFE FE MENA MENA IRN/IRQ IRN/IRQ
Notes: Table C8 summarizes a series of logistic regressions by presenting the coefficient estimate for log oil income percapita (lagged one year) and the p-value in parentheses. Other coefficient estimates are suppressed for expositionalclarity.
Table C9. Oil Wealth and All Civil War Onset, Existing Models
(1) (2) (3) (4) (5) (6) (7) (8) (9) (10)Panel A. Dependent Variable: UCDP/PRIO All Civil War Onset
Log oil income 0.133 0.010 0.109 0.026 0.123 0.035 0.124 −0.011 0.100 −0.025per capita (0.001) (0.789) (0.004) (0.455) (0.001) (0.326) (0.004) (0.806) (0.008) (0.472)
Observations 6426 6426 5538 5538 6426 6426 5699 5699 6351 6351Panel B. Dependent Variable: Fearon All Civil War Onset
Log oil income 0.135 −0.023 0.093 −0.023 0.088 −0.023 0.079 −0.100 0.083 −0.076per capita (0.011) (0.638) (0.107) (0.640) (0.081) (0.579) (0.194) (0.086) (0.104) (0.106)
Observations 6426 6426 5538 5538 6426 6426 5699 5699 6351 6351Peace years and cubic splines?
Yes Yes Yes Yes Yes Yes Yes Yes Yes YesLog population covariate?
Yes Yes Yes Yes Yes Yes Yes Yes Yes YesIncome per capita covariate?
Yes No Yes No Yes No Yes No Yes NoAdditional covariates/Sample modifications
None None F&L F&L Region Region Drop Drop Drop DropFE FE MENA MENA IRN/IRQ IRN/IRQ
Notes: Table C9 summarizes a series of logistic regressions by presenting the coefficient estimate for log oil income percapita (lagged one year) and the p-value in parentheses. Other coefficient estimates are suppressed for expositionalclarity.
The discussion accompanying assumption #6 also implies that location should condition the rela-tionship between oil wealth and separatist civil wars. Therefore, because standard cross-nationaloil measures do not take location into account, oil income should not correlate strongly with ei-ther separatist war onset or all civil war onset in cross-national regressions. Tables C10 and C11
56
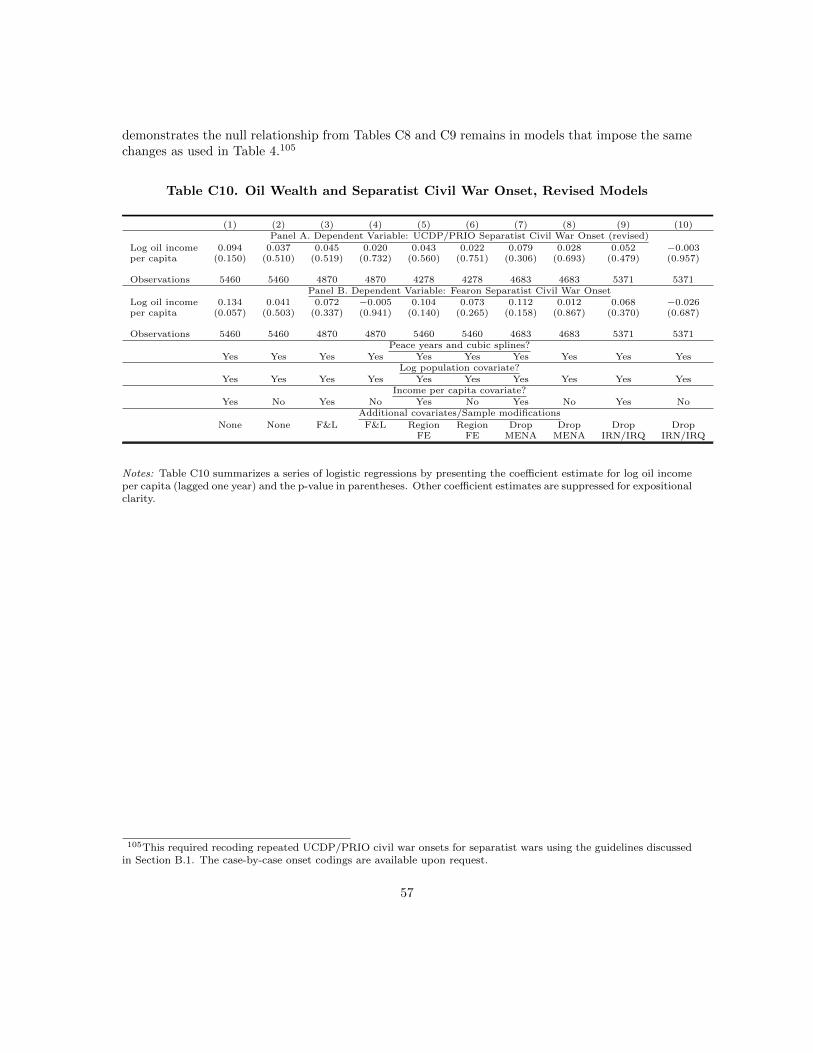
demonstrates the null relationship from Tables C8 and C9 remains in models that impose the samechanges as used in Table 4.105
Table C10. Oil Wealth and Separatist Civil War Onset, Revised Models
(1) (2) (3) (4) (5) (6) (7) (8) (9) (10)Panel A. Dependent Variable: UCDP/PRIO Separatist Civil War Onset (revised)
Log oil income 0.094 0.037 0.045 0.020 0.043 0.022 0.079 0.028 0.052 −0.003per capita (0.150) (0.510) (0.519) (0.732) (0.560) (0.751) (0.306) (0.693) (0.479) (0.957)
Observations 5460 5460 4870 4870 4278 4278 4683 4683 5371 5371Panel B. Dependent Variable: Fearon Separatist Civil War Onset
Log oil income 0.134 0.041 0.072 −0.005 0.104 0.073 0.112 0.012 0.068 −0.026per capita (0.057) (0.503) (0.337) (0.941) (0.140) (0.265) (0.158) (0.867) (0.370) (0.687)
Observations 5460 5460 4870 4870 5460 5460 4683 4683 5371 5371Peace years and cubic splines?
Yes Yes Yes Yes Yes Yes Yes Yes Yes YesLog population covariate?
Yes Yes Yes Yes Yes Yes Yes Yes Yes YesIncome per capita covariate?
Yes No Yes No Yes No Yes No Yes NoAdditional covariates/Sample modifications
None None F&L F&L Region Region Drop Drop Drop DropFE FE MENA MENA IRN/IRQ IRN/IRQ
Notes: Table C10 summarizes a series of logistic regressions by presenting the coefficient estimate for log oil incomeper capita (lagged one year) and the p-value in parentheses. Other coefficient estimates are suppressed for expositionalclarity.
105This required recoding repeated UCDP/PRIO civil war onsets for separatist wars using the guidelines discussedin Section B.1. The case-by-case onset codings are available upon request.
57
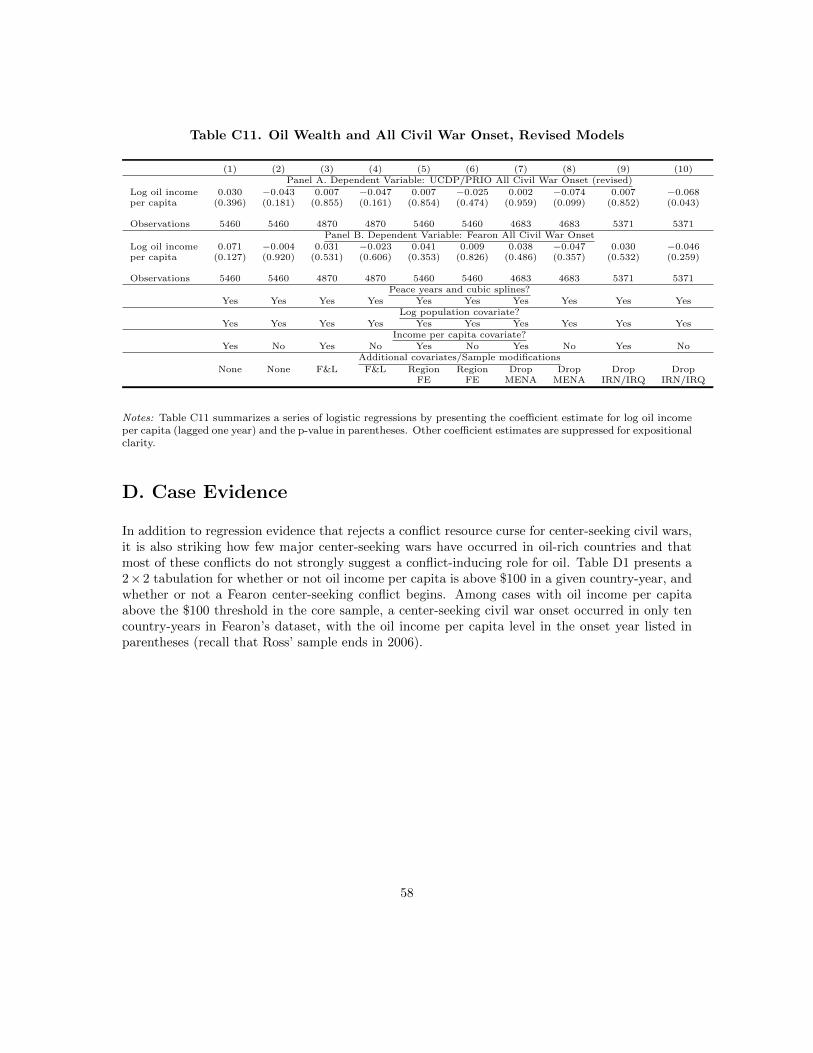
Table C11. Oil Wealth and All Civil War Onset, Revised Models
(1) (2) (3) (4) (5) (6) (7) (8) (9) (10)Panel A. Dependent Variable: UCDP/PRIO All Civil War Onset (revised)
Log oil income 0.030 −0.043 0.007 −0.047 0.007 −0.025 0.002 −0.074 0.007 −0.068per capita (0.396) (0.181) (0.855) (0.161) (0.854) (0.474) (0.959) (0.099) (0.852) (0.043)
Observations 5460 5460 4870 4870 5460 5460 4683 4683 5371 5371Panel B. Dependent Variable: Fearon All Civil War Onset
Log oil income 0.071 −0.004 0.031 −0.023 0.041 0.009 0.038 −0.047 0.030 −0.046per capita (0.127) (0.920) (0.531) (0.606) (0.353) (0.826) (0.486) (0.357) (0.532) (0.259)
Observations 5460 5460 4870 4870 5460 5460 4683 4683 5371 5371Peace years and cubic splines?
Yes Yes Yes Yes Yes Yes Yes Yes Yes YesLog population covariate?
Yes Yes Yes Yes Yes Yes Yes Yes Yes YesIncome per capita covariate?
Yes No Yes No Yes No Yes No Yes NoAdditional covariates/Sample modifications
None None F&L F&L Region Region Drop Drop Drop DropFE FE MENA MENA IRN/IRQ IRN/IRQ
Notes: Table C11 summarizes a series of logistic regressions by presenting the coefficient estimate for log oil incomeper capita (lagged one year) and the p-value in parentheses. Other coefficient estimates are suppressed for expositionalclarity.
D. Case Evidence
In addition to regression evidence that rejects a conflict resource curse for center-seeking civil wars,it is also striking how few major center-seeking wars have occurred in oil-rich countries and thatmost of these conflicts do not strongly suggest a conflict-inducing role for oil. Table D1 presents a2×2 tabulation for whether or not oil income per capita is above $100 in a given country-year, andwhether or not a Fearon center-seeking conflict begins. Among cases with oil income per capitaabove the $100 threshold in the core sample, a center-seeking civil war onset occurred in only tencountry-years in Fearon’s dataset, with the oil income per capita level in the onset year listed inparentheses (recall that Ross’ sample ends in 2006).
58
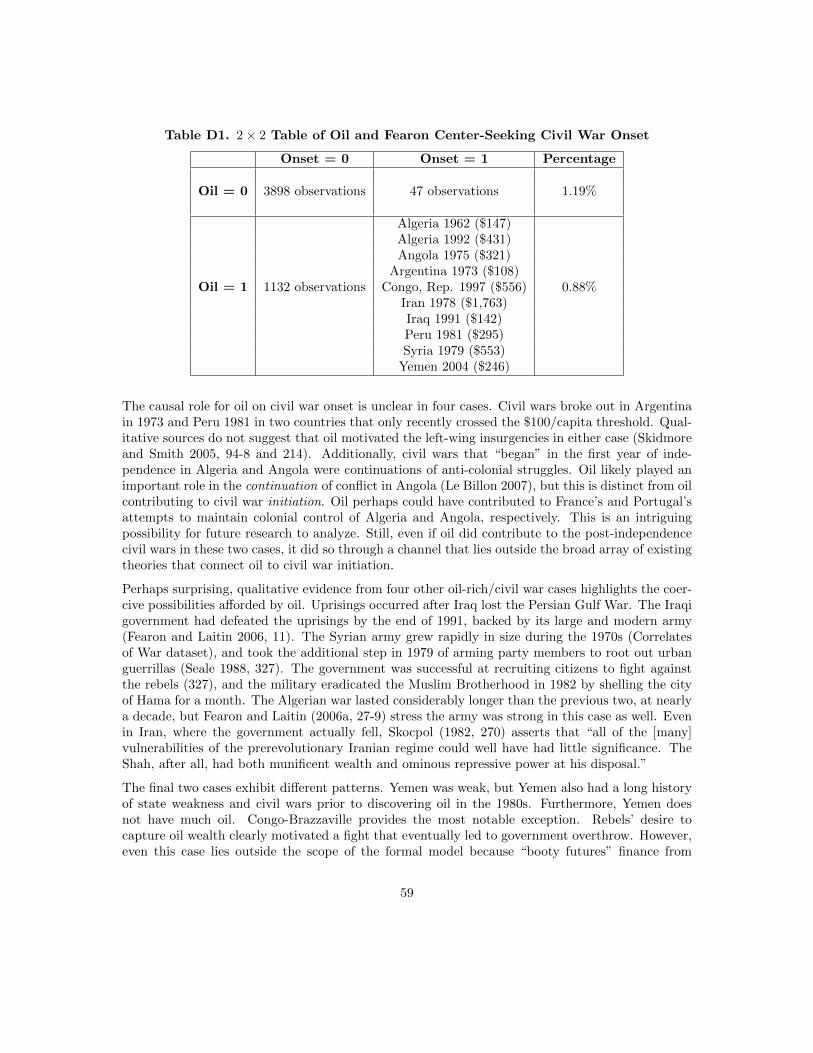
Table D1. 2× 2 Table of Oil and Fearon Center-Seeking Civil War Onset
Onset = 0 Onset = 1 Percentage
Oil = 0 3898 observations 47 observations 1.19%
Algeria 1962 ($147)Algeria 1992 ($431)Angola 1975 ($321)
Argentina 1973 ($108)Oil = 1 1132 observations Congo, Rep. 1997 ($556) 0.88%
Iran 1978 ($1,763)Iraq 1991 ($142)Peru 1981 ($295)Syria 1979 ($553)
Yemen 2004 ($246)
The causal role for oil on civil war onset is unclear in four cases. Civil wars broke out in Argentinain 1973 and Peru 1981 in two countries that only recently crossed the $100/capita threshold. Qual-itative sources do not suggest that oil motivated the left-wing insurgencies in either case (Skidmoreand Smith 2005, 94-8 and 214). Additionally, civil wars that “began” in the first year of inde-pendence in Algeria and Angola were continuations of anti-colonial struggles. Oil likely played animportant role in the continuation of conflict in Angola (Le Billon 2007), but this is distinct from oilcontributing to civil war initiation. Oil perhaps could have contributed to France’s and Portugal’sattempts to maintain colonial control of Algeria and Angola, respectively. This is an intriguingpossibility for future research to analyze. Still, even if oil did contribute to the post-independencecivil wars in these two cases, it did so through a channel that lies outside the broad array of existingtheories that connect oil to civil war initiation.
Perhaps surprising, qualitative evidence from four other oil-rich/civil war cases highlights the coer-cive possibilities afforded by oil. Uprisings occurred after Iraq lost the Persian Gulf War. The Iraqigovernment had defeated the uprisings by the end of 1991, backed by its large and modern army(Fearon and Laitin 2006, 11). The Syrian army grew rapidly in size during the 1970s (Correlatesof War dataset), and took the additional step in 1979 of arming party members to root out urbanguerrillas (Seale 1988, 327). The government was successful at recruiting citizens to fight againstthe rebels (327), and the military eradicated the Muslim Brotherhood in 1982 by shelling the cityof Hama for a month. The Algerian war lasted considerably longer than the previous two, at nearlya decade, but Fearon and Laitin (2006a, 27-9) stress the army was strong in this case as well. Evenin Iran, where the government actually fell, Skocpol (1982, 270) asserts that “all of the [many]vulnerabilities of the prerevolutionary Iranian regime could well have had little significance. TheShah, after all, had both munificent wealth and ominous repressive power at his disposal.”
The final two cases exhibit different patterns. Yemen was weak, but Yemen also had a long historyof state weakness and civil wars prior to discovering oil in the 1980s. Furthermore, Yemen doesnot have much oil. Congo-Brazzaville provides the most notable exception. Rebels’ desire tocapture oil wealth clearly motivated a fight that eventually led to government overthrow. However,even this case lies outside the scope of the formal model because “booty futures” finance from
59
an international oil company (contrary to argument #1 above about government control of oilrevenues) proved crucial to the rebels’ success (Ross 2012, 174-6).
E. Examples of Misinterpreting Fearon and Laitin
For examples of research that cites Fearon and Laitin (2003) or Fearon (2005) as positing a hy-pothesis about the overall effects of oil—that is, dropping the conditionality about income—seeHumphreys (2005, 512-3), Basedau and Lay (2009, 759), Glynn (2009, 1), Lujala (2009, 52), Hen-drix (2010, 275), Sobek (2010, 269), Morrison (2012, 18), Ross (2012, 162), Cotet and Tsui (2013,52), Cederman, Gleditsch, and Buhaug (2013, 16), Kennedy and Tiede (2013, 760), Waldner andSmith (2013, 21), and Koubi et al. (2014, 232).
Additional References
Acemoglu, Daron, and Alexander Wolitzky. “The Economics of Labor Coercion.” Econometrica,79: 555-600.
Cederman, Lars-Erik, Kristian Skrede Gleditsch, and Halvard Buhaug. 2013. Inequality, Grievances,and Civil War. Cambridge University Press: New York.
Correlates of War. “National Material Capabilities (v3.02).” http://www.correlatesofwar.org/COW2%20Data/Capabilities/nmc3-02.htm. Accessed 2/25/14.
Cotet, Anca M. and Kevin K. Tsui. 2010. “Resource Curse or Malthusian Trap? Evidence fromOil Discoveries and Extractions.” Working paper.
Fearon, James D. and David D. Laitin. 2006a. “Random Narrative: Algeria.”
Geddes, Barbara, Joseph Wright, and Erica Frantz. 2014. “Autocratic Breakdown and RegimeTransitions.” Perspectives on Politics, 12(2): 313-331.
Glynn, Adam N. 2009. “Does Oil Cause State Weakness Because It Causes Civil War?” WorkingPaper.
Hendrix, Cullen S. 2010. “Measuring state capacity: Theoretical and empirical implications for thestudy of civil conflict.” Journal of Peace Research, 47(3): 273-285.
Heston, Alan, Robert Summers, and Bettina Aten. 2006. “Penn World Table Version 6.2.” Centerfor International Comparisons of Production, Income and Prices at the University of Pennsylvania.https://pwt.sas.upenn.edu/php site/pwt index.php. Accessed 12/17/14.
Heston, Alan, Robert Summers, and Bettina Aten. 2012. “Penn World Table Version 7.1.” Centerfor International Comparisons of Production, Income and Prices at the University of Pennsylvania.https://pwt.sas.upenn.edu/php site/pwt index.php. Accessed 12/17/14.
Lujala, Paivi. 2009. “Deadly combat over natural resources: Gems, petroleum, drugs, and theseverity of armed civil conflict.” Journal of Conflict Resolution, 53(1): 50-71.
60
Maddison, Angus. 2010. “Statistics on World Population, GDP and Per Capita GDP, 1-2008 AD.”http://www.ggdc.net/maddison/oriindex.htm. Accessed 12/9/14.
National Counterterrorism Center. 2014. “Islamic Jihad Union (IJU).” http://www.nctc.gov/site/groups/iju.html. Accessed 12/9/14.
Powell, Robert. 2013. “Monopolizing Violence and Consolidating Power.” The Quarterly Journalof Economics, 128(2): 807-859.
Seale, Patrick. 1988. Asad: The Struggle for the Middle East. California University Press: Berke-ley.
Skidmore, Thomas E. and Peter H. Smith. 2005. Modern Latin America: Sixth Edition. OxfordUniversity Press: New York.
Skocpol, Theda. 1982. “Rentier State and Shi’a Islam in the Iranian Revolution.” Theory andSociety, 11(3): 265-283.
Sobek, David. 2010. “Masters of their domains: The role of state capacity in civil wars.” Journalof Peace Research, 47(3): 267-271.
Waldner, David and Benjamin Smith. 2013. “Rentier States and State Transformation.” Forth-coming in The Oxford Handbook of Transformations of the State, Eds. Stephan Leibfried, FrankNullmeier, Evelyne Huber, Matthew Lange, Jonah Levy, and John Stephens.
61
Chapter 2
Irreconcilable Grievances? WhyOil-Rich Ethnic Minority GroupsFight Separatist Civil Wars
Abstract
Providing one of the strongest empirical regularities related to the prominent conflictresource curse hypothesis, separatist civil wars occur more frequently in territories pop-ulated by ethnic minority groups. However, crucial questions remain about the strategicfoundations for this relationship. What properties of oil production, as opposed to othertypes of economic activity, cause bargaining breakdown? This concern is especiallypressing because oil revenues provide governments with revenues to deter insurgencies.And what prevents the government from strategically reducing grievances to preventcostly fighting? This paper presents a game theoretic model featuring an interactionbetween a government and ethnic minority group. Because the government can extractoil revenues with minimal local participation, it can enact high tax rates on oil produc-tion. This creates grievances. Furthermore, the government chooses not to lower taxrates to alleviate grievances when oil revenues are large relative to other revenue sources,because the lost consumption from fighting is lower than the opportunity costs of low-ering taxes on the “prize.” Finally, the model also yields a novel conditional conflictresource curse hypothesis that finds statistical support for ethnic civil war onsets: localoil wealth should only raise separatist civil war propensity for groups with weak insti-tutional ties to the center, but the conflict-inducing parameter range is not empiricallyrelevant for center-seeking civil wars.
62
2.1 Introduction
Grievances by ethnic minority groups are an important explanation for civil wars (Gurr 1969;Horowitz 1985; Cederman et al. 2013). Separatist civil wars in particular—in which combatantsfight to create an autonomous government—frequently feature ethnically oriented grievances. Com-batants have proclaimed ethnic-related goals in 39 of 40 major separatist wars since 1945 (Dennyand Walter 2014, 201).1 Related to this pattern, regional concentration of a self-identified groupwithin a circumscribed territory—as ethnic groups often are—is a near precondition for initiatinga separatist civil war (Toft 2014, 191).
Ethnic grievances provide an especially prominent explanation linking oil production to higherrates of separatist civil war onset.2 Although this literature has used the term “grievance” indifferent ways,3 scholars commonly invoke inter-ethnic wealth disparities, also known as horizontalinequalities (e.g., Humphreys 2005, 512; Ross 2007, 245; Basedau and Lay 2009, 759; Morrison 2012,7-8; Cederman et al. 2013, 84; Smith 2015, 7). Regarding empirical trends, there is consistentevidence that ethnic minority groups in oil-rich territories fight separatist civil wars at elevatedrates (Sorens 2011; Ross 2012, 165-6; Condra 2013; Blair 2014; Morelli and Rohner 2014). Amongnumerically small and politically relevant ethnic groups in Africa and Asia, oil-rich groups initiatedseparatist civil wars in 2.4% of group-years between 1945 and 2009, compared to 0.5% among oil-poor groups.4 In total, 15 of 16 separatist civil wars fought over oil-rich territories between 1960and 2006 were initiated by an ethnic or religious minority group (Ross 2012, 165-6).
Why should local oil wealth exacerbate ethnic grievances and cause separatist civil wars? Makingadditional progress on this question requires scrutinizing properties of oil that prevent successfulbargaining between the government and a minority group—because in principal the parties shouldprefer a negotiated settlement to costly fighting.5 As one possibility, oil may trigger fighting bycreating a valuable prize that a group can seize by seceding (Collier and Hoeffler 2005; Le Billon2006).6 This explanation on its own, however, is unsatisfying because oil production also exertsa strong countervailing effect: providing the government with revenues to build a strong coerciveapparatus and to distribute patronage. Focusing on center-seeking civil wars, Chapter 1 arguesthese revenue-enhancing mechanisms tend to overwhelm the prize effect to lower center-seekingconflict propensity. Why should the effect of oil wealth on separatist civil wars differ?
As another possibility, local oil wealth may not only create a valuable prize, but also exacerbategrievances by causing redistribution of wealth away from the ethnic group’s territory (e.g., Sorens
1This contrasts with 33 out of 73 center-seeking civil wars, in which combatants fight to capture the capital.2Major academic contributions to the broader intra-state conflict resource curse literature include Collier and
Hoeffler (2004), Fearon and Laitin (2003), Fearon (2005), Hegre and Sambanis (2006), Ross (2004, 2012), and Leiand Michaels (2014). According to Google Scholar these articles have a combined citation count of 11,620 (accessed12/16/14). Ross (2013) reviews this voluminous literature.
3As examples, Humphreys (2005, 511-2) discusses four variants of natural resource-based grievances and Smith(2015, 6-7) discusses two.
4Author’s calculation. Section 7 describes the sample and data in more depth.5Fearon (1995) raised this concern about theories of international warfare. Walter (2009) summarizes its
widespread applications in studies of civil war.6Toft (2014, 188-9) reviews widespread arguments about valuable territory and civil war. Laitin (2007, 22) and
Fearon (2008, 8) present broad statements about the oil prize argument. Prize-based arguments derive mainly fromeconomic theories of conflict (e.g., Garfinkel and Skaperdas 2006), which provided the original theoretical insightslinking oil wealth to civil wars according to (Ross 2013, 13).
63
2011, 574-5; Ross 2012, 151-2; Condra 2013). If this redistribution tension is irreconcilable, itmay indeed overwhelm the revenue-enhancing effects of oil production. However, this explanationfor high rates of separatist civil wars in oil-rich territories also raises crucial questions. Whydoes oil production—as opposed to other forms of economic output—cause such strong grievances?Furthermore, what prevents the government from strategically reducing redistribution to alleviatetensions and facilitate peaceful bargaining?
This paper addresses these questions by presenting a novel formal model to explain the separatistconflict resource curse. The model in the second section features an interaction between a govern-ment and a minority group in an infinite horizon game. The game features shifts across periodsin the group’s probability of winning a separatist war as well as limited ability for the governmentto commit to bargaining offers in future periods. In each period, the government sets a tax rateon the group’s taxable economic output and the group decides how much labor effort to allocatebetween producing a taxable and nontaxable good. These choices determine the government’s rev-enues in the period. Next, the government makes a patronage offer. The group either accepts theoffer or fights to create a separate state—which, if successful, prevents the government from taxingthe group’s economic production in future periods. The third section solves the equilibria of themodel.
Two key attributes of oil production explain higher separatist civil war propensity. First, the fourthsection explains why local oil production enables government territorial encroachment, which createsgrievances. Empirically, oil production requires minimal local participation because of the highcapital costs and frequent need for assistance from international corporations to produce oil, whichimplies higher tax rates do not strongly decrease output of the taxable good. This key feature of oilproduction enables governments to levy high tax rates on oil-rich regions—i.e., encroach upon theirterritory—without high labor substitution adversely affecting its revenue intake, which increasesthe interior optimal tax rate. The territorial encroachment effect decreases the government’s abilityto buy off the group, thereby increasing incentives for the minority group to fight to secede.
Local oil production enables territorial encroachment but does not imply the government will nec-essarily choose a high tax rate. The government faces a tradeoff when interacting with an oil-richgroup: the government can prevent fighting by lowering the tax rate and strategically alleviatingthe group’s grievances, or the government can choose a higher tax rate to collect a larger percentageof the group’s taxable economic output—albeit at the cost of triggering a separatist civil war. Thefifth section focuses on a second key attribute of oil production to explain how the governmentsolves this tradeoff. Although ceteris paribus the government does not want separatist wars tohappen—because fighting destroys surplus—the government’s lost consumption from costly fight-ing is lower than the opportunity costs of reducing oil taxes if the minority group’s oil productionis large relative to the government’s other revenue sources. This parameter range is particularlyrelevant for previously impoverished countries that have subsequently become oil-rich because ofthe key property that oil production tends to produce large revenue windfalls. Intriguingly, thisimplication of prize-induced fighting stems from the government’s strategic choices, rather thanthe group fighting because the prize is valuable. In a more general theoretical sense, this resultalso extends commitment problem models to address the relevant question for domestic politics ofwhy governments may sometimes forego actions that would increase their commitment ability andprevent costly fighting.
The sixth section concludes the theoretical analysis by deriving differential implications for sepa-
64
ratist and center-seeking civil wars. It first shows these two core properties of oil production onlytrigger separatist wars when the government and oil-rich ethnic group share weak institutionalizedties, which highlights a crucial conditional effect. This implication also facilitates a comparisonbetween separatist and center-seeking civil wars. Most important, the territorial encroachmentmechanism should exert a stronger positive effect on separatist than center-seeking conflicts. Nu-merically small ethnic groups—which, empirically, are most likely to fight separatist civil wars—tendto experience weaker institutional ties with the center, whereas larger ethnic groups at higher riskfor center-seeking wars tend to experience stronger ties. This implies the conditions under whichlocal oil wealth raises separatist civil war propensity are not empirically relevant for center-seekingwars.
To empirically test this implication, I use spatial data from the Ethnic Power Relations database(Cederman et al. 2010) to match the location of ethnic groups with oil fields, and use variousmeasures of institutional ties between each ethnic group and the center. The seventh sectionprovides strong evidence that the conditional conflict resource curse holds for ethnic separatist civilwars but not for ethnic center-seeking civil wars, followed by the conclusion.
2.2 A Model of Taxation, Bargaining, and Separatist CivilWars
A government (G) and ethnic minority group (M) engage in taxation and economic production,respectively, and bargain over the distribution of state revenues in an infinite time horizon. Futurepayoffs are discounted by a common rate of δ ∈ (0, 1) and time is denoted by t ∈ Z+. There are twocomponents of the per-period stage game. The first is the production and taxation phase, whichunfolds as follows. G proposes a tax rate τt ∈ [0, 1] to M . Next, M allocates its one unit of timebetween labor Lt ≥ 0 used a produce a taxable good, and “safe” economic activities st ≥ 0 toproduce a nontaxable good, with Lt + st ≤ 1. Taxable economic activity in M ’s territory equalsθ(Lt)Y
M and non-taxable output equals u(st). The function θ(·) captures how labor effort affectsproduction of the taxable good. θ(·) strictly increases in Lt, θ(Lt) ∈ [0, 1] for all Lt, and θ(1) = 1.Therefore, when M devotes all its time to labor, taxable good output achieves its maximum of YM ,whereas choosing Lt < 1 yields taxable economic output θ(Lt)Y
M < YM . Denote the percentageof potential output from M ’s territory that derives from oil as ω ∈ [0, 1]. For the nontaxable good,u(·) is also a strictly increasing function of st. Both θ(·) and u(·) are weakly concave and twicedifferentiable.
These moves determine G’s revenues in the period, which derive from two sources. The first is anexogenously determined constant per-period amount RG, which captures G’s revenues from otherareas of the country. Second, M ’s economic production yields an additional τtθ(Lt)Y
M in revenues.Therefore, before the bargaining stage of the interaction in each period begins, G has access to totalrevenues τtθ(Lt)Y
M +RG and M possesses (1− τt)θ(Lt)YM + u(st) in assets.
The bargaining phase follows the taxation phase. Nature moves first, deciding whether M is strong(probability σ) or weak (probability 1 − σ) in the period, terms that will be defined below. Adegenerate move follows in which G gives α ∈ [0, 1] percent of its revenues from M ’s territory backto M . The parameter α captures the quality of institutionalized ties between G and M . For ethnicgroups with a pre-colonial history of fighting against the group that controls the government, or
65
groups that belonged to different colony prior to independence, α should be low. In contrast, ifM is not an ethnic minority group but instead a co-ethnic to G, or if M and G belong to thesame inter-ethnic political party,7 α should be high. This institutions parameter does not affect theanalysis until the sixth section, which discusses the conditional conflict resource curse and differenttypes of civil war.
Next, G makes a patronage offer to M of xt ∈[0, (1 − α)τtθ(Lt)Y
M + RG], meaning the offer
cannot be negative and cannot exceed G’s per-period budget. M either accepts the offer or fights tocreate its own state. If M accepts, M consumes the assets it produced earlier in the period plus thepatronage offer, [1−(1−α)τt]θ(Lt)Y
M +u(st)+xt; G consumes the remaining government revenuesfrom that period, (1− α)τtθ(Lt)Y
M +RG − xt; and the game moves to the next period.
If instead M fights, neither actor consumes in the period of the fight. Regardless of the outcomeof the war, G consumes RG in all future periods and the bargaining phase of the game becomesdegenerate. If M successfully separates, the tax rate drops permanently to 0. Therefore, Machieves utility θ(Lt)Y
M + u(st) in each period and G receives RG. If M loses, it cannot fightin any future period and continues to be subject to G’s taxes. Therefore, in periods after anunsuccessful separatist attempt, M ’s and G’s respective per-period utility amounts are [1 − (1 −α)τt]θ(Lt)Y
M + u(st) and (1− α)τtθ(Lt)YM +RG.8
M ’s probability of winning a separatist fight depends on the Nature move that occurs at thebeginning of the bargaining phase of the stage game. M wins with probability p > 0 when it isstrong and probability 0 when it is weak. Therefore, following existing prominent formal theoriesof civil wars that feature stochastic shifts in the distribution of power (Fearon 2004; Powell 2012),the model assumes there are events M does not control that affect M ’s probability of winning.One plausible microfoundation for this assumption is that political actors are only occasionallyable to solve collective action problems and mount an effective challenge against the government(Acemoglu and Robinson 2006, 123-128), in particular when the government is temporarily weak.As an example, the fall of the Iranian shah in 1979 created perceptions of temporary regime weaknessby oil-rich Arab and Kurd minorities in Iran and facilitated separatist attempts (Ward 2009, 230-3).The Iranian Revolution may have also facilitated mobilization in nearby countries. “There is littledoubt that the Iranian Revolution helped galvanize politics and energize dissent among Shiites inneighboring countries. The revolution helped explain both the timing and some of the forces thatencouraged Saudis to take to the streets” (Jones 2010, 186). As another example, Angola’s long-running major center-seeking civil war resumed after the opposition party UNITA rejected election
7Magaloni (2008) and Svolik (2012) discuss how authoritarian parties can improve commitment ability.8Notably, M is assumed to continue to receive α percent of its taxed production even after losing a separatist war.
This assumption, which simplifies notation but does not qualitatively alter any of the main results, can be defendedin several different ways. First, if α represents the overall quality of state institutions (rather than capturing specificsof the interaction between the government and the particular ethnic group M), a war would not necessarily alter thisparameter. Second, if α is based on long-term historical interactions between G and M , one war will not necessarilyalter α. Third, if α instead captures more short-term factors such as whether M is included or excluded from theruling coalition, G may optimally choose to co-opt M to terminate the war—implying continued payments afterwardsfor M .
Additionally, assuming bargaining ceases after a fight is without loss of generality and simply reduces notation.After a successful separatist war, under the implicit assumption M cannot to fight to capture G’s resources, thereare no incentives to fight and therefore no incentives for G to make a patronage offer (and under the substantiveinterpretation that M now belongs to its own state, it would be strange to conceptualize M bargaining with G overpatronage). After an unsuccessful separatist war, G would never optimally choose a positive patronage offer becauseM cannot fight.
66
results in 1992. The rebel group FLEC-FAC escalated its low-intensity separatist fight over the oil-rich Cabinda province shortly afterwards, “at a time when the government was facing its toughestmilitary challenge yet from UNITA” (Porto 2003, 5). This provided a window for FLEC-FAC toachieve military aims or to gain concessions from the government.
The solution concept is Markov Perfect Equilibrium (MPE), which requires every player to chooseoptimal actions by conditioning only on the current state of the world and on prior actions in thecurrent period. There are two state variables. Ft ∈ {n,m, g} captures whether no fight (n) hasoccurred in the history of the game, whether a fight occurred that M won (m), or whether a fightoccurred that G won (g). Σt ∈ {s, w} captures whether M is strong (s) or weak (w) in the currentperiod. Because the production and taxation choices occur before M ’s strength in the period isrevealed, only Ft affects τt, Lt, and st. By the Markov assumption, we need to specify one choiceof each of these three variables for each of the three elements of Ft. By assumption (because Gcannot tax M following a successful separatist attempt), τ∗m = 0. The other equilibrium amountsare denoted as {τ∗n, L∗n, s∗n, L∗m, s∗m, τ∗g , L∗g, s∗g}. Furthermore, the setup assumes the bargainingphase of the stage game is degenerate in any period with Ft = {m, g}. If Ft = n, G will useone patronage offer function in every period M is strong, x∗s(τt, Lt, st), and another in every weakperiod, x∗w(τt, Lt, st). Similarly if Ft = n, M will use one acceptance/rejection rule in every strongperiod (accept if xt ≥ xs(τt, Lt, st); reject otherwise) and another in every weak period (accept ifxt ≥ xw(τt, Lt, st); reject otherwise).
In sum, the sequence of moves within each period unfold as follows: If no fight has occurred in thepast, (1) G offers a tax rate, (2) M allocates between labor effort to produce a taxable good andsafe effort to produce a nontaxable good, (3) Nature decides whether M is strong or weak in theperiod, (4) G makes a patronage offer to M , and (5) M either accepts the patronage offer or fightsto create its own state. If a fight has occurred in the past that M won, only move 2 occurs in eachperiod. If a fight has occurred in the past that M lost, only moves 1 and 2 occur.
2.3 Equilibrium Analysis
I solve backwards on the stage game to present the equilibria of the game. First, I characterize M ’soptimal patronage acceptance/fighting rule and G’s optimal patronage offer as a function of Σt andof the choices earlier in the period. Second, I solve for M ’s optimal labor allocation as a functionof the tax rate. Lemma 1 uses these two steps to characterize how the tax rate affects prospectsfor fighting in a strong period. Finally, I analyze G’s optimal tax rate by discussing the two maintradeoffs involved with setting higher tax rates (Lemmas 2 and 3). Proposition 1 uses these stepsto state the equilibria.
2.3.1 Bargaining Phase
Analyzing the bargaining phase yields G’s optimal patronage offer and M ’s optimal accept/rejectrule as a function of the vector of choices (τt, Lt, lt) made earlier in the period. The bargainingphase only occurs if no fight has occurred in the past, implying Ft = n. If M is weak in the currentperiod, M will not receive a positive patronage offer regardless of previous actions in the period.Because M cannot coerce G, the government faces no incentives to choose x∗w > 0.
67
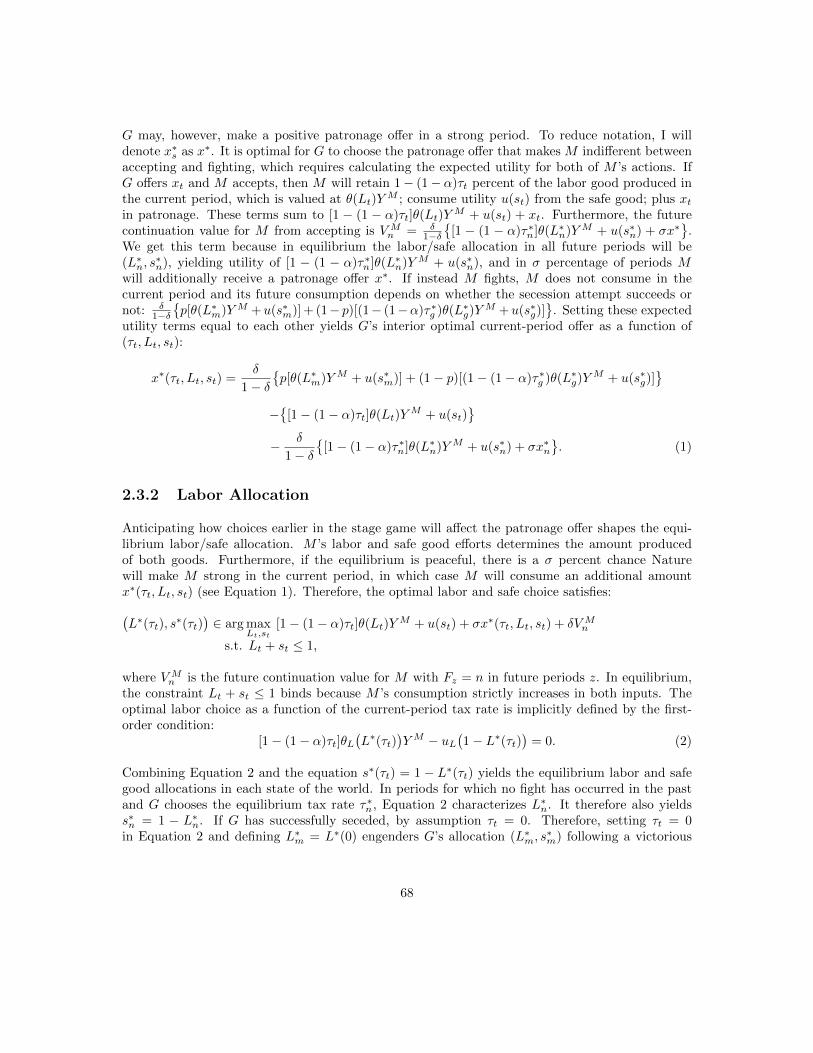
G may, however, make a positive patronage offer in a strong period. To reduce notation, I willdenote x∗s as x∗. It is optimal for G to choose the patronage offer that makes M indifferent betweenaccepting and fighting, which requires calculating the expected utility for both of M ’s actions. IfG offers xt and M accepts, then M will retain 1− (1− α)τt percent of the labor good produced inthe current period, which is valued at θ(Lt)Y
M ; consume utility u(st) from the safe good; plus xtin patronage. These terms sum to [1 − (1 − α)τt]θ(Lt)Y
M + u(st) + xt. Furthermore, the futurecontinuation value for M from accepting is VMn = δ
1−δ{
[1 − (1 − α)τ∗n]θ(L∗n)YM + u(s∗n) + σx∗}
.We get this term because in equilibrium the labor/safe allocation in all future periods will be(L∗n, s
∗n), yielding utility of [1 − (1 − α)τ∗n]θ(L∗n)YM + u(s∗n), and in σ percentage of periods M
will additionally receive a patronage offer x∗. If instead M fights, M does not consume in thecurrent period and its future consumption depends on whether the secession attempt succeeds ornot: δ
1−δ{p[θ(L∗m)YM +u(s∗m)] + (1− p)[(1− (1−α)τ∗g )θ(L∗g)Y
M +u(s∗g)]}
. Setting these expectedutility terms equal to each other yields G’s interior optimal current-period offer as a function of(τt, Lt, st):
x∗(τt, Lt, st) =δ
1− δ{p[θ(L∗m)YM + u(s∗m)] + (1− p)[(1− (1− α)τ∗g )θ(L∗g)Y
M + u(s∗g)]}
−{
[1− (1− α)τt]θ(Lt)YM + u(st)
}spacespaces
sii− δ
1− δ{
[1− (1− α)τ∗n]θ(L∗n)YM + u(s∗n) + σx∗n}. (1)
2.3.2 Labor Allocation
Anticipating how choices earlier in the stage game will affect the patronage offer shapes the equi-librium labor/safe allocation. M ’s labor and safe good efforts determines the amount producedof both goods. Furthermore, if the equilibrium is peaceful, there is a σ percent chance Naturewill make M strong in the current period, in which case M will consume an additional amountx∗(τt, Lt, st) (see Equation 1). Therefore, the optimal labor and safe choice satisfies:(L∗(τt), s
∗(τt))∈ arg max
Lt,sts[1− (1− α)τt]θ(Lt)Y
M + u(st) + σx∗(τt, Lt, st) + δVMn
spacespacespaces s.t. Lt + st ≤ 1,
where VMn is the future continuation value for M with Fz = n in future periods z. In equilibrium,the constraint Lt + st ≤ 1 binds because M ’s consumption strictly increases in both inputs. Theoptimal labor choice as a function of the current-period tax rate is implicitly defined by the first-order condition:
[1− (1− α)τt]θL(L∗(τt)
)YM − uL
(1− L∗(τt)
)= 0. (2)
Combining Equation 2 and the equation s∗(τt) = 1 − L∗(τt) yields the equilibrium labor and safegood allocations in each state of the world. In periods for which no fight has occurred in the pastand G chooses the equilibrium tax rate τ∗n, Equation 2 characterizes L∗n. It therefore also yieldss∗n = 1 − L∗n. If G has successfully seceded, by assumption τt = 0. Therefore, setting τt = 0in Equation 2 and defining L∗m = L∗(0) engenders G’s allocation (L∗m, s
∗m) following a victorious
68
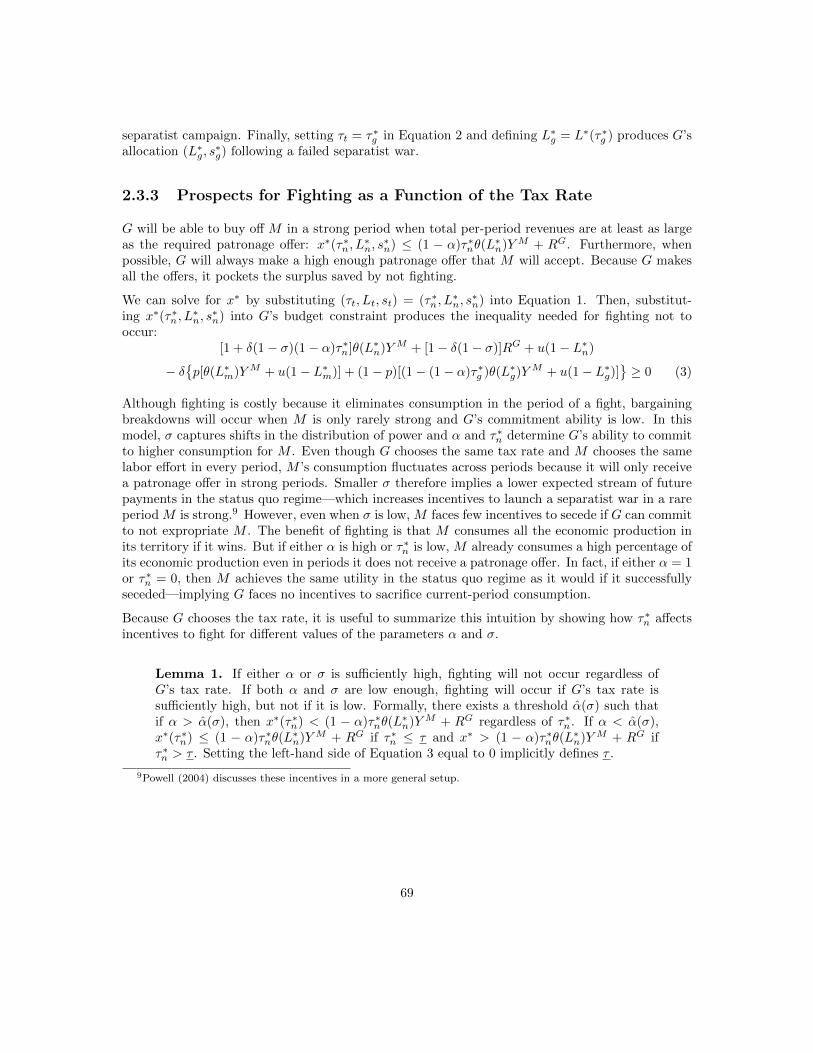
separatist campaign. Finally, setting τt = τ∗g in Equation 2 and defining L∗g = L∗(τ∗g ) produces G’sallocation (L∗g, s
∗g) following a failed separatist war.
2.3.3 Prospects for Fighting as a Function of the Tax Rate
G will be able to buy off M in a strong period when total per-period revenues are at least as largeas the required patronage offer: x∗(τ∗n, L
∗n, s∗n) ≤ (1 − α)τ∗nθ(L
∗n)YM + RG. Furthermore, when
possible, G will always make a high enough patronage offer that M will accept. Because G makesall the offers, it pockets the surplus saved by not fighting.
We can solve for x∗ by substituting (τt, Lt, st) = (τ∗n, L∗n, s∗n) into Equation 1. Then, substitut-
ing x∗(τ∗n, L∗n, s∗n) into G’s budget constraint produces the inequality needed for fighting not to
occur:[1 + δ(1− σ)(1− α)τ∗n]θ(L∗n)YM + [1− δ(1− σ)]RG + u(1− L∗n)
− δ{p[θ(L∗m)YM + u(1− L∗m)] + (1− p)[(1− (1− α)τ∗g )θ(L∗g)Y
M + u(1− L∗g)]}≥ 0 (3)
Although fighting is costly because it eliminates consumption in the period of a fight, bargainingbreakdowns will occur when M is only rarely strong and G’s commitment ability is low. In thismodel, σ captures shifts in the distribution of power and α and τ∗n determine G’s ability to committo higher consumption for M . Even though G chooses the same tax rate and M chooses the samelabor effort in every period, M ’s consumption fluctuates across periods because it will only receivea patronage offer in strong periods. Smaller σ therefore implies a lower expected stream of futurepayments in the status quo regime—which increases incentives to launch a separatist war in a rareperiod M is strong.9 However, even when σ is low, M faces few incentives to secede if G can committo not expropriate M . The benefit of fighting is that M consumes all the economic production inits territory if it wins. But if either α is high or τ∗n is low, M already consumes a high percentage ofits economic production even in periods it does not receive a patronage offer. In fact, if either α = 1or τ∗n = 0, then M achieves the same utility in the status quo regime as it would if it successfullyseceded—implying G faces no incentives to sacrifice current-period consumption.
Because G chooses the tax rate, it is useful to summarize this intuition by showing how τ∗n affectsincentives to fight for different values of the parameters α and σ.
Lemma 1. If either α or σ is sufficiently high, fighting will not occur regardless ofG’s tax rate. If both α and σ are low enough, fighting will occur if G’s tax rate issufficiently high, but not if it is low. Formally, there exists a threshold α(σ) such thatif α > α(σ), then x∗(τ∗n) < (1 − α)τ∗nθ(L
∗n)YM + RG regardless of τ∗n. If α < α(σ),
x∗(τ∗n) ≤ (1 − α)τ∗nθ(L∗n)YM + RG if τ∗n ≤ τ and x∗ > (1 − α)τ∗nθ(L
∗n)YM + RG if
τ∗n > τ . Setting the left-hand side of Equation 3 equal to 0 implicitly defines τ .
9Powell (2004) discusses these incentives in a more general setup.
69
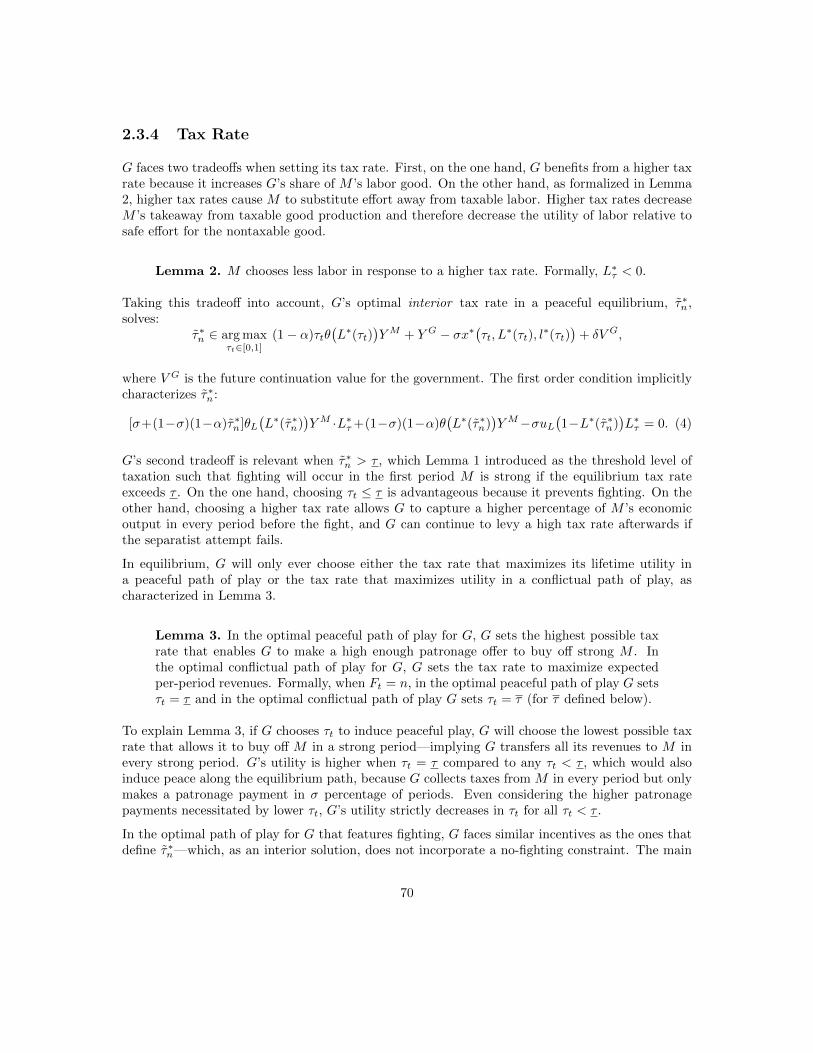
2.3.4 Tax Rate
G faces two tradeoffs when setting its tax rate. First, on the one hand, G benefits from a higher taxrate because it increases G’s share of M ’s labor good. On the other hand, as formalized in Lemma2, higher tax rates cause M to substitute effort away from taxable labor. Higher tax rates decreaseM ’s takeaway from taxable good production and therefore decrease the utility of labor relative tosafe effort for the nontaxable good.
Lemma 2. M chooses less labor in response to a higher tax rate. Formally, L∗τ < 0.
Taking this tradeoff into account, G’s optimal interior tax rate in a peaceful equilibrium, τ∗n,solves:
τ∗n ∈ arg maxτt∈[0,1]
s(1− α)τtθ(L∗(τt)
)YM + Y G − σx∗
(τt, L
∗(τt), l∗(τt)
)+ δV G,
where V G is the future continuation value for the government. The first order condition implicitlycharacterizes τ∗n:
[σ+(1−σ)(1−α)τ∗n]θL(L∗(τ∗n)
)YM ·L∗τ+(1−σ)(1−α)θ
(L∗(τ∗n)
)YM−σuL
(1−L∗(τ∗n)
)L∗τ = 0. (4)
G’s second tradeoff is relevant when τ∗n > τ , which Lemma 1 introduced as the threshold level oftaxation such that fighting will occur in the first period M is strong if the equilibrium tax rateexceeds τ . On the one hand, choosing τt ≤ τ is advantageous because it prevents fighting. On theother hand, choosing a higher tax rate allows G to capture a higher percentage of M ’s economicoutput in every period before the fight, and G can continue to levy a high tax rate afterwards ifthe separatist attempt fails.
In equilibrium, G will only ever choose either the tax rate that maximizes its lifetime utility ina peaceful path of play or the tax rate that maximizes utility in a conflictual path of play, ascharacterized in Lemma 3.
Lemma 3. In the optimal peaceful path of play for G, G sets the highest possible taxrate that enables G to make a high enough patronage offer to buy off strong M . Inthe optimal conflictual path of play for G, G sets the tax rate to maximize expectedper-period revenues. Formally, when Ft = n, in the optimal peaceful path of play G setsτt = τ and in the optimal conflictual path of play G sets τt = τ (for τ defined below).
To explain Lemma 3, if G chooses τt to induce peaceful play, G will choose the lowest possible taxrate that allows it to buy off M in a strong period—implying G transfers all its revenues to M inevery strong period. G’s utility is higher when τt = τ compared to any τt < τ , which would alsoinduce peace along the equilibrium path, because G collects taxes from M in every period but onlymakes a patronage payment in σ percentage of periods. Even considering the higher patronagepayments necessitated by lower τt, G’s utility strictly decreases in τt for all τt < τ .
In the optimal path of play for G that features fighting, G faces similar incentives as the ones thatdefine τ∗n—which, as an interior solution, does not incorporate a no-fighting constraint. The main
70
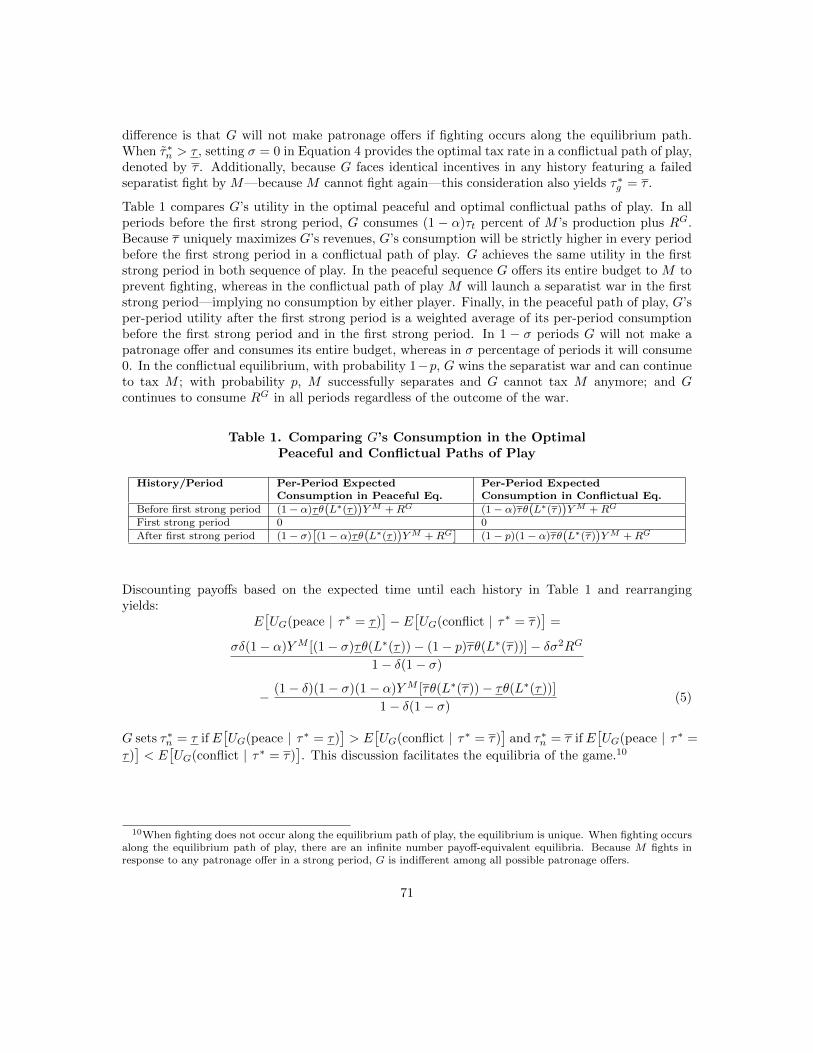
difference is that G will not make patronage offers if fighting occurs along the equilibrium path.When τ∗n > τ , setting σ = 0 in Equation 4 provides the optimal tax rate in a conflictual path of play,denoted by τ . Additionally, because G faces identical incentives in any history featuring a failedseparatist fight by M—because M cannot fight again—this consideration also yields τ∗g = τ .
Table 1 compares G’s utility in the optimal peaceful and optimal conflictual paths of play. In allperiods before the first strong period, G consumes (1 − α)τt percent of M ’s production plus RG.Because τ uniquely maximizes G’s revenues, G’s consumption will be strictly higher in every periodbefore the first strong period in a conflictual path of play. G achieves the same utility in the firststrong period in both sequence of play. In the peaceful sequence G offers its entire budget to M toprevent fighting, whereas in the conflictual path of play M will launch a separatist war in the firststrong period—implying no consumption by either player. Finally, in the peaceful path of play, G’sper-period utility after the first strong period is a weighted average of its per-period consumptionbefore the first strong period and in the first strong period. In 1 − σ periods G will not make apatronage offer and consumes its entire budget, whereas in σ percentage of periods it will consume0. In the conflictual equilibrium, with probability 1−p, G wins the separatist war and can continueto tax M ; with probability p, M successfully separates and G cannot tax M anymore; and Gcontinues to consume RG in all periods regardless of the outcome of the war.
Table 1. Comparing G’s Consumption in the OptimalPeaceful and Conflictual Paths of Play
History/Period Per-Period ExpectedConsumption in Peaceful Eq.
Per-Period ExpectedConsumption in Conflictual Eq.
Before first strong period (1− α)τθ(L∗(τ)
)YM +RG (1− α)τθ
(L∗(τ)
)YM +RG
First strong period 0 0
After first strong period (1− σ)[(1− α)τθ
(L∗(τ)
)YM +RG
](1− p)(1− α)τθ
(L∗(τ)
)YM +RG
Discounting payoffs based on the expected time until each history in Table 1 and rearrangingyields:
E[UG(peace |sτ∗ = τ)
]− E
[UG(conflict |sτ∗ = τ)
]=
σδ(1− α)YM [(1− σ)τθ(L∗(τ))− (1− p)τθ(L∗(τ))]− δσ2RG
1− δ(1− σ)
− (1− δ)(1− σ)(1− α)YM [τθ(L∗(τ))− τθ(L∗(τ))]
1− δ(1− σ)(5)
G sets τ∗n = τ if E[UG(peace |sτ∗ = τ)
]> E
[UG(conflict |sτ∗ = τ)
]and τ∗n = τ if E
[UG(peace |sτ∗ =
τ)]< E
[UG(conflict |sτ∗ = τ)
]. This discussion facilitates the equilibria of the game.10
10When fighting does not occur along the equilibrium path of play, the equilibrium is unique. When fighting occursalong the equilibrium path of play, there are an infinite number payoff-equivalent equilibria. Because M fights inresponse to any patronage offer in a strong period, G is indifferent among all possible patronage offers.
71
Proposition 1. If the history does not include a fight in a previous period. G choosesτt = τ if E
[UG(peace |sτ∗ = τ)
]> E
[UG(conflict |sτ∗ = τ)
]and τt = τ if E
[UG(peace |sτ∗ =
τ)]< E
[UG(conflict |sτ∗ = τ)
]. M chooses (Lt, st) such that Lt solves Equation 2 and
st = 1−Lt. If M is weak in the period, M accepts any offer and G sets xt = 0. If M isstrong in the period, M accepts xt ≥ x∗(τt, Lt, st), for x∗(τt, Lt, st) defined in Equation1. G sets xt = x∗(τt, Lt, st) if τt ≤ τ and xt ∈
[0, (1− α)τtθ(Lt)Y
M +RG]
if τt > τ .
If the history includes a successful secession fight in a previous period. M chooses (Lt, st)such that Lt solves Equation 2 with τt = 0, and st = 1− Lt.
If the history includes a failed secession fight in a previous period. G chooses τt = τ . Mchooses (Lt, st) such that Lt solves Equation 2 and st = 1− Lt.
2.4 Local Oil Wealth, Territorial Encroachment, andIncentives to Secede
This section explains why local oil production enables government territorial encroachment, whichcreates grievances. Empirically, oil production requires minimal local participation because of thehigh capital costs and frequent need for assistance from international corporations to produce oil,which implies higher tax rates do not strongly decrease output of the taxable good. This key featureof oil production enables governments to levy high tax rates on oil-rich regions—i.e., encroachupon their territory—without high labor substitution adversely affecting its revenue intake, whichincreases the interior optimal tax rate. The territorial encroachment effect increases incentivesfor the minority group to fight to secede by decreasing the government’s ability to buy off thegroup.
Assumption 1 captures this key property of oil production.
Assumption 1. The elasticity of taxable good production with respect to labor de-creases in the percentage of M ’s economic activity that derives from oil production, ω.
Formally, d2θdLdω < 0.
Figure 1 illustrates Assumption 1 using the functional form θ(L) = (1 − b)L + b. For both b andb > b, more labor increases total taxable output [(1−b)L+b]YM . However, the slope of the functionis higher when b = b. Assumption 1 implies higher ω increases the parameter b in this function.When b = b, corresponding with oil as the territory’s primary economic activity, θ(L) will be closeto 1 regardless of labor supplied—implying M ’s labor choice only minimally impacts output of thetaxable good.
72
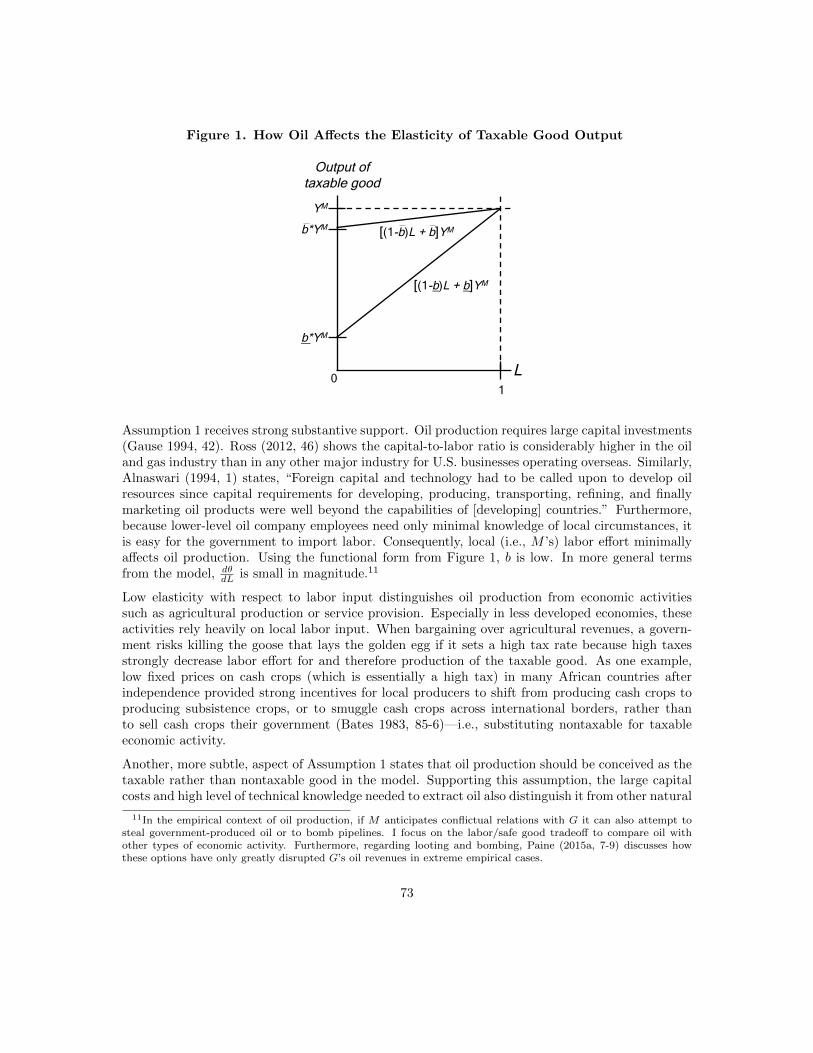
Figure 1. How Oil Affects the Elasticity of Taxable Good Output
L
YM
1 0
b*YM
b*YM
[(1-b)L + b]YM
[(1-b)L + b]YM
Output of taxable good
Assumption 1 receives strong substantive support. Oil production requires large capital investments(Gause 1994, 42). Ross (2012, 46) shows the capital-to-labor ratio is considerably higher in the oiland gas industry than in any other major industry for U.S. businesses operating overseas. Similarly,Alnaswari (1994, 1) states, “Foreign capital and technology had to be called upon to develop oilresources since capital requirements for developing, producing, transporting, refining, and finallymarketing oil products were well beyond the capabilities of [developing] countries.” Furthermore,because lower-level oil company employees need only minimal knowledge of local circumstances, itis easy for the government to import labor. Consequently, local (i.e., M ’s) labor effort minimallyaffects oil production. Using the functional form from Figure 1, b is low. In more general termsfrom the model, dθ
dL is small in magnitude.11
Low elasticity with respect to labor input distinguishes oil production from economic activitiessuch as agricultural production or service provision. Especially in less developed economies, theseactivities rely heavily on local labor input. When bargaining over agricultural revenues, a govern-ment risks killing the goose that lays the golden egg if it sets a high tax rate because high taxesstrongly decrease labor effort for and therefore production of the taxable good. As one example,low fixed prices on cash crops (which is essentially a high tax) in many African countries afterindependence provided strong incentives for local producers to shift from producing cash crops toproducing subsistence crops, or to smuggle cash crops across international borders, rather thanto sell cash crops their government (Bates 1983, 85-6)—i.e., substituting nontaxable for taxableeconomic activity.
Another, more subtle, aspect of Assumption 1 states that oil production should be conceived as thetaxable rather than nontaxable good in the model. Supporting this assumption, the large capitalcosts and high level of technical knowledge needed to extract oil also distinguish it from other natural
11In the empirical context of oil production, if M anticipates conflictual relations with G it can also attempt tosteal government-produced oil or to bomb pipelines. I focus on the labor/safe good tradeoff to compare oil withother types of economic activity. Furthermore, regarding looting and bombing, Paine (2015a, 7-9) discusses howthese options have only greatly disrupted G’s oil revenues in extreme empirical cases.
73
resources such as alluvial diamonds and drugs. Implicit in the distinction between the taxable goodand the nontaxable good in the model, G can perfectly enforce tax rates on the taxable goodwhereas G cannot enforce any taxes on the nontaxable good. Because governments can relativelyeasily monitor production and enforce military control over oil fields, taxing oil production requiresminimal bureaucratic capacity (Dunning 2008, 40). In contrast, it is much easier to hide manyother types of natural resources. This implies oil is a “less lootable resource” (Humphreys 2005,523) and oil revenues are “easily controlled by the central government” (Colgan 2013, 4).
Recall from Lemma 2 that the constraint limiting the interior optimal tax rate is that higher taxescause M to substitute effort away from taxable good production. Lemma 4 shows that becausehigher ω weakens this constraint, the interior optimal tax rate increases. Therefore, oil productionin M ’s territory enables G to encroach upon M ’s economic production.
Lemma 4. The interior optimal tax rate increases in the percentage of M ’s economicactivity that derives from oil production, i.e., oil wealth enables government territorial
encroachment. Formally,dτ∗ndω > 0.
Assuming the government chooses the interior optimal tax rate—an assumption the next sectionrelaxes—M ’s oil wealth exerts a positive overall effect on separatist civil war propensity becauseof the territorial encroachment effect. Equation 6 shows how the percentage of M ’s wealth thatderives from oil production affects G’s ability to make a high enough patronage offer in a period Mis strong (see Equation 3) and highlights the three main effects of oil.
d
dω
{E[UM(consumption from the taxable goods|sτ∗n(ω), ω
)]}−
d
dω
{δp · E
[UM (fight | win, ω)
]+ δ(1− p) · E
[UM (fight | lose, ω)
]}. (2.1)
First, a larger prize increases incentives to fight by raising the value of winning, as shown in thebottom line of Equation 6. The oil prize does not cause fighting in this model, however, becauseoil also increases G’s revenues by raising YM . Therefore, for a constant tax rate, more oil alsoimproves G’s ability to make attractive patronage offers to M . The direct effect of oil in the topline of Equation 6 captures this effect by increasing the amount M consumes from the taxable goodin the status quo regime. Oil exerts an ambiguous overall effect on the probability of fighting whenonly considering these two effects.12
The third effect of oil in the model is decisive: territorial encroachment. A higher tax rate impliesG takes a higher percentage of M ’s output in every period, whereas M will only receive a patron-age offer in periods it is strong. Combining all three mechanisms, if the territorial encroachmentmechanism is strong enough, local oil wealth increases the expected utility of secession more thanthe expected utility of the status quo regime because the territorial encroachment effect partiallyoffsets the revenue-enhancing effects. Proposition 2 summarizes this implication.
12Paine (2015a, 29-30) presents a special case of his model with exogenous oil production in which the revenue-enhancing and prize effects perfectly offset each other. Generically, this will not happen in the current model becauseendogenous taxation and labor decisions cause the amount produced to differ depending on whether the subgamecontains a separatist war in its history.
74
Proposition 2. Assuming G chooses the interior optimal tax rate, G’s ability tobuy off M decreases in the percentage of M ’s economic activity that derives from oilproduction. Formally, subtracting the equilibrium patronage offer in a strong periodfrom G’s equilibrium level of revenues, and deriving with respect to ω, yields a negativeterm:ddω
[(1− α) · τ∗n(ω) · θ
(L∗(τ∗n(ω), ω)
)YM +RG − x
(τ∗n(ω), ω
)]< 0.
2.5 Why the Government Chooses Not to Alleviate Grievances
Local oil production enables territorial encroachment but does not imply the government will nec-essarily choose a high tax rate. The government faces a tradeoff when interacting with an oil-richgroup: the government can prevent fighting by lowering the tax rate and strategically alleviatingthe group’s grievances, or the government can choose a higher tax rate to collect a larger percent-age of the group’s taxable economic output—albeit at the cost of triggering a separatist civil war.This section focuses on a second key attribute of oil production to explain how the governmentsolves this tradeoff. Although ceteris paribus the government does not want separatist wars tohappen—because fighting destroys surplus—the government’s lost consumption from costly fight-ing is lower than the opportunity costs of reducing oil taxes if the minority group’s oil productionis large relative to the government’s other revenue sources. This parameter range is particularlyrelevant for previously impoverished countries that have subsequently become oil-rich because ofthe key property that oil production tends to produce large revenue windfalls. Intriguingly, thisimplication of prize-induced fighting stems from the government’s strategic choices, rather thanthe group fighting because the prize is valuable. In a more general theoretical sense, this resultalso extends commitment problem models to address the relevant question for domestic politics ofwhy governments may sometimes forego actions that would increase their commitment ability andprevent costly fighting.
YM is often large relative to RG when major oil fields are discovered in previously impoverishedcountries. Ross (2012, 27-33) lists the “exceptionally large size” of oil revenues as a central char-acteristic of oil production and provides supporting cross-national evidence. Oil revenues are alsolarge even compared to rents from other natural resources. In Haber and Menaldo’s (2011) dataseton oil, natural gas, coal, and metals income for a global sample of countries, oil and natural gascomposed 90% of all global resource income from 1960 to 2006. Furthermore, in 76% of country-years with more than $500 in resource income per capita in this global sample, at least half theincome came from oil and gas. According to Colgan (2013, 12), “The global trade of oil generatesrevenues that are somewhere between ten and a hundred times larger than the next largest naturalresource.”13
The reason larger economic production in M ’s territory increases G’s desire to choose τ∗ = τ
over τ∗ = τ is that a larger YM
RGratio raises the opportunity cost of lowering the tax rate on M ’s
economic production while decreases the relative costs of fighting. When YM is large, G losesmore consumption for every percentage it lowers the tax rate. Additionally, the costs of fightingare relatively low when YM is large relative to RG because RG—which gets destroyed along withall other economic activity in the period of the fight—has less of an effect on enabling G to buy
13Chapter 1 provides additional evidence for this argument.
75
off M . Therefore, the higher is YM relative to RG, the lower is τ , creating a greater disparity inG’s percentage takeaway from M ’s production when τt = τ as opposed to τt = τ . When YM ishigh, G will not take actions that decrease its takeaway from M ’s economic production—even ifthe consequence is grievances that cause fighting.
Proposition 3. When τ∗n > τ , higher ω increases the likelihood G chooses τt = τ overτt = τ in every period t. Formally,ddω
{E[UG(peace |sτ∗ = τ)
]− E
[UG(conflict |sτ∗ = τ)
]}< 0.
Propositions 2 and 3 provide similar implications as existing theories but rest on very differentmicrofoundations. Much existing work argues large oil rents cause separatist civil wars in partby increasing the prize of secession for the groups located in oil-rich territory (Collier and Hoef-fler 2005; Le Billon 2005; Sorens 2011, 574-5; Ross 2012, 149-50; Condra 2013, 6-10; Morelli andRohner 2014, 3). Many of these theories assert local oil wealth triggers separatist civil wars becauseincumbents face insurmountable incentives to redistribute a region’s oil wealth to its core politicalconstituency, which creates grievances among residents of the oil-rich region (Sorens 2011, 574-5;Ross 2012, 149-50; Condra 2013, 6-10).14 In particular, these authors assume the government can-not simultaneously satisfy greedy oil-poor political insiders and equity-motivated oil-rich politicaloutsiders.
The central concern with these arguments, however, is that they do not specify how a large prizecreates these redistribution incentives. If a group has a weak bargaining position, why would agovernment only redistribute away from that region if it produced a valuable commodity? Whywould it not also redistribute less lucrative revenue sources? These concerns persist even if athird actor (a political insider) is explicitly modeled. Why would a larger prize encourage politicalinsiders to pressure the government to demand a larger percentage of the prize, hence leaving oil-rich outsiders relatively worse off relative to the size of their economic production? Why does thecostliness of fighting not cause oil-poor insiders to lessen their demands?
The current model provides a simpler setup—that is, does not require modeling a third actor—that addresses these questions and shows how oil wealth can cause bargaining breakdown. Thegovernment is able to take a large percentage of an oil-rich minority group’s economic productionbecause of low output elasticity with respect to M ’s labor input, not because M ’s oil prize islarge. Furthermore, G chooses to encroach upon M ’s territory—rather than reduce the tax rate tostrategically alleviate grievances—because of the opportunity costs of taking a lower cut of a largerprize.
Also important, existing conflict resource curse arguments assume oil wealth causes irreconcilablegrievances without engaging why G is unwilling to take actions that would prevent costly fighting.In fact, G’s unwillingness to lower taxes may appear puzzling from the perspective of existing“commitment problem” theories (Fearon 1995; Powell 2004). The current model resembles manybargaining models of conflict by assuming M ’s ability to coerce G varies over time and G cannotcommit to make patronage offers independent of M ’s probability of winning a fight in the currentperiod. When war occurs along the equilibrium path in these models, G commitment inability
14Highlighting similarities in setup between these three theories and the present model, they all espouse languagerelated to bargaining theory, despite not being formalized. Sorens (2011, 575) explicitly uses a commitment problemframework.
76
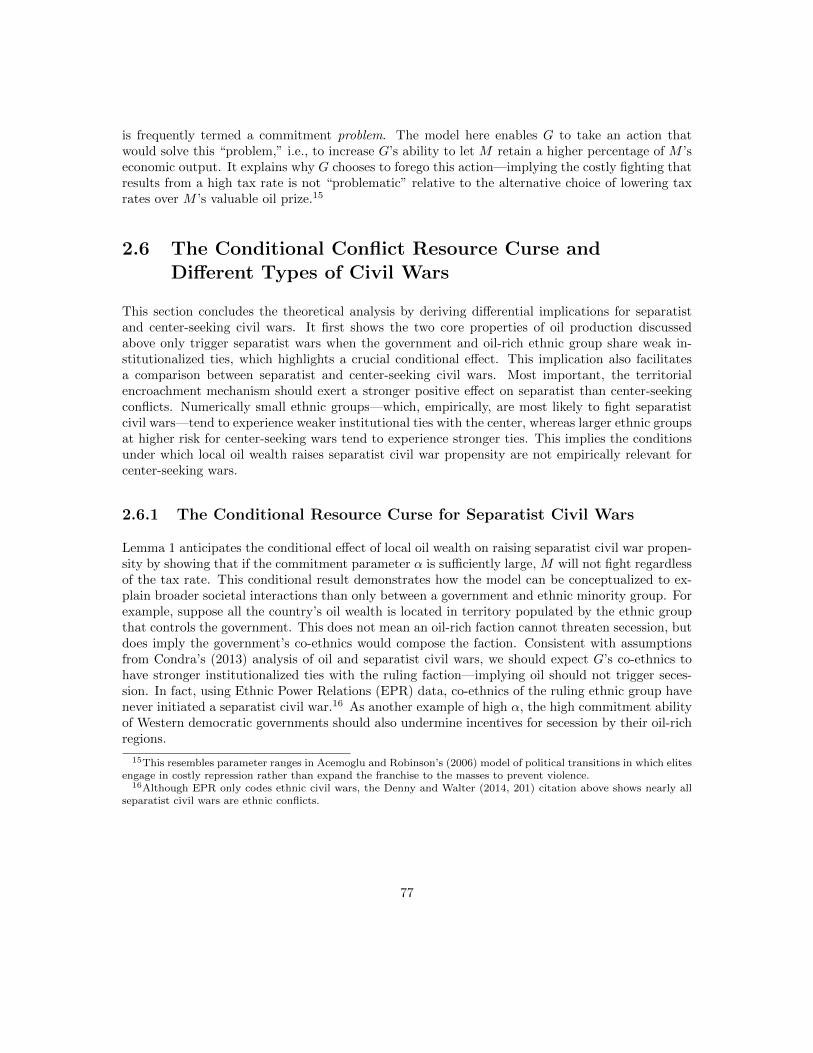
is frequently termed a commitment problem. The model here enables G to take an action thatwould solve this “problem,” i.e., to increase G’s ability to let M retain a higher percentage of M ’seconomic output. It explains why G chooses to forego this action—implying the costly fighting thatresults from a high tax rate is not “problematic” relative to the alternative choice of lowering taxrates over M ’s valuable oil prize.15
2.6 The Conditional Conflict Resource Curse andDifferent Types of Civil Wars
This section concludes the theoretical analysis by deriving differential implications for separatistand center-seeking civil wars. It first shows the two core properties of oil production discussedabove only trigger separatist wars when the government and oil-rich ethnic group share weak in-stitutionalized ties, which highlights a crucial conditional effect. This implication also facilitatesa comparison between separatist and center-seeking civil wars. Most important, the territorialencroachment mechanism should exert a stronger positive effect on separatist than center-seekingconflicts. Numerically small ethnic groups—which, empirically, are most likely to fight separatistcivil wars—tend to experience weaker institutional ties with the center, whereas larger ethnic groupsat higher risk for center-seeking wars tend to experience stronger ties. This implies the conditionsunder which local oil wealth raises separatist civil war propensity are not empirically relevant forcenter-seeking wars.
2.6.1 The Conditional Resource Curse for Separatist Civil Wars
Lemma 1 anticipates the conditional effect of local oil wealth on raising separatist civil war propen-sity by showing that if the commitment parameter α is sufficiently large, M will not fight regardlessof the tax rate. This conditional result demonstrates how the model can be conceptualized to ex-plain broader societal interactions than only between a government and ethnic minority group. Forexample, suppose all the country’s oil wealth is located in territory populated by the ethnic groupthat controls the government. This does not mean an oil-rich faction cannot threaten secession, butdoes imply the government’s co-ethnics would compose the faction. Consistent with assumptionsfrom Condra’s (2013) analysis of oil and separatist civil wars, we should expect G’s co-ethnics tohave stronger institutionalized ties with the ruling faction—implying oil should not trigger seces-sion. In fact, using Ethnic Power Relations (EPR) data, co-ethnics of the ruling ethnic group havenever initiated a separatist civil war.16 As another example of high α, the high commitment abilityof Western democratic governments should also undermine incentives for secession by their oil-richregions.
15This resembles parameter ranges in Acemoglu and Robinson’s (2006) model of political transitions in which elitesengage in costly repression rather than expand the franchise to the masses to prevent violence.
16Although EPR only codes ethnic civil wars, the Denny and Walter (2014, 201) citation above shows nearly allseparatist civil wars are ethnic conflicts.
77
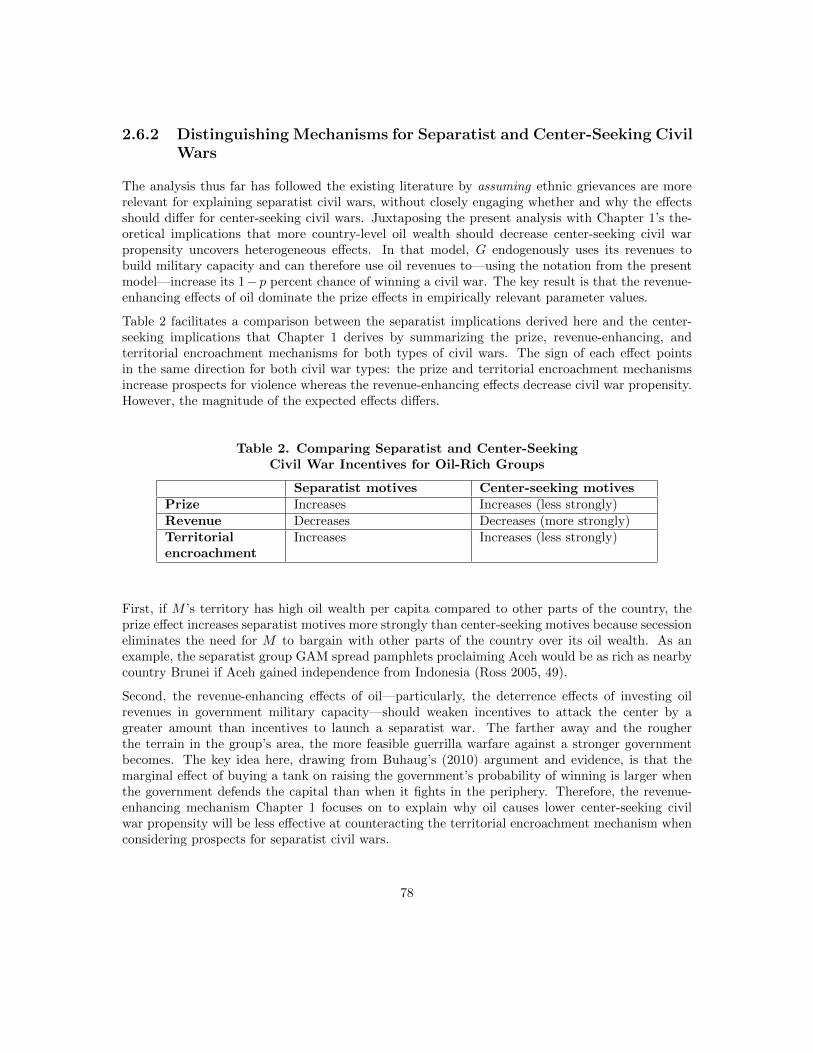
2.6.2 Distinguishing Mechanisms for Separatist and Center-Seeking CivilWars
The analysis thus far has followed the existing literature by assuming ethnic grievances are morerelevant for explaining separatist civil wars, without closely engaging whether and why the effectsshould differ for center-seeking civil wars. Juxtaposing the present analysis with Chapter 1’s the-oretical implications that more country-level oil wealth should decrease center-seeking civil warpropensity uncovers heterogeneous effects. In that model, G endogenously uses its revenues tobuild military capacity and can therefore use oil revenues to—using the notation from the presentmodel—increase its 1− p percent chance of winning a civil war. The key result is that the revenue-enhancing effects of oil dominate the prize effects in empirically relevant parameter values.
Table 2 facilitates a comparison between the separatist implications derived here and the center-seeking implications that Chapter 1 derives by summarizing the prize, revenue-enhancing, andterritorial encroachment mechanisms for both types of civil wars. The sign of each effect pointsin the same direction for both civil war types: the prize and territorial encroachment mechanismsincrease prospects for violence whereas the revenue-enhancing effects decrease civil war propensity.However, the magnitude of the expected effects differs.
Table 2. Comparing Separatist and Center-SeekingCivil War Incentives for Oil-Rich Groups
Separatist motives Center-seeking motivesPrize Increases Increases (less strongly)Revenue Decreases Decreases (more strongly)Territorialencroachment
Increases Increases (less strongly)
First, if M ’s territory has high oil wealth per capita compared to other parts of the country, theprize effect increases separatist motives more strongly than center-seeking motives because secessioneliminates the need for M to bargain with other parts of the country over its oil wealth. As anexample, the separatist group GAM spread pamphlets proclaiming Aceh would be as rich as nearbycountry Brunei if Aceh gained independence from Indonesia (Ross 2005, 49).
Second, the revenue-enhancing effects of oil—particularly, the deterrence effects of investing oilrevenues in government military capacity—should weaken incentives to attack the center by agreater amount than incentives to launch a separatist war. The farther away and the rougherthe terrain in the group’s area, the more feasible guerrilla warfare against a stronger governmentbecomes. The key idea here, drawing from Buhaug’s (2010) argument and evidence, is that themarginal effect of buying a tank on raising the government’s probability of winning is larger whenthe government defends the capital than when it fights in the periphery. Therefore, the revenue-enhancing mechanism Chapter 1 focuses on to explain why oil causes lower center-seeking civilwar propensity will be less effective at counteracting the territorial encroachment mechanism whenconsidering prospects for separatist civil wars.
78
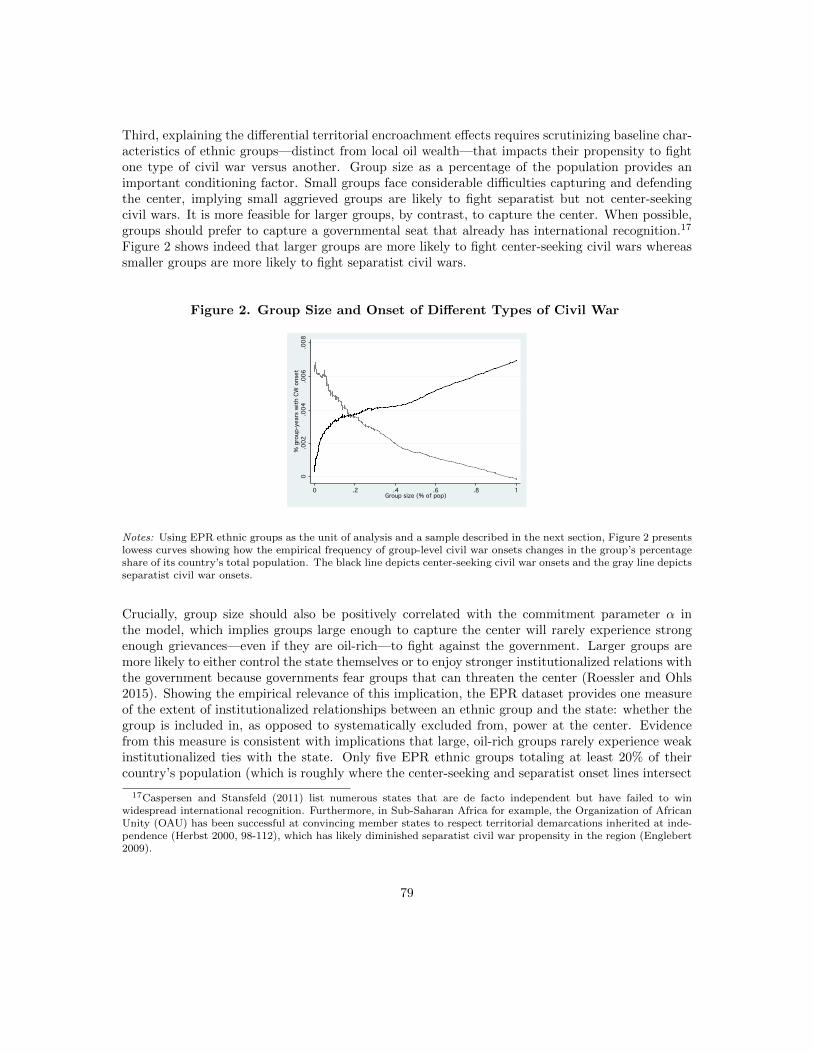
Third, explaining the differential territorial encroachment effects requires scrutinizing baseline char-acteristics of ethnic groups—distinct from local oil wealth—that impacts their propensity to fightone type of civil war versus another. Group size as a percentage of the population provides animportant conditioning factor. Small groups face considerable difficulties capturing and defendingthe center, implying small aggrieved groups are likely to fight separatist but not center-seekingcivil wars. It is more feasible for larger groups, by contrast, to capture the center. When possible,groups should prefer to capture a governmental seat that already has international recognition.17
Figure 2 shows indeed that larger groups are more likely to fight center-seeking civil wars whereassmaller groups are more likely to fight separatist civil wars.
Figure 2. Group Size and Onset of Different Types of Civil War
0
0
0.002
.002
.002.004
.004
.004.006
.006
.006.008
.008
.008% group-years with CW onset
% g
roup
-yea
rs w
ith C
W o
nset
% group-years with CW onset0
0
0.2
.2
.2.4
.4
.4.6
.6
.6.8
.8
.81
1
1Group size (% of pop)
Group size (% of pop)
Group size (% of pop)
Notes: Using EPR ethnic groups as the unit of analysis and a sample described in the next section, Figure 2 presentslowess curves showing how the empirical frequency of group-level civil war onsets changes in the group’s percentageshare of its country’s total population. The black line depicts center-seeking civil war onsets and the gray line depictsseparatist civil war onsets.
Crucially, group size should also be positively correlated with the commitment parameter α inthe model, which implies groups large enough to capture the center will rarely experience strongenough grievances—even if they are oil-rich—to fight against the government. Larger groups aremore likely to either control the state themselves or to enjoy stronger institutionalized relations withthe government because governments fear groups that can threaten the center (Roessler and Ohls2015). Showing the empirical relevance of this implication, the EPR dataset provides one measureof the extent of institutionalized relationships between an ethnic group and the state: whether thegroup is included in, as opposed to systematically excluded from, power at the center. Evidencefrom this measure is consistent with implications that large, oil-rich groups rarely experience weakinstitutionalized ties with the state. Only five EPR ethnic groups totaling at least 20% of theircountry’s population (which is roughly where the center-seeking and separatist onset lines intersect
17Caspersen and Stansfeld (2011) list numerous states that are de facto independent but have failed to winwidespread international recognition. Furthermore, in Sub-Saharan Africa for example, the Organization of AfricanUnity (OAU) has been successful at convincing member states to respect territorial demarcations inherited at inde-pendence (Herbst 2000, 98-112), which has likely diminished separatist civil war propensity in the region (Englebert2009).
79
in Figure 2) that contain a major oil field in their homeland have ever been excluded from power,in a sample of African and Asian countries from 1945 to 2009.18
2.6.3 Generating Hypotheses
Three hypotheses arise directly from the preceding considerations about the prize, revenue-enhancing,and territorial encroachment mechanisms.
H1. Unconditional hypothesis for separatist. There should be a strong positive rela-tionship between local oil wealth and group-level separatist civil war onset.
H2. Unconditional hypothesis for center-seeking. There should not be a strong positiverelationship between local oil wealth and group-level center-seeking civil war onset.
H3. Conditional hypothesis for separatist. There should be a strong positive relationshipbetween local oil wealth and group-level separatist civil war onset for groups with weaklyinstitutionalized ties to the government, but no systematic relationship for groups withstrongly institutionalized ties to the government.
The only ambiguities arise when considering an unconditional hypothesis for center-seeking wars.Although the unconditional effect of local oil wealth on center-seeking civil war onset should notproduce clear trends in the data (H2) because large groups with weak institutionalized ties to thecenter are empirically rare, it is unclear what to expect for large groups that do have weak insti-tutional ties with the government. Although the conflict-inducing territorial encroachment effectshould be relevant for these groups, as Table 2 summarizes, the prize effect should not strongly in-crease center-seeking incentives and the revenue-enhancing effects should strongly deter attacks onthe center. Furthermore, from a statistical power perspective, the empirical rarity of large groupswith weak inter-ethnic ties should also diminish the ability to statistically distinguish their effecteven if there is a clear trend in one direction or the other. Therefore, other than implying any con-ditional effect for center-seeking civil wars is not empirically important for explaining unconditionaleffects, the analysis does not yield clear implications for a conditional hypothesis for center-seekingcivil wars.
2.7 Statistical Results
This section demonstrates statistical support for these three hypotheses. The unit of analysis isethnic group-years, with ethnic groups coded by EPR. This dataset codes politically relevant ethnicgroups in all country-years since either 1945 or their country’s independence. The main advantageof this dataset over others that provide ethnic group-level data, such as Minorities at Risk, is thatEPR provides data points for all politically relevant ethnic groups, not just discriminated minorities.The availability of ethnic group-specific location data, discussed below, provides another advantageof EPR over other ethnicity datasets.
18The next section provides additional details about the sample.
80
The sample consists of all ethnic groups in Africa and Asia (including the Middle East) in everyyear their country was independent from 1945 to 2009. Although this truncated sample limitsthe generality of the results, this is not particularly problematic because the main goal is evaluateconditional effects. All Western European countries and offshoots clearly fall outside the scopeconditions of conflict resource curse arguments because these consolidated democracies have stronginstitutions, and therefore α is high for all ethnic groups in these countries. Excluding LatinAmerica follows Ross’ (2010) argument that the absence of oil-related separatist conflicts in thisregion does not reflect special properties of Latin American oil, but instead results from longer-term historical factors that have made the region essentially secession-proof despite the existence ofethnic tensions. Eastern European countries are excluded for a different reason. In Africa and Asia,it is straightforward to distinguish post-colonial separatist civil wars from anti-colonial separatistrebellions, and only the former are included in the analysis below. However, the differences are lessclear in Eastern Europe following the fall of the Soviet Union. Regions such as Chechnya in Russiacould be conceptualized either as post-colonial or anti-colonial. These caveats about other regionshighlight clear advantages to focusing on the relatively large sample of ethnic groups in African andAsian countries that provides wide variance in inter-ethnic relationships and should better isolatethe effects of local oil wealth.
There are two dependent variables: group-level separatist civil war onset and group-level center-seeking civil war onset. These are coded using the ACD2EPR dataset, which links conflicts in theArmed Conflict Database to EPR groups (Wucherpfennig et al. 2012). Importantly, ACD2EPRonly includes ethnic civil wars, meaning the rebel group recruited from a clear ethnic base andproclaimed ethnically related goals. This poses few limitations for studying separatist civil wars,almost all of which are ethnic civil wars. The tradeoffs are sharper for studying center-seekingconflicts. On the one hand, because the formal model focuses on how ethnic cleavages mitigatethe effect of oil on civil wars, examining ethnic center-seeking civil wars is theoretically relevant.On the other hand, the results do not provide insight into the effect of local oil wealth on center-seeking civil wars more generally—which, in addition to the ambiguous theoretical implicationsdiscussed above, may provide another contributing factor to finding null results for center-seekingcivil wars.19
A binary variable denotes whether each ethnic group’s territory contains at least one giant oilfield.Resembling a procedure used by Hunziker and Cederman (2012), I used GIS methods to matchGeoEPR group location polygons (Wucherpfennig et al. 2011) with the location of giant oilfieldsfrom Horn’s (2003) data, which are oil fields that contain at least 500 million barrels in ultimatelyrecoverable reserves.
I consider two proxies for the credible commitment parameter α. The first is commonly used inexisting civil war research: EPR’s measure of whether an ethnic group is systematically excludedfrom, as opposed to included in, the ruling coalition in a particular year.20 This variable hasthe advantage of directly measuring commitment ability, but the disadvantage of possibly beingendogenous to group-level oil production. I therefore also consider two historical proxies for inter-
19Because it is difficult to use ethnic groups as the unit of analysis to study non-ethnic civil wars, this caveathighlights why country-level data also provide insight into the center-seeking conflict resource curse (see Chapter 1for additional details).
20The results using this variable are similar to those from Hunziker and Cederman (2012), albeit here I distinguishdifferent types of civil war, and do not control for the problematic post-treatment variable of income per capita(Chapter 1 provides an extended discussion).
81
ethnic institutions. The first is a binary measure, for each ethnic group’s country, of whether or notthe ethnic group that controlled the government at independence was organized as a hierarchicalkingdom prior to colonization. Chapter 3 argues pre-colonial kingdom groups impeded inter-ethnicinstitution formation and caused violence in post-colonial Sub-Saharan Africa. The current codingscheme extends this variable to North Africa and Asia as well. Notably, all countries that werenever colonized were organized as a kingdom at the turn of the 20th century and therefore ethnicgroups in these countries are also coded as 1 on this variable. The second historical proxy forinter-ethnic institutions is a binary measure of whether the ethnic group participated in a rebellionto resist the onset of colonization, coded using Clodfelter’s (2002) encyclopedia on historical wars.Crucially, many of these wars were fought not only to prevent European control over their territory,but also to prevent Europeans from placing them into undesired colonial units. For example, afterEuropean Allies reneged on an earlier promise to grant Kurds an independent state, Iraqi Kurdsfought against Britain to contest their integration with Arabs to the south.
The core regression models include standard temporal dynamics controls (peace years and cubicsplines) in addition to oil and an institutions measure. Tables 3 and 4 present unconditionalresults that do not include an interaction term, whereas Figures 3 and 4 present conditional resultsthat include an interaction between oil and institutions. The models with additional covariatesalso control for an ethnic group’s log percentage of their country’s population and two geographicfactors that should affect separatist civil war propensity. These are a binary indicator of whetherthe ethnic group resides in territory discontiguous from the capital city, and the log of the group’sdistance from the capital. A higher value of either variable increases the difficulty of putting downan insurgency for the government, and rebel groups can use their geographically distinct territoryto help frame grievances (e.g., Cabinda in Angola, Porto 2003). Importantly, these geographicalfactors are independent of oil production. The final two covariates are region fixed effects for Sub-Saharan Africa and the Middle East and North Africa, leaving other Asian countries as the excludedbasis region. All models are estimated using OLS with robust standard errors clustered by ethnicgroup.
Table 3 presents results from eight regressions for separatist civil wars. The first four specificationsuse EPR exclusion to proxy for weak inter-ethnic institutions, whereas the last four specificationscode institutions as weak if the group either belongs to a country in which the ethnic group thatcontrolled the government at independence was organized as a hierarchical kingdom prior to col-onization, or if the group fought against their colonizer.21 The first two specifications for eachinstitutions measure (Columns 1, 2, 5, and 6) only include ethnic groups composing less than 20%of their country’s population. As discussed above, these are the groups with the strongest separatistpotential and for which local oil wealth should exert the strongest positive effects on separatist civilwar onset if the conditional separatist conflict resource curse hypothesis is correct. The last twospecifications for each institutions measure (Columns 3, 4, 7, and 8) include all groups in the sam-ple described above. Odd-numbered specifications include only the covariates from the core modelwhereas even-numbered specifications include all the covariates described above.
21Therefore, all the institutions variables equal 1 when inter-ethnic institutions are weak, and 0 when strong. Also,combining the two historical variables into one obviates the need to examine a third-order interaction term thatincludes oil and both historical institutions measures individually in the regressions with conditional effects (Figures3 and 4).
82
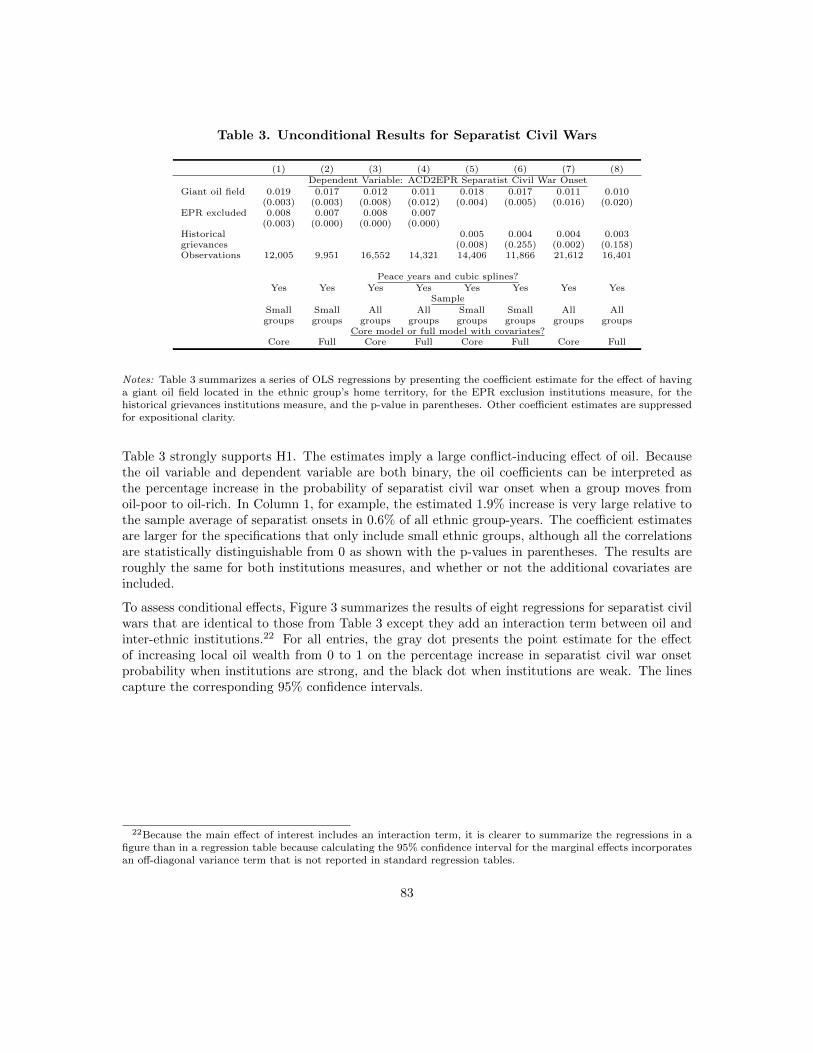
Table 3. Unconditional Results for Separatist Civil Wars
(1) (2) (3) (4) (5) (6) (7) (8)Dependent Variable: ACD2EPR Separatist Civil War Onset
Giant oil field 0.019 0.017 0.012 0.011 0.018 0.017 0.011 0.010(0.003) (0.003) (0.008) (0.012) (0.004) (0.005) (0.016) (0.020)
EPR excluded 0.008 0.007 0.008 0.007(0.003) (0.000) (0.000) (0.000)
Historical 0.005 0.004 0.004 0.003grievances (0.008) (0.255) (0.002) (0.158)Observations 12,005 9,951 16,552 14,321 14,406 11,866 21,612 16,401
Peace years and cubic splines?Yes Yes Yes Yes Yes Yes Yes Yes
SampleSmall Small All All Small Small All Allgroups groups groups groups groups groups groups groups
Core model or full model with covariates?Core Full Core Full Core Full Core Full
Notes: Table 3 summarizes a series of OLS regressions by presenting the coefficient estimate for the effect of havinga giant oil field located in the ethnic group’s home territory, for the EPR exclusion institutions measure, for thehistorical grievances institutions measure, and the p-value in parentheses. Other coefficient estimates are suppressedfor expositional clarity.
Table 3 strongly supports H1. The estimates imply a large conflict-inducing effect of oil. Becausethe oil variable and dependent variable are both binary, the oil coefficients can be interpreted asthe percentage increase in the probability of separatist civil war onset when a group moves fromoil-poor to oil-rich. In Column 1, for example, the estimated 1.9% increase is very large relative tothe sample average of separatist onsets in 0.6% of all ethnic group-years. The coefficient estimatesare larger for the specifications that only include small ethnic groups, although all the correlationsare statistically distinguishable from 0 as shown with the p-values in parentheses. The results areroughly the same for both institutions measures, and whether or not the additional covariates areincluded.
To assess conditional effects, Figure 3 summarizes the results of eight regressions for separatist civilwars that are identical to those from Table 3 except they add an interaction term between oil andinter-ethnic institutions.22 For all entries, the gray dot presents the point estimate for the effectof increasing local oil wealth from 0 to 1 on the percentage increase in separatist civil war onsetprobability when institutions are strong, and the black dot when institutions are weak. The linescapture the corresponding 95% confidence intervals.
22Because the main effect of interest includes an interaction term, it is clearer to summarize the regressions in afigure than in a regression table because calculating the 95% confidence interval for the marginal effects incorporatesan off-diagonal variance term that is not reported in standard regression tables.
83
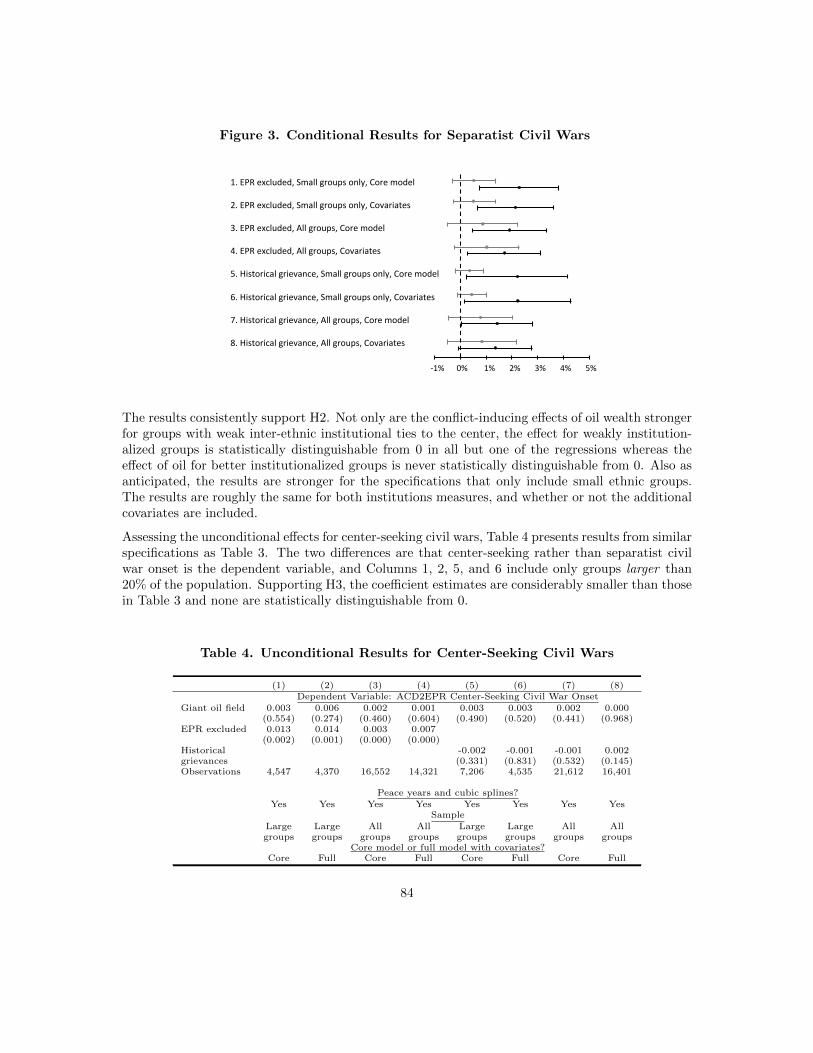
Figure 3. Conditional Results for Separatist Civil Wars
1. EPR excluded, Small groups only, Core model 2. EPR excluded, Small groups only, Covariates 3. EPR excluded, All groups, Core model 4. EPR excluded, All groups, Covariates 5. Historical grievance, Small groups only, Core model 6. Historical grievance, Small groups only, Covariates 7. Historical grievance, All groups, Core model 8. Historical grievance, All groups, Covariates
-‐1% 0% 1% 2% 3% 4% 5%
The results consistently support H2. Not only are the conflict-inducing effects of oil wealth strongerfor groups with weak inter-ethnic institutional ties to the center, the effect for weakly institution-alized groups is statistically distinguishable from 0 in all but one of the regressions whereas theeffect of oil for better institutionalized groups is never statistically distinguishable from 0. Also asanticipated, the results are stronger for the specifications that only include small ethnic groups.The results are roughly the same for both institutions measures, and whether or not the additionalcovariates are included.
Assessing the unconditional effects for center-seeking civil wars, Table 4 presents results from similarspecifications as Table 3. The two differences are that center-seeking rather than separatist civilwar onset is the dependent variable, and Columns 1, 2, 5, and 6 include only groups larger than20% of the population. Supporting H3, the coefficient estimates are considerably smaller than thosein Table 3 and none are statistically distinguishable from 0.
Table 4. Unconditional Results for Center-Seeking Civil Wars
(1) (2) (3) (4) (5) (6) (7) (8)Dependent Variable: ACD2EPR Center-Seeking Civil War Onset
Giant oil field 0.003 0.006 0.002 0.001 0.003 0.003 0.002 0.000(0.554) (0.274) (0.460) (0.604) (0.490) (0.520) (0.441) (0.968)
EPR excluded 0.013 0.014 0.003 0.007(0.002) (0.001) (0.000) (0.000)
Historical -0.002 -0.001 -0.001 0.002grievances (0.331) (0.831) (0.532) (0.145)Observations 4,547 4,370 16,552 14,321 7,206 4,535 21,612 16,401
Peace years and cubic splines?Yes Yes Yes Yes Yes Yes Yes Yes
SampleLarge Large All All Large Large All Allgroups groups groups groups groups groups groups groups
Core model or full model with covariates?Core Full Core Full Core Full Core Full
84
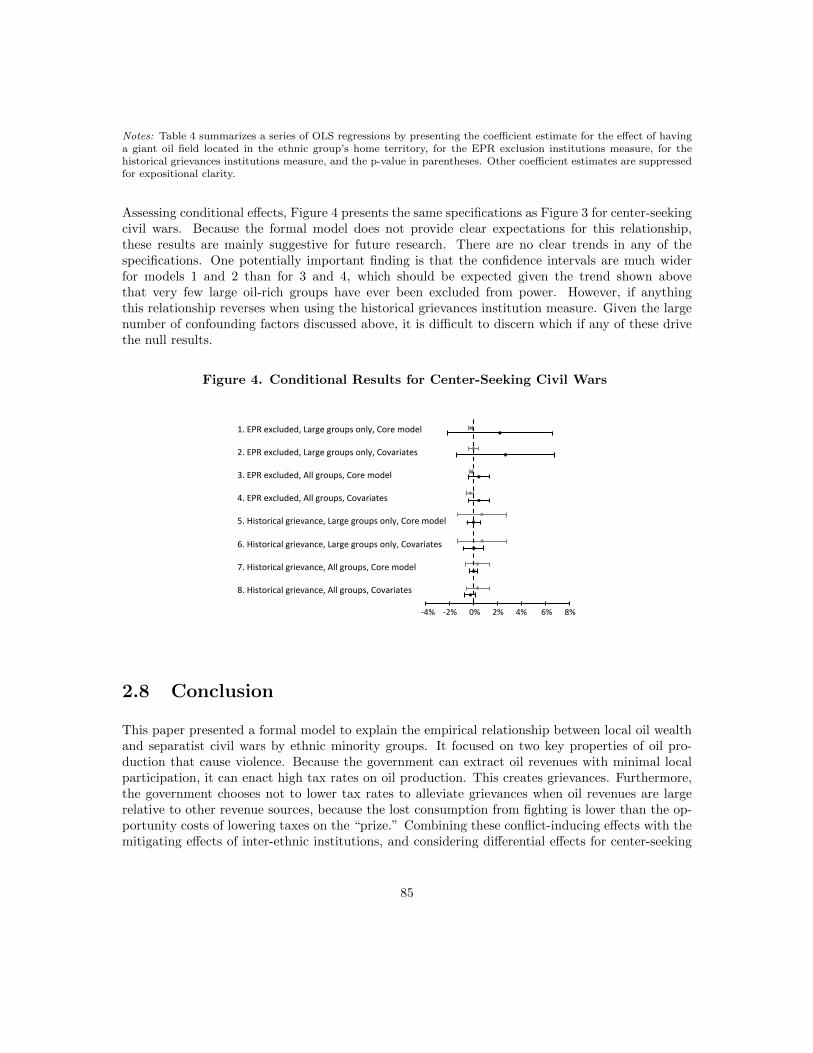
Notes: Table 4 summarizes a series of OLS regressions by presenting the coefficient estimate for the effect of havinga giant oil field located in the ethnic group’s home territory, for the EPR exclusion institutions measure, for thehistorical grievances institutions measure, and the p-value in parentheses. Other coefficient estimates are suppressedfor expositional clarity.
Assessing conditional effects, Figure 4 presents the same specifications as Figure 3 for center-seekingcivil wars. Because the formal model does not provide clear expectations for this relationship,these results are mainly suggestive for future research. There are no clear trends in any of thespecifications. One potentially important finding is that the confidence intervals are much widerfor models 1 and 2 than for 3 and 4, which should be expected given the trend shown abovethat very few large oil-rich groups have ever been excluded from power. However, if anythingthis relationship reverses when using the historical grievances institution measure. Given the largenumber of confounding factors discussed above, it is difficult to discern which if any of these drivethe null results.
Figure 4. Conditional Results for Center-Seeking Civil Wars
-‐4% -‐2% 0% 2% 4% 6% 8%
1. EPR excluded, Large groups only, Core model 2. EPR excluded, Large groups only, Covariates 3. EPR excluded, All groups, Core model 4. EPR excluded, All groups, Covariates 5. Historical grievance, Large groups only, Core model 6. Historical grievance, Large groups only, Covariates 7. Historical grievance, All groups, Core model 8. Historical grievance, All groups, Covariates
2.8 Conclusion
This paper presented a formal model to explain the empirical relationship between local oil wealthand separatist civil wars by ethnic minority groups. It focused on two key properties of oil pro-duction that cause violence. Because the government can extract oil revenues with minimal localparticipation, it can enact high tax rates on oil production. This creates grievances. Furthermore,the government chooses not to lower tax rates to alleviate grievances when oil revenues are largerelative to other revenue sources, because the lost consumption from fighting is lower than the op-portunity costs of lowering taxes on the “prize.” Combining these conflict-inducing effects with themitigating effects of inter-ethnic institutions, and considering differential effects for center-seeking
85
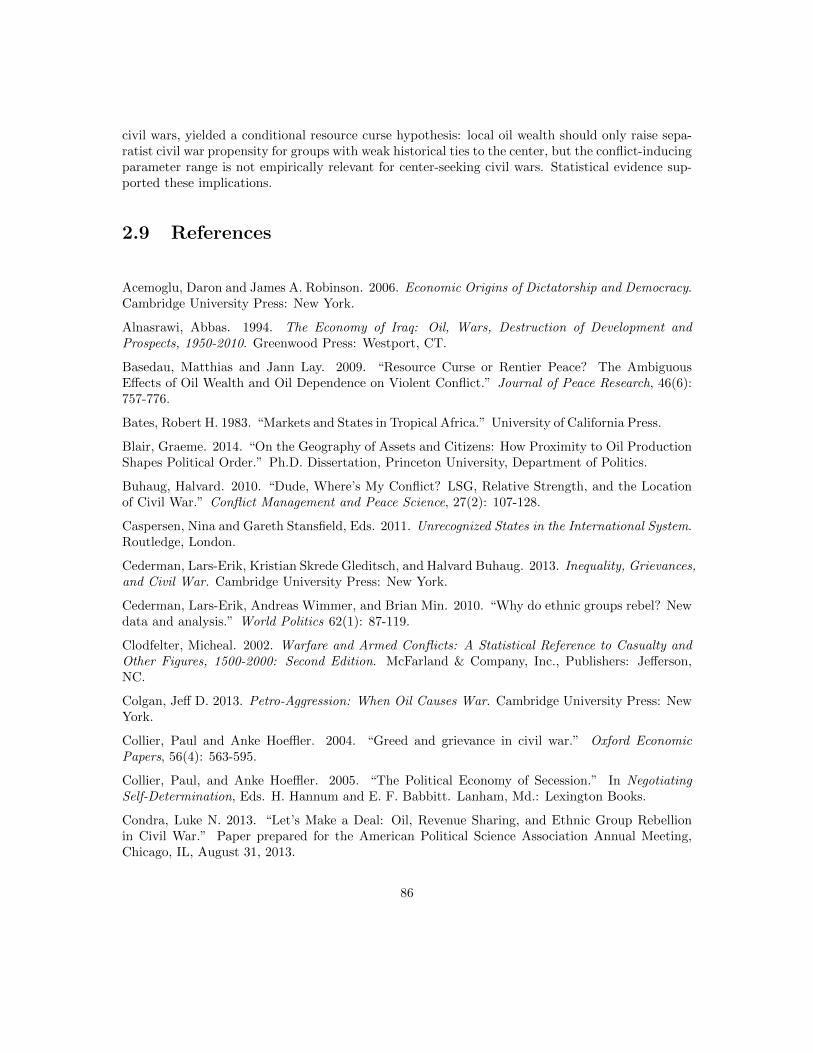
civil wars, yielded a conditional resource curse hypothesis: local oil wealth should only raise sepa-ratist civil war propensity for groups with weak historical ties to the center, but the conflict-inducingparameter range is not empirically relevant for center-seeking civil wars. Statistical evidence sup-ported these implications.
2.9 References
Acemoglu, Daron and James A. Robinson. 2006. Economic Origins of Dictatorship and Democracy.Cambridge University Press: New York.
Alnasrawi, Abbas. 1994. The Economy of Iraq: Oil, Wars, Destruction of Development andProspects, 1950-2010. Greenwood Press: Westport, CT.
Basedau, Matthias and Jann Lay. 2009. “Resource Curse or Rentier Peace? The AmbiguousEffects of Oil Wealth and Oil Dependence on Violent Conflict.” Journal of Peace Research, 46(6):757-776.
Bates, Robert H. 1983. “Markets and States in Tropical Africa.” University of California Press.
Blair, Graeme. 2014. “On the Geography of Assets and Citizens: How Proximity to Oil ProductionShapes Political Order.” Ph.D. Dissertation, Princeton University, Department of Politics.
Buhaug, Halvard. 2010. “Dude, Where’s My Conflict? LSG, Relative Strength, and the Locationof Civil War.” Conflict Management and Peace Science, 27(2): 107-128.
Caspersen, Nina and Gareth Stansfield, Eds. 2011. Unrecognized States in the International System.Routledge, London.
Cederman, Lars-Erik, Kristian Skrede Gleditsch, and Halvard Buhaug. 2013. Inequality, Grievances,and Civil War. Cambridge University Press: New York.
Cederman, Lars-Erik, Andreas Wimmer, and Brian Min. 2010. “Why do ethnic groups rebel? Newdata and analysis.” World Politics 62(1): 87-119.
Clodfelter, Micheal. 2002. Warfare and Armed Conflicts: A Statistical Reference to Casualty andOther Figures, 1500-2000: Second Edition. McFarland & Company, Inc., Publishers: Jefferson,NC.
Colgan, Jeff D. 2013. Petro-Aggression: When Oil Causes War. Cambridge University Press: NewYork.
Collier, Paul and Anke Hoeffler. 2004. “Greed and grievance in civil war.” Oxford EconomicPapers, 56(4): 563-595.
Collier, Paul, and Anke Hoeffler. 2005. “The Political Economy of Secession.” In NegotiatingSelf-Determination, Eds. H. Hannum and E. F. Babbitt. Lanham, Md.: Lexington Books.
Condra, Luke N. 2013. “Let’s Make a Deal: Oil, Revenue Sharing, and Ethnic Group Rebellionin Civil War.” Paper prepared for the American Political Science Association Annual Meeting,Chicago, IL, August 31, 2013.
86
Denny, Elaine K. and Barbara F. Walter. 2014. “Ethnicity and civil war.” Journal of PeaceResearch, 51(2): 199-212.
Dunning, Thad. 2008. Crude Democracy: Natural Resource Wealth and Political Regimes. Cam-bridge University Press: New York, NY.
Englebert, Pierre. 2009. Africa: Unity, Sovereignty, and Sorrow. Lynne Rienner Publishers:Boulder, CO.
Fearon, James D. 1995. “Rationalist Explanations for War.” International Organization, 49(3):379-414.
Fearon, James D. 2004. “Why do some civil wars last so much longer than others?” Journal ofPeace Research, 41(3): 275-301.
Fearon, James D. 2005. “Primary Commodity Exports and Civil War.” Journal of Conflict Reso-lution, 49(4): 483-507.
Fearon, James D. 2008. “Economic Development, Insurgency, and Civil War.” In Ed. ElhananHelpman Institutions and Economic Performance, Harvard University Press: Cambridge.
Fearon, James D. and David D. Laitin. 2003. “Ethnicity, Insurgency, and Civil War.” AmericanPolitical Science Review, 97(1): 75-90.
Garfinkel, Michelle R. and Stergios Skaperdas. 2006. “Economics of Conflict: An Overview.”Prepared for Handbook of Defense Economics, Vol. 2.
Gause, F. Gregory. 1994. Oil Monarchies: Domestic and Security Challenges in the Arab GulfStates. Council on Foreign Relations: New York.
Gurr, Ted. 1969. Why Men Rebel. Paradigm Publishers.
Haber, Stephen and Victor Menaldo. 2011. “Do Natural Resources Fuel Authoritarianism? AReappraisal of the Resource Curse.” American Political Science Review, 105(1): 1-26.
Hegre, Havard and Nicholas Sambanis. 2006. “Sensitivity Analysis of Empirical Results on CivilWar Onset.” Journal of Conflict Resolution, 50(4): 508-535.
Herbst, Jeffrey. 2000. States and Power in Africa: Comparative Lessons in Authority and Control.Princeton University Press: New Jersey.
Horn, Myron K. 2003. “Giant Fields 1868-2003 (CD-ROM).” In Giant Oil and Gas Fields of theDecade, 1990-1999, Ed. Halbouty, M.K.. Houston: AAPG Memoir 78.
Horowitz, Donald. 1985. Ethnic Groups in Conflict. University of California Press.
Humphreys, Macartan. 2005. “Natural Resources, Conflict, and Conflict Resolution: Uncoveringthe Mechanisms.” Journal of Conflict Resolution, 49(4): 508-537.
Hunziker, Philipp and Lars-Erik Cederman. 2012. “No Extraction without Representation: PetroleumProduction and Ethnonationalist Conflict.” Working Paper.
Jones, Toby Craig. 2010. Desert Kingdom: How Oil and Water Forged Modern Saudi Arabia.Harvard University Press: Cambridge, MA.
Laitin, David D. 2007. Nations, States, and Violence. Oxford University Press: New York.
87
Le Billon, Philippe. 2006. Fuelling War: Natural Resources and Armed Conflict. Routledge.
Lei, Yu-Hsiang and Guy Michaels. 2014. “Do giant oilfields fuel internal armed conflicts?” Journalof Development Economics, 110: 139-157.
Lujala, Paivi, Jan Ketil Rod, and Nadja Thieme. 2007. “Fighting over Oil: Introducing a NewDataset.” Conflict Management and Peace Science, 24: 239-256.
Magaloni, Beatriz. 2008. “Credible Power-Sharing and the Longevity of Authoritarian Rule.”Comparative Political Studies.
Morelli, Massimo and Dominic Rohner. 2014. “Resource Concentration and Civil Wars.” NBERWorking Paper 20129.
Morrison, Kevin M. 2012. “Oil, Conflict, and Stability.” Working Paper.
Porto, Joao Gomes. 2003. “Cabinda: Notes on a soon-to-be-forgotten war.” Institute for SecurityStudies Paper 77.
Powell, Robert. 2004. “The Inefficient Use of Power: Costly Conflict with Complete Information.”American Political Science Review, 98(2): 231-241.
Powell, Robert. 2012. “Persistent Fighting and Shifting Power.” American Journal of PoliticalScience.
Roessler, Philip and David Ohls. 2015. “The Societal Origins of Powersharing: Ethnic Geography,Threat Capabilities and Horizontal Accountability in Weak States.” Working paper.
Ross, Michael L. 2004. “How Do Natural Resources Influence Civil War? Evidence from ThirteenCases.” International Organization, 58: 35-67.
Ross, Michael L. 2005. “Resources and Rebellion in Aceh, Indonesia.” In Understanding Civil WarVolume 2: Europe, Central Asia, and Other Regions, Eds. Paul Collier and Nicholas Sambanis.The World Bank : Washington, D.C., 35-58.
Ross, Michael L. 2007. “How Mineral-Rich States Can Reduce Inequality.” In Escaping the ResourceCurse, Eds. Marcartan Humphreys, Jeffrey D. Sachs, and Joseph E. Stiglitz. Columbia UniversityPress.
Ross, Michael L. 2010. “Latin America’s Missing Oil Wars.” Paper prepared for the World Bank’sOffice of the Chief Economist for Latin America and the Caribbean, project “Myths and Realitiesof Commodity Dependence in Latin America.”
Ross, Michael L. 2012. The Oil Curse: How Petroleum Wealth Shapes the Development of Nations.Princeton University Press: Princeton.
Ross, Michael L. 2013. “The Politics of the Resource Curse: A Review.” Forthcoming in theHandbook on the Politics of Development.
Smith, Benjamin. 2015. “Exploring the Resource-Civil War Nexus.” Working paper.
Sorens, Jason. 2011. “Mineral Production, Territory, and Ethnic Rebellion: The Role of RebelConstituencies.” Journal of Peace Research, 48(5): 571-585.
88
Svolik, Milan W. 2012. The Politics of Authoritarian Rule. Cambridge University Press: NewYork, NY.
Toft, Monica Duffy. 2014. “Territory and War.” Journal of Peace Research, 51(2): 185-198.
Walter, Barbara F. 2009. “Bargaining Failure and Civil War.” Annual Review of Political Science,12: 243-61.
Ward, Steven R. 2009. Immortal: A Military History of Iran and Its Armed Forces. GeorgetownUniversity Press: Washington, D.C.
Wucherpfennig, J., N. B.Weidmann, L. Girardin, L.-E. Cederman, and A. Wimmer. 2011. “Polit-ically relevant ethnic groups across space and time: Introducing the GeoEPR dataset.” ConflictManagement and Peace Science, 28(5): 423-437.
Wucherpfennig, J., N. Metternich, L.-E. Cederman, and K. S. Gleditsch. 2012. “Ethnicity, thestate and the duration of civil war.” World Politics, 64(1): 79-115.
89
Chapter 3
Pre-Colonial Kingdoms and theCoup-Civil War Nexus inSub-Saharan Africa
Abstract
Recent research on how horizontal ethnic inequalities affect civil war propensity hasdemonstrated ethnic groups systematically excluded from power at the center rebel athigher rates. This paper builds on this important finding by addressing two questions.(1) Why would a ruler strategically choose to undermine inter-ethnic relationships?(2) What historical factors explain variance in ethnopolitical exclusion in Sub-SaharanAfrica? A formal model addresses question #1 by allowing a government to politicallyinclude or exclude a challenger. It shows that because the prospect of military coupscreates an internal security dilemma, weak inter-ethnic commitment ability causes acoup-civil war nexus and induces strategic rulers to pursue ethnic exclusion. To addressquestion #2, I argue ethnic groups in Sub-Saharan Africa that were organized as king-doms prior to colonization undermined possibilities for developing strong inter-ethnicrelationships through reinforcing pre-colonial and colonial epochs. This diminished gov-ernment commitment ability after independence. Statistical evidence at the ethnic grouplevel, alongside case evidence, shows pre-colonial kingdom groups are an important ex-planation for ethnic exclusion, coups, and civil wars in Sub-Saharan Africa during theCold War era.
90
3.1 Introduction
What causes civil wars? Whereas early statistical research on civil wars focused mainly on eco-nomic factors (Collier and Hoeffler 2004) and opportunities for insurgencies (Fearon and Laitin2003), a prominent and burgeoning literature has convincingly demonstrated that ethnopoliticalcompetition over the state affects prospects for violence (e.g., Cederman, Wimmer, and Min 2010;Cederman, Gleditsch, and Buhaug 2013). One of the most important findings from this recent“horizontal inequalities” research agenda is that ethnic groups systematically excluded from powerat the center initiate civil wars more frequently than groups with access to central power.1 Thispaper aims to build on these contributions by examining two critical factors that have received rel-atively little attention: strategic and historical causes of variation in ethnic exclusion and politicalviolence.
Regarding strategy, this core empirical finding about excluded ethnic groups and violence sitsuneasily with a different strand of the civil war literature. It is nearly a truism that weak institutionscreate ripe conditions for civil war. One prominent mechanism from existing research that connectsweak institutions to fighting focuses on low commitment ability: if future promises are perceivedas incredible, actors expecting a weakened future bargaining position may choose to exercise forcein the present.2 Juxtaposing commitment problem theories and horizontal inequalities argumentsraises a puzzle that provides the first main inquiry of this paper:
(1) Why do political leaders frequently choose to lower their commitment ability bysystematically excluding other ethnic groups from government power—thereby raisingcivil war risk?
This question is particularly pertinent for Sub-Saharan Africa (SSA). Because few ethnic groupscomprise a majority of their national population, we may expect rulers to build inclusive inter-ethniccoalitions to stabilize their regime. In contrast, intriguingly, rulers in this region have frequentlypursued ethnic exclusion.
It is also vital to scrutinize the considerable variation in ethnic representation choices across andwithin countries. Because differences in ethnopolitical composition had already emerged by inde-pendence in many SSA countries, it appears necessary to examine variance in historical legacies.Furthermore, it may be fruitful to complement the horizontal inequalities literature—and civil warresearch more broadly—with insights from the active research agenda on historical causes of insti-tutional weakness in SSA, most of which focuses on economic development.3 This yields a secondkey question:
(2) What historical factors explain why SSA rulers exclude some ethnic groups but not
1Horizontal inequalities are “inequalities in economic, social or political dimensions or cultural status betweenculturally defined groups” (Stewart 2008, 3; quoted in Cederman, Gleditsch, and Buhaug 2013, 31).
2Fearon (1995) and Powell (2004, 2006) explain the general logic. Walter (2009, 251) and Blattman and Miguel(2010, 13) discuss its application to civil wars. Throughout this paper, “commitment ability” refers to the govern-ment’s ability to commit to delivering promised future payments to a challenger, independent of the challenger’scontemporaneous coercive capacity. A government that can credibly promise a large payment to a group that ismilitarily weak (either temporarily or permanently) has high commitment ability.
3Contributions include Gennaioli and Rainer (2007), Nunn (2008), Nunn and Wantchekon (2011), Michalopoulosand Papaioannou (2013), and Akyeampong et al. (2014). Englebert et al. (2002), Besley and Reynal-Querol (2014),and Dincecco et al. (2014) focus on civil wars.
91
others?
This paper provides two main contributions. First, it presents a formal model that bridges twoprominent but previously disparate strands of the civil war literature by incorporating horizontalethnic inequalities into a commitment problem framework. The model addresses the first questionby analyzing how internal security constraints provide incentives for ethnic exclusion. It focusesattention on what types of ethnic groups pose severe internal threats to the ruler. Second, thepaper empirically examines the long-term effects of pre-colonial kingdoms (PCKs) in SSA, which Iargue exacerbated ethnically rooted commitment problems and triggered a tradeoff between militarycoups and civil wars.
Section 2 extends formal commitment problem models to allow a government to choose whether toinclude or exclude a rival ethnic group—i.e., a challenger—in the ruling coalition. Providing the keytension in the model, although by assumption political inclusion increases the government’s abilityto commit to future payments to the challenger, inclusion also enhances the challenger’s ability tolaunch a military coup. Thus, an internal security dilemma may cause the ruler to practice ethnicexclusion and risk civil wars, which formalizes an argument from Roessler (2011). Rather thanfocusing on a generic weakly institutionalized environment that induces fear of all ethnic “others,”however, the analysis focuses on the differential ability of ethnic groups to commit to future promisesto each other. It demonstrates why a coup-civil war nexus may arise when inter-ethnic commitmentability is low, whereas political coalitions will be stable when commitment ability is higher.
The remainder of the paper provides evidence that variability in pre-colonial political organiza-tion can help explain why we observe ethnic exclusion and a coup-civil war nexus in some SSAcountries but not others. Section 3 provides qualitative historical evidence to substantively groundthe argument that PCK groups created considerable obstacles to fostering productive inter-ethnicrelationships prior to independence, through their alternative vision of statehood and history of an-imosity toward neighboring groups. After independence, the pressing commitment problems facedby governments in political coalitions that included a PCK group created frequent crises—whichresulted in coups that aimed to exclude other ethnic groups and, subsequently, civil wars.
Statistical evidence shows PCKs can explain variance in patterns of military coups, civil wars,and ethnic representation in SSA. Section 4 describes the process for coding PCKs and presentsthe research design by examining why kingdoms arose in certain parts of pre-colonial Africa butnot others. Section 5 provides ethnic group-level statistical evidence and qualitative evidence thatPCK groups caused coups, civil wars, and ethnic exclusion. Section 6 summarizes the findings anddiscusses broader implications.
3.2 Modeling the Tradeoff Between Ethnic Inclusion andExclusion
The formal model achieves two main goals. First, it bridges two influential strands of the civil warliterature. Horizontal inequalities research focuses almost exclusively on cultural arguments relatedto modernization and nationalist mobilization to explain why governments exclude ethnic groups(e.g., Cederman, Gleditsch, and Buhaug 2013, 30-53). Despite the usefulness of these considerations,it is striking that excepting Roessler (2011) there have been few attempts to understand the strategic
92
calculations that undergird ethnic representation decisions. Furthermore, existing theories havedifficulty explaining variance in ethnic exclusion choices because they focus on generic factors toexplain nationalist tensions or fears of ethnic outsiders. Incorporating strategic choices over ethnicrepresentation into a formal commitment problem model addresses these considerations.
Second, the model elucidates the mechanism argued below to link PCKs to political violence.Although it is perhaps not surprising that peaceful bargaining ensues when the government hashigh commitment ability, the model provides novel theoretical grounding for why coup-civil warspirals—as opposed to other patterns of violence—may arise when inter-ethnic commitment abilityis weak.
3.2.1 Setup
Two ethnic groups—one controlling the government (G) and one that can challenge for governmentcontrol (C)—bargain over the distribution of state revenues in an infinite time horizon game. Withregard to PCK groups in SSA, the model provides insight into strategic bargaining after indepen-dence, whereas the historical discussion in the next section explains how pre-colonial interactionsaffected the credible commitment parameter in this post-colonial bargaining game.
The sequence of moves within each period unfolds as follows. Nature moves first and decides whetherC is strong (probability σ) or weak (probability 1 − σ) in the period, terms that will be definedbelow. G then makes a patronage offer to C, and C responds by either accepting or fighting.4
Although bargaining is a key feature in rationalist theories of conflict (Fearon 1995), the idea thatactors can bargain to reduce latent grievances and therefore avoid costly fighting is largely absentin the horizontal inequalities literature. For example, Cederman, Gleditsch, and Buhaug (2013,49) argue that authoritarian states “generally refuse to accept even the most modest proposals forpolitical change while exposing peaceful protestors to the full force of their repressive capabilities.”Rather than assume that bargaining will fail, integrating ideas about horizontal inequalities intoa bargaining framework facilitates analyzing why bargaining may fail when actors seemingly couldpeacefully resolve their grievances.
If C accepts the patronage offer, each side consumes its share of the agreed division and the gamemoves to the next period. If C rejects G’s offer by fighting, no consumption occurs in the currentperiod, which captures the surplus destroyed by fighting. The winner gains (or remains in) powerand the loser becomes (or remains) the challenger. Therefore, G and C refer to an actor’s positionin a particular period. Finally, if a fight has occurred, as the last move in the period the winnerdecides whether to “include” or “exclude” the loser in the ruling coalition for their interactionstarting in the next period. That is, G only can make an inclusion/exclusion choice if fighting hasoccurred earlier in the period. Future consumption is discounted exponentially by δ ∈ (0, 1).
Existing horizontal inequalities theories trace the emergence of political inequalities to nationalistideologies spreading to the colonial world (Cederman, Gleditsch, and Buhaug 2013, 33-35). Thismodel, by contrast, allows actors to strategically choose inclusionary or exclusionary ruling coali-tions. History certainly impacts equilibrium outcomes—below I explain how PCK groups affected
4Prevalent forms of patronage in post-colonial SSA have included positions in the government bureaucracy, cabinetpositions (Arriola 2009), and state-sanctioned racketeering (Englebert 2009).
93
the credible commitment parameter—but history shapes the incentive structure for ethnopoliticalexclusion rather than pre-determines whether a group is included or excluded.
In the model, inclusionary and exclusionary ruling coalitions are distinguished by (1) C’s probabilityof winning a fight and (2) G’s ability to commit to future payments for C. On the one hand,exclusion benefits G because C is less likely to win a fight when excluded. Specifically, in periods Cis strong, if C is included it wins a coup attempt with probability p and loses with complementaryprobability. If C is excluded, it wins a civil war—or rebellion—with probability αp in a period itis strong, for α ∈ [0, 1).5 Substantively, coup attempts pose a more direct threat to the ruler thanrebellions by causing government turnover with higher probability. If instead C is weak in a period,it wins with probability 0 regardless of whether it is included or excluded from power.6
On the other hand, exclusion inhibits the government by decreasing its ability to credibly committo higher patronage offers, which the following assumptions capture. If C is excluded, G has noability to commit to future promises. Formally, from a budget normalized to size 1, G chooses anoffer xt ∈ [0, 1] in all periods t. Therefore, any “promises” G has made in the past do not constrainits current-period choice. The analysis shows that when C is excluded, C’s consumption in eachperiod is determined entirely by its ability to coerce G at that time.
Including C increases G’s commitment ability. The commitment parameter θ affects the magnitudeof this increase by capturing G’s ability to credibly promise to make offers independent of C’scontemporaneous expected utility to fighting. Specifically, the first time an included C accepts anoffer xt in a strong period t, there is a θ ∈ (0, 1] percent chance G will be bound to make the sameoffer xt in all future periods.7 In other words, whenever G makes an offer in a strong period it“promises” to make the same offer in all future periods, and with probability θ that promise willbe credible. Denote G’s offer as xt = xI (“I” stands for Inclusion) and the equilibrium offer as x∗I .With complementary 1−θ probability, bargaining continues with C included in the ruling coalitionand G not bound to offer xI in future periods—but the next time C accepts an offer in a strongperiod, there is again a θ percent chance that G will be bound to make the same offer in all futureperiods.8
5Of course, empirically, it is possible for an excluded group to stage a coup or for an included group to launch a civilwar. This setup instead implicitly assumes that coups are the optimal fighting technology for included groups andrebellions for excluded groups, implying that providing a richer set of fighting options would not affect equilibriumactions.
6One microfoundation for assuming C’s probability of winning fluctuates over time is that political actors areonly occasionally able to solve collective action problems and mount an effective challenge against the government(Acemoglu and Robinson 2006, 123-128). The next section provides examples of power shifting in PCK countries.Furthermore, because the goal of this model is to integrate horizontal inequality hypotheses into a formal commitmentproblem framework, it is useful to build on existing prominent formal bargaining theories of civil wars that also modelstochastic shifts in the distribution of power (Fearon 2004; Powell 2012).
7Formally, G’s action space becomes degenerate because it must make the same offer in all future periods.8Formally, a state variable St ∈ {0, 1} tracks whether or not G is bound to make a particular offer to an included
challenger. St = 1 means G is bound and St = 0 means G is not. Entering any period t, G inherits the value of thestate variable from the previous period, St−1. If St−1 = 1 and there is no fight in the current period, then St = 1.If a fight occurs when St−1 = 1, and the winner of the fight chooses to include C, then St = 0. That is, fighting issufficient to destroy the promise that earlier had been locked in, although does not eliminate the θ possibility of Gbeing able to commit in the future. Additionally, if the winner of the fight excludes the loser, then St = ∅ becauseSt is undefined in exclusionary subgames. If St−1 = 0, there is a θ percent chance the state variable changes toSt = 1 if C is strong in period t and C accepts G’s offer. This corresponds to the scenario described in the maintext that introduced θ. Conversely, if St−1 = 0, St cannot change to 1 if either C is weak or there is a fight at timet. Assuming that St−1 = 0 cannot transform into St = 1 if C is weak at time t ensures G cannot lock in a low offer
94
Substantively, θ captures how the two ethnic groups’ history of interaction prior to the start of thepost-independence bargaining game has affected perceptions about commitment ability. Formalinstitutions partially determine the magnitude of θ. Below I argue PCK groups hindered prospectsfor creating inter-ethnic political parties during the decolonization era. Drawing on existing re-search arguing that parties facilitate commitment to lucrative future payments for party members(Magaloni 2008; Svolik 2012), failing to create inter-ethnic political parties undermined an oppor-tunity to enhance the credibility of the government’s promised future payments. Informal historicalinteractions also impact θ. I additionally argue below that PCK groups’ frequent involvement inpre-colonial warfare and slave raiding engendered acrimonious relations with neighbors. Further-more, patterns of indirect colonial rule reinforced a pre-colonial history of hierarchical politicalorganization to create an alternative vision for statehood. In countries with a PCK group, thesefactors cause C to believe G’s future promises are not credible—hence lowering θ—whether a PCKgroup is the government or the challenger.9
Finally, the model assumes Nature chooses at the outset of the game which group becomes gov-ernment and whether the challenger is included or excluded, although the exact probabilities donot affect the analysis below. Substantively, this assumption corresponds with colonial influence onthe initial post-independence ruling coalition, as described in more detail below. This Nature movemakes observable behavior that would be off-the-equilibrium path if instead G strategically chosethe coalition at the outset. For example, even if the winner of a fight always prefers exclusion inequilibrium, G may inherit an inclusive coalition at the outset of the game.
The solution concept is Markov Perfect Equilibrium, which requires actors to make optimal choicesbased only on the contemporaneous state of the world and on previous moves within the currentperiod. Figure 1 presents trees for the stage games.
that a vulnerable C accepted. Finally, as shown in Figure 1, whether or not the state variable changes is the lastmove in the stage game.
9To my knowledge, no existing formal models of ethnic violence parameterize inter-ethnic commitment ability andderive its implications for fighting. Fearon (1998) provides perhaps the most closely related model. Also consideringan interaction between two ethnic groups, he assumes the ruling group has no commitment ability—in the sense ofbeing able to promise payments above the reservation value of the out-of-power group—and shows ethnic civil warswill occur if shifting demographic trends are sufficiently large. Furthermore, in his model the government cannotchoose to include the out-of-power group.
95
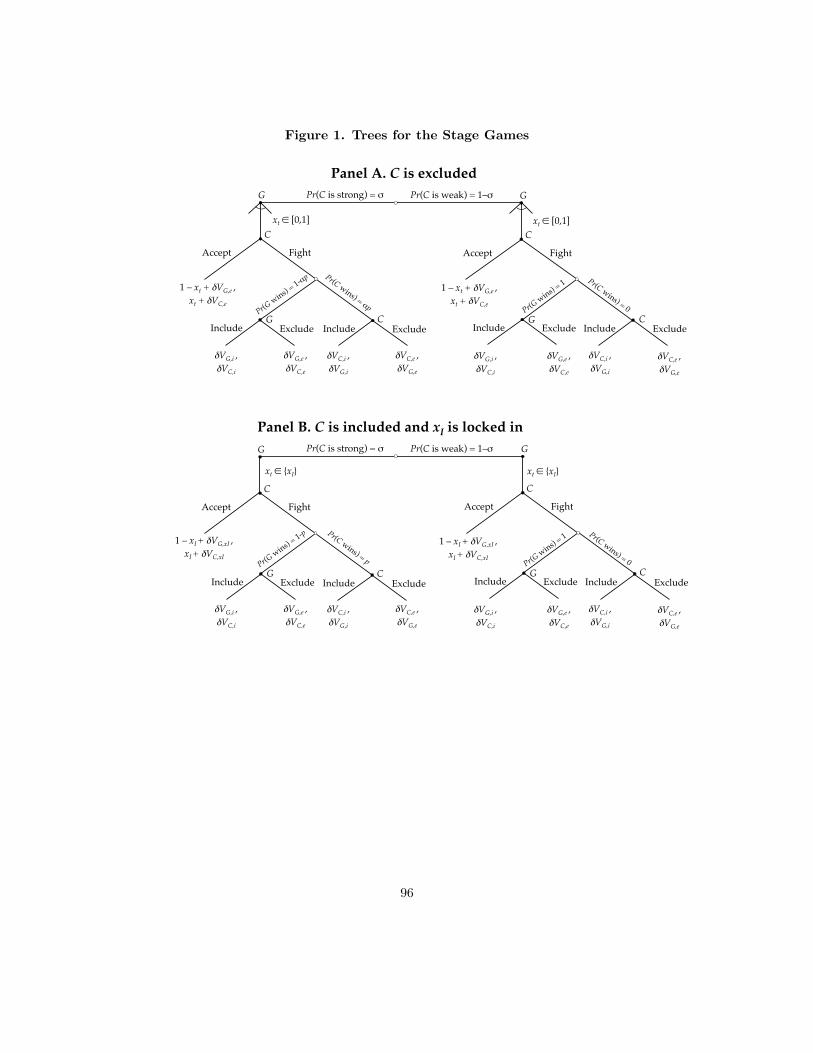
Figure 1. Trees for the Stage Games
Pr(C is strong) = σ Pr(C is weak) = 1–σ
Panel A. C is excluded
1 – xt + δVG,e ,!
xt + δVC,e!
G
C
Accept Fight
xt ∈ [0,1]!
G
C
Accept Fight
xt ∈ [0,1]!
1 – xt + δVG,e ,!
xt + δVC,e!
Include Exclude Include Exclude
G C
Include Exclude Include Exclude
G C
δVG,e ,!
δVC,e!
δVC,e ,!
δVG,e!
δVG,e ,!
δVC,e!
δVC,e ,!
δVG,e!
δVG,i ,!
δVC,i!
δVC,i ,!
δVG,i!
δVG,i ,!
δVC,i!
δVC,i ,!
δVG,i!
Panel B. C is included and xI is locked in Pr(C is strong) = σ Pr(C is weak) = 1–σ G
C
Accept Fight
xt ∈ {xI}!
G
C
Accept Fight
xt ∈ {xI}!
Include Exclude Include Exclude
G C
Include Exclude Include Exclude
G C
1 – xI + δVG,xI ,!
xI + δVC,xI!
1 – xI + δVG,xI ,!
xI + δVC,xI!
δVG,e ,!
δVC,e!
δVC,e ,!
δVG,e!
δVG,e ,!
δVC,e!
δVC,e ,!
δVG,e!
δVG,i ,!
δVC,i!
δVC,i ,!
δVG,i!
δVG,i ,!
δVC,i!
δVC,i ,!
δVG,i!
96
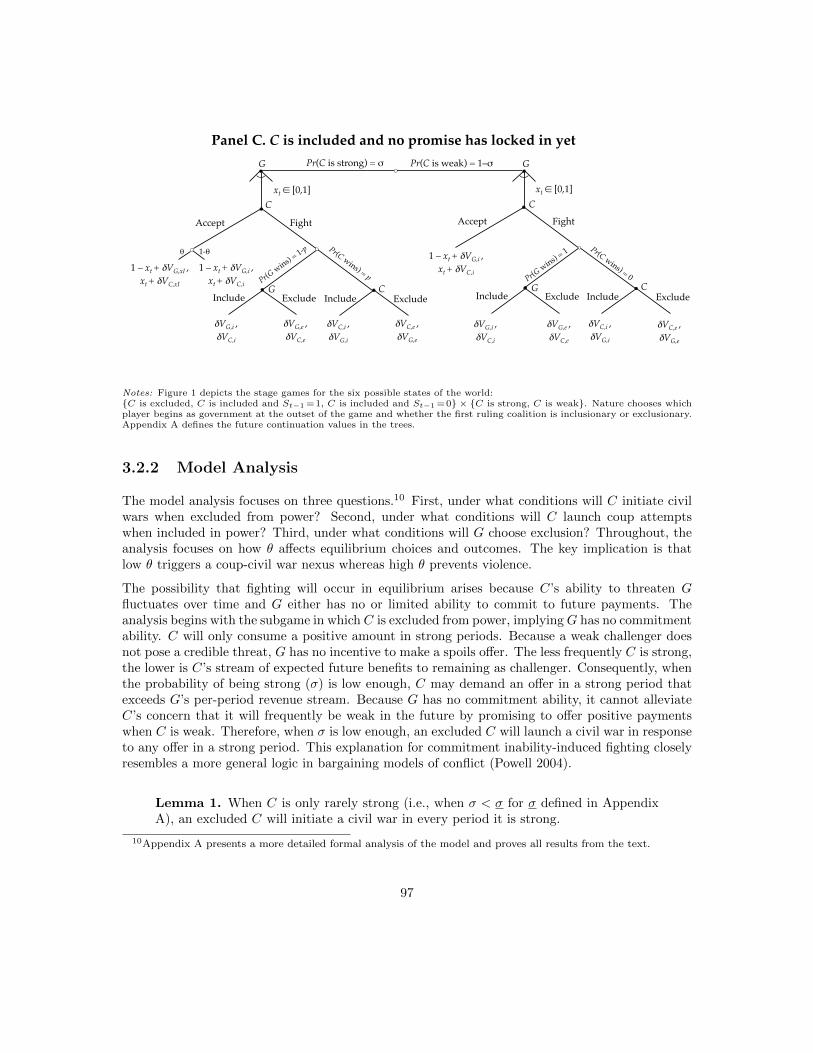
Pr(C is strong) = σ G G Pr(C is weak) = 1–σ
Panel C. C is included and no promise has locked in yet
C
Accept Fight
xt ∈ [0,1]!
Include Exclude Include Exclude
G C
Fight
xt ∈ [0,1]!
Include Exclude Include Exclude
G
C
θ 1-θ
Accept
C
1 – xt + δVG,i ,!
xt + δVC,i!1 – xt + δVG,i ,!
xt + δVC,i!
1 – xt + δVG,xI ,!
xt + δVC,xI!
δVG,e ,!
δVC,e!
δVC,e ,!
δVG,e!
δVG,e ,!
δVC,e!
δVC,e ,!
δVG,e!
δVG,i ,!
δVC,i!
δVC,i ,!
δVG,i!
δVG,i ,!
δVC,i!
δVC,i ,!
δVG,i!
Notes: Figure 1 depicts the stage games for the six possible states of the world:{C is excluded, C is included and St−1 =1, C is included and St−1 =0} × {C is strong, C is weak}. Nature chooses whichplayer begins as government at the outset of the game and whether the first ruling coalition is inclusionary or exclusionary.Appendix A defines the future continuation values in the trees.
3.2.2 Model Analysis
The model analysis focuses on three questions.10 First, under what conditions will C initiate civilwars when excluded from power? Second, under what conditions will C launch coup attemptswhen included in power? Third, under what conditions will G choose exclusion? Throughout, theanalysis focuses on how θ affects equilibrium choices and outcomes. The key implication is thatlow θ triggers a coup-civil war nexus whereas high θ prevents violence.
The possibility that fighting will occur in equilibrium arises because C’s ability to threaten Gfluctuates over time and G either has no or limited ability to commit to future payments. Theanalysis begins with the subgame in which C is excluded from power, implyingG has no commitmentability. C will only consume a positive amount in strong periods. Because a weak challenger doesnot pose a credible threat, G has no incentive to make a spoils offer. The less frequently C is strong,the lower is C’s stream of expected future benefits to remaining as challenger. Consequently, whenthe probability of being strong (σ) is low enough, C may demand an offer in a strong period thatexceeds G’s per-period revenue stream. Because G has no commitment ability, it cannot alleviateC’s concern that it will frequently be weak in the future by promising to offer positive paymentswhen C is weak. Therefore, when σ is low enough, an excluded C will launch a civil war in responseto any offer in a strong period. This explanation for commitment inability-induced fighting closelyresembles a more general logic in bargaining models of conflict (Powell 2004).
Lemma 1. When C is only rarely strong (i.e., when σ < σ for σ defined in AppendixA), an excluded C will initiate a civil war in every period it is strong.
10Appendix A presents a more detailed formal analysis of the model and proves all results from the text.
97
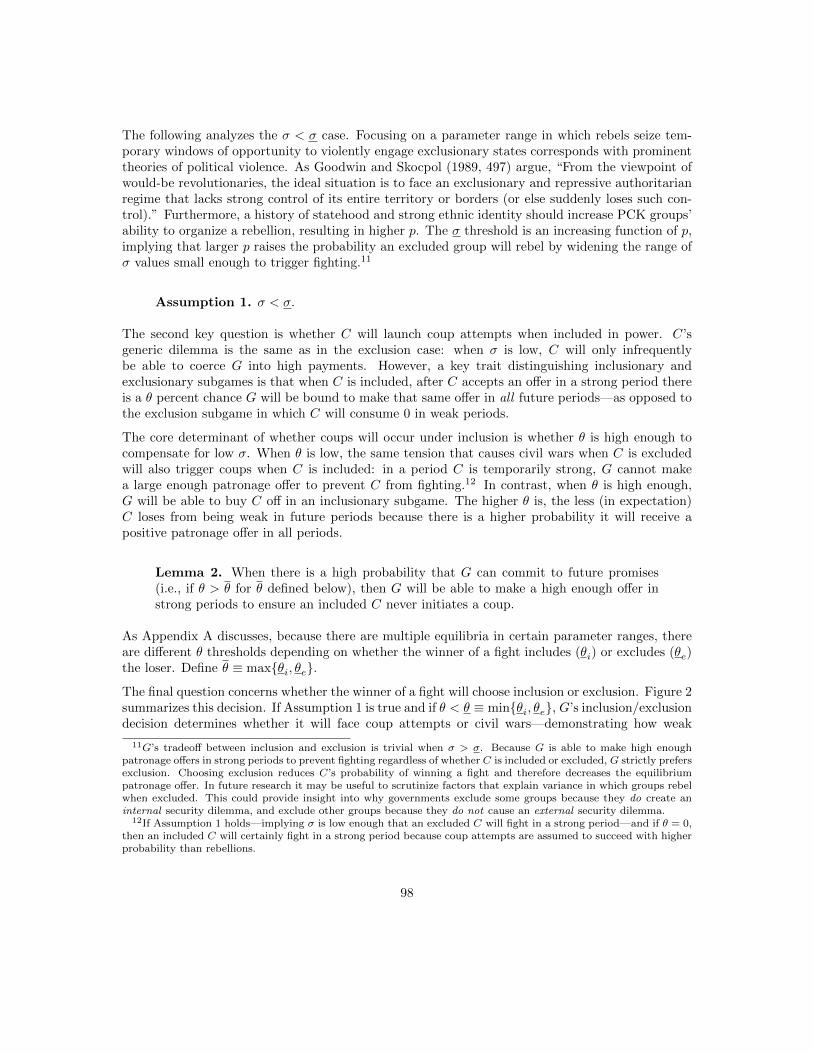
The following analyzes the σ < σ case. Focusing on a parameter range in which rebels seize tem-porary windows of opportunity to violently engage exclusionary states corresponds with prominenttheories of political violence. As Goodwin and Skocpol (1989, 497) argue, “From the viewpoint ofwould-be revolutionaries, the ideal situation is to face an exclusionary and repressive authoritarianregime that lacks strong control of its entire territory or borders (or else suddenly loses such con-trol).” Furthermore, a history of statehood and strong ethnic identity should increase PCK groups’ability to organize a rebellion, resulting in higher p. The σ threshold is an increasing function of p,implying that larger p raises the probability an excluded group will rebel by widening the range ofσ values small enough to trigger fighting.11
Assumption 1. σ < σ.
The second key question is whether C will launch coup attempts when included in power. C’sgeneric dilemma is the same as in the exclusion case: when σ is low, C will only infrequentlybe able to coerce G into high payments. However, a key trait distinguishing inclusionary andexclusionary subgames is that when C is included, after C accepts an offer in a strong period thereis a θ percent chance G will be bound to make that same offer in all future periods—as opposed tothe exclusion subgame in which C will consume 0 in weak periods.
The core determinant of whether coups will occur under inclusion is whether θ is high enough tocompensate for low σ. When θ is low, the same tension that causes civil wars when C is excludedwill also trigger coups when C is included: in a period C is temporarily strong, G cannot makea large enough patronage offer to prevent C from fighting.12 In contrast, when θ is high enough,G will be able to buy C off in an inclusionary subgame. The higher θ is, the less (in expectation)C loses from being weak in future periods because there is a higher probability it will receive apositive patronage offer in all periods.
Lemma 2. When there is a high probability that G can commit to future promises(i.e., if θ > θ for θ defined below), then G will be able to make a high enough offer instrong periods to ensure an included C never initiates a coup.
As Appendix A discusses, because there are multiple equilibria in certain parameter ranges, thereare different θ thresholds depending on whether the winner of a fight includes (θi) or excludes (θe)the loser. Define θ ≡ max{θi, θe}.
The final question concerns whether the winner of a fight will choose inclusion or exclusion. Figure 2summarizes this decision. If Assumption 1 is true and if θ < θ ≡ min{θi, θe}, G’s inclusion/exclusiondecision determines whether it will face coup attempts or civil wars—demonstrating how weak
11G’s tradeoff between inclusion and exclusion is trivial when σ > σ. Because G is able to make high enoughpatronage offers in strong periods to prevent fighting regardless of whether C is included or excluded, G strictly prefersexclusion. Choosing exclusion reduces C’s probability of winning a fight and therefore decreases the equilibriumpatronage offer. In future research it may be useful to scrutinize factors that explain variance in which groups rebelwhen excluded. This could provide insight into why governments exclude some groups because they do create aninternal security dilemma, and exclude other groups because they do not cause an external security dilemma.
12If Assumption 1 holds—implying σ is low enough that an excluded C will fight in a strong period—and if θ = 0,then an included C will certainly fight in a strong period because coup attempts are assumed to succeed with higherprobability than rebellions.
98
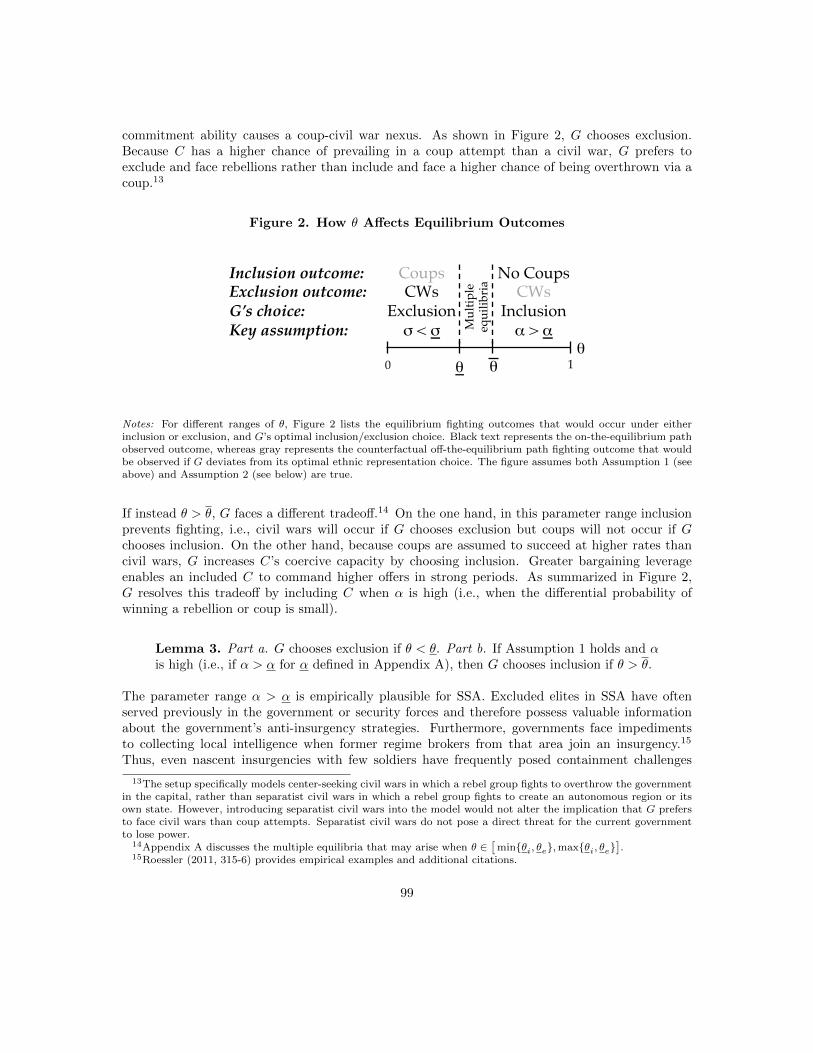
commitment ability causes a coup-civil war nexus. As shown in Figure 2, G chooses exclusion.Because C has a higher chance of prevailing in a coup attempt than a civil war, G prefers toexclude and face rebellions rather than include and face a higher chance of being overthrown via acoup.13
Figure 2. How θ Affects Equilibrium Outcomes
Coups!CWs!
Exclusion!σ < σ
θ θ! 1!0!
Inclusion outcome:!Exclusion outcome:!G’s choice:!Key assumption:!
No Coups!CWs!
Inclusion!α > α M
ultip
le!
equi
libria
θ!
Notes: For different ranges of θ, Figure 2 lists the equilibrium fighting outcomes that would occur under eitherinclusion or exclusion, and G’s optimal inclusion/exclusion choice. Black text represents the on-the-equilibrium pathobserved outcome, whereas gray represents the counterfactual off-the-equilibrium path fighting outcome that wouldbe observed if G deviates from its optimal ethnic representation choice. The figure assumes both Assumption 1 (seeabove) and Assumption 2 (see below) are true.
If instead θ > θ, G faces a different tradeoff.14 On the one hand, in this parameter range inclusionprevents fighting, i.e., civil wars will occur if G chooses exclusion but coups will not occur if Gchooses inclusion. On the other hand, because coups are assumed to succeed at higher rates thancivil wars, G increases C’s coercive capacity by choosing inclusion. Greater bargaining leverageenables an included C to command higher offers in strong periods. As summarized in Figure 2,G resolves this tradeoff by including C when α is high (i.e., when the differential probability ofwinning a rebellion or coup is small).
Lemma 3. Part a. G chooses exclusion if θ < θ. Part b. If Assumption 1 holds and αis high (i.e., if α > α for α defined in Appendix A), then G chooses inclusion if θ > θ.
The parameter range α > α is empirically plausible for SSA. Excluded elites in SSA have oftenserved previously in the government or security forces and therefore possess valuable informationabout the government’s anti-insurgency strategies. Furthermore, governments face impedimentsto collecting local intelligence when former regime brokers from that area join an insurgency.15
Thus, even nascent insurgencies with few soldiers have frequently posed containment challenges
13The setup specifically models center-seeking civil wars in which a rebel group fights to overthrow the governmentin the capital, rather than separatist civil wars in which a rebel group fights to create an autonomous region or itsown state. However, introducing separatist civil wars into the model would not alter the implication that G prefersto face civil wars than coup attempts. Separatist civil wars do not pose a direct threat for the current governmentto lose power.
14Appendix A discusses the multiple equilibria that may arise when θ ∈[
min{θi, θe},max{θi, θe}].
15Roessler (2011, 315-6) provides empirical examples and additional citations.
99
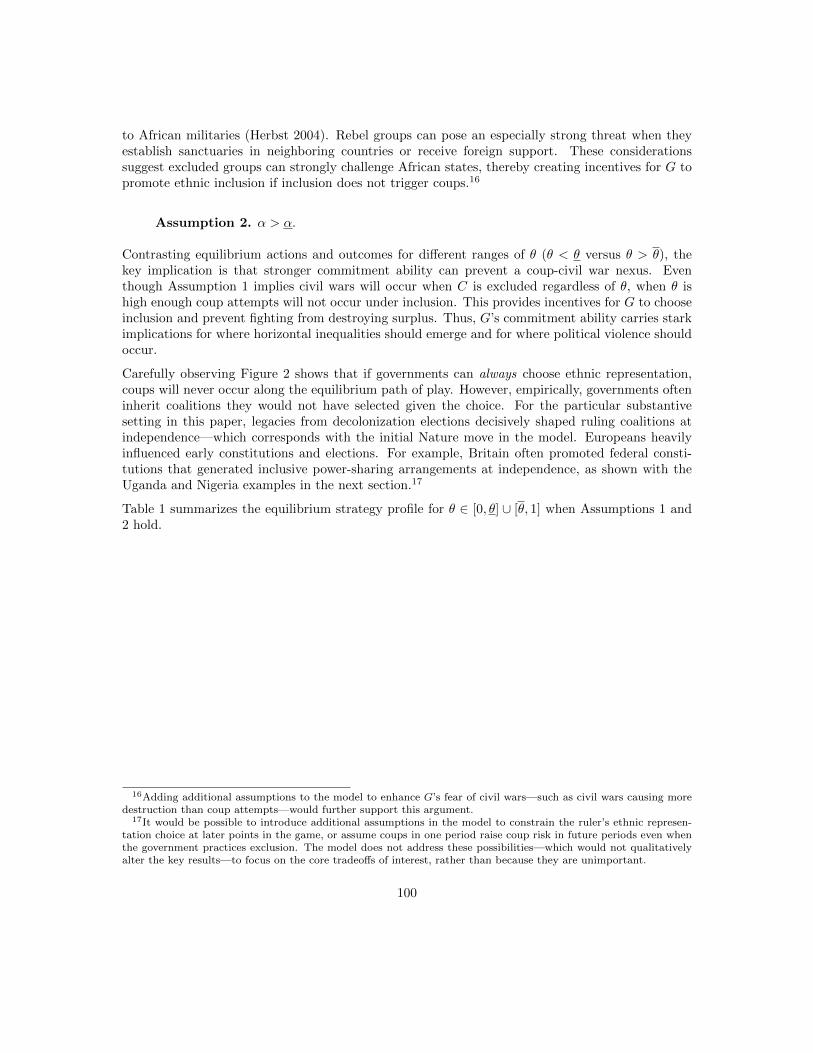
to African militaries (Herbst 2004). Rebel groups can pose an especially strong threat when theyestablish sanctuaries in neighboring countries or receive foreign support. These considerationssuggest excluded groups can strongly challenge African states, thereby creating incentives for G topromote ethnic inclusion if inclusion does not trigger coups.16
Assumption 2. α > α.
Contrasting equilibrium actions and outcomes for different ranges of θ (θ < θ versus θ > θ), thekey implication is that stronger commitment ability can prevent a coup-civil war nexus. Eventhough Assumption 1 implies civil wars will occur when C is excluded regardless of θ, when θ ishigh enough coup attempts will not occur under inclusion. This provides incentives for G to chooseinclusion and prevent fighting from destroying surplus. Thus, G’s commitment ability carries starkimplications for where horizontal inequalities should emerge and for where political violence shouldoccur.
Carefully observing Figure 2 shows that if governments can always choose ethnic representation,coups will never occur along the equilibrium path of play. However, empirically, governments ofteninherit coalitions they would not have selected given the choice. For the particular substantivesetting in this paper, legacies from decolonization elections decisively shaped ruling coalitions atindependence—which corresponds with the initial Nature move in the model. Europeans heavilyinfluenced early constitutions and elections. For example, Britain often promoted federal consti-tutions that generated inclusive power-sharing arrangements at independence, as shown with theUganda and Nigeria examples in the next section.17
Table 1 summarizes the equilibrium strategy profile for θ ∈ [0, θ] ∪ [θ, 1] when Assumptions 1 and2 hold.
16Adding additional assumptions to the model to enhance G’s fear of civil wars—such as civil wars causing moredestruction than coup attempts—would further support this argument.
17It would be possible to introduce additional assumptions in the model to constrain the ruler’s ethnic represen-tation choice at later points in the game, or assume coups in one period raise coup risk in future periods even whenthe government practices exclusion. The model does not address these possibilities—which would not qualitativelyalter the key results—to focus on the core tradeoffs of interest, rather than because they are unimportant.
100
Table 1. Equilibrium Strategy Profile
Action Government’s action Challenger’s actionInclusion/exclusion choiceafter a fight
Chooses exclusion whenθ < θ and inclusionwhen θ > θ
n.a.
C is included and θ > θ:• If St−1 = 0 and C is weak Offers xt = 0 Accepts any offer• If St−1 = 0 and C is strong Offers xt = x∗I
(by optimal choice)Accepts xt ≥ x∗I
• If St−1 = 1 and C is weak† Offers xt = x∗I(by assumption)
Accepts x∗I††
• If St−1 = 1 and C is strong† Offers xt = x∗I(by assumption)
Accepts x∗I††
C is included and θ < θ:• If St−1 = 0 and C is weak Offers xt = 0 Accepts any offer• If St−1 = 0 and C is strong Offers any xt ∈ [0, 1] Fights against any offer• If St−1 = 1 and C is weak† n.a. n.a.• If St−1 = 1 and C is strong† n.a. n.a.C is excluded:• If C is weak Offers xt = 0 Accepts any offer• If C is strong Offers any xt ∈ [0, 1] Fights against any offer
† For rows with St−1 = 1, Table 1 only contains equilibrium responses to the xI choice that occurs along the equilibriumpath, which is x∗I . Appendix A additionally describes optimal actions if G makes an off-the-equilibrium path patronageoffer that C accepts, and G subsequently is bound to make that offer in future periods.
†† Because G is bound to offer xt = x∗I , C’s information set is a singleton in which G has offered x∗I . Therefore, C’s onlychoices are {accept x∗I , reject x∗I}, which obviates specifying an acceptance rule for a continuum of possible offers.
3.3 Applying the Formal Model: Pre-Colonial Kingdomsand the Coup-Civil War Nexus in SSA
The formal model explains how low inter-ethnic commitment ability causes horizontal inequalitiesto arise, and how these inequalities contribute to a coup-civil war nexus. This section appliesthe theory to generate hypotheses about PCK groups and political violence in SSA that will beempirically assessed below. Specifically, I provide qualitative historical evidence to explain how PCKgroups’ alternative visions of statehood and history of animosity toward neighboring groups causedregional schisms and undermined creating inter-ethnic institutional ties prior to independence—resulting in low θ. Uganda and Nigeria provide examples of how, after independence, an inabilityto solve commitment problems engendered crises that resulted in coups aiming to exclude otherethnic groups and, subsequently, civil wars.
101
3.3.1 Defining Kingdoms
Vansina (1962, 325) defines an African kingdom as a “sovereign political group, headed by a singleleader who delegates authority to representatives in charge of the territorial units into which thecountry is divided.” The existence of state infrastructure distinguished kingdoms from less cen-tralized polities in which kinship ties composed the basic principle underlying authority delegation(324). Unless one embraces primordialist views of ethnic salience, at a basic level political cen-tralization enhanced recognition of a common identity. In contrast, many non-centralized groupsin pre-colonial Africa “recognized no common name and had no feeling that they belonged toa common polity,” such as the Tonga in Zambia (Colson 1969, 29; quoted in Posner 2005, 28).Below I additionally argue that hierarchical political organization heavily influenced pre-colonialinter-ethnic relationships and patterns of colonial rule.
3.3.2 How PCK Groups Undermined Inter-Ethnic Commitment AbilityPrior to Independence
Distinguishing four pre-independence periods explains how PCK groups’ alternative visions ofstatehood and history of animosity toward neighboring groups—which stemmed from politicalcentralization—resulted in low θ at independence. These periods include pre-colonial, onset ofcolonial rule, pre-1945 colonial, and post-1945 decolonization. The analysis treats effects fromthese epochs as reinforcing, rather than trying to isolate the effect of each distinct period. In thissense, focusing on a pre-colonial legacy does not obviate the importance of the colonial period,which is instead theorized to be a crucial mediating factor. To avoid confusion, all countries arereferred to by their contemporary name rather than colonial or other historical names.
Hostile Pre-Colonial Relations
SSA exhibits considerable variance with regard to the extent and type of pre-colonial relationshipsamong different ethnic groups later placed into the same colony. Whereas many closely locatedgroups interacted seldomly prior to colonization,18 PCK groups frequently experienced acrimoniousrelations with their neighbors. Reid (2012) argues Africa experienced a military revolution duringthe 19th century that enlarged the scale and vision of political violence in many parts of the continent(109). Centralized states were well-positioned to create the war economies needed to profit fromEuropean guns and slave trading. Some cases featured warfare between competing kingdoms. InUganda, Buganda and Bunyoro fought continuously throughout the 19th century (Tripp 2009, 44),a product of heightened competition between two states that continually adapted new militarytechnologies (Reid 2012, 116). In Benin, Dahomey—one of “the most dramatic manifestations ofthe highly competitive war economies” (Reid 2012, 114)—fought continually with the neighboringPorto Novo kingdom until France invaded in 1892 (Decalo 1990, 91).
Many PCK groups also participated in the continent’s widespread slave trade, one of the mostconsequential and destructive activities in Africa’s pre-colonial history (Nunn 2008). Examples oforganized groups raiding less developed groups for slaves include Muslim slave raids of southern
18Decalo (1998, 177) discusses Kenya.
102
animists in Chad (Decalo, 1980, 483) and Sudan that created “a deep hatred for northerners”(Ofcansky 1992), Merina raids of coastal peoples in Madagascar (Minorities at Risk “Merina”2006), and Bambara raids of Berbers and Arabs in Mali (Krings 1995, 58).
Violent Colonization Hardens Ethnic Identity
Between the Berlin Conference of 1884-5 and the turn of the century, European colonizers con-quered most of the African continent. This process frequently resulted in violence—especially whenEuropeans faced a centralized state that could defend itself. Whereas 46% of PCK groups foughtat least one war to resist colonization, less than 2% of non-PCK groups did. Hargreaves’ (1969)argument about West African states highlights how these wars contributed to heightened ethnicidentity and an alternative vision of statehood. Although every centralized state attempted tobargain with Europeans, all possessed interests similar to a “rudimentary ‘national cause”’ (206)they would defend by revolting. Resisting imperialism strengthened this (sub)national vision andfacilitated stronger ethnic identities that survived colonial rule (216).
Indirect Colonial Rule Through PCK Groups
Colonial rule perpetuated pre-colonial differences in statehood. Colonizers often ruled indirectlythrough PCK groups—in some cases as a de facto autonomous colony—which further differentiatedthem from other groups. This either created or reinforced the regional schisms that impacteddecolonization party formation.
Across the region, minimal European presence in most colonies necessitated heavy reliance onAfricans to administer local affairs (Kirk-Greene 1980; Berry 1992). Indirect rule required localhierarchies able to collect taxes, regulate land, and enforce laws. Considerable scholarship charac-terizes European colonial rule mainly in terms of how Europeans frequently “invented tradition”by promoting chiefs in previously acephalous communities and granting them widespread despoticpowers (Ranger 1983; Mamdani 1996).
Although informative, however, general arguments about inventing tradition tend not to considerthe vast heterogeneity in pre-colonial polities (Gordon 2005). Groups organized as pre-colonialkingdoms required considerably less European intervention to regulate their own affairs, creatingcontinuity between pre-colonial and colonial political authority. Consequently, the privileged statusof hierarchically organized groups hardened ethnic differences. For example, “the special status ofthe Buganda in Uganda was the most important legacy of the colonial era.” Their founding treatywith Britain in 1900 “appeared to the Baganda as in some sense at least an agreement betweenequals” (Rothchild and Rogin 1966, 341). Therefore, Buganda’s “integration within the rest ofUganda posed serious problems first to colonial officials and subsequently to nationally-orientedAfrican politicians [because] Buganda could not be dethroned from its dominant position withoutseriously compromising the viability of Uganda as a whole” (Doornbos 1977, 241).
The trend of ruling indirectly through pre-colonial kingdoms is most pronounced in British colonies.19
19Although it may seem surprising that colonizers tended to rely on groups they fought while establishing colonialrule, Europeans often effectively enforced compliance—backed by the threat of force—by replacing intransigent rulerswith more pliable ones, as with the Ashanti in Ghana (Hargreaves 1969, 212). Furthermore, Europeans often provoked
103
Prominent examples range from Ashanti in Ghana (Boone 2003, 144-77), Buganda in Uganda(Rothchild and Rogin 1966, 341-51), Hausa and Fulani in Nigeria (Sklar and Whitaker 1966, 19),Lozi in Zambia (Caplan 1970), riverine Arabs in Sudan (Sharkey 2008, 28-33), and Sotho in Lesotho(Weisfelder 1977). And although France attempted to flatten the Muslim empires that confrontedthem at the onset of colonization (Hargreaves 1969, 200-1), they too realized the necessity of collab-oration (Mamdani 1996, 83). France ruled indirectly through PCK groups in colonies such as Benin(Thompson 1963, 169), Burkina Faso (Hargreaves 1969, 204), and Chad (Nolutshungu 1996, 28-9).Belgian indirect rule through PCK groups hardened distinctions between the ruling class Tutsi andmajority Hutu in Rwanda and Burundi by mandating ethnic designation in the census and requiringidentity cards for all subjects (Young 2006, 309). Ethiopia avoided colonization except for a briefperiod of Italian rule, which placed its monarch at the center of politics.
PCK Groups Undermine Inter-Ethnic Party Creation
Although the “imperial peace” imposed by Europeans (e.g., Bates 2014) mitigated inter-ethnicviolence during colonial rule, latent differences between PCK and non-PCK groups—includingdistinct visions of statehood and a pre-colonial history of ethnic antagonism—caused institutionaldivergence during the post-1945 decolonization era. Electoral reforms after World War II providedthe first major spark for creating inter-ethnic institutions in SSA. However, PCK groups frequentlyorganized regionally oriented parties rather than mass nationalist parties. In addition to legaciesfrom pre-colonial political centralization, the royal line itself often provided an important organizingdevice.
In stark cases, a PCK group attempted to achieve a separate independence from the remainder of itscolony. The Baganda in Uganda cited their distinct status in the Uganda Agreement of 1900 whentrying to gain their own state, stemming from a desire to “safeguard the traditions, Kabakaship[kingship], and the customs of Buganda in an independent Uganda” (Kyeyune and Nsibambi 1962).As a result, “the power of traditional groups . . . precluded the success of a centralized, ideologicalmass party” (Rothchild and Rogin 1966, 389). Instead, supporters of Buganda’s king created theKabaka Yekka (KY; meaning “king only”) party after the king led a highly successful boycott of the1961 Legislative Council elections in which less than 2% of eligible Baganda voted. KY provided“a practical avenue through which Buganda could enter national politics and yet preserve its ownautonomy and unity” (358). The ethnically rooted party received 38% of total votes in the final pre-independence parliamentary elections (Schmidt 1999), enabling the Kabaka to become Uganda’sfirst post-independence president.
Even for PCK groups that did not attempt to gain their own state, regional schisms that hademerged during the pre-colonial or early colonial eras often produced locally oriented parties. TheNorthern People’s Congress (NPC) in Nigeria was led by an aspiring sultan of Sokoto, and theparty’s platform emphasized “the integrity of the north [and] its traditions” whereas “support forbroad Nigerian concerns occupied a clear second place” (Lovejoy 1992). Benin’s three hegemonic re-gional parties split among the former Dahomey kingdom—whose leader descended from the formerroyal house (Hargreaves 1969, 216)—Porto Novo kingdom, and north (Decalo 1973). A north/south
small wars to prove their military might prior to installing indirect rule. One historian has argued that Britain’sconflict with northern Nigerian emirs in 1903 “was due less to intransigent resistance by Sultan Attahiru than toLugard’s determination that, before the British could utilize the Fulani as a ‘ruling caste,’ the military basis ofBritish suzerainty should be asserted by conquest” (Hargreaves 1969, 211).
104
divide also pervaded politics in Chad (Nolutshungu 1996) and Sudan (Ofcansky 1992). In Mada-gascar, “Since the 1950s political development has been influenced by conflict structures [betweenMerina and coastal groups] that trace back to the 19th century but were reinforced by colonialpolitics of ‘divide and rule.”’ (Thibaut 1999).
3.3.3 How Weak Inter-Ethnic Commitment Ability Caused PoliticalViolence After Independence
The formal model implies that if the challenger’s contemporaneous coercive strength heavily impactsthe patronage offers it will receive, portended future power shifts will cause political violence. Whenpolitical bargaining occurred after independence in SSA, weak inter-ethnic commitment abilitycaused by PCKs transformed normal political events such as referenda or census counts—whichshifted the distribution of power—into political crises because the government had low ability tocommit to future promises. Examples from Uganda and Nigeria illustrate how low θ can underminepeaceful bargaining.
Uganda exhibited weak inter-ethnic commitment ability at independence. As described above,through reinforcing historical epochs that included Baganda unwillingness to join a nationally ori-ented party, due to British intervention at independence in 1963 an “alliance of complete opposites”(Decalo 1990, 152) between Buganda’s KY and Milton Obote’s (a Langi, non-PCK group) UPCparty governed the country. “It is hard to determine at what stage Prime Minister Obote madeup his mind to confront the Kabaka and the Kingdom of Buganda . . . but it is tempting, from thesmall amount of evidence available and his careful preparing of the ground, to think that he hadintended it all along” (Dinwiddy 1981, 514). These are the type of machinations we would expect ina country with low θ but in which the ruler, because of externally imposed circumstances, inheritsan ethnically inclusionary ruling coalition.
Three key events occurred in 1964 that—at least temporarily—shifted power in favor of Obote(Young 1977, 226).20 First, UPC gained an absolute majority in parliament. Second, a short-lived military mutiny that Britain helped to quell enabled Obote to strengthen his control over thesecurity forces. The third event related to historical inter-kingdom disputes. To provide background,in 1900 Buganda became the first group in contemporary Uganda to sign a treaty with Britain.This treaty awarded territory to Buganda that a British-Baganda alliance had recently capturedfrom rival kingdom Bunyoro (also incorporated into Uganda). Britain’s contentious decision tostrip Bunyoro of its culturally and historically significant “Lost Counties” provided an opportunityfor Obote (G) to undermine Buganda (C) by allowing a referendum to occur. Residents of the LostCounties voted to join Bunyoro. This vote portended a shift in the distribution of power—similarto any election or referendum—but the depth of weak inter-ethnic commitment ability raised thestakes. “As President, the Kabaka should have ratified the transfer; as Kabaka [i.e., king], such anact was an impossibility” [emphasis in original] (Dinwiddy 1981, 514) because the transfer woulderode the king’s support from his main constituency. The Lost Counties referendum soon “shifted
20The model assumes shifts in the distribution of power are exogenous. When examining empirical cases, however,very few events that shift the distribution of power contain no element of choice. Instead, it may be useful to thinkabout opportunities to shift power as arising exogenously, followed by an actor’s choice regarding whether to seizethe opportunity to shift power in their favor. Based on the analysis above, we would expect actors to seize theseopportunities when commitment ability is low—because payments will be more closely tied to each actors’ share ofpower.
105
the balance of power back from Buganda to the central government” (155). Capitalizing on hisimproved bargaining position, Obote arrested key Baganda ministers before they could appeal forBritish military assistance. The crisis culminated in 1966 when Obote militarily suppressed aBaganda secession attempt, staged a coup to become the undisputed head of state, and unilaterallyterminated the Baganda monarchy (Tripp 2009, 45). After continued turmoil at the center includingIdi Amin’s kleptocratic reign in the 1970s, Baganda participated in civil wars that removed Aminand later that removed Obote after he had become president for a second time.
Nigeria also inherited an ethnically inclusive coalition at independence despite weak inter-ethniccommitment ability and also experienced volatility.21 Nigeria’s federal formula—a legacy of Fred-erick Lugard’s invention of the Native Authority System for the Sokoto Caliphate in the north—dictated that each of the country’s three regions would be apportioned seats in the national legisla-ture based on population share. As a result, the constitutionally mandated dicennial census in 1962carried huge consequences for the distribution of power.22 Despite conducting the census twice, ex-perts estimated the total count was wildly inflated and Igbo (non-PCK group, C) leaders publiclycharged the northern government (G) with fraud. Consistent with actions to prevent adverse powershifts in weak commitment environments, Igbo officers reacted to these events by leading a suc-cessful coup attempt in 1966. Despite stating they aimed to create a unitary government withoutethnopolitical bias, deep-seated regional cleavages caused northern leaders to perceive the coup “notso much as an effort to impose a unitary government as a plot by the Igbo to dominate Nigeria.”This led to a northern-dominated countercoup in 1966, followed by political exclusion of Igbo andan Igbo secession attempt in 1967.
3.3.4 Hypotheses
The analysis below distinguishes among three types of groups: (1) PCK groups, (2) non-PCKgroups in a country that has at least one PCK group (i.e., non-PCK groups in a PCK country),and (3) groups in non-PCK countries. Ceteris paribus, the model implies PCK groups and non-PCKgroups in PCK countries should have higher rates of coups and civil wars, and lower rates of politicalinclusion, than groups in non-PCK countries. It is crucial to distinguish between two categoriesof non-PCK groups because the model implies there are within-country spillover effects from PCKgroups to non-PCK groups within their country. For example, non-PCK Langi in Uganda shouldbe more likely to participate in political violence than non-PCK Kikuyu in Kenya because Ugandacontains PCK groups whereas Kenya does not.
Several caveats to the ceteris paribus condition must be considered before stating the core hy-potheses. There is state dependence in the model conditional on which group inherits control ofthe government at the outset of the game via the Nature move. For groups in PCK countries,the magnitude of the effects should be conditioned by whether PCK groups or non-PCK groupstended to be more more successful at gaining control of the state at independence, about which themodel is agnostic. If the higher organizational capacities of PCK groups enabled them to capturethe state more often, then PCK groups’ inclusion rates should be higher than those of non-PCK
21The references in this paragraph come from Lovejoy (1992).22Supporting this claim, “The Northern Region’s political strength, marshaled by the NPC, had arisen in large
measure from the results of the 1952-53 census, which had identified 54 percent of the country’s population in thatarea.”
106
groups within their country—and, consequently, PCK groups’ coup rates should also be higherwhereas civil war propensity should be lower than those of non-PCK groups within their country.In contrast, the opposite would be true if non-PCK groups in PCK countries tended to build broadcoalitions during the decolonization period to neutralize PCK groups. Still, ceteris paribus, themodel implies the following hypotheses.
H1. PCK groups and non-PCK groups in PCK countries should be included in theruling coalition less frequently than groups in non-PCK countries.
H2. PCK groups and non-PCK groups in PCK countries should participate in militarycoups more frequently than groups in non-PCK countries.
H3. PCK groups and non-PCK groups in PCK countries should participate in newcivil wars more frequently than groups in non-PCK countries.
3.4 Data and Research Design
The remainder of the paper empirically assesses these hypotheses. This section presents the sampleand data, followed by results in the next section.
3.4.1 Unit of Analysis and Time Period
The unit of analysis is ethnic group-years, with ethnic groups coded by the Ethnic Power Relations(EPR) database (Cederman, Wimmer, and Min 2010). This dataset codes politically relevant ethnicgroups in all country-years since either 1945 or their country’s year of independence. The mainadvantage of this dataset over others that provide ethnic group-level data, such as Minorities at Risk,is that EPR provides data points for all politically relevant ethnic groups, not just discriminatedminorities. A potential drawback is that EPR does not provide data for countries in which ethnicityis judged politically irrelevant. This excludes from the analysis countries such as Lesotho andSwaziland that have only one effective ethnic group—but did have a pre-colonial kingdom.23 Asdiscussed in Appendix B, however, the available sample does match a key implied scope conditionof the model: multi-ethnic political competition.
Outcomes are measured for each ethnic group from independence until 1989. Most SSA countriesexperienced independence for about three decades prior to the end of the Cold War. Pre-coloniallegacies should exert their strongest effects during this initial post-independence period becauseof tighter temporal proximity to the hypothesized cause and because political dynamics changedconsiderably in SSA after 1989 in at least two important ways. First, Western governments gainedincreased leverage over governments heavily dependent on their foreign aid after the Cold War ended(Levitsky and Way 2010). Among other effects, Western governments have undermined incentives
23More generally, the sample here excludes all ethnic group-years coded by EPR as “politically irrelevant.”
107
to stage coups by heavily discouraging military rule.24 Second, Benin’s national conference in 1990initiated a regional trend of elections that are at least semi-competitive. Although this patternresembles SSA’s immediate post-independence political situation, the important difference is thatPCK groups heavily influenced electoral cleavages during the decolonization era whereas threedecades of independence—often accompanied by predatory and authoritarian rule and economicmismanagement in both PCK and non-PCK countries—engendered new cleavages during SSA’spost-Cold War wave of liberalization.
3.4.2 Main Explanatory Variable: Pre-Colonial Kingdoms
The theory posits PCK groups created political tensions after independence by causing violent pre-colonial interactions and by influencing the calculus of colonial officials. Unfortunately, sparse dataposes considerable difficulties for measuring this concept directly, and reading individual countryhistories reveals a myriad of pre-colonial political organizations that historians have labeled as“kingdoms” or related terms.25
To address these issues I constructed a new dataset of pre-colonial kingdoms in SSA. I followeda two-step procedure that involved (1) compiling a list of candidate states and (2) coding whichof these polities were indeed organized as hierarchical kingdoms alongside matching the kingdomswith EPR ethnic groups. First, to identify possible kingdoms I consulted African historical atlasesand survey history books. Specifically, I analyzed continent-wide maps of states in Africa on eitherthe eve of the European Scramble for Africa (roughly, 1880s) or the entire 19th century.26 Althoughnone of the sources stated explicit coding rules for how they selected which African states to includein their map, I consulted 11 different sources to minimize the likelihood of omitting any importantkingdoms. Second, for all 82 states identified in step 1, I consulted Encyclopaedia Britannica (EB)entries and additional secondary sources for evidence of political centralization. Step 2 yielded 27EPR groups belonging to pre-colonial kingdoms.
Table 2 lists all the PCK groups and their countries. Countries that contain at least one PCKgroup will be referred to as “PCK countries.”
24Marinov and Goemans (2013) report that 72% of successful coups since 1991 have been followed by electionswithin the next five years, compared to 27% prior to 1991. Thus, in the post-Cold War era, juntas have facedconsiderable obstacles to remaining in power even after succeeding in a coup attempt.
25Warner (2001, 70) elaborates upon the confusing and inconsistent nomenclature that scholars have used todescribe pre-colonial African states.
26Appendix C discusses the coding rules and sources in more detail.
108
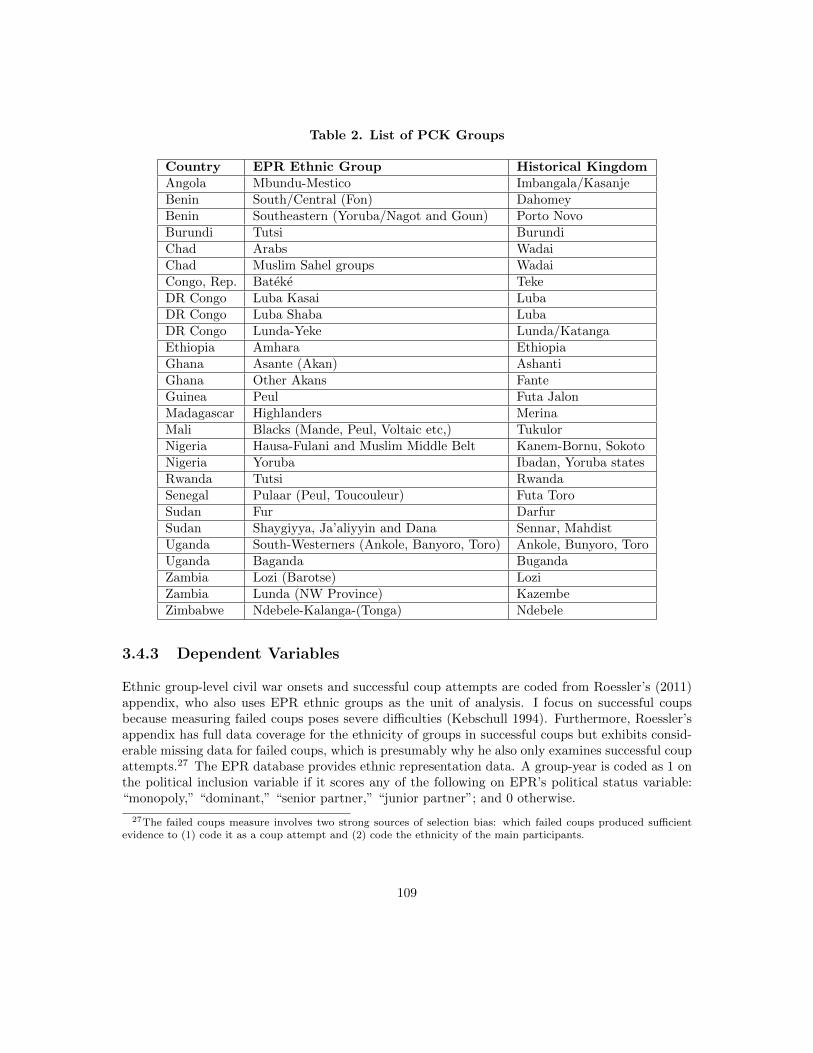
Table 2. List of PCK Groups
Country EPR Ethnic Group Historical KingdomAngola Mbundu-Mestico Imbangala/KasanjeBenin South/Central (Fon) DahomeyBenin Southeastern (Yoruba/Nagot and Goun) Porto NovoBurundi Tutsi BurundiChad Arabs WadaiChad Muslim Sahel groups WadaiCongo, Rep. Bateke TekeDR Congo Luba Kasai LubaDR Congo Luba Shaba LubaDR Congo Lunda-Yeke Lunda/KatangaEthiopia Amhara EthiopiaGhana Asante (Akan) AshantiGhana Other Akans FanteGuinea Peul Futa JalonMadagascar Highlanders MerinaMali Blacks (Mande, Peul, Voltaic etc,) TukulorNigeria Hausa-Fulani and Muslim Middle Belt Kanem-Bornu, SokotoNigeria Yoruba Ibadan, Yoruba statesRwanda Tutsi RwandaSenegal Pulaar (Peul, Toucouleur) Futa ToroSudan Fur DarfurSudan Shaygiyya, Ja’aliyyin and Dana Sennar, MahdistUganda South-Westerners (Ankole, Banyoro, Toro) Ankole, Bunyoro, ToroUganda Baganda BugandaZambia Lozi (Barotse) LoziZambia Lunda (NW Province) KazembeZimbabwe Ndebele-Kalanga-(Tonga) Ndebele
3.4.3 Dependent Variables
Ethnic group-level civil war onsets and successful coup attempts are coded from Roessler’s (2011)appendix, who also uses EPR ethnic groups as the unit of analysis. I focus on successful coupsbecause measuring failed coups poses severe difficulties (Kebschull 1994). Furthermore, Roessler’sappendix has full data coverage for the ethnicity of groups in successful coups but exhibits consid-erable missing data for failed coups, which is presumably why he also only examines successful coupattempts.27 The EPR database provides ethnic representation data. A group-year is coded as 1 onthe political inclusion variable if it scores any of the following on EPR’s political status variable:“monopoly,” “dominant,” “senior partner,” “junior partner”; and 0 otherwise.
27The failed coups measure involves two strong sources of selection bias: which failed coups produced sufficientevidence to (1) code it as a coup attempt and (2) code the ethnicity of the main participants.
109
3.4.4 Research Design and Control Variables
Although the statistical results are not based on natural experimental variation, I examine thePCK “treatment” assignment process to identify the most likely confounding effects. Furthermore,many prominent explanations of political violence can be eliminated because they are potentiallyendogenous to PCK. Furthermore, a coherent alternative explanation would need to explain awaythe correlation between PCK and all three outcomes.
Examining the Treatment Assignment Process
Existing statistical and qualitative studies on Africa provide insight into why some but not otherethnic groups developed kingdoms prior to colonization, i.e., why the “treatment” was assignedto some ethnic groups but not others. Alsan (2015, 395) shows groups residing in territory withgreater tsetse fly prevalence (tsetse) tended to have lower levels of political centralization, perhapsby causing low population density (popdens; see Herbst 2000) and by eliminating the possibilityof using horses and camels to move armies and conduct large-scale trade (Colson 1969, 35; Reid2012, 2). Related, Putterman (2008) shows in a global sample that territories experiencing earliertransitions to agricultural production (agtransition) tended to experience higher levels of statehoodin the second millennium. Fenske (2014) provides evidence that states were more likely to arise inareas with higher ecological diversity (ecodiv) because they could more easily trade across ecologicalregions.
Violence also affected state formation. Although slave wars destroyed historical states such as theKongo kingdom (Nunn 2008, 143) and could have also adversely affected state formation throughincreasing ethnic diversity (Whatley and Gillezeau 2011), states able to monopolize trade routesbenefited greatly (Lloyd 1965, 70; Reid 2014, 398) and kingdoms such as the Ashanti went intodecline after West African slave exports decreased (Hopkins 2000, 314-318). Slave exports alsoyielded European firearms, which facilitated violent expansion in the “long” 19th century (Reid2012, 107-146). Therefore, it is important to account for a group’s distance from major ports inthe Atlantic or Indian Ocean slave trade (min slavedistance), which affected its propensity for slavetrading. Finally, Besley and Reynal-Querol (2014) and Dincecco et al. (2014) demonstrate a strongpositive relationship between historical and modern wars in Africa. Applying Eurocentric theorieson wars and state formation suggests histwar may also be important in Africa.28
PCK may also be correlated with colonial-era factors by affecting colonial border formation, whichin turn impacted treatment assignment by categorizing ethnic groups into different national units.Although qualitative evidence suggests no clear relationship between PCK and identity of thecolonizer, this is important to control for because different strategies of colonial rule, stances towarddecolonization, and willingness to prop up friendly post-colonial regimes affected all three dependentvariables (Fearon and Laitin 2003, 86; Blanton, Mason, and Athow 2001; Wucherpfennig, Hunziker,and Cederman 2012). Pre-colonial political centralization also likely affected a group’s share of thenational population (groupsize) and its distance from the capital (dist capital), which have beenstudied as causes of civil war.
28Regarding research design, it is unfortunate that none of these factors come close to meeting the main instru-mental variables criterion of being independent from the outcome except by affecting the treatment.
110
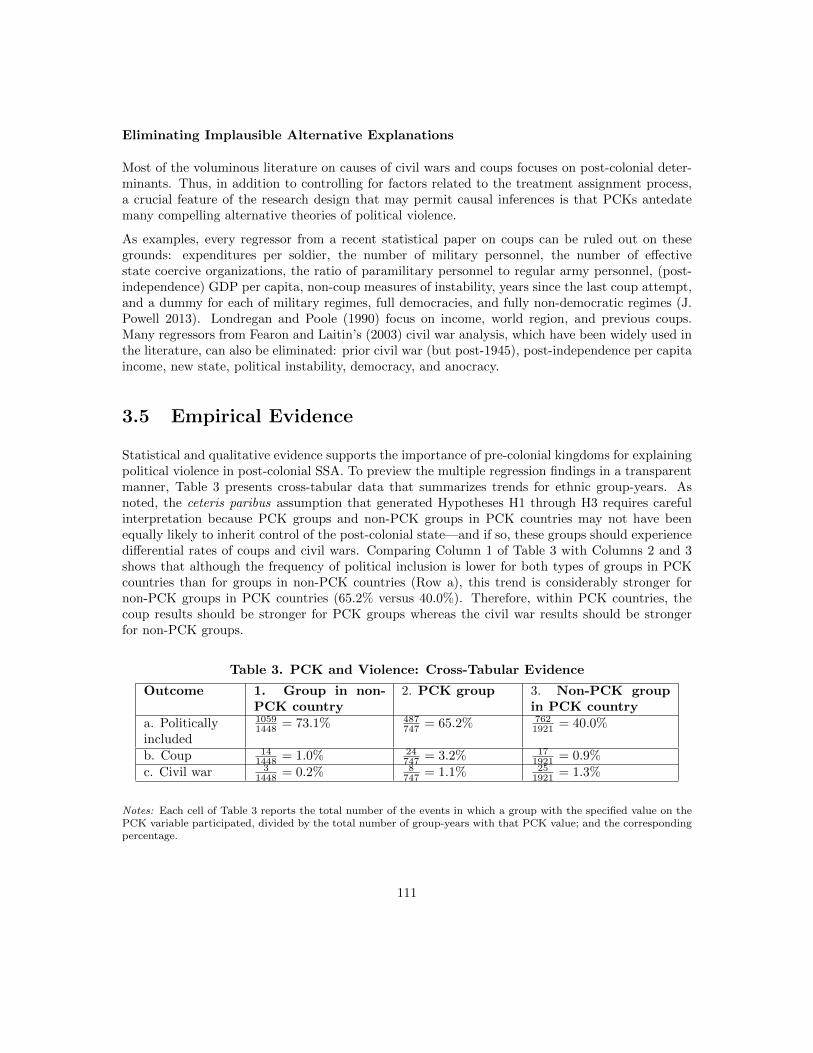
Eliminating Implausible Alternative Explanations
Most of the voluminous literature on causes of civil wars and coups focuses on post-colonial deter-minants. Thus, in addition to controlling for factors related to the treatment assignment process,a crucial feature of the research design that may permit causal inferences is that PCKs antedatemany compelling alternative theories of political violence.
As examples, every regressor from a recent statistical paper on coups can be ruled out on thesegrounds: expenditures per soldier, the number of military personnel, the number of effectivestate coercive organizations, the ratio of paramilitary personnel to regular army personnel, (post-independence) GDP per capita, non-coup measures of instability, years since the last coup attempt,and a dummy for each of military regimes, full democracies, and fully non-democratic regimes (J.Powell 2013). Londregan and Poole (1990) focus on income, world region, and previous coups.Many regressors from Fearon and Laitin’s (2003) civil war analysis, which have been widely used inthe literature, can also be eliminated: prior civil war (but post-1945), post-independence per capitaincome, new state, political instability, democracy, and anocracy.
3.5 Empirical Evidence
Statistical and qualitative evidence supports the importance of pre-colonial kingdoms for explainingpolitical violence in post-colonial SSA. To preview the multiple regression findings in a transparentmanner, Table 3 presents cross-tabular data that summarizes trends for ethnic group-years. Asnoted, the ceteris paribus assumption that generated Hypotheses H1 through H3 requires carefulinterpretation because PCK groups and non-PCK groups in PCK countries may not have beenequally likely to inherit control of the post-colonial state—and if so, these groups should experiencedifferential rates of coups and civil wars. Comparing Column 1 of Table 3 with Columns 2 and 3shows that although the frequency of political inclusion is lower for both types of groups in PCKcountries than for groups in non-PCK countries (Row a), this trend is considerably stronger fornon-PCK groups in PCK countries (65.2% versus 40.0%). Therefore, within PCK countries, thecoup results should be stronger for PCK groups whereas the civil war results should be strongerfor non-PCK groups.
Table 3. PCK and Violence: Cross-Tabular Evidence
Outcome 1. Group in non-PCK country
2. PCK group 3. Non-PCK groupin PCK country
a. Politicallyincluded
10591448 = 73.1% 487
747 = 65.2% 7621921 = 40.0%
b. Coup 141448 = 1.0% 24
747 = 3.2% 171921 = 0.9%
c. Civil war 31448 = 0.2% 8
747 = 1.1% 251921 = 1.3%
Notes: Each cell of Table 3 reports the total number of the events in which a group with the specified value on thePCK variable participated, divided by the total number of group-years with that PCK value; and the correspondingpercentage.
111
The tabular data support these implications. Although PCK groups are more than three times morelikely than groups in non-PCK countries to participate in successful coups, both types of non-PCKgroups participate in successful coups at roughly an equal rate. Civil war propensity is higher forboth types of groups in PCK countries than groups in non-PCK countries, although the frequencyis higher for non-PCK groups in PCK countries. Strikingly, in the time period considered, 33 group-level civil war onsets occurred in PCK countries compared to only 3 in non-PCK countries.
Table 4 provides multiple regression estimates. Column 1 includes separate fixed effects for PCKgroups and non-PCK groups in PCK countries—leaving groups in non-PCK countries as the omittedcomparison category—and includes temporal dependence controls. Column 2 additionally controlsfor three pre-colonial variables that are exogenous to PCK: tsetse fly prevalence, timing of agri-cultural transition, and distance from a major slave trade. Column 3 adds to Column 2 threepre-colonial variables whose inclusion hopefully alleviates omitted variable bias but may inducesome post-treatment bias: population density, ecological diversity, and historical wars. Column4 adds to Column 3 the colonial-era covariates, which exhibit the same concern about an omit-ted variable bias/post-treatment bias tradeoff: fixed effects for British, French, and Portuguesecolonization, the group’s share of the national population, and distance from the capital. The de-pendent variables in Panels A through C, respectively, are ethnopolitical inclusion, successful coupattempts, and civil war onsets. Panel A features standard logit models whereas Panels B and Cuse logit models developed by King and Zeng (2001) for rare events dependent variable data. Allregressions cluster standard errors by ethnic group.29
29Importantly, the models do not control for country fixed effects. Because the model predicts within-countryspillover effects of PCK groups on non-PCK groups within their country, within-country comparisons would notprovide a valid test of the formal model’s hypotheses.
112
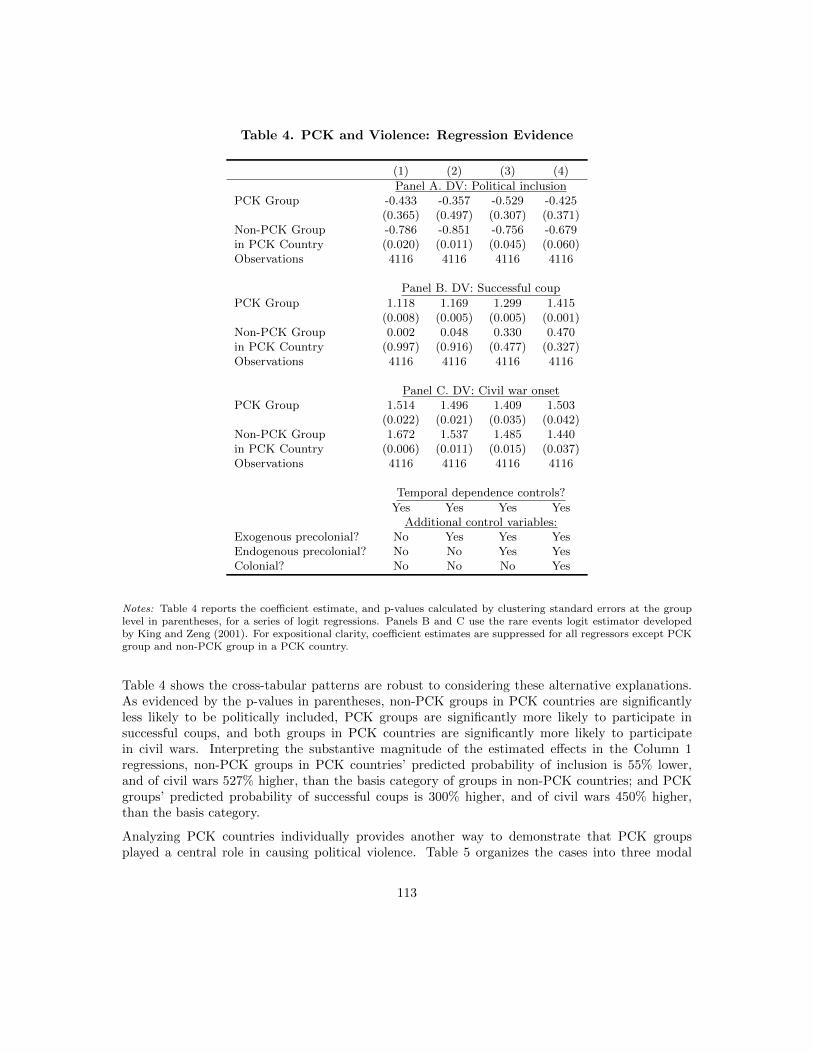
Table 4. PCK and Violence: Regression Evidence
(1) (2) (3) (4)
Panel A. DV: Political inclusionPCK Group -0.433 -0.357 -0.529 -0.425
(0.365) (0.497) (0.307) (0.371)Non-PCK Group -0.786 -0.851 -0.756 -0.679in PCK Country (0.020) (0.011) (0.045) (0.060)Observations 4116 4116 4116 4116
Panel B. DV: Successful coup
PCK Group 1.118 1.169 1.299 1.415(0.008) (0.005) (0.005) (0.001)
Non-PCK Group 0.002 0.048 0.330 0.470in PCK Country (0.997) (0.916) (0.477) (0.327)Observations 4116 4116 4116 4116
Panel C. DV: Civil war onsetPCK Group 1.514 1.496 1.409 1.503
(0.022) (0.021) (0.035) (0.042)Non-PCK Group 1.672 1.537 1.485 1.440in PCK Country (0.006) (0.011) (0.015) (0.037)Observations 4116 4116 4116 4116
Temporal dependence controls?
Yes Yes Yes YesAdditional control variables:
Exogenous precolonial? No Yes Yes YesEndogenous precolonial? No No Yes YesColonial? No No No Yes
Notes: Table 4 reports the coefficient estimate, and p-values calculated by clustering standard errors at the grouplevel in parentheses, for a series of logit regressions. Panels B and C use the rare events logit estimator developedby King and Zeng (2001). For expositional clarity, coefficient estimates are suppressed for all regressors except PCKgroup and non-PCK group in a PCK country.
Table 4 shows the cross-tabular patterns are robust to considering these alternative explanations.As evidenced by the p-values in parentheses, non-PCK groups in PCK countries are significantlyless likely to be politically included, PCK groups are significantly more likely to participate insuccessful coups, and both groups in PCK countries are significantly more likely to participatein civil wars. Interpreting the substantive magnitude of the estimated effects in the Column 1regressions, non-PCK groups in PCK countries’ predicted probability of inclusion is 55% lower,and of civil wars 527% higher, than the basis category of groups in non-PCK countries; and PCKgroups’ predicted probability of successful coups is 300% higher, and of civil wars 450% higher,than the basis category.
Analyzing PCK countries individually provides another way to demonstrate that PCK groupsplayed a central role in causing political violence. Table 5 organizes the cases into three modal
113
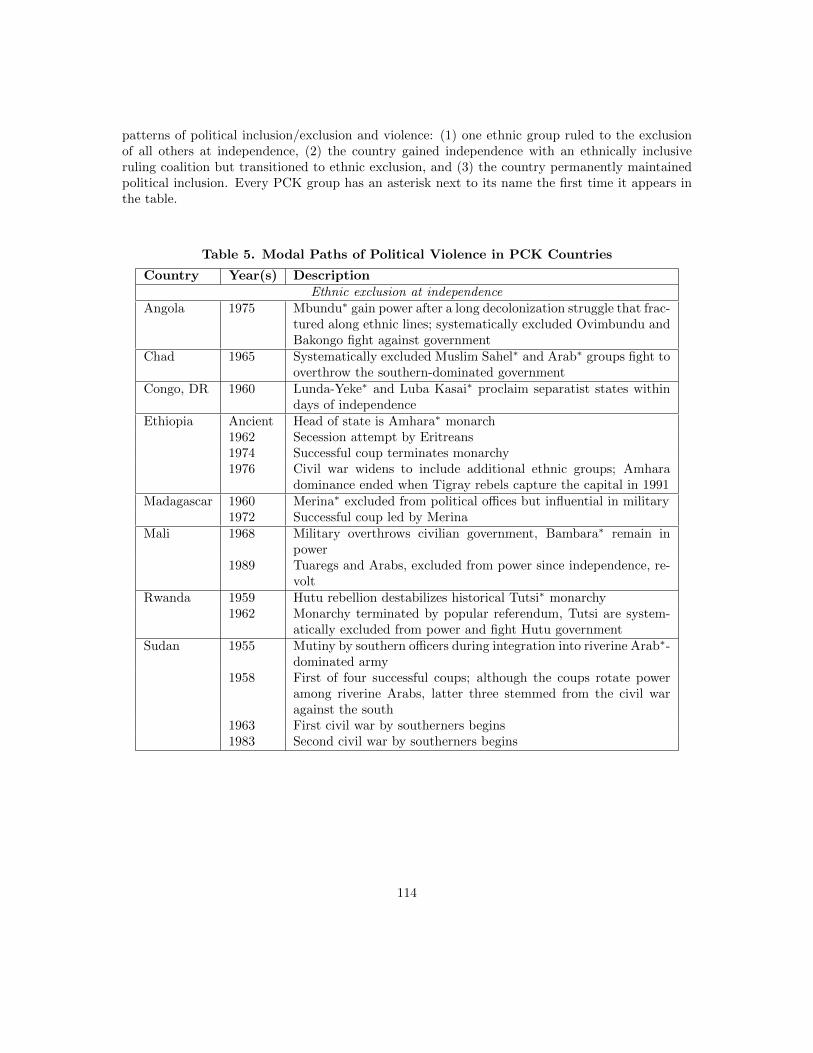
patterns of political inclusion/exclusion and violence: (1) one ethnic group ruled to the exclusionof all others at independence, (2) the country gained independence with an ethnically inclusiveruling coalition but transitioned to ethnic exclusion, and (3) the country permanently maintainedpolitical inclusion. Every PCK group has an asterisk next to its name the first time it appears inthe table.
Table 5. Modal Paths of Political Violence in PCK Countries
Country Year(s) DescriptionEthnic exclusion at independence
Angola 1975 Mbundu∗ gain power after a long decolonization struggle that frac-tured along ethnic lines; systematically excluded Ovimbundu andBakongo fight against government
Chad 1965 Systematically excluded Muslim Sahel∗ and Arab∗ groups fight tooverthrow the southern-dominated government
Congo, DR 1960 Lunda-Yeke∗ and Luba Kasai∗ proclaim separatist states withindays of independence
Ethiopia Ancient Head of state is Amhara∗ monarch1962 Secession attempt by Eritreans1974 Successful coup terminates monarchy1976 Civil war widens to include additional ethnic groups; Amhara
dominance ended when Tigray rebels capture the capital in 1991Madagascar 1960 Merina∗ excluded from political offices but influential in military
1972 Successful coup led by MerinaMali 1968 Military overthrows civilian government, Bambara∗ remain in
power1989 Tuaregs and Arabs, excluded from power since independence, re-
voltRwanda 1959 Hutu rebellion destabilizes historical Tutsi∗ monarchy
1962 Monarchy terminated by popular referendum, Tutsi are system-atically excluded from power and fight Hutu government
Sudan 1955 Mutiny by southern officers during integration into riverine Arab∗-dominated army
1958 First of four successful coups; although the coups rotate poweramong riverine Arabs, latter three stemmed from the civil waragainst the south
1963 First civil war by southerners begins1983 Second civil war by southerners begins
114
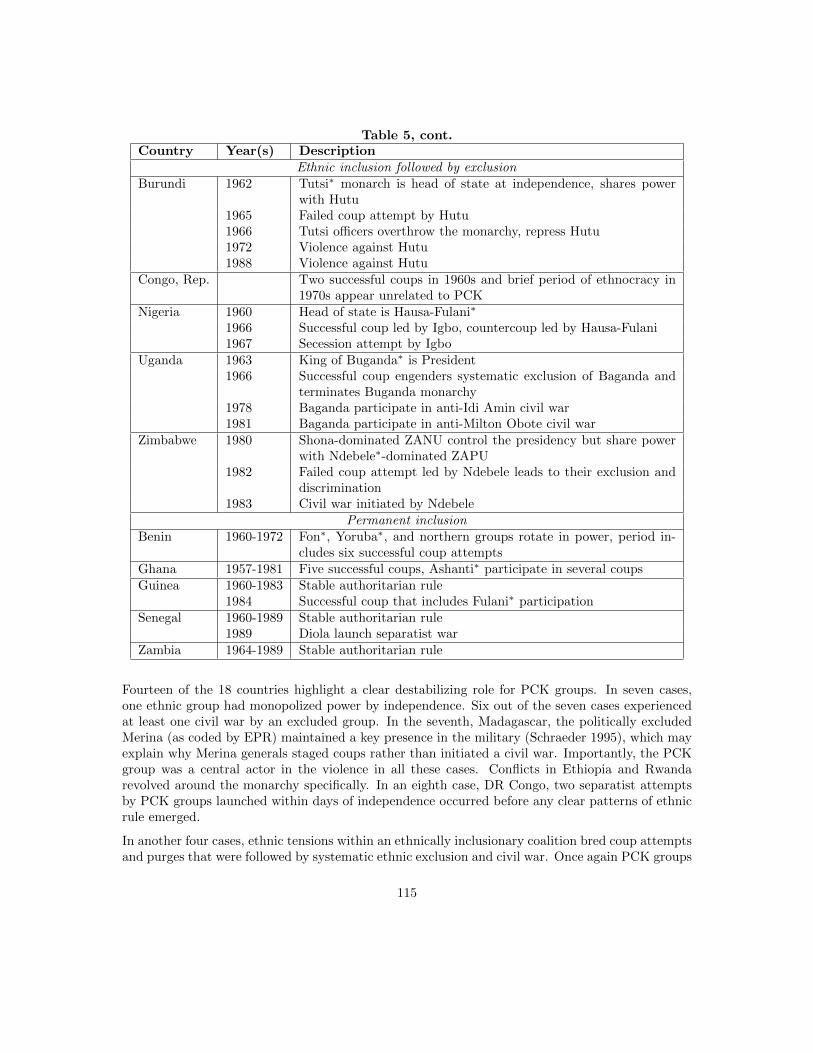
Table 5, cont.Country Year(s) Description
Ethnic inclusion followed by exclusionBurundi 1962 Tutsi∗ monarch is head of state at independence, shares power
with Hutu1965 Failed coup attempt by Hutu1966 Tutsi officers overthrow the monarchy, repress Hutu1972 Violence against Hutu1988 Violence against Hutu
Congo, Rep. Two successful coups in 1960s and brief period of ethnocracy in1970s appear unrelated to PCK
Nigeria 1960 Head of state is Hausa-Fulani∗
1966 Successful coup led by Igbo, countercoup led by Hausa-Fulani1967 Secession attempt by Igbo
Uganda 1963 King of Buganda∗ is President1966 Successful coup engenders systematic exclusion of Baganda and
terminates Buganda monarchy1978 Baganda participate in anti-Idi Amin civil war1981 Baganda participate in anti-Milton Obote civil war
Zimbabwe 1980 Shona-dominated ZANU control the presidency but share powerwith Ndebele∗-dominated ZAPU
1982 Failed coup attempt led by Ndebele leads to their exclusion anddiscrimination
1983 Civil war initiated by NdebelePermanent inclusion
Benin 1960-1972 Fon∗, Yoruba∗, and northern groups rotate in power, period in-cludes six successful coup attempts
Ghana 1957-1981 Five successful coups, Ashanti∗ participate in several coupsGuinea 1960-1983 Stable authoritarian rule
1984 Successful coup that includes Fulani∗ participationSenegal 1960-1989 Stable authoritarian rule
1989 Diola launch separatist warZambia 1964-1989 Stable authoritarian rule
Fourteen of the 18 countries highlight a clear destabilizing role for PCK groups. In seven cases,one ethnic group had monopolized power by independence. Six out of the seven cases experiencedat least one civil war by an excluded group. In the seventh, Madagascar, the politically excludedMerina (as coded by EPR) maintained a key presence in the military (Schraeder 1995), which mayexplain why Merina generals staged coups rather than initiated a civil war. Importantly, the PCKgroup was a central actor in the violence in all these cases. Conflicts in Ethiopia and Rwandarevolved around the monarchy specifically. In an eighth case, DR Congo, two separatist attemptsby PCK groups launched within days of independence occurred before any clear patterns of ethnicrule emerged.
In another four cases, ethnic tensions within an ethnically inclusionary coalition bred coup attemptsand purges that were followed by systematic ethnic exclusion and civil war. Once again PCK groups
115
were key actors in the violence, and conflicts in Uganda and Burundi revolved specifically aroundthe monarchy.
Two other countries, Benin and Ghana, exhibit spirals of coups but also raise important questions.The role of PCK groups causing political instability in Benin is quite direct (e.g., Decalo 1973,1990), and the leader of Ghana’s first coup explicitly denounced Nkrumah’s attempts to underminetraditional Ashanti organizations (Owusu 1989, 381)—a rivalry that began during the colonialera after Nkrumah attempted to undermine Ashanti planter-chiefs (Boone 2003, 159-63). However,these countries raise the puzzle of why subsequent governments did not attempt systematic politicalexclusion.
Four countries, however, do not provide clear support for the theory. Although the Republic ofCongo experienced two successful coups in the 1960s and a brief period of ethnocratic rule in the1970s, the role of PCK groups is unclear. Three cases—Guinea, Senegal, and Zambia—defy thegeneral pattern by exhibiting stable authoritarian rule, although in the 1980s a successful coupoccurred in Guinea and a civil war began in Senegal.
3.6 Conclusion
This paper aimed to develop stronger historical and strategic foundations for the expanding lit-erature on horizontal ethnic inequalities and civil war. It developed a game theoretic model ofethnopolitical inclusion/exclusion and derived implications for coups and civil wars. It then pre-sented historical and statistical evidence that ethnic groups in Sub-Saharan Africa organized aspre-colonial kingdoms (PCKs) undermined inter-ethnic commitment ability and caused higher ratesof civil wars and coups alongside low levels of ethnopolitical inclusion after independence.
The findings from this paper carry implications for at least two other important literatures. First, alarge economics literature studies historical causes of modern development. Existing evidence showshistorical states caused higher levels of economic development in Africa (Gennaioli and Rainer 2007;Michalopoulos and Papaoiannou 2013). It will be intriguing in future work to explore whether andhow historical statehood can be consistent with both higher levels of development and higher levelsof violence. Building on several recent studies, this paper also demonstrates the importance ofhistorical factors for understanding modern conflict (Besley and Reynal-Querol 2014; Fearon andLaitin 2014; Dincecco et al. 2014). Second, this paper applies a bargaining model of war to studythe causes and consequences of ethnopolitical exclusion—a previously unexplored application. Thiswill hopefully provide a constructive step for integrating previously disparate strands of the civilwar literature.
116
3.7 References
Acemoglu, Daron and James A. Robinson. 2006. Economic Origins of Dictatorship and Democracy.Cambridge University Press: New York, NY.
Akyeampong, Emmanuel, Robert H. Bates, Nathan Nunn, and James A. Robinson, Eds. 2014.Africa’s Development in Historical Perspective. Cambridge University Press: New York, NY.
Alsan, Marcella. 2015. “The Effect of the TseTse Fly on African Development.” American Eco-nomic Review, 105(1): 382-410.
Arriola, Leonardo R. 2009. “Patronage and Political Stability in Africa.” Comparative PoliticalStudies, 42(10): 1339-1362.
Bates, Robert H. 2014. “The Imperial Peace.” In Akyeampong, Emmanuel, Robert H. Bates,Nathan Nunn, and James A. Robinson, Eds. 2014. Africa’s Development in Historical Perspective.Cambridge University Press: New York, NY, pp. 424-443.
Berry, Sara. 1992. “Hegemony on a Shoestring: Indirect Rule and Access to Agricultural Land.”Africa: Journal of the International African Institute, 62(3): 327-355.
Besley, Timothy and Marta Reynal-Querol. 2014. “The Legacy of Historical Conflict: Evidencefrom Africa.” American Political Science Review, 108(2): 319-336.
Blanton, Robert, T. David Mason, and Brian Athow. 2001. “Colonial Style and Post-ColonialEthnic Conflict in Africa.” Journal of Peace Research, 38(4): 473-91.
Blattman, Christopher and Edward Miguel. 2010. “Civil War.” Journal of Economic Literature,48(1): 3-57.
Boone, Catherine. 2003. Political Topographies of the African State: Territorial Authority andInstitutional Choice. New York: Cambridge University Press.
Caplan, Gerald L. 1970. The Elites of Barotseland, 1878-1969: A Political History of Zambia’sWestern Province. Berkeley: University of California Press.
Cederman, Lars-Erik, Andreas Wimmer, and Brian Min. 2010. “Why do ethnic groups rebel? Newdata and analysis.” World Politics 62(1): 87-119.
Cederman, Lars-Erik, Kristian Skrede Gleditsch, and Halvard Buhaug. 2013. Inequality, Grievances,and Civil War. Cambridge University Press: New York, NY.
Collier, Paul and Anke Hoeffler. 2004. “Greed and grievance in civil wars.” Oxford EconomicPapers, 56: 563-95.
Colson, Elizabeth. 1969. “African Society at the Time of the Scramble.” In L.H. Gann and PeterDuignan, Eds., Colonialism in Africa, 1870-1960. Vol 1. New York, NY: Cambridge UniversityPress, pp. 27-65.
Decalo, Samuel. 1973. “Regionalism, Politics, and the Military in Dahomey.” The Journal ofDeveloping Areas, 7(3): 449-478.
Decalo, Samuel. 1980. “Regionalism, Decay, and Civil Strife in Chad.” Journal of Modern AfricanStudies, 18(1): 23-56.
117
Decalo, Samuel. 1990. Coups and Army Rule in Africa. Second Edition. Yale University Press:New Haven, CT.
Dincecco, Mark, James Fenske, and Massimiliano Gaetano Onorato. 2014. “Is Africa Different?Historical Conflict and State Development.” CSAE Working Paper WPS/2014-35.
Dinwiddy, Hugh. 1981. “The Search for Unity in Uganda: Early Days to 1966.” African Affairs:501-518.
Doornbos, Martin R. 1977. “Ankole.” In African Kingships in Perspective: Political Change andModernization in Monarchical Settings, Ed. Rene Lemarchand. Frank Cass & Co. Ltd.
Encyclopaedia Britannica online. Accessed 4/1/15.
Englebert, Pierre. 2009. Africa: Unity, Sovereignty, and Sorrow. Lynne Rienner Publishers:Boulder, CO.
Englebert, Pierre, Stacy Tarango, and Matthew Carter. 2002. “Dismemberment and Suffocation:A Contribution to the Debate on African Boundaries.” Comparative Political Studies, 35: 1093-1118.
Fearon, James D. 1995. “Rationalist Explanations for War.” International Organization, 49(3):379-414.
Fearon, James D. 1998. “Commitment Problems and the Spread of Ethnic Conflict.” In DavidA. Lake and Donald Rothchild, eds., The International Spread of Ethnic Conflict. Princeton:Princeton University Press.
Fearon, James D. 2004. “Why do some civil wars last so much longer than others?” Journal ofPeace Research, 41(3): 275-301.
Fearon, James D. and David D. Laitin. 2003. “Ethnicity, Insurgency, and Civil War.” AmericanPolitical Science Review, 97(1): 75-90.
Fearon, James D. and David D. Laitin. 2014. “Does contemporary armed conflict have ‘deep histor-ical roots’?” Prepared for the 2014 Annual Meeting of the American Political Science Association,August 28-31.
Fenske, James. 2014. “Ecology, Trade, and States in Pre-Colonial Africa.” Journal of the EuropeanEconomic Association. 12(3): 612-640.
Gennaioli, Nicola and Ilia Rainer. 2007. “The Modern Impact of Precolonial Centralization inAfrica.” Journal of Economic Growth, 12: 185234.
Goodwin, Jeff and Theda Skocpol. 1989. “Explaining Revolutions in the Contemporary ThirdWorld.” Politics & Society, 17(4): 489-509
Gordon, David M. 2005. “History on the Lualupa Retold: Landscape, Memory and Identity in theKazembe Kingdom.” Journal of African History, 47: 21-42.
Hargreaves, John D. 1969. “West African states and the European conquest.” In L.H. Gannand Peter Duignan, Eds., Colonialism in Africa, 1870-1960. Vol 1. New York, NY: CambridgeUniversity Press, pp. 199-219.
118
Herbst, Jeffrey. 2000. States and Power in Africa: Comparative Lessons in Authority and Control.Princeton University Press: Princeton, NJ.
Herbst, Jeffrey. 2004. “African Militaries and Rebellion: The Political Economy of Threat andCombat Effectiveness.” Journal of Peace Research, 41(3): 357-369.
Hopkins, A.G. 2000. “Quasi-states, weak states, and the partition of Africa.” Review of Interna-tional Studies, 26(2): 311-320.
Kebschull, Harvey G. 1994. “Operation ‘Just Missed’: Lessons From Failed Coup Attempts.”Armed Forces and Society, 20(4): 565-579.
King, Gary and Langche Zeng. 2001. “Logistic Regression in Rare Events Data.” Political Analy-sis.
Kirk-Greene, A. H. M. 1980. “The Thin White Line: The Size of the British Colonial Service inAfrica.” African Affairs, 79(314): 25-44.
Krings, Thomas. 1995. “Marginalisation and Revolt among the Tuareg in Mali and Niger.” Geo-Journal, 36(1): 57-63.
Kyeyune, Henry and Apolo Nsibambi. 1962. Buganda, Federal State of Uganda. Mmengo:Kabaka’s Government.
Levitsky, Steven and Lucan A. Way. 2010. Competitive Authoritarianism. Hybrid Regimes Afterthe Cold War. Cambridge University Press: New York.
Lloyd, Peter C. 1965. “The Political Structure of African Kingdoms: An Exploratory Model.”In Political Systems and the Distribution of Power, Ed. Michael Banton. Frederick A. PraegerPublishers: New York, pp. 63-112.
Londregan, John B. and Keith T. Poole. 1990. “Poverty, The Coup Trap, and the Seizure ofExecutive Power.” World Politics, 42(2): 151-83.
Lovejoy, Paul E. 1992. “Nigeria: Country Studies - Federal Research Division, Library of Congress.Chapter 1.” http://lcweb2.loc.gov/frd/cs/ngtoc.html. Accessed 8/11/14.
Magaloni, Beatriz. 2008. “Credible Power-Sharing and the Longevity of Authoritarian Rule.”Comparative Political Studies, 41(4-5): 715-741.
Mamdani, Mahmood. 1996. Citizen and Subject: Contemporary Africa and the Legacy of LateColonialism. Princeton University Press: Princeton, NJ.
Marinov, Nikolay and Hein Goemans. 2013. “Coups and Democracy.” British Journal of PoliticalScience, forthcoming.
Michalopoulos, Stelios and Elias Papaioannou. 2013. “Pre-colonial Ethnic Institutions and Con-temporary African Development.” Econometrica, 81(1): 113152.
Minorities at Risk. 2006. “Assessment for Merina in Madagascar.”http://www.cidcm.umd.edu/mar/assessment.asp?groupId=58002. Accessed 8/11/14.
Nolutshungu, Sam C. 1996. Limits of Anarchy: Intervention and State Formation in Chad. Char-lottesville: University of Virginia Press.
119
Nunn, Nathan. 2008. “The Long Term Effects of Africa’s Slave Trades.” The Quarterly Journal ofEconomics, February: 139-176.
Nunn, Nathan and Leonard Wantchekon. 2011. “The Slave Trade and the Origins of Mistrust inAfrica.” American Economic Review, 101(7): 3221-52.
Ofcansky, Thomas. 1992. “Sudan: Country Studies - Federal Research Division, Library ofCongress. Chapter 1.” http://lcweb2.loc.gov/frd/cs/sdtoc.html. Accessed 8/11/14.
Owusu, Maxwell. 1989. “Rebellion, Revolution and Tradition: Reinterpreting Coups in Ghana.”Comparative Studies in Society and History, 31(2): 372-397.
Posner, Daniel N. 2005. Institutions and Ethnic Politics in Africa. Cambridge University Press:New York.
Powell, Jonathan. 2012. “Determinants of the Attempting and Outcome of Coups d’etat.” Journalof Conflict Resolution, 56(6): 1017-1040.
Powell, Robert. 2004. “The Inefficient Use of Power: Costly Conflict with Complete Information.”American Political Science Review, 98(2): 231-241.
Powell, Robert. 2006. “War as a Commitment Problem.” International Organization, 60(1):169-203.
Powell, Robert. 2012. “Persistent Fighting and Shifting Power.” American Journal of PoliticalScience.
Putterman, Louis. 2008. “Agriculture, Diffusion and Development: Ripple Effects of the NeolithicRevolution.” Economica, 75(300): 72948.
Ranger, Terence. 1983. “The Invention of Tradition in Colonial Africa.” In The Invention ofTradition, Eds. Eric Hobsbawm and Terence Ranger. Cambridge University Press: New York,NY.
Reid, Richard J. 2012. Warfare in African History. Cambridge University Press: New York,NY.
Roessler, Philip. 2011. “The Enemy Within: Personal Rule, Coups, and Civil War in Africa.”World Politics, 63(2): 300-346.
Rothchild, Donald and Michael Rogin. 1966. “Uganda.” In National Unity and Regionalism inEight African States, Ed. Gwendolen M. Carter. Ithaca: Cornell University Press, 337-440.
Schmidt, Siegmar. 1999. “Uganda.” In Elections in Africa: A Data Handbook, Eds. Dieter Nohlen,Bernard Thibaut, and Michael Krennerich. Oxford University Press: New York, NY.
Schraeder, Peter J. 1995. “Madagascar: Country Studies – Federal Research Division, Libraryof Congress. Chapter 1 – Madagascar.” http://lcweb2.loc.gov/frd/cs/mgtoc.html. Accessed12/15/14.
Sharkey, Heather J. 2008. “Arab Identity and Ideology in Sudan: The Politics of Language, Eth-nicity, and Race.” African Affairs, 107/426: 21-43.
120
Sklar, Richard L. and C.S. Whitaker, Jr. 1966. “The Federal Republic of Nigeria.” In NationalUnity and Regionalism in Eight African States, Ed. Gwendolen M. Carter. Ithaca: Cornell Uni-versity Press, 7-150.
Stewart, Frances. 2008. “Horizontal Inequalities and Conflict: An Intriduction and Some Hy-potheses.” In Horizontal Inequalities and Conflict: Understanding Group Violence in MultiethnicSocieties, Ed. Frances Stewart. Houndmills: Palgrave Macmillan.
Svolik, Milan W. 2012. The Politics of Authoritarian Rule. Cambridge University Press: NewYork, NY.
Thibaut, Bernhard. 1999. “Madagascar.” In Elections in Africa: A Data Handbook, Eds. DieterNohlen, Bernard Thibaut, and Michael Krennerich. Oxford University Press: New York, NY.
Thompson, Virginia. 1963. “Dahomey.” In Five African States: Responses to Diversity, Ed.Gwendolen M. Carter. Ithaca: Cornell University Press, 161-262.
Tripp, Aili Mari. 2009. Museveni’s Uganda: Paradoxes of Power in a Hybrid Regime. Rienner:New York.
Vansina, J. 1962. “A Comparison of African Kingdoms.” Africa: Journal of the InternationalAfrican Institute, 32(4): 324-335.
Walter, Barbara F. 2009. “Bargaining Failures and Civil War.” Annual Review of Political Science,12: 243-61.
Warner, Carolyn M. 2001. “The rise of the state system in Africa.” Review of International Studies,27(5): 65-89.
Weisfelder, Richard F. 1977. “The Basotho Monarchy.” In African Kingships in Perspective:Political Change and Modernization in Monarchical Settings, Ed. Rene Lemarchand. Frank Cass& Co. Ltd.
Whatley, Warren and Rob Gillezeau. 2011. “The Impact of the Transatlantic Slave Trade onEthnic Stratification in Africa.” American Economic Review: Papers & Proceedings, 101(3): 571-576.
Wucherpfennig, Julian, Philipp Hunziker, and Lars-Erik Cederman. 2012. “Who Inherits the State?Colonial Rule and Post-Colonial Conflict.” Working Paper.
Young, Crawford. 1977. “Buganda.” In African Kingships in Perspective: Political Change andModernization in Monarchical Settings, ed. Rene Lemarchand. Frank Cass & Co. Ltd.: ForestGrove, OR, pp. 193-235.
Young, Crawford. 2006. “The Heart of the African Conflict Zone: Democratization, Ethnicity,Civil Conflict, and the Great Lakes Crisis.” Annual Review of Political Science, 9: 301-28.
121
Appendix to accompanyPre-Colonial Kingdoms and the Coup-Civil War Nexus
in Sub-Saharan Africa
A. Formal Model Analysis
Appendix A presents a more detailed formal analysis of the model and proves all the results fromthe text. After summarizing the actions in a strategy profile and providing notation, I solve forequilibrium actions in strategy profiles in which the winner of a fight chooses inclusion followed bystrategy profiles in which the winner chooses exclusion. Next, I prove the results from the text andstate the equilibrium strategy profiles.
A.1. Actions in a Strategy Profile
A strategy profile contains 13 elements. First, the winner’s inclusion/exclusion decision following afight. The other 12 are:{G’s offer, C’s acceptance/fighting function} × {C is strong, C is weak}×{C is included and St−1 = 0, C is included and St−1 = 1, C is excluded}.
A.2. Notation
The following notation will be used below.
122
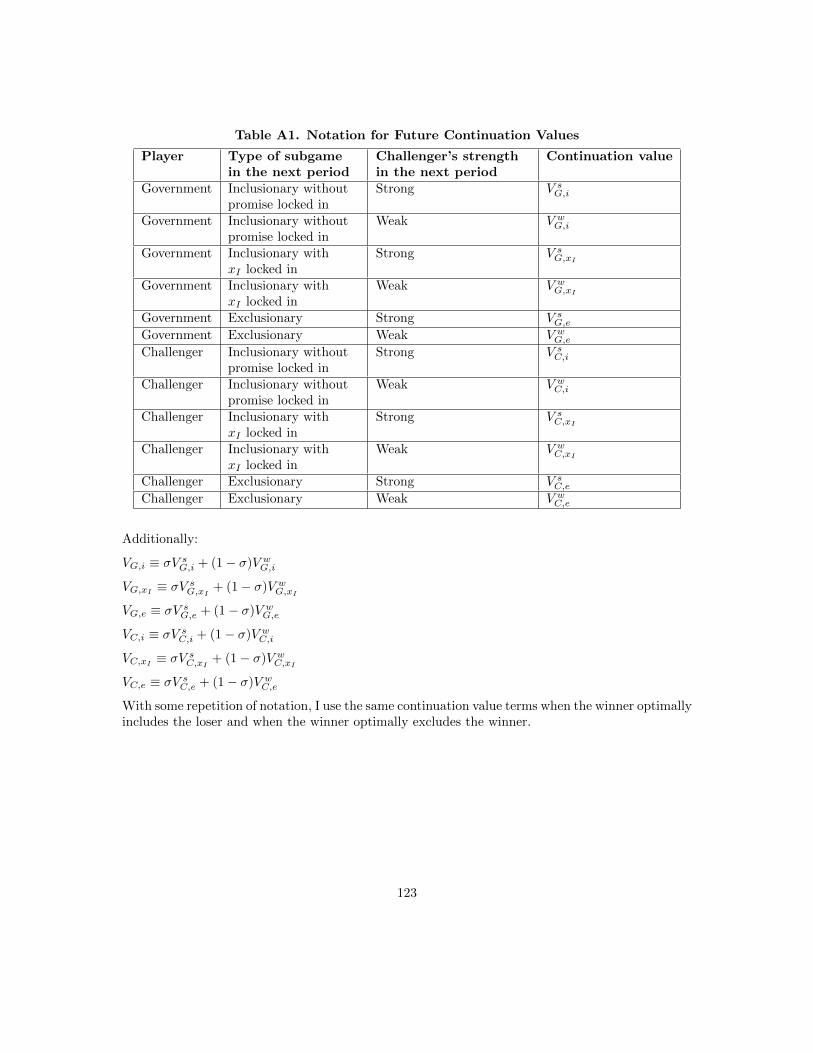
Table A1. Notation for Future Continuation Values
Player Type of subgamein the next period
Challenger’s strengthin the next period
Continuation value
Government Inclusionary withoutpromise locked in
Strong V sG,i
Government Inclusionary withoutpromise locked in
Weak V wG,i
Government Inclusionary withxI locked in
Strong V sG,xI
Government Inclusionary withxI locked in
Weak V wG,xI
Government Exclusionary Strong V sG,eGovernment Exclusionary Weak V wG,eChallenger Inclusionary without
promise locked inStrong V sC,i
Challenger Inclusionary withoutpromise locked in
Weak V wC,i
Challenger Inclusionary withxI locked in
Strong V sC,xI
Challenger Inclusionary withxI locked in
Weak V wC,xI
Challenger Exclusionary Strong V sC,eChallenger Exclusionary Weak V wC,e
Additionally:
VG,i ≡ σV sG,i + (1− σ)V wG,i
VG,xI ≡ σV sG,xI + (1− σ)V wG,xI
VG,e ≡ σV sG,e + (1− σ)V wG,e
VC,i ≡ σV sC,i + (1− σ)V wC,i
VC,xI ≡ σV sC,xI + (1− σ)V wC,xI
VC,e ≡ σV sC,e + (1− σ)V wC,e
With some repetition of notation, I use the same continuation value terms when the winner optimallyincludes the loser and when the winner optimally excludes the winner.
123
Table A2. Notation for Equilibrium Offers
Winner’s optimalchoice
Type of subgame inthe current period
Equilibrium Offer
Inclusionary Inclusionary x∗i,iInclusionary Exclusionary x∗i,eExclusionary Inclusionary x∗e,iExclusionary Inclusionary x∗e,e
Using notation from the text, x∗I = x∗i,i if the winner optimally includes and x∗I = x∗e,i if the winneroptimally excludes.
A.3. Winner chooses inclusion
Conditions under which the inclusive subgame will be peaceful
The following five recursive equations characterize payoffs and the patronage offer in an inclusivesubgame when St−1 = 0 if the equilibrium is peaceful. If C accepts the offer in a strong period,it consumes xt in the current period. With probability θ, G’s implicit promise binds and C willreceive xt in all future periods. With probability 1−θ the promise does not bind and C receives thefuture continuation value associated with being the challenger in either a strong period (probabilityσ) or in a weak period (probability 1− σ):
V sC,i = xt + δ{θxt
1− δ+ (1− θ)
[σV sC,i + (1− σ)V wC,i
]}. (A1)
C will only accept xt if this action provides utility at least as large as the expected utility offighting. No consumption occurs in the period of a fight, if C wins (probability p) it receives thefuture continuation value of the government in an inclusive subgame (by the assumption the winnerincludes), and if C loses (probability 1−p) it receives the future continuation value of the challengerin an inclusive subgame:
V sC,i ≥ δ[pVG,i + (1− p)VC,i
]. (A2)
In a peaceful equilibrium, G needs to set xt large enough that C prefers to accept rather thanto reject. Conditional on inducing acceptance, G’s utility is a strictly decreasing function of thepatronage offer. Therefore, G sets xt to make C exactly indifferent between accepting and fighting—implying in equilibrium Equation A2 holds with equality.
In a weak period, C wins with probability 0. Therefore, it receives a patronage offer of 0 andremains as challenger in the next period:
V wC,i = δ[σV sC,i + (1− σ)V wC,i
]. (A3)
In a strong period, G consumes the entire per-period revenue stream minus the patronage offer.With probability θ the implicit promise binds and G will consume 1−xt in all future periods. Withcomplementary probability the promise does not bind and C receives either the future continuation
124
value associated with being the government in a strong period (probability σ) or in a weak period(probability 1− σ):
V sG,i = 1− xt + δ{θ
1− xt1− δ
+ (1− θ)[σV sG,i + (1− σ)V wG,i
]}. (A4)
In a weak period, G consumes the entire per-period revenue stream and remains as government inthe next period:
V sG,i = 1 + δ[σV sG,i + (1− σ)V wG,i
]. (A5)
Solving A1 through A5 for x∗i,i yields:
x∗i,i =δp[1− δ(1− σθ)]
[1− δ(1− 2σp)][1− δ(1− θ)]. (A6)
G is able to make a high enough patronage offer to buy off C if x∗i,i ≤ 1. Setting x∗i,i = 1 and solvingfor θ provides the threshold value of θ such that G can buy off C and the inclusionary subgame willbe peaceful if θ ≥ θi:
θi =(1− δ){δ[1 + p(1− 2σ)]− 1}
δ[1− δ(1− σp)]. (A7)
Conditions under which C accepts the permanent offer
Once G’s promise gets locked in, G’s action space becomes degenerate. C will always accept theequilibrium offer. However, there is an off-the-equilibrium-path possibility that a patronage offerlower than the equilibrium one gets locked in. Therefore, we must specify locked in offers C willaccept. If the offer is xI , then C’s utility to accepting is:
V sC,xI =xI
1− δ. (A8)
Based on C’s expected utility to fighting, it must receive at least
V sC,xI ≥ δ[pVG,i + (1− p)VC,i]. (A9)
Substituting in information from A1 through A5 and simplifying yields:
xI,i =δp[1− δ(1− σ)]
1− δ(1− 2σp). (A10)
Contradict existence of a peaceful exclusive subgame
The following five recursive equations characterize payoffs and the patronage offer in an exclusivesubgame if the equilibrium is peaceful. I will solve for a σ threshold that contradicts the existenceof a peaceful exclusionary subgame. If C accepts an offer in a strong period, it consumes xt in thecurrent period, and in the next period C receives either the future continuation value associated with
125
being the challenger in a strong period (probability σ) or in a weak period (probability 1−σ):
V wC,e = xt + δ[σV sC,i + (1− σ)V wC,i
]. (A11)
C will only accept xt if this action provides utility at least as large as the expected utility of fighting.No consumption occurs in the period of a fight, if C wins (probability αp) it receives the futurecontinuation value of the government conditional on the winner choosing inclusion, and if C loses(probability 1 − αp) it receives the future continuation value of the challenger conditional on thewinner choosing inclusion. These future continuation values presume the inclusionary subgame ispeaceful. As shown below, the winner will only ever choose inclusion (the presumption undergirdingthis subsection) if the inclusive subgame is peaceful. These considerations yield:
V sC,e ≥ δ[αpVG,i + (1− αp)VC,i
]. (A12)
In a peaceful equilibrium, G needs to set xt large enough that C prefers to accept rather thanto reject. Conditional on inducing acceptance, G’s utility is a strictly decreasing function of thepatronage offer. Therefore, G sets xt to make C exactly indifferent between accepting and fighting—implying in equilibrium Equation A12 holds with equality.
In a weak period, C does not consume in the current period and remains as challenger in the nextperiod:
V wC,e = δ[σV sC,i + (1− σ)V wC,i
]. (A13)
In a strong period, G consumes the entire per-period revenue stream minus the patronage offer,and in the next period C receives either the future continuation value associated with being thegovernment in a strong period (probability σ) or in a weak period (probability 1− σ):
V sG,e = 1− xt + δ[σV sG,e + (1− σ)V wG,e
]. (A14)
In a weak period, G consumes the entire per-period revenue stream and remains as government inthe next period:
V sG,e = 1 + δ[σV sG,e + (1− σ)V wG,e
]. (A15)
Solving A11 through A15 for x∗i,e yields:
x∗i,e =δp[(1− δ)α+ δσ]
[1− δ(1− σ)][1− δ(1− 2σp)]. (A16)
G cannot make a high enough patronage offer to buy off C if x∗i,e > 1. Setting x∗i,e = 1 and solvingfor σ provides the threshold value of σ such that G cannot buy off C and the exclusionary subgamewill be conflictual if σ < σi:
σi =−δ + δ2 − 2δp+ 3δ2p+
√δ2[(−1 + δ − 2p+ 3δp)2 − 8(1− δ)p(1− δ(1 + αp))]
4δ2p. (A17)
126
Will the winner deviate from inclusion?
If θ < θi, the winner can profitably deviate to exclusion. By assumptions σ < σ and θ < θi, fightingoccurs in both the inclusionary and exclusionary subgames. G will receive per-period utility of 1 inall periods before the first strong period in either type of subgame, and utility of 0 in the period ofthe fight in either type of subgame. Therefore, the only difference in utility occurs after the fight.G’s expected lifetime utility starting in the period after the fight in an exclusionary subgame is(1− αp)VG,i + αpVC,i, and in an inclusionary subgame is (1− p) · VG,i + pVC,i. Because α < 1, thewinner strictly prefers to deviate to exclusion.
If θ > θi, the winner cannot profitably deviate to exclusion. If G deviates to exclusion, it willreceive the same payoff of 1 in every period before the first strong period as in an inclusionaryregime. However, in the first strong period, G will not consume in the exclusionary equilibrium butwill consume in the inclusionary equilibrium, and there is a chance G will not remain as governmentafter the fight in the exclusionary subgame. Therefore, deviating strictly decreases G’s utility.
A.4. Winner chooses exclusion
Contradict existence of a peaceful exclusive subgame
The following five recursive equations characterize payoffs and the patronage offer in an exclusivesubgame if the equilibrium is peaceful. I will solve for a σ threshold that contradicts the existenceof a peaceful exclusionary subgame. If C accepts an offer in a strong period, it consumes xt inthe current period, and in the next period C receives the future continuation value associatedwith being either the challenger in a strong period (probability σ) or in a weak period (probability1− σ):
V wC,e = xt + δ[σV sC,i + (1− σ)V wC,i
]. (A18)
C will only accept xt if this action provides utility at least as large as the expected utility offighting. No consumption occurs in the period of a fight, if C wins (probability αp) it receivesthe future continuation value of the government in an exclusive subgame (by the assumption thewinner excludes), and if C loses (probability 1−αp) it receives the future continuation value of thechallenger in an exclusive subgame:
V sC,e ≥ δ[αpVG,e + (1− αp)VC,e
]. (A19)
In a peaceful equilibrium, G needs to set xt large enough that C prefers to accept rather thanto reject. Conditional on inducing acceptance, G’s utility is a strictly decreasing function of thepatronage offer. Therefore, G sets xt to make C exactly indifferent between accepting and fighting—implying in equilibrium Equation A19 holds with equality.
In a weak period, C does not consume in the current period and remains as challenger in the nextperiod:
V wC,e = δ[σV sC,i + (1− σ)V wC,i
]. (A20)
In a strong period, G consumes the entire per-period revenue stream minus the patronage offer,and in the next period C receives either the future continuation value associated with being the
127
government in a strong period (probability σ) or in a weak period (probability 1− σ):
V sG,e = 1− xt + δ[σV sG,e + (1− σ)V wG,e
]. (A21)
In a weak period, G consumes the entire per-period revenue stream and remains as government inthe next period:
V sG,e = 1 + δ[σV sG,e + (1− σ)V wG,e
]. (A22)
Solving A18 through A22 for x∗e,e yields:
x∗e,e =δαp
1− δ(1− 2σαp). (A23)
G cannot make a high enough patronage offer to buy off C if x∗e,e > 1. Setting x∗e,e = 1 and solvingfor σ provides the threshold value of σ such that G cannot buy off C and the exclusionary subgamewill be conflictual if σ < σe:
σe =δ(1 + αp)− 1
2δαp. (A24)
Calculate continuation values in a conflictual exclusionary subgame
In order to calculate x∗e,i, it is necessary to calculate the continuation values in a conflictual exclu-sionary subgame. At the outset of every period in the exclusionary subgame, there is a 1−σ percentchance C will be weak, meaning G consumes 1 in that period and remains as government in thenext period. With complementary probability σ, C is strong and a fight occurs. With probability1 − αp, G wins the fight and receives future continuation value VG,e, and with probability αp, Gloses and receives future continuation value VC,e:
VG,e = (1− σ)(1 + δVG,e) + σδ[αpVC,e + (1− αp)VG,e
]. (A25)
For the challenger, at the outset of every period there is a 1−σ percent chance it will be weak, con-sume nothing in the current period, and remain as challenger in the next period. With probabilityσ it will be strong and a fight will occur. With probability αp, C wins the fight and receives futurecontinuation value VG,e, and with probability 1−αp, C loses and receives future continuation valueVC,e:
VC,e = (1− σ)δVC,e + σδ[αpVG,e + (1− αp)VC,e
]. (A26)
Solving Equations A25 and A26 yields:
VG,e =(1− σ)[1− δ(1− σαp)](1− δ)[1− δ(1− 2σαp)]
(A27)
and
VC,e =δαpσ(1− σ)
(1− δ)[1− δ(1− 2σαp)]. (A28)
128
Conditions under which the inclusive subgame will be peaceful
The following five recursive equations characterize payoffs and the patronage offer in an inclusivesubgame when St−1 = 0 if the equilibrium is peaceful. If C accepts an offer in a strong period, itconsumes xt in the current period. With probability θ, G’s implicit promise binds and C will receivext in all future periods. With probability 1 − θ the promise does not bind and C receives eitherthe future continuation value associated with being the challenger in a strong period (probabilityσ) or in a weak period (probability 1− σ):
V sC,i = xt + δ{θxt
1− δ+ (1− θ)
[σV sC,i + (1− σ)V wC,i
]}. (A29)
C will only accept xt if this action provides utility at least as large as the expected utility offighting. No consumption occurs in the period of a fight, if C wins (probability p) it receivesthe future continuation value of the government in an exclusionary subgame (because the strategyprofile instructs the winner to exclude), and if C loses (probability 1 − p) it receives the futurecontinuation value of the challenger in an exclusive subgame (probability 1− p):
V sC,i ≥ δ[pVG,e + (1− p)VC,e
]. (A30)
In a peaceful equilibrium, G needs to set xt large enough that C prefers to accept rather thanto reject. Conditional on inducing acceptance, G’s utility is a strictly decreasing function of thepatronage offer. Therefore, G sets xt to make C exactly indifferent between accepting and fighting—implying in equilibrium Equation A30 holds with equality.
In a weak period, C does not consume in the current period and remains as challenger in the nextperiod. Therefore:
V wC,i = δ[σV sC,i + (1− σ)V wC,i
]. (A31)
In a strong period, G consumes the entire per-period revenue stream minus the patronage offer.With probability θ the implicit promise binds and G will consume 1−xt in all future periods. Withcomplementary probability the promise does not bind and C receives either the future continuationvalue associated with being the government in a strong period (probability σ) or in a weak period(probability 1− σ):
V sG,i = 1− xt + δ{θ
1− xt1− δ
+ (1− θ)[σV sG,i + (1− σ)V wG,i
]}. (A32)
In a weak period, G consumes the entire per-period revenue stream and remains as government inthe next period:
V sG,i = 1 + δ[σV sG,i + (1− σ)V wG,i
]. (A33)
Solving A29 through A33 yields:
x∗e,i =δ(1− σ)(p+ σ)[1− δ(1− σθ)]
[1− δ(1− σ)](1 + 2σ)[1− δ(1− θ)]. (A34)
G is able to make a high enough patronage offer to buy off C if x∗e,i ≤ 1. Setting x∗e,i = 1 andsolving for θ provides the threshold value of θ such that G can buy off C and the inclusionary
129
subgame will be peaceful if θ ≥ θe:
θe ≡(1− δ)[δ(1− σ)(1 + p+ 3σ)− (1 + 2σ)]
δ{1 + 2σ − δ(1− σ)[1 + (2 + p)σ + σ2]}. (A35)
Finally, we can state VG,i as a function of VG,e and VC,e:
VG,i =1− δ(1− σ)− δ(1− δ)σ
[pVG,e + (1− p)VC,e
](1− δ)[1− δ(1− σ)]
. (A36)
Conditions under which C accepts the permanent offer
Once G’s promise gets locked in, G’s action space becomes degenerate. C will always accept theequilibrium offer. However, there is an off-the-equilibrium-path possibility that a patronage offerlower than the equilibrium one gets locked in. Therefore, we must specify locked in offers C willaccept. If the offer is xI , then C’s utility to accepting is:
V sC,xI =xI
1− δ. (A37)
Based on C’s expected utility to fighting, it must receive at least
V sC,xI ≥ δ[pVG,e + (1− p)VC,e]. (A38)
Substituting in A27 and A28 and simplifying yields:
xI,e =δ(p+ σ)
1 + 2σ. (A39)
Will the winner deviate from exclusion?
If θ < θe, there is no profitable deviation. The logic is identical to why the winner has a profitabledeviation from including if θ < θi.
If θ > θe, whether or not there is a profitable deviation depends on the value of α. The winner canprofitably deviate if:
G(α) ≡ VG,i − VG,e > 0. (A40)
Applying the intermediate value theorem proves the existence of α such that G will deviate fromexcluding if α > α but will not deviate if α > α; however, α may be negative, in which case G willdeviate for all α ∈ [0, 1).
• G(1) > 0. In general, VG,i = 11−δ − VC,i and VG,e = 1−σ
1−δ − VC,e. Total surplus is larger in theinclusive subgame because fighting does not occur. When α = 1, VC,i = VC,e because C winswith the same probability in each subgame. Therefore, VG,i > VG,e when α = 1.
• Assumption 1 holds as long as σ < σe, from A24. This is only possible if σe > 0, which solvesto α > α ≡ 1−δ
δp . Therefore, α is the relevant lower bound for α. Substitute α = α, A27, A28,
130
and A36 into A40 and simplify to get G(α) = σ[2+σ−δ(1−σ)(2(1+σ)+p](1−δ)[1−δ(1−σ)](1+2σ) . This term is strictly
positive if p > 2+σδ(1−σ) −2(1+σ). Intuitively, the larger is p, the bigger is the power shift when
α = α, which increases the winner’s incentives to exclude.
• The derivative of G(α) with respect to α is − δσ1−δ(1−σ)
[p ddαVG,e + (1 − p) d
dαVC,e]− d
dαVG,e.
Using Equations A27 and A28 to calculate ddαVG,e and d
dαVC,e, substituting, and simplifying
yields the strictly positive term δp(1−σ)σ[1−δ(1−2pσ)][1−δ(1−σ)][1−δ(1−2αpσ)]2 .
A.5. Proving results from the text
Proof of Lemma 1. C will reject any offer in a strong period in an exclusionary subgame if:
σ < σ ≡ min{σi, σe},
for σi defined in A17 and σe defined in A24. �
Proof of Lemma 2. G will be able to make high enough offer to buy off C in a strong period in aninclusionary subgame if:
θ > θ ≡ max{θi, θe},
for θi defined in A7 and θe defined in A35. �
Proof of Lemma 3. See Sections A.3.4 and A.4.5. �
A.6. Stating the equilibria
If either (1) θ < θ ≡ min{θi, θe} or (2) θ < θi, θ > θe, and α < α, then any equilibriumfeatures the winner choosing exclusion. The following strategies define a set of payoff-equivalentequilibria:
1. If C is excluded:
(a) If C is weak, G offers xt = 0 and C accepts any offer xt ≥ 0.
(b) If C is strong, G offers xt ∈ [0, 1] and C rejects any offer xt ≥ 0.
2. If C is included and St−1 = 0:
(a) If C is weak, G offers xt = 0 and C accepts any offer xt ≥ 0.
(b) If C is strong, G offers xt = x∗e,i and C accepts any offer xt ≥ x∗e,i.
3. If C is included and St−1 = 1:
(a) If C is weak, G offers xt = xI and C accepts xI ≥ xI,e.
(b) If C is strong, G offers xt = xI and C accepts xI ≥ xI,e.
If θ > θ and α > α, any equilibrium features the winner choosing inclusion. The following strategiesdefine the set of payoff-equivalent equilibria:
131
• If C is excluded:
– If C is weak, G offers xt = 0 and C accepts any offer xt ≥ 0.
– If C is strong, G offers xt ∈ [0, 1] and C rejects any offer xt ≥ 0.
• If C is included and St−1 = 0:
– If C is weak, G offers xt = 0 and C accepts any offer xt ≥ 0.
– If C is strong, G offers xt = x∗i,i and C accepts any offer xt ≥ x∗i,i.
• If C is included and St−1 = 1:
– If C is weak, G offers xt = xI and C accepts xI ≥ xI,i.
– If C is strong, G offers xt = xI and C accepts xI ≥ xI,i.
If either (1) θi > θe, θ ∈ [θe, θi], and α > α or (2) θi < θe and θ ∈ [θi, θe], then there existequilibria with inclusion and with exclusion. The strategy profiles above characterize the equilibriumactions.
B. Sample for the Statistical Analysis
The sample contains almost all ethnic group-years from the EPR dataset for each Sub-SaharanAfrican country from their year of independence until 1989 (which eliminates Namibia, Eritrea,and South Sudan from the sample). The current version of EPR (2014 Update 2) does not providedata for Burkina Faso, Cape Verde, Comoros, Equatorial Guinea, Lesotho, Sao Tome and Principe,Seychelles, Somalia, or Swaziland. Older versions of EPR did not include data for Botswana,Mauritius, or Tanzania, and these countries are not included in Roessler’s (2011) coup and civil wardata. Besides Burkina Faso, Equatorial Guinea, and Tanzania, it is preferred that these countriesare not included because they fail to meet an important scope condition implicit in the model. Manyof the islands lacked an indigenous population prior to colonization, eliminating the possibility ofpre-colonial kingdoms. The rest only have one effective ethnic group, obviating the theory’s focuson inter -ethnic political interactions. Finally, because the statistical results focus on post-colonialpolitical interactions, the sample excludes foreign settler-dominated South Africa, Liberia before1980, and Zimbabwe before 1980—therefore only focusing on years in which indigenous Africansheld power.
C. Coding PCK Groups/Countries
Appendix C provides additional details on the coding procedure for pre-colonial kingdoms. TableC1 summarizes the 11 sources used.
132
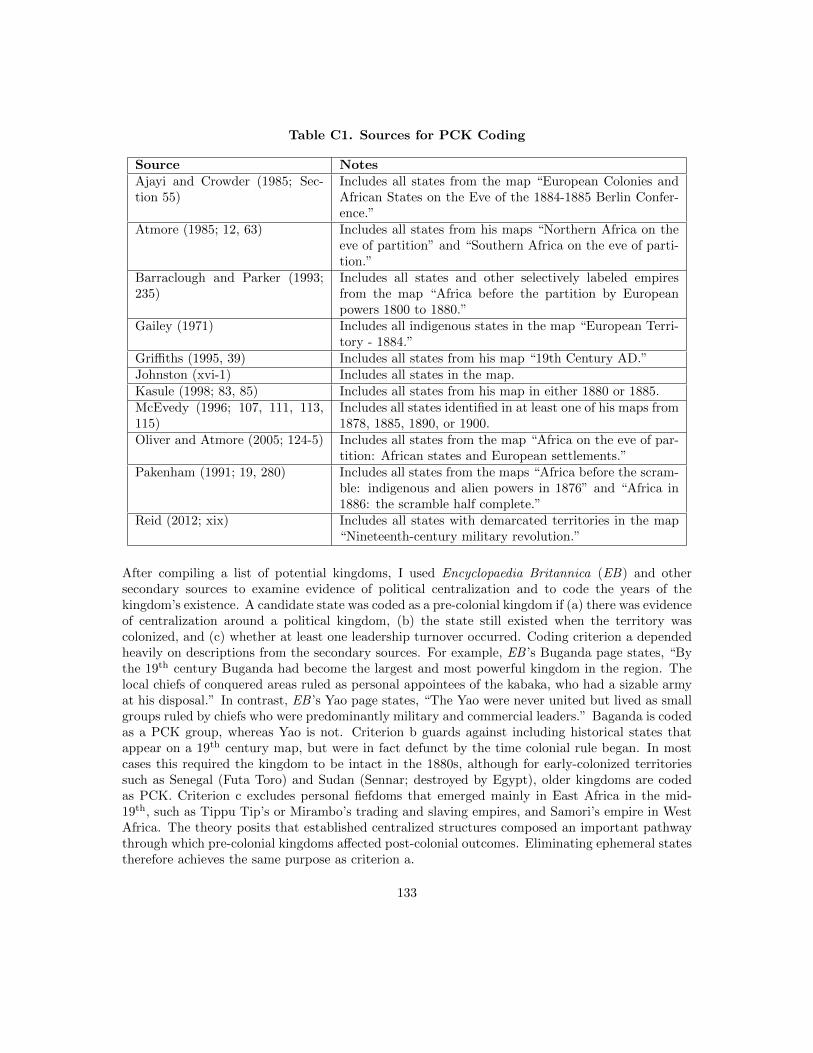
Table C1. Sources for PCK Coding
Source NotesAjayi and Crowder (1985; Sec-tion 55)
Includes all states from the map “European Colonies andAfrican States on the Eve of the 1884-1885 Berlin Confer-ence.”
Atmore (1985; 12, 63) Includes all states from his maps “Northern Africa on theeve of partition” and “Southern Africa on the eve of parti-tion.”
Barraclough and Parker (1993;235)
Includes all states and other selectively labeled empiresfrom the map “Africa before the partition by Europeanpowers 1800 to 1880.”
Gailey (1971) Includes all indigenous states in the map “European Terri-tory - 1884.”
Griffiths (1995, 39) Includes all states from his map “19th Century AD.”Johnston (xvi-1) Includes all states in the map.Kasule (1998; 83, 85) Includes all states from his map in either 1880 or 1885.McEvedy (1996; 107, 111, 113,115)
Includes all states identified in at least one of his maps from1878, 1885, 1890, or 1900.
Oliver and Atmore (2005; 124-5) Includes all states from the map “Africa on the eve of par-tition: African states and European settlements.”
Pakenham (1991; 19, 280) Includes all states from the maps “Africa before the scram-ble: indigenous and alien powers in 1876” and “Africa in1886: the scramble half complete.”
Reid (2012; xix) Includes all states with demarcated territories in the map“Nineteenth-century military revolution.”
After compiling a list of potential kingdoms, I used Encyclopaedia Britannica (EB) and othersecondary sources to examine evidence of political centralization and to code the years of thekingdom’s existence. A candidate state was coded as a pre-colonial kingdom if (a) there was evidenceof centralization around a political kingdom, (b) the state still existed when the territory wascolonized, and (c) whether at least one leadership turnover occurred. Coding criterion a dependedheavily on descriptions from the secondary sources. For example, EB ’s Buganda page states, “Bythe 19th century Buganda had become the largest and most powerful kingdom in the region. Thelocal chiefs of conquered areas ruled as personal appointees of the kabaka, who had a sizable armyat his disposal.” In contrast, EB ’s Yao page states, “The Yao were never united but lived as smallgroups ruled by chiefs who were predominantly military and commercial leaders.” Baganda is codedas a PCK group, whereas Yao is not. Criterion b guards against including historical states thatappear on a 19th century map, but were in fact defunct by the time colonial rule began. In mostcases this required the kingdom to be intact in the 1880s, although for early-colonized territoriessuch as Senegal (Futa Toro) and Sudan (Sennar; destroyed by Egypt), older kingdoms are codedas PCK. Criterion c excludes personal fiefdoms that emerged mainly in East Africa in the mid-19th, such as Tippu Tip’s or Mirambo’s trading and slaving empires, and Samori’s empire in WestAfrica. The theory posits that established centralized structures composed an important pathwaythrough which pre-colonial kingdoms affected post-colonial outcomes. Eliminating ephemeral statestherefore achieves the same purpose as criterion a.
133
References for coding kingdoms
Ajayi, A. J .F. and Michael Crowder. 1985. Historical Atlas of Africa. New York, NY: CambridgeUniversity Press.
Atmore, A.E. 1985. “Africa on the eve of partition.” In The Cambridge History of Africa, Volume6: 1870 to 1905, Eds. J.D. Fage and Roland Oliver. Cambridge University Press. pp. 10-95.
Barraclough, Geoffrey, and Geoffrey Parker, Eds. 1993. The Times Atlas of World History. Ham-mond World Atlas Corporation.
Gailey, Harry A. Jr. 1971. The History of Africa in Maps. Denoyer-Geppert.
Griffiths, Ieuan Ll. 1995. The Atlas of African Affairs, Second Edition. Routledge.
Johnston, Keith F.R.G.S. 1884. Stanford’s Compendium of Geography and Travel: Africa, FourthEdition. London: Edward Stanford.
Kasule, Samuel. 1998. The History Atlas of Africa: From the First Humans to the Emergence of aNew South Africa. MacMillan Publishing Company.
McEvedy, Colin. 1996. The Penguin Atlas of African History: Revised Edition. Penguin Books.
Oliver, Roland and Anthony Atmore. 2005. Africa Since 1800, Fifth Edition. Cambridge.
Pakenham, Thomas. 1991. The Scramble for Africa: The White Man’s Conquest of the DarkContinent from 1876 to 1912. Random House.
Reid, Richard J. 2012. Warfare in African History. Cambridge University Press: New York,NY.
134
Conclusion to the Dissertation
This dissertation has presented three new game theoretic models to provide insight into how au-thoritarian survival strategies affect prospects for civil wars, focusing in particular on applicationsto debates about a conflict resource curse and about ethnicity and political violence. Two keybroader implications emerge for studying comparative politics. The first is that two subject areastypically studied in isolation from each other—authoritarian regime survival and civil war—can beproductively integrated to expand upon and to challenge conventional wisdom about each topic.The conflict resource curse literature resembles much of the broader civil war literature becausemost contributions focus mainly on rebels’ incentives without closely scrutinizing government strat-egy. The horizontal inequalities and conflict literature provides a partial exception by analyzingincorporation into the ruling coalition, but also tends not to carefully consider the government’sstrategic incentives with regard to ethnopolitical inclusion. A game theoretic framework forcesthe analyst to focus on both government and rebel strategy, and incorporating insights from theauthoritarian politics literature provides guidance regarding which aspects of government strategyare more relevant than others.
Second, important insights arise when combining distinct paradigmatic categories of causes for civilwars into a unified analysis. Perhaps the three most important paradigms in the current literatureare greed (rebels fight for economic aims), grievance (rebels fight when governments enact unjustpolicies), and opportunities (rebels fight when the state is weak). Rather than attempt to isolatewhich of these effects is most important, the game theoretic models presented here demonstratethe necessity of considering these factors in tandem. For example, the oil and center-seeking essayshows how combining the greed and opportunities paradigms overturns conventional wisdom aboutthe conflict resource curse. The oil and separatist essay shows how combining the greed andgrievance paradigms highlights new strategic foundations for an important empirical finding as wellas produces a new empirical implication about oil wealth affects different types of civil war. Thesecond and third essays also demonstrate how grievances can emerge as a consequence of governmentstrategy.
Overall, this focus on strategic interactions between governments and rebels, and on combiningdisparate paradigmatic approaches to studying civil wars, should help to perpetuate progress in theinfluential political science research agenda on causes of civil war.
135