Embed Size (px)
Citation preview

Policy, Research, and External Affairs
WORKING PAPERS
International Trade
International Economics DepartmentThe World Bank
April 1991WPS 642
How a Changein Brazil's Sugar Policies
Would Affectthe World Sugar Market
Brent Borrell
By changing its policy, Brazil could increase its sugar exportsgreatly. The world price would decline, but Brazil's sugarrevenues would increase.
1Elc Pl'l'w R-. - .a d I A ! (' - j - * : i I'RI ,x'..V l g n'.. h ! ll ; rf s III prTgrC- andI
to clm .srjgo ! Jlr.c e C -h 0! Fe '0 'g I,1::k :..,: .! nr.:-' .' . . ' I hcsc ar, 'drr) the namle,s outhe ao:ilm,rs rct,. : Cs i ! k . 5 .. so.' ' .h . a < .i'. :' I 'c ,: c' -;..:17 o. and ,s,o 4:e lhe
)' .. 1 ': I .. .'.. . 0. .. ' 11. ....... .1). or. : -" i! c:V. ('7 3¾ *1 IIS JISOtJK -
Pub
lic D
iscl
osur
e A
utho
rized
Pub
lic D
iscl
osur
e A
utho
rized
Pub
lic D
iscl
osur
e A
utho
rized
Pub
lic D
iscl
osur
e A
utho
rized
Pub
lic D
iscl
osur
e A
utho
rized
Pub
lic D
iscl
osur
e A
utho
rized
Pub
lic D
iscl
osur
e A
utho
rized
Pub
lic D
iscl
osur
e A
utho
rized

Policy, Research, and External Affairs
International Trade
WPS 642
Tlhis palpcr- -I prtodLC (oIl Ch Iiternaliional 'l'rae (iel)iv isbn, Iote,ail i jional tEcoioniiiics Departmenltli is parlof a larger Cf'orit in PRl to understaInd the impact ol changes in CoulintriCs' trade policies on or1idcommodilt miarkc:s. Copies are availablefree Ironii the Worl(d Bantik, 1 8 I 8 11 SLtreel Nct \NW ashinWlolt. n)( 20(433. Please colitlact Audrey Kirsonl-Wa;liers, rooln] S7-053, exteisionl 33712 (3) pa-cs).
Alihoughi Brar/iI is the world's largest sugarcane lations were run1 on suslalillCnd inlCICISCS illproducer, oinly one-third o0 'thc Caine it grows is Brazilian suglar pr-oductioll ol .5 mlillioni ton1s, 2used to pro(luce sugar; thc rest is used to produce Iflillionl tols, anid 6i millioni toils. To exalmlile ilicetlhanol as fuel lor automobiles. Still, Bratzil is sensitivity of' Brazil's inilucice on pricc a1tthe world's fburth largest sugar producer. What dilfferent phases ol' tlie world sugar price cycic.would it mean Ior Brazil and lfo the world sugar these sustainei( increalses were simulate(l 'rontmarket if Brazil werc to shift largely a\A l'rom two difl'erent stalt dales. Moreover, the mo(lclethanol to sugaIr pro(ductioni ? was ruIn i60 timiecs over the period 1985-2004,
with di 'ffrctt shocks repr-escingit randomThis questionl is of kcen initerest or thc clemenits such as weather.
world sugar maliket because suchi a shil' -alllhoughi politically di 'licuIll -- is possiblc. Boricil coniclu(des thiati altihougih Bria/zil conIl(Brazil's system ol' coitrollinig the sugarcane and inifluence world sugar pricCs si'rlnigicantly in thecsugar industries to ensuic cnoughl ethanol lor shlior run. it could not inilucice thcimi to its sliort-domestic lucl needs is costly. With the border or long-term advantage by restirictingr plro0dUcioln.price ol'petrolcum at $24 a barrel, forexamplc, Indeed, to the exteni that B3raZil COUld mia;kCthe shadow price of ethanol as a fuel substitute is world prices more stable by) allowing its produc-about 4 to 5 cenis a pound in sugar equivalent. crs incrcalsc( llcxibility in prOdUCtiOll, rCellOViilu(The world pricc ol' sugar is low 9 centis a existing productioni conltiols coul(d pl)vide notpound.) oinly subst:rntial econoiliic ,gains (in leiuns ()1
increased exports to Brauzil) but also moie stableBorrell uscs a nine-rcgion trade mod(el of thc world prices. FoI otlihCr producers, thCIC could bc
world sugar industiy to study this qluestion under a tradeolf inl eCtIIS lHowr but tMore StIaCboth dynamic and stochastic simulations. Simu- income.
The PRE Working Paper Series disscminaite the findings of' %ork un(ler A ay in tlt Bank's lPolic! Re'oarclh. arid E\tkialAffatirs Conililx. An ohjective ofhlie scries ij to get these findings 0ou (luickly. c en if prewiination'. arc leI titan 1 lullI- ld ididThe Fin(lings. nk'rpr.tp.rios. and (olnl fusions ill 1liew p.iller (1do not 1CCC'srrill\ TellrC.111ot 0 il 13.nk policy1
PlOdUKlCI hs tlI PRIE l)D,'enmn.ntion (Cnk!c
Table of Contents
I. Introduction .. ........ ...... I............... I
II. Constraints on Brazilian Sugar Production . .. 3
III. A Model of the Brazilian Sugarcane, Sugar and EthanolIndustry Pelicies . ............
IV. Brazil's Impact on the World Sugar Price . . .12
V. Empirical Estimates of Brazil's Influence on the World Price .... 16
VI. Conclusions .... ...... ..... 28

I. INTRODUCTION
Brazil is b- dC the largest sugarcane producer, with output of well
over 200 miliion tons of cane annually. However, only about one-third of the
cane grown is used to produce sugar. The majority is used to produce ethanol--
a substitute automobile fuel Brazil is the fourth latgest sugar producer
after the EEC, India and the USSR. The vast quantities of cane produced
potentially give Brazil an immense capacity to produce more sugar. If all
cane grown were used to produce sugar, Brazilian sugar output would rise from
around 8 million tons annually to over 20 million tons. Currently, around 105
million tons of sugar are produced worldwide each year.
A tight net of governmental controls and interventions has long been
a feature of the Brazilian industry. They strictly limit the industry's
ability to switch cane between ethanol and sugar production. Potentially, the
economic gains for the Brazilian economy from diverting cane away from ethanol
to sugar are great. With a border price of petroleum at around $24/barrel
($18/barrel for Saudi crude) the shadow price of ethanol as a fuel substitute,
measured in sugar equivalents, is about 4-5¢/lb only. Compared to recent
world sugar prices in the range 9-15c/lb, the marginal opportunity cost of not
switching is clear.
Brazil's ethanol program has been strongly promoted by government and
has been highly visible. Politically, a radical reversal of policies on
ethanol seems unlikely. Nevertheless, the economic arguments for switching at
least some cane away from ethanol to sugar production are very persuasive.

- 2 -
Because Brazil is already a major exporter and given ic has the sugarcane to
nearly treble its sugar output, the impact of a change in Brazilian policies
on the world price is of great interest. The purpose of this 3tudy was to
estimate the potential impact of changes in Brazilian production on the world
sugar market. Policy implications of the impact will also be discussed.
A nine-region trade model of the world sugar economy is used to study
Brazil's impact on the market. The model is dynamic, allowing both short- and
long-run impacts to be studied. The model also makes it possible to study
Brazil's potential to affect the variability of the world price--sugar is the
most volatile of all commodity markets.
-3-
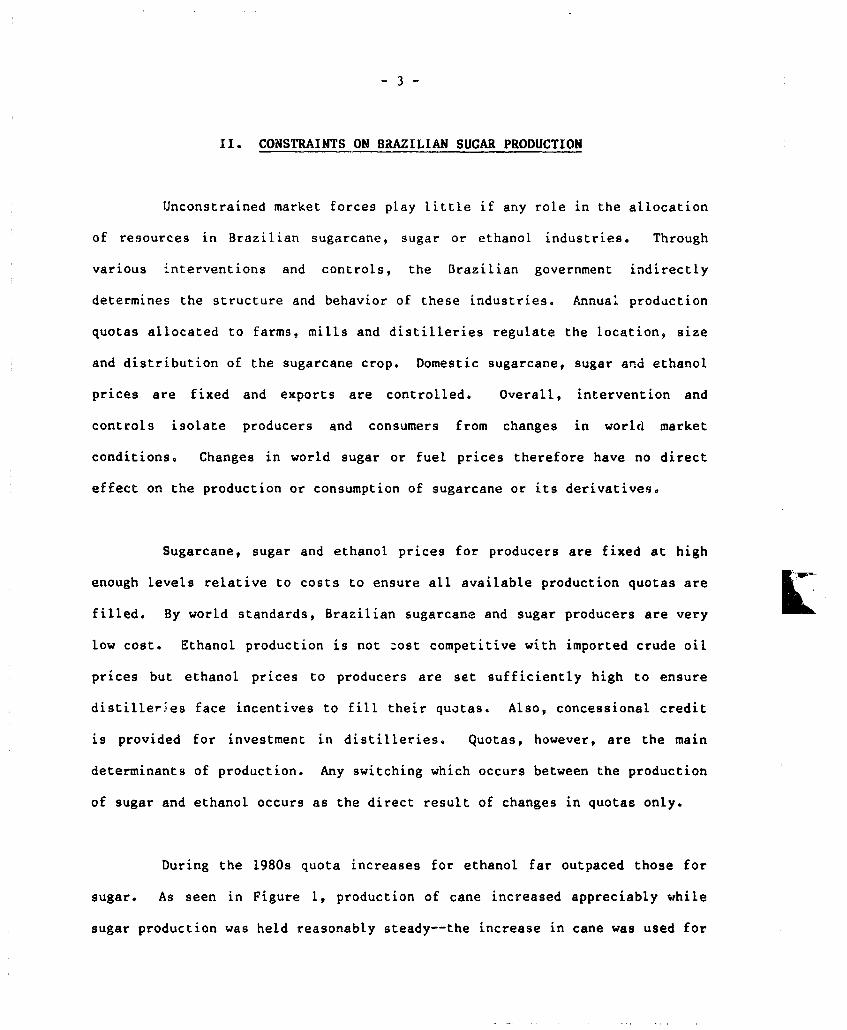
II. CONSTRAINTS ON BaAZILIAN SUCAR PRODUCTION
Unconstrained market forces play little if any role in the allocation
of resources in Brazilian sugarcane, sugar or ethanol industries. Through
various interventions and controls, the Brazilian government indirectly
determines the structure and behavior of these industries. Annual production
quotas allocated to farms, mills and distilleries regulate the location, size
and distribution of the sugarcane crop. Domestic sugarcane, sugar and ethanol
prices are fixed and exports are controlled. Overall, intervention and
controls isolate producers and consumers from changes in world market
conditions. Changes in world sugar or fuel prices therefore have no direct
effect on the production or consumption of sugarcane or its derivatives.
Sugarcane, sugar and ethanol prices for producers are fixed at high
enough levels relative to costs to ensure all available production quotas are
filled. By world standards, Brazilian sugarcane and sugar producers are very
low cost. Ethanol production is not zost competitive with imported crude oil
prices but ethanol prices to producers are set sufficiently high to ensure
distilleries face incentives to fill their quotas. Also, concessional credit
is provided for investment in distilleries. Quotas, however, are the main
determinants of production. Any switching which occurs between the production
of sugar and ethanol occurs as the direct result of changes in quotas only.
During the 1980s quota increases for ethanol far outpaced those for
sugar. As seen in Figure 1, production of cane increased appreciably while
sugar production was held reasonably steady--the increase in cane was used for

-4-
ethanol production Polici is favor the consumption of ethanol over other
fuels and regular increases in supply have been necessary to meet the energy
demands of the ever-enlarging fleet of ethanol-powered cars.
Until recently the retail price of ethanol was set at a substantial
discount relative to the blended gasoline/ethanol price, and many cars are
fully reliant on pure ethanol. It is very costly to convert ethanol-powered
engines to gasoline. The ethanol fuel program has reduced Brazil's dependence
on imported oil, but has made its economy highly dependent on the use of
sugarcane for ethanol production. Each year the stock of cars running on pure
ethanol is increasing. With total production controlled by government
policies, large volumes of the 1989/90 cane crop have been diverted from sugar
production to meet the rising ethanol demand. This has occurred despite the
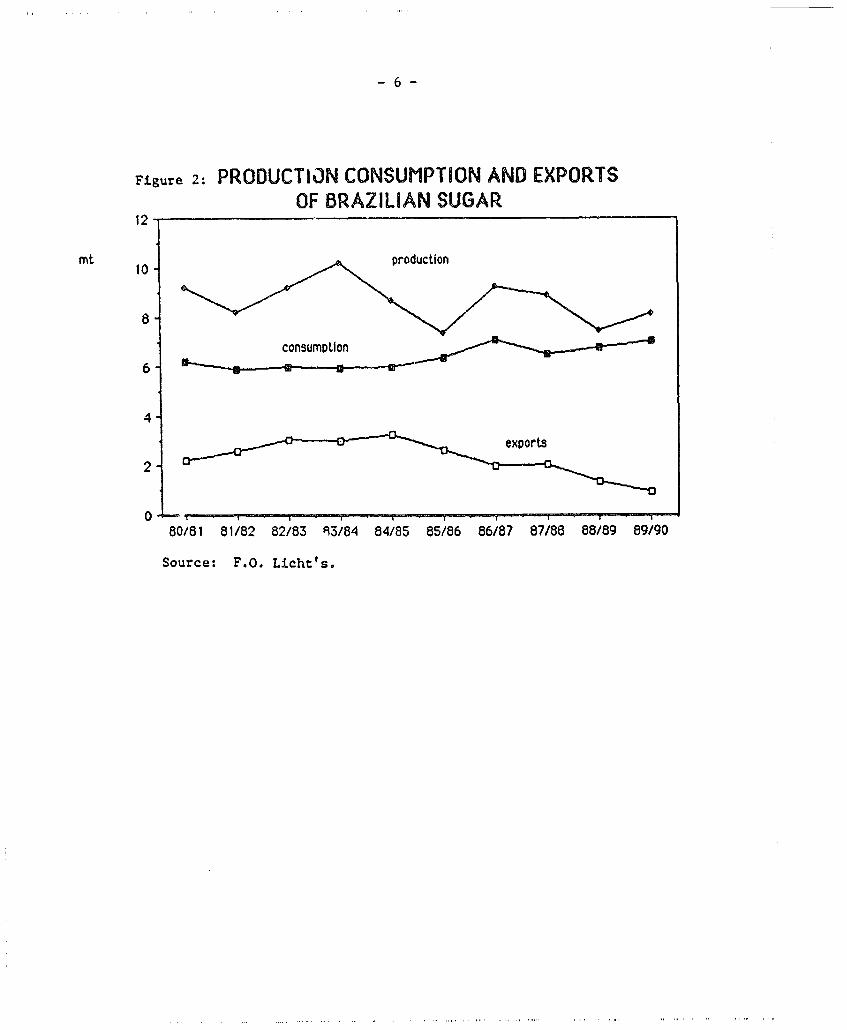
higher sugLr prices and has caused Brazil's sugar exports to decline to a 25-
year low--in fact they have been declining since 1984/85 (see Figure 2). The
empirical evidence (see Wong, Sturgiss and Borrell, 1989) is that Brazil's
capacity to switch cane between sugar and ethanol in response to even larger
changes in crude oil and sugar prices is greatly limited under current
policies.

-5-
Figure 1: 2ANEAND7 SW zA X7qU7Ct A 7 21NIN &4.7AZ
250
mitow CAI.^ -fcam, an -lAg suga
200 -
150 /
100 1979/80 1980/81 1981/82 1982/83 1983/84 1984/85 1985/86 1986/87 1987/88 1988/89
Source: World Bank, Brazil Agriculture Operations Division,Latin America and the Caribbean Region.
-6-
Figure 2: PRODUCTION CONSUMPTION AND EXPORTSOF BRAZILIAN SUGAR
12 -
mt 10 production
consumptlon,
6 -
4
2
80/81 81/82 82/83 3/84 84/85 85/86 86/87 87/88 88/89 89/90
Source: F.O. Licht's.
-7
I1I. A MODEL OF THE BRAZILIAN SUCARCANE, SUGAR ANI ETHANOLINDUSTRY POLICIES
The workings of the various instruments included in Brazil's
cane/sugar/ethanol program are illustrated in Figure 3. The demand for
sugarcane is a derived demand arising from the demand for sugar (domestic and
international) and the demand for ethanol. The derived demand arising from
Brazilian sugar conFumers is represented in the left panel of the graph
(dds). The demand for sugarcane for the production of ethanol is the derived
demand after taking into account all policies favoring the consumption of
ethanol over other fuels and is represented in the middle panel (dde'). In
the absence of such policies the derived demand for sugarcane emanacing from
ethanol demand would be highly inelastic over a small range and then become
perfectly elastic reflecting the world price of other fuels. This is also
represented in the middle panel (dde). In the right-hand panel the rest-of-
the-world demand and supply of sugar are represented in sugarcane equivalent
terms.
The total supply of Brazilian sugarcane, if the market were
undistorted, is represented in the left :nel (ss). For the purposes of
illustration it is assumed that the Brazilian market for sugar provides the
primary demand for sugarcane and consumes ql. Excess supplies of sugar are
exported to the rest of the world. In sugarcane equivalent terms, q2-ql is
depicted as being exported from the left panel and imported in the right-hand
panel, and the world market is in equilibrium at the world price (WP--
expressed in sugarcane equivalent terms). Excess supplies are also made
available to the ethanol industry and market, as shown in the middle panel.
(q3-q2) of sugarcane is transferred to the ethanol market for sugarcane.
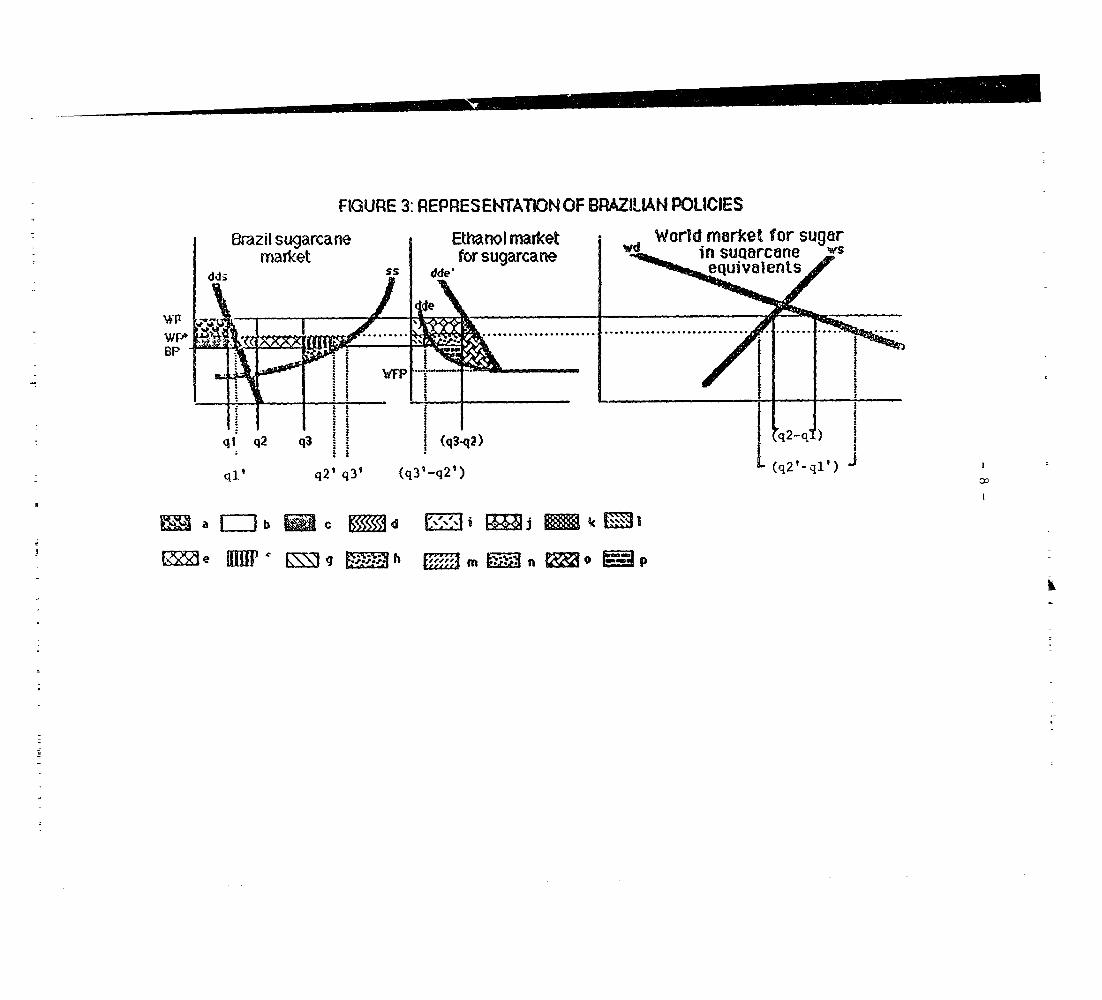
FIGURE 3: REPRESENTATION OF BRAZILIAN POLICIES
Brazil sugarcane Ethanol market World market for sugarmarket efor sugarcane in suarcane w
ddp Ss dd&e eQuies
t~~~~ I s-__{ qj q2 q3 f (q3.q2) XL2-)
ql' q2' q3' (q3v-q2') (q2'-ql
=a | jb E c dd e";;" I j gc
e El1 ~m? g MO , h 3m n o ° 3p
_-9-
The supply of sugarcane to sugar mills is limited by production
quotas on sugar and delivery quotas on sugarcane itself--equivalent to q2.
Once the quotas to the sugar mills are filled, excess supplies of cane are
used to fill the delivery quotas to ethanol distilleries and .he production
quotas placed on distilleries themselves (q3-q2). Irrespective of whether
cane is delivered to distilleries or mills, growers receive the government-
fixed cane price (BP). As depicted, the cane price is set sufficiently high
to ensure all quotas (in total the sugarcane quota is q3) are filled. It is
assumed that prices for sugar and ethanol to consumers are set in a manner
that enabl.!s the dcmestic markets to clear. In reality, prices and quota
levels are not always consistent with the market clearing at government-fixed
prices. This opens the opportunity for black mar eteering. For the sake of
analysis it is also assumed that domestic sugar prices are set in line with
world prices, though in fact the world price fluctuates widely and domestic
price. are fixed, being sometimes above and sometimes below the world price.
The economic effects of the policies can be illustrated by comparing
the present situation to that which would prevail under competitive free
trade. This is also tepresented in Figure 3. The fixed cane price, production
and delivery quotas, and policies favoring ethanol consumption would no longer
apply. Demand for ethanol would change in line with that represented Uy curve
dde instead of dde'. Unless there was a substantial change in relative world
sugar/fuel prices (compared to the current situation in the world markets for
these commodities), the change in demand for cane from the ethanol sector
would lead to a significant quantity of sugarcane being diverted from ethanol
to sugar production in the long term [(q3-q2)-(q3'-q2')]. In the short term,
10 -
ethanol may not be represented by the opportunity cost of alternative fuels
because the cost of converting ethanol-powered engines to alternative fuels is
high. Nonetheless, in th long term, greater quantities of sugar would be
produced for the world market (not only because of switching from ethanol to
sugar but also because (q2'-q3') extra sugar would be produced as a result of
dropping the production controls) causing the world price to decline from WP
to WP*; (q2'-ql') would be exported to the world market. The extent of the
world price decline would principally depend on the nature of supply and
demand in all other trading countries (that is, by the slopes of the demand
and supply curves in the right-hand panel).
If Brazil's impact on the world sugar market is not large and the
world price does not decline below BP, the production and income of Brazilian
sugarcane growers could increase in a free trade situation. This situation is
depicted in Figure 3. Growers' welfare would increase by c+d+e+f+g+h.
Economic rents represented by a+c, which are currently being received by
either the government or others in the marketing chain, would be lost. As
indicated, growers would receive c. Consumers would receive a. Consumers
would also gain b. Fuel users would gain i+j+k+n+o+p, while others in the
ethanol marketing chain currently gaining rents equal to i+j+l+m would lose
them. However, the government would save on s'lbsidies currently being paid to
ethanol producers (not shown in the graph). Overall, the gains to the
Brazilian economy would be at least b+d+e+f+g+h+k+o+p.
If Brazil's impact on the world sugar market is large and the world
price declines significantly below BP, it is conceivable that the production
- 11 -
and income of Brazilian sugarcane growers could decline in a free trade
situation. Nonetheless, the Brazilian economy is still likely to benefit due
to the reduction in fuel costs. Ultimately, the benefits of switching cane
from ethanol to sugar production depend on Brazil's impact on the world price.
This, in turn, depends on the elasticity of demand for Brazilian sugar.

- 12 -
IV. BRAZIL'S IMPACT ON THE WORLD SUGAR PRICE
Government intervention in domestic sugar markets is widespread and
typically insulates producers and consumers from changes in the world price.
World production and consumption are, therefore, relatively unresponsive to
changes in the world price, at least in the short term. Only stock demand is
relatively responsive to changes in the world price, and then only at certain
times (as discussed below).
Because consumption and production are largely unresponsive to
changes in the world price, increases in Brazil's production may need to be
matched (mostly) by increased quantities of stocks demanded in other countries
in the short run. The world price will adjust to induce stockholders to
willingly hold such stocks. Changes in stock demand may, therefore, be
important in understanding the price effects of increases in Brazilian supply.
When stock levels are high, security of supply is well established
and the value of stocks is low. Accordingly, the world price is low. A small
change in stock levels either way will not change the implied level of
security much. So, any additional supply from Brazil could be held as stocks
without much change in the value of total stocks, implying little change in
the world price. If, however, stock levels are very low then the existing
stocks have very high value (world price is high). A small change in supplies
at this time will have a relatively large impact on security. An increase in
supplies from Brazil would quickly increase security and therefore the world
price might fall rapidly. In the short run, therefore, Brazil's influence on

- 13 -
the world price could be greater when the world price is high compared to when
it is low because of the response of stocks demand.
Although slowly, policy makers do respond to changes in the world
sugar price, causing some response in production and consumption over the
longer term. The world sugar price is notoriously volatile and cyclical. And
at times, changes in policy can be large. Therefore, over the longer term,
other countries may make adjustments to help accommodate the increased
production from Brazil, thus lessening Brazil's impact.
Volatility in world agricultural commodity markets generally gives
rise to forces which compel farmers to form coalitions and to demand political
action to address farm problems caused by price instability and risk. The
incentives for consumer groups (and perhaps taxpayers) to respond politically
to volatile prices are different from those of farmers. Uneven political
pressures from producers, consumers and taxpayers are postulated by Wong,
Sturgiss and Borrell (1989) to give rise to policy intervention which
consistently favors one group over another in domestic sugar markets. Usually
this involves protection to farmer groups. Policy responses to changes in the
world price are therefore postulated to be asymmetric. Production quotas and
producer (and consumer) prices are usually increased one or two years after a
world price rise or peak, but are decreased only slowly in response to price
falls.
In the past, long periods of surplus production have followed price
booms. When prices fall due to a surge in production, producers have a strong
14 -
incentive to see their fixed investments protected. Given that governments
may have, or appeared to have, encouraged their industries to expand in the
first place, politically it is difficult to lower protection--despite the
rising economic and financial costs of such policies. The continuing
protection of the enlarged industries causes another sustained period of
depressed prices. Indeed, the expectation of increased protection resulting
from low prices may be an incentive for producers to overexpand when given the
opportunity to do so due to a policy change.
Only after long periods of depressed prices is action likely to be
taken to decrease levels of government support. With low world prices the
costs of export rebates and government stockholding increase considerably.
Further, the costs to consumers increase, Eventually, these mounting costs
lead to changes in the domestic price level or to changes in other instruments
such as production controls, but these changes occur slowly and only after
sustained periods of low prices.
In the long term, the asymmetry of policy and production to changes
in the world price in many countries may hold important implications for
Brazil. Contrary to the short-run impact, Brazilian expansion will have less
effect on the long-run average world price if it occurs when the world price
is rising than if it is falling. Such results have been obtained in analyzing
Australia's long-term impact on the world market (Sturgiss, Connell and
Tobler, 1990). Expansions which ease supply shortfalls duting a period of
rising prices will reduce the extent of the peak in the price cycle. The
incentives for policy changes in other countries, particularly high-cost

- 15 -
countries which otherwise encourage large expansions, will be lessened.
Taking account of the phase of the world price cycle when expansion begins
may, therefore, be important to understanding Brazil's potential to affect the
world market.
Changes in the world market could alter Brazil's future impact on the
world price. There could be changes in the responsiveness of world demand and
supply to movements in the world price. A move towards less regulation
through the current GATT round of multilateral traae negotiations would expose
more producers and consumers to the world price. The emergence of close
substitutes for sugar, such as aspartame or crystalline high fructose would
also make consumers somewhat more responsive to changes in the sugar price.
Such increased responsiveness of producers and consumers would make the
effects of a Brazilian expansion on the world price less than might currently
be the case.

- 16 -
V. EMPIRICAL ESTIMATES OF BRAZIL'S INFLUENCE ON THE WORLD PRICE
The world sugar market model of Wong, et al (1989) was used to
estimate Brazil's potential impact on the world market price. Sustained
increases in Brazilian sugar production of O.S million tons, 2 million tons
and 6 million tons were simulated and compared with a baseline run in which
producLion was assumed to increase in a fashion similar to what has occurred
in the past. To examine the sensitivity of Brazil's influence on price at
different phases of the world price cycle, sustained increases were simulated
from two different start dates.
Although sustained output increases provide a basis on which to
estimate Brazil's influence on the market, in reality if producers were
exposed to world prices they would have incentives to respond to and
anticipate price changes. Accordingly, production would vary to some extent
with fluctuations in the world price. The potential for Brazilian producers
to respond to the world price in an unregulated environment cannot be easily
determined. However, to provide some representation of the potential effects
of producer flexibility, a procedure similar to that used by Wong, et al was
used. I/
1/ The procedure used in this study varies from that used by Wong et al inthe way the price expectation variable is specified. In Wong et al thedeterministic world price is used as the expected price, and the assumedforecasting error is the difference between the deterministic andstochastic world price. The forecasting error is therefore explained byrandom shocks which producers cannot anticipate. This technique iscomputationally complex because both deterministic and stochastic versionsof the model must be solved simultaneously. The computer time taken torun the model more than doubles compared to when just one version of the
For each simulation, the model was run 60 times over the period 1985
to 2004 with different shocks representing random elements affecting produc-
tion (such as weather) being applied in each year and in each simulation. The
results presented are the averages of the 60 simulations for each year. They
therefore represent the average impact under a wide range of potential market
conditions. Accordingly, the results should be regarded as illustrative of
the potential impact under a variety of market conditions rather than forecast
effects based on current market conditions. The forward simulations are
performed based on market information up until 1985. The simulations therefore
do not take into account the recent, and most unexpected, decline in Brazilian
exports. The prices presented for the baseline simulation are not World Bank
forecasts. They do, however, represent the type of price behavior that can
generally be expected in the world market--although to some extent the true
variability of price is masked by the averaging of the 60 simulations.
The estimated effects of sustained increases in production and
exports from 1985 onwards are presented in Table 1. Over the entire 20-year
period simulated, the 0.5 million ton increase in Brazilian production
translates into an average 8.3% increase in exports. Because the increase is
model is run. To overcome this difficulty a simpler procedure was used
which achieves a similar result. The expected world price was set equal
to the stochastic (or actual model-generated) world price plus a random
error with a mean of zero and a standard deviation equal to that generated
for each year from all 60 stochastic runs for the baseline. The assumed
producer forecasting error was therefore assumed to be random with a
distribution reflecting the expected distribution of prices in any
particular year, given the typical sorts of random shocks in production
and their effect on the uncertainty of prices. The standard forecasting
error is over 40% of the long-run average world price, and is therefore
quite large.

TabWe I Effects on World Price of Sustained Expansions from 1985 Onwards
Year Simulated ------------------- Cange in World Pr e --World Price 8.3% increase in exports * 32.6% increase ip exports* 96.1 % increase 'n exports *
USc/lb % Elasticity of % Elasticity of % Elasticilty ofExport Demand Export Demand Exp)ort Demano
1 985 7.3 -4.4 -3.1 - 16.4 -3.3 -40.2 -4 01 986 6.1 -5.7 -2.5 -20.6 -2.7 -47.9 -3 31 987 8.3 -6.2 - ?.7 -22.6 - 1.8 -52.7 -2 21 988 9.0 -5.5 - 1.8 -21 .1 - 1.9 -52 0 -2 21989 1 4.5 -5.5 - 1.6 -20.7 - 1.7 -54 0 - 1.81 990 1 4.1 -3.5 -2.7 - 16.3 -2.3 -48 2 -2 31 99 1 1 1 8 -2.5 -3.7 - 12.7 -3.0 -42.3 -2 61 992 1 5.2 -2.6 -3. 1 - 1 1.2 -2.9 -38 2 -2 51993 26.6 -2.6 -3.0 -10.4 -3.3 -36 0 -2 51 994 22.4 - 1.8 -4.6 -6.7 -4.9 -24 6 -4 01 995 1 3.7 -0.7 -1 1.6 -2.2 - 1i1.2 - 10 8 -9 01996 11.9 -0.8 -9.4 -4.2 -7.1 -13.7 -651997 13 0 - 1.5 -4.9 -7.7 -3.8 -23 1 -3.81 998 1 4.0 -2.1 -3.7 -9.3 -3.3 -26.4 -3 51999 13 6 -2.2 -3.4 -8.8 -3.4 -27.0 -3 32000 12.9 -2.3 -3.3 -9.0 -3.4 -26 0 -3 42001 18.6 -2.1 -3.1 -8.1 -3.2 -25.8 -3 02002 20.6 -1.4 -4.9 -6.3 -4.4 -22 8 -3 62003 1 7.3 - 1.7 -4.0 -4.6 -6.0 -1 6 8 - 4 92004 15.4 -0.6 - 10.7 -3.2 -8.2 - 1 3.6 -58
Avereae 14.3 -2.4 -3.5 -9.8 -3.3 -30 1 -3 ?
>: Baseline average of 60 stochastic simulations in 1984 dollar terms.
Average increase across all simulations and all years.
19 _
constant over the period, it is a declining percentage of total exports
through time--exports are simulated to grow through time irrespective of the
exogenous increase. Similarly, the 2 rillion ton and 6 million ton increases
translate into 32.6% and 96.1% average increases in Brazilian exports.
Based on the sin, lation results, the elasticity of Brazilian exporL
demand over the projections period is estimated at between -_.5 and -3.2,
implying that each 1% increase in Brazilian exports would lower the world
price by between 0.29% and 0.31% (i.e., the reciprocals of the estimated
elasticities) on average over a long period. 2/ Brazil is therefore estimated
to indeed be influential in affecting the world price, but its influence is
estimated to be insufficient to mean that Brazil could increase total revenue
by restricting production. For this to occur, the elasticity would have to be
greater than or equal to -1.0.
The impacts of .ie sustained increases on the world price are seen to
vary through time about a declining trend. In part, the declining trend is
explained by the growth in world consumption through time. It is also
explained by the adjustments which Brazil's expansion induces in other
countries. The greatest impact occurs 3 to 5 years after the expansion. The
delayed impact occurs because the simulated increase begins in a period of low
world prices when stocks are already at a high level. As explained earlier,
when stocks are high small changes in them do not much affect the implied
security of supply and so prices change less than when stock levels are low.
Nonetheless, because production and consumption worldwide are so unresponsive
2! The ransformation from price elasticities to price impact can be madeunder certain conditions--see, for examp' , Houck (1965).
- 20 -
to changes in the world price in the short term, increased exports by Brazil
during a period of low prices cause an increase in world stocks generally.
This prolongs the period of depressed prices, having a relatively large
negative ettect during a period when prices first start to increase.
Brazil's increases have their least effect on the world price in the
period immediately following a boom. This is due to two behavioral
characteristics incorporated in the model. First, is the fact that lower
prices during a boom period reduce the incentives for changes in policies
which, in the past, have led to large increases in production worldwide.
Reduced production elsewhere in the world mitigates the effects of Brazil's
expansion. Second, is the effect on stocks referred to above.
The fact that Brazil's influence on the world price is lower during
periods of high prices and immediately after them raises questions about the
timing of expansions. In Figure 4, the impact on the world price of sustained
0.5 million ton increases starting in 1985 or 1992 (the beginning of a boom
period) are compared. The initial impact is less for the 1992 start date than
for the 1985 start date. Moreo:er, although beginning the output increase in
the run-up to a boom is more influential in reducing very high prices than
during a depressed phase, virtually throughout the remainder of the period the
impact on price from the 1992 start date is less. Indeed, in the period
following the boom, prices in this simulation actually increase due to the
fact that other countries are not encouraged to expand as dramatically in
response to the boom as they do in the other simulation. The elasticity of
export demand in the 1992-start simulation is estimated at 4.4 over the 13
years to 2004, implying that a 1% increase in exports would lower the world
price by 0.23%, compared to around 0.3% when the increase starts in 1985.

- 21 -
Figure 4: Comparison of effect on prie of 5uswired mwmases m 1985 vs 1992
2-impacsat 1992 egaLsion
on worm
priceO- - El oc3 o3 B E3-1
-2 -
-4 185 expawsio
-6-
1980 1990 2000 2010
yen

- 22 -
As sLated e ar ier, sustained Bra7i I iat iut put increases may niot be
realistic if producers are free to respond to the variability in the world
price. As well as increasing production and exports to a greater extent when
prices are high, producers would tend to reduce production as prices fall.
Thus, world prices would be less variable ir. this more realistic world.
Without a detailed analysis, it is not possible to determine the
flexibility of producers to respond to the world price. However, to provide
some representation of the potential effects, it was assumed producers could
respond directly to expected world prices to produce an additional quantity of
sugar. It was assumed that when expected world prices rose above USC10/lb,
producers would progressively increase production up to a maximum additional
quantity of 2.5% of world production at an expected price of US'25/lb. The
flexible component of production was added to the non-;lexible component.
For illustrative purposes, three forms of price expectations were
assumed--model-consistent expectations, perfect fo.-sight, and naive
expectations. Under model-consistent expectations, producers are assumed to
have knowledge of all the information embodied in the model and to form their
expectations of price in the same fashion as the model solves for price.
However, because of random factors producers will make price forecasting
errors. Their forecasting errors are assumed to be normally distributed with
a mean of zero and a standard deviation equal to the standard deviation of
prices for each year generated by the 60 stochastic runs of the model--which
ranges from USC2.7/lb to USc8.5/lb (also see footnote 1).

The other forms of expectations were chosen as extreme alternatives.
Under perfect foresight, producers are assumed to make no forecasting error,
while under naive expectations producers are assumed to expect that next
year's price will not be different from the current price. Perfect foresight
provides an upper bound on the possible effects of expectations on production
flexibility, while the naive expectations assumption provides a lower bound.
The potential price impacts of allowing producer flexibility in
supply are presented in Table 2. The results under the assumption of perfect
foresight suggest that if producers are able to anticipate prices exactly,
increasing production and exports to a certain extent can raise prices in some
instances (1995-2000 in Table 2) and cause the long-term impact on price
(-0.07% for each 1% increase in exports) to be considerably less than when
one-off, sustained increases are introduced. Even allowing for quite large
forecast errors (equal to more than 40% of the average world price under
model-consistent expectations), similar, though slightly less pronounced,
impacts are simulated. The counter cyclical nature of producers' response to
the world price under model-consistent expectations tends to make price less
variable, as seen by substantial reductions in the coefficient of variation
(0.46 to 0.392). Even under naive expectations there is some reduction in the
coefficient of variation. Under naive expectations the average negative
impact on the world price is, however, similar to that observed when sustained
increases are simulated (-0.36). The world price impacts of flexible produc-
tion under the assumptions about price expectations are shown in Figure 5.

- 24 -
Tdble 2: Impdct on Worild t'rice vi1li :vexAle Production (1984 USf/Iu)
Model odel
Model Consistent Consistent
Naive Consistent Pertect 7.5-25 USf/Ib 7.5-25 USt/lbYedr BaselIne Fxpectat cii, Expectations Foresight 2.5% Limit 5.0% Limit
1985 7.3 7,3 (0.0) 7.2 (-0.09) 7.3 (-0.03) 7.2 (-0.13) 7.1 (-0.23)1986 6.1 6.1 (-0.02) 6.0 (-0.04) 6.1 (0.0) 6.0 (-0.09) 5.9 (-0.16)1987 8.3 8.3 (-0.02) 8.1 (-0.15) 8.2 (-0.08) 8.0 (-0.25) 7.8 (-0,44)
1988 9.0 8.9 (-0.09) 8.7 (-0.21) 8.8 (-0.1) 8.6 (-0.36) 8.3 (-0,62)
1989 14.5 14.3 (-0.18) 13.4 (-1.09) i3.5 (-1.01) 13.2 (-1.31) 12.3 (-2,17)1990 14.1 13,. (-1.13) 13.0 (-1.13) 13.1 (-1.0) 12.8 (-1,34) 11.9 (-2,22)1991 11.8 11.0 (-0.77) 11.5 (-0.36) 11.5 (-0.28) 11.3 (-0.54) 10.8 (-1.01)
1992 15.2 14.6 (-0.55) 14.6 (-0.59) 14.6 (-0.61) 14.4 (-0.76) 13.7 (-1.49)199w 26.6 24.8 (-1.72) 23.1 (-3.5) 22.8 (-3.79) 23.0 (-3.53) 20.1 (-6.5)1994 22.4 18.6 (-3.72) 20.2 (-2.11) 20.2 (-2.2) 20.2 (-2.15) 18,2 (-4.12)
1995 13.7 12.4 (-1.33) 14.6 (0.94) 14.9 (1.22) 14.4 (0.74) 14.4 (0,73)
1996 11.9 12.3 (0.39) 13.5 (1.58) 13.6 (1.69) 13.3 (1.34) 13.7 (1.78)1997 13.0 13.8 (0.75) 14.3 (1.27) 14.4 (1.33) 14.0 (0.98) 14,1 (1.06)1998 14.0 14.1 (0.08) 14.5 (0.49) 14,7 (0.66) 14.3 (0.24) 13,9 (-0.15)
1999 13.6 13.0 (-0.06) 13,8 (0.21) 14,1 (0.5) 13.5 (-0.03) 13,1 (-0,49)
2000 12.9 12.3 (-0.54) 13.2 (0.36) 13.5 (0.64) 13.0 (0.14) 12.7 (-0.18)
2001 18.6 18.3 (-0.34) 18.4 (-0.22) 18.5 (-o.1) 18.2 (-0.44) 17.0 (-1.56)2002 20.6 18.8 (-1.86) 19.7 (-0.96) 19.6 (-1.07) 19.5 (-1,13) 18.0 (-2.67)2003 17.3 15.2 (-2.06) 17.0 (-0.29) 17.2 (-0.0?) 16.8 (-0.44) 15.9 (-1.33)2004 15.4 14.6 (-0.85) 15.8 (0.38) 16.3 (0.86) 15.6 (0.16) 15.2 (-0.27)
Average 14.3 13.6 (-0.7) 14.0 (-0.3) 14.1 (-0.2) 13.9 (-0.4) 13.2 (-1.1)
Coeff. Var 0.466 0,429 0.392 0.382 0.397 0.357
Average I impact Per 1 -0.30 -0.11 -0,07 -0.16 -0.21Increade in txports
Average % Increase in 14.1 17.1 16.5 19.9 36.2Exports
Average E lasticity ot -2.77 -8.82 -14.15 -6.35 -4.72xport Dcmand
Note. ( i iS ch3'qe -_5¢'11 (1984 uii ars, comnodred to the baseline.
Source: ori d i ., L. ! i ; .
Octctier 10, 1990

L
Figure S: Impact on World Plrice with Flexible P'roductionunder Alternative Assumpticns about Price Expectations
2 - ---------
1---…- to rb X Cn _ tM vPe fect Foresiga_
0. ~ ~ ~ ~~~~_Mo el Consis t~
C ci 3, TablE
-0.5Nave (col2 Tble 2)
Real :zzti. Ye1984.
USC,/lb I 2-1.5 ----
-2.5 -- - - -1-
-3-….
- t-~~~I cF - I-nc -CO0 r-j M Yt U-- (D - CO CM CMO C M
Years

- 26 -
The average negative impact is also sensitive to the amount of
flexible production assumed and to the price range over which flexible
production is assumed to take place. In Table 2 and Figure 6 the effects of
changing both the amount and the range are demonstrated. When the range is
changed from 10-15C/lb to 7.5-25c/lb (7.5C/lb is more in line with the sugar
price at which sugar starts to become clearly more profitable than ethanol),
the elasticity of export demand under model-consistent expectations changes
from -8.82 to -6.35--and the increase in exports over the baseline run changes
from +17.1% to +19.9%. When the maximum allowable amount of flexible
production is doubled from 2.5% of world production to 5% (over the price
range 7.5-25C/lb), the estimated elasticity changes from -6.35 to -4.72. The
increase in exports over the baseline changes from +19.9% to +36.2%. Compared
to the baseline, the coefficient of variation in world prices is reduced by
about 22%.
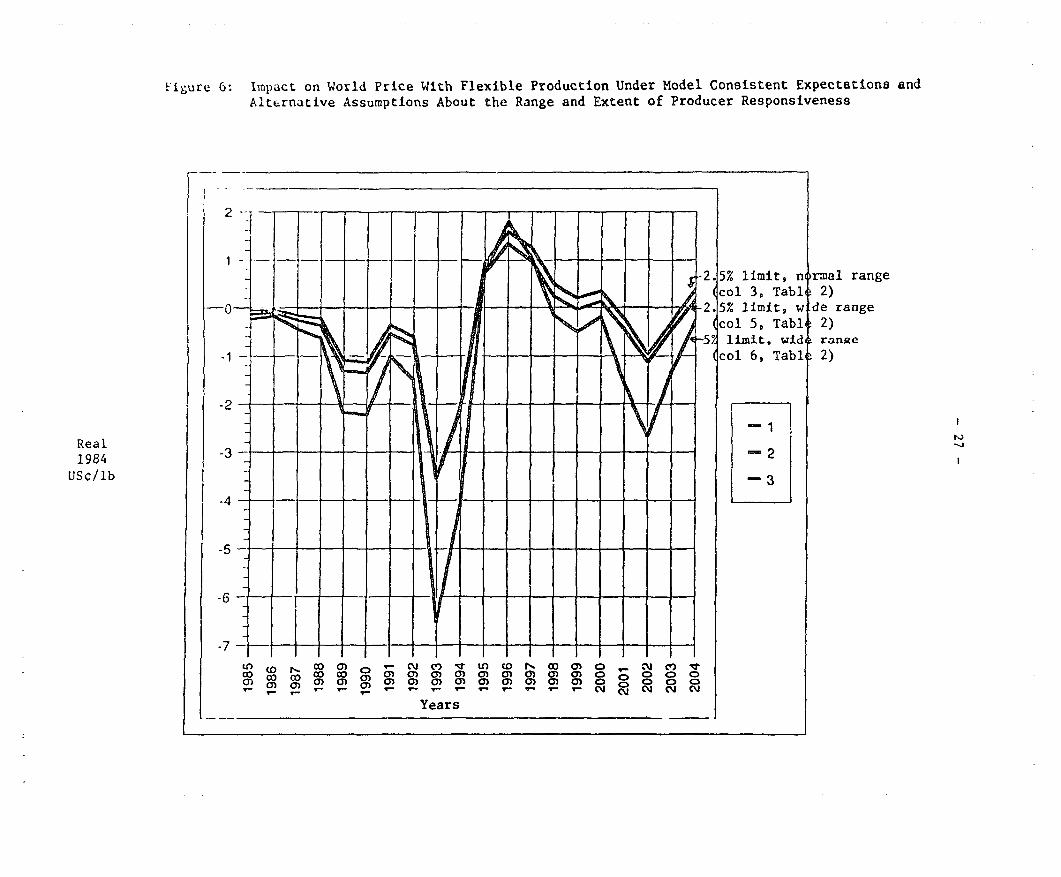
Figure 6: Impact on World Price With Flexible Production Under Model Consistent Expectations and
Alternative Assumptions About the Range and Extent of Producer Responsiveness
r2.5% limit, normal range(col 3, Table 2)
-0 ~ ~ ~ ~ ~ ~ ~ ~ ~ ~ -- -. 5% limit, wOde range(col 5, Tabli 2)
52 limit, wid ranRe
al C ° au a) '5' a) a) a) cn a) o( c)col 6, Tabli 2)
-2 ~ ~ ~ ~ ~ ~ ~ ~ ~ ~ -
Real1984
USc/lb -
(Or- 0'~~ N C)~ (0 cON~0) O~. ~J C'~ 3
a-)M 0`0) 0)0)0)0)0)0)0)0) 0)OC0O CD
Years
- 28 -
VI. CONCLUSIONS
Although facing political difficulties ii, attempting to switch
sugarcane away from the production of ethanol to sugar production and exports,
Brazil potentially could achieve large economic gains from doing so. However,
because of the vast quantities of sugarcane which could be switched to sugar
production, the impact this might have on the world price for sugar could have
a bearing on the economics of reforming the sugarcane, ethanol and sugar
industries in Brazil.
Results presented in this paper suggest that changes in Brazil's
sugar production have a reasonably large impact on world sugar prices in the
short term. Nonetheless, its influence is not estimated to be great enough,
either in the short term or long term, to enable Brazil to increase total
revenue by restricting production (through the continued use of quotas). From
the results it appears that the long-term impact that Brazilian expansion
would have on the world price is sensitive to the types of policies Brazil
adopts. Expansions of exports occurring as the result of sustained increases
in quotas would have a larger relative negative impact on the world price than
if the same long-term percentage increase were achieved by leaving producers
free to respond to world prices (i.e., they adjust their production and
exports in response to expected prices).
There are general reasons for believing that Brazil's long-term
impact on price could be even less than estimated here. Orcutt (1950)
discusses a number of reasons why econometric estimates of price elasticities

- 29 -
in incernational trade may be underestimated, which implies that a country's
potential impact on world prices from changes in supply would be
overestimated. Some of Orcutt's reasons may be valid with respect to the
estimates in this paper. Further, as reviewed earlier, if structural changes
in the world market make the rest of the world's producers and consumers more
responsive to the world price in the future, Brazil's impact on the world
price from changes in its exports will tend to be less than estimated.
Based on these findings it seems reasonable to conclude that although
Brazil appears to have the pote tial to influence world sugar prices to some
degree in the short term, it is nonetheless unable to influence them t'.. its
short- or long-term advantage by restricting production. Indeed, to the
extent that the results presented suggest the possibility that Brazil could
introduce an element of stability to world prices by allowing its producers
increased flexibility in production, removing existing production controls
could provide not only substantial economic gains in terms of increased
exports to Brazil but also more stable world prices. For other producers,
there could be a trade-off in terms of lower but more stable incomes.

- 30 -
References
Houck, J.P. (1965), "The relationship of direct price flexibilities to directprice elasticities," Journal of Farm Economics, 47, 789-93.
Orcutt, G.H. (1950), "Measurement of the price elasticities in internationaltrade," The Review of Economics and Statistics, XXXII (2), 117-31.
Sturgiss, R., Connell, P. and Tobler, P. (1 '0), "Australia's influence onworld sugar prices," Agriculture and Resource Quarterly, 2(1), 47-55
Wong, G., Sturgiss, R. and Borrell, B. (1989), The Economic Consequences ofInternational Sugar Trade Reform, ABARE Discussion Paper 89.7, AGPS,Canberra.
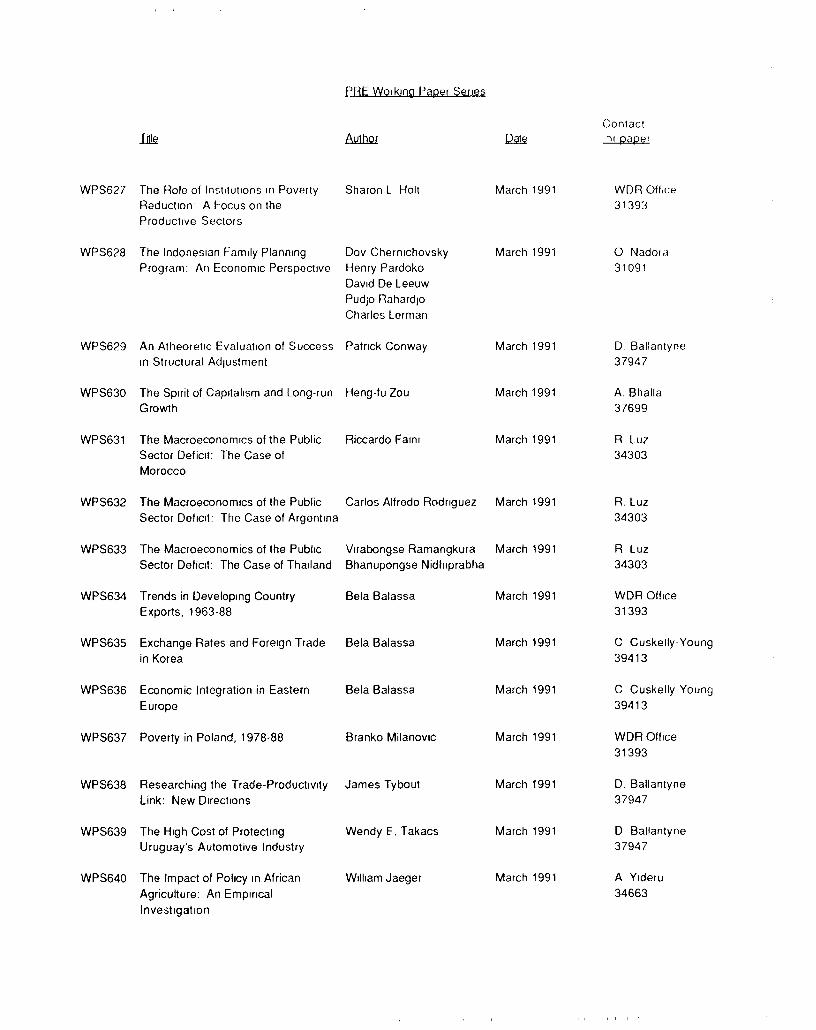
PRE Working Paper Series
Contactle AAuthor mi papeL
WPS627 The Role of Institutions in Poverty Sharon L Holt March 1991 WDR OfficeRaduction A Focus on the 31393Productive Sectors
WPS628 The Indonesian Family Planning Dov Chernichovsky March 1991 0 NadoraProgram: An Economic Perspective Henry Pardoko 31091
David De LeeuwPudjo RahardtoCharles Lerman
WPS629 An Atheoretic Evaluation of Success Patrick Conway March 1991 D. Ballantynein Structural Adjustment 37947
WPS630 The Spirit of Capitalism and Long-run Heng-fu Zou March 1991 A. BhallaGrowlh 37699
WPS631 The Macroeconomics of the Public Riccardo Faini March 1991 R LuzSector Deficit: The Case of 34303Morocco
WPS632 The Macroeconomics of the Public Carlos Alfredo Rodriguez March 1991 R. LuzSector Deficit: The Case of Argentina 34303
WPS633 The Macroeconomics of the Public Virabongse Ramangkura March 1991 R LuzSector Deficit: The Case of Thailand Bhanupongse Nidhiprabha 34303
WPS634 Trends in Developing Country Bela Balassa March 1991 WDR OfficeExports, 1963-88 31393
WPS635 Exchange Rates and Foreign Trade Bela Balassa March 1991 C Cuskelly-Youngin Korea 39413
WPS636 Economic Integration in Eastern Bela Balassa March 1991 C Cuskelly YoungEurope 39413
WPS637 Poverty in Poland, 1978-88 Branko Milanovic March 1991 WDR Office31393
WPS638 Researching the Trade-Productivity James Tybout March 1991 D. BallantyneLink: New Directions 37947
WPS639 The High Cost of Protecting Wendy E. Takacs March 1991 D BallantyneUruguay's Automotive Industry 37947
WPS640 The Impact of Policy in African William Jaeger March 1991 A YideruAgriculture: An Empirical 34663Investigation

PRE Working Paper Series
ContactBLe Author QDae for paper
WPS641 Interlemporal Substitution in Karsten N Pedersen April 1991 M HilemanConsumption: Evidence for Some 31284High- and Middle-lncome Countries
WPS642 How a Change n Brazil's Sugar Brent Borrell April 1991 A. Kitson-WaltersPolicies Would Atfect the World 33712Sugar Market
WPS643 Regional Integration among Andras lnotai April 1991 D. BallantyneDeveloping Countries, Revisited 37947