Embed Size (px)
Citation preview
Houston/Harris County/
Fort Bend County
Point-in-Time Enumeration
2014
Executive Summary
Prepared by Catherine Troisi, Ph.D. and the Coalition for the Homeless of
Houston/Harris County for the Houston/Harris County Continuum of Care
May 2014
2
Overview
A Point-In-Time (PIT) count of sheltered and unsheltered homeless persons in the Houston,
Harris County, and Ft. Bend County areas was conducted from 3 to 11 pm on 30 January 2014.
The purpose of the count was to determine the number of homeless persons [defined by the
Department of Housing and Urban Development (HUD) as those staying in emergency shelter,
transitional housing, or safe haven with beds dedicated for homeless persons or those persons
who are unsheltered (i.e., staying in a place not meant for human habitation)]. The PIT count is
a federal requirement for all communities receiving funding from HUD. Although, due to the size
of the geographic area that is covered by the count, we know that not all persons experiencing
homelessness and unsheltered can be identified in a single night, the PIT Count gives a good
assessment of the extent of the problem in the region.
The PIT count was organized and led by the Coalition for the Homeless in consultation with The
University of Texas School of Public Health and the City of Houston Department of Health and
Human Services. Many homeless services providers participated as well as community
volunteers, including homeless and formerly homeless persons.
The 2014 count enumerated individuals staying in a total of 61 shelters including emergency
shelters (n=17), transitional housing units (n=43), and one safe haven on the night of 30
January based on reports received from the providers and data entered into the Homeless
Management Information System (HMIS). Unsheltered homeless individuals (those sleeping on
the streets or in places not meant for habitation) were counted using two methods. Surface
teams (one driver, one service provider, one homeless or formerly homeless person, and one
community volunteer) drove the streets of the enumeration area observing and counting
homeless individuals. Teams left from one of ten staging areas, each of which was divided into
smaller sectors. The number of teams assigned to each sector was based on the prevalence of
unsheltered homeless in previous counts. The surface teams counted unsheltered homeless
persons found on street corners, parks, parking lots, convenience stores and other areas where
they congregate.
Areas where homeless persons were likely to be found but that are not visible from the street
were canvassed by Specialized Outreach Teams comprised of homeless outreach service
providers familiar with the areas through their professional work. These teams walked under
bridges, along the bayous and other areas where encampments of homeless had been
identified. They also investigated abandoned buildings where homeless persons may be
residing. Care was taken not to double count homeless individuals.
Changes from 2010 to 2014 in PIT Count Methodology
Several significant changes were made in the methodology of the 2011 count to improve the
completeness and accuracy of the enumeration and these were implemented and enhanced in
3
subsequent years’ counts. The first was the involvement of traditional homeless services
providers under the umbrella of the Coalition for the Homeless along with academia (University
of Texas Health Science Center at Houston School of Public Health) and a local health
department [Houston Department of Health and Human Services (HDHHS)]. This collaboration
was exemplified by including the implementation of an Incident Command System (ICS), a
standardized management tool used in fire, police, and public health preparedness activities
ensuring integration of efforts through its defined organizational structure. ICS has many
advantages including an orderly, systematic planning process and clear chains of command and
supervision. Command Central was set up at HDHHS.
Other improvements include use of ten staging areas, an increase of four over the six staging
areas used in 2010. The additional staging areas reduced travel time needed by teams to get
into the field and thus increased their time available to count homeless individuals. In 2011-13,
practice counts were held one week before the actual count but by 2014, this was no longer
needed. Training, however, was held prior to the count to allow Staging Area Captains and Co-
Captains as well as the Surface and Outreach Specialist teams to become familiar with their
duties and the geographic areas which they were to cover.
Enumeration activity included the Ft. Bend area to better characterize homelessness in that
county. Efforts in the past to count Ft. Bend homeless individuals have not been optimized and
so the extent of the problem has not been well defined. By increasing the number of teams and
adding a staging area in the county, we were able to get a better picture of homelessness in that
area.
Improvements were made in the composition and function of teams that counted unsheltered
homeless individuals. Volunteer teams included homeless and formerly homeless individuals
who could guide teams to locations where homeless individuals are likely to be found. The use
of Specialized Outreach Teams to canvass areas not readily seen by teams driving by resulted
in fewer unsheltered homeless persons remaining undetected. On the night of the count,
“SWAT” teams were formed with HDHHS personnel familiar with working with those
experiencing homelessness. These teams were sent out to sectors that needed additional
assistance identifying and counting homeless persons, thus increasing coverage of all areas.
The methodology of the sheltered count also was enhanced. This was accomplished in two
ways. First, a greater effort was made to identify and inventory all emergency shelters in the
area, whether or not they were officially part of the Homeless Management Information System.
Secondly, shelter providers were trained on entering data and assessments into HMIS and
given the opportunity to confirm the data counted on the night of the Point in Time count.
Shelters that do not use HMIS such as domestic violence shelters were asked to report using
the housing inventory chart and were encouraged to return that form for the night of the PIT and
follow-up calls were made to ensure they were received. In 2010, only 75% of the emergency
shelter projects and 69% of the transitional housing projects reported the number of persons
sheltered on the night of the PIT. For the 2011-2014 counts, due to this increased effort, 100%
4
of entities defined by HUD as housing homeless individuals for the purposes of the Point-in-
Time count reported their numbers.
The 2014 PIT Count included a modified effort, based on the 2013 YouthCounts! Initiative, to
enumerate emancipated youth ages 24 and younger who have not been optimally counted in
previous years. This was done by sending volunteer teams to places where youth were known
to congregate (such as the downtown library and areas near the University of Houston
downtown). Specialized Youth Outreach teams were also deployed during the count.
2014 PIT Count Key Findings
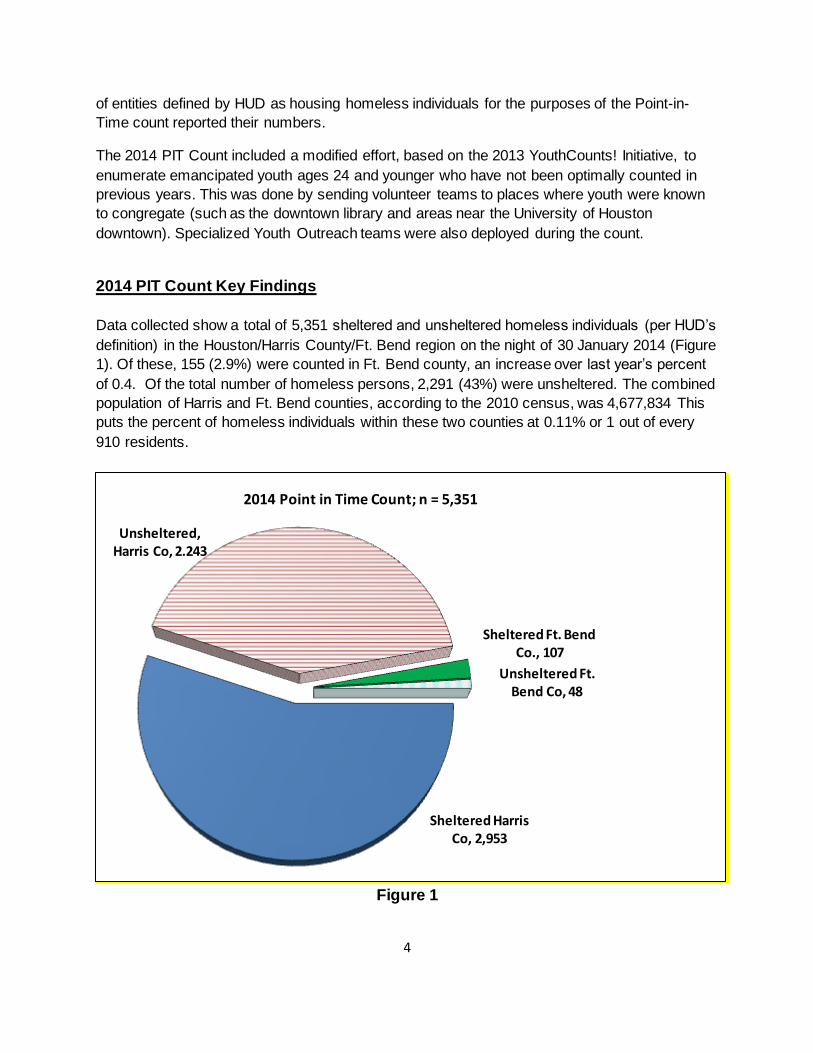
Data collected show a total of 5,351 sheltered and unsheltered homeless individuals (per HUD’s
definition) in the Houston/Harris County/Ft. Bend region on the night of 30 January 2014 (Figure
1). Of these, 155 (2.9%) were counted in Ft. Bend county, an increase over last year’s percent
of 0.4. Of the total number of homeless persons, 2,291 (43%) were unsheltered. The combined
population of Harris and Ft. Bend counties, according to the 2010 census, was 4,677,834 This
puts the percent of homeless individuals within these two counties at 0.11% or 1 out of every
910 residents.
Figure 1
Sheltered Harris Co, 2,953
Unsheltered, Harris Co, 2.243
Sheltered Ft. Bend Co., 107
Unsheltered Ft. Bend Co, 48
2014 Point in Time Count; n = 5,351
5
Comparison between 2014 and 2011-2013 PIT Counts
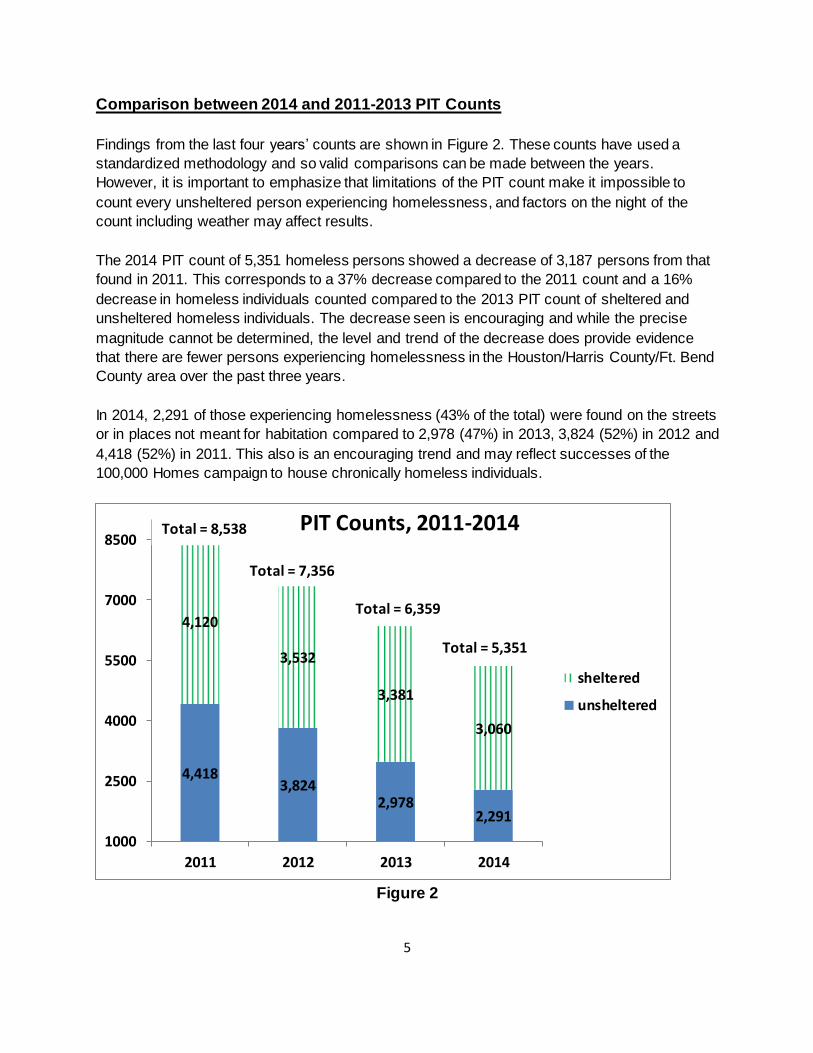
Findings from the last four years’ counts are shown in Figure 2. These counts have used a
standardized methodology and so valid comparisons can be made between the years.
However, it is important to emphasize that limitations of the PIT count make it impossible to
count every unsheltered person experiencing homelessness, and factors on the night of the
count including weather may affect results.
The 2014 PIT count of 5,351 homeless persons showed a decrease of 3,187 persons from that
found in 2011. This corresponds to a 37% decrease compared to the 2011 count and a 16%
decrease in homeless individuals counted compared to the 2013 PIT count of sheltered and
unsheltered homeless individuals. The decrease seen is encouraging and while the precise
magnitude cannot be determined, the level and trend of the decrease does provide evidence
that there are fewer persons experiencing homelessness in the Houston/Harris County/Ft. Bend
County area over the past three years.
In 2014, 2,291 of those experiencing homelessness (43% of the total) were found on the streets
or in places not meant for habitation compared to 2,978 (47%) in 2013, 3,824 (52%) in 2012 and
4,418 (52%) in 2011. This also is an encouraging trend and may reflect successes of the
100,000 Homes campaign to house chronically homeless individuals.
Figure 2
4,418 3,824
2,978 2,291
4,120
3,532
3,381
3,060
1000
2500
4000
5500
7000
8500
2011 2012 2013 2014
PIT Counts, 2011-2014
sheltered
unsheltered
Total = 8,538
Total = 7,356
Total = 6,359
Total = 5,351

6
Homelessness in Houston/Harris County/Ft. Bend Counties
HUD’s rules and regulations dictate the definition of homelessness that was used for the count,
and these figures were reported to HUD in the Homeless Data Exchange. However, a more
complete picture of homelessness in the region can be obtained by widening the definition of
homeless to include individuals in the Harris County Jail the night of the count who indicated
that they were homeless before arrest (and therefore likely to be so after release). When these
numbers are added to the 2014 PIT Count (Figure 3), the total number of homeless individuals
in the region is 6,876 with the largest percentage sheltered (45%).
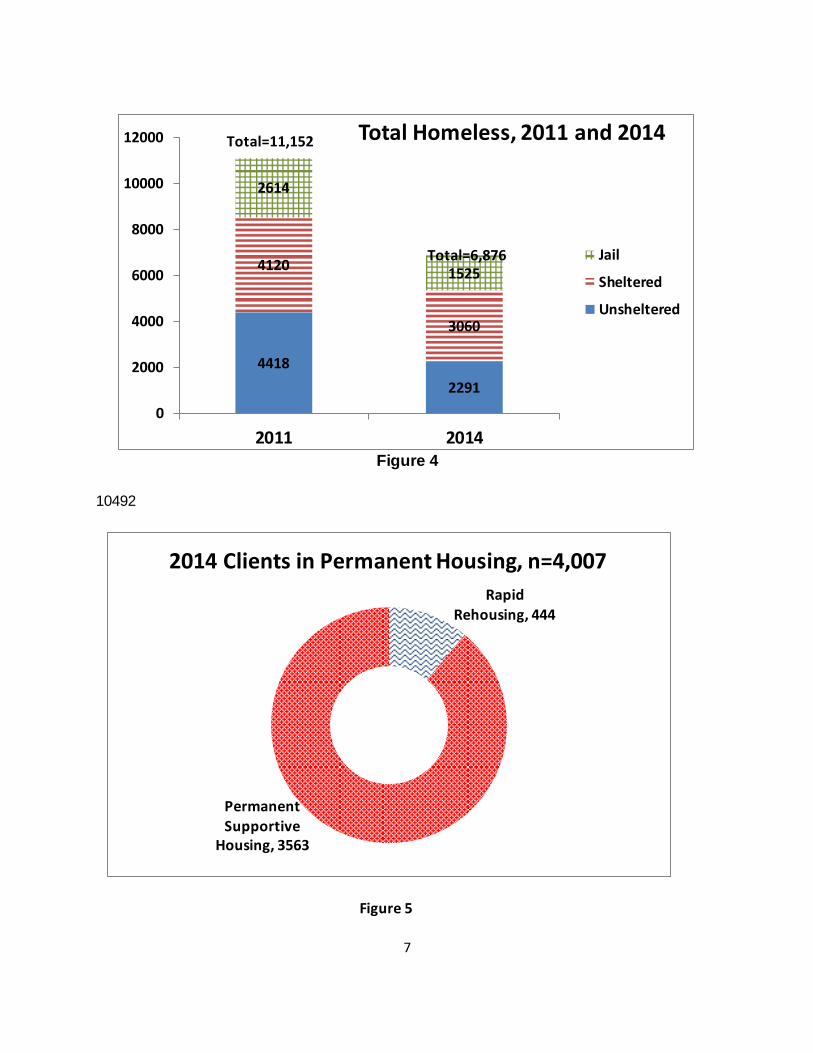
A comparison was made using this expanded definition of homelessness between 2011 and
2014 (Figure 4). In 2011, 11,152 individuals were deemed to be homeless using the expanded
definition. The 2014 finding of 6,876 represents a 38% decrease or 4,276 fewer people in the
total number of those counted experiencing homelessness since 2011, a similar decrease to
that found when assessing using only the HUD definition of homelessness. However, the caveat
must again be stated that the PIT count is exactly that, a count, and may not be measuring all
persons experiencing homelessness. The decrease seen, however, is encouraging and it does
represent a general trend over the past three years.
Figure 3
Unsheltered 2,291
Sheltered 3,060
Harris Co. Jail
1,525
Expanded Homeless in Houston/Harris/ Ft. Bend Counties, 2014 (n=6,876)
7
Figure 4
10492
4418
2291
4120
3060
2614
1525
0
2000
4000
6000
8000
10000
12000
2011 2014
Total Homeless, 2011 and 2014
Jail
Sheltered
Unsheltered
Rapid Rehousing, 444
Permanent Supportive
Housing, 3563
2014 Clients in Permanent Housing, n=4,007
Figure 5
Total=11,152
-
Total=6,876

8
Figure 6
Concomitant with the observed decrease in the number of persons counted who were
experiencing homelessness is an increase in the number of persons in permanent housing from
2013-2014. Permanent housing consists of Rapid Rehousing (RRH) and Permanent Supportive
Housing (PSH). The majority of clients (89%) were in PSH (Figure 5). Figure 6 shows a
comparison of the number of clients in permanent housing from 2011 through 2014, an increase
of 81% over the three years (1,829 additional individuals housed) and 28% over the past year.
Again, this represents success of targeting vulnerable and chronically homeless individuals first
for PSH in Houston.
Characteristics of Those Experiencing Homelessness
HUD requires that certain subpopulations of persons experiencing homelessness are
enumerated along with the total number of homeless. These subpopulations include veterans,
chronically homeless individuals and families1, victims of domestic violence, persons with
HIV/AIDS, and those who are severely mentally ill or experience chronic substance use
1 HUD’s definition of chronic homelessness is four or more episodes of homelessness within the
past three years or one or more current consecutive years of homelessness. In addition, the
individual must have a disabling condition which makes daily activities difficult (e.g., medical,
psychological, substance abuse). A chronically homeless family meets the above definition with
at least one child under the age of 18 years living with his/her parent(s). For sheltered
individuals, they must be staying in emergency shelter or safe haven, but not in transitional
housing .
2,178
2,902 3,126
4,007
1,000
1,500
2,000
2,500
3,000
3,500
4,000
2011 2012 2013 2014
Clients in Permanent Housing, 2011-2014
9
disorder. This information can be captured by the Homeless Management Information System
(HMIS) for those in shelters (although only those answering positively to a question are counted
and so we can’t distinguish between negative responses and missing responses ). The total
shelter (or total number of adults in the shelter) population was used as the denominator to
calculate percentages, but the actual percent may be higher, given that some responses may
be missing.
It is more difficult to determine subpopulation demographics on those who are unsheltered the
night of the count due to the observational method employed. Therefore, surveys to determine
these subpopulations were administered to a total of 324 clients the night of count by the
Specialized Outreach Teams and those canvasing youth and the following morning at agencies
providing meals or day services to the homeless community to provide an estimation of the
percent of these subpopulations. Only those who were unsheltered the previous night were
included in the survey. Information was based on self-reporting and so may over or under
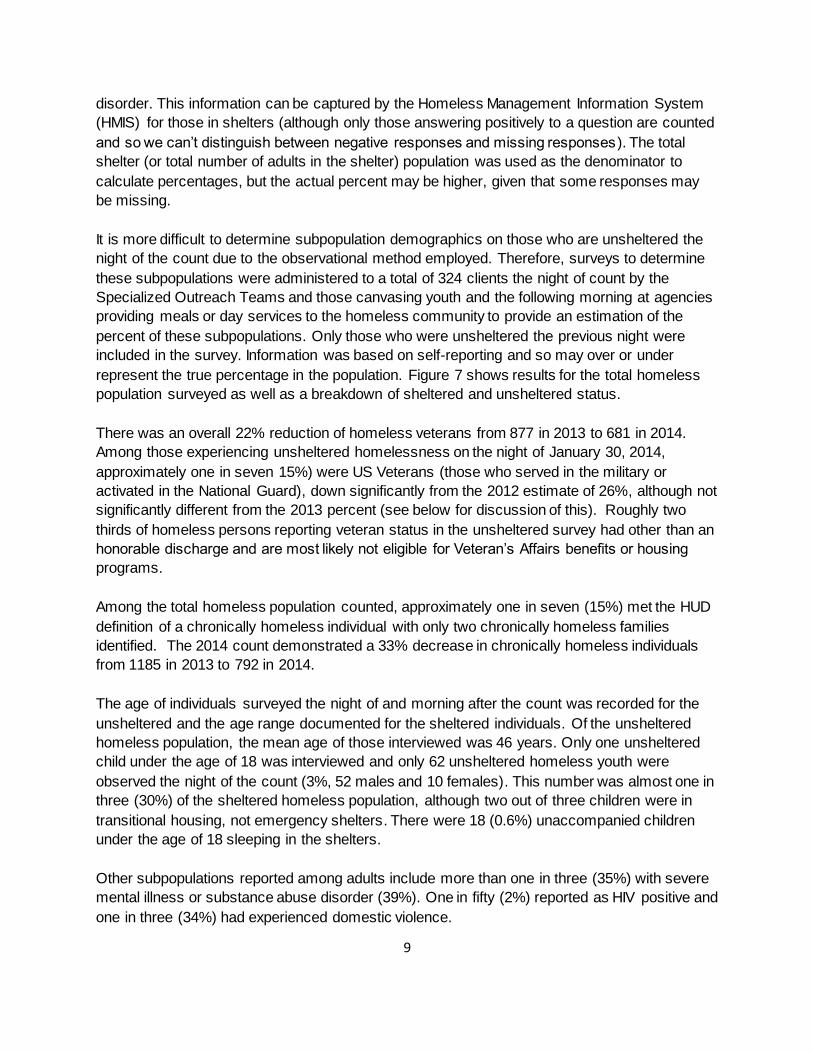
represent the true percentage in the population. Figure 7 shows results for the total homeless
population surveyed as well as a breakdown of sheltered and unsheltered status.
There was an overall 22% reduction of homeless veterans from 877 in 2013 to 681 in 2014.
Among those experiencing unsheltered homelessness on the night of January 30, 2014,
approximately one in seven 15%) were US Veterans (those who served in the military or
activated in the National Guard), down significantly from the 2012 estimate of 26%, although not
significantly different from the 2013 percent (see below for discussion of this). Roughly two
thirds of homeless persons reporting veteran status in the unsheltered survey had other than an
honorable discharge and are most likely not eligible for Veteran’s Affairs benefits or housing
programs.
Among the total homeless population counted, approximately one in seven (15%) met the HUD
definition of a chronically homeless individual with only two chronically homeless families
identified. The 2014 count demonstrated a 33% decrease in chronically homeless individuals
from 1185 in 2013 to 792 in 2014.
The age of individuals surveyed the night of and morning after the count was recorded for the
unsheltered and the age range documented for the sheltered individuals. Of the unsheltered
homeless population, the mean age of those interviewed was 46 years. Only one unsheltered
child under the age of 18 was interviewed and only 62 unsheltered homeless youth were
observed the night of the count (3%, 52 males and 10 females). This number was almost one in
three (30%) of the sheltered homeless population, although two out of three children were in
transitional housing, not emergency shelters. There were 18 (0.6%) unaccompanied children
under the age of 18 sleeping in the shelters.
Other subpopulations reported among adults include more than one in three (35%) with severe
mental illness or substance abuse disorder (39%). One in fifty (2%) reported as HIV positive and
one in three (34%) had experienced domestic violence.
10
Figure 7 * only sheltered individuals in emergency shelters can be considered chronically homeless ** among adults only
Among those in emergency shelters on the night of the PIT count, approximately one out of
every twenty-five adults (4%) was classified as a chronically homeless individual. Only two
chronically homeless families were identified. Among the unsheltered population, 30% of adults
were chronically homeless and 0% of unsheltered families were chronically homeless. As
expected, both the percent with mental illness and those with chronic substance abuse disorder
were higher among unsheltered individuals than sheltered individuals (48% vs. 19% and 48%
vs. 28%). The percent of individuals who had experienced domestic violence were higher
among those who were sheltered; this may be due to the availability of dedicated beds for this
subpopulation.
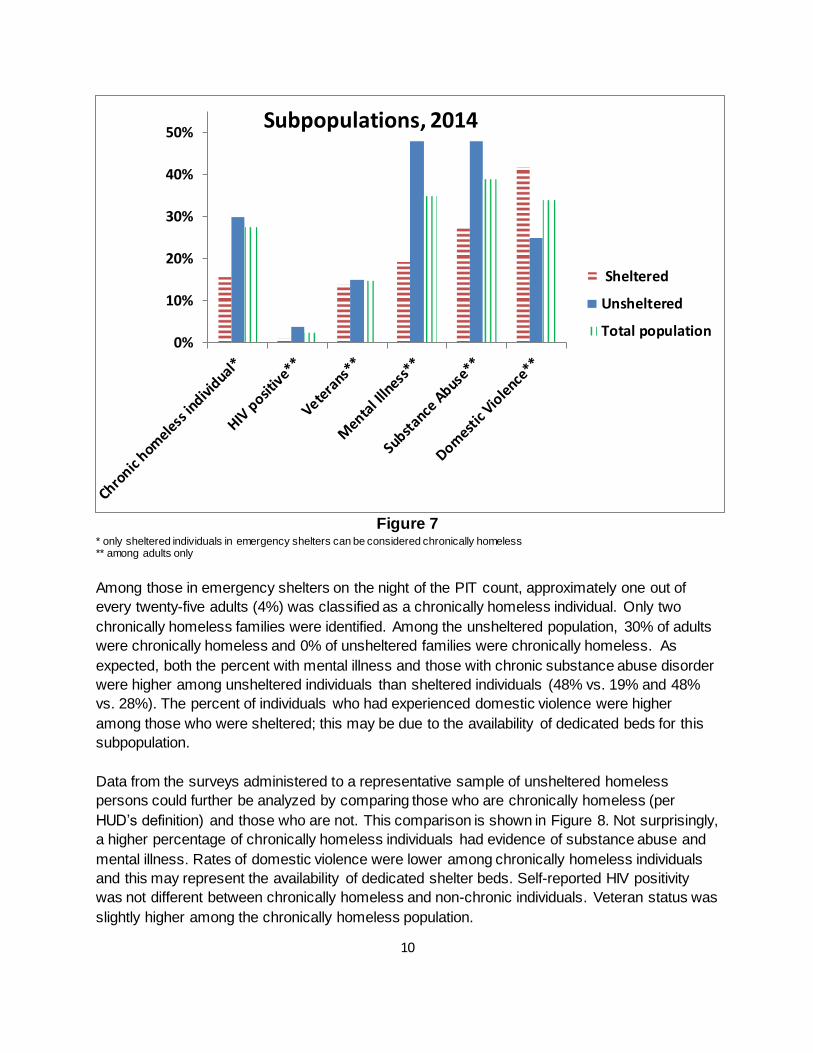
Data from the surveys administered to a representative sample of unsheltered homeless
persons could further be analyzed by comparing those who are chronically homeless (per
HUD’s definition) and those who are not. This comparison is shown in Figure 8. Not surprisingly,
a higher percentage of chronically homeless individuals had evidence of substance abuse and
mental illness. Rates of domestic violence were lower among chronically homeless individuals
and this may represent the availability of dedicated shelter beds. Self-reported HIV positivity
was not different between chronically homeless and non-chronic individuals. Veteran status was
slightly higher among the chronically homeless population.
0%
10%
20%
30%
40%
50%Subpopulations, 2014
Sheltered
Unsheltered
Total population
11
Figure 8
As shown in Figure 9, a significant proportion (two out of three) of the military veterans who
were unsheltered the night of the PIT count did not receive an honorable/general discharge and,
therefore, are ineligible for veteran benefits. If only the veterans eligible for benefits are
included, the percent of veterans in the unsheltered population drops to 9.2%. A much larger
proportion of sheltered homeless veterans received an honorable/general discharge
Figure 9
0%
20%
40%
60%
80%
HIV positive Veterans MentalIllness
SubstanceAbuse
DomesticViolence
Unsheltered Subpopulations, by chronic status
chronic
non-chronic
0%
2%
4%
6%
8%
10%
12%
14%
16%
Unsheltered veterans Sheltered veterans
Other discharge
Honorable/General
Discharge% in
po
pu
lati
on
Military Discharge Status
12
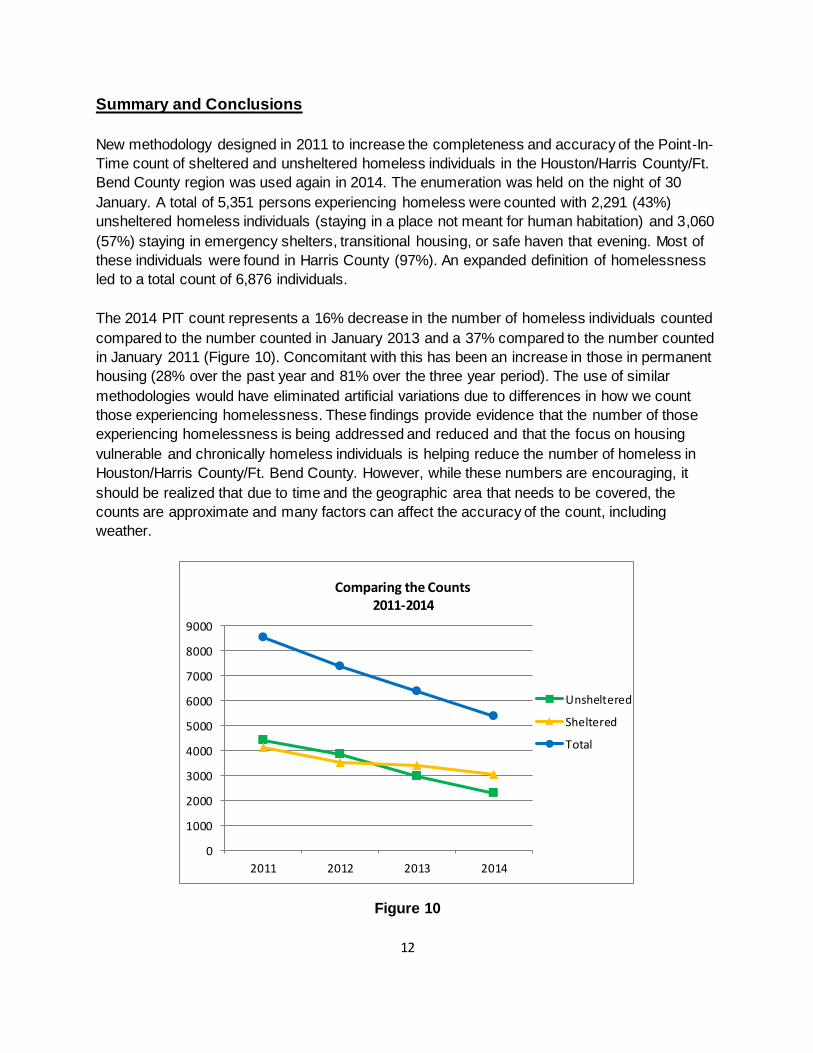
Summary and Conclusions
New methodology designed in 2011 to increase the completeness and accuracy of the Point-In-
Time count of sheltered and unsheltered homeless individuals in the Houston/Harris County/Ft.
Bend County region was used again in 2014. The enumeration was held on the night of 30
January. A total of 5,351 persons experiencing homeless were counted with 2,291 (43%)
unsheltered homeless individuals (staying in a place not meant for human habitation) and 3,060
(57%) staying in emergency shelters, transitional housing, or safe haven that evening. Most of
these individuals were found in Harris County (97%). An expanded definition of homelessness
led to a total count of 6,876 individuals.
The 2014 PIT count represents a 16% decrease in the number of homeless individuals counted
compared to the number counted in January 2013 and a 37% compared to the number counted
in January 2011 (Figure 10). Concomitant with this has been an increase in those in permanent
housing (28% over the past year and 81% over the three year period). The use of similar
methodologies would have eliminated artificial variations due to differences in how we count
those experiencing homelessness. These findings provide evidence that the number of those
experiencing homelessness is being addressed and reduced and that the focus on housing
vulnerable and chronically homeless individuals is helping reduce the number of homeless in
Houston/Harris County/Ft. Bend County. However, while these numbers are encouraging, it
should be realized that due to time and the geographic area that needs to be covered, the
counts are approximate and many factors can affect the accuracy of the count, including
weather.
Figure 10
0
1000
2000
3000
4000
5000
6000
7000
8000
9000
2011 2012 2013 2014
Unsheltered
Sheltered
Total
Comparing the Counts 2011-2014