Embed Size (px)
Citation preview

HOUSTON HOSPITALS
EMERGENCY DEPARTMENT USE STUDY
January 1, 2011 through December 31, 2011
FINAL REPORT
Prepared By
School of Public Health
University of Texas Health Science Center at Houston
Charles Begley, Patrick Courtney, Ibrahim Abbass, Nayeema Ahmed, Keith Burau
June 2013

2
TABLE OF CONTENTS
I. Executive Summary ........................................................................................... 3
II. Purpose .............................................................................................................. 14
III. Methods ............................................................................................................. 15
IV. Results ……………………………,…. ............................................................ 18
A. Total ED Visits………….……………...…...…..…………..…....……...18
B. Primary Care Related ED Visits…………………….……………...….23
C. ED Visits by Month, Day, and Time…………………...….……..….…26
D. ED Visits by Patient Characteristics…………………….…...….…..…33
E. Health Conditions of Patients with ED Visits………….…..…...……..51
F. Behavioral Health Related ED Visits…………………….….…...…….51
G. Length of Stay in the ED……….……………………….…….……..…55
H. Estimated Cost of Primary Care Related ED Visits…………….……55
I. Geographic Distribution of Patients with
ED Visits………………………….…….…..………….......…………....59
J. Trends in ED Visits Over Time…………………………….………….66
K. Emergency Severity Index………………………………………….….75
V. Limitations……………………………....………………..…….……..……77

3
I. EXECUTIVE SUMMARY
The University Of Texas School Of Public Health collects and analyzes emergency
department (ED) visit data in Harris County hospitals and monitors primary care related (PCR)
use of the ED. The main purpose of this report is to provide information on the frequency and
type of ED visits in Houston hospitals in 2011, the medical conditions for which visits were
made, the characteristics of patients that visited the ED, and the trends in ED use over the last
several years.
Data and Analysis
Twenty six hospitals with EDs that serve the general public of Harris County (provide
hospital based ED care and accept 911 deliveries) participated in the 2011 hospital ED study.
They include: two hospitals of the Harris County Hospital District (Ben Taub General and
Lyndon B. Johnson General); nine hospitals of the Memorial Hermann Health Care System
(Hermann/Texas Medical Center, Southwest, Southeast, Northeast, Northwest, The Woodlands,
Memorial City, Katy, and Sugar Land); four hospitals of the Hospital Corporation of America
(Bayshore Medical Center, Clear Lake Regional Medical Center, East Houston Regional
Medical Center, and West Houston Medical Center); two Texas Children’s Hospital facilities
(Texas Medical Center and West Campus); two hospitals of CHRISTUS Gulf Coast (St.
Catherine and St. John); two hospitals of the St. Luke’s hospital system (Episcopal Hospital and
Community Medical Center); and five hospitals of the Methodist Hospital System
(Methodist/Texas Medical Center, San Jacinto Methodist, Methodist Willowbrook Methodist
Sugar Land, and Methodist West Houston).

4
Each hospital supplied the following information on each ED visit during the period
January 1, 2011 through December 31, 2011:
1. Date and time of admission to the ED
2. Primary and all secondary discharge diagnoses
3. Discharge date and time
4. Payment source
5. Patient age
6. Patient gender
7. Patient race/ethnicity
8. Patient ZIP code
9. Where discharged (e.g. home, nursing home, etc.)
10. Method of transport (e.g. ambulance, self, other)
11. Emergency Severity Index (ESI)
Based on this information, the number, type, and rate of ED visits to all Houston
hospitals for various population groups was estimated and the number and percentage of primary
care-related ED (PCRED) visits was estimated by applying the New York University ED
Algorithm to each visit. The NYU Algorithm determines the likelihood that a visit is one of the
following types.
1. Non-emergent: Immediate treatment was not required within 12 hours.
2. Emergent-Primary Care Treatable: Treatment was required within 12 hours, but
could have been provided effectively and safely in a primary care setting.
Continuous observation was not required, no procedures were performed or
resources used that are not typically available in a primary care setting.
3. Emergent-ED Care Needed-Preventable/Avoidable: ED care was required within
12 hours, but the emergent nature of the condition was potentially preventable/
avoidable if timely/continuous primary care had been received for the underlying
illness.
4. Emergent-ED Care Needed-Not Preventable/Avoidable: ED care was required
within 12 hours and primary care could not have prevented the condition.
The demographic, coverage, and health conditions of patients with ED visits and PCRED
visits was determined. ED visits were mapped by ZIP code, population-based PCRED visit rates
5
were calculated, and the pattern over time of ED visits and PCRED visits was summarized and
assessed.
2011 Highlights
1. Total ED Visits
a. During 2011, 1,219,554 ED visits were made to all 26 participating hospitals. Of this
total, 97.3% of visits were made by residents of the eight county area (including Harris County),
and 82.7% were made by Harris County residents alone. Of all 2011 ED visits reported, 71.1%
were by Harris County residents who were discharged home or elsewhere (Table 1a).
b. The ED visits of participating hospitals represented 67.8% of all ED visits reported to
the Texas Department of State Health Services by all hospitals in Harris County in 2010. Using
this percentage for extrapolation, an estimated 1,295,814 ED visits were made by Harris County
residents to all hospitals in the county. The ED visit rate of Harris County residents was 31.66
per 100 residents in 2009, minimally lower than the rate of 31.84 in 2009 (Table 1a).
2. Primary Care Related ED Visits
Four in ten (39.7%) ED visits by Harris County residents were PCR in 2011. This
includes non-urgent, primary care treatable, and primary care preventable visits. The 2011
percentage compares to 41.0% in 2009 and 40.9% in 2010 (Table 2, Figures 5 and 6).
3. ED Visit Rates by Population Sub-Group
Insured males had the lowest rates of PCRED visits (9.04 per 100 insured males) and
total ED visits (18.9 per 100 insured males), whereas uninsured females had the highest rates of
PCRED visits (19.5 per 100 uninsured females) and total ED visits (31.1 per 100 uninsured
females). However, uninsured males age 75 and over had the highest rates of PCRED visits

6
(260.0 per 100 uninsured males age 75 and over) and total visits (685.68 per 1,000 uninsured
males age 75 and over) (Table 1b, Figures 1 and 2). Persons who were Black non-Hispanic had
the highest rate of total visits in 2011 (478.37 per 1,000 Black persons) and PCRED visits
(214.02 per 1,000 Black persons) (Table 1c, Figures 3 and 4).
4. ED Visits by Month, Day, and Time
The number of ED visits by Harris County residents fluctuated very little on a monthly
basis, with the fewest in June and July (Figure 7). The percentage of ED visits that led to
hospitalizations was also relatively constant over the year. The peak day of the week for ED
visits was Thursday (Figure 8). The percentage of ED visits leading to hospitalizations remained
relatively level each day.
ED visits by children peaked at 8 PM, with a secondary peak at 11 AM-12 PM (Figure
9a). ED visits by adults age 18 to 64 peaked from 10 AM to 12 PM (Figure 9b). ED visits by
adults age 65 and over peaked from 10 AM to 12 PM, then dropped during the rest of the day
(Figure 9c). Relatively few ED visits by children resulted in a hospitalization, in contrast to
adults age 65 and over.
5. ED Visits by Patient Characteristics
a. Payer source: The uninsured accounted for 32.2% of PCRED visits and 26.5% of non-
PCRED visits. Medicaid covered individuals made up 28.9% of PCRED visits and 21.1% of
non-PCRED visits. Children on CHIP made up 2.6% of PCRED visits (Tables 3a and 3b, Figures
10 & 11). Patients with commercial insurance accounted for 24.1% of PCRED visits and 26.5%
of non-PCRED visits. Nearly five in ten ED visits made by persons on Medicaid (47.7%) were
PCR and a smaller percentage of all ED visits by persons on CHIP (46.5%) were PCR.

7
Medicare enrollees had the highest percentage of hospitalized ED visits (26.8%) (Table 3c,
Figure 12).
b. Race/Ethnicity: Two thirds (66.9%) PCRED visits were by persons who were
Black or Hispanic, but only 55.5% of non-PCRED visits were by persons who were Black or
Hispanic. By contrast, persons who were White accounted for 23.8% of PCRED visits and
31.7% of non-PCRED visits (Tables 4a & 4b, Figures 13 & 14). More than four in ten of all ED
visits by persons who were Black (45.0%) or Hispanic (44.1%) were PCR. Asians (16.1%) and
Whites (18.5%) were most likely to have an ED visits resulting in a hospitalization (Table 4c,
Figure 15).
c. Age: Children age 17 and under made up more than one third (34.5%) of all
PCRED visits, and just over one fourth (26.0%) of non-PCRED visits. Adults age 65 and over
were almost twice as likely to have a non-PCRED visit (16.1%) than a PCRED visit (8.3%).
(Tables 5a & 5b, Figures 16 & 17). Three in ten (30.2%) ED visits by adults age 65 and older
resulted in a hospitalization (Table 5c, Figure 18).
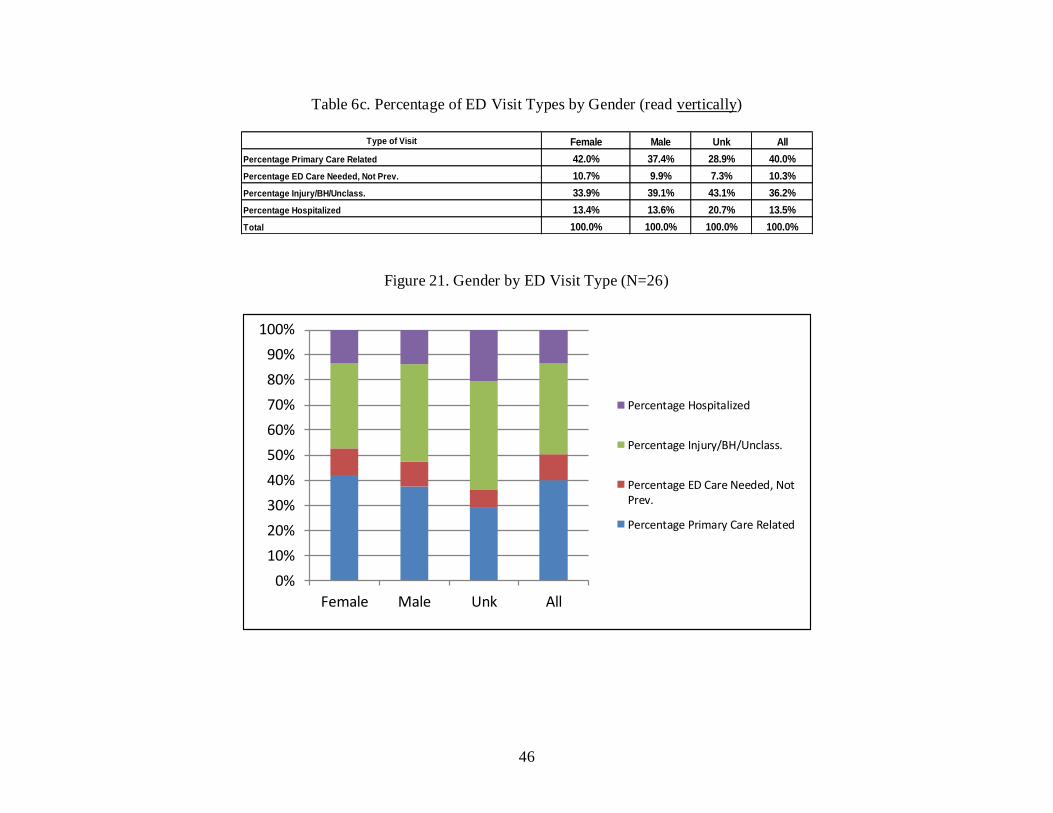
d. Gender: Almost six in ten (59.3%) PCRED visits were by females and 40.7% by males
(Tables 6a & 6b, Figure 16). Of total non-PCRED visits, 54.6% were by females and 45.4% by
males (Figure 20). The percentage of ED visits resulting in a hospitalization was only slightly
higher among males (13.6%) than females (13.4%) (Table 6c, Figure 21).
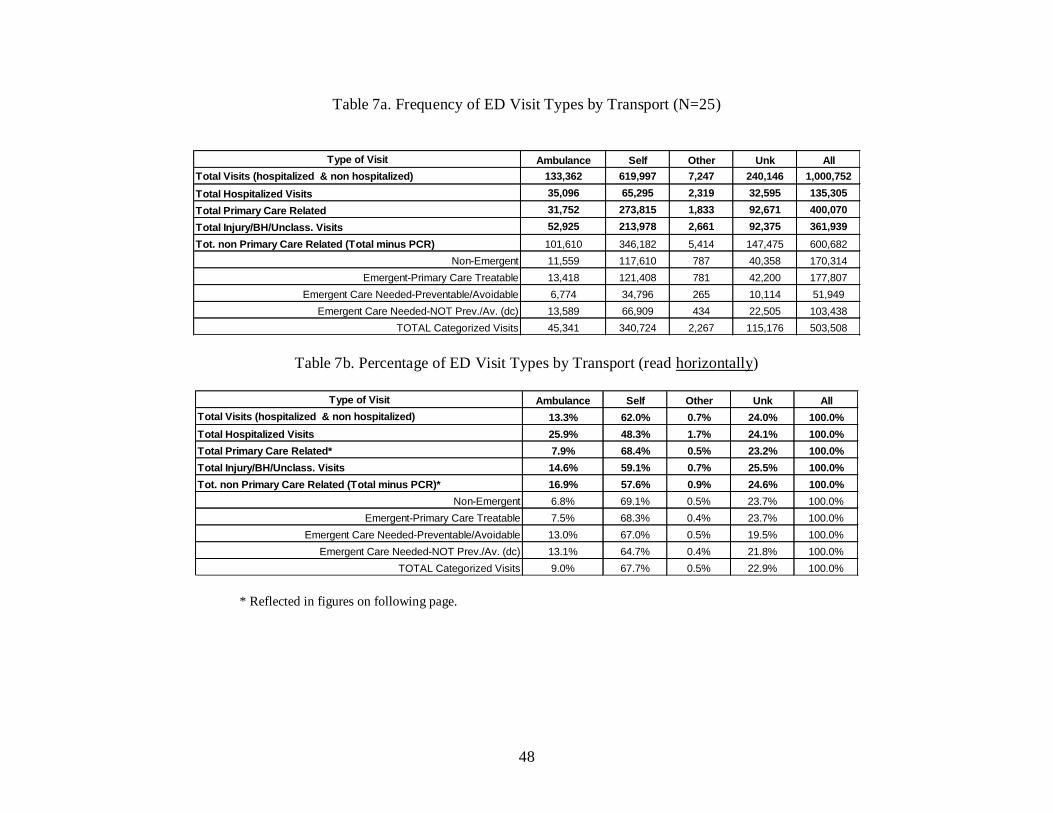
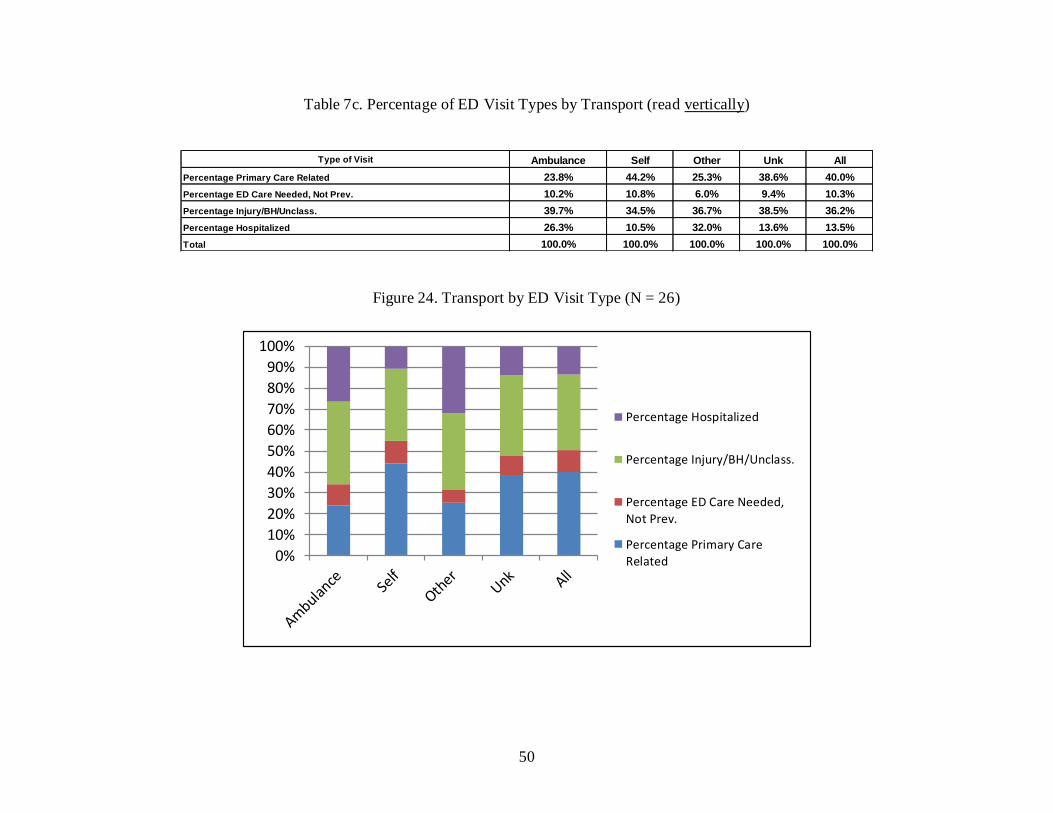
e. Transport: Fewer than one in ten (7.9%) PCRED visits were by persons with an
ambulance transport to the ED. By contrast, nearly one in five (16.9%) non-PCRED visits were
by persons with an ambulance transport to the ED (Tables 7a & 7b; Figures 22 & 23). More than
one fourth (26.3%) of ambulance transports to the ED eventually resulted in a hospitalization
(Table 7c and Figure 24). The findings for transport status are limited by the large
8
percentage of visits with an unknown transport status (23.2% PCRED, 24.6% non PCRED).
6. Health Conditions of Patients with ED Visits
The most common discharge diagnoses of patients with PCRED visits for the last three
years have been acute upper respiratory infection not otherwise specified, urinary tract infection
not otherwise specified, otitis media NOS, and abdominal pain unspecified site (Table 8). Chest
pain not otherwise specified has been the leading non-PCRED diagnosis for the last three years
(Table 9).
7. Behavioral Health-Related ED Visits
The percentage of persons with any behavioral health diagnosis was at 9.1% in 2011, its
highest level in three years. The percentage of persons with a primary medical diagnosis (ICD1)
as well as a behavioral health diagnosis (ICD 2 through 10) was likewise at its highest level in
three years (6.9%) (Table 10).
8. Length of Stay in the ED
The mean length of stay of ED visits (measured from time of admission to the ED to time
of discharge from the ED) was calculated for visits of less than 24 hours each. The mean LOS
for PCRED visits rose slightly in 2011 (3.93 hours). Non hospitalized behavioral health visits
continue to last longer than non hospitalized medical visits. In 2011 the difference amounted to
two hours (4.13 hours medical vs. 6.16 hours behavioral) (Table 11).
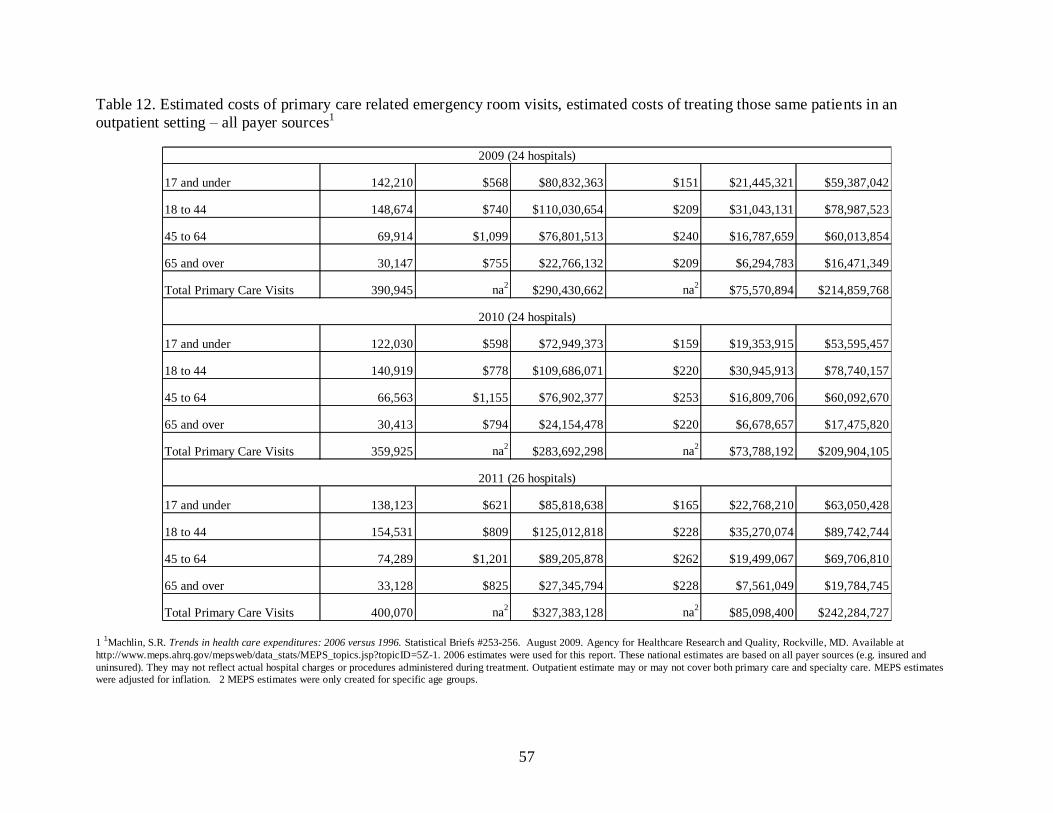
8. Estimated Cost of Primary Care Related ED Visits
Applying national estimates of the unit cost of ED visits to Houston ED visits suggests
that the greatest potential cost savings would be diverting PCRED visits among adults age 18 to
44 (Table 12, Figure 25). The cost estimates do not account for the variability that may occur

9
among treating chronic vs. acute conditions (e.g. treatment for chronic conditions may be more
expensive).
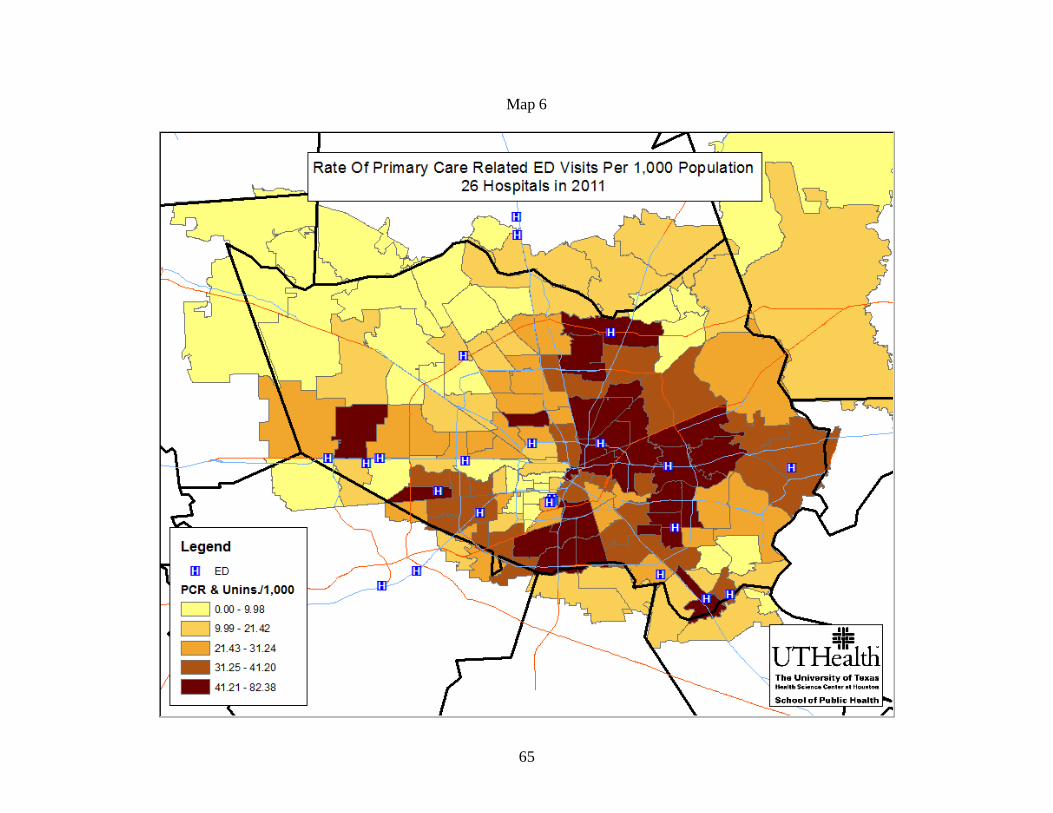
9. Geographic Distribution of Patients with ED Visits
The highest numbers of ED visits were in the following ZIP code clusters: 1) the
intersection of Highway 59 and the North Loop East; 2) the Ship Channel and the area along
Interstate 10 and the East Belt; 3) scattered areas of south Harris County; 4) an area along the
Southwest Freeway and between the West Loop and West Belt; 5) the Bear Creek and Katy areas
of west Harris County (Map 1).
The geographic distribution of PCRED visits, both by the insured and uninsured, was
similar to that of ED visits (Maps 2 and 3).
The areas with the highest rates of total ED visits, total PCRED visits, and PCRED visits
by the uninsured were the East/Northeast and South Central areas of Harris County, as well as
the Katy area in the west (Maps 4, 5, and 6).
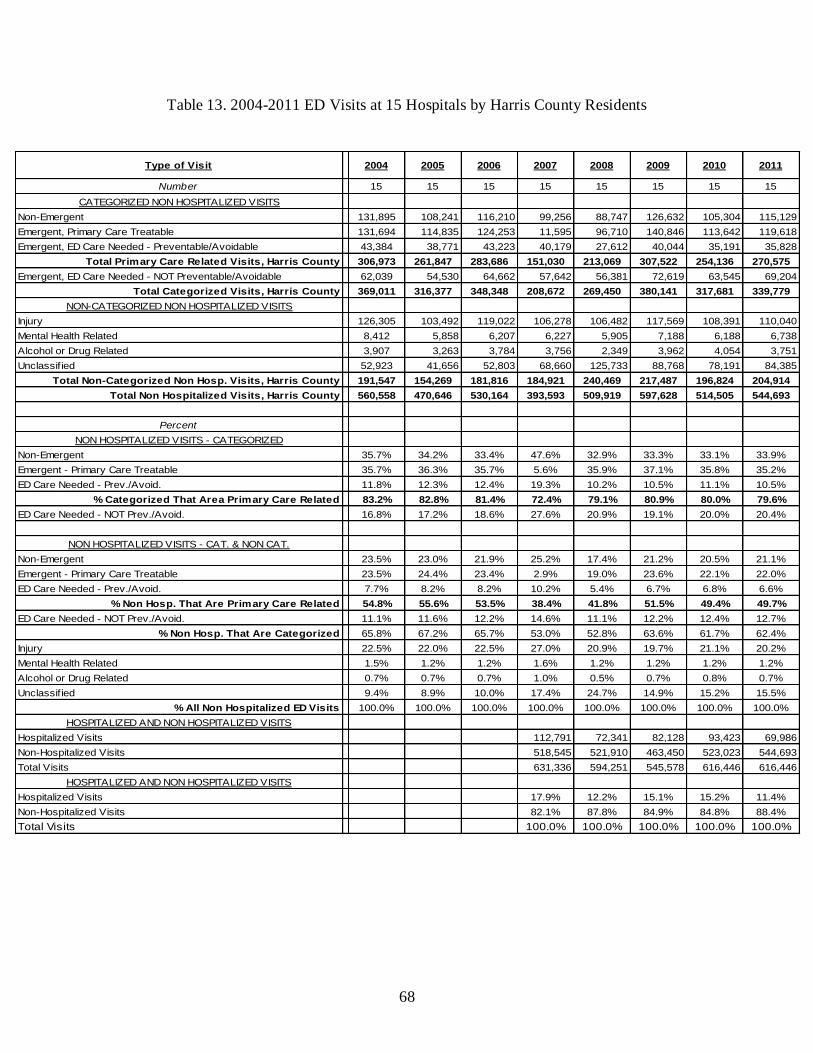
10. Trends in ED Visits Over Time
To examine trends over time, annual ED visits at 15 participating hospitals in which
patients were discharged home or elsewhere were tracked over the five-year period from 2004 to
2011 (Ben Taub General, Lyndon B. Johnson General, Memorial Hermann (MH) Hermann, MH
Southwest, MH Southeast, MH Northwest, MH Woodlands, MH Memorial City, MH Katy, MH
Sugar Land (formerly Fort Bend), Hospital Corporation of America (HCA) Bayshore,, HCA East
Houston, Texas Children’s Hospital, Spring Branch Medical Center, St. Luke’s Episcopal
Hospital). The ED visits of 22 participating hospitals were tracked over the four-year period
from 2005 to 2011 (above listed hospitals, plus MH Northeast, HCA West Houston, CHRISTUS
St. Catherine, CHRISTUS St. John, St. Luke’s Community Medical Center, The Methodist

10
Hospital, and San Jacinto Methodist Hospital). Both groups include Spring Branch Medical
Center data only for the 2004- 2010 period.
In both groups the percentage of non-hospitalized visits that are PCR has fluctuated over
the years, and was slightly higher among the 15 (49.7%) than among the 22 (46.8%). By
contrast, the percentage of hospitalizations were lower among the 15 (11.4%) than among the 22
(13.0%) (Tables 13 and 14).
After a reordering in 2010, the uninsured once again had the most PCRED visits of any
other payer source group. Persons enrolled in Medicaid were second highest (Figures 26 and
27).
Hispanics continue to have the greatest percentage of PCRED visits (Figures 28 & 29).
Blacks have the next highest percentage of PCRED visits.
Visits by children age 17 and under continue to account for the largest proportion of
PCRED visits. That percentage has been slowly declining according to both hospital groups
(Figures 30 & 31). Adults age 26 to 44 accounted for the next largest percentage, and there has
been a slow increase in the percentages of visits by adults age 65 and over.
There has been little change in the percentage of PCRED visits by gender over the last
several years (Figures 32 & 33).
PCRED visits for the last four years were analyzed by transport status using data from the
22-hospital group. The majority of persons with a PCRED visit do not come by ambulance, but
use some other means of transportation (Figure 34).

11
11. Emergency Severity Index
The Emergency Severity Index1, or ESI, is a score commonly assigned to each ED patient
at the point of nursing triage. The score, which ranges from level 1 (most acute) to level 5 (least
acute) is used as an initial assessment of patient acuity and resource need. Of all ED visits by
Harris County residents in 2011, 437,086 were assigned an ESI score. The following analyses
are limited to this subset of visits.
More than half of total visits (52.6%) and PCRED visits (55.5%) had a score of level 3,
indicating a midrange level of acuity. Less than one percent of total visits (0.9%) and PCRED
visits (0.1%) were level 1, the highest level of acuity (Table 15).
More than six in ten PCRED visits by those with commercial insurance (62.0%) or
Medicare (62.0%) were level 3. Just over half of PCRED by persons enrolled in CHIP (51.4%)
or Medicaid (50.4%), as well as those without insurance (54.3%) were level 3. However, one in
five (19.8%) of all PCRED visits by Medicare enrollees were level 2, the highest percentage of
any payer source (Table 16).
Analysis of ESI scores were done according to a primary discharge diagnosis of a
medical condition (primary and non primary care related, injury/poisoning, unclassified
diagnosis) or a behavioral condition (mental health and substance abuse). Analyses included both
hospitalized and non hospitalized visits. In contrast to medical visits and PCRED visits, fewer
than half of all BHED visits (46.6%) were classified as level 3 whereas more than half of
medical ED visits (52.8%) were level 3. Four in ten (39.3%) of all BHED visits were classified
as level 2, the second highest level of acuity. In contrast, fewer than two in ten (14.2%) of all
medical ED visits were classified level 2 (Table 17).
1 http://www.ahrq.gov/professionals/systems/hospital/esi/esi1.html

12
Conclusion
ED visits of Harris County residents in area hospitals increased in total volume in 2011
but held steady in relation to the population. The percentage of visits that were PCR fell
slightly. Rates of ED visits are affected by a mixture of age, gender, and insurance status. While
insured males have the lowest rates, uninsured females have the highest rates. When examined
by age, uninsured males age 75 and over have the highest ED visit rates. Diversion of PCRED
visits of adults age 18 to 44 have the largest potential for cost-savings. The geographic areas with
the highest rates of ED visits were mostly outside the 610 loop.
The fact that more than half of all PCRED visits were assessed by the ESI as having a
moderate level of severity indicates the lack of correlation between these two measures of acuity
and appropriateness of ED care. This is further illustrated by the fact that one in five PCRED
visits by Medicare enrollees (both elderly and non elderly) were rated as level 2 by the ESI –
higher than any other payer source group. It is also important to note the high percentage of total
ED visits with a behavioral health diagnosis that were classified by the ESI as level 2, indicating
a higher acuity level of patients with a behavioral vs. medical diagnosis. This high percentage
may also be an indirect indication of lack of timely access to outpatient behavioral health
services; further study is needed.
High levels of continued participation by a large number of hospitals has allowed for
monitoring of community-wide trends in ED and PCRED visits in Harris County. The trends
over the last five years provide evidence to support the need for multiple ED diversion strategies
targeting high risk population groups to reduce the high rates of non-urgent and PCRED visits.
Such strategies might include the following: a) the need for expanded outpatient primary and
specialty care capacity, especially for adults and the elderly, b) the need for patient education

13
about appropriate ED use, c) the need for after-hours clinics for children and adults, d) the need
for hospital staffing at peak hours of ED use, and e) the need for efforts to link the population,
particularly the uninsured, as well as Medicaid and CHIP enrollees to a medical home.
Limitations
The NYU ED algorithm does not classify hospitalized visits, mental health,
drug/alcohol, and injury-related visits. It may be assumed that most hospitalized visits and a
large percentage of mental health, drug/alcohol, and injury visits are not PCRED visits. To the
extent that some are PCR, the estimates understate the number of PCRED visits. This limitation
does not affect the percentage or population rate calculations. Because the data submitted is de-
identified, it is not possible to identify patients who make multiple ED visits. Therefore, we are
not able to identify frequent users of the ED.

14
II. PURPOSE
The increasing number of hospital ED visits, many of which are PCR, is leading to a
multitude of associated issues regarding equity and access to care in the U.S. One of the most
pressing issues in Houston is the capacity of hospitals to provide emergency care when
emergency rooms are crowded with patients seeking basic care. The main purpose of this study
is to provide information on the frequency, type, and distribution of ED visits in Houston
hospitals that are PCR. To achieve this purpose, the study obtained ED data from twenty six
hospitals in Houston for 2011, classified the visits of Harris County residents in terms of
PCR/non-PCR use of the ED, and examined the demographic, coverage, and geographic
characteristics of patients making the visits. The goal is to replicate the study over time in order
to determine trends and evaluate primary care enhancement activities.
15
III. METHODS
The study initially resulted from a partnership between Gateway to Care, the Harris
County Hospital District (HCHD), and The University of Texas School of Public Health
(UTSPH). In 2002, UTSPH worked with Gateway to Care on a pilot study to develop a process
for monitoring ED use in Houston. The process developed in the pilot study was then applied to
11 hospitals in 2002. An increasing number of hospitals have participated each year. The current
report uses data from 26 of the hospitals that serve the Houston 911 service area. Aggregate
reports for each year are posted on the website for the Health Services Research Collaborative.
The first step in the study involves requesting the following information on ED visits in
Houston hospitals:
1. Date and time of admission to ED
2. Primary and secondary discharge diagnosis
3. Discharge date and time
4. Payment source (payer codes from the Patient Data Set of the Texas Hospital
Association and the Texas Health Care Information Council)
5. Patient age
6. Patient gender
7. Patient race/ethnicity (Black, Asian, American Indian, Hispanic, White, Other,
Unknown)
8. Patient ZIP code
9. Where discharged to (e.g. home, hospital, etc)
10. Method of transport (e.g. ambulance, self, other)
11. Emergency Severity Index (ESI)
Working with the hospitals, a dataset was obtained, reviewed, and cleaned comprising a full set
of ED visit information for the period January 1, 2011 – December 31, 2011. Visits that did not
result in a hospitalization were analyzed.
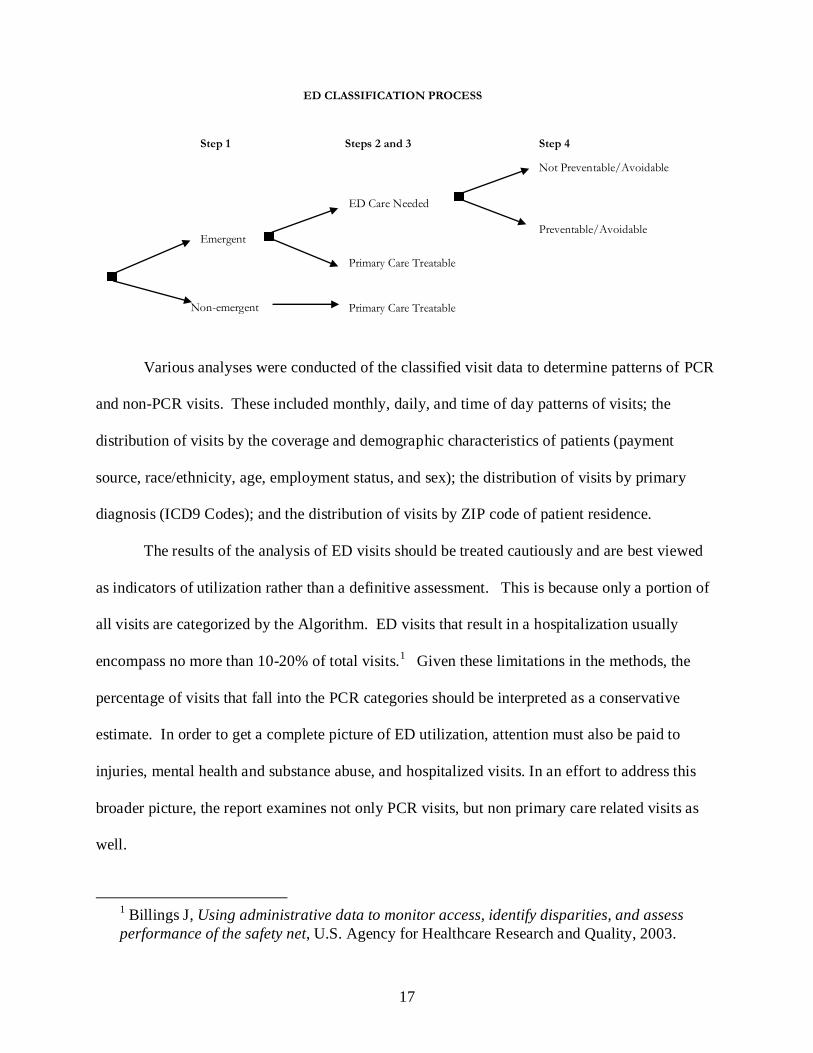
The second step involved the application of the New York University ED Classification
Algorithm to classify ED visits of Harris County residents into the following four categories:
1. Non-emergent: Immediate treatment was not required within 12 hours.

16
2. Emergent-Primary Care Treatable: Treatment was required within 12 hours, but
could have been provided effectively and safely in a primary care setting.
Continuous observation was not required, no procedures were performed or
resources used that are not typically available in a primary care setting.
3. Emergent-ED Care Needed-Preventable/Avoidable: ED care was required within
12 hours, but the emergent nature of the condition was potentially
preventable/avoidable if timely/continuous primary care had been received for the
underlying illness.
4. Emergent-ED Care Needed-Not Preventable/Avoidable: ED care was required
within 12 hours and primary care could not have prevented the condition.
The NYU Center for Health and Public Service Research and the United Hospital Fund
of New York developed the ED Algorithm as a measure of PCRED use. The ED Algorithm is a
set of probabilities that when applied to the primary diagnosis (ICD-9 code) of the patient
estimates the likelihood that the patient’s ED visit was one or more of the types described above.
The ED algorithm was developed with the advice of a panel of ED physicians and is based on
information abstracted from a sample of complete ED records – 3,500 cases in 1994 and 2,200
cases in 1999 – from six Bronx, New York hospitals. The decision tree followed by the panel is
summarized on the next page.
The distribution of ED visits by type represents the weighted sum of all visits with a
certain probability of being that type. ED visits in the first three categories are considered PCR
use of the ED, while those in the fourth category reflect non-PCR use of the ED. A number of
visits are not categorized using the Algorithm. These include injury, mental health-related, and
alcohol or drug-related visits, and visits with missing data. The ED Algorithm for these visits
has not yet been developed by the NYU researchers.
17
Various analyses were conducted of the classified visit data to determine patterns of PCR
and non-PCR visits. These included monthly, daily, and time of day patterns of visits; the
distribution of visits by the coverage and demographic characteristics of patients (payment
source, race/ethnicity, age, employment status, and sex); the distribution of visits by primary
diagnosis (ICD9 Codes); and the distribution of visits by ZIP code of patient residence.
The results of the analysis of ED visits should be treated cautiously and are best viewed
as indicators of utilization rather than a definitive assessment. This is because only a portion of
all visits are categorized by the Algorithm. ED visits that result in a hospitalization usually
encompass no more than 10-20% of total visits.1 Given these limitations in the methods, the
percentage of visits that fall into the PCR categories should be interpreted as a conservative
estimate. In order to get a complete picture of ED utilization, attention must also be paid to
injuries, mental health and substance abuse, and hospitalized visits. In an effort to address this
broader picture, the report examines not only PCR visits, but non primary care related visits as
well.
1 Billings J, Using administrative data to monitor access, identify disparities, and assess
performance of the safety net, U.S. Agency for Healthcare Research and Quality, 2003.
Emergent
Non-emergent
ED Care Needed
Primary Care Treatable
Primary Care Treatable
Not Preventable/Avoidable
Preventable/Avoidable
Step 1 Steps 2 and 3 Step 4
ED CLASSIFICATION PROCESS
18
IV. RESULTS
A. Total ED Visits by Type
During 2011, 1,219,554 ED visits were made to all 26 participating hospitals. Of this
total, 97.3% of visits were made by residents of the eight county area (including Harris County),
and 82.7% were made by Harris County residents alone. Of all 2011 ED visits reported, 71.1%
were by Harris County residents who were discharged home or elsewhere (Table 1a).
The ED visits of participating hospitals represented 67.8% of all ED visits reported to the
Texas Department of State Health Services by all hospitals in Harris County in 2010. Using this
percentage for extrapolation, an estimated 1,295,814 ED visits were made by Harris County
residents to all hospitals in the county. The ED visit rate of Harris County residents was 31.66
per 100 residents in 2009, minimally lower than the rate of 31.84 in 2009 (Table 1a).
Insured males had the lowest rates of PCRED visits (9.04 per 100 insured males) and
total ED visits (18.9 per 100 insured males), whereas uninsured females had the highest rates of
PCRED visits (19.5 per 100 uninsured females) and total ED visits (31.1 per 100 uninsured
females). However, uninsured males age 75 and over had the highest rates of PCRED visits
(260.0 per 100 uninsured males age 75 and over) and total visits (685.68 per 1,000 uninsured
males age 75 and over) (Table 1b, Figures 1 and 2). Persons who were Black non-Hispanic had
the highest rate of total visits in 2011 (478.37 per 1,000 Black persons) and PCRED visits
(214.02 per 1,000 Black persons) (Table 1c, Figures 3 and 4)..

19
Table 1a. Total ED Visits to Hospitals in Harris County
1 Total visits reported by hospitals participating in this report.
2 “All areas” = all states, all countries.
3 A number of visits each year lacked a primary ICD9 code.
4 Source: Cooperative DSHS/AHA/THA Annual Survey of Hospital and Tracking Database.
5Row J x percentage in Row G.
6Row J x percentage in Row H.
7Row J x percentage in Row I.
8 Source: 2009 - Texas State Data Center. http://txsdc.utsa.edu/tpepp/txpopest.php; 2010 – 2010 US Census; 2011 – American Community
Survey
Study Hospital Visits
FrequencyPercent of
first rowFrequency
Percent of
first rowFrequency
Percent of
first row
A Total1 (all areas)
21,127,557 100.0% 1,044,738 100.0% 1,219,554 100.00%
B Total Discharged to Home or Self (all areas)3 961,707 85.3% 877,062 84.0% 1,044,276 85.6%
C Total Admitted (all areas)3 165,850 14.7% 167,676 16.0% 175,278 14.4%
D Total (eight county area)3 1,094,529 97.1% 1,014,498 97.1% 1,186,596 97.3%
E Total Discharged to Home or Self (eight county area)3
934,563 82.9% 852,677 81.6% 1,016,962 83.4%
F Total Admitted (eight county area)3
159,966 14.2% 161,821 15.5% 169,634 13.9%
G Total (Harris County) 953,395 84.6% 878,941 84.1% 1,008,241 82.7%
H Total Discharged to Home or Self (Harris County) 812,863 72.1% 739,979 70.8% 866,956 71.1%
I Total Admitted (Harris County)3
140,532 12.5% 138,962 13.3% 141,285 11.6%
All Hospital Visits
J Total All4 (all areas)
2
K Total Visits as a Percentage of Total All Visits
L Estimated Number of Total That Are From Harris Co.5
M Est. Number of Discharged That Are From Harris Co.6
N Est. Number of Admitted That Are From Harris Co.7
O Population of Harris County8
P Harris Co. ED Rate per 100 population (adm. and disch.)
Q Total Rate of Discharged ED Visits per 100
R Total Rate of Admitted ED Visits per 100
24 Hospitals - 2009 25 Hospitals - 2010 26 Hospitals - 2011
All Hospitals 2009 All Hospitals 2010 All Hospitals 2011
1,522,943 1,540,247 1,584,830
74.0% 67.8% 77.0%
1,287,710 1,295,814 1,310,225
1,097,899 1,090,944 1,126,623
189,811 204,870 183,602
4,044,032 4,092,459 4,173,695
4.40
31.84 31.66 31.39
27.15 26.66 26.99
4.69 5.01
20
Table 1b. ED Visits to Hospitals in Harris County by Gender, Age, and Insurance Status; Population Rates1 For Gender, Age, and
Insurance Status
1 Population data taken from 2011 American Community Survey.
PCR ED Under 6 6 to 17 18 to 24 25 to 34 35 to 44 45 to 54 55 to 64 65 to 74 75 and over Total
Female Insured 47,212 29,553 23,040 26,614 19,335 18,654 14,921 11,541 12,179 203,049
Male Insured 55,581 26,282 6,243 8,701 9,434 11,747 10,348 7,484 5,954 141,774
Female Uninsured 4,785 5,835 21,006 27,013 18,641 14,506 7,396 984 475 100,643
Male Uninsured 5,365 4,775 10,366 16,545 12,087 11,194 5,662 767 242 67,003
Total ED Under 6 6 to 17 18 to 24 25 to 34 35 to 44 45 to 54 55 to 64 65 to 74 75 and over Total
Female Insured69,536 50,587 40,527 49,821 38,439 40,731 35,257 28,843 39,664 393,405
Male Insured 83,830 54,022 15,968 20,925 22,370 28,871 27,646 21,538 21,639 296,809
Female Uninsured 7,935 9,712 32,193 42,565 29,469 23,126 12,482 1,899 964 160,345
Male Uninsured 9,090 9,798 21,379 33,079 23,667 20,760 10,942 1,611 632 130,958
Popuplation Under 6 6 to 17 18 to 24 25 to 34 35 to 44 45 to 54 55 to 64 65 to 74 75 and over Total
Female Insured 178,586 305,190 119,704 206,834 199,371 206,425 173,770 105,159 81,631 1,576,670
Male Insured 187,742 317,895 189,500 189,500 187,210 189,710 161,783 91,605 54,218 1,569,163
Female Uninsured 23,680 62,807 83,289 124,602 97,920 72,727 43,586 4,672 1,827 515,110
Male Uninsured 22,986 65,925 96,464 148,131 109,506 81,622 42,312 3,882 771 571,599
PCRrate/100 Under 6 6 to 17 18 to 24 25 to 34 35 to 44 45 to 54 55 to 64 65 to 74 75 and over Total
Female Insured 26.4 9.7 19.2 12.9 9.7 9.0 8.6 11.0 14.9 12.9
Male Insured 29.6 8.3 3.3 4.6 5.0 6.2 6.4 8.2 11.0 9.0
Female Uninsured 20.2 9.3 25.2 21.7 19.0 19.9 17.0 21.1 26.0 19.5
Male Uninsured 23.3 7.2 10.7 11.2 11.0 13.7 13.4 19.8 31.4 11.7
Totrate/100 Under 6 6 to 17 18 to 24 25 to 34 35 to 44 45 to 54 55 to 64 65 to 74 75 and over Total
Female Insured 50.6 21.5 44.0 31.3 25.1 25.6 26.4 35.6 63.1 25.0
Male Insured 58.0 22.1 11.0 14.3 15.5 19.8 22.2 30.6 51.9 18.9
Female Uninsured 43.5 20.1 50.2 44.4 39.1 41.3 37.2 52.8 68.6 31.1
Male Uninsured 51.4 19.3 28.8 29.0 28.1 33.1 33.6 53.9 106.5 22.9

21
Figure 1. Rate of PCRED visits per 100 population
0
5
10
15
20
25
30
35
Female Insured
Male Insured
Female Uninsured
Male Uninsured
Figure 2. Rate of total ED visits per 100 population
0
20
40
60
80
100
120
Female Insured
Male Insured
Female Uninsured
Male Uninsured
22
Table 1c. ED Visits to Hospitals in Harris County by Race; Population Rates For Race
PCR ED Asian Black Hispanic Am. Ind. Other White
8,295 164,329 183,765 617 10,775 123,763
Total ED Asian Black Hispanic Am. Ind. Other White
24,493 367,306 418,886 1,476 30,080 373,508
Popuplation Asian Black Hispanic Am. Ind. Other White
255,760 767,821 1,731,046 8,589 57,251 1,360,427
PCRrate/100 Asian Black Hispanic Am. Ind. Other White
3.2 21.4 10.6 7.2 18.8 9.1
Totrate/100 Asian Black Hispanic Am. Ind. Other White
9.6 47.8 24.2 17.2 52.5 27.5
Figure 3. Rate of PCRED visits per 1000 population
0
5
10
15
20
25
Asian Black Hispanic Am. Ind. Other White
Figure 4. Rate of total ED visits per 1,000 population
0
10
20
30
40
50
60
Asian Black Hispanic Am. Ind. Other White

23
B. Primary Care Related ED Visits
Four in ten (39.7%) ED visits by Harris County residents were PCR in 2011. This
includes non-urgent, primary care treatable, and primary care preventable visits. The 2011
percentage compares to 41.0% in 2009 and 40.9% in 2010 (Table 2, Figures 5 and 6).

24
Table 2. ED visits to Hospitals by Harris County Residents
Type of Visit24 Hospitals
2009
25 Hospitals
2010
26 Hospitals
2011
Frequency
TOTAL VISITS
Total All Visits, Harris County (discharged and admitted)1 953,395 878,941 1,008,241
Total Discharged Visits (DC), Harris County1 812,863 739,979 866,956
Total Admitted Visits, Harris County1 140,532 138,962 141,285
CATEGORIZED VISITS (DC)
Non-Emergent2
158,180 148,866 170,314
Emergent, Primary Care Treatable2
180,389 161,388 177,807
Emergent, ED Care Needed - Preventable/Avoidable2
52,376 49,671 51,949
Total Primary Care Related Visits, Harris County 390,945 359,925 400,070
Emergent, ED Care Needed - NOT Preventable/Avoidable 95,463 91,012 103,438
Total Categorized Visits, Harris County 486,408 450,937 503,508
NON-CATEGORIZED VISITS (DC)
Injury 164,243 157,535 174,933
Mental Health Related 10,227 9,380 11,068
Alcohol or Drug Related 4,973 5,442 5,213
Unclassified3
135,390 107,196 170,725
Total Non-Categorized Visits, eight county area 314,833 279,553 361,939
Percent
PERCENTAGE OF CATEGORIZED ED VISITS (DC)
Non-Emergent 32.5% 33.0% 33.8%
Emergent - Primary Care Treatable 37.1% 35.8% 35.3%
ED Care Needed - Prev./Avoid. 10.8% 11.0% 10.3%
% Categorized That Are Primary Care Related 80.4% 79.8% 79.5%
ED Care Needed - NOT Prev./Avoid. 19.6% 20.2% 20.5%
PERCENTAGE OF TOTAL ED VISITS
Non-Emergent (DC) 16.6% 16.9% 16.9%
Emergent - Primary Care Treatable (DC) 18.9% 18.4% 17.6%
ED Care Needed - Prev./Avoid. (DC) 5.5% 5.7% 5.2%
% Total That Are Primary Care Related 41.0% 40.9% 39.7%
ED Care Needed - NOT Prev./Avoid. (DC) 10.0% 10.4% 10.3%
PERCENTAGE OF TOTAL ED VISITS
Injury (DC) 17.2% 17.9% 17.4%
Mental Health Related (DC) 1.1% 1.1% 1.1%
Alcohol or Drug Related (DC) 0.5% 0.6% 0.5%
Unclassified (DC)3
14.2% 12.2% 16.9%
Admitted Visits (all causes) 14.7% 15.8% 14.0%
PERCENTAGE OF DISCHARGED ED VISITS
Non-Emergent 19.5% 20.1% 19.6%
Emergent - Primary Care Treatable 22.2% 21.8% 20.5%
ED Care Needed - Prev./Avoid. 6.4% 6.7% 6.0%
% Discharged That Are Primary Care Related 48.1% 48.6% 46.1%
ED Care Needed - NOT Prev./Avoid. 11.7% 12.3% 11.9%
PERCENTAGE OF DISCHARGED ED VISITS
Injury 20.2% 21.3% 20.2%
Mental Health Related 1.3% 1.3% 1.3%
Alcohol or Drug Related 0.6% 0.7% 0.6%
Unclassified 16.7% 14.5% 19.7%
1 May contain missing data. Therefore, percentages at the bottom will not total to 100%.
2 Primary care related.

25
Figure 5. 2011 Categorized ED Visits by Type (N=26)
Non-Emergent, 33.8%
Emergent -Primary Care
Treatable, 35.3%
ED Care Needed -
Prev./Avoid., 10.3%
ED Care Needed - NOT Prev./Avoid.,
20.5%
Figure 6. 2011 Total ED Visits by Type (N = 26)
Non-Emergent
(DC), 16.9%
Emergent -Primary Care
Treatable (DC), 17.6%
ED Care Needed - Prev./Avoid.
(DC), 5.2%
ED Care Needed - NOT
Prev./Avoid. (DC), 10.3%
Injury (DC), 17.4%
Mental Health Related (DC),
1.1%
Alcohol or Drug Related (DC),
0.5%
Unclassified (DC), 16.9%
Admitted Visits (all causes),
14.0%
26
C. ED Visits by Month, Day, and Time
The number of ED visits by Harris County residents fluctuated very little on a monthly
basis, with the fewest in June and July (Figure 7). The percentage of ED visits that led to
hospitalizations was also relatively constant over the year. The peak day of the week for ED
visits was Thursday (Figure 8). The percentage of ED visits leading to hospitalizations remained
relatively level each day.
ED visits by children peaked at 8 PM, with a secondary peak at 11 AM-12 PM (Figure
9a). ED visits by adults age 18 to 64 peaked from 10 AM to 12 PM (Figure 9b). ED visits by
adults age 65 and over peaked from 10 AM to 12 PM, then dropped during the rest of the day
(Figure 9c). Relatively few ED visits by children resulted in a hospitalization, in contrast to
adults age 65 and over.
27
Figure 7

28
Figure 8

29
Figure 9. All ages
30
Figure 9a. Age 0-17
31
Figure 9b. Age 18-64
32
Figure 9c. Age 65 and over

33
D. ED Visits by Patient Characteristics
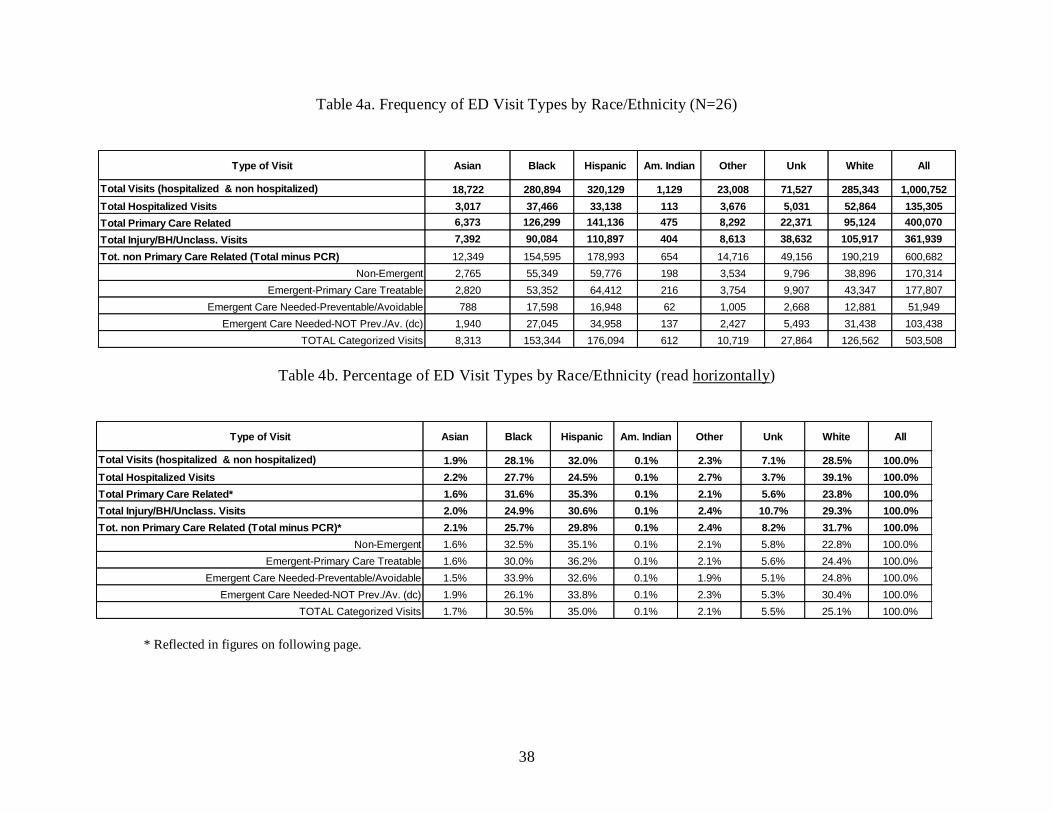
Tables 3a, 4a, 5a, and 6a represent the frequency counts for ED visits by payer source,
race, age, and gender (respectively). Tables 3b, 4b, 5b, and 6b represent percentages of these
characteristics when summed horizontally (e.g. total hospitalized visits by payer source). Tables
3c, 4c, 5c, and 6c represent percentages of these characteristics in four broad categories when
summed vertically (e.g. total visits by persons who are Hispanic).
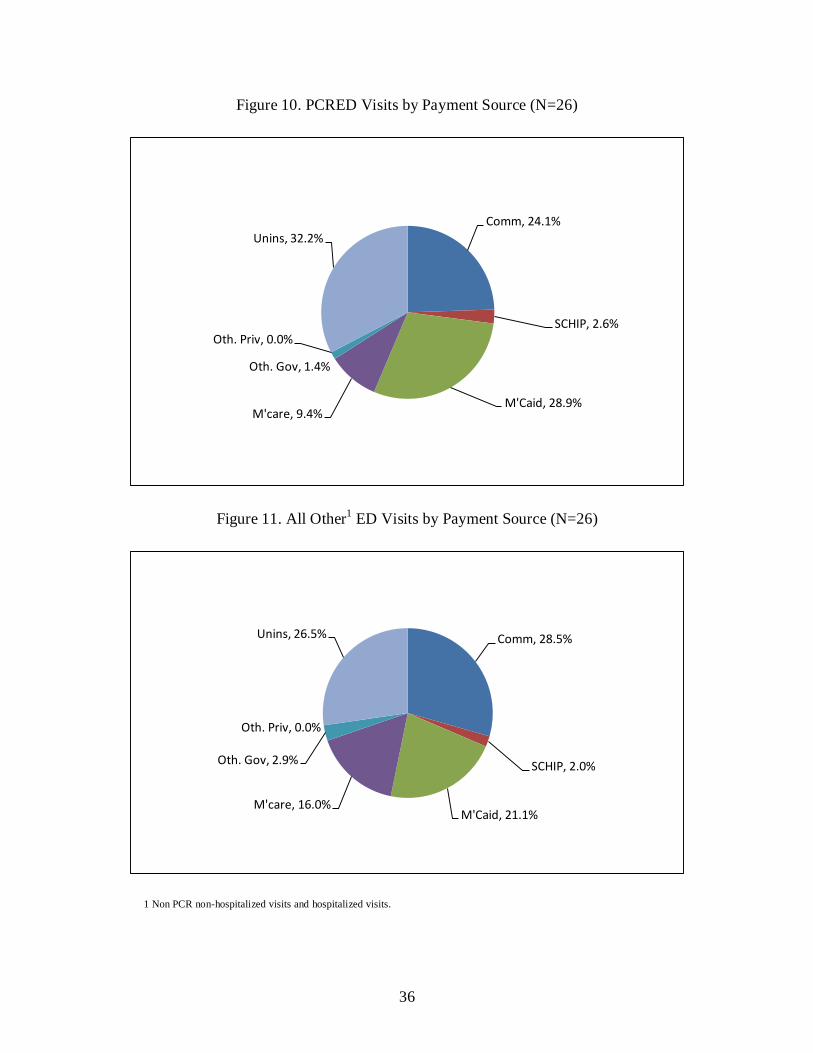
Payer source: The uninsured accounted for 32.2% of PCRED visits and 26.5% of non-
PCRED visits. Medicaid covered individuals made up 28.9% of PCRED visits and 21.1% of
non-PCRED visits. Children on CHIP made up 2.6% of PCRED visits (Tables 3a and 3b, Figures
10 & 11). Patients with commercial insurance accounted for 24.1% of PCRED visits and 26.5%
of non-PCRED visits. Nearly five in ten ED visits made by persons on Medicaid (47.7%) were
PCR and a smaller percentage of all ED visits by persons on CHIP (46.5%) were PCR.
Medicare enrollees had the highest percentage of hospitalized ED visits (26.8%) (Table 3c,
Figure 12).
Race/Ethnicity: Two thirds (66.9%) PCRED visits were by persons who were
Black or Hispanic, but only 55.5% of non-PCRED visits were by persons who were Black or
Hispanic. By contrast, persons who were White accounted for 23.8% of PCRED visits and
31.7% of non-PCRED visits (Tables 4a & 4b, Figures 13 & 14). More than four in ten of all ED
visits by persons who were Black (45.0%) or Hispanic (44.1%) were PCR. Asians (16.1%) and
Whites (18.5%) were most likely to have an ED visits resulting in a hospitalization (Table 4c,
Figure 15).
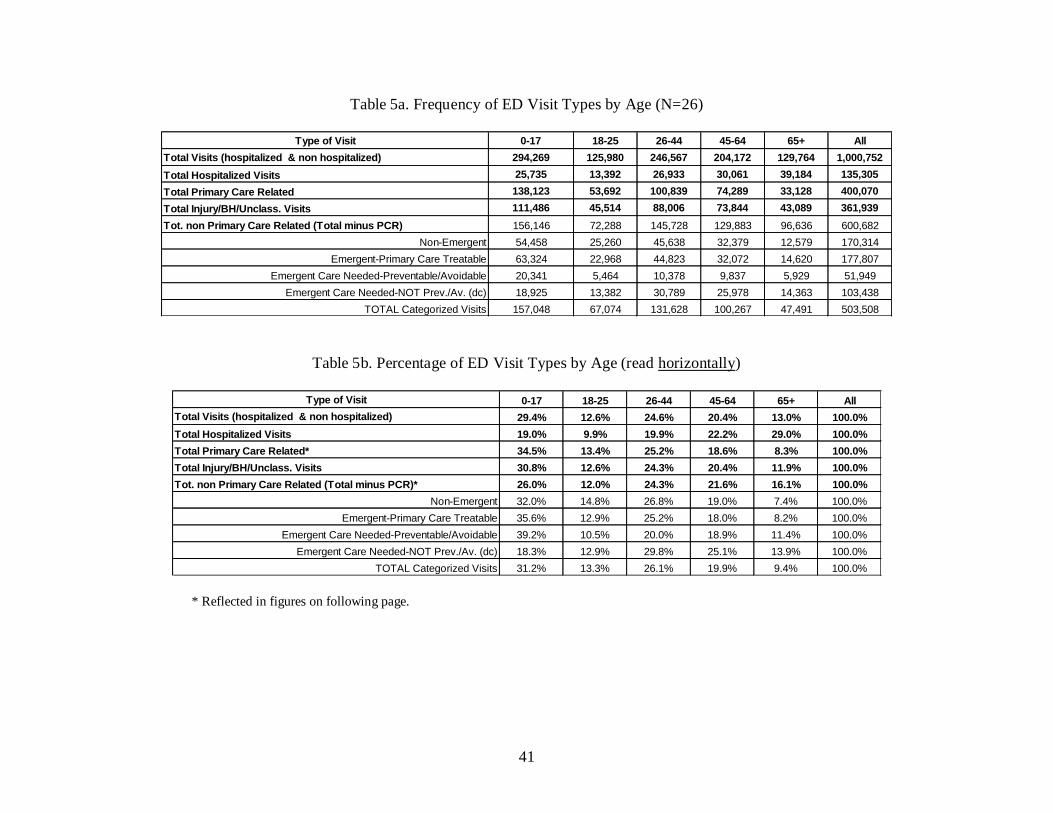
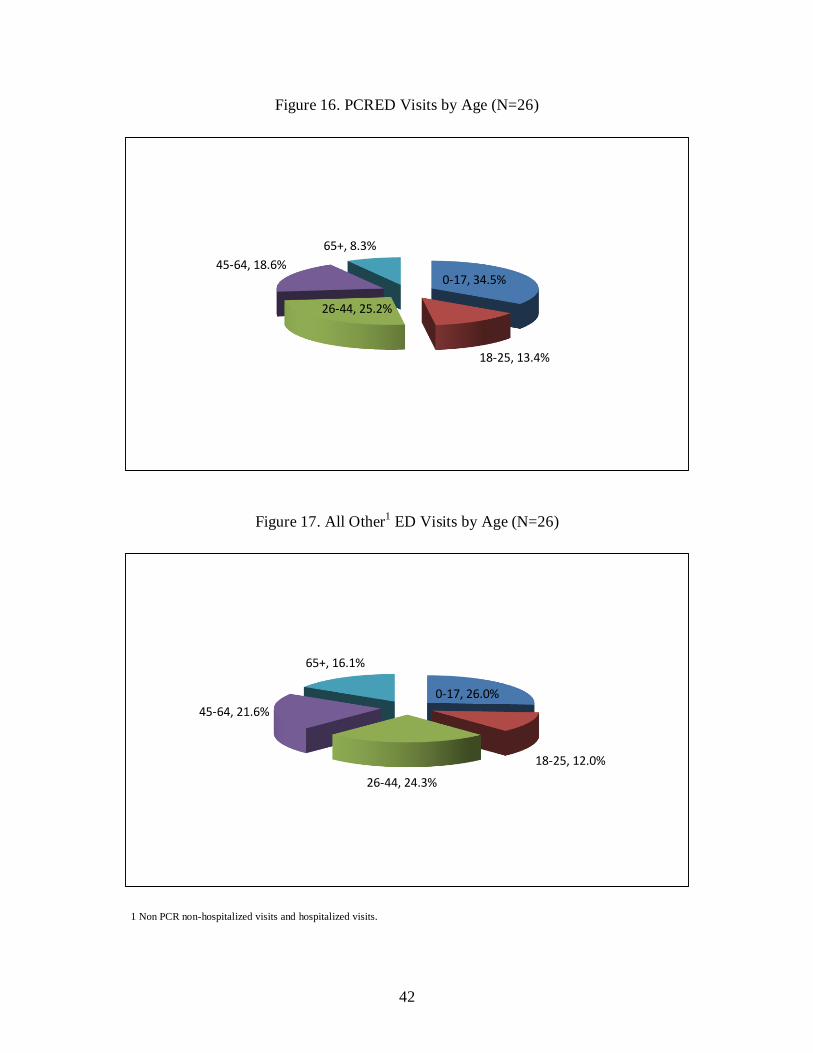
Age: Children age 17 and under made up more than one third (34.5%) of all PCRED
visits, and just over one fourth (26.0%) of non-PCRED visits. Adults age 65 and over were

34
almost twice as likely to have a non-PCRED visit (16.1%) than a PCRED visit (8.3%). (Tables
5a & 5b, Figures 16 & 17). Three in ten (30.2%) ED visits by adults age 65 and older resulted in
a hospitalization (Table 5c, Figure 18).
Gender: Almost six in ten (59.3%) PCRED visits were by females and 40.7% by males
(Tables 6a & 6b, Figure 16). Of total non-PCRED visits, 54.6% were by females and 45.4% by
males (Figure 20). The percentage of ED visits resulting in a hospitalization was only slightly
higher among males (13.6%) than females (13.4%) (Table 6c, Figure 21).
35
Table 3a. Frequency of ED Visit Types by Payment Source (N=26)
Type of Visit Comm SCHIP M'Caid M'care Other Gov. Other Priv. Unins Unk All
Total Visits (hospitalized & non hospitalized) 267,629 22,007 242,154 133,821 22,645 0 287,652 24,844 1,000,752
Total Hospitalized Visits 28,675 1,531 26,537 35,887 1,893 0 30,584 10,198 135,305
Total Primary Care Related 96,398 10,229 115,423 37,688 5,446 0 128,663 6,223 400,070
Total Injury/BH/Unclass. Visits 111,230 8,413 79,617 45,129 13,736 0 97,420 6,394 361,939
Tot. non Primary Care Related (Total minus PCR) 171,231 11,778 126,731 96,133 17,199 0 158,989 18,621 600,682
Non-Emergent 40,178 4,268 47,470 14,292 2,610 0 58,785 2,710 170,314
Emergent-Primary Care Treatable 44,289 4,547 52,030 16,447 2,284 0 55,472 2,739 177,807
Emergent Care Needed-Preventable/Avoidable 11,931 1,413 15,924 6,950 552 0 14,406 774 51,949
Emergent Care Needed-NOT Prev./Av. 31,326 1,834 20,577 15,117 1,570 0 30,985 2,029 103,438
TOTAL Categorized Visits 127,724 12,063 136,000 52,805 7,016 0 159,648 8,252 503,508
Table 3b. Percentage of ED Visit Types by Payment Source (read horizontally)
Type of Visit Comm SCHIP M'Caid M'care Oth. Gov Oth. Priv Unins All
Total Visits (hospitalized & non hospitalized) 26.7% 2.2% 24.2% 13.4% 2.3% 0.0% 28.7% 100.0%
Total Hospitalized Visits 21.2% 1.1% 19.6% 26.5% 1.4% 0.0% 22.6% 100.0%
Total Primary Care Related* 24.1% 2.6% 28.9% 9.4% 1.4% 0.0% 32.2% 100.0%
Total Injury/BH/Unclass. Visits 30.7% 2.3% 22.0% 12.5% 3.8% 0.0% 26.9% 100.0%
Tot. non Primary Care Related (Total minus PCR)* 28.5% 2.0% 21.1% 16.0% 2.9% 0.0% 26.5% 100.0%
Non-Emergent 23.6% 2.5% 27.9% 8.4% 1.5% 0.0% 34.5% 100.0%
Emergent-Primary Care Treatable 24.9% 2.6% 29.3% 9.2% 1.3% 0.0% 31.2% 100.0%
Emergent Care Needed-Preventable/Avoidable 23.0% 2.7% 30.7% 13.4% 1.1% 0.0% 27.7% 100.0%
Emergent Care Needed-NOT Prev./Av. 30.3% 1.8% 19.9% 14.6% 1.5% 0.0% 30.0% 100.0%
TOTAL Categorized Visits 25.4% 2.4% 27.0% 10.5% 1.4% 0.0% 31.7% 100.0%
* Reflected in figures on following page.
36
Figure 10. PCRED Visits by Payment Source (N=26)
Comm, 24.1%
SCHIP, 2.6%
M'Caid, 28.9%M'care, 9.4%
Oth. Gov, 1.4%
Oth. Priv, 0.0%
Unins, 32.2%
Figure 11. All Other1 ED Visits by Payment Source (N=26)
Comm, 28.5%
SCHIP, 2.0%
M'Caid, 21.1%M'care, 16.0%
Oth. Gov, 2.9%
Oth. Priv, 0.0%
Unins, 26.5%
1 Non PCR non-hospitalized visits and hospitalized visits.

37
Table 3c. Percentage of ED Visit Types by Payment Source (read vertically)
Figure 12. Payment Source by ED Visit Type (N=26)
0%
10%
20%
30%
40%
50%
60%
70%
80%
90%
100%
Percentage Hospitalized
Percentage Injury/BH/Unclass.
Percentage ED Care Needed, NotPrev.
Percentage Primary Care Related
T ype o f Visit Commerc. SCHIP Medicaid Medicare Other Gov. Other Priv. Uninsured Unk All
P ercentage P rimary C are R elated 36.0% 46.5% 47.7% 28.2% 24.0% 0.0% 44.7% 25.0% 40.0%
P ercentage ED C are N eeded, N o t P rev. 11.7% 8.3% 8.5% 11.3% 6.9% 0.0% 10.8% 8.2% 10.3%
P ercentage Injury/ B H / Unclass. 41.6% 38.2% 32.9% 33.7% 60.7% 0.0% 33.9% 25.7% 36.2%
P ercentage H o spitalized 10.7% 7.0% 11.0% 26.8% 8.4% 0.0% 10.6% 41.0% 13.5%
T o tal 100.0% 100.0% 100.0% 100.0% 100.0% 100.0% 100.0% 100.0% 100.0%
38
Table 4a. Frequency of ED Visit Types by Race/Ethnicity (N=26)
Type of Visit Asian Black Hispanic Am. Indian Other Unk White All
Total Visits (hospitalized & non hospitalized) 18,722 280,894 320,129 1,129 23,008 71,527 285,343 1,000,752
Total Hospitalized Visits 3,017 37,466 33,138 113 3,676 5,031 52,864 135,305
Total Primary Care Related 6,373 126,299 141,136 475 8,292 22,371 95,124 400,070
Total Injury/BH/Unclass. Visits 7,392 90,084 110,897 404 8,613 38,632 105,917 361,939
Tot. non Primary Care Related (Total minus PCR) 12,349 154,595 178,993 654 14,716 49,156 190,219 600,682
Non-Emergent 2,765 55,349 59,776 198 3,534 9,796 38,896 170,314
Emergent-Primary Care Treatable 2,820 53,352 64,412 216 3,754 9,907 43,347 177,807
Emergent Care Needed-Preventable/Avoidable 788 17,598 16,948 62 1,005 2,668 12,881 51,949
Emergent Care Needed-NOT Prev./Av. (dc) 1,940 27,045 34,958 137 2,427 5,493 31,438 103,438
TOTAL Categorized Visits 8,313 153,344 176,094 612 10,719 27,864 126,562 503,508
Table 4b. Percentage of ED Visit Types by Race/Ethnicity (read horizontally)
Type of Visit Asian Black Hispanic Am. Indian Other Unk White All
Total Visits (hospitalized & non hospitalized) 1.9% 28.1% 32.0% 0.1% 2.3% 7.1% 28.5% 100.0%
Total Hospitalized Visits 2.2% 27.7% 24.5% 0.1% 2.7% 3.7% 39.1% 100.0%
Total Primary Care Related* 1.6% 31.6% 35.3% 0.1% 2.1% 5.6% 23.8% 100.0%
Total Injury/BH/Unclass. Visits 2.0% 24.9% 30.6% 0.1% 2.4% 10.7% 29.3% 100.0%
Tot. non Primary Care Related (Total minus PCR)* 2.1% 25.7% 29.8% 0.1% 2.4% 8.2% 31.7% 100.0%
Non-Emergent 1.6% 32.5% 35.1% 0.1% 2.1% 5.8% 22.8% 100.0%
Emergent-Primary Care Treatable 1.6% 30.0% 36.2% 0.1% 2.1% 5.6% 24.4% 100.0%
Emergent Care Needed-Preventable/Avoidable 1.5% 33.9% 32.6% 0.1% 1.9% 5.1% 24.8% 100.0%
Emergent Care Needed-NOT Prev./Av. (dc) 1.9% 26.1% 33.8% 0.1% 2.3% 5.3% 30.4% 100.0%
TOTAL Categorized Visits 1.7% 30.5% 35.0% 0.1% 2.1% 5.5% 25.1% 100.0% * Reflected in figures on following page.

39
Figure 13. Primary Care-Related ED Visits by Race/Ethnicity (N=26)
Asian, 1.6%
Black, 31.6%
Hispanic, 35.3%Am. Indian,
0.1%
Other, 2.1%
Unk, 5.6%
White, 23.8%
Figure 14. All Other1 ED Visits by Race/Ethnicity (N=26)
Asian, 2.1%
Black, 25.7%
Hispanic, 29.8%Am. Indian, 0.1%
Other, 2.4%
Unk, 8.2%
White, 31.7%
1 Non PCR non-hospitalized visits and hospitalized visits.

40
Table 4c. Percentage of ED Visit Types by Race/Ethnicity (read vertically)
Type of Visit Asian Black Hispanic Am.Indian Other Unk White All
Percentage Primary Care Related 34.0% 45.0% 44.1% 42.1% 36.0% 31.3% 33.3% 40.0%
Percentage ED Care Needed, Not Prev. 10.4% 9.6% 10.9% 12.1% 10.5% 7.7% 11.0% 10.3%
Percentage Injury/BH/Unclass. 39.5% 32.1% 34.6% 35.8% 37.4% 54.0% 37.1% 36.2%
Percentage Hospitalized 16.1% 13.3% 10.4% 10.0% 16.0% 7.0% 18.5% 13.5%
Total 100.0% 100.0% 100.0% 100.0% 100.0% 100.0% 100.0% 100.0%
Figure 15. Race/Ethnicity by ED Visit Type (N=26)
0%
10%
20%
30%
40%
50%
60%
70%
80%
90%
100%
Percentage Hospitalized
Percentage Injury/BH/Unclass.
Percentage ED Care Needed, NotPrev.
Percentage Primary Care Related
41
Table 5a. Frequency of ED Visit Types by Age (N=26)
Type of Visit 0-17 18-25 26-44 45-64 65+ All
Total Visits (hospitalized & non hospitalized) 294,269 125,980 246,567 204,172 129,764 1,000,752
Total Hospitalized Visits 25,735 13,392 26,933 30,061 39,184 135,305
Total Primary Care Related 138,123 53,692 100,839 74,289 33,128 400,070
Total Injury/BH/Unclass. Visits 111,486 45,514 88,006 73,844 43,089 361,939
Tot. non Primary Care Related (Total minus PCR) 156,146 72,288 145,728 129,883 96,636 600,682
Non-Emergent 54,458 25,260 45,638 32,379 12,579 170,314
Emergent-Primary Care Treatable 63,324 22,968 44,823 32,072 14,620 177,807
Emergent Care Needed-Preventable/Avoidable 20,341 5,464 10,378 9,837 5,929 51,949
Emergent Care Needed-NOT Prev./Av. (dc) 18,925 13,382 30,789 25,978 14,363 103,438
TOTAL Categorized Visits 157,048 67,074 131,628 100,267 47,491 503,508
Table 5b. Percentage of ED Visit Types by Age (read horizontally)
Type of Visit 0-17 18-25 26-44 45-64 65+ All
Total Visits (hospitalized & non hospitalized) 29.4% 12.6% 24.6% 20.4% 13.0% 100.0%
Total Hospitalized Visits 19.0% 9.9% 19.9% 22.2% 29.0% 100.0%
Total Primary Care Related* 34.5% 13.4% 25.2% 18.6% 8.3% 100.0%
Total Injury/BH/Unclass. Visits 30.8% 12.6% 24.3% 20.4% 11.9% 100.0%
Tot. non Primary Care Related (Total minus PCR)* 26.0% 12.0% 24.3% 21.6% 16.1% 100.0%
Non-Emergent 32.0% 14.8% 26.8% 19.0% 7.4% 100.0%
Emergent-Primary Care Treatable 35.6% 12.9% 25.2% 18.0% 8.2% 100.0%
Emergent Care Needed-Preventable/Avoidable 39.2% 10.5% 20.0% 18.9% 11.4% 100.0%
Emergent Care Needed-NOT Prev./Av. (dc) 18.3% 12.9% 29.8% 25.1% 13.9% 100.0%
TOTAL Categorized Visits 31.2% 13.3% 26.1% 19.9% 9.4% 100.0% * Reflected in figures on following page.
42
Figure 16. PCRED Visits by Age (N=26)
0-17, 34.5%
18-25, 13.4%
26-44, 25.2%
45-64, 18.6%
65+, 8.3%
Figure 17. All Other1 ED Visits by Age (N=26)
0-17, 26.0%
18-25, 12.0%
26-44, 24.3%
45-64, 21.6%
65+, 16.1%
1 Non PCR non-hospitalized visits and hospitalized visits.

43
Table 5c. Percentage of ED Visit Types by Age (read vertically)
Type of Visit 0-17 18-25 26-44 45-64 65+ All
Percentage Primary Care Related 46.9% 42.6% 40.9% 36.4% 25.5% 40.0%
Percentage ED Care Needed, Not Prev. 6.4% 10.6% 12.5% 12.7% 11.1% 10.3%
Percentage Injury/BH/Unclass. 37.9% 36.1% 35.7% 36.2% 33.2% 36.2%
Percentage Hospitalized 8.7% 10.6% 10.9% 14.7% 30.2% 13.5%
Total 100.0% 100.0% 100.0% 100.0% 100.0% 100.0%
Figure 18. Age by ED Visit Type (N=26)
0%
10%
20%
30%
40%
50%
60%
70%
80%
90%
100%
0-17 18-25 26-44 45-64 65+ All
Percentage Hospitalized
Percentage Injury/BH/Unclass.
Percentage ED Care Needed, NotPrev.
Percentage Primary Care Related

44
Table 6a. Frequency of ED Visit Types by Gender (N=26)
Type of Visit Female Male Unk All
Total Visits (hospitalized & non hospitalized) 565,330 435,364 58 1,000,752
Total Hospitalized Visits 76,033 59,260 12 135,305
Total Primary Care Related 237,309 162,745 17 400,070
Total Injury/BH/Unclass. Visits 191,568 170,346 25 361,939
Tot. non Primary Care Related (Total minus PCR) 328,021 272,619 41 600,682
Non-Emergent 104,734 65,572 8 170,314
Emergent-Primary Care Treatable 104,137 73,663 7 177,807
Emergent Care Needed-Preventable/Avoidable 28,438 23,509 2 51,949
Emergent Care Needed-NOT Prev./Av. (dc) 60,420 43,013 4 103,438
TOTAL Categorized Visits 297,729 205,758 21 503,508
Table 6b. Percentage of ED Visit Types by Gender (read horizontally)
Type of Visit Female Male Unk All
Total Visits (hospitalized & non hospitalized) 56.5% 43.5% 0.0% 100.0%
Total Hospitalized Visits 56.2% 43.8% 0.0% 100.0%
Total Primary Care Related* 59.3% 40.7% 0.0% 100.0%
Total Injury/BH/Unclass. Visits 52.9% 47.1% 0.0% 100.0%
Tot. non Primary Care Related (Total minus PCR)* 54.6% 45.4% 0.0% 100.0%
Non-Emergent 61.5% 38.5% 0.0% 100.0%
Emergent-Primary Care Treatable 58.6% 41.4% 0.0% 100.0%
Emergent Care Needed-Preventable/Avoidable 54.7% 45.3% 0.0% 100.0%
Emergent Care Needed-NOT Prev./Av. (dc) 58.4% 41.6% 0.0% 100.0%
TOTAL Categorized Visits 59.1% 40.9% 0.0% 100.0%
* Reflected in figures on following page.

45
Figure 19. Primary Care Related ED Visits by Gender (N=26)
Female, 59.3%
Male, 40.7%
Figure 20. All Other1 ED Visits by Gender (N=26)
Female, 54.6%
Male, 45.4%
1 Non PCR non-hospitalized visits and hospitalized visits.
46
Table 6c. Percentage of ED Visit Types by Gender (read vertically)
Type of Visit Female Male Unk All
Percentage Primary Care Related 42.0% 37.4% 28.9% 40.0%
Percentage ED Care Needed, Not Prev. 10.7% 9.9% 7.3% 10.3%
Percentage Injury/BH/Unclass. 33.9% 39.1% 43.1% 36.2%
Percentage Hospitalized 13.4% 13.6% 20.7% 13.5%
Total 100.0% 100.0% 100.0% 100.0%
Figure 21. Gender by ED Visit Type (N=26)
0%
10%
20%
30%
40%
50%
60%
70%
80%
90%
100%
Female Male Unk All
Percentage Hospitalized
Percentage Injury/BH/Unclass.
Percentage ED Care Needed, NotPrev.
Percentage Primary Care Related

47
ED Visits by Method of Transporation to the ED
Visits were classified according to the following groupings: ambulance (any form of
ground or air ambulance), self (automobile, walk in, public transporation), other (e.g. police,
newborns), and unknown (field was empty or missing). Even though the hospitals invited to take
part in the study are primarily the ones serving the Houston 911 service area, non HFD
ambulance transports are reflected in these results as well.
Fewer than one in ten (7.9%) PCRED visits were by persons with an
ambulance transport to the ED. By contrast, nearly one in five (16.9%) non-PCRED visits were
by persons with an ambulance transport to the ED (Tables 7a & 7b; Figures 22 & 23). More than
one fourth (26.3%) of ambulance transports to the ED eventually resulted in a hospitalization
(Table 7c and Figure 24). The findings for transport status are limited by the large
percentage of visits with an unknown transport status (23.2% PCRED, 24.6% non PCRED).
48
Table 7a. Frequency of ED Visit Types by Transport (N=25)
Type of Visit Ambulance Self Other Unk All
Total Visits (hospitalized & non hospitalized) 133,362 619,997 7,247 240,146 1,000,752
Total Hospitalized Visits 35,096 65,295 2,319 32,595 135,305
Total Primary Care Related 31,752 273,815 1,833 92,671 400,070
Total Injury/BH/Unclass. Visits 52,925 213,978 2,661 92,375 361,939
Tot. non Primary Care Related (Total minus PCR) 101,610 346,182 5,414 147,475 600,682
Non-Emergent 11,559 117,610 787 40,358 170,314
Emergent-Primary Care Treatable 13,418 121,408 781 42,200 177,807
Emergent Care Needed-Preventable/Avoidable 6,774 34,796 265 10,114 51,949
Emergent Care Needed-NOT Prev./Av. (dc) 13,589 66,909 434 22,505 103,438
TOTAL Categorized Visits 45,341 340,724 2,267 115,176 503,508
Table 7b. Percentage of ED Visit Types by Transport (read horizontally)
Type of Visit Ambulance Self Other Unk All
Total Visits (hospitalized & non hospitalized) 13.3% 62.0% 0.7% 24.0% 100.0%
Total Hospitalized Visits 25.9% 48.3% 1.7% 24.1% 100.0%
Total Primary Care Related* 7.9% 68.4% 0.5% 23.2% 100.0%
Total Injury/BH/Unclass. Visits 14.6% 59.1% 0.7% 25.5% 100.0%
Tot. non Primary Care Related (Total minus PCR)* 16.9% 57.6% 0.9% 24.6% 100.0%
Non-Emergent 6.8% 69.1% 0.5% 23.7% 100.0%
Emergent-Primary Care Treatable 7.5% 68.3% 0.4% 23.7% 100.0%
Emergent Care Needed-Preventable/Avoidable 13.0% 67.0% 0.5% 19.5% 100.0%
Emergent Care Needed-NOT Prev./Av. (dc) 13.1% 64.7% 0.4% 21.8% 100.0%
TOTAL Categorized Visits 9.0% 67.7% 0.5% 22.9% 100.0% * Reflected in figures on following page.

49
Figure 22. Primary Care Related ED Visits by Transport (N=26)
Ambulance, 7.9%
Self, 68.4%
Other, 0.5%
Unk, 23.2%
Figure 23. All Other1 ED Visits by Transport (N=26)
Ambulance, 16.9%
Self, 57.6%
Other, 0.9%
Unk, 24.6%
1 Non PCR non-hospitalized visits and hospitalized visits.
50
Table 7c. Percentage of ED Visit Types by Transport (read vertically)
Type of Visit Ambulance Self Other Unk All
Percentage Primary Care Related 23.8% 44.2% 25.3% 38.6% 40.0%
Percentage ED Care Needed, Not Prev. 10.2% 10.8% 6.0% 9.4% 10.3%
Percentage Injury/BH/Unclass. 39.7% 34.5% 36.7% 38.5% 36.2%
Percentage Hospitalized 26.3% 10.5% 32.0% 13.6% 13.5%
Total 100.0% 100.0% 100.0% 100.0% 100.0%
Figure 24. Transport by ED Visit Type (N = 26)
0%
10%
20%
30%
40%
50%
60%
70%
80%
90%
100%
Percentage Hospitalized
Percentage Injury/BH/Unclass.
Percentage ED Care Needed,
Not Prev.
Percentage Primary Care
Related

51
E. Health Conditions of Patients with ED Visits
Categorized (primary and non primary care related) ED visits
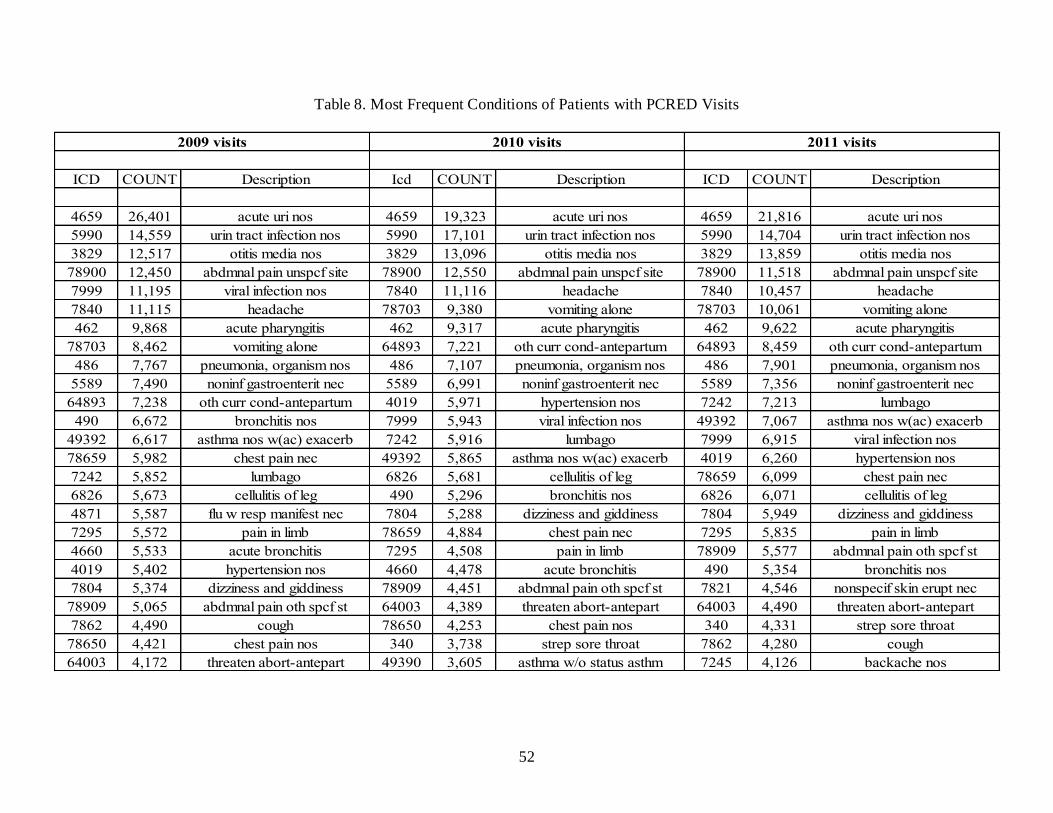
The most common discharge diagnoses of patients with PCRED visits for the last three
years have been acute upper respiratory infection not otherwise specified, urinary tract infection
not otherwise specified, otitis media NOS, and abdominal pain unspecified site (Table 8). Chest
pain not otherwise specified has been the leading non-PCRED diagnosis for the last three years
(Table 9).
F. Behavioral Health Related ED Visits
The percentage of persons with any behavioral health diagnosis was at 9.1% in 2011, its
highest level in three years. The percentage of persons with a primary medical diagnosis (ICD1)
as well as a behavioral health diagnosis (ICD 2 through 10) was likewise at its highest level in
three years (6.9%) (Table 10).
52
Table 8. Most Frequent Conditions of Patients with PCRED Visits
ICD COUNT Description Icd COUNT Description ICD COUNT Description
4659 26,401 acute uri nos 4659 19,323 acute uri nos 4659 21,816 acute uri nos
5990 14,559 urin tract infection nos 5990 17,101 urin tract infection nos 5990 14,704 urin tract infection nos
3829 12,517 otitis media nos 3829 13,096 otitis media nos 3829 13,859 otitis media nos
78900 12,450 abdmnal pain unspcf site 78900 12,550 abdmnal pain unspcf site 78900 11,518 abdmnal pain unspcf site
7999 11,195 viral infection nos 7840 11,116 headache 7840 10,457 headache
7840 11,115 headache 78703 9,380 vomiting alone 78703 10,061 vomiting alone
462 9,868 acute pharyngitis 462 9,317 acute pharyngitis 462 9,622 acute pharyngitis
78703 8,462 vomiting alone 64893 7,221 oth curr cond-antepartum 64893 8,459 oth curr cond-antepartum
486 7,767 pneumonia, organism nos 486 7,107 pneumonia, organism nos 486 7,901 pneumonia, organism nos
5589 7,490 noninf gastroenterit nec 5589 6,991 noninf gastroenterit nec 5589 7,356 noninf gastroenterit nec
64893 7,238 oth curr cond-antepartum 4019 5,971 hypertension nos 7242 7,213 lumbago
490 6,672 bronchitis nos 7999 5,943 viral infection nos 49392 7,067 asthma nos w(ac) exacerb
49392 6,617 asthma nos w(ac) exacerb 7242 5,916 lumbago 7999 6,915 viral infection nos
78659 5,982 chest pain nec 49392 5,865 asthma nos w(ac) exacerb 4019 6,260 hypertension nos
7242 5,852 lumbago 6826 5,681 cellulitis of leg 78659 6,099 chest pain nec
6826 5,673 cellulitis of leg 490 5,296 bronchitis nos 6826 6,071 cellulitis of leg
4871 5,587 flu w resp manifest nec 7804 5,288 dizziness and giddiness 7804 5,949 dizziness and giddiness
7295 5,572 pain in limb 78659 4,884 chest pain nec 7295 5,835 pain in limb
4660 5,533 acute bronchitis 7295 4,508 pain in limb 78909 5,577 abdmnal pain oth spcf st
4019 5,402 hypertension nos 4660 4,478 acute bronchitis 490 5,354 bronchitis nos
7804 5,374 dizziness and giddiness 78909 4,451 abdmnal pain oth spcf st 7821 4,546 nonspecif skin erupt nec
78909 5,065 abdmnal pain oth spcf st 64003 4,389 threaten abort-antepart 64003 4,490 threaten abort-antepart
7862 4,490 cough 78650 4,253 chest pain nos 340 4,331 strep sore throat
78650 4,421 chest pain nos 340 3,738 strep sore throat 7862 4,280 cough
64003 4,172 threaten abort-antepart 49390 3,605 asthma w/o status asthm 7245 4,126 backache nos
2011 visits2010 visits2009 visits

53
Table 9. Most frequent Conditions of Patients with Non PCRED Visits
ICD COUNT Description Icd COUNT Description ICD COUNT Description
78650 9,225 chest pain nos 78650 8,877 chest pain nos 78650 8,278 chest pain nos
78900 6,140 abdmnal pain unspcf site 78900 6,189 abdmnal pain unspcf site 78900 5,680 abdmnal pain unspcf site
5921 4,024 calculus of ureter 5921 4,378 calculus of ureter 5921 4,930 calculus of ureter
78659 3,807 chest pain nec 7802 3,591 syncope and collapse 7802 4,132 syncope and collapse
7802 3,719 syncope and collapse 78659 3,108 chest pain nec 78659 3,881 chest pain nec
78909 2,498 abdmnal pain oth spcf st 78909 2,195 abdmnal pain oth spcf st 78909 2,750 abdmnal pain oth spcf st
64003 2,086 threaten abort-antepart 64003 2,194 threaten abort-antepart 2767 2,354 hyperpotassemia
4871 1,862 flu w resp manifest nec 78703 2,010 vomiting alone 64003 2,245 threaten abort-antepart
78703 1,813 vomiting alone 5770 1,843 acute pancreatitis 78703 2,156 vomiting alone
7840 1,659 headache 57420 1,792 cholelithiasis nos 42731 1,995 atrial fibrillation
57420 1,531 cholelithiasis nos 7840 1,659 headache 7851 1,771 palpitations
46619 1,504 acu brnchlts d/t oth org 5920 1,655 calculus of kidney 56211 1,628 dvrtcli colon w/o hmrhg
42731 1,495 atrial fibrillation 42731 1,572 atrial fibrillation 4644 1,611 croup
7851 1,459 palpitations 7851 1,477 palpitations 57420 1,609 cholelithiasis nos
5920 1,452 calculus of kidney 56211 1,375 dvrtcli colon w/o hmrhg 46619 1,608 acu brnchlts d/t oth org
56211 1,331 dvrtcli colon w/o hmrhg 53550 1,298 gstr/ddnts nos w/o hmrhg 7840 1,561 headache
4644 1,294 croup 7243 1,291 sciatica V715 1,461 observ following rape
78605 1,265 shortness of breath 46619 1,275 acu brnchlts d/t oth org 41071 1,443 subendo infarct, initial
5770 1,262 acute pancreatitis 5789 1,231 gastrointest hemorr nos 5770 1,440 acute pancreatitis
7999 1,256 viral infection nos 4644 1,221 croup 5920 1,401 calculus of kidney
53550 1,226 gstr/ddnts nos w/o hmrhg V715 1,177 observ following rape 7243 1,365 sciatica
5409 1,219 acute appendicitis nos 41071 1,098 subendo infarct, initial 5789 1,295 gastrointest hemorr nos
V715 1,183 observ following rape 5409 1,079 acute appendicitis nos 43491 1,226 crbl art ocl nos w infrc
5789 1,159 gastrointest hemorr nos 43491 1,021 crbl art ocl nos w infrc 5409 1,207 acute appendicitis nos
7243 1,105 sciatica 28262 993 hb-s disease with crisis 78605 1,180 shortness of breath
2011 visits2010 visits2009 visits

54
Table 10. Total Behavioral Health1 Visits To Harris County Area Hospitals
1 “Behavioral Health” = mental health, alcohol, or drug related.
2 Harris County, all diagnoses, all discharge dispositions.
3 “Primary diagnosis” = first ICD code. “Any other diagnosis” = ICD codes 2 through 10.
4 A medical diagnosis is the primary diagnosis.
5 Unlike above, “secondary diagnosis” in this case refers only to the second ICD code. Person may or may not have a secondary medical diagnosis.
Frequency - Primary diagnosis and any other diagnosis 2009 2010 2011
N = 24 N = 25 N = 26
Total Visits2
953,395 878,941 1,008,241
Total Visits With Any Behavioral Health Diagnosis 73,383 74,401 91,269
Total Visits With No Behavioral Health Diagnosis 880,012 804,540 916,972
Total Visits With a Behavioral Health Diagnosis as the primary diagnosis3
10,311 12,371 12,824
Total Visits With a Behavioral Health Diagnosis as both primary and any other diagnosis3
8,211 7,939 9,050
Total Visits With a Behavioral Health Diagnosis as any other diagnosis3,4
54,861 54,091 69,395
Percentage of First Row
Total Visits 100.0% 100.0% 100.0%
Total Visits With Any Behavioral Health Diagnosis 7.7% 8.5% 9.1%
Total Visits With No Behavioral Health Diagnosis 92.3% 91.5% 90.9%
Total Visits With a Behavioral Health Diagnosis as the primary diagnosis 1.1% 1.4% 1.3%
Total Visits With a Behavioral Health Diagnosis as both primary and any other diagnosis3
0.9% 0.9% 0.9%
Total Visits With a Behavioral Health Diagnosis as any other diagnosis3,4
5.8% 6.2% 6.9%
Frequency - Primary and secondary diagnoses
Total Visits With a Mental Health Diagnosis as the primary diag. & no secondary behavioral diag.5
2,761 3,474 3,648
Total Visits With an Alcohol Related Diagnosis as the primary diag. & no secondary behavioral diag.5
1,079 1,649 1,262
Total Visits With a Drug Related Diagnosis as the primary diag. & no secondary behavioral diag.5
137 167 244
Total Visits With a medical diagnosis as the primary diag. & Mental Health as the secondary diag.5
11,155 10,943 13,471
Total Visits With a medical diagnosis as the primary diag. & Alcohol Related as the secondary diag.5
3,689 3,322 3,971
55
G. Length of Stay in the ED
The mean length of stay of ED visits (measured from time of admission to the ED to time
of discharge from the ED) was calculated for visits of less than 24 hours each. The mean LOS
for PCRED visits rose slightly in 2011 (3.93 hours). Non hospitalized behavioral health visits
continue to last longer than non hospitalized medical visits. In 2011 the difference amounted to
two hours (4.13 hours medical vs. 6.16 hours behavioral) (Table 11).
H. Estimated Cost of Primary Care Related ED Visits
Applying national estimates of the unit cost of ED visits to Houston ED visits suggests
that the greatest potential cost savings would be diverting PCRED visits among adults age 18 to
44 (Table 12, Figure 25). The cost estimates do not account for the variability that may occur
among treating chronic vs. acute conditions (e.g. treatment for chronic conditions may be more
expensive).
1 1Machlin, S.R. Trends in health care expenditures: 2006 versus 1996. Statistical Briefs #253-256. August 2009.
Agency for Healthcare Research and Quality, Rockville, MD. Available at
http://www.meps.ahrq.gov/mepsweb/data_stats/MEPS_topics.jsp?topicID=5Z-1. 2006 estimates were used for this
report. These national estimates are based on all payer sources (e.g. insured and uninsured). They may not reflect
actual hospital charges or procedures administered during treatment. Outpatient estimate may or may not cover both
primary care and specialty care. MEPS estimates were adjusted for inflation.

56
Table 11. Hospitals in the Houston 911 Service Area. Mean length of stay (in hours) in the
emergency department for visits of less than 24 hours.
Residence Discharge status 2009 Mean
(sd)
24 hospitals
2010 Mean
(sd)
25 hospitals
2011 Mean
(sd)
26 hospitals
Harris County
All Visits1
4.54 (4.27) 4.44 (4.13) 4.67 (4.71)
Harris County
Primary care
related1
3.70 (3.49) 3.54 (3.30) 3.93 (4.01)
Harris County
All non-
hospitalized1
4.34 (4.04) 4.20 (3.82) 4.58 (4.60)
Harris County
Other1,2
6.84 (5.83) 6.63 (5.95) 5.77 (5.77)
Harris County
Non-hospitalized
medical3
4.28 (3.94) 4.14 (3.70) 4.13 (4.01)
Harris County
Non-hospitalized
behavioral3
6.01 (5.02) 5.83 (4.94) 6.16 (5.47)
1 All diagnoses
2 Admitted, transferred to another facility, etc.
3 Medical or behavioral as the primary discharge diagnosis.
57
Table 12. Estimated costs of primary care related emergency room visits, estimated costs of treating those same patients in an
outpatient setting – all payer sources1
17 and under 142,210 $568 $80,832,363 $151 $21,445,321 $59,387,042
18 to 44 148,674 $740 $110,030,654 $209 $31,043,131 $78,987,523
45 to 64 69,914 $1,099 $76,801,513 $240 $16,787,659 $60,013,854
65 and over 30,147 $755 $22,766,132 $209 $6,294,783 $16,471,349
Total Primary Care Visits 390,945 na2
$290,430,662 na2
$75,570,894 $214,859,768
17 and under 122,030 $598 $72,949,373 $159 $19,353,915 $53,595,457
18 to 44 140,919 $778 $109,686,071 $220 $30,945,913 $78,740,157
45 to 64 66,563 $1,155 $76,902,377 $253 $16,809,706 $60,092,670
65 and over 30,413 $794 $24,154,478 $220 $6,678,657 $17,475,820
Total Primary Care Visits 359,925 na2
$283,692,298 na2
$73,788,192 $209,904,105
17 and under 138,123 $621 $85,818,638 $165 $22,768,210 $63,050,428
18 to 44 154,531 $809 $125,012,818 $228 $35,270,074 $89,742,744
45 to 64 74,289 $1,201 $89,205,878 $262 $19,499,067 $69,706,810
65 and over 33,128 $825 $27,345,794 $228 $7,561,049 $19,784,745
Total Primary Care Visits 400,070 na2
$327,383,128 na2
$85,098,400 $242,284,727
2011 (26 hospitals)
2010 (24 hospitals)
2009 (24 hospitals)
1
1Machlin, S.R. Trends in health care expenditures: 2006 versus 1996. Statistical Briefs #253-256. August 2009. Agency for Healthcare Research and Quality, Rockville, MD. Available at
http://www.meps.ahrq.gov/mepsweb/data_stats/MEPS_topics.jsp?topicID=5Z-1. 2006 estimates were used for this report. These national estimates are based on all payer sources (e.g. insured and
uninsured). They may not reflect actual hospital charges or procedures administered during treatment. Outpatient estimate may or may not cover both primary care and specialty care. MEPS estimates
were adjusted for inflation. 2 MEPS estimates were only created for specific age groups.

58
Figure 25. Estimated savings for treating all PCRED visits in an outpatient setting – all payer sources
(final column of previous table)
$0
$10,000,000
$20,000,000
$30,000,000
$40,000,000
$50,000,000
$60,000,000
$70,000,000
$80,000,000
$90,000,000
$100,000,000
2009 2010 2011
17 and under
18 to 44
45 to 64
65 and over

59
I. Geographic Distribution of Patients with ED Visits
The highest numbers of ED visits were in the following ZIP code clusters: 1) the
intersection of Highway 59 and the North Loop East; 2) the Ship Channel and the area along
Interstate 10 and the East Belt; 3) scattered areas of south Harris County; 4) an area along the
Southwest Freeway and between the West Loop and West Belt; 5) the Bear Creek and Katy areas
of west Harris County (Map 1).
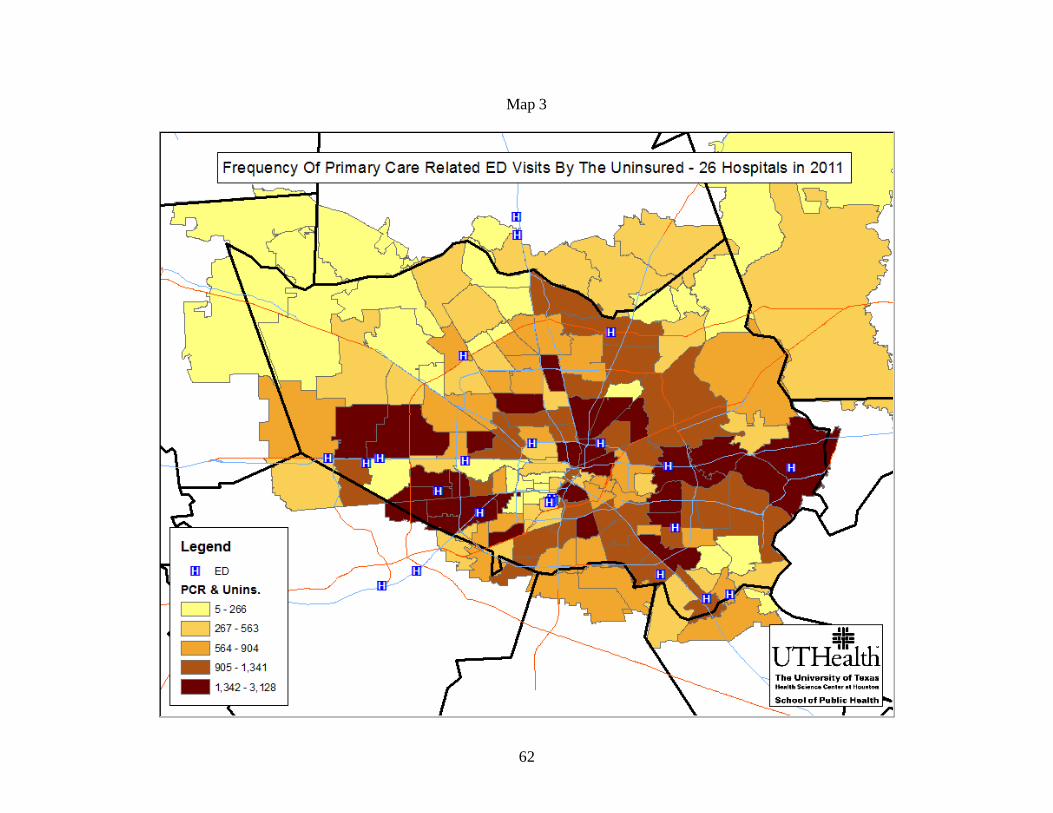
The geographic distribution of PCRED visits by the insured and uninsured was similar to
that of ED visits (Maps 2 and 3).
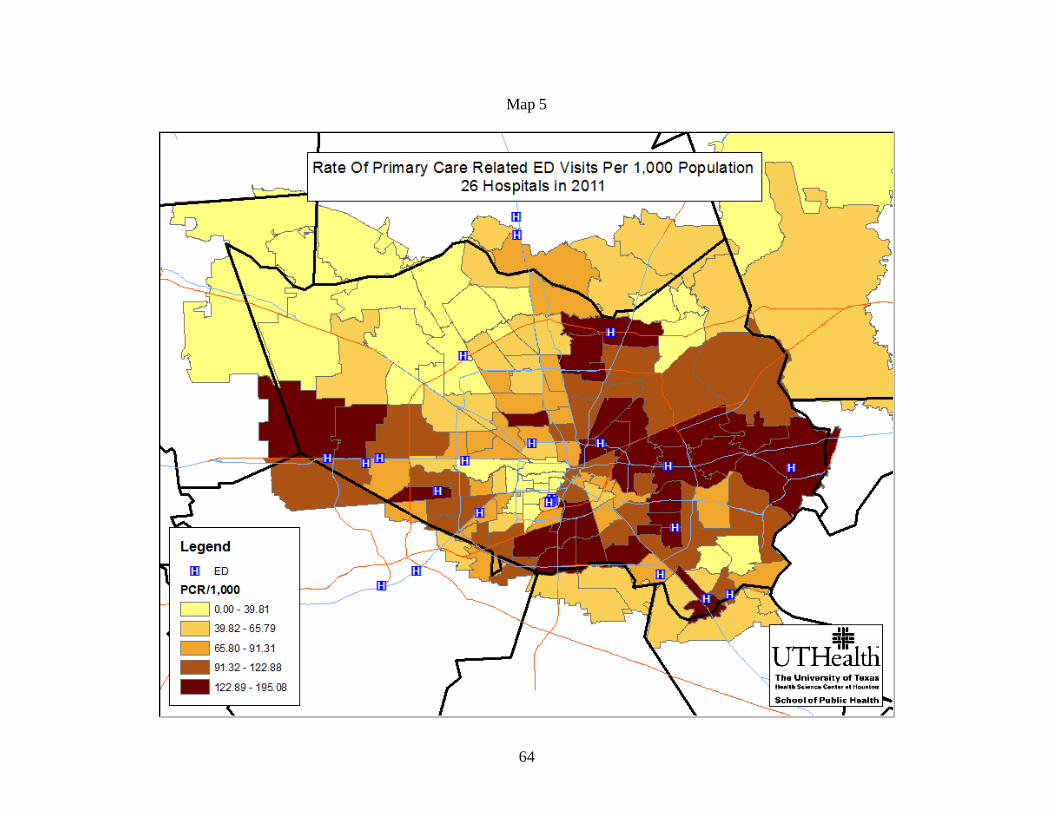
The areas with the highest rates of ED visits, PCRED visits by all, and PCRED visits by
the uninsured were the East/Northeast and South Central areas of Harris County, as well as the
Katy area in the west (Maps 4, 5, and 6).

60
Map 1

61
Map 2
62
Map 3

63
Map 4
64
Map 5
65
Map 6

66
J. Trends in ED Visits Over Time
To examine trends over time, annual ED visits at 15 participating hospitals in which
patients were discharged home or elsewhere were tracked over the five-year period from 2004 to
2011 (Ben Taub General, Lyndon B. Johnson General, Memorial Hermann (MH) Hermann, MH
Southwest, MH Southeast, MH Northwest, MH Woodlands, MH Memorial City, MH Katy, MH
Sugar Land (formerly Fort Bend), Hospital Corporation of America (HCA) Bayshore,, HCA East
Houston, Texas Children’s Hospital, Spring Branch Medical Center, St. Luke’s Episcopal
Hospital). The ED visits of 22 participating hospitals were tracked over the four-year period
from 2005 to 2011 (above listed hospitals, plus MH Northeast, HCA West Houston, CHRISTUS
St. Catherine, CHRISTUS St. John, St. Luke’s Community Medical Center, The Methodist
Hospital, and San Jacinto Methodist Hospital). Both groups include Spring Branch Medical
Center data only for the 2004- 2010 period.
In both groups the percentage of non-hospitalized visits that are PCR has fluctuated over
the years, and was slightly higher among the 15 (49.7%) than among the 22 (46.8%). By
contrast, the percentage of hospitalizations were lower among the 15 (11.4%) than among the 22
(13.0%) (Tables 13 and 14).
After a reordering in 2010, the uninsured once again had the most PCRED visits of any
other payer source group. Persons enrolled in Medicaid were second highest (Figures 26 and
27).).
Hispanics continue to have the greatest percentage of PCRED visits (Figures 28 & 29).
Blacks have the next highest percentage of PCRED visits.
Visits by children age 17 and under continue to account for the largest proportion of
PCRED visits. That percentage has been slowly declining according to both hospital groups
67
(Figures 30 & 31). Adults age 26 to 44 accounted for the next largest percentage, and there has
been a slow increase in the percentages of visits by adults age 65 and over.
There has been little change in the percentage of PCRED visits by gender over the last
several years (Figures 32 & 33).
PCRED visits for the last four years were analyzed by transport status using data from the
22-hospital group. The majority of persons with a PCRED visit do not come by ambulance, but
use some other means of transportation (Figure 34).
68
Table 13. 2004-2011 ED Visits at 15 Hospitals by Harris County Residents
Type of Visit 2004 2005 2006 2007 2008 2009 2010 2011
Number 15 15 15 15 15 15 15 15
CATEGORIZED NON HOSPITALIZED VISITS
Non-Emergent 131,895 108,241 116,210 99,256 88,747 126,632 105,304 115,129
Emergent, Primary Care Treatable 131,694 114,835 124,253 11,595 96,710 140,846 113,642 119,618
Emergent, ED Care Needed - Preventable/Avoidable 43,384 38,771 43,223 40,179 27,612 40,044 35,191 35,828
Total Primary Care Related Visits, Harris County 306,973 261,847 283,686 151,030 213,069 307,522 254,136 270,575
Emergent, ED Care Needed - NOT Preventable/Avoidable 62,039 54,530 64,662 57,642 56,381 72,619 63,545 69,204
Total Categorized Visits, Harris County 369,011 316,377 348,348 208,672 269,450 380,141 317,681 339,779
NON-CATEGORIZED NON HOSPITALIZED VISITS
Injury 126,305 103,492 119,022 106,278 106,482 117,569 108,391 110,040
Mental Health Related 8,412 5,858 6,207 6,227 5,905 7,188 6,188 6,738
Alcohol or Drug Related 3,907 3,263 3,784 3,756 2,349 3,962 4,054 3,751
Unclassif ied 52,923 41,656 52,803 68,660 125,733 88,768 78,191 84,385
Total Non-Categorized Non Hosp. Visits, Harris County 191,547 154,269 181,816 184,921 240,469 217,487 196,824 204,914
Total Non Hospitalized Visits, Harris County 560,558 470,646 530,164 393,593 509,919 597,628 514,505 544,693
Percent
NON HOSPITALIZED VISITS - CATEGORIZED
Non-Emergent 35.7% 34.2% 33.4% 47.6% 32.9% 33.3% 33.1% 33.9%
Emergent - Primary Care Treatable 35.7% 36.3% 35.7% 5.6% 35.9% 37.1% 35.8% 35.2%
ED Care Needed - Prev./Avoid. 11.8% 12.3% 12.4% 19.3% 10.2% 10.5% 11.1% 10.5%
% Categorized That Area Primary Care Related 83.2% 82.8% 81.4% 72.4% 79.1% 80.9% 80.0% 79.6%
ED Care Needed - NOT Prev./Avoid. 16.8% 17.2% 18.6% 27.6% 20.9% 19.1% 20.0% 20.4%
NON HOSPITALIZED VISITS - CAT. & NON CAT.
Non-Emergent 23.5% 23.0% 21.9% 25.2% 17.4% 21.2% 20.5% 21.1%
Emergent - Primary Care Treatable 23.5% 24.4% 23.4% 2.9% 19.0% 23.6% 22.1% 22.0%
ED Care Needed - Prev./Avoid. 7.7% 8.2% 8.2% 10.2% 5.4% 6.7% 6.8% 6.6%
% Non Hosp. That Are Primary Care Related 54.8% 55.6% 53.5% 38.4% 41.8% 51.5% 49.4% 49.7%
ED Care Needed - NOT Prev./Avoid. 11.1% 11.6% 12.2% 14.6% 11.1% 12.2% 12.4% 12.7%
% Non Hosp. That Are Categorized 65.8% 67.2% 65.7% 53.0% 52.8% 63.6% 61.7% 62.4%
Injury 22.5% 22.0% 22.5% 27.0% 20.9% 19.7% 21.1% 20.2%
Mental Health Related 1.5% 1.2% 1.2% 1.6% 1.2% 1.2% 1.2% 1.2%
Alcohol or Drug Related 0.7% 0.7% 0.7% 1.0% 0.5% 0.7% 0.8% 0.7%
Unclassif ied 9.4% 8.9% 10.0% 17.4% 24.7% 14.9% 15.2% 15.5%
% All Non Hospitalized ED Visits 100.0% 100.0% 100.0% 100.0% 100.0% 100.0% 100.0% 100.0%
HOSPITALIZED AND NON HOSPITALIZED VISITS
Hospitalized Visits 112,791 72,341 82,128 93,423 69,986
Non-Hospitalized Visits 518,545 521,910 463,450 523,023 544,693
Total Visits 631,336 594,251 545,578 616,446 616,446
HOSPITALIZED AND NON HOSPITALIZED VISITS
Hospitalized Visits 17.9% 12.2% 15.1% 15.2% 11.4%
Non-Hospitalized Visits 82.1% 87.8% 84.9% 84.8% 88.4%
Total Visits 100.0% 100.0% 100.0% 100.0% 100.0%
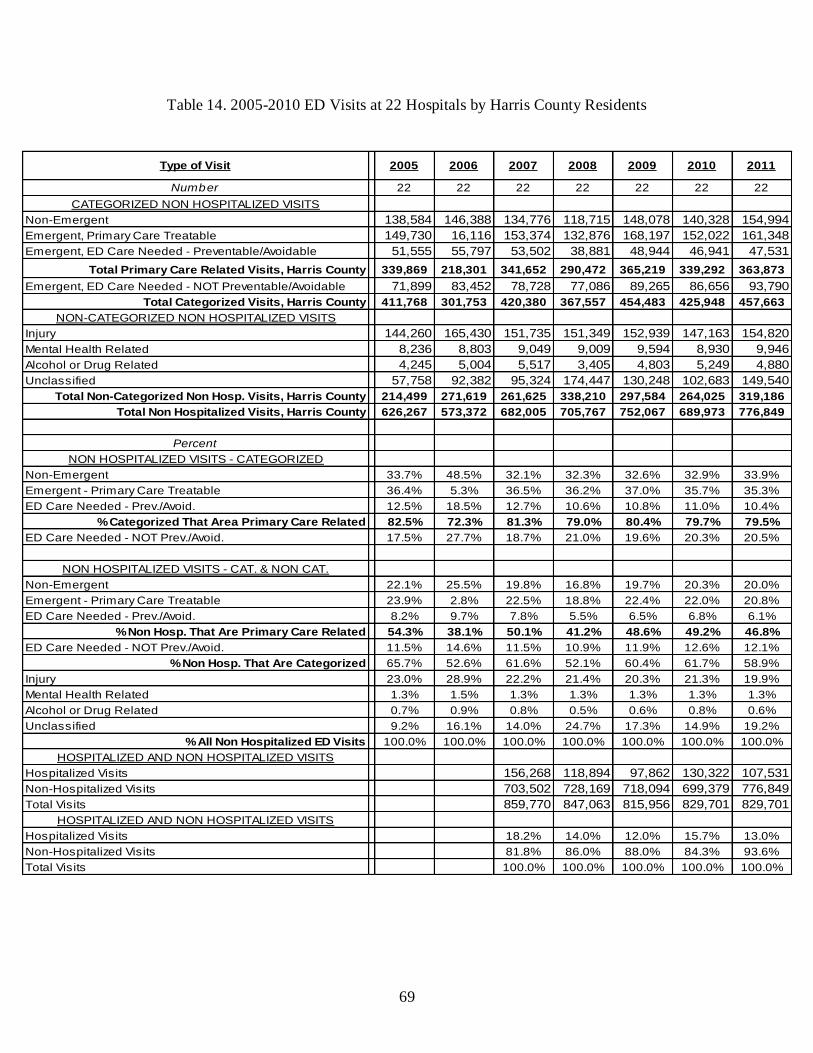
69
Table 14. 2005-2010 ED Visits at 22 Hospitals by Harris County Residents
Type of Visit 2005 2006 2007 2008 2009 2010 2011
Number 22 22 22 22 22 22 22
CATEGORIZED NON HOSPITALIZED VISITS
Non-Emergent 138,584 146,388 134,776 118,715 148,078 140,328 154,994
Emergent, Primary Care Treatable 149,730 16,116 153,374 132,876 168,197 152,022 161,348
Emergent, ED Care Needed - Preventable/Avoidable 51,555 55,797 53,502 38,881 48,944 46,941 47,531
Total Primary Care Related Visits, Harris County 339,869 218,301 341,652 290,472 365,219 339,292 363,873
Emergent, ED Care Needed - NOT Preventable/Avoidable 71,899 83,452 78,728 77,086 89,265 86,656 93,790
Total Categorized Visits, Harris County 411,768 301,753 420,380 367,557 454,483 425,948 457,663
NON-CATEGORIZED NON HOSPITALIZED VISITS
Injury 144,260 165,430 151,735 151,349 152,939 147,163 154,820
Mental Health Related 8,236 8,803 9,049 9,009 9,594 8,930 9,946
Alcohol or Drug Related 4,245 5,004 5,517 3,405 4,803 5,249 4,880
Unclassified 57,758 92,382 95,324 174,447 130,248 102,683 149,540
Total Non-Categorized Non Hosp. Visits, Harris County 214,499 271,619 261,625 338,210 297,584 264,025 319,186
Total Non Hospitalized Visits, Harris County 626,267 573,372 682,005 705,767 752,067 689,973 776,849
Percent
NON HOSPITALIZED VISITS - CATEGORIZED
Non-Emergent 33.7% 48.5% 32.1% 32.3% 32.6% 32.9% 33.9%
Emergent - Primary Care Treatable 36.4% 5.3% 36.5% 36.2% 37.0% 35.7% 35.3%
ED Care Needed - Prev./Avoid. 12.5% 18.5% 12.7% 10.6% 10.8% 11.0% 10.4%
% Categorized That Area Primary Care Related 82.5% 72.3% 81.3% 79.0% 80.4% 79.7% 79.5%
ED Care Needed - NOT Prev./Avoid. 17.5% 27.7% 18.7% 21.0% 19.6% 20.3% 20.5%
NON HOSPITALIZED VISITS - CAT. & NON CAT.
Non-Emergent 22.1% 25.5% 19.8% 16.8% 19.7% 20.3% 20.0%
Emergent - Primary Care Treatable 23.9% 2.8% 22.5% 18.8% 22.4% 22.0% 20.8%
ED Care Needed - Prev./Avoid. 8.2% 9.7% 7.8% 5.5% 6.5% 6.8% 6.1%
% Non Hosp. That Are Primary Care Related 54.3% 38.1% 50.1% 41.2% 48.6% 49.2% 46.8%
ED Care Needed - NOT Prev./Avoid. 11.5% 14.6% 11.5% 10.9% 11.9% 12.6% 12.1%
% Non Hosp. That Are Categorized 65.7% 52.6% 61.6% 52.1% 60.4% 61.7% 58.9%
Injury 23.0% 28.9% 22.2% 21.4% 20.3% 21.3% 19.9%
Mental Health Related 1.3% 1.5% 1.3% 1.3% 1.3% 1.3% 1.3%
Alcohol or Drug Related 0.7% 0.9% 0.8% 0.5% 0.6% 0.8% 0.6%
Unclassified 9.2% 16.1% 14.0% 24.7% 17.3% 14.9% 19.2%
% All Non Hospitalized ED Visits 100.0% 100.0% 100.0% 100.0% 100.0% 100.0% 100.0%
HOSPITALIZED AND NON HOSPITALIZED VISITS
Hospitalized Visits 156,268 118,894 97,862 130,322 107,531
Non-Hospitalized Visits 703,502 728,169 718,094 699,379 776,849
Total Visits 859,770 847,063 815,956 829,701 829,701
HOSPITALIZED AND NON HOSPITALIZED VISITS
Hospitalized Visits 18.2% 14.0% 12.0% 15.7% 13.0%
Non-Hospitalized Visits 81.8% 86.0% 88.0% 84.3% 93.6%
Total Visits 100.0% 100.0% 100.0% 100.0% 100.0%

70
Figure 26. PCRED Visits by Payer Source – 15 Hospitals
0%
5%
10%
15%
20%
25%
30%
35%
40%
45%
2004 2005 2006 2007 2008 2009 2010 2011
Commerc.
SCHIP
Medicaid
Medicare
Other Gov.
Uninsured
Figure 27. PCRED Visits by Payer Source – 22 Hospitals
0%
5%
10%
15%
20%
25%
30%
35%
40%
2005 2006 2007 2008 2009 2010 2011
Commerc.
SCHIP
Medicaid
Medicare
Other Gov.
Uninsured

71
Figure 28. PCRED Visits by Race/Ethnicity – 15 Hospitals
0%
5%
10%
15%
20%
25%
30%
35%
40%
45%
50%
2004 2005 2006 2007 2008 2009 2010 2011
Asian
Black
Hispanic
Am. Indian
Other
Unknown
White
Figure 29. PCRED Visits by Race/Ethnicity – 22 Hospitals
0%
5%
10%
15%
20%
25%
30%
35%
40%
45%
2005 2006 2007 2008 2009 2010 2011
Asian
Black
Hispanic
Am. Indian
Other
Unknown
White
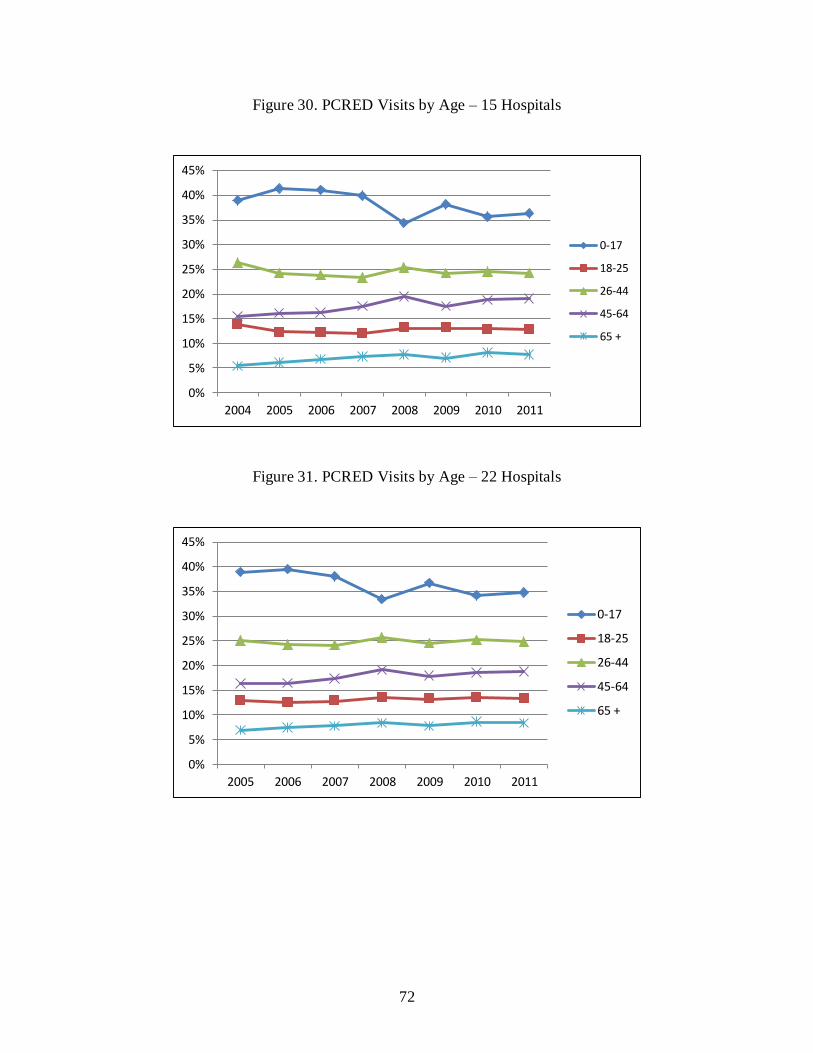
72
Figure 30. PCRED Visits by Age – 15 Hospitals
0%
5%
10%
15%
20%
25%
30%
35%
40%
45%
2004 2005 2006 2007 2008 2009 2010 2011
0-17
18-25
26-44
45-64
65 +
Figure 31. PCRED Visits by Age – 22 Hospitals
0%
5%
10%
15%
20%
25%
30%
35%
40%
45%
2005 2006 2007 2008 2009 2010 2011
0-17
18-25
26-44
45-64
65 +

73
Figure 32. PCRED Visits by Gender – 15 Hospitals
0%
10%
20%
30%
40%
50%
60%
70%
2004 2005 2006 2007 2008 2009 2010 2011
Female
Male
Figure 33. PCRED Visits by Gender – 22 Hospitals
0%
10%
20%
30%
40%
50%
60%
70%
2005 2006 2007 2008 2009 2010 2011
Female
Male

74
Figure 34. PCRED visits by transport – 22 hospitals
0%
10%
20%
30%
40%
50%
60%
70%
80%
90%
100%
2008 2009 2010 2011
Ambulance
Self
Other
Unk

75
K. Emergency Severity Index
The Emergency Severity Index1, or ESI, is a score commonly assigned to each ED patient
at the point of nursing triage. The score, which ranges from level 1 (most acute) to level 5 (least
acute) is used as an initial assessment of patient acuity and resource need. Of all ED visits by
Harris County residents in 2011, 437,086 were assigned an ESI score. The following analyses
are limited to this subset of visits.
More than half of total visits (52.6%) and PCRED visits (55.5%) had a score of level 3,
indicating a midrange level of acuity. Less than one percent of total visits (0.9%) and PCRED
visits (0.1%) were level 1, the highest level of acuity (Table 15).
More than six in ten PCRED visits by those with commercial insurance (62.0%) or
Medicare (62.0%) were level 3. Just over half of PCRED by persons enrolled in CHIP (51.4%)
or Medicaid (50.4%), as well as those without insurance (54.3%) were level 3. However, one in
five (19.8%) of all PCRED visits by Medicare enrollees were level 2, the highest percentage of
any payer source (Table 16).
Analysis of ESI scores were done according to a primary discharge diagnosis of a
medical condition (primary and non primary care related, injury/poisoning, unclassified
diagnosis) or a behavioral condition (mental health and substance abuse). Analyses included both
hospitalized and non hospitalized visits. In contrast to medical visits and PCRED visits, fewer
than half of all BHED visits (46.6%) were classified as level 3 whereas more than half of
medical ED visits (52.8%) were level 3. Four in ten (39.3%) of all BHED visits were classified
as level 2, the second highest level of acuity. In contrast, fewer than two in ten (14.2%) of all
medical ED visits were classified level 2 (Table 17).
1 http://www.ahrq.gov/professionals/systems/hospital/esi/esi1.html

76
Table 15. Total and PCRED visits by Emergency Severity Index (ESI)
Total ED Pct. PCR ED Pct
ESI 1 3,720 0.85% 170 0.09%
ESI 2 64,717 14.81% 16,920 9.11%
ESI 3 229,956 52.61% 103,031 55.48%
ESI 4 123,876 28.34% 57,027 30.71%
ESI 5 14,817 3.39% 8,560 4.61%
437,086 100.00% 185,708 100.00%
Table 16. PCRED visits by ESI and Payer Source.
ESI 1 ESI 2 ESI 3 ESI 4 ESI 5 Total
Commercial 23 2,658 21,678 9,776 810 34,945
CHIP 0 5 101 88 2 197
Medicaid 27 3,274 24,260 18,287 2,304 48,153
Medicare 72 4,128 12,935 3,287 439 20,862
Other Govt. 1 144 1,015 743 82 1,986
Uninsured 44 6,375 42,691 24,620 4,897 78,627
Unknown 2 336 351 225 25 939
170 16,920 103,031 57,027 8,560 185,708
ESI 1 ESI 2 ESI 3 ESI 4 ESI 5 Total
Commercial 0.07% 7.61% 62.03% 27.98% 2.32% 100.00%
CHIP 0.00% 2.76% 51.36% 44.71% 1.17% 100.00%
Medicaid 0.06% 6.80% 50.38% 37.98% 4.78% 100.00%
Medicare 0.35% 19.79% 62.00% 15.76% 2.11% 100.00%
Other Govt. 0.07% 7.25% 51.13% 37.42% 4.14% 100.00%
Uninsured 0.06% 8.11% 54.30% 31.31% 6.23% 100.00%
Unknown 0.20% 35.77% 37.37% 24.00% 2.67% 100.00%
Table 17. Total ER visits by ESI and medical or behavioral as primary discharge diagnosis.
Medical or Injury Behavioral
ESI 1 3,675 45
ESI 2 60,213 4,504
ESI 3 224,613 5,343
ESI 4 122,549 1,327
ESI 5 14,570 247
425,620 11,466
ESI 1 0.86% 0.39%
ESI 2 14.15% 39.28%
ESI 3 52.77% 46.60%
ESI 4 28.79% 11.57%
ESI 5 3.42% 2.15%

77
Limitations:
The NYU ED algorithm does not classify hospitalized visits, mental health,
drug/alcohol, and injury-related visits. It may be assumed that most hospitalized visits and a
large percentage of mental health, drug/alcohol, and injury visits are not PCRED visits. To the
extent that some are PCR, the estimates understate the number of PCRED visits. This limitation
does not affect the percentage of population rate calculations. Because the data submitted is de-
identified, it is not possible to identify patients who make multiple ED visits. Therefore, we are
not able to identify frequent users of the ED.