Embed Size (px)
Citation preview

Housing StartsDecember 2014
January 21, 2015
Copyright (c) 2014 by APA – The Engineered Wood Association. All rights reserved. Printed in the United States of America. No part of this publication may be reproduced, published, stored in a retrieval system, or transmitted, in any form or by any means, electronic, mechanical, photocopy, recording, or otherwise, without written permission from APA – The Engineered Wood Association.

Key TakeawaysResidential:
The housing starts data for December were generally very positive. Starts were up to an annual rate of 1.089 million units for the month, with the single-family sector driving the increase. The estimates for October and November were revised up with all of the revisions coming on the multifamily side. The NAHB Homebuilder Confidence Index was down one point in December, but still at a level consistent with increases in sales and starts activity. Perhaps the most important development has been the drop in mortgage rates to below 3.7%, which led to a surge in mortgage applications for purchase and refinance. The drop in the mortgage rate has been driven by the overall decline in long-term rates as global investors continue to look to the U.S. for yield as the central banks in Europe and Japan pursue their versions of quantitative easing. For example, the yields on German government bonds are currently below zero for maturities of 4 years or less and less than 0.5% on a 10-year government bond.
Other sectors:
The U.S. economy is entering 2015 with considerable momentum. The mix of healthy job gains and gas prices below $2/gallon throughout much of the nation has driven consumer confidence to the highest levels since the middle of the previous decade. Using data covering October and November, the consensus is growing that real GDP growth in the U.S. will be near 3.5% in the fourth quarter. It is true certain states will be hurt by the drop in oil prices, most notably Texas and North Dakota. However the drop in gas prices will give a boost to discretionary income throughout the country, which is likely to flow through to increased spending in remodeling and furniture. In Canada, a similar pattern will show up, with Alberta feeling the downside of the oil price decline and the rest of the nation doing relatively well. The decline in the Canadian dollar though will help the country’s exporters.
U.S. Housing ForecastSingle-family & Multifamily Only*
*Manufactured home production totaled 51,618 in 2011, 54,871 in 2012 and 60,300 in 2013.
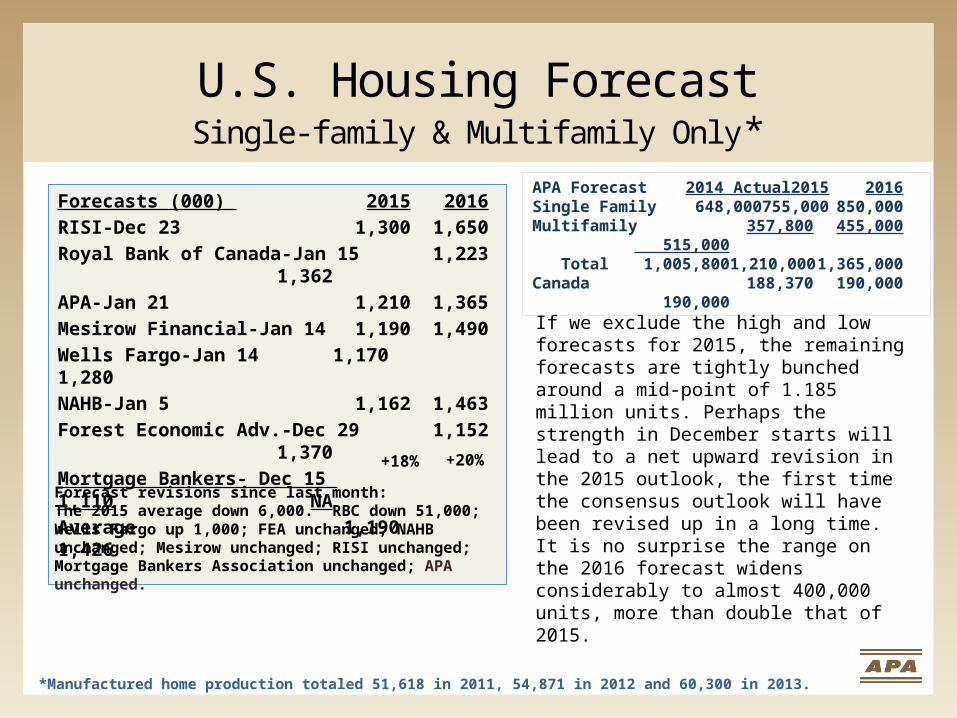
APA Forecast 2014 Actual 2015 2016Single Family 648,000 755,000 850,000Multifamily 357,800 455,000 515,000 Total 1,005,800 1,210,000 1,365,000Canada 188,370 190,000 190,000
Forecasts (000) 2015 2016
RISI-Dec 23 1,300 1,650
Royal Bank of Canada-Jan 15 1,223 1,362
APA-Jan 21 1,210 1,365
Mesirow Financial-Jan 14 1,190 1,490
Wells Fargo-Jan 14 1,170 1,280
NAHB-Jan 5 1,162 1,463
Forest Economic Adv.-Dec 29 1,152 1,370
Mortgage Bankers- Dec 15 1,110 NA
Average 1,190 1,426
Forecast revisions since last month:The 2015 average down 6,000. RBC down 51,000; Wells Fargo up 1,000; FEA unchanged; NAHB unchanged; Mesirow unchanged; RISI unchanged; Mortgage Bankers Association unchanged; APA unchanged.
+18% +20%
If we exclude the high and low forecasts for 2015, the remaining forecasts are tightly bunched around a mid-point of 1.185 million units. Perhaps the strength in December starts will lead to a net upward revision in the 2015 outlook, the first time the consensus outlook will have been revised up in a long time. It is no surprise the range on the 2016 forecast widens considerably to almost 400,000 units, more than double that of 2015.
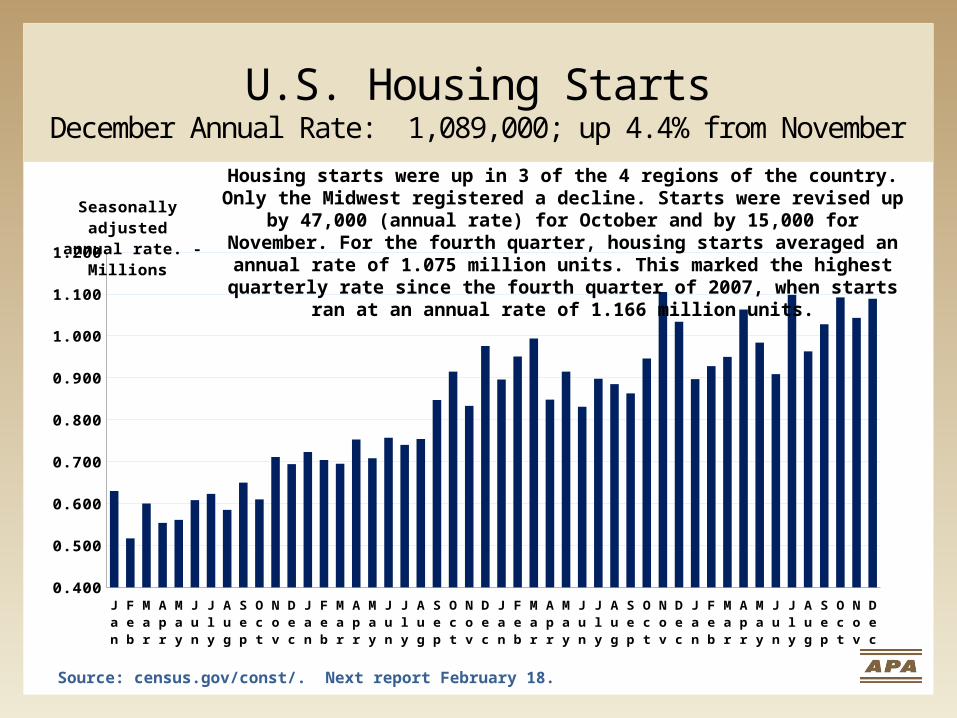
U.S. Housing StartsDecember Annual Rate: 1,089,000; up 4.4% from November
Jan '11
Feb
Mar
Apr
May
June
Jly
Aug
Sep
Oct
Nov
Dec
Jan '12
Feb
Mar
Apr
May
Jun
Jly
Aug
Sep
Oct
Nov
Dec
Jan '13
Feb
Mar
Apr
May
June
Jly
Aug
Sep
Oct
Nov
Dec
Jan '14
Feb
Mar
Apr
May
June
Jly
Aug
Sept
Oct
Nov
Dec
0.400
0.500
0.600
0.700
0.800
0.900
1.000
1.100
1.200
Seasonally adjusted annual rate. - Millions
Source: census.gov/const/. Next report February 18.
Housing starts were up in 3 of the 4 regions of the country. Only the Midwest registered a decline. Starts were revised up by 47,000 (annual rate) for October
and by 15,000 for November. For the fourth quarter, housing starts averaged an annual rate of 1.075 million units. This marked the highest quarterly rate since the fourth quarter of 2007, when starts ran at an annual rate of 1.166
million units.
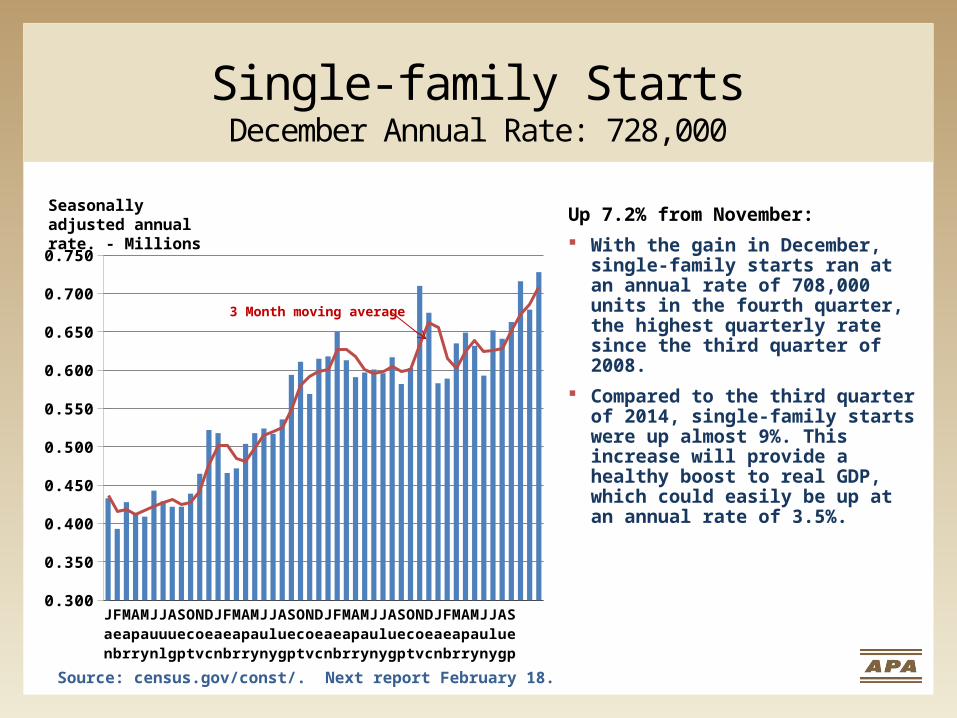
Single-family StartsDecember Annual Rate: 728,000
Source: census.gov/const/. Next report February 18.
Jan '11
Feb
Mar
Apr
May
June
July
Aug
Sep
Oct
Nov
Dec
Jan '12
Feb
Mar
Apr
May
Jun
Jly
Aug
Sep
Oct
Nov
Dec
Jan '13
Feb
Mar
Apr
May
June
Jly
Aug
Sep
Oct
Nov
Dec
Jan '14
Feb
Mar
Apr
May
June
Jly
Aug
Sept
0.300
0.350
0.400
0.450
0.500
0.550
0.600
0.650
0.700
0.750
Seasonally adjusted annual rate. - Millions Up 7.2% from November:
With the gain in December, single-family starts ran at an annual rate of 708,000 units in the fourth quarter, the highest quarterly rate since the third quarter of 2008.
Compared to the third quarter of 2014, single-family starts were up almost 9%. This increase will provide a healthy boost to real GDP, which could easily be up at an annual rate of 3.5%.
3 Month moving average
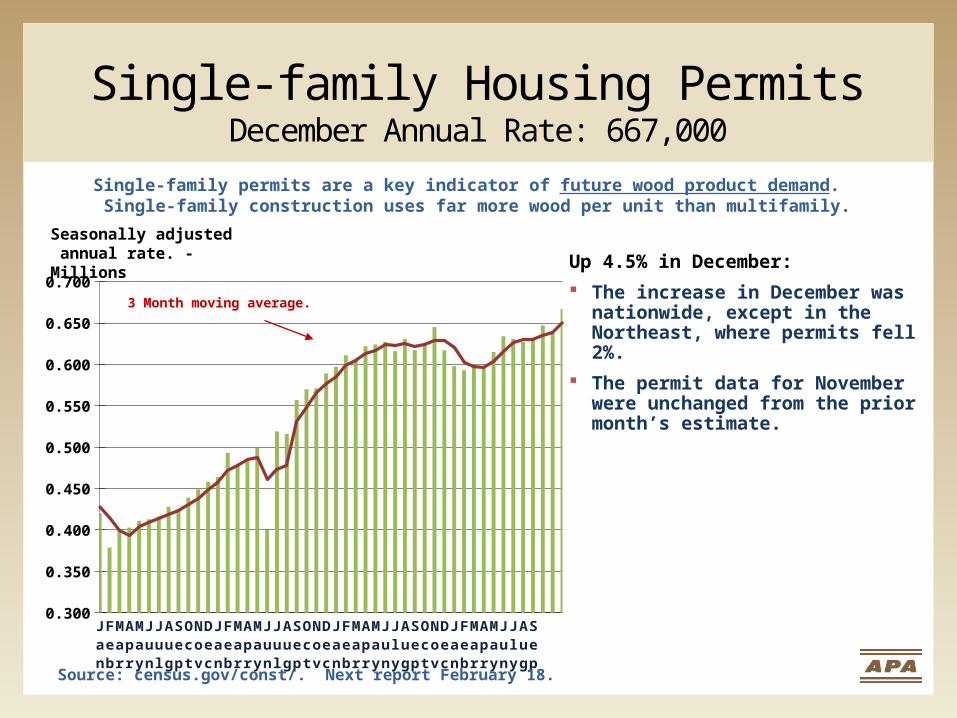
Single-family Housing PermitsDecember Annual Rate: 667,000
Jan '11
Feb
Mar
Apr
May
June
Jul
Aug
Sep
Oct
Nov
Dec
Jan '12
Feb
Mar
Apr
May
Jun
Jul
Aug
Sep
Oct
Nov
Dec
Jan '13
Feb
Mar
Apr
May
June
Jly
Aug
Sep
Oct
Nov
Dec
Jan '14
Feb
Mar
Apr
May
June
Jly
Aug
Sept
0.300
0.350
0.400
0.450
0.500
0.550
0.600
0.650
0.700
3 Month moving average.
Single-family permits are a key indicator of future wood product demand. Single-family construction uses far more wood per unit than multifamily.
Seasonally adjusted annual rate. - Millions Up 4.5% in December:
The increase in December was nationwide, except in the Northeast, where permits fell 2%.
The permit data for November were unchanged from the prior month’s estimate.
Source: census.gov/const/. Next report February 18.
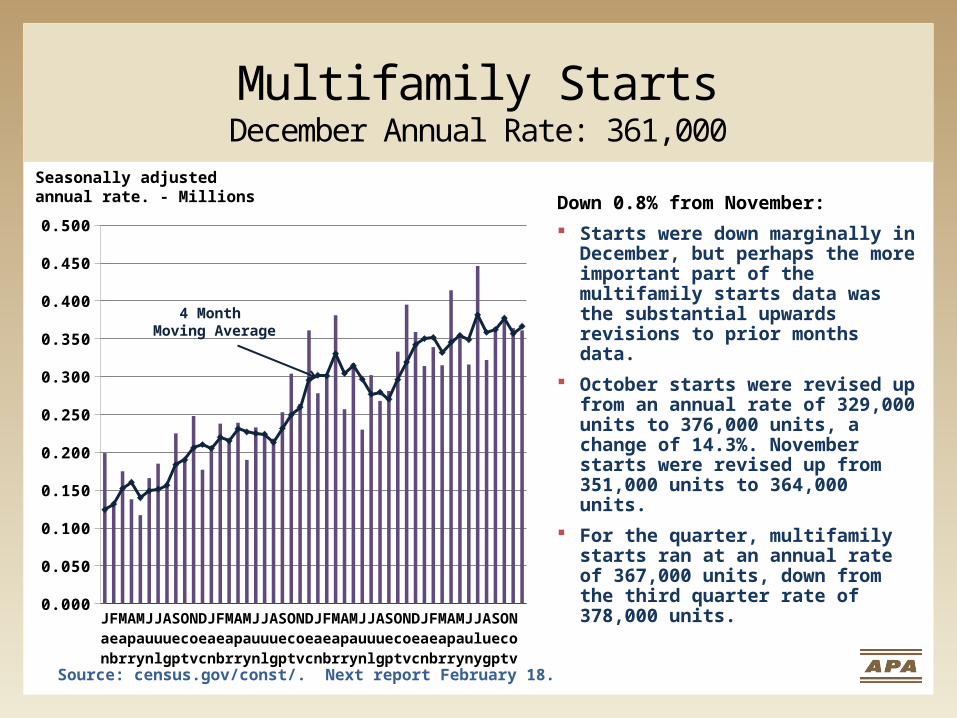
Multifamily StartsDecember Annual Rate: 361,000
Source: census.gov/const/. Next report February 18.
Jan '10
Feb
Mar
Apr
May
June
July
Aug
Sep
Oct
Nov
Dec
Jan '11
Feb
Mar
Apr
May
June
July
Aug
Sep
Oct
Nov
Dec
Jan '12
Feb
Mar
Apr
May
Jun
Jul
Aug
Sep
Oct
Nov
Dec
Jan '13
Feb
Mar
Apr
May
June
Jly
Aug
Sep
Oct
Nov
0.000
0.050
0.100
0.150
0.200
0.250
0.300
0.350
0.400
0.450
0.500
Seasonally adjustedannual rate. - Millions
4 Month Moving Average
Down 0.8% from November:
Starts were down marginally in December, but perhaps the more important part of the multifamily starts data was the substantial upwards revisions to prior months data.
October starts were revised up from an annual rate of 329,000 units to 376,000 units, a change of 14.3%. November starts were revised up from 351,000 units to 364,000 units.
For the quarter, multifamily starts ran at an annual rate of 367,000 units, down from the third quarter rate of 378,000 units.
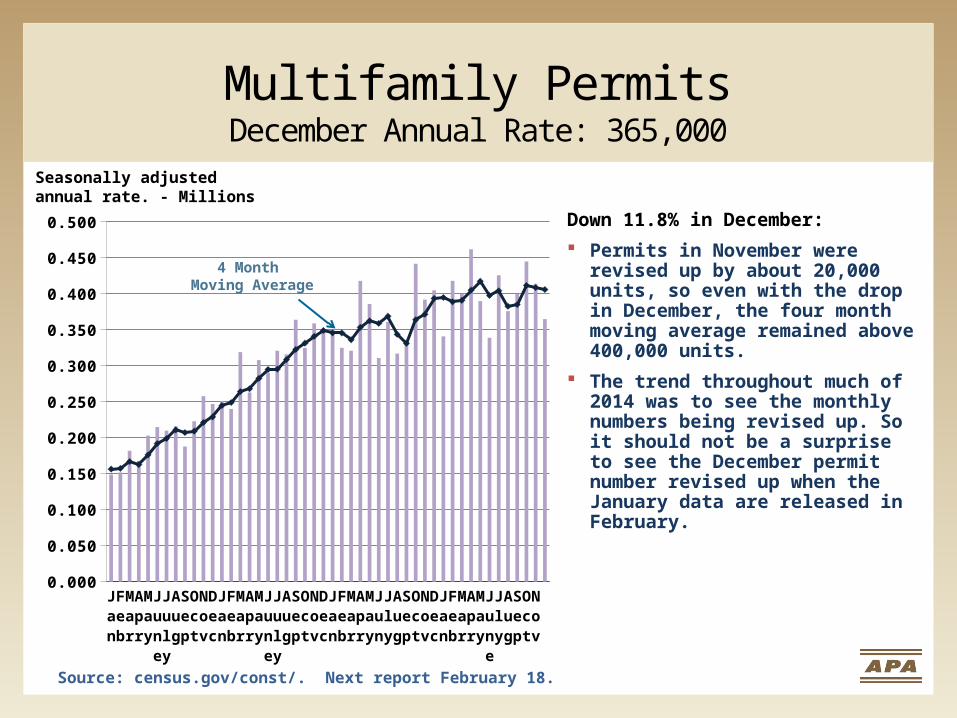
Multifamily PermitsDecember Annual Rate: 365,000
Source: census.gov/const/. Next report February 18.
Jan '10
Feb
Mar
Apr
May
June
July
Aug
Sep
Oct
Nov
Dec
Jan '11
Feb
Mar
Apr
May
June
July
Aug
Sep
Oct
Nov
Dec
Jan '12
Feb
Mar
Apr
May
Jun
Jly
Aug
Sep
Oct
Nov
Dec
Jan '13
Feb
Mar
Apr
May
June
Jly
Aug
Sep
Oct
Nov
0.000
0.050
0.100
0.150
0.200
0.250
0.300
0.350
0.400
0.450
0.500
Seasonally adjustedannual rate. - Millions
4 Month Moving Average
Down 11.8% in December:
Permits in November were revised up by about 20,000 units, so even with the drop in December, the four month moving average remained above 400,000 units.
The trend throughout much of 2014 was to see the monthly numbers being revised up. So it should not be a surprise to see the December permit number revised up when the January data are released in February.
Annual U.S. Housing Starts(Thousands)
1970
1973
1976
1979
1982
1985
1988
1991
1994
1997
2000
2003
2006
2009
2012
0
500
1,000
1,500
2,000
2,500
Single-fam-ily
Multifamily
Source: census.gov/const/.
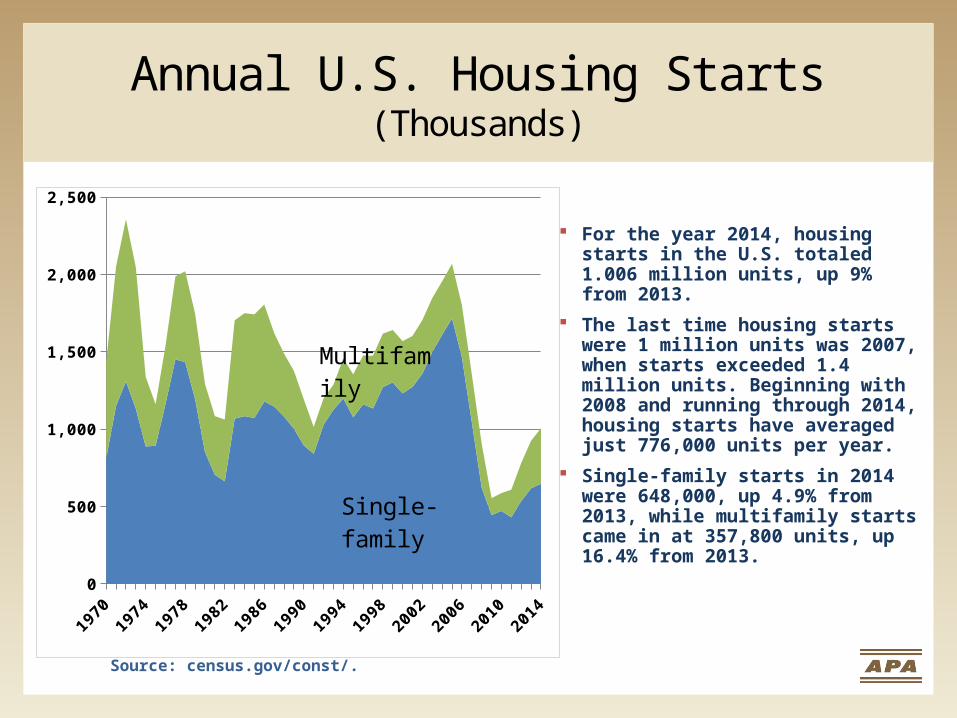
For the year 2014, housing starts in the U.S. totaled 1.006 million units, up 9% from 2013.
The last time housing starts were 1 million units was 2007, when starts exceeded 1.4 million units. Beginning with 2008 and running through 2014, housing starts have averaged just 776,000 units per year.
Single-family starts in 2014 were 648,000, up 4.9% from 2013, while multifamily starts came in at 357,800 units, up 16.4% from 2013.
Housing Starts – NortheastSeasonally Adjusted Annual Rate
2008.1
2008.2
2008.3
2008.4
2009.1
2009.2
2009.3
2009.4
2010.1
2010.2
2010.3
2010.4
2011.1
2011.2
2011.3
2011.4
2012.1
2012.2
2012.3
2012.4
2013.1
2013.2
2013.3
2013.4
2014.1
2014.2
2014.3
2014.4
0
40
80
120
160
Single-family
Multifamily
(1,000s)
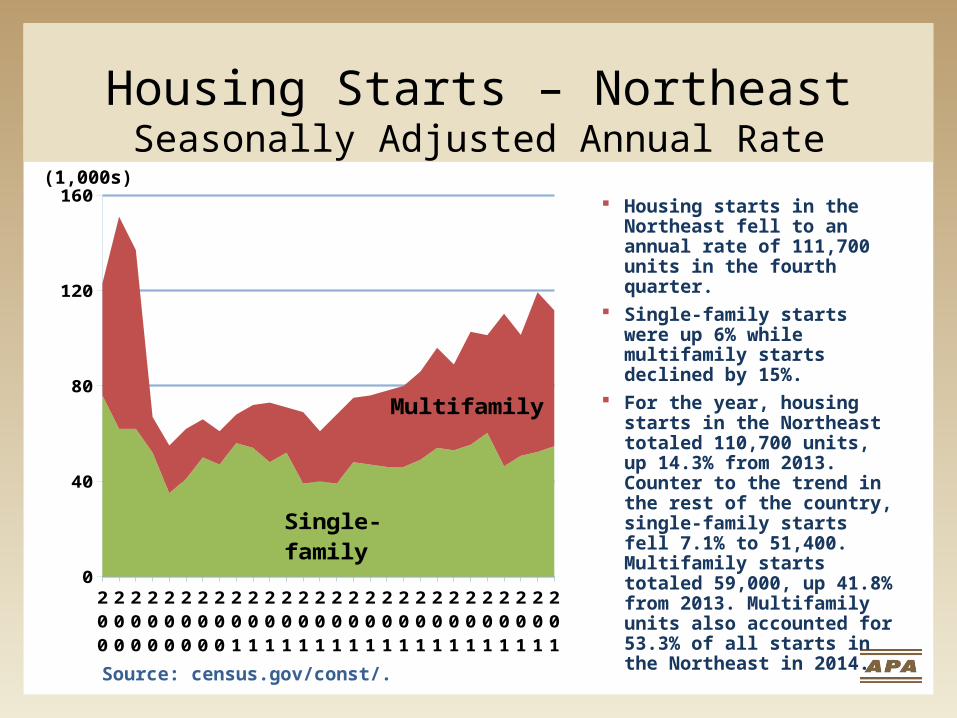
Housing starts in the Northeast fell to an annual rate of 111,700 units in the fourth quarter.
Single-family starts were up 6% while multifamily starts declined by 15%.
For the year, housing starts in the Northeast totaled 110,700 units, up 14.3% from 2013. Counter to the trend in the rest of the country, single-family starts fell 7.1% to 51,400. Multifamily starts totaled 59,000, up 41.8% from 2013. Multifamily units also accounted for 53.3% of all starts in the Northeast in 2014.
Source: census.gov/const/.
Housing Starts – MidwestSeasonally Adjusted Annual Rate
2008.1
2008.2
2008.3
2008.4
2009.1
2009.2
2009.3
2009.4
2010.1
2010.2
2010.3
2010.4
2011.1
2011.2
2011.3
2011.4
2012.1
2012.2
2012.3
2012.4
2013.1
2013.2
2013.3
2013.4
2014.1
2014.2
2014.3
2014.4
0
25
50
75
100
125
150
175
200
Single-family
Multifamily
(1,000s)
Source: census.gov/const/.
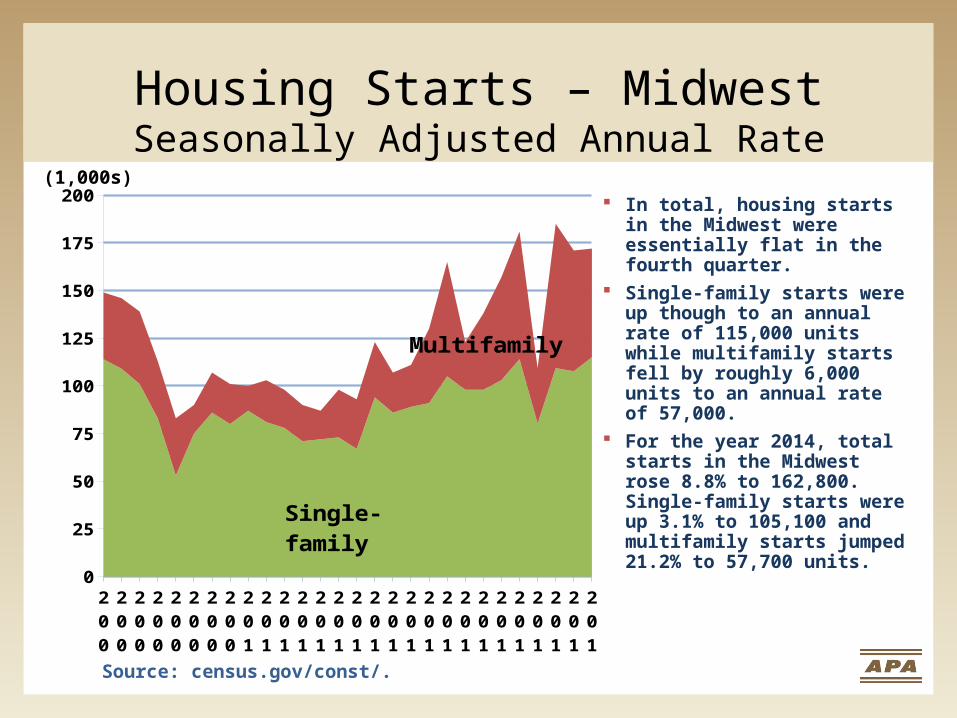
In total, housing starts in the Midwest were essentially flat in the fourth quarter.
Single-family starts were up though to an annual rate of 115,000 units while multifamily starts fell by roughly 6,000 units to an annual rate of 57,000.
For the year 2014, total starts in the Midwest rose 8.8% to 162,800. Single-family starts were up 3.1% to 105,100 and multifamily starts jumped 21.2% to 57,700 units.
Housing Starts – SouthSeasonally Adjusted Annual Rate
2008.1
2008.2
2008.3
2008.4
2009.1
2009.2
2009.3
2009.4
2010.1
2010.2
2010.3
2010.4
2011.1
2011.2
2011.3
2011.4
2012.1
2012.2
2012.3
2012.4
2013.1
2013.2
2013.3
2013.4
2014.1
2014.2
2014.3
2014.4
0
50
100
150
200
250
300
350
400
450
500
550
Single-family
Multifamily
(1,000s)
Source: census.gov/const/.
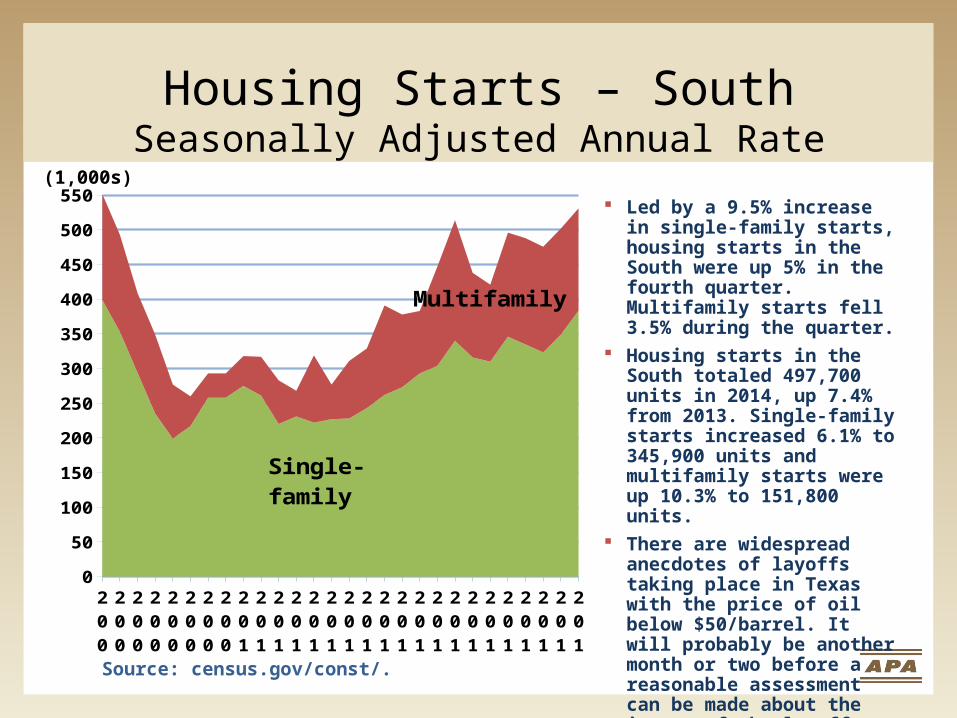
Led by a 9.5% increase in single-family starts, housing starts in the South were up 5% in the fourth quarter. Multifamily starts fell 3.5% during the quarter.
Housing starts in the South totaled 497,700 units in 2014, up 7.4% from 2013. Single-family starts increased 6.1% to 345,900 units and multifamily starts were up 10.3% to 151,800 units.
There are widespread anecdotes of layoffs taking place in Texas with the price of oil below $50/barrel. It will probably be another month or two before a reasonable assessment can be made about the impact of the layoffs on homebuilding in Texas and some of the major oil producing states.
Housing Starts – WestSeasonally Adjusted Annual Rate
2008.1
2008.2
2008.3
2008.4
2009.1
2009.2
2009.3
2009.4
2010.1
2010.2
2010.3
2010.4
2011.1
2011.2
2011.3
2011.4
2012.1
2012.2
2012.3
2012.4
2013.1
2013.2
2013.3
2013.4
2014.1
2014.2
2014.3
2014.4
0
50
100
150
200
250
300
Single-family
Multifamily
(1,000s)
Source: census.gov/const/.
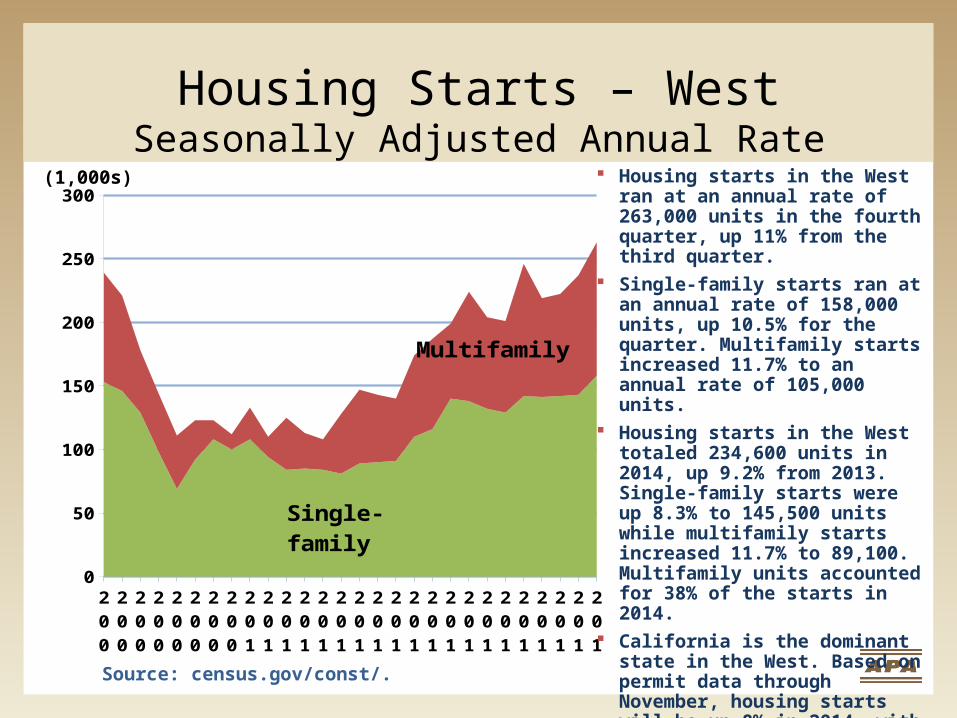
Housing starts in the West ran at an annual rate of 263,000 units in the fourth quarter, up 11% from the third quarter.
Single-family starts ran at an annual rate of 158,000 units, up 10.5% for the quarter. Multifamily starts increased 11.7% to an annual rate of 105,000 units.
Housing starts in the West totaled 234,600 units in 2014, up 9.2% from 2013. Single-family starts were up 8.3% to 145,500 units while multifamily starts increased 11.7% to 89,100. Multifamily units accounted for 38% of the starts in 2014.
California is the dominant state in the West. Based on permit data through November, housing starts will be up 8% in 2014, with single-family starts up 6% and multifamily starts up 10%. Roughly 53% of the starts in California will be multifamily units.
New and Existing Home SalesSeasonally Adjusted Annual Rate
Jan '11
Feb
Mar
Apr
May
June
July '11
Aug
Sep
Oct
Nov
Dec
Jan '12
Feb
Mar
Apr
May
Jun
July '12
Aug
Sep
Oct
Nov
Dec
Jan '13
Feb
Mar
Apr
May
Jun
July '13
Aug
Sep
Oct
Nov
Dec
Jan '14
Feb
Mar
Apr
May
June
July '14
250
300
350
400
450
500
550
600
3,500
3,750
4,000
4,250
4,500
4,750
5,000
5,250
5,500
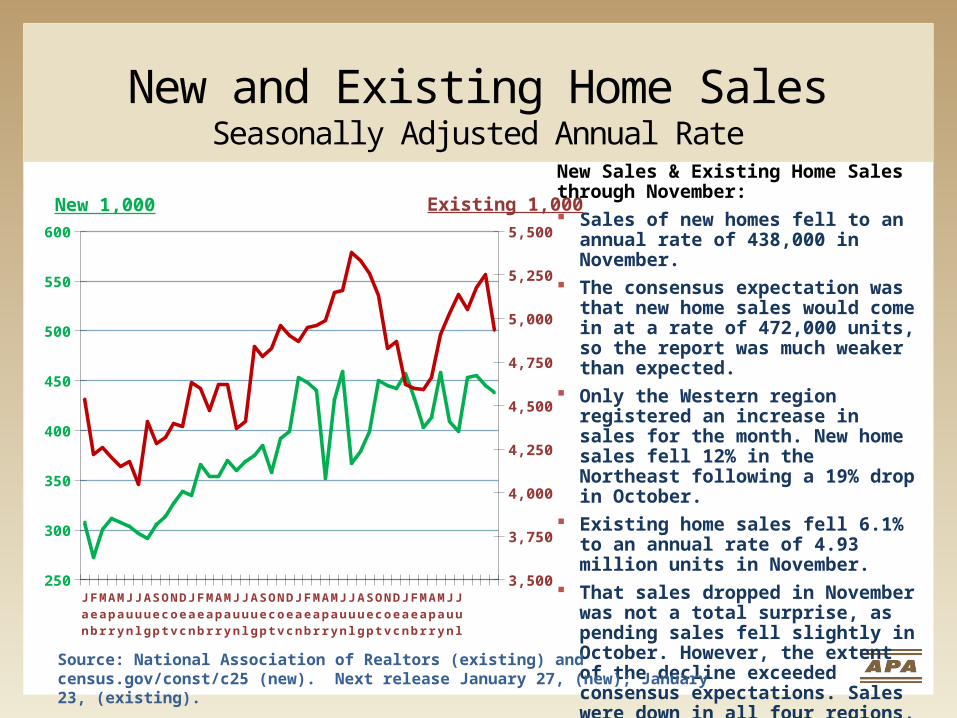
New 1,000 Existing 1,000 New Sales & Existing Home Sales through November: Sales of new homes fell to an annual
rate of 438,000 in November. The consensus expectation was that
new home sales would come in at a rate of 472,000 units, so the report was much weaker than expected.
Only the Western region registered an increase in sales for the month. New home sales fell 12% in the Northeast following a 19% drop in October.
Existing home sales fell 6.1% to an annual rate of 4.93 million units in November.
That sales dropped in November was not a total surprise, as pending sales fell slightly in October. However, the extent of the decline exceeded consensus expectations. Sales were down in all four regions, so the decline was not isolated to one or two areas of the country.Source: National Association of Realtors (existing) and census.gov/const/c25 (new).
Next release January 27, (new); January 23, (existing).
U.S. New Homes Sold(Thousands)
19701974
19781982
19861990
19941998
20022006
20102014
0
200
400
600
800
1,000
1,200
1,400
Source: census.gov/const/.
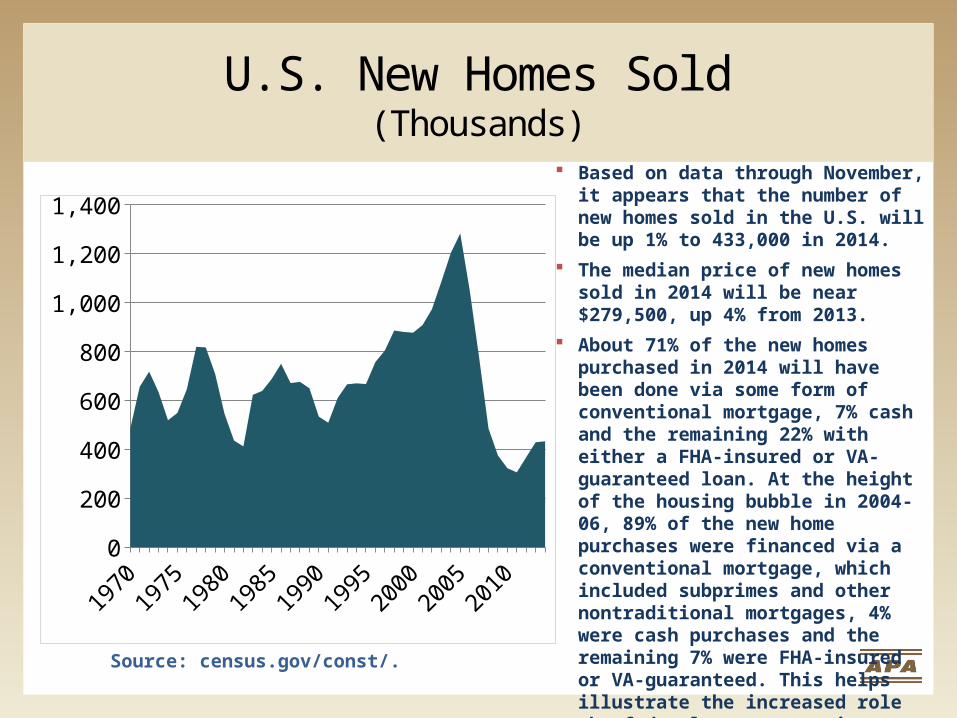
Based on data through November, it appears that the number of new homes sold in the U.S. will be up 1% to 433,000 in 2014.
The median price of new homes sold in 2014 will be near $279,500, up 4% from 2013.
About 71% of the new homes purchased in 2014 will have been done via some form of conventional mortgage, 7% cash and the remaining 22% with either a FHA-insured or VA-guaranteed loan. At the height of the housing bubble in 2004-06, 89% of the new home purchases were financed via a conventional mortgage, which included subprimes and other nontraditional mortgages, 4% were cash purchases and the remaining 7% were FHA-insured or VA-guaranteed. This helps illustrate the increased role the federal government is playing to support the housing industry.
U.S. Existing Homes Sold(Millions)
19901992
19941996
19982000
20022004
20062008
20102012
20140
1
2
3
4
5
6
7
8
Source: National Associaiton of Realtors
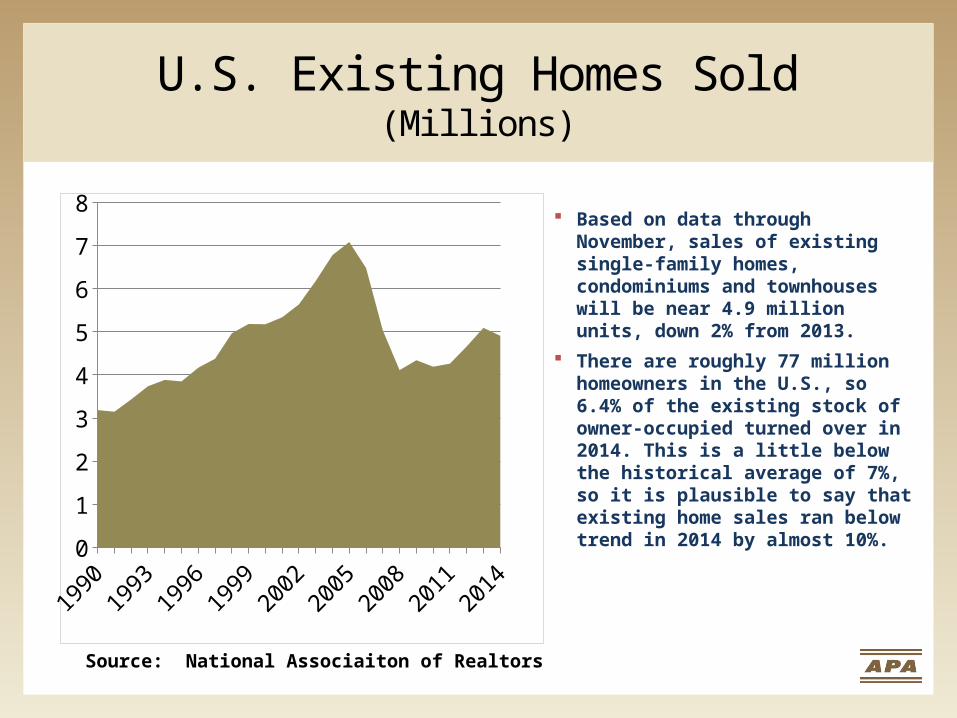
Based on data through November, sales of existing single-family homes, condominiums and townhouses will be near 4.9 million units, down 2% from 2013.
There are roughly 77 million homeowners in the U.S., so 6.4% of the existing stock of owner-occupied turned over in 2014. This is a little below the historical average of 7%, so it is plausible to say that existing home sales ran below trend in 2014 by almost 10%.
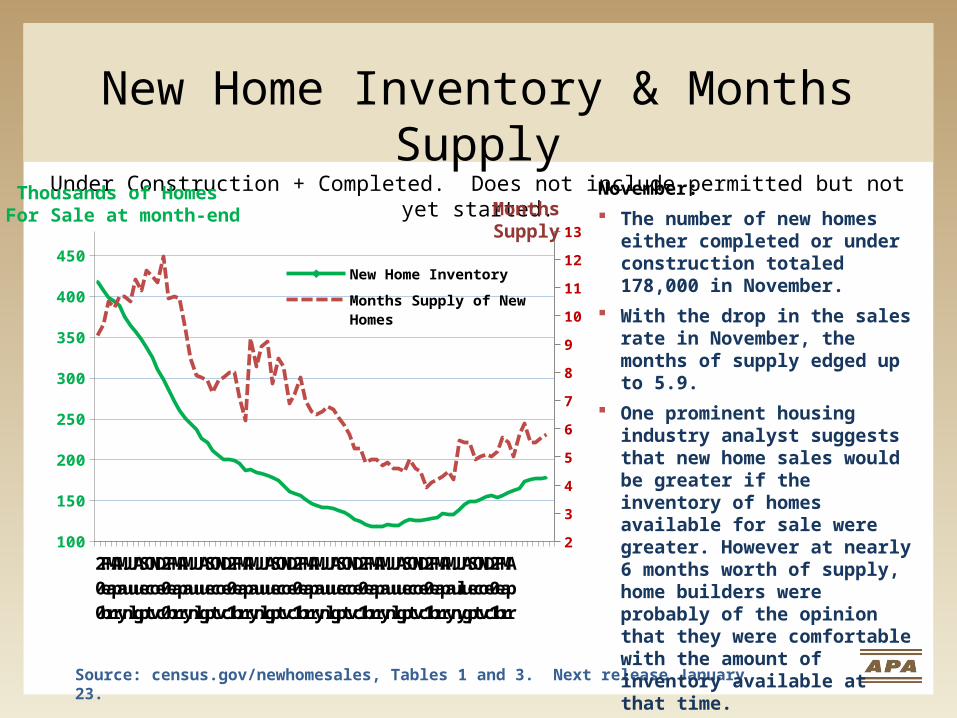
New Home Inventory & Months Supply
Under Construction + Completed. Does not include permitted but not yet started.
2008
Feb
Mar
Apr
May
June
July
Aug
Sep
Oct
Nov
Dec
2009
Feb
Mar
Apr
May
June
July
Aug
Sep
Oct
Nov
Dec
2010
Feb
Mar
Apr
May
June
July
Aug
Sep
Oct
Nov
Dec
2011
Feb
Mar
Apr
May
June
Jul
Aug
Sep
Oct
Nov
Dec
2012
Feb
Mar
Apr
May
Jun
Jul
Aug
Sep
Oct
Nov
Dec
2013
Feb
Mar
Apr
May
Jun
Jly
Aug
Sep
Oct
Nov
Dec
2014
Feb
Mar
Apr
100
150
200
250
300
350
400
450
2
3
4
5
6
7
8
9
10
11
12
13
New Home Inventory
Months Supply of New Homes
Thousands of Homes For Sale at month-end
Source: census.gov/newhomesales, Tables 1 and 3. Next release January 23.
November:
The number of new homes either completed or under construction totaled 178,000 in November.
With the drop in the sales rate in November, the months of supply edged up to 5.9.
One prominent housing industry analyst suggests that new home sales would be greater if the inventory of homes available for sale were greater. However at nearly 6 months worth of supply, home builders were probably of the opinion that they were comfortable with the amount of inventory available at that time.
Months Supply
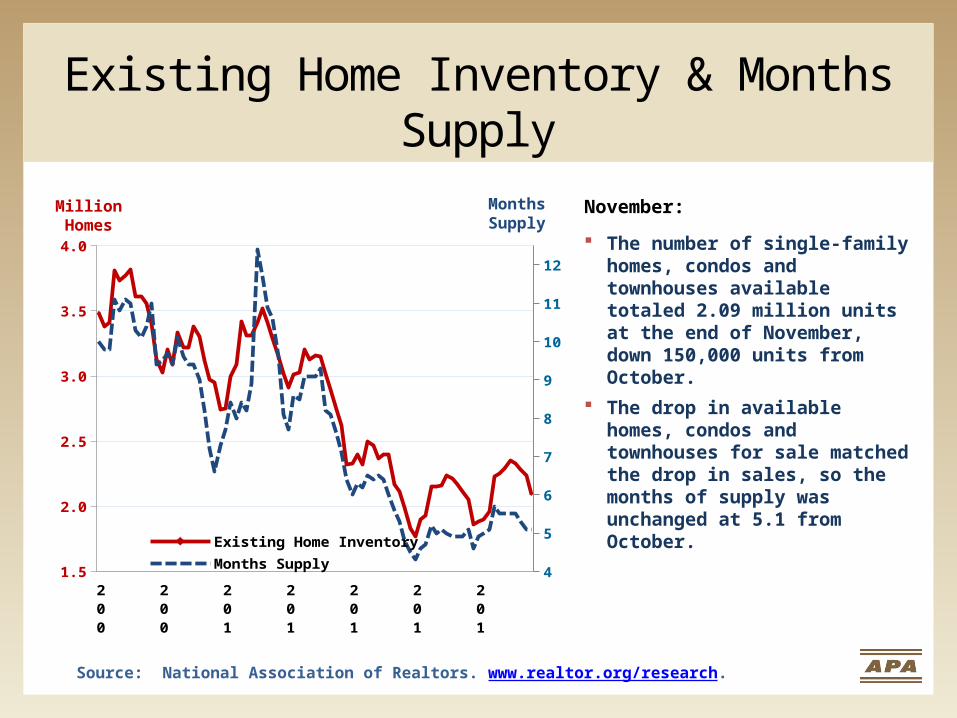
Existing Home Inventory & Months Supply
Source: National Association of Realtors. www.realtor.org/research.
2008
2009
2010
2011
2012
2013
2014
1.5
2.0
2.5
3.0
3.5
4.0
4
5
6
7
8
9
10
11
12
Existing Home Inventory Months Supply
MillionHomes
November:
The number of single-family homes, condos and townhouses available totaled 2.09 million units at the end of November, down 150,000 units from October.
The drop in available homes, condos and townhouses for sale matched the drop in sales, so the months of supply was unchanged at 5.1 from October.
Months Supply
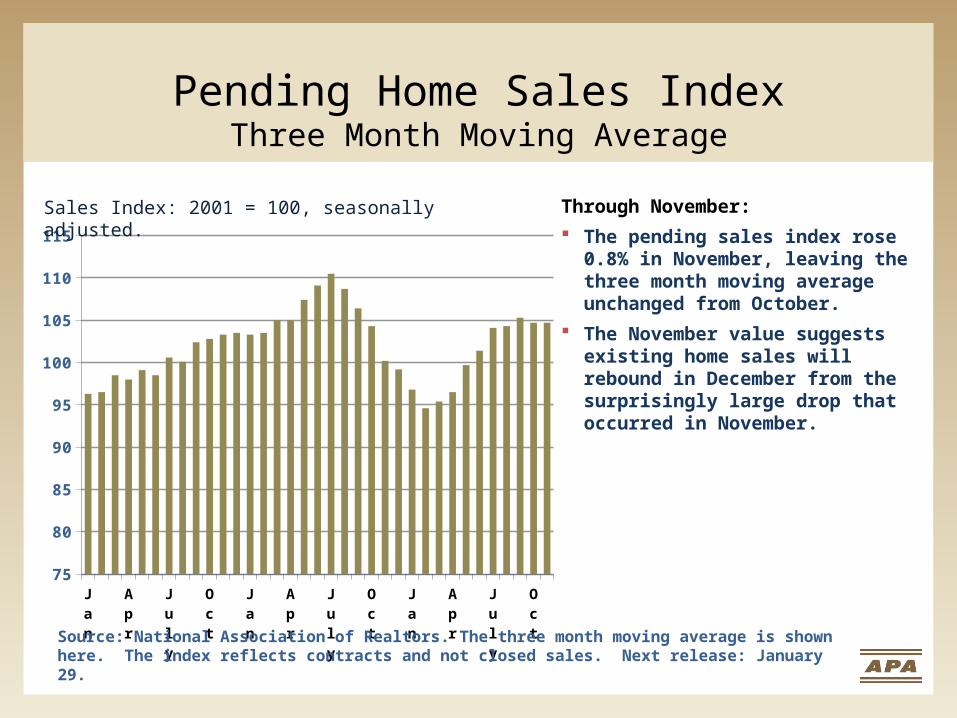
Pending Home Sales IndexThree Month Moving Average
Jan '12
Apr
July
Oct
Jan '13
Apr
July
Oct
Jan '14
Apr
July
Oct
75
80
85
90
95
100
105
110
115
Sales Index: 2001 = 100, seasonally adjusted.
Source: National Association of Realtors. The three month moving average is shown here. The index reflects contracts and not closed sales. Next release: January 29.
Through November:
The pending sales index rose 0.8% in November, leaving the three month moving average unchanged from October.
The November value suggests existing home sales will rebound in December from the surprisingly large drop that occurred in November.
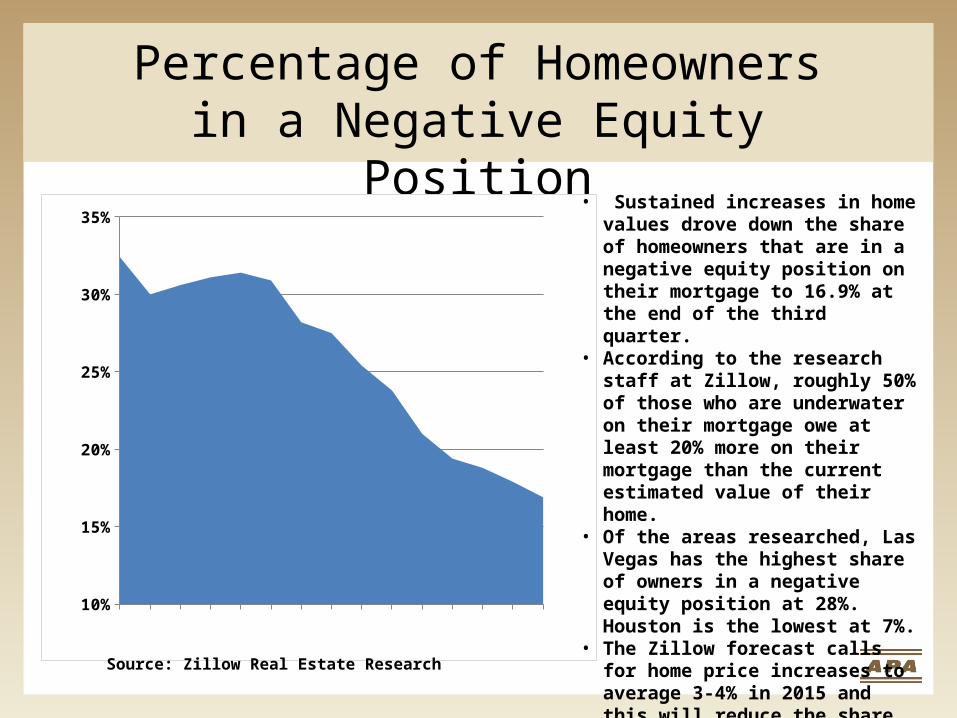
Percentage of Homeowners in a Negative Equity Position
201
201
201
201
201
201
201
201
201
201
201
201
201
201
201
10%
15%
20%
25%
30%
35%• Sustained increases in home
values drove down the share of homeowners that are in a negative equity position on their mortgage to 16.9% at the end of the third quarter.
• According to the research staff at Zillow, roughly 50% of those who are underwater on their mortgage owe at least 20% more on their mortgage than the current estimated value of their home.
• Of the areas researched, Las Vegas has the highest share of owners in a negative equity position at 28%. Houston is the lowest at 7%.
• The Zillow forecast calls for home price increases to average 3-4% in 2015 and this will reduce the share of homeowners underwater on their mortgage to 15.2% by the third quarter of 2015. Source: Zillow Real Estate Research
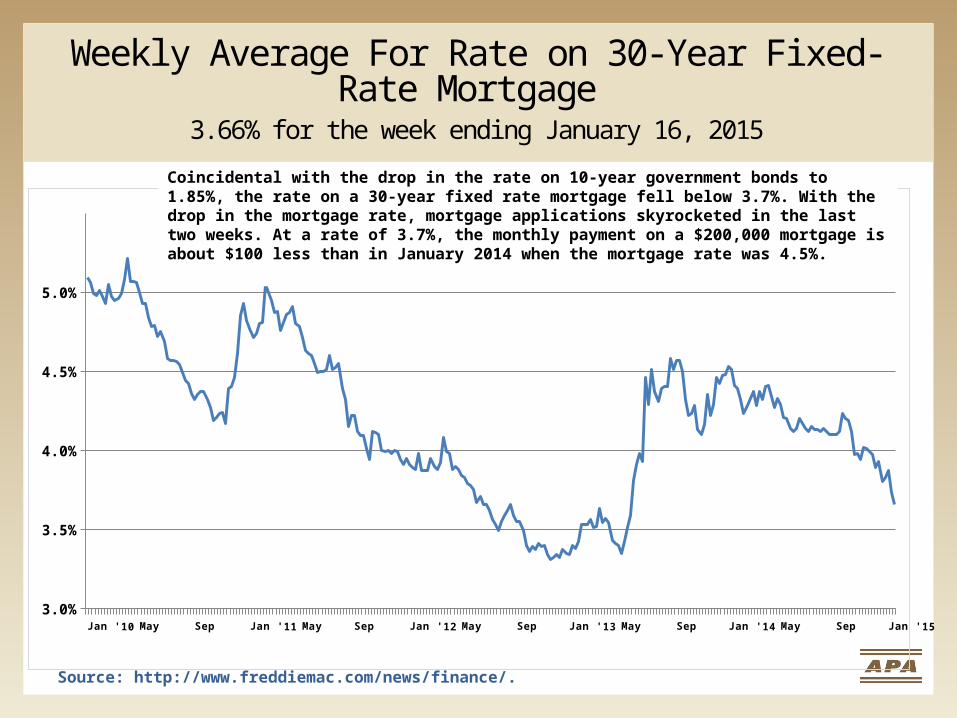
Weekly Average For Rate on 30-Year Fixed-Rate Mortgage
3.66% for the week ending January 16, 2015
Jan '10 May Sep Jan '11 May Sep Jan '12 May Sep Jan '13 May Sep Jan '14 May Sep Jan '153.0%
3.5%
4.0%
4.5%
5.0%
Source: http://www.freddiemac.com/news/finance/.
Coincidental with the drop in the rate on 10-year government bonds to 1.85%, the rate on a 30-year fixed rate mortgage fell below 3.7%. With the drop in the mortgage rate, mortgage applications skyrocketed in the last two weeks. At a rate of 3.7%, the monthly payment on a $200,000 mortgage is about $100 less than in January 2014 when the mortgage rate was 4.5%.
Jan '11
FMar
Apr
May
J July
ASept
Oct
Nov
DJan '12
FMar
Apr
May
J July
ASept
Oct
Nov
Dec
Jan '13
Feb
Mar
Apr
May
June
July
Aug
Sep
Oct
Nov
Dec
Jan '14
Feb
Mar
Apr
May
June
July
Aug
Sept
Oct
100
125
150
175
200
225
250
275
300
1.0
1.1
1.2
1.3
1.4
1.5
1.6
1.7
1.8
1.9
2.0
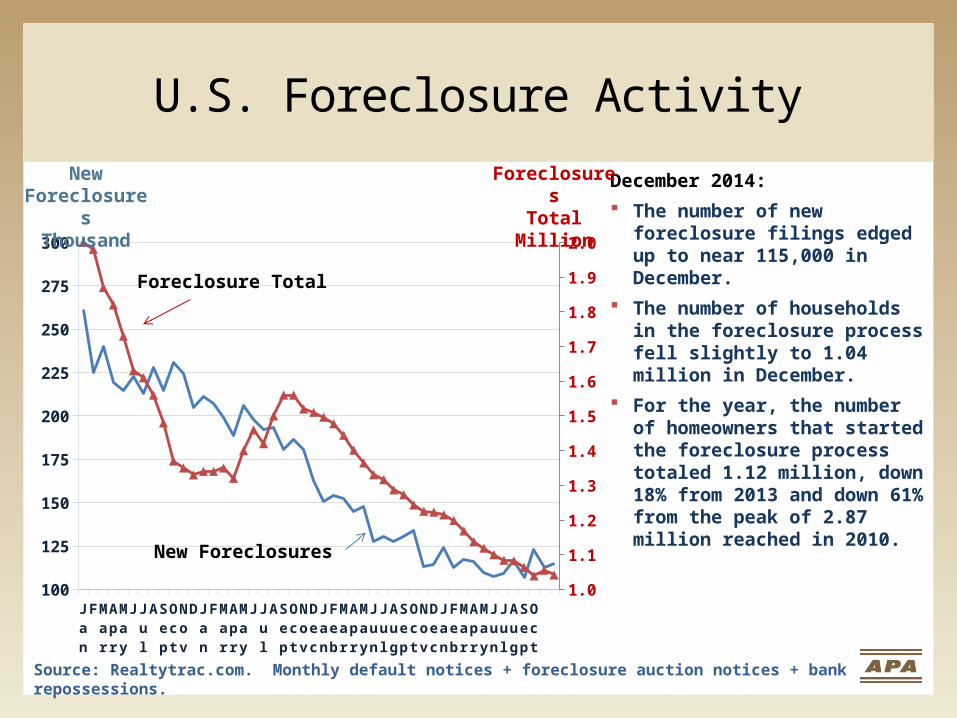
U.S. Foreclosure Activity
New Foreclosures
Thousand
Source: Realtytrac.com. Monthly default notices + foreclosure auction notices + bank repossessions.
December 2014:
The number of new foreclosure filings edged up to near 115,000 in December.
The number of households in the foreclosure process fell slightly to 1.04 million in December.
For the year, the number of homeowners that started the foreclosure process totaled 1.12 million, down 18% from 2013 and down 61% from the peak of 2.87 million reached in 2010.
Foreclosure Total
New Foreclosures
ForeclosuresTotal
Million
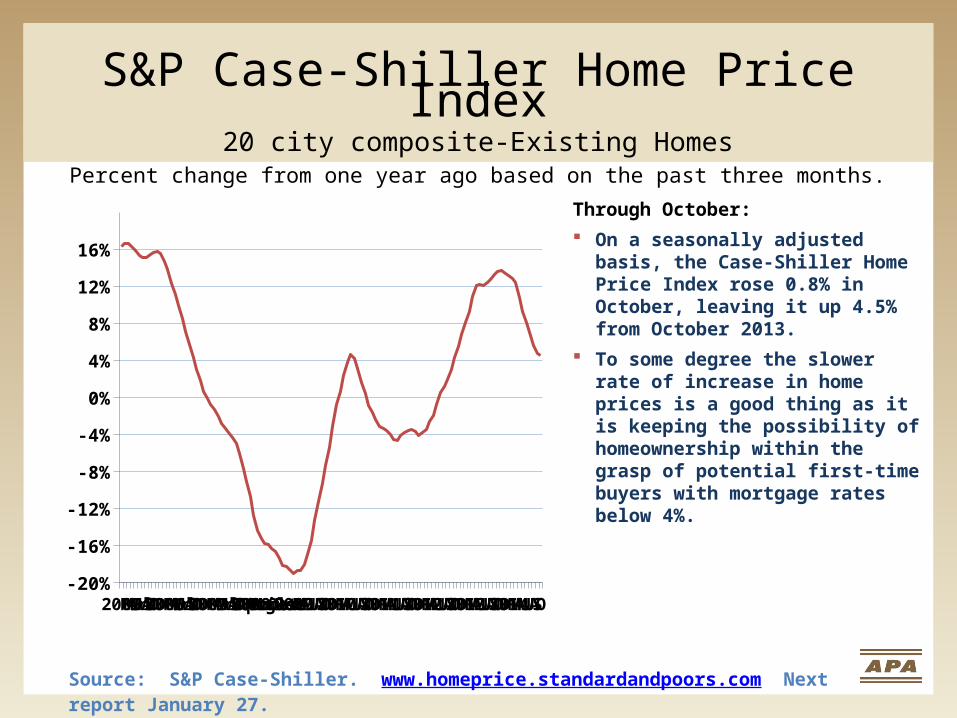
S&P Case-Shiller Home Price Index20 city composite-Existing Homes
Percent change from one year ago based on the past three months.
2005FMAMJnJlASOND2006FMAMJnJlASOND2007FMAMJnJlASOND2008FMAprilJuneAugustOctDec2009FMAMJJASOND2010FMAMJJASOND2011FMAMJJASOND2012FMAMJJASOND2013FMAMJJASOND2014FMAMJJASO-20%
-16%
-12%
-8%
-4%
0%
4%
8%
12%
16%
Source: S&P Case-Shiller. www.homeprice.standardandpoors.com Next report January 27.
Through October:
On a seasonally adjusted basis, the Case-Shiller Home Price Index rose 0.8% in October, leaving it up 4.5% from October 2013.
To some degree the slower rate of increase in home prices is a good thing as it is keeping the possibility of homeownership within the grasp of potential first-time buyers with mortgage rates below 4%.
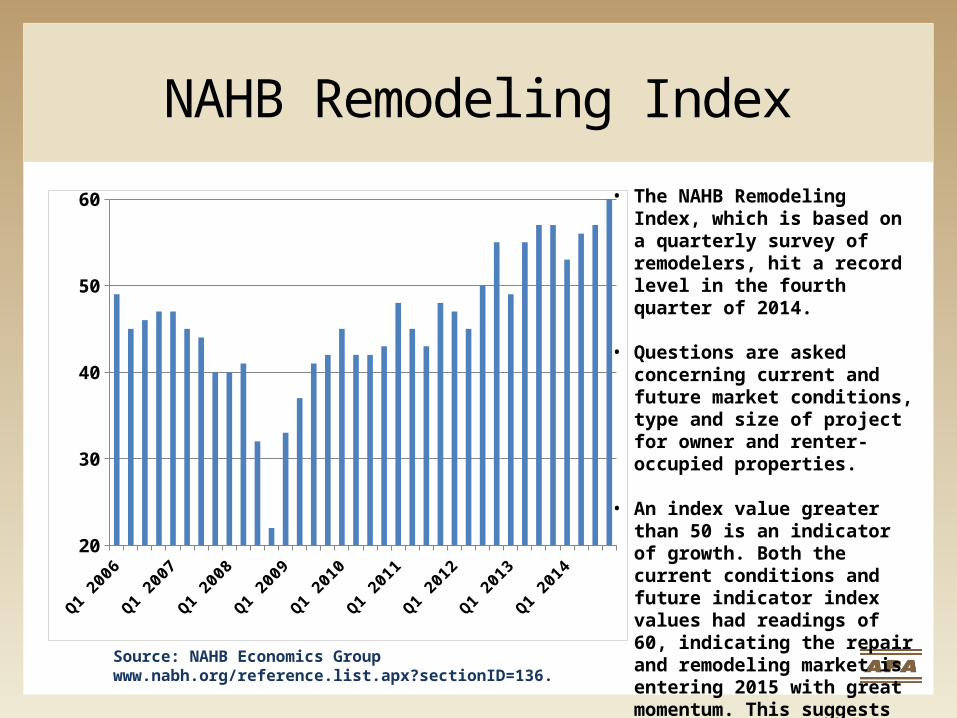
NAHB Remodeling Index
Q1 20
06
Q1 20
07
Q1 20
08
Q1 20
09
Q1 20
10
Q1 20
11
Q1 20
12
Q1 20
13
Q1 20
1420
30
40
50
60
Source: NAHB Economics Groupwww.nabh.org/reference.list.apx?sectionID=136.
• The NAHB Remodeling Index, which is based on a quarterly survey of remodelers, hit a record level in the fourth quarter of 2014.
• Questions are asked concerning current and future market conditions, type and size of project for owner and renter-occupied properties.
• An index value greater than 50 is an indicator of growth. Both the current conditions and future indicator index values had readings of 60, indicating the repair and remodeling market is entering 2015 with great momentum. This suggests upside to the APA outlook published in September 2014.
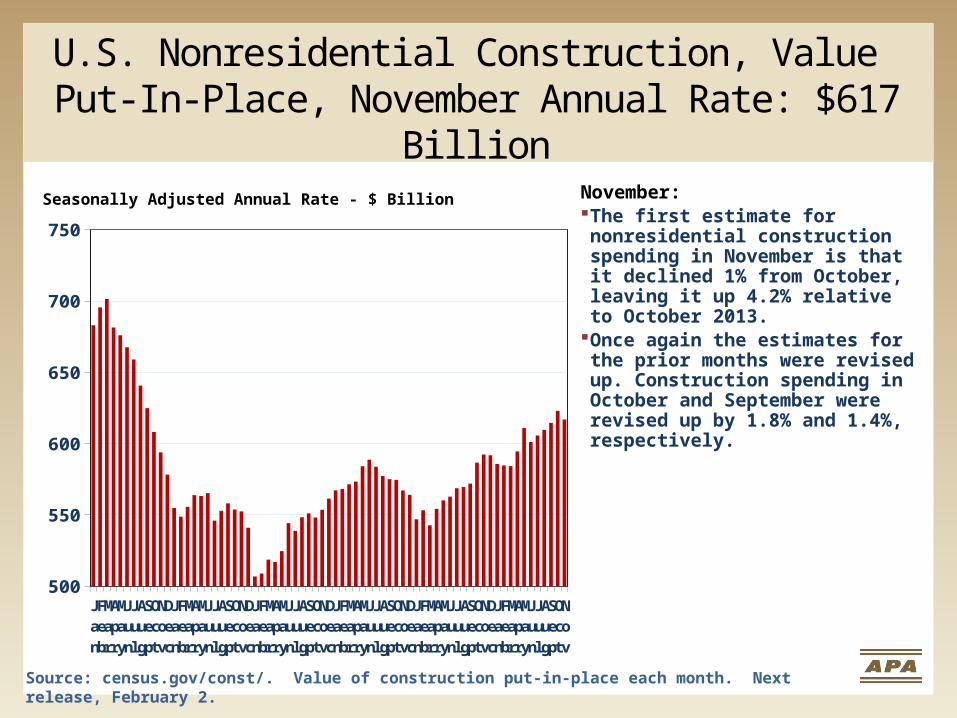
U.S. Nonresidential Construction, Value Put-In-Place, November Annual Rate: $617 Billion
Source: census.gov/const/. Value of construction put-in-place each month. Next release, February 2.
Seasonally Adjusted Annual Rate - $ Billion November: The first estimate for nonresidential construction spending in November is that it declined 1% from October, leaving it up 4.2% relative to October 2013.
Once again the estimates for the prior months were revised up. Construction spending in October and September were revised up by 1.8% and 1.4%, respectively.
Jan '09
Feb
Mar
April
May
Jun
July
Aug
Sep
Oct
Nov
Dec
Jan '10
Feb
Mar
Apr
May
Jun
July
Aug
Sep
Oct
Nov
Dec
Jan '11
Feb
Mar
Apr
May
Jun
July
Aug
Sep
Oct
Nov
Dec
Jan '12
Feb
Mar
Apr
May
June
July
Aug
Sep
Oct
Nov
Dec
Jan '13
Feb
Mar
Apr
May
Jun
July
Aug
Sep
Oct
Nov
Dec
Jan '14
Feb
Mar
Apr
May
June
July
Aug
Sep
Oct
Nov
500
550
600
650
700
750
Jan
'09 May Sep
Jan
'10 May Sep
Jan
'11 May Sep
Jan
'12 May Sep
Jan
'13 May Sep
Jan'1
4M
aySep
t100
125
150
175
200
225
250
275
300
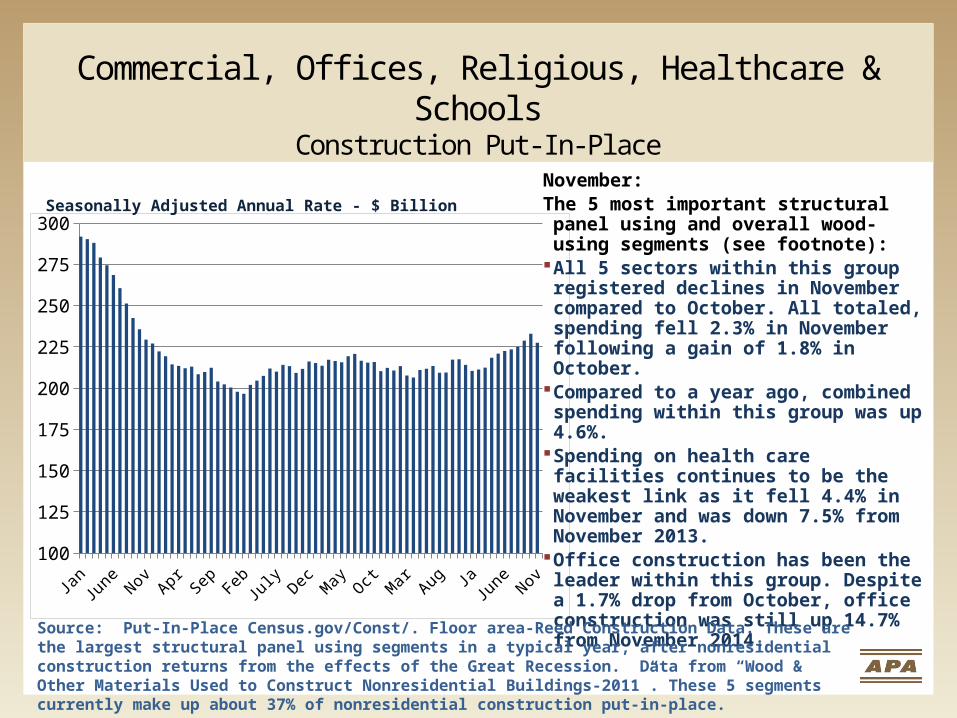
Commercial, Offices, Religious, Healthcare & SchoolsConstruction Put-In-Place
November:The 5 most important structural panel using and overall wood-using segments (see footnote):
All 5 sectors within this group registered declines in November compared to October. All totaled, spending fell 2.3% in November following a gain of 1.8% in October.
Compared to a year ago, combined spending within this group was up 4.6%.
Spending on health care facilities continues to be the weakest link as it fell 4.4% in November and was down 7.5% from November 2013.
Office construction has been the leader within this group. Despite a 1.7% drop from October, office construction was still up 14.7% from November 2014.
Source: Put-In-Place Census.gov/Const/. Floor area-Reed Construction Data. These are the largest structural panel using segments in a typical year, after nonresidential construction returns from the effects of the Great Recession. Data from “Wood & Other Materials Used to Construct Nonresidential Buildings-2011”. These 5 segments currently make up about 37% of nonresidential construction put-in-place.
Seasonally Adjusted Annual Rate - $ Billion
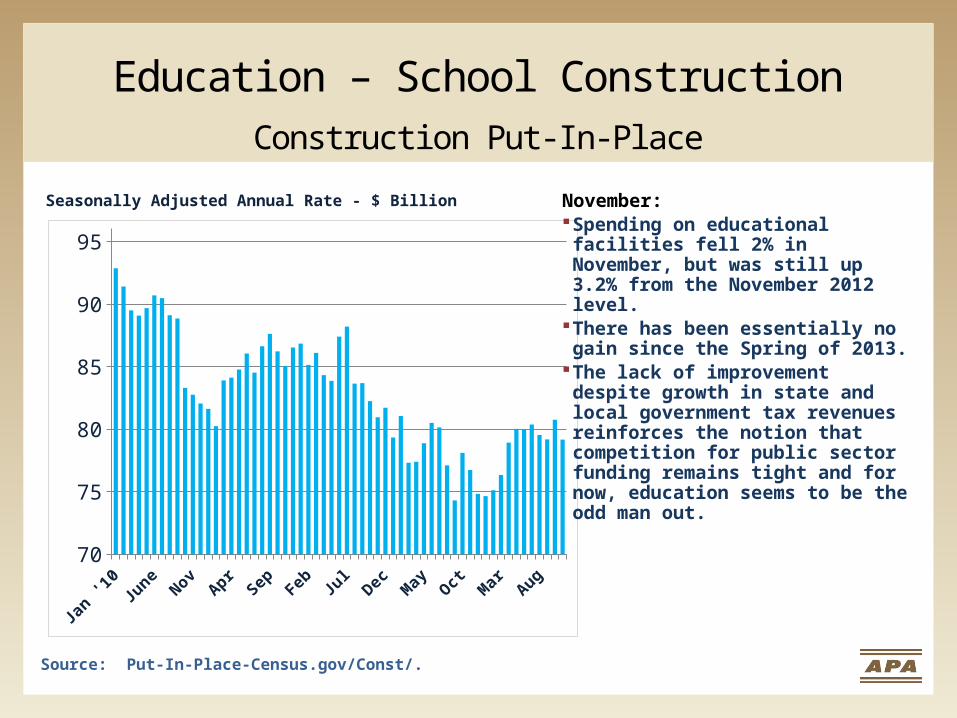
Education – School ConstructionConstruction Put-In-Place
Jan '1
0M
ay Sep
Jan '1
1M
ay Sep
Jan '1
2M
ay Sep
Jan '1
3M
ay Sep
Jan '1
4M
ay Sep70
75
80
85
90
95
Seasonally Adjusted Annual Rate - $ Billion
Source: Put-In-Place-Census.gov/Const/.
November:Spending on educational facilities fell 2% in November, but was still up 3.2% from the November 2012 level.
There has been essentially no gain since the Spring of 2013.
The lack of improvement despite growth in state and local government tax revenues reinforces the notion that competition for public sector funding remains tight and for now, education seems to be the odd man out.
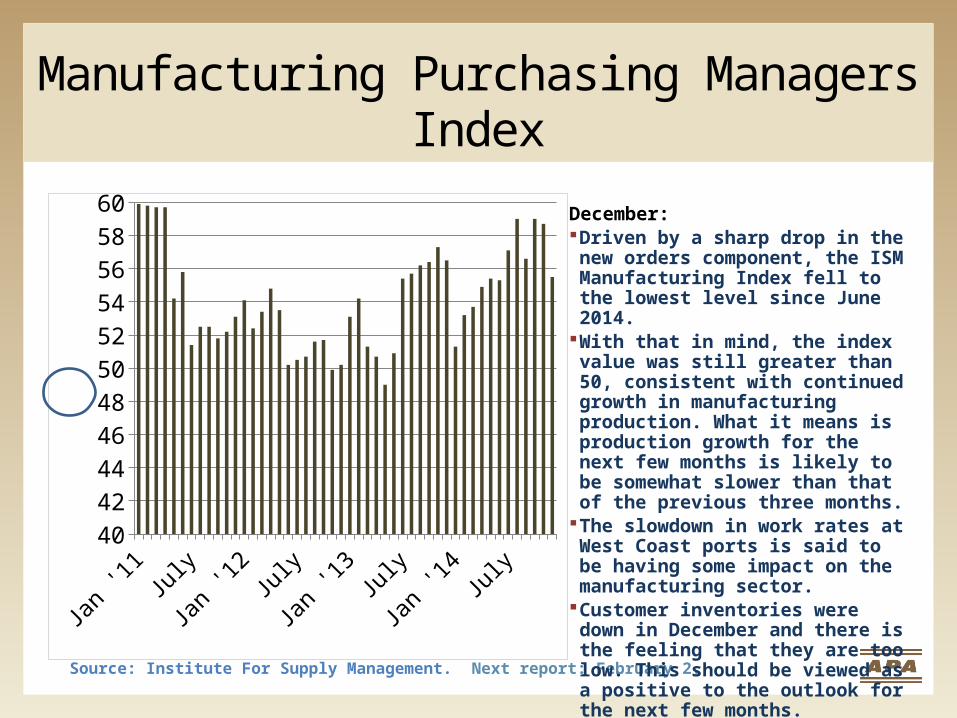
Manufacturing Purchasing Managers Index
Jan '1
1May
Sept
Jan '1
2May
Sept
Jan '1
3May Se
p
Jan '1
4May
Sept
40
42
44
46
48
50
52
54
56
58
60
Source: Institute For Supply Management. Next report: February 2.
December:Driven by a sharp drop in the new orders component, the ISM Manufacturing Index fell to the lowest level since June 2014.
With that in mind, the index value was still greater than 50, consistent with continued growth in manufacturing production. What it means is production growth for the next few months is likely to be somewhat slower than that of the previous three months.
The slowdown in work rates at West Coast ports is said to be having some impact on the manufacturing sector.
Customer inventories were down in December and there is the feeling that they are too low. This should be viewed as a positive to the outlook for the next few months.
Manufacturing Industrial Production Index Less Mining & Utilities
Jan '08
Feb
Mar
Apr
May
Jun
Jly
Aug
Sep
Oct
Nov
Dec
Jan '09
Feb
Mar
Apr
May
June
Jly
Aug
Sep
Oct
Nov
Dec
Jan '10
Feb
Mar
Apr
May
Jun
Jly
Aug
Sep
Oct
Nov
Dec
Jan '11
Feb
Mar
Apr
May
Jun
Jly
Aug
Sep
Oct
Nov
Dec
Jan '12
Feb
Mar
Apr
May
Jun
Jly
Aug
Sep
Oct
Nov
Dec
Jan '13
Feb
Mar
Apr
May
June
Jly
Aug
Sep
Oct
Nov
Dec
Jan '14
Feb
Mar
Apr
May
June
Jly
Aug
Sept
Oct
Nov
Dec
-20%
-15%
-10%
-5%
0%
5%
10%
Monthly Year-Over-Year % Change
Source: Federal Reserve G.17, Tables 1 and 7. Next release: February 18.
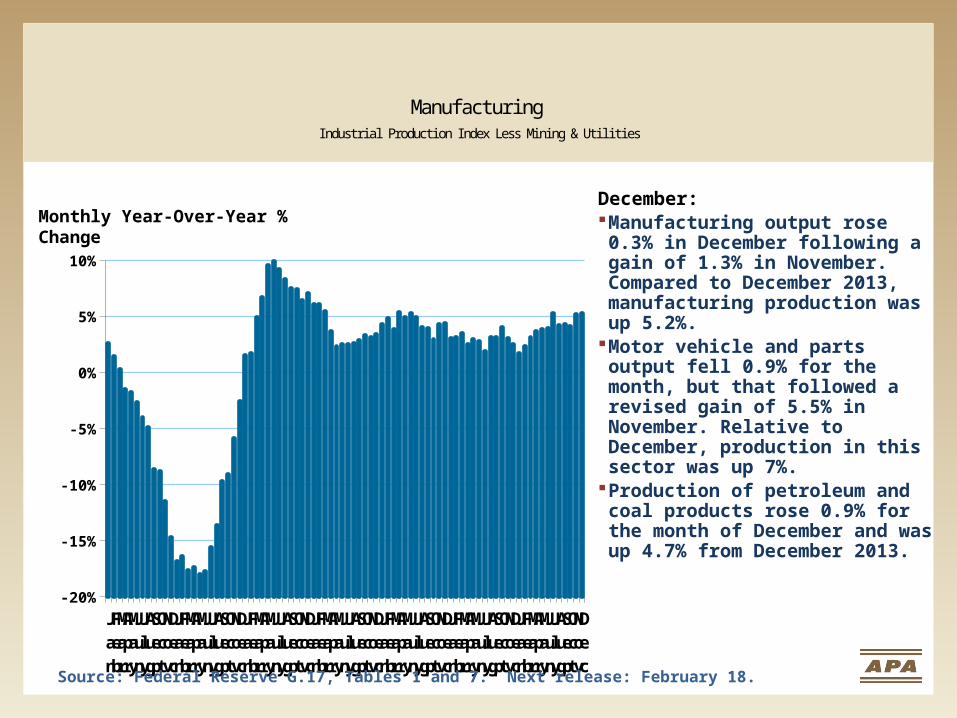
December:Manufacturing output rose 0.3% in December following a gain of 1.3% in November. Compared to December 2013, manufacturing production was up 5.2%.
Motor vehicle and parts output fell 0.9% for the month, but that followed a revised gain of 5.5% in November. Relative to December, production in this sector was up 7%.
Production of petroleum and coal products rose 0.9% for the month of December and was up 4.7% from December 2013.
Furniture Production Industrial Production Index
Jan '08
Feb
Mar
Apr
May
Jun
Jly
Aug
Sep
Oct
Nov
Dec
Jan '09
Feb
Mar
Apr
May
June
Jly
Aug
Sep
Oct
Nov
Dec
Jan '10
Feb
Mar
Apr
May
Jun
Jly
Aug
Sep
Oct
Nov
Dec
Jan '11
Feb
Mar
Apr
May
Jun
Jly
Aug
Sep
Oct
Nov
Dec
Jan '12
Feb
Mar
Apr
May
Jun
Jly
Aug
Sep
Oct
Nov
Dec
Jan '13
Feb
Mar
Apr
May
June
Jly
Aug
Sep
Oct
Nov
Dec
Jan '14
Feb
Mar
Apr
May
June
Jly
Aug
Sept
Oct
Nov
Dec
-35%
-30%
-25%
-20%
-15%
-10%
-5%
0%
5%
10%
15%
Monthly Year-Over-Year % Change
Source: Federal Reserve.
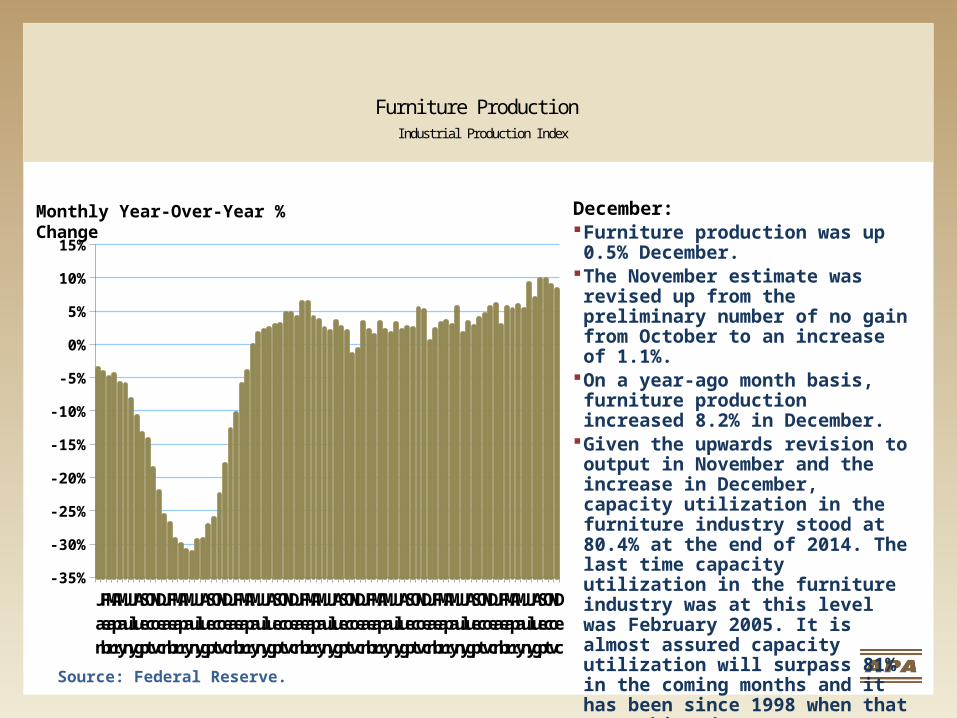
December:Furniture production was up 0.5% December.
The November estimate was revised up from the preliminary number of no gain from October to an increase of 1.1%.
On a year-ago month basis, furniture production increased 8.2% in December.
Given the upwards revision to output in November and the increase in December, capacity utilization in the furniture industry stood at 80.4% at the end of 2014. The last time capacity utilization in the furniture industry was at this level was February 2005. It is almost assured capacity utilization will surpass 81% in the coming months and it has been since 1998 when that was achieved.
Number of U.S. Jobs Created/LostSeasonally Adjusted
December 2014:
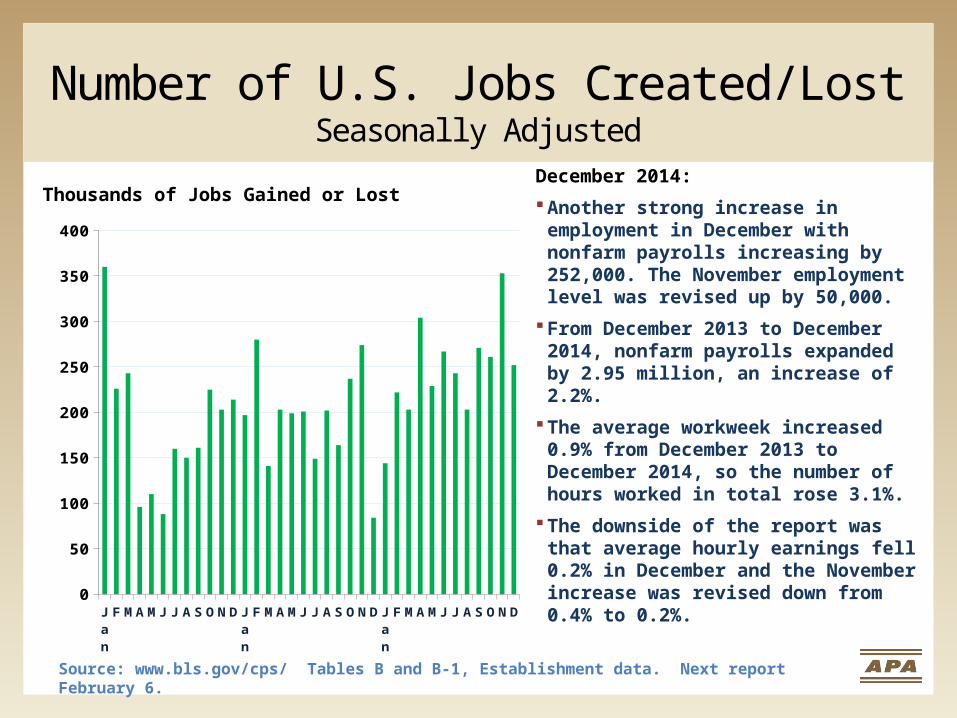
Another strong increase in employment in December with nonfarm payrolls increasing by 252,000. The November employment level was revised up by 50,000.
From December 2013 to December 2014, nonfarm payrolls expanded by 2.95 million, an increase of 2.2%.
The average workweek increased 0.9% from December 2013 to December 2014, so the number of hours worked in total rose 3.1%.
The downside of the report was that average hourly earnings fell 0.2% in December and the November increase was revised down from 0.4% to 0.2%.
Source: www.bls.gov/cps/ Tables B and B-1, Establishment data. Next report February 6.
Thousands of Jobs Gained or Lost
Jan '12
F MAM J J A S ON D Jan '13
F MAM J J A S ON D Jan '14
F MAM J J A S ON D0
50
100
150
200
250
300
350
400
U.S. Employment Rate(Percentage of population employed either full-time or part-time)
2000 2001 2002 2003 2004 2005 2006 2007 2008 2009 2010 2011 2012 2013 201458%
60%
62%
64%
66%
72%
74%
76%
78%
80%
82%
Population, 16 years-old plus
Population, 25-34 year-olds
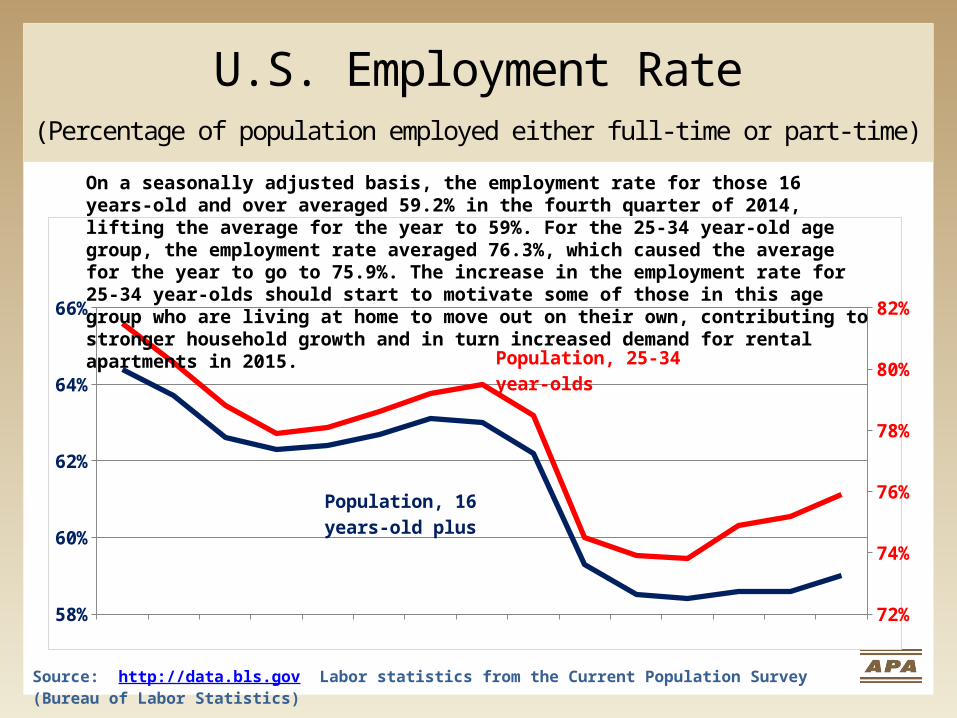
On a seasonally adjusted basis, the employment rate for those 16 years-old and over averaged 59.2% in the fourth quarter of 2014, lifting the average for the year to 59%. For the 25-34 year-old age group, the employment rate averaged 76.3%, which caused the average for the year to go to 75.9%. The increase in the employment rate for 25-34 year-olds should start to motivate some of those in this age group who are living at home to move out on their own, contributing to stronger household growth and in turn increased demand for rental apartments in 2015.
Source: http://data.bls.gov Labor statistics from the Current Population Survey (Bureau of Labor Statistics)
Jan-09
Jan-10
Jan-11
Jan-12
Jan-13
Jan-14
2%
4%
6%
8%
10%
12%
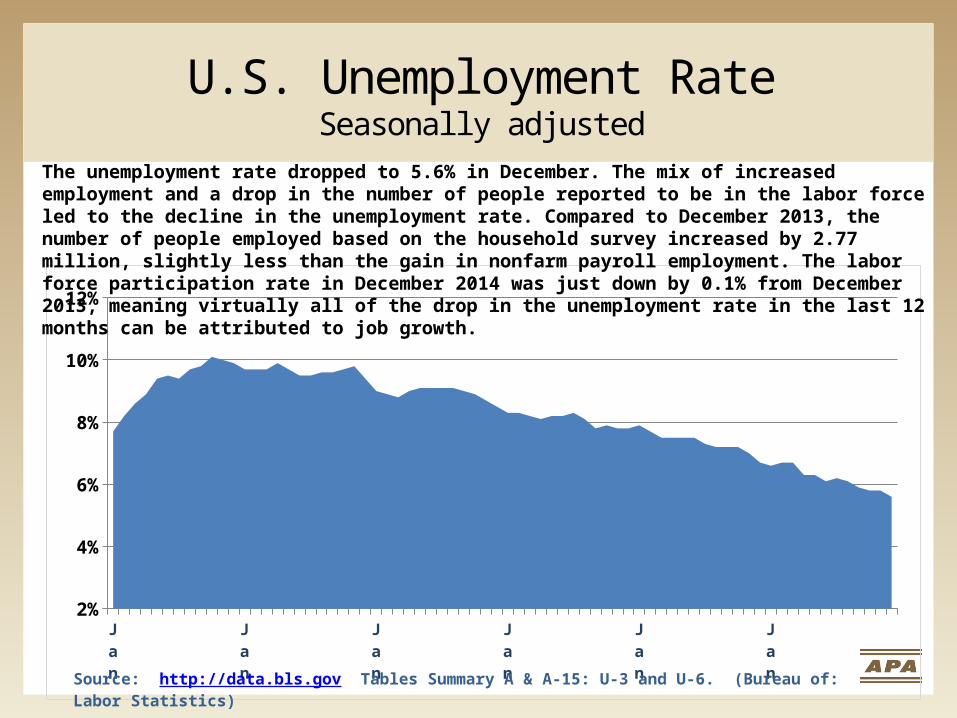
The unemployment rate dropped to 5.6% in December. The mix of increased employment and a drop in the number of people reported to be in the labor force led to the decline in the unemployment rate. Compared to December 2013, the number of people employed based on the household survey increased by 2.77 million, slightly less than the gain in nonfarm payroll employment. The labor force participation rate in December 2014 was just down by 0.1% from December 2013, meaning virtually all of the drop in the unemployment rate in the last 12 months can be attributed to job growth.
U.S. Unemployment RateSeasonally adjusted
Source: http://data.bls.gov Tables Summary A & A-15: U-3 and U-6. (Bureau of: Labor Statistics)
Jan '09
Feb
Mar
Apr
May
Jun
July
Aug
Sep
Oct
Nov
Jan '10
Feb
Mar
Apr
May
Jun
July
Aug
Sep
Oct
Nov
Dec
Jan '11
Feb
Mar
Apr
May
Jun
July
Aug
Sep
Oct
Nov
Dec
Jan '12
Feb
Mar
Apr
May
Jun
July
Aug
Sep
Oct
Nov
Dec
Jan '13
Feb
Mar
Apr
May
Jun
July
Aug
Sep
Oct
Nov
Dec
Jan '14
Feb
Mar
Apr
May
June
July
August
Sept
Oct
Nov
Dec
Jan '15
45
50
55
60
65
70
75
80
85
90
95
100
Overall Sentiment Expectations for the Future
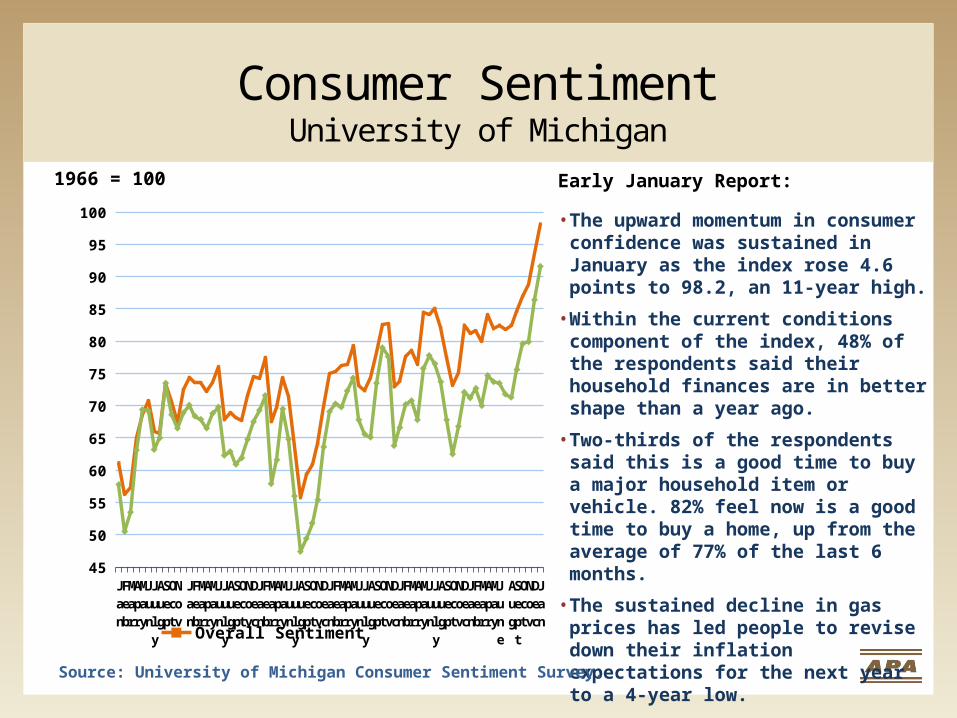
Consumer SentimentUniversity of Michigan
Early January Report:
• The upward momentum in consumer confidence was sustained in January as the index rose 4.6 points to 98.2, an 11-year high.
• Within the current conditions component of the index, 48% of the respondents said their household finances are in better shape than a year ago.
• Two-thirds of the respondents said this is a good time to buy a major household item or vehicle. 82% feel now is a good time to buy a home, up from the average of 77% of the last 6 months.
• The sustained decline in gas prices has led people to revise down their inflation expectations for the next year to a 4-year low.
Source: University of Michigan Consumer Sentiment Survey.
1966 = 100
U. S. Retail and Food Services Sales(Seasonally Adjusted)
Jan '11
AprJuly Oct
Jan '12
AprJuly Oct
Jan '13
AprJuly Oct
Jan '14
AprJuly Oct
370
380
390
400
410
420
430
440
450
$ Billions
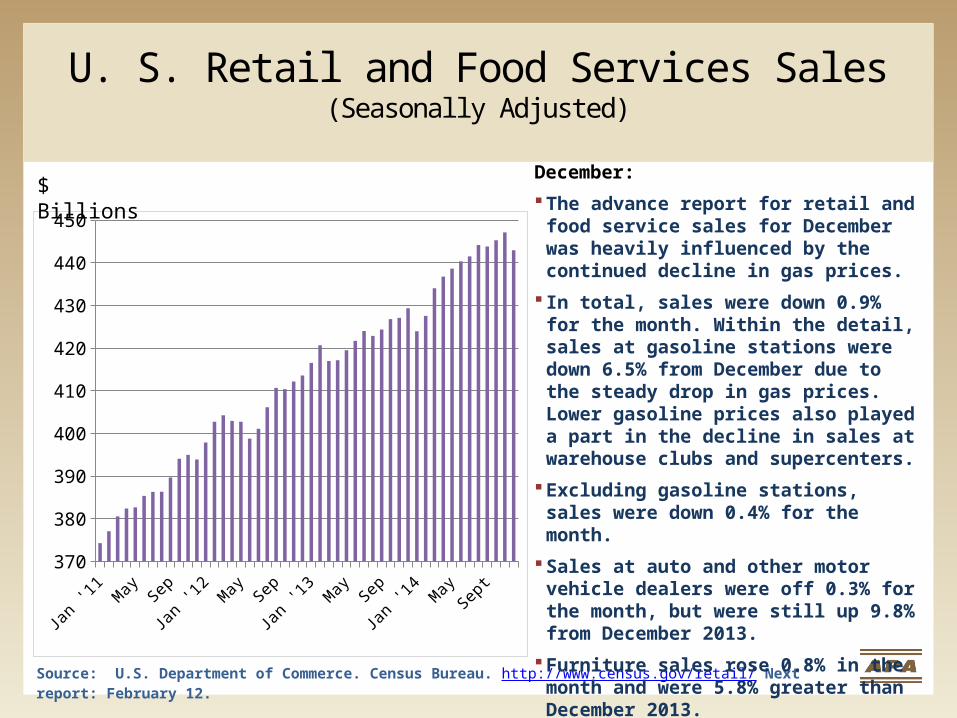
Source: U.S. Department of Commerce. Census Bureau. http://www.census.gov/retail/ Next report: February 12.
December:
The advance report for retail and food service sales for December was heavily influenced by the continued decline in gas prices.
In total, sales were down 0.9% for the month. Within the detail, sales at gasoline stations were down 6.5% from December due to the steady drop in gas prices. Lower gasoline prices also played a part in the decline in sales at warehouse clubs and supercenters.
Excluding gasoline stations, sales were down 0.4% for the month.
Sales at auto and other motor vehicle dealers were off 0.3% for the month, but were still up 9.8% from December 2013.
Furniture sales rose 0.8% in the month and were 5.8% greater than December 2013.
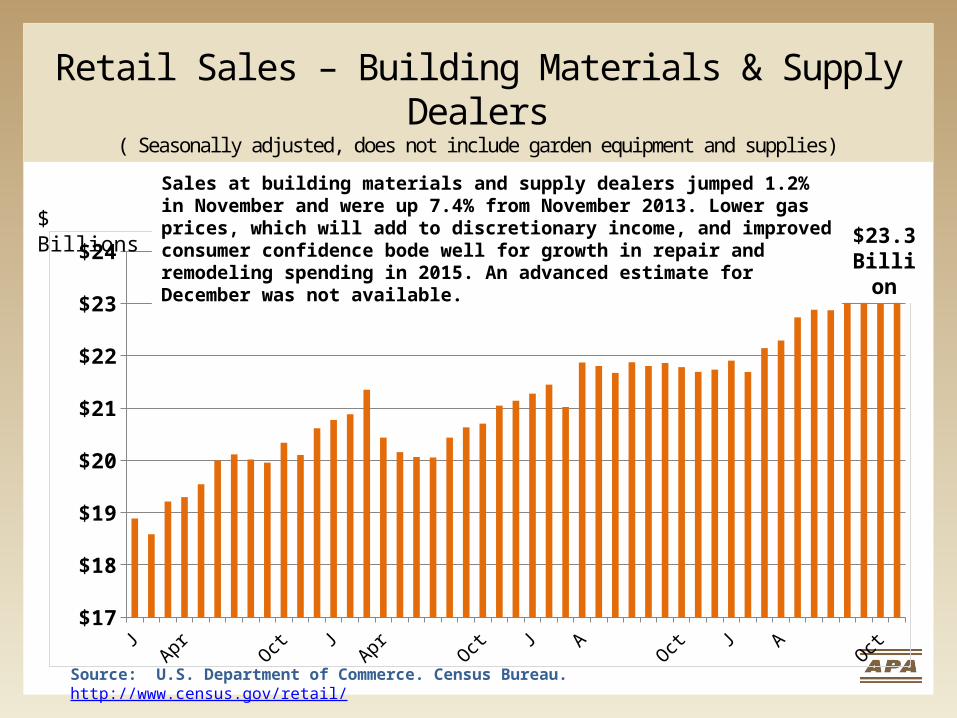
Retail Sales – Building Materials & Supply Dealers( Seasonally adjusted, does not include garden equipment and supplies)
JanMar
MayJuly Sep
Nov JanMar
MayJuly Sep
Nov JanMar
MayJuly Sep
Nov JanMar
MayJuly
SeptNOv
$17
$18
$19
$20
$21
$22
$23
$24$ Billions
Sales at building materials and supply dealers jumped 1.2% in November and were up 7.4% from November 2013. Lower gas prices, which will add to discretionary income, and improved consumer confidence bode well for growth in repair and remodeling spending in 2015. An advanced estimate for December was not available.
Source: U.S. Department of Commerce. Census Bureau. http://www.census.gov/retail/
$23.3Billion
U.S. Real GDP +5.0% In Q-3 (3rd Estimate)
2008
2009
2010
2011
2012
2013
2014
-8%
-6%
-4%
-2%
0%
2%
4%
6%
Chart Title
Source: Dept. of Commerce, Bureau of Economic Analysis. Next report: January 30.
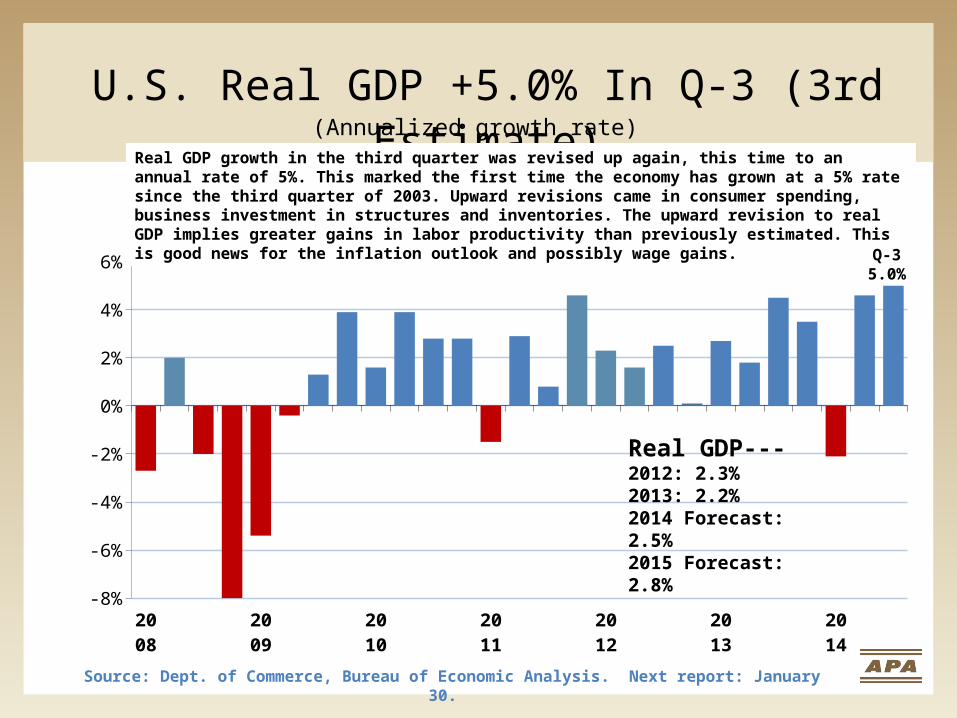
(Annualized growth rate)Real GDP growth in the third quarter was revised up again, this time to an annual rate of 5%. This marked the first time the economy has grown at a 5% rate since the third quarter of 2003. Upward revisions came in consumer spending, business investment in structures and inventories. The upward revision to real GDP implies greater gains in labor productivity than previously estimated. This is good news for the inflation outlook and possibly wage gains.
Real GDP---2012: 2.3%2013: 2.2%2014 Forecast: 2.5%2015 Forecast: 2.8%
Q-35.0%
Canada Housing Starts(Seasonally adjusted annual rate, thousands)
2010 2011 2012 2013 2014100
125
150
175
200
225
250
275
Source: http://www.cmhc-schl.gc.ca/en/hoficlincl/homain/stda/
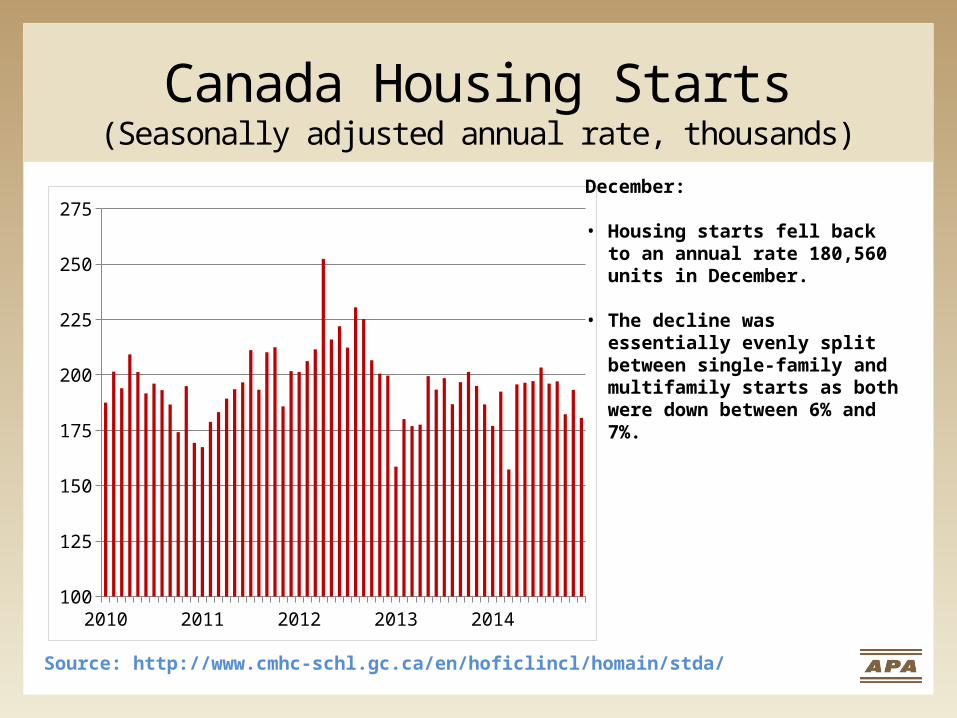
December:
• Housing starts fell back to an annual rate 180,560 units in December.
• The decline was essentially evenly split between single-family and multifamily starts as both were down between 6% and 7%.
Canada Housing Starts
1990
1991
1992
1993
1994
1995
1996
1997
1998
1999
2000
2001
2002
2003
2004
2005
2006
2007
2008
2009
2010
2011
2012
2013
2014
0
50
100
150
200
250
Single-familySingle-familySingle-familySingle-familySingle-family
Single-familySingle-familySingle-familySingle-familySingle-familySingle-family
Single-familySingle-familySingle-familySingle-familySingle-familySingle-familySingle-family
Single-familySingle-familySingle-familySingle-familySingle-familySingle-family
MultifamilyMultifamily
MultifamilyMultifamily
MultifamilyMultifamily
MultifamilyMultifamily
MultifamilyMultifamilyMultifamily
MultifamilyMultifamilyMultifamily
MultifamilyMultifamilyMultifamily
Multifamily
Multifamily
MultifamilyMultifamilyMultifamily
MultifamilyMultifamily
Multifamily
Single-family
(1000’s)
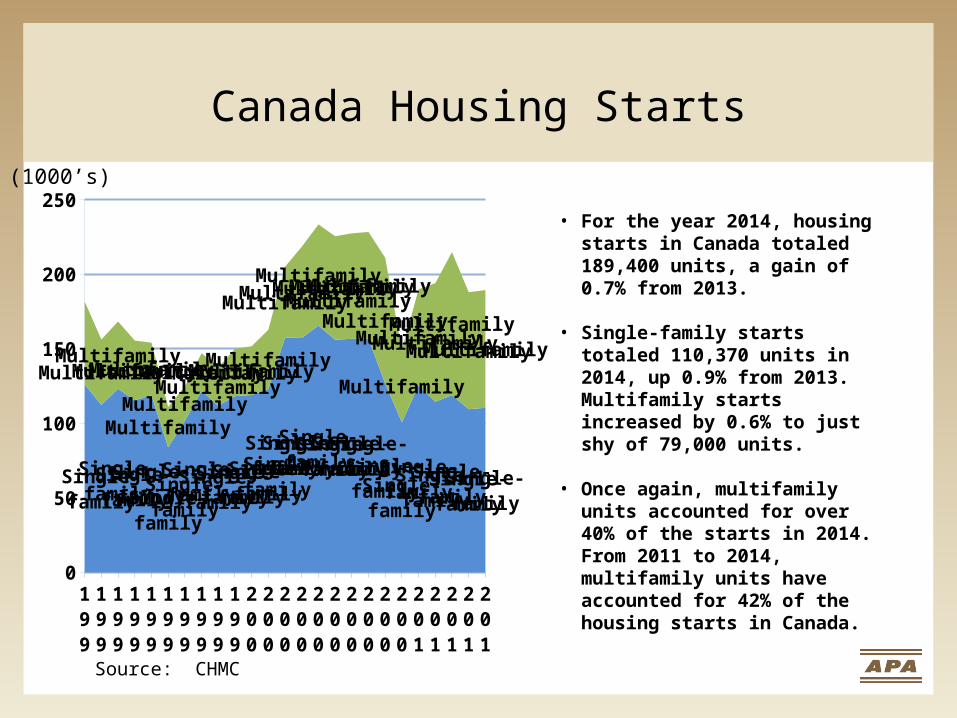
• For the year 2014, housing starts in Canada totaled 189,400 units, a gain of 0.7% from 2013.
• Single-family starts totaled 110,370 units in 2014, up 0.9% from 2013. Multifamily starts increased by 0.6% to just shy of 79,000 units.
• Once again, multifamily units accounted for over 40% of the starts in 2014. From 2011 to 2014, multifamily units have accounted for 42% of the housing starts in Canada.
Source: CHMC
Canadian Single-family Housing Startsby Type of Structure
1990
1991
1992
1993
1994
1995
1996
1997
1998
1999
2000
2001
2002
2003
2004
2005
2006
2007
2008
2009
2010
2011
2012
2013
2014
0
25
50
75
100
125
150
175
DetachedDetachedDetachedDetachedDetached
DetachedDetachedDetachedDetachedDetachedDetached
DetachedDetachedDetachedDetachedDetachedDetached
DetachedDetached
DetachedDetachedDetachedDetachedDetached
RowRow
RowRow
Row
Row
RowRow
RowRowRow
RowRowRow
RowRowRow
Row
Row
RowRowRow
RowRow
Semi-detachedSemi-detached
Semi-detachedSemi-detached
Semi-detached
Semi-detached
Semi-detachedSemi-detached
Semi-detachedSemi-detachedSemi-detached
Semi-detachedSemi-detachedSemi-detached
Semi-detachedSemi-detachedSemi-detached
Semi-detached
Semi-detached
Semi-detachedSemi-detachedSemi-detached
Semi-detachedSemi-detached
(1000’s)
Source: CHMC
Detached
Row
Semi-detached
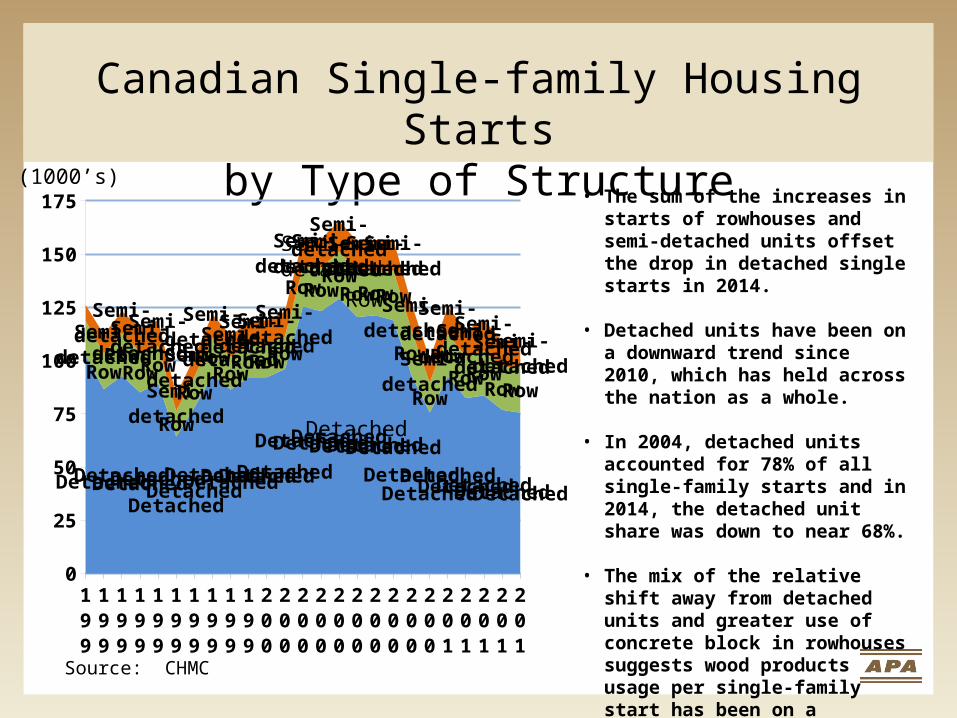
• The sum of the increases in starts of rowhouses and semi-detached units offset the drop in detached single starts in 2014.
• Detached units have been on a downward trend since 2010, which has held across the nation as a whole.
• In 2004, detached units accounted for 78% of all single-family starts and in 2014, the detached unit share was down to near 68%.
• The mix of the relative shift away from detached units and greater use of concrete block in rowhouses suggests wood products usage per single-family start has been on a downward trend.
Canadian Nonfarm Payroll Employment(Millions)
2012 2013 201415.0
15.1
15.2
15.3
15.4
15.5
15.6
15.7
Source: http://www.statcan.gc.ca, Next report January 29.
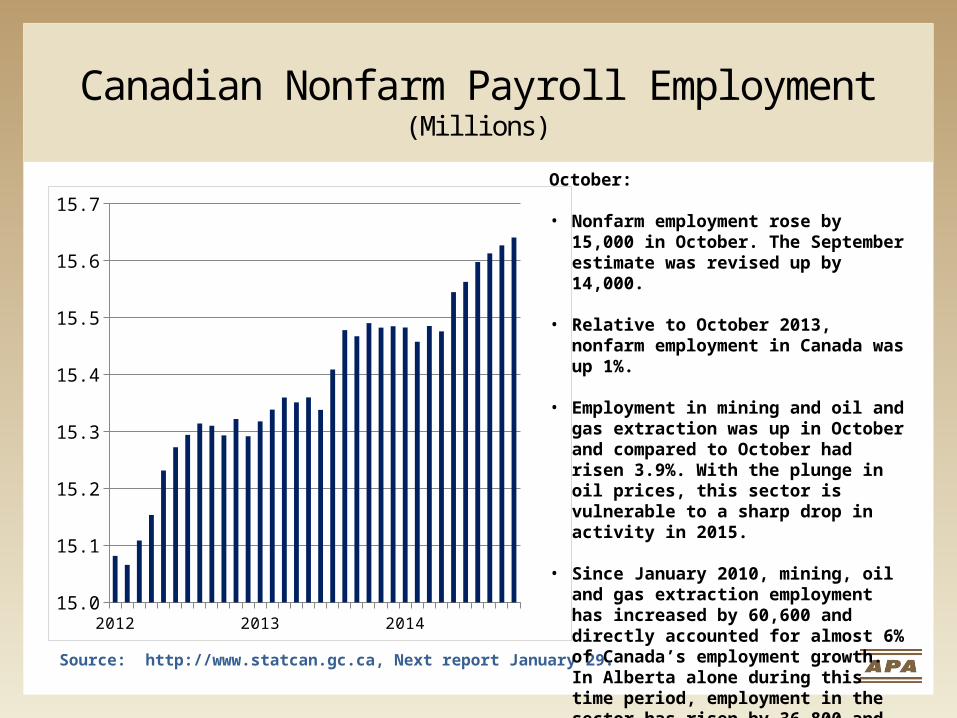
October:
• Nonfarm employment rose by 15,000 in October. The September estimate was revised up by 14,000.
• Relative to October 2013, nonfarm employment in Canada was up 1%.
• Employment in mining and oil and gas extraction was up in October and compared to October had risen 3.9%. With the plunge in oil prices, this sector is vulnerable to a sharp drop in activity in 2015.
• Since January 2010, mining, oil and gas extraction employment has increased by 60,600 and directly accounted for almost 6% of Canada’s employment growth. In Alberta alone during this time period, employment in the sector has risen by 36,800 and accounted for 11.7% of the province’s employment growth.
Retail Sales(Billion Canadian $, Seasonally Adjusted)
2011 2012 2013 201435
36
37
38
39
40
41
42
43
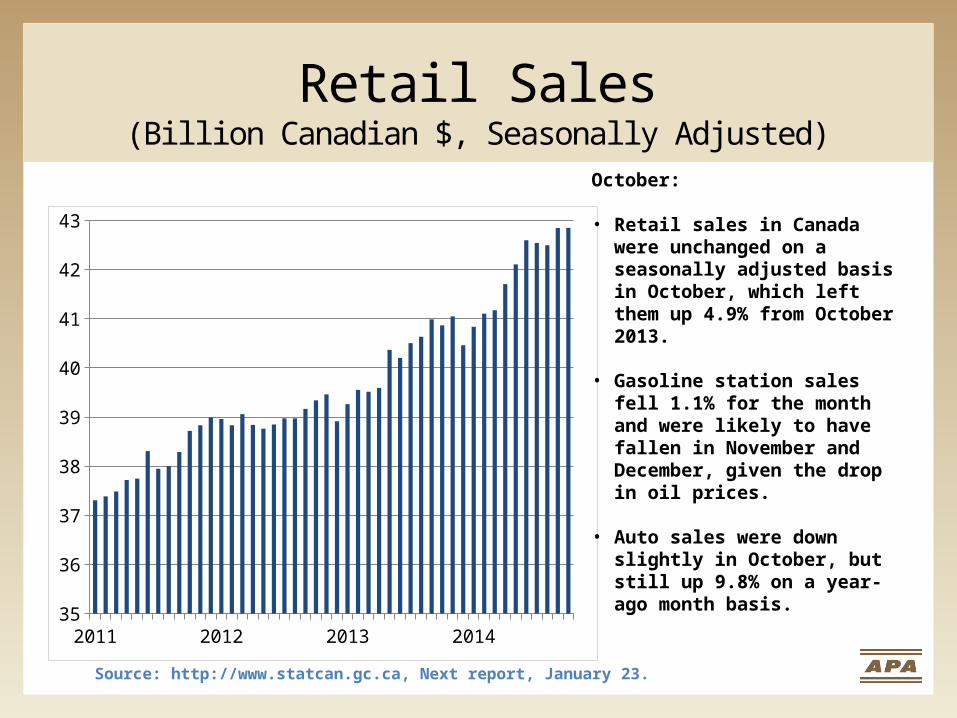
October:
• Retail sales in Canada were unchanged on a seasonally adjusted basis in October, which left them up 4.9% from October 2013.
• Gasoline station sales fell 1.1% for the month and were likely to have fallen in November and December, given the drop in oil prices.
• Auto sales were down slightly in October, but still up 9.8% on a year-ago month basis.
Source: http://www.statcan.gc.ca, Next report, January 23.
Retail Sales, Building Material and Garden Equipment and Supplies Dealers
(Billion Canadian $, Seasonally Adjusted)
2011 2012 2013 20141.9
2.0
2.1
2.2
2.3
2.4
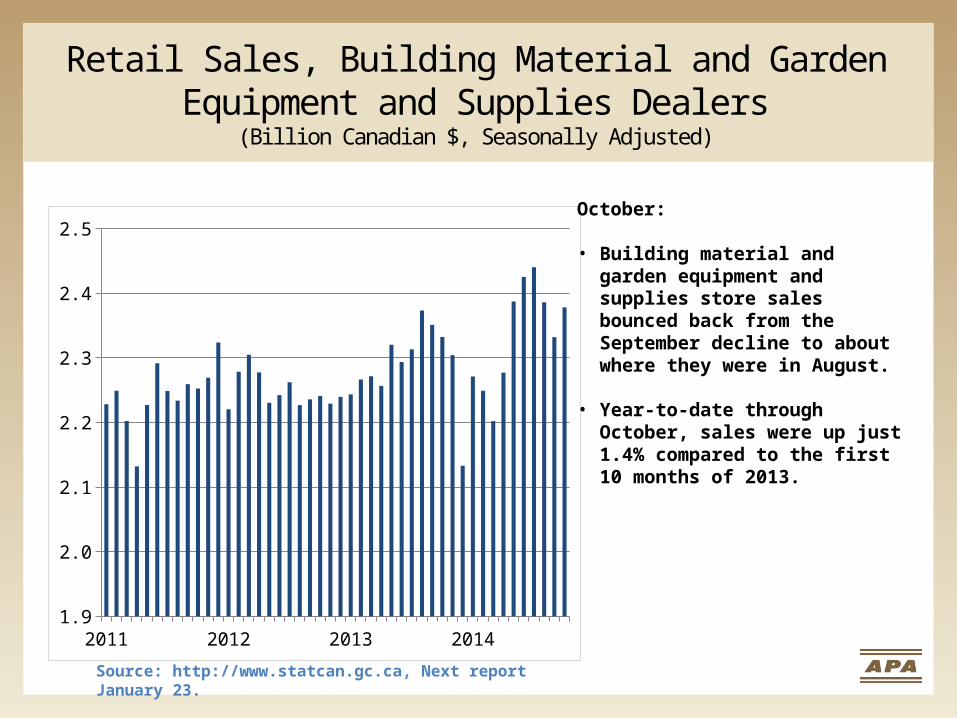
2.5October:
• Building material and garden equipment and supplies store sales bounced back from the September decline to about where they were in August.
• Year-to-date through October, sales were up just 1.4% compared to the first 10 months of 2013.
Source: http://www.statcan.gc.ca, Next report January 23.