Embed Size (px)
Citation preview

1
Housing Condition in Kerala With special focus on Rural areas and Socially
Disadvantaged Sections
Volume I Main Report
K.P. Kannan Imran Khan
Study sponsored by the SR Sankaran Chair National Institute of Rural Development and Panchayat Raj,
Hyderabad
Prepared by Laurie Baker Centre for Habitat Studies
Vilappilsala, Trivandrum 695573 Kerala, India
February 2016

2
Preface
This study on Housing Condition in Kerala is part of a larger collaborative project between the
SR Sankaran Chair on Rural Labour Studies, National Institute of Rural Development and
Panchayati Raj, Hyderabad and the Laurie Baker Centre for Habitat Studies,
Thiruvananthapuram. The main objective of the collaborative effort is to analyse the condition of
housing and related living amenities for the poor in the country with special focus on rural areas
as well as the socially disadvantaged sections of the population. The first study report covered an
assessment of the all India situation.
This second study focuses on the State of Kerala which is one of the leading states in the country
with a high level of achievement in ensuring basic housing condition. This study examines the
housing condition and related living amenities in the country and presents a comparative profile
between 2001 and 2011 based on data from the Population Census reports. We have taken care
to examine the condition of housing in rural areas and compare it with the situation in urban
areas. In addition we have also focused on the Scheduled Tribes and Scheduled Castes separately
to examine their position in relation to other sections of the population. The resulted are
summarized in the introductory chapter. The study team consisted of K.P. Kannan (Team
leader), Imran Khan (Research Associate). The team was assisted by Soumya Maria (Research
Associates) and S. Dhanya (Research Assistant).
The study team would like to place on record the cooperation, support and advice received from
Professor D. Narasimha Reddy, the first SR Sankaran Chair Professor at the NIRD as well as his
successor Professor Kailas Sarap. The team also would like to thank their colleagues at the LBC
especially P.B. Sajan, Member Secretary, V.K. Anilkumar, Chief Administrative and Programme
Manager, and Shalini Rajesh for their administrative support.
K.P. Kannan
Chairman
Laurie Baker Centre for Habitat Studies
Trivandrum, Kerala
29 February 2016

3
Contents
Chapter 1
Introduction and Summary of Findings
Chapter 2
Housing Condition in Kerala: Well Ahead of National
Achievements
Chapter 3
Social and Spatial Dimensions
Chapter 4
Some Additional Amenities and Facilities
Chapter 5
District Level Scenario: A Comparative Analysis
Chapter 6
Deficiencies in Housing Condition and
Policy Implications
References

4
Chapter 1
Introduction and Summary of Findings
1.1. General introduction
The State of Kerala is well known for its high level of achievement in human development. The
state not only had an early start but also maintains this lead to this day among the major Indian
states. The most well-known indicators of human development are life expectancy, average
enrolment in schools and per capita income. While these core indicators are quite capable of
representing the overall achievement of a region or country in human development, it is
important to assess other equally important basic needs. Shelter is one such basic need and this is
something that is not usually examined and discussed in the discourse on human development.
This study therefore is intended to assess this important basic need that should be counted
as an indicator of human development. The Kerala Human Development Report 2005 prepared
by the Centre for Development Studies (see CDS 2006) brought out that the process of human
development in Kerala has not yet lost its momentum and that it has now entered a stage where
its intra-regional (i.e. district level) differences are being narrowed. It therefore makes sense to
find out whether this trend applies to the issue of access to housing and related amenities.
Unlike the case of health and educational policies and programmes, Kerala does not have
a long history of public intervention in the provision of housing facilities. A notable early public
housing is the village housing scheme in early 1950s that was implemented through the
Community Development Programme of the Government of India. However, a major turning
point in public housing for the poor was the One Lakh Housing Scheme that was meant for the
landless and houseless poor initiated in 1971 by the Government of Kerala under the Chief
Ministership of C. Achutha Menon. From then there has been a stream of Schemes for public
provisioning of housing to the poor as well as sections of the middle class. We have discussed
the subsequent public policies and initiatives in Chapter 2.

5
1.2. Rationale for research
The primary rationale for research is the inadequacy of studies based on quantitative data to
assess the trend in the provision and creation of housing and related amenities to the people on a
periodic basis. Studies focused on the housing condition are rather far and few unlike studies
relating to education and health. In the Kerala context there are some studies but all of them
cover a period not exceeding the Census of 2001. As this present study shows significant
changes have taken place between 2001 and 2011. In addition to capturing the recent changes,
this study has focused on two important aspects of the housing condition in Kerala. The first is
the rural-urban disparities and the other to assess the social disparities by examining the housing
condition of people belonging to SC and ST groups viz-a-viz others. As we shall see later, the
rural-urban disparities in Kerala are not so significant as is the case in many other indicators of
poverty and human development. But the social disparities continue to be significant and needs
to be addressed as such.
An earlier report dealt with the condition of housing in India as a whole focusing on
rural-urban differences as well as the social disparities.
1.3. Objectives of the study
The specific objectives are as follows:
To assess the overall housing condition in Kerala viz-a-viz all India with a view to assess
the comparative performance of Kerala and to bring out any special features and
characteristics of Kerala;
To identify the core characteristics/indicators of housing condition and to assess the
progress in Kerala between 2001 and 2011 with special focus on rural-urban disparities
as well as social disparities;
To assess the progress in housing condition across districts in Kerala; and
To draw lessons and major policy implications with regards to improving housing
conditions as well as moving towards a Green Habitat.
1.4. Data sources and Methodology
There are two sources of data to assess the housing condition. One is the Population Census
reports on housing that are available on a decadal basis and the other is the National Sample

6
Survey Organisation which conducts sample surveys on housing condition with a lag of 7 to 10
years. We have based our analysis on the Census data since district level data are available for
the different states. Given the sample survey nature of NSS data collection, district level
analysis is not possible due to inadequate sampling units at that level. Based on an analysis of
data we have discussed the results in the context of housing policies and programmes of the
Government of Kerala and the recent changes in its economy.
1.5. Summary of main findings
Kerala being a state with a high density of population has also a high density of buildings per
unit of land area. In 1961 this was three times the all India average and in 2011 it stood at 2.9
times.
The growth in residential buildings in Kerala during the last 50 years – 1961 to 2011 was
xxx times while it was xx times at the all India level. This is understandable given the declining
population growth in Kerala which during 2001 ad 2011 was only around five per cent as
opposed to 16 per cent in all India.
The growth in non-residential buildings in Kerala was considerably higher than all India
between 1961 and 2011. It was xxx times in Kerala compared to xx times in all India.
Taking seven core indicators of basic housing condition, Kerala is well ahead of India in
terms of reducing housing deprivation. For example, houses without a private latrine facility in
Kerala was around 5 per cent in Kerala compared to 53 per cent in all India in 2011. While 95
per cent of houses in Kerala was electrified by 2011 it was only 67 per cent in all India.
While rural-urban disparity in a number of indicators has come down in Kerala it
increased in some others. However, this has to be interpreted cautiously given the fact that
between 2001 and 2011 the increase in Kerala’s urbanisation has been due to the transformation
of rural areas into urban areas rather than an increase in population in the existing big urban
cities. This means an increase in inequality could be due to the construction of better housing
facilities by the richer sections of the population in the earlier rural areas or by moving from
rural areas to nearby smaller towns.

7
To begin with, both SC and ST sections had significantly low levels of achievement
compared to the other sections in 2001. The gap is being narrowed in most indicators. However,
the gap to be narrowed is higher for the ST population than for the SC population.
The deprivation in housing condition is around five per cent for most indicators except
access to drinking water (16%) and dependence on firewood for cooking (64%). Except cooking
energy, Kerala is well placed to tackle the last mile problem.
Having attained basic housing condition for an overwhelming majority of the population,
Kerala now faces a major challenge in terms of environmental resources for building
construction. There is an urgent need to move away from high cost and environmentally-
unsustainable resources to locally available, cost-effective and less energy-intensive resources
for a climatically compatible and sustainable habitat.
This challenge to move towards a Green Habitat has become all the more urgent in view
of the global concerns and national commitment to move towards a low carbon-emitting regime
of resource use in the economy and society.

8
Chapter 2
Housing Condition in Kerala
Well ahead of national achievement
2.1 Introduction
Kerala has been known for its high level of social and human development indicators not only
when compared to other Indian states but also to other similarly placed developing countries
(see, e.g. Kannan 2000 in Parayil). While the Human Development Index developed and
propagated by the UNDP has become a standard criterion for comparison across countries as
well as provinces/regions within a country, housing is not part of this summary index. This is
quite understandable given the focus on individual characteristics as well as the need for as few a
number of foundational characteristics as possible for purposes of easy comparison.
However, housing condition is an important indicator of human welfare both from the
point of individuals as well as communities. It has an instrumental value in so far as it affects the
physical and mental health of the residents and through that in their ability to function in both
economic and social spheres of life. It is also a symbol of dignity that affects in many social and
economic interactions. For these reasons, housing has been considered as a basic necessity.
That makes it one of the foundational characteristics in measuring the economic and social
development of a country or its constituent parts.
In an earlier report, we dealt with the housing condition in India in terms of its
constituent states with special focus on rural and urban differences as well as across three major
social groups viz., Scheduled Castes, Scheduled Tribes and Others. In this study, we undertake a
detailed examination and analysis of the housing condition in Kerala given its overall leading
position in social and human development indicators including hosing condition.
The main source of data is the Population Census Reports for the relevant years. We
confine ourselves to a comparison of the situation between 2001 and 2011 and subsequently
focus mainly on the 2011 Census Report for detailed analysis. The National Sample Survey

9
(which undertook a survey in 2008-09) is useful for obtaining further details that are not captured
in Population Census but it does not permit district level analysis due to small sample size. The
state level picture from this source has been compared with other states in our earlier report and
hence we do not repeat them here except in highlighting achievements in the selected basic
indicators.
2.2 Census Houses and Residential Houses
Census houses are defined as building units used for any purpose. From this we need to
find out those houses which are occupied for any purpose. Then there is a further classification
that will give the number of residential houses (including those used partially for other purposes
such as a grocery shop). As in most parts of India, there has been a construction boom in Kerala
but perhaps in a more accelerated form. This shows that Kerala had 112.18 lakh building units in
2011 that was higher by 18.6 lakhs units compared to 2001. This comes to 3.4 per cent of the all
India total compared to its population share of only 2.7 per cent. What is important to look at is
the proportion of occupied census houses which was only 89.4 percent in Kerala compared to
92.5 per cent for all India. This means not an insignificant number of building units (i.e. 10.6
percent of census houses) – presumably residential units – are not occupied and left empty. In
absolute terms this comes to 11.9 lakh for Kerala in 2011. Enquiries with builders and others
knowledgeable in the sector has confirmed the popular impression that a number of newly
constructed residential apartments and independent residential buildings are owned by Keralaites
working abroad in anticipation of their eventual return for settlement. However, it should also be
added that residential buildings/apartments are also being increasingly viewed as investments by
the richer classes and the unoccupied status could be a transient phenomenon before it is being
leased out or sold. If that is the case, there is an oversupply of housing. But at the same time,
there is a deficiency in quality housing for the poor as we shall see later. Despite overall
improvement in the economic condition of most sections of the population, this of course reflects
the economic inequality which has been on the increase in Kerala as well since the 1990s.

10
Table 2.1: Total number of census houses by Use (Rural and Urban) in lakhs
India
Sl
no 1961 1971 1981 1991 2001 2011
1 Total number of census houses 1078.57037 1228.58597 1510.01488 1950.24257 2490.95869 3308.86373
2 Census houses vacant at the time
of house listing 62.59452 77.54926 80.46567 124.11900 158.11192 246.73289
3 Residence 772.21275 896.63937 1072.02355 1400.79652 1792.75605 2361.09682
4 Residences in combination with
other uses 20.01582 27.94009 44.31081 71.38837 78.86567 85.79218
5 Total of 3+4 792.22857 924.57946 1116.33436 1472.18489 1871.62172 2446.88900
Index 100 116.70615 140.91064 185.82830 236.24769 308.86149
6 Hotels, tourists homes, etc. 1.71771 1.77011 2.10654 3.18730 5.21598 7.20896
7 Shops excluding eating houses 23.01435 27.01610 36.98698 56.26875 133.90292 176.73199
8 Factories, workshops/worksheds 10.71730 15.98197 22.92849 34.33632 22.10912 24.96727
9 Others 188.29792 181.68907 251.19284 260.14631 299.99703 406.33362
10 Total of 6 to 9 223.74728 226.45725 313.21485 353.93868 461.22505 615.24184
Index 100 101.21117 139.98599 158.18681 206.13661 274.97176
Kerala-Total
1961 1971 1981 1991 2001 2011
1 Total number of census houses 33.80469 45.61185 58.81075 80.71960 93.56874 112.17853
2 Census houses vacant at the time
of houselisting 2.87973 3.25765 4.09550 6.84015 7.31823 11.89144
3 Residence 27.39867 33.32515 40.59540 52.12510 64.90580 76.58685
4 Residences in cumbination with
other uses 0.14316 0.29365 1.35775 1.29795 0.49620 0.44931
5 Total of 3+4 27.54183 33.61880 41.95315 53.42305 65.40200 77.03616
Index 100 122.0645 152.3252 193.9706 237.4642 279.7060
6 Hotels, dharamashalas, tourists
homes, etc 0.02604 0.06220 0.07805 0.29365 0.42029 0.52509
7 Shops excluding eating houses 1.41682 2.03045 2.63175 3.66040 8.97251 9.64441
8 Factories, workshops/worksheds 0.54576 0.91185 1.52260 2.23775 1.51692 1.65901
9 Others 1.39451 5.73090 8.52970 14.26460 9.93879 11.42242
Total of 6 to 9 3.38313 8.73540 12.76210 20.45640 20.84851 23.25093
10 Index 100 258.20468 377.2276 604.65900 616.2492 687.2609
11
The 2011 Census had noted that the continuing pace of urbanization of the country in
which a few states including Kerala has registered a much higher rate than the rest of the
country. As such the share of census houses in urban areas in Kerala has gone up to 48 per cent
compared from just 26 per cent in 2001 while the all India increase is quite modest.
37 47 64 76
101 117
151
208
241
289
0
50
100
150
200
250
300
350
1 9 7 1 1 9 8 1 1 9 9 1 2 0 0 1 2 0 1 1
DENSITY OF BUILDINGS IN INDIA AND KERALA
India Kerala
73.46 75.49 73.95
81.47
66.19 68.67
0
10
20
30
40
50
60
70
80
90
100
1961 1991 2011
Percentage of Residences in Total Buildings (India and Kerala)
India Kerala

12
2.3 Housing Condition as a part of Basic Living Condition
While the Census Reports on Housing give a picture of the housing condition in the country (by
states as well as districts) covering a large number of its physical characteristics and amenities,
our objective in this report is to capture the basic housing condition that would include the
physical characteristics such as current condition of the structure, space, etc. as well as basic
amenities such as latrine facility, access to drinking water, etc. From this point of view we have
identified seven indicators the satisfaction of which we reckon, would constitute the attainment
of basic housing facility. The idea is to find out what proportion of the households in Kerala has
satisfied these conditions. While so doing we extend the analysis to the broad social groups
constituting the population i.e. the Scheduled Castes (SC) and Scheduled Tribes (ST) and the
residual category of Others. The idea is to see to what extent the housing condition deprivation
of the socially most disadvantaged have been reduced compared to the other groups. This we do
with respect to two time points i.e. 2001 and 2011.
From among the large number of indicators available in the Census Reports, we have
selected the following to assess the basic housing condition in Kerala.
(i) Condition of the housing structure: Here the classification is in terms of (a) ‘good’,
(b) ‘satisfactory’, and (c) ‘dilapidated’ as reported by the respondent. Dilapidated is
taken as the characteristic of deprivation. It means that the housing structure is in
need of serious repair.
(ii) Number of rooms: Since the Census Report does not give the floor area of the house;
we have taken the number of rooms as a relevant indicator. If a house has only two
rooms or less, then it is an indication of basic deprivation.
(iii) Latrine Facility: We examine the data on latrine facility with respect to having a
private latrine facility or no latrine facility. If it is the latter, it is an indication of
basic deprivation.
(iv) Separate kitchen facility: We examine this as an indicator of better housing condition
from the point of women for whom the availability of a space that can be called
exclusively as kitchen is important from the point working freedom as well as overall
housing facility.
(v) Access to drinking water within premises: Access to drinking water is a critical basic
amenity. If it is not available within the premises, it is treated as a basic deprivation.

13
(vi) Availability of electricity for domestic use: Electricity has become a basic utility for
households. However, there is still a backlog of electricity connection or an inability
to afford an electricity connection. The absence of electricity for domestic use such
as lighting is taken as a basic deprivation.
(vii) Type of cooking energy: This is an essential item in the household expenditure. It also
has implications for health of the women engaged in cooking. The absence of safe
cooking energy could be taken as a basic deprivation.
2.4 Assessing Basic Housing Condition
The basic housing condition in terms of the above indicators in Kerala is one that is considerably
far better than the country as a whole. We discuss the housing condition in terms of the above
indicators one by one. Table 2.4 summarizes the information for Kerala and all India from the
Census of 2011 while Table 2.5 summarizes the information computed from the National Sample
Survey of 2008-09. We give the overall picture from the two sources in order to see whether they
present a reasonably similar picture. They in fact do although in some cases (e.g. access to
drinking water) the findings differ in some measure. What comes out unequivocally is that the
State of Kerala reports considerable progress in improving the quality of the housing condition of
its people compared to the country as a whole. In that respect, Kerala perhaps provides a
roadmap for other states to achieve similar progress. As we shall however note later, Kerala has
a small backlog in terms of improving the housing condition of a small segment of its
population. Its further challenges seem to be of a second order type especially the need to move
away from less environment-friendly housing and other building construction to a more
environment-friendly one involving less carbon emission, climatic suitability and use of locally
available materials.
We now discuss the basic indicators in the housing condition in Kerala and all India.
Condition of housing structure: When the condition of the housing structure is described
as ‘good’ in the Population Census it means it does not need any repair at the time of the survey.
In that respect two-thirds of houses in Kerala are in good condition while it is only 53 per cent
for all India. The worst condition is described as ‘dilapidated’ whose share is the same for both
Kerala and all India. “Livable’ indicates that only minor repairs are required. Another indicator is
the strength of materials in terms of pucca, semi-pucca and katcha. Pucca refers to housing units
whose wall and roof are built with permanent – rather durable – materials while semi-pucca

14
refers to only either wall or roof with such material. When both are constructed with temporary
materials such as thatch, it is referred to as kacha. In this respect Kerala has a very high share of
pucca houses at 80 per cent compared to 66 for all India. But the katcha housing is only about
three percent while it is a high of nearly 13 per cent for all India.
Number of living rooms: It is not enough to have a good or livable house but also one
with some space for the family members. If we take at least two rooms as a reasonable space,
then almost 92 per cent in Kerala belong to that category as per the Census of 2011 but it is a
mere 59 per cent for all India. Therefore the lack of reasonable space for a family of five in
India is quite a major problem. We will see later that if such houses also lack a separate kitchen
then the situation with regard to space is a much more serious problem than what the number of
living rooms indicates.
Private latrine facility : We would consider this as one of the most basic requirements in
a housing facility. This impinges directly on the dignity of the individual especially the women
members of the household. In this respect Kerala’s record is a commendable one having attained
95 per cent (according to both Census and NSS) although even the remaining five per cent
should be deemed as an urgent issue to be addressed. At the all India level it is a massive 53 per
cent that cannot be allowed to continue given the question of protecting the dignity of the
individual.
Availability of a separate kitchen: A space that could be called a ‘kitchen only’ is not a
luxury for family. For women, who mainly manage the kitchen, it gives them some private
space as well as autonomy in daily chores. In Kerala 98 per cent of the households reported as
having such a facility while the remaining do not have it. But for all India, nearly half the
households do not have a space that they can call ‘kitchen only’. Along with the absence of a
private latrine facility this deficiency should also be marked as a national problem with regard to
such a basic need as a reasonable housing facility.
Access to drinking water: It goes without saying how important it is to have easy access
to drinking water facility within the household or in the premise. While close to 77 per cent of
the households in Kerala report access to drinking water within the premise, this facility is
available only for 51 per cent of the households at the all India level. Here again what we see is
a huge gap that needs to be filled in with regard to basic housing condition. A similar, if not the

15
same, information is available from the NSS round on housing in 2008-09 given in Table 2.5.
Here two-thirds of Kerala households reported exclusive use of drinking water facility while it is
only 35 per cent for all India. The gap between Kerala and all India is quite considerable here.
Electricity for lighting: Access to electricity for lighting within the housing unit is
another facility we have identified as part of basic housing condition. In this respect, as in the
case of access to a private latrine, Kerala has achieved near universal coverage with 95 per cent
of households reporting electricity connection. However there is significant gap of around 33
percent at the all India level.
Type of cooking energy: What type of cooking energy is used has a bearing on the health
of women who are usually the ones who spent a good part of their time in the kitchen. Use of
firewood has a health hazard while it is often, but not necessarily always, a less expensive
commodity. Use of cow dung cake is also common in rural households.
In some respects the two sources - Census and NSS – findings are broadly similar but in
some other respects there is some divergence. This could be due to the two time points of the
field surveys although the gap between the two was only 2-3 years. But what is significant from
from the point of Kerala is its leading position in all basic indicators that we have selected.
However, this does not mean that the deficiencies are negligible; even where it affects only a
small segment of the population the fact is that they constitute the most vulnerable segments in
the society. We will see this later when we examine the housing condition and its various
indicators in terms of broad social groups with focus on ST and SC as well as spatial dimensions
such as rural-urban and districts.

16
Table 2.3: Percentage Distribution in selected indicators on Quality of
Housing Condition in Kerala and India(Census 2011)
1. Condition of Structure
Good Liveable Dilapidated
Kerala 66.3 28.4 5.3
INDIA 53.1 41.5 5.4
2. No. of rooms
1 room* 2 rooms 3 and above
Kerala 8.4 25.1 66.5
INDIA 41.0 32.7 28.3
3. Latrine facility
Water Closet Pit and Other No latrine
Kerala 66.7 28.5 4.8
INDIA 36.4 10.5 53.1
4. Separate kitchen facility
With separate kitchen No separate kitchen
Kerala
INDIA
5. Access to drinking water
Within premises 0.2-1 km
1 km and
more
Kerala 76.5 23.3 0.2
INDIA 50.7 48.9 0.5
6. Major source of lighting
Electricity Kerosene Others
Kerala 94.5 5.2 0.3
INDIA 67.2 31.4 1.4
7. Type of cooking energy
LPH/PNG Firewood* Other
Kerala 36.0 63.0 1.0
INDIA 28.5 65.8 5.7
*Inclusive. Crop residue and crowding cake.

17
Table 2.4: Percentage Distribution (NSSO 65th Round (July 2008-
June2009)
1a. Condition of the Structure of Houses
Region Good Satisfactory Bad
Kerala 51.9 37.9 10.2
INDIA 37.9 46.9 15.3
1b. Type of Structure of Houses
Region Pucca Semi –Pucca Katcha
Kerala 80.3 16.8 2.9
INDIA 65.8 21.2 12.6
2. Number of living rooms
Region One room Two rooms Three and above
Kerala 8.8 17.6 71.8
INDIA 38.3 35.6 24.7
3. Latrine facility
No latrine
Kerala 66.7 28.3 4.8
INDIA
4. Access to Drinking Water
Exclusive use
Common use in the
building/Community
use
Others
Kerala 66.4 19.5 14.2
INDIA 35.7 59.8 4.3
5. Type of Kitchen
Region
With Water
Tap No Water Tap No Separate Kitchen
Kerala 38.9 53.0 8.0
INDIA 12.4 38.2 49.6
6. Source of lighting
Electricity Kerosene Others
Kerala 94.4 5.6 0
INDIA

18
2.5 Housing Policy in Kerala
Public policy on such an important basic need as housing has been central to taking care of the
housing requirements of the poor and relatively poor especially those belonging to labour
households. This has been the historical experience of both currently developed as well as
developing countries. In India, public policy of an active type to meet the housing requirements
of the poor and vulnerable is still a work in progress given the deficiency in housing with quality
and reasonable amenities. In the case of Kerala, its housing policy as well as schemes till 1971
were in tandem with the Government of India; in fact the state mostly implemented the housing
schemes that were quite limited in terms of requirements.
The turnaround in housing policy in Kerala came about in 1971 when the Government of
Kerala led by a visionary Chief Minister C. Achutha Menon announced the One Lakh Housing
Scheme for the landless poor. The scheme was a departure from the usual bureaucratic-led
implementation mechanism since it was conceived as one based on social mobilization of
beneficiaries as agents as well as resources. It was meant for poor landless agricultural labourers
who did not get homestead lands under the then implemented Kerala Agriarian Relations Act.
The poor beneficiaries received such houses almost free although the houses were quite small
with bare minimum of materials and amenities. Plots of land were allotted with funds collected
from the public and willing donors and labour mobilized from beneficiaries, students, civil
society organizations and anyone willing to participate in the scheme. According to one estimate
60 thousand houses were thus constructed by 1976.
The importance of beneficiary participation and its success led to the designing of
another scheme in 1983 known as Subsidized Aided Self Help Housing Scheme (SASH) for the
economically weaker sections. While this resulted in constructing close to 30 thousand houses, a
couple of other schemes such as the Cooperative Housing Scheme for the economically weaker
sections and the houses constructed under the Central Government scheme of National Rural
Employment Programme far exceeded this achievement. A number of schemes followed
subsequently in which the State Government initiatives with imaginative provisions for
assistance and implementation were quite conspicuous. During the government of C. Achutha
Menon (1969-77), he took personal interest in promoting alternative architecture and building
construction techniques that were cost effective and environment friendly and suited to the local

19
climatic and resource availability of Kerala. A committee of experts was appointed to provide
guidelines for cost-effective approaches to building construction which submitted a report that
was called “Performance Approach to Cost Reduction in Building Construction” in 1974.
Foremost among them was the architecture and cost effective building construction approach
propagated by Laurie Baker. Following the Laurie Baker approach, the Government of Kerala
set up district level Nirmiti Kendras as autonomous bodies for propagating cost effective and
environmentally-less energy intensive materials. This model was adopted at the national level
and the Government of India empowered the Housing and Urban Development Corporation
(HUDCO) to establish a similar network of ‘Building Centres’ throughout the country. At the
national level, however, none of these made more than a symbolic impact given the absence of a
firm political commitment backed by policies for an environmentally-compatible (less carbon
emitting) and cost-effective architecture and building construction. Even in Kerala, such a
paradigm-changing initiative got marginalized through the persistence of the official culture of
building construction using concrete and similar energy-intensive and high cost materials and the
emergence of a powerful real estate-cum-building construction lobby that catered to the rising
middle and rich classes powered largely, if not only, by remittances from abroad to private
households.
However, such an evolution of public policy on housing in Kerala became a basic tenet of
the two political coalitions – the Left Democratic Front led by the Communist Party of India
(Marxist) and the United Democratic Front led by the Indian National Congress – which came to
power alternately. Special schemes for housing for the poor among the marginalized
communities such as the Scheduled Tribes, Castes and the fisher folk were designed and
implemented. Housing under cooperative schemes was also encouraged. This period from 1985
to 1995 marked another phase in the public policy on housing in Kerala.
A third phase perhaps accelerated this process of providing reasonable housing and
related amenities for the poor and vulnerable sections emerged by the time Kerala embarked in a
big way for implementing the new Panchayat Raj after the constitutional amendment on this
subject during 1994 and 1994. By this time the Government of Kerala was also ready with its
own state policy on housing in line with the national housing policy. The implementation of the
new Panchayat Raj through a people’s plan campaign (PPC) mode greatly facilitated the further

20
enhancement of focus on improving the housing conditions for the weaker sections. In 1996 the
Kerala State Housing Board (KSHB) launched a Maithri Housing Scheme with the objective of
constructing 100 thousand housing units every year. This was largely for the economically
weaker sections and the beneficiaries were to be selected by the newly constituted village
panchayats. An official report recorded that within the next eight years i.e. by 2004, 2.82 lakh
houses were constructed under this scheme.
While the KSHB proceeded with its own abovementioned housing scheme, the PPC for
implementing the new panchayat raj was entrusted with a more ambitious housing scheme called
Total Housing Scheme that aimed to meet the housing requirement of the poor. Three districts
were first selected for implementing this scheme viz., Thiruvananthapuram, Kollam and
Thrissur. This was because of the presence of three important organizations in the civil society
that was engaged in promoting cost effective and environment friendly construction. These were:
Habitat Technology Group in Thiruvananthapuram, Nirmithi Kendra in Kollam and the Centre
for Science and Technology for Rural Development known as COSTFORD (founded by the late
C. Achutha Menon, K.N. Raj and the famed architect Laurie Baker.
Subsequently this scheme was enlarged and called EMS Total Housing Scheme
introduced in 2008 for a period of three years coinciding with the ending of the term of the LDF
Government. The audit report of the Local Fund Audit reported that the achievement rate was
around 22 per cent of the target of assisting 5.58 lakh families. Although the achievement rate
was low, it was a commendable effort. However, the hiatus between intention and
implementation is a significant one as in the case of most of the earlier schemes.
Another scheme implemented in 2008 was the renovation and reconstruction of the
houses built under the One Lakh Housing scheme during the early 1970s associated with the
name of M.N. Govindan Nair, a veteran politician in the cabinet of C. Achutha Menon.
Remittance Induced Construction Boom
While public policy on housing and the resultant public schemes by and large focused on
meeting the housing demands of the absolutely and relatively poorer sections of the population,
Kerala began to witness a construction boom both in the house-building as well as non-house-
building sectors arising primarily out of the flow of remittance income from its workers working

21
in Gulf countries and the multiplier effect that was created in the economy. Though the flow of
international labour migration picked up slowly from 1973, the impact of the remittances began
to affect the house-building sector in a significant way by the beginning of the 1980s. Given the
skilled and semi-skilled nature of the background of a significant proportion of workers, their
first priority was to build a modern house that would add to the social status of the family in a
hierarchical society. But the educated and better paid segment of the people who were working
in the Gulf also seemed to accord a high priority to house-building with modern facilities and
amenities that they now could afford. The growth in housing units began to accelerate since the
early 1980s. Along with it the characteristics of housing also changed as manifested in the size
of the building with more rooms than before, modern toilets and bathrooms, with modern kitchen
and appliances. Since housing constituted the largest segment in the construction sector, the
growth in output in value terms in this sector provides an indication of the construction boom.
Along with the series sector the construction sector also contributed significantly to the growth
acceleration in the Kerala economy since early 1990’s (see Kannan 2007)
By collating data from the six rounds of Population Census reports, we are in a position
to get an overview of the growth in the building sector in Kerala comprising both the housing
segment as well as non-housing segment. The important statistics are given in Tables xx while
detailed statistics are given in the tables in the Appendix to this study.
Table 2.1 shows the growth in the number of all buildings referred as ‘census houses’ in
the Census volumes. This consists of residences (those buildings used only as residences as well
as those that are used as residence and other uses). A comparison with the all India scenario
gives us an idea of the relative growth made in this sector in Kerala. The total number of
building units in Kerala in 1961 was lakhs that increased to 112 lakhs in 2011 i.e. 3.3 fold or 330
per cent increase. Residential units increased from 27.5 to 77.0 lakhs registering an increase of
280 percent. What is important is the growth in Kerala for exceeded the growth in population.
While at the all India the share of residences remained in the range of 74-75 per cent of all
building units, it was as high as 81 per cent in Kerala in 1961 that steadily decreased to 68 per
cent within the last fifty years. This means a greater rate of growth of non-residential buildings
that is indicative of its economic and social change. It is well known that the density of
educational (especially school) and health facilities in Kerala are quite high compared to the all

22
India situation. There is also a remarkable growth in the trading sector as indicated by the
growth in ‘shops excluding eating houses’. The increase was 6.8 times or 680 percent during the
last 50 years.
100
150
200
250
300
350
1961 1971 1981 1991 2001 2011
Index Number of total buildings in India & Kerala
India Kerala
100
150
200
250
300
350
1961 1971 1981 1991 2001 2011
Index Number of total residential buildings in India & Kerala
India Kerala

23
The construction boom contributed to an income multiplier in the economy through
employment since building activity construction is a non-traded sector. As far as materials are
concerned, there was some local multiplier effect through the demand for sand, granite, baked
bricks, tiles and wood. But over a period of time, the imported materials (both from other parts
of India as well as from abroad) content increased with preference for Malayasian wood,
marbles, new floor tiles, electricity and plumbing material apart from cement and steel. Wage
increase in the construction sector led to a situation whereby rural wages were being determined
by the demand from this sector since a lot of workers from agriculture and related activities
migrated to this sector. Wage increase has been quite impressive leading to increasing
purchasing power among the workers. With their newly acquired experience in the construction
sector, a large number of skilled workers such as masons, carpenters, plumbers, electricians,
specialists in flooring, tiling, etc. migrated to the booming construction sector in the Gulf
countries. All these ultimately resulted in either improving the existing amenities of their
housebuilding or in constructing new houses.
Therefore a combination of factors helped Kerala in improving its housing condition. If
left to the market forces, Kerala would have certainly witnessed the construction boom but it
would have bypassed the poorer and weaker sections. It is here public policy and its
implementation in terms of a series of public housing schemes played a very significant role in
improving the housing conditions of the poor. In fact, after the establishment of the new
panchayat raj in 1995, housing has been an important area of activity of the panchayats (and
municipalities) in implementing the various public housing schemes. This also includes
0
100
200
300
400
500
600
700
800
1961 1971 1981 1991 2001 2011
Index Number of growth in non-residential buildings in India & Kerala
India
Kerala

24
improving amenities such as drinking water, electrification, construction of toilets and related
housing amenities.
It is in this background we analyse the housing condition in Kerala during 2001 and
2011. Given the sharp rural-urban division in many aspects of basic development, it is important
to examine the rural condition and compare it with the urban situation. This we do in the next
chapter. However, we have realized that the division is much deeper than mere spatial division.
It often takes the form of a social division in terms of segments of population who are
advantaged, less advantaged and disadvantaged. Our earlier analysis of poverty and related
issues confirm such a sharp social dimension (see Kannan 2014). We have therefore subjected
the data to an analysis of the housing condition in terms of Scheduled Castes, Scheduled Tribes
and Others by relying on the data from the Census reports.
The second point to note is the use of highly energy-intensive materials in the
construction of buildings in Kerala as in the case of the rest of the country. Despite the
availability of more cost-effective and environmentally friendly architectural and construction
approaches, the idea of a ‘modern building’ be it a house or other building has come to mean use
of high cost materials and high expenditure for gadgets and fixtures. This however is a theme
that is beyond the scope of this study but something that has to be pursued separately given the
concerns over the adverse impact of environmental degradation ultimately resulting in increased
carbon emission.

25
Chapter 3
Social and Spatial Dimensions
3.1 Introduction
There are two important differentiating features of the Indian economy and society relating to the
social and spatial dimensions; the former referring to the rural-urban differences and the latter to
social groups. While social groups can be listed according to different layers, we focus here on
three aggregate groups namely ST, SC and Others. In this way we are in a position to examine
the condition of the two important groups that are found to be at the bottom of the economy and
society on a very large number of indicators.
We then examine the three groups in terms of the rural an urban areas. Rural is associated
with mainly agriculture and related activities, lower income, seasonal employment and so on
whereas urban is dominated non-agricultural activities, wage income, better infrastructure and so
on. However the rural economy in Kerala has changed much faster than all India with a much
higher share of workers in non-agricultural activities (especially agro-processing as well
education and health)
As mentioned in Chapter 2, we have selected seven basic indicators as constituting the
core of the housing and associated amenities. For short they are referred to as ‘housing
condition’. In addition we have also selected some of the additional indicators of housing and
amenities other than basic indicators referred to as ‘Additional facilities’.
Basic indicators of the housing condition have been identified by selecting from a whole range of
housing characteristics used for the population census. By comparing 2001 and 2011 censuses
we are in a position to capture the progress made in improving the housing condition in Kerala.
3.2. Performance in basic indicators
In this section we present the performance in the basic indicators (as mentioned above) of
housing and amenities among SC, ST and other groups.

26
Housing condition
The following section presents the distribution of the condition of houses by categorizing them
into good, livable and dilapidated. The houses are reported as ‘Good’ if such houses do not
require any repair and are in fair good condition. Livable houses are defined as those which need
minor repairs. The houses are recorded as dilapidated, if the house had shown the signs of decay
or those breaking down or require major repair, and far from being in condition that can be
repaired or restored.
Table 3.1 presents the data on housing conditions by social groups in year 2001 and
2011. In 2011 out of total houses in Kerala (76,58,685), 66 percent were in good condition, 28
percent livable and 5.2 percent dilapidated. From 2001 to 2011 data reveals an increase in good
condition houses (11 percentage points), decrease in livable houses by 8 percent points and
dilapidated by 3 percentage points.
In 2011, out of total houses (7,51,165) belonging to SC only, 45 percent houses were
good condition, 43 livable and 11 percent dilapidated. A comparison with the census 2001, the
good condition houses have increased by 11 percentage points and the reduction of the livable
and dilapidated houses as evident from the declining percentages. The share of good condition
houses among the total houses (136006) belonging to ST’s is only 38 percent much lower than
the total average which is 66 percent in 2011. While the livable houses are 45 percent and
dilapidated houses are 16 percent which is more than three times the average dilapidated houses
in Kerala. There has been increase in the good condition houses among ST households with an
increase of 9 percentage points from Census 2001 to Census 2011 and a similar percentage point
reduction in livable houses in the same time period. Though, the share of dilapidated houses has
reduced (less than one percentage points) from 2001 to 2011 but the absolute number of houses
have shown an increase from 2001 to 2011. The Other group other than SC and ST, the share of
good condition houses are 69 percent, 26 percent livable and 4 percent dilapidated out of total
houses (67,71,514) in Census 2011. While comparing with census 2001 the good condition
houses have increased by 10 percentage points and reduction of livable and dilapidated houses
by 8 percent and 3 percentage points respectively.

27
Table 3.1 Percentage distribution and its change in condition of houses by social
groups between 2001 and 2011
All Population SC
Condition 2011 2001 PPC* 2011 2001 PPC
Good 66.41 55.9 10.51 45.81 34.98 10.83
Livable 28.32 35.92 -7.6 43.07 49.04 -5.97
Dilapidated 5.26 8.17 -2.91 11.12 15.99 -4.87
Total 100 100 100 100
Total Number of Houses 76,58,685 6553765 7,51,165 709143
ST Others
Good 38.38 29.02 9.36 69.26 59.04 10.22
Livable 45.3 53.82 -8.52 26.35 33.94 -7.59
Dilapidated 16.32 17.16 -0.84 4.39 7.02 -2.63
Total 100 100 100 100
Total Number of Houses 136006 116623 6771514 5727999
*PPC stands for percentage point change
Rural urban differences in the housing condition.
In rural areas the percentage share of households with good housing condition in 2011 was 61
percent, livable 33 percent and dilapidated 6 percent. In comparison to 2001 the percentage share
of good condition houses have increased by 9 percentage points, livable houses by 5 percentage
points and dilapidated have decreased by 14 percentage points. Although, in absolute number of
houses have shown negative decadal growth rates from year 2001 to 2011. Among the social
groups; of total (SC) households in rural areas, 42 percent households have good condition
houses followed by livable houses (46 percent) and 12 percent dilapidated in 2011. While
comparing to 2001 the percentage share of good condition houses have increased by 9
percentage points, livable houses and dilapidated decreased by 4 percentage points each.
Similarly ST households 34 percent have good condition houses, 47 percent livable and 18
percent dilapidated houses which is highest among the social groups.

28
Table 3.2 Condition of census houses by sector, social groups and census year (2001 and 2011)
Rural Urban
2011 2001 2011 2001
Census
houses
%
share
Census
houses
%
share PPC
Census
houses
%
share
Census
houses
%
share PPC*
All Population
Good 2482591 61.05 2590507 52.36 8.69 2626904 72.48 851472.8 51.47 21.01
Livable 1322015 32.51 1369466 27.68 4.83 854976.1 23.59 553035.5 33.43 -9.84
Dilapidated 261881.8 6.44 987519.4 19.96 -13.52 142435.6 3.93 249800.7 15.1 -11.17
Total 4066488 100 4947492 100 3624316 100 1654309 100
SC
Good 191941.1 42.21 197085.1 33.56 8.65 152190.2 51.34 50958.45 41.81 9.53
Livable 208720.6 45.9 294688.1 50.18 -4.28 114780 38.72 53042.61 43.52 -4.8
Dilapidated 54067.28 11.89 95488.8 16.26 -4.37 29465.74 9.94 17879.94 14.67 -4.73
Total 454729 100 587262 100 296436 100 121881 100
ST
Good 39684.22 34.32 29111 27.27 7.05 12512.9 61.41 4733.624 47.95 13.46
Livable 55132.38 47.68 58734.4 55.02 -7.34 6479.568 31.8 4038.635 40.91 -9.11
Dilapidated 20813.4 18 18916.28 17.72 0.28 1383.53 6.79 1098.754 11.13 -4.34
Total 115630 100 106751 100 20376 100 9872 100
Others
Good 2272587 64.39 2293901 53.93 10.46 2462767 74.46 789597.5 51.86 22.6
Livable 1067999 30.26 1098674 25.83 4.43 733273.6 22.17 502595.7 33.01 -10.84
Dilapidated 188823.4 5.35 860904.1 20.24 -14.89 111462.9 3.37 230362.7 15.13 -11.76
Total 3529410 100 4253479 100 3307504 100 1522556 100
PPC stands for percentage point change .
The percentage share in good condition houses of schedule tribe (ST) households has
increased by 7 percentage points and the share of livable houses has reduced by 7 percentage
points. Of the total other group houses in rural areas, 64 percent of houses are in good conditions,
30 percent livable houses and only 5 percent dilapidated in 2011. While comparing with 2001,
the percentage share of households belonging to the Other group other than SC and ST has
shown greater improvement in the share of good condition houses (10 percentage points), the
percentage share of livable houses increased by 4 percent and greater reduction in dilapidated
houses by 15 percentage points. From 2001 to 2011, dilapidated houses have recorded the
highest decline recorded the decadal growth rate of 78 percent.

29
In urban areas percentage share of households with good housing condition in 2011 was
72 percent, livable 24 percent and dilapidated 4 percent. In comparison to 2001 the percentage
share of good condition houses has increased by 21 percentage points and absolute number of
houses has increased by the decadal growth rate of 209 percent from 2001 to 2011. Livable
houses and dilapidated have decreased by 9 and 11 percentage points from the same time period.
Among the social groups; SC households in urban areas have, 51 percent households have good
condition houses followed by’32’percent livable houses ’32’ and 10 percent dilapidated. While
comparing to 2001 the percentage share of good condition houses have increased by 10
percentage points, livable houses and dilapidated decreased by 5 and 5 percentage points
respectively. Similarly for ST households 61 percent have good condition houses, 32 percent
livable and 7 percent dilapidated houses in 2011. The percentage share in good condition houses
of ST households has increased by 13 percentage points and the share of livable houses has
reduced by 9 percentage points and dilapidated decreased by 4 percentage points from 2001 to
2011. Though the livable and dilapidated houses have recorded a reduction in the percentage
share but in absolute numbers the households have increased by 60 percent livable houses and 26
percent dilapidated houses from the year 2001 to 2011. The other group household in urban
areas has 74 percent of houses with good conditions, 22 percent livable houses and only 3
percent dilapidated in 2011. While comparing with 2001, the percentage share of households
belonging to Other households other than SC and ST has shown greater improvement in the
share of good condition houses (23 percentage points), the percentage share of livable houses
increased by 12 percent and greater reduction in dilapidated houses by 15 percentage points with
an absolute reduction of number of houses from 2001 to 2011.
Availability of Space: Number of Rooms
The following section presents the distribution of the households by the availability of rooms
across social groups in Kerala. In 2011, 34 percent of the households have four rooms and above,
32 persons have three rooms, 25 percent have two rooms and 8 percent households do not have
exclusive rooms or have only one room. In terms of increase in different categories of dwelling
rooms in Kerala, from 2001 to 2011, there is an increase in one percentage point in four rooms

30
and above, 5 percentage points in three rooms and a reduction of two rooms by 2 percentage
points in two rooms and 4 percent point decrease in no exclusive rooms/one room.
In 2011, out of a total number of 7,51,165 houses belonging to the SC category, 14
percent of the households have four rooms and above, 30 percent have three rooms, 40 percent
have two rooms and 16 percent households do not have have only one room. In terms of increase
in different categories of dwelling rooms in SC households in Kerala, from 2001 to 2011, there is
one percentage point decrease in four rooms and above, 7 percentage points increase in three
rooms, an increase in two rooms by 2 percentage points and a reduction of no exclusive
rooms/one room by 7 percentage points.
31
Table 3.3 Availability of space by social groups and census
year (2001 and 2011) All Population
2011 2001
Number of rooms No. of
houses
% No. of
houses
% PPC
no exclusive
room/ one room 645066 8.36 825121 12.51 -4.15
two rooms 1937119 25.10 1756379 26.63 -1.53
three rooms 2484792 32.20 1801212 27.31 4.89
four rooms and
above 2649393 34.33 2212494 33.55 0.79
Total 7716370 100 6595206 100
SC
2011 2001
no exclusive
room/ one room 122242 16.27 167999 23.69 -7.42
two rooms 298352 39.72 271531 38.29 1.43
three rooms 226857 30.20 166625 23.50 6.70
four rooms and
above 103714 13.81 102988 14.52 -0.72
Total 751165 100 709143 100
ST
no exclusive
room/ one room 29307 21.55 36195 31.04 -9.49
two rooms 48111 35.37 41802 35.84 -0.47
three rooms 36241 26.65 21571 18.50 8.15
four rooms and
above 22347 16.43 17055 14.62 1.81
Total 136006 100 116623 100
Others
no exclusive
room/ one room 493517 7.23 620927 10.76 -3.54
two rooms 1590656 23.29 1443046 25.01 -1.72
three rooms 2221694 32.53 1613016 27.96 4.57
four rooms and
above 2523332 36.95 2092451 36.27 0.68
Total 6829199 100 5769440 100
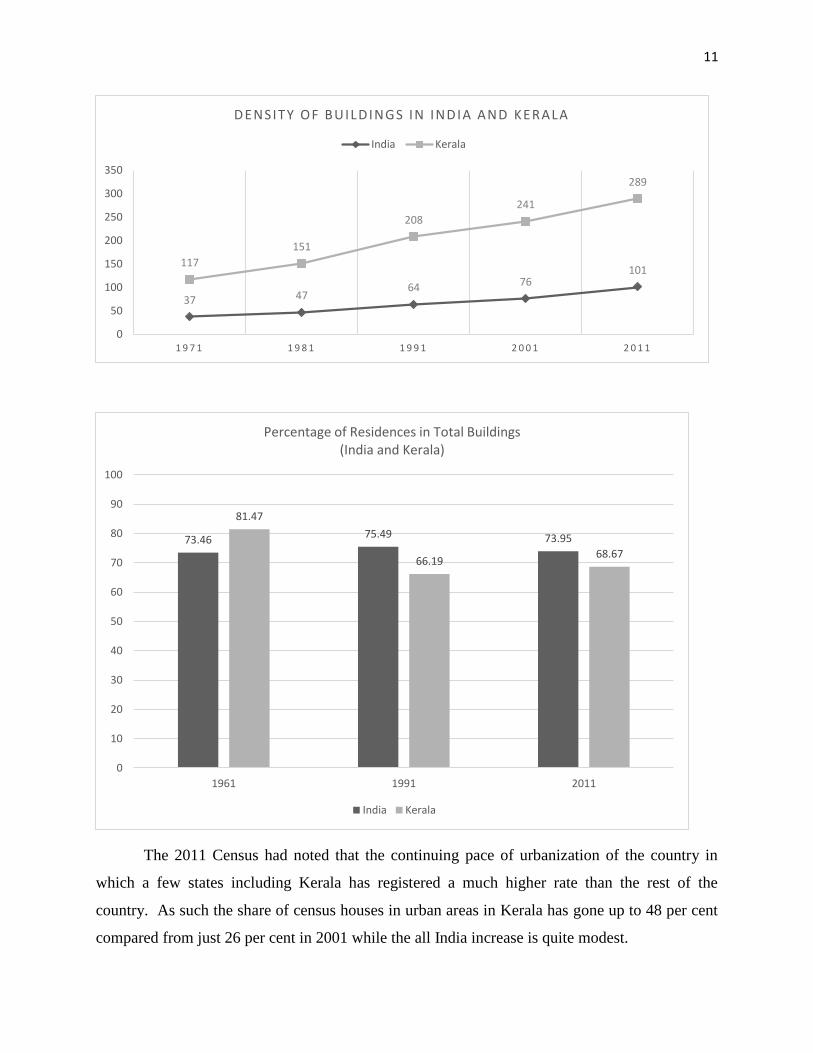
The share of availability of rooms among the total houses (1,36,006) belonging to ST
households, 16 percent of the households have four rooms and above, 27 percent has three
rooms, 35 percent has two rooms and 22 percent households do not have only one room or a few

32
without an exclusive room in 2011. In terms of increase in different categories of dwelling rooms
in ST households in Kerala, from 2001 to 2011, there is 2 percentage point decrease in four
rooms and above, 8 percentage point increase in three rooms, decrease of two rooms by less than
one percentage points and a reduction of 9 percentage points in housing units with one room (or
those without an exclusive room) . The Others group – i.e. other than SC and ST , 37 percent of
households have four rooms and above, 33 percent of households have three rooms, 23 percent
have two rooms and 7 percent do not have exclusive rooms or one room in 2011. In terms of
increase in different categories of dwelling rooms in ST households in Kerala, from 2001 to
2011, there is less than one percentage point increase in four rooms and above, 5 percentage
points increase three rooms, and decrease of two rooms by 2 percentage points and a reduction of
no exclusive rooms/one room by 4 percentage points.
Rural urban differences in the availability of space
In rural areas, 32 percent of the households have four rooms and above, 32 percent have three
rooms, 27 percent have two rooms and 9 percent households do not have exclusive rooms or
have only one room in 2011. In terms of increase in different categories of dwelling rooms in
rural Kerala, from 2001 to 2011, then increase in four rooms and above has remained the same, 5
percentage points in three rooms and a reduction of one percentage points in two rooms and 4
percent point decrease in no exclusive rooms/one room. In 2011, out of total households
belonging to SC in rural areas, 12 percent of the households have four rooms and above, 29
persons have three rooms, 42 percent have two rooms and 17 percent households do not have
exclusive rooms or have only one room. In terms of increase in different categories of dwelling
rooms in SC households in rural areas, from 2001 to 2011, there is one percentage point decrease
in four rooms and above, 6 percentage points increase three rooms, an increase of two rooms by
2 percentage points and a reduction of no exclusive rooms/one room by 7 percentage points. The
share of availability of rooms among the total houses (136006) belonging to ST households in
rural areas, 15 percent of the households have four rooms and above, 26 percent has three rooms,
36 percent has two rooms and 23 percent households do not have exclusive rooms or one room
in 2011. In terms of increase in different categories of dwelling rooms in ST households in rural
areas, from 2001 to 2011, there is one percentage point increase in four rooms and above, 8
percentage point increase in three rooms and a reduction of no exclusive rooms/one room by 9

33
percentage points. The Other group other than SC and ST in rural areas, 35 percent of
households has four rooms and above, 33 percent of households have three rooms, 24 percent
have two rooms and 8 percent do not have exclusive rooms or one room in 2011. In terms of
increase in different categories of dwelling rooms in Other households households in rural areas,
from 2001 to 2011, the percentage share of four rooms and above has remained same, 5
percentage points increase three rooms, and decrease of two rooms by 2 percentage points and a
reduction of no exclusive rooms/one room by 3 percentage points.
In urban areas, 37 percent of the households have four rooms and above, 32 percent have
three rooms, 23 percent have two rooms and 7 percent households do not have exclusive rooms
or have only one room in 2011. In terms of increase in different categories of dwelling rooms in
urban areas, from 2001 to 2011, there increase in four rooms and above has decreased by 2
percentage points and 3 percent point decrease in no exclusive rooms/one room. In 2011, out of
total households belonging to SC in urban areas, 16 percent of the households have four rooms
and above, 32 persons have three rooms, 37 percent have two rooms and 14 percent households
do not have exclusive rooms or have only one room. In terms of increase in different categories
of dwelling rooms in SC households in urban areas, from 2001 to 2011, there is a 3 percentage
point decrease in four rooms and above, 6 percentage points increase three rooms, an increase of
two rooms by 2 percentage points and a reduction of no exclusive rooms/one room by 7
percentage points. The share of availability of rooms among the total houses (1,36,006)
belonging to ST households in urban areas, 26 percent of the households have four rooms and
above, 29 percent has three rooms, 30 percent has two rooms and 15 percent households do not
have exclusive rooms or one room in 2011. In terms of increase in different categories of
dwelling rooms in ST households in urban areas, from 2001 to 2011, there is 2 percentage point
increase in four rooms and above, 6 percentage point increase in three rooms and, a reduction of
two rooms and no exclusive rooms/one room by one percentage point and 6 percentage points
respectively.
The Other groups other than SC and ST in urban areas, 39 percent of households have
four rooms and above, 32 percent of households have three rooms, 22 percent have two rooms
and 7 percent do not have exclusive rooms or one room in 2011. In terms of increase in different

34
categories of dwelling rooms in Other households in urban areas, from 2001 to 2011, there is
significant decline in four rooms and above by one percentage point, 4 percentage points
increase three rooms and a reduction of no exclusive rooms/one room by 3 percentage points.
Table 3.4: Availability of space by sector, social groups and census year (2001 and 2011)
Rural Urban
2011 2001 2011 2001
number of rooms census
houses
% census
houses
% PPC census
houses
% census
houses
% PPC
All Population
no exclusive
room/ one room
384487 9.39 656865 13.29 -3.90 260579 7.20 168406 10.19 -2.99
two rooms 1091934 26.66 1370075 27.72 -1.06 845185 23.34 386226 23.37 -0.03
three rooms 1310280 31.99 1340420 27.12 4.87 1174512 32.44 460760 27.88 4.56
four rooms and
above
1308973 31.96 1575191 31.87 0.09 1340420 37.02 637264 38.56 -1.54
Total 4095674 100 4942550 100 3620696 100 1652656 100
SC
no exclusive
room/ one room
79444 17.47 142304 24.23 -6.76 42798 14.44 25695 21.08 -6.64
two rooms 188882 41.54 230094 39.18 2.36 109470 36.93 41437 34.00 2.93
three rooms 131281 28.87 135192 23.02 5.85 95576 32.24 31433 25.79 6.45
four rooms and
above
55122 12.12 79672 13.57 -1.44 48592 16.39 23316 19.13 -2.74
Total 454729 100 587262 100 296436 100 121881 100
ST
no exclusive
room/ one room
26339 22.78 34145 31.99 -9.21 2968 14.57 2050 20.77 -6.20
two rooms 41947 36.28 38686 36.24 0.04 6164 30.25 3116 31.56 -1.31
three rooms 30317 26.22 19245 18.03 8.19 5924 29.07 2326 23.56 5.51
four rooms and
above
17027 14.73 14675 13.75 0.98 5320 26.11 2380 24.11 2.00
Total 115630 100 106751 100 20376 100 9872 100
Others
no exclusive
room/ one room
278704 7.91 480415.9 11.31 -3.40 214813 6.50 140661 9.25 -2.75
two rooms 861105 24.43 1101295 25.92 -1.50 729551 22.08 341673 22.47 -0.38
three rooms 1148682 32.58 1185983 27.92 4.67 1073012 32.48 427001 28.08 4.40
four rooms and
above
1236824 35.08 1480844 34.86 0.23 1286508 38.94 611568 40.21 -1.27
Total 3525315 100 4248537 100 3303884 100 1520903 100

35
Latrine Facilities
There are different types of latrine facilities within the houses defined by the census. These
include water closet latrines, Pit latrine, other latrine and the houses with no-latrine facility.
Water closet latrines are defined as those latrines which have water closets fitted with flushing
cistern connected to a septic tank or underground sewerage and the faecal matter is removed
without the need of manual scavenging. Pit latrines are attached to the pit that is dug into the
ground for the reception of night soil. And the ‘Other latrines’ include latrines other than water
closet and pit latrine types, and also consist of service latrines serviced by animals such as pigs.
‘Other latrines’ are dry type latrines were human excreta is dried and removed by scavengers.
‘No latrine’ constitutes the houses with no latrine facility of any kind available within the house.
Table 3 presents the data on latrine facilities by social groups in year 2001 and 2011. In 2011 in
Kerala out of total houses, 67 percent had water closet latrine within the house, 28 percent had
pit latrine, less than half percent had ‘other latrine’ type and 5 percent of houses did not have any
kind of latrine within the house. In comparison to census 2001 the houses with water closet
latrines have recorded an increase of 2 percentage points and houses with pit latrines have shown
an increase of 16 percentage points from the year 2001 to year 2011. There has been reduction of
‘other latrines’ by 6 percentage points and houses with no latrines have decreased 11 percentage
points from the same time period.
In 2011 report houses belonging to SC report 50 percent of houses with water closet
latrines, 36 percent reported pit latrines, less than half percent reported other latrines and 14
percent reported no latrines which is more than three times the percentage share at the state level.
As compared to census 2001, the number of houses with water closet latrines has recorded an
increase of 3 percentage points and the houses with ‘pit latrines’ have increased by 20 percentage
points from year 2001 to 2011. While there is a reduction of ‘Other latrines’ and houses with ‘no
latrines’ by 6 percentage points and 17 percentage points, respectively from year 2001 to 2011.
Similarly, in 2011 houses belonging to ST report 45 percent of houses with water closet latrines,
27 percent with pit latrines, less than half percent reported other latrines and 28 percent reported
no latrine which is higher with respect to all other groups. Interestingly, the number of houses
with water closet latrines has almost doubled from 2001 to 2011 with an increase of 17
percentage points. As compared to census 2001, the houses with pit latrines have increased by 7

36
percentage points from 2011. There is a reduction of houses with ‘Other latrines’ and ‘no
latrines’ by 5 percentage points and 18 percentage points, respectively from year 2001 to 2011.
In the ‘Others’ category households, the percentages of houses with water closet latrines
are 69 percent, 28 percent of houses have pit latrine in 2011. In comparison to 2001 the
percentage share in 2011 had remained almost similar with a slight increase of less than one
percentage point from 2001 to 2011. In contrast, the houses with pit latrines had more than
doubled from 2001 to 2011 with an increase of 16 percentage points. In 2011, less than one
percent recorded other latrines and 3 percent of households with no latrines. While comparing
with 2001, the houses with ‘other latrines’ and ‘no latrines’ had reduced by 6 percentage points
and 13 percentage points, respectively from 2001 to 2011.
Table 3.5: Latrine Facilities by social groups and census year (2001 and 2011).
All Population SC
2011 2001 2011 2001
Facilities No. of
houses %
No. of
houses % PPC
No. of
houses %
No. of
houses % PPC
Water
Closet 5146819 66.7 4300074 65.13 1.57 376192 50.08 332859 46.94 3.14
Pit Latrine 2183733 28.3 817806 12.39 15.91 269602 35.89 110941 15.64 20.25
Other
Latrine 15433 0.2 428688 6.49 -6.29 2720 0.36 42863 6.04 -5.68
No Latrine 370386 4.8 1055233 15.98 -11.18 102651 13.67 222480 31.37 -17.7
Total 7716371 100 6601801 100 751165 100 709143 100
ST Others
Water
Closet 60685 44.62 32664 28.01 16.61 4709942 68.97 3934551 68.12 0.85
Pit Latrine 36019 26.48 22877 19.62 6.86 1878112 27.5 683988 11.84 15.66
Other
Latrine 357 0.26 6250 5.36 -5.1 12356 0.18 379575 6.57 -6.39
No Latrine 38945 28.63 54832 47.02 -18.39 228790 3.35 777921 13.47 -10.12
Total 136006 100 116623 100 6829200 100 5776035 100
Rural urban difference in latrine facilities
In rural areas percentage share of households with water closet latrines in 2011 was 59 percent,
pit latrines (34 percent), other latrines (0.2 percent) and no latrines (7 percent). In comparison to

37
2001 the percentage share of water closet latrines has reduced by 3 percentage points, other
latrines by 6 percentage points and increase in the share of pit latrines by 21 percentage points.
The reduction in percentage of houses with water closets is due to the classification of some rural
areas (panchayats) in 2001 as Urban areas is the census of 2011. The share of houses with no
latrines has decreased by 12 percentage points from 2001 to 2011. Among the social groups; of
total Schedule caste (SC) households in rural areas, 44 percent households have water closet
latrines followed by pit latrines (39 percent), no latrines (17 percent) and other latrines which is
less than half percent of the households in 2011. While comparing to 2001 the percentage share
of water closet latrines has slightly reduced by one percentage point, pit latrines has increased by
24 percentage points. The share of households with no latrines has reduced by
17 percentage points and a 6 percentage point decline in ‘other latrines’ from 2001 to
2011. Similarly, of total schedule tribe (ST) households, 40 percent have water closet latrines, 27
percent pit latrines and 33 percent of households do not have latrines within the premises of their
houses in 2011. The percentage share in water closet latrines of schedule tribe (ST) households
has increased by 15 percentage points and the share of pit latrines has increased by 7 percentage
points. There has been reduction of ‘other latrines’ and houses with ‘no latrines’ from year 2001
to 2011. The household with ‘no latrines’ has reduced by 17 percentage points from 2001 to
2011. The number of households with closet latrines in other category households in 2011 is 62
percent and the percentage share has declined by 4 percentage points from 2001 to 2011. The
percentage share of pit latrines has increased by 21 percentage points in rural areas from 12
percent in 2001 to 34 percent in 2011. Meanwhile there is reduction of households with no
latrines by 11 percentage points from 16 percent in 2001 to 5 percent in 2011.
In urban areas percentage share of households with water closet latrines in 2011 was 75
percent, pit latrines (21 percent), other latrines (0.3 percent) and no latrines (3 percent). In
comparison to 2001, the percentage share of water closet latrines has remained more or less the
same. Households with pit latrines are 22 percent, less than half percent use ‘other latrines’ and
only 3 percent of total households do not have latrines in urban areas in 2011. The percentage
share of pit latrines has increased by 11 percentage points and the share of ‘no latrines’ has
decreased by 5 percentage points from the year 2001 to 2011.

38
Table 3.6: Latrine Facilities by sector, social groups and census year (2001 and 2011)
Rural Urban
2011 2001 2011 2001
census
houses %
census
houses % PPC
census
houses %
census
houses % PPC
All Population
Water
Closet 2420543 59.04 3064381 61.94 -2.9 2726384 75.22 1236187 74.73 0.49
Pit Latrine 1392529 33.97 632646 12.79 21.18 792932 21.88 183445 11.09 10.79
Other
Latrine 8191 0.2 326208 6.59 -6.39 10862 0.3 102465 6.19 -5.89
No Latrine 278506 6.79 924257 18.68 -11.89 94138 2.6 132212 7.99 -5.39
Total 4099769 100 4947492 100 3624316 100 1654309 100
SC
Water
Closet 201600 44.33 265902 45.28 -0.95 174592 58.9 66957 54.94 3.96
Pit Latrine 175914 38.69 88697 15.1 23.59 93688 31.6 22244 18.25 13.35
Other
Latrine 1380 0.3 35231 6 -5.7 1340 0.45 7632 6.26 -5.81
No Latrine 75835 16.68 197432 33.62 -16.94 26816 9.05 25048 20.55 -11.5
Total 454729 100 587262 100 296436 100 121881 100
ST
Water
Closet 46017 39.8 26872 25.17 14.63 14668 71.99 5792 58.67 13.32
Pit Latrine 31617 27.34 21266 19.92 7.42 4402 21.6 1611 16.32 5.28
Other
Latrine 283 0.24 5213 4.88 -4.64 74.0 0.36 1037 10.5
-
10.14
No Latrine 37713 32.62 53400 50.02 -17.4 1232 6.05 1432 14.51 -8.46
Total 115630 100 106751 100 20376 100 9872 100
Others
Water
Closet 2172926 61.57 2771607 65.16 -3.59 2537124 76.71 1163438 76.41 0.3
Pit Latrine 1184998 33.57 522683 12.29 21.28 694842 21.01 159590 10.48 10.53
Other
Latrine 6528 0.18 285764 6.72 -6.54 9448 0.29 93796 6.16 -5.87
No Latrine 164958 4.67 673425 15.83 -11.16 66090 2 105732 6.94 -4.94
Total 3529410 100 4253479 100 3307504 100 1522556 100
Among the social groups; of the total SC households in rural areas, 59 percent
households have water closet latrines followed by pit latrines (31 percent), no latrines (9 percent)

39
and ‘other latrines’ which is less than half percent of the households in 2011. While comparing
to 2001 the percentage share of water closet latrines has increased by 4 percentage points, pit
latrines has increased by 13 percentage points. The share of households with no latrines has
reduced by 12 percentage points but in absolute terms the number of households having no
latrines have recorded a decadal growth rate of 7 percent from 2001 to 2011. Similarly, of the
total ST households, 72 percent have water closet latrines, 22 percent have pit latrines and 6
percent of households do not have latrines within the premises of their houses in 2011. The
percentage share in water closet latrines of ST households has decreased by 13 percentage points
and the share of pit latrines has decreased by 5 percentage points and the reduction of other
latrines by 10 percentage points from year 2001 to 2011. The household with no latrines has
reduced by 8 percentage points from 2001 to 2011. The number of households with water closet
latrines in other category households in 2011 was 77 percent and the percentage share has
remained same but in absolute terms the total number of houses with water closet latrines has
increased by 118 percent from 2001 to 2011. The percentage share of pit latrines has increased
by 11 percentage points from 10 percent in 2001 to 21 percent in 2011 with a decadal growth
rate of 335 percent in the same time period. Moreover there is reduction of households with no
latrines by 5 percentage points from 7 percent in 2001 to 2 percent in 2011.
Source of Drinking Water
The present section will examine the main sources of drinking water available to the households
in Kerala across social groups during 2001 and 2011. Well water is the major source of drinking
water in Kerala which accounts for 62 percent of total households followed by tap water (29
percent); though the share of well water as a source of drinking water has reduced by 10
percentage points from 2001 to 2011. In contrast, the share of tap water as a source of drinking
water has increased by 9 percentage points from 2001 to 2011. Hand pump is used by 4 percent
of households and the remaining 4 percent use ‘Other sources’ as a source of drinking water in
2011. In comparison to 2001, the percentage share of hand pump increased by 1 percentage point
and slight reduction of percentage share of ‘Other sources’.
In 2011, of the total SC households, 57 percent use well water, 38 percent use tap water,
2 percent use hand pump and 3 percent use ‘Other sources’ as the main source of drinking water.

40
The use of well water has reduced by 13 percentage points and tap water as a source of drinking
water has increased by 13 percentage points from census year 2001 to year 2011. Similarly, of
the total ST households, 50 percent use well water as the main source of drinking water followed
by hand pump (22 percent), tap water (16 percent) and ‘Other sources’ (3 percent) in 2011.
While comparing with 2001, the share of households using well water has reduced by 6
percentage points, hand pump by 3 percentage points and ‘Other sources' by a slightly positive
change in percentage share. It is the tap water as a source that has increased by 9 percentage
points from year 2001 to 2011.
For the Other households other than SC and ST in Kerala, 63 percent use well water, 29
percent use tap water, 4 percent use hand pump and another 4 percent use ‘Other sources’ as a
source of drinking water in 2011. While comparing with 2001, tap water had gained significance
as a source of drinking water with an increase of 9 percentage points and the well water had
shown a reduction of 10 percentage points.
Table 3.7: sources of drinking water by social groups and census year (2001 and 2011).
All Population SC
2011 2001 2011 2001
Sources No. of
houses %
No. of
houses % PPC
No. of
houses %
No. of
houses % PPC
Tap 2260896 29.33 1345422 20.38 8.95 271625 37.92 170153 25.34 12.58
Well 4784149 62.06 4741953 71.83 -9.77 408960 57.09 470353 70.04 -12.95
Hand
pump 324088 4.2 197856 3.0 1.2 5220 0.73 11106 1.65 -0.92
Other
Sources 339520 4.4 316570 4.8 -0.4 30524 4.26 19941 2.97 1.29
Total 7708653 100 6601801 100 716329 100 671553 100
ST Others
Tap 33528 24.75 18315 15.91 8.84 1955743 28.52 1156954 19.9 28.52
Well 68193 50.33 65226 56.65 -6.32 4306996 62.81 4206374 72.34 62.81
Hand
pump 29329 21.65 28318 24.6 -2.95 289539 4.22 158432 2.72 4.22
Other
Sources 4433 3.27 3275 2.84 0.43 304563 4.44 293354 5.04 4.44
Total 135483 100 115134 100 6856841 100 5815114 100

41
Rural urban difference in sources of drinking water
In rural areas percentage share of households with tap water as a source of drinking water in
2011 was 27 percent, well water (70 percent) which is the major source of drinking water in
Kerala. Hand pump and other sources together has been reported as the main source of drinking
water by 3 percent of the household in 2011. The percentage share of tap water has increased by
12 percentage points and well water as the source has reduced by 12 percentage points from
2001 to 2011. Among the social groups; of the total SC households in rural areas, 59 percent use
well water followed by tap water (35 percent), 5 percent use other sources and only half a
percent use hand pump as a source of drinking water in 2011. While comparing with 2001 the
percentage share of tap water has increased by 14 percentage point with a similar decline of well
water as a source of drinking water. For ST households in rural areas, well water (50 percent) is
the major source of drinking water, followed by hand pump (25 percent) and tap water (22
percent) in 2011. The percentage share of tap water of ST households has increased by 9
percentage points and the share of well water and hand pump has decreased by 7 percentage
points and 2 percentage points respectively from 2001 to 2011. For Other category households
in rural areas, well water (72 percent) is the major source of drinking water followed by tap
water (26 percent) in year 2011. The rest have reported hand pump (0.46 percent) and other
sources (3 percent) as the main source of drinking water in 2011. While comparing with 2001,
the percentage share of tap water has increased by 12 percentage points and a reduction of well
water by 13 percentage points as a source of drinking water in rural areas.
In urban areas percentage share of households with tap water as the main source of
drinking water is well water (61 percent) followed by tap water(36 percent) in 2011. Hand pump
and other sources together has been reported as the main source of drinking water by 3 percent of
the household in 2011. The percentage share of tap water has decreased by 4 percentage points
and well water as the source has increased by 4 percentage points from 2001 to 2011. Among the
social groups; of total SC households in urban areas, 54 percent of use well water followed by
tap water (43 percent) and rest 3 percent use other sources and hand pump together as a source of
drinking water in 2011.

42
Table 3.8: sources of drinking water by sector, social groups and census year (2001 and 2011)
Rural Urban
2011 2001 2011 2001
sources No. of
houses %
No. of
houses % PPC
No. of
houses %
No. of
houses % PPC
All Population
Tap 1003440 26.52 647474 14.06 12.46 1263623 36.43 659410 40.8 -4.37
Well 2653997 70.13 3815649 82.83 -12.7 2132590 61.48 925487 57.26 4.22
Hand
pump 16383 0.43 54368 1.18 -0.75 21724 0.63 16527 1.02 -0.39
Other
Sources 110583 2.92 88966 1.93 0.99 50690 1.46 14874 0.92 0.54
Total 3784403 100 4606457 100 3468627 100 1616298 100
SC
Tap water 149227 34.81 116821 21.16 13.65 122398 42.55 53332 44.66 -2.11
Well
water 254511 59.38 407792 73.86 -14.48 154449 53.69 62561 52.39 1.3
Hand
pump 2814 0.66 9578 1.73 -1.07 2406 0.84 1528 1.28 -0.44
Other
sources 22087 5.15 17945 3.25 1.9 8437 2.93 1996 1.67 1.26
Total 428639 100 552136 100 287690 100 119417 100
ST
Tap water 25147 21.82 13681 12.98 8.84 8381 41.44 4634 47.75 -6.31
Well
water 57762 50.11 60573 57.45 -7.34 10431 51.58 4653 47.95 3.63
Hand
pump 28343 24.59 28015 26.57 -1.98 986 4.88 303 3.12 1.76
Other
sources 4009 3.48 3161 3 0.48 424 2.1 114 1.17 0.93
Total 115261 100 105430 100 20222 100 9704 100
Others
Tap water 829066 25.58 516972 13.09 12.49 1132844 35.84 601444 40.44 -4.6
Well
water 2341724 72.26 3347284 84.77 -12.51 1967710 62.26 858273 57.71 4.55
Hand
pump 14774 0.46 16775 0.42 0.04 18332 0.58 14696 0.99 -0.41
Other
sources 84487 2.61 67860 1.72 0.89 41829 1.32 12764 0.86 0.46
Total 3240503 100 3948891 100 3160715 100 1487177 100
While comparing with 2001 the percentage share of tap water has decreased by 2
percentage point with an increase of use of well water by 1 percent as a source of drinking water.

43
For ST households in urban areas, well water (52 percent) is the major source of drinking water,
followed by hand pump (41 percent), tap water (5 percent) and other sources (2 percent) in 2011.
The percentage share of tap water of ST households has decreased by 6 percentage points and the
share of well water and hand pump has increased by 4 percentage points and 2 percentage points
respectively from 2001 to 2011. For Other category households in urban areas, the major source
of drinking water is well water (62 percent) followed by tap water (35 percent) in year 2011.
The rest have reported hand pump (0.58 percent) and other sources (1 percent) as a source of
drinking water in 2011. While comparing with 2001, the percentage share of tap water has
decreased by 4 percentage points and well water increased of by 5 percentage points as a source
of drinking water in urban areas.
Availability of Separate Kitchen
The following section presents the distribution of the households by the availability of
separate kitchen across social groups in Kerala. In 2011, 97 percent of the households have a
separate kitchen that increased by 4 percentage points from 2001 to 2011. Among the social
groups in 2011, 93 percent of SC households, 90 percent of ST households and 97 percent
‘Other’ households have separate kitchen. In terms of increase in households with separate
kitchen in Kerala, from 2001 to 2011, there is 9 percentage point increase in SC households, 7
percentage points increase in ST households and an increase of 3 percentage points in other
households.
Table 3.9: availability of separate kitchen by social groups and census year (2001 and 2011)
Separate
kitchen
All Population SC
2011 2001 2011 2001
No. of
houses
% No. of
houses
% PPC No. of
houses
% No. of
houses
% PPC
Yes 7463375 96.72 6118547 92.77 3.95 699979 93.19 599431 84.53 8.66
Total
households
7716370 100 6595206 100 751165 100 709143 100
ST Others
Yes
121817
89.57 96450 82.7 6.86 6641579 97.25 5422666 93.99 3.26
Total
households
136006 100 116623 100 6829199 100 5769440 100

44
Rural urban differences in the availability of separate kitchen
In rural areas in 2011, 96 percent of the households have separate which has increased by 4
percentage points by 2011. Among the social groups in 2011, 93 percent of SC households, 88
percent of ST households and 96 percent ‘Other’ households have separate kitchen. In terms of
increase in households with separate kitchen in rural areas, from 2001 to 2011, there is 9
percentage point increase in SC households, 6 percentage points increase in ST households and
an increase of 3 percentage points in other households.
In urban areas in 2011, 98 percent of the households have separate kitchen that increased
by 3 percentage points from 2001 to 2011. Among the social groups in 2011, 92 percent of SC
households, 96 percent of ST households and 98 percent ‘Other’ households have separate
kitchen. In terms of increase in households with separate kitchen in urban areas, from 2001 to
2011, there is 3 percentage point increase in SC households, 8 percentage points increase in ST
households and an increase of 2 percentage points in other households.
Table 3.10: availability of separate kitchen by sector, social groups and census year (2001 and 2011)
Rural Urban
2011 2001 2011 2001
No. of
houses
% No. of
houses
% PPC No. of
houses
% No. of
houses
% PPC
Availability of
separate kitchen
3912037 95.52 4542383 91.90 3.61 3551338 98.08 1576164 95.37 2.71
Total 4095674 100 4942550 100 3620696 100 1652656 100
SC
Availability of
separate kitchen
699979 93.19 599431 84.53 8.66 418258 91.98 491925 83.77 8.21
Total 454729 100 587262 100 454729 100 587262 100
ST
Availability of
separate kitchen
102249 88.43 87643 82.10 6.33
19568
96.03 8,807 89.21 6.82
Total 115630 100 106751 100
20376
100 9872 100
Others
Availability of
separate kitchen
3391530 96.21 3962815 93.27 2.93
3250049
98.37 1459851 95.99 2.38
Total 4248537 100
3525315
100 1520903 3303884 100

45
In rural areas in 2011, 96 percent of the households have separate kitchen that increased
by 4 percentage points from 2001 to 2011. Among the social groups in 2011, 93 percent of SC
households, 88 percent of ST households and 96 percent ‘Other’ households have separate
kitchen. In terms of increase in households with separate kitchen in rural areas, from 2001 to
2011, there is 9 percentage point increase in SC households, 6 percentage points increase in ST
households and an increase of 3 percentage points in other households.
In urban areas in 2011, 98 percent of the households have separate kitchen that increased
by 3 percentage points from 2001 to 2011. Among the social groups in 2011, 92 percent of SC
households, 96 percent of ST households and 98 percent ‘other’ households have separate
kitchen. In terms of increase in households with separate kitchen in urban areas, from 2001 to
2011, there is 3 percentage point increase in SC households, 8 percentage points increase in ST
households and an increase of 2 percentage points in other households.
Sources of Lighting
The source of lighting which was used for the major part of the preceding year was recorded by
Census. The main source of lighting is categorized as electricity, kerosene and ‘other sources’.
In 2011, 94 percent of the total households in Kerala used electricity as the main source
of lighting followed by kerosene (5 percent) and rest less than one percent by other sources.
There has been significant change since 2001 where electricity has replaced kerosene as the main
source of lighting, which has reduced by 24 percentage points from 2001 to 2011 and the similar
percentage point increase in the usage of electricity as the main source of lighting. The
percentage of households with kerosene as the main source of lighting has decreased by 24
percentage points and ‘other sources’ have also declined slightly from 2001 to 2011.
For SC households, 86 percent use electricity and 13 percent use kerosene as the main
source of lighting in 2011. As compared to 2001 electricity has increased by 33 percentage
points with a corresponding decline in the usage of kerosene by 34 percentage points. The
percentage share of ST households with electricity as the main source of lighting is much lower
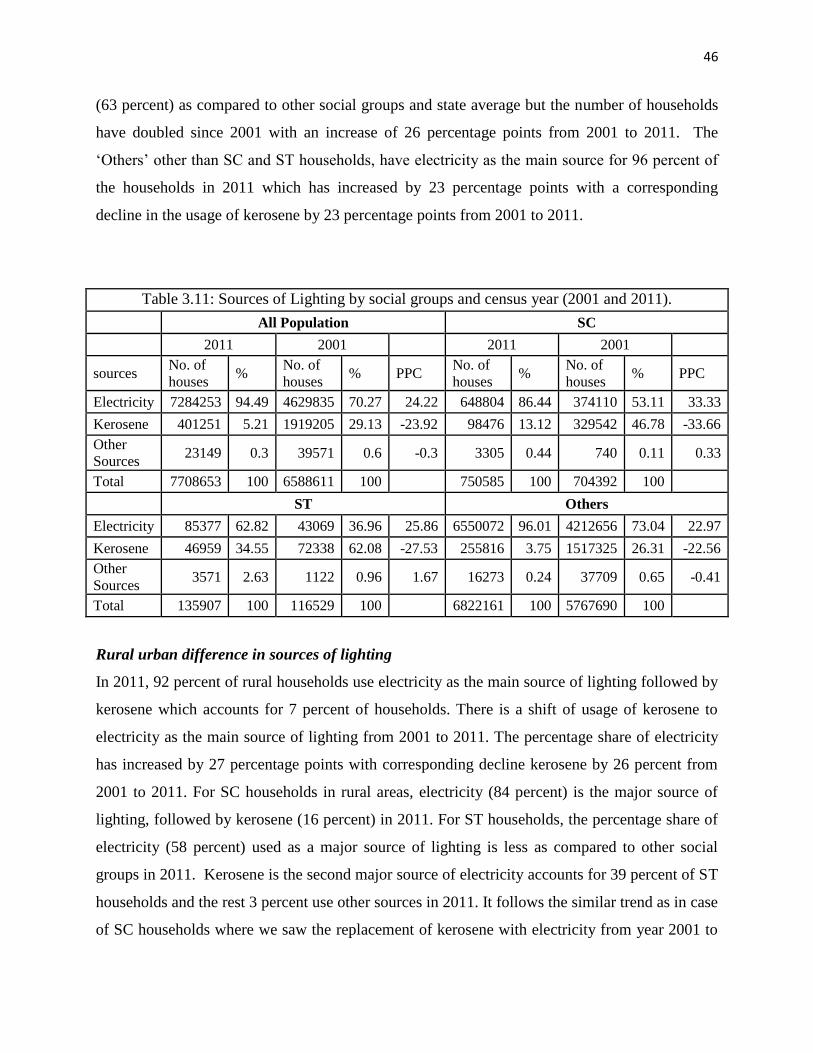
46
(63 percent) as compared to other social groups and state average but the number of households
have doubled since 2001 with an increase of 26 percentage points from 2001 to 2011. The
‘Others’ other than SC and ST households, have electricity as the main source for 96 percent of
the households in 2011 which has increased by 23 percentage points with a corresponding
decline in the usage of kerosene by 23 percentage points from 2001 to 2011.
Table 3.11: Sources of Lighting by social groups and census year (2001 and 2011).
All Population SC
2011 2001 2011 2001
sources No. of
houses %
No. of
houses % PPC
No. of
houses %
No. of
houses % PPC
Electricity 7284253 94.49 4629835 70.27 24.22 648804 86.44 374110 53.11 33.33
Kerosene 401251 5.21 1919205 29.13 -23.92 98476 13.12 329542 46.78 -33.66
Other
Sources 23149 0.3 39571 0.6 -0.3 3305 0.44 740 0.11 0.33
Total 7708653 100 6588611 100 750585 100 704392 100
ST Others
Electricity 85377 62.82 43069 36.96 25.86 6550072 96.01 4212656 73.04 22.97
Kerosene 46959 34.55 72338 62.08 -27.53 255816 3.75 1517325 26.31 -22.56
Other
Sources 3571 2.63 1122 0.96 1.67 16273 0.24 37709 0.65 -0.41
Total 135907 100 116529 100 6822161 100 5767690 100
Rural urban difference in sources of lighting
In 2011, 92 percent of rural households use electricity as the main source of lighting followed by
kerosene which accounts for 7 percent of households. There is a shift of usage of kerosene to
electricity as the main source of lighting from 2001 to 2011. The percentage share of electricity
has increased by 27 percentage points with corresponding decline kerosene by 26 percent from
2001 to 2011. For SC households in rural areas, electricity (84 percent) is the major source of
lighting, followed by kerosene (16 percent) in 2011. For ST households, the percentage share of
electricity (58 percent) used as a major source of lighting is less as compared to other social
groups in 2011. Kerosene is the second major source of electricity accounts for 39 percent of ST
households and the rest 3 percent use other sources in 2011. It follows the similar trend as in case
of SC households where we saw the replacement of kerosene with electricity from year 2001 to

47
2011 as a source of lighting in rural areas. For other category households in rural areas, the
major source of lighting is electricity (94 percent) followed by kerosene (5 percent) in year 2011.
While comparing with 2001, the percentage share of electricity has increased by 26 percentage
points and a reduction of kerosene by 31 percentage points as a source of lighting in rural areas.
Table 3.12: Sources of Lighting by sector, social groups and census year (2001 and 2011)
Rural Urban
2011 2001 2011 2001
sources No. of
houses %
No. of
houses % PPC
No. of
houses %
No. of
houses % PPC
All Population
Electricity 3772116 92.1 3237370 65.5 26.6 3512075 97.19 1393189 84.38 12.81
Kerosene 303080 7.4 1670582 33.8 -26.4 101379 2.81 249551 15.12 -12.31
Other
Sources 20478 0.5 34598 0.7 -0.2 0.0 0.0 8263 0.5 -0.5
Total 4095674 100 4942550 100 3613454 100 1651003 100
SC
Electricity 380851 83.82 292287 50.1 33.72 267953 90.46 81823 67.62 22.84
Kerosene 71160 15.66 290546 49.8 -34.14 27316 9.22 38996 32.23 -23.01
Other
Sources 2350 0.52 549 0.09 0.43 955 0.32 191 0.16 0.16
Total 454361 100 583382 100 296224 100 121010 100
ST
Electricity 66857 57.86 35960 33.71 24.15 18520 90.97 7109 72.06 18.91
Kerosene 45218 39.13 69694 65.34 -26.21 1741 8.55 2644 26.8 -18.25
Other
Sources 3473 3.01 1009 0.95 2.06 98 0.48 113 1.15 -0.67
Total 115548 100 106663 100 20359 100 9866 100
Others
Electricity 3324408 94.29 2909123 68.41 25.88 3225602 97.84 1304257 85.8 12.04
Kerosene 186702 5.3 1310342 30.81 -25.51 72322 2.19 207911 13.68 -11.49
Other
Sources 14655 0.42 33040 0.78 -0.36 -1053 -0.03 7959 0.52 -0.55
Total 3525765 100 4252505 100 3296871 100 1520127 100
For urban households in 2011, 97 percent use electricity as the main source of lighting
followed by kerosene which accounts for 3 percent of households. The percentage share of

48
electricity has increased by 13 percentage points with corresponding decline kerosene by 12
percent from 2001 to 2011. For SC households in urban areas, electricity (90 percent) is the
major source of lighting, followed by kerosene (9 percent) in 2011. The percentage share of
electricity has increased by 13 percentage points and 12 percentage point reduction in the usage
of kerosene as the main source of lighting from 2001 to 2011. Similarly for ST households in
urban areas electricity (91 percent) is the major source and 9 percent households use kerosene as
the main source of lighting in 2011. In comparison with 2001, electricity increases by 19
percentage points and a reduction of 18 percentage points. For other category households in
urban areas, the major source of lighting is electricity (97 percent) followed by kerosene (2
percent) in year 2011. While comparing with 2001, the percentage share of electricity has
increased by 12 percentage points and a reduction of kerosene by 11 percentage points as a
source of lighting in urban areas.
Type of cooking energy
This section provides an overview of the households classified by different types of cooking
energy used in Kerala across social groups in census year 2001 and 2011. The different type of
cooking energy is defined by census the keeping in mind the mostly used fuel in the household.
In case of multiple sources of fuel used for cooking, the predominant one was recorded. The fuel
was categorized as firewood, crop residue, kerosene and LPG/PNG. In 2011, 63 percent of total
households in Kerala used firewood as the main source of cooking energy followed by
LPG/PNG (36 percent) both of these taken together account for 99 percent of fuel used for
cooking and the rest one percent includes crop residue and kerosene. The number of households
using LPG/PNG has more than doubled since 2001 reporting an increase of 18 percentage points
from 2001 to 2011 while firewood has reduced as a source with a decline of 16 percentage points
from the same time period.
For SC households in 2011, firewood is the main source of cooking energy which
accounts for 83 percent of total households followed by LPG/PNG (15 percent) and rest two
percent households use kerosene and crop residue as a source of cooking energy. While
comparing with year 2001, firewood as a source of energy has declined by 9 percentage points

49
from 2001 to 2011. LPG/PNG seems to be substituting firewood as a source of cooking energy
which has increased by 11 percentage points in the same time period.
For ST households in 2011, firewood is the main source cooking energy which accounts
for 88 percent of total households followed by LPG/PNG (10 percent) and rest more than one
percent of households use kerosene and crop residue as a source of cooking energy. While
comparing with year 2001, firewood as a source of energy has declined by 4 percentage points
from 2001 to 2011. Similar to that of SC households, ST households seem to be substituting
LPG/PNG to firewood as a source of cooking energy which has increased by 6 percentage points
in the same time period. For ‘Others’ other than SC and ST households , 59 percent of
households use firewood as a source of cooking energy followed by LPG/PNG (39 percent) in
2011. In comparison to 2001 firewood as a source of cooking has reduced by 17 percentage
points and a corresponding increase in the usage of LPG/PNG as a source of cooking fuel with
an increase of 19 percentage points.
Table 3.13: Type of cooking energy by social groups and census year (2001 and 2011)
All Population SC
2011 2001 2011 2001
No. of
houses %
No. of
houses % PPC
No. of
houses %
No. of
houses % PPC
Firewood 4777867 62.6 5107552 78.49 -15.89 619231 83.07 647520 92 -8.93
Crop
Residue 61816 0.81 116947 1.8 -0.99 8837 1.19 18408 2.62 -1.43
Kerosene 27346 0.36 113890 1.75 -1.39 2568 0.34 7482 1.06 -0.72
LPG/PNG 2765913 36.24 1168536 17.96 18.28 114809 15.4 30428 4.32 11.08
Total 7632942 100 6506925 100 745445 100 703838 100
ST Others
Firewood 119155 88.38 106806 92.28 -3.9 4039481 59.82 4353226 76.54 -16.72
Crop
Residue 1478 1.1 3139 2.71 -1.61 51501 0.76 95400 1.68 -0.92
Kerosene 297 0.22 977 0.84 -0.62 24481 0.36 105431 1.85 -1.49
LPG/PNG 13892 10.3 4821 4.17 6.13 2637212 39.05 1133287 19.93 19.12
Total 134822 100 115743 100 6752675 100 5687344 100

50
Rural urban difference in the types of cooking energy
In rural areas, 74 percent of households use firewood and 25 percent of households use
LPG/PNG as the source of fuel for cooking in 2011. Crop residue and kerosene constitute
together 1 percent of the households in rural areas. The percentage share of firewood has reduced
by 11 percentage points and LPG/PNG as the source has increased by 13 percentage points from
2001 to 2011. Among the social groups, SC households in rural areas, 90 percent of them use
firewood followed by LPG/PNG (9 percent) and more than one percent use crop residue and
kerosene together as a source of cooking in 2011. While comparing with 2001, the percentage
share of firewood has decreased by 5 percentage point and a 6 percentage point increase in
LPG/PNG. For ST households in rural areas, firewood (94 percent) is the major source of
cooking energy, followed by LPG/PNG (5 percent) and other sources such as kerosene and crop
residue is used by 1 percent of households 2011. The percentage share of firewood has reduced
slightly by 1 percentage point and 2 percentage point increase in the usage of LPG/PNG from
2001 to 2011. For Other category households in rural areas, the firewood constitutes the main
source of energy which caters to 71 percent of the households and LPG/PNG is the main source
of cooking energy to 28 percent of the households in 2011. While comparing with 2001, the
percentage share of firewood has decreased by 12 percentage points and an increase in
LPG/PNG by 14 percentage points as a source of cooking energy in rural areas.
In urban areas 50 percent of households use firewood and 49 percent of households use
LPG/PNG as the source of fuel for cooking in 2011. Crop residue and kerosene constitute
together 1 percent of the households in urban areas. The percentage share of firewood has
reduced by 9 percentage points and LPG/PNG as the source has increased by 13 percentage
points from 2001 to 2011. Among the social groups, SC households in urban areas, 73 percent of
them use firewood followed by LPG/PNG (25 percent) and more than one percent use crop
residue and kerosene together as a source of cooking in 2011. While comparing with 2001, the
percentage share of firewood has decreased by 9 percentage point and 13 percentage point
increase in LPG/PNG. For ST households in urban areas, firewood (48 percent) is the major
source of cooking energy, followed by LPG/PNG (41 percent) and other sources such as
kerosene and crop residue is used by 2 percent of households 2011. The percentage share of
firewood has reduced by 8 percentage point and 15 percentage point increase in the usage of

51
LPG/PNG from 2001 to 2011. For Other category households in urban areas, the LPG/PNG
constitutes the major source of cooking energy which caters to 51 percent of the households
followed by firewood (48 percent) percent of the households in 2011. While comparing with
2001, the percentage share of firewood has decreased by 9 percentage points and an increase in
LPG/PNG by 13 percentage points as a source of cooking energy in urban areas.
Table 3.14: Type of cooking energy by sector, social groups and census year (2001 and 2011)
Rural Urban
2011 2001 2011 2001
sources No. of
houses %
No. of
houses % PPC
No. of
houses %
No. of
houses % PPC
All Population
Firewood 2990953 73.84 4153466 85.09 -11.25 1786914 49.88 954086 58.68 -8.8
Crop
Residue 37732 0.93 91654 1.88 -0.95 24084 0.67 25293 1.56 -0.89
Kerosene 8486 0.21 46828 0.96 -0.75 18860 0.53 67062 4.12 -3.59
LPG/PNG 1013198 25.01 589189 12.07 12.94 1752715 48.92 579347 35.63 13.29
Total 4050369 100 4881137 100 3582573 100 1625788 100
SC
Fire-wood 404375 89.52 548764 94.09 -4.57 214856 73.15 98756 81.89 -8.74
Crop
residue 5879 1.3 15438 2.65 -1.35 2958 1.01 2970 2.46 -1.45
Kerosene 800 0.18 2917 0.5 -0.32 1768 0.6 4565 3.79 -3.19
LPG/PNG 40671 9 16122 2.76 6.24 74138 25.24 14306 11.86 13.38
Total 451725 100 583241 100 293720 100 120597 100
ST
Fire-wood 107685 93.81 100534 94.77 -0.96 11470 57.27 6272 64.91 -7.64
Crop
residue 1197 1.04 2808 2.65 -1.61 281 1.4 331 3.43 -2.03
Kerosene 138 0.12 363 0.34 -0.22 159 0.79 614 6.35 -5.56
LPG/PNG 5775 5.03 2375 2.24 2.79 8117 40.53 2446 25.31 15.22
Total 114795 100 106080 100 20027 100 9663 100
Others
Fire-wood 2478893 71.15 3504168 83.6 -12.45 1560588 47.74 849058 56.77 -9.03
Crop
residue 30656 0.88 73408 1.75 -0.87 20845 0.64 21992 1.47 -0.83
Kerosene 7548 0.22 43548 1.04 -0.82 16933 0.52 61883 4.14 -3.62
LPG/PNG 966752 27.75 570692 13.61 14.14 1670460 51.1 562595 37.62 13.48
Total 3483849 100 4191816 100 3268826 100 1495528 100

52
3.3 Attainment rate
It is widely accepted that SC’s and ST’s lag behind in many developmental indicators with
respect to the general population at the national level. The present section attempts to examine if
the gap between SC/ST and Other population in case of housing conditions and amenities in
Kerala. To understand the status of SC/ST households with respect to other households in case of
housing conditions and amenities, we constructed an attainment rate index of different indicators
of housing conditions and amenities of the best outcomes. To construct the index we used the
following formula;
𝐴𝑇𝑅 = {𝑔𝑟(𝑥)
𝑔𝑟(𝑦)} ∗ 100
ATR is the attainment rate which measures the gap of incidence in different indicators
between SC or ST households with respect to other households other than SC and ST, gr(x) is the
percentage share of SC/ST households in different housing condition and amenity indicators,
gr(y) is the percentage share of referral group (other households) in different housing condition
and amenity indicators. Attainment rate ranges from zero to 100 where zero means complete
inequality and 100 means complete equality between the socially disadvantageous groups to that
of other households. In other words, it means that the SC’s and ST’s share of houses in best
outcomes in different indicators is same to the share other population in the best outcomes in
different housing indicators is completely equal. Attainment rate calculated only in best housing
indicators. We have calculated attainment rate separately for rural and urban areas for the census
year 2001 and 2011.
Table 3.15 presents the attainment rate of SC population for both in rural and urban areas
for year 2001 and 2011. In 2011 the attainment rate of SC households in good condition houses
is 66 percent which means that the share of SC population having good conditions houses is only
sixty percent to that of share of other households having the same housing conditions. The gap
between SC and other groups seem to have reduced from 2001 with the increase in the
attainment rate by 7 percentage points. There does not seem to have a rural and urban difference
in the gap between the SC households and Other households in 2011. But with respect to urban
areas the attainment rate has reduced from 2001 to 2011, which implies that the growth rate of

53
good conditions houses has been faster among other households than SC households in the same
time period. The attainment rate of SC households with respect to the availability of space
(measured by having four rooms and above) seem to have improved from 2001 to 2011 with a
smaller difference between rural and urban areas. In case of latrine facilities we have taken the
water closet latrines as the best indicator to compare between SC and Other households. The data
reveals that the attainment rate in 2011 is 73 percent which has increased from the year 2001 by
4 percentage points. The attainment rate remains more or less similar across rural and urban
areas and has shown improvement over the year 2001.
To calculate the attainment rate of sources of drinking water by SC households with
respect to the referral group i.e. Other group, we have taken Tap water and well water as the best
outcomes. Among SC households both in rural and urban areas the attainment rate is more than
hundred percent which implies that the share of households using tap water as the main source
of drinking water among SC in 2011 is higher than the share of households among Other
households. The difference remains same across rural and urban areas. The attainment rate is
increased overall from 2001 to 2011 but rural urban differences exist. In rural areas the
attainment rate has decreased by 26 percentage points and had increased in urban areas by 8
percentage points from 2001 to 2011. The attainment rate of Well water in 2011 is 90 percent in
general and 82 percent in rural and 86 percent in urban areas. The attainment rate is closer to
hundred which indicates that there is less gap between the share SC households using well water
as a main source of drinking water to that of the share of Other households using the same.
While comparing the attainment rate in case of usage of well water with 2001, the attainment
rate has decreased not only in general but also in rural and urban areas. The availability of
Kitchen seem to be same as between SC households and Other households in 2001 as the
attainment rate is more than 95 percent both in rural and urban areas.
The attainment rate in electricity as the main source of lighting generally reflects the
outreach of electrification in SC households with respect to Other households in Kerala. The
attainment rate of SC households in case of electricity is 90 percent in general, 89 percent in
rural areas and 92 percent in urban areas. The attainment rate is closer to hundred and does not
have a significant difference between rural and urban areas. The attainment rate has increased by

54
17 percentage points in general, 16 percentage point increase in rural areas and 14 percentage
point increase in urban areas from 2001 to 2011.
The LPG/PNG as the best indicator of the cooking energy has the lowest attainment
among all indicators. In 2011, the attainment rate is 39 percent in general, 32 percent in rural
areas and 49 percent in urban areas. Though the attainment rate is lower but it had improved
from 2001 to 2011with an increase of 18 percentages point in general, 12 percentage point in
rural areas and 18 percentage points in urban areas.
Table 3.15: Attainment rate of Schedule caste (SC) by sector and year
Rural + Urban Rural Urban
2011 2001 2011 2001 2011 2001
A. Basic indicators
1. Condition of census houses
Good Condition houses 66.14 59.25 65.55 62.23 68.95 80.62
2. availability of space
Four rooms and above 37.37 40.04 34.55 38.92 42.10 47.57 3. Latrine Facilities
Water Closet latrines 72.61 68.91 72.00 69.49 76.78 71.90
4. Source of Drinking Water
Tap water 132.96 127.34 136.08 161.65 118.72 110.44
Well water 90.89 96.82 82.18 87.13 86.24 90.78
5. Availability of Separate Kitchen
With separate kitchen 95.83 88.63 96.86 90.63 97.62 92.94 6. Sources of Lighting
Electricity 90.03 72.71 88.90 73.23 92.46 78.81
7. Type of cooking energy
LPG/PNG 39.44 21.68 32.43 20.28 49.39 31.53
The attainment rate calculated for the additional indicators as presented in table 9 panelB,
which include closed drainage system and households with bathing facilities. In 2011, the share
SC household’s having closed drainage facility is 43 percent of the share of other households
having closed drainage facility. For rural areas the attainment rate is 41 percent and 48 percent
in urban areas in 2011. The attainment rate of SC households in terms of closed drainage
facilities has reduced in general and both in rural and urban areas from 2001 to 2011. The
attainment rate in case of bathroom facilities reveals that the share of SC households having

55
bathroom facilities is 74 percent of the share of other households having bathroom facilities. The
figures for rural areas are 70 percent and 84 percent in urban areas. The difference between SC
households and Other households in concrete roof and stone walls do not differ between rural
and urban areas and the SC households seem to be catching up with the Other households which
is evident in the increasing attainment rate from 2001 to 2011. The attainment rate in the type of
floor-mosaic/floor tiles is very low at 26 in general and 19 percent in rural and 35 percent in
urban areas. The SC households seem to be catching up from 2001 to 2011.
Table 3.16 presents the attainment rate of ST population for both in rural and urban areas.
In 2011 the attainment rate in good condition houses is 55 percent which means that the share of
ST population having good conditions houses is only 55 percent to the share of others population
having the same facilities. The gap between ST’s and other groups seem to have reduced from
2001 with the increase in the attainment rate by 6 percentage points. There seem to have a
significant rural (53 percent) and urban (82 percent) difference in the gap between the SC
households and Other households in 2011. The attainment rate has increased in rural areas from
2001 to 2011 but in urban areas the attainment has reduced which implies that the growth rate of
good conditions houses has been faster among Other households than SC households in urban
areas in the same time period. The attainment rate of ST households in terms of the availability
of space while considering four rooms and above, is low in general(44 percent) and the gap is
less in urban areas than in rural areas. The gap is because the sample size of ST households in
urban areas is very less which might be a selective group and majority of them live in rural areas.
In case of latrine facilities we have taken the water closet latrines as the best indicator to
compare the share of SC households and Other households in the respective category. The data
reveals that the attainment rate in 2011 is 65 percent which has increased from the year 2001 by
24 percentage points. There is stark difference in rural and urban areas in the attainment rate. The
attainment rate in rural areas is 65 percent while in urban areas the attainment rate is 94 percent
which is much closer to equality between the ST households and Other households. While
comparing between 2001 and 2011 the attainment rate has increase which implies that the ST
households are catching up with the other groups in terms of the usage of water closet latrine as a
latrine facility.

56
Table 3.16: Attainment rate of Schedule tribe (ST) by sector and year
Rural + Urban Rural Urban
index 2011 2001 2011 2001 2011 2001
A. Basic indicators
1. Condition of census houses
Good Condition houses 55.41 49.15 53.30 50.57 82.47 92.46
2. availability of space
Four rooms and above 44.47 40.32 41.97 39.44 67.05 59.96
3. Latrine Facilities
Water Closet latrines 64.69 41.12 64.64 38.63 93.85 76.78
4. Source of Drinking Water
Tap water 86.78 79.95 85.30 99.16 115.63 118.08
Well water 80.13 78.31 69.35 67.77 82.85 83.09
5. Availability of Separate Kitchen
With separate kitchen 92.10 87.99 91.91 88.02 97.62 92.94
6. Sources of Lighting
Electricity 65.43 50.60 61.36 49.28 92.98 83.99
7.Type of cooking energy
LPG/PNG 26.38 20.92 18.13 16.46 79.32 67.28
To calculate the attainment rate of sources of drinking water by ST households with
respect to the referral group i.e. Other group, we have taken Tap water and well water as the best
outcomes. Among ST households both in rural and urban areas the attainment rate is closer to
hundred percent in general and in rural areas but the attainment rate is more than hundred in
urban areas which implies that the share of households using tap water as the main source of
drinking water among ST in 2011 in urban areas is higher than the share of households among
Other households.
The attainment rate of ST households in using Well water as the main source of drinking
water in 2011 was 80 percent in general and 85 percent in rural and 116 percent in urban areas.
The attainment rate is closer to hundred which indicates that there is less gap between the share
ST households using well water as a main source of drinking water to that of the share of Other

57
households in the same category. While comparing the attainment rate in case of usage of well
water with 2001, the attainment rate has increased in general and in rural areas but has shown a
slight decline in urban areas from 2001 to 2011. The gap in terms of the availability of kitchen in
ST households with respect to Other households is low with more than 90 percent attainment rate
in both rural and urban areas.
The attainment rate of ST households in case of electricity is 65 percent in general, 61
percent in rural areas and 93 percent in urban areas. The attainment rate is closer to hundred in
urban areas and does reveal a sharp difference between rural and urban areas. The attainment rate
has increased by 15 percentage points in general, 12 percentage point increase in rural areas and
9 percentage point increase in urban areas from 2001 to 2011.
The LPG/PNG as the best indicator of the cooking energy has the lowest attainment rate
among ST households particularly in rural areas even lower than the attainment rate of SC
households. In 2011, the attainment rate is 26 percent in general, 18 percent in rural areas and 79
percent in urban areas. Though the attainment rate is lower but it had improved from 2001 to
2011with an increase of 5 percentage points in general, 2 percentage point in rural areas and 12
percentage points in the attainment rate in urban areas.

58
Chapter 4
Some Additional Amenities and Facilities
4.1 Introduction
Apart from the core indicators of the housing condition that we have selected, we now examine
two additional amenities. These are (a) drainage and bathroom facilities across sector and social
groups in year 2001 and 2011.
4.2 Drainage Facilities
The section gives the overview of the type of drainage connectivity for waste water outlet in
Kerala. The drainage is either closed, open or no drainage. Kerala’s 54 percent of households
have no drainage facility, 21 percent has open drainage facility and only 25 percent has closed
drainage system. The situation seems to have improved since 2001 where the households with
closed drainage facility has increased by 17 percentage points, open drainage facility increased
by 10 percentage points and there is a reduction of 27 percentage points in the households with
no drainage facility from 2001 to 2011. Disaggregating the population into social groups; SC,
ST and Others the trend is more or less the same.
In 2011, 12 percent of SC households have closed drainage system facility, 18 percent
open and majority (77 percent) of the households do not have any drainage facility in 2011.
Similarly among ST, 77 percent of households do not have any kind of drainage facility; only 9
percent have closed drainage facility and rest 14 percent have open drainage facility in 2011.
However among ‘Other’ households 51 percent do not have drainage facility but the conditions
are better than SC and ST households. In comparison to 2001, the improvement in the drainage
system varies across social groups. The number of households without drainage system had
decreased by 16 percentage points among SC households. ST households have reduced by 10
percentage points and Other Households have reported drastic reduction by 28 percentage points
from 2001 to 2011.

59
Table 4.1: Drainage facilities by social groups and census year (2001 and 2011)
All Population SC
2011 2001 2011 2001
Drainage
facility
No. of
houses %
No. of
houses % PPC
No. of
houses %
No. of
houses % PPC
Closed 1948041 25.25 530486 8.04 17.21 87510 11.65 28472 4.01 7.64
Open 1634514 21.18 770183 11.68 9.50 142482 18.97 72876 10.28 8.69
None 4133815 53.57 5294537 80.28 -26.71 521173 69.38 607795 85.71 -16.33
Total 7716370 100 6595206 100 751165 100 709143 100
ST Others
Closed 12484 9.18 4783 4.1 5.08 1848047 27.06 497231 8.62 18.44
Open 19117 14.06 10897 9.34 4.72 1472915 21.57 686410 11.9 9.67
None 104405 76.76 100943 86.55 -9.79 3508237 51.37 4585799 79.48 -28.11
Total 136006 100 116623 100 6829199 100 5769440 100
Rural urban difference in drainage facilities
In 2011, 18 percent of rural households have closed drainage facilities, 21 percent has open
drainage facility and majority of households (61 percent) in rural areas do not have drainage
facilities. The percentage share of closed drainage system has increased by 12 percentage points
and open drainage system has increased by 11 percentage points with corresponding decline no
drainage facility by 23 percent from 2001 to 2011.
For SC households in rural areas majority of households (73 percent) do not have
drainage electricity, 18 percent have open drainage and 8 percent have closed drainage facility in
2011. The percentage share of closed drainage increased by 5 percentage points, open drainage
increased by 9 percentage points and households with no drainage decreased by 14 percentage
points from 2001 to 2011 in rural areas. Similarly, among ST household’s 82 percent households
do not have drainage system and only 5 percent of them have closed drainage and 13 percent
have open drainage system in 2011. The change in the percentage share from 2001 to 2011 is
slower than the SC households though the percentage share of the households with no drainage
have decreased by 7 percentage points with a corresponding increase in open and closed drainage
facility. For other category households in rural areas, 58 percent of households do not have

60
drainage facility and rest around 40 percent have either open drainage (22) or closed drainage
(20 percent) in 2011. While comparing with 2001, the percentage share of households without
drainage has decreased by 25 percentage points and a corresponding increase in closed
drainage(13 percentage points) and open drainage (12 percentage points) from 2001 to 2011.
In 2011, 34 percent of urban households have closed drainage facilities, 21 percent has
open drainage facility and majority of households (45 percent) in urban areas do not have
drainage facilities which is lower than that of rural households. The percentage share of closed
drainage system has increased by 19 percentage points and open drainage system increased by 5
percentage points with corresponding decline no drainage facility by 24 percent from 2001 to
2011.
For SC households in urban areas, majority of households (63 percent) do not have
drainage facility, 20 percent have open drainage and 17 percent have closed drainage facility in
2011. The percentage share of closed drainage in urban areas increased by 9 percentage points,
open drainage increased by 7 percentage points and households with no drainage decreased by
16 percentage points from 2001 to 2011. Similarly, among ST household’s, 48 percent do not
have drainage system and only 30 percent of them have closed drainage and 22 percent have
open drainage system in 2011. The percentage share of the households with no drainage have
decreased by 18 percentage points with a corresponding increase in open ( 5 percentage points)
and closed(13 percentage points) drainage facility from 2001 to 2011. For other category
households in urban areas, 44 percent of households do not have drainage facility and 22 percent
have open drainage and 35 percent have closed drainage in 2011. While comparing with 2001,
the percentage share of households without drainage has decreased by 25 percentage points and a
corresponding increase in closed drainage by 20 percentage points and open drainage by 5
percentage points from 2001 to 2011.

61
Table 4.2: Drainage facilities by sector, social groups and census year (2001 and 2011)
Rural Urban
2011 2001 2011 2001
sources No. of
houses %
No. of
houses % PPC
No. of
houses %
No. of
houses % PPC
All Population
Closed 733491 17.91 285001 5.77 12.14 1214550 33.54 245485 14.85 18.69
Open 874009 21.34 505104 10.22 11.12 760505 21 265079 16.04 4.96
None 2488174 60.75 4152455 84.01 -23.26 1645641 45.45 1142092 69.11 -23.66
Total 4095674 100 4942560 100 3620696 100 1652656 100
SC
Closed 37321 8.21 18384 3.13 5.08 50189 16.93 10088 8.28 8.65
Open 83694 18.41 57120 9.73 8.68 58788 19.83 15756 12.93 6.9
No
drainage 333714 73.39 511758 87.14 -13.75 187459 63.24 96037 78.8 -15.56
Total 454729 100 587262 100 296436 100 121881 100
ST
Closed 6334 5.48 3081 2.89 2.59 6150 30.18 1702 17.24 12.94
Open 14662 12.68 9209 8.63 4.05 4455 21.86 1688 17.1 4.76
No
drainage 94634 81.84 94461 88.49 -6.65 9771 47.95 6482 65.66 -17.71
Total 115630 100 106751 100 20376 100 9872 100
Others
Closed 689836 19.57 263536 6.2 13.37 1158211 35.06 233695 15.37 19.69
Open 775653 22 438775 10.33 11.67 697262 21.1 247635 16.28 4.82
No
drainage 2059826 58.43 3546236 83.47 -25.04 1448411 43.84 1039573 68.35 -24.51
Total 3525315 100 4248547 100 3303884 100 1520903 100
4.3 Bathing Facility
In 2011, 86 percent of total households have bathing facilities and the rest 14 do not have bathing
facilities in their houses. From 2001 to 2011, households with bathing facilities have increased
by 24 percentage points. In 2011, Among SC households only 66 percent have bathing facility
while the corresponding figure for ST’s is 48 percent which is lowest among all groups. The
bathing facility of ‘Other’ groups is 89 percent in 2011 which is higher than the state average.
From 2001 to 2011, the number of SC and ST households with bathing facility has increased by
32 percentage points and 24 percentage points respectively.

62
Table 4.3: bathing facility by social groups and census year (2001 and 2011)
All Population SC
2011 2001 2011 2001
Bath
room
census
houses %
census
houses % PPC
census
houses %
census
houses % PPC
Yes 6618914 85.78 4096714 62.12 23.66 496229 66.06 244246 34.44 31.62
Total 7716370 100 6595206 100 751165 100 709143 100
ST Others
Yes 65326 48.03 27411 23.5 24.53 6057359 88.7 3825057 66.3 22.4
Total 136006 100 116623 100 6829199 100 5769440 100
Rural urban difference in bathing facilities
In rural areas, 78 percent of total households have bathing facilities and 93 percent of urban
households in 2011. From 2001 to 2011, the percentage share of households with bathing
facilities has increased by 22 percentage points in rural areas and 13 percentage points in urban
areas. In rural areas, among SC households only 58 percent have bathing facility while the
corresponding figure for urban areas is 79 percent in 2011. From 2001 to 2011, the percentage
share of SC households with bathing facility has increased by 27 percentage points in rural areas
and 26 percentage points in urban areas. Among ST in rural areas, 44 percent of households have
bathing facility and for urban ST households the figures are 86 percent in 2011. From 2001 to
2011, the percentage share of ST households has increased by 22 percentage points in rural areas
and 21 percentage points in urban areas. For other group, the rural urban gap is smaller than SC
and ST households. In 2011 among Other households, 83 percent households in rural areas and
94 percent households in urban areas have bathroom facility within the premises in 2011. The
percentage share of households with bathroom facility has increased more in rural areas by 22
percentage points than in urban areas which has increased by 13 percentage points from 2001 to
2011.

63
Table 4.4: Bathing facility by sector, social groups and census year (2001 and 2011)
Rural Urban
2011 2001 2011 2001
sources No. of
houses %
No. of
houses % PPC
No. of
houses %
No. of
houses % PPC
All Population
With 3052699 78.44 2792551 56.5 21.94 3214669 92.57 1304163 78.91 13.66
Total 3891977 100 4942550 100 3472847 100 1652656 100
SC
With 263442 57.93 179844 30.62 27.31 232787 78.53 64402 52.84 25.69
Total 454729 100 587262 100 296436 100 121881 100
ST
With 47884 41.41 21012 19.68 21.73 17442 85.6 6399 64.82 20.78
Total 115630 100 106751 100 20376 100 9872 100
Others
With 2741373 82.53 2591695 61 21.53 2964440 93.93 1233362 81.09 12.84
Total 3321618 100 4248537 100 3156035 100 1520903 100
4.4 Type of roof
In 2011, 48 percent of total households in Kerala have concrete roof, 38 percent use tiles, 9
percent use G.I./Metal/Asbestos sheets and 3 percent have roof made up of Grass/thatch/
Bamboo/Wood/Mud. Among social groups; SC, ST and Others, majority of them households
use titles as the predominant material for roof in 2011. From 2001 to 2011, the percentage share
of roof types such as G.I./Metal/ Asbestos sheets and concrete has increased in percentage points
in general and across social groups and the corresponding decline in Grass/thatch/
Bamboo/Wood/Mud and tiles.

64
Table 4.5: type of roof by social groups and census year (2001 and 2011)
All Population SC
2011 2001 2011 2001
No. of
houses
% No. of
houses
% PPC No. of
houses
% No. of
houses
% PPC
Grass/thatch/
Bamboo/Wood/
Mud
205567 2.66 676394 10.26 -7.59 47953 6.38 145639 20.54 -14.15
Tiles 2957668 38.33 3764851 57.08 -18.75 337706 44.96 424885 59.92 -14.96
G.I./Metal/
Asbestos sheets
697932 9.04 286516 4.34 4.70 101997 13.58 44486 6.27 7.31
Concrete 3701357 47.97 1745121 26.46 21.51 238754 31.78 78697 11.10 20.69
Total 7716370 100 6595206 100.00 751165 100.00 709143 100.00
ST Others
Grass/thatch
/Bamboo/Wood/
Mud
13640 10.03 24946 21.39 -11.36 143974 2.11 505809 8.77 -6.66
Tiles 58624 43.10 68874 59.06 -15.95 2561338 37.51 3271092 56.70 -19.19
G.I./Metal/
Asbestos sheets
18933 13.92 8719 7.48 6.44 577002 8.45 233311 4.04 4.41
Concrete 39183 28.81 10225 8.77 20.04 3423420 50.13 1656199 28.71 21.42
Total 136006 100.00 116623 100.00 6829199 100.00 5769440 100.00
Rural urban difference in predominant material used in roof
In rural areas, majority of the households (43 percent) use tiles in 2011 and in urban areas
majority of the households (58 percent) use concrete material for roof. Similarly SC and ST
households use tiles predominantly in rural areas and concrete material roof in urban areas in
2011. From 2001 to 2011 there is a decline in the usage of Grass/thatch/Bamboo /Wood/Mud and
tiles as a roof material and an increase in G.I./Metal/ Asbestos sheets and concrete. Similar trend is across
social groups and sector with varying magnitudes.

65
Table 4.6: Type of roof by sector, social groups and census year (2001 and 2011)
Rural Urban
2011 2001 2011 2001
Type of roof census
houses
% census
houses
% PPC census
houses
% census
houses
% PPC
All Population
Grass/thatch/
Bamboo
/Wood/Mud
128035 3.13 568052 11.49 -8.37 77532 2.14 108342 6.56 -4.41
Tiles 1775453 43.35 2935300 59.39 -16.04 1182215 32.65 829551 50.20 -17.54
G.I./Metal/
Asbestos sheets
499390 12.19 235203 4.76 7.43 198542 5.48 51313 3.10 2.38
Concrete 1600213 39.07 1113393 22.53 16.54 2101144 58.03 631728 38.23 19.81
Total 4095674 100.00 4942550 100.00 3620696 100.00 1652656 100.00
SC
Grass/thatch/
Bamboo
/Wood/Mud
28778 6.33 123077 20.96 -14.63 19175 6.47 22562 18.51 -12.04
Tiles 221756 48.77 360219 61.34 -12.57 115950 39.11 64666 53.06 -13.94
G.I./Metal/
Asbestos sheets
77590 17.06 39531 6.73 10.33 24407 8.23 4955 4.07 4.17
Concrete 110500 24.30 52651 8.97 15.33 128254 43.27 26046 21.37 21.90
Total 454729 100.00 587262 100.00 296436 100.00 121881 100.00
ST
Grass/thatch/
Bamboo/Wood/
Mud
12876 11.14 23851 22.34 -11.21 764 3.75 1095 11.09 -7.34
Tiles 51568 44.60 63933 59.89 -15.29 7056 34.63 4941 50.05 -15.42
G.I./Metal/
Asbestos sheets
17316 14.98 8087 7.58 7.40 1617 7.94 632 6.40 1.53
Concrete 28811 24.92 7459 6.99 17.93 10372 50.90 2766 28.02 22.88
Total 115630 100.00 106751 100.00 20376 100.00 9872 100.00
Others
Grass/thatch/
Bamboo/Wood/
Mud
86381 2.45 421124 9.91 -7.46 57593 1.74 84685 5.57 -3.82
Tiles 1502129 42.61 2511148 59.11 -16.50 1059209 32.06 759944 49.97 -17.91
G.I./Metal/
Asbestos sheets
404484 11.47 187585 4.42 7.06 172518 5.22 45726 3.01 2.22
Concrete 1460902 41.44 1053283 24.79 16.65 1962518 59.40 602916 39.64 19.76
Total 3525315 100.00 4248537 100.00 3303884 100.00 1520903 100.00

66
4.5 Type of wall
In 2011, 57 percent of total households in Kerala have stone packed with/ without mortar as a
predominant material used for wall, 25 percent use burnt bricks and 13 percent of households use
grass/thatch/bamboo, mud or unburnt brick. Among social groups; SC, ST and Others, follow the
similar trend but among ST households, 27 percent of households have walls made of
grass/thatch/bamboo, mud or unburnt brick followed by SC households (21 percent) in 2011.
From 2001 to 2011, the percentage share of wall predominantly made of Stone packed
with/without Mortar has increased across social groups and the decline in other type of walls in
terms of percentage points.
Table 4.7: Type of wall by social groups and census year (2001 and 2011)
All Population SC
2011 2001 2011 2001
Type of wall No. of
houses
% No. of
houses
% PPC No. of
houses
% No. of
houses
% PPC
Grass/Thatch/
Bamboo
130314 1.69 321952 4.88 -3.19 30631 4.08 74574 10.52 -6.44
Mud/Unburnt
brick
889634 11.53 1568558 23.78 -12.25 126321 16.82 239572 33.78 -16.97
Stone packed
with/without
mortar
4387640 56.86 2209364 33.50 23.36 399817 53.23 196755 27.75 25.48
Burnt brick 1890204 24.50 2087317 31.65 -7.15 143097 19.05 157736 22.24 -3.19
total 7716370 100 6595206 100 751165 100 709143 100
ST Others
Grass/Thatch
/Bamboo
11137 8.19 15144 12.99 -4.80 88546 1.30 232234 4.03 -2.73
Mud/Unburnt
brick
25218 18.54 40629 34.84 -16.30 738095 10.81 1288357 22.33 -11.52
Stone packed
with/without
mortar
51999 38.23 15390 13.20 25.04 3935824 57.63 1997219 34.62 23.02
Burnt brick 37043 27.24 36176 31.02 -3.78 1710064 25.04 1893405 32.82 -7.78
total 136006 100 116623 100 6829199 100 5769440 100
Rural urban difference in predominant material used in wall
In 2011, 54 percent of the households in rural areas and 61 percent in urban areas have walls
predominantly made of stone. Similarly, schedule caste and schedule tribe households majority

67
of them use stone as a material for wall both in rural as well as in urban areas. Though, the
percentage of households using Grass/thatch/Bamboo /Wood/Mud for wall is highest among SC
households (29 percent) in rural areas followed by SC households (24 percent) in rural areas. From 2001
to 2011 there is a decline in the usage of Grass/thatch/Bamboo /Wood/Mud and burnt as a wall
material and an increase in the use of Stone with/without mortar. Similar trend can be seen across social
groups both in rural as well as in urban areas with varying magnitudes.
Table 4.8: Type of wall by sector, social groups and census year (2001 and
2011)
Rural
2011 2001
census
houses
% census
houses
% PPC
Type of wall All Population
Grass/Thatch/Bamboo 83645 2.04 260683 5.27 -3.23
Mud/Unburnt brick 616639 15.06 1337147 27.05 -12.00
Stone packed
with/without mortar
2192868 53.54 1631616 33.01 20.53
Burnt brick 963203 23.52 1402837 28.38 -4.87
total 4095674 100 4942550 100
SC
Grass/Thatch/Bamboo 18233 4.01 61997 10.56 -6.55
Mud/Unburnt brick 89228 19.62 208686 35.54 -15.91
Stone packed
with/without mortar
232544 51.14 164359 27.99 23.15
Burnt brick 82822 18.21 120021 20.44 -2.22
total 454729 100 587262 100
ST
Grass/Thatch/Bamboo 10689 9.24 14554 13.63 -4.39
Mud/Unburnt brick 23260 20.12 38924 36.46 -16.35
Stone packed
with/without mortar
40338 34.89 12786 11.98 22.91
Burnt brick 31968 27.65 32118 30.09 -2.44
total 115630 100 106751 100
Others
Grass/Thatch/Bamboo 54723 1.55 184132 4.33 -2.78
Mud/Unburnt brick 504151 14.30 1089537 25.64 -11.34
Stone packed
with/without mortar
1919986 54.46 1454471 34.23 20.23
Burnt brick 848413 24.07 1250698 29.44 -5.37
total 3525315 100 4248537 100

68
Table 4.9: Type of wall by sector, social groups and census year (2001 and
2011)
Urban
2011 2001
census
houses
% census
houses
% PPC
Type of wall All Population
Grass/Thatch/Bamboo 46669 1.29 61269 3.71 -2.42
Mud/Unburnt brick 272995 7.54 231411 14.00 -6.46
Stone packed
with/without mortar
2194772 60.62 577748 34.96 25.66
Burnt brick 927001 25.60 684480 41.42 -15.81
total 3620696 100 1652656 100
SC
Grass/Thatch/Bamboo 12398 4.18 12577 10.32 -6.14
Mud/Unburnt brick 37093 12.51 30886 25.34 -12.83
Stone packed
with/without mortar
167273 56.43 32396 26.58 29.85
Burnt brick 60275 20.33 37715 30.94 -10.61
total 296436 100 121881 100
ST
Grass/Thatch/Bamboo 448 2.20 590 5.98 -3.78
Mud/Unburnt brick 1958 9.61 1705 17.27 -7.66
Stone packed
with/without mortar
11661 57.23 2604 26.38 30.85
Burnt brick 5075 24.91 4058 41.11 -16.20
total 20376 100 9872 100
Others
Grass/Thatch/Bamboo 33823 1.02 48102 3.16 -2.14
Mud/Unburnt brick 233944 7.08 198820 13.07 -5.99
Stone packed
with/without mortar
2015838 61.01 542748 35.69 25.33
Burnt brick 861651 26.08 642707 42.26 -16.18
total 3303884 100 1520903 100
4.6 Type of floor
In 2011, 61 percent of total households in Kerala have cemented floor, 23 percent use
mosaic/floor tiles and 10 percent of households use mud. Among social groups; among SC

69
households 65 percent use cement for floor and 24 percent have mud floor, ST households, 47 percent use
cement and 44 percent use mud as a material for floor. From 2001 to 2011, the percentage share of
floor predominantly made of mud or cement has decreased in general and among other
households but among SC and ST households Mud floor has shown a sharp decline in terms of
percentage points and an increase cemented floor and mosaic/floor tiles in the same time period.
Table 4.10: Type of floor by social groups and census year (2001 and 2011)
All Population SC
2011 2001 2011 2001
Type of
floor
No. of
houses
% No. of
houses
% PPC No. of
houses
% No. of
houses
% PPC
Mud 747339 9.69 1606927 24.37 -14.68 183862 24.48 354891 50.05 -25.57
Cement 4735079 61.36 4158498 63.05 -1.69 489936 65.22 321187 45.29 19.93
Mosaic/floor
tiles
1768412 22.92 644790 9.78 13.14 49287 6.56 13685 1.93 4.63
total 7716370 100 6595206 100 751165 100.00 709143 100
ST Others
Mud 59985 44.10 75480 64.72 -20.62 503492 7.37 1176556 20.39 -13.02
Cement 64223 47.22 36188 31.03 16.19 4180920 61.22 3801123 65.88 -4.66
Mosaic/floor
tiles
8041 5.91 2384 2.04 3.87 1711084 25.06 628721 10.90 14.16
total 136006 100 116623 100 6829199 100 5769440 100
Rural urban difference in predominant material used in floor
In 2011, 65 percent of the households in rural areas and 57 percent in urban areas have floor
predominantly made of cement. The percentage of households with mud floor is 14 percent in
rural areas and 5 percent in urban areas in 2011. Consequently there are more mosaic floor or of
floor tiles in urban areas than in rural areas. Similarly, in case of schedule caste, majority of them
have cemented floor both in rural as well as in urban areas. But among the schedule tribe
households, 50 percent have mud floor in rural areas where the majority of them reside. From
2001 to 2011 there is a decline in mud floors in general and across social groups which has
shown sharper decline than at state level. The data also reveals that there is a corresponding
increase in the use of cement and mosaic/floor tiles as a predominant material for floor from
2001 to 2011.

70
Table 4.11 Type of floor by sector, social groups and
census year (2001 and 2011) Rural
2011 2001
census
houses
% census
houses
% PPC
All Population
Mud 559960 13.67 1412213 28.57 -14.90
Cement 2655615 64.84 3056043 61.83 3.01
Mosaic/floor
tiles
698956 17.07 345880 7.00 10.07
Total 4095674 100 4942550 100
SC
Mud 134926 29.67 314937 53.63 -23.96
Cement 288950 63.54 250023 42.57 20.97
Mosaic/floor
tiles
16718 3.68 6887 1.17 2.50
Total 454729 100 587262 100
ST
Mud 57623 49.83 73228 68.60 -18.76
Cement 51935 44.91 30052 28.15 16.76
Mosaic/floor
tiles
3608 3.12 1314 1.23 1.89
total 115630 100 106751 100
Others
Mud 367411 10.42 1024048 24.10 -13.68
Cement 2314730 65.66 2775968 65.34 0.32
Mosaic/floor
tiles
678630 19.25 337679 7.95 11.30
total 3525315 100 4248537 100

71
Table 4.12: Type of floor by sector, social groups and
census year (2001 and 2011) Urban
2011 2001
census
houses
% census
houses
% PPC
All Population
Mud 187379 5.18 194714 11.78 -6.61
Cement 2079464 57.43 1102455 66.71 -9.28
Mosaic/floor
tiles
1069456 29.54 298910 18.09 11.45
Total 3620696 100 1652656 100
SC
Mud 48936 16.51 39954 32.78 -16.27
Cement 200986 67.80 71164 58.39 9.41
Mosaic/floor
tiles
32569 10.99 6798 5.58 5.41
Total 296436 100 121881 100
ST
Mud 2362 11.59 2252 22.81 -11.22
Cement 12288 60.31 6136 62.16 -1.85
Mosaic/floor
tiles
4433 21.76 1070 10.84 10.92
total 20376 100 9872 100
Others
Mud 136081 4.12 152508 10.03 -5.91
Cement 1866190 56.48 1025155 67.40 -10.92
Mosaic/floor
tiles
1032454 31.25 291042 19.14 12.11
total 3303884 100 1520903 100
4.7 Attainment Rate of SC and ST in Additional Facilities
The attainment rate calculated for the additional indicators as presented in table 9 panelB,
which include closed drainage system and households with bathing facilities. In 2011, the share
SC household’s having closed drainage facility is 43 percent of the share of other households
having closed drainage facility. For rural areas the attainment rate is 41 percent and 48 percent
in urban areas in 2011. The attainment rate of SC households in terms of closed drainage
facilities has reduced in general and both in rural and urban areas from 2001 to 2011. The
attainment rate in case of bathroom facilities reveals that the share of SC households having
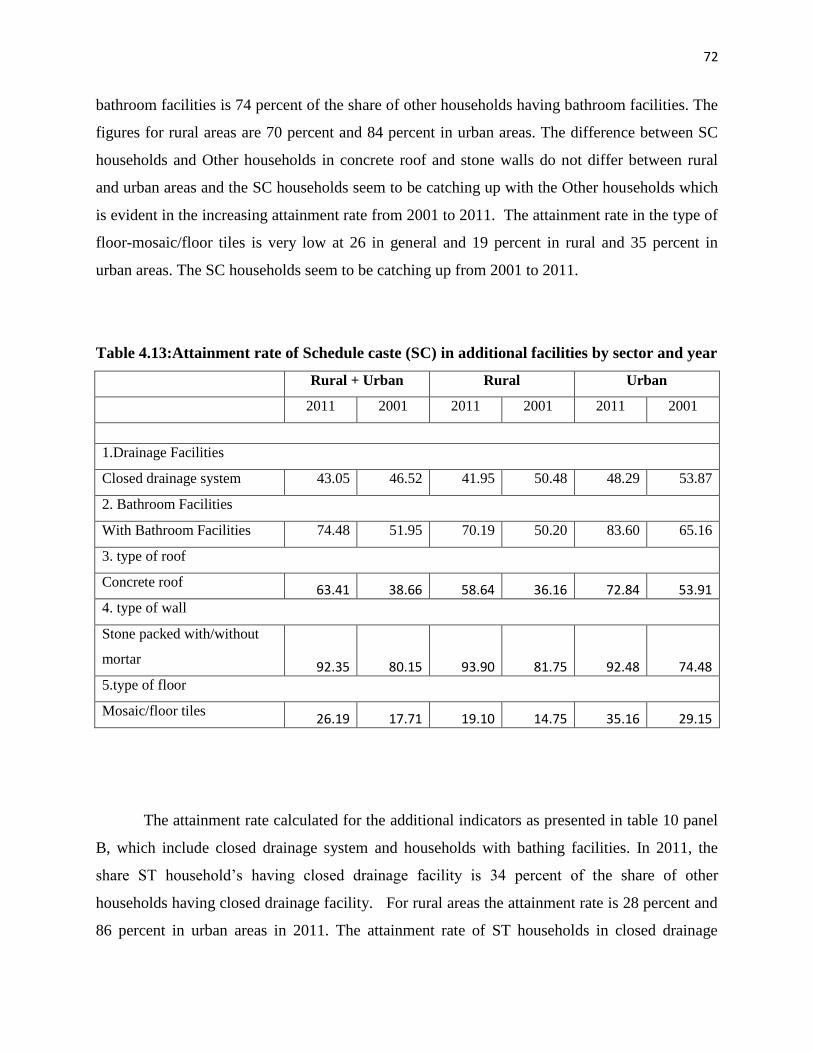
72
bathroom facilities is 74 percent of the share of other households having bathroom facilities. The
figures for rural areas are 70 percent and 84 percent in urban areas. The difference between SC
households and Other households in concrete roof and stone walls do not differ between rural
and urban areas and the SC households seem to be catching up with the Other households which
is evident in the increasing attainment rate from 2001 to 2011. The attainment rate in the type of
floor-mosaic/floor tiles is very low at 26 in general and 19 percent in rural and 35 percent in
urban areas. The SC households seem to be catching up from 2001 to 2011.
Table 4.13:Attainment rate of Schedule caste (SC) in additional facilities by sector and year
Rural + Urban Rural Urban
2011 2001 2011 2001 2011 2001
1.Drainage Facilities
Closed drainage system 43.05 46.52 41.95 50.48 48.29 53.87
2. Bathroom Facilities
With Bathroom Facilities 74.48 51.95 70.19 50.20 83.60 65.16
3. type of roof
Concrete roof 63.41 38.66 58.64 36.16 72.84 53.91
4. type of wall
Stone packed with/without
mortar 92.35 80.15 93.90 81.75 92.48 74.48
5.type of floor
Mosaic/floor tiles 26.19 17.71 19.10 14.75 35.16 29.15
The attainment rate calculated for the additional indicators as presented in table 10 panel
B, which include closed drainage system and households with bathing facilities. In 2011, the
share ST household’s having closed drainage facility is 34 percent of the share of other
households having closed drainage facility. For rural areas the attainment rate is 28 percent and
86 percent in urban areas in 2011. The attainment rate of ST households in closed drainage

73
facilities has reduced in general and both in rural and urban areas from 2001 to 2011. The
attainment rate in case of bathroom facilities reveals that the share of ST households having
bathroom facilities is 54 percent of the share of other households having bathroom facilities in
2011. The figures for rural areas are 50 percent and 91 percent in urban areas. The difference
between ST households and Other households in concrete roof and stone walls significantly
difference between rural and urban areas. The reason which we had stated earlier is the small
number of ST households in urban areas. ST households seem to be catching up faster with the
Other households which is evident in the increasing attainment rate from 2001 to 2011. The
attainment rate in the type of floor-mosaic/floor tiles is very low at 23 in general and 16 percent
in rural areas and 70 percent in urban areas which is lower than SC households in Kerala. But the
conditions seem to have improved from 2001 to 2011 in rural as well as in urban areas.
Table 4.14: Attainment rate of Schedule tribe (ST) by sector and year
Rural + Urban Rural Urban
index 2011 2001 2011 2001 2011 2001
1.Drainage Facilities
Closed drainage system 33.92 47.56 28.00 46.61 86.08 112.17
2. Bathroom Facilities
With Bathroom Facilities 54.15 35.44 50.18 32.26 91.13 79.94
3. type of roof
Concrete roof 57.47 30.54 58.64 28.18 85.69 70.68
4. type of wall
Stone packed with/without
mortar 66.34 38.12 93.90 34.99 93.80 73.92
5.type of floor
Mosaic/floor tiles 23.60 18.76 16.21 15.49 69.62 56.64

74
Chapter 5
District Level Scenario
A Comparative Analysis
5.1 Introduction
The idea of a detailed analysis of the housing conditions and amenities at the district level is that
it would then reveal the extent of the geographical spread of the improvement that has taken
place in the state. The chapter analyzes the housing condition on the basis of selected indicators
including basic and additional housing conditions and amenities as mentioned in the earlier
chapter.
We are not differentiating between rural and urban since the difference between them is
quite small as we saw in the earlier chapter, unlike the India’s overall scenario where the
difference is quite significant. The chapter examines the performance of districts in terms of
housing conditions and amenities by using the following three measures. One is to measure the
rate of change we have calculated the percentage point change between census 2001 and census
2011 and the second is the ranking of districts to see if there are any changes from 2001 to 2011.
Finally, we measure the inter-district inequality in housing conditions and amenities across by
computing Krtscha index. Krtscha index is a well-known inequality, which is the product of
Coefficient of Variation (as a relative measure of inequality) and Standard Deviation (as an
absolute measure inequality) (see Subramanian). The inequality is calculated for both the years
to judge if inter-district inequality has increased or decreased from the year 2001 to 2011.
5.2 Housing condition
Condition of the residential structure
In 2011 Kerala reported 66 percent of houses in good condition while the percentage of good
condition houses vary across districts. Kozhikode (74 percent) has highest percentage of houses
in good condition closely followed by Kannur (72.7 percent) and Malappuram (72 percent).
Idukki (49 percent) had the lowest proportion of households living in ‘good condition’ houses
followed by Wayanad (56 percent), Palakkad (61 percent) and Thiruvananthapuram (62 percent).

75
Ernakulam ranked top in 2001 in the highest percentage of good condition houses, which is taken
over by Kozhikode in 2011. Northern districts like Kozhikode, Kannur, Malappuram and
Kasaragod have reported highest percentage point increase in the proportion of good condition
houses from year 2001 to 2011. The lowest percentage point increase has been reported by
Ernakulam followed by Alappuzha, Pathanamthitta, Idukki and Wayanad from 2001 to 2011. As
per the coefficient of variation method, the variation has reduced by 2 percentage points from 12
percent in 2001 to 10 percent in 2011. The value of Krtscha index has reduced 0.77 in 2001 to
0.68 which indicates that the spatial inequality between the districts in terms of good condition
houses has reduced, though slightly.
Table 5.1: District wise percentage of Households living in 'good' houses in
2001 and 2011
Rank %age of good
condition houses
% point
change
District 2001 2011 2001 2011
Kozhikode 2 1 61.0 73.5 12.5
Kannur 5 2 58.2 72.7 14.5
Ernakulam 1 3 68.7 71.7 3.0
Malappuram 6 4 57.2 71.7 14.5
Kasaragod 10 5 50.4 67.4 17.0
Kollam 7 6 55.4 65.9 10.5
Pathanamthitta 3 7 60.3 65.8 5.5
Alappuzha 4 8 60.0 64.8 4.8
Thrissur 8 9 52.9 64.8 11.9
Kottayam 9 10 52.9 63.4 10.5
Thiruvananthapuram 11 11 50.2 62.2 12.0
Palakkad 12 12 49.0 61.5 12.5
Wayanad 13 13 50.2 55.6 5.4
Idukki 14 14 43.5 48.8 5.3
Kerala 55.9 66.3 10.4
Coefficient of Variation(CV) 0.12 0.10
Standard Deviation(SD) 6.42 6.81
Krtscha index(CV*SD) 0.77 0.68

76
Availability of space: Number of Rooms
In 2011, 25 percent of houses in Kerala have two rooms and the percentages vary across
districts; Palakkad (32 percent) has maximum and Kannur (16 percent) with minimum
percentage of households with two rooms. From 2001 to 2011 the percentage of houses with two
rooms have decreased in all the districts with highest decline in Pathanamthitta which has
decreased by 5 percentage points and the lowest decline in Kozhikode with a decline of less than
1 percentage point. As per the coefficient of variation the variation across districts is 19 percent
in 2001 which has reduced to 17 percent in 2011. The value of Krtscha index has reduced 0.93
in 2001 to 0.69 which indicates that the spatial inequality between the districts in terms of
percentage of houses with two rooms has reduced.
Kerala’s 32 percent of households have three rooms in 2011 which has increased by 5
percentage points from 2001. The percentage of households with three rooms varies across
districts; Ernakulam (35 percent) has the maximum and Pathanamthitta (29 percent) has
minimum in 2011. The ranking has remained more or less similar except Kollam which was 9th
position in 2001 has jumped to 4th
rank in 2011 with a 7 percentage point increase in the
percentage of houses with three rooms from 2001 to 2011. All the districts have recorded an
increased percentage point change from 2001 to 2011. The variation across districts from the
state average has reduced from 10 percent to 6 percent from 2001 to 2011 and a similar decline
in Krtscha index which indicates the decline in inequality across districts in the same time
period.

77
Table 5.2: District wise percentage of Households with two and three rooms in 2001 and 2011
%age of houses with two rooms %age of houses with three rooms
Districts 2001 2011 Rank
in
2001
Rank
in
2011
%age
point
change
2001 2011 Rank
In
2001
Rank
in
2011
%age
point
change
Ernakulam 22.3 19.9 12 13 -2.4 32.1 35.1 1 1 3.0
Kozhikode 29.3 28.5 6 4 -0.8 31.6 34.2 2 2 2.5
Thrissur 21.6 22.4 13 11 0.8 28.9 34.2 3 3 5.3
Kollam 26.1 26.0 8 7 -0.1 25.6 32.5 9 4 6.9
Thiruvananthapuram 23.3 24.8 10 9 1.5 27.5 32.3 5 5 4.8
Malappuram 27.3 24.9 7 8 -2.3 26.7 32.2 6 6 5.5
Kannur 18.6 16.3 14 14 -2.3 28.3 32.0 4 7 3.7
Kottayam 30.7 27.2 5 5 -3.6 25.6 31.3 8 8 5.7
Palakkad 32.2 32.0 3 1 -0.2 25.5 30.4 10 9 4.9
Alappuzha 33.9 29.2 2 3 -4.7 24.3 30.4 11 10 6.1
Idukki 31.0 26.7 4 6 -4.3 26.1 30.3 7 11 4.2
Wayanad 24.6 22.3 9 12 -2.3 23.2 29.7 14 12 6.6
Pathanamthitta 34.8 29.7 1 2 -5.1 24 29.3 13 14 5.2
Kasaragod 23.0 23.4 11 10 0.3 24.1 29.3 12 13 5.2
Kerala 26.6 25.1 -1.5 27.3 32.2 4.9
Coefficient of
Variation(CV)
0.19 0.17 0.10 0.06
Standard
Deviation(SD)
5.02 4.18 2.74 1.88
Krtscha
index(CV*SD)
0.93 0.69 0.28 0.11
Facility to protect basic dignity: Availability of Latrine facility within premises
The section presents the district wise availability of latrine facilities in year 2001 and 2011. We
are presenting the district wise percentage of households having latrine within the premises and
later present the district wise percentage of households having water closet type latrines while
comparing them in both the years. In 2011, 95 percent of the households have latrine facilities
within the premises which have increased by 11 percentage points from 2001 to 2011. This must
be reckoned as a remarkable achievement in the all India context given the fact that nearly half
the Indian households did not have a latrine facility within premises in 2011. The percentage of
households varies across districts; Ernakulam (98 percent) has maximum percentage of
households closely followed by Thrissur (98), Kozhikode (98 percent) and Idukki (89 percent)
has the minimum percentage of households with latrine facility. From 2001 to 2011 the

78
percentage of houses with latrine facility has increased in all the districts with highest increase in
terms of percentage points; Kasaragod (23 percentage points) and Palakkad (21 percentage
points). The lowest increase has been reported in terms of percentage points; Ernakulam (6
percentage points), Wayanad (7 percentage points) and Thrissur (7 percentage points) from year
2001 to 2011. As per the coefficient of variation the variation from the state average is 3 percent
in 2011 which has declined by 6 percentage points from 9 percent in 2001. The inequality
measured by Krtscha index has decreased from 0.70 to 0.10 from 2001 to 2011 which indicates
that the spatial inequality between the districts in terms of percentage of houses with two rooms
has slightly decreased.
Table 5.3: District wise percentage of Households with Latrine Facilities in 2001 and 2011
Hhds. with latrine within premises Water closet latrines
Districts rank
2001
rank
2011
2001 2011 %age
point
change
rank
2001
rank
2011
2001 2011 %age
point
change
Kozhikode 1 3 92.0 97.8 5.8 5 1 72.2 84.9 12.7
Kannur 5 4 87.2 97.6 10.4 4 2 73.0 75.9 2.9
Ernakulam 2 1 91.9 97.9 5.9 1 3 78.2 72.0 -6.2
Thrissur 3 2 90.9 97.8 6.9 3 4 75.2 70.9 -4.4
Kasaragod 13 12 68.4 91.8 23.3 12 5 54.0 70.3 16.3
Malappuram 4 5 87.4 97.4 10.0 2 6 76.8 69.9 -6.9
Wayanad 7 11 85.2 91.8 6.6 13 7 49.2 69.3 20.1
Kottayam 6 6 85.3 96.6 11.3 6 8 66.2 65.3 -0.8
Alappuzha 11 10 80.0 92.9 12.9 8 9 58.0 63.5 5.6
Thiruvananthapuram 9 8 82.6 94.2 11.6 11 10 56.0 62.2 6.2
Idukki 12 14 76.0 89.1 13.1 14 11 47.9 57.4 9.6
Kollam 8 7 82.6 94.5 11.9 7 12 60.3 56.8 -3.4
Palakkad 14 13 68.4 89.8 21.4 9 13 57.1 53.3 -3.8
Pathanamthitta 10 9 81.7 93.9 12.2 10 14 56.7 50.5 -6.2
Kerala 84.0 95.2 11.2 65.2 66.7 1.5
Coefficient of Variation(CV) 0.09 0.03 0.17 0.14
Standard Deviation(SD) 7.62 3.09 10.46 9.36
Krtscha index(CV*SD) 0.70 0.10 1.74 1.33
As we understood from the above analysis that at least close to ninety percent and even
more households in each district has latrines within their premises. There are three types of

79
latrines; water closet latrine, pit latrines and other type of latrines and here the focus is water
closet latrines as the most hygienic latrine facility. Kerala’s 65 percent of households have water
closet latrines in 2011 which has increased by one and half percentage points from 2001. The
percentage of households with water closet latrine type varies across districts; Kozhikode (85
percent) in 2011, ranks first and had fifth position in 2001, and Pathanamthitta (51 percent) has
minimum percentage of households with water closet latrines, even declined by 6 percentage
points from 2001 to 2011. Wayanad district has shown the highest increase of 20 percentage
points from 2001 to 2011 in the percentage of households having water closet latrines followed
by Kasaragod (16 percentage points) which had jumped from 12 positions in 2001 to 5th
position
in 2011. All the districts have recorded an increased percentage point change from 2001 to 2011.
As a measure of dispersion from the state average, Coefficient of variation has reduced from 17
percent to 14 percent from 2001 to 2011 and a similar decline in Krtscha index from 1.74 in
2001 to 1.33 in 2011 which indicates the decline in inequality across districts in the in the
households with water closet latrines.
Source of Drinking Water
The analysis of the data shows that the well water is the major source of drinking water in the
state. In 2011, 62 percent of the households used well water as the main source of drinking water
and 29 percent of the households used tap water and the rest used other sources. The data shows
variation across districts; Kannur (81 percent) had the highest proportion of households with well
as the major source of drinking water followed by Malappuram (78 percent), Pathanamthitta (74
percent) and Kozhikode (73 percent) in 2011. While Idukki (40 percent) has the lowest
percentage of household’s followed by Ernakulam (41 percent) and Alappuzha (46 percent) in
the same time period. Ernakulam (57 percent) had the highest proportion of households
depending on tap water followed by Palakkad (43 percent) and Thiruvananthapuram (38
percent). While, Kannur (12 percent) has the lowest proportion of households dependent on tap
water which is followed by Kasaragod (14 percent) and Pathanamthitta (19 percent) in 2011. In
comparison to 2001, there is decline in the percentage of households using well water as the
main source and tap water seem to be a close substitute. This is evident from the decline in the
percentage of households across districts in the usage of well water and a corresponding increase
in the proportion of households using tap water as the main source of drinking water but still

80
well water remains the main source of drinking water. The inequalities across the districts have
decreased in the usage of both well and tap water from year 2001 to 2011.
Table 5.4: District wise percentage of Households with source of drinking Water in 2001 and 2011
Tap water Well water
District rank 2001
rank 2011
2001 2011
%age point
change
rank 2001
rank 2011
2001 2011
%age point
change
Ernakulam 1 1 47.4 57.2 9.8 13 13 49.8 40.5 -9.3
Palakkad 3 2 26.8 42.9 16.1 11 11 64.7 48.4 -16.3
Thiruvananthapuram 4 3 26.6 38.2 11.6 10 10 69 56.9 -12.1
Alappuzha 2 4 26.9 35.0 8.1 12 12 58.5 45.8 -12.7
Idukki 5 5 24.1 30.2 6.1 14 14 43.3 40.3 -3.0
Thrissur 6 6 19.7 27.5 7.8 9 8 71.8 63.2 -8.6
Kollam 10 7 13.6 27.1 13.5 4 6 82.3 68.9 -13.4
Kottayam 7 8 18.3 22.9 4.6 7 5 76.7 69.9 -6.8
Wayanad 8 9 14.2 22.6 8.4 8 7 73.7 65.9 -7.8
Kozhikode 11 10 11.7 21.0 9.3 3 4 83.4 72.8 -10.6
Pathanamthitta 9 11 13.9 19.1 5.2 5 3 80.6 74.4 -6.2
Malappuram 12 12 7.6 14.9 7.3 2 2 86.7 78.4 -8.3
Kasaragod 13 13 7.4 13.7 6.3 6 9 77.1 62.6 -14.5
Kannur 14 14 5.9 11.7 5.8 1 1 87.9 81.3 -6.6
Kerala
20.4 29.3 8.9
71.9 62.0 -9.9
Coefficient of Variation(CV) 0.58 0.46
0.19 0.22
Standard Deviation(SD) 11.03 12.57
13.56 13.72
Krtscha index(CV*SD) 6.45 5.76
2.56 3.03
Availability of Separate Kitchen
This section presents the district wise percentage of households with separate kitchen in the year
2001 and 2011. In 2011, 97 percent of the households in Kerala have separate kitchen, which has
increased by 4 percentage points from 2001. The percentages of households with separate
kitchen vary across districts but the variations are small; 98 percent in Ernakulam is the
maximum and 94 percent in Pathanamthitta is the minimum in 2011. The percentage of
households with separate kitchen have shown a positive percentage point increase from 2001 to
2011 except Pathanamthitta which has declined by 2 percentage points in the same time period.
The variation across districts measured by coefficient of variation is very low at 1 percent in
2011 and has declined by one percentage point from 2001. The Krtscha index also shows are

81
corresponding decline from the same time period indicating the decline in inequality across
districts.
Table 5 5: District wise percentage of Households with separate
kitchen in 2001 and 2011
Ranking HHs with separate
Kitchen
Districts 2001 2011 2001 2011
% point
change
Ernakulam 10 1 93.4 98.4 4.9
Thrissur 2 2 96.1 98.3 2.2
Kannur 4 3 94.9 98.2 3.3
Malappuram 6 4 94.8 98.2 3.4
Kasaragod 8 5 94.2 97.6 3.4
Kozhikode 7 6 94.6 97.5 3.0
Kottayam 11 7 92.4 97.1 4.7
Thiruvananthapuram 13 8 91.4 97.0 5.6
Palakkad 5 9 94.9 96.6 1.7
Kollam 14 10 88.1 96.6 8.5
Alappuzha 9 11 93.7 96.0 2.3
Wayanad 3 12 95.5 95.6 0.1
Idukki 12 13 91.6 95.2 3.6
Pathanamthitta 1 14 96.3 94.7 -1.6
Kerala 94.0 97.3 3.3
Coefficient of Variation(CV) 0.02 0.01
Standard Deviation(SD) 2.21 1.21
Krtscha index(CV*SD) 0.05 0.01
Sources of Lighting
The section presents the district- wise percentage of households with electricity and kerosene as
the major source of lighting in year 2001 and 2011. 94 percent of households in Kerala (2011)
used electricity as a major source of lighting while the percentage households with electricity
vary across districts. Ernakulam (97 percent) has highest percentage of houses with electricity
and Wayanad (81 percent) has the lowest percentage of houses with electricity. The rankings
have not changed between the year 2001 and 2011 but the districts have recorded positive
percentage point increase in the same time period. Ernakulam ranked top in 2011 in highest
percentage of electrified houses and the Wayanad has the lowest electrified houses. The low
ranked districts in 2001 and 2011 have recorded highest percent point increase from 2001 to

82
2011. Wayanad had recorded 39 percentage points increase in the percentage of households with
electricity as the main source of lighting, followed by Palakkad (34 percentage points),
Kasaragod(32 percentage points), Idukki (31 percentage points), Kozhikode(30 percentage
points) and Malappuram(30 percentage points) from 2001 to 2011. Ernakulam (12 percentage
point) has recorded lowest increase of the households with electricity in the same time period.
The variation in the percentage of households using electricity across districts has reduced
significantly from 17 percent in 2001 to 5 percent in 2011 as per the coefficient of variation
method. The inequality across districts has reduced as the value of Krtscha index has shown a
decline from 1.85 in 2001 to 0.21 in 2011. In fact the decline in inter district inequality is quite
striking.
Table 5.6: District wise percentage of households with electricity as
the major source of lighting
Percentage of households with Electricity
Districts rank
2001
rank
2011
2001 2011 %age point
change
Ernakulam 1 1 85.0 97.0 12.0
Kottayam 2 2 78.0 97.0 19.0
Thrissur 3 3 77.0 97.0 20.0
Alappuzha 4 4 75.0 96.0 21.0
Thiruvananthapuram 5 5 75.0 95.0 20.0
Kollam 6 6 73.0 95.0 22.0
Pathanamthitta 7 7 72.0 94.0 22.0
Kannur 8 8 67.0 94.0 27.0
Malappuram 10 10 64.0 94.0 30.0
Kozhikode 9 9 64.0 94.0 30.0
Palakkad 11 11 60.0 94.0 34.0
Kasaragod 12 12 57.0 89.0 32.0
Idukki 13 13 57.0 88.0 31.0
Wayanad 14 14 42.0 81.0 39.0
Kerala 70.0 94.0 24.0
Coefficient of Variation(CV) 0.17 0.05
Standard Deviation(SD) 11.17 4.42
Krtscha index(CV*SD) 1.85 0.21

83
Type of cooking energy
The section presents the district wise percentage of households by the major source of cooking
fuel such as LPG/PNG in year 2001 and 2011. In 2011, 36 percent of households in Kerala use
LPG/PNG as a major source of cooking fuel while the percentage of households using LPG/PNG
has increased by 18 percentage points from 2001 to 2011. The usage LPG/PNG as a main source
of cooking fuel varies across districts; Ernakulam (63 percent) has highest percentage of
households followed by Alappuzha (52 percent), Thrissur (45 percent) while Wayanad (12
percent) has the lowest percentage of households use LPG/PNG followed by Malappuram (18
percent) and Idukki (20 percent) in 2011. While comparing with 2001, Alappuzha has recorded
highest percentage point increase of 31 percentage points and has also jumped from 5th
rank in
2001 to 2 rank in 2011 after Ernakulam. While Wayanad has recorded lowest percentage point
increase of one percentage point in the same time period. As per the coefficient of variation, the
variation has increased from 40 percent in 2001 to 44 percent in 2011. The value of Krtscha
index has increased from 2.8 in 2001 to 6.4 in 2011which indicates that the spatial inequality
between the districts in terms of percentage of houses using LPG/PNG as a major source of
cooking has increased significantly in the same time period. The increase in inequality in the use
of LPG as cooking energy is as striking as the decrease in equality in many other basic indicators
discussed earlier. This could be partly due to the rate of urbanization and increase in inequality in
household increase. However, the more proximate reason is the inadequate supply of LPG
cylinders by the petroleum companies.

84
Table 5.7: District wise distribution of households by the major source
of cooking fuel
Percentage of households with LPG\PNG
District rank
2001
rank
2011 2001 2011
% point
change
Ernakulam 1 1 35.0 63.0 28.0
Alappuzha 5 2 20.0 52.0 32.0
Thrissur 4 3 21.0 45.0 24.0
Thiruvananthapuram 6 4 18.0 41.0 23.0
Pathanamthitta 2 5 23.0 40.0 18.0
Kollam 10 6 14.0 40.0 25.0
Kottayam 3 7 22.0 39.0 17.0
Palakkad 9 8 14.0 28.0 14.0
Kasaragod 11 9 13.0 28.0 15.0
Kannur 8 10 14.0 21.0 7.0
Kozhikode 13 11 11.0 21.0 11.0
Idukki 7 12 15.0 20.0 5.0
Malappuram 14 13 8.0 18.0 10.0
Wayanad 12 14 11.0 12.0 1.0
Kerala 18.0 36.0 18.0
Coefficient of Variation(CV) 0.40 0.44
Standard Deviation(SD) 6.86 14.61
Krtscha index(CV*SD) 2.75 6.38
5.3 Additional facilities
The section examines the additional facilities represented by the indicators of housing conditions
and amenities such as drainage and bathing facilities across districts.
Drainage Facilities
The section presents the district-wise percentage of households with drainage facilities for the
household waste outlet. The data is provided according to the households having open or closed
drainage system in the table below. In 2011, only 46 percent of households have drainage system
of which 25 percent have closed drainages and 21 have open drainage system. Though, the
conditions have improved since 2001 wherein closed drainage system increased by 17 percent
points and open drainage system increased by 10 percentage points from 2001 to 2011. The
percentage of households with closed drainage and open drainage system varies across districts;

85
Thrissur (41 percent) has highest proportion of houses with closed drainage system and
Kasaragod (30 percent) has the highest percentage of households with open drainage system in
2011. Thiruvananthapuram (12 percent) has the lowest percentage of houses with closed
drainage and Ernakulam (12 percent) has the lowest proportion of open drainages in 2011.
Though there is an increase in the proportion of houses with closed or open drainage systems
from 2001 to 2011 but the data shows higher percentage point increase in closed drainage system
than open drainages as is evident from the table. The closed drainages facility have recorded
highest percentage point increase in Thrissur (41 percentage points) followed by Palakkad (39
percentage points), Malappuram (34 percentage points) and Wayanad (32 percentage points)
respectively from 2001 to 2011. In case of open drainages the highest percentage increase has
recorded in Kozhikode (18 percentage points) followed by Kasaragod (15 percentage points),
and Thiruvananthapuram (13 percentage points) from 2001 to 2011. The increase in the
proportion of households with closed drainage system is recorded lowest in Pathanamthitta (7
percentage points) and Ernakulam (5 percentage points) has recorded lowest increase in the
proportion of households with open drainage system from 2001 to 2011. The value of Krtscha
index has increased from 0.85 in 2001 to 3.94 in 2011 which indicates that the spatial inequality
between the districts in terms of the percentage of households with closed drainage systems has
increased significantly from 2001 to 2011. Similarly the inequality across districts in case of
proportion of households using open drainage systems has slightly increased from 2001 to 2011.

86
Table 5.8: District wise distribution of drainage facilities
Closed Drainage Open Drainage
districts rank
2001
rank
2011
2001 2011 %age
point
change
rank
2001
rank
2011
2001 2011 %age
point
change
Thrissur 1 1 12.1 40.8 28.7 2 8 16.4 20.8 4.4
Palakkad 6 2 8.2 38.7 30.5 9 10 11.8 18.9 7.1
Malappuram 4 3 9.5 34.3 24.8 4 7 14.7 23.5 8.8
Wayanad 2 4 11.7 32.6 20.9 8 9 12.9 19.6 6.6
Idukki 5 5 8.8 26.9 18.1 10 11 11.2 17.7 6.5
Kasaragod 7 6 7.7 25.3 17.5 5 1 14.6 30.0 15.3
Kannur 8 7 7.7 22.6 14.9 13 13 6.5 14.4 7.9
Ernakulam 3 8 10.6 21.4 10.7 12 14 6.6 11.6 5.0
Kottayam 11 9 5.6 19.3 13.7 14 12 5.6 14.9 9.2
Kozhikode 13 10 4.5 18.7 14.2 11 3 8.8 26.5 17.6
Pathanamthitta 9 11 7.4 14.3 6.9 6 6 14.4 24.1 9.7
Kollam 12 12 4.9 14.1 9.3 1 5 18.0 25.4 7.4
Alappuzha 10 13 6.0 12.8 6.8 7 4 13.8 25.8 12.0
Thiruvananthapura
m
14 14 4.3 11.6 7.3 3 2 15.7 28.8 13.0
KERALA 8.0 25.2 17.2 11.7 21.2 9.5
Coefficient of Variation(CV) 0.33 0.41 0.32 0.26
Standard Deviation(SD) 2.57 9.68 3.95 5.63
Krtscha index(CV*SD) 0.85 3.94 1.28 1.47
Bathing Facility
There is an increasing trend in creating private bathing facilities within the residential space or
its premises. This is especially, so in urban areas where public bathing facility is almost absent in
Kerala. This is now more common along with an increase in the quality of housing conditions. In
2011, 86 percent of households in Kerala have bathing facilities while the percentage of
households having these facilities has increased by 24 percentage points from 2001 to 2011.
Though there are higher percentage of households with bathing facilities within the premises at
the state level but it varies across districts; Thrissur (96 percent) has highest percentage of
households followed Ernakulam (93 percent), Kannur (92 percent) and Kozhikode (91 percent).
Idukki (74 percent) had the lowest proportion of households with bathroom facility within
premises. While comparing with 2001, Alappuzha has recorded highest percentage point
increase of 33 percentage points and has also jumped from 12th
rank in 2001 to 8 rank in 2011.

87
While Thrissur has recorded lowest percentage point increase of 16 percentage points in the
same time period. As per the coefficient of variation, the variation has decreased from 17
percent in 2001 to 8 percent in 2011. The value of Krtscha index has also declined from 1.8 in
2001 to 0.57 in 2011 which indicates that the spatial inequality between the districts in terms of
percentage of households with bathing facilities decreased from 2001 to 2011.
Table 5.9: District wise distribution of bathing facilities
Bathing facility
Districts rank
2001
rank
2011
2001 2011 %age point
change
Thrissur 1 1 79.7 95.7 16.0
Ernakulam 2 2 77.0 93.4 16.4
Kannur 3 3 69.3 91.5 22.2
Kozhikode 4 4 66.9 89.7 22.8
Malappuram 5 5 66.2 89.4 23.2
Kasaragod 7 6 61.3 88.5 27.1
Kottayam 6 7 63.0 86.8 23.8
Alappuzha 12 8 51.7 84.4 32.6
Palakkad 9 9 54.2 81.5 27.3
Kollam 10 10 53.9 80.3 26.4
Pathanamthitta 8 11 57.3 80.2 22.9
Wayanad 13 12 49.2 79.0 29.9
Thiruvananthapuram 11 13 52.3 74.0 21.6
Idukki 14 14 44.7 73.6 28.9
KERALA 62.1 85.8 23.7
Coefficient of Variation(CV) 0.17 0.08
Standard Deviation(SD) 10.43 6.96
Krtscha index(CV*SD) 1.80 0.57
Type of roof
There is a widespread tendency in using raw materials and techniques to build physically more
stronger buildings including houses. It is mostly by using concrete using cement mortar and iron
bars, Kerala is no exception. In 2011, 47 percent of households in Kerala have houses with
concrete roof while the percentage of households has nearly doubled from 26 percent in 2001 by
22 percentage points. Ernakulam (64 percent) has the maximum percentage of households with
concrete roof followed by Thrissur (59 percent) and Kozhikode (56 percent). Idukki (21 percent)
had the lowest proportion of households with concrete roof followed by Wayanad (28 percent)

88
and Kottayam (30 percent). While comparing with 2001, Malappuram has recorded highest
percentage point increase of 28 percentage points. While Idukki has recorded lowest percentage
point increase of 11 percentage points from 2001 to 2011. As per the coefficient of variation, the
variation has decreased from 37 percent in 2001 to 29 percent in 2011. The value of Krtscha
index has also declined from 3.33 in 2001 to 3.66 in 2011 which indicates that the spatial
inequality between the districts in terms of percentage of households with concrete roof has
slightly increased from 2001 to 2011.
Table 5.10: District wise percentage of households with a concrete roof in year
2001 and 2011
Concrete roof
Districts rank
2001
rank
2011
2001 2011 PPC
Ernakulam 1 1 41.72 64.13 22.40
Thrissur 2 2 36.41 59.41 23.01
Kozhikode 4 3 29.52 56.08 26.56
Thiruvananthapuram 3 4 31.34 53.77 22.43
Kannur 6 5 28.12 52.38 24.26
Malappuram 9 6 21.55 49.61 28.06
Kollam 5 7 28.15 48.81 20.65
Kasaragod 8 8 23.37 48.00 24.63
Pathanamthitta 7 9 25.09 41.87 16.79
Alappuzha 10 10 20.91 38.83 17.92
Kottayam 11 11 18.87 33.95 15.08
Palakkad 13 12 12.83 30.10 17.27
Wayanad 12 13 13.03 27.95 14.91
Idukki 14 14 10.48 21.09 10.61
KERALA 26.46 47.97 21.51
Coefficient of Variation(CV) 0.37 0.29
Standard Deviation(SD) 9.01 12.79
Krtscha index(CV*SD) 3.33 3.66
Type of floor
Along with the invasion of the use of reinforced cement concrete (RCC), there is also another
trend in the use of high cost and high-energy intensive tiles and mosaic as floor materials. In
2011, 23 percent of households in Kerala have houses with floor of mosaic/floor tiles while the
percentage of households has increased from 10 percent in 2001 by 13 percentage points.

89
Ernakulam (30 percent) has the maximum percentage of households have floor of mosaic/floor
tiles followed by Thrissur (29 percent) and Pathanamthitta (27 percent). Idukki (8 percent) had
the lowest proportion of households with floor of mosaic/floor tiles followed by Wayanad (9
percent) and Palakkad (17 percent). While comparing with 2001, Ernakulam has recorded
highest percentage point increase of 17 percentage points. While Idukki and Wayanad have
recorded lowest percentage point increase of 6 percentage points from 2001 to 2011. As per the
coefficient of variation, the variation has decreased from 42 percent in 2001 to 31 percent in
2011. The value of Krtscha index has increased from 1.55 in 2001 to 2.09 in 2011 which
indicates that the spatial inequality between the districts in terms of percentage of households
with floor material of mosaic/floor tiles has increased from 2001 to 2011.
Table 5.11: district wise Percentage of households with floor material of
mosaic/floor tiles
floor tiles/mosaic
Districts rank 2001 rank 2011 2001 2011 PPC
Ernakulam 2 1 13.87 30.82 16.95
Thrissur 3 2 13.01 29.07 16.06
Pathanamthitta 5 3 10.16 26.56 16.39
Kottayam 6 4 9.04 25.44 16.40
Kozhikode 4 5 11.78 25.15 13.36
Thiruvananthapuram 1 6 14.37 24.80 10.43
Kannur 7 7 8.84 22.66 13.82
Malappuram 8 8 8.80 21.97 13.18
Kollam 9 9 7.97 20.76 12.79
Alappuzha 12 10 6.24 18.61 12.37
Kasaragod 10 11 7.95 18.32 10.37
Palakkad 11 12 6.32 16.72 10.40
Wayanad 13 13 2.89 8.92 6.03
Idukki 14 14 2.19 8.48 6.29
Kerala 9.78 22.92 13.14
Coefficient of Variation(CV) 0.42 0.31
Standard Deviation(SD) 3.70 6.68
Krtscha index(CV*SD) 1.55 2.09
Type of wall
Here we focus on two types of materials used for wall; stone packed wall and burnt bricks. In
2011 majority of the households in Kerala (57 percent) predominantly use stone packed wall and
90
is increased by 23 percentage points from 2001 to 2011 and 23 percent of households use
predominantly burnt brick as a wall material which is decreased by 7 percentage points from
2001 to 2011. The percentage of households using stone wall vary from districts from 88 percent
to 19 percent with maximum in Ernakulam and minimum in Wayanad in 2011. In contrast, the
percentages of households using burnt brick across districts vary from 56 percent and one
percent with maximum in Wayanad and minimum in Ernakulam in 2011. From 2001 to 2011
the percentage of households using stone packed wall in all the districts have increased with
Thiruvananthapuram (38 percentage points) showing highest increase and Kozhikode (15
percentage points) the lowest. The percentage of households using burnt brick is decreased in all
districts except Idukki and Wayanad which have recorded a positive percentage point increase
from 2001 to 2011.The variation of districts from the mean was 74 percent in 2001 and has
reduced to 42 percent in 2011 in stone packed material for constructing wall. The variation in the
percentage of households across districts using burnt brick as a predominant material for wall has
increased from 66 percent in 2001 to 68 percent in 2011. According to Krtscha index the
inequality across districts seem to have reduced as the value of index have decreased in both the
cases from 2001 to 2011.

91
Table 5.12: district wise Percentage of households by types of wall material in 2001 and 2011
Stone packed with/without mortar Burnt brick
Districts rank
2001
rank
2011
2001 2011 PPC rank
2001
rank
2011
2001 2011 PPC
Kozhikode 1 1 72.96 88.08 15.11 14 14 1.25 1.09 -0.16
Malappuram 2 2 64.39 85.52 21.13 12 13 3.77 1.93 -1.84
Kasaragod 3 3 62.80 84.94 22.15 13 11 3.53 2.21 -1.32
Kannur 4 4 58.76 83.43 24.67 11 12 4.11 1.94 -2.17
Ernakulam 5 5 47.09 60.95 13.85 5 8 41.58 28.89 -12.69
Thrissur 6 6 30.57 53.37 22.80 8 10 37.19 27.00 -10.20
Kollam 8 7 20.99 46.83 25.84 4 6 44.02 34.58 -9.44
Kottayam 7 8 26.52 43.10 16.57 6 4 41.56 37.56 -3.99
Thiruvananthapuram 13 9 3.83 42.17 38.35 7 9 40.15 28.78 -11.37
Palakkad 9 10 19.82 39.10 19.28 9 7 30.28 29.28 -1.00
Pathanamthitta 11 11 17.81 38.74 20.93 3 3 46.54 39.51 -7.04
Idukki 10 12 19.32 37.41 18.08 10 5 29.60 35.07 5.47
Alappuzha 12 13 8.30 35.38 27.08 1 2 67.45 49.78 -17.67
Wayanad 14 14 1.86 19.08 17.22 2 1 55.11 55.51 0.40
Kerala 33.50 56.86 23.36 31.65 24.50 -7.15
Coefficient of Variation(CV) 0.74 0.42 0.66 0.68
Standard Deviation(SD) 24.09 22.59 21.05 18.13
Krtscha index(CV*SD) 17.85 9.42 13.91 12.34
In sum what we find is that Kerala has achieved a remarkable reduction in inter-district
inequality as far as the basic housing condition is concerned. When same additional features such
as use of RCC, tiles and mosaic and access to LPG as cooking energy are concerned, these is an
increase in inter-district inequality that most likely could be a reflection of increasing economic
inequality.

92
Chapter 6
Deficiencies in Housing Condition and
Policy Implications
6.1 Introduction
There are remarkable advances made by Kerala in improving the housing condition of its people.
This is evident in its position relative to other states in India (see Chapter 2). Also it has made
significant progress during the inter-census period of 2001 and 2011. This is in line with
Kerala’s continuing lead in other human development indicators such as per capita income,
education and health. Kerala also has very low level of poverty compared to other states
represented by the Multidimensional Poverty Index. This is the comparative picture.
Having said that, there remains a certain degree of deficiency in absolute terms in the overall
housing condition represented by the core indicators selected for this study. In this chapter we
attempt to give a measure of these deficiencies in terms of the ‘most poor’ indicators in the basic
set of indicators in housing condition and amenities. These are represented by
(i) dilapidated housing structure
(ii) one-room tenements (including houses with no exclusive room),
(iii) no latrine facility,
(iv) no separate kitchen,
(v) no electricity for lighting,
(vi) physical access to drinking water measured by distance,
(vii) no LPG for cooking.
These are self-evident except the last one. Here the reference is to the use of firewood
which is the main source of cooking energy. While use of firewood in itself is not a deficiency,
what we are referring is the absence of clean energy for cooking. If smokeless chulah’s are used,
the use of firewood need not be deemed as a deficiency but we do not have the data for that.
We are presenting the number of households experiencing this deficiency as of 2011. In
most cases the gap to be covered has come down drastically and this should make it far easier for
the state to address the deficiency without much of a financial burden. Here the question is how

93
to take care of this last mile groups. We have identified them in terms of three social group’s
viz., ST, SC and Others. This is because the last group has made considerably more progress
than the former two. The deficiencies experienced by ST and SC groups are disproportionate to
their population size. Therefore, we present the deficiency in core housing condition for the total
population as well as ST, SC and others. In addition we have also presented the district-wise
picture. So that it will help policy makers to target the regard remedial measures according to
districts and social groups simultaneous. Table 1 gives an overview of the total household share
in the districts across social groups and share of districts in the households in the state. We also
distinguished the districts into broader state
Table 6.1: Distribution of total occupied houses across districts and by social groups, 2011
Total SC ST others
District Total
houses
% Total
houses
% Total
houses
% Total
houses
%
Kasaragod 267762 3.47 12129 4.53 11809 4.41 243824 91.06
Kannur 543209 7.04 20289 3.74 10150 1.87 512770 94.40
Wayanad 185403 2.40 9588 5.17 33053 17.83 142762 77.00
Kozhikode 683825 8.86 48028 7.02 5194 0.76 630603 92.22
Malappuram 774595 10.04 64571 8.34 6285 0.81 703739 90.85
Palakkad 628287 8.14 92207 14.68 14206 2.26 521874 83.06
Total (Northern
districts )
3083081 39.96 246812 8.01 80697 2.62 2755572 89.38
Thrissur 743830 9.64 87367 11.75 4499 0.61 651964 87.65
Ernakulam 791737 10.26 66355 8.38 6416 0.81 718966 90.81
Total (Central
districts)
1535567 19.90 153722 10.01 10915 0.71 1370930 89.28
Idukki 276976 3.59 40103 14.48 16776 6.06 220097 79.46
Kottayam 480453 6.23 38341 7.98 7520 1.57 434592 90.45
Alappuzha 528275 6.85 49925 9.45 2722 0.52 475628 90.03
Pathanamthitta 319968 4.15 41949 13.11 3138 0.98 274881 85.91
Kollam 663276 8.60 81875 12.34 4587 0.69 576814 86.96
Thiruvananthapuram 828774 10.74 98438 11.88 9651 1.16 720685 86.96
Total (Southern
districts)
3097722 40.14 350631 11.32 44394 1.43 2702697 87.25
Kerala 7716370 100 751165 9.73 136006 1.76 6829199 88.50 *This percentage refers to the share of SC or ST in the district’s total number of houses whereas the
percentage in column 3 refers to the share of the district in the total houses in the state.
regions into Northern, central and southern districts. Thiruvananthapuram, Ernakulam and
Malappuram are densely populated districts which constitute one third of Kerala’s households
while Idukki, Wayanad and Kasaragod are sparsely populated districts in Kerala. Palakkad (15

94
percent) district has the highest proportion of Schedule Caste households closely followed by
Idukki (14 percent) and Pathanamthitta (13 percent). While Kannur (4 percent) and Kasaragod (5
percent) have the lowest proportion of SC households in 2011, Wayanad (18 percent) has the
highest proportion of Schedule Tribe households followed by Idukki (6 percent). In case of
regions, northern districts (2.6 percent) have the highest share of ST households in their take has
and southern districts (11 percent) have the highest share of SC households though the difference
in the share with respect to other regions is not large, particularly in case of SC households.
The following sections present the deficiencies in each of the basic indicators of housing
conditions as mentioned earlier, by districts which make it possible to identify the deficiency
spatially as well as across social group.
6.2 Dilapidated Houses
The following section provides the analysis of condition of housing with respect to dilapidated
houses across districts and social groups in year 2011. There are five percent of dilapidated
houses in Kerala as a whole. In terms of districts, Thiruvananthapuram (8 percent) has the
maximum and Mallapuram (3 percent) has the minimum. As per the percentage share, 50 percent
of the total dilapidated houses are in southern districts while its population share is only 40
percent. Thiruvananthapuram (16 percent) has the highest share of dilapidated houses followed
by Kollam (11 percent) while Pathanamthitta (4 percent) and Kasaragod (4 percent) has the
lowest share of dilapidated houses in Kerala. Looking at the distribution of dilapidated houses
across social groups namely SC, ST and Others within districts; the share in dilapidated houses
among SC/ST households is higher than their respective population share in each district and
region. In Pathanamthitta, 33 percent of the total dilapidated houses belong to SC households of
whose total share in total houses is 13 percent. Kannur (15 percent) has the lowest SC household
share to total dilapidated houses in the district, which is similar to the percentage share of SC
households to total households in the district. Wayanad (39 percent) has highest share of ST
households in total dilapidated houses followed by Kasaragod (17 percent) and Idukki (11
percent). While Alappuzha has the lowest share of ST households in the total dilapidated houses
in district.

95
At the broader regional level, southern districts (15 percent) have the highest proportion
of dilapidated houses belonging to SC households. While in the northern districts (10 percent)
the highest share of dilapidated houses belongs to ST households with respect to other regions of
the state. The percentage shares of dilapidated houses are disproportionate to their share of total
households. Southern districts have 11 percent of total share to its total households and northern
districts have three percent of ST households to its total households.
Table 6.2: Dilapidated House (DH) by district and social groups, 2011
District % of
DH
total
houses
Total SC ST Others
No. of
houses
dilapidated
% total
houses
% total
houses
% total
houses
%
Kasaragod 5.77 15463 3.80 1472 9.52 2684 17.36 11307 73.12
Kannur 3.61 19594 4.82 728 3.72 1762 8.99 17104 87.29
Wayanad 8.89 16489 4.06 1039 6.3 6385 38.72 9065 54.98
Kozhikode 4.58 31308 7.70 3206 10.24 368 1.18 27734 88.58
Malappuram 3.45 26689 6.57 3619 13.56 819 3.07 22251 83.37
Palakkad 4.87 30589 7.53 5958 19.48 2333 7.63 22298 72.9
Total of Northern
districts
4.55 140132 34.48 16022 11.43 14351 10.241 109759 78.33
Thrissur 4.44 33002 8.12 3673 11.13 211 0.64 29118 88.23
Ernakulam 3.71 29359 7.22 2866 9.76 589 2.01 25904 88.23
Total of Central
districts
4.06 62361 15.34 6539 10.49 800 1.283 55022 88.23
Idukki 7.98 22104 5.44 2934 13.27 2451 11.09 16719 75.64
Kottayam 4.05 19478 4.79 3028 15.55 667 3.42 15783 81.03
Alappuzha 7.04 37188 9.15 3956 10.64 168 0.45 33064 88.91
Pathanamthitta 4.65 14893 3.66 4971 33.38 403 2.71 9519 63.92
Kollam 6.60 43764 10.77 8357 19.1 551 1.26 34856 79.65
Thiruvananthapuram 8.02 66500 16.36 8242 12.39 1421 2.14 56837 85.47
Total of Southern
districts
6.58 203927 50.18 31488 15.44 5661 2.77 166778 81.78
Kerala 5.27 406420 100 54049 13.3 20812 5.12 331559 81.58

96
6.3 Deficiency in Space: Houses with only One Room
In Table 3 we give the data on one room also includes the no exclusive room category. The
percentage of no exclusive room’s category is around one percent of the total households in
Kerala and the percentages across the districts are more or less the same. Hence we clubbed the
both categories together to represent the deficiencies in the space in Kerala. In 2011, 8 percent
of the households in Kerala have only room. Idukki (15 percent) has the highest
Table 6.3: Deficiency in space: Distribution of one room (including no exclusive room) by district and
social groups, 2011
District %age of
houses with
one room to
total houses
Total SC ST Others
No. of
houses
% ST total
houses
%
DT
total
houses
%
DT
total
houses
%
DT
Kasaragod 10.98 29388 4.56 2756 9.38 3237 11.01 23395 79.61
Kannur 5.23 28383 4.40 2306 8.12 2096 7.38 23981 84.49
Wayanad 11.63 21570 3.34 1761 8.16 7086 32.85 12723 58.98
Kozhikode 7.97 54491 8.45 8290 15.21 874 1.6 45327 83.18
Malappuram 6.26 48457 7.51 7559 15.6 1204 2.48 39694 81.92
Palakkad 11.79 74048 11.48 14000 18.91 4857 6.56 55191 74.53
Total of Northern
districts
8.31 256337 39.74 36672 14.31 19354 7.55 200311 78.14
Thrissur 7.79 57935 8.98 13701 23.65 855 1.48 43379 74.88
Ernakulam 6.11 48400 7.50 7866 16.25 1178 2.43 39356 81.31
Total of Central
districts
6.92 106335 16.48 21567 20.28 2033 1.912 82735 77.81
Idukki 14.55 40301 6.25 12393 30.75 3403 8.44 24505 60.8
Kottayam 6.69 32165 4.99 5151 16.01 839 2.61 26175 81.38
Alappuzha 8.65 45685 7.08 8099 17.73 406 0.89 37180 81.38
Pathanamthitta 7.58 24268 3.76 7519 30.98 512 2.11 16237 66.91
Kollam 8.88 58892 9.13 14436 24.51 851 1.45 43605 74.04
Thiruvananthapuram 9.78 81083 12.57 16405 20.23 1909 2.35 62769 77.41
Total of Southern
districts
9.12 282394 43.78 64003 22.66 7920 2.805 210471 74.53
Kerala 8.36 645066 100 122242 18.95 29307 4.54 493517 76.51
Note: % ST means percentage share in state total.
% DT means percentage share in district total
percentage of houses with one room followed by Palakkad (12 percent) and Wayanad (12).
Kannur (5 percent) has the lowest percentage of houses with one room followed by Mallapuram
(6 percent). In terms of broader regions; southern districts (9 percent) has the highest percentage

97
of houses with one room and Central districts (7 percent) on an average has the minimum
percentage of houses with one room. The distribution of houses with one room across social
groups reveals that the share of SC and ST households is disproportionate to their share in total
households share. The disproportionality in the share is more prominent in SC households with
the exception of Wayanad district where the share of ST households with one room houses is the
highest with respect to other districts. SC’s in southern districts (22 percent) has the highest
share in total one room houses with respect to their share (11 percent) to their total houses in
Kerala which is closely followed by central districts whose share of SC households with one
room to total one room houses is 20 percent and its respective share SC households to total
houses is 10 percent. However the share of ST houses is highest in the northern districts where
Wayanad (33 percent) has the highest share of ST houses with one room followed by Kasaragod
(11 percent).
6.4 Houses without a latrine
In Table 4 we present the statistics on the deficiency in latrine facilities across districts and its
distribution across social groups in 2011. We also account the distribution of no latrines houses
into; those who depend on open defecation and others who use public latrines. On an average 5
percent of the total houses do not have latrines; out of which 77 percent depend on open
defecation and the rest use public latrines. The percentage of no latrine households varies across
districts with the maximum in Palakkad (10 percent) and minimum in central districts (2
percent). In terms of the total share of no latrine households across districts, 50 percent of them
reside in four districts namely Palakkad (17 percent), Thiruvananthapuram (13 percent), Kollam
(10 percent) and Alappuzha (10 percent). The share of no latrine households disproportionally
belongs to SC and ST households in general and SC in particular across districts. With respect to
broader regional level; southern districts constitute 50 percent of the households with no latrines
and other 40 percent in northern districts and 10 percent in central districts. But out of these,
relatively smaller percentages of households with no latrines in southern and central districts
open defecate than northern districts. Among social groups; Schedule Caste share 22 percent of
houses with no latrines in northern districts, 32 percent in central districts and 3 percent in
southern districts while the total household share is 8 percent, 10 percent and 11 percent
respectively. Schedule Tribes share 17 percent of houses with no latrines in northern districts, 4

98
Table 6.4: Houses without a latrine across districts and social groups, 2011
District No
latrines
(% )
Total SC
total
houses
with no
latrine
Share
in
total
(%)
Of which total
houses
with no
latrine
Share
in
total
%
Of which
open
defecate
(%)
Use public
latrines
(%)
open
defecate
(%)
Use pub
latrines
(%)
Kasaragod 8.22 22015 5.94 86.18 13.82 3393 15.41 90.66 9.34
Kannur 2.35 12773 3.45 74.65 25.35 1472 11.52 75.82 24.18
Wayanad 8.22 15233 4.11 80.98 19.02 962 6.32 73.18 26.82
Kozhikode 2.19 14983 4.05 67.37 32.63 3944 26.32 68.61 31.39
Malappuram 2.65 20521 5.54 70.94 29.06 6128 29.86 65.36 34.64
Palakkad 10.21 64145 17.32 92.13 7.87 17529 27.33 92.10 7.90
Total of Northern dists 4.85 149670 40.41 83.25 16.75 33428 22.33 83.02 16.98
Thrissur 2.15 16007 4.32 68.64 31.36 6047 37.78 69.21 30.79
Ernakulam 2.15 16994 4.59 60.70 39.30 4741 27.90 63.59 36.41
Total of Central dists 2.15 33001 8.91 64.55 35.45 10788 32.69 66.74 33.26
Idukki 10.87 30098 8.13 86.08 13.92 7093 23.57 80.83 19.17
Kottayam 3.40 16329 4.41 75.57 24.43 4239 25.96 76.98 23.02
Alappuzha 7.07 37340 10.08 75.96 24.04 10784 28.88 80.76 19.24
Pathanamthitta 6.09 19484 5.26 78.71 21.29 8356 42.89 78.99 21.01
Kollam 5.51 36518 9.86 73.55 26.45 13632 37.33 77.18 22.82
Thiruvananthapuram 5.79 47953 12.95 73.03 26.97 14331 29.89 75.77 24.23
Total of Southern dists 6.06 187722 50.68 76.62 23.38 58435 31.13 78.17 21.82
Kerala 4.80 370393 100 78.22 21.78 102651 27.71 78.55 21.45
District ST Others
Kasaragod - 3821 17.36 91.81 8.19 14801 67.23 83.70 16.30
Kannur - 2003 15.68 83.97 16.03 9298 72.79 72.46 27.54
Wayanad - 9145 60.03 82.67 17.33 5126 33.65 79.44 20.56
Kozhikode - 522 3.48 87.16 12.84 10517 70.19 65.92 34.08
Malappuram - 1601 7.80 86.26 13.74 12792 62.34 71.70 28.30
Palakkad - 8387 13.08 96.91 3.09 38229 59.60 91.10 8.90
Total of Northern dists - 25479 17.02 89.15 10.85 90763 60.64 81.67 18.33
Thrissur - 378 2.36 81.22 18.78 9582 59.86 67.79 32.21
Ernakulam - 1023 6.02 89.64 10.36 11230 66.08 56.84 43.16
Total of Central dists - 1401 4.25 87.37 12.63 20812 63.06 61.88 38.12
Idukki - 6262 20.81 92.64 7.36 16743 55.63 85.84 14.16
Kottayam - 929 5.69 86.65 13.35 11161 68.35 74.12 25.88
Alappuzha - 353 0.95 72.80 27.20 26203 70.17 74.03 25.97
Pathanamthitta - 820 4.21 88.90 11.10 10308 52.90 77.67 22.33
Kollam - 923 2.53 84.72 15.28 21963 60.14 70.83 29.17
Thiruvananthapuram - 2778 5.79 96.87 3.13 30844 64.32 69.61 30.39
Total of Southern dists - 12065 6.43 91.71 8.29 117222 62.44 74.28 25.72
Kerala - 38945 10.51 89.88 10.12 228797 61.77 76.09 23.91

99
percent in central districts and 6 percent in southern districts while the total household share is
three percent, less than one percent and one percent respectively. This reveals that the deficiency
is much higher among SC and ST households even in central districts where the situation is
relatively better.
6.5 Deficiency in Cooking Facility: No Separate Kitchen
The deficiency in the cooking facility in terms of households who do not have separate kitchen
across districts and social groups in 2011 is given in Table 5. There are three percent of
households in Kerala which do not have separate kitchen facility in the house. The variations
across districts are very less with Pathanamthitta (6 percent) has the maximum number of
households without separate kitchen and Thrissur (2 percent) has the minimum. As per the share
of households without separate kitchen, five districts constitute more than 50 percent of such
households; Thiruvananthapuram (12 percent), Kollam (11 percent), Alappuzha and Palakkad
(10 percent each), and Kozhikode (8 percent). If we look at the regional level, southern districts
have more than fifty percent of all households with no separate kitchen, is disproportionate to its
share of total households in Kerala. Among social groups the percentage share of households
without separate kitchen belongs to SC households disproportionate to its population size more
likely from southern districts.

100
6.6 Deficiency in Lighting: No Electricity
In this section we present the households without electricity across districts and social groups in
2011 in Table 6. The households without electricity mainly constitute those who use kerosene as
a source of lighting. The category also includes households without any kind of lighting which
constitute less than one percent of the households in Kerala. The percentage of households
without electricity is 6 percent to total households in Kerala and northern districts on an average
have higher percentage of households without electricity with respect to other regions. The
percentages vary across districts with highest percentage of households without electricity from
19 percent in Wayanad followed by Idukki (12 percent) and Kasaragod (11 percent) to lowest in
Ernakulam, Kottayam and Thrissur with 3 percent each. As the share of households without
electricity, more than fifty percent of them reside in northern districts and one third of total
reside in Kozhikode (10 percent), Mallapuram (10 percent) and Palakkad (9 percent). The
Table 6.5 Availability of kitchen-no separate kitchen by district and social groups
District No
separate
kitchen (%
of total
houses)
Total SC ST Others
total
houses
% total
houses
% total
houses
% total
houses
%
Kasaragod 2.84 7602 3.00 770 10.13 1009 13.27 5823 76.6
Kannur 2.03 11031 4.36 814 7.38 1092 9.9 9125 82.72
Wayanad 5.84 10832 4.28 788 7.27 3789 34.98 6255 57.75
Kozhikode 2.88 19713 7.79 3843 19.49 352 1.79 15518 78.72
Malappuram 2.11 16365 6.47 2858 17.46 589 3.6 12918 78.94
Palakkad 3.98 25011 9.89 4911 19.64 2408 9.63 17692 70.74
Total of Northern dists 2.94 90554 35.79 13984 15.44 9239 10.203 67331 74.35
Thrissur 1.91 14223 5.62 3359 23.62 188 1.32 10676 75.06
Ernakulam 1.93 15266 6.03 2878 18.85 446 2.92 11942 78.23
Total of Central dists 1.92 29489 11.66 6237 21.15 634 2.150 22618 76.70
Idukki 5.94 16442 6.50 2702 16.43 2033 12.36 11707 71.2
Kottayam 3.23 15527 6.14 2571 16.56 488 3.14 12468 80.3
Alappuzha 4.65 24582 9.72 5375 21.87 209 0.85 18998 77.28
Pathanamthitta 6.11 19535 7.72 5959 30.5 443 2.27 13133 67.23
Kollam 4.11 27264 10.78 7033 25.8 438 1.61 19793 72.6
Thiruvananthapuram 3.57 29602 11.70 7325 24.74 705 2.38 21572 72.87
Total of Southern
districts
4.29 132952 52.55 30965 23.29 4316 3.246 97671 73.46
Kerala 3.28 252995 100 51186 20.23 14189 5.61 187620 74.16

101
distribution across social groups suggests that the SC and ST households have higher share of
households without electricity with respect to their share in total households.
For SC households have the higher share across districts which are highly disproportionate to
their share in total households and on average central districts have the highest share with respect
to other regions while ST households without electricity have the highest share in northern
districts.
Table 6.6: Source of lighting-no electricity for lighting by district and social groups, 2011
District percentage
of total
households
in Kerala
Total SC ST Others
total
houses
%age
share
total
houses
%age
distr.
total
houses
%age
distr.
total
houses
%age
distr.
Kasaragod 11.24 30092 6.97 3632 12.07 5666 18.83 20794 69.10
Kannur 5.90 32042 7.42 2546 7.95 3893 12.15 25603 79.90
Wayanad 19.17 35539 8.23 2483 6.99 16511 46.46 16545 46.55
Kozhikode 6.17 42165 9.77 9014 21.38 1055 2.50 32096 76.12
Malappuram 5.74 44476 10.30 10533 23.68 2347 5.28 31596 71.04
Palakkad 6.48 40704 9.43 11431 28.08 6651 16.34 22622 55.58
Total of Northern
districts
7.30 225018 52.13 39639 17.62 36123 16.05 149256 66.33
Thrissur 2.99 22205 5.14 7948 35.79 622 2.80 13635 61.41
Ernakulam 2.58 20450 4.74 5865 28.68 1337 6.54 13248 64.78
Total of Central districts 2.78 42655 9.88 13813 32.38 1959 4.59 26883 63.02
Idukki 11.60 32132 7.44 5633 17.53 7016 21.83 19483 60.63
Kottayam 3.42 16414 3.80 3800 23.15 879 5.36 11735 71.49
Alappuzha 3.85 20362 4.72 5905 29.00 279 1.37 14178 69.63
Pathanamthitta 5.52 17672 4.09 6902 39.06 736 4.16 10034 56.78
Kollam 4.90 32509 7.53 12775 39.30 944 2.90 18790 57.80
Thiruvananthapuram 5.42 44902 10.40 13894 30.94 2693 6.00 28315 63.06
Total of Southern
districts
5.29 163991 37.99 48909 29.82 12547 7.65 102535 62.52
Kerala 5.59 431664 100 102361 23.71 50629 11.73 278674 64.56

102
6.7 Ease of Accessing Drinking Water
In Table 7 we present the statistics relating to the ease of accessing drinking water measured by
distance. Census measures distance through three indicators: first, within the premises; second,
near the premises; third, away from the premises. The first category is self-explanatory and the
last two were defined on the basis of the distance in meters from the household to the location of
the source of drinking water. If the source of drinking water is located 100 metres from the
premises in urban areas and 500 metres in rural areas was defined as near premises and beyond
this limit is defined as away from the premises. We took deficiency in the ease of accessing
drinking water by the number of households whose drinking water source is far away from the
premises i.e. beyond 500 metres in rural areas and beyond 100 metres in urban areas.
In 2011, 16 percent of households in Kerala have water sources away from the premises
and across districts; more than fifty percent of the households in Wayanad and one third
household in Idukki have drinking water sources far away from the premises. The lowest
percentages of households are in southern districts (9 percent) with such type of drinking water
access. In case of the share of households with drinking water sources far away from the
premises across districts, southern districts have the highest share of such households. The
highest share across districts is Idukki (12 percent) and lowest share of such households is in
Pathanamthitta (4 percent). The distribution of such houses across social groups in each district
is revealing. In many of the districts the share of SC households in the households with drinking
water sources away from the premises is much higher than their respective share in total
households and districts such as in districts like Kollam (30 percent), Pathanamthitta (27
percent), Thrissur (27 percent), Palakkad (26 percent), Mallapuram (20 percent) and
Thiruvananthapuram ( 23 percent) has the SC household share which range from 20 percent to
30 percent while as their respective share in total households ranges from 8 percent to 15
percent. The share is ST households is higher in Wayanad (18 percent) followed by Idukki (6
percent).

103
Table 6.7: drinking water facility-far away from all sources by district and social groups in 2011
District Percentage
of total
households
in Kerala
Total SC ST Others
total
houses
%age
share
total
houses
%age
distr.
total
houses
%age
distr.
total
houses
%age
distr.
Kasaragod 23.79 63708 5.05 6206 9.74 8474 13.3 49028 76.96
Kannur 14.39 78176 6.19 5896 7.54 5680 7.27 66600 85.19
Wayanad 32.23 59764 4.73 4010 6.71 16332 27.33 39422 65.96
Kozhikode 16.25 111100 8.80 17044 15.34 2250 2.03 91806 82.63
Malappuram 13.10 101438 8.04 20062 19.78 2332 2.3 79044 77.92
Palakkad 17.01 106882 8.47 27332 25.57 7164 6.7 72386 67.73
Total of Northern
districts
16.90 521068 41.28 80550 15.46 42232 8.10 398286 76.44
Thrissur 9.28 69046 5.47 18504 26.8 996 1.44 49546 71.76
Ernakulam 9.63 76206 6.04 13450 17.65 1700 2.23 61056 80.12
Total of Central
districts
9.46 145252 11.51 31954 22.00 2696 1.86 110602 76.14
Idukki 54.37 150584 11.93 21222 14.09 14366 9.54 114996 76.37
Kottayam 24.21 116324 9.22 18228 15.67 4192 3.6 93904 80.73
Alappuzha 22.59 119316 9.45 18896 15.84 774 0.65 99646 83.51
Pathanamthitta 17.07 54610 4.33 14638 26.8 1346 2.46 38626 70.73
Kollam 9.12 60472 4.79 17910 29.62 952 1.57 41610 68.81
Thiruvananthapuram 11.42 94646 7.50 21928 23.17 2516 2.66 70202 74.17
Total of Southern
districts
19.24 595952 47.21 112822 18.93 24146 4.05 458984 77.02
Kerala 16.36 1262272 100 225326 17.85 69074 5.47 967872 76.68
6.8 Deficiency in Clean Cooking Energy
The importance of examining cooking energy is from the point of the health of the women
although the census questionnaire may not have factored this point of views. In Table 8, we
present the deficiency in clean cooking energy across districts and social groups in 2011. As we

104
discussed earlier the deficiency of clean energy is measured in terms of number of households
using firewood as a predominant source of cooking fuel. There are only two predominant sources
of cooking energy in Kerala firewood and LPG/PNG. The households using other sources other
than LPG/PNG and firewood is less than half a percent of total households in Kerala. Here we
are focussing here on the poor source of cooking energy i.e. firewood. Majority of the
households in Kerala use firewood predominantly as a source of cooking energy in 2011 which
ranges from 88 percent in Wayanad and 37 percent in Ernakulam. In terms of the share of
households across districts around half of the total households using firewood as a predominant
fuel for cooking reside in northern districts. The central districts have the lowest share and the
southern districts are just maintaining its share to its total household share. Among the social
groups there does not seem to have a difference in using firewood with respect to Other
households. The schedule castes have a higher share in districts like Palakkad and Idukki (16
percent each), and Kollam (12 percent) and for schedule tribes the share is higher in Wayanad
(20 percent).

105
Table 6.8: cooking energy other than LPG (Firewood) by district and social groups, 2011
Districts Percentage
of total
households
in Kerala
Total SC ST Others
total
houses
%age
share
total
houses
%age
distr.
total
houses
%age
distr.
total
houses
%age
distr.
Kasaragod 72.33 193670 3.91 7865 4.06 10823 5.59 174982 90.35
Kannur 78.76 427853 8.64 6343 1.48 8308 1.94 413202 96.58
Wayanad 87.58 162375 3.28 8550 5.27 32066 19.75 121759 74.99
Kozhikode 78.71 538267 10.87 18059 3.36 2656 0.49 517552 96.15
Malappuram 81.93 634601 12.82 39350 6.20 4464 0.70 590787 93.1
Palakkad 71.61 449901 9.09 70352 15.64 13180 2.93 366369 81.43
Total of Northern
districts
78.06 2406667 48.62 150519 6.25 71497 2.97 2184651 90.77
Thrissur 54.51 405480 8.19 29273 7.22 1905 0.47 374302 92.31
Ernakulam 36.94 292446 5.91 21300 7.28 2468 0.84 268678 91.87
Total of Central
districts
45.45 697926 14.10 50573 7.25 4373 0.63 642980 92.13
Idukki 80.28 222350 4.49 35111 15.79 15724 7.07 171515 77.14
Kottayam 61.03 293240 5.92 25945 8.85 5637 1.92 261658 89.23
Alappuzha 48.06 253883 5.13 22490 8.86 846 0.33 230547 90.81
Pathanamthitta 59.72 191079 3.86 34785 18.2 2532 1.33 153762 80.47
Kollam 60.33 400128 8.08 49385 12.34 2751 0.69 347992 86.97
Thiruvananthapuram 58.54 485184 9.80 45250 9.33 6495 1.34 433439 89.33
Total of Southern
districts
59.59 1845864 37.29 212966 11.54 33985 1.84 1598913 86.62
Kerala 64.16 4950457 100 414058 8.36 109855 2.22 4426544 89.42

106
6.9 Policy Implications
Several issues relating to policy has emerged from our analysis of the housing condition in
Kerala during the last decade. One is that Kerala has been able to register impressive progress in
providing basic housing amenities to an overwhelming majority of its people going by the core
housing indicators that we have selected here. Its progress is impressive on two counts. The
first is the considerable reduction in housing deprivation as we have shown above. The second is
its position in relation to the all India scenario.
Although the latest Kerala State Housing Policy of 2014 recognizes that housing
deprivation should not be based only on the housing structure (either absent or dilapidated),
housing schemes are often planned in terms of number of houses to be provided. The question of
examining housing deprivation in terms of certain core facilities and amenities are often either
missing or postponed to a later date. In that sense, we emphasize the need to assess housing
deprivation in terms of access to the core facilities. When such an approach is taken, the
quantitative dimensions differ and therefore a single number will not suffice for purposes of
policy.
In the Kerala context, what we find is the ‘last mile’ challenge in terms of core facilities.
We have already discussed their total magnitude for all the population and for SC and ST
sections separately by districts. With the available resources from the central government
schemes supplemented by state’s own resources it should be possible for Kerala to abolish
housing deprivation in terms of the core facilities selected here. For effective implementation,
Kerala already has a reasonably well functioning Panchayat Raj (both in villages and urban
areas) that should be assisted and guided by state agencies.
While undertaking the abovementioned task, it is important to note the higher incidence
of housing deprivation among SC and ST sections despite the formulation and implementation of
a number of schemes. Therefore, a higher priority should be accorded to the housing needs of
this section of the population.
At the higher end of the housing spectrum, there is a problem of plenty. Kerala has a
higher percentage of census houses (mostly residential, one presumes) that are unoccupied. A

107
higher taxation for non-occupancy beyond a certain period would yield some resources that
could be utilised for the housing needs of the poor.
While the availability of housing as shelter has only a relatively small backlog, what
Kerala now faces is the inadequacy or absence of certain facilities associated with the idea of a
habitat. Foremost among these is the question of waste management especially in urban areas.
This has now assumed the proportion of social conflicts given the lack of effective collective
mechanisms for collection, processing and disposal or conversion into usable goods. While a
number of rural panchayats and small towns have successfully tackled this issue, the bigger
towns and cities continue to face this as a major challenge. The social and health dimensions of
this problem could get aggravated if timely and adequate steps are not taken by the Government
of Kerala on a priority basis.
Equally important is the inadequacy of drainage facilities. Nearly half the population of
Kerala (as of 2011) lives in urban areas but the drainage facilities are either quite inadequate or
absent. Except in certain important areas of big cities, the existing drainage is of a open canal
kind with a high propensity for health hazards such as breeding of mosquitos and other harmful
consequences. Very little attention is being paid to cover the open drainage system. From the
point of both health and safety of the population, the two immediate tasks before the government
is in the area of instituting an efficient system of waste management and closing of open drains
as well as creating suitable drainage systems in the urban areas.
The question of environmental sustainability in construction – both in housing and other
than housing sectors – has emerged as a serious agenda of concern but very little has been done
beyond grand declarations and some minor initiatives. This is as much true for Kerala as the
country as a whole. In Kerala the issue has affected the cost of construction in a significant way.
The growth in the construction sector has led to the widespread and indiscriminate extraction of
sand from its rivers, canals and wherever one can find one’s hands on. This has not only resulted
in a steep increase in the price of sand but an absolute decline in supply. Currently a substitute
called M-sand is being widely used which is produced by crushing of granites. In addition the
demand for granites had also increased for construction especially in roads, bridges, ports and
other infrastructural facilities. This has led to another widespread and indiscriminate quarrying
of granites littered all over the western ghats in Kerala. Although a licensing system exists, it is

108
believed that there are thousands of unlicensed quarries. Even the licensed ones do not follow
any sustainability principles or remedial measures arising out of negative externalities to the
local area.
In addition to the immediate resource constraints and adverse environmental
consequences, there is the ultimate environmental impact of carbon emissions. The construction
is said to be the single largest sector contributing to at least one-third of the carbon emissions
globally. This calls for a low carbon emitting system of construction. In the Kerala context, the
indiscriminate use of reinforced concrete as well as cement (for plastering, etc.) and steel and
other metallic inputs is hardly compatible with its tropical climate of warm temperature.
Traditional architecture and its construction technologies using mud, bamboo, wood, lime, and
an array of locally available resources have got neglected in the name of ‘modern’ construction
and facilities. Although the topic is beyond the scope of this study, we had mentioned earlier the
alternative architecture of cost-effective and environmentally sustainable technologies that made
an entry into Kerala’s construction sector. However such alternatives continue through
voluntary and private initiatives of a few professional restricting themselves to a niche market.
Despite bombastic policy pronouncements (see Government of Kerala 2011) while releasing
housing policies, there is a no effective public intervention or credible support system to develop
this alternative that has now become imperative given the national commitment to a low carbon
emitting regime.
A number of policy interventions can be made by the Government of Kerala to move
towards what we would call this alternative as a Green Habitat. It should include the
introduction of a new curriculum that incorporates the knowledge and practices in alternative
architecture and construction subjects. Despite the demonstrated feasibility of an alternative
architecture and construction technology of Laurie Baker and a number of his followers, none of
the departments or colleges of architecture in Kerala has thought it appropriate to include it in the
curriculum for architecture and civil engineering students.
Another public intervention could be in the area of developing the skills of workers in the
construction sector. The feasibility of translating new ideas that are environmentally and
economically sustainable depends on the capability of workers to translate them into action.
Given the literate and educated (around 9 to 12 years of schooling) nature of Kerala’s workforce

109
their learning curve in terms of absorbing new ideas and techniques is expected to be quite high.
In fact those working in the alternative construction technology sector will vouch for the seed
with which the workers have learned the new techniques. What is needed is institutional
arrangements for skill development by way of training courses and other programmes to impart
the new knowledge and technologies. The Kerala Academy of Skills Excellence is an
appropriate agency to undertake this task along with other institutional facilities (such as
Polytechnics, Industrial Training Centres and Vocational Higher Secondary Schools.
Along with the abovementioned public initiatives, there is an urgent need to promote
research, development and dissemination activities in the area of a cost effective and
environmentally sustainable approach to architecture and construction. There is considerable
scope here to adapt, improve and assimilate traditional knowledge and technology with modern
knowledge, technology and requirements. This is an area where the government could promote
the existing efforts by policy encouragement, grants and other financial and non-financial
assistance. In some instances, local self-governments and other public agencies have adopted
such alternative building construction systems by awarding the construction of a number of
institutions. Special mention should be made of the panchayat raj institutions who have
promoted such alternative construction systems for building anganawadis, offices, housing
schemes and so on. Such construction systems have also been adopted by a select few of private
institutions especially in the hospitality sector such as building tourist resorts. But more should
be, and can be, done.
In fact, Kerala can claim to have laid the foundations for a cost-effective,
environmentally sustainable, pro-people especially the poor and aesthetically pleasing that
respects traditional knowledge, local climatic conditions and availability of resources alternative
architecture and construction approach way back in early 1970s when C. Achutha Menon was
the Chief Minister. His initiative resulted in a government report that very much carried the
imprint of Laurie Bake who pioneered this architecture (see Government of Kerala 1973
CHECK). However the well-entrenched techno-bureacratic system had already abandoned the
traditional knowledge and its environmental compatibility and moved towards a high cost,
concrete intensive, cubic-oriented architecture devoid of any aesthetic appeal or climatic and
cultural sensibilities of the region. It also gave rise to a system that is widely perceived as one of

110
a nexus between technocrats-contractors-politicians. While there are exceptions to this
characterization, the actual record of cost and time-overruns resulting in considerable financial
burden to the exchequer is often pointed out as a testimony to tis nexus. The rent-seeking
interest that such a system gave rise to was powerful enough to thwart the adoption of an
alternative approach and system of construction where the scope for rent-seeking was
intrinsically much restricted.
In sum, a new paradigm in the area of providing housing facilities within a perspective of
moving towards a green habitat and then to a green economy is called for. Kerala is well
positioned to move towards such a goal.
**End**
References
Centre for Development Studies (2006), Kerala Human Development Report 2005, State
Planning Board, Trivandrum.
Deepa .G. Nair (2006), Sustainable-Affordable Housing for the Poor in Kerala, Doctoral Thesis
submitted to Delft University of Technology, December.
Government of India (20 ), Census of india, Housing Tables
Government of Kerala (197xx), Report on Performance Approach to Cost Reduction in Building
Technology, Department of Planning and Economic Affairs, Trivandrum.
Government of Kerala (2011), Housing Policy, Department of Housing, Government of Kerala.
Government of Kerala, Economic Review (An annual publication, Various issues), State
Planning Board, Trivandrum.
Kannan, K.P.(2007), ‘From Human Development to Economic Growth: Kerala’s Turnaround in
Growth Remittances, and Reform’ in Vaidyanathan, . and K.L. Krishna (eds.), Institutions and
Markets in India’s Developmen: Essays for K.N. Raj, Oxford university Press, New Delhi.
Kannan, K.P. (2014), Interrogating Inclusive Growth: Poverty and Inequality in India,
Routledge, New Delhi and Oxon.

111
Kannan, K.P (2000), ‘Poverty Alleviation as Advancing Basic Human Capabilities: Kerala in a
Comparative Perspective’ in Govindan Parayil (ed.) Reflections on Kerala’s Development, Zed
Press, London.