Embed Size (px)
Citation preview

Household Energy Use and Travel:
Opportunities for Behavioral ChangeSashank Musti, Katherine Kortum and Dr. Kara
KockelmanThe University of Texas at Austin

Questionnaire Design
• Cover letter (English and Spanish)• Five sections
– Travel Choices– Vehicle Ownership– Home Design and Energy Use– Energy Policy Opinions– Demographics

Survey Distribution
Westlake
Sunset Valley
East Austin
Manor
Hyde Park
Far West

Survey Distribution (2)
• Central Market Grocery• Flyers and URL cards• Community organizations• Web links via CapMetro and City sites• Internet version of the survey:
www.energysurvey.co.nr
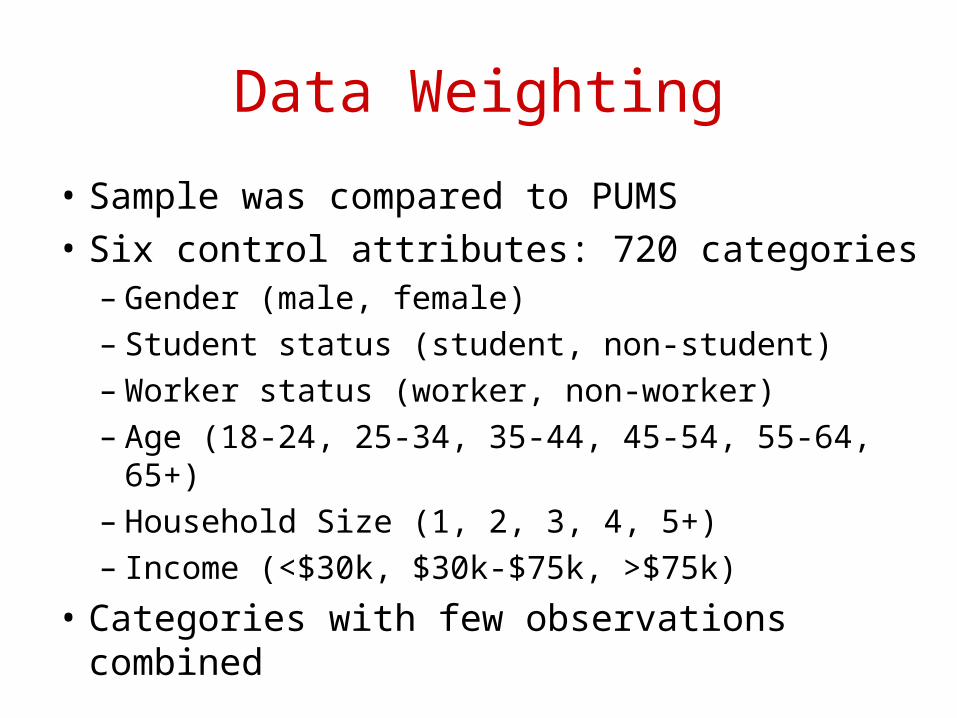
Data Weighting
• Sample was compared to PUMS• Six control attributes: 720 categories
– Gender (male, female)– Student status (student, non-student)– Worker status (worker, non-worker)– Age (18-24, 25-34, 35-44, 45-54, 55-64, 65+)– Household Size (1, 2, 3, 4, 5+)– Income (<$30k, $30k-$75k, >$75k)
• Categories with few observations combined

Sample vs. Austin
• Workers are under-represented (nearly 2 to 1).• Students are very over-represented.
Variable Sample Austin
Female 49.6% 50.4%
Age 45+ 37.5% 38.7%
High-income 46.6% 39.5%
Employed 37% 70.3%
Students 82% 13%

What Should We Do?
3
5
29
56
69
84
0 10 20 30 40 50 60 70 80 90
Do Not Do Anything
Global Warming is Not a Problem
Adapt to a Warmer Climate
Regulations Imposed by the Government
Research and Development
Lifestyle Changes
Percent of Respondents (Weighted)
`

Yearly VMT per Person (WLS)
Variable Coefficient T-statisticMean
Elasticity
Constant 5903 5.30 -College-educated -1437 -2.67 -0.135 Income per person 0.0203 1.77 0.099 Number of children -1385 -5.48 -0.071 Distance to CBD 307.4 6.06 0.2254 Population density 124.6 1.71 0.069 Population density &distance to CBD >6
-209.49 -1.68 -0.023
Transit stops -16.34 -2.18 -0.054 Age of respondent 25.46 1.46 0.127 R2 0.1289 Adjusted R2 0.1191

Yearly Fuel Use per Person (WLS)
Variable Coefficient T-statisticMean
Elasticity
Constant 388.18 6.42 -College-educated -101.18 -3.00 -0.170 Income per person 9.25 E-04 1.30 0.080 Number of children -71.17 -4.60 -0.065 Distance to CBD 16.6 5.08 0.218 Population density &distance to CBD >6
-11.04 -1.51 -0.022
Transit stops -1.17 -2.43 -0.069 Age of respondent 1.58 1.50 0.140 R2 0.1263 Adjusted R2 0.1169
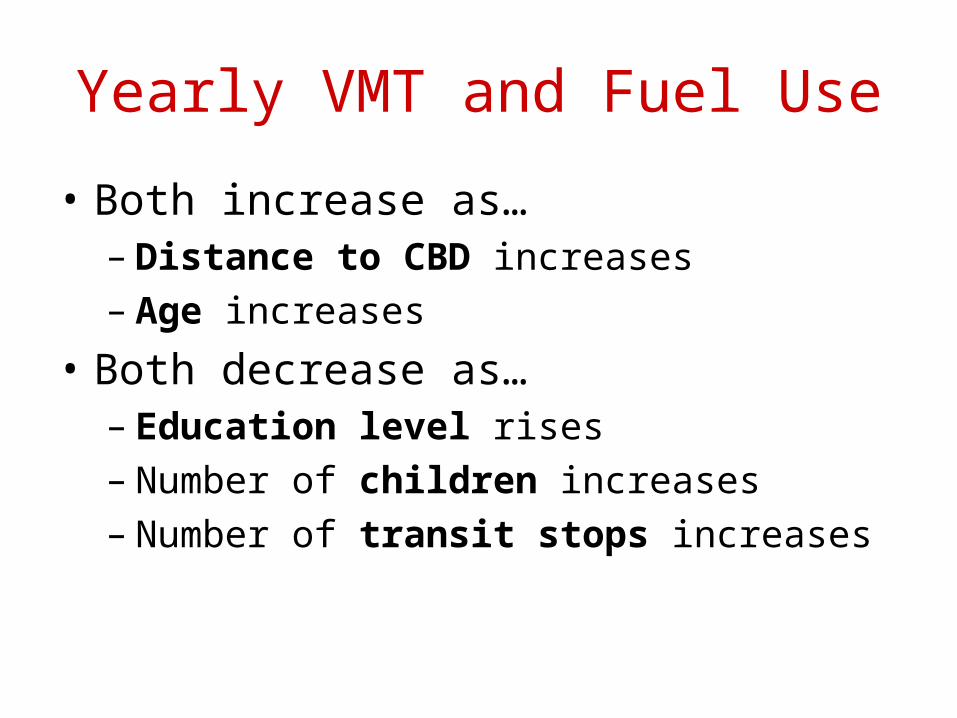
Yearly VMT and Fuel Use
• Both increase as…– Distance to CBD increases– Age increases
• Both decrease as…– Education level rises– Number of children increases– Number of transit stops increases
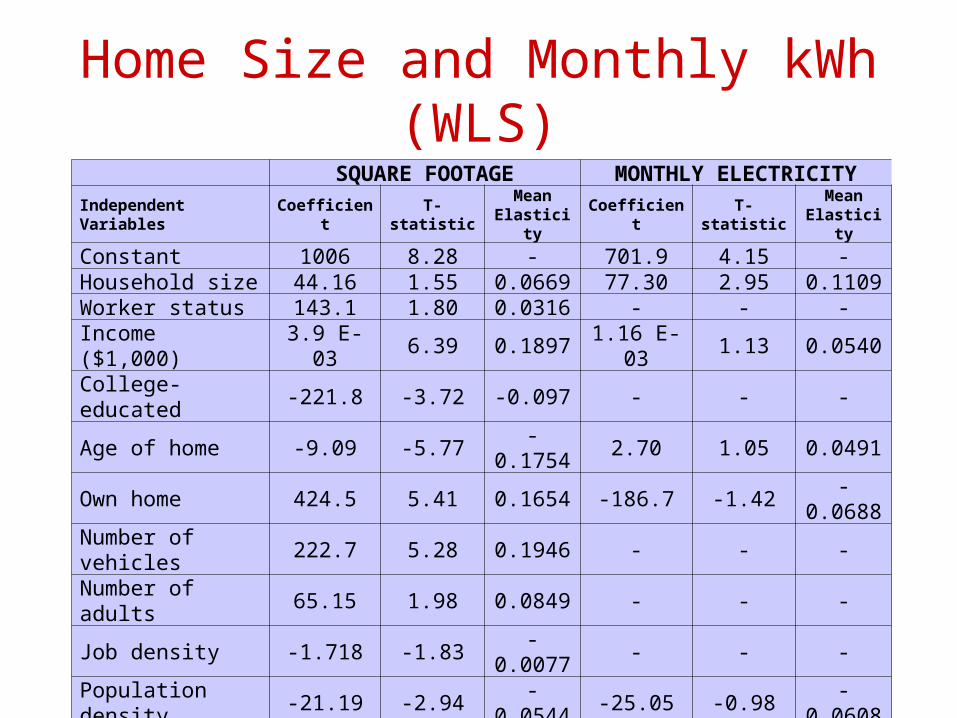
Home Size and Monthly kWh (WLS)
SQUARE FOOTAGE MONTHLY ELECTRICITYIndependent Variables
CoefficientT-
statistic
Mean Elasticit
yCoefficient
T-statistic
Mean Elasticit
y
Constant 1006 8.28 - 701.9 4.15 -Household size 44.16 1.55 0.0669 77.30 2.95 0.1109Worker status 143.1 1.80 0.0316 - - -
Income ($1,000) 3.9 E-03 6.39 0.18971.16 E-
031.13 0.0540
College-educated
-221.8 -3.72 -0.097 - - -
Age of home -9.09 -5.77-
0.17542.70 1.05 0.0491
Own home 424.5 5.41 0.1654 -186.7 -1.42-
0.0688Number of vehicles
222.7 5.28 0.1946 - - -
Number of adults
65.15 1.98 0.0849 - - -
Job density -1.718 -1.83-
0.0077- - -
Population density
-21.19 -2.94-
0.0544-25.05 -0.98
-0.0608
Two- & three-storydetached home
- - - 355.2 3.26 0.05
Home size - - - 0.4918 6.46 0.4687R2 0.3646 0.1958Adjusted R2 0.3542 0.1844
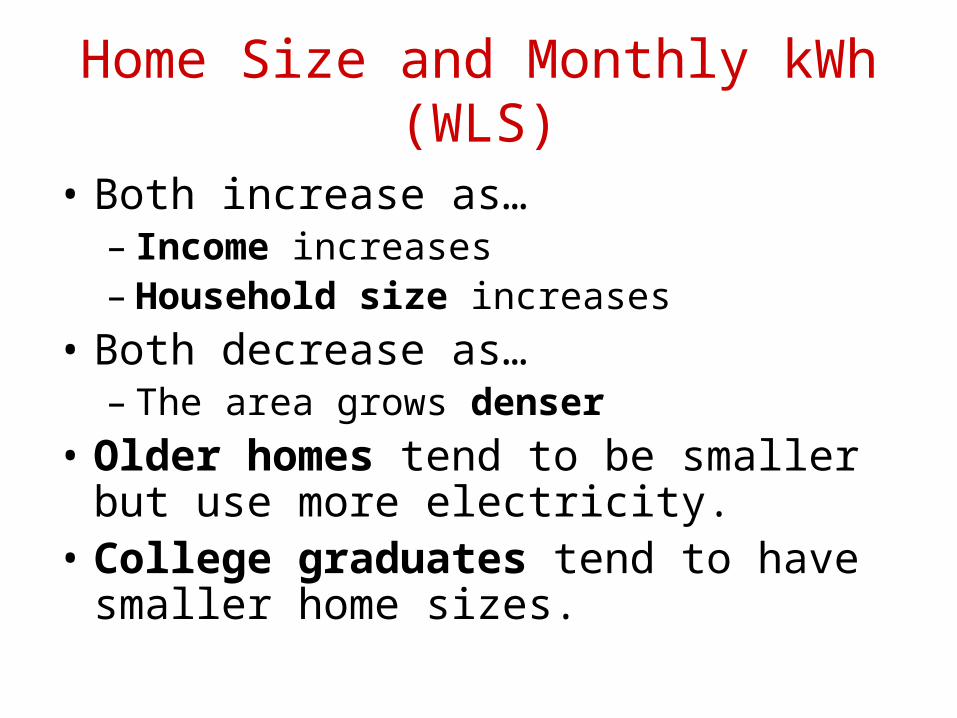
Home Size and Monthly kWh (WLS)
• Both increase as…– Income increases– Household size increases
• Both decrease as…– The area grows denser
• Older homes tend to be smaller but use more electricity.
• College graduates tend to have smaller home sizes.
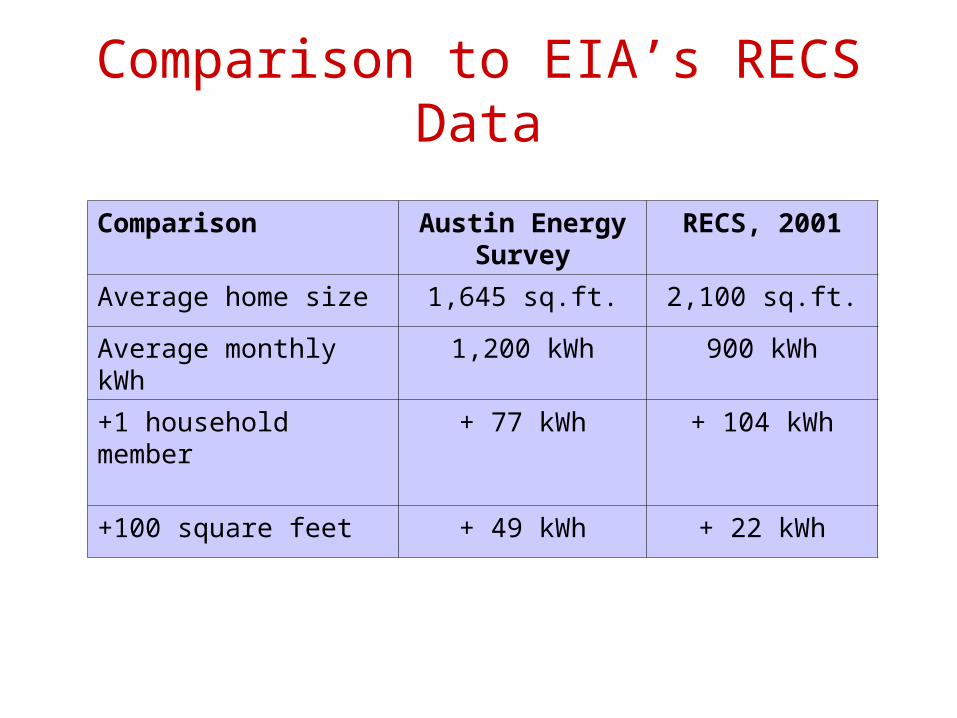
Comparison to EIA’s RECS Data
Comparison Austin Energy Survey
RECS, 2001
Average home size 1,645 sq.ft. 2,100 sq.ft.
Average monthly kWh
1,200 kWh 900 kWh
+1 household member
+ 77 kWh + 104 kWh
+100 square feet + 49 kWh + 22 kWh
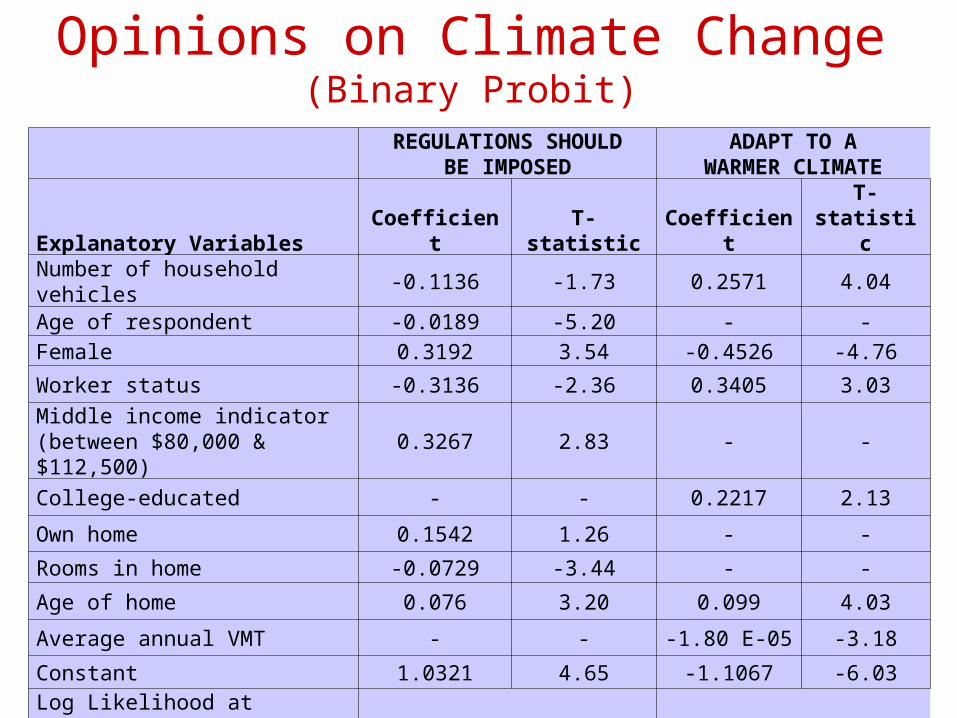
Opinions on Climate Change(Binary Probit)
REGULATIONS SHOULDBE IMPOSED
ADAPT TO AWARMER CLIMATE
Explanatory Variables Coefficient T-statistic CoefficientT-
statisticNumber of household vehicles
-0.1136 -1.73 0.2571 4.04
Age of respondent -0.0189 -5.20 - -Female 0.3192 3.54 -0.4526 -4.76Worker status -0.3136 -2.36 0.3405 3.03Middle income indicator (between $80,000 & $112,500)
0.3267 2.83 - -
College-educated - - 0.2217 2.13Own home 0.1542 1.26 - -Rooms in home -0.0729 -3.44 - -Age of home 0.076 3.20 0.099 4.03Average annual VMT - - -1.80 E-05 -3.18Constant 1.0321 4.65 -1.1067 -6.03Log Likelihood at Convergence -540.37 -473.94Pseudo R2 0.07251 0.07410
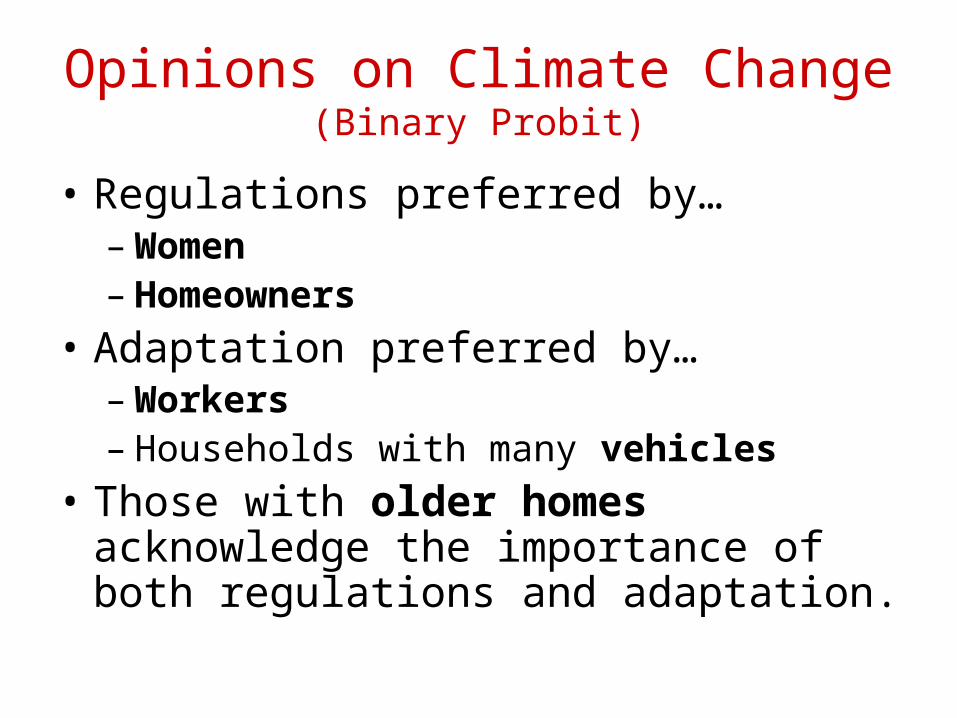
Opinions on Climate Change(Binary Probit)
• Regulations preferred by…– Women– Homeowners
• Adaptation preferred by…– Workers– Households with many vehicles
• Those with older homes acknowledge the importance of both regulations and adaptation.
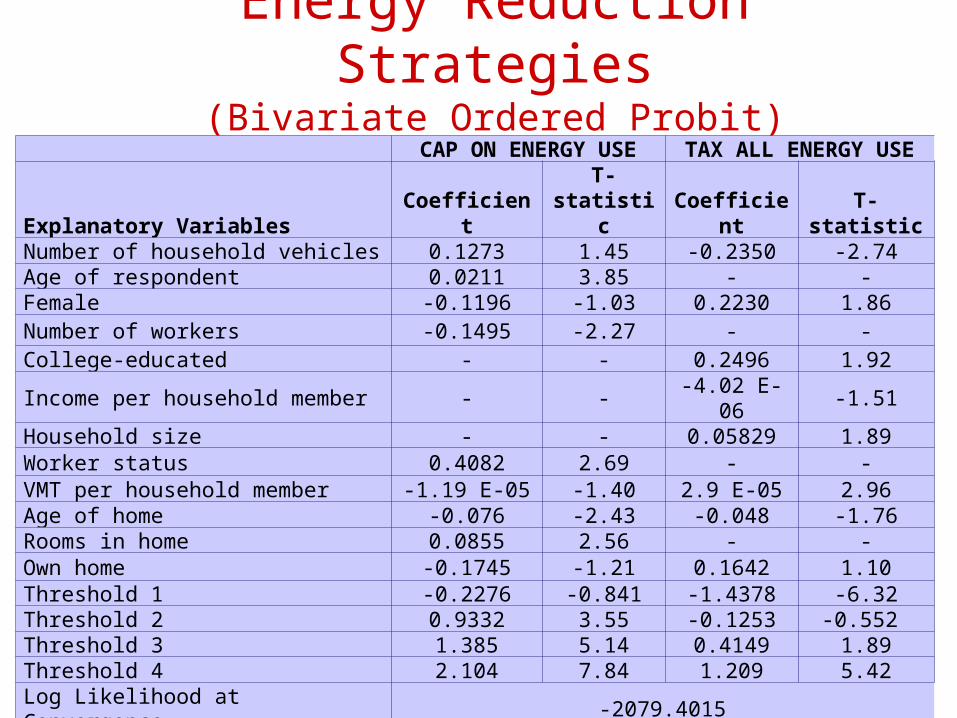
Energy Reduction Strategies(Bivariate Ordered Probit)
CAP ON ENERGY USETAX ALL ENERGY
USE
Explanatory Variables CoefficientT-
statisticCoefficien
t T-statisticNumber of household vehicles 0.1273 1.45 -0.2350 -2.74Age of respondent 0.0211 3.85 - -Female -0.1196 -1.03 0.2230 1.86Number of workers -0.1495 -2.27 - -College-educated - - 0.2496 1.92Income per household member - - -4.02 E-06 -1.51Household size - - 0.05829 1.89Worker status 0.4082 2.69 - -VMT per household member -1.19 E-05 -1.40 2.9 E-05 2.96Age of home -0.076 -2.43 -0.048 -1.76Rooms in home 0.0855 2.56 - -Own home -0.1745 -1.21 0.1642 1.10Threshold 1 -0.2276 -0.841 -1.4378 -6.32Threshold 2 0.9332 3.55 -0.1253 -0.552 Threshold 3 1.385 5.14 0.4149 1.89Threshold 4 2.104 7.84 1.209 5.42Log Likelihood at Convergence -2079.4015Covariance across equations’ residuals
0.2124 3.37

Energy Reduction Strategies
• CAPPING is preferred by…– Households with many vehicles– Older respondents– Workers
• TAXATION is preferred by…– College graduates– Large households– Homeowners

Conclusions• Long-term behavioral changes
are difficult to implement.
• Most agree climate change is a concern, but are unwilling to change their own behavior.
• Increasing income and education lead to greater (stated) concern about one’s impact on the environment.
Conclusions (2)• Electricity usage increases by 77
kWh/month for an additional person in a household & by 49 kWh/month for an additional 100 square feet of living space.
• Average electricity consumption can be reduced by moving into newer, smaller homes.
• Fuel consumption increases by 16.6 gallon/person with a one mile increase in driving distance to the CBD.
• VMT per person per year increases by 307 miles with every additional mile a household lives from the CBD.

Thank Youfor your attention.
Questions and Suggestions?