Embed Size (px)
Citation preview
House Rural Development Council An Analysis of Skilled Nursing Care in Rural
Georgia: Innovations and Outcomes
September 7, 2017
1
Tony Marshall President & CEO
Pam Clayton VP for Quality Advancement &
Regulatory Affairs
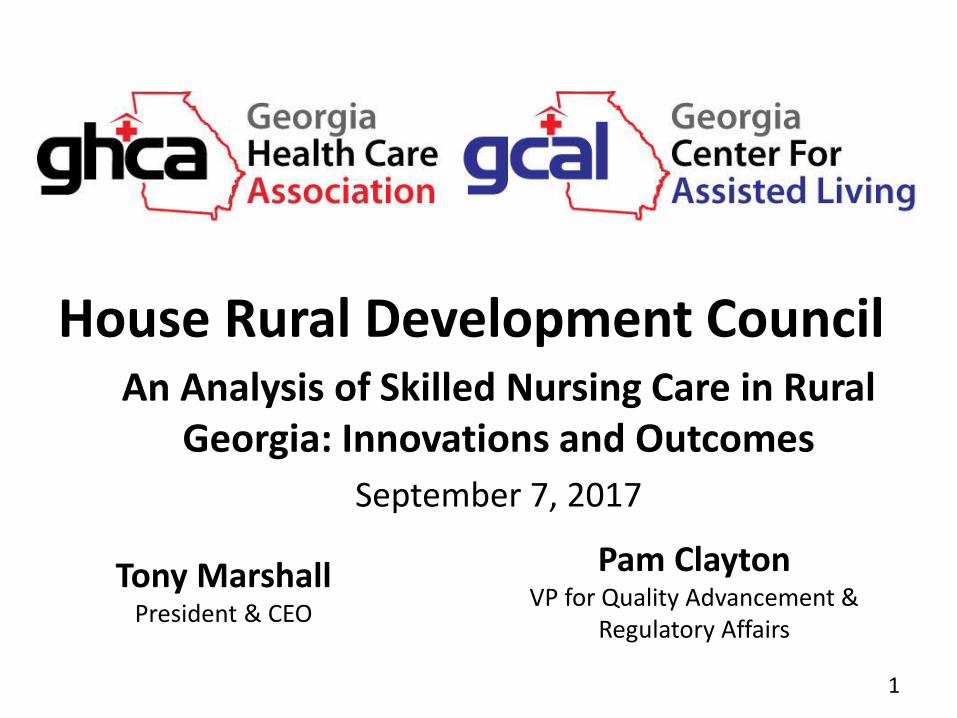
Georgia Demographics Centers Rural % Rural
Number of Nursing Care Centers 362 145 40.0%
Number of Nursing Care Center Beds 39,704 13,543 34.1%
Medicaid Nursing Center Patient Days (SFY 2016 Medicaid Cost Reports – FS and HB) 8,613,712 3,573,434 41.5%
All Nursing Center Patient Days (SFY 2016 Medicaid Cost Reports – FS and HB) 11,853,438 4,890,421 41.3%
Number of Georgians between age 65 and 84 (2017 Estimate) 1,134,546 269,669 23.7%
Number of Georgians age 85 and older (2017 Estimate) 130,693 31,345 24.0%
Beds per 1,000 for Georgians age 65 and older 31.38 44.99
No. AL / Personal Care Centers 1,881
No. AL / Personal Care Center Beds 30,421
2

Aging Trends in Georgia
• The Aging of our population is one of the most significant trends affecting our society today.
• Georgia has the 5th fastest growing 60+ population and the 24th fastest growing 85+ population.
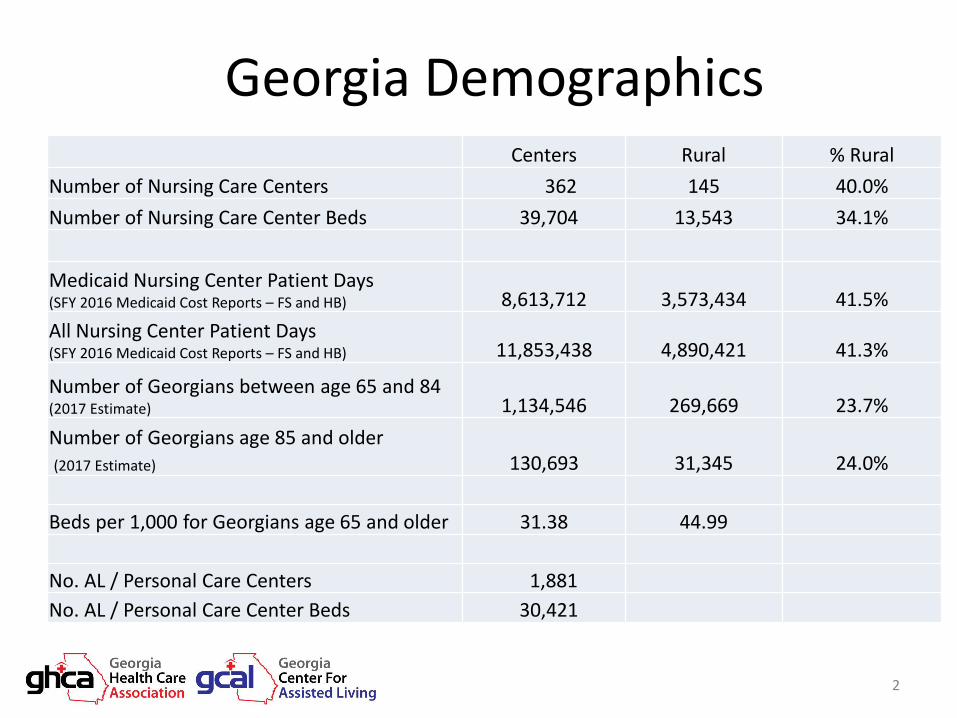
• Georgia’s population 60+ is expected to increase 65.8% between 2010 and 2030 (from 1,528,041 persons to 2,533,710 persons)
Presentation to Georgia State Senate Aging Study Committee - Georgia: Trends in Aging and Service Delivery, Dr. James Bulot, 10/22/12
3
Georgia v United States
4

Number of People 65 and Over (2010 and 2030)
State 2010 Percent of total population
2030 Percent of total population
Percent change (2010 – 2030)
Georgia 980,824 10.2% 1,907,837 15.9% 94.5%
North Carolina 1,161,164 12.4% 2,173,173 17.8% 87.2%
Tennessee 829,023 13.3% 1,417,708 19.2% 71.0%
South Carolina 605,660 13.6% 1,134,459 22.0% 87.3%
Kentucky 557,471 13.1% 903,450 19.8% 62.1%
Mississippi 379,025 12.8% 634,067 20.5% 67.3%
Alabama 648,889 14.1% 1,039,160 21.3% 60.1%
Florida 3,418,697 17.8% 7,769,452 27.1% 127.3%
5
Source of Data – Long-Term Care in the South Special publication on Demographics, January, 2017

Number of People 85 and Over (2010 and 2030)
State 2010 Percent of total population
2030 Percent of total population
Percent change (2010 – 2030)
Georgia 122,818 1.3% 224,926 1.9% 83.1%
North Carolina 155,537 1.7% 266,881 2.2% 71.6%
Tennessee 110,070 1.8% 180,192 2.4% 63.7%
South Carolina 78,253 1.8% 141,286 2.7% 80.6%
Kentucky 73,633 1.7% 106,052 2.3% 44.0%
Mississippi 52,056 1.8% 73,646 2.4% 41.5%
Alabama 88,211 1.9% 132,070 2.7% 49.7%
Florida 537,846 2.8% 943,675 3.3% 75.5%
6
Source of Data – Long-Term Care in the South Special publication on Demographics, January, 2017

Census Trend
7
0%
10%
20%
30%
40%
50%
60%
70%
80%
90%
100%
07 08 09 10 11 12 13 14 15 16
75.16% 73.70% 73.33% 72.69% 72.38% 71.99% 72.18% 73.44% 72.25% 72.10%
90.21% 91.10% 89.48% 88.20% 87.20% 87.56% 86.10% 85.86% 85.74% 85.4%
Medicaid Total
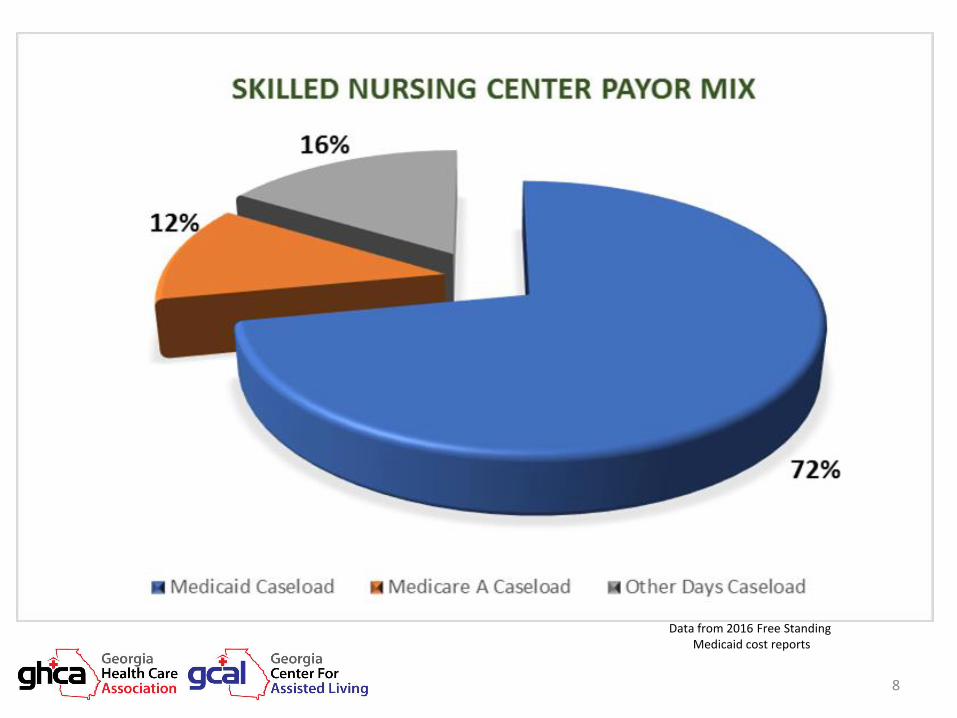
Skilled Nursing Center Payer Mix
Data from 2016 Free Standing Medicaid cost reports
8
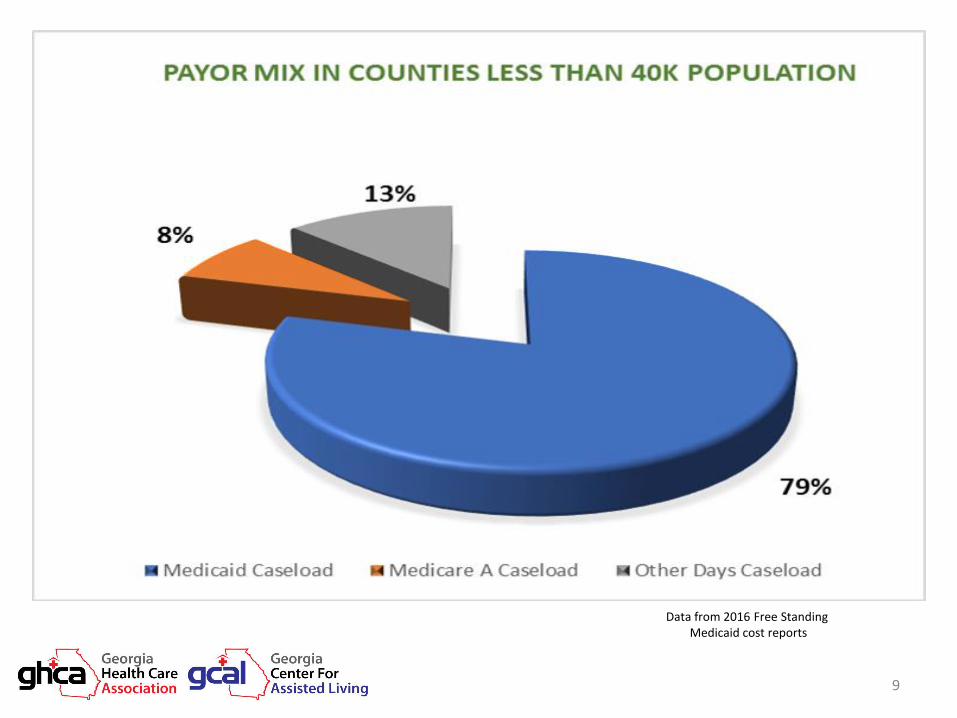
Skilled Nursing Center Payer Mix
Data from 2016 Free Standing Medicaid cost reports
9

Skilled Nursing Center Payer Mix
Data from 2016 Free Standing Medicaid cost reports
10
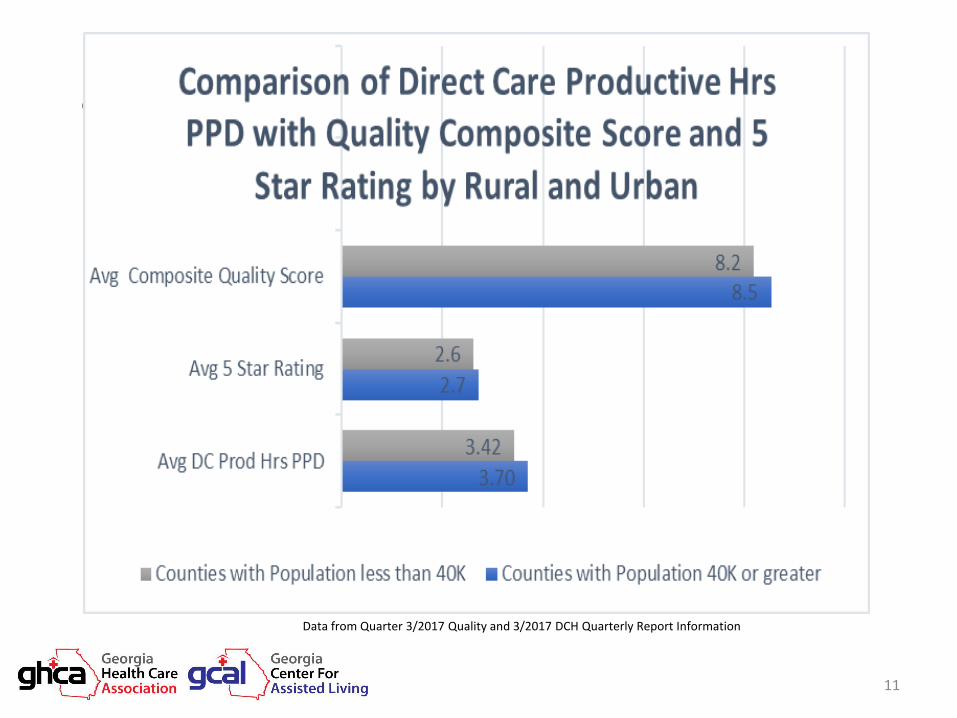
Skilled Nursing Center Payer Mix
Data from Quarter 3/2017 Quality and 3/2017 DCH Quarterly Report Information
11
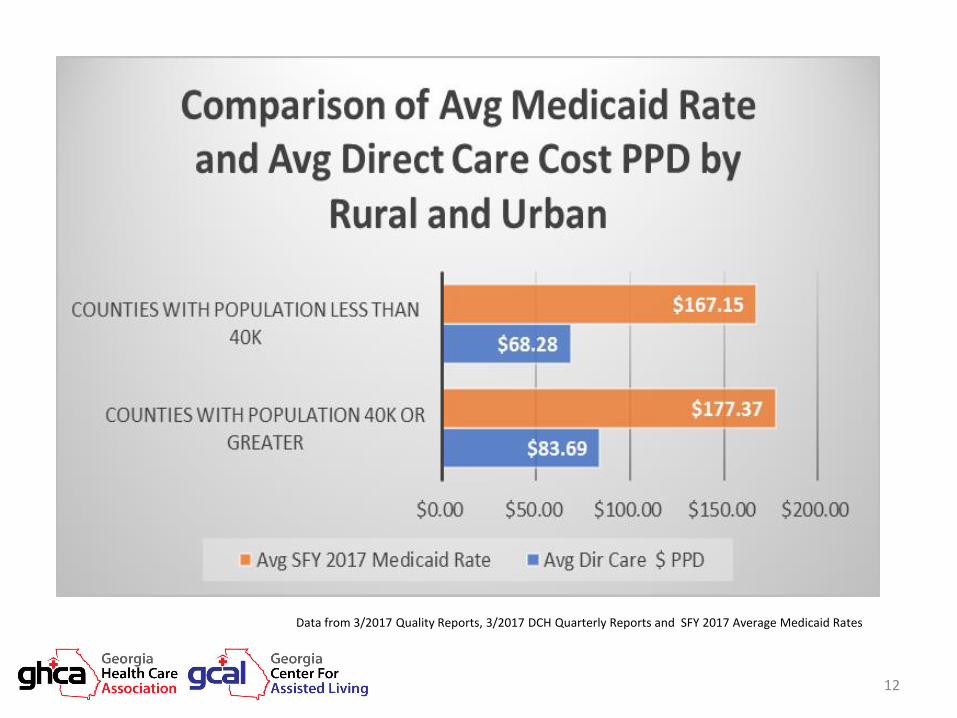
Skilled Nursing Center Payer Mix
Data from 3/2017 Quality Reports, 3/2017 DCH Quarterly Reports and SFY 2017 Average Medicaid Rates
12

Cost data from 2015 Medicaid cost reports without audit adjs; payment based on 2012 cost reports and provided by DCH
FY 2015 Medicaid Per Diems Component Cost Payment Profit (Loss) % with Loss
Routine $ 85.53 $ 82.42 $ (3.11) 49.34%
Dietary $ 17.52 $ 16.29 $ (1.23) 78.95%
Lndry, Hskpg, Maint $ 19.73 $ 18.58 $ (1.15) 59.54%
A & G $ 27.29 $ 20.16 $ (7.13) 85.86%
Property $ 14.14 $ 10.45 $ (3.69) 60.20%
Total $ 164.21 $ 147.90 $ (16.31) 71.05%
Taxes and Insurance $ 1.22 $ 1.09 $ (.13)
Provider Fee $ 14.04 $ 17.10 $ 3.06
TOTAL $179.47 $166.09
$ (13.38)

Cost data from 2016 Medicaid cost reports without audit adjs. Payment based on SFY 2016 Payment Rates
FY 2016 Medicaid Per Diems Component Cost Payment Profit (Loss)
Routine $ 87.84 $ 84.63 $ (3.20)
Dietary $ 17.70 $ 16.40 $ (1.29)
Lndry, Hskpg, Maint $ 20.03 $ 18.72 $ (1.31)
A & G $ 28.74 $ 20.56 $ (8.17)
Property $ 14.30 $ 10.60 $ (3.71)
Total $ 168.60 $ 150.92 $ (17.69)
Taxes and Insurance $ 1.33 $ 1.10 $ (.24)
Provider Fee $ 15.13 $ 17.10 $ 1.97
TOTAL $185.07 $169.11
$ (15.95)

Cost data from 2016 Medicaid cost reports without audit adjs; includes 3% annual inflation. Payment based on actual SFY 2017 Medicaid Payment Rates
FY 2017 Medicaid Per Diems
Component Estimated
Cost
Actual Payment
Estimated Profit (Loss)
Routine $ 90.47 $ 87.48 $ (2.99)
Dietary $ 18.23 $ 16.87 $ (1.35)
Lndry, Hskpg, Maint $ 20.63 $ 19.29 $ (1.34)
A & G $ 29.60 $ 21.09 $ (8.51)
Property $ 14.30 $ 11.04 $ (3.26)
Total $ 173.23 $ 155.77 $ (17.46)
Taxes and Insurance $ 1.37 $ 1.10 $ (.28)
Provider Fee $ 15.13 $ 17.10 $ 1.97
TOTAL $189.74 $173.97
$ (15.77)

Cost data from 2016 Medicaid cost reports without audit adjs; includes 3% annual inflation. Payment based on estimate of SFY 2018 Medicaid Payment Rates provided by DCH.
FY 2018 Medicaid Per Diems
Component Estimated
Cost
Estimated Payment
Estimated Profit (Loss)
Routine $ 93.11 $ 89.77 $ (3.34)
Dietary $ 18.76 $ 17.32 $ (1.44)
Lndry, Hskpg, Maint $ 21.24 $ 19.80 $ (1.44)
A & G $ 30.46 $ 21.64 $ (8.82)
Property $ 14.30 $ 11.33 $ (2.97)
Total $ 177.86 $ 159.85 $ (18.01)
Taxes and Insurance $ 1.41 $ 1.12 $ (.29)
Provider Fee $ 15.13 $ 17.10 $ 1.97
TOTAL $194.41 $178.08
$ (16.33)
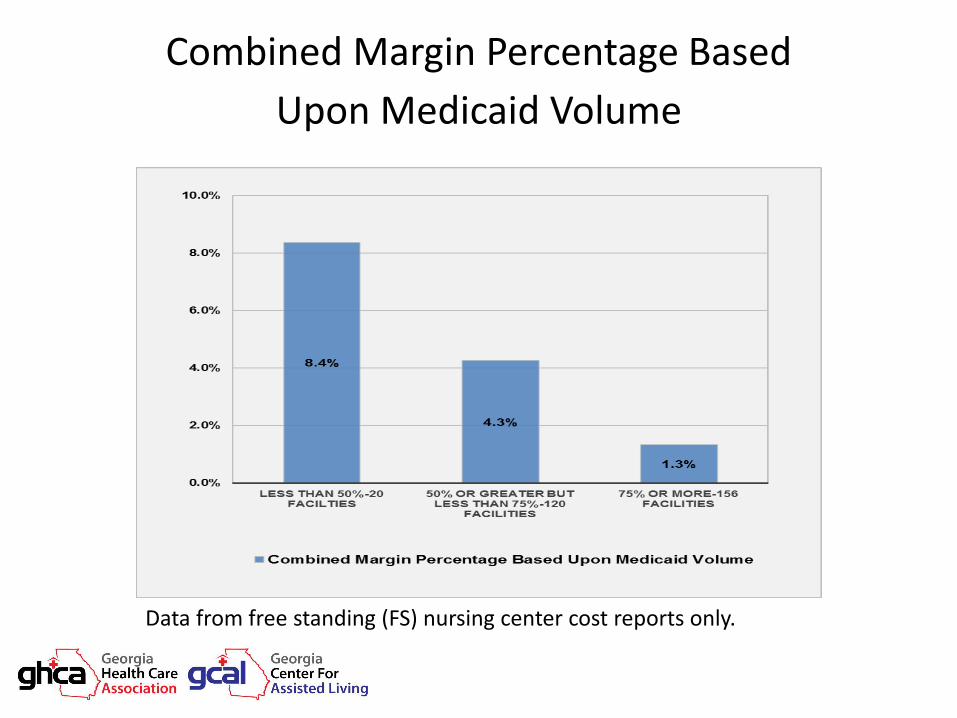
Combined Margin Percentage Based
Upon Medicaid Volume
Data from free standing (FS) nursing center cost reports only.

Combined Margin Percentage Based
Upon Medicaid Volume
Data from free standing (FS) nursing center cost reports only.

Combined Margin Percentage Based
Upon Medicaid Volume
Data from free standing (FS) nursing center cost reports only.
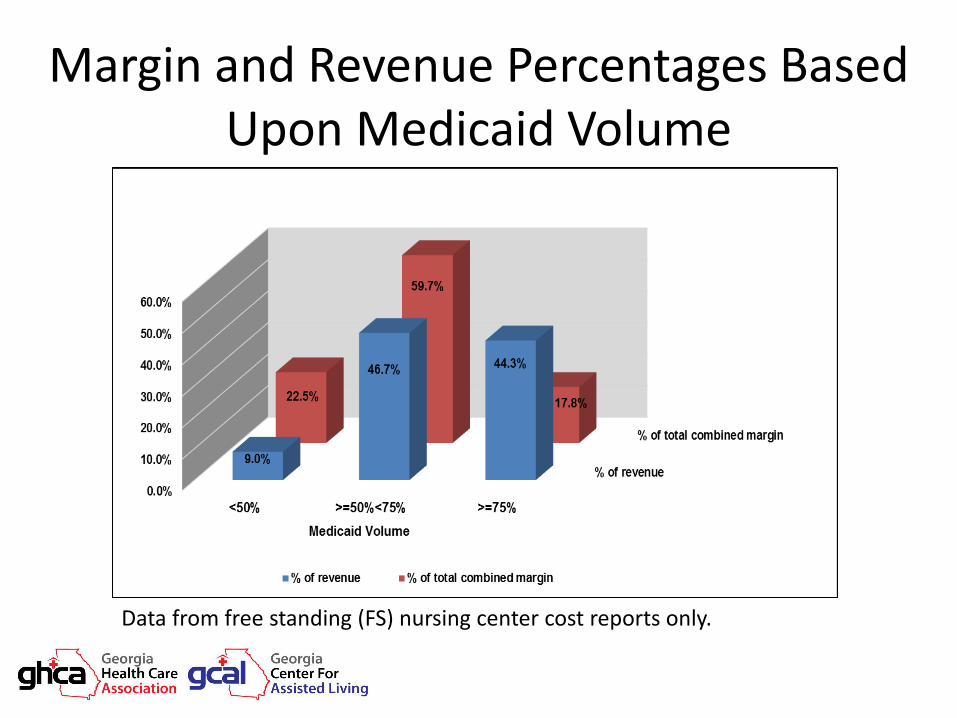
Margin and Revenue Percentages Based Upon Medicaid Volume
Data from free standing (FS) nursing center cost reports only.

Medicaid Rates of SE States - latest data available
$0
$1
00
$2
00
$3
00
GA NC TN SC KY MS AL FL
155.77
$158.51 $158.61
$170.95
$172.83
$183.72
$184.84
$200.60 $17.10 $11.91 $6.10
$0.00 $9.64 $14.08
$7.73 $24.59
ProviderFee
Cost-basedRate
21
22
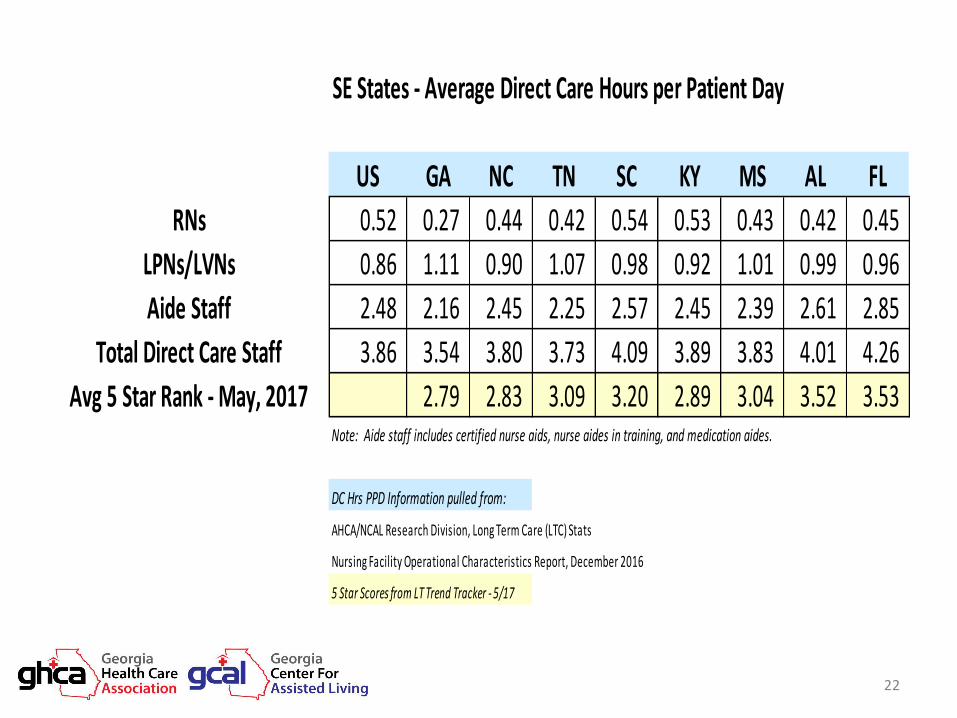
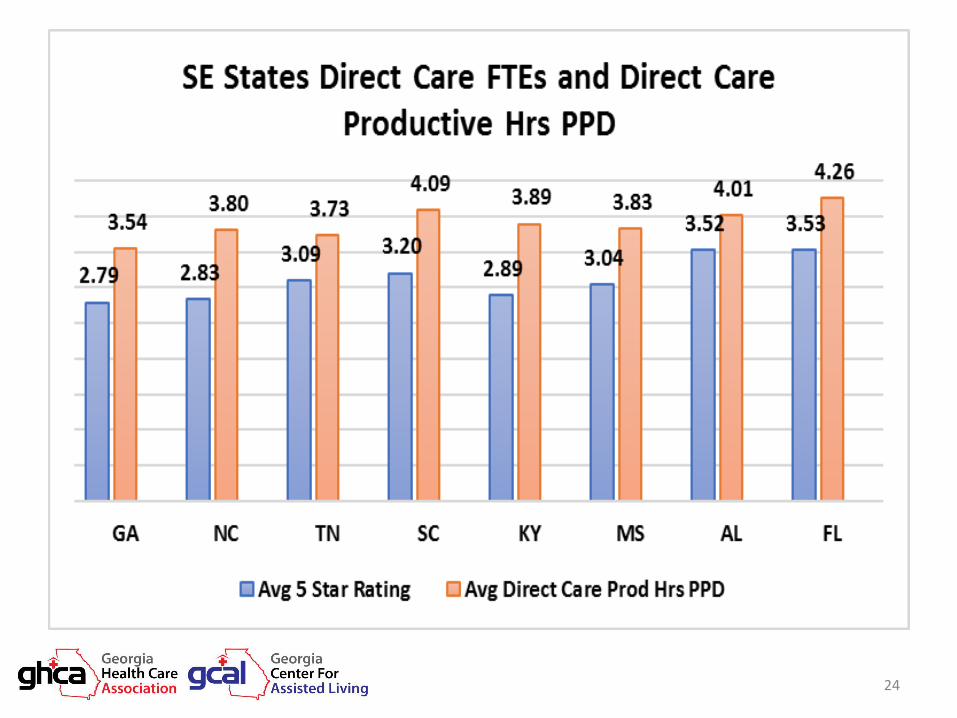
SE States - Average Direct Care Hours per Patient Day
US GA NC TN SC KY MS AL FL
RNs 0.52 0.27 0.44 0.42 0.54 0.53 0.43 0.42 0.45
LPNs/LVNs 0.86 1.11 0.90 1.07 0.98 0.92 1.01 0.99 0.96
Aide Staff 2.48 2.16 2.45 2.25 2.57 2.45 2.39 2.61 2.85
Total Direct Care Staff 3.86 3.54 3.80 3.73 4.09 3.89 3.83 4.01 4.26
Avg 5 Star Rank - May, 2017 2.79 2.83 3.09 3.20 2.89 3.04 3.52 3.53 Note: Aide staff includes certified nurse aids, nurse aides in training, and medication aides.
DC Hrs PPD Information pulled from:
AHCA/NCAL Research Division, Long Term Care (LTC) Stats
Nursing Facility Operational Characteristics Report, December 2016
5 Star Scores from LT Trend Tracker - 5/17
23
24
Patient, Resident & Family Satisfaction • Georgia holds the
distinction of having the longest-running statewide satisfaction measurement & improvement program in the US
• 2016 Satisfaction Survey generated over 17,000 responses
• Greater than 35% of resident respondents rated centers as a “10,” the highest possible score, for best place to live
25
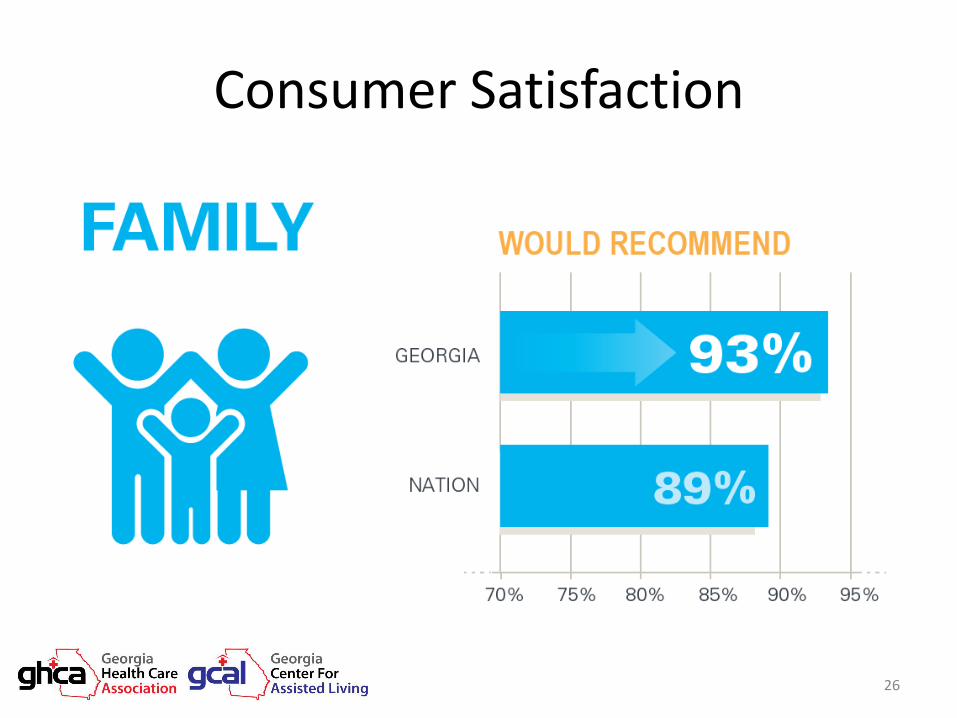
Consumer Satisfaction
26
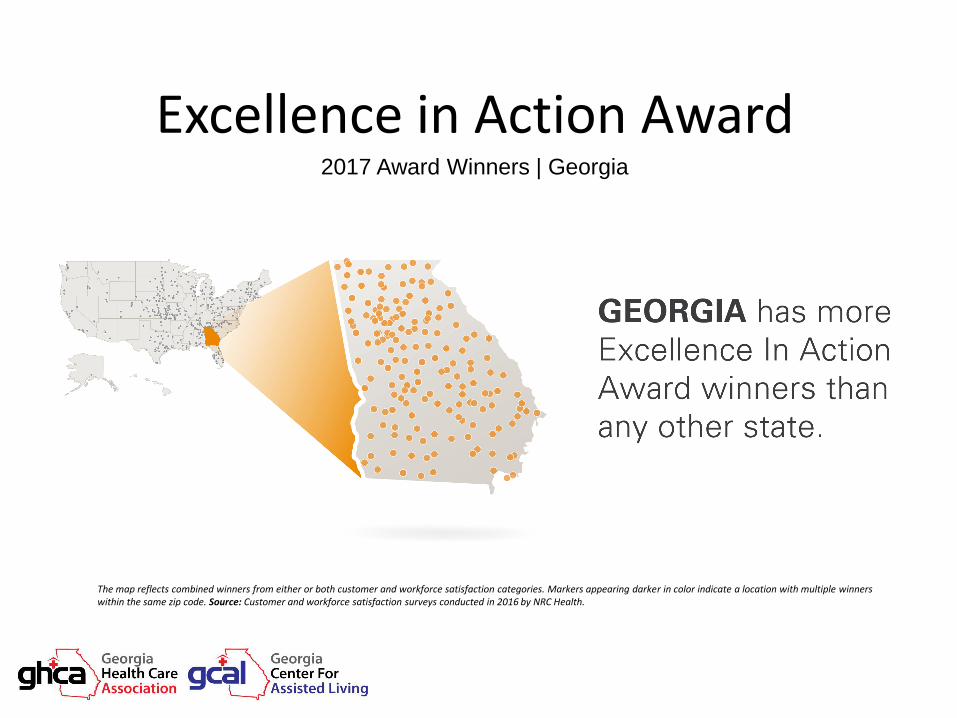
Excellence in Action Award 2017 Award Winners | Georgia
The map reflects combined winners from either or both customer and workforce satisfaction categories. Markers appearing darker in color indicate a location with multiple winners within the same zip code. Source: Customer and workforce satisfaction surveys conducted in 2016 by NRC Health.
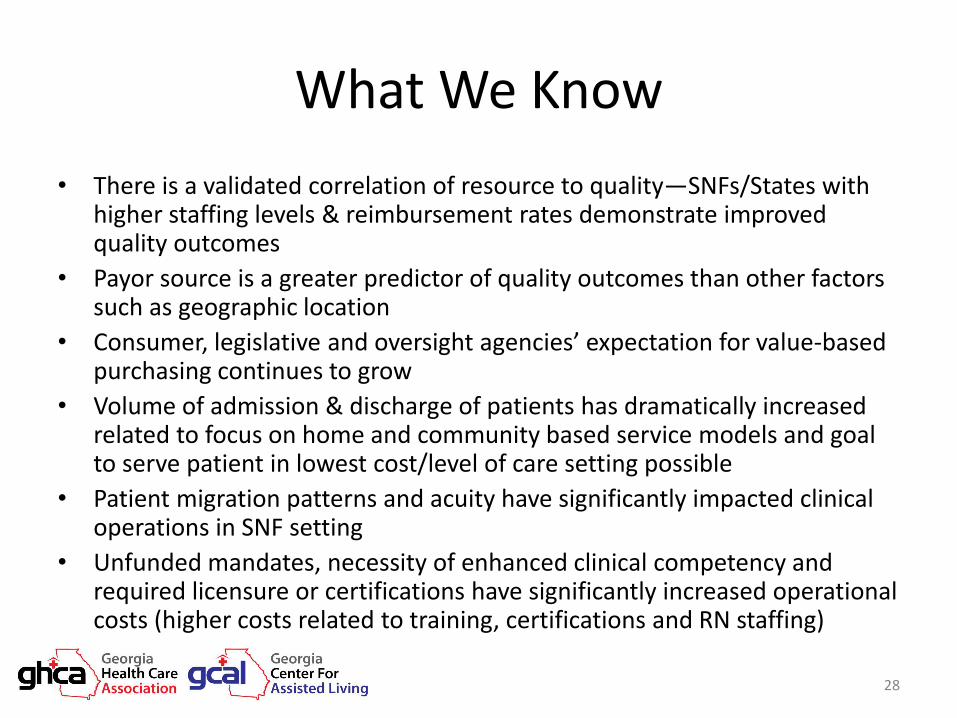
What We Know
• There is a validated correlation of resource to quality—SNFs/States with higher staffing levels & reimbursement rates demonstrate improved quality outcomes
• Payor source is a greater predictor of quality outcomes than other factors such as geographic location
• Consumer, legislative and oversight agencies’ expectation for value-based purchasing continues to grow
• Volume of admission & discharge of patients has dramatically increased related to focus on home and community based service models and goal to serve patient in lowest cost/level of care setting possible
• Patient migration patterns and acuity have significantly impacted clinical operations in SNF setting
• Unfunded mandates, necessity of enhanced clinical competency and required licensure or certifications have significantly increased operational costs (higher costs related to training, certifications and RN staffing)
28

Workforce Challenges
• Nationally, projections indicate more than one million additional direct-care workers will be needed by 2018
• Approximately 55,000 social workers are currently needed in long-term care. By 2050, this number will nearly double to approximately 109,000 (DHHS, 2006). While nearly 75% of licensed social workers work with older adults in some capacity, many have not received training or education in gerontology (NASW, 2006a). In 2009–2010, only 2.8% of BSW graduates and 6.7% of MSW graduates completed a specialization in aging, or an average of 5% across all social work graduates (CSWE, 2011).
• By 2020, the nursing workforce is expected to drop 20 percent below projected requirements.
https://eldercareworkforce.org/research/issue-briefs/research:geriatrics-workforce-shortage-a-looming-crisis-for-our-families
29

Georgia DOL 2016 Annual Report
• 18 of 25 fastest growing occupations in GA relate to health care
• Supply v Demand issue
• SNF operators are at a competitive disadvantage related to resource deficit
30

31
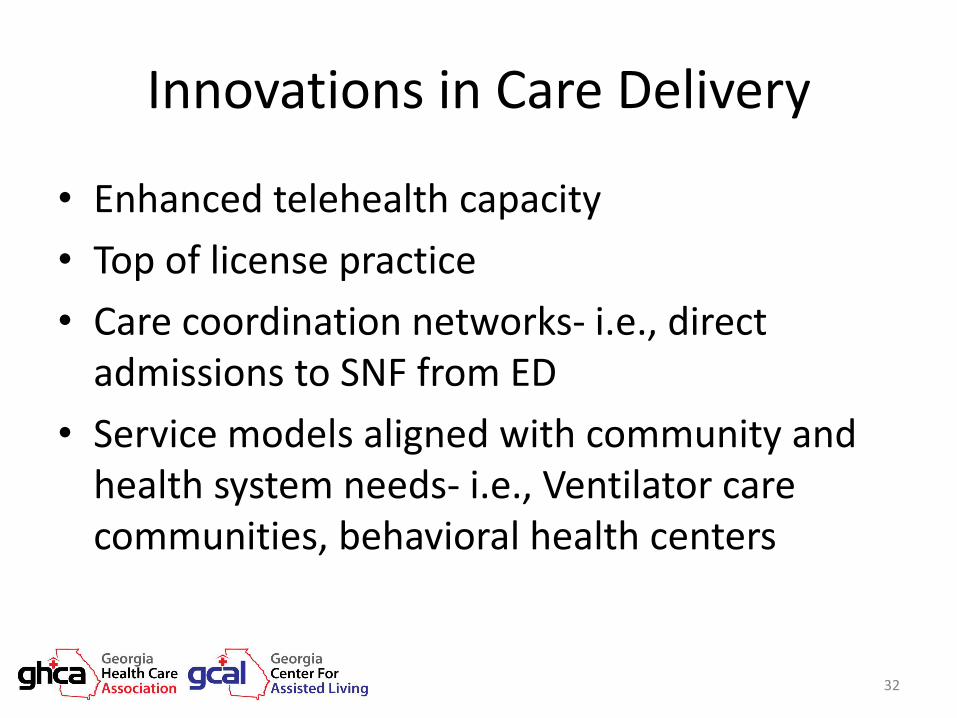
Innovations in Care Delivery
• Enhanced telehealth capacity
• Top of license practice
• Care coordination networks- i.e., direct admissions to SNF from ED
• Service models aligned with community and health system needs- i.e., Ventilator care communities, behavioral health centers
32

Timeline of Florida Legislative Action to Increase Nurse Staffing in Nursing Centers
Session Effective Date
Legislative Action CNA Hours PPD
RN/LPN Hours PPD
Prior to 2002
Staffing defined in regulation (no minimum statutory requirement) 1.7 0.6
2001 01/2002 01/2003 01/2004
Mandated new staffing standards over 36 months (RN/LPN: 01/2002 2.3 2.6 2.9
1.0
01/2002 Increase CNA and RN/LPN staffing standards 2.3 1.0
01/2003 Increase CNA staffing standard 2.6 1.0
2003/2004/2005 Delayed implementation of 2.9 CNA hours to July 2004/to July 2005/to July 2006
2.6 1.0
2006 01/2007 Amended to weekly average of 2.9 CNA hours and daily minimum of 2.7 CNA hours
2.7 daily 2.9 weekly
1.0
2008 07/2008 Maintains 2.9 CNA hours standard, but does not allow sanction unless center falls below 2.6 CNA hours daily
2.9 weekly 1.0
2010 07/2010 Amended to establish minimum weekly combined staffing standard of 3.9 CNA and RN/LPN hours and daily minimum of 2.7 CNA hours and daily minimum of 1.0 RN/LPN hours
3.9 Combined 2.7 daily
1.0 daily
2011 07/2011 Amended to minimum weekly combined staffing standard of 3.6 CNA and RN/LPN hours and daily minimum of 2.5 CNA hours and daily minimum of 1.0 RN/LPN hours
3.6 Combined 2.5 daily
1.0 daily


Questions • Tony Marshall, GHCA President and CEO
– Direct dial: (678) 289-6643
– Cell: (678) 672-7586
– Email: [email protected]
• Pam Clayton, GHCA VP Quality Advancement and Regulatory Affairs
– Direct dial: (678) 902-9224
– Cell: (706) 280-7217
– Email: [email protected]
• Russel Carlson, GHCA VP Governmental Affairs
– Direct dial: (678) 783-1704
– Cell: (404) 421-4066
– Email: [email protected]
• Donna Nackers, GHCA VP of Reimbursement
– Direct dial: (678) 902-9221
– Cell: (678) 234-6335
– Email: [email protected]
36

FY 2016 Analysis of Financial Margins • Eljay, LLC, report on the financial margins of Medicaid nursing facilities in Georgia.
• The combined margin for the 296 nursing facilities in the database was $76.2 million, representing a margin percentage of 3.3% on reported revenue of almost $2.3 billion.
• 94 facilities (32%) incurred negative margins, reflecting a combined negative margin of 5.2%. Another 32 facilities had positive margins of 2% or less.
• The 148 facilities that rank in the bottom half of all facilities relative to margin had a combined negative margin percentage of 2.8%.
• The 156 facilities with high Medicaid volume (75% Medicaid volume or greater) have financial margins that are six times lower than low volume Medicaid providers (less than 50% Medicaid volume). High volume Medicaid providers reflect an average margin of just 1.3% compared to 8.4% for low volume Medicaid providers.
• The 20 facilities with less than 50% Medicaid volume represent just 9.0% of the total revenue of all facilities yet constitute almost 22.5% of the total combined margin for all facilities. In contrast, the 156 facilities with Medicaid volume of at least 75% represent almost 44.3% of total revenues, but just less than 17.8% of the total combined margin.


![A General and Adaptive Robust Loss Function · 2019-05-03 · loss ( = 1), Cauchy loss ( = 0), Geman-McClure loss ( = 2), and Welsch loss ( = 1 ). 1 arXiv:1701.03077v10 [cs.CV] 4](https://img.pdfslide.us/doc/110x75/5f8285a03eed9b085a0fd28c/a-general-and-adaptive-robust-loss-function-2019-05-03-loss-1-cauchy-loss.jpg)