Embed Size (px)
Citation preview

HOT SPOT MEMORANDUM
I-85 Planning and Environmental Linkages (PEL) Study
Oct 21, 2020

I - 8 5 P l a n n i n g a n d E n v i r o n m e n t a l L i n k a g e s ( P E L ) S t u d y H o t S p o t M e m o r a n d u m
I-85 PLANNING AND ENVIRONMENTAL LINKAGES (PEL) STUDY Hot Spot Memorandum
Prepared for:
Georgia Department of Transportation
Office of Planning
600 West Peachtree Street
Atlanta
Georgia 30308
Prepared by:
Arcadis U.S., Inc.
2839 Paces Ferry Road
#900
Atlanta
Georgia 30339
Tel 770 431 8666
Fax 770 435 2666
Our Ref.:
30033075
Date:
Oct 21, 2020
This document is intended only for the use of the individual or entity for which it was prepared and may contain information that is privileged, confidential, and exempt from disclosure under applicable law. Any dissemination, distribution or copying of this document is strictly prohibited.
Jonathan Langley, PE Project Manager
Cristina Pastore, PE, AICP Deputy Project Manager, Planning
Otto Clemente, PE Deputy Project Manager, Implementation

I - 8 5 P l a n n i n g a n d E n v i r o n m e n t a l L i n k a g e s ( P E L ) S t u d y H o t S p o t M e m o r a n d u m
VERSION CONTROL Issue Revision
No. Date
Issued Page No.
Description Reviewed by
1 0 06-03-20 22 Draft Hot Spot Memo
1 07-20-20 24 Addressed GDOT comments received on July 6, 2020.
Yuwen Hou
2 07-22-20 24 Addressed GDOT comments received on July 22, 2020.
Yuwen Hou
3 10-21-20 24 Added a note on Page 8 and 9 to address the FHWA comment about numbering.
Yuwen Hou

I - 8 5 P l a n n i n g a n d E n v i r o n m e n t a l L i n k a g e s ( P E L ) S t u d y H o t S p o t M e m o r a n d u m
i
CONTENTS Acronyms and Abbreviations ........................................................................................................................ iii
Executive Summary ....................................................................................................................................... 1
1 Introduction ............................................................................................................................................. 1
Corridor Background ....................................................................................................................... 1
Study Background........................................................................................................................... 3
2 Definition of a Hot Spot ........................................................................................................................... 5
3 Hot Spot Identification Approach ............................................................................................................ 6
4 Hot Spots ................................................................................................................................................ 7
Hot Spot Location Map ........................................................................................................................... 8
Overview of Hot Spot Sheets ................................................................................................................ 10
Hot Spot 1: NB I-85/I-285 Interchange to Pleasantdale Road ...................................................... 11
Hot Spot 2: NB Pleasantdale Road to Jimmy Carter Boulevard .................................................. 12
Hot Spot 3: NB Indian Trail-Lilburn Road to Beaver Ruin Road ................................................... 13
Hot Spot 4: NB Beaver Ruin Road to Steve Reynolds Boulevard ................................................ 14
Hot Spot 5: NB Steve Reynolds Boulevard to Pleasant Hill Road ............................................... 15
Hot Spot 6: NB SR 316/Sugarloaf Parkway ................................................................................. 16
Hot Spot 7: NB Old Peachtree Road/Lawrenceville-Suwanee Road ........................................... 17
Hot Spot 8: NB Lawrenceville-Suwanee Road to I-985 ................................................................ 18
Hot Spot 9: SB I-985 to Lawrenceville-Suwanee Road ................................................................ 19
Hot Spot 10: SB SR 316 to Pleasant Hill Road ............................................................................ 20
Hot Spot 11: SB Steve Reynolds Boulevard/Beaver Ruin Road .................................................. 21
Hot Spot 12: SB Indian Trail-Lilburn Road to Jimmy Carter Boulevard ........................................ 22
Hot Spot 13: SB Pleasantdale Road to I-285 ............................................................................... 23
5 Summary ............................................................................................................................................... 24

I - 8 5 P l a n n i n g a n d E n v i r o n m e n t a l L i n k a g e s ( P E L ) S t u d y H o t S p o t M e m o r a n d u m
ii
FIGURES Figure 1. Alternative Generation Process ..................................................................................................... 3
Figure 2. PEL Study Needs ........................................................................................................................... 4
Figure 3. Hot Spot Word Cloud by Hot Spot Workshop Attendees ............................................................... 5
Figure 4. Datasets Reviewed for Hot Spots Analysis .................................................................................... 6
Figure 5. Data Layers for Hot Spots Analysis ............................................................................................... 6
Figure 6. Hot Spot Identification Process ...................................................................................................... 7
TABLES Table 1. Study Corridor Crash Rate Comparison and State Average Crash Rates Comparison ................. 2

I - 8 5 P l a n n i n g a n d E n v i r o n m e n t a l L i n k a g e s ( P E L ) S t u d y H o t S p o t M e m o r a n d u m
iii
ACRONYMS AND ABBREVIATIONS CD Collector-Distributor
CID Community Improvement District
GCDOT Gwinnett County Department of Transportation
GCT Gwinnett County Transit
GDOT Georgia Department of Transportation
GEARS Georgia Electronic Accident Reporting System
GIS Geographic Information System
GPS Global Positioning System
HERO Highway Emergency Response Operator
HOT High-Occupancy Toll
LCI Livable Centers Initiative
PEL Planning and Environmental Linkages
SME Subject-Matter Expert
SR State Route
I - 8 5 P l a n n i n g a n d E n v i r o n m e n t a l L i n k a g e s ( P E L ) S t u d y H o t S p o t M e m o r a n d u m
1
EXECUTIVE SUMMARY The purpose of this memorandum is to provide the Georgia Department of Transportation (GDOT), the Gwinnett County Department of Transportation (GCDOT), stakeholders, and the public with an overview and analysis of the Hot Spots identified as part of the I-85 Planning and Environmental Linkages (PEL) Study. Hot Spots are areas that experience a high proportion of operational and capacity issues, as well as high concentrations of crashes or incidents. Based on several rounds of workshop discussions with multidisciplinary groups, the study team – Arcadis U.S. Inc. (Arcadis), Kimley-Horn and Associates (KHA), and Modern Mobility Partners, LLC (MMP) – identified 13 Hot Spots (eight northbound and five southbound) along the I-85 study area.
This memorandum consists of four chapters. Chapter 1 provides a background description of the study corridor and where the Hot Spots analysis fits in the overall study process. Following the introduction, Chapter 2 defines Hot Spots in the context of the I-85 PEL Study. Chapter 3 describes the methodology by which Hot Spots were identified. Chapter 4 presents the Hot Spot Location Map and discusses each Hot Spot in detail.
1 INTRODUCTION
Corridor Background The I-85 study area runs roughly 18 miles along I-85 from I-285 to I-985. The corridor contains 16 interchanges 1, four to six general-purpose travel lanes in each direction, and one High-Occupancy Toll (HOT) lane in each direction. The study area starts in DeKalb County but runs primarily through Gwinnett County, with 14 cities within or adjacent to the corridor. Principal and minor arterials, collector-distributor lanes, and state highway routes intersect and connect to I-85 along the study area, linking these communities to large employment centers, educational facilities, retail districts, and recreational areas within the corridor, and beyond. I-85 is a key conduit in the quality of life for these communities.
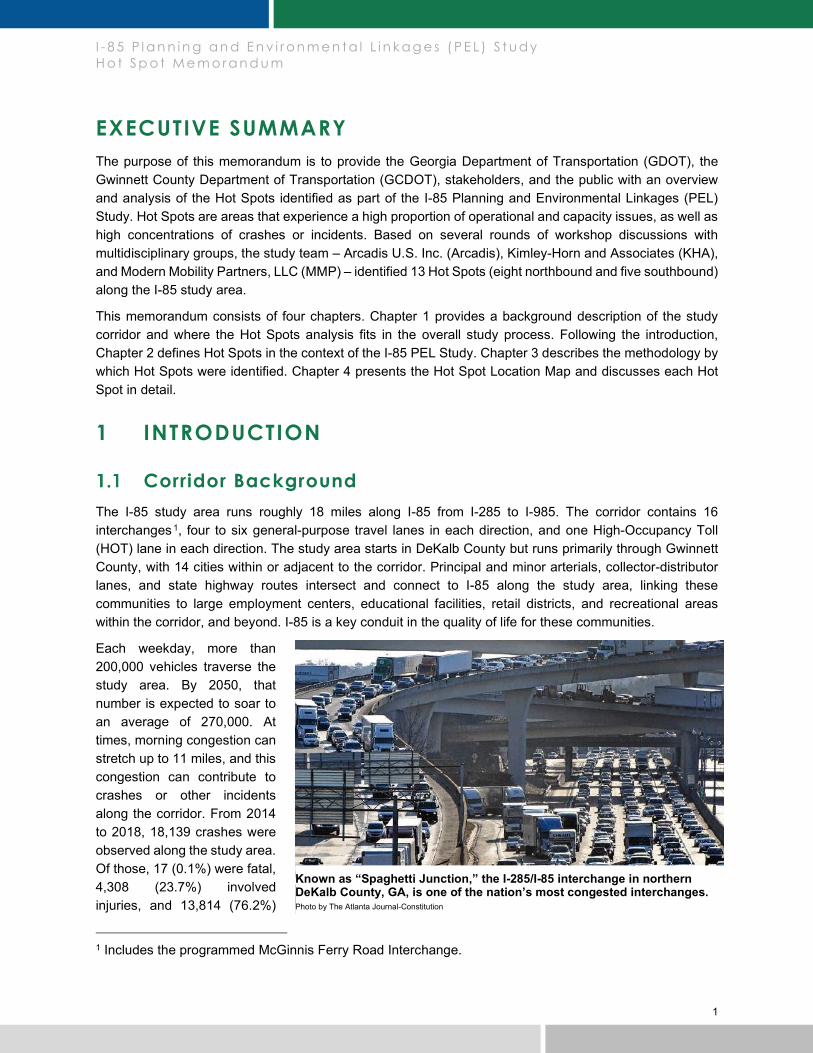
Each weekday, more than 200,000 vehicles traverse the study area. By 2050, that number is expected to soar to an average of 270,000. At times, morning congestion can stretch up to 11 miles, and this congestion can contribute to crashes or other incidents along the corridor. From 2014 to 2018, 18,139 crashes were observed along the study area. Of those, 17 (0.1%) were fatal, 4,308 (23.7%) involved injuries, and 13,814 (76.2%)
1 Includes the programmed McGinnis Ferry Road Interchange.
Known as “Spaghetti Junction,” the I-285/I-85 interchange in northern DeKalb County, GA, is one of the nation’s most congested interchanges. Photo by The Atlanta Journal-Constitution

I - 8 5 P l a n n i n g a n d E n v i r o n m e n t a l L i n k a g e s ( P E L ) S t u d y H o t S p o t M e m o r a n d u m
2
involved property damage only. Compared to state averages on interstate highways, the I-85 study area experiences fewer fatal crashes/fatalities but more non-fatal injury crashes/injuries (Table 1). Such crashes can slow traffic to a crawl – or even a full stop. Such was the case on February 1, 2020, when a fiery truck crash near Jimmy Carter Boulevard shut down northbound traffic on I-85 for eight hours.
Table 1. Study Corridor Crash Rate Comparison and State Average Crash Rates Comparison
Crash/Injury Type
I-85 Crash Rates (per 100 MVM) Statewide Crash Rates (per 100 MVM)
2015 2016 2017 2018 Average
2015-2018
2015 2016 2017 2018 Average
2015-2018
Fatal Crashes 0.21 0.07 0.20 0.40 0.22 0.48 0.50 0.56 0.61 0.54
Fatalities 0.27 0.07 0.20 0.54 0.27 0.52 0.55 0.61 0.66 0.59
Injury Crashes 63 58 60 67 62 46 45 48 49 47
Injuries 91 84 88 98 90 66 67 71 72 69
All Crashes 259 254 269 268 263 183 190 203 201 194
As one of the principal freight corridors in the southeastern United States, I-85 carries significant truck traffic. According to 2019 StreetLight Origin-Destination Data 2, of the commercial freight traffic (13% of total volume) within the corridor, 35% travels all the way through the study area without stopping. In addition, the study corridor sees a significant amount of local traffic. Many trips (67%) begin and end inside the study area, making the corridor a primary artery for short, local trips to bedroom communities within or near the corridor. This high demand for local trips means drivers may spend much of their travel time weaving and merging to avoid friction with other vehicles making conflicting maneuvers.
Hot Spots indicate areas that could benefit from design improvements. Hot Spots are identified throughout the I-85 study area, and they are typically located at or near major roadway junctions, from Pleasantdale Road in the southern part of the corridor to Lawrenceville-Suwanee Road in the northern part. In several instances, these Hot Spots share common characteristics, including closely spaced interchanges, weaving segments, lane drops, and/or an abundance of signs that may confuse drivers. These issues often contribute to a
2 For more information related to StreetLight Data, please visit https://www.streetlightdata.com/our-data/
A fiery crash on I-85 in February closed northbound traffic for eight hours. Photo by The Atlanta Journal-Constitution
I - 8 5 P l a n n i n g a n d E n v i r o n m e n t a l L i n k a g e s ( P E L ) S t u d y H o t S p o t M e m o r a n d u m
3
challenging driver experience, with motorists often having to quickly change lanes, adjust speeds, and/or navigate lane drops at key points along the corridor.
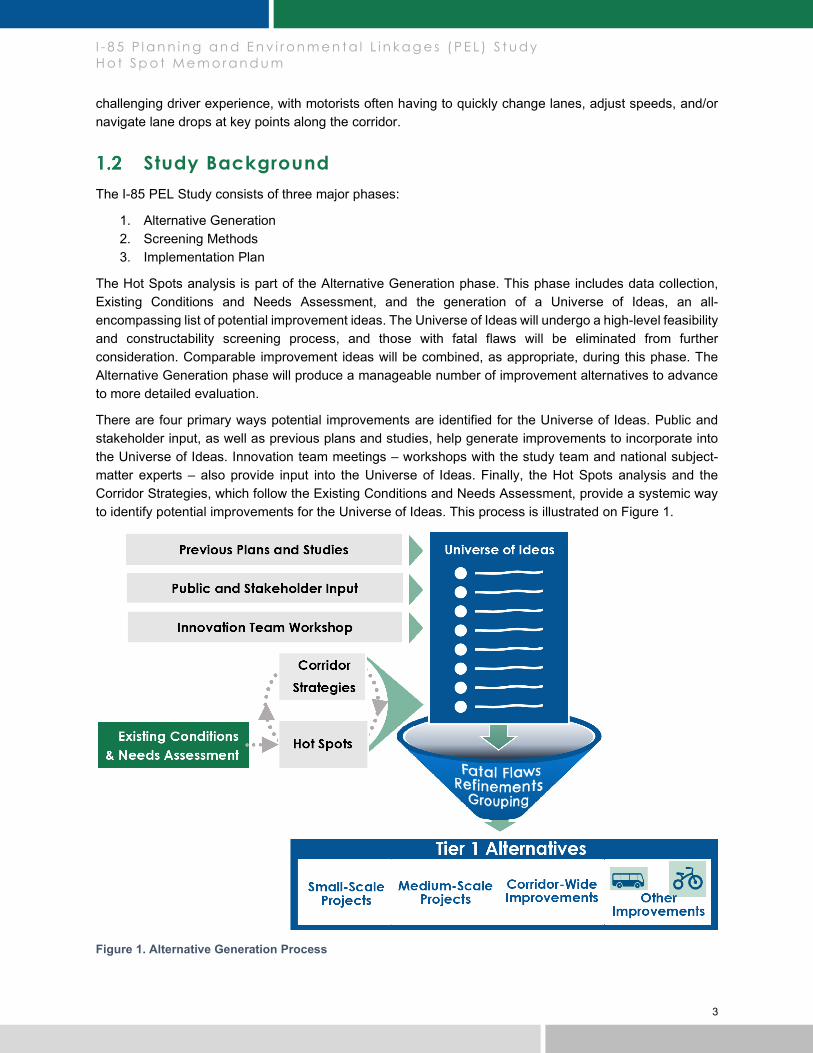
Study Background The I-85 PEL Study consists of three major phases:
1. Alternative Generation 2. Screening Methods 3. Implementation Plan
The Hot Spots analysis is part of the Alternative Generation phase. This phase includes data collection, Existing Conditions and Needs Assessment, and the generation of a Universe of Ideas, an all-encompassing list of potential improvement ideas. The Universe of Ideas will undergo a high-level feasibility and constructability screening process, and those with fatal flaws will be eliminated from further consideration. Comparable improvement ideas will be combined, as appropriate, during this phase. The Alternative Generation phase will produce a manageable number of improvement alternatives to advance to more detailed evaluation.
There are four primary ways potential improvements are identified for the Universe of Ideas. Public and stakeholder input, as well as previous plans and studies, help generate improvements to incorporate into the Universe of Ideas. Innovation team meetings – workshops with the study team and national subject-matter experts – also provide input into the Universe of Ideas. Finally, the Hot Spots analysis and the Corridor Strategies, which follow the Existing Conditions and Needs Assessment, provide a systemic way to identify potential improvements for the Universe of Ideas. This process is illustrated on Figure 1.
Figure 1. Alternative Generation Process

I - 8 5 P l a n n i n g a n d E n v i r o n m e n t a l L i n k a g e s ( P E L ) S t u d y H o t S p o t M e m o r a n d u m
4
In addition to generating ideas, the Hot Spots collectively serve as a tool to summarize and communicate problems along the corridor to stakeholders and the public. In particular, they communicate a distilled version of the Existing Conditions and Needs Assessment.
Lastly, as the ultimate intent of the Existing Conditions and Needs Assessment was to identify PEL Study Needs (listed on Figure 2), the Hot Spots demonstrate where the needs are along the study corridor.
Figure 2. PEL Study Needs

I - 8 5 P l a n n i n g a n d E n v i r o n m e n t a l L i n k a g e s ( P E L ) S t u d y H o t S p o t M e m o r a n d u m
5
2 DEFINITION OF A HOT SPOT In the context of the I-85 PEL Study, the definition of a Hot Spot is as follows:
An area that has been identified as having a high proportion of operational and/or capacity issues, experiencing a high concentration of crashes, and/or needing design improvements.
The definition of a Hot Spot may vary from context to context. The most common definition is “a place of more than usual interest, activity, or popularity.” For transportation studies and analyses, Hot Spots are typically frequent crash zones based on the spatial distribution and concentration of historical crash data or areas of high congestion depending the focus of a study. The following figure is the word cloud generated by participants in a series of Hot Spot workshops held during the week of March 23, 2020. As the figure shows, the audience consensus is that a Hot Spot relates to a problem, congestion, and safety issues.
Figure 3. Hot Spot Word Cloud by Hot Spot Workshop Attendees

I - 8 5 P l a n n i n g a n d E n v i r o n m e n t a l L i n k a g e s ( P E L ) S t u d y H o t S p o t M e m o r a n d u m
6
3 HOT SPOT IDENTIFICATION APPROACH Hot Spots were developed based on data and identified through collaborative workshop sessions with par-ticipants from various disciplines, including planning, environmental, traffic, and roadway design. First, the study team collected a variety of datasets on different topics. These datasets, as illustrated on Figure 4, were sorted and aggregated into digital dashboards that helped identify Hot Spots. The dashboards created interactive experiences in which various datasets could be overlain visually. The dashboards are as follows:
• General Data: information related to safety issues along the corridor • 2019 Existing Conditions Traffic Operations: results from travel demand models • Origin-Destination Explorer: aggregated results from StreetLight Data • Survey Analytics: results from the public online survey
Figure 4. Datasets Reviewed for Hot Spots Analysis
Figure 5 illustrates how Hot Spots can be identified by overlaying different layers of data that reveal significant patterns, including public concerns, congestion, incidents, crashes, human factors, and geometric constraints.
Next, a series of workshop sessions were held to identify, refine, and finalize the locations of Hot Spots along the study corridor. The first round of workshop was held by a group of subject-matter experts (SMEs) to identify preliminary Hot Spots in early February 2020. The workshop consisted of 20 SMEs who could analyze data using digital tools to identify Hot Spots.
Figure 5. Data Layers for Hot Spots Analysis

I - 8 5 P l a n n i n g a n d E n v i r o n m e n t a l L i n k a g e s ( P E L ) S t u d y H o t S p o t M e m o r a n d u m
7
By combining and comparing data sources, the study team identified interrelated patterns leading to areas of concern. In this session, each SME identified a Hot Spot by addressing the root causes to understand the problem and resulting symptoms. This process is illustrated on Figure 6.
The Hot Spots identified by the SMEs were further refined by a series of small group discussions throughout February and March 2020. To document the results, the team developed a draft Hot Spot Location Map.
The study team presented the draft map during three virtual workshop sessions with GDOT and GCDOT during the week of March 23, 2020. All materials, presentations, and feedback are available in the meeting record package submitted to GDOT and GCDOT on April 10, 2020.
Figure 6. Hot Spot Identification Process
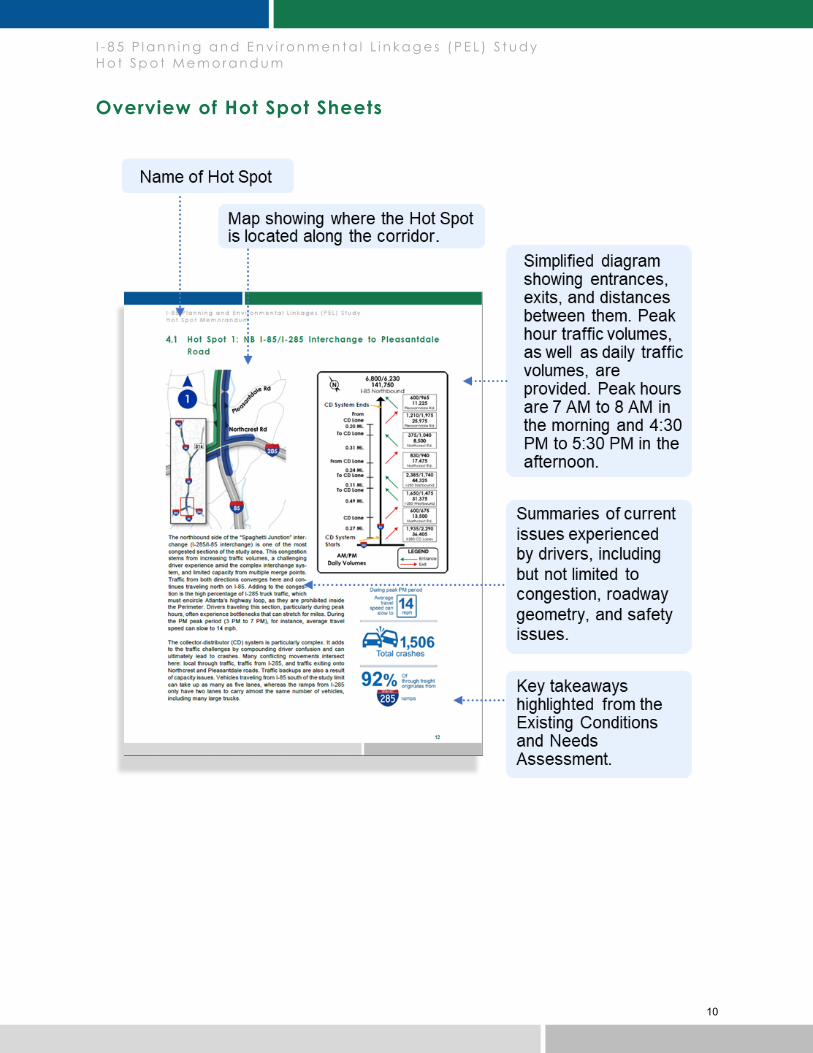
4 HOT SPOTS Thirteen Hot Spots were identified along the I-85 study area, and these are described in detail in this chapter. The chapter begins with a map showing all Hot Spots and their locations along the study corridor. Before examining each Hot Spot, a review sheet is provided to explain the format of each page.

Old
Nor
cros
s Rd
Bufo
rd H
ighw
a
Rockbridge Rd
Jimmy Carter Blvd
Indian Trai l- Lilbu rn Rd
141
23
Northcrest Rd
Steve Reynolds Blvd
Beave
r Ruin
Rd
Pleasantd
ale Rd
285
85
85
Old
Nor
cros
s Rd
Bufo
rd H
ighw
a
Rockbridge Rd
Jimmy Carter Blvd
Indian Trai l- Lilbu rn Rd
141
23
Northcrest Rd
Steve Reynolds Blvd
Pleasant Hill RdPleasant Hill Rd
Beave
r Ruin
Rd
Pleasantd
ale Rd
285285
285
85
85
NNDoravilleDoraville
85StudyHot Spot Location Map
1
13
12
11
3
2
4
5
Pleasantdale Rd/I-285
As drivers from I-285 and I-85 converge at Northcrest Road, they tend to adjust their speed given the large influx of traffic. This leads to a high number of crashes in this area. The complex design of the interchange confuses drivers and leads to last-minute lane changes as many are merging from the Collector-Distributor (C-D) lanes and others are trying to access the High-Occupancy Toll (HOT) lane.
1
Beaver Ruin Rd/Indian Trail-Lilburn Rd
Drivers entering from Indian Trail-Lilburn Road rush to merge onto I-85 due to the short distance between this entrance and the exit to Beaver Ruin Road. This combined with the high number of freight positioning to exit at Beaver Ruin Road causes congestion stretching back along I-85.
3
Jimmy Carter Blvd
Many motorists must change lanes to stay on I-85 as they approach Jimmy CarterBoulevard since the right-most lane endsthere. This lane change causes congestionthat backs up toward Pleasantdale Road.
2
Steve Reynolds Blvd/Beaver Ruin Rd
Drivers entering from Beaver Ruin Road who wish to stay on I-85 must merge due to the auxiliary lane between this entrance and Steve Reynolds Boulevard. These vehicle merges contribute to congestion.
4
Pleasant Hill Rd/Steve Reynolds Blvd
Due to congestion on Pleasant Hill Road caused by the commercial density of Gwinnett Place Mall and Santa Fe Mall, drivers experience slow exit flows at the Pleasant Hill Road interchange.
5
13Pleasantdale Rd/I-285
Due to high volume of traffic exiting onto I-285, drivers begin positioning for this exitearly. This results in lane changes and speedadjustments extending well before the I-285exit. There is also a large number of signs inthis area, leading to driver confusion. This,combined with a high number of vehiclesexiting at Pleasantdale Road, results in a highnumber of crashes and congestion extendingback along I-85.
12Jimmy Carter Blvd/Indian Trail-Lilburn Rd
Drivers using the High-Occupancy Toll (HOT) lane who wish to exit onto Jimmy Carter Boulevard must merge across the entire mainline while traffic from Indian Trail-Lilburn Road must merge to get onto the mainline in the same area. This causes vehicle conflicts, resulting in speed adjustments and congestion.
11Beaver Ruin Rd/Steve Reynolds Blvd
Drivers entering from Steve Reynolds Boulevard who wish to stay on I-85 must merge due to the auxiliary lane between this entrance and Beaver Ruin Road, which contributes to congestion. Also, a high influx of drivers enter I-85 from Steve Reynolds Boulevard and Beaver Ruin Road in the morning peak hours, exceeding the capacity of I-85 in this area. This causes congestion stretching back toward Pleasant Hill Road.
LEGENDHot Spot NorthboundHot Spot Southbound
What Defines a Hot Spot? A Hot Spot, as identified in the I-85 PEL Study, is an area that has been identified as experiencing a high proportion of: 1. Operational/capacity issues; 2. Areas that could benefit from design
improvements; and/or 3. High concentrations of incidents or crashes.
8
Note: The Hot Spots were numbered according to direction along the Interstate, from NB to SB.

Cru
se R
d
Old
Nor
cros
s Rd
Bufo
rd H
ighw
ay N
W 316
317
Sugarloaf Pkwy
Old Peach
tree
Rd
Lawrenceville-Suwanee Rd
85
Cru
se R
d
Old
Nor
cros
s Rd
Bufo
rd H
ighw
ay N
WDuluthDuluth
316
317
Sugarloaf Pkwy
Old Peach
tree
Rd
Lawrenceville-Suwanee Rd
85
Suwanee Suwanee
85StudyHot Spot Location Map
10
9
6
7
8Lorem ipsum
Sugarloaf Pkwy/SR 316
Large volumes of traffic exit I-85 onto SR 316. Due to capacity constraints on SR 316, traffic may back up, causing congestion on I-85.
6
Old Peachtree Rd/Lawrenceville-Suwanee Rd
As a result of the I-85 lane drop at Lawrenceville-Suwanee Road, drivers in the right-most lane must change lanes to stay on I-85, which causes many drivers to adjust theirspeed. These lane and speed changes lead toa high number of crashes in this area.
7
I-985/Lawrenceville-Suwanee Rd
The existing left-hand exit onto I-985 does not meet drivers expectations, causing many drivers to change lanes suddenly. In addition, drivers using the High-Occupancy Toll (HOT) lane who wish to exit onto I-985 must merge into the mainline lanes. These combined lane changes cause congestion in this area.
8
10Pleasant Hill Rd/SR 316
The large volume of drivers entering onto I-85 from SR 316 leads to congestion as they reach a lane drop near Pleasant Hill Road, causing drivers to adjust their speed and merge. In addition, a high volume of drivers enter I-85 at Pleasant Hill Road in the morning peak hours, exceeding the capacity of I-85 in this area. This leads to congestion stretching back toward SR 316.
9Lawrenceville-Suwanee Rd/I-985
As southbound drivers from I-985 and I-85 converge, they tend to adjust their speed due to the heavy flow of traffic. This leads to a high number of crashes in the area. After the merge onto I-85, there is congestion caused by thelarge number of drivers exiting at Lawrenceville-Suwanee Road.
LEGENDHot Spot NorthboundHot Spot Southbound
What Defines a Hot Spot? A Hot Spot, as identified in the I-85 PEL Study, is an area that has been identified as experiencing a high proportion of: 1. Operational/capacity issues; 2. Areas that could benefit from design
improvements; and/or 3. High concentrations of incidents or crashes.
9
Note: The Hot Spots were numbered according to direction along the Interstate, from NB to SB.
I - 8 5 P l a n n i n g a n d E n v i r o n m e n t a l L i n k a g e s ( P E L ) S t u d y H o t S p o t M e m o r a n d u m
10
Overview of Hot Spot Sheets
I - 8 5 P l a n n i n g a n d E n v i r o n m e n t a l L i n k a g e s ( P E L ) S t u d y H o t S p o t M e m o r a n d u m
11
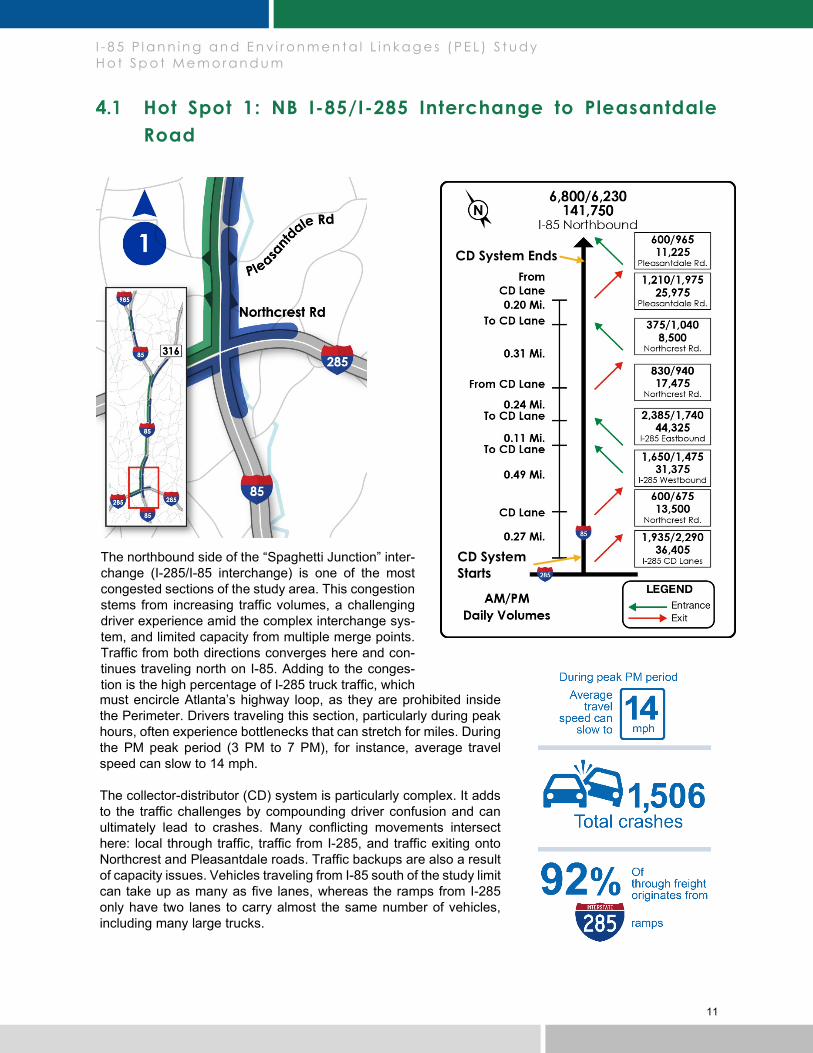
Hot Spot 1: NB I-85/I-285 Interchange to Pleasantdale Road
must encircle Atlanta’s highway loop, as they are prohibited inside the Perimeter. Drivers traveling this section, particularly during peak hours, often experience bottlenecks that can stretch for miles. During the PM peak period (3 PM to 7 PM), for instance, average travel speed can slow to 14 mph. The collector-distributor (CD) system is particularly complex. It adds to the traffic challenges by compounding driver confusion and can ultimately lead to crashes. Many conflicting movements intersect here: local through traffic, traffic from I-285, and traffic exiting onto Northcrest and Pleasantdale roads. Traffic backups are also a result of capacity issues. Vehicles traveling from I-85 south of the study limit can take up as many as five lanes, whereas the ramps from I-285 only have two lanes to carry almost the same number of vehicles, including many large trucks.
The northbound side of the “Spaghetti Junction” inter-change (I-285/I-85 interchange) is one of the most congested sections of the study area. This congestion stems from increasing traffic volumes, a challenging driver experience amid the complex interchange sys-tem, and limited capacity from multiple merge points. Traffic from both directions converges here and con-tinues traveling north on I-85. Adding to the conges-tion is the high percentage of I-285 truck traffic, which
CD System Ends
CD System Starts

I - 8 5 P l a n n i n g a n d E n v i r o n m e n t a l L i n k a g e s ( P E L ) S t u d y H o t S p o t M e m o r a n d u m
12
Hot Spot 2: NB Pleasantdale Road to Jimmy Carter Boulevard
The Jimmy Carter Boulevard exit is the second busiest local exit, with traffic backups originating from multiple lane changes and merge points. Many drivers, especially those traveling from I-285 EB, must change lanes to stay on I-85 as they approach Jimmy Carter Boulevard since the right-most lane ends there. This lane change causes congestion that backs up toward Pleasantdale Road. Meanwhile, as exiting motorists merge to the right, a large amount of traffic is merging left to stay on I-85. Drivers from I-285 seeking to enter the HOT lane must make five lane changes over a distance of about 1 mile, which is particularly challenging during the PM peak hours. These lane changes contribute to a challenging driver experience, resulting in recurring crashes. Almost 65% of these crashes are rear-end collisions. Drivers follow-ing too closely or distracted are some of the common contributing factors for rear-end collisions. A high share of rear-end collisions is a typical indicator for heavy stop-and-go traffic.
Lane Drop
HOT Lane Entrance

I - 8 5 P l a n n i n g a n d E n v i r o n m e n t a l L i n k a g e s ( P E L ) S t u d y H o t S p o t M e m o r a n d u m
13
Hot Spot 3: NB Indian Trail-Lilburn Road to Beaver Ruin Road
A confluence of factors drives congestion in this seg-ment. The distance between the on-ramp from Indian Trail-Lilburn Road and the off-ramp to Beaver Ruin Road is merely a half-mile. This results in a weaving conflict between drivers merging onto I-85 from the Indian Trail- Lilburn Road entrance ramp and drivers diverging to the Beaver Ruin Road exit ramp. The dynamic shoulder lane currently in place is activated when the travel speed drops below 45 mph. A total of 11,950 vehicles exit at Beaver Ruin Road daily, which comprises almost 5% of all northbound traffic. As for freight vehicles, 7% of all northbound trips conclude at Beaver Ruin Road. More than 15,000 vehicles enter I-85 from Indian Trail-Lilburn Road, but 13% of them exit at Beaver Ruin Road. One possible explanation for why drivers use the interstate for such a short distance could be the lack of direct local connections near I-85. Three fatal crashes occurred in this area over the past five years. Two of the fatal collisions occurred as a result of improper lane changes. Distracted driving or inatten-tiveness accounted for approximately half of the colli-sions. Following too closely and improper lane changes each contributed to about 20% of the crashes, indicating a challenging driver experience due to the complexity of this area to drivers.
Lane Drop

I - 8 5 P l a n n i n g a n d E n v i r o n m e n t a l L i n k a g e s ( P E L ) S t u d y H o t S p o t M e m o r a n d u m
14
Hot Spot 4: NB Beaver Ruin Road to Steve Reynolds Boulevard
Short merging and weaving distances, combined with a high volume of entering and exiting vehicles, make this segment problematic for motorists. During peak periods, drivers merg-ing in from the Beaver Ruin Road entrance ramp may encoun-ter turbulence as diverging drivers maneuver to exit to Steve Reynolds Boulevard. Approximately 16,000 vehicles exit at Steve Reynold Boule-vard, more than half of which entered I-85 north of the I-285 interchange; 17% of that traffic originates from Jimmy Carter Boulevard, less than 5 miles apart. This indicates the potential to use a local road network as alternative routes to I-85. The complex demand and other conditions make this a partic-ularly congested section – and one that experiences occa-sional vehicle crashes. Rear-end collisions account for the highest proportion (59%) of the crashes followed by sideswipe (same direction) collisions (25%). Other factors contributing to crashes include distracted driving (the most common phe-nomenon), improper lane changes, and following too closely. Rear-end crashes and sideswipe crashes are typically consid-ered “congestion-related” crashes. Improvements that focus on alleviating traffic and reducing congestion could result in a reduction of crashes in this area.
Lane Drop

I - 8 5 P l a n n i n g a n d E n v i r o n m e n t a l L i n k a g e s ( P E L ) S t u d y H o t S p o t M e m o r a n d u m
15
Hot Spot 5: NB Steve Reynolds Boulevard to Pleasant Hill Road
Drivers experience slow exit speeds at the Pleasant Hill Road interchange due to traffic backups that severely impact opera-tions within this segment. Approximately 9,000 vehicles, or 5% of all northbound traffic, exit at Pleasant Hill Road. More than half of the traffic exiting at Pleasant Hill Road originates from ramps north of I-285. Pleasant Hill Road is a significant gateway to communities north of metro Atlanta, including Duluth and Peachtree Corners in Gwinnett County as well as Johns Creek and Alpharetta in Ful-ton County. In addition, Pleasant Hill Road is a commercial cor-ridor, serving as a destination for those looking to shop at Gwin-nett Place Mall or frequent nearby restaurants, grocery stores, and car dealerships. Some keywords mentioned by the public when commenting on this segment of the corridor include “con-gested” and “traffic.” Almost 60% of the crashes observed within this segment were rear-end collisions. Although rear-end collisions are typically re-lated to stop-and-go traffic conditions, in this segment, dis-tracted driving (42%) was the most prevalent factor contributing to these crashes, which means safety improvements may in-volve additional non-infrastructure solutions.
Lane Drop

I - 8 5 P l a n n i n g a n d E n v i r o n m e n t a l L i n k a g e s ( P E L ) S t u d y H o t S p o t M e m o r a n d u m
16
Hot Spot 6: NB SR 316/Sugarloaf Parkway
State Route (SR) 316 is the most popular destination for vehicles traveling north along I-85. More than 35,000 vehi-cles exit onto SR 316 each day, of which approximately 20% is freight traffic. This means a significant number of trucks are using SR 316 to travel to areas such as Law-renceville or Athens. A large share of the overall traffic (24%) exiting here originates from I-285. During peak hours, the share of traffic originating from I-285 increases to 30%. Another large portion of traffic (22%) exiting onto SR 316 originates from I-85 south of the study limit, all in-dicating the significant impact from this Hot Spot to the overall operations of the study area. Drivers traveling from I-285 can stay in the fifth lane along I-85 after making a lane change at Jimmy Carter Boulevard to continue traveling to SR 316. This also means that driv-ers who want to stay on I-85 must merge left to continue north. Lane changes, coupled with frequent congestion, contribute to this area’s vehicle crash history. From 2014 to 2018, 736 crashes, including one fatal crash, were ob-served. The fatal crash occurred after a driver improperly changed lanes, causing a sideswipe collision.

I - 8 5 P l a n n i n g a n d E n v i r o n m e n t a l L i n k a g e s ( P E L ) S t u d y H o t S p o t M e m o r a n d u m
17
Hot Spot 7: NB Old Peachtree Road/Lawrenceville-Suwanee Road
A lane reduction in this segment of I-85 forces drivers to weave and reduce speeds, causing a ripple effect of sudden traffic movements that can lead to vehicle crashes. The lane drop at Lawrenceville-Suwanee Road forces drivers in the right-most lane to change lanes to stay on I-85. Like SR 316, Lawrenceville-Suwanee Road is a top destination, with more than 16,000 vehi-cles, or 6% of all northbound traffic, exiting here. The high volume of traffic exiting, combined with the number of vehicles continuing north, creates turbulence in traffic flow. The situation is worse at night, when drivers in this area often find it difficult to see the roads clearly. In the past five years, one fatal crash was reported in this segment, and it occurred during evening hours with limited visibil-ity. Additionally, weaving also leads to a significant num-ber of rear-end crashes in this segment. A new interchange planned for I-85 and McGinnis Ferry Road holds the promise of easing traffic on nearby Lawrenceville-Suwanee Road. Among other features, the interchange may shorten the weaving section. This project is listed in the region’s Transportation Improvement Plan.
Lane Drop
I - 8 5 P l a n n i n g a n d E n v i r o n m e n t a l L i n k a g e s ( P E L ) S t u d y H o t S p o t M e m o r a n d u m
18
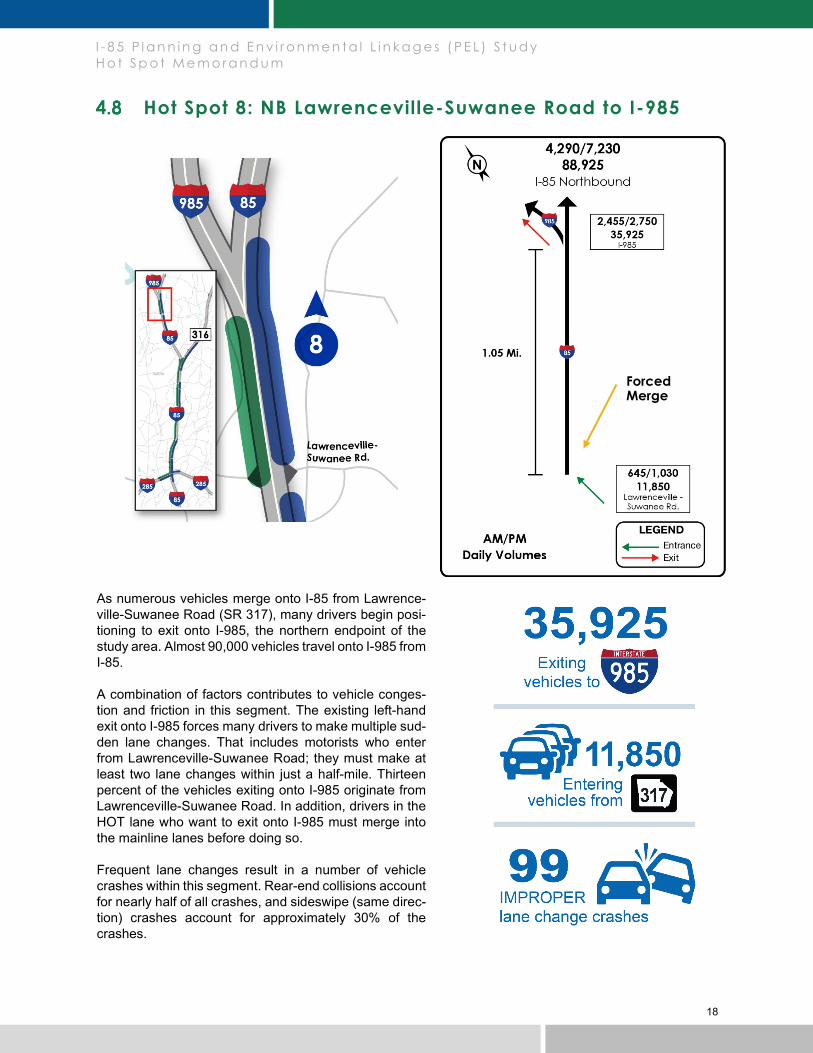
Hot Spot 8: NB Lawrenceville-Suwanee Road to I-985
As numerous vehicles merge onto I-85 from Lawrence-ville-Suwanee Road (SR 317), many drivers begin posi-tioning to exit onto I-985, the northern endpoint of the study area. Almost 90,000 vehicles travel onto I-985 from I-85. A combination of factors contributes to vehicle conges-tion and friction in this segment. The existing left-hand exit onto I-985 forces many drivers to make multiple sud-den lane changes. That includes motorists who enter from Lawrenceville-Suwanee Road; they must make at least two lane changes within just a half-mile. Thirteen percent of the vehicles exiting onto I-985 originate from Lawrenceville-Suwanee Road. In addition, drivers in the HOT lane who want to exit onto I-985 must merge into the mainline lanes before doing so. Frequent lane changes result in a number of vehicle crashes within this segment. Rear-end collisions account for nearly half of all crashes, and sideswipe (same direc-tion) crashes account for approximately 30% of the crashes.
Forced Merge

I - 8 5 P l a n n i n g a n d E n v i r o n m e n t a l L i n k a g e s ( P E L ) S t u d y H o t S p o t M e m o r a n d u m
19
Hot Spot 9: SB I-985 to Lawrenceville-Suwanee Road
This segment experiences a heavy flow of traffic, par-ticularly as drivers going southbound from I-985 and I-85 (outside the study area) converge. Traffic that originates from I-85 north and I-985 comprises 20% of all southbound traffic. Approximately 90,000 vehi-cles enter the corridor daily from these two directions. A significant number of drivers exit at Lawrenceville-Suwanee Road (SR 317), and the weaving distance between the I-985 on-ramp and SR 317 off-ramp is just 1 mile. This distance makes it difficult for drivers to change lanes, particularly during peak hours. The challenging driver experience is even more pro-nounced for I-985 motorists seeking to use the HOT lane. These motorists need to make five lane changes within roughly the same distance. Each day, about 16,000 vehicles enter I-85 south from Lawrenceville-Suwanee Road, making it the busiest on-ramp north of SR 316 and sixth busiest along the corridor. Vehicle crashes are prevalent, and they consist mostly of rear-end and sideswipe (same direction) collisions.

I - 8 5 P l a n n i n g a n d E n v i r o n m e n t a l L i n k a g e s ( P E L ) S t u d y H o t S p o t M e m o r a n d u m
20
Hot Spot 10: SB SR 316 to Pleasant Hill Road
With 13% of all southbound traffic originating from SR 316, this segment of I-85 experiences a crush of heavy traffic. Each day, more than 38,000 vehicles (HOT lane and gen-eral-purpose lane combined) travel from SR 316 to I-85. Making matters worse, motorists entering I-85 from SR 316 must merge before a lane reduction near Pleasant Hill Road, adding to the congestion from limited capacity. During morning peak hours, about 15,000 vehicles enter I-85 at Pleasant Hill Road. The CD system ends here, car-rying another 12,000 vehicles from local ramps as far as Sugarloaf Parkway. As a result, drivers come to a veritable standstill during their morning commute. Drivers who want to access the HOT lane can take the direct ramp from SR 316. However, when merging onto the HOT lane from I-85, drivers must slow down because of the short merging distance. Also, HOT lane travel speeds in this segment are lower than that of the general-purpose lanes.
Lane Drop

I - 8 5 P l a n n i n g a n d E n v i r o n m e n t a l L i n k a g e s ( P E L ) S t u d y H o t S p o t M e m o r a n d u m
21
Hot Spot 11: SB Steve Reynolds Boulevard/Beaver Ruin Road
Heavy congestion is prevalent in this segment. So are rear-end collisions. This is due, in part, to an influx of traffic from Beaver Ruin Road and Steve Reynolds Boulevard. Each day, approximately 16,000 vehicles enter from Steve Reynolds Boulevard and approxi-mately 14,500 from Beaver Ruin Road. Together, these two entrances contribute almost 12% of all SB traffic, as much as SR 316. Making matters worse, a large number of vehicles entering from Steve Reynolds Boulevard exit at Beaver Ruin Road. Plus, drivers en-tering from Steve Reynolds Boulevard who want to stay on I-85 must merge because of the auxiliary lane be-tween this entrance and Beaver Ruin Road. During the morning peak hours, the high influx of driv-ers entering the interstate from these two arterials ex-ceeds the capacity of I-85 in this segment. This limited capacity causes congestion stretching toward Pleasant Hill Road and contributes to a high number of crashes, particularly rear-end collisions. Rear-end crashes are prevalent in all segments, but that is particularly true in this segment, with rear-end collisions accounting for more than 70% of all crashes. Factors contributing to crashes include distracted driving (49%), following too closely (23%), and changing lanes improperly (20%).

I - 8 5 P l a n n i n g a n d E n v i r o n m e n t a l L i n k a g e s ( P E L ) S t u d y H o t S p o t M e m o r a n d u m
22
Hot Spot 12: SB Indian Trail-Lilburn Road to Jimmy Carter Boulevard
Aside from I-85 south of the study limit, I-285 west, and I-285 east, Jimmy Carter Boulevard is the most popular local destination for all southbound vehicles. More than 21,000 vehicles exit onto Jimmy Carter Boulevard when traveling south along the corridor. This segment also experiences a large number of lo-cal traffic: 18% from Beaver Ruin Road, 11% from Pleasant Hill Road, and 10% from Steve Reynolds Boulevard, all interchanges south of SR 316.
In the meantime, more than 20,000 vehicles enter I-85 from Jimmy Carter Boulevard. With this influx of cars, drivers (especially in the right lanes) would slow down as they approach the entrance ramp of Jimmy Carter Boulevard. Speed adjustments and vehicle conflicts result from a confluence of factors. Drivers using the HOT lane who want to exit onto Jimmy Carter Boulevard must merge across five lanes. In the same area, traffic from Indian Trail-Lilburn Road must merge onto the mainline. In addition, a significant number of motorists enter from Jimmy Carter Boulevard, causing backups in the right lanes. There was one fatal crash in this segment between 2014 and 2018. The crash report indicated the driver was speeding or “other” and hit a concrete median barrier.

I - 8 5 P l a n n i n g a n d E n v i r o n m e n t a l L i n k a g e s ( P E L ) S t u d y H o t S p o t M e m o r a n d u m
23
Hot Spot 13: SB Pleasantdale Road to I-285
Nearly 25% of all vehicles traveling south along the corridor exit at I-285. This share jumps to 58% for large and medium trucks because commercial vehi-cles must use I-285 to bypass metro Atlanta. The high volume of traffic exiting onto I-285 has drivers posi-tioning for this exit early. This results in lane changes and speed adjustments extending well before the I-285 exit ramps. During morning peak hours, the number of motorists traveling to I-285 west exceeds the capacity of the current roadway. The exit ramps are placed close to one another, and signs are densely placed in this area. Information shown on the signs typically occupies as much as the entire signage plate. Drivers unfamiliar with this seg-ment are likely to feel overwhelmed by the amount of information and movements in this area. It is not sur-prising that crashes in this area appeared to be more severe than those in other areas. From 2014 to 2018, this segment experienced four fatal crashes. Three were reported as rear-end collisions in which the driv-ers were following too closely. The remaining fatal crash was a single-vehicle collision in which the driver was distracted.

I - 8 5 P l a n n i n g a n d E n v i r o n m e n t a l L i n k a g e s ( P E L ) S t u d y H o t S p o t M e m o r a n d u m
24
5 SUMMARY The I-85 PEL Study area plays an important role in linking surrounding communities to metro Atlanta and carrying regional freight movement. All 13 Hot Spots listed in this memo are areas that experience a high proportion of operational and/or capacity issues, show a high concentration of crashes, and/or need design improvements. Hot Spots have the largest impact on operations of the I-85 corridor; therefore, identifying improvements that target these areas will yield the greatest benefits to the corridor. The study team will use these Hot Spots as a guide to develop problem-solving strategies and improvement ideas along the corridor. The related documents listed below provide further information about the study:
• Data Technical Memo: provides a summary of data collected, detailed data dictionary, and a summary of previous plans and studies that were reviewed by the project team.
• Existing Conditions and Needs Assessment Memo: examines existing and future conditions on key disciplines such as demographics, land use, roadway, safety, human factors, traffic operations, and environmental, as well as identifies the I-85 PEL Study needs.
• Corridor Strategies Technical Memo: documents the process of developing typical strategies that can be applied to the study corridor.
Hot Spots, working in conjunction with Corridor Strategies, provide a systematic way to identify potential improvements for the Universe of Ideas. In addition to generating ideas, Hot Spots serve as a tool to summarize and communicate problems along the corridor to stakeholders and the public as a distilled version of the Existing Conditions and Needs Assessment.

Arcadis U.S., Inc.
2839 Paces Ferry Road
Suite 900
Atlanta, Georgia 30339
Tel 770 431 8666
Fax 770 435 2666
www.arcadis.com