Embed Size (px)
Citation preview
Please refer to the important disclosures and analyst certification on page 2 and the inside back cover of this document, or on our website www.macquarie.com.au/disclosures.
CANADA
PFC CN Outperform Price 15 Mar 11 C$3.20 Volatility index Very High 12-month target C$ 10.00 12-month TSR % +212.5 Valuation C$ 10.00 - 0.5x RENAV GICS sector Energy Market cap C$m 153 30-day avg turnover C$m 0.7 Market cap US$m 156 Number shares on issue m 47.70
Investment fundamentals Year end 31 Dec 2010E 2011E 2012E 2013E Revenue m nmf 0.0 0.0 0.0 EBITDA m nmf -2.0 -2.0 -2.0 Recurring profit m nmf -2.3 -3.2 -7.0 Reported profit m nmf -2.3 -3.2 -7.0 Gross cashflow m nmf -1.5 -2.4 -6.2 CFPS C$ nmf -0.03 -0.05 -0.12 CFPS growth % nmf nmf -56.8 -155.5 PGCFPS x nmf -107.2 -68.3 -26.7 Total DPS C$ nmf 0.00 0.00 0.00 Total div yield % nmf 0.0 0.0 0.0 ROA % nmf -5.3 -4.5 -2.9 ROE % nmf -2.3 -3.7 -10.2 EV/EBITDA x nmf -53.3 -53.3 -53.3 Net debt/equity % -87.6 -34.7 45.9 165.3 P/BV x 2.4 2.5 2.6 2.9
Source: FactSet, Macquarie Research, March 2011 (all figures in CAD unless noted)
David Popowich +1 403 539 8529 [email protected] Darrell Bishop +1 403 218 6657 [email protected]
16 March 2011 Macquarie Capital Markets Canada Ltd.
PetroFrontier “Hot” shots: exploring for light oil resource in Australia’s outback Unrivalled resource potential PetroFrontier is an exploration-stage oil and gas company with a core operational focus in Australia’s Georgina Basin, where it controls an average 64% working interest in 13.6m contiguous acres of oil and gas exploration permits. Independent resource assessments of PetroFrontier’s land base have pegged the prospective recoverable oil resource at 27.5bn bbl (P50, gross, unrisked).
Analogous to Bakken oil play The unconventional Lower Arthur Creek Hot Shale is believed to hold oil reservoirs, source beds and traps that are analogous to the unconventional Bakken shale play in Canada and the US. The Bakken is recognized as the largest and most successful unconventional reservoir in North America, and the Lower Arthur Creek has the potential to be a very large unconventional play for PetroFrontier.
Live oil shows and high background gas Initial signs from the Georgina Basin appear promising. Between 1962 and 1991, approximately 29 wells were drilled on PetroFrontier’s lands. Most of these legacy wells were logged and cored, and although subsequently abandoned, many encountered oil shows. PetroFrontier has identified 12 potential, untested, bypassed pay zones in a number of these wells, many with high background gas.
Low-cost, onshore exploration in a first-world country Onshore exploration in Australia offers a competitive cost structure and fiscal terms, in a stable, democratic country. With access to oil and gas infrastructure in close proximity to PetroFrontier’s land base, we believe the company is positioned to turn a discovery into a development project in short order.
Initiating coverage with a C$10.00 target price and Outperform rating We are initiating coverage on PetroFrontier with a 12-month target price of C$10.00, which is based on a heavily risked valuation for the company’s conventional and unconventional inventory. We believe this represents fair risked value for the company’s current portfolio, given available independent estimates of the Georgina Basin’s resource potential and taking into account PetroFrontier’s working capital position.
Macquarie Research PetroFrontier
16 March 2011 2
Inside
“Hot” shots: exploring for light oil resource in Australia’s outback 3
Asset overview 6
Operations update 14
Valuation and RENAV 16
Recommendation and Conclusion 18
Key risks 19
PetroFrontier Corp. Company profile PetroFrontier is an exploration-stage oil and gas company with a core operational
focus in Australia’s Georgina Basin, where it controls a 64% working interest in 13.6m contiguous acres of oil and gas exploration permits. With 47.7m common shares outstanding, PetroFrontier has a market capitalization of C$150m. The company’s common shares trade on the TSX Venture Exchange under the ticker symbol PFC.
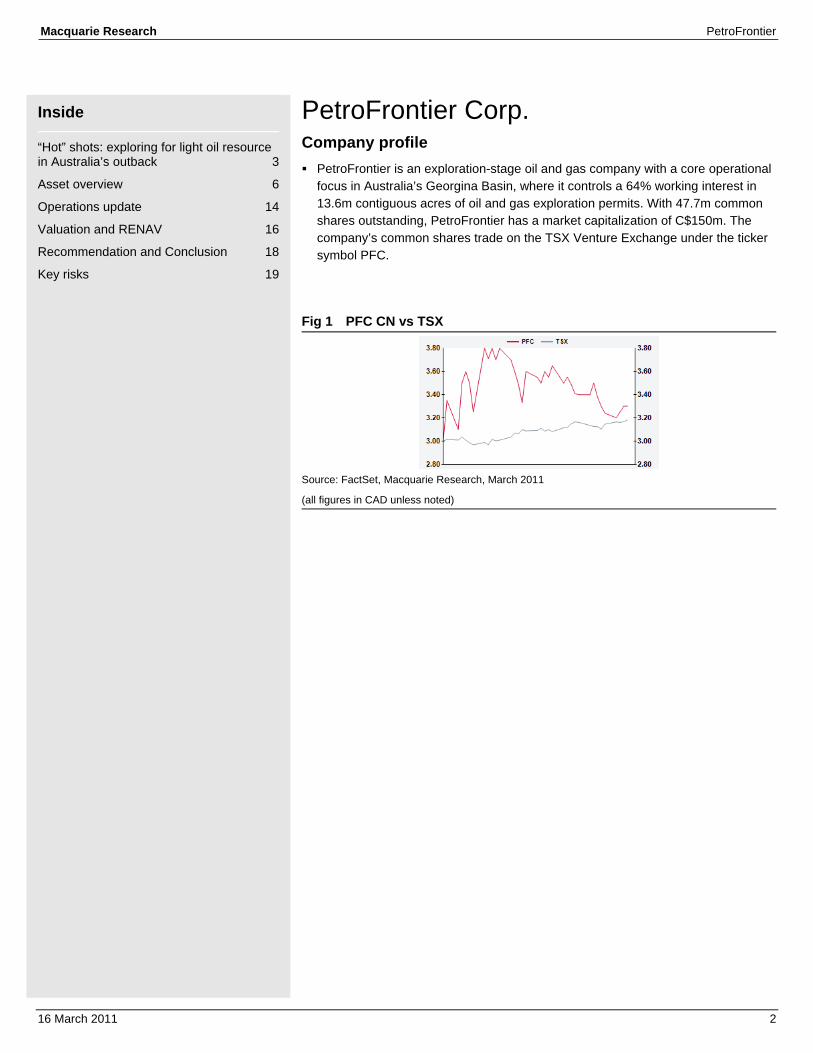
Fig 1 PFC CN vs TSX
Source: FactSet, Macquarie Research, March 2011
(all figures in CAD unless noted)
Macquarie Research PetroFrontier
16 March 2011 3
“Hot” shots: exploring for light oil resource in Australia’s outback We are initiating coverage of PetroFrontier with a 12-month target price of C$10.00, which equates to 0.5x our RENAV on flat US$90.00/b WTI crude pricing. PetroFrontier does not currently have any production or reserves, and as such, our valuation is largely based on an independent resource assessment of the company’s lands, prepared by Ryder Scott in November 2010, which estimated gross recoverable resource potential of 27.5bn bbl of oil (P50, unrisked).
PetroFrontier’s entire land base is located in Australia’s Georgina Basin. The company holds an average 64% WI and is the operator on 13.6m contiguous acres of land in this onshore basin, which is sparsely explored by modern oil and gas standards. PetroFrontier has acquired 2D seismic, and analysed legacy well logs and core samples taken by early explorers to the region. The company has identified more than 12 potential bypassed pay zones across its four exploration permits, with the primary zone of interest being the unconventional Lower Arthur Creek organic-rich “Hot Shale”. According to independent resource estimates, this zone may contain recoverable oil resource of more than 26bn bbl (P50, gross, unrisked). Several drilling locations have been mapped, and a rig is expected to move to site shortly and spud the first of two initial horizontal wells by the end of April 2011.
Investment highlights Unrivalled resource potential. Prospective recoverable oil on PetroFrontier’s land is estimated at 27.5bn bbl (P50, unrisked). A commercial oil discovery even a fraction of this size would be a “company-maker” for PetroFrontier.
Analogous to Bakken oil play. The Lower Arthur Creek formation is believed to be analogous to the unconventional Bakken oil shale in Canada and the US. While the Bakken is recognized as the largest and most successful unconventional reservoir in North America, we believe the Lower Arthur Creek also has the potential to become a very large unconventional play.
Legacy wells had live oil shows and high background gas. Mining companies and previous oil and gas explorers drilled 29 wells on PetroFrontier’s lands in the Georgina Basin. Legacy wells were logged and cored, and although subsequently abandoned, many of these wells encountered oil shows with high background gas.
Low-cost, onshore exploration in a first-world country. Onshore exploration in Australia offers a competitive cost structure and fiscal terms, in a stable, democratic country. With access to oil and gas infrastructure in close proximity to PetroFontier’s land base, the company is positioned to turn a discovery into development in short order.
Investment risks Wildcat exploration. We view PetroFrontier as a high-risk/high-reward exploration story. Drilling results are likely to be closely watched by the market and can be expected to result in significant fluctuations in the share price.
Financing/dilution risk. While PetroFrontier is currently adequately funded to execute its first few exploration wells, the company will likely require external sources of capital to fund ongoing exploration activities and perhaps even to retain its existing licences.
Availability of services. Although PetroFrontier has identified a drilling contractor for its first four exploration wells, Australia does not have a robust land rig market. This may lead to delays in PetroFrontier’s work program down the road.
Macquarie Research PetroFrontier
16 March 2011 4
Management PetroFrontier is led by Chief Executive Officer Paul Bennett, who is based in Calgary, Alberta. Mr. Bennett is a geologist with more than 38 years of experience in the oil and gas, and mining industries. Prior to joining PetroFrontier, Mr. Bennett held senior management positions with ExxonMobil in the United States, the United Kingdom and Canada. Mr. Bennett has supervised exploration teams in the Gulf of Mexico, the North Sea, Western Canada, Newfoundland and Nova Scotia.
Matthew Philipchuk is PetroFrontier’s President and a co-founder of the company. He manages PetroFrontier’s corporate and business development activities from Adelaide, Australia. Mr. Philipchuk has more than 13 years of experience in the energy industry, including senior management positions with WIN Energy, Phi Capital and Odin Capital.
Shane Kozak is VP Finance, CFO and Secretary. Mr. Kozak has held a number of senior financial management roles in the oil and gas industry, including VP Finance and CFO of WIN Energy, where he worked with other principals of PetroFrontier.
Peter Philipchuk is a co-founder and the current VP Exploration of PetroFrontier; he is a geologist by profession and previously served as President of WIN Energy, a publicly listed E&P company with operations in southern Alberta.
PetroFrontier’s board of directors includes a number of respected members of the Canadian oil and gas community. Dr. James Buckee is the former President and CEO of Talisman Energy, and has extensive experience in the field of international oil and gas exploration. Donald Rae is the current President and CEO of Coral Hill Energy; previously, Mr. Rae served as the President and CEO of Wave Energy, a Canadian E&P with operations in Saskatchewan’s unconventional Lower Shaunavon light oil play. Officers and directors control 15% of PetroFrontier’s outstanding shares (20% on a fully diluted basis).
Note that a number of PetroFrontier’s principals remain affiliated with Rodinia Oil (ROZ CN, C$2.04, Outperform, TP: C$5.00), a sister company from which PetroFrontier was spun out in February 2009. Rodinia is expected to commence a multiwell exploratory drilling program in Australia’s Officer Basin in 2Q11.
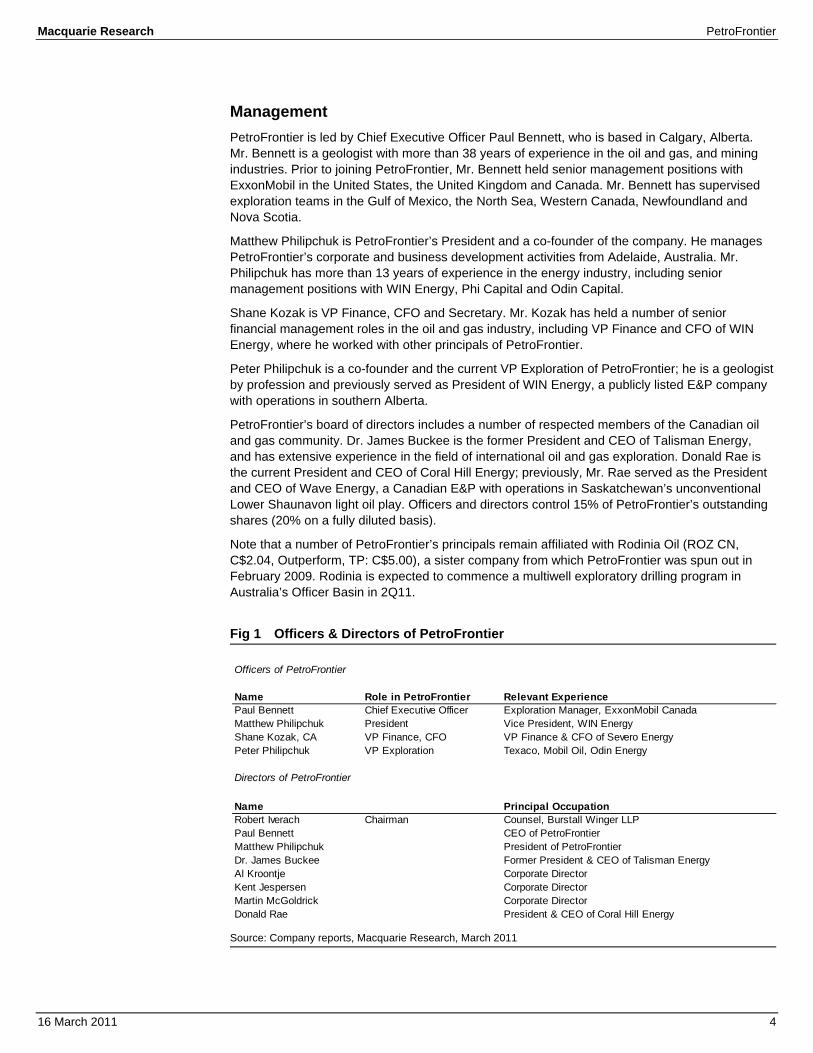
Fig 1 Officers & Directors of PetroFrontier
Source: Company reports, Macquarie Research, March 2011
Officers of PetroFrontier
Name Role in PetroFrontier Relevant ExperiencePaul Bennett Chief Executive Officer Exploration Manager, ExxonMobil CanadaMatthew Philipchuk President Vice President, WIN EnergyShane Kozak, CA VP Finance, CFO VP Finance & CFO of Severo EnergyPeter Philipchuk VP Exploration Texaco, Mobil Oil, Odin Energy
Directors of PetroFrontier
Name Principal OccupationRobert Iverach Chairman Counsel, Burstall Winger LLPPaul Bennett CEO of PetroFrontierMatthew Philipchuk President of PetroFrontierDr. James Buckee Former President & CEO of Talisman EnergyAl Kroontje Corporate DirectorKent Jespersen Corporate DirectorMartin McGoldrick Corporate DirectorDonald Rae President & CEO of Coral Hill Energy
Macquarie Research PetroFrontier
16 March 2011 5
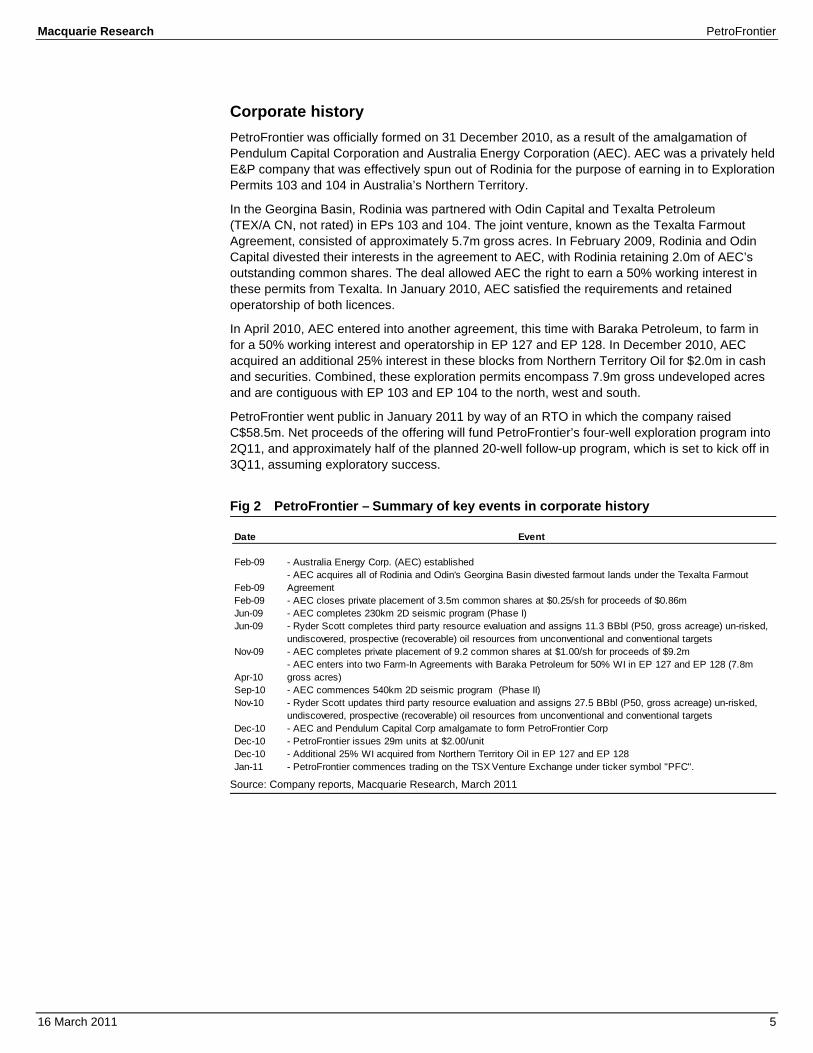
Corporate history PetroFrontier was officially formed on 31 December 2010, as a result of the amalgamation of Pendulum Capital Corporation and Australia Energy Corporation (AEC). AEC was a privately held E&P company that was effectively spun out of Rodinia for the purpose of earning in to Exploration Permits 103 and 104 in Australia’s Northern Territory.
In the Georgina Basin, Rodinia was partnered with Odin Capital and Texalta Petroleum (TEX/A CN, not rated) in EPs 103 and 104. The joint venture, known as the Texalta Farmout Agreement, consisted of approximately 5.7m gross acres. In February 2009, Rodinia and Odin Capital divested their interests in the agreement to AEC, with Rodinia retaining 2.0m of AEC’s outstanding common shares. The deal allowed AEC the right to earn a 50% working interest in these permits from Texalta. In January 2010, AEC satisfied the requirements and retained operatorship of both licences.
In April 2010, AEC entered into another agreement, this time with Baraka Petroleum, to farm in for a 50% working interest and operatorship in EP 127 and EP 128. In December 2010, AEC acquired an additional 25% interest in these blocks from Northern Territory Oil for $2.0m in cash and securities. Combined, these exploration permits encompass 7.9m gross undeveloped acres and are contiguous with EP 103 and EP 104 to the north, west and south.
PetroFrontier went public in January 2011 by way of an RTO in which the company raised C$58.5m. Net proceeds of the offering will fund PetroFrontier’s four-well exploration program into 2Q11, and approximately half of the planned 20-well follow-up program, which is set to kick off in 3Q11, assuming exploratory success.
Fig 2 PetroFrontier – Summary of key events in corporate history
Source: Company reports, Macquarie Research, March 2011
Date Event
Feb-09 - Australia Energy Corp. (AEC) established
Feb-09- AEC acquires all of Rodinia and Odin's Georgina Basin divested farmout lands under the Texalta Farmout Agreement
Feb-09 - AEC closes private placement of 3.5m common shares at $0.25/sh for proceeds of $0.86mJun-09 - AEC completes 230km 2D seismic program (Phase I)Jun-09 - Ryder Scott completes third party resource evaluation and assigns 11.3 BBbl (P50, gross acreage) un-risked,
undiscovered, prospective (recoverable) oil resources from unconventional and conventional targetsNov-09 - AEC completes private placement of 9.2 common shares at $1.00/sh for proceeds of $9.2m
Apr-10- AEC enters into two Farm-In Agreements with Baraka Petroleum for 50% WI in EP 127 and EP 128 (7.8m gross acres)
Sep-10 - AEC commences 540km 2D seismic program (Phase II)Nov-10 - Ryder Scott updates third party resource evaluation and assigns 27.5 BBbl (P50, gross acreage) un-risked,
undiscovered, prospective (recoverable) oil resources from unconventional and conventional targetsDec-10 - AEC and Pendulum Capital Corp amalgamate to form PetroFrontier CorpDec-10 - PetroFrontier issues 29m units at $2.00/unitDec-10 - Additional 25% WI acquired from Northern Territory Oil in EP 127 and EP 128Jan-11 - PetroFrontier commences trading on the TSX Venture Exchange under ticker symbol "PFC".
Macquarie Research PetroFrontier
16 March 2011 6
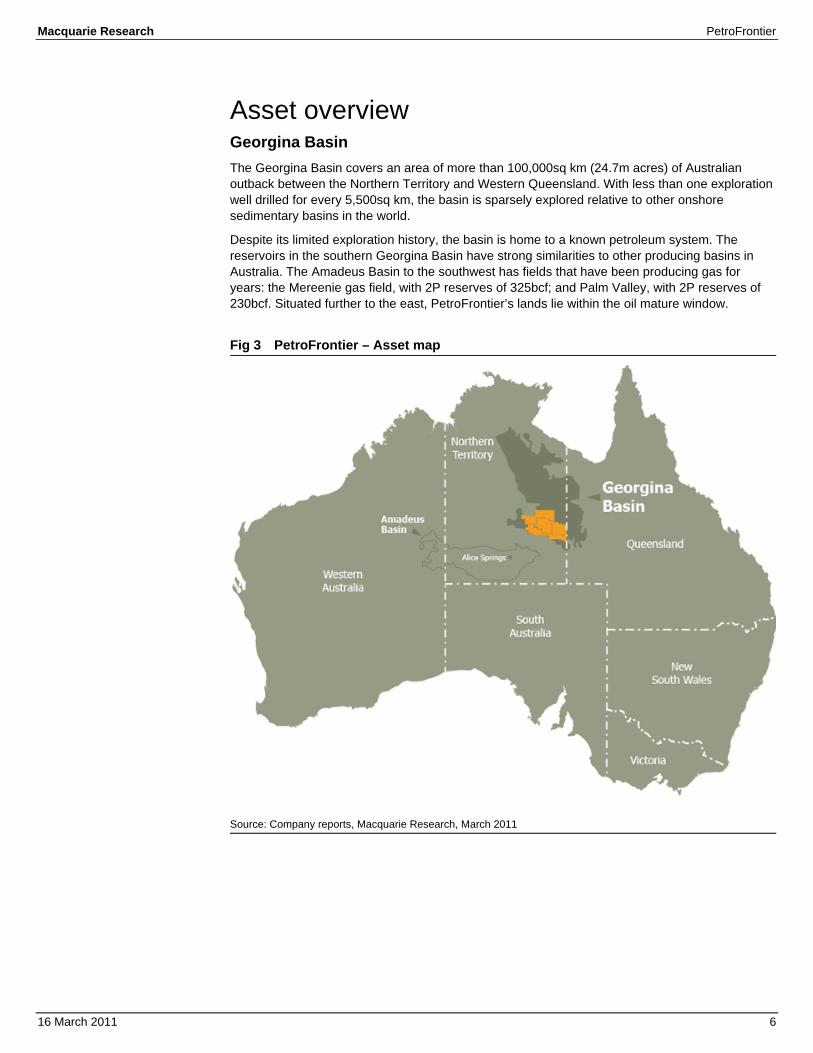
Asset overview Georgina Basin The Georgina Basin covers an area of more than 100,000sq km (24.7m acres) of Australian outback between the Northern Territory and Western Queensland. With less than one exploration well drilled for every 5,500sq km, the basin is sparsely explored relative to other onshore sedimentary basins in the world.
Despite its limited exploration history, the basin is home to a known petroleum system. The reservoirs in the southern Georgina Basin have strong similarities to other producing basins in Australia. The Amadeus Basin to the southwest has fields that have been producing gas for years: the Mereenie gas field, with 2P reserves of 325bcf; and Palm Valley, with 2P reserves of 230bcf. Situated further to the east, PetroFrontier’s lands lie within the oil mature window.
Fig 3 PetroFrontier – Asset map
Source: Company reports, Macquarie Research, March 2011
Macquarie Research PetroFrontier
16 March 2011 7
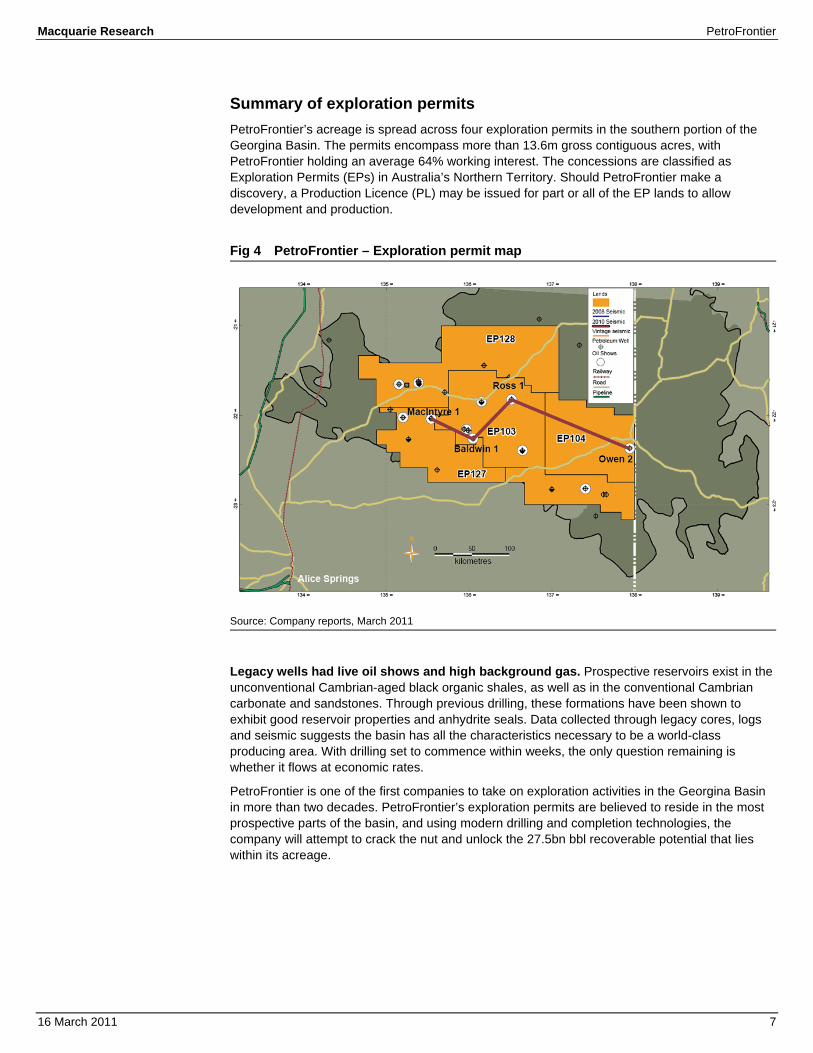
Summary of exploration permits PetroFrontier’s acreage is spread across four exploration permits in the southern portion of the Georgina Basin. The permits encompass more than 13.6m gross contiguous acres, with PetroFrontier holding an average 64% working interest. The concessions are classified as Exploration Permits (EPs) in Australia’s Northern Territory. Should PetroFrontier make a discovery, a Production Licence (PL) may be issued for part or all of the EP lands to allow development and production.
Fig 4 PetroFrontier – Exploration permit map
Source: Company reports, March 2011
Legacy wells had live oil shows and high background gas. Prospective reservoirs exist in the unconventional Cambrian-aged black organic shales, as well as in the conventional Cambrian carbonate and sandstones. Through previous drilling, these formations have been shown to exhibit good reservoir properties and anhydrite seals. Data collected through legacy cores, logs and seismic suggests the basin has all the characteristics necessary to be a world-class producing area. With drilling set to commence within weeks, the only question remaining is whether it flows at economic rates.
PetroFrontier is one of the first companies to take on exploration activities in the Georgina Basin in more than two decades. PetroFrontier’s exploration permits are believed to reside in the most prospective parts of the basin, and using modern drilling and completion technologies, the company will attempt to crack the nut and unlock the 27.5bn bbl recoverable potential that lies within its acreage.
Macquarie Research PetroFrontier
16 March 2011 8
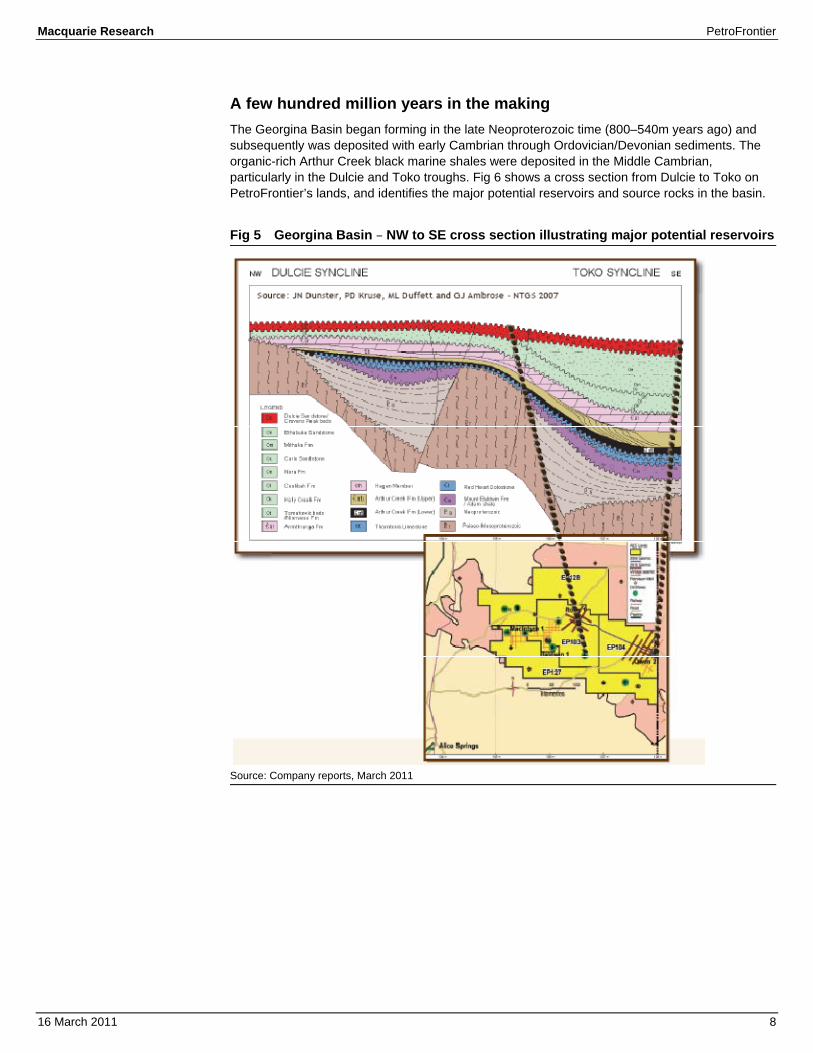
A few hundred million years in the making The Georgina Basin began forming in the late Neoproterozoic time (800–540m years ago) and subsequently was deposited with early Cambrian through Ordovician/Devonian sediments. The organic-rich Arthur Creek black marine shales were deposited in the Middle Cambrian, particularly in the Dulcie and Toko troughs. Fig 6 shows a cross section from Dulcie to Toko on PetroFrontier’s lands, and identifies the major potential reservoirs and source rocks in the basin.
Fig 5 Georgina Basin – NW to SE cross section illustrating major potential reservoirs
Source: Company reports, March 2011
Macquarie Research PetroFrontier
16 March 2011 9
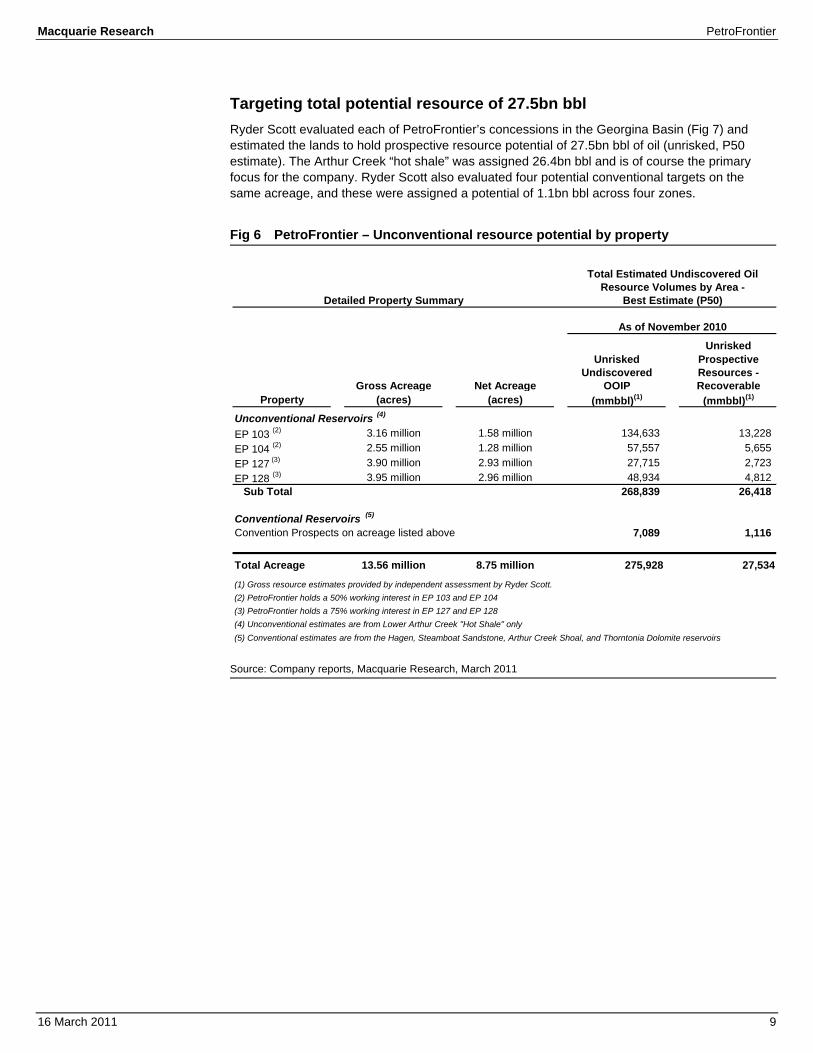
Targeting total potential resource of 27.5bn bbl Ryder Scott evaluated each of PetroFrontier’s concessions in the Georgina Basin (Fig 7) and estimated the lands to hold prospective resource potential of 27.5bn bbl of oil (unrisked, P50 estimate). The Arthur Creek “hot shale” was assigned 26.4bn bbl and is of course the primary focus for the company. Ryder Scott also evaluated four potential conventional targets on the same acreage, and these were assigned a potential of 1.1bn bbl across four zones.
Fig 6 PetroFrontier – Unconventional resource potential by property
Source: Company reports, Macquarie Research, March 2011
UnriskedUnrisked Prospective
Undiscovered Resources -Gross Acreage Net Acreage OOIP Recoverable
Property (acres) (acres) (mmbbl)(1) (mmbbl)(1)
Unconventional Reservoirs (4)
EP 103 (2) 3.16 million 1.58 million 134,633 13,228 EP 104 (2) 2.55 million 1.28 million 57,557 5,655 EP 127 (3) 3.90 million 2.93 million 27,715 2,723 EP 128 (3) 3.95 million 2.96 million 48,934 4,812
Sub Total 268,839 26,418
Conventional Reservoirs (5)
Convention Prospects on acreage listed above 7,089 1,116
Total Acreage 13.56 million 8.75 million 275,928 27,534
(1) Gross resource estimates provided by independent assessment by Ryder Scott.(2) PetroFrontier holds a 50% working interest in EP 103 and EP 104(3) PetroFrontier holds a 75% working interest in EP 127 and EP 128(4) Unconventional estimates are from Lower Arthur Creek "Hot Shale" only(5) Conventional estimates are from the Hagen, Steamboat Sandstone, Arthur Creek Shoal, and Thorntonia Dolomite reservoirs
Detailed Property Summary
As of November 2010
Total Estimated Undiscovered OilResource Volumes by Area -
Best Estimate (P50)
Macquarie Research PetroFrontier
16 March 2011 10
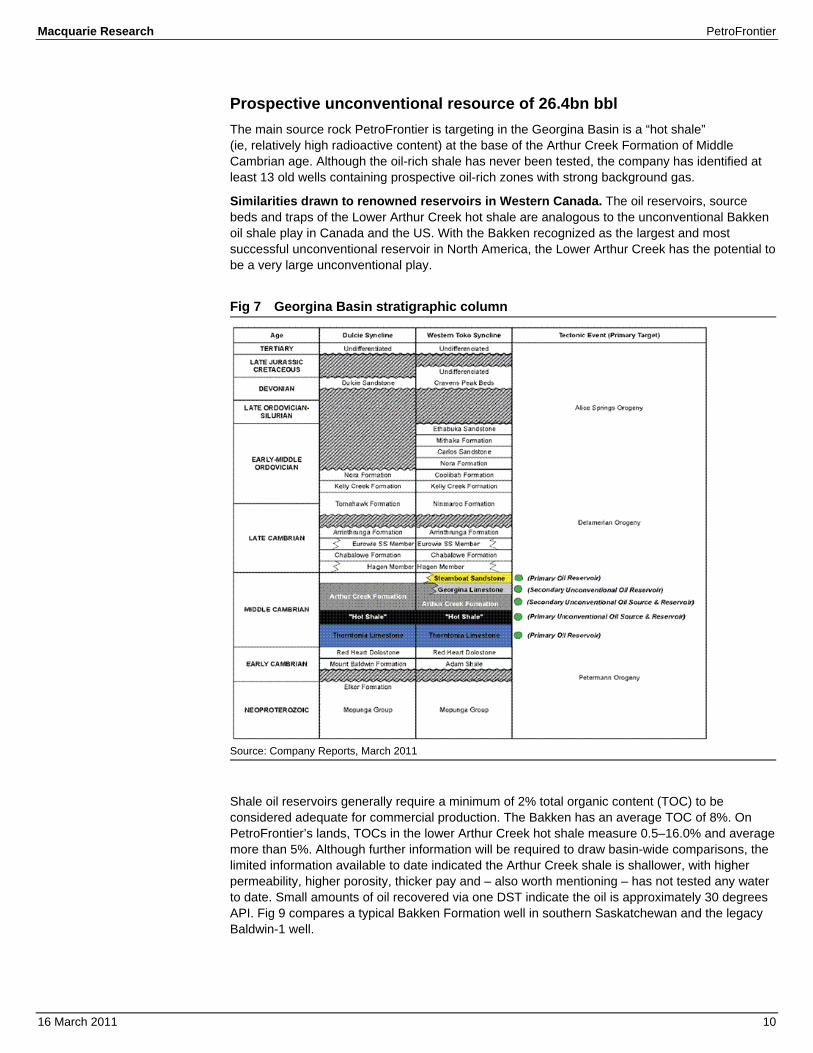
Prospective unconventional resource of 26.4bn bbl The main source rock PetroFrontier is targeting in the Georgina Basin is a “hot shale” (ie, relatively high radioactive content) at the base of the Arthur Creek Formation of Middle Cambrian age. Although the oil-rich shale has never been tested, the company has identified at least 13 old wells containing prospective oil-rich zones with strong background gas.
Similarities drawn to renowned reservoirs in Western Canada. The oil reservoirs, source beds and traps of the Lower Arthur Creek hot shale are analogous to the unconventional Bakken oil shale play in Canada and the US. With the Bakken recognized as the largest and most successful unconventional reservoir in North America, the Lower Arthur Creek has the potential to be a very large unconventional play.
Fig 7 Georgina Basin stratigraphic column
Source: Company Reports, March 2011
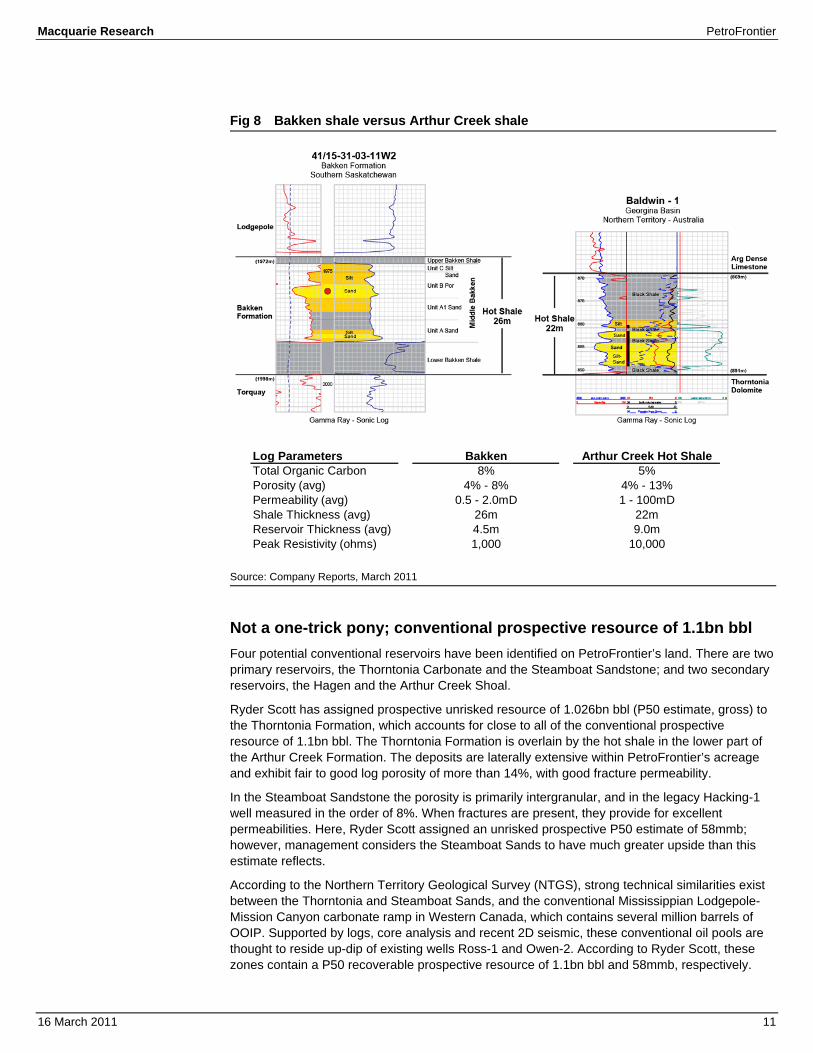
Shale oil reservoirs generally require a minimum of 2% total organic content (TOC) to be considered adequate for commercial production. The Bakken has an average TOC of 8%. On PetroFrontier’s lands, TOCs in the lower Arthur Creek hot shale measure 0.5–16.0% and average more than 5%. Although further information will be required to draw basin-wide comparisons, the limited information available to date indicated the Arthur Creek shale is shallower, with higher permeability, higher porosity, thicker pay and – also worth mentioning – has not tested any water to date. Small amounts of oil recovered via one DST indicate the oil is approximately 30 degrees API. Fig 9 compares a typical Bakken Formation well in southern Saskatchewan and the legacy Baldwin-1 well.
Macquarie Research PetroFrontier
16 March 2011 11
Fig 8 Bakken shale versus Arthur Creek shale
Source: Company Reports, March 2011
Not a one-trick pony; conventional prospective resource of 1.1bn bbl Four potential conventional reservoirs have been identified on PetroFrontier’s land. There are two primary reservoirs, the Thorntonia Carbonate and the Steamboat Sandstone; and two secondary reservoirs, the Hagen and the Arthur Creek Shoal.
Ryder Scott has assigned prospective unrisked resource of 1.026bn bbl (P50 estimate, gross) to the Thorntonia Formation, which accounts for close to all of the conventional prospective resource of 1.1bn bbl. The Thorntonia Formation is overlain by the hot shale in the lower part of the Arthur Creek Formation. The deposits are laterally extensive within PetroFrontier’s acreage and exhibit fair to good log porosity of more than 14%, with good fracture permeability.
In the Steamboat Sandstone the porosity is primarily intergranular, and in the legacy Hacking-1 well measured in the order of 8%. When fractures are present, they provide for excellent permeabilities. Here, Ryder Scott assigned an unrisked prospective P50 estimate of 58mmb; however, management considers the Steamboat Sands to have much greater upside than this estimate reflects.
According to the Northern Territory Geological Survey (NTGS), strong technical similarities exist between the Thorntonia and Steamboat Sands, and the conventional Mississippian Lodgepole-Mission Canyon carbonate ramp in Western Canada, which contains several million barrels of OOIP. Supported by logs, core analysis and recent 2D seismic, these conventional oil pools are thought to reside up-dip of existing wells Ross-1 and Owen-2. According to Ryder Scott, these zones contain a P50 recoverable prospective resource of 1.1bn bbl and 58mmb, respectively.
Log Parameters Bakken Arthur Creek Hot ShaleTotal Organic Carbon 8% 5%Porosity (avg) 4% - 8% 4% - 13%Permeability (avg) 0.5 - 2.0mD 1 - 100mDShale Thickness (avg) 26m 22mReservoir Thickness (avg) 4.5m 9.0mPeak Resistivity (ohms) 1,000 10,000
Macquarie Research PetroFrontier
16 March 2011 12
The Hagen member is best developed in the western part of the Georgina Basin, where reservoir thickness reaches up to 70 meters. From the Randall-1 well, core analysis revealed porosities of 8–14% and permeability up to 300mD. Ryder Scott assigned a P50 estimate of 31mmb unrisked prospective resource to this formation.
Although PetroFrontier’s conventional resource exposure pales in comparison to that of the Arthur Creek hot shale, it is still of sufficient size to be material for the company. The conventional targets will require future 3D seismic to help firm up drilling locations but are generally believed to be a lower-risk proposition than the unconventional hot shale.
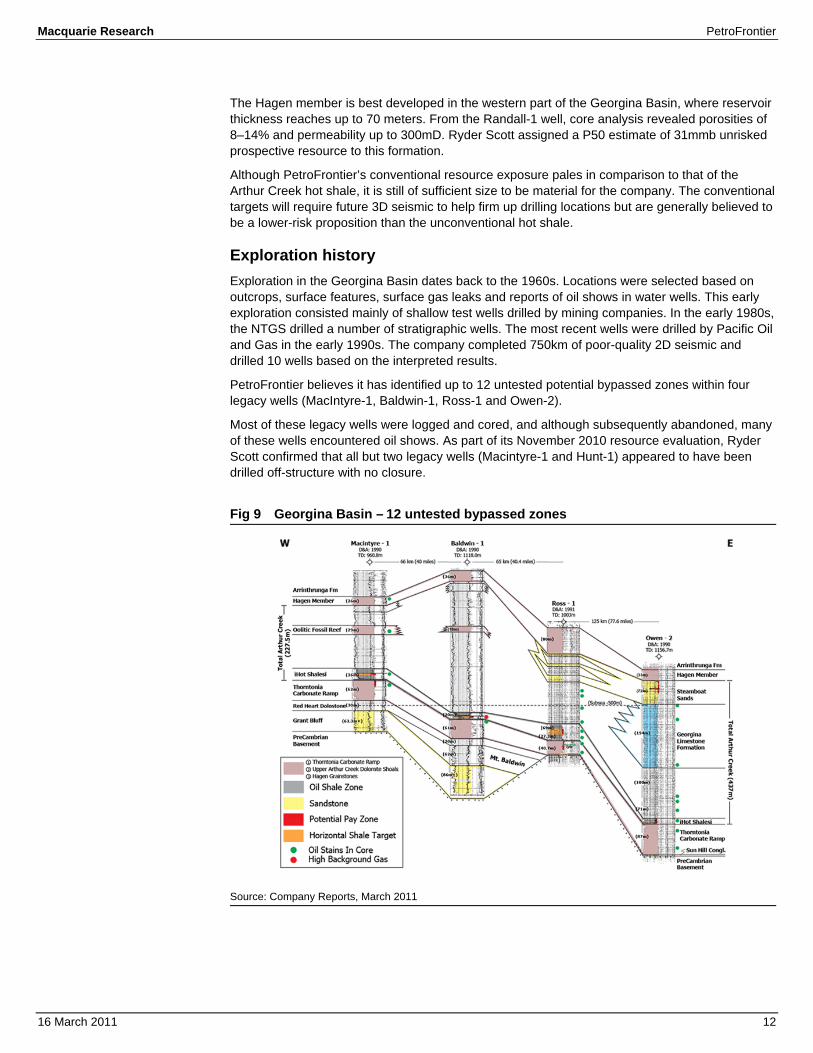
Exploration history Exploration in the Georgina Basin dates back to the 1960s. Locations were selected based on outcrops, surface features, surface gas leaks and reports of oil shows in water wells. This early exploration consisted mainly of shallow test wells drilled by mining companies. In the early 1980s, the NTGS drilled a number of stratigraphic wells. The most recent wells were drilled by Pacific Oil and Gas in the early 1990s. The company completed 750km of poor-quality 2D seismic and drilled 10 wells based on the interpreted results.
PetroFrontier believes it has identified up to 12 untested potential bypassed zones within four legacy wells (MacIntyre-1, Baldwin-1, Ross-1 and Owen-2).
Most of these legacy wells were logged and cored, and although subsequently abandoned, many of these wells encountered oil shows. As part of its November 2010 resource evaluation, Ryder Scott confirmed that all but two legacy wells (Macintyre-1 and Hunt-1) appeared to have been drilled off-structure with no closure.
Fig 9 Georgina Basin – 12 untested bypassed zones
Source: Company Reports, March 2011
Macquarie Research PetroFrontier
16 March 2011 13
The fine print A little information on PetroFrontier’s partners. As mentioned previously, Texalta Petroleum is a 50/50 partner with PetroFrontier in EPs 103 and 104. PetroFrontier has been advised that Texalta has elected not to participate in the initial exploration wells and the contingent follow up program of 20 wells. Therefore, PetroFrontier will carry out the program as an exclusive operation and shoulder 100% of the cost burden. In the event of a discovery, Texalta may reinstate its rights by paying cost plus 400% on its 50% share of drilling and completion costs. The fact that it has gone penalty on the initial exploration will not prohibit Texalta from participating in future exploration or development activity. Baraka Petroleum Ltd. (BKP AU, not rated) is PetroFrontier’s minority partner (25% WI) in EP 127 and EP 128.
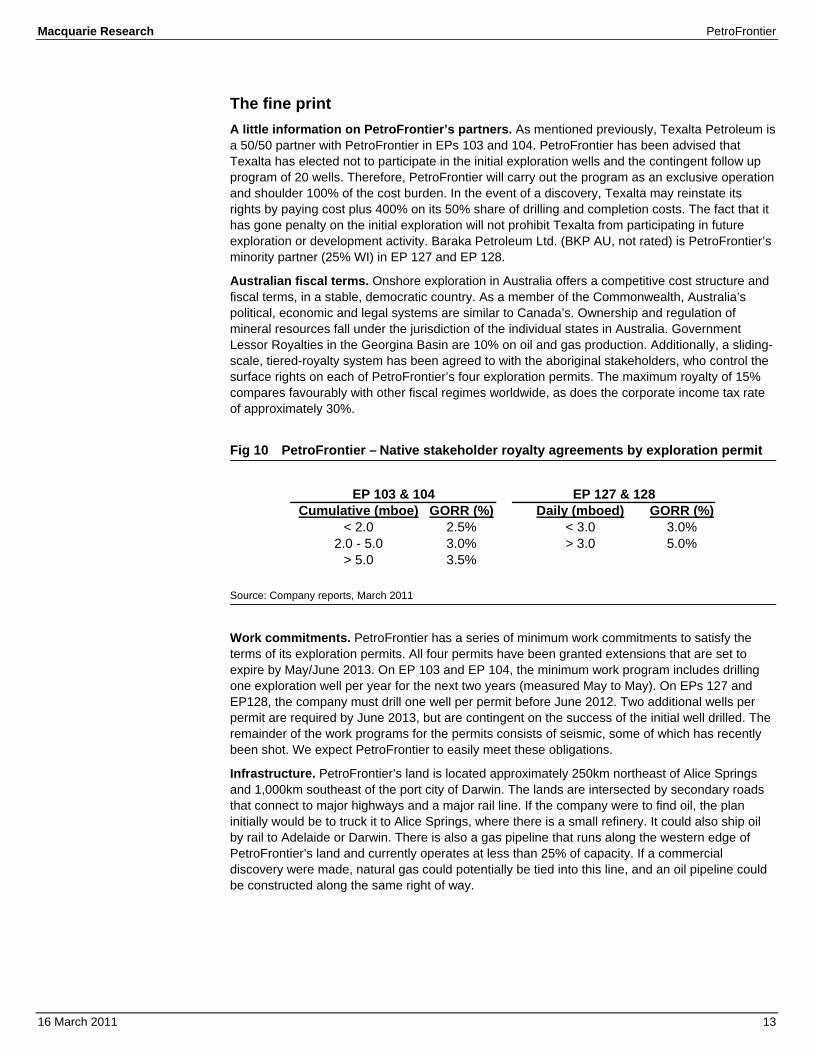
Australian fiscal terms. Onshore exploration in Australia offers a competitive cost structure and fiscal terms, in a stable, democratic country. As a member of the Commonwealth, Australia’s political, economic and legal systems are similar to Canada’s. Ownership and regulation of mineral resources fall under the jurisdiction of the individual states in Australia. Government Lessor Royalties in the Georgina Basin are 10% on oil and gas production. Additionally, a sliding-scale, tiered-royalty system has been agreed to with the aboriginal stakeholders, who control the surface rights on each of PetroFrontier’s four exploration permits. The maximum royalty of 15% compares favourably with other fiscal regimes worldwide, as does the corporate income tax rate of approximately 30%.
Fig 10 PetroFrontier – Native stakeholder royalty agreements by exploration permit
Source: Company reports, March 2011
Work commitments. PetroFrontier has a series of minimum work commitments to satisfy the terms of its exploration permits. All four permits have been granted extensions that are set to expire by May/June 2013. On EP 103 and EP 104, the minimum work program includes drilling one exploration well per year for the next two years (measured May to May). On EPs 127 and EP128, the company must drill one well per permit before June 2012. Two additional wells per permit are required by June 2013, but are contingent on the success of the initial well drilled. The remainder of the work programs for the permits consists of seismic, some of which has recently been shot. We expect PetroFrontier to easily meet these obligations.
Infrastructure. PetroFrontier’s land is located approximately 250km northeast of Alice Springs and 1,000km southeast of the port city of Darwin. The lands are intersected by secondary roads that connect to major highways and a major rail line. If the company were to find oil, the plan initially would be to truck it to Alice Springs, where there is a small refinery. It could also ship oil by rail to Adelaide or Darwin. There is also a gas pipeline that runs along the western edge of PetroFrontier’s land and currently operates at less than 25% of capacity. If a commercial discovery were made, natural gas could potentially be tied into this line, and an oil pipeline could be constructed along the same right of way.
Cumulative (mboe) GORR (%) Daily (mboed) GORR (%)< 2.0 2.5% < 3.0 3.0%
2.0 - 5.0 3.0% > 3.0 5.0%> 5.0 3.5%
EP 127 & 128EP 103 & 104
Macquarie Research PetroFrontier
16 March 2011 14
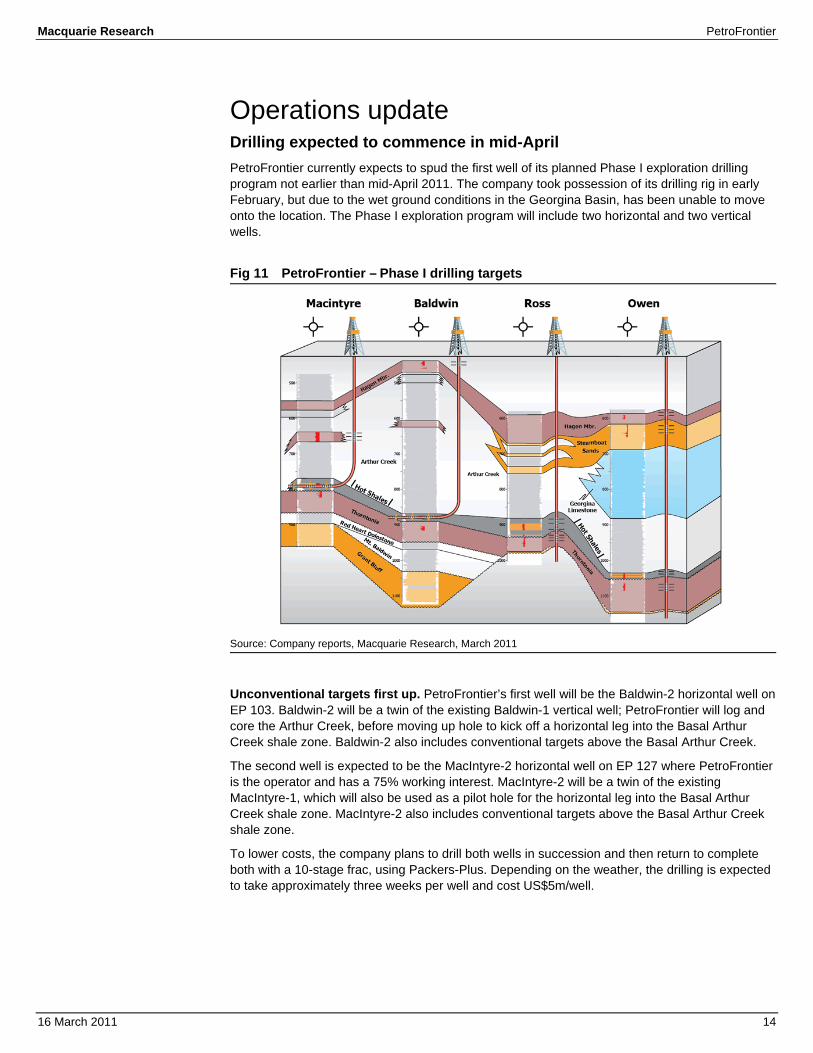
Operations update Drilling expected to commence in mid-April PetroFrontier currently expects to spud the first well of its planned Phase I exploration drilling program not earlier than mid-April 2011. The company took possession of its drilling rig in early February, but due to the wet ground conditions in the Georgina Basin, has been unable to move onto the location. The Phase I exploration program will include two horizontal and two vertical wells.
Fig 11 PetroFrontier – Phase I drilling targets
Source: Company reports, Macquarie Research, March 2011
Unconventional targets first up. PetroFrontier’s first well will be the Baldwin-2 horizontal well on EP 103. Baldwin-2 will be a twin of the existing Baldwin-1 vertical well; PetroFrontier will log and core the Arthur Creek, before moving up hole to kick off a horizontal leg into the Basal Arthur Creek shale zone. Baldwin-2 also includes conventional targets above the Basal Arthur Creek.
The second well is expected to be the MacIntyre-2 horizontal well on EP 127 where PetroFrontier is the operator and has a 75% working interest. MacIntyre-2 will be a twin of the existing MacIntyre-1, which will also be used as a pilot hole for the horizontal leg into the Basal Arthur Creek shale zone. MacIntyre-2 also includes conventional targets above the Basal Arthur Creek shale zone.
To lower costs, the company plans to drill both wells in succession and then return to complete both with a 10-stage frac, using Packers-Plus. Depending on the weather, the drilling is expected to take approximately three weeks per well and cost US$5m/well.
Macquarie Research PetroFrontier
16 March 2011 15
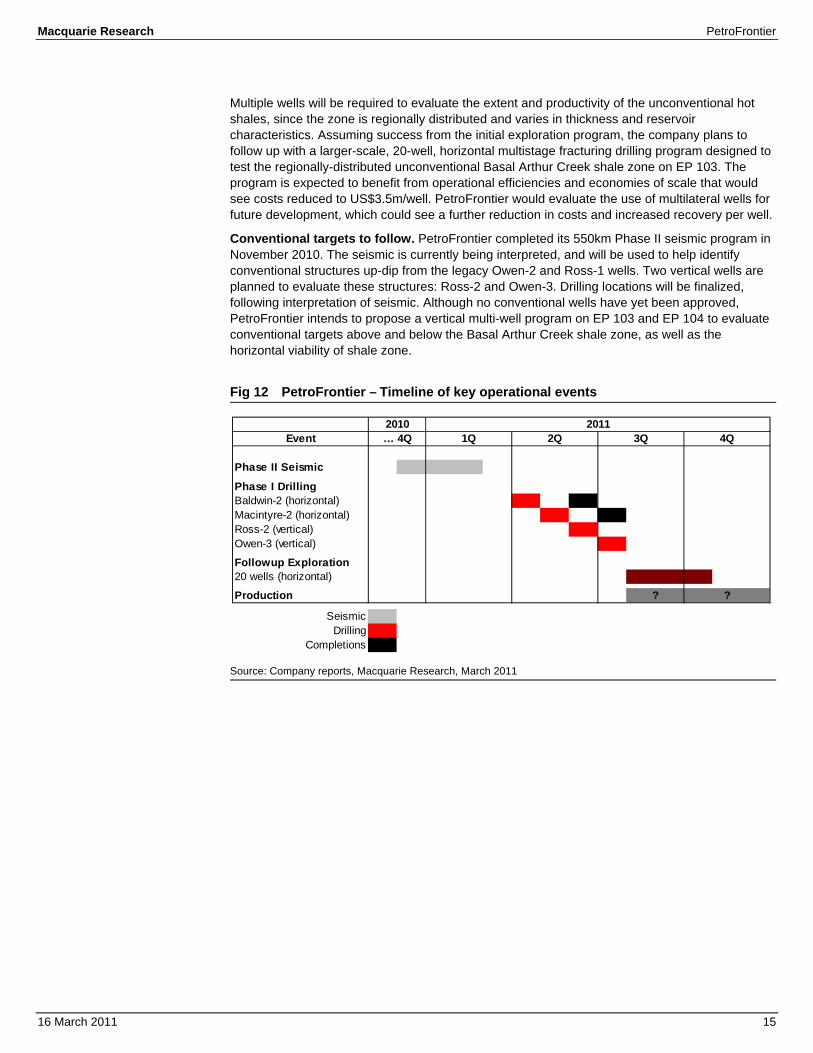
Multiple wells will be required to evaluate the extent and productivity of the unconventional hot shales, since the zone is regionally distributed and varies in thickness and reservoir characteristics. Assuming success from the initial exploration program, the company plans to follow up with a larger-scale, 20-well, horizontal multistage fracturing drilling program designed to test the regionally-distributed unconventional Basal Arthur Creek shale zone on EP 103. The program is expected to benefit from operational efficiencies and economies of scale that would see costs reduced to US$3.5m/well. PetroFrontier would evaluate the use of multilateral wells for future development, which could see a further reduction in costs and increased recovery per well.
Conventional targets to follow. PetroFrontier completed its 550km Phase II seismic program in November 2010. The seismic is currently being interpreted, and will be used to help identify conventional structures up-dip from the legacy Owen-2 and Ross-1 wells. Two vertical wells are planned to evaluate these structures: Ross-2 and Owen-3. Drilling locations will be finalized, following interpretation of seismic. Although no conventional wells have yet been approved, PetroFrontier intends to propose a vertical multi-well program on EP 103 and EP 104 to evaluate conventional targets above and below the Basal Arthur Creek shale zone, as well as the horizontal viability of shale zone.
Fig 12 PetroFrontier – Timeline of key operational events
Source: Company reports, Macquarie Research, March 2011
Event
Phase II Seismic
Phase I DrillingBaldwin-2 (horizontal)Macintyre-2 (horizontal)Ross-2 (vertical)Owen-3 (vertical)
Followup Exploration20 wells (horizontal)
Production ?
SeismicDrilling
Completions
?
2010… 4Q
20111Q 2Q 3Q 4Q
Macquarie Research PetroFrontier
16 March 2011 16
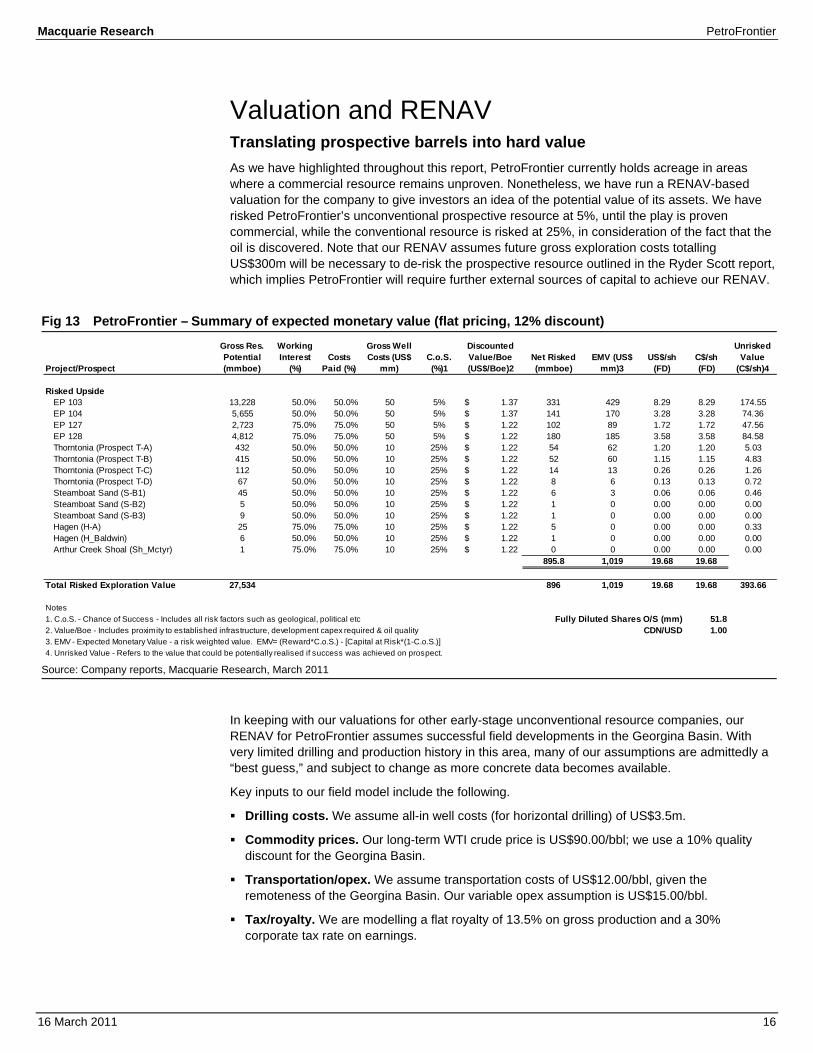
Valuation and RENAV Translating prospective barrels into hard value As we have highlighted throughout this report, PetroFrontier currently holds acreage in areas where a commercial resource remains unproven. Nonetheless, we have run a RENAV-based valuation for the company to give investors an idea of the potential value of its assets. We have risked PetroFrontier’s unconventional prospective resource at 5%, until the play is proven commercial, while the conventional resource is risked at 25%, in consideration of the fact that the oil is discovered. Note that our RENAV assumes future gross exploration costs totalling US$300m will be necessary to de-risk the prospective resource outlined in the Ryder Scott report, which implies PetroFrontier will require further external sources of capital to achieve our RENAV.
Fig 13 PetroFrontier – Summary of expected monetary value (flat pricing, 12% discount)
Source: Company reports, Macquarie Research, March 2011
In keeping with our valuations for other early-stage unconventional resource companies, our RENAV for PetroFrontier assumes successful field developments in the Georgina Basin. With very limited drilling and production history in this area, many of our assumptions are admittedly a “best guess,” and subject to change as more concrete data becomes available.
Key inputs to our field model include the following.
Drilling costs. We assume all-in well costs (for horizontal drilling) of US$3.5m.
Commodity prices. Our long-term WTI crude price is US$90.00/bbl; we use a 10% quality discount for the Georgina Basin.
Transportation/opex. We assume transportation costs of US$12.00/bbl, given the remoteness of the Georgina Basin. Our variable opex assumption is US$15.00/bbl.
Tax/royalty. We are modelling a flat royalty of 13.5% on gross production and a 30% corporate tax rate on earnings.
Project/Prospect
Gross Res. Potential (mmboe)
Working Interest
(%)Costs
Paid (%)
Gross Well Costs (US$
mm)C.o.S. (%)1
Discounted Value/Boe (US$/Boe)2
Net Risked (mmboe)
EMV (US$ mm)3
US$/sh (FD)
C$/sh (FD)
Unrisked Value
(C$/sh)4
Risked UpsideEP 103 13,228 50.0% 50.0% 50 5% 1.37$ 331 429 8.29 8.29 174.55EP 104 5,655 50.0% 50.0% 50 5% 1.37$ 141 170 3.28 3.28 74.36EP 127 2,723 75.0% 75.0% 50 5% 1.22$ 102 89 1.72 1.72 47.56EP 128 4,812 75.0% 75.0% 50 5% 1.22$ 180 185 3.58 3.58 84.58Thorntonia (Prospect T-A) 432 50.0% 50.0% 10 25% 1.22$ 54 62 1.20 1.20 5.03Thorntonia (Prospect T-B) 415 50.0% 50.0% 10 25% 1.22$ 52 60 1.15 1.15 4.83Thorntonia (Prospect T-C) 112 50.0% 50.0% 10 25% 1.22$ 14 13 0.26 0.26 1.26Thorntonia (Prospect T-D) 67 50.0% 50.0% 10 25% 1.22$ 8 6 0.13 0.13 0.72Steamboat Sand (S-B1) 45 50.0% 50.0% 10 25% 1.22$ 6 3 0.06 0.06 0.46Steamboat Sand (S-B2) 5 50.0% 50.0% 10 25% 1.22$ 1 0 0.00 0.00 0.00Steamboat Sand (S-B3) 9 50.0% 50.0% 10 25% 1.22$ 1 0 0.00 0.00 0.00Hagen (H-A) 25 75.0% 75.0% 10 25% 1.22$ 5 0 0.00 0.00 0.33Hagen (H_Baldwin) 6 50.0% 50.0% 10 25% 1.22$ 1 0 0.00 0.00 0.00Arthur Creek Shoal (Sh_Mctyr) 1 75.0% 75.0% 10 25% 1.22$ 0 0 0.00 0.00 0.00
895.8 1,019 19.68 19.68
Total Risked Exploration Value 27,534 896 1,019 19.68 19.68 393.66
Notes1. C.o.S. - Chance of Success - Includes all risk factors such as geological, political etc Fully Diluted Shares O/S (mm) 51.82. Value/Boe - Includes proximity to established infrastructure, development capex required & oil quality CDN/USD 1.003. EMV - Expected Monetary Value - a risk weighted value. EMV= (Reward*C.o.S.) - [Capital at Risk*(1-C.o.S.)]4. Unrisked Value - Refers to the value that could be potentially realised if success was achieved on prospect.
Macquarie Research PetroFrontier
16 March 2011 17
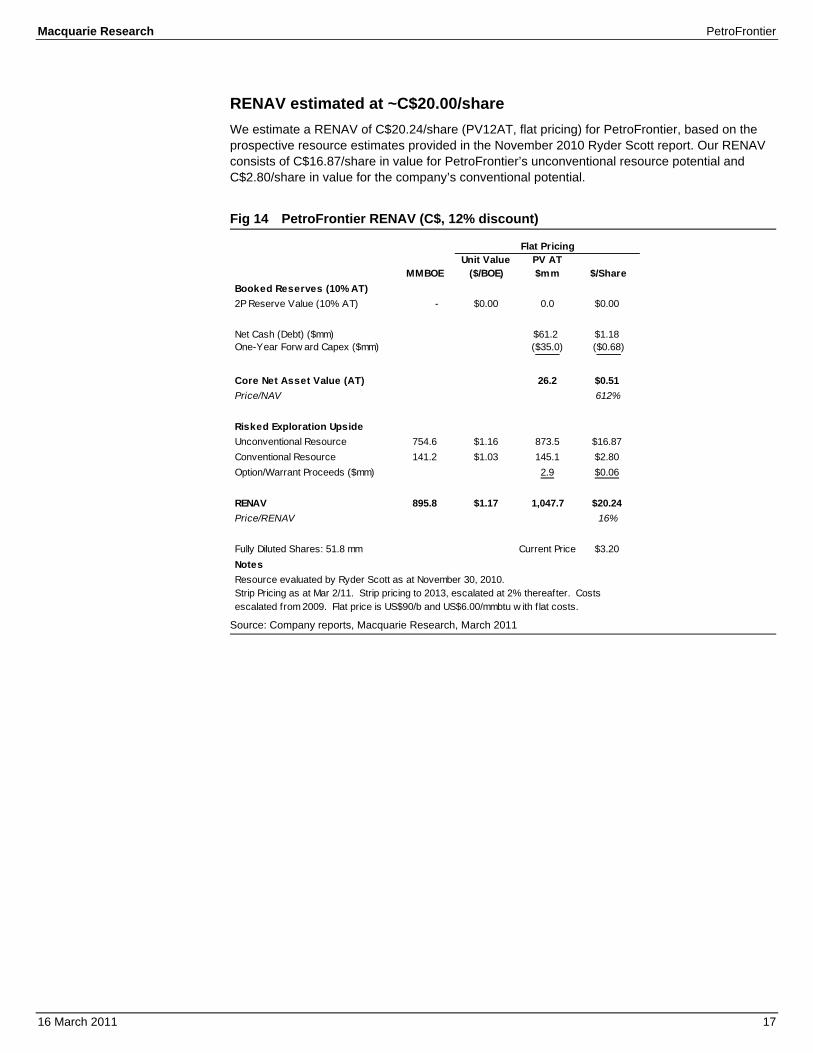
RENAV estimated at ~C$20.00/share We estimate a RENAV of C$20.24/share (PV12AT, flat pricing) for PetroFrontier, based on the prospective resource estimates provided in the November 2010 Ryder Scott report. Our RENAV consists of C$16.87/share in value for PetroFrontier’s unconventional resource potential and C$2.80/share in value for the company’s conventional potential.
Fig 14 PetroFrontier RENAV (C$, 12% discount)
Source: Company reports, Macquarie Research, March 2011
MMBOEUnit Value
($/BOE)PV AT $mm $/Share
Booked Reserves (10% AT)2P Reserve Value (10% AT) - $0.00 0.0 $0.00
Net Cash (Debt) ($mm) $61.2 $1.18One-Year Forw ard Capex ($mm) ($35.0) ($0.68)
Core Net Asset Value (AT) 26.2 $0.51Price/NAV 612%
Risked Exploration UpsideUnconventional Resource 754.6 $1.16 873.5 $16.87Conventional Resource 141.2 $1.03 145.1 $2.80Option/Warrant Proceeds ($mm) 2.9 $0.06
RENAV 895.8 $1.17 1,047.7 $20.24Price/RENAV 16%
Fully Diluted Shares: 51.8 mm Current Price $3.20NotesResource evaluated by Ryder Scott as at November 30, 2010.
Flat Pricing
Strip Pricing as at Mar 2/11. Strip pricing to 2013, escalated at 2% thereafter. Costs escalated from 2009. Flat price is US$90/b and US$6.00/mmbtu w ith f lat costs.
Macquarie Research PetroFrontier
16 March 2011 18
Recommendation and Conclusion Initiating coverage with C$10.00 target price and an Outperform rating. Our C$10.00 target price is based on a heavily-risked valuation of the company’s first four drilling leads. We believe PetroFrontier currently warrants a target price at a discount to our RENAV, given the considerable exploration capital we believe will be required to properly de-risk the Arthur Creek oil shale play. Given the large independent resource estimates associated with PetroFrontier’s initial drilling leads, we fully expect any commercial discovery to be valued at multiples of the current share price. Similarly, disappointing drilling results can be expected to have a significant, negative impact on PetroFrontier’s share price. We rate PetroFrontier as Outperform.
Macquarie Research PetroFrontier
16 March 2011 19
Key risks We would highlight the following risks associated with an investment in PetroFrontier.
Geological/dry hole risk. PetroFrontier is expected to engage in a number of high impact exploration wells in 2011. We believe the market is ascribing a very high degree of risk to these wells, and we would expect drilling results (positive or negative) to have a material impact on PetroFrontier’s share price.
Reserve estimates. Estimates of oil and gas reserves, contingent resources, prospective resources and prospect and lead size are inherently uncertain. While an independent resource report exists for a portion of PetroFrontier’s asset base, there are no independently audited reserve estimates or disclosures for some of the company’s other assets and exploration leads. Where possible, attempts have been made to cross check estimates, but again these are not always verified by independent sources.
Financial risk. Oil and gas exploration and development is a high capital cost venture that may be unsuitable for even the best-capitalized small cap producers. Although PetroFrontier is currently adequately capitalized to execute its planned 2011 program, there is no guarantee that the company will enjoy ongoing access to capital, which may lead to project delays.
Commodity prices. PetroFrontier does not currently have any production, and as such the company’s revenue stream is shielded from fluctuations in oil prices. However, a material drop in oil prices may impact the market’s view of PetroFrontier’s prospect inventory, thereby impacting the company’s share price.
Macquarie Research PetroFrontier
16 March 2011 20
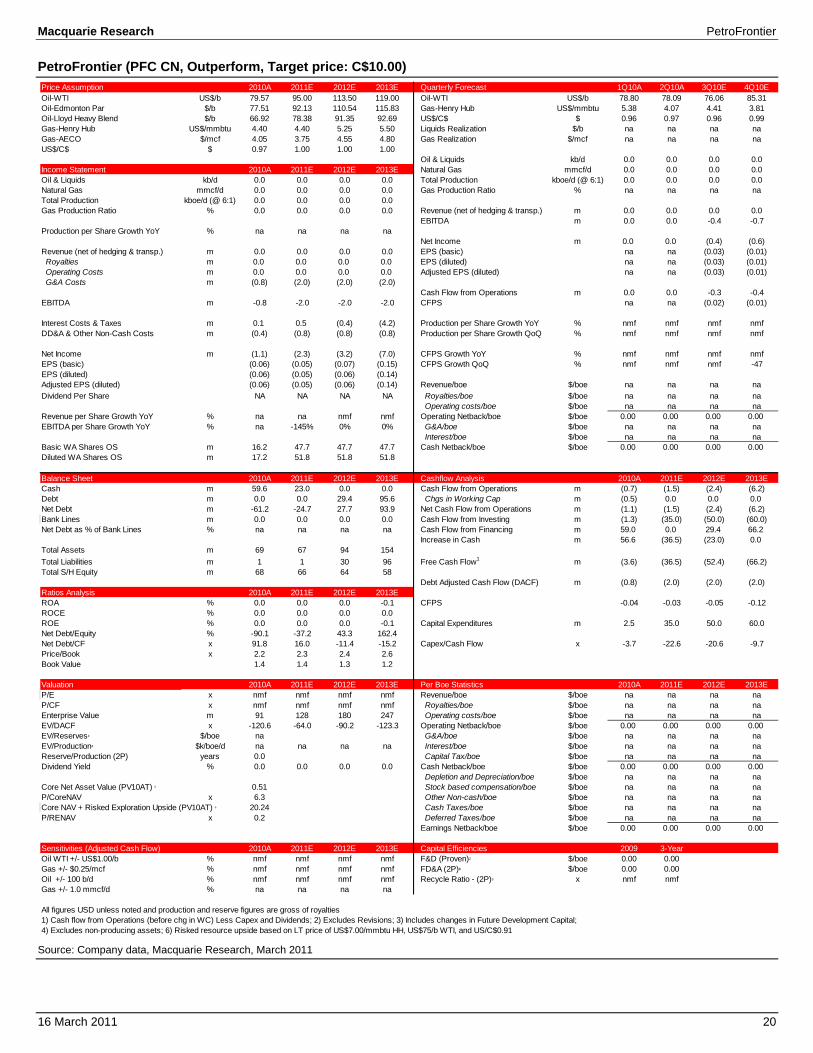
PetroFrontier (PFC CN, Outperform, Target price: C$10.00)
Source: Company data, Macquarie Research, March 2011
Price Assumption 2010A 2011E 2012E 2013E Quarterly Forecast 1Q10A 2Q10A 3Q10E 4Q10EOil-WTI US$/b 79.57 95.00 113.50 119.00 Oil-WTI US$/b 78.80 78.09 76.06 85.31Oil-Edmonton Par $/b 77.51 92.13 110.54 115.83 Gas-Henry Hub US$/mmbtu 5.38 4.07 4.41 3.81Oil-Lloyd Heavy Blend $/b 66.92 78.38 91.35 92.69 US$/C$ $ 0.96 0.97 0.96 0.99Gas-Henry Hub US$/mmbtu 4.40 4.40 5.25 5.50 Liquids Realization $/b na na na naGas-AECO $/mcf 4.05 3.75 4.55 4.80 Gas Realization $/mcf na na na naUS$/C$ $ 0.97 1.00 1.00 1.00
Oil & Liquids kb/d 0.0 0.0 0.0 0.0Income Statement 2010A 2011E 2012E 2013E Natural Gas mmcf/d 0.0 0.0 0.0 0.0Oil & Liquids kb/d 0.0 0.0 0.0 0.0 Total Production kboe/d (@ 6:1) 0.0 0.0 0.0 0.0Natural Gas mmcf/d 0.0 0.0 0.0 0.0 Gas Production Ratio % na na na naTotal Production kboe/d (@ 6:1) 0.0 0.0 0.0 0.0Gas Production Ratio % 0.0 0.0 0.0 0.0 Revenue (net of hedging & transp.) m 0.0 0.0 0.0 0.0
EBITDA m 0.0 0.0 -0.4 -0.7Production per Share Growth YoY % na na na na
Net Income m 0.0 0.0 (0.4) (0.6)Revenue (net of hedging & transp.) m 0.0 0.0 0.0 0.0 EPS (basic) na na (0.03) (0.01) Royalties m 0.0 0.0 0.0 0.0 EPS (diluted) na na (0.03) (0.01) Operating Costs m 0.0 0.0 0.0 0.0 Adjusted EPS (diluted) na na (0.03) (0.01) G&A Costs m (0.8) (2.0) (2.0) (2.0)
Cash Flow from Operations m 0.0 0.0 -0.3 -0.4EBITDA m -0.8 -2.0 -2.0 -2.0 CFPS na na (0.02) (0.01)
Interest Costs & Taxes m 0.1 0.5 (0.4) (4.2) Production per Share Growth YoY % nmf nmf nmf nmfDD&A & Other Non-Cash Costs m (0.4) (0.8) (0.8) (0.8) Production per Share Growth QoQ % nmf nmf nmf nmf
Net Income m (1.1) (2.3) (3.2) (7.0) CFPS Growth YoY % nmf nmf nmf nmfEPS (basic) (0.06) (0.05) (0.07) (0.15) CFPS Growth QoQ % nmf nmf nmf -47EPS (diluted) (0.06) (0.05) (0.06) (0.14)Adjusted EPS (diluted) (0.06) (0.05) (0.06) (0.14) Revenue/boe $/boe na na na naDividend Per Share NA NA NA NA Royalties/boe $/boe na na na na
Operating costs/boe $/boe na na na naRevenue per Share Growth YoY % na na nmf nmf Operating Netback/boe $/boe 0.00 0.00 0.00 0.00EBITDA per Share Growth YoY % na -145% 0% 0% G&A/boe $/boe na na na na
Interest/boe $/boe na na na naBasic WA Shares OS m 16.2 47.7 47.7 47.7 Cash Netback/boe $/boe 0.00 0.00 0.00 0.00Diluted WA Shares OS m 17.2 51.8 51.8 51.8
Balance Sheet 2010A 2011E 2012E 2013E Cashflow Analysis 2010A 2011E 2012E 2013ECash m 59.6 23.0 0.0 0.0 Cash Flow from Operations m (0.7) (1.5) (2.4) (6.2)Debt m 0.0 0.0 29.4 95.6 Chgs in Working Cap m (0.5) 0.0 0.0 0.0Net Debt m -61.2 -24.7 27.7 93.9 Net Cash Flow from Operations m (1.1) (1.5) (2.4) (6.2)Bank Lines m 0.0 0.0 0.0 0.0 Cash Flow from Investing m (1.3) (35.0) (50.0) (60.0)Net Debt as % of Bank Lines % na na na na Cash Flow from Financing m 59.0 0.0 29.4 66.2
Increase in Cash m 56.6 (36.5) (23.0) 0.0Total Assets m 69 67 94 154Total Liabilities m 1 1 30 96 Free Cash Flow1 m (3.6) (36.5) (52.4) (66.2)Total S/H Equity m 68 66 64 58
Debt Adjusted Cash Flow (DACF) m (0.8) (2.0) (2.0) (2.0)Ratios Analysis 2010A 2011E 2012E 2013EROA % 0.0 0.0 0.0 -0.1 CFPS -0.04 -0.03 -0.05 -0.12ROCE % 0.0 0.0 0.0 0.0ROE % 0.0 0.0 0.0 -0.1 Capital Expenditures m 2.5 35.0 50.0 60.0Net Debt/Equity % -90.1 -37.2 43.3 162.4Net Debt/CF x 91.8 16.0 -11.4 -15.2 Capex/Cash Flow x -3.7 -22.6 -20.6 -9.7Price/Book x 2.2 2.3 2.4 2.6Book Value 1.4 1.4 1.3 1.2
Valuation 2010A 2011E 2012E 2013E Per Boe Statistics 2010A 2011E 2012E 2013EP/E x nmf nmf nmf nmf Revenue/boe $/boe na na na naP/CF x nmf nmf nmf nmf Royalties/boe $/boe na na na naEnterprise Value m 91 128 180 247 Operating costs/boe $/boe na na na naEV/DACF x -120.6 -64.0 -90.2 -123.3 Operating Netback/boe $/boe 0.00 0.00 0.00 0.00EV/Reserves4 $/boe na G&A/boe $/boe na na na naEV/Production4 $k/boe/d na na na na Interest/boe $/boe na na na naReserve/Production (2P) years 0.0 Capital Tax/boe $/boe na na na naDividend Yield % 0.0 0.0 0.0 0.0 Cash Netback/boe $/boe 0.00 0.00 0.00 0.00
Depletion and Depreciation/boe $/boe na na na naCore Net Asset Value (PV10AT) 5 0.51 Stock based compensation/boe $/boe na na na naP/CoreNAV x 6.3 Other Non-cash/boe $/boe na na na naCore NAV + Risked Exploration Upside (PV10AT) 5 20.24 Cash Taxes/boe $/boe na na na naP/RENAV x 0.2 Deferred Taxes/boe $/boe na na na na
Earnings Netback/boe $/boe 0.00 0.00 0.00 0.00
Sensitivities (Adjusted Cash Flow) 2010A 2011E 2012E 2013E Capital Efficiencies 2009 3-YearOil WTI +/- US$1.00/b % nmf nmf nmf nmf F&D (Proven)2 $/boe 0.00 0.00Gas +/- $0.25/mcf % nmf nmf nmf nmf FD&A (2P)3 $/boe 0.00 0.00Oil +/- 100 b/d % nmf nmf nmf nmf Recycle Ratio - (2P)3 x nmf nmfGas +/- 1.0 mmcf/d % na na na na
All figures USD unless noted and production and reserve figures are gross of royalties1) Cash flow from Operations (before chg in WC) Less Capex and Dividends; 2) Excludes Revisions; 3) Includes changes in Future Development Capital;4) Excludes non-producing assets; 6) Risked resource upside based on LT price of US$7.00/mmbtu HH, US$75/b WTI, and US/C$0.91
Macquarie Research PetroFrontier
16 March 2011 21
Important disclosures: Recommendation definitions Macquarie - Australia/New Zealand Outperform – return >3% in excess of benchmark return Neutral – return within 3% of benchmark return Underperform – return >3% below benchmark return Benchmark return is determined by long term nominal GDP growth plus 12 month forward market dividend yield Macquarie – Asia/Europe Outperform – expected return >+10% Neutral – expected return from -10% to +10% Underperform – expected return <-10% Macquarie First South - South Africa Outperform – expected return >+10% Neutral – expected return from -10% to +10% Underperform – expected return <-10% Macquarie - Canada Outperform – return >5% in excess of benchmark return Neutral – return within 5% of benchmark return Underperform – return >5% below benchmark return Macquarie - USA Outperform (Buy) – return >5% in excess of Russell 3000 index return Neutral (Hold) – return within 5% of Russell 3000 index return Underperform (Sell)– return >5% below Russell 3000 index return
Volatility index definition* This is calculated from the volatility of historical price movements. Very high–highest risk – Stock should be expected to move up or down 60–100% in a year – investors should be aware this stock is highly speculative. High – stock should be expected to move up or down at least 40–60% in a year – investors should be aware this stock could be speculative. Medium – stock should be expected to move up or down at least 30–40% in a year. Low–medium – stock should be expected to move up or down at least 25–30% in a year. Low – stock should be expected to move up or down at least 15–25% in a year. * Applicable to Australian/NZ/Canada stocks only Recommendations – 12 months Note: Quant recommendations may differ from Fundamental Analyst recommendations
Financial definitions All "Adjusted" data items have had the following adjustments made: Added back: goodwill amortisation, provision for catastrophe reserves, IFRS derivatives & hedging, IFRS impairments & IFRS interest expense Excluded: non recurring items, asset revals, property revals, appraisal value uplift, preference dividends & minority interests EPS = adjusted net profit / efpowa* ROA = adjusted ebit / average total assets ROA Banks/Insurance = adjusted net profit /average total assets ROE = adjusted net profit / average shareholders funds Gross cashflow = adjusted net profit + depreciation *equivalent fully paid ordinary weighted average number of shares All Reported numbers for Australian/NZ listed stocks are modelled under IFRS (International Financial Reporting Standards).
Recommendation proportions – For quarter ending 31 December 2010 AU/NZ Asia RSA USA CA EUR Outperform 46.38% 62.62% 52.17% 44.99% 67.57% 50.90% (for US coverage by MCUSA, 13.59% of stocks covered are investment banking clients) Neutral 37.68% 18.58% 34.78% 50.61% 28.83% 35.48% (for US coverage by MCUSA, 15.22% of stocks covered are investment banking clients) Underperform 15.94% 18.80% 13.04% 4.40% 3.60% 13.62% (for US coverage by MCUSA, 0.00% of stocks covered are investment banking clients)
Company Specific Disclosures: Macquarie Capital Markets Canada Ltd has received compensation for acting as a financial agent (underwriter) to PetroFrontier Corp. (formerly Australia Energy Corp) within the past two years. Macquarie Capital Markets Canada Ltd has received compensation for acting as a financial agent (underwriter) and financial advisor for Rodinia Oil Corp within the past two years. Macquarie Capital Markets North America Ltd., which is a registered broker-dealer and member of FINRA, accepts responsibility for the contents of reports issued by Macquarie Capital Markets Canada Ltd in the United States and sent to US persons. Any US person wishing to effect transactions in the securities described in the reports issued by Macquarie Capital Markets Canada Ltd should do so with Macquarie Capital Markets North America Ltd. The Research Distribution Policy of Macquarie Capital Markets Canada Ltd is to allow all clients that are entitled to have equal access to our research. Important disclosure information regarding the subject companies covered in this report is available at www.macquarie.com/disclosures.
Analyst Certification: The views expressed in this research accurately reflect the personal views of the analyst(s) about the subject securities or issuers and no part of the compensation of the analyst(s) was, is, or will be directly or indirectly related to the inclusion of specific recommendations or views in this research. The analyst principally responsible for the preparation of this research receives compensation based on overall revenues of Macquarie Group Ltd ABN 94 122 169 279 (AFSL No. 318062) (MGL) and its related entities (the Macquarie Group) and has taken reasonable care to achieve and maintain independence and objectivity in making any recommendations. General Disclaimers: Macquarie Securities (Australia) Ltd; Macquarie Capital (Europe) Ltd; Macquarie Capital Markets Canada Ltd; Macquarie Capital Markets North America Ltd; Macquarie Capital (USA) Inc; Macquarie Capital Securities Ltd and its Taiwan branch; Macquarie Capital Securities (Singapore) Pte Ltd; Macquarie Securities (NZ) Ltd; Macquarie First South Securities (Pty) Limited; Macquarie Capital Securities (India) Pvt Ltd; Macquarie Capital Securities (Malaysia) Sdn Bhd; Macquarie Securities Korea Limited and Macquarie Securities (Thailand) Ltd are not authorized deposit-taking institutions for the purposes of the Banking Act 1959 (Commonwealth of Australia), and their obligations do not represent deposits or other liabilities of Macquarie Bank Limited ABN 46 008 583 542 (MBL) or MGL. MBL does not guarantee or otherwise provide assurance in respect of the obligations of any of the above mentioned entities. MGL provides a guarantee to the Monetary Authority of Singapore in respect of the obligations and liabilities of Macquarie Capital Securities (Singapore) Pte Ltd for up to SGD 35 million. This research has been prepared for the general use of the wholesale clients of the Macquarie Group and must not be copied, either in whole or in part, or distributed to any other person. If you are not the intended recipient you must not use or disclose the information in this research in any way. If you received it in error, please tell us immediately by return e-mail and delete the document. We do not guarantee the integrity of any e-mails or attached files and are not responsible for any changes made to them by any other person. MGL has established and implemented a conflicts policy at group level (which may be revised and updated from time to time) (the "Conflicts Policy") pursuant to regulatory requirements (including the FSA Rules) which sets out how we must seek to identify and manage all material conflicts of interest. Nothing in this research shall be construed as a solicitation to buy or sell any security or product, or to engage in or refrain from engaging in any transaction. In preparing this research, we did not take into account your investment objectives, financial situation or particular needs. Before making an investment decision on the basis of this research, you need to consider, with or without the assistance of an adviser, whether the advice is appropriate in light of your particular investment needs, objectives and financial circumstances. There are risks involved in securities trading. The price of securities can and does fluctuate, and an individual security may even become valueless. International investors are reminded of the additional risks inherent in international investments, such as currency fluctuations and international stock market or economic conditions, which may adversely affect the value of the investment. This research is based on information obtained from sources believed to be reliable but we do not make any representation or warranty that it is accurate, complete or up to date. We accept no obligation to correct or update the information or opinions in it. Opinions expressed are subject to change without notice. No member of the Macquarie Group accepts any liability whatsoever for any direct, indirect, consequential or other loss arising from any use of this research and/or further communication in relation to this research. Clients should contact analysts at, and execute transactions through, a Macquarie Group entity in their home jurisdiction unless governing law permits otherwise. Country-Specific Disclaimers: Australia: In Australia, research is issued and distributed by Macquarie Securities (Australia) Ltd (AFSL No. 238947), a participating organisation of the Australian Securities Exchange. New Zealand: In New Zealand, research is issued and distributed by Macquarie Securities (NZ) Ltd, a NZX Firm. Canada: In Canada, research is prepared, approved and distributed by Macquarie Capital Markets Canada Ltd, a participating organisation of the Toronto Stock Exchange, TSX Venture Exchange & Montréal Exchange. Macquarie Capital Markets North America Ltd., which is a registered broker-dealer and member of FINRA, accepts responsibility for the contents of reports issued by Macquarie Capital Markets Canada Ltd in the United States and sent to US persons. Any
Macquarie Research PetroFrontier
16 March 2011 22
person wishing to effect transactions in the securities described in the reports issued by Macquarie Capital Markets Canada Ltd should do so with Macquarie Capital Markets North America Ltd. The Research Distribution Policy of Macquarie Capital Markets Canada Ltd is to allow all clients that are entitled to have equal access to our research. United Kingdom: In the United Kingdom, research is issued and distributed by Macquarie Capital (Europe) Ltd, which is authorised and regulated by the Financial Services Authority (No. 193905). Germany: In Germany, research is issued and distributed by Macquarie Capital (Europe) Ltd, Niederlassung Deutschland, which is authorised and regulated in the United Kingdom by the Financial Services Authority (No. 193905). France: In France, research is issued and distributed by Macquarie Capital (Europe) Ltd, which is authorised and regulated in the United Kingdom by the Financial Services Authority (No. 193905). Hong Kong: In Hong Kong, research is issued and distributed by Macquarie Capital Securities Ltd, which is licensed and regulated by the Securities and Futures Commission. Japan: In Japan, research is issued and distributed by Macquarie Capital Securities (Japan) Limited, a member of the Tokyo Stock Exchange, Inc. and Osaka Securities Exchange Co. Ltd (Financial Instruments Firm, Kanto Financial Bureau (kin-sho) No. 231, a member of Japan Securities Dealers Association and Financial Futures Association of Japan). India: In India, research is issued and distributed by Macquarie Capital Securities (India) Pvt Ltd. Level 3, Mafatlal Centre, Nariman Point, Mumbai 400 021, INDIA, which is a SEBI registered Stock Broker having membership with National Stock Exchange of India Limited (INB231246738) and Bombay Stock Exchange Limited (INB011246734). Malaysia: In Malaysia, research is issued and distributed by Macquarie Capital Securities (Malaysia) Sdn. Bhd. (Company registration number: 463469-W) which is a Participating Organisation of Bursa Malaysia Berhad and a holder of Capital Markets Services License issued by the Securities Commission. Taiwan: Information on securities/instruments that are traded in Taiwan is distributed by Macquarie Capital Securities Ltd, Taiwan Branch, which is licensed and regulated by the Financial Supervisory Commission. No portion of the report may be reproduced or quoted by the press or any other person without authorisation from Macquarie. Nothing in this research shall be construed as a solicitation to buy or sell any security or product. Thailand: In Thailand, research is issued and distributed by Macquarie Securities (Thailand) Ltd, a licensed securities company that is authorized by the Ministry of Finance, regulated by the Securities and Exchange Commission of Thailand and is an exchange member no. 28 of the Stock Exchange of Thailand. The Thai Institute of Directors Association has disclosed the Corporate Governance Report of Thai Listed Companies made pursuant to the policy of the Securities and Exchange Commission of Thailand. Macquarie Securities (Thailand) Ltd does not endorse the result of the Corporate Governance Report of Thai Listed Companies but this Report can be accessed at: http://www.thai-iod.com/en/publications.asp?type=4. South Korea: In South Korea, unless otherwise stated, research is prepared, issued and distributed by Macquarie Securities Korea Limited, which is regulated by the Financial Supervisory Services. Information on analysts in MSKL is disclosed at http://dis.kofia.or.kr/fs/dis2/fundMgr/DISFundMgrAnalystPop.jsp?companyCd2=A03053&pageDiv=02. South Africa: In South Africa, research is issued and distributed by Macquarie First South Securities (Pty) Limited, a member of the JSE Limited. Singapore: In Singapore, research is issued and distributed by Macquarie Capital Securities (Singapore) Pte Ltd (Company Registration Number: 198702912C), a Capital Markets Services license holder under the Securities and Futures Act to deal in securities and provide custodial services in Singapore. Pursuant to the Financial Advisers (Amendment) Regulations 2005, Macquarie Capital Securities (Singapore) Pte Ltd is exempt from complying with sections 25, 27 and 36 of the Financial Advisers Act. All Singapore-based recipients of research produced by Macquarie Capital (Europe) Limited, Macquarie Capital Markets Canada Ltd, Macquarie First South Securities (Pty) Limited and Macquarie Capital (USA) Inc. represent and warrant that they are institutional investors as defined in the Securities and Futures Act. United States: In the United States, research is issued and distributed by Macquarie Capital (USA) Inc., which is a registered broker-dealer and member of FINRA. Macquarie Capital (USA) Inc, accepts responsibility for the content of each research report prepared by one of its non-US affiliates when the research report is distributed in the United States by Macquarie Capital (USA) Inc. Macquarie Capital (USA) Inc.’s affiliate’s analysts are not registered as research analysts with FINRA, may not be associated persons of Macquarie Capital (USA) Inc., and therefore may not be subject to FINRA rule restrictions on communications with a subject company, public appearances, and trading securities held by a research analyst account. Any persons receiving this report directly from Macquarie Capital (USA) Inc. and wishing to effect a transaction in any security described herein should do so with Macquarie Capital (USA) Inc. Important disclosure information regarding the subject companies covered in this report is available at www.macquarie.com/research/disclosures, or contact your registered representative at 1-888-MAC-STOCK, or write to the Supervisory Analysts, Research Department, Macquarie Securities, 125 W.55th Street, New York, NY 10019. © Macquarie Group Auckland Tel: (649) 377 6433
Jakarta Tel: (62 21) 515 1818
Mumbai Tel: (91 22) 6653 3000
Singapore Tel: (65) 6601 1111
Bangkok Tel: (662) 694 7999
Johannesburg Tel: (2711) 583 2000
Munich Tel: (089) 2444 31800
Sydney Tel: (612) 8232 9555
Calgary Tel: (1 403) 218 6650
Kuala Lumpur Tel: (60 3) 2059 8833
New York Tel: (1 212) 231 2500
Taipei Tel: (886 2) 2734 7500
Denver Tel: (303) 952 2800
London Tel: (44 20) 3037 4400
Paris Tel: (33 1) 7842 3823
Tokyo Tel: (81 3) 3512 7900
Frankfurt Tel: (069) 509 578 000
Manila Tel: (63 2) 857 0888
Perth Tel: (618) 9224 0888
Toronto Tel: (1 416) 848 3500
Geneva Tel: (41) 22 818 7777
Melbourne Tel: (613) 9635 8139
Seoul Tel: (82 2) 3705 8500
Hong Kong Tel: (852) 2823 3588
Montreal Tel: (1 514) 925 2850
Shanghai Tel: (86 21) 6841 3355
Available to clients on the world wide web at www.macquarieresearch.com and through Thomson Financial, FactSet, Reuters, Bloomberg, CapitalIQ and TheMarkets.com.
Research Heads of Equity Research John O’Connell (Global Co-Head) (612) 8232 7544 David Rickards (Global Co-Head) (44 20) 3037 4399 Graham Copley (US) (1 212) 231 2632 Stephen Harris (Canada Co-Head) (1 416) 848 3655 Matthew Akman (Canada Co-Head) (1 416) 848 3510
Consumer Discretionary & Healthcare Life Sciences & Technology Jon Groberg (Head of US Discretionary & Healthcare) (1 212) 231 2612
Gaming & Leisure Chad Beynon (New York) (1 212) 231 2634
Consumer Staples and Agriculture David Pupo (Toronto) (1 416) 848 3505
Energy
US Exploration & Production Joe Magner (Denver) (1 303) 952 2751 John Nelson (New York) (1 212) 231 2622
US Oilfield Services & Drilling Waqar Syed (Head of US Energy) (1 303) 952 2753 Ryan McCormick (Denver) (1 303) 952 2752
US Refining Chi Chow (Denver) (1 303) 952 2757
Canadian Oil Sands/Heavy Oil Producers Chris Feltin (Calgary) (1 403) 539 8544
Canadian Oilfield Services & Drilling Scott Treadwell (Calgary) (1 403) 539 8530
Canadian Independents Chris Feltin (Calgary) (1 403) 539 8544
Canadian Integrateds Chris Feltin (Calgary) (1 403) 539 8544
International/Canadian Oil & Gas Producers Cristina Lopez (Calgary) (1 403) 539 8542 David Popowich (Calgary) (1 403) 539 8529 Ray Kwan (Calgary) (1 403) 539 4355
Financials Asset Managers Roger Smith (New York) (1 212) 231 8016
Banks/Trust Banks Albert Savastano (New York) (1 212) 231 8046 Thomas Alonso (New York) (1 212) 231 8047 Jonathan Elmi (New York) (1 212) 231 8065 Bill Young (New York) (1 212) 231 8052 Sumit Malhotra (Toronto) (1 416) 848 3687 Stephen Scinicariello (New York) (1 212) 231 0663 John Moran (New York) (1 212) 231 0662
Financials – cont’d Financial Technology Bill Carcache (New York) (1 212) 231 8034
Life Insurance Mark Finkelstein (Chicago) (1 312) 660 9179 Paul Sarran (Chicago) (1 312) 660 9137 Sumit Malhotra (Toronto) (1 416) 848 3687
Market Structure Edward Ditmire (Head of Diversified Financials) (1 212) 231 8076 Chris Ross (New York) (1 212) 231 8033
Mortgage & Consumer Finance Matthew Howlett (New York) (1 212) 231 8063
Mortgage REITs Matthew Howlett (New York) (1 212) 231 8063
Property & Casualty Insurance Alan Zimmermann (1 212) 231 8081 Amit Kumar (New York) (1 212) 231 8013 Caroline Steers (New York) (1 212) 231 8048
Industrials
Air Freight & Surface Transportation Scott Flower (New York) (1 212) 231 2537
Chemicals Cooley May (New York) (1 212) 231 2586
Construction and Engineering/Machinery Sameer Rathod (New York) (1 212) 231 2474
Containers & Packaging Al Kabili (New York) (1 212) 231 2473
Materials Global Metals & Mining Curt Woodworth (New York) (1 212) 231 2482 Pierre Vaillancourt (Toronto) (1 416) 848 3647 Tony Lesiak (Toronto) (1 416) 848 3594 Duncan McKeen (Montréal) (1 514) 925 2856 Michael Gray (Vancouver) (1 604) 639 6372
Real Estate Property Trusts & Developers Robert Stevenson (Head of US REITs) (1 212) 231 8068 Ki Bin Kim (New York) (1 212) 231 6386 Michael Smith (Toronto) (1 416) 848 3696
TMET Telecommunications Kevin Smithen (New York) (1 212) 231 0695
Business Services Kevin McVeigh (New York) (1 212) 231 6191
Cable & Satellite Amy Yong (New York) (1 212) 231 2624
TMET – cont’d Internet Ben Schachter (New York) (1 212) 231 0644 Tom White (New York) (1 212) 231 0643
Media Andrew Kim (New York) (1 212) 231 2631
Semiconductors Shawn Webster (New York) (1 212) 231 2539
Software & IT Hardware Brad Zelnick (New York) (1 212) 231 2618
Solar & Clean Technology Kelly Dougherty (New York) (1 212) 231 2493
Utilities & Alternative Energy Angie Storozynski (Head of US Utilities & Alternative Energy) (1 212) 231 2569 Andrew Weisel (New York) (1 212) 231 1159 Matthew Akman (Toronto) (1 416) 848 3510 Stephen Harris (Toronto) (1 416) 848 3655
Commodities & Precious Metals Metals & Mining Jim Lennon (London) (44 20) 3037 4271 Max Layton (London) (44 20) 3037 4273 Kona Haque (London) (44 20) 3037 4334
Oil & gas Jan Stuart (New York) (1 212) 231 2485
Economics and Strategy Stephen Harris (Toronto) (1 416) 848 3655 Jan Stuart (Global Oil Economist) (1 212) 231 2485 Rebecca Hiscock-Croft (US Economist) (1 212) 231 6115
Quantitative Analysis Charles Lowe (New York) (1 212) 231 2602 Victor Morange (New York) (1 212) 231 2538
Find our research at Macquarie: www.macquarie.com.au/research Thomson: www.thomson.com/financial Reuters: www.knowledge.reuters.com Bloomberg: MAC GO Factset: http://www.factset.com/home.aspx CapitalIQ www.capitaliq.com TheMarkets.com www.themarkets.com Contact Gareth Warfield for access (612) 8232 3207
Email addresses [email protected] eg. [email protected]
Equities Head of Global Cash Equities Stevan Vrcelj (Sydney) (612) 8232 5999
Head of Canadian Equities Alex Rothwell (Toronto) (1 416) 848 3677
Head of US Equities Graham Copley (New York) (1 212) 231 2632
Sales US Sales Greg Coleman (New York) (1 212) 231 2567
US Financial Specialist Sales Blair Smith (New York) (1 212) 231 8004
Canada Sales Craig Brenner (Toronto) (1 416) 848-3626 Chris Naprawa (Toronto) (1 416) 848-3634
Trading US Sales Trading Austin Graham (New York) (1 212) 231 2494
Canada Trading Perry Catellier (Toronto) (1 416) 848 3619
International Sales Trading Chris Reale (New York) (1 212) 231 2555