Embed Size (px)
Citation preview
Corrections
EVOLUTIONCorrection for “Host adaptation to viruses relies on few geneswith different cross-resistance properties,” by Nelson E. Martins,Vítor G. Faria, Viola Nolte, Christian Schlötterer, Luis Teixeira,Élio Sucena, and Sara Magalhães, which appeared in issue 16,
April 22, 2014, of Proc Natl Acad Sci USA (111:5938–5943; firstpublished April 7, 2014; 10.1073/pnas.1400378111).The authors note that Fig. 4 appeared incorrectly. The cor-
rected figure and its legend appear below.
www.pnas.org/cgi/doi/10.1073/pnas.1418561111
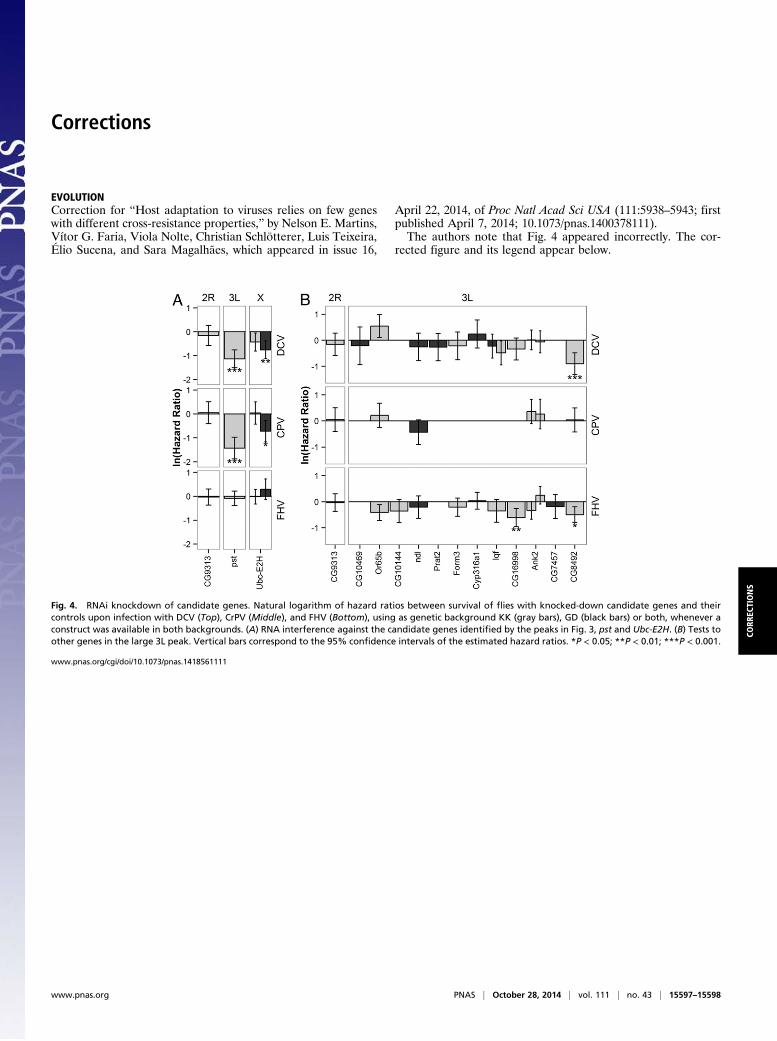
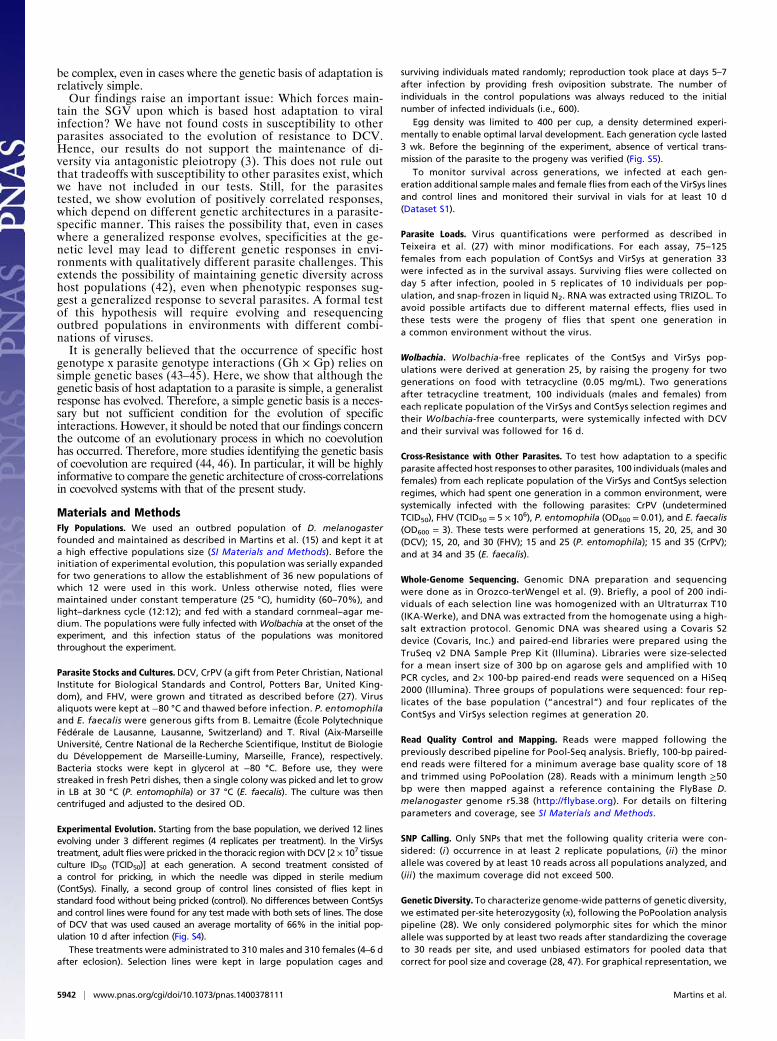
Fig. 4. RNAi knockdown of candidate genes. Natural logarithm of hazard ratios between survival of flies with knocked-down candidate genes and theircontrols upon infection with DCV (Top), CrPV (Middle), and FHV (Bottom), using as genetic background KK (gray bars), GD (black bars) or both, whenever aconstruct was available in both backgrounds. (A) RNA interference against the candidate genes identified by the peaks in Fig. 3, pst and Ubc-E2H. (B) Tests toother genes in the large 3L peak. Vertical bars correspond to the 95% confidence intervals of the estimated hazard ratios. *P < 0.05; **P < 0.01; ***P < 0.001.
www.pnas.org PNAS | October 28, 2014 | vol. 111 | no. 43 | 15597–15598
CORR
ECTIONS
MEDICAL SCIENCES, APPLIED MATHEMATICSCorrection for “Predicting the outcomes of treatment to eradi-cate the latent reservoir for HIV-1,” by Alison L. Hill, Daniel I. S.Rosenbloom, Feng Fu, Martin A. Nowak, and Robert F. Siliciano,which appeared in issue 37, September 16, 2014, of Proc NatlAcad Sci USA (111:13475–13480; first published August 5, 2014;10.1073/pnas.1406663111).
The authors note that, due to a printer’s error, Table 1 ap-peared incorrectly. The corrected table appears below. The on-line version has been corrected.
www.pnas.org/cgi/doi/10.1073/pnas.1418638111
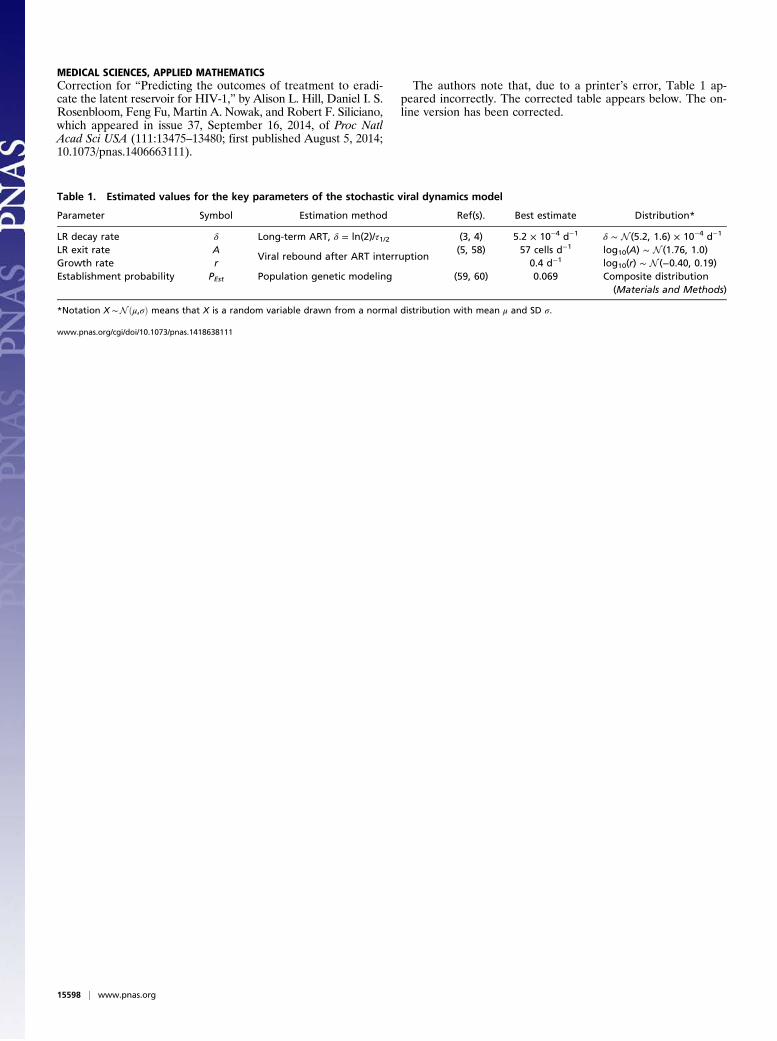
Table 1. Estimated values for the key parameters of the stochastic viral dynamics model
Parameter Symbol Estimation method Ref(s). Best estimate Distribution*
LR decay rate δ Long-term ART, δ = ln(2)/τ1/2 (3, 4) 5.2 × 10⁻⁴ d−1 δ ∼ N (5.2, 1.6) × 10−4 d−1
LR exit rate AViral rebound after ART interruption
(5, 58) 57 cells d−1 log10(A) ∼ N (1.76, 1.0)Growth rate r 0.4 d−1 log10(r) ∼ N (−0.40, 0.19)Establishment probability PEst Population genetic modeling (59, 60) 0.069 Composite distribution
(Materials and Methods)
*Notation X ∼Nðμ,σÞ means that X is a random variable drawn from a normal distribution with mean μ and SD σ.
15598 | www.pnas.org
Host adaptation to viruses relies on few genes withdifferent cross-resistance propertiesNelson E. Martinsa,1, Vítor G. Fariaa,1, Viola Nolteb, Christian Schlöttererb, Luis Teixeiraa, Élio Sucenaa,c,2,3,and Sara Magalhãesc,d,2,3
aInstituto Gulbenkian de Ciência, 2780-156 Oeiras, Portugal; bInstitut für Populationsgenetik, University of Veterinary Medicine Vienna, 1210 Vienna, Austria;cDepartamento de Biologia Animal, Faculdade de Ciências, Universidade de Lisboa, 1749-016 Lisbon, Portugal; and dCentro de Biologia Ambiental, Faculdadede Ciências, Universidade de Lisboa, 1749-016 Lisbon, Portugal
Edited by Trudy F. C. Mackay, North Carolina State University, Raleigh, NC, and approved March 14, 2014 (received for review January 9, 2014)
Host adaptation to one parasite may affect its response to others.However, the genetics of these direct and correlated responsesremains poorly studied. The overlap between these responses isinstrumental for the understanding of host evolution in multi-parasite environments. We determined the genetic and phenotypicchanges underlying adaptation of Drosophila melanogaster toDrosophila C virus (DCV). Within 20 generations, flies selectedwith DCV showed increased survival after DCV infection, but alsoafter cricket paralysis virus (CrPV) and flock house virus (FHV) in-fection. Whole-genome sequencing identified two regions of sig-nificant differentiation among treatments, from which candidategenes were functionally tested with RNAi. Three genes were vali-dated—pastrel, a known DCV-response gene, and two other loci,Ubc-E2H and CG8492. Knockdown of Ubc-E2H and pastrel alsoled to increased sensitivity to CrPV, whereas knockdown ofCG8492 increased susceptibility to FHV infection. Therefore, Dro-sophila adaptation to DCV relies on few major genes, each withdifferent cross-resistance properties, conferring host resistance toseveral parasites.
host–parasite interactions | experimental evolution |Drosophila immunity | evolve and resequence
Parasites impose a strong fitness cost on their hosts as theydevelop and reproduce at the expenses of host resources.
Therefore, it is expected that host strategies will be selected tocope with parasite burden. There is an ample variety of suchstrategies, from behavioral to intracellular responses (1). Be-cause the range of possibilities is very broad, it is difficult topredict which strategy, if any, will evolve in host populationsupon parasite attack. Moreover, in natural populations, hosts areexposed simultaneously to several parasite species and manyother selection pressures. If these selection pressures do not varyindependently of each other, a clear establishment of causalitybetween changes in host traits and the selection pressure posedby a given parasite species may be hampered.Experimental evolution enables the establishment of a direct
link between the selection imposed by a given environment andthe genetic and phenotypic changes observed in a population.The explanatory power of this methodology relies on three majorcharacteristics: (i) knowledge of the ancestral state; (ii) controlof the selection forces driving different sets of replicated pop-ulations; and (iii) the ability to follow the dynamics of a process,instead of measuring only its end-product (2). In addition, thismethodology allows addressing the consequences of the adap-tation process for the performance in other environments (3–5).Experimental evolution coupled with whole-genome approaches
can provide a nearly unbiased view of the actual targets of selec-tion, a long-standing aim of evolutionary biology (2). To thisday few examples exist in which these combined methodologieshave been used in multicellular sexual organisms in which mostadaptation comes from standing genetic variation (SGV) insteadof novel mutations (6–10). However, despite the centrality ofhost–parasite interactions in evolutionary biology and severalexperimental evolution studies in host–parasite systems (11–16),
to our knowledge, no study of host–parasite interactions hascombined experimental evolution with genomics.Another important aspect of experimental evolution is that it
allows the measurement of the consequences of evolving in oneenvironment for the performance in other environments (3).Indeed, adaptation to one environment may entail a fitness de-crease in other environments, possibly hampering future evolu-tion in such settings (17, 18). Despite being common, these costsare not universal (4) even within experiments (17). Moreover,adapting to one environment may even lead to increased per-formance in other environments (e.g., 5, 19). In host–parasiteinteractions, this question is particularly important because ofthe epidemiological consequences of infecting or resisting mul-tiple hosts or parasites, respectively.Despite ample knowledge of the genes triggered by parasite
attacks against Drosophila, only a few key studies have analyzedhow an outbred fly population may adapt to a given parasite (11–13, 15). However, the genetic basis and the consequences of suchadaptation for host susceptibility to other parasites have notbeen determined.
Significance
Despite ample knowledge of the genetics and physiology ofhost responses to parasites, little is known about the geneticbasis of host adaptation to parasites. Moreover, adaptationto one parasite is likely to impact the outcome of differentinfections. Yet these correlated responses, seminal to the un-derstanding of host evolution in multiparasite environments,remain poorly studied. We determined the genetic and phe-notypic changes underlying adaptation upon experimentalevolution of a Drosophila melanogaster population under viralinfection [Drosophila C virus (DCV)]. After 20 generations, se-lected flies showed increased survival upon infection with DCVand two other viruses. Using whole-genome sequencing andthrough RNAi, we identified and functionally validated threegenes underlying the adaptive process and revealed their dif-ferential roles in the correlated responses observed.
Author contributions: N.E.M., V.G.F., L.T., É.S., and S.M. designed research; N.E.M., V.G.F.,and V.N. performed research; C.S. and É.S. contributed new reagents/analytic tools;N.E.M., V.G.F., C.S., L.T., É.S., and S.M. analyzed data; and N.E.M., É.S., and S.M. wrotethe paper.
The authors declare no conflict of interest.
This article is a PNAS Direct Submission.
Freely available online through the PNAS open access option.
Data deposition: The sequences reported in this paper have been deposited in the Se-quence Read Archive of the European Nucleotide Archive, www.ebi.ac.uk/ena/about/search_and_browse (accession nos. ERS409776–ERS409787).1N.E.M. and V.G.F. contributed equally to this work.2É.S. and S.M. contributed equally to this work.3To whom correspondence may be addressed. E-mail: [email protected] [email protected].
This article contains supporting information online at www.pnas.org/lookup/suppl/doi:10.1073/pnas.1400378111/-/DCSupplemental.
5938–5943 | PNAS | April 22, 2014 | vol. 111 | no. 16 www.pnas.org/cgi/doi/10.1073/pnas.1400378111
It has been shown that natural Drosophila melanogaster pop-ulations contain SGV for resistance against natural viruses.Whereas some studies show that most of this variation can beattributed to a limited number of genes with major effect (20–23), others indicate that a significant fraction of the geneticvariation for resistance is polygenic (24, 25). Interestingly, thealleles that contribute to the variation in resistance to a givenvirus are of genes unrelated to the canonical insect antiviraldefense pathways (26). Moreover, this variation may be ratherspecific in mediating responses to distinct natural pathogens (21).Here, we addressed the genetics of host adaptation to para-
sites and the effects in cross-resistance in a D. melanogaster–virussystem. To this aim, we performed experimental evolution of anoutbred D. melanogaster population exposed to a natural viralparasite (Drosophila C virus or DCV), analyzed the basis for theresponse using a genome-wide approach, and functionally testedcandidate genes for their role in the response against DCV andother parasites.
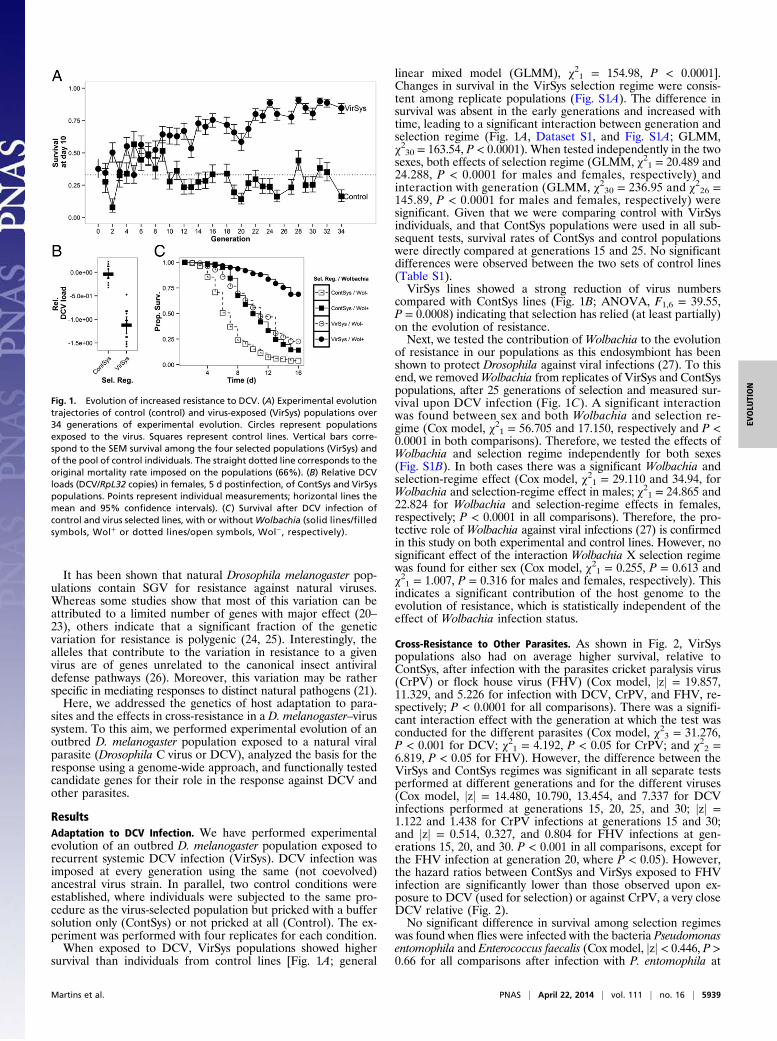
ResultsAdaptation to DCV Infection. We have performed experimentalevolution of an outbred D. melanogaster population exposed torecurrent systemic DCV infection (VirSys). DCV infection wasimposed at every generation using the same (not coevolved)ancestral virus strain. In parallel, two control conditions wereestablished, where individuals were subjected to the same pro-cedure as the virus-selected population but pricked with a buffersolution only (ContSys) or not pricked at all (Control). The ex-periment was performed with four replicates for each condition.When exposed to DCV, VirSys populations showed higher
survival than individuals from control lines [Fig. 1A; general
linear mixed model (GLMM), χ21 = 154.98, P < 0.0001].Changes in survival in the VirSys selection regime were consis-tent among replicate populations (Fig. S1A). The difference insurvival was absent in the early generations and increased withtime, leading to a significant interaction between generation andselection regime (Fig. 1A, Dataset S1, and Fig. S1A; GLMM,χ230 = 163.54, P < 0.0001). When tested independently in the twosexes, both effects of selection regime (GLMM, χ21 = 20.489 and24.288, P < 0.0001 for males and females, respectively) andinteraction with generation (GLMM, χ230 = 236.95 and χ226 =145.89, P < 0.0001 for males and females, respectively) weresignificant. Given that we were comparing control with VirSysindividuals, and that ContSys populations were used in all sub-sequent tests, survival rates of ContSys and control populationswere directly compared at generations 15 and 25. No significantdifferences were observed between the two sets of control lines(Table S1).VirSys lines showed a strong reduction of virus numbers
compared with ContSys lines (Fig. 1B; ANOVA, F1,6 = 39.55,P = 0.0008) indicating that selection has relied (at least partially)on the evolution of resistance.Next, we tested the contribution of Wolbachia to the evolution
of resistance in our populations as this endosymbiont has beenshown to protect Drosophila against viral infections (27). To thisend, we removedWolbachia from replicates of VirSys and ContSyspopulations, after 25 generations of selection and measured sur-vival upon DCV infection (Fig. 1C). A significant interactionwas found between sex and both Wolbachia and selection re-gime (Cox model, χ21 = 56.705 and 17.150, respectively and P <0.0001 in both comparisons). Therefore, we tested the effects ofWolbachia and selection regime independently for both sexes(Fig. S1B). In both cases there was a significant Wolbachia andselection-regime effect (Cox model, χ21 = 29.110 and 34.94, forWolbachia and selection-regime effect in males; χ21 = 24.865 and22.824 for Wolbachia and selection-regime effects in females,respectively; P < 0.0001 in all comparisons). Therefore, the pro-tective role of Wolbachia against viral infections (27) is confirmedin this study on both experimental and control lines. However, nosignificant effect of the interaction Wolbachia X selection regimewas found for either sex (Cox model, χ21 = 0.255, P = 0.613 andχ21 = 1.007, P = 0.316 for males and females, respectively). Thisindicates a significant contribution of the host genome to theevolution of resistance, which is statistically independent of theeffect of Wolbachia infection status.
Cross-Resistance to Other Parasites. As shown in Fig. 2, VirSyspopulations also had on average higher survival, relative toContSys, after infection with the parasites cricket paralysis virus(CrPV) or flock house virus (FHV) (Cox model, jzj = 19.857,11.329, and 5.226 for infection with DCV, CrPV, and FHV, re-spectively; P < 0.0001 for all comparisons). There was a signifi-cant interaction effect with the generation at which the test wasconducted for the different parasites (Cox model, χ23 = 31.276,P < 0.001 for DCV; χ21 = 4.192, P < 0.05 for CrPV; and χ22 =6.819, P < 0.05 for FHV). However, the difference between theVirSys and ContSys regimes was significant in all separate testsperformed at different generations and for the different viruses(Cox model, jzj = 14.480, 10.790, 13.454, and 7.337 for DCVinfections performed at generations 15, 20, 25, and 30; jzj =1.122 and 1.438 for CrPV infections at generations 15 and 30;and jzj = 0.514, 0.327, and 0.804 for FHV infections at gen-erations 15, 20, and 30. P < 0.001 in all comparisons, except forthe FHV infection at generation 20, where P < 0.05). However,the hazard ratios between ContSys and VirSys exposed to FHVinfection are significantly lower than those observed upon ex-posure to DCV (used for selection) or against CrPV, a very closeDCV relative (Fig. 2).No significant difference in survival among selection regimes
was found when flies were infected with the bacteria Pseudomonasentomophila and Enterococcus faecalis (Cox model, jzj < 0.446, P >0.66 for all comparisons after infection with P. entomophila at
Fig. 1. Evolution of increased resistance to DCV. (A) Experimental evolutiontrajectories of control (control) and virus-exposed (VirSys) populations over34 generations of experimental evolution. Circles represent populationsexposed to the virus. Squares represent control lines. Vertical bars corre-spond to the SEM survival among the four selected populations (VirSys) andof the pool of control individuals. The straight dotted line corresponds to theoriginal mortality rate imposed on the populations (66%). (B) Relative DCVloads (DCV/RpL32 copies) in females, 5 d postinfection, of ContSys and VirSyspopulations. Points represent individual measurements; horizontal lines themean and 95% confidence intervals). (C) Survival after DCV infection ofcontrol and virus selected lines, with or withoutWolbachia (solid lines/filledsymbols, Wol+ or dotted lines/open symbols, Wol−, respectively).
Martins et al. PNAS | April 22, 2014 | vol. 111 | no. 16 | 5939
EVOLU
TION
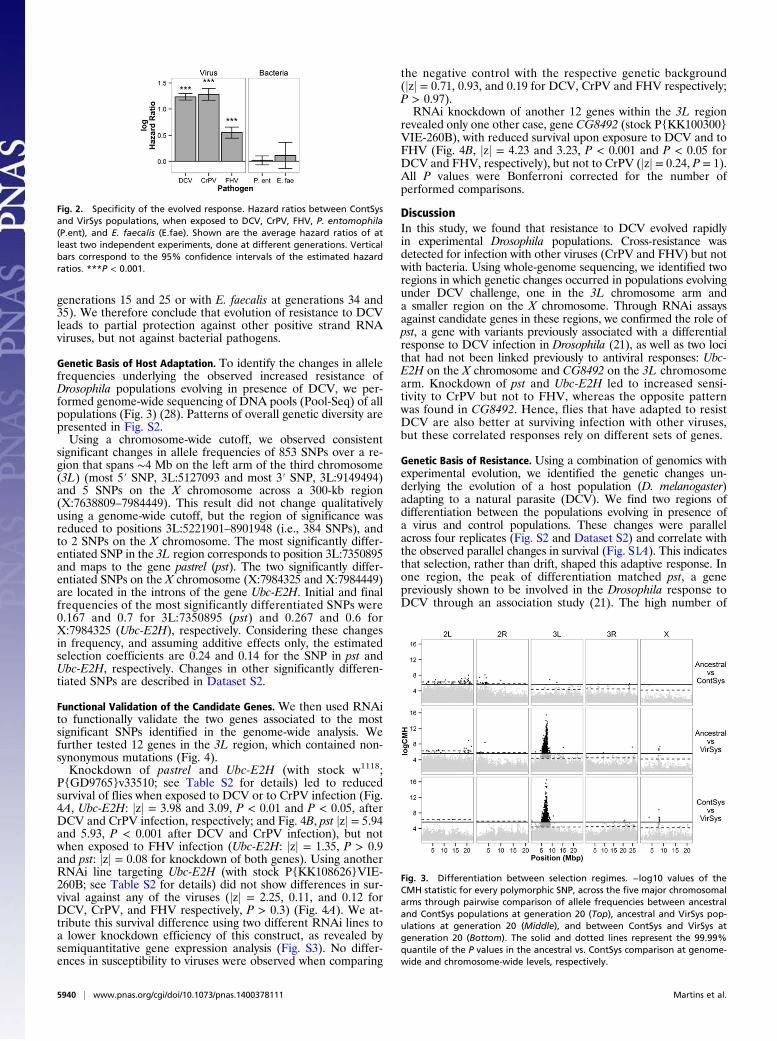
generations 15 and 25 or with E. faecalis at generations 34 and35). We therefore conclude that evolution of resistance to DCVleads to partial protection against other positive strand RNAviruses, but not against bacterial pathogens.
Genetic Basis of Host Adaptation. To identify the changes in allelefrequencies underlying the observed increased resistance ofDrosophila populations evolving in presence of DCV, we per-formed genome-wide sequencing of DNA pools (Pool-Seq) of allpopulations (Fig. 3) (28). Patterns of overall genetic diversity arepresented in Fig. S2.Using a chromosome-wide cutoff, we observed consistent
significant changes in allele frequencies of 853 SNPs over a re-gion that spans ∼4 Mb on the left arm of the third chromosome(3L) (most 5′ SNP, 3L:5127093 and most 3′ SNP, 3L:9149494)and 5 SNPs on the X chromosome across a 300-kb region(X:7638809–7984449). This result did not change qualitativelyusing a genome-wide cutoff, but the region of significance wasreduced to positions 3L:5221901–8901948 (i.e., 384 SNPs), andto 2 SNPs on the X chromosome. The most significantly differ-entiated SNP in the 3L region corresponds to position 3L:7350895and maps to the gene pastrel (pst). The two significantly differ-entiated SNPs on the X chromosome (X:7984325 and X:7984449)are located in the introns of the gene Ubc-E2H. Initial and finalfrequencies of the most significantly differentiated SNPs were0.167 and 0.7 for 3L:7350895 (pst) and 0.267 and 0.6 forX:7984325 (Ubc-E2H), respectively. Considering these changesin frequency, and assuming additive effects only, the estimatedselection coefficients are 0.24 and 0.14 for the SNP in pst andUbc-E2H, respectively. Changes in other significantly differen-tiated SNPs are described in Dataset S2.
Functional Validation of the Candidate Genes. We then used RNAito functionally validate the two genes associated to the mostsignificant SNPs identified in the genome-wide analysis. Wefurther tested 12 genes in the 3L region, which contained non-synonymous mutations (Fig. 4).Knockdown of pastrel and Ubc-E2H (with stock w1118;
P{GD9765}v33510; see Table S2 for details) led to reducedsurvival of flies when exposed to DCV or to CrPV infection (Fig.4A, Ubc-E2H: jzj = 3.98 and 3.09, P < 0.01 and P < 0.05, afterDCV and CrPV infection, respectively; and Fig. 4B, pst jzj = 5.94and 5.93, P < 0.001 after DCV and CrPV infection), but notwhen exposed to FHV infection (Ubc-E2H: jzj = 1.35, P > 0.9and pst: jzj = 0.08 for knockdown of both genes). Using anotherRNAi line targeting Ubc-E2H (with stock P{KK108626}VIE-260B; see Table S2 for details) did not show differences in sur-vival against any of the viruses (jzj = 2.25, 0.11, and 0.12 forDCV, CrPV, and FHV respectively, P > 0.3) (Fig. 4A). We at-tribute this survival difference using two different RNAi lines toa lower knockdown efficiency of this construct, as revealed bysemiquantitative gene expression analysis (Fig. S3). No differ-ences in susceptibility to viruses were observed when comparing
the negative control with the respective genetic background(jzj = 0.71, 0.93, and 0.19 for DCV, CrPV and FHV respectively;P > 0.97).RNAi knockdown of another 12 genes within the 3L region
revealed only one other case, gene CG8492 (stock P{KK100300}VIE-260B), with reduced survival upon exposure to DCV and toFHV (Fig. 4B, jzj = 4.23 and 3.23, P < 0.001 and P < 0.05 forDCV and FHV, respectively), but not to CrPV (jzj = 0.24, P = 1).All P values were Bonferroni corrected for the number ofperformed comparisons.
DiscussionIn this study, we found that resistance to DCV evolved rapidlyin experimental Drosophila populations. Cross-resistance wasdetected for infection with other viruses (CrPV and FHV) but notwith bacteria. Using whole-genome sequencing, we identified tworegions in which genetic changes occurred in populations evolvingunder DCV challenge, one in the 3L chromosome arm anda smaller region on the X chromosome. Through RNAi assaysagainst candidate genes in these regions, we confirmed the role ofpst, a gene with variants previously associated with a differentialresponse to DCV infection in Drosophila (21), as well as two locithat had not been linked previously to antiviral responses: Ubc-E2H on the X chromosome and CG8492 on the 3L chromosomearm. Knockdown of pst and Ubc-E2H led to increased sensi-tivity to CrPV but not to FHV, whereas the opposite patternwas found in CG8492. Hence, flies that have adapted to resistDCV are also better at surviving infection with other viruses,but these correlated responses rely on different sets of genes.
Genetic Basis of Resistance. Using a combination of genomics withexperimental evolution, we identified the genetic changes un-derlying the evolution of a host population (D. melanogaster)adapting to a natural parasite (DCV). We find two regions ofdifferentiation between the populations evolving in presence ofa virus and control populations. These changes were parallelacross four replicates (Fig. S2 and Dataset S2) and correlate withthe observed parallel changes in survival (Fig. S1A). This indicatesthat selection, rather than drift, shaped this adaptive response. Inone region, the peak of differentiation matched pst, a genepreviously shown to be involved in the Drosophila response toDCV through an association study (21). The high number of
Fig. 2. Specificity of the evolved response. Hazard ratios between ContSysand VirSys populations, when exposed to DCV, CrPV, FHV, P. entomophila(P.ent), and E. faecalis (E.fae). Shown are the average hazard ratios of atleast two independent experiments, done at different generations. Verticalbars correspond to the 95% confidence intervals of the estimated hazardratios. ***P < 0.001.
Fig. 3. Differentiation between selection regimes. −log10 values of theCMH statistic for every polymorphic SNP, across the five major chromosomalarms through pairwise comparison of allele frequencies between ancestraland ContSys populations at generation 20 (Top), ancestral and VirSys pop-ulations at generation 20 (Middle), and between ContSys and VirSys atgeneration 20 (Bottom). The solid and dotted lines represent the 99.99%quantile of the P values in the ancestral vs. ContSys comparison at genome-wide and chromosome-wide levels, respectively.
5940 | www.pnas.org/cgi/doi/10.1073/pnas.1400378111 Martins et al.
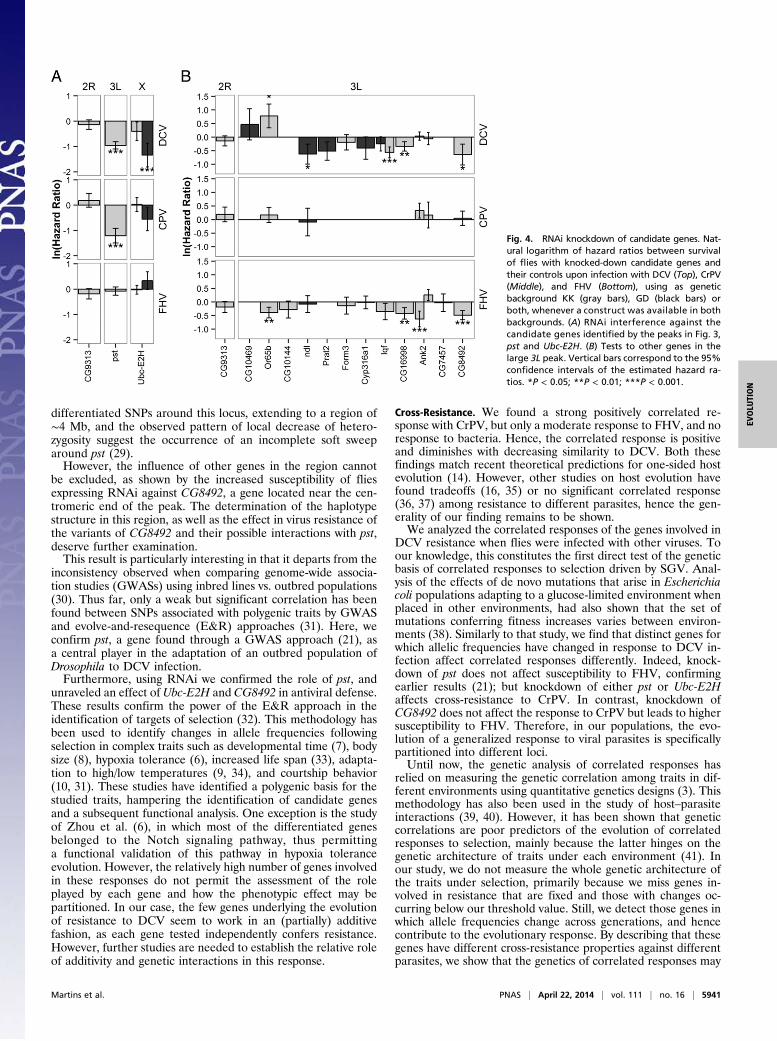
differentiated SNPs around this locus, extending to a region of∼4 Mb, and the observed pattern of local decrease of hetero-zygosity suggest the occurrence of an incomplete soft sweeparound pst (29).However, the influence of other genes in the region cannot
be excluded, as shown by the increased susceptibility of fliesexpressing RNAi against CG8492, a gene located near the cen-tromeric end of the peak. The determination of the haplotypestructure in this region, as well as the effect in virus resistance ofthe variants of CG8492 and their possible interactions with pst,deserve further examination.This result is particularly interesting in that it departs from the
inconsistency observed when comparing genome-wide associa-tion studies (GWASs) using inbred lines vs. outbred populations(30). Thus far, only a weak but significant correlation has beenfound between SNPs associated with polygenic traits by GWASand evolve-and-resequence (E&R) approaches (31). Here, weconfirm pst, a gene found through a GWAS approach (21), asa central player in the adaptation of an outbred population ofDrosophila to DCV infection.Furthermore, using RNAi we confirmed the role of pst, and
unraveled an effect of Ubc-E2H and CG8492 in antiviral defense.These results confirm the power of the E&R approach in theidentification of targets of selection (32). This methodology hasbeen used to identify changes in allele frequencies followingselection in complex traits such as developmental time (7), bodysize (8), hypoxia tolerance (6), increased life span (33), adapta-tion to high/low temperatures (9, 34), and courtship behavior(10, 31). These studies have identified a polygenic basis for thestudied traits, hampering the identification of candidate genesand a subsequent functional analysis. One exception is the studyof Zhou et al. (6), in which most of the differentiated genesbelonged to the Notch signaling pathway, thus permittinga functional validation of this pathway in hypoxia toleranceevolution. However, the relatively high number of genes involvedin these responses do not permit the assessment of the roleplayed by each gene and how the phenotypic effect may bepartitioned. In our case, the few genes underlying the evolutionof resistance to DCV seem to work in an (partially) additivefashion, as each gene tested independently confers resistance.However, further studies are needed to establish the relative roleof additivity and genetic interactions in this response.
Cross-Resistance. We found a strong positively correlated re-sponse with CrPV, but only a moderate response to FHV, and noresponse to bacteria. Hence, the correlated response is positiveand diminishes with decreasing similarity to DCV. Both thesefindings match recent theoretical predictions for one-sided hostevolution (14). However, other studies on host evolution havefound tradeoffs (16, 35) or no significant correlated response(36, 37) among resistance to different parasites, hence the gen-erality of our finding remains to be shown.We analyzed the correlated responses of the genes involved in
DCV resistance when flies were infected with other viruses. Toour knowledge, this constitutes the first direct test of the geneticbasis of correlated responses to selection driven by SGV. Anal-ysis of the effects of de novo mutations that arise in Escherichiacoli populations adapting to a glucose-limited environment whenplaced in other environments, had also shown that the set ofmutations conferring fitness increases varies between environ-ments (38). Similarly to that study, we find that distinct genes forwhich allelic frequencies have changed in response to DCV in-fection affect correlated responses differently. Indeed, knock-down of pst does not affect susceptibility to FHV, confirmingearlier results (21); but knockdown of either pst or Ubc-E2Haffects cross-resistance to CrPV. In contrast, knockdown ofCG8492 does not affect the response to CrPV but leads to highersusceptibility to FHV. Therefore, in our populations, the evo-lution of a generalized response to viral parasites is specificallypartitioned into different loci.Until now, the genetic analysis of correlated responses has
relied on measuring the genetic correlation among traits in dif-ferent environments using quantitative genetics designs (3). Thismethodology has also been used in the study of host–parasiteinteractions (39, 40). However, it has been shown that geneticcorrelations are poor predictors of the evolution of correlatedresponses to selection, mainly because the latter hinges on thegenetic architecture of traits under each environment (41). Inour study, we do not measure the whole genetic architecture ofthe traits under selection, primarily because we miss genes in-volved in resistance that are fixed and those with changes oc-curring below our threshold value. Still, we detect those genes inwhich allele frequencies change across generations, and hencecontribute to the evolutionary response. By describing that thesegenes have different cross-resistance properties against differentparasites, we show that the genetics of correlated responses may
Fig. 4. RNAi knockdown of candidate genes. Nat-ural logarithm of hazard ratios between survivalof flies with knocked-down candidate genes andtheir controls upon infection with DCV (Top), CrPV(Middle), and FHV (Bottom), using as geneticbackground KK (gray bars), GD (black bars) orboth, whenever a construct was available in bothbackgrounds. (A) RNAi interference against thecandidate genes identified by the peaks in Fig. 3,pst and Ubc-E2H. (B) Tests to other genes in thelarge 3L peak. Vertical bars correspond to the 95%confidence intervals of the estimated hazard ra-tios. *P < 0.05; **P < 0.01; ***P < 0.001.
Martins et al. PNAS | April 22, 2014 | vol. 111 | no. 16 | 5941
EVOLU
TION
be complex, even in cases where the genetic basis of adaptation isrelatively simple.Our findings raise an important issue: Which forces main-
tain the SGV upon which is based host adaptation to viralinfection? We have not found costs in susceptibility to otherparasites associated to the evolution of resistance to DCV.Hence, our results do not support the maintenance of di-versity via antagonistic pleiotropy (3). This does not rule outthat tradeoffs with susceptibility to other parasites exist, whichwe have not included in our tests. Still, for the parasitestested, we show evolution of positively correlated responses,which depend on different genetic architectures in a parasite-specific manner. This raises the possibility that, even in caseswhere a generalized response evolves, specificities at the ge-netic level may lead to different genetic responses in envi-ronments with qualitatively different parasite challenges. Thisextends the possibility of maintaining genetic diversity acrosshost populations (42), even when phenotypic responses sug-gest a generalized response to several parasites. A formal testof this hypothesis will require evolving and resequencingoutbred populations in environments with different combi-nations of viruses.It is generally believed that the occurrence of specific host
genotype x parasite genotype interactions (Gh × Gp) relies onsimple genetic bases (43–45). Here, we show that although thegenetic basis of host adaptation to a parasite is simple, a generalistresponse has evolved. Therefore, a simple genetic basis is a neces-sary but not sufficient condition for the evolution of specificinteractions. However, it should be noted that our findings concernthe outcome of an evolutionary process in which no coevolutionhas occurred. Therefore, more studies identifying the genetic basisof coevolution are required (44, 46). In particular, it will be highlyinformative to compare the genetic architecture of cross-correlationsin coevolved systems with that of the present study.
Materials and MethodsFly Populations. We used an outbred population of D. melanogasterfounded and maintained as described in Martins et al. (15) and kept it ata high effective populations size (SI Materials and Methods). Before theinitiation of experimental evolution, this population was serially expandedfor two generations to allow the establishment of 36 new populations ofwhich 12 were used in this work. Unless otherwise noted, flies weremaintained under constant temperature (25 °C), humidity (60–70%), andlight–darkness cycle (12:12); and fed with a standard cornmeal–agar me-dium. The populations were fully infected with Wolbachia at the onset of theexperiment, and this infection status of the populations was monitoredthroughout the experiment.
Parasite Stocks and Cultures. DCV, CrPV (a gift from Peter Christian, NationalInstitute for Biological Standards and Control, Potters Bar, United King-dom), and FHV, were grown and titrated as described before (27). Virusaliquots were kept at −80 °C and thawed before infection. P. entomophilaand E. faecalis were generous gifts from B. Lemaitre (École PolytechniqueFédérale de Lausanne, Lausanne, Switzerland) and T. Rival (Aix-MarseilleUniversité, Centre National de la Recherche Scientifique, Institut de Biologiedu Développement de Marseille-Luminy, Marseille, France), respectively.Bacteria stocks were kept in glycerol at −80 °C. Before use, they werestreaked in fresh Petri dishes, then a single colony was picked and let to growin LB at 30 °C (P. entomophila) or 37 °C (E. faecalis). The culture was thencentrifuged and adjusted to the desired OD.
Experimental Evolution. Starting from the base population, we derived 12 linesevolving under 3 different regimes (4 replicates per treatment). In the VirSystreatment, adult flies were pricked in the thoracic region with DCV [2 × 10⁷ tissueculture ID50 (TCID50)] at each generation. A second treatment consisted ofa control for pricking, in which the needle was dipped in sterile medium(ContSys). Finally, a second group of control lines consisted of flies kept instandard food without being pricked (control). No differences between ContSysand control lines were found for any test made with both sets of lines. The doseof DCV that was used caused an average mortality of 66% in the initial pop-ulation 10 d after infection (Fig. S4).
These treatments were administrated to 310 males and 310 females (4–6 dafter eclosion). Selection lines were kept in large population cages and
surviving individuals mated randomly; reproduction took place at days 5–7after infection by providing fresh oviposition substrate. The number ofindividuals in the control populations was always reduced to the initialnumber of infected individuals (i.e., 600).
Egg density was limited to 400 per cup, a density determined experi-mentally to enable optimal larval development. Each generation cycle lasted3 wk. Before the beginning of the experiment, absence of vertical trans-mission of the parasite to the progeny was verified (Fig. S5).
To monitor survival across generations, we infected at each gen-eration additional sample males and female flies from each of the VirSys linesand control lines and monitored their survival in vials for at least 10 d(Dataset S1).
Parasite Loads. Virus quantifications were performed as described inTeixeira et al. (27) with minor modifications. For each assay, 75–125females from each population of ContSys and VirSys at generation 33were infected as in the survival assays. Surviving flies were collected onday 5 after infection, pooled in 5 replicates of 10 individuals per pop-ulation, and snap-frozen in liquid N2. RNA was extracted using TRIZOL. Toavoid possible artifacts due to different maternal effects, flies used inthese tests were the progeny of flies that spent one generation ina common environment without the virus.
Wolbachia. Wolbachia-free replicates of the ContSys and VirSys pop-ulations were derived at generation 25, by raising the progeny for twogenerations on food with tetracycline (0.05 mg/mL). Two generationsafter tetracycline treatment, 100 individuals (males and females) fromeach replicate population of the VirSys and ContSys selection regimes andtheir Wolbachia-free counterparts, were systemically infected with DCVand their survival was followed for 16 d.
Cross-Resistance with Other Parasites. To test how adaptation to a specificparasite affected host responses to other parasites, 100 individuals (males andfemales) from each replicate population of the VirSys and ContSys selectionregimes, which had spent one generation in a common environment, weresystemically infected with the following parasites: CrPV (undeterminedTCID50), FHV (TCID50 = 5 × 10⁶), P. entomophila (OD600 = 0.01), and E. faecalis(OD600 = 3). These tests were performed at generations 15, 20, 25, and 30(DCV); 15, 20, and 30 (FHV); 15 and 25 (P. entomophila); 15 and 35 (CrPV);and at 34 and 35 (E. faecalis).
Whole-Genome Sequencing. Genomic DNA preparation and sequencingwere done as in Orozco-terWengel et al. (9). Briefly, a pool of 200 indi-viduals of each selection line was homogenized with an Ultraturrax T10(IKA-Werke), and DNA was extracted from the homogenate using a high-salt extraction protocol. Genomic DNA was sheared using a Covaris S2device (Covaris, Inc.) and paired-end libraries were prepared using theTruSeq v2 DNA Sample Prep Kit (Illumina). Libraries were size-selectedfor a mean insert size of 300 bp on agarose gels and amplified with 10PCR cycles, and 2× 100-bp paired-end reads were sequenced on a HiSeq2000 (Illumina). Three groups of populations were sequenced: four rep-licates of the base population (“ancestral”) and four replicates of theContSys and VirSys selection regimes at generation 20.
Read Quality Control and Mapping. Reads were mapped following thepreviously described pipeline for Pool-Seq analysis. Briefly, 100-bp paired-end reads were filtered for a minimum average base quality score of 18and trimmed using PoPoolation (28). Reads with a minimum length ≥50bp were then mapped against a reference containing the FlyBase D.melanogaster genome r5.38 (http://flybase.org). For details on filteringparameters and coverage, see SI Materials and Methods.
SNP Calling. Only SNPs that met the following quality criteria were con-sidered: (i ) occurrence in at least 2 replicate populations, (ii ) the minorallele was covered by at least 10 reads across all populations analyzed, and(iii) the maximum coverage did not exceed 500.
Genetic Diversity. To characterize genome-wide patterns of genetic diversity,we estimated per-site heterozygosity (π), following the PoPoolation analysispipeline (28). We only considered polymorphic sites for which the minorallele was supported by at least two reads after standardizing the coverageto 30 reads per site, and used unbiased estimators for pooled data thatcorrect for pool size and coverage (28, 47). For graphical representation, we
5942 | www.pnas.org/cgi/doi/10.1073/pnas.1400378111 Martins et al.
calculated average values in sliding 500-kb windows, with a step size of 100kb across the entire genome (Fig. S1A).
Identification of Candidate SNPs. We used the Cochran–Mantel–Haenszel(CMH) test, as implemented in PoPoolation2 (48) to identify SNPs withchanges in allele frequencies between the different regimes that wereconsistent among replicates as described in Orozco-terWengel et al. (9) (SIMaterials and Methods).
RNAi. We performed in vivo RNAi knockdown assays for the candidate genesin the 3L and X (pst and Ubc-E2H) and for a set of genes in the 3L peak ofdifferentiation, selected according to whether (i) they had significantlydifferentiated nonsynonymous SNPs or (ii) gene ontology or previousfunctional assays suggested a role in antiviral immunity. We took advantageof the two large RNAi collections of the Vienna Drosophila RNAi Center (49),and used the Gal80ts/Tub-Gal4 inducible system as a rescue from
developmental lethality. The tested constructs are shown in Table S2. Moredetails are available in SI Materials and Methods.
Statistical Analysis. All statistical analyses were done using R (Version2.15; www.r-project.org). Full details are provided in SI Materials andMethods.
ACKNOWLEDGMENTS. The authors thank Dieter Ebert and Britt Koskellafor critical comments that significantly improved the manuscript; thelaboratories of Patrícia Beldade, Christen Mirth, and É.S.; and MargaridaMatos for inspiring discussions on the project. N.E.M. (SFRH/BPD/62964/2009) and V.G.F. (SFRH/BD/82299/2011) are funded by Fundação paraa Ciência e a Tecnologia. C.S. is funded by the Austrian Science Fund(FWF) (P22725 and P19467) and the European Research Council(ArchAdapt). This work was supported by Fundação para a Ciência e Tecno-logia (PTDC/SAU-IMU/120673/2010), Instituto Gulbenkian de Ciência/Fun-dação Calouste Gulbenkian, and Vetmeduni funding.
1. Schmid-Hempel P (2011) Evolutionary Parasitology: The Integrated Study of In-fections, Immunology, Ecology, and Genetics (Oxford Biology, Oxford).
2. Kawecki TJ, et al. (2012) Experimental evolution. Trends Ecol Evol 27(10):547–560.3. Kassen R (2002) The experimental evolution of specialists, generalists, and the
maintenance of diversity. J Evol Biol 15(2):173–190.4. Lopes PC, Sucena E, Santos ME, Magalhães S (2008) Rapid experimental evolution of
pesticide resistance in C. elegans entails no costs and affects the mating system. PLoSONE 3(11):e3741.
5. Magalhães S, Blanchet E, Egas M, Olivieri I (2009) Are adaptation costs necessary tobuild up a local adaptation pattern? BMC Evol Biol 9:182.
6. Zhou D, et al. (2011) Experimental selection of hypoxia-tolerant Drosophila mela-nogaster. Proc Natl Acad Sci USA 108(6):2349–2354.
7. Burke MK, et al. (2010) Genome-wide analysis of a long-term evolution experimentwith Drosophila. Nature 467(7315):587–590.
8. Turner TL, Stewart AD, Fields AT, Rice WR, Tarone AM (2011) Population-based re-sequencing of experimentally evolved populations reveals the genetic basis of bodysize variation in Drosophila melanogaster. PLoS Genet 7(3):e1001336.
9. Orozco-terWengel P, et al. (2012) Adaptation of Drosophila to a novel laboratoryenvironment reveals temporally heterogeneous trajectories of selected alleles. MolEcol 21(20):4931–4941.
10. Turner TL, Miller PM (2012) Investigating natural variation in Drosophila courtshipsong by the evolve and resequence approach. Genetics 191(2):633–642.
11. Ye YH, Chenoweth SF, McGraw EA (2009) Effective but costly, evolved mechanisms ofdefense against a virulent opportunistic pathogen in Drosophila melanogaster. PLoSPathog 5(4):e1000385.
12. Kraaijeveld AR, Godfray HC (1997) Trade-off between parasitoid resistance and larvalcompetitive ability in Drosophila melanogaster. Nature 389(6648):278–280.
13. Vijendravarma RK, Kraaijeveld AR, Godfray HCJ (2009) Experimental evolution showsDrosophila melanogaster resistance to a microsporidian pathogen has fitness costs.Evolution 63(1):104–114.
14. Antonovics J, et al. (2013) The origin of specificity by means of natural selection:Evolved and nonhost resistance in host-pathogen interactions. Evolution 67(1):1–9.
15. Martins NE, Faria VG, Teixeira L, Magalhães S, Sucena E (2013) Host adaptation iscontingent upon the infection route taken by pathogens. PLoS Pathog 9(9):e1003601.
16. Zbinden M, Haag CR, Ebert D (2008) Experimental evolution of field populations ofDaphnia magna in response to parasite treatment. J Evol Biol 21(4):1068–1078.
17. Bennett AF, Lenski RE (2007) An experimental test of evolutionary trade-offs duringtemperature adaptation. Proc Natl Acad Sci USA 104(Suppl 1):8649–8654.
18. Kubinak JL, Ruff JS, Hyzer CW, Slev PR, Potts WK (2012) Experimental viral evolutionto specific host MHC genotypes reveals fitness and virulence trade-offs in alternativeMHC types. Proc Natl Acad Sci USA 109(9):3422–3427.
19. Vogwill T, Lagator M, Colegrave N, Neve P (2012) The experimental evolution ofherbicide resistance in Chlamydomonas reinhardtii results in a positive correlationbetween fitness in the presence and absence of herbicides. J Evol Biol 25(10):1955–1964.
20. Magwire MM, Bayer F, Webster CL, Cao C, Jiggins FM (2011) Successive increases inthe resistance of Drosophila to viral infection through a transposon insertion fol-lowed by a Duplication. PLoS Genet 7(10):e1002337.
21. Magwire MM, et al. (2012) Genome-wide association studies reveal a simple geneticbasis of resistance to naturally coevolving viruses in Drosophila melanogaster. PLoSGenet 8(11):e1003057.
22. Bangham J, Knott SA, Kim K-W, Young RS, Jiggins FM (2008) Genetic variation af-fecting host-parasite interactions: Major-effect quantitative trait loci affect thetransmission of sigma virus in Drosophila melanogaster. Mol Ecol 17(17):3800–3807.
23. Contamine D, Petitjean AM, Ashburner M (1989) Genetic resistance to viral infection:The molecular cloning of a Drosophila gene that restricts infection by the rhabdovirussigma. Genetics 123(3):525–533.
24. Bangham J, Kim K-W, Webster CL, Jiggins FM (2008) Genetic variation affecting host-parasite interactions: Different genes affect different aspects of sigma virus replica-tion and transmission in Drosophila melanogaster. Genetics 178(4):2191–2199.
25. Carpenter JA, Hadfield JD, Bangham J, Jiggins FM (2012) Specific interactions be-tween host and parasite genotypes do not act as a constraint on the evolution ofantiviral resistance in Drosophila. Evolution 66(4):1114–1125.
26. Xu J, Cherry S (2014) Viruses and antiviral immunity in Drosophila. Dev Comp Im-munol 42(1):67–84.
27. Teixeira L, Ferreira Á, Ashburner M (2008) The bacterial symbiont Wolbachia inducesresistance to RNA viral infections in Drosophila melanogaster. PLoS Biol 6(12):e2.
28. Kofler R, et al. (2011) PoPoolation: A toolbox for population genetic analysis of nextgeneration sequencing data from pooled individuals. PLoS ONE 6(1):e15925.
29. Burke MK (2012) How does adaptation sweep through the genome? Insights fromlong-term selection experiments. Proc Biol Sci 279(1749):5029–5038.
30. Huang W, et al. (2012) Epistasis dominates the genetic architecture of Drosophilaquantitative traits. Proc Natl Acad Sci USA 109(39):15553–15559.
31. Turner TL, Miller PM, Cochrane VA (2013) Combining genome-wide methods to in-vestigate the genetic complexity of courtship song variation in Drosophila mela-nogaster. Mol Biol Evol 30(9):2113–2120.
32. Kofler R, Schlötterer C (2014) A guide for the design of evolve and resequencingstudies. Mol Biol Evol 31(2):474–483.
33. Remolina SC, Chang PL, Leips J, Nuzhdin SV, Hughes KA (2012) Genomic basis of agingand life-history evolution in Drosophila melanogaster. Evolution 66(11):3390–3403.
34. Tobler R, et al. (2014) Massive habitat-specific genomic response in D. melanogasterpopulations during experimental evolution in hot and cold environments. Mol BiolEvol 31(2):364–375.
35. Gwynn DM, Callaghan A, Gorham J, Walters KF, Fellowes MD (2005) Resistance iscostly: Trade-offs between immunity, fecundity and survival in the pea aphid. ProcBiol Sci 272(1574):1803–1808.
36. Lazzaro BP, Sackton TB, Clark AG (2006) Genetic variation in Drosophila melanogasterresistance to infection: A comparison across bacteria. Genetics 174(3):1539–1554.
37. Kraaijeveld AR, Layen SJ, Futerman PH, Godfray HCJ (2012) Lack of phenotypic andevolutionary cross-resistance against parasitoids and pathogens in Drosophila mela-nogaster. PLoS ONE 7(12):e53002.
38. Ostrowski EA, Rozen DE, Lenski RE (2005) Pleiotropic effects of beneficial mutationsin Escherichia coli. Evolution 59(11):2343–2352.
39. Luong LT, Polak M (2007) Costs of resistance in the Drosophila-macrocheles system:A negative genetic correlation between ectoparasite resistance and reproduction.Evolution 61(6):1391–1402.
40. Magalhães S, Fayard J, Janssen A, Carbonell D, Olivieri I (2007) Adaptation in a spidermite population after long-term evolution on a single host plant. J Evol Biol 20(5):2016–2027.
41. Czesak ME, Fox CW, Wolf JB (2006) Experimental evolution of phenotypic plasticity:How predictive are cross-environment genetic correlations? Am Nat 168(3):323–335.
42. Thompson JN (2005) The Geographic Mosaic of Coevolution (Interspecific Inter-actions) (Univ of Chicago Press, Chicago).
43. Luijckx P, Ben-Ami F, Mouton L, Du Pasquier L, Ebert D (2011) Cloning of the un-culturable parasite Pasteuria ramosa and its Daphnia host reveals extreme genotype-genotype interactions. Ecol Lett 14(2):125–131.
44. Luijckx P, Fienberg H, Duneau D, Ebert D (2013) A matching-allele model explains hostresistance to parasites. Curr Biol 23(12):1085–1088.
45. Clarke B (1976) Genetic Aspects of Host-Parasite Relationships, eds Taylor AER,Muller R (Blackwell, Oxford), pp 87–103.
46. Thrall PH, et al. (2012) Rapid genetic change underpins antagonistic coevolution ina natural host-pathogen metapopulation. Ecol Lett 15(5):425–435.
47. Futschik A, Schlötterer C (2010) The next generation of molecular markers frommassively parallel sequencing of pooled DNA samples. Genetics 186(1):207–218.
48. Kofler R, Pandey RV, Schlötterer C (2011) PoPoolation2: Identifying differentiationbetween populations using sequencing of pooled DNA samples (Pool-Seq). Bio-informatics 27(24):3435–3436.
49. Dietzl G, et al. (2007) A genome-wide transgenic RNAi library for conditional geneinactivation in Drosophila. Nature 448(7150):151–156.
Martins et al. PNAS | April 22, 2014 | vol. 111 | no. 16 | 5943
EVOLU
TION


![LIVING ENVIRONMENT - JMAPjmap.org/IJMAP/LivingEnvironment/0807ExamLE.pdf · Living Environment–Aug. ’07 [4] 12 Viruses frequently infect bacteria and insert new genes into the](https://img.pdfslide.us/doc/110x75/5e7e6b757ec4593b6b0f9689/living-environment-living-environmentaaug-a07-4-12-viruses-frequently-infect.jpg)