Embed Size (px)
Citation preview
Health Care PolicyStudies in
March 2009
The Fraser Institute
Hospital Report Card Ontario 2009
by Nadeem Esmail and Maureen Hazel

www.fraserinstitute.org / Fraser Institute
Studies inHealth Care Policy
March 2009
The Fraser Institute Hospital Report Card
Ontario 2009
by Nadeem Esmail and Maureen Hazel
www.fraserinstitute.org / Fraser Institute
Contents
Overview and Observations / 1
Methodological Appendices / 39
Frequently Asked Questions / 105
References / 115
About the authors / 121
Acknowledgments and CIHI Acknowledgment & Disclaimer / 122
About this publication / 123
Supporting the Fraser Institute / 124
About the Fraser Institute / 125
Editorial Advisory Board / 126
www.fraserinstitute.org / Fraser Institute
Hospital Report Card: Ontario 2009
Overview and Observations
Overview / 2
Introduction and background / 15
Overview of methodology used / 31
Legend for sample table / 35
Hospital responses / 37
2 / Hospital Report Card: Ontario 2009 / Overview and Observations
Fraser Institute / www.fraserinstitute.org
Overview
The Fraser Institute’s Hospital Report Card: Ontario 2009 is constructed to help patients choose the best hospital for their inpatient care by providing them with information on the performance of acute-care hospitals in Ontario. All of the information in this report is available at our interactive web site, <www.hospitalreportcards.ca>.
We set out to create a hospital report card that is easy to understand and accessible by the public, where individuals are able to look up a given condition or procedure and compare death rates, volumes of procedures, rates of adverse events, and utilization rates for their hospital to those of other hospitals in Ontario. This is accomplished by using state-of-the-art indicators developed by the US Agency for Healthcare Research and Quality (AHRQ) in conjunction with Stanford University that have been shown to reflect quality of care inside hospitals. These indicators are presently in use in more than a dozen US states, including several of the more populous ones, New York, Texas, Florida, and California.
We are using the Canadian Institute for Health Information’s (CIHI) Discharge Abstract Database (DAD) as our primary information source. This information is derived from patient records provided to the CIHI by all hospitals in Ontario. Demographic, administrative, and clinical data are extracted from the Discharge Abstract Database for inpatient hospital stays from all acute-care hospitals in Ontario. Since more specialized hospitals may treat more high-risk patients and some patients arrive at hospitals sicker than others, it is important to risk-adjust the indicators for patients with the same condition but a different health status. The international standard for risk adjustment, the 3M™ APR™ DRG Classification System,1 is employed to risk-adjust the data. The Fraser Institute spent two years developing the methods, databases, and computer programs required to adapt the measures to Canadian circumstances. This work has been internally and externally peer-reviewed (Mullins, Menaker, and Esmail, 2006) and is supported by an extensive body of research based on the AHRQ approach.
Of Ontario’s 136 acute-care hospitals, 17, representing 5% of inpatient records in Ontario in the latest year, granted us authorization to identify them by name in this report. This represents a significant drop from the first report, in which we were authorized to identify 43 hospitals, representing 41% of inpa-tient records in Ontario in 2004/05. We applaud those hospitals who volun-tarily agreed to be identified in the Hospital Report Card: Ontario 2009. These
1 3M and APR are trademarks of 3M, used under license in Canada.
Overview and Observations / Hospital Report Card: Ontario 2009 / 3
www.fraserinstitute.org / Fraser Institute
hospitals should be commended for their efforts to empower patients with information regarding the health care they receive and for their ongoing com-mitment to quality improvement through accountability and transparency.
What indicators are used?The Fraser Institute’s Hospital Report Card: Ontario 2009 consists of 50 of AHRQ’s indicators of quality (such as death due to a stroke) and patient safety (such as a foreign body left inside a patient during a procedure). The indicators are shown for all acute-care hospitals in Ontario from 1997/98 to 2006/07, comprising more than 10.5 million patient records.2 We have also calculated the indicators for all municipalities in Ontario, based on patient residence postal codes. This constitutes the most comprehensive and detailed publicly available measure of acute-care hospital performance and account-ability in Canada at the present time.
The indicators are expressed as observed rates (such as death due to hip replacement surgery) and risk-adjusted rates (the same rate adjusted for patient health status). Each institution was given a score from 0 to 100 for each indicator based on its risk-adjusted rate, where 100 is the best. The institutions were then ranked based on their scores, where 1 is the best.3 The indicators are classified into three groups: those related to medical conditions, hospital procedures, and child birth. The indicators are further classified by type: death rates, volumes of procedures, utilization rates, and adverse events.
Hospital Mortality IndexThe Hospital Mortality Index (HMI) shows the overall performance of a hospital (table 1, pages 8–9) or municipality (table 2, pages 11–14) across indicators that measure death rates. It consists of eight or nine indicators, depending upon the year:
1 deaths due to hip replacement surgery
2 deaths due to heart attacks (2002/03 onwards)
2 There are a total of 50 indicators in this report. Due to changes in diagnostic and pro-cedural classifications, the availability of indicators varies from year to year. Forty-two indicators are reported for the period from 2002/03 to 2003/04. Due to changes in the AHRQ software, three indicators were dropped from 2005/06 onwards for a total of 39 indicators.
3 Some adverse events tend to be rare and smaller municipalities and hospitals will not always see these consequences of patient care. It cannot be imputed that a high score on these types of indicators is necessarily due to fewer adverse events for those places with relatively low numbers of cases as their volume of activity may be inadequate to produce the inevitable adverse event. Therefore, results for some indicators must be interpreted with caution in the case of smaller institutions and municipalities.
4 / Hospital Report Card: Ontario 2009 / Overview and Observations
Fraser Institute / www.fraserinstitute.org
3 deaths due to heart failure
4 deaths due to acute strokes
5 deaths due to bleeding from the esophagus, stomach, small intestine or colon
6 deaths due to hip fractures
7 deaths due to pneumonia infection
8 deaths among patients that are considered unlikely to die in the hospital
9 deaths in patients that developed complications of care during hospitalization
The final score in the HMI for each hospital and municipality is an aver-age of the scores of these indicators (100 is the best). All institutions and municipalities were ranked based on their HMI score (1 is the top rank). It is important to note that the 50 indicators and the Hospital Mortality Index are applicable only to acute-care conditions and procedures for inpatient care. The results cannot be generalized to assess the overall performance of any given hospital.
Limitations and caveatsSince this report is based on administrative data, the results have limitations related to coding variations and other factors. Hospital deaths or complica-tions will occur even when all standards of care are followed. Deciding on treatment options and choosing a hospital are decisions that should be made in consultation with a physician. It is not recommended that anyone choose a hospital based solely on statistics and descriptions such as those given in this report.
That said, the Discharge Abstract Database (DAD) is a major data source used to produce various reports published by the Canadian Institute for Health Information (CIHI), including annual reports on the performance of hospitals and the health care system. It is also a major data source for seven of the health indicators adopted by the federal, provincial, and terri-torial governments. These data have also been used extensively in previous reports on health care performance and form the basis for many journal arti-cles. As is noted in the Ontario Hospital Report, which uses the same DAD data set underlying this report card, “the data are collected under consistent guidelines, by trained abstractors, in all acute-care hospitals in Ontario. The data undergo extensive edit checks to improve accuracy, but all errors can-not be eliminated” (Ontario Hospital Association and the Government of Ontario, 2006: 6).
There are a number of publications that have addressed the data-quality issues that are discussed in our report. Of note are the CIHI’s reabstraction studies that go back to the original patient charts and recode the information
Overview and Observations / Hospital Report Card: Ontario 2009 / 5
www.fraserinstitute.org / Fraser Institute
using a different set of expert coders.4 Overall, according to the CIHI (2004), findings from their three-year DAD re-abstraction studies have confirmed the strengths of the database, while identifying limitations in certain areas resulting from inconsistencies in the coding of some data elements. In addi-tion, the findings from the inter-rater data (that is, comparison between reab-stractors) were generally similar to the findings from the main study data (that is, comparison between original coder and reabstractor). This suggests that the database is coded as well as can be expected using existing approaches in the hospital system.
In addition to the aforementioned reabstraction studies, the OECD published a report that supports the AHRQ patient-safety indicator approach, noting that “this set of measures represents an exciting development and their use should be tested in a variety of countries” (Millar, Mattke, et al., 2004: 12). Further, a recently released report by the Manitoba Center for Health Policy that used the AHRQ Patient Safety Indicators (Bruce et al., 2006) noted two important advantages to using the AHRQ approach. The first advantage is the breadth of coverage offered by the indicators in study-ing in-hospital patient safety. The second is that the AHRQ patient safety indicators were developed to measure complications of hospital-based care among a group of patients for whom the complications seemed preventable or highly unlikely.
Observations
A report based on over 10.5 million patient records, shown across 50 quality and safety indicators, for 136 hospitals and 138 municipalities, over 10 years, is not something that can be summarized in a few words. In fact, the primary purpose of this research is to provide patients with access to information on specific medical procedures and conditions, and understand the variation in hospital care across the entire system. It is for that reason that we have rates, scores, and ranks for each separate indicator. All documents are avail-able at <www.hospitalreportcards.ca> and <www.fraserinstitute.org/reportcards/hospitalperformance/>.
However, we have created one summary measure of mortality, based on the most important and reliable data in this study, the Hospital Mortality Index (HMI). The component indicators of the HMI were arrived at by a process of
4 Reabstractors participating in the study were required to have several years of coding experience, experience coding in ICD-10-CA and CCI in particular, experience coding at a tertiary care centre, and attendance at specific CIHI educational workshops. They were also required to attend a one-week training session and to receive a passing score on the inter-rater test.

6 / Hospital Report Card: Ontario 2009 / Overview and Observations
Fraser Institute / www.fraserinstitute.org
elimination. Starting with our complete group of indicators, we eliminated indicators that had no data for several years or for which there were relatively few hospitals with data. The resulting HMI has scores and rankings for 54 hospitals and 94 municipalities in the latest year since not all hospitals and municipalities had data for all nine indicators in 2006/07.
Tables 1 (pages 8–9) and 2 (pages 11–14) show scores and rankings for the Hospital Mortality Index for 2006/07. This is compared to the score in 2005/06. The change column shows the improvement or deterioration in score between the two periods. Due to changes in the underlying methodol-ogy, comparisons of the Hospital Mortality Index for 2005/06 onwards with previous years must be interpreted with caution.5
Hospital Mortality Index: Hospitals
Top-Ranked Hospitals
•The top hospital in Ontario is Anonymous Hospital 211 with a high HMI score of 91.1 out of 100 in 2006/07. It was not among the top 10 in the pre-vious period.
•Anonymous Hospital 220 is the second-ranked hospital. Unlike Anony-mous Hospital 211, it was among the top ten performers in the previous period, where it ranked seventh with a score of 90.1 as compared to 90.4 in 2006/07.
•Anonymous Hospital 10 was ranked first in 2005/06 and ranks seventh in 2006/07.
•Among the hospitals ranked in the top 10 in 2006/07, three saw a deterio-ration in their scores between 2005/06 and 2006/07. All but two hospitals in the top 10 in 2006/07 were also in the top 15 in 2005/06.
•Calculation of an HMI score was possible for only five of the identified hos-pitals, none of which are in the top 10. Rouge Valley Health System—Ajax and Pickering Site was the top identified hospital in 32nd place and a score of 86.7. Hanover and District Hospital ranked 36th; Rouge Valley Health System—Centenary Health Centre Site, 42nd; Timmins and District Gen-eral Hospital, 51st; and Bluewater Health-Sarnia General Site, 58th.
5 In the previous version of the AHRQ software used for the Hospital Report Card: Ontario, a linear regression model was used for risk adjustment where the risk-adjusted rate = observed rate − expected rate + population rate. In the new version of the software implemented for data from 2005/06 onwards, logistic regression was used, where the risk-adjusted rate = observed rate / expected rate * population rate. In addition, the application of risk adjustment was revised for some indicators.
Overview and Observations / Hospital Report Card: Ontario 2009 / 7
www.fraserinstitute.org / Fraser Institute
Bottom-Ranked Hospitals
•Anonymous Hospital 31 is the lowest-ranked hospital with a score of 78.3. It saw a deterioration in its score between 2005/06 and 2006/07 and was ranked 52nd out of 57 in 2005/06.
•Anonymous Hospital 40 experienced the biggest improvement in its HMI from 2005/06 among hospitals for which an HMI could be calculated in both years. It went from 56th of 57 in 2005/06 to 47th of 59 in 2006/07.
•Bluewater Health-Sarnia General Site is the lowest-ranked participating hospital and is ranked 58th with a score of 79.9.
Consistency
•There is a fair amount of consistency in the performance of both top-ranked and bottom-ranked hospitals.
•Of the seven hospitals among the bottom 10 for whom scores are available in both years, only only two were not among the bottom 15 performers in 2005/06.
•Similarly, only two of the top 10 hospitals in 2006/07 did not rank among the top 15 in 2005/06.
8 / Hospital Report Card: Ontario 2009 / Overview and Observations
Fraser Institute / www.fraserinstitute.org
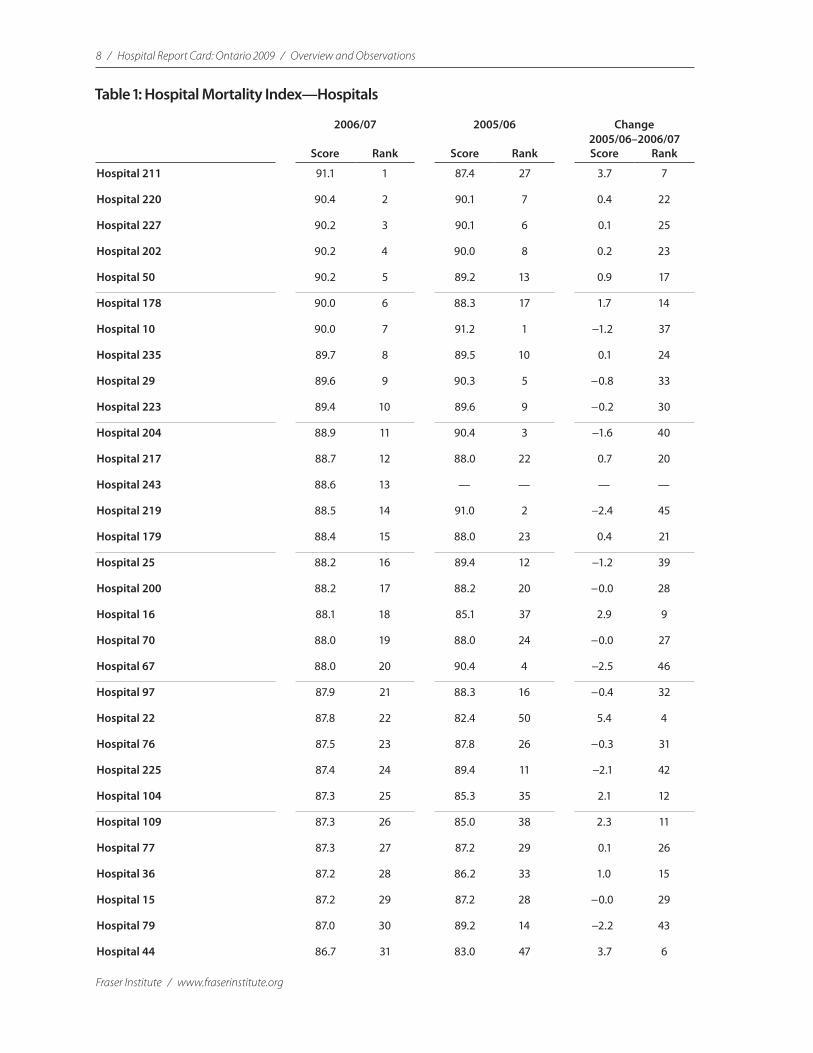
Table 1: Hospital Mortality Index—Hospitals
2006/07 2005/06 Change 2005/06–2006/07
Score Rank Score Rank Score Rank
Hospital 211 91.1 1 87.4 27 3.7 7
Hospital 220 90.4 2 90.1 7 0.4 22
Hospital 227 90.2 3 90.1 6 0.1 25
Hospital 202 90.2 4 90.0 8 0.2 23
Hospital 50 90.2 5 89.2 13 0.9 17
Hospital 178 90.0 6 88.3 17 1.7 14
Hospital 10 90.0 7 91.2 1 −1.2 37
Hospital 235 89.7 8 89.5 10 0.1 24
Hospital 29 89.6 9 90.3 5 −0.8 33
Hospital 223 89.4 10 89.6 9 −0.2 30
Hospital 204 88.9 11 90.4 3 −1.6 40
Hospital 217 88.7 12 88.0 22 0.7 20
Hospital 243 88.6 13 — — — —
Hospital 219 88.5 14 91.0 2 −2.4 45
Hospital 179 88.4 15 88.0 23 0.4 21
Hospital 25 88.2 16 89.4 12 −1.2 39
Hospital 200 88.2 17 88.2 20 −0.0 28
Hospital 16 88.1 18 85.1 37 2.9 9
Hospital 70 88.0 19 88.0 24 −0.0 27
Hospital 67 88.0 20 90.4 4 −2.5 46
Hospital 97 87.9 21 88.3 16 −0.4 32
Hospital 22 87.8 22 82.4 50 5.4 4
Hospital 76 87.5 23 87.8 26 −0.3 31
Hospital 225 87.4 24 89.4 11 −2.1 42
Hospital 104 87.3 25 85.3 35 2.1 12
Hospital 109 87.3 26 85.0 38 2.3 11
Hospital 77 87.3 27 87.2 29 0.1 26
Hospital 36 87.2 28 86.2 33 1.0 15
Hospital 15 87.2 29 87.2 28 −0.0 29
Hospital 79 87.0 30 89.2 14 −2.2 43
Hospital 44 86.7 31 83.0 47 3.7 6
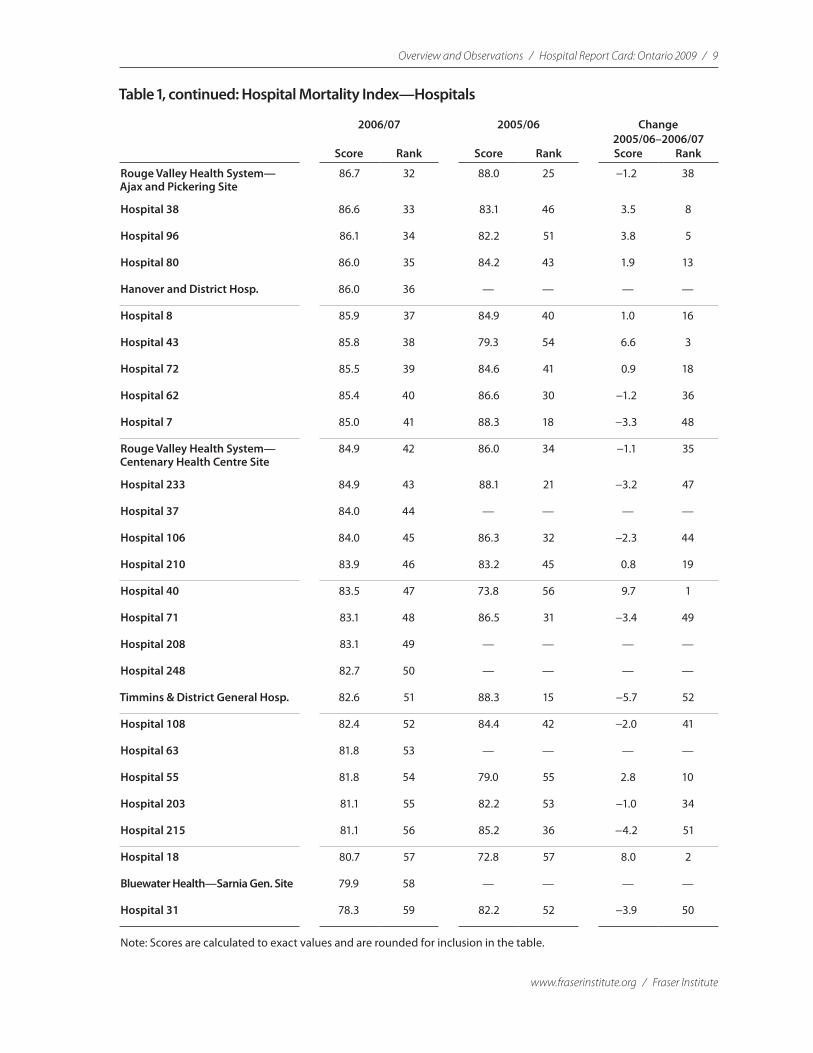
Overview and Observations / Hospital Report Card: Ontario 2009 / 9
www.fraserinstitute.org / Fraser Institute
2006/07 2005/06 Change 2005/06–2006/07
Score Rank Score Rank Score Rank
Rouge Valley Health System— Ajax and Pickering Site
86.7 32 88.0 25 −1.2 38
Hospital 38 86.6 33 83.1 46 3.5 8
Hospital 96 86.1 34 82.2 51 3.8 5
Hospital 80 86.0 35 84.2 43 1.9 13
Hanover and District Hosp. 86.0 36 — — — —
Hospital 8 85.9 37 84.9 40 1.0 16
Hospital 43 85.8 38 79.3 54 6.6 3
Hospital 72 85.5 39 84.6 41 0.9 18
Hospital 62 85.4 40 86.6 30 −1.2 36
Hospital 7 85.0 41 88.3 18 −3.3 48
Rouge Valley Health System— Centenary Health Centre Site
84.9 42 86.0 34 −1.1 35
Hospital 233 84.9 43 88.1 21 −3.2 47
Hospital 37 84.0 44 — — — —
Hospital 106 84.0 45 86.3 32 −2.3 44
Hospital 210 83.9 46 83.2 45 0.8 19
Hospital 40 83.5 47 73.8 56 9.7 1
Hospital 71 83.1 48 86.5 31 −3.4 49
Hospital 208 83.1 49 — — — —
Hospital 248 82.7 50 — — — —
Timmins & District General Hosp. 82.6 51 88.3 15 −5.7 52
Hospital 108 82.4 52 84.4 42 −2.0 41
Hospital 63 81.8 53 — — — —
Hospital 55 81.8 54 79.0 55 2.8 10
Hospital 203 81.1 55 82.2 53 −1.0 34
Hospital 215 81.1 56 85.2 36 −4.2 51
Hospital 18 80.7 57 72.8 57 8.0 2
Bluewater Health—Sarnia Gen. Site 79.9 58 — — — —
Hospital 31 78.3 59 82.2 52 −3.9 50
Note: Scores are calculated to exact values and are rounded for inclusion in the table.
Table 1, continued: Hospital Mortality Index—Hospitals
10 / Hospital Report Card: Ontario 2009 / Overview and Observations
Fraser Institute / www.fraserinstitute.org
Hospital Mortality Index: Municipalities6
Top-Ranked Municipalities
•The top municipality is Caledon with an HMI score of 93.1 out of 100; data is inadequate to show Caledon’s score in 2005/06.
•The second-ranked municipality, Innisfil, scored 90.0 in 2006/07, but ranked 1st for its improvement from the previous period, moving up from 85th position with an improvement of 15.5.
•Municipal scores at the high end showed little consistency between the two years. Only one municipaly among the top 10 in 2006/07 was among the top 10 in 2005/06, while only two were among the top 15 (HMI scores could not be calculated for 2005/06 for two). Conversely, 7 of the 10 lowest-ranked municipalities in 2006/07 for which scores were available for 2005/06 ranked among the bottom 15 in 2005/06.
Bottom-Ranked Municipalities
•The lowest-ranked municipality in Ontario is Kirkland Lake, with an HMI score of 58.6. The lowest-ranked municipality for which data is available for both 2005/06 and 2006/07 is Napanee, with a score of 66.6 for 2006/07, which comes after a decline of approximately 9.5 points from its score in 2005/06.
Five Largest Municipalities
•The five largest municipalities in Ontario by number of inpatient stays are: Toronto, ranked 28th on the Hospital Mortality Index; Ottawa, ranked 22nd; Mississauga, ranked 36th; Scarborough, ranked 40th; and Hamilton, ranked 12th.
6 The Hospital Mortality Index (HMI) is calculated for municipalities using the residence of patients treated in Ontario’s acute-care hospitals. Due to patient mobility, municipal scores cannot be reliably used to infer the performance of hospitals.
Overview and Observations / Hospital Report Card: Ontario 2009 / 11
www.fraserinstitute.org / Fraser Institute
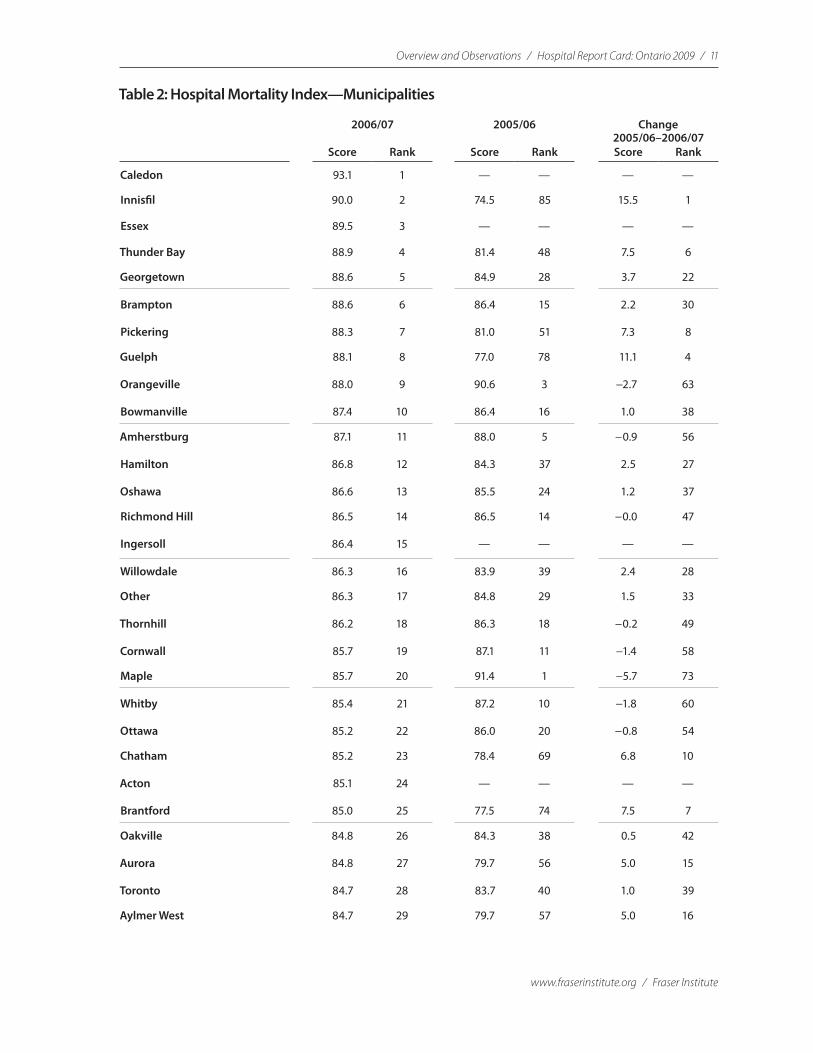
Table 2: Hospital Mortality Index—Municipalities
2006/07 2005/06 Change 2005/06–2006/07
Score Rank Score Rank Score Rank
Caledon 93.1 1 — — — —
Innisfil 90.0 2 74.5 85 15.5 1
Essex 89.5 3 — — — —
Thunder Bay 88.9 4 81.4 48 7.5 6
Georgetown 88.6 5 84.9 28 3.7 22
Brampton 88.6 6 86.4 15 2.2 30
Pickering 88.3 7 81.0 51 7.3 8
Guelph 88.1 8 77.0 78 11.1 4
Orangeville 88.0 9 90.6 3 −2.7 63
Bowmanville 87.4 10 86.4 16 1.0 38
Amherstburg 87.1 11 88.0 5 −0.9 56
Hamilton 86.8 12 84.3 37 2.5 27
Oshawa 86.6 13 85.5 24 1.2 37
Richmond Hill 86.5 14 86.5 14 −0.0 47
Ingersoll 86.4 15 — — — —
Willowdale 86.3 16 83.9 39 2.4 28
Other 86.3 17 84.8 29 1.5 33
Thornhill 86.2 18 86.3 18 −0.2 49
Cornwall 85.7 19 87.1 11 −1.4 58
Maple 85.7 20 91.4 1 −5.7 73
Whitby 85.4 21 87.2 10 −1.8 60
Ottawa 85.2 22 86.0 20 −0.8 54
Chatham 85.2 23 78.4 69 6.8 10
Acton 85.1 24 — — — —
Brantford 85.0 25 77.5 74 7.5 7
Oakville 84.8 26 84.3 38 0.5 42
Aurora 84.8 27 79.7 56 5.0 15
Toronto 84.7 28 83.7 40 1.0 39
Aylmer West 84.7 29 79.7 57 5.0 16
12 / Hospital Report Card: Ontario 2009 / Overview and Observations
Fraser Institute / www.fraserinstitute.org
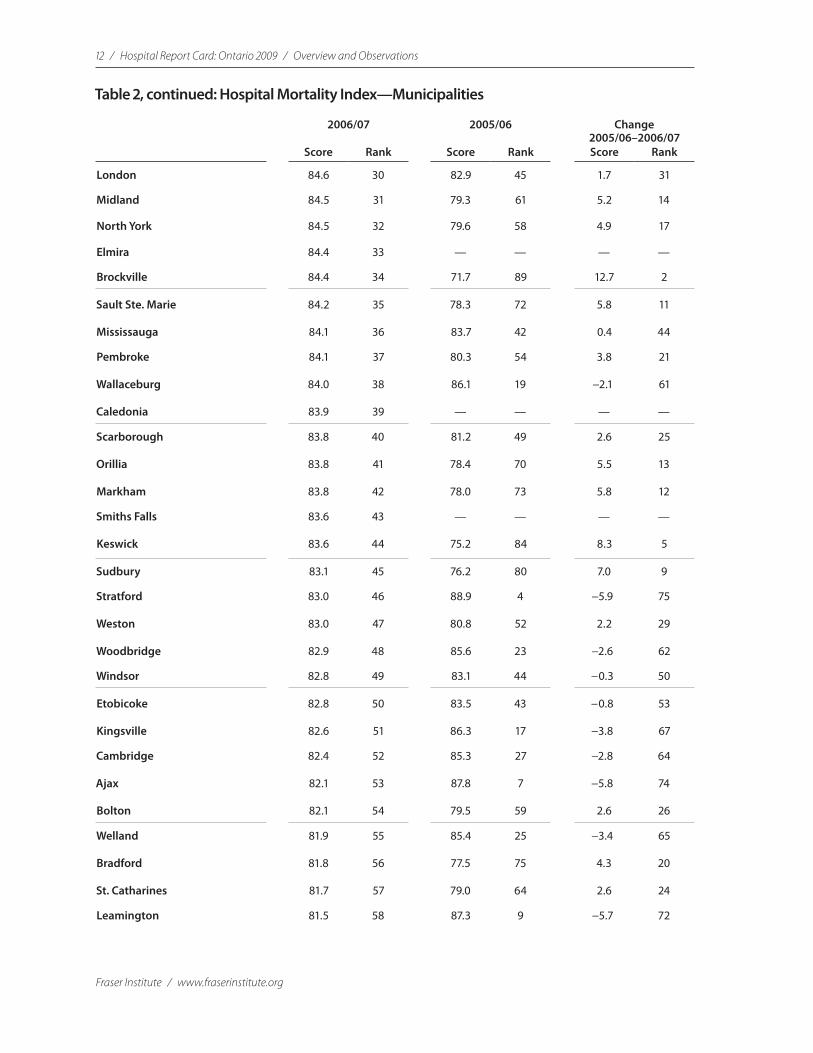
Table 2, continued: Hospital Mortality Index—Municipalities
2006/07 2005/06 Change 2005/06–2006/07
Score Rank Score Rank Score Rank
London 84.6 30 82.9 45 1.7 31
Midland 84.5 31 79.3 61 5.2 14
North York 84.5 32 79.6 58 4.9 17
Elmira 84.4 33 — — — —
Brockville 84.4 34 71.7 89 12.7 2
Sault Ste. Marie 84.2 35 78.3 72 5.8 11
Mississauga 84.1 36 83.7 42 0.4 44
Pembroke 84.1 37 80.3 54 3.8 21
Wallaceburg 84.0 38 86.1 19 −2.1 61
Caledonia 83.9 39 — — — —
Scarborough 83.8 40 81.2 49 2.6 25
Orillia 83.8 41 78.4 70 5.5 13
Markham 83.8 42 78.0 73 5.8 12
Smiths Falls 83.6 43 — — — —
Keswick 83.6 44 75.2 84 8.3 5
Sudbury 83.1 45 76.2 80 7.0 9
Stratford 83.0 46 88.9 4 −5.9 75
Weston 83.0 47 80.8 52 2.2 29
Woodbridge 82.9 48 85.6 23 −2.6 62
Windsor 82.8 49 83.1 44 −0.3 50
Etobicoke 82.8 50 83.5 43 −0.8 53
Kingsville 82.6 51 86.3 17 −3.8 67
Cambridge 82.4 52 85.3 27 −2.8 64
Ajax 82.1 53 87.8 7 −5.8 74
Bolton 82.1 54 79.5 59 2.6 26
Welland 81.9 55 85.4 25 −3.4 65
Bradford 81.8 56 77.5 75 4.3 20
St. Catharines 81.7 57 79.0 64 2.6 24
Leamington 81.5 58 87.3 9 −5.7 72
Overview and Observations / Hospital Report Card: Ontario 2009 / 13
www.fraserinstitute.org / Fraser Institute
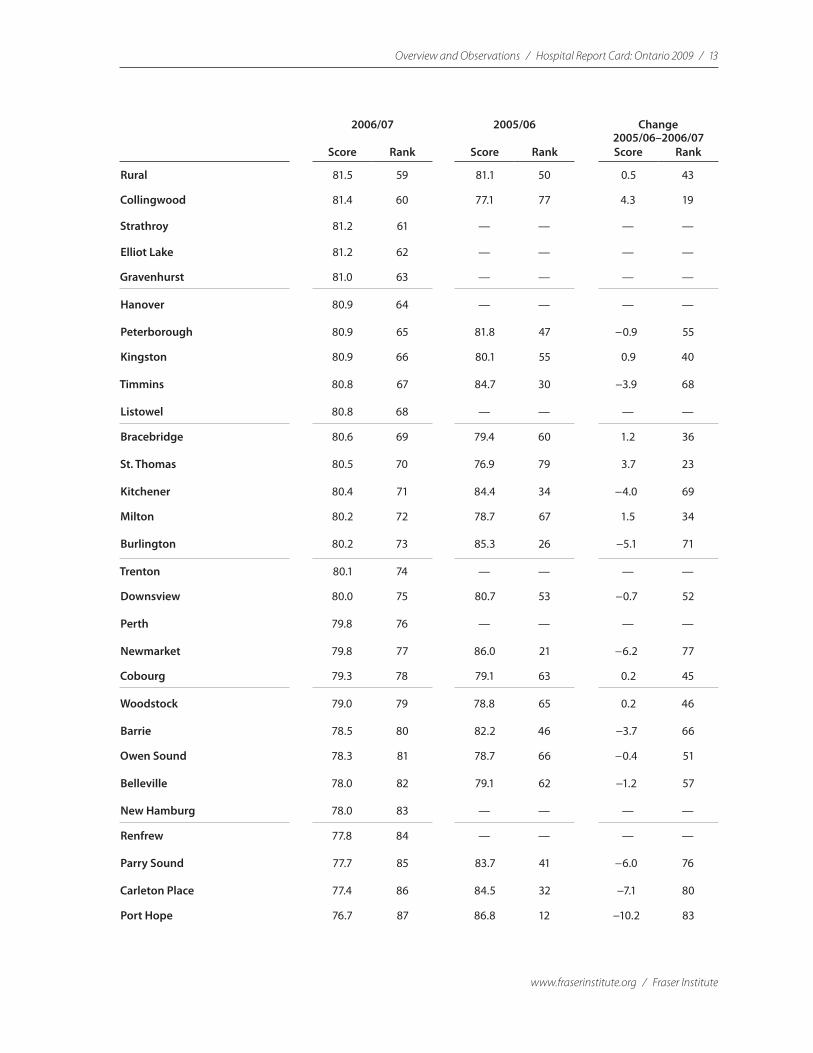
2006/07 2005/06 Change 2005/06–2006/07
Score Rank Score Rank Score Rank
Rural 81.5 59 81.1 50 0.5 43
Collingwood 81.4 60 77.1 77 4.3 19
Strathroy 81.2 61 — — — —
Elliot Lake 81.2 62 — — — —
Gravenhurst 81.0 63 — — — —
Hanover 80.9 64 — — — —
Peterborough 80.9 65 81.8 47 −0.9 55
Kingston 80.9 66 80.1 55 0.9 40
Timmins 80.8 67 84.7 30 −3.9 68
Listowel 80.8 68 — — — —
Bracebridge 80.6 69 79.4 60 1.2 36
St. Thomas 80.5 70 76.9 79 3.7 23
Kitchener 80.4 71 84.4 34 −4.0 69
Milton 80.2 72 78.7 67 1.5 34
Burlington 80.2 73 85.3 26 −5.1 71
Trenton 80.1 74 — — — —
Downsview 80.0 75 80.7 53 −0.7 52
Perth 79.8 76 — — — —
Newmarket 79.8 77 86.0 21 −6.2 77
Cobourg 79.3 78 79.1 63 0.2 45
Woodstock 79.0 79 78.8 65 0.2 46
Barrie 78.5 80 82.2 46 −3.7 66
Owen Sound 78.3 81 78.7 66 −0.4 51
Belleville 78.0 82 79.1 62 −1.2 57
New Hamburg 78.0 83 — — — —
Renfrew 77.8 84 — — — —
Parry Sound 77.7 85 83.7 41 −6.0 76
Carleton Place 77.4 86 84.5 32 −7.1 80
Port Hope 76.7 87 86.8 12 −10.2 83
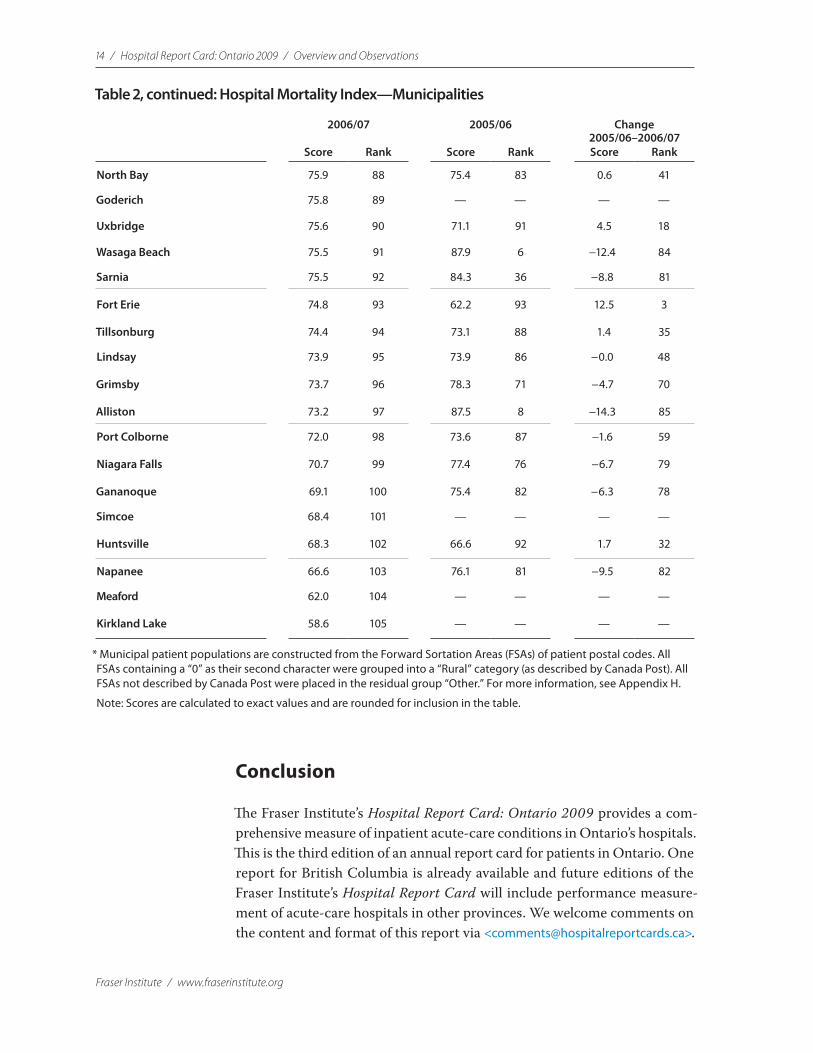
14 / Hospital Report Card: Ontario 2009 / Overview and Observations
Fraser Institute / www.fraserinstitute.org
Conclusion
The Fraser Institute’s Hospital Report Card: Ontario 2009 provides a com-prehensive measure of inpatient acute-care conditions in Ontario’s hospitals. This is the third edition of an annual report card for patients in Ontario. One report for British Columbia is already available and future editions of the Fraser Institute’s Hospital Report Card will include performance measure-ment of acute-care hospitals in other provinces. We welcome comments on the content and format of this report via <[email protected]>.
2006/07 2005/06 Change 2005/06–2006/07
Score Rank Score Rank Score Rank
North Bay 75.9 88 75.4 83 0.6 41
Goderich 75.8 89 — — — —
Uxbridge 75.6 90 71.1 91 4.5 18
Wasaga Beach 75.5 91 87.9 6 −12.4 84
Sarnia 75.5 92 84.3 36 −8.8 81
Fort Erie 74.8 93 62.2 93 12.5 3
Tillsonburg 74.4 94 73.1 88 1.4 35
Lindsay 73.9 95 73.9 86 −0.0 48
Grimsby 73.7 96 78.3 71 −4.7 70
Alliston 73.2 97 87.5 8 −14.3 85
Port Colborne 72.0 98 73.6 87 −1.6 59
Niagara Falls 70.7 99 77.4 76 −6.7 79
Gananoque 69.1 100 75.4 82 −6.3 78
Simcoe 68.4 101 — — — —
Huntsville 68.3 102 66.6 92 1.7 32
Napanee 66.6 103 76.1 81 −9.5 82
Meaford 62.0 104 — — — —
Kirkland Lake 58.6 105 — — — —
* Municipal patient populations are constructed from the Forward Sortation Areas (FSAs) of patient postal codes. All FSAs containing a “0” as their second character were grouped into a “Rural” category (as described by Canada Post). All FSAs not described by Canada Post were placed in the residual group “Other.” For more information, see Appendix H.
Note: Scores are calculated to exact values and are rounded for inclusion in the table.
Table 2, continued: Hospital Mortality Index—Municipalities
Overview and Observations / Hospital Report Card: Ontario 2009 / 15
www.fraserinstitute.org / Fraser Institute
Introduction and background
The goal of the Fraser Institute’s Hospital Report Card: Ontario 2009 is to contribute to the improvement of inpatient care in Ontario by providing hospital-specific information about quality of service directly to patients and to the general public. This series was the first in Canada to empower patients to make informed choices about their health care delivery options by pro-viding comparable, hospital-specific, performance measurements on clearly identified indicators. The Fraser Institute’s Hospital Report Card: Ontario 2009 has been published to promote accountability within hospitals, thereby stimulating improved performance through an independent and objective measurement of performance.
In Canada, individuals have access to data identifying problem areas in an automobile from information willingly supplied by consumers, the vehi-cle’s manufacturer, and industry experts. They can find which CD player is the best on the market for their needs. They can compare restaurants before heading out for an evening meal. Yet when it comes to health care, which many will consider more important for an individual’s well being, consumers are left with remarkably little information about where the best services are available. They cannot even tell which hospitals offer the worst care or have the highest mortality rates (Esmail, 2003).
What Are Hospital Report Cards?
Hospital report cards provide a set of consistent performance measure-ments to rank the services in question and give consumers the information they need to make a more informed choice.1 In some cases, these indica-tors may be subjective, based on the opinions of survey respondents. In other cases, the indicators will be objective measures of performance or outcomes.
Hospital report cards are used to measure specific practices in hos-pitals such as the application of a specific drug or technology to certain events; or performance with respect to access to care or consumer sat-isfaction; or to measure the likelihood of a positive or negative outcome provided by health facilities in a specific jurisdiction.
1 See Kessler, 2003 for a helpful delineation of the field.
16 / Hospital Report Card: Ontario 2009 / Overview and Observations
Fraser Institute / www.fraserinstitute.org
The Four Primary Types of Hospital Report Cards
1 Process Report CardsThis type of report card describes the inputs used by hospitals, health plans, or individual physicians in the course of treating their patients. An example of these types of report cards can be found in those commissioned by The Leapfrog Group <http://www.leapfroggroup.org/>. The primary strength of a process report card is that it can be developed from existing medical admin-istrative databases with relative ease. The process report card, however, does not necessarily measure the appropriateness, the quality, or the importance of the inputs employed in ensuring good health, although these factors can be captured to some extent by the inclusion or exclusion of specific inputs.
2 Survey Report CardsThis type of report card is composed of patients’ evaluations of their qual-ity of care and/or customer service. An example of this type of report card is found in the California HealthCare Foundation’s ratings <http://www. calhospitalcompare.org/>. Although survey-based report cards do provide valuable information on subjective areas of patient care, they cannot measure how treatment decisions by a doctor or hospital lead to objective improve-ments in patient care.
3 Outcomes Report CardsThese report cards present average levels of adverse health outcomes based on mortality or complication rates experienced by patients as part of a health plan, as treated by a specific doctor, or in a specific hospital. An example of this type of report card can be found in the Pennsylvania CABG sur-gery reports <http://www.phc4.org/reports/cabg/>. These report cards provide objective measures of differences in the quality of care but are susceptible to being “gamed” by either doctors or hospitals. For example, the doctor or hospital may avoid exceptionally sick patients (that is, patients who are quali-tatively more ill with a listed condition and who will consequently drag aver-age results down) in favor of healthier patients (to skew results upward). This unintended effect can, however, be mitigated through the appropriate appli-cation of risk-adjustment in the measures. Outcomes report cards (including the Fraser Institute’s Hospital Report Cards) provide the most empirically sound basis for analyzing the quality of care.
4 Balanced ScorecardsThe balanced scorecard was developed in the early 1990s by Robert Kaplan and David Norton to examine a business above and beyond the financial bot-tom line. Translated into the healthcare field, this results in four quadrants. In the case of the Ontario Hospital Reports series, a prime example of the
Overview and Observations / Hospital Report Card: Ontario 2009 / 17
www.fraserinstitute.org / Fraser Institute
use of a balanced scorecard, these are [a] financial performance and con-ditions; [b] patient/client satisfaction; [c] clinical utilization and outcomes; and, [d] system integration and change. While this variant of report card is useful in determining the broadest view of a hospital’s operations and func-tions, specific and relevant indicators regarding hospital performance may be overlooked.
Why Are Hospital Report Cards Published?
Hospital report cards are published to provide outcomes data that can both improve the quality of care in hospitals and inform patients’ healthcare deci-sion-making. Armed with more information based on a set of repeatable measurements about the relative performance of caregivers, both patients and physicians are able to make a more informed choice about which facility or provider to select for a given condition. This allows for a rational discussion of relative levels of quality and eliminates measurement based on anecdotal information, which can be misleading and ultimately harmful.
Where Are Hospital Report Cards Published?
The United States of AmericaThe United States was one of the first nations to begin measuring, compar-ing, and publishing measurements of hospital performance. Hospital report card initiatives were first undertaken by the federal government, with state governments following its lead. Private-sector information providers offering several competing reports on the quality of health care providers have refined the reporting of information. In 1987, the first US hospital report cards were published by the Health Care Financing Administration (HCFA), the federal agency that administers Medicare and Medicaid. These reports gave detailed annual mortality rates that were measured from the records of hospitalized Medicare patients. However, because of extensive criticism of the accuracy, usefulness, and interpretability of the HCFA’s mortality data, this initiative was withdrawn in 1993 (Berwick and Wald, 1990).
In the late 1980s, the state of New York began the Cardiac Surgery Reporting System (CSRS), which collected data from patients’ medical his-tories and recorded whether they died in hospital following surgery. From these data, New York was able to report detailed physician-specific statistics. While the information contained in the CSRS was not originally intended to provide the public with information about the performance of their provider, the news media understood the public’s desire for such data and saw the ben-efit in publishing the information. In December of 1990, the New York Times
18 / Hospital Report Card: Ontario 2009 / Overview and Observations
Fraser Institute / www.fraserinstitute.org
used this information to publish a list of local hospitals, which ranked facili-ties according to their mortality rates for Coronary Artery Bypass Surgery (CABG). Invoking the Freedom of Information Act, the New York Newsday sued the New York State Department of Health to obtain access to its data-base on bypass surgery and on cardiac surgeons. The goal was to publish physician-specific death rates for patients. The Supreme Court of New York ruled that it was in the public’s best interests to have access to these mortality data in order to make informed decisions about their health care (Zinman, 1991). As a result, Newsday was able to publish the information on physicians’ performance for citizens to assess where the best care was available. Driven by this development, the New York State Department of Health began pub-lishing annual editions of the Coronary Artery Bypass Surgery Report in 1996 (New York State, Department of Health, 2005).
Following the precedent set by this pioneering case, a wide variety of hospital performance reports began to be produced in the 1990s by a disparate group that includes the news media, coalitions of large employers, consumer advocacy organizations, and state governments (Marshall et al., 2003). More recently, the US Centers for Medicare and Medicaid Services released mortality-rate estimates for heart attack, heart failure, and pneumo-nia for every US hospital over two years alongside other measures of hospital performance (Sternberg and DeBarros, 2008). Development of reports in the United States has taken many different paths so there is currently no “stan-dardized” hospital report card or agreement on the indicators to measure. Furthermore, reports range widely in terms of both quality and comprehen-siveness. Indeed, as Marshall and colleagues cheekily note: “Public reporting in the United States is now much like healthcare delivery in that country: It is diverse, is primarily market-based, and lacks an overarching organiza-tional structure or strategic plan. Public reporting systems vary in what they measure, how they measure it and how (and to whom) it is reported” (2003: 136). Of course, for patients who are the beneficiaries of such competition between information providers, each of whom strives to deliver a product in some way superior to his competitors, this is no bad thing.
Examples of American Private and Public Information Providers
•Hospital Compare <hospitalcompare.hhs.gov>
•America’s Best Hospitals —USNEWS & World Report <http://www.usnews.com>
•Healthgrades <http://www.healthgrades.com>
•The Leapfrog Group <http://www.leapfroggroup.org>
•National Committee for Quality Assurance (NCQA) <http://www.ncqa.org>
•National Quality Forum <http://www.qualityforum.org>

Overview and Observations / Hospital Report Card: Ontario 2009 / 19
www.fraserinstitute.org / Fraser Institute
•Quality Check <http://www.jointcommission.org/PerformanceMeasurement/PerformanceMeasurement/>
•Cardiac Surgery in New Jersey <http://www.state.nj.us/health/reportcards.htm>
•Cardiac Surgery Reports <http://www.health.state.ny.us/nysdoh/healthinfo/index.htm>
•Pennsylvania Hospital Performance Reports <http://www.phc4.org>
•Indicators of Inpatient Care in New York Hospitals <http://www.myhealthfinder.com/newyork>
•Indicators of Inpatient Care in Texas Hospitals <http://www.dshs.state.tx.us/thcic/>
•Maryland Hospital Performance Evaluation Guide <http://mhcc.maryland.gov/consumerinfo/hospitalguide/index.htm>
•California HealthCare Foundation <http://www.calhospitalcompare.org/>.
United KingdomThe hospital reporting universe in the United Kingdom is a fraction of the US market’s size. League tables2 of death rates for English hospitals were avail-able from 1992 to 1996 (Leyland and Boddy, 1998) and mortality statistics for English hospitals were published by the national government in 1998. Although publicly released, these were intended for managerial use and had little discernible impact (Street, 2002). The first initiative designed for public consumption was the Patient’s Charter (National Health Service, 1991), which focused on waiting times as opposed to clinical quality.
In 1998, the National Health Service (NHS, Britain’s tax-funded, uni-versal medical-insurance program) adopted a new Performance Assessment Framework (PAF) to report clinical outcomes at the hospital level (London Department of Health, 1998). It focused on health gain, fair access, effec-tive delivery of services, efficient delivery of services, health outcomes, and patient/career experience. This initiative received prominence in 2001 as the NHS became the first government plan in the developed world to deal explic-itly with report cards. Beginning in September 2001, the UK Department of Health began to publish a new rating system for all NHS non-specialist hos-pitals in England. The performance of hospitals included in this survey was classified into one of four categories, ranging from zero to three stars based on the hospital’s performance on a range of indicators and the outcome of their clinical governance review by the Commission for Health Improvement (CHI). As an additional incentive for improvement, beyond that assumed to come with public reporting of performance, the Department of Health man-dated that hospitals scoring at the high end of the scale would receive greater
2 A league table ranks the performance of a range of institutions.
20 / Hospital Report Card: Ontario 2009 / Overview and Observations
Fraser Institute / www.fraserinstitute.org
funding and autonomy, while those at the bottom of the scale would be sub-ject to greater government oversight and intervention. For example, those receiving zero stars were subject to investigations and underwent changes in management where necessary.
Although the lion’s share of reporting in Britain has been by and at the direction of government, an independent initiative entered the arena in the latter half of 2000 when Tim Kelsey and Jake Arnold-Forster, a pair of Sunday Times journalists, founded Dr. Foster to generate authoritative independent information about local health services on the web at <http://www.drfosterintelligence.co.uk/>. The partnership is in the form of a 50/50 joint venture involving the new Health and Social Care Information Centre (a special health authority of the NHS) and Dr. Foster, a commercial provider of healthcare information. Numerous publications have emerged from this ini-tiative including the Good Birth Guide and the annual Good Hospital Guide, which was first published in 2001 and continues to be published annually. These guides contain information about hospital-specific mortality rates; the total number of staff; wait times; numbers of complaints; as well as, uniquely, private hospitals’ prices for services.
CanadaIn Canada, as in the United States and the United Kingdom, hospital report-ing initiatives have emerged only recently. In 1998, the Ontario Hospital Association produced a report card comparing the hospitals covered by its organization. Undertaken by a research group at the University of Toronto, the publication focused upon inpatient acute care and reported results at both peer group and regional levels of aggregation, but not for individual facili-ties. Hospital Report ’99, published the following year, saw the first reporting of hospital-specific acute-care hospital performance indicators in Canada. In 2000, the Government of Ontario joined as a partner in the enterprise and the scope of the report was expanded to include such areas as complex continuing care, mental health, rehabilitation, and emergency department care. In addition, specific reports dealing with women’s health, the health of the population as a whole, and nursing care were also produced. These pub-lications have since appeared annually. The Hospital Report Series (see, e.g., Ontario Hospital Association and the Government of Ontario: 2006, 2007) appears in a “balanced scorecard” format and assesses the performance of hospitals in four quadrants including (as noted above): [a] financial perfor-mance and conditions; [b] patient/client satisfaction; [c] clinical utilization and outcomes; and [d] system integration and change.
Other notable reporting initiatives in Canada include CIHI’s Hospital Standardized Mortality Ratio (HSMR) (discussed below), Healthcare Performance Measurement in Canada: Who’s Doing What? (Baker et al., 1998), Quality of Cardiac Care in Ontario (CCORT, 2004) and The State of Hospital
Overview and Observations / Hospital Report Card: Ontario 2009 / 21
www.fraserinstitute.org / Fraser Institute
Care in the GTA/905 (GTA/905 Healthcare Alliance, 2005). Additionally, two publications that have reported on patient safety and adverse events are the Ottawa Hospital Patient Safety Study (Forster et al., 2004) and The Canadian Adverse Events Study (Baker et al., 2004), though neither reported institution-specific measures. Similarly, the Manitoba Center for Health Policy released an in-hospital patient safety report using the AHRQ Patient Safety Indicators (Bruce et al., 2006). Additionally, for the last 17 years, the Fraser Institute has published Waiting Your Turn: Hospital Waiting lists in Canada, a report that provides Canada’s only national, comparable, and comprehensive mea-surement of waiting times for medically necessary treatment (Esmail and Hazel with Walker, 2008). Another initiative of the Fraser Institute is How Good is Canadian Health Care? An International Comparison of Health Care Systems (Esmail and Walker, 2008), which compares Canada’s health policies and healthcare performance with other nations that guarantee their citizens access to healthcare insurance.
Other avenues for reporting and monitoring hospital performance in Canada have largely been in the form of private assessments of hospital performance by a contracted third party using a proprietary methodology. A prime example of this is the work done by the Hay Group in rating the performance of participating Ontario hospitals for a fixed fee per facility (Hay Group, 2005).
Hospital Standardized Mortality Ratio (HSMR)The Canadian Institute for Health Information (CIHI) has published its own measure of hospital and regional performances, the Hospital Standardized Mortality Ratio (HSMR), since 2007. While both the CIHI’s measure and the Hospital Report Card: Ontario 2009 use data from the CIHI’s Discharge Abstract Database, there are several significant differences between the mea-sure published by the CIHI and those published by the Fraser Institute. These differences make comparisons between the two reports difficult and lead to the conclusion that the CIHI and the Hospital Report Card: Ontario 2009 are measuring mortality in two very different ways.
The most significant difference between the measures published by the Fraser Institute and those published by the CIHI is the level of detail available. According to the CIHI’s report, the Hospital Standardized Mortality Ratio (HSMR) is a “big dot summary” measure (CIHI, 2007: 4), or a measure that
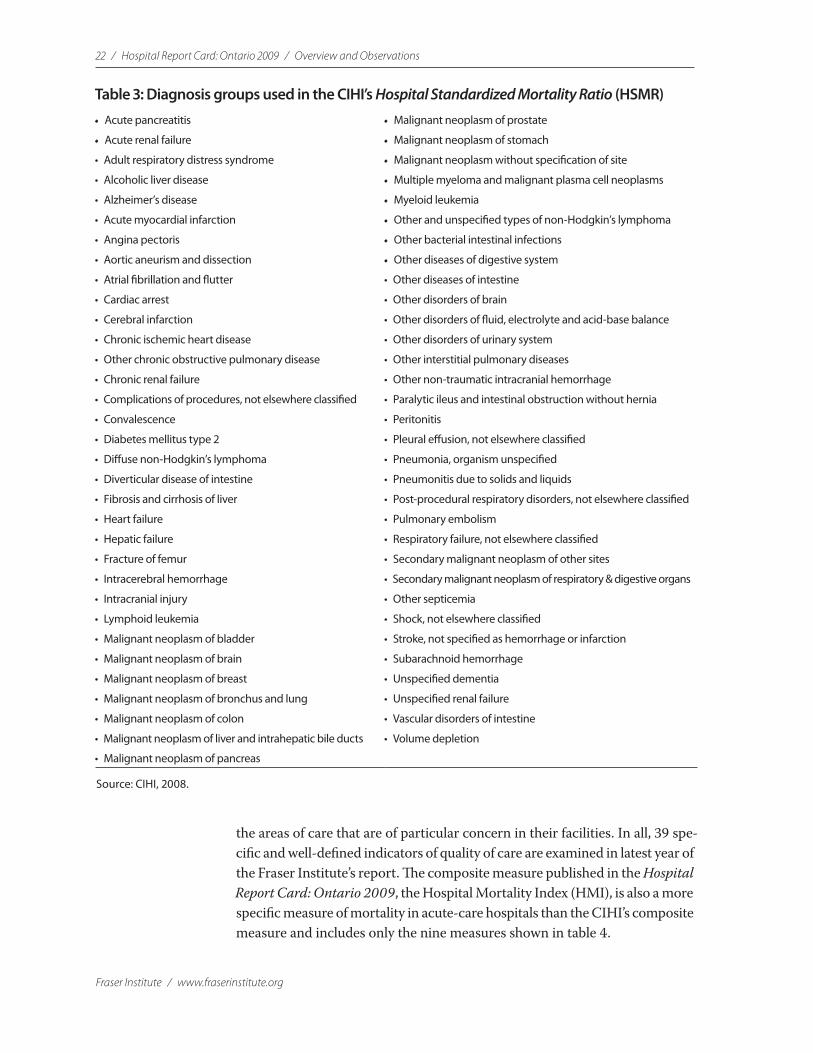
“tracks progress on broad outcomes at a system level” (2007: vii). More spe-cifically, the HSMR is a composite measure of mortality in diagnosis groups that comprise 80% of all deaths in acute-care facilities (see table 3).
By comparison, the measures published in the Hospital Report Card: Ontario 2009 allow for the examination of hospital performance in specific and detailed areas, thus providing patients with a greater level of information about their particular interest or diagnosis and allowing providers greater insight into
22 / Hospital Report Card: Ontario 2009 / Overview and Observations
Fraser Institute / www.fraserinstitute.org
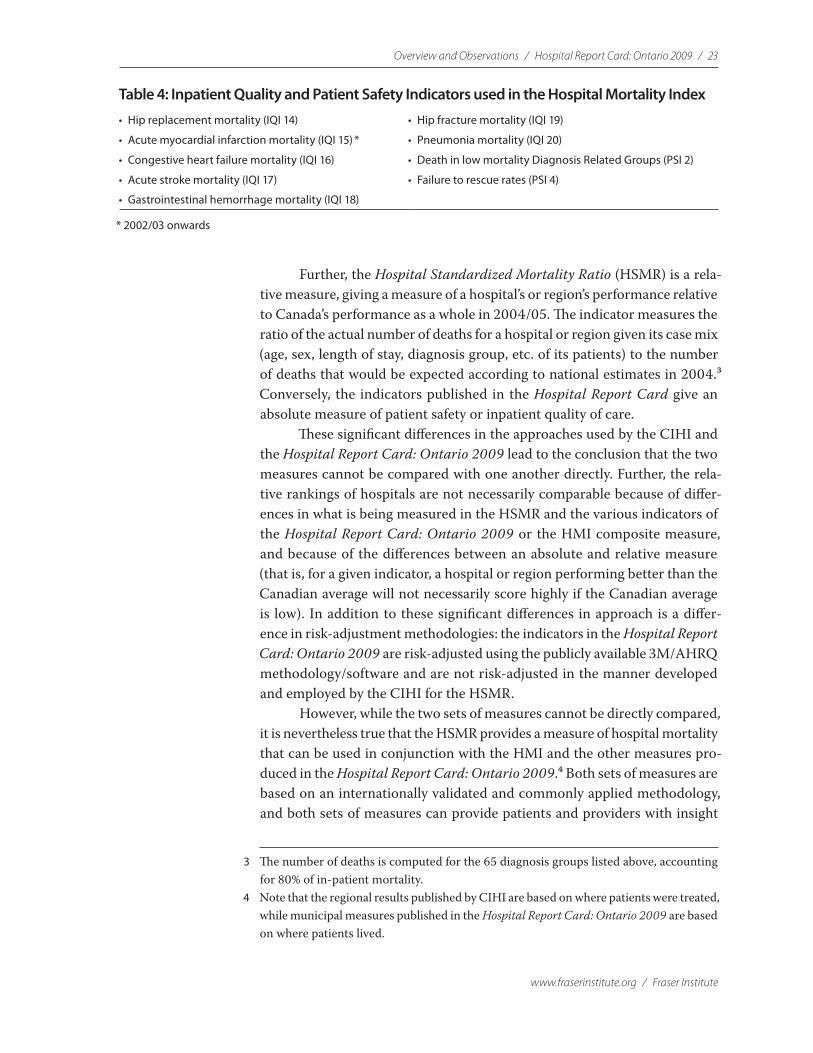
the areas of care that are of particular concern in their facilities. In all, 39 spe-cific and well-defined indicators of quality of care are examined in latest year of the Fraser Institute’s report. The composite measure published in the Hospital Report Card: Ontario 2009, the Hospital Mortality Index (HMI), is also a more specific measure of mortality in acute-care hospitals than the CIHI’s composite measure and includes only the nine measures shown in table 4.
Table 3: Diagnosis groups used in the CIHI’s Hospital Standardized Mortality Ratio (HSMR)
• Acute pancreatitis • Malignant neoplasm of prostate
• Acute renal failure • Malignant neoplasm of stomach
• Adult respiratory distress syndrome • Malignant neoplasm without specification of site
• Alcoholic liver disease • Multiple myeloma and malignant plasma cell neoplasms
• Alzheimer’s disease • Myeloid leukemia
• Acute myocardial infarction • Other and unspecified types of non-Hodgkin’s lymphoma
• Angina pectoris • Other bacterial intestinal infections
• Aortic aneurism and dissection • Other diseases of digestive system
• Atrial fibrillation and flutter • Other diseases of intestine
• Cardiac arrest • Other disorders of brain
• Cerebral infarction • Other disorders of fluid, electrolyte and acid-base balance
• Chronic ischemic heart disease • Other disorders of urinary system
• Other chronic obstructive pulmonary disease • Other interstitial pulmonary diseases
• Chronic renal failure • Other non-traumatic intracranial hemorrhage
• Complications of procedures, not elsewhere classified • Paralytic ileus and intestinal obstruction without hernia
• Convalescence • Peritonitis
• Diabetes mellitus type 2 • Pleural effusion, not elsewhere classified
• Diffuse non-Hodgkin’s lymphoma • Pneumonia, organism unspecified
• Diverticular disease of intestine • Pneumonitis due to solids and liquids
• Fibrosis and cirrhosis of liver • Post-procedural respiratory disorders, not elsewhere classified
• Heart failure • Pulmonary embolism
• Hepatic failure • Respiratory failure, not elsewhere classified
• Fracture of femur • Secondary malignant neoplasm of other sites
• Intracerebral hemorrhage • Secondary malignant neoplasm of respiratory & digestive organs
• Intracranial injury • Other septicemia
• Lymphoid leukemia • Shock, not elsewhere classified
• Malignant neoplasm of bladder • Stroke, not specified as hemorrhage or infarction
• Malignant neoplasm of brain • Subarachnoid hemorrhage
• Malignant neoplasm of breast • Unspecified dementia
• Malignant neoplasm of bronchus and lung • Unspecified renal failure
• Malignant neoplasm of colon • Vascular disorders of intestine
• Malignant neoplasm of liver and intrahepatic bile ducts • Volume depletion
• Malignant neoplasm of pancreas
Source: CIHI, 2008.
Overview and Observations / Hospital Report Card: Ontario 2009 / 23
www.fraserinstitute.org / Fraser Institute
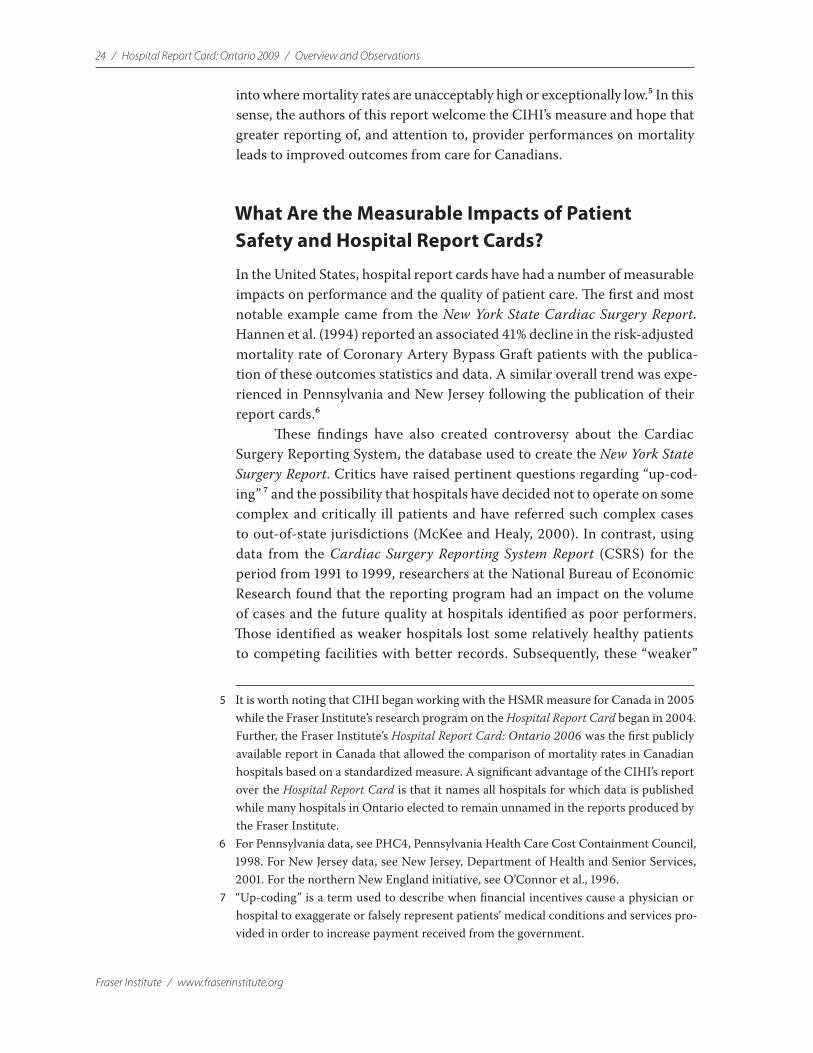
Further, the Hospital Standardized Mortality Ratio (HSMR) is a rela-tive measure, giving a measure of a hospital’s or region’s performance relative to Canada’s performance as a whole in 2004/05. The indicator measures the ratio of the actual number of deaths for a hospital or region given its case mix (age, sex, length of stay, diagnosis group, etc. of its patients) to the number of deaths that would be expected according to national estimates in 2004.3 Conversely, the indicators published in the Hospital Report Card give an absolute measure of patient safety or inpatient quality of care.
These significant differences in the approaches used by the CIHI and the Hospital Report Card: Ontario 2009 lead to the conclusion that the two measures cannot be compared with one another directly. Further, the rela-tive rankings of hospitals are not necessarily comparable because of differ-ences in what is being measured in the HSMR and the various indicators of the Hospital Report Card: Ontario 2009 or the HMI composite measure, and because of the differences between an absolute and relative measure (that is, for a given indicator, a hospital or region performing better than the Canadian average will not necessarily score highly if the Canadian average is low). In addition to these significant differences in approach is a differ-ence in risk-adjustment methodologies: the indicators in the Hospital Report Card: Ontario 2009 are risk-adjusted using the publicly available 3M/AHRQ methodology/software and are not risk-adjusted in the manner developed and employed by the CIHI for the HSMR.
However, while the two sets of measures cannot be directly compared, it is nevertheless true that the HSMR provides a measure of hospital mortality that can be used in conjunction with the HMI and the other measures pro-duced in the Hospital Report Card: Ontario 2009.4 Both sets of measures are based on an internationally validated and commonly applied methodology, and both sets of measures can provide patients and providers with insight
3 The number of deaths is computed for the 65 diagnosis groups listed above, accounting for 80% of in-patient mortality.
4 Note that the regional results published by CIHI are based on where patients were treated, while municipal measures published in the Hospital Report Card: Ontario 2009 are based on where patients lived.
Table 4: Inpatient Quality and Patient Safety Indicators used in the Hospital Mortality Index
• Hip replacement mortality (IQI 14) • Hip fracture mortality (IQI 19)
• Acute myocardial infarction mortality (IQI 15) * • Pneumonia mortality (IQI 20)
• Congestive heart failure mortality (IQI 16) • Death in low mortality Diagnosis Related Groups (PSI 2)
• Acute stroke mortality (IQI 17) • Failure to rescue rates (PSI 4)
• Gastrointestinal hemorrhage mortality (IQI 18)
* 2002/03 onwards
24 / Hospital Report Card: Ontario 2009 / Overview and Observations
Fraser Institute / www.fraserinstitute.org
into where mortality rates are unacceptably high or exceptionally low.5 In this sense, the authors of this report welcome the CIHI’s measure and hope that greater reporting of, and attention to, provider performances on mortality leads to improved outcomes from care for Canadians.
What Are the Measurable Impacts of Patient Safety and Hospital Report Cards?
In the United States, hospital report cards have had a number of measurable impacts on performance and the quality of patient care. The first and most notable example came from the New York State Cardiac Surgery Report. Hannen et al. (1994) reported an associated 41% decline in the risk-adjusted mortality rate of Coronary Artery Bypass Graft patients with the publica-tion of these outcomes statistics and data. A similar overall trend was expe-rienced in Pennsylvania and New Jersey following the publication of their report cards.6
These findings have also created controversy about the Cardiac Surgery Reporting System, the database used to create the New York State Surgery Report. Critics have raised pertinent questions regarding “up-cod-ing” 7 and the possibility that hospitals have decided not to operate on some complex and critically ill patients and have referred such complex cases to out-of-state jurisdictions (McKee and Healy, 2000). In contrast, using data from the Cardiac Surgery Reporting System Report (CSRS) for the period from 1991 to 1999, researchers at the National Bureau of Economic Research found that the reporting program had an impact on the volume of cases and the future quality at hospitals identified as poor performers. Those identified as weaker hospitals lost some relatively healthy patients to competing facilities with better records. Subsequently, these “weaker”
5 It is worth noting that CIHI began working with the HSMR measure for Canada in 2005 while the Fraser Institute’s research program on the Hospital Report Card began in 2004. Further, the Fraser Institute’s Hospital Report Card: Ontario 2006 was the first publicly available report in Canada that allowed the comparison of mortality rates in Canadian hospitals based on a standardized measure. A significant advantage of the CIHI’s report over the Hospital Report Card is that it names all hospitals for which data is published while many hospitals in Ontario elected to remain unnamed in the reports produced by the Fraser Institute.
6 For Pennsylvania data, see PHC4, Pennsylvania Health Care Cost Containment Council, 1998. For New Jersey data, see New Jersey, Department of Health and Senior Services, 2001. For the northern New England initiative, see O’Connor et al., 1996.
7 “Up-coding” is a term used to describe when financial incentives cause a physician or hospital to exaggerate or falsely represent patients’ medical conditions and services pro-vided in order to increase payment received from the government.

Overview and Observations / Hospital Report Card: Ontario 2009 / 25
www.fraserinstitute.org / Fraser Institute
hospitals experienced a decline of 10% in the number of patients during the first 12 months after an initial report and this decrease remained in place for three years. Consequently, patients choosing these hospitals demonstrated a decrease in their risk-adjusted mortality rate by approximately 1.2 percent-age points (Cutler et al., 2004).
Though subject to a number of caveats regarding their design and structure, report cards have had a beneficial impact on the quality of health care delivery in those regions where they are published.
The Fraser Institute’s Hospital Report Cards
The Fraser Institute’s Hospital Report Cards aim to provide a patient-friendly measurement of hospital care that is focused on clinical outcomes. This report includes information about all health facilities treating patients through the Ontario Health Insurance Program, 17 of which (out of a total of 136) are identified in the report.8 The report is built on a recognized methodology for constructing hospital report cards from the Agency for Healthcare Research & Quality (AHRQ), an agency of the US federal government’s Department of Health and Human Services.
1 What Are the AHRQ Inpatient Quality and Patient Safety Indicators?The first stage of the research in producing this report was to acquire or create a methodology that was reliable, easily understood by the public and participants, and that produced an accurate measurement of provider per-formance. An initial period of examining performance-indicator frameworks from earlier literature on hospital report cards provided a number of different examples of accepted and proven methodologies that were not otherwise proprietary information and thus could be employed by the Fraser Institute9 The search also turned up methodologies that, though available, would be less effective in providing a patient-friendly hospital report card focused on clinical outcomes.
Further examination of the methodologies available led to the selec-tion of the performance-indicator framework developed by the Agency for Healthcare Research & Quality (AHRQ). AHRQ’s indicator modules
8 These facilities voluntarily participated in this project. Other facilities in Ontario either declined or offered no response to our requests for participation/identification. Readers should note that the participation rate declined from 43 facilities in FY2004 to 30 facili-ties in FY2005 and 17 facilities in FY2006.
9 For an example of how some report-card methodologies are proprietary, please refer to the Healthgrades user agreement at <http://www.healthgrades.com/aboutus/index.cfm?fuseaction=modnw&modtype=content&modact=UserAgreement>.
26 / Hospital Report Card: Ontario 2009 / Overview and Observations
Fraser Institute / www.fraserinstitute.org
were chosen because they represent a comprehensive set of indictors that are widely used, highly regarded, and applicable to any hospital inpatient administrative data. They are readily available and relatively inexpensive to use. Importantly, they comprise an ideal set of indicators to allow a patient-friendly, clinical outcomes-focused, hospital-specific patient care report card.
The AHRQ indicators date from the mid-1990s when AHRQ devel-oped a set of quality measures, or indicators, that required only the informa-tion found in routine hospital administrative data: diagnoses and procedures codes, patient age, sex, other basic demographic and personal information, source of admission, and discharge status. These indicators, 33 in all, made up the Healthcare Cost and Utilization Project (HCUP) Quality Indicators, designed to be used by hospitals to assess their inpatient quality of care as well as by the State and community to assess access to primary care.10 Although they could not be used to provide definitive measures of the quality of health care directly, they are used to provide indicators of healthcare quality. They serve as the basis for subsequent in-depth investigation of issues of quality and patient safety at the facility level.
In the years following the release of the HCUP, both the knowledge base about quality indicators increased and newer risk-adjustment methods developed. Following input from then-current users, as well as advances in the specific indicators themselves, AHRQ underwrote a project to develop and refine the original Quality Indicators. This project was undertaken by the University of California San Francisco-Stanford Evidence-based Practice Centre. The results of this research were the AHRQ Quality Indicators, which are currently used to measure hospital performance in more than 12 US States including New York, Texas, Colorado, California, Florida, Kentucky, Maryland, Minnesota, New Jersey, Oregon, Utah, Vermont and parts of Wisconsin.
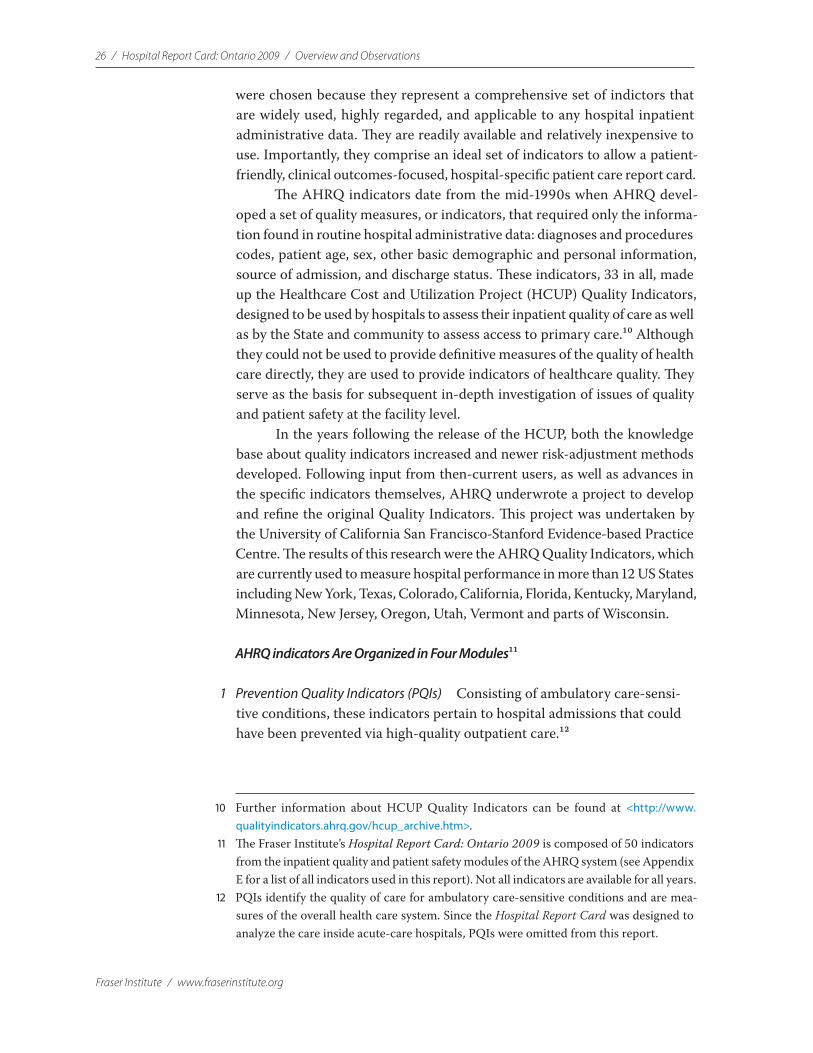
AHRQ indicators Are Organized in Four Modules11
1 Prevention Quality Indicators (PQIs) Consisting of ambulatory care-sensi-tive conditions, these indicators pertain to hospital admissions that could have been prevented via high-quality outpatient care.12
10 Further information about HCUP Quality Indicators can be found at <http://www.qualityindicators.ahrq.gov/hcup_archive.htm>.
11 The Fraser Institute’s Hospital Report Card: Ontario 2009 is composed of 50 indicators from the inpatient quality and patient safety modules of the AHRQ system (see Appendix E for a list of all indicators used in this report). Not all indicators are available for all years.
12 PQIs identify the quality of care for ambulatory care-sensitive conditions and are mea-sures of the overall health care system. Since the Hospital Report Card was designed to analyze the care inside acute-care hospitals, PQIs were omitted from this report.
Overview and Observations / Hospital Report Card: Ontario 2009 / 27
www.fraserinstitute.org / Fraser Institute
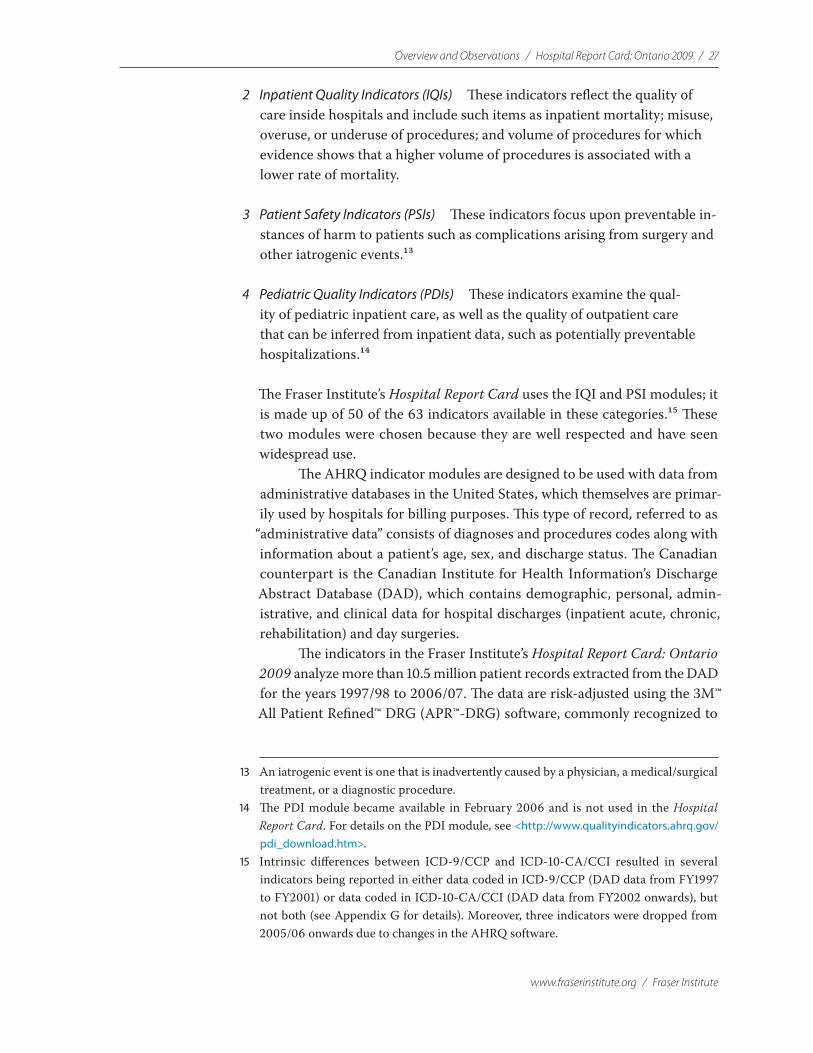
2 Inpatient Quality Indicators (IQIs) These indicators reflect the quality of care inside hospitals and include such items as inpatient mortality; misuse, overuse, or underuse of procedures; and volume of procedures for which evidence shows that a higher volume of procedures is associated with a lower rate of mortality.
3 Patient Safety Indicators (PSIs) These indicators focus upon preventable in-stances of harm to patients such as complications arising from surgery and other iatrogenic events.13
4 Pediatric Quality Indicators (PDIs) These indicators examine the qual-ity of pediatric inpatient care, as well as the quality of outpatient care that can be inferred from inpatient data, such as potentially preventable hospitalizations.14
The Fraser Institute’s Hospital Report Card uses the IQI and PSI modules; it is made up of 50 of the 63 indicators available in these categories.15 These two modules were chosen because they are well respected and have seen widespread use.
The AHRQ indicator modules are designed to be used with data from administrative databases in the United States, which themselves are primar-ily used by hospitals for billing purposes. This type of record, referred to as
“administrative data” consists of diagnoses and procedures codes along with information about a patient’s age, sex, and discharge status. The Canadian counterpart is the Canadian Institute for Health Information’s Discharge Abstract Database (DAD), which contains demographic, personal, admin-istrative, and clinical data for hospital discharges (inpatient acute, chronic, rehabilitation) and day surgeries.
The indicators in the Fraser Institute’s Hospital Report Card: Ontario 2009 analyze more than 10.5 million patient records extracted from the DAD for the years 1997/98 to 2006/07. The data are risk-adjusted using the 3M™ All Patient Refined™ DRG (APR™-DRG) software, commonly recognized to
13 An iatrogenic event is one that is inadvertently caused by a physician, a medical/surgical treatment, or a diagnostic procedure.
14 The PDI module became available in February 2006 and is not used in the Hospital Report Card. For details on the PDI module, see <http://www.qualityindicators.ahrq.gov/pdi_download.htm>.
15 Intrinsic differences between ICD-9/CCP and ICD-10-CA/CCI resulted in several indicators being reported in either data coded in ICD-9/CCP (DAD data from FY1997 to FY2001) or data coded in ICD-10-CA/CCI (DAD data from FY2002 onwards), but not both (see Appendix G for details). Moreover, three indicators were dropped from 2005/06 onwards due to changes in the AHRQ software.
28 / Hospital Report Card: Ontario 2009 / Overview and Observations
Fraser Institute / www.fraserinstitute.org
be the gold-standard system for risk-adjusting hospital data.16 The AHRQ QIs were designed to be used in conjunction with 3M™ All Patient Refined™ Diagnosis Related Groups (APR™-DRG) software, which risk adjusts the QIs for patients’ clinical conditions and severity of illness or risk of mortality. Indeed, the version of the APR-DRG software built into the AHRQ software was used for this report.
Since this report is based on administrative data, the results have limi-tations. Coding varies from hospital to hospital and codes do not always pro-vide specific details about a patient’s condition at the time of admission or capture all that occurs during hospitalization. For these reasons, individual judgment often is required while reviewing the results from this report.
When reviewing mortality or other measures of quality and patient safety, remember that medicine is not an exact science and death or com-plications will occur even when all standards of care are followed. Deciding on treatment options and choosing a hospital are decisions that should be made in consultation with a physician. It is not recommended that anyone choose a hospital based solely on statistics and descriptions such as those given in this report.
2 Data QualityCIHI’s Discharge Abstract Database (DAD) contains information on hos-pital stays in Canada. Various CIHI publications note that the DAD is used extensively by a variety of stakeholder groups to monitor the use of acute-care health services, conduct analyses of health conditions and injuries, and increasingly to track patient outcomes. The DAD is a major data source used to produce various CIHI reports, including annual reports on the perfor-mance of hospitals and the health care system and for seven of the health indicators adopted by the federal, provincial, and territorial governments (CIHI, 2002). These data have been used extensively in previous reports on health care performance and form the basis for many journal articles (see, e.g., Ontario Hospital Association and the Government of Ontario, 2007; Aubrey-Bassler et al., 2007).
As the Hospital Report 2006: Acute Care notes, using the same DAD data set underlying this report card, “the data are collected under consistent guidelines, by trained abstractors, in all acute care hospitals in Ontario. The data undergo extensive edit checks to improve accuracy, but all errors can-not be eliminated” (Ontario Hospital Association and the Government of Ontario, 2006: 6). However, in order to produce good information about data quality, CIHI established a comprehensive and systematic data-quality program, whose framework involves 24 characteristics relating to the five
16 For further details, please refer to Appendix B and <http://www.3m.com/us/healthcare/his/products/coding/refined_drg.jhtml>.

Overview and Observations / Hospital Report Card: Ontario 2009 / 29
www.fraserinstitute.org / Fraser Institute
data-quality dimensions of accuracy, timeliness, relevance, comparability, and usability. (CIHI, 2005)
There are a number of publications that have addressed data-quality issues, which are discussed in our report. Of note are CIHI’s reabstraction studies (2002, 2004b) that go back to the original patient charts and recode the information using a different set of expert coders.17 The reabstraction studies note the following rates of agreement between what was initially coded and what was coded on reabstraction:
a non-medical data: 96%–100%
b selection of intervention codes (procedure codes): 90%–95%
c selection of diagnosis codes: 83%–94%
d selection of most responsible diagnosis: 89%–92%
e typing of co-morbidities: pre-admit: 47%–69%; post-admit: 51%–69%
f diagnosis typing (which indicates the relationship of the diagnosis to the patient’s stay in hospital) continues to present a problem; discrepancy rates have not diminished with adoption of ICD-10-CA.
The coding issues in points (e) and (f ) do not affect our results since the most responsible diagnosis is coded with a high degree of agreement and the AHRQ indicators do not discriminate among diagnosis types. Overall, when the rates of agreement in the third year of this reabstraction study (performed on data coded in ICD-10-CA) were compared to the rates of agreement of the previous years’ data (coded in ICD-9/CCP), the rates were as good as, or better than, previous rates.
However, with regard to the coding of pneumonia, a potential issue with data quality exists because some coders selected pneumonia instead of chronic obstructive pulmonary disease (COPD) as the most responsible diagnosis (CIHI, 2004b). This could potentially create false positive results for Pneumonia mortality rate (IQI 20) since this indicator counts deaths due to pneumonia in situations where the primary diagnosis is a pneumonia diagnosis code.
17 Reabstractors participating in the study were required to have several years of coding experience, experience coding in ICD-10-CA and CCI in particular, experience coding at a tertiary care centre, and attendance at specific CIHI educational workshops. They were also required to attend a one-week training session and to receive a passing score on the inter-rater test.
30 / Hospital Report Card: Ontario 2009 / Overview and Observations
Fraser Institute / www.fraserinstitute.org
With respect to specific conditions related to the health indicators exam-ined, those that are procedure-driven (i.e. Cesarean section, coronary artery bypass graft, and total knee replacement) were coded well with low discrepancy rates. The following had less than a 5% rate of discrepancy: Cesarean section, coronary artery bypass graft, hysterectomy, total knee replacement, vaginal birth after Cesarean, and total hip replacement. The following had greater than a 5% discrepancy: AMI (8.9%), hip fracture (6.0%), hospitalization due to pneu-monia and influenza (6.9%), and injury hospitalization (5.3%) (CIHI, 2002).
Discrepancy rates were noted in conditions that are diagnosis driven: acute myocardial infarction (AMI) (CIHI, 2002: 8), stroke, pneumonia, and COPD (CIHI, 2004b) (as described above). Only the pneumonia codes are potentially affected in our report.
Overall, according to CIHI, findings from their three-year DAD reab-straction studies “have confirmed the strengths of the database, while identi-fying limitations in certain areas resulting from inconsistencies in the coding of some data elements” (CIHI, 2004b: 41). In addition, the findings from the inter-rater data (that is, comparison between reabstractors) were generally similar to the findings from the main study data (that is, comparison between original coder and reabstractor). This suggests that the database is coded as well as can be expected using existing approaches in the hospital system.
In addition to the aforementioned reabstraction studies, the OECD published a report in support of the AHRQ patient-safety indicator modules noting that “this set of measures represents an exciting development and their use should be tested in a variety of countries” (Millar, Mattke, et al., 2004: 12). Further, a recently released report by the Manitoba Center for Health Policy that used the AHRQ Patient Safety Indicators (Bruce et al., 2006) noted two important advantages to using the AHRQ module: The first advantage is the breadth of coverage offered by the indicators in studying in-hospital patient safety. The second is that the AHRQ patient-safety indicators were developed to measure complications of hospital-based care among a group of patients for whom the complications seemed preventable or highly unlikely.
3 Participation and identification of hospitalsParticipation in the report-card project was not mandatory for hospitals in Ontario. In the end, 17 out of 136 acute-care facilities (representing 5% of inpatient records) agreed to have their institution identified. The unidentified hospitals were assigned an arbitrary hospital number.
Overview and Observations / Hospital Report Card: Ontario 2009 / 31
www.fraserinstitute.org / Fraser Institute
Overview of methodology used
All hospital data used in the Fraser Institute’s Hospital Report Card: Ontario 2009 are from the Discharge Abstract Database (DAD) that was purchased from the Canadian Institute for Health Information (CIHI). The DAD is an administrative database containing demographic, administrative, and clini-cal data for hospital discharges (inpatient acute, chronic, rehabilitation) and day surgeries. Only inpatient acute records were used in this report (see Appendix A for details on which DAD data fields were used).
CIHI is unable to release the identity of specific institutions whose data is included in the DAD unless those institutions have explicitly granted per-mission to the researchers requesting the data. For 2006/07, only 17 acute-care hospitals (representing 54,867 inpatient records or 5% of records in Ontario in 2006/07) granted their authorization (see Appendix D for a list of participating institutions).1
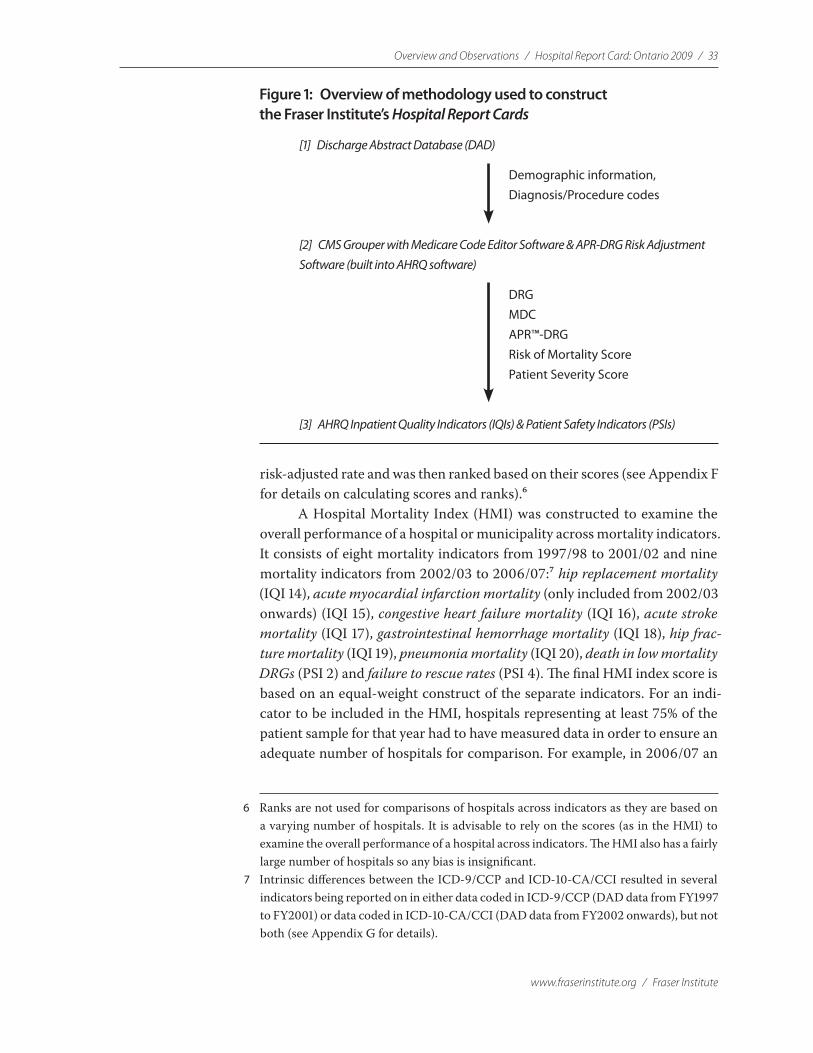
The inpatient acute records were grouped into diagnosis-related groups (DRGs) using the Centers for Medicare and Medicaid Services (CMS) Grouper with Medicare Code Editor software. The program sorts patients’ records into groups of patients who are expected to make simi-lar use of a hospital’s resources. The groupings are based on information extracted from diagnosis and procedure codes as well as the patients’ age, sex, and the presence of complications or co-morbidities (see Appendix B for details).2
Since more specialized hospitals may treat more high-risk patients and some patients arrive at hospitals sicker than others, it is difficult to compare hospital mortality rates for patients with the same condition but a different health status. In order to compensate for this possible difference in the mix of hospital cases, the international standard for risk adjustment,
1 For the years from 1997/98 to 2004/05, 43 of Ontario’s 136 acute-care hospitals (rep-resenting 457,409 inpatient records or 41% of inpatient records in Ontario in 2004/05) voluntarily granted the Fraser Institute authorization to identify their institution-specific discharge data in the DAD. The total number of patient records for the province during these years was 8,588,784. For 2005/06, only 30 acute-care hospitals (representing 54,316 inpatient records or 4.94% of records in Ontario in 2005/06) granted their authorization.
2 In order to use the Centers for Medicare and Medicaid Services (CMS) Grouper with Medicare Code Editor as well as the Agency for Healthcare Research and Quality (AHRQ) Inpatient Quality Indicators (IQI) and Patient Safety Indicators (PSI) modules, the diagnosis and proce-dure codes had to be translated from ICD-10-CA/CCI (ICD-10-CA is an enhanced version of ICD-10 developed by CIHI for morbidity classification in Canada; the companion classification to ICD-10-CA for coding procedures in Canada is CCI) to ICD-9-CM. See Appendix J for details.
32 / Hospital Report Card: Ontario 2009 / Overview and Observations
Fraser Institute / www.fraserinstitute.org
developed by 3M Corporation, was employed to risk-adjust the data. This was done to ensure that a hospital’s final score reflected the performance grading that the hospital would have received if it had provided services to patients with the average mix of medical complications.3
The final step in our methodology was to produce separate indica-tors for hospital performance based on the methodology developed by the Agency for Healthcare Research and Quality’s (AHRQ) Evidence-Based Practice Center (EPC) at the University of California San Francisco-Stanford.4 AHRQ’s indicator modules use readily available discharge data and were cho-sen because they have been demonstrated to be a concise and effective tool by which to inform patients’ decision-making about their health care. They are currently used to measure hospital performance in more than 12 US states including New York, Texas, Colorado, California, Florida, Kentucky, Maryland, Massachusetts, Minnesota, New Jersey, Oregon, Utah, Vermont and parts of Wisconsin.
Figure 1 shows a graphical representation of the methodology. The Fraser Institute’s Hospital Report Card: Ontario 2009 comprises 39 indi-cators of the quality of inpatient care and patient safety in 2006/07 (for a list of all indicators used in the report, see Appendix E).5 Inpatient Quality Indicators (IQIs) reflect the quality of care inside hospitals and include mor-tality rates, the utilization of procedures (where there are questions of mis-use, overuse, or underuse), and volume of procedures (for which evidence shows that a higher volume of procedures is associated with a lower rate of mortality). Patient Safety Indicators (PSIs) focus on preventable complica-tions acquired while in hospital, as well as adverse events following surgeries, procedures, and childbirth.
The indicators are expressed as observed rates (which are raw mea-sures) and risk-adjusted rates (incorporating patient severity and risk of mor-tality scores from the 3M™ software described above). IQI rates are expressed as rates per 100 patients while PSI rates are expressed per 1,000. Each insti-tution was also given a score from 0 to 100 for each indicator based on its
3 For information about 3M’s standard for risk adjustment, see <http://www.3m.com/us/healthcare/his/products/coding/refined_drg.jhtml>. See Appendix B for details of its use in this report.
4 The AHRQ Quality Indicators were developed in response to the need for both multi-dimensional and accessible quality indicators. They include a family of measures that patients, providers, policy makers, and researchers can use with easily accessible inpatient data to identify apparent variations in the quality of inpatient care. For more information, see <http://www.qualityindicators.ahrq.gov/>.
5 There are a total of 50 indicators in this report. Due to changes in diagnostic and proce-dural classifications, the availability of indicators varies across years. Forty-two indicators are reported for the period from 2002/03 to 2003/04. Due to changes in the AHRQ soft-ware, three indicators were dropped from 2005/06 onwards for a total of 39 indicators.
Overview and Observations / Hospital Report Card: Ontario 2009 / 33
www.fraserinstitute.org / Fraser Institute
risk-adjusted rate and was then ranked based on their scores (see Appendix F for details on calculating scores and ranks).6
A Hospital Mortality Index (HMI) was constructed to examine the overall performance of a hospital or municipality across mortality indicators. It consists of eight mortality indicators from 1997/98 to 2001/02 and nine mortality indicators from 2002/03 to 2006/07:7 hip replacement mortality (IQI 14), acute myocardial infarction mortality (only included from 2002/03 onwards) (IQI 15), congestive heart failure mortality (IQI 16), acute stroke mortality (IQI 17), gastrointestinal hemorrhage mortality (IQI 18), hip frac-ture mortality (IQI 19), pneumonia mortality (IQI 20), death in low mortality DRGs (PSI 2) and failure to rescue rates (PSI 4). The final HMI index score is based on an equal-weight construct of the separate indicators. For an indi-cator to be included in the HMI, hospitals representing at least 75% of the patient sample for that year had to have measured data in order to ensure an adequate number of hospitals for comparison. For example, in 2006/07 an
6 Ranks are not used for comparisons of hospitals across indicators as they are based on a varying number of hospitals. It is advisable to rely on the scores (as in the HMI) to examine the overall performance of a hospital across indicators. The HMI also has a fairly large number of hospitals so any bias is insignificant.
7 Intrinsic differences between the ICD-9/CCP and ICD-10-CA/CCI resulted in several indicators being reported on in either data coded in ICD-9/CCP (DAD data from FY1997 to FY2001) or data coded in ICD-10-CA/CCI (DAD data from FY2002 onwards), but not both (see Appendix G for details).
Figure 1: Overview of methodology used to construct the Fraser Institute’s Hospital Report Cards
[1] Discharge Abstract Database (DAD)
[2] CMS Grouper with Medicare Code Editor Software & APR-DRG Risk Adjustment Software (built into AHRQ software)
[3] AHRQ Inpatient Quality Indicators (IQIs) & Patient Safety Indicators (PSIs)
Demographic information, Diagnosis/Procedure codes
DRG MDC APR™-DRG Risk of Mortality Score Patient Severity Score
34 / Hospital Report Card: Ontario 2009 / Overview and Observations
Fraser Institute / www.fraserinstitute.org
indicator had to contain at least 806,412 records in order to be included in the HMI.8 All institutions were ranked based on their HMI score, where the highest rank (1) corresponds to the highest score out of 100 (for details on cal-culating scores, ranks, the HMI, and rank of the HMI, please see Appendix F).
Throughout the Hospital Report Card, several measures were taken in order to protect patients’ confidentiality. First, patient identifiers such as patients’ names and addresses were removed before the Fraser Institute had access to the dataset. Also, postal codes were truncated to Forward Sortation Areas (FSAs) and grouped into municipalities in order to assess and compare care received by patients from those jurisdictions (please see Appendix H for details). Furthermore, results were omitted from publication if the patient population in any given indicator was less than, or equal to, five in any insti-tution and/or municipality.
8 The total number of patient records in 2006/07 was 1,075,216.
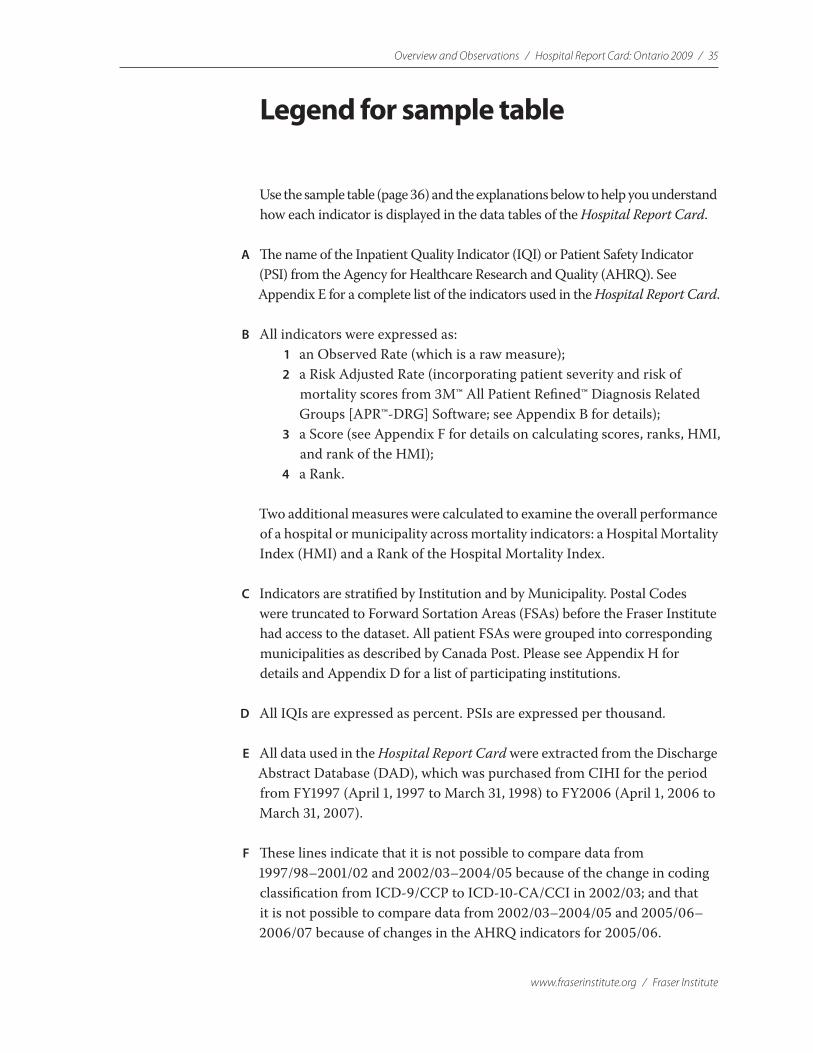
Overview and Observations / Hospital Report Card: Ontario 2009 / 35
www.fraserinstitute.org / Fraser Institute
Legend for sample table
Use the sample table (page 36) and the explanations below to help you understand how each indicator is displayed in the data tables of the Hospital Report Card.
A The name of the Inpatient Quality Indicator (IQI) or Patient Safety Indicator (PSI) from the Agency for Healthcare Research and Quality (AHRQ). See Appendix E for a complete list of the indicators used in the Hospital Report Card.
B All indicators were expressed as: 1 an Observed Rate (which is a raw measure); 2 a Risk Adjusted Rate (incorporating patient severity and risk of
mortality scores from 3M™ All Patient Refined™ Diagnosis Related Groups [APR™-DRG] Software; see Appendix B for details);
3 a Score (see Appendix F for details on calculating scores, ranks, HMI, and rank of the HMI);
4 a Rank.
Two additional measures were calculated to examine the overall performance of a hospital or municipality across mortality indicators: a Hospital Mortality Index (HMI) and a Rank of the Hospital Mortality Index.
C Indicators are stratified by Institution and by Municipality. Postal Codes were truncated to Forward Sortation Areas (FSAs) before the Fraser Institute had access to the dataset. All patient FSAs were grouped into corresponding municipalities as described by Canada Post. Please see Appendix H for details and Appendix D for a list of participating institutions.
D All IQIs are expressed as percent. PSIs are expressed per thousand.
E All data used in the Hospital Report Card were extracted from the Discharge Abstract Database (DAD), which was purchased from CIHI for the period from FY1997 (April 1, 1997 to March 31, 1998) to FY2006 (April 1, 2006 to March 31, 2007).
F These lines indicate that it is not possible to compare data from 1997/98–2001/02 and 2002/03–2004/05 because of the change in coding classification from ICD-9/CCP to ICD-10-CA/CCI in 2002/03; and that it is not possible to compare data from 2002/03–2004/05 and 2005/06–2006/07 because of changes in the AHRQ indicators for 2005/06.

36 / Hospital Report Card: Ontario 2009 / Overview and Observations
Fraser Institute / www.fraserinstitute.org
G “—“ indicates that either no data were available for that hospital for that year, that the institution did not exist in that year, or that the data were censored to protect patient confidentiality (when the denominator for a given indicator is 5 or less).
H Indicators were calculated for all of Ontario’s 136 acute-care hospitals. Seventeen hospitals agreed to participate in The Fraser Institute’s Hospital Report Card: Ontario 2009 (representing 5% of inpatient records in Ontario in 2006/07). Please see Appendix D for a list of participating institutions.
I The institution numbers from all acute-care hospitals that did not consent to be identified in the Hospital Report Card were encrypted by the Canadian Institute for Health Information (CIHI) prior to delivery. We assigned these institutions an arbitrary number.
J The average rate (Observed or Risk Adjusted) for all the acute-care hospitals in the province.
A B C D
J
H
I
Hospital 1997-1998 1998-1999 1999-2000 2000-2001 2001-2002 2002-2003 2003-2004 2004-2005 2005-2006 2006-2007Arnprior and District Memorial Hospital (The) 1.05 6.84 14.35 8.33 0.00 1.22 1.56 0.78 — 8.40 0.00Cambridge Memorial Hospita 4.17 1.05 0.00 2.28 3.17 3.08 4.03 1.66 — — —Carleton Place and District Memorial Hospita 2.47 2.17 2.15 2.31 0.00 1.27 7.56 0.68 — — —Clinton Public Hospital 0.87 0.00 8.15 8.09 0.65 5.68 0.67 2.36 — 16.92 —Dryden Regional Health Centre 0.00 0.00 4.04 5.93 5.36 5.75 2.40 1.14 — — —Geraldton District Hospital 2.96 3.22 3.01 2.32 3.02 16.50 1.81 2.89 — 0.00 —Glengarry Memorial Hospita 9.88 3.80 1.23 8.65 6.25 1.83 2.74 2.44 — — —Haldimand War Memorial Hospital 0.48 8.84 2.61 1.77 2.46 7.76 1.73 8.45 — 14.00 12.36Haliburton Highlands Health Services Corporation - Haliburton and Minden Sites 2.51 — 1.79 — — 11.52 20.32 9.88 — — —Hamilton Health Sciences - Henderson Hospital Site 1.93 3.22 4.87 0.00 2.45 4.63 2.85 2.03 — — —Hamilton Health Sciences - General Hospital Site 5.87 6.84 3.95 5.25 3.86 3.86 4.96 5.23 — — —Hamilton Health Sciences - McMaster University Medical Centre Site 3.94 2.65 2.13 3.78 4.38 3.86 6.18 1.87 — — —Hamilton Health Sciences - Total 3.95 4.27 3.60 3.07 3.71 4.13 4.86 2.87 — — —Hanover and District Hospital 8.67 2.47 0.25 1.82 0.60 12.04 5.34 12.93 — 3.90 4.52Grand River Hospital Corporation - Kitchener-Waterloo Hospital Site 4.49 5.94 4.60 3.41 7.32 1.73 2.64 6.25 — — —Lady Dunn Health Centre 3.18 2.02 — 3.13 11.23 2.96 — — — — —Lennox and Addington County General Hospita 8.82 4.98 0.71 0.00 6.23 0.63 6.38 1.10 — — —London Health Sciences Centre - University/Victoria South/CHWO 3.05 3.99 2.87 4.60 0.00 2.85 4.40 4.43 — — —McCausland Hospital — — — — — — — — — — —Mount Sinai Hospital 6.04 2.78 5.79 5.44 3.44 3.33 2.87 2.45 — — —Nipigon District Memorial Hospita 12.77 — 3.25 2.49 — 3.10 2.80 2.20 — 0.00 —Norfolk General Hospital 1.97 2.59 0.00 0.97 0.48 3.12 4.92 3.45 — — —North York General Hospital Site 2.31 3.53 1.93 3.08 0.37 3.22 4.56 3.44 — — —North York General Hospital - Branson Hospital Site 3.30 7.33 0.00 3.78 — — — — — — —North York General Hospital - Total 2.69 4.92 0.98 3.15 — — — — — — —Notre Dame Hospital — — 0.12 2.34 1.87 7.76 2.48 2.59 — — —Ottawa Hospital (The)/L'Hôpital d'Ottawa - Civic Site 7.44 5.66 5.05 4.67 1.69 2.58 3.81 4.50 — — —Ottawa Hospital (The)/L'Hôpital d'Ottawa - General Site 3.20 4.29 3.68 7.35 4.82 4.50 2.92 3.25 — — —Ottawa Hospital (The)/L'Hôpital d'Ottawa - Riverside Site 3.49 5.25 0.65 — — — — — — — —Ottawa Hospital (The)/L'Hôpital d'Ottawa - Total 5.32 5.09 4.19 5.98 3.12 3.42 3.31 3.84 — — —Rouge Valley Health System - Ajax and Pickering Site 0.44 0.00 3.70 1.84 1.39 2.03 5.42 2.37 — 2.97 12.85Rouge Valley Health System - Centenary Health Centre Site 3.07 2.80 1.02 1.73 2.64 2.26 4.09 2.84 — 4.08 5.30Rouge Valley Health System - Total 2.32 1.63 1.88 1.77 2.20 2.17 4.54 2.64 — — 7.87Hospital 225 — — — — — — — — — 3.53 6.13Hospital 226 — — — — — — — — — 58.67 5.72
Hospital 227 — — — — — — — — — 4.17 4.20Hospital 228 — — — — — — — — — 29.14 100.00Hospital 229 — — — — — — — — — — —
Hospital 230 — — — — — — — — — 0.00 —
Hospital 231 — — — — — — — — — — —
Hospital 232 — — — — — — — — 0.00 —
Hospital 233 — — — — — — — — 6.71 7.30Hospital 234 — — — — — — — — 0.00 0.00Hospital 235 — — — — — — — — — 5.92 1.13Hospital 236 — — — — — — — — — —
Manitoulin Health Centre - Little Current Site — — — — — — — — — 0.00Manitoulin Health Centre - Mindemoya Site — — — — — — — — — 31.52Manitoulin Health Centre - Total — — — — — — — — — 15.44Hospital 239 — — — — — — — — — 0.00Hospital 240 — — — — — — — — — 0.00Bluewater Health - Sarnia General Site — — — — — — — — — 14.36Bluewater Health - Charlotte Eleanor Englehart Site — — — — — — — — — 13.92Bluewater Health - Total — — — — — — — — — 14.31Hospital 243 — — — — — — — — — 8.72Hospital 244 — — — — — — — — — 0.00Hospital 245 — — — — — — — — — 31.42Hospital 246 — — — — — — — — — 10.07Hospital 247 — — — — — — — — — 12.24Hospital 248 — — — — — — — — — 4.35Hospital 249 — — — — — — — — — 0.00Huron Perth Healthcare Alliance — — — — — — — — 3.39 —
Perth & Smith Falls District Hospital — — — — — — — — 0.00 —
Listowel and Wingham Hospitals Alliance — — — — — — — — 52.23 —
Ontario Average 4.11 3.74 3.07 3.28 3.09 3.75 4.15 3.91 4.66 5.44
Gastrointestinal Hemorrhage Mortality: Risk Adjusted Rate by Institution (percent)
"—" indicates either no data were available for that facility for that year, that the institution did not exist in that year, or that the data were censored to protect patient confidentiality (when the denominator for a given indicator < 5)
Note: It is not possible to compare data from 1997-2001 with data from 2002-2004 because of the change in coding classification from ICD9CCP to ICD10CA in FY2002. It is not possible to compare data from 2002-2004 with data from 2005-2006 because of the ch
Not statistically different from averageWorse than averageBetter than average
FF
E
G
Overview and Observations / Hospital Report Card: Ontario 2009 / 37
www.fraserinstitute.org / Fraser Institute
Hospital responses
During the validation phase of the Fraser Institute’s Hospital Report Card, hospitals that agreed to be identified in the report were sent the results of their performance across both Inpatient Quality Indicators and Patient Safety Indicators. The hospitals had the opportunity to review their results and provide comments about their data and their quality efforts.
Response from Bluewater Health
Unfortunately it is not possible to validate the Bluewater Health results that you have provided. The AHRQ documentation does not provide sufficient detail that would allow us to accurately replicate the indicators used in this study. However, based on the descriptions contained the AHRQ documentation, we were able to estimate numerators and denominators for some indicators that roughly approximate those contained in the validation file.
Further, we do not have access to the risk-adjustment tool used in this study and are therefore unable to validate these findings. We are concerned that the risk adjustment methodology changes Bluewater Health’s results significantly for many indicators. In nine instances, the risk-adjusted value is greater than the observed value by over 70%. Conversely, there are eight indicators in which the risk-adjusted value was less than the observed value; however, the average change for these indi-cators is only −2.7%. We urge the Fraser Institute to review these findings and carefully consider how these results are communicated.
For future studies, we urge you to use methods and tools that are more ap-plicable to datasets used in Canadian hospitals.
Julie Moffat, Director, Health Information Services, Chief Privacy Officer
www.fraserinstitute.org / Fraser Institute
Hospital Report Card: Ontario 2009
Methodological Appendices
Appendix A Discharge Abstract Database (DAD) / 40
Appendix B The Centers for Medicare and Medicaid Services (CMS) Diagnosis Related Groups (DRG) Grouper / 44
Appendix C Agency for Healthcare Research and Quality’s (AHRQ) Inpatient Quality Indicators (IQI) and Patient Safety Indicator (PSI) modules / 47
Appendix D Hospital Identification / 52
Appendix E List of the Agency for Healthcare Research and Quality’s Inpatient Quality and Patient Safety Indicators used in the Fraser Institute’s Hospital Report Card / 62
Appendix F Calculating the Score, Rank, Hospital Mortality Index, and Rank of Hospital Mortality Index / 69
Appendix G Indicators Omitted from This Report / 73
Appendix H Municipalities and Corresponding Patient Forward Sortation Areas (FSAs) / 80
Appendix I Codes for Age / 86
Appendix J International Classification of Diseases (ICD) conversion tables / 88
Appendix K Hospitals and Health Authorities / 96

40 / Hospital Report Card: Ontario 2009 / Methodological Appendices
Fraser Institute / www.fraserinstitute.org
Appendix ADischarge Abstract Database (DAD)
In the first stage of data processing, records for all hospitals and munici-palities were drawn from the DAD data extracts (from CIHI) for use in the Hospital Report Card. The following DAD fields were used in our analysis.
Province Province of the patient.
Institution number Numeric value corresponding to each acute care facility. The institution numbers corresponding to those institutions that did not agree to be identified in this report were received from CIHI in an encrypted format.
Postal Code To protect patient confidentiality, all postal codes were trun-cated to the first 3 characters (representing the Forward Sortation Area) and grouped into corresponding municipalities as described by Canada Post. Please refer to Appendix H for further details.
Age code A unit value to denote how the patient’s age was recorded. Please refer to Appendix I for further details.
Age units Age of patient at the time of admission, which must be evalu-ated using the age code. Please refer to Appendix I for further details.
Gender Gender of the patient.
Admission date Date the patient was admitted to the facility.
Discharge Date Date the patient was separated from the facility.
Institution from type A code identifying the level of care provided by the facil-ity from which the patient was transferred to the acute care institution, where
1 = acute care2 = general rehabilitation facility3 = chronic care facility4 = nursing home5 = psychiatric facility6 = unclassified or other type of facility
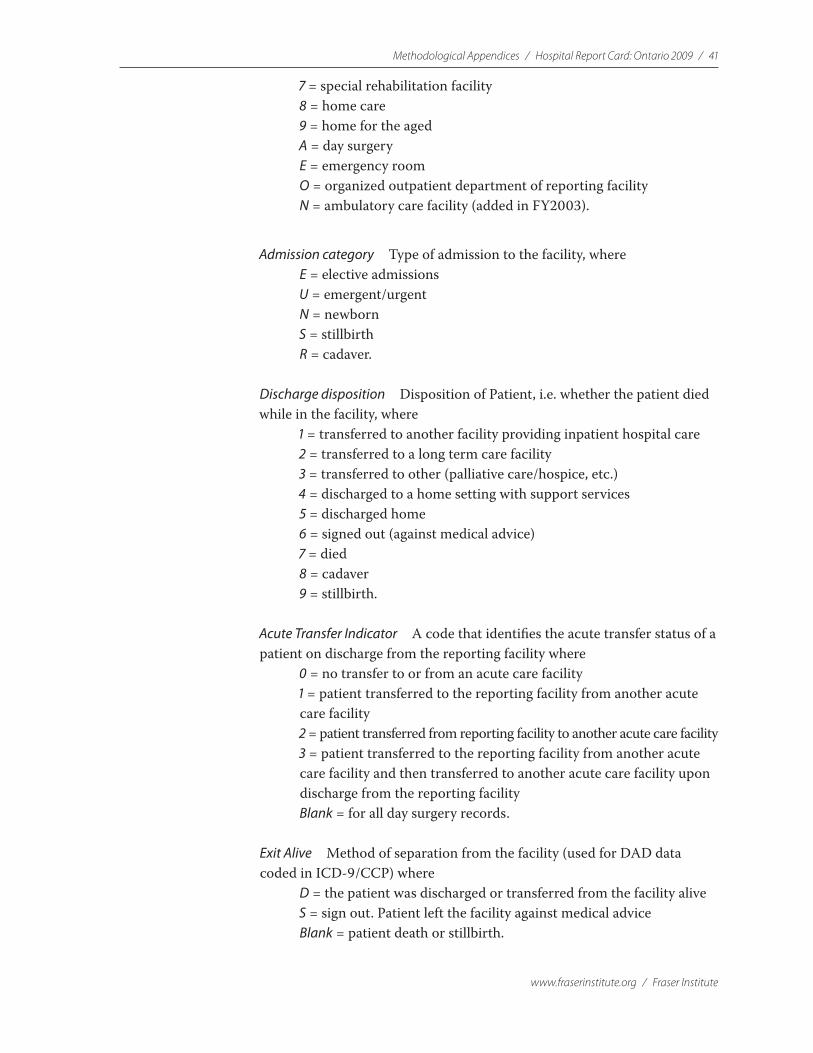
Methodological Appendices / Hospital Report Card: Ontario 2009 / 41
www.fraserinstitute.org / Fraser Institute
7 = special rehabilitation facility8 = home care9 = home for the agedA = day surgeryE = emergency roomO = organized outpatient department of reporting facilityN = ambulatory care facility (added in FY2003).
Admission category Type of admission to the facility, whereE = elective admissionsU = emergent/urgentN = newbornS = stillbirthR = cadaver.
Discharge disposition Disposition of Patient, i.e. whether the patient died while in the facility, where
1 = transferred to another facility providing inpatient hospital care2 = transferred to a long term care facility3 = transferred to other (palliative care/hospice, etc.)4 = discharged to a home setting with support services5 = discharged home6 = signed out (against medical advice)7 = died8 = cadaver9 = stillbirth.
Acute Transfer Indicator A code that identifies the acute transfer status of a patient on discharge from the reporting facility where
0 = no transfer to or from an acute care facility1 = patient transferred to the reporting facility from another acute care facility2 = patient transferred from reporting facility to another acute care facility3 = patient transferred to the reporting facility from another acute care facility and then transferred to another acute care facility upon discharge from the reporting facilityBlank = for all day surgery records.
Exit Alive Method of separation from the facility (used for DAD data coded in ICD-9/CCP) where
D = the patient was discharged or transferred from the facility aliveS = sign out. Patient left the facility against medical adviceBlank = patient death or stillbirth.

42 / Hospital Report Card: Ontario 2009 / Methodological Appendices
Fraser Institute / www.fraserinstitute.org
Entry Code Method of admission to the facility. This field was used in con-junction with “Age code” to exclude all “Stillbirths” from analysis where
E = emergency department from the reporting hospitalD = directN = newbornS = stillborn (in reporting hospital)C = clinic from the reporting hospitalP = day surgery from the reporting hospital.
Diagnosis codes International Classification of Disease codes (ICD-9 or ICD-10)1 identifying the condition considered to be the most responsible for the patient’s condition treated during hospitalization.
Diagnosis prefix codes A code that provides greater detail than the ICD diagnosis code. This field was applied by CIHI to DAD data coded in ICD-9/CCP only to identify “External cause of injury codes.”
Procedure and/or Intervention codes CCP or CCI procedure codes that indicate the procedure performed on the patient during the hospitalization.
Procedure dates Date the procedure was performed on the patient.
Procedure Suffix A code that provides further specificity to the ICD-9/CCP procedure code where
8 = cancelled surgery9 = previous surgery (surgery that the patient had prior to this hospitalization)0 = procedure performed out of hospital.2
Intervention out of hospital indicator = Y Denotes a procedure that was performed in another facility during the patient’s hospitalization (for use with data coded in CCI only).3
Intervention status attribute = A A code denoting a cancelled procedure (for use with data coded in CCI only).4
1 For further details on ICD-9, see <http://secure.cihi.ca/cihiweb/dispPage.jsp?cw_page =codingclass_icd9cm_e>; for ICD-10-CA, see <http://secure.cihi.ca/cihiweb/dispPage.jsp?cw_page =codingclass_icd10_e>.
2 All procedures denoted as “Procedure Suffix” = 0, 8 or 9 were removed from all analysis. 3 All procedures denoted as “Intervention out of hospital indicator” = Y were removed
from analysis. 4 All procedures denoted as “Intervention status attribute” = A were removed from analysis.

Methodological Appendices / Hospital Report Card: Ontario 2009 / 43
www.fraserinstitute.org / Fraser Institute
Acute length of stay The total number of days the patient was in the acute care facility.
Weight in grams Captured for newborns and neonates (age ≤ 28 days) inclusively.

44 / Hospital Report Card: Ontario 2009 / Methodological Appendices
Fraser Institute / www.fraserinstitute.org
Appendix BThe Centers for Medicare and Medicaid
Services (CMS) Diagnosis Related Groups
(DRG) Grouper
In order to use the CMS and 3M™ APR™ DRG Classification System software(1997/98–2004/05) or the CMS Grouper with Medicare Code Editor (2005/06 onwards), the DAD dataset received from CIHI required several standard modifications to account for differences in the Canadian and US coding methodologies. In other cases, no modifications were required. The table below lists all fields imported from the DAD and specifies what modi-fications, if any, were required.
Data Elements required by the CMS- and 3M™ APR™ DRG Classification System software
Variable name
Description Value description DAD Data Element or Comment
Key Unique case identifier
Numeric Each record was given a unique case identifier number
Adate Date of admission
Used for length of stay (LOS) calculation
Numeric
dd.mm.yyyy
Date of Admission was taken directly from DAD. No changes were made.
Ddate Date of discharge
Used for LOS calculation
Numeric
dd.mm.yyyy
Date of Discharge was taken directly from DAD. No changes were made.
Alos Calculated LOS overrides entered LOS
Numeric
(Days)
Acute length of stay information was taken directly from DAD. No changes were made.
Bdate Date of birth Numeric
dd.mm.yyyy
CIHI encrypts all patient identifiers in the DAD prior to cutting the dataset, including “date of birth” information. Since this field is required for all patients ≤ 28 days, it was calculated by subtracting the patient’s age (in days) from the admission date.
“Birth date” for all other patients remained as a “blank” in order to run the software.
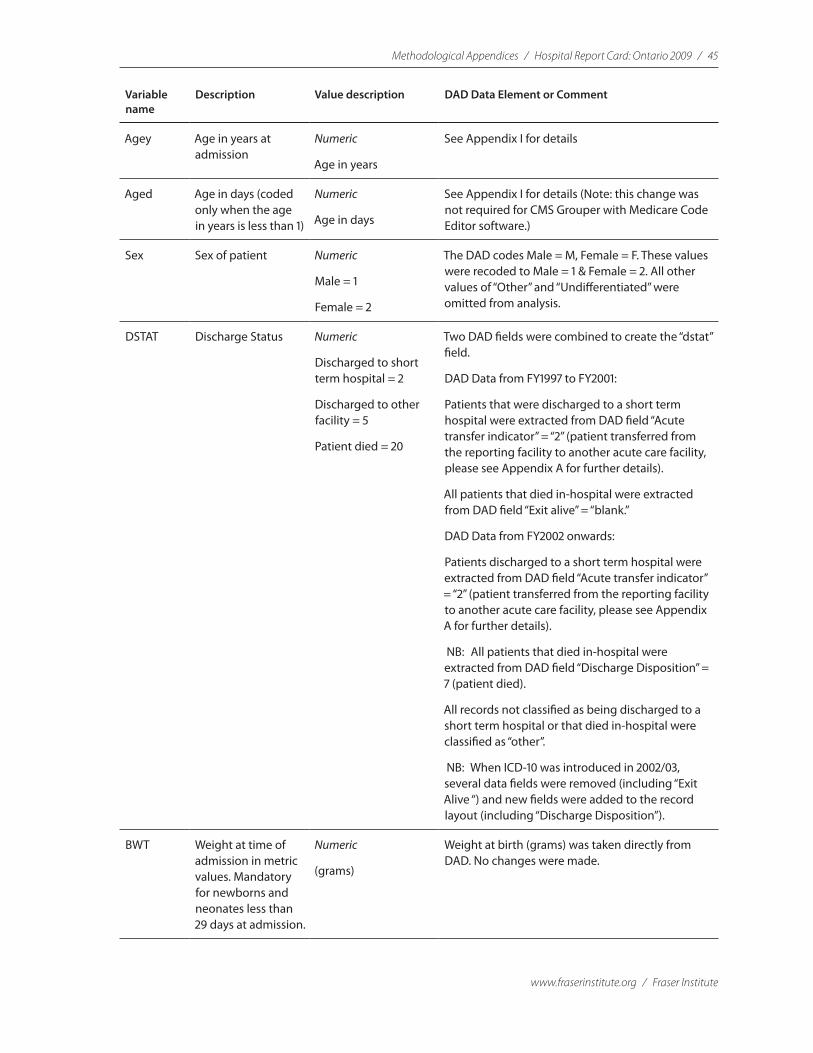
Methodological Appendices / Hospital Report Card: Ontario 2009 / 45
www.fraserinstitute.org / Fraser Institute
Variable name
Description Value description DAD Data Element or Comment
Agey Age in years at admission
Numeric
Age in years
See Appendix I for details
Aged Age in days (coded only when the age in years is less than 1)
Numeric
Age in days
See Appendix I for details (Note: this change was not required for CMS Grouper with Medicare Code Editor software.)
Sex Sex of patient Numeric
Male = 1
Female = 2
The DAD codes Male = M, Female = F. These values were recoded to Male = 1 & Female = 2. All other values of “Other” and “Undifferentiated” were omitted from analysis.
DSTAT Discharge Status Numeric
Discharged to short term hospital = 2
Discharged to other facility = 5
Patient died = 20
Two DAD fields were combined to create the “dstat” field.
DAD Data from FY1997 to FY2001:
Patients that were discharged to a short term hospital were extracted from DAD field “Acute transfer indicator” = “2” (patient transferred from the reporting facility to another acute care facility, please see Appendix A for further details).
All patients that died in-hospital were extracted from DAD field “Exit alive” = “blank.”
DAD Data from FY2002 onwards:
Patients discharged to a short term hospital were extracted from DAD field “Acute transfer indicator” = “2” (patient transferred from the reporting facility to another acute care facility, please see Appendix A for further details).
NB: All patients that died in-hospital were extracted from DAD field “Discharge Disposition” = 7 (patient died).
All records not classified as being discharged to a short term hospital or that died in-hospital were classified as “other”.
NB: When ICD-10 was introduced in 2002/03, several data fields were removed (including “Exit Alive “) and new fields were added to the record layout (including “Discharge Disposition”).
BWT Weight at time of admission in metric values. Mandatory for newborns and neonates less than 29 days at admission.
Numeric
(grams)
Weight at birth (grams) was taken directly from DAD. No changes were made.

46 / Hospital Report Card: Ontario 2009 / Methodological Appendices
Fraser Institute / www.fraserinstitute.org
Variable name
Description Value description DAD Data Element or Comment
DMV Days on Mechanical Ventilation
Numeric DMV information is not directly available from the DAD but is required to run the software. This field was created as a “dummy variable” and left “blank”.
Diagnosis Codes
ICD-9-CM diagnosis codes. DX1 is the principal diagnosis, DX2-DX30 are secondary diagnoses.
String All Diagnosis codes contained in the DAD were converted to ICD-9-CM.
NB: Please refer to Appendix J for further explanation on classification conversions.
Procedure Codes
ICD-9-CM procedure codes. PR1 is the principal diagnosis, PR2-PR30 are secondary procedures.
String All Procedure codes contained in the DAD were converted to ICD-9-CM.
NB: Please refer to Appendix J for further explanation on classification conversions.
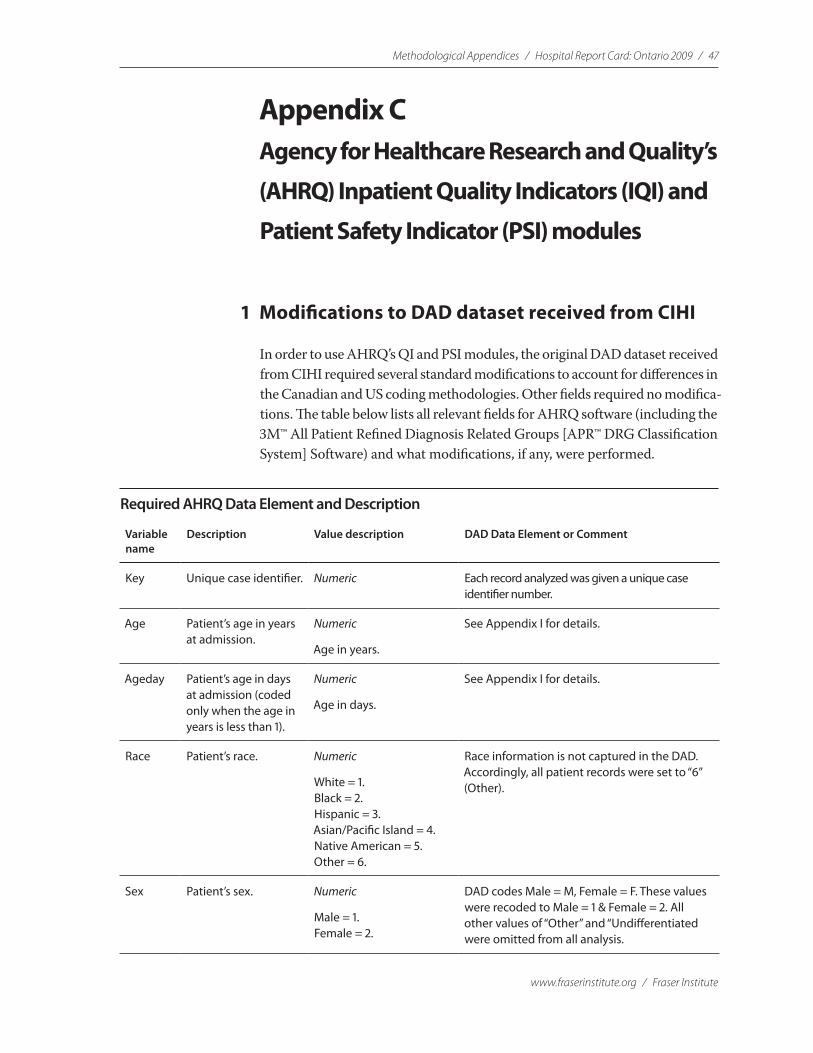
Methodological Appendices / Hospital Report Card: Ontario 2009 / 47
www.fraserinstitute.org / Fraser Institute
Appendix CAgency for Healthcare Research and Quality’s
(AHRQ) Inpatient Quality Indicators (IQI) and
Patient Safety Indicator (PSI) modules
1 Modifications to DAD dataset received from CIHI
In order to use AHRQ’s QI and PSI modules, the original DAD dataset received from CIHI required several standard modifications to account for differences in the Canadian and US coding methodologies. Other fields required no modifica-tions. The table below lists all relevant fields for AHRQ software (including the 3M™ All Patient Refined Diagnosis Related Groups [APR™ DRG Classification System] Software) and what modifications, if any, were performed.
Required AHRQ Data Element and Description
Variable name
Description Value description DAD Data Element or Comment
Key Unique case identifier. Numeric Each record analyzed was given a unique case identifier number.
Age Patient’s age in years at admission.
Numeric
Age in years.
See Appendix I for details.
Ageday Patient’s age in days at admission (coded only when the age in years is less than 1).
Numeric
Age in days.
See Appendix I for details.
Race Patient’s race. Numeric
White = 1.Black = 2.Hispanic = 3.Asian/Pacific Island = 4.Native American = 5.Other = 6.
Race information is not captured in the DAD. Accordingly, all patient records were set to “6” (Other).
Sex Patient’s sex. Numeric
Male = 1.Female = 2.
DAD codes Male = M, Female = F. These values were recoded to Male = 1 & Female = 2. All other values of “Other” and “Undifferentiated were omitted from all analysis.
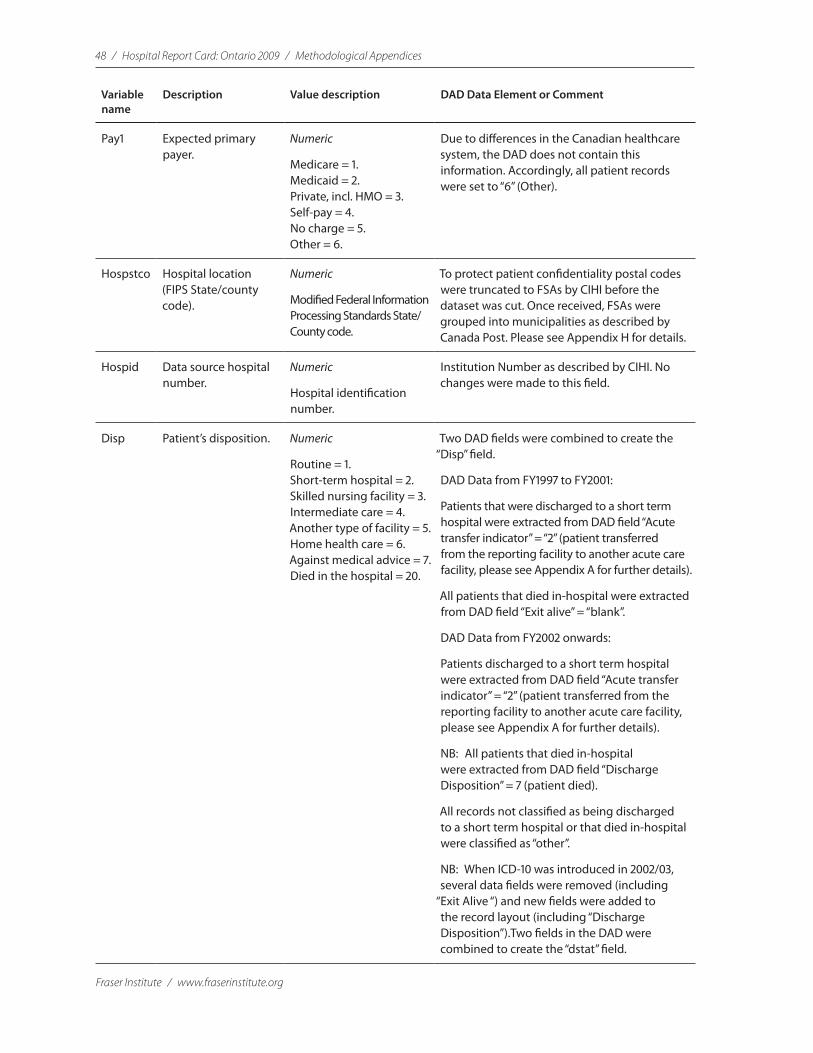
48 / Hospital Report Card: Ontario 2009 / Methodological Appendices
Fraser Institute / www.fraserinstitute.org
Variable name
Description Value description DAD Data Element or Comment
Pay1 Expected primary payer.
Numeric
Medicare = 1.Medicaid = 2.Private, incl. HMO = 3.Self-pay = 4.No charge = 5.Other = 6.
Due to differences in the Canadian healthcare system, the DAD does not contain this information. Accordingly, all patient records were set to “6” (Other).
Hospstco Hospital location (FIPS State/county code).
Numeric
Modified Federal Information Processing Standards State/County code.
To protect patient confidentiality postal codes were truncated to FSAs by CIHI before the dataset was cut. Once received, FSAs were grouped into municipalities as described by Canada Post. Please see Appendix H for details.
Hospid Data source hospital number.
Numeric
Hospital identification number.
Institution Number as described by CIHI. No changes were made to this field.
Disp Patient’s disposition. Numeric
Routine = 1.Short-term hospital = 2.Skilled nursing facility = 3.Intermediate care = 4.Another type of facility = 5.Home health care = 6.Against medical advice = 7.Died in the hospital = 20.
Two DAD fields were combined to create the “Disp” field.
DAD Data from FY1997 to FY2001:
Patients that were discharged to a short term hospital were extracted from DAD field “Acute transfer indicator” = “2” (patient transferred from the reporting facility to another acute care facility, please see Appendix A for further details).
All patients that died in-hospital were extracted from DAD field “Exit alive” = “blank”.
DAD Data from FY2002 onwards:
Patients discharged to a short term hospital were extracted from DAD field “Acute transfer indicator” = “2” (patient transferred from the reporting facility to another acute care facility, please see Appendix A for further details).
NB: All patients that died in-hospital were extracted from DAD field “Discharge Disposition” = 7 (patient died).
All records not classified as being discharged to a short term hospital or that died in-hospital were classified as “other”.
NB: When ICD-10 was introduced in 2002/03, several data fields were removed (including
“Exit Alive “) and new fields were added to the record layout (including “Discharge Disposition”).Two fields in the DAD were combined to create the “dstat” field.
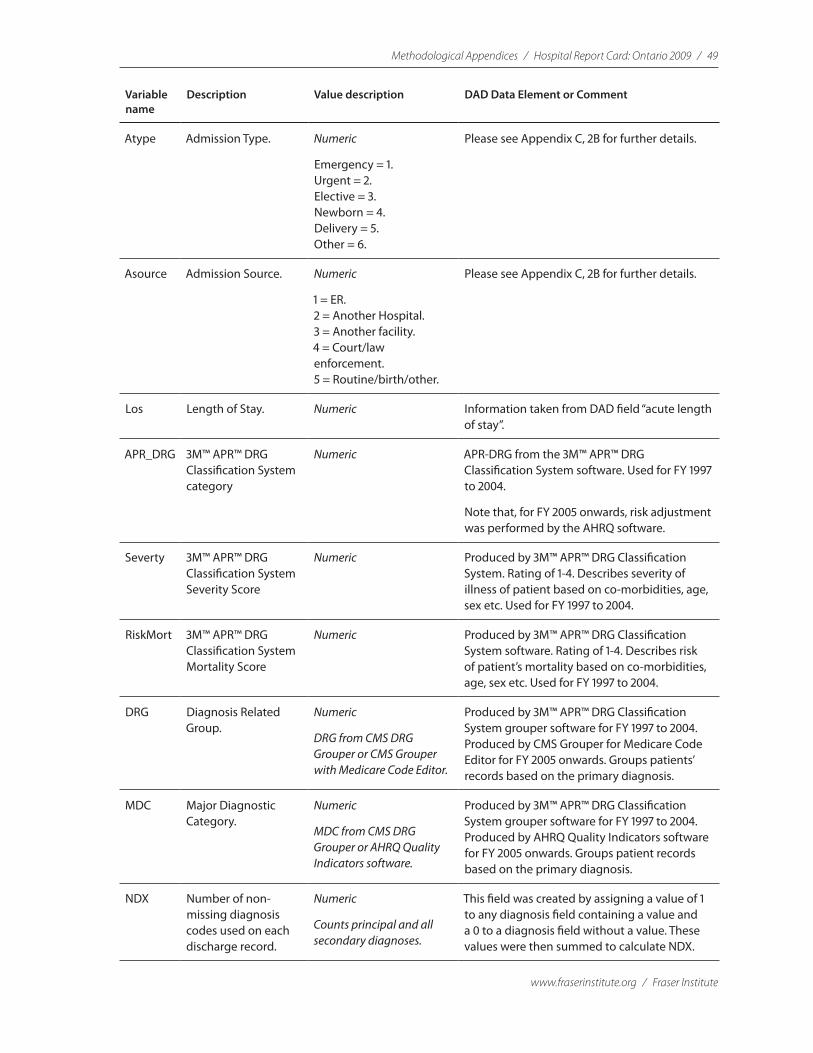
Methodological Appendices / Hospital Report Card: Ontario 2009 / 49
www.fraserinstitute.org / Fraser Institute
Variable name
Description Value description DAD Data Element or Comment
Atype Admission Type. Numeric
Emergency = 1.Urgent = 2.Elective = 3.Newborn = 4.Delivery = 5.Other = 6.
Please see Appendix C, 2B for further details.
Asource Admission Source. Numeric
1 = ER.2 = Another Hospital.3 = Another facility.4 = Court/law enforcement.5 = Routine/birth/other.
Please see Appendix C, 2B for further details.
Los Length of Stay. Numeric Information taken from DAD field “acute length of stay”.
APR_DRG 3M™ APR™ DRG Classification System category
Numeric APR-DRG from the 3M™ APR™ DRG Classification System software. Used for FY 1997 to 2004.
Note that, for FY 2005 onwards, risk adjustment was performed by the AHRQ software.
Severty 3M™ APR™ DRG Classification System Severity Score
Numeric Produced by 3M™ APR™ DRG Classification System. Rating of 1-4. Describes severity of illness of patient based on co-morbidities, age, sex etc. Used for FY 1997 to 2004.
RiskMort 3M™ APR™ DRG Classification System Mortality Score
Numeric Produced by 3M™ APR™ DRG Classification System software. Rating of 1-4. Describes risk of patient’s mortality based on co-morbidities, age, sex etc. Used for FY 1997 to 2004.
DRG Diagnosis Related Group.
Numeric
DRG from CMS DRG Grouper or CMS Grouper with Medicare Code Editor.
Produced by 3M™ APR™ DRG Classification System grouper software for FY 1997 to 2004. Produced by CMS Grouper for Medicare Code Editor for FY 2005 onwards. Groups patients’ records based on the primary diagnosis.
MDC Major Diagnostic Category.
Numeric
MDC from CMS DRG Grouper or AHRQ Quality Indicators software.
Produced by 3M™ APR™ DRG Classification System grouper software for FY 1997 to 2004. Produced by AHRQ Quality Indicators software for FY 2005 onwards. Groups patient records based on the primary diagnosis.
NDX Number of non-missing diagnosis codes used on each discharge record.
Numeric
Counts principal and all secondary diagnoses.
This field was created by assigning a value of 1 to any diagnosis field containing a value and a 0 to a diagnosis field without a value. These values were then summed to calculate NDX.
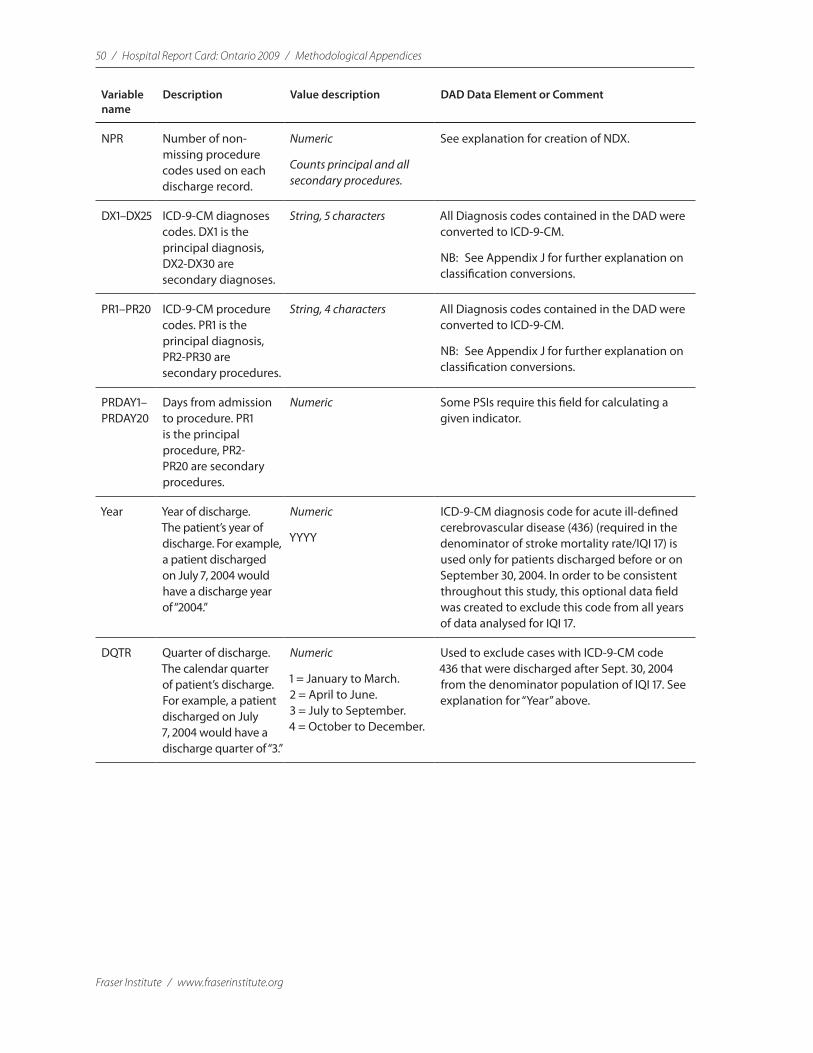
50 / Hospital Report Card: Ontario 2009 / Methodological Appendices
Fraser Institute / www.fraserinstitute.org
Variable name
Description Value description DAD Data Element or Comment
NPR Number of non-missing procedure codes used on each discharge record.
Numeric
Counts principal and all secondary procedures.
See explanation for creation of NDX.
DX1–DX25 ICD-9-CM diagnoses codes. DX1 is the principal diagnosis, DX2-DX30 are secondary diagnoses.
String, 5 characters All Diagnosis codes contained in the DAD were converted to ICD-9-CM.
NB: See Appendix J for further explanation on classification conversions.
PR1–PR20 ICD-9-CM procedure codes. PR1 is the principal diagnosis, PR2-PR30 are secondary procedures.
String, 4 characters All Diagnosis codes contained in the DAD were converted to ICD-9-CM.
NB: See Appendix J for further explanation on classification conversions.
PRDAY1–PRDAY20
Days from admission to procedure. PR1 is the principal procedure, PR2-PR20 are secondary procedures.
Numeric Some PSIs require this field for calculating a given indicator.
Year Year of discharge. The patient’s year of discharge. For example, a patient discharged on July 7, 2004 would have a discharge year of “2004.”
Numeric
YYYY
ICD-9-CM diagnosis code for acute ill-defined cerebrovascular disease (436) (required in the denominator of stroke mortality rate/IQI 17) is used only for patients discharged before or on September 30, 2004. In order to be consistent throughout this study, this optional data field was created to exclude this code from all years of data analysed for IQI 17.
DQTR Quarter of discharge. The calendar quarter of patient’s discharge. For example, a patient discharged on July 7, 2004 would have a discharge quarter of “3.”
Numeric
1 = January to March.2 = April to June.3 = July to September.4 = October to December.
Used to exclude cases with ICD-9-CM code 436 that were discharged after Sept. 30, 2004 from the denominator population of IQI 17. See explanation for “Year” above.

Methodological Appendices / Hospital Report Card: Ontario 2009 / 51
www.fraserinstitute.org / Fraser Institute
2 Other DAD Data Elements Translated for Calculation of AHRQ’s IQIs and PSIs
A. Admission type (Atype)All information used for this field was taken from the DAD field “Admission Category” and converted into the required numeric value for AHRQ’s IQI and PSI modules. The following translations were performed.=
Admission Category (DAD) Atype (AHRQ)
L = Elective Admissions 3 = Elective
N = Newborn 4 = Newborn
Note: The “Admission type” variable is only used in calculating PSI indicators (i.e. not for calculating IQI indicators). The values “3” and “4” are referenced by the PSI code to identify elective surgeries and newborn admissions.
B. Admission source (Asource)All information used for this field was taken from the DAD field “Admission Category.” The following translations were performed.
Institution from type (DAD) Asource (AHRQ)
1 = Acute Care 2 = Another Hospital
2 = General Rehabilitation Facility 3 = Another Facility including Long Term Care (LTC)
3 = Chronic Care Facility 3 = Another Facility including LTC
4 = Nursing Home 3 = Another Facility including LTC
5 = Psychiatric Facility 3 = Another Facility including LTC
6 = Unclassified or other type of Facility
3 = Another Facility including LTC
7 = Special Rehabilitation Facility 3 = Another Facility including LTC
8 = Home Care 3 = Another Facility including LTC
9 = Home for the Aged 3 = Another Facility including LTC
A = Day Surgery 3 = Another Facility including LTC
O = Organized Outpatient Department of Reporting Facility
3 = Another Facility including LTC
Note: The value “2” is referenced by the IQI code to identify transfers from another short-term hospital. The values “2” and “3” are referenced by the PSI code to identify transfers from another hospital or facility.
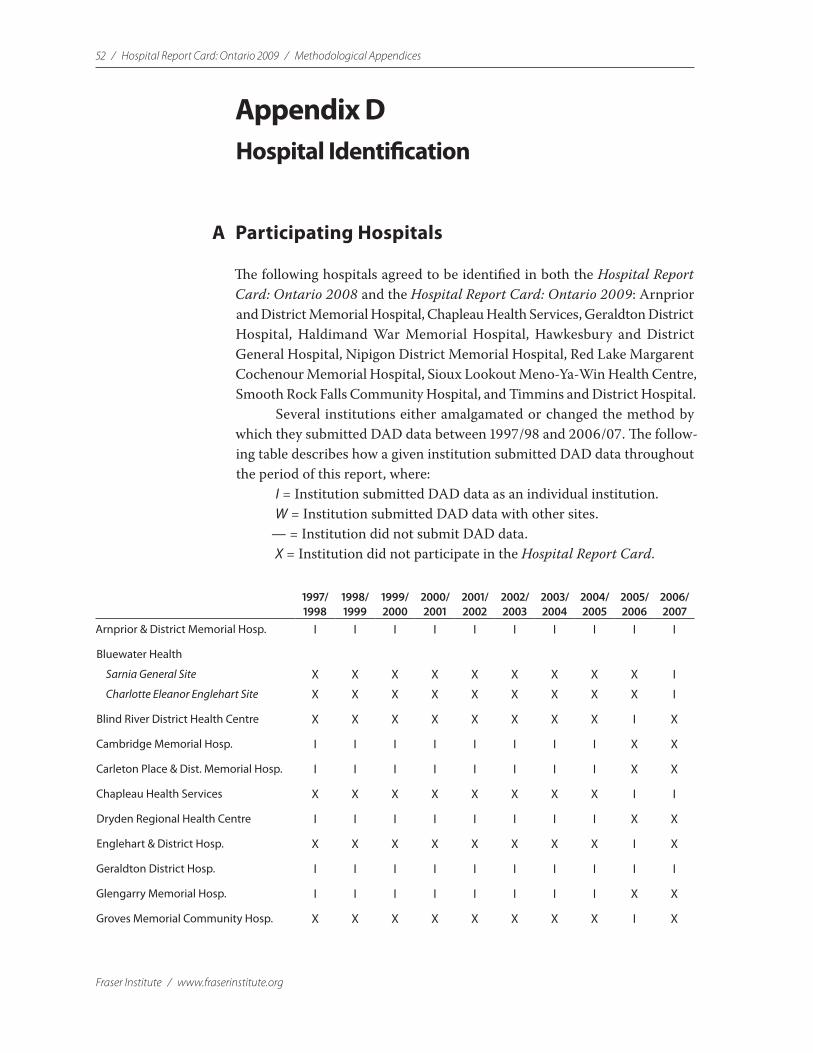
52 / Hospital Report Card: Ontario 2009 / Methodological Appendices
Fraser Institute / www.fraserinstitute.org
Appendix DHospital Identification
A Participating Hospitals
The following hospitals agreed to be identified in both the Hospital Report Card: Ontario 2008 and the Hospital Report Card: Ontario 2009: Arnprior and District Memorial Hospital, Chapleau Health Services, Geraldton District Hospital, Haldimand War Memorial Hospital, Hawkesbury and District General Hospital, Nipigon District Memorial Hospital, Red Lake Margarent Cochenour Memorial Hospital, Sioux Lookout Meno-Ya-Win Health Centre, Smooth Rock Falls Community Hospital, and Timmins and District Hospital.
Several institutions either amalgamated or changed the method by which they submitted DAD data between 1997/98 and 2006/07. The follow-ing table describes how a given institution submitted DAD data throughout the period of this report, where:
I = Institution submitted DAD data as an individual institution.W = Institution submitted DAD data with other sites.
— = Institution did not submit DAD data.X = Institution did not participate in the Hospital Report Card.
1997/ 1998
1998/ 1999
1999/ 2000
2000/ 2001
2001/ 2002
2002/ 2003
2003/ 2004
2004/ 2005
2005/ 2006
2006/ 2007
Arnprior & District Memorial Hosp. I I I I I I I I I I
Bluewater Health
Sarnia General Site X X X X X X X X X I
Charlotte Eleanor Englehart Site X X X X X X X X X I
Blind River District Health Centre X X X X X X X X I X
Cambridge Memorial Hosp. I I I I I I I I X X
Carleton Place & Dist. Memorial Hosp. I I I I I I I I X X
Chapleau Health Services X X X X X X X X I I
Dryden Regional Health Centre I I I I I I I I X X
Englehart & District Hosp. X X X X X X X X I X
Geraldton District Hosp. I I I I I I I I I I
Glengarry Memorial Hosp. I I I I I I I I X X
Groves Memorial Community Hosp. X X X X X X X X I X
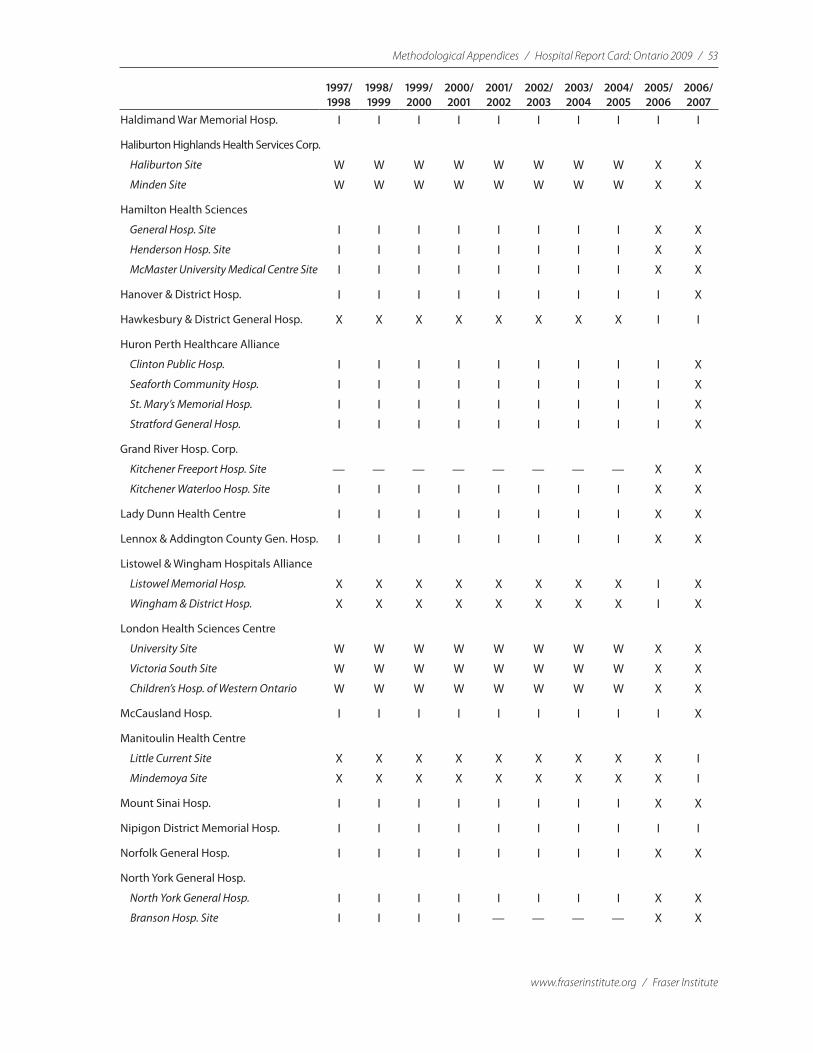
Methodological Appendices / Hospital Report Card: Ontario 2009 / 53
www.fraserinstitute.org / Fraser Institute
1997/ 1998
1998/ 1999
1999/ 2000
2000/ 2001
2001/ 2002
2002/ 2003
2003/ 2004
2004/ 2005
2005/ 2006
2006/ 2007
Haldimand War Memorial Hosp. I I I I I I I I I I
Haliburton Highlands Health Services Corp.
Haliburton Site W W W W W W W W X X
Minden Site W W W W W W W W X X
Hamilton Health Sciences
General Hosp. Site I I I I I I I I X X
Henderson Hosp. Site I I I I I I I I X X
McMaster University Medical Centre Site I I I I I I I I X X
Hanover & District Hosp. I I I I I I I I I X
Hawkesbury & District General Hosp. X X X X X X X X I I
Huron Perth Healthcare Alliance
Clinton Public Hosp. I I I I I I I I I X
Seaforth Community Hosp. I I I I I I I I I X
St. Mary’s Memorial Hosp. I I I I I I I I I X
Stratford General Hosp. I I I I I I I I I X
Grand River Hosp. Corp.
Kitchener Freeport Hosp. Site — — — — — — — — X X
Kitchener Waterloo Hosp. Site I I I I I I I I X X
Lady Dunn Health Centre I I I I I I I I X X
Lennox & Addington County Gen. Hosp. I I I I I I I I X X
Listowel & Wingham Hospitals Alliance
Listowel Memorial Hosp. X X X X X X X X I X
Wingham & District Hosp. X X X X X X X X I X
London Health Sciences Centre
University Site W W W W W W W W X X
Victoria South Site W W W W W W W W X X
Children’s Hosp. of Western Ontario W W W W W W W W X X
McCausland Hosp. I I I I I I I I I X
Manitoulin Health Centre
Little Current Site X X X X X X X X X I
Mindemoya Site X X X X X X X X X I
Mount Sinai Hosp. I I I I I I I I X X
Nipigon District Memorial Hosp. I I I I I I I I I I
Norfolk General Hosp. I I I I I I I I X X
North York General Hosp.
North York General Hosp. I I I I I I I I X X
Branson Hosp. Site I I I I — — — — X X

54 / Hospital Report Card: Ontario 2009 / Methodological Appendices
Fraser Institute / www.fraserinstitute.org
1997/ 1998
1998/ 1999
1999/ 2000
2000/ 2001
2001/ 2002
2002/ 2003
2003/ 2004
2004/ 2005
2005/ 2006
2006/ 2007
Notre Dame Hosp. I I I I I I I I X X
Orillia Soldiers’ Memorial Hosp. X X X X X X X X I X
Ottawa Hosp. /L’Hôpital d’Ottawa
Civic Site I I I I I I I I X X
General Site I I I I I I I I X X
Riverside Site (conv. to urgent care clinic) I I I — — — — — X X
Rehabilitation Centre Site — — — — — — — — X X
Perth & Smith Falls District Hosp.
Perth Site X X X X X X X X I X
Smith Falls Site X X X X X X X X I X
Red Lake Margaret Cochenour Mem. Hosp. X X X X X X X X I I
Rouge Valley Health System
Ajax & Pickering Site I I I I I I I I I I
Centenary Health Centre Site I I I I I I I I I I
Sensenbrenner Hosp. I I I I I I I I X X
Sioux Lookout Meno-Ya-Win Health Cen.
Sioux Lookout Dist. Health Centre Site I I I I I I I W W W
Sioux Lookout Zone Hosp. Site I I I I I I I W W W
Smooth Rock Falls Community Hosp. X X X X X X X X I I
South Huron Hosp. I I I I I I I I X X
South Muskoka Memorial Hosp. I I I I I I I I X X
Stevenson Memorial Hosp. X X X X X X X X I X
St. Mary’s General Hosp. I I I I I I I I X X
St. Thomas-Elgin General Hosp. I I I I I I I I I X
St. Joseph’s Health Care System – Hamilton I I I I I I I I X X
Strathroy Middlesex General Hosp. X X X X X X X X I X
Sunnybrook & Women’s College Health Sciences Cen.
Sunnybrook Health Sciences Site I I W W W W W W X X
Women’s College Site I I — — — — — — X X
Orthopaedic & Arthritic Site I I W W W W W W X X
Thunder Bay Regional Health Sciences Cen. I I I I I I I I X X
Timmins & District General Hosp. I I I I I I I I I I
Trillium Health Centre
The Mississauga Hosp. Site I I W W W W W W X X
Etobicoke Queensway Gen. Site I I W W W W W W X X
University of Ottawa Heart Institute — — — I I I I I X I
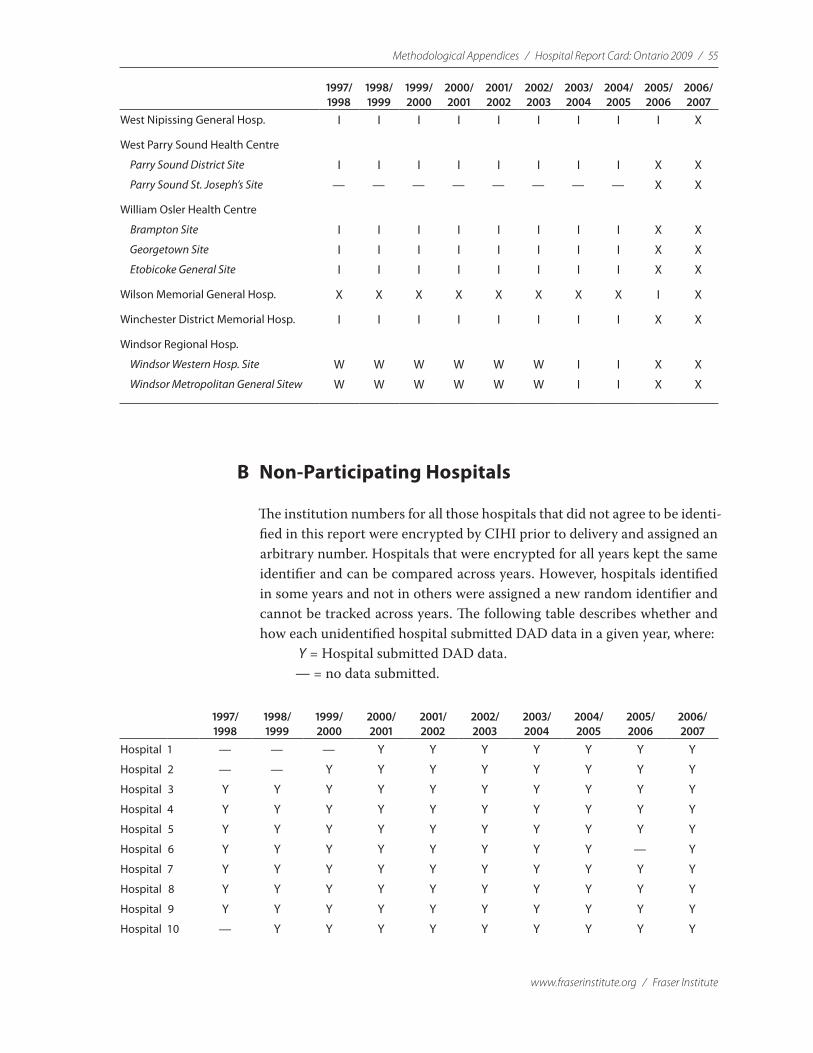
Methodological Appendices / Hospital Report Card: Ontario 2009 / 55
www.fraserinstitute.org / Fraser Institute
1997/ 1998
1998/ 1999
1999/ 2000
2000/ 2001
2001/ 2002
2002/ 2003
2003/ 2004
2004/ 2005
2005/ 2006
2006/ 2007
West Nipissing General Hosp. I I I I I I I I I X
West Parry Sound Health Centre
Parry Sound District Site I I I I I I I I X X
Parry Sound St. Joseph’s Site — — — — — — — — X X
William Osler Health Centre
Brampton Site I I I I I I I I X X
Georgetown Site I I I I I I I I X X
Etobicoke General Site I I I I I I I I X X
Wilson Memorial General Hosp. X X X X X X X X I X
Winchester District Memorial Hosp. I I I I I I I I X X
Windsor Regional Hosp.
Windsor Western Hosp. Site W W W W W W I I X X
Windsor Metropolitan General Sitew W W W W W W I I X X
B Non-Participating Hospitals
The institution numbers for all those hospitals that did not agree to be identi-fied in this report were encrypted by CIHI prior to delivery and assigned an arbitrary number. Hospitals that were encrypted for all years kept the same identifier and can be compared across years. However, hospitals identified in some years and not in others were assigned a new random identifier and cannot be tracked across years. The following table describes whether and how each unidentified hospital submitted DAD data in a given year, where:
Y = Hospital submitted DAD data.— = no data submitted.
1997/ 1998
1998/ 1999
1999/ 2000
2000/ 2001
2001/ 2002
2002/ 2003
2003/ 2004
2004/ 2005
2005/ 2006
2006/ 2007
Hospital 1 — — — Y Y Y Y Y Y Y
Hospital 2 — — Y Y Y Y Y Y Y Y
Hospital 3 Y Y Y Y Y Y Y Y Y Y
Hospital 4 Y Y Y Y Y Y Y Y Y Y
Hospital 5 Y Y Y Y Y Y Y Y Y Y
Hospital 6 Y Y Y Y Y Y Y Y — Y
Hospital 7 Y Y Y Y Y Y Y Y Y Y
Hospital 8 Y Y Y Y Y Y Y Y Y Y
Hospital 9 Y Y Y Y Y Y Y Y Y Y
Hospital 10 — Y Y Y Y Y Y Y Y Y
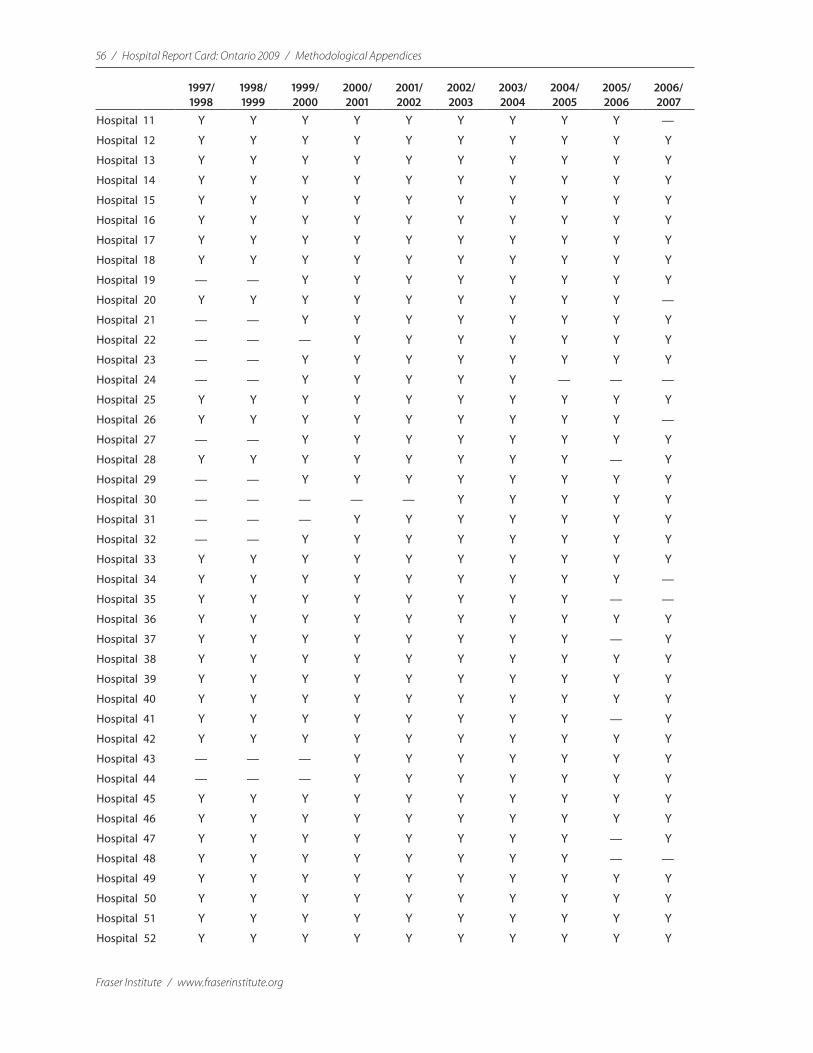
56 / Hospital Report Card: Ontario 2009 / Methodological Appendices
Fraser Institute / www.fraserinstitute.org
1997/ 1998
1998/ 1999
1999/ 2000
2000/ 2001
2001/ 2002
2002/ 2003
2003/ 2004
2004/ 2005
2005/ 2006
2006/ 2007
Hospital 11 Y Y Y Y Y Y Y Y Y —
Hospital 12 Y Y Y Y Y Y Y Y Y Y
Hospital 13 Y Y Y Y Y Y Y Y Y Y
Hospital 14 Y Y Y Y Y Y Y Y Y Y
Hospital 15 Y Y Y Y Y Y Y Y Y Y
Hospital 16 Y Y Y Y Y Y Y Y Y Y
Hospital 17 Y Y Y Y Y Y Y Y Y Y
Hospital 18 Y Y Y Y Y Y Y Y Y Y
Hospital 19 — — Y Y Y Y Y Y Y Y
Hospital 20 Y Y Y Y Y Y Y Y Y —
Hospital 21 — — Y Y Y Y Y Y Y Y
Hospital 22 — — — Y Y Y Y Y Y Y
Hospital 23 — — Y Y Y Y Y Y Y Y
Hospital 24 — — Y Y Y Y Y — — —
Hospital 25 Y Y Y Y Y Y Y Y Y Y
Hospital 26 Y Y Y Y Y Y Y Y Y —
Hospital 27 — — Y Y Y Y Y Y Y Y
Hospital 28 Y Y Y Y Y Y Y Y — Y
Hospital 29 — — Y Y Y Y Y Y Y Y
Hospital 30 — — — — — Y Y Y Y Y
Hospital 31 — — — Y Y Y Y Y Y Y
Hospital 32 — — Y Y Y Y Y Y Y Y
Hospital 33 Y Y Y Y Y Y Y Y Y Y
Hospital 34 Y Y Y Y Y Y Y Y Y —
Hospital 35 Y Y Y Y Y Y Y Y — —
Hospital 36 Y Y Y Y Y Y Y Y Y Y
Hospital 37 Y Y Y Y Y Y Y Y — Y
Hospital 38 Y Y Y Y Y Y Y Y Y Y
Hospital 39 Y Y Y Y Y Y Y Y Y Y
Hospital 40 Y Y Y Y Y Y Y Y Y Y
Hospital 41 Y Y Y Y Y Y Y Y — Y
Hospital 42 Y Y Y Y Y Y Y Y Y Y
Hospital 43 — — — Y Y Y Y Y Y Y
Hospital 44 — — — Y Y Y Y Y Y Y
Hospital 45 Y Y Y Y Y Y Y Y Y Y
Hospital 46 Y Y Y Y Y Y Y Y Y Y
Hospital 47 Y Y Y Y Y Y Y Y — Y
Hospital 48 Y Y Y Y Y Y Y Y — —
Hospital 49 Y Y Y Y Y Y Y Y Y Y
Hospital 50 Y Y Y Y Y Y Y Y Y Y
Hospital 51 Y Y Y Y Y Y Y Y Y Y
Hospital 52 Y Y Y Y Y Y Y Y Y Y
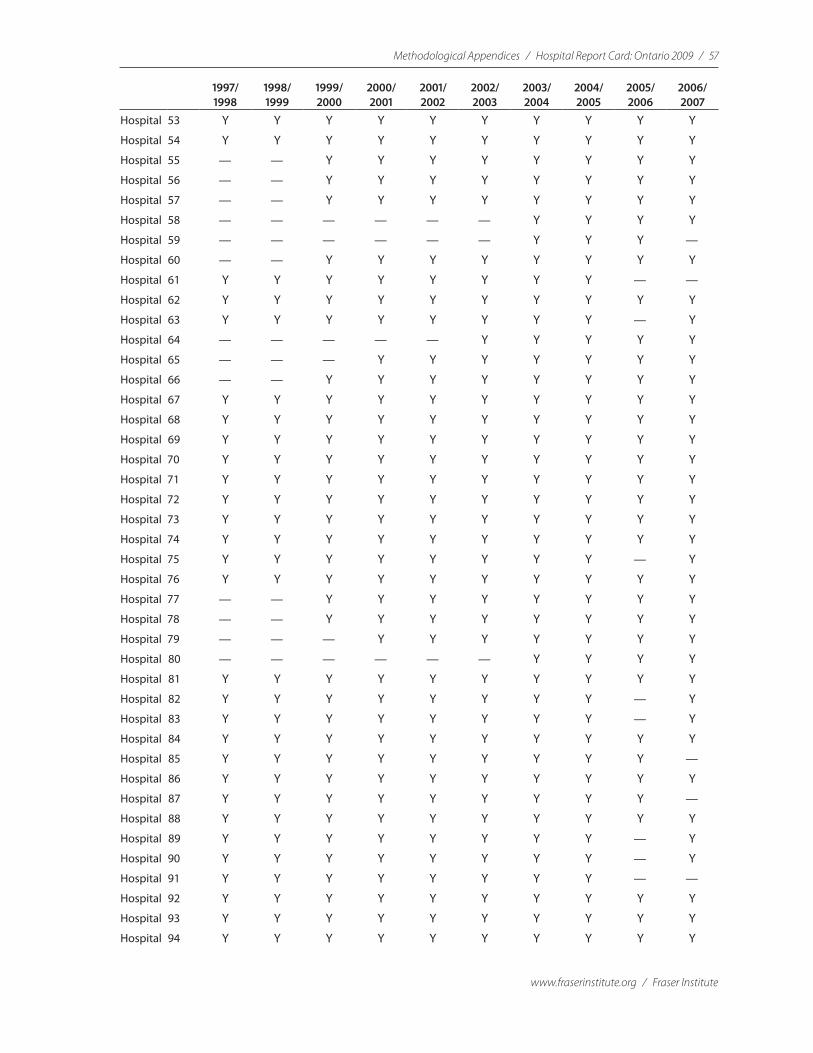
Methodological Appendices / Hospital Report Card: Ontario 2009 / 57
www.fraserinstitute.org / Fraser Institute
1997/ 1998
1998/ 1999
1999/ 2000
2000/ 2001
2001/ 2002
2002/ 2003
2003/ 2004
2004/ 2005
2005/ 2006
2006/ 2007
Hospital 53 Y Y Y Y Y Y Y Y Y Y
Hospital 54 Y Y Y Y Y Y Y Y Y Y
Hospital 55 — — Y Y Y Y Y Y Y Y
Hospital 56 — — Y Y Y Y Y Y Y Y
Hospital 57 — — Y Y Y Y Y Y Y Y
Hospital 58 — — — — — — Y Y Y Y
Hospital 59 — — — — — — Y Y Y —
Hospital 60 — — Y Y Y Y Y Y Y Y
Hospital 61 Y Y Y Y Y Y Y Y — —
Hospital 62 Y Y Y Y Y Y Y Y Y Y
Hospital 63 Y Y Y Y Y Y Y Y — Y
Hospital 64 — — — — — Y Y Y Y Y
Hospital 65 — — — Y Y Y Y Y Y Y
Hospital 66 — — Y Y Y Y Y Y Y Y
Hospital 67 Y Y Y Y Y Y Y Y Y Y
Hospital 68 Y Y Y Y Y Y Y Y Y Y
Hospital 69 Y Y Y Y Y Y Y Y Y Y
Hospital 70 Y Y Y Y Y Y Y Y Y Y
Hospital 71 Y Y Y Y Y Y Y Y Y Y
Hospital 72 Y Y Y Y Y Y Y Y Y Y
Hospital 73 Y Y Y Y Y Y Y Y Y Y
Hospital 74 Y Y Y Y Y Y Y Y Y Y
Hospital 75 Y Y Y Y Y Y Y Y — Y
Hospital 76 Y Y Y Y Y Y Y Y Y Y
Hospital 77 — — Y Y Y Y Y Y Y Y
Hospital 78 — — Y Y Y Y Y Y Y Y
Hospital 79 — — — Y Y Y Y Y Y Y
Hospital 80 — — — — — — Y Y Y Y
Hospital 81 Y Y Y Y Y Y Y Y Y Y
Hospital 82 Y Y Y Y Y Y Y Y — Y
Hospital 83 Y Y Y Y Y Y Y Y — Y
Hospital 84 Y Y Y Y Y Y Y Y Y Y
Hospital 85 Y Y Y Y Y Y Y Y Y —
Hospital 86 Y Y Y Y Y Y Y Y Y Y
Hospital 87 Y Y Y Y Y Y Y Y Y —
Hospital 88 Y Y Y Y Y Y Y Y Y Y
Hospital 89 Y Y Y Y Y Y Y Y — Y
Hospital 90 Y Y Y Y Y Y Y Y — Y
Hospital 91 Y Y Y Y Y Y Y Y — —
Hospital 92 Y Y Y Y Y Y Y Y Y Y
Hospital 93 Y Y Y Y Y Y Y Y Y Y
Hospital 94 Y Y Y Y Y Y Y Y Y Y
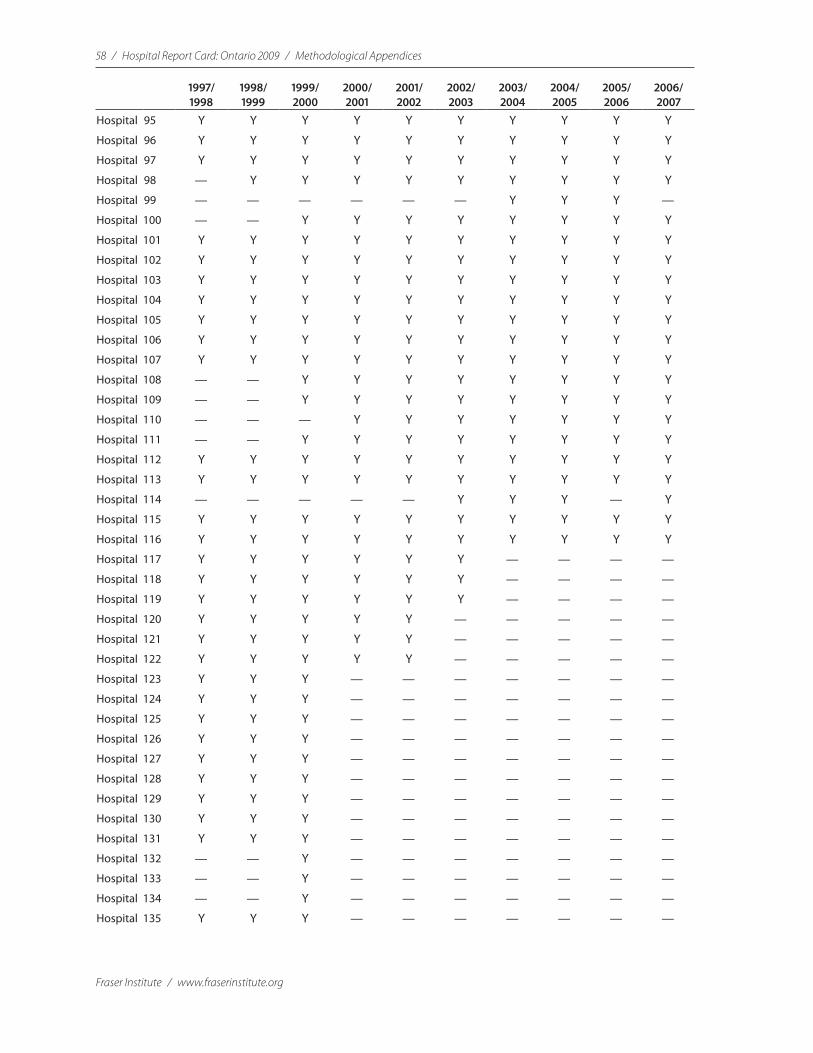
58 / Hospital Report Card: Ontario 2009 / Methodological Appendices
Fraser Institute / www.fraserinstitute.org
1997/ 1998
1998/ 1999
1999/ 2000
2000/ 2001
2001/ 2002
2002/ 2003
2003/ 2004
2004/ 2005
2005/ 2006
2006/ 2007
Hospital 95 Y Y Y Y Y Y Y Y Y Y
Hospital 96 Y Y Y Y Y Y Y Y Y Y
Hospital 97 Y Y Y Y Y Y Y Y Y Y
Hospital 98 — Y Y Y Y Y Y Y Y Y
Hospital 99 — — — — — — Y Y Y —
Hospital 100 — — Y Y Y Y Y Y Y Y
Hospital 101 Y Y Y Y Y Y Y Y Y Y
Hospital 102 Y Y Y Y Y Y Y Y Y Y
Hospital 103 Y Y Y Y Y Y Y Y Y Y
Hospital 104 Y Y Y Y Y Y Y Y Y Y
Hospital 105 Y Y Y Y Y Y Y Y Y Y
Hospital 106 Y Y Y Y Y Y Y Y Y Y
Hospital 107 Y Y Y Y Y Y Y Y Y Y
Hospital 108 — — Y Y Y Y Y Y Y Y
Hospital 109 — — Y Y Y Y Y Y Y Y
Hospital 110 — — — Y Y Y Y Y Y Y
Hospital 111 — — Y Y Y Y Y Y Y Y
Hospital 112 Y Y Y Y Y Y Y Y Y Y
Hospital 113 Y Y Y Y Y Y Y Y Y Y
Hospital 114 — — — — — Y Y Y — Y
Hospital 115 Y Y Y Y Y Y Y Y Y Y
Hospital 116 Y Y Y Y Y Y Y Y Y Y
Hospital 117 Y Y Y Y Y Y — — — —
Hospital 118 Y Y Y Y Y Y — — — —
Hospital 119 Y Y Y Y Y Y — — — —
Hospital 120 Y Y Y Y Y — — — — —
Hospital 121 Y Y Y Y Y — — — — —
Hospital 122 Y Y Y Y Y — — — — —
Hospital 123 Y Y Y — — — — — — —
Hospital 124 Y Y Y — — — — — — —
Hospital 125 Y Y Y — — — — — — —
Hospital 126 Y Y Y — — — — — — —
Hospital 127 Y Y Y — — — — — — —
Hospital 128 Y Y Y — — — — — — —
Hospital 129 Y Y Y — — — — — — —
Hospital 130 Y Y Y — — — — — — —
Hospital 131 Y Y Y — — — — — — —
Hospital 132 — — Y — — — — — — —
Hospital 133 — — Y — — — — — — —
Hospital 134 — — Y — — — — — — —
Hospital 135 Y Y Y — — — — — — —
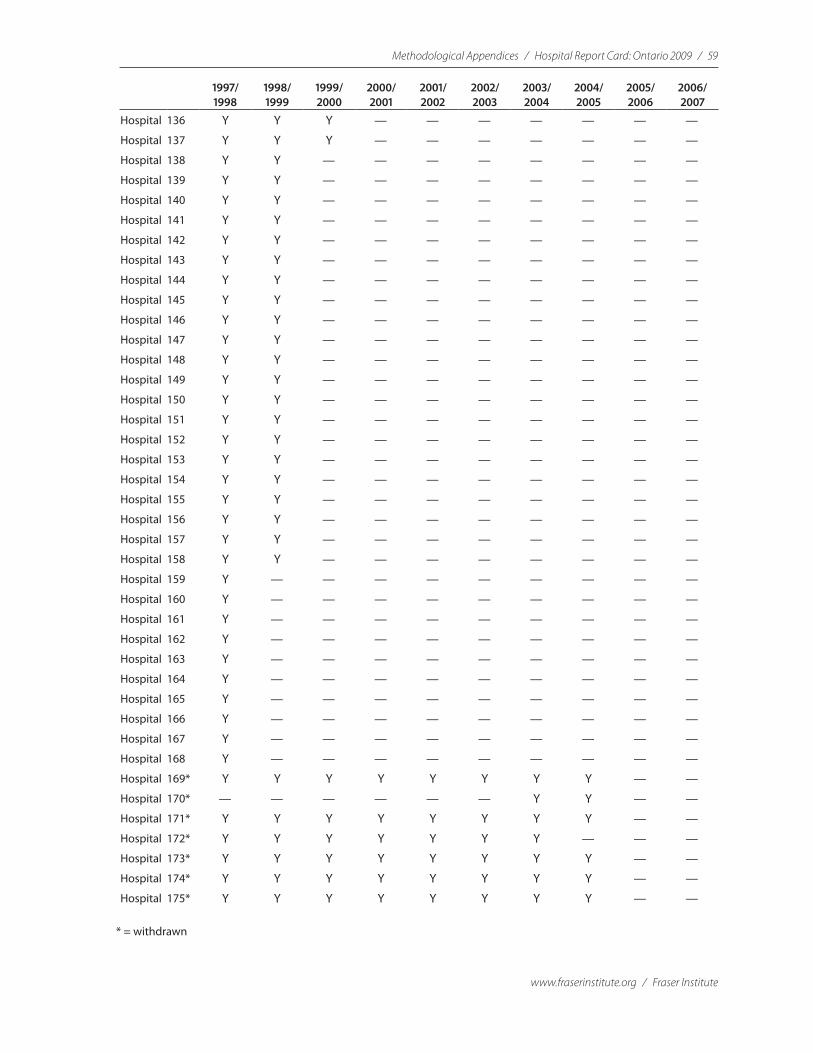
Methodological Appendices / Hospital Report Card: Ontario 2009 / 59
www.fraserinstitute.org / Fraser Institute
1997/ 1998
1998/ 1999
1999/ 2000
2000/ 2001
2001/ 2002
2002/ 2003
2003/ 2004
2004/ 2005
2005/ 2006
2006/ 2007
Hospital 136 Y Y Y — — — — — — —
Hospital 137 Y Y Y — — — — — — —
Hospital 138 Y Y — — — — — — — —
Hospital 139 Y Y — — — — — — — —
Hospital 140 Y Y — — — — — — — —
Hospital 141 Y Y — — — — — — — —
Hospital 142 Y Y — — — — — — — —
Hospital 143 Y Y — — — — — — — —
Hospital 144 Y Y — — — — — — — —
Hospital 145 Y Y — — — — — — — —
Hospital 146 Y Y — — — — — — — —
Hospital 147 Y Y — — — — — — — —
Hospital 148 Y Y — — — — — — — —
Hospital 149 Y Y — — — — — — — —
Hospital 150 Y Y — — — — — — — —
Hospital 151 Y Y — — — — — — — —
Hospital 152 Y Y — — — — — — — —
Hospital 153 Y Y — — — — — — — —
Hospital 154 Y Y — — — — — — — —
Hospital 155 Y Y — — — — — — — —
Hospital 156 Y Y — — — — — — — —
Hospital 157 Y Y — — — — — — — —
Hospital 158 Y Y — — — — — — — —
Hospital 159 Y — — — — — — — — —
Hospital 160 Y — — — — — — — — —
Hospital 161 Y — — — — — — — — —
Hospital 162 Y — — — — — — — — —
Hospital 163 Y — — — — — — — — —
Hospital 164 Y — — — — — — — — —
Hospital 165 Y — — — — — — — — —
Hospital 166 Y — — — — — — — — —
Hospital 167 Y — — — — — — — — —
Hospital 168 Y — — — — — — — — —
Hospital 169* Y Y Y Y Y Y Y Y — —
Hospital 170* — — — — — — Y Y — —
Hospital 171* Y Y Y Y Y Y Y Y — —
Hospital 172* Y Y Y Y Y Y Y — — —
Hospital 173* Y Y Y Y Y Y Y Y — —
Hospital 174* Y Y Y Y Y Y Y Y — —
Hospital 175* Y Y Y Y Y Y Y Y — —
* = withdrawn
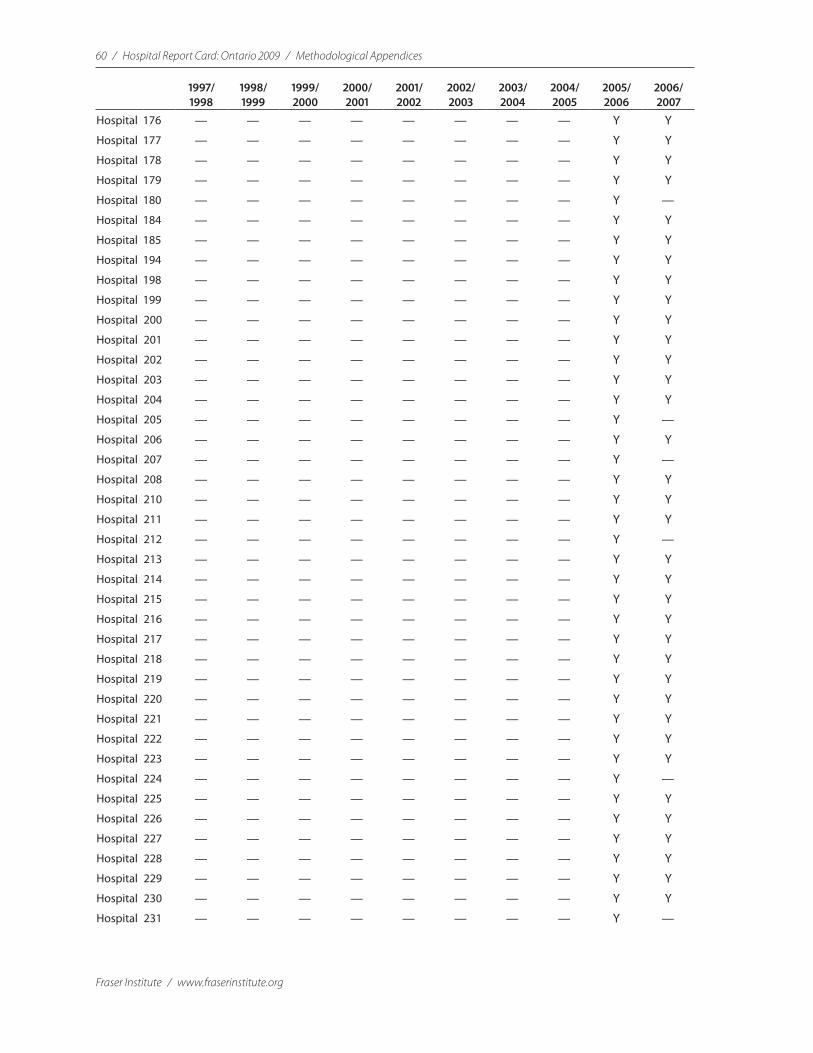
60 / Hospital Report Card: Ontario 2009 / Methodological Appendices
Fraser Institute / www.fraserinstitute.org
1997/ 1998
1998/ 1999
1999/ 2000
2000/ 2001
2001/ 2002
2002/ 2003
2003/ 2004
2004/ 2005
2005/ 2006
2006/ 2007
Hospital 176 — — — — — — — — Y Y
Hospital 177 — — — — — — — — Y Y
Hospital 178 — — — — — — — — Y Y
Hospital 179 — — — — — — — — Y Y
Hospital 180 — — — — — — — — Y —
Hospital 184 — — — — — — — — Y Y
Hospital 185 — — — — — — — — Y Y
Hospital 194 — — — — — — — — Y Y
Hospital 198 — — — — — — — — Y Y
Hospital 199 — — — — — — — — Y Y
Hospital 200 — — — — — — — — Y Y
Hospital 201 — — — — — — — — Y Y
Hospital 202 — — — — — — — — Y Y
Hospital 203 — — — — — — — — Y Y
Hospital 204 — — — — — — — — Y Y
Hospital 205 — — — — — — — — Y —
Hospital 206 — — — — — — — — Y Y
Hospital 207 — — — — — — — — Y —
Hospital 208 — — — — — — — — Y Y
Hospital 210 — — — — — — — — Y Y
Hospital 211 — — — — — — — — Y Y
Hospital 212 — — — — — — — — Y —
Hospital 213 — — — — — — — — Y Y
Hospital 214 — — — — — — — — Y Y
Hospital 215 — — — — — — — — Y Y
Hospital 216 — — — — — — — — Y Y
Hospital 217 — — — — — — — — Y Y
Hospital 218 — — — — — — — — Y Y
Hospital 219 — — — — — — — — Y Y
Hospital 220 — — — — — — — — Y Y
Hospital 221 — — — — — — — — Y Y
Hospital 222 — — — — — — — — Y Y
Hospital 223 — — — — — — — — Y Y
Hospital 224 — — — — — — — — Y —
Hospital 225 — — — — — — — — Y Y
Hospital 226 — — — — — — — — Y Y
Hospital 227 — — — — — — — — Y Y
Hospital 228 — — — — — — — — Y Y
Hospital 229 — — — — — — — — Y Y
Hospital 230 — — — — — — — — Y Y
Hospital 231 — — — — — — — — Y —
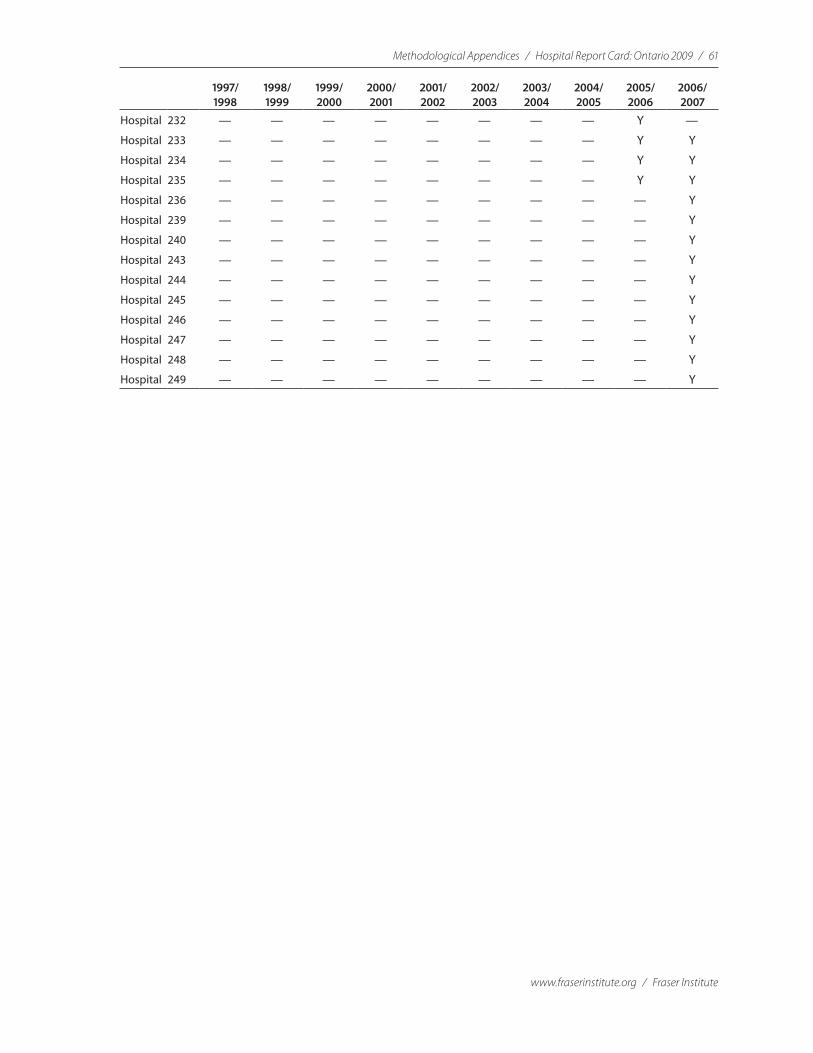
Methodological Appendices / Hospital Report Card: Ontario 2009 / 61
www.fraserinstitute.org / Fraser Institute
1997/ 1998
1998/ 1999
1999/ 2000
2000/ 2001
2001/ 2002
2002/ 2003
2003/ 2004
2004/ 2005
2005/ 2006
2006/ 2007
Hospital 232 — — — — — — — — Y —
Hospital 233 — — — — — — — — Y Y
Hospital 234 — — — — — — — — Y Y
Hospital 235 — — — — — — — — Y Y
Hospital 236 — — — — — — — — — Y
Hospital 239 — — — — — — — — — Y
Hospital 240 — — — — — — — — — Y
Hospital 243 — — — — — — — — — Y
Hospital 244 — — — — — — — — — Y
Hospital 245 — — — — — — — — — Y
Hospital 246 — — — — — — — — — Y
Hospital 247 — — — — — — — — — Y
Hospital 248 — — — — — — — — — Y
Hospital 249 — — — — — — — — — Y
62 / Hospital Report Card: Ontario 2009 / Methodological Appendices
Fraser Institute / www.fraserinstitute.org
Appendix EList of the Agency for Healthcare Research
and Quality’s Inpatient Quality and Patient
Safety Indicators used in the Fraser Institute
Hospital Report Card
The indicators measured in the Hospital Report Card are classified into threegroups: those related to medical conditions, hospital procedures, and child birth. The indicators are further classified by type: death rates, volumes of procedures, utilization rates, and adverse events. It should be noted that the indicators may vary in their computation according to the version of the AHRQ software used. Version 2.1 was used for FY 1997 to 2004 in Ontario whereas version 3.1 was used for FY 2005 and FY 2006 in Ontario and for all years in the Hospital Report Card: British Columbia. Logs of the changes made between software versions are available at:
<http://www.qualityindicators.ahrq.gov/downloads/iqi/iqi_change_log.pdf> <http://www. qualityindicators.ahrq.gov/downloads/psi/psi_change_log.pdf>.
A Conditions
Death Rates
1 Acute myocardial infarction (AMI) mortality rate (IQI 15) Deaths from heart attacks. Lower rates are more desirable.
2 Acute myocardial infarction (AMI) mortality rate (without transfers) (IQI 32) Deaths from heart attacks; excludes patients that were transferred from another short term hospital. Lower rates are more desirable.
3 Congestive heart failure (CHF) mortality rate (IQI 16) Deaths due to heart fail-ure. Lower rates are more desirable.
4 Acute Stroke mortality rate (IQI 17) Deaths from acute strokes. Lower rates are more desirable.
Methodological Appendices / Hospital Report Card: Ontario 2009 / 63
www.fraserinstitute.org / Fraser Institute
5 Gastrointestinal hemorrhage mortality rate (IQI 18) Deaths due to bleeding from the esophagus, stomach, small intestine or colon. Lower rates are more desirable.
6 Hip fracture mortality rate (IQI 19) Deaths due to hip fractures. Lower rates are more desirable.
7 Pneumonia mortality rate (IQI 20) Death due to a condition involving an infection in the lungs. Lower rates are more desirable.
8 Death in low mortality DRG (PSI 2) Deaths among patients that are consid-ered unlikely to die in the hospital. Lower rates are more desirable.
9 Failure to Rescue (PSI 4) Deaths in patients that developed specified compli-cations of care during hospitalization. Lower rates are more desirable.
Adverse Events These indicators focus on preventable instances of harm to patients such as complications arising from surgery.
1 Decubitus ulcer (PSI 3) Pressure sores that develop when a patient lies on his or her back for extended periods. Lower rates are more desirable.
2 Iatrogenic pneumothorax (PSI 6) The collapse of a patient’s lung inadvertently induced by a physician or medical treatment. Lower rates are more desirable.
3 Selected infections due to medical care (PSI 7) Cases of infection due to medi-cal care, primarily those related to intravenous (IV) lines and catheters. Lower rates are more desirable.
4 Transfusion reaction (PSI 16) Patients with blood transfusion reactions. Lower rates are more desirable.
B Procedures
Death Rates
1 Esophageal resection surgery mortality rate (IQI 8) Deaths due to the surgi-cal removal of the tube that connects the mouth to the stomach, often due to esophageal cancer. Lower rates are more desirable.
2 Pancreatic resection surgery mortality rate (IQI 9) Deaths due to the surgical removal of the pancreas, an organ that secretes many important hormones
64 / Hospital Report Card: Ontario 2009 / Methodological Appendices
Fraser Institute / www.fraserinstitute.org
such as insulin, in an attempt to cure pancreatic cancer. Lower rates are more desirable.
3 Abdominal Aortic Artery (AAA) Repair mortality rate (IQI 11) Deaths due to sur-gery performed to repair the major artery that carries blood from the heart to the lower part of the body. Lower rates are more desirable.
4 Coronary Artery Bypass Graft (CABG) mortality rate (IQI 12) Deaths due to surgery performed to allow blood to bypass a clogged artery and allow it to carry oxygen to the heart. Lower rates are more desirable.
5 Craniotomy mortality rate (IQI 13) Deaths due to the surgical opening of the skull that is performed to remove a brain tumor, repair an aneurysm (ballooning of blood vessels), perform a biopsy or to relieve pressure inside the skull. Lower rates are more desirable.
6 Hip replacement mortality rate (IQI 14) Deaths due to hip replacement sur-gery. Lower rates are more desirable.
7 Percutaneous Transluminal Coronary Angioplasty (PTCA) mortality rate (IQI 30) Deaths due to a non-surgical procedure performed to open blockages in the arteries that carry blood to the heart. Lower rates are more desirable.
8 Carotid endarterectomy mortality rate (IQI 31) Deaths due to a procedure that removes blockages from arteries in the neck to reduce the chance of stroke and brain damage. Lower rates are more desirable.
Volume of ProceduresThese indicators are calculated because they reflect procedures for which evi-dence shows that hospitals performing more of certain highly complex pro-cedures may have better outcomes for those procedures. Providers exceeding these thresholds are considered high volume providers . Please see Appendix F for further details on Volume of Procedures and their Thresholds.
1 Esophageal resection surgery volume (IQI 1) Numbers of procedures involv-ing the surgical removal of the tube that connects the mouth to the stom-ach, often due to esophageal cancer. Numbers above 6 are more desirable. Please see Appendix F for details on Threshold values.
2 Pancreatic resection surgery volume (IQI 2) Numbers of procedures involv-ing the surgical removal of the pancreas in an attempt to cure pancreatic cancer. Numbers above 10 are more desirable. Please see Appendix F for details on Threshold values.

Methodological Appendices / Hospital Report Card: Ontario 2009 / 65
www.fraserinstitute.org / Fraser Institute
3 Abdominal Aortic Artery (AAA) Repair volume (IQI 4) Numbers of procedures to repair the major artery carrying blood from the heart to the lower part of the body. Numbers above 10 are more desirable. Please see Appendix F for details on Threshold values.
4 Coronary Artery Bypass Graft (CABG) volume (IQI 5) Numbers of surgeries performed to allow blood to bypass a clogged artery. Numbers above 100 are more desirable. Please see Appendix F for details on Threshold values.
5 Percutaneous Transluminal Coronary Angioplasty volume (PTCA) (IQI 6) Number of procedures performed to open blockages in the arteries that carry blood to the heart. Numbers above 200 are more desirable. Please see Appendix F for details on Threshold values.
6 Carotid endarterectomy volume (IQI 7) Number of procedures performed to remove blockages from arteries in the neck to reduce the chance of stroke and brain damage. Numbers above 50 are more desirable. Please see Appendix F for details on Threshold values.
Utilization RatesThese indicators are calculated because they examine procedures whose use varies significantly across hospitals and for which questions have been raised about overuse, underuse, or misuse. High or low rates for these indicators are likely to represent inappropriate or inefficient delivery of care.
1 Laparoscopic cholecystectomy (IQI 23) Minimally invasive removal of the gall bladder, a small pear-shaped sac that stores and concentrates bile, which is needed for digestion. Higher rates are more desirable.
2 Incidental appendectomy among elderly (IQI 24) Removal of the appendix at the time of another necessary abdominal surgery. This procedure is per-formed to eliminate the risk of future appendicitis (inflammation of the appendix). Incidental appendectomy is generally not recommended in the elderly because they have both a lower risk for developing appendicitis and a higher risk of complications after surgery (calculated for patients 65 years or older). Lower rates are more desirable.
3 Bi-lateral cardiac catheterization (IQI 25) A diagnostic test performed to see if the blood vessels to the heart are narrowed or blocked. Lower rates are more desirable.
66 / Hospital Report Card: Ontario 2009 / Methodological Appendices
Fraser Institute / www.fraserinstitute.org
Adverse EventsThese indicators focus on preventable instances of harm to patients such as complications arising from surgery.
1 Foreign body left during procedure (PSI 5) Foreign object left in a patient during a procedure. Lower rates are more desirable.
2 Post-operative hip fracture (PSI 8) Hip fracture after surgery. Lower rates are more desirable.
3 Post-operative hemorrhage or hematoma (PSI 9) Bleeding after surgery. Lower rates are more desirable.
4 Post-operative physiologic and metabolic derangements (PSI 10) Development of disorders that interfere with biochemical processes within the body including kidney failure and diabetes occurring in patients after an elective surgery. Lower rates are more desirable.
5 Post-operative respiratory failure (PSI 11) Development of respiratory failure occurring in patients after undergoing elective surgery. Lower rates are more desirable.
6 Post-operative pulmonary embolism or deep vein thrombosis (PSI 12) These conditions occur when a blood clot (usually formed in one of the leg veins) becomes detached and lodges in the lung artery or one of its branches (pulmonary embolism) or lodges in another part of the body (usually the leg; deep vein thrombosis). This indicator is calculated for patients who develop these conditions after undergoing surgery. Lower rates are more desirable.
7 Post-operative sepsis (PSI 13) Patients that undergo elective surgeries and subsequently develop a hospital-acquired infection. Lower rates are more desirable.
8 Post-operative wound dehiscence (PSI 14) Parting of the layers of a surgical wound. Either the surface layers separate or the whole wound splits open. Lower rates are more desirable.
9 Accidental puncture or laceration (PSI 15) Accidental cut or wound during procedure. Lower rates are more desirable.
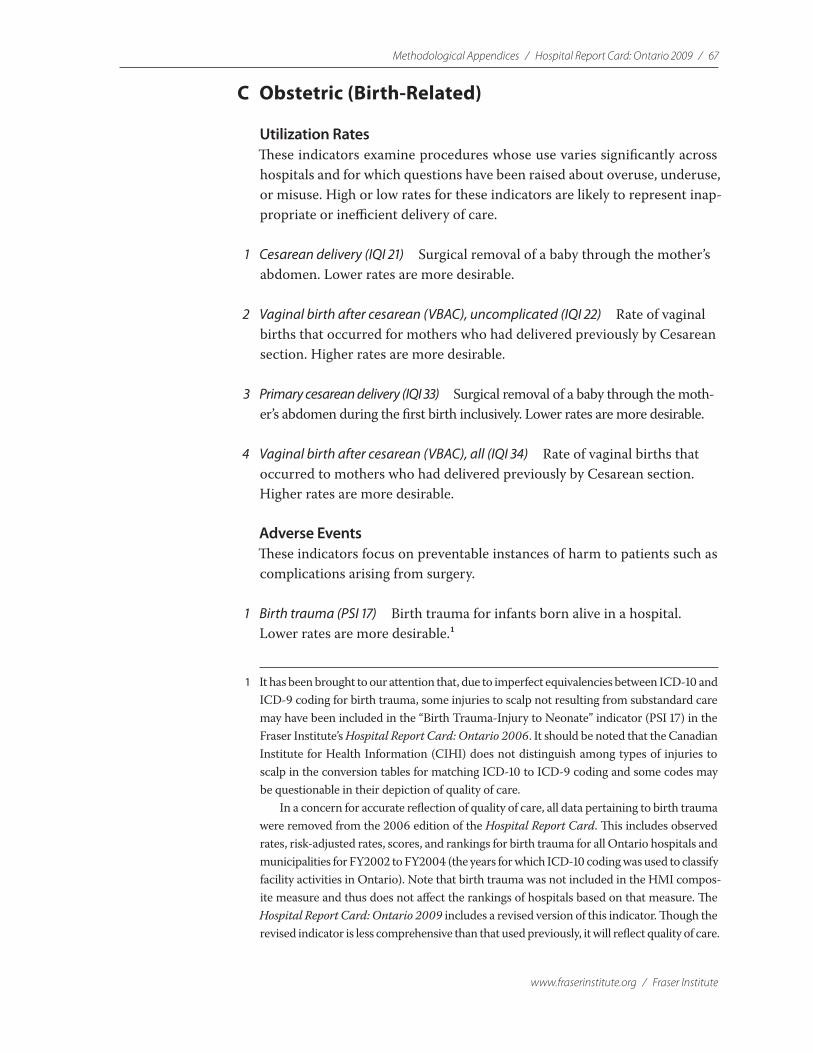
Methodological Appendices / Hospital Report Card: Ontario 2009 / 67
www.fraserinstitute.org / Fraser Institute
C Obstetric (Birth-Related)
Utilization RatesThese indicators examine procedures whose use varies significantly across hospitals and for which questions have been raised about overuse, underuse, or misuse. High or low rates for these indicators are likely to represent inap-propriate or inefficient delivery of care.
1 Cesarean delivery (IQI 21) Surgical removal of a baby through the mother’s abdomen. Lower rates are more desirable.
2 Vaginal birth after cesarean (VBAC), uncomplicated (IQI 22) Rate of vaginal births that occurred for mothers who had delivered previously by Cesarean section. Higher rates are more desirable.
3 Primary cesarean delivery (IQI 33) Surgical removal of a baby through the moth-er’s abdomen during the first birth inclusively. Lower rates are more desirable.
4 Vaginal birth after cesarean (VBAC), all (IQI 34) Rate of vaginal births that occurred to mothers who had delivered previously by Cesarean section. Higher rates are more desirable.
Adverse Events These indicators focus on preventable instances of harm to patients such as complications arising from surgery.
1 Birth trauma (PSI 17) Birth trauma for infants born alive in a hospital. Lower rates are more desirable.1
1 It has been brought to our attention that, due to imperfect equivalencies between ICD-10 and ICD-9 coding for birth trauma, some injuries to scalp not resulting from substandard care may have been included in the “Birth Trauma-Injury to Neonate” indicator (PSI 17) in the Fraser Institute’s Hospital Report Card: Ontario 2006. It should be noted that the Canadian Institute for Health Information (CIHI) does not distinguish among types of injuries to scalp in the conversion tables for matching ICD-10 to ICD-9 coding and some codes may be questionable in their depiction of quality of care.
In a concern for accurate reflection of quality of care, all data pertaining to birth trauma were removed from the 2006 edition of the Hospital Report Card. This includes observed rates, risk-adjusted rates, scores, and rankings for birth trauma for all Ontario hospitals and municipalities for FY2002 to FY2004 (the years for which ICD-10 coding was used to classify facility activities in Ontario). Note that birth trauma was not included in the HMI compos-ite measure and thus does not affect the rankings of hospitals based on that measure. The Hospital Report Card: Ontario 2009 includes a revised version of this indicator. Though the revised indicator is less comprehensive than that used previously, it will reflect quality of care.
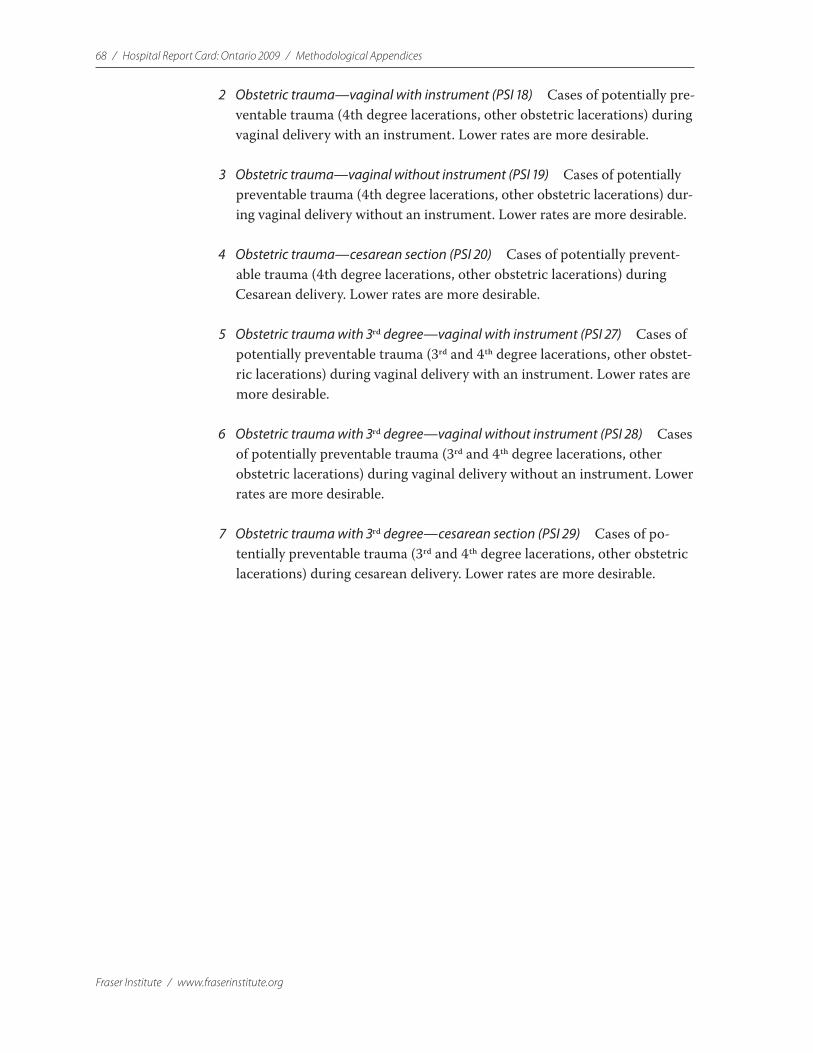
68 / Hospital Report Card: Ontario 2009 / Methodological Appendices
Fraser Institute / www.fraserinstitute.org
2 Obstetric trauma —vaginal with instrument (PSI 18) Cases of potentially pre-ventable trauma (4th degree lacerations, other obstetric lacerations) during vaginal delivery with an instrument. Lower rates are more desirable.
3 Obstetric trauma—vaginal without instrument (PSI 19) Cases of potentially preventable trauma (4th degree lacerations, other obstetric lacerations) dur-ing vaginal delivery without an instrument. Lower rates are more desirable.
4 Obstetric trauma—cesarean section (PSI 20) Cases of potentially prevent-able trauma (4th degree lacerations, other obstetric lacerations) during Cesarean delivery. Lower rates are more desirable.
5 Obstetric trauma with 3rd degree—vaginal with instrument (PSI 27) Cases of potentially preventable trauma (3rd and 4th degree lacerations, other obstet-ric lacerations) during vaginal delivery with an instrument. Lower rates are more desirable.
6 Obstetric trauma with 3rd degree—vaginal without instrument (PSI 28) Cases of potentially preventable trauma (3rd and 4th degree lacerations, other obstetric lacerations) during vaginal delivery without an instrument. Lower rates are more desirable.
7 Obstetric trauma with 3rd degree—cesarean section (PSI 29) Cases of po-tentially preventable trauma (3rd and 4th degree lacerations, other obstetric lacerations) during cesarean delivery. Lower rates are more desirable.

Methodological Appendices / Hospital Report Card: Ontario 2009 / 69
www.fraserinstitute.org / Fraser Institute
Appendix FCalculating the Score, Rank, Hospital
Mortality Index, and Rank of Hospital
Mortality Index
1 Score
Each institution was given a score from 0 to 100 for each indicator. The basis for this scoring is described below, as it varied slightly between types of indicators.
Volume Indicators Each volume indicator is supported by evidence suggesting that providers performing more than a certain number of procedures have better patient outcomes. The thresholds are listed below. Threshold 1 is the lowest reported threshold in the literature, while threshold 2 is the highest. Providers exceed-ing these thresholds are considered high-volume providers.
The scores for each volume indicator were calculated in the following manner. If the volume of procedures of a hospital did not exceed Threshold 1, a score of 0 was given. If the volume of procedures of a hospital exceeded Threshold 1 but did not exceed Threshold 2, a score of 75 was given. If the vol-ume of procedures of a hospital exceeded Threshold 2, a score of 100 was given.
Thresholds for volume of procedures indicators
Volume Indicator Threshold 1 Threshold 2 Reference for Threshold 1 Reference for Threshold 2
Esophageal resection (IQI 1)
6 7 Patti MG, Corvera CU, Glasgow RE, et al. A hospital’s annual rate of esophagectomy influences the operative mortality rate. J Gastrointest Surg 1998; 2 (2): 186–92.
Dudley RA, Johansen KL, Rand R, et al. Selective referral to high-volume hospitals: estimating potentially avoidable deaths. JAMA 2000; 283 (9): 1159–66.
Pancreatic resection (IQI 2)
10 11 Glasgow RD, Mulvihill SJ. Hospital volume influences outcome in patients undergoing pancreatic resection for cancer. West J Med 1996; 165 (5): 294–300.
Glasgow, Mulvihill, 1996.
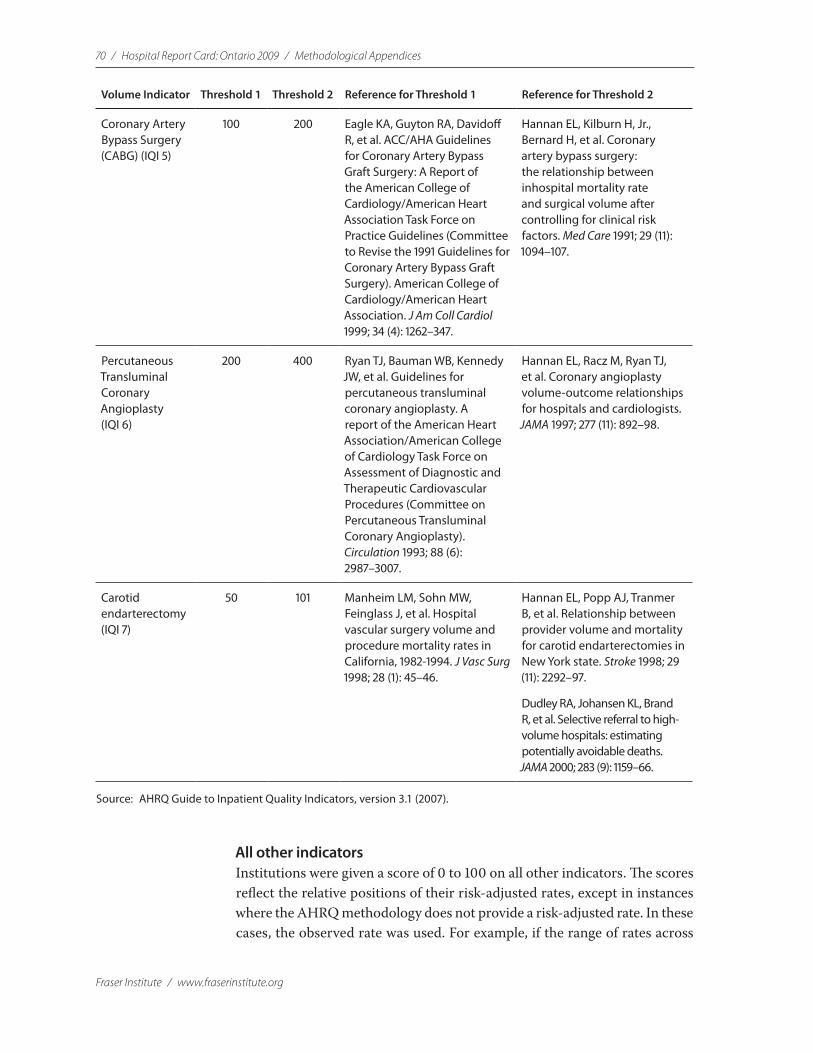
70 / Hospital Report Card: Ontario 2009 / Methodological Appendices
Fraser Institute / www.fraserinstitute.org
Volume Indicator Threshold 1 Threshold 2 Reference for Threshold 1 Reference for Threshold 2
Coronary Artery Bypass Surgery (CABG) (IQI 5)
100 200 Eagle KA, Guyton RA, Davidoff R, et al. ACC/AHA Guidelines for Coronary Artery Bypass Graft Surgery: A Report of the American College of Cardiology/American Heart Association Task Force on Practice Guidelines (Committee to Revise the 1991 Guidelines for Coronary Artery Bypass Graft Surgery). American College of Cardiology/American Heart Association. J Am Coll Cardiol 1999; 34 (4): 1262–347.
Hannan EL, Kilburn H, Jr., Bernard H, et al. Coronary artery bypass surgery: the relationship between inhospital mortality rate and surgical volume after controlling for clinical risk factors. Med Care 1991; 29 (11): 1094–107.
Percutaneous Transluminal Coronary Angioplasty (IQI 6)
200 400 Ryan TJ, Bauman WB, Kennedy JW, et al. Guidelines for percutaneous transluminal coronary angioplasty. A report of the American Heart Association/American College of Cardiology Task Force on Assessment of Diagnostic and Therapeutic Cardiovascular Procedures (Committee on Percutaneous Transluminal Coronary Angioplasty). Circulation 1993; 88 (6): 2987–3007.
Hannan EL, Racz M, Ryan TJ, et al. Coronary angioplasty volume-outcome relationships for hospitals and cardiologists. JAMA 1997; 277 (11): 892–98.
Carotid endarterectomy (IQI 7)
50 101 Manheim LM, Sohn MW, Feinglass J, et al. Hospital vascular surgery volume and procedure mortality rates in California, 1982-1994. J Vasc Surg 1998; 28 (1): 45–46.
Hannan EL, Popp AJ, Tranmer B, et al. Relationship between provider volume and mortality for carotid endarterectomies in New York state. Stroke 1998; 29 (11): 2292–97.
Dudley RA, Johansen KL, Brand R, et al. Selective referral to high-volume hospitals: estimating potentially avoidable deaths. JAMA 2000; 283 (9): 1159–66.
Source: AHRQ Guide to Inpatient Quality Indicators, version 3.1 (2007).
All other indicatorsInstitutions were given a score of 0 to 100 on all other indicators. The scores reflect the relative positions of their risk-adjusted rates, except in instances where the AHRQ methodology does not provide a risk-adjusted rate. In these cases, the observed rate was used. For example, if the range of rates across
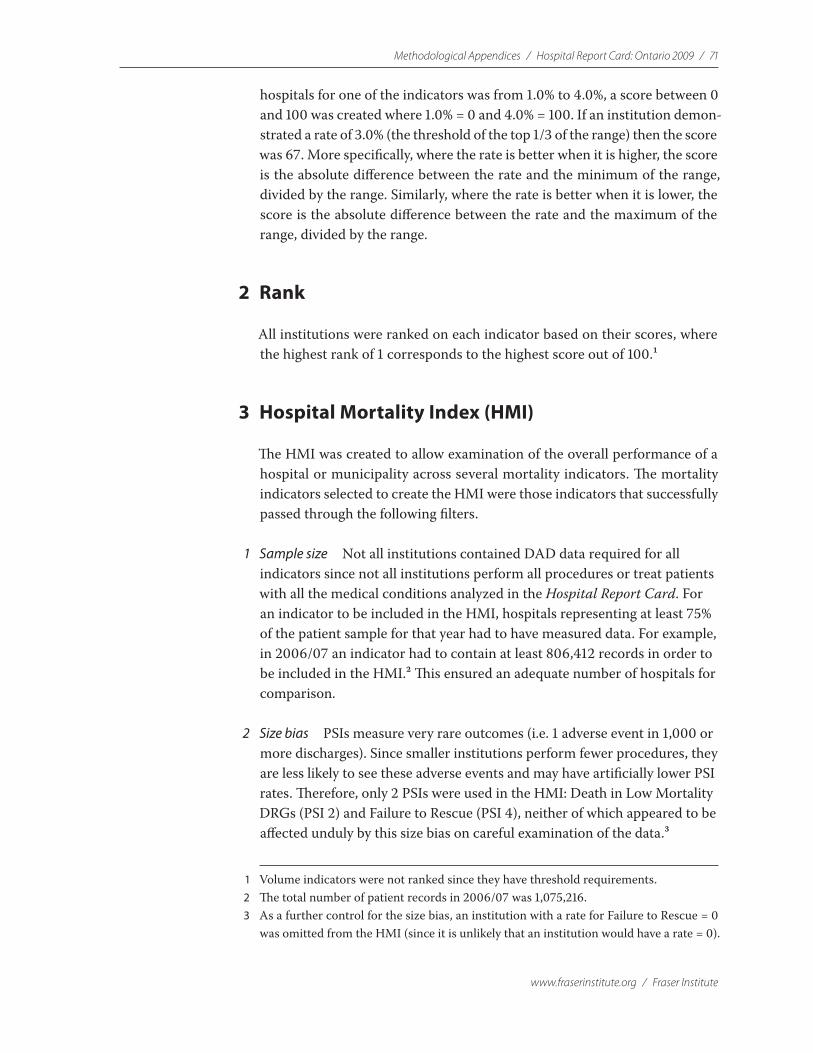
Methodological Appendices / Hospital Report Card: Ontario 2009 / 71
www.fraserinstitute.org / Fraser Institute
hospitals for one of the indicators was from 1.0% to 4.0%, a score between 0 and 100 was created where 1.0% = 0 and 4.0% = 100. If an institution demon-strated a rate of 3.0% (the threshold of the top 1/3 of the range) then the score was 67. More specifically, where the rate is better when it is higher, the score is the absolute difference between the rate and the minimum of the range, divided by the range. Similarly, where the rate is better when it is lower, the score is the absolute difference between the rate and the maximum of the range, divided by the range.
2 Rank
All institutions were ranked on each indicator based on their scores, where the highest rank of 1 corresponds to the highest score out of 100.1
3 Hospital Mortality Index (HMI)
The HMI was created to allow examination of the overall performance of a hospital or municipality across several mortality indicators. The mortality indicators selected to create the HMI were those indicators that successfully passed through the following filters.
1 Sample size Not all institutions contained DAD data required for all indicators since not all institutions perform all procedures or treat patients with all the medical conditions analyzed in the Hospital Report Card. For an indicator to be included in the HMI, hospitals representing at least 75% of the patient sample for that year had to have measured data. For example, in 2006/07 an indicator had to contain at least 806,412 records in order to be included in the HMI.2 This ensured an adequate number of hospitals for comparison.
2 Size bias PSIs measure very rare outcomes (i.e. 1 adverse event in 1,000 or more discharges). Since smaller institutions perform fewer procedures, they are less likely to see these adverse events and may have artificially lower PSI rates. Therefore, only 2 PSIs were used in the HMI: Death in Low Mortality DRGs (PSI 2) and Failure to Rescue (PSI 4), neither of which appeared to be affected unduly by this size bias on careful examination of the data.3
1 Volume indicators were not ranked since they have threshold requirements. 2 The total number of patient records in 2006/07 was 1,075,216. 3 As a further control for the size bias, an institution with a rate for Failure to Rescue = 0
was omitted from the HMI (since it is unlikely that an institution would have a rate = 0).
72 / Hospital Report Card: Ontario 2009 / Methodological Appendices
Fraser Institute / www.fraserinstitute.org
3 Sample coverage Some indicators could only be calculated accurately in ei-ther the ICD-9/CCP or ICD-10-CA/CCI periods, but not both (please refer to Appendix G for further details). With the sole exception of IQI 15, only indicators that were used in both classifications were used for calculation of the HMI.4
Only eight mortality indicators passed these filters from FY1997 to FY2001 and nine from FY2002 onwards. The mortality indicators included in the HMI are: hip replacement mortality (IQI 14), congestive heart failure mortality (IQI 16), acute stroke mortality (IQI 17), gastrointestinal hemor-rhage mortality (IQI 18), hip fracture mortality (IQI 19), pneumonia mortality (IQI 20), death in low mortality DRGs (PSI 2)5 and failure to rescue rates (PSI 4).6 Acute myocardial infarction mortality (IQI 15) is included from 2002/03 onwards.
4 Rank of the Hospital Mortality Index (HMI)
All institutions were ranked based on their HMI value, where the highest rank of 1 corresponds to the highest score out of 100.
4 IQI 15 is included in the HMI since sufficient coverage existed for this indicator and since AMI mortality rates are very commonly used as a measure of mortality.
5 PSI 2 is no longer risk-adjusted in version 3.1 of the AHRQ software. The observed rate, rather than the risk-adjusted rate, of this measure was used for computation of the HMI from 2005/06 onwards.
6 The HMI is not a comprehensive rating of overall inpatient care in a hospital setting but is a broad measure of mortality rates, which are likely the most accurately recorded patient outcome.

Methodological Appendices / Hospital Report Card: Ontario 2009 / 73
www.fraserinstitute.org / Fraser Institute
Appendix GIndicators Omitted from This Report
Intrinsic differences between ICD-9/CCP and ICD-10-CA/CCI resulted in several indicators being reported either in data coded in ICD-9/CCP (DAD data from FY1997 to FY2001) or in data coded in ICD-10-CA/CCI (DAD data from FY2002 onwards), but not both.
A Indicators Not Calculated from Data Coded in ICD-10-CA/CCI (2002/03 onwards)
1 AAA Volume/Mortality (IQI 4/11) Conversion of the required ICD-10-CA/CCI diagnosis and procedure codes to ICD-9-CM for calculation of IQI 4 & 11 did not produce accurate results. This was caused by intrinsic differences between the classifications.
2 PTCA Volume/Mortality (IQI 6/30) (2002/03 only)The rates for IQI 6 & 30 in FY2002, the first year for ICD-10 coding in Ontario, were outliers when compared to rates in FY2003 and FY2004.
3 Incidental Appendectomy among Elderly Utilization Rate (IQI 24)The numerator of IQI 24 is composed of incidental appendectomy pro-cedure codes: Incidental appendectomy (471), Laparoscopic incidental appendectomy (4711), and Other incidental appendectomy (4719). No ICD-10-CA/CCI codes translate directly into the required ICD-9-CM procedure codes.
4 Bilateral Cardiac Catheterization Utilization Rate (IQI 25)The numerator of IQI 25 is composed of the number of simultaneous right and left heart catheterizations: Right/Left heart cardiac catheterization (3723). No ICD-10-CA/CCI codes translate directly into the required ICD-9-CM procedure code.
5 Post-operative Hip Fracture (PSI 8)Conversion of the required ICD-10-CA/CCI diagnosis codes to ICD-9-CM for PSI 8 did not produce accurate results. This was caused by intrinsic dif-ferences between the classifications.

74 / Hospital Report Card: Ontario 2009 / Methodological Appendices
Fraser Institute / www.fraserinstitute.org
6 Post-operative Hemorrhage or Hematoma (PSI 9)Conversion of the required ICD-10-CA/CCI diagnosis codes to ICD-9-CM did not produce accurate results. This was caused by intrinsic differences between the classifications.
7 Post-operative Pulmonary Embolism or Deep Vein Thrombosis (PSI 12)Conversion of the required ICD-10-CA/CCI diagnosis codes to ICD-9-CM did not produce accurate results. This was caused by intrinsic differences between the classifications.
8 Post-operative Wound Dehiscence (PSI 14)The numerator of PSI 14 is composed of the number of discharges with an ICD-9-CM code for reclosure of postoperative disruption of the abdomi-nal wall (5461) in any secondary procedure field. No ICD-10-CA/CCI codes translate directly into the required ICD-9-CM procedure code.
9 Obstetric Trauma with 3rd Degree—Vaginal with Instrument (PSI 27), Obstetric Trauma with 3rd Degree—Vaginal without Instrument (PSI 28), Obstetric Trauma with 3rd Degree—cesarean section (PSI 29) 2005/06 onwardsThese three indicators were dropped in versions 3.0 and 3.1 of the AHRQ software and are thus not calculated for FY 2005 onwards.
B Indicators Not Calculated from Data Coded in ICD-9/CCP (FY1997 to FY2001)
1 Acute Myocardial Infarction Mortality Rate (IQI 15 & 32)ICD-9-CM is a more specific and updated coding classification than ICD-9/CCP. This results in numerous (more specific) ICD-9-CM codes mapping to a single (general) ICD-9/CCP code. For example, in ICD-9/CCP there is a single code that denotes an acute myocardial infarction (AMI) (410), com-pared to 30 more specific codes contained in ICD-9-CM, as shown in the following table.
ICD-9/CCP to ICD-9-CM conversion tableICD-9/CCP ICD-9-CM
410 AMI 41000 AMI ANTEROLATERAL WALL EPISODE NOS
410 AMI 41001 AMI ANTEROLATERAL WALL INIT EPISODE
410 AMI 41002 AMI ANTEROLATERAL WALL SUBSEQ EPISODE
410 AMI 41010 AMI OTHER ANT WALL EPISODE UNSPEC
410 AMI 41011 AMI OTHER ANT WALL INIT EPISODE
410 AMI 41012 AMI OTHER ANT WALL SUBSEQUENT EPISODE
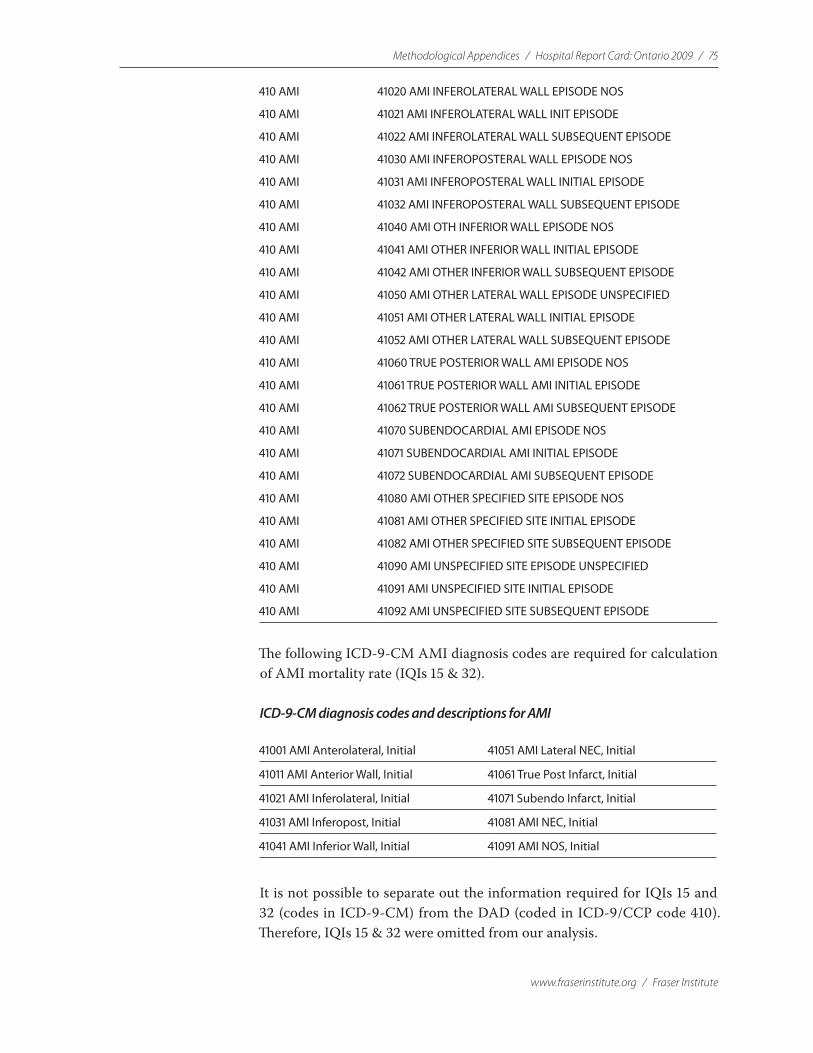
Methodological Appendices / Hospital Report Card: Ontario 2009 / 75
www.fraserinstitute.org / Fraser Institute
410 AMI 41020 AMI INFEROLATERAL WALL EPISODE NOS
410 AMI 41021 AMI INFEROLATERAL WALL INIT EPISODE
410 AMI 41022 AMI INFEROLATERAL WALL SUBSEQUENT EPISODE
410 AMI 41030 AMI INFEROPOSTERAL WALL EPISODE NOS
410 AMI 41031 AMI INFEROPOSTERAL WALL INITIAL EPISODE
410 AMI 41032 AMI INFEROPOSTERAL WALL SUBSEQUENT EPISODE
410 AMI 41040 AMI OTH INFERIOR WALL EPISODE NOS
410 AMI 41041 AMI OTHER INFERIOR WALL INITIAL EPISODE
410 AMI 41042 AMI OTHER INFERIOR WALL SUBSEQUENT EPISODE
410 AMI 41050 AMI OTHER LATERAL WALL EPISODE UNSPECIFIED
410 AMI 41051 AMI OTHER LATERAL WALL INITIAL EPISODE
410 AMI 41052 AMI OTHER LATERAL WALL SUBSEQUENT EPISODE
410 AMI 41060 TRUE POSTERIOR WALL AMI EPISODE NOS
410 AMI 41061 TRUE POSTERIOR WALL AMI INITIAL EPISODE
410 AMI 41062 TRUE POSTERIOR WALL AMI SUBSEQUENT EPISODE
410 AMI 41070 SUBENDOCARDIAL AMI EPISODE NOS
410 AMI 41071 SUBENDOCARDIAL AMI INITIAL EPISODE
410 AMI 41072 SUBENDOCARDIAL AMI SUBSEQUENT EPISODE
410 AMI 41080 AMI OTHER SPECIFIED SITE EPISODE NOS
410 AMI 41081 AMI OTHER SPECIFIED SITE INITIAL EPISODE
410 AMI 41082 AMI OTHER SPECIFIED SITE SUBSEQUENT EPISODE
410 AMI 41090 AMI UNSPECIFIED SITE EPISODE UNSPECIFIED
410 AMI 41091 AMI UNSPECIFIED SITE INITIAL EPISODE
410 AMI 41092 AMI UNSPECIFIED SITE SUBSEQUENT EPISODE
The following ICD-9-CM AMI diagnosis codes are required for calculation of AMI mortality rate (IQIs 15 & 32).
ICD-9-CM diagnosis codes and descriptions for AMI
41001 AMI Anterolateral, Initial 41051 AMI Lateral NEC, Initial
41011 AMI Anterior Wall, Initial 41061 True Post Infarct, Initial
41021 AMI Inferolateral, Initial 41071 Subendo Infarct, Initial
41031 AMI Inferopost, Initial 41081 AMI NEC, Initial
41041 AMI Inferior Wall, Initial 41091 AMI NOS, Initial
It is not possible to separate out the information required for IQIs 15 and 32 (codes in ICD-9-CM) from the DAD (coded in ICD-9/CCP code 410). Therefore, IQIs 15 & 32 were omitted from our analysis.

76 / Hospital Report Card: Ontario 2009 / Methodological Appendices
Fraser Institute / www.fraserinstitute.org
2 Cesarean Delivery Utilization Rate/Primary Cesarean Delivery Utilization Rate & Vaginal Birth After Cesarean (VBAC), All/Uncomplicated Utilization Rate (IQI 21/33 & IQI 22/34)The calculation of IQIs 21/33, & 22/34 are based on the DRGs in the follow-ing table.
DRG number and description table
DRG Description
370 CESAREAN SECTION W CC
371 CESAREAN SECTION W/O CC
372 VAGINAL DELIVERY W COMPLICATION
373 VAG DELIVERY W/O COMPLICATION
374 VAG DELIV W STERIL OR DC
375 VAG DELIV W OTH OR PROC
These DRGs are calculated by the CMS Diagnosis Related Grouper, which itself is based on the ICD-9-CM coding classification, and are based on the patient’s principle diagnosis.
ICD-9-CM is a more specific coding classification than ICD-9/CCP. This results in numerous (more specific) ICD-9-CM codes mapping to a sin-gle (general) ICD-9/CCP code. In all cases where this occurred, the ICD-9/CCP code was translated to the Unspecified/Not Otherwise Specified1 ICD-9-CM code (please refer to Appendix J part B for further details on translating between ICD-9/CCP and ICD-9-CM).
When this translation was performed on the diagnosis codes required for DRGs 370-375, the CMS software produced DRG 469 (illogical primary diagnosis) instead. This is because the software does not recognize these
“Unspecified/Not Otherwise Specified” codes in the primary diagnosis field. Since the definitions of IQIs 21, 22, 33, and 34 are dependent on DRGs 370–375, these indicators were omitted from our analysis.
3 Obstetric Trauma—Vaginal Delivery with Instrument/Obstetric Trauma with 3rd Degree—Vaginal with Instrument (PSI 18/27)The denominators of PSIs 18 & 27 are partially based on the DRGs in the following table.
1 ICD-9-CM contains several conventions including “NOS” or “Not otherwise specified” (usually a code with a 4th digit 9 or 5th digit 0 for diagnosis codes). They are for use when the information in the medical record is insufficient to assign a more specific code.
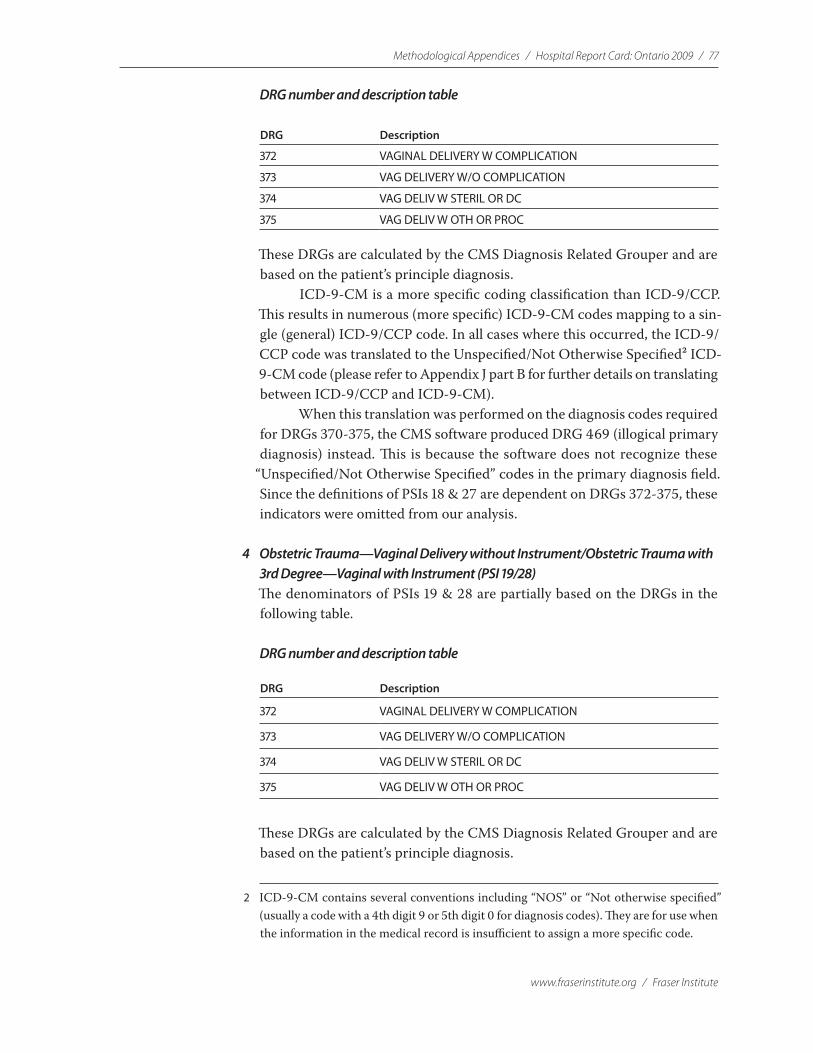
Methodological Appendices / Hospital Report Card: Ontario 2009 / 77
www.fraserinstitute.org / Fraser Institute
DRG number and description table
DRG Description
372 VAGINAL DELIVERY W COMPLICATION
373 VAG DELIVERY W/O COMPLICATION
374 VAG DELIV W STERIL OR DC
375 VAG DELIV W OTH OR PROC
These DRGs are calculated by the CMS Diagnosis Related Grouper and are based on the patient’s principle diagnosis.
ICD-9-CM is a more specific coding classification than ICD-9/CCP. This results in numerous (more specific) ICD-9-CM codes mapping to a sin-gle (general) ICD-9/CCP code. In all cases where this occurred, the ICD-9/CCP code was translated to the Unspecified/Not Otherwise Specified2 ICD-9-CM code (please refer to Appendix J part B for further details on translating between ICD-9/CCP and ICD-9-CM).
When this translation was performed on the diagnosis codes required for DRGs 370-375, the CMS software produced DRG 469 (illogical primary diagnosis) instead. This is because the software does not recognize these
“Unspecified/Not Otherwise Specified” codes in the primary diagnosis field. Since the definitions of PSIs 18 & 27 are dependent on DRGs 372-375, these indicators were omitted from our analysis.
4 Obstetric Trauma—Vaginal Delivery without Instrument/Obstetric Trauma with 3rd Degree—Vaginal with Instrument (PSI 19/28)The denominators of PSIs 19 & 28 are partially based on the DRGs in the following table.
DRG number and description table
DRG Description
372 VAGINAL DELIVERY W COMPLICATION
373 VAG DELIVERY W/O COMPLICATION
374 VAG DELIV W STERIL OR DC
375 VAG DELIV W OTH OR PROC
These DRGs are calculated by the CMS Diagnosis Related Grouper and are based on the patient’s principle diagnosis.
2 ICD-9-CM contains several conventions including “NOS” or “Not otherwise specified” (usually a code with a 4th digit 9 or 5th digit 0 for diagnosis codes). They are for use when the information in the medical record is insufficient to assign a more specific code.
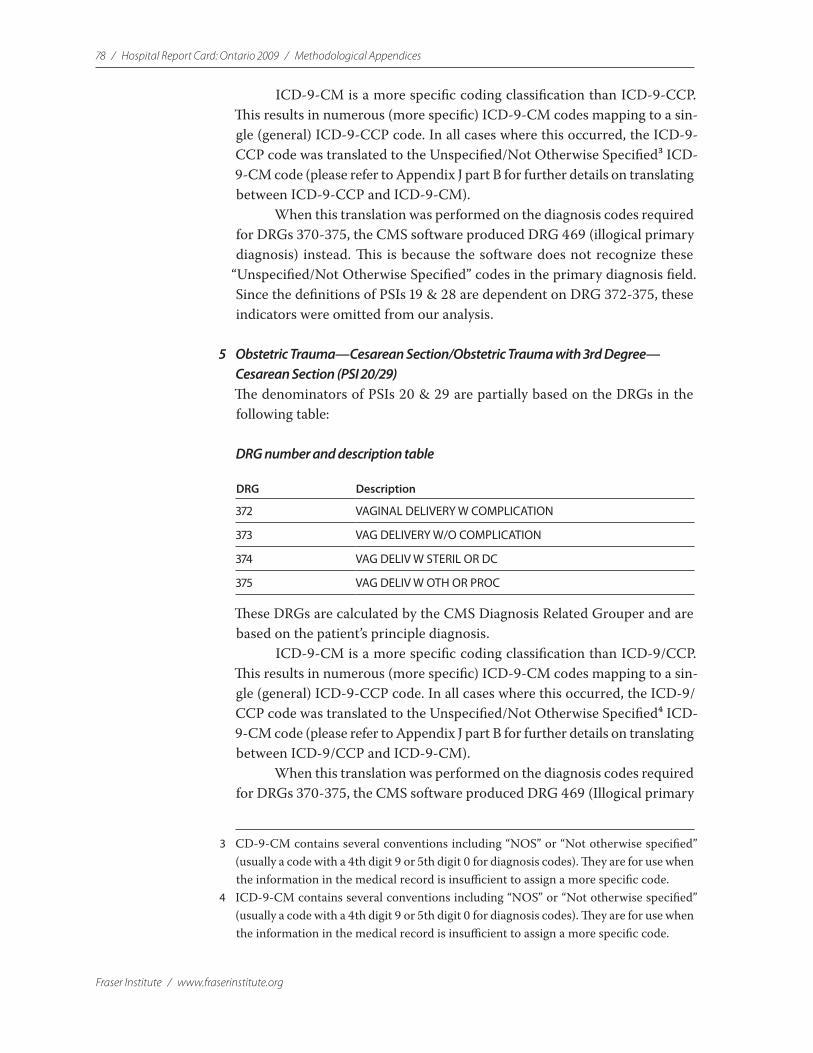
78 / Hospital Report Card: Ontario 2009 / Methodological Appendices
Fraser Institute / www.fraserinstitute.org
ICD-9-CM is a more specific coding classification than ICD-9-CCP. This results in numerous (more specific) ICD-9-CM codes mapping to a sin-gle (general) ICD-9-CCP code. In all cases where this occurred, the ICD-9-CCP code was translated to the Unspecified/Not Otherwise Specified3 ICD-9-CM code (please refer to Appendix J part B for further details on translating between ICD-9-CCP and ICD-9-CM).
When this translation was performed on the diagnosis codes required for DRGs 370-375, the CMS software produced DRG 469 (illogical primary diagnosis) instead. This is because the software does not recognize these
“Unspecified/Not Otherwise Specified” codes in the primary diagnosis field. Since the definitions of PSIs 19 & 28 are dependent on DRG 372-375, these indicators were omitted from our analysis.
5 Obstetric Trauma—Cesarean Section/Obstetric Trauma with 3rd Degree—Cesarean Section (PSI 20/29)The denominators of PSIs 20 & 29 are partially based on the DRGs in the following table:
DRG number and description table
DRG Description
372 VAGINAL DELIVERY W COMPLICATION
373 VAG DELIVERY W/O COMPLICATION
374 VAG DELIV W STERIL OR DC
375 VAG DELIV W OTH OR PROC
These DRGs are calculated by the CMS Diagnosis Related Grouper and are based on the patient’s principle diagnosis.
ICD-9-CM is a more specific coding classification than ICD-9/CCP. This results in numerous (more specific) ICD-9-CM codes mapping to a sin-gle (general) ICD-9-CCP code. In all cases where this occurred, the ICD-9/CCP code was translated to the Unspecified/Not Otherwise Specified4 ICD-9-CM code (please refer to Appendix J part B for further details on translating between ICD-9/CCP and ICD-9-CM).
When this translation was performed on the diagnosis codes required for DRGs 370-375, the CMS software produced DRG 469 (Illogical primary
3 CD-9-CM contains several conventions including “NOS” or “Not otherwise specified” (usually a code with a 4th digit 9 or 5th digit 0 for diagnosis codes). They are for use when the information in the medical record is insufficient to assign a more specific code.
4 ICD-9-CM contains several conventions including “NOS” or “Not otherwise specified” (usually a code with a 4th digit 9 or 5th digit 0 for diagnosis codes). They are for use when the information in the medical record is insufficient to assign a more specific code.
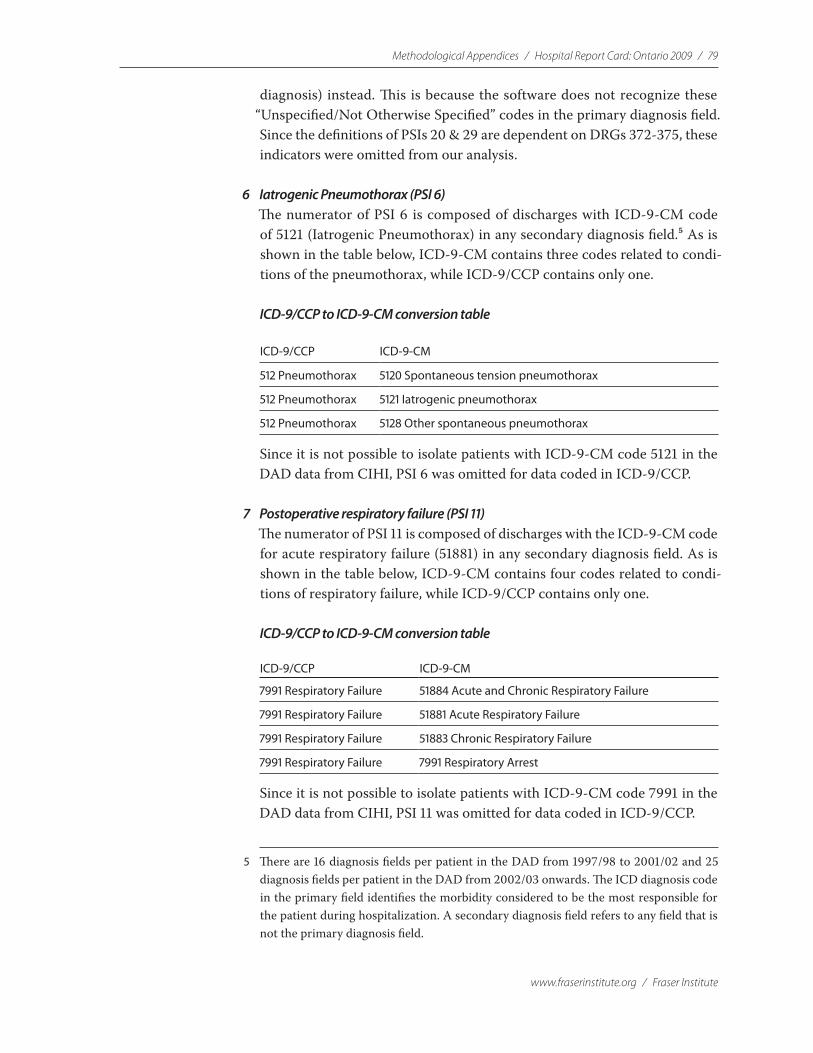
Methodological Appendices / Hospital Report Card: Ontario 2009 / 79
www.fraserinstitute.org / Fraser Institute
diagnosis) instead. This is because the software does not recognize these “Unspecified/Not Otherwise Specified” codes in the primary diagnosis field. Since the definitions of PSIs 20 & 29 are dependent on DRGs 372-375, these indicators were omitted from our analysis.
6 Iatrogenic Pneumothorax (PSI 6)The numerator of PSI 6 is composed of discharges with ICD-9-CM code of 5121 (Iatrogenic Pneumothorax) in any secondary diagnosis field.5 As is shown in the table below, ICD-9-CM contains three codes related to condi-tions of the pneumothorax, while ICD-9/CCP contains only one.
ICD-9/CCP to ICD-9-CM conversion table
ICD-9/CCP ICD-9-CM
512 Pneumothorax 5120 Spontaneous tension pneumothorax
512 Pneumothorax 5121 Iatrogenic pneumothorax
512 Pneumothorax 5128 Other spontaneous pneumothorax
Since it is not possible to isolate patients with ICD-9-CM code 5121 in the DAD data from CIHI, PSI 6 was omitted for data coded in ICD-9/CCP.
7 Postoperative respiratory failure (PSI 11) The numerator of PSI 11 is composed of discharges with the ICD-9-CM code for acute respiratory failure (51881) in any secondary diagnosis field. As is shown in the table below, ICD-9-CM contains four codes related to condi-tions of respiratory failure, while ICD-9/CCP contains only one.
ICD-9/CCP to ICD-9-CM conversion table
ICD-9/CCP ICD-9-CM
7991 Respiratory Failure 51884 Acute and Chronic Respiratory Failure
7991 Respiratory Failure 51881 Acute Respiratory Failure
7991 Respiratory Failure 51883 Chronic Respiratory Failure
7991 Respiratory Failure 7991 Respiratory Arrest
Since it is not possible to isolate patients with ICD-9-CM code 7991 in the DAD data from CIHI, PSI 11 was omitted for data coded in ICD-9/CCP.
5 There are 16 diagnosis fields per patient in the DAD from 1997/98 to 2001/02 and 25 diagnosis fields per patient in the DAD from 2002/03 onwards. The ICD diagnosis code in the primary field identifies the morbidity considered to be the most responsible for the patient during hospitalization. A secondary diagnosis field refers to any field that is not the primary diagnosis field.
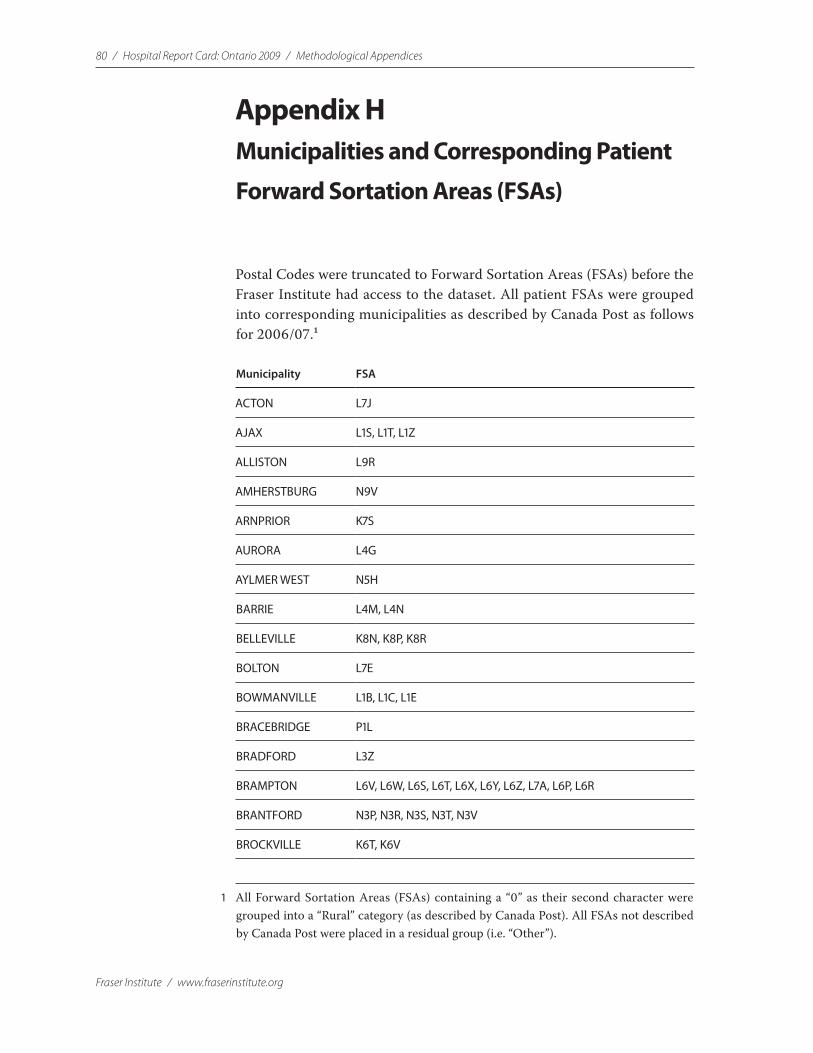
80 / Hospital Report Card: Ontario 2009 / Methodological Appendices
Fraser Institute / www.fraserinstitute.org
Appendix HMunicipalities and Corresponding Patient
Forward Sortation Areas (FSAs)
Postal Codes were truncated to Forward Sortation Areas (FSAs) before the Fraser Institute had access to the dataset. All patient FSAs were grouped into corresponding municipalities as described by Canada Post as follows for 2006/07.1
Municipality FSA
ACTON L7J
AJAX L1S, L1T, L1Z
ALLISTON L9R
AMHERSTBURG N9V
ARNPRIOR K7S
AURORA L4G
AYLMER WEST N5H
BARRIE L4M, L4N
BELLEVILLE K8N, K8P, K8R
BOLTON L7E
BOWMANVILLE L1B, L1C, L1E
BRACEBRIDGE P1L
BRADFORD L3Z
BRAMPTON L6V, L6W, L6S, L6T, L6X, L6Y, L6Z, L7A, L6P, L6R
BRANTFORD N3P, N3R, N3S, N3T, N3V
BROCKVILLE K6T, K6V
1 All Forward Sortation Areas (FSAs) containing a “0” as their second character were grouped into a “Rural” category (as described by Canada Post). All FSAs not described by Canada Post were placed in a residual group (i.e. “Other”).
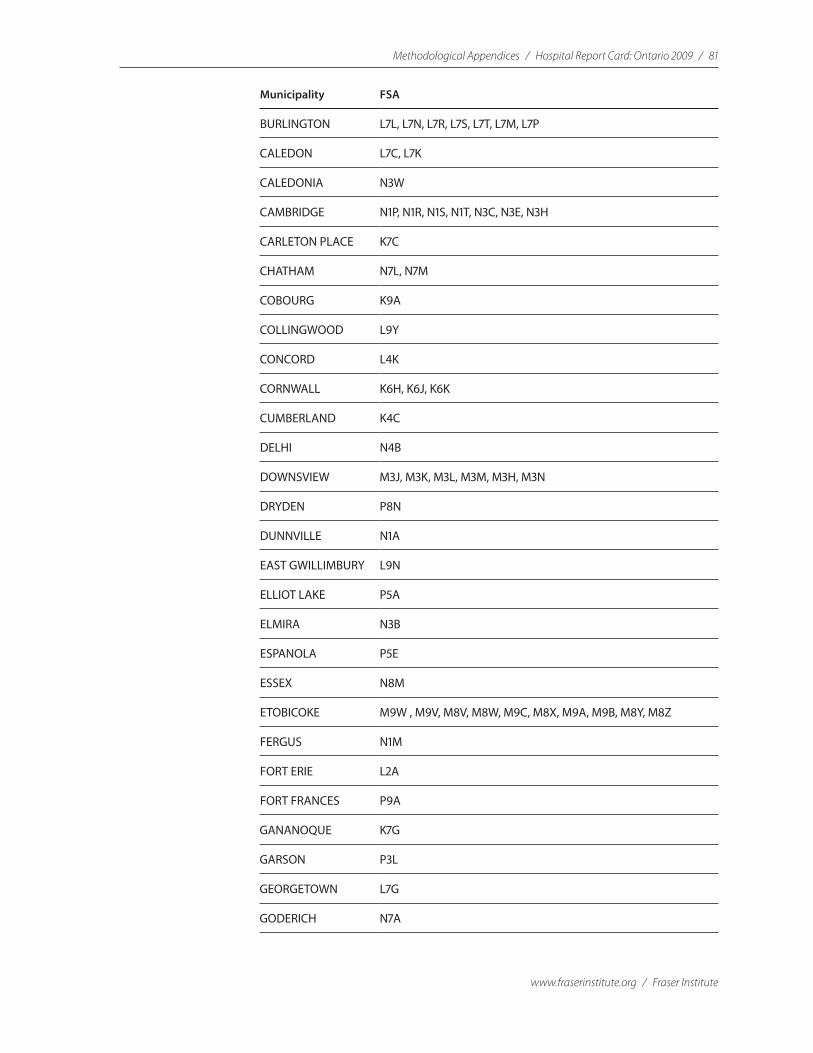
Methodological Appendices / Hospital Report Card: Ontario 2009 / 81
www.fraserinstitute.org / Fraser Institute
Municipality FSA
BURLINGTON L7L, L7N, L7R, L7S, L7T, L7M, L7P
CALEDON L7C, L7K
CALEDONIA N3W
CAMBRIDGE N1P, N1R, N1S, N1T, N3C, N3E, N3H
CARLETON PLACE K7C
CHATHAM N7L, N7M
COBOURG K9A
COLLINGWOOD L9Y
CONCORD L4K
CORNWALL K6H, K6J, K6K
CUMBERLAND K4C
DELHI N4B
DOWNSVIEW M3J, M3K, M3L, M3M, M3H, M3N
DRYDEN P8N
DUNNVILLE N1A
EAST GWILLIMBURY L9N
ELLIOT LAKE P5A
ELMIRA N3B
ESPANOLA P5E
ESSEX N8M
ETOBICOKE M9W , M9V, M8V, M8W, M9C, M8X, M9A, M9B, M8Y, M8Z
FERGUS N1M
FORT ERIE L2A
FORT FRANCES P9A
GANANOQUE K7G
GARSON P3L
GEORGETOWN L7G
GODERICH N7A

82 / Hospital Report Card: Ontario 2009 / Methodological Appendices
Fraser Institute / www.fraserinstitute.org
Municipality FSA
GRAVENHURST P1P
GREELY K4P
GRIMSBY L3M
GUELPH N1C, N1E, N1G, N1H, N1K, N1L
HAMILTON L9H, L8M, L8N, L8P, L8R, L8S, L8T, L8V, L8W, L8E, L8G, L8J, L9G, L9K, L9A, L9B, L9C, L8H, L8K
HANMER P3P
HANOVER N4N
HAWKESBURY K6A
HUNTSVILLE P1H
INGERSOLL N5C
INNISFIL L9S
KAPUSKASING P5N
KENORA P9N
KESWICK L4P
KINCARDINE N2Z
KING CITY L7B
KINGSTON K7M, K7N, K7P, K7K, K7L
KINGSVILLE N9Y
KIRKLAND LAKE P2N
KITCHENER N2J, N2L, N2T, N2V, N2A, N2C, N2B, N2G, N2H, N2K, N2E, N2M, N2N, N2R
LEAMINGTON N8H
LINDSAY K9V
LISTOWEL N4W
LIVELY P3Y
LONDON N5Z, N6A, N6B, N5V, N5W, N5X, N5Y, N6M, N6J, N6K, N6P, N6G, N6H, N6C, N6E, N6L, N6N
MANOTICK K4M
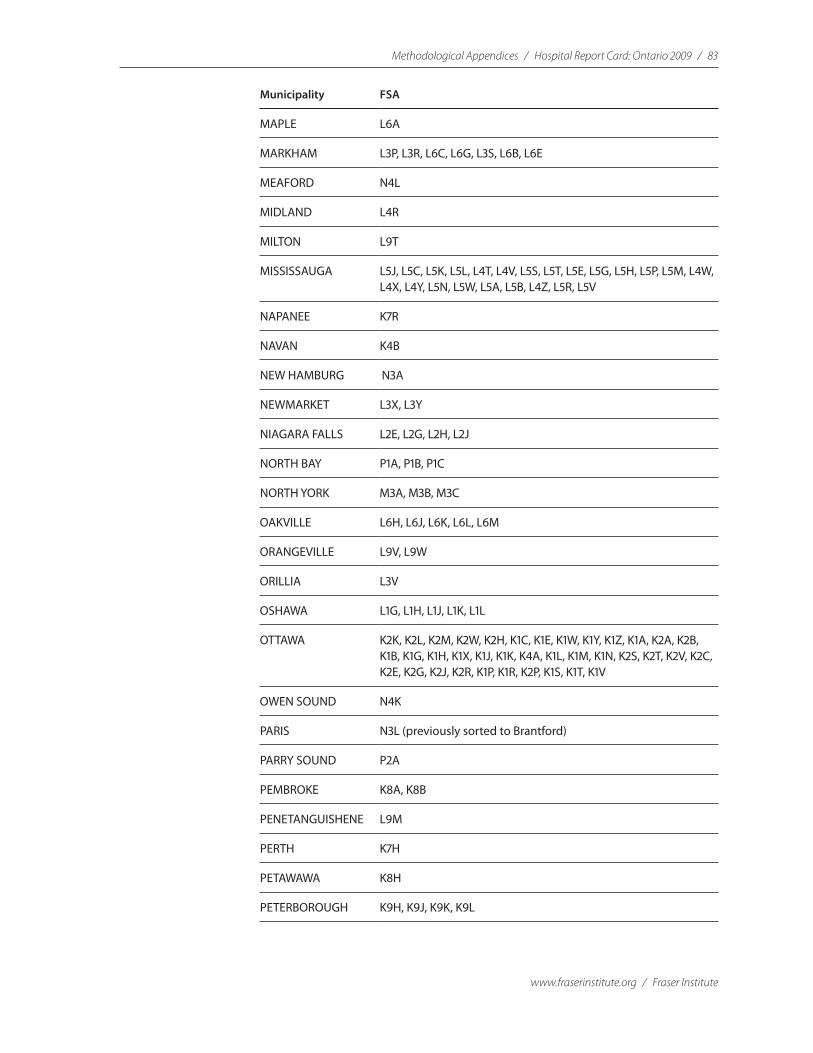
Methodological Appendices / Hospital Report Card: Ontario 2009 / 83
www.fraserinstitute.org / Fraser Institute
Municipality FSA
MAPLE L6A
MARKHAM L3P, L3R, L6C, L6G, L3S, L6B, L6E
MEAFORD N4L
MIDLAND L4R
MILTON L9T
MISSISSAUGA L5J, L5C, L5K, L5L, L4T, L4V, L5S, L5T, L5E, L5G, L5H, L5P, L5M, L4W, L4X, L4Y, L5N, L5W, L5A, L5B, L4Z, L5R, L5V
NAPANEE K7R
NAVAN K4B
NEW HAMBURG N3A
NEWMARKET L3X, L3Y
NIAGARA FALLS L2E, L2G, L2H, L2J
NORTH BAY P1A, P1B, P1C
NORTH YORK M3A, M3B, M3C
OAKVILLE L6H, L6J, L6K, L6L, L6M
ORANGEVILLE L9V, L9W
ORILLIA L3V
OSHAWA L1G, L1H, L1J, L1K, L1L
OTTAWA K2K, K2L, K2M, K2W, K2H, K1C, K1E, K1W, K1Y, K1Z, K1A, K2A, K2B, K1B, K1G, K1H, K1X, K1J, K1K, K4A, K1L, K1M, K1N, K2S, K2T, K2V, K2C, K2E, K2G, K2J, K2R, K1P, K1R, K2P, K1S, K1T, K1V
OWEN SOUND N4K
PARIS N3L (previously sorted to Brantford)
PARRY SOUND P2A
PEMBROKE K8A, K8B
PENETANGUISHENE L9M
PERTH K7H
PETAWAWA K8H
PETERBOROUGH K9H, K9J, K9K, K9L
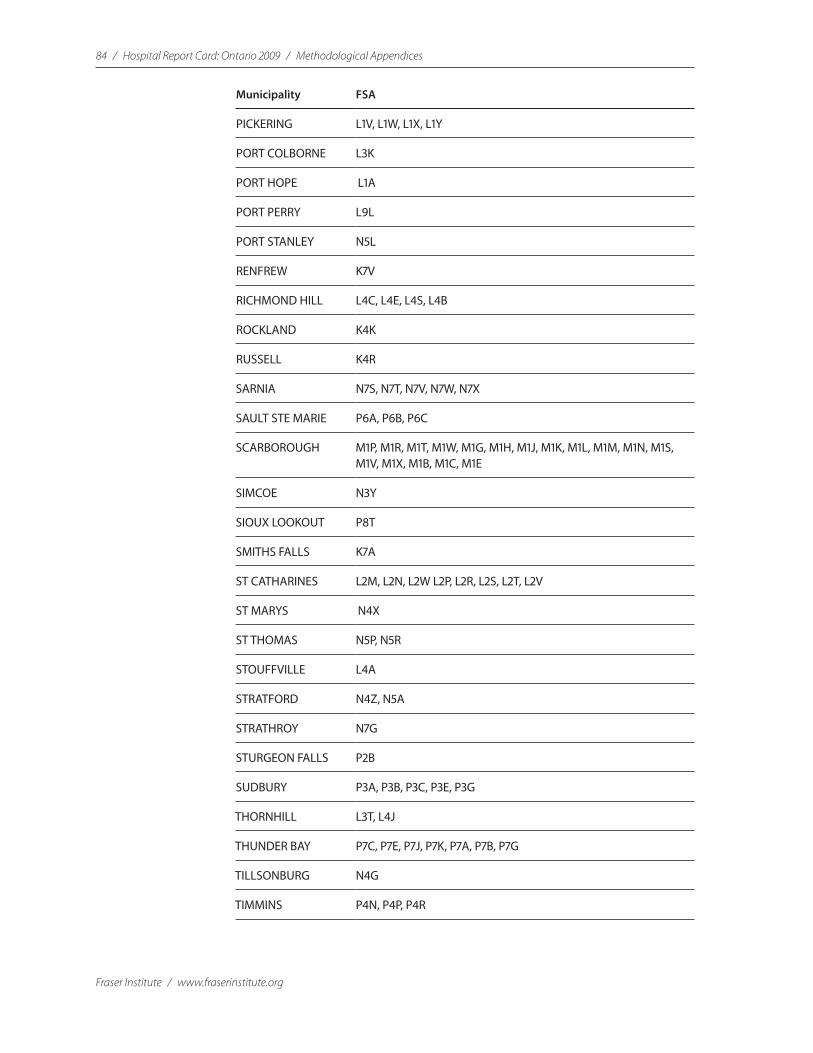
84 / Hospital Report Card: Ontario 2009 / Methodological Appendices
Fraser Institute / www.fraserinstitute.org
Municipality FSA
PICKERING L1V, L1W, L1X, L1Y
PORT COLBORNE L3K
PORT HOPE L1A
PORT PERRY L9L
PORT STANLEY N5L
RENFREW K7V
RICHMOND HILL L4C, L4E, L4S, L4B
ROCKLAND K4K
RUSSELL K4R
SARNIA N7S, N7T, N7V, N7W, N7X
SAULT STE MARIE P6A, P6B, P6C
SCARBOROUGH M1P, M1R, M1T, M1W, M1G, M1H, M1J, M1K, M1L, M1M, M1N, M1S, M1V, M1X, M1B, M1C, M1E
SIMCOE N3Y
SIOUX LOOKOUT P8T
SMITHS FALLS K7A
ST CATHARINES L2M, L2N, L2W L2P, L2R, L2S, L2T, L2V
ST MARYS N4X
ST THOMAS N5P, N5R
STOUFFVILLE L4A
STRATFORD N4Z, N5A
STRATHROY N7G
STURGEON FALLS P2B
SUDBURY P3A, P3B, P3C, P3E, P3G
THORNHILL L3T, L4J
THUNDER BAY P7C, P7E, P7J, P7K, P7A, P7B, P7G
TILLSONBURG N4G
TIMMINS P4N, P4P, P4R

Methodological Appendices / Hospital Report Card: Ontario 2009 / 85
www.fraserinstitute.org / Fraser Institute
Municipality FSA
TORONTO M2P, M4A, M4B, M6L, M6M, M5W, M6J, M6K, M6R, M5L, M6N, M6P, M6G, M6H, M4L, M4M, M4C, M4E, M4J, M4K, M4N, M4P, M4R, M5P, M6C, M6E, M5R, M5S, M7A, M4G, M4H, M5M, M5N, M6A, M6B, M5K, M5X, M4X, M5A, M4Y, M4W, M4S, M4T, M4V, M5H, M5J, M5B, M5C, M5E, M5G, M6S
TRENTON K8V
UXBRIDGE L9P
VAL CARON P3N
WALLACEBURG N8A
WASAGA BEACH L9Z
WELLAND L3B, L3C
WESTON M9N, M9P, M9R, M9L, M9M
WHITBY L1M, L1N, L1P, L1R
WILLOWDALE M2K, M2L, M2R, M2H, M2J, M2M, M2N
WINDSOR N8N, N8P, N9K, N8S, N8T, N9E, N9J, N8X, N9A, N9B, N9C, N8R, N8V, N8W, N8Y, N9G, N9H
WOODBRIDGE L4H, L4L
WOODSTOCK N4S, N4T, N4V
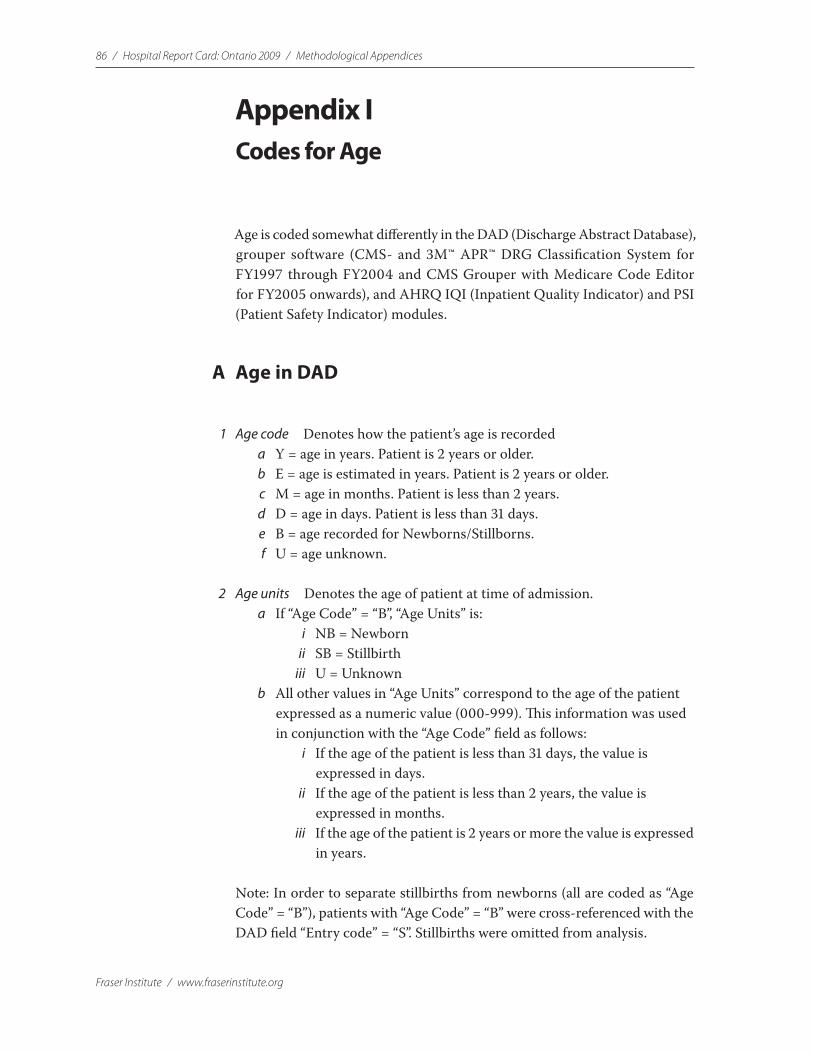
86 / Hospital Report Card: Ontario 2009 / Methodological Appendices
Fraser Institute / www.fraserinstitute.org
Appendix ICodes for Age
Age is coded somewhat differently in the DAD (Discharge Abstract Database), grouper software (CMS- and 3M™ APR™ DRG Classification System for FY1997 through FY2004 and CMS Grouper with Medicare Code Editor for FY2005 onwards), and AHRQ IQI (Inpatient Quality Indicator) and PSI (Patient Safety Indicator) modules.
A Age in DAD
1 Age code Denotes how the patient’s age is recorded a Y = age in years. Patient is 2 years or older. b E = age is estimated in years. Patient is 2 years or older. c M = age in months. Patient is less than 2 years. d D = age in days. Patient is less than 31 days. e B = age recorded for Newborns/Stillborns. f U = age unknown.
2 Age units Denotes the age of patient at time of admission. a If “Age Code” = “B”, “Age Units” is:
i NB = Newborn ii SB = Stillbirth iii U = Unknown
b All other values in “Age Units” correspond to the age of the patient expressed as a numeric value (000-999). This information was used in conjunction with the “Age Code” field as follows: i If the age of the patient is less than 31 days, the value is
expressed in days. ii If the age of the patient is less than 2 years, the value is
expressed in months. iii If the age of the patient is 2 years or more the value is expressed
in years.
Note: In order to separate stillbirths from newborns (all are coded as “Age Code” = “B”), patients with “Age Code” = “B” were cross-referenced with the DAD field “Entry code” = “S”. Stillbirths were omitted from analysis.
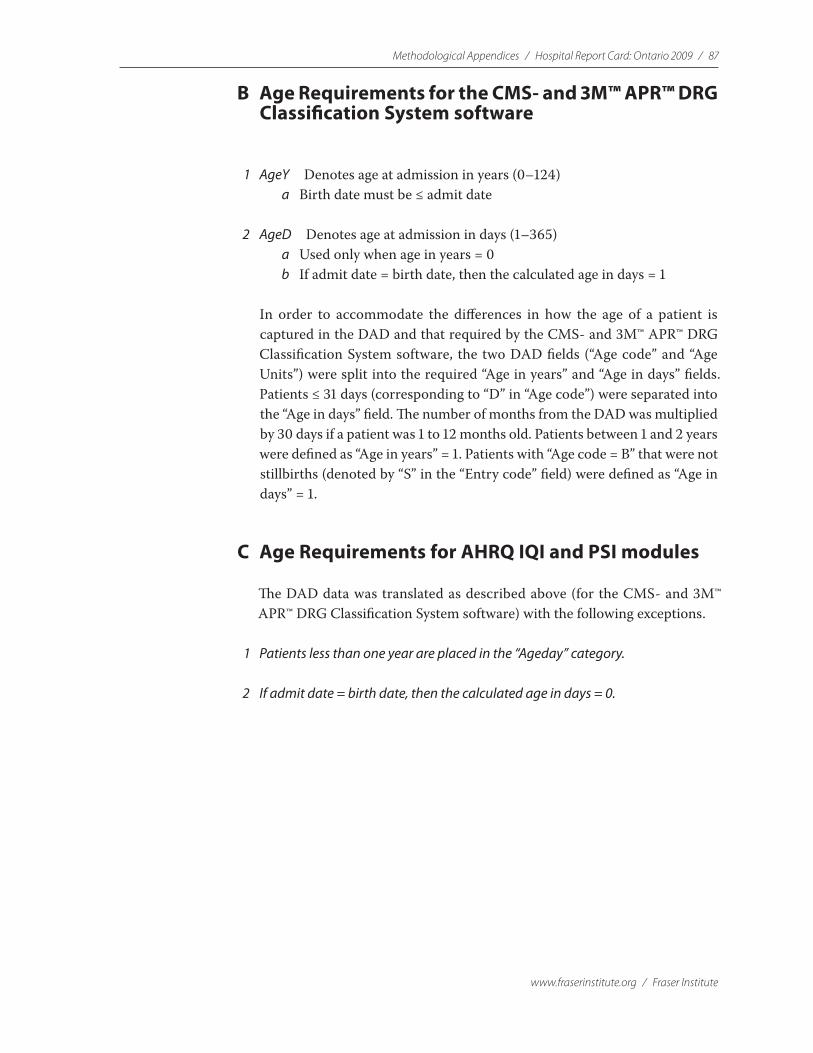
Methodological Appendices / Hospital Report Card: Ontario 2009 / 87
www.fraserinstitute.org / Fraser Institute
B Age Requirements for the CMS- and 3M™ APR™ DRG Classification System software
1 AgeY Denotes age at admission in years (0–124) a Birth date must be ≤ admit date
2 AgeD Denotes age at admission in days (1–365) a Used only when age in years = 0 b If admit date = birth date, then the calculated age in days = 1
In order to accommodate the differences in how the age of a patient is captured in the DAD and that required by the CMS- and 3M™ APR™ DRG Classification System software, the two DAD fields (“Age code” and “Age Units”) were split into the required “Age in years” and “Age in days” fields. Patients ≤ 31 days (corresponding to “D” in “Age code”) were separated into the “Age in days” field. The number of months from the DAD was multiplied by 30 days if a patient was 1 to 12 months old. Patients between 1 and 2 years were defined as “Age in years” = 1. Patients with “Age code = B” that were not stillbirths (denoted by “S” in the “Entry code” field) were defined as “Age in days” = 1.
C Age Requirements for AHRQ IQI and PSI modules
The DAD data was translated as described above (for the CMS- and 3M™ APR™ DRG Classification System software) with the following exceptions.
1 Patients less than one year are placed in the “Ageday” category.
2 If admit date = birth date, then the calculated age in days = 0.
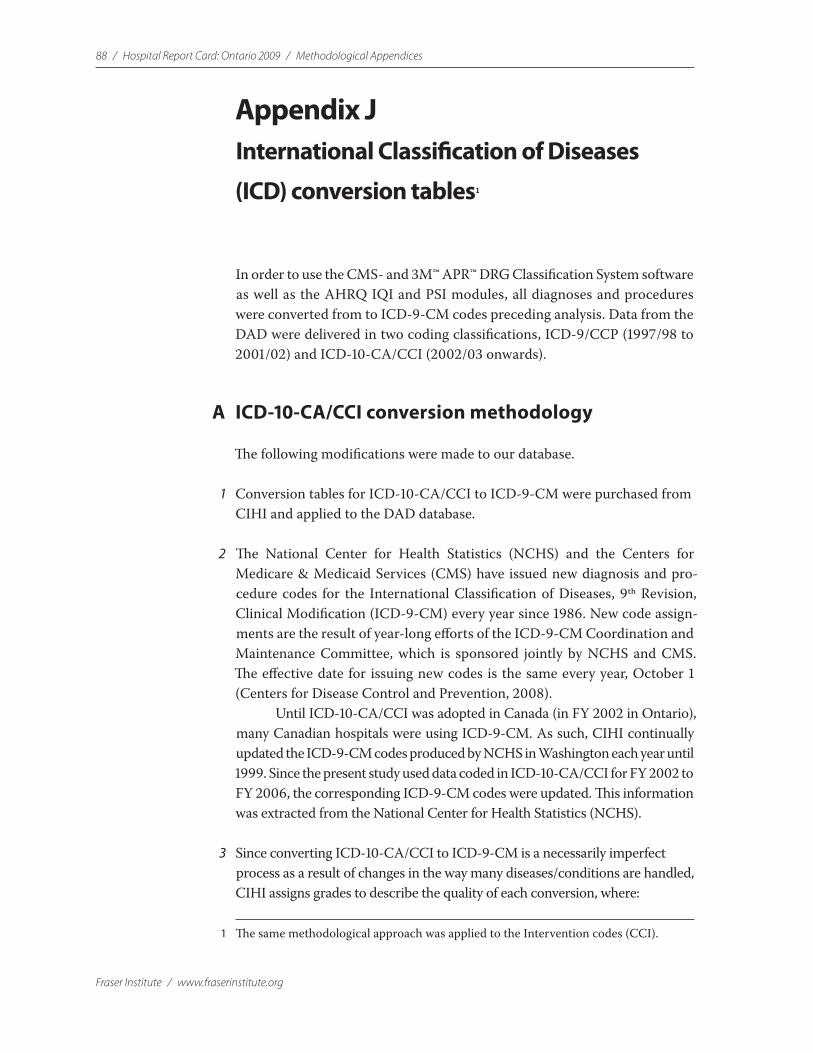
88 / Hospital Report Card: Ontario 2009 / Methodological Appendices
Fraser Institute / www.fraserinstitute.org
Appendix JInternational Classification of Diseases
(ICD) conversion tables1
In order to use the CMS- and 3M™ APR™ DRG Classification System software as well as the AHRQ IQI and PSI modules, all diagnoses and procedures were converted from to ICD-9-CM codes preceding analysis. Data from the DAD were delivered in two coding classifications, ICD-9/CCP (1997/98 to 2001/02) and ICD-10-CA/CCI (2002/03 onwards).
A ICD-10-CA/CCI conversion methodology
The following modifications were made to our database.
1 Conversion tables for ICD-10-CA/CCI to ICD-9-CM were purchased from CIHI and applied to the DAD database.
2 The National Center for Health Statistics (NCHS) and the Centers for Medicare & Medicaid Services (CMS) have issued new diagnosis and pro-cedure codes for the International Classification of Diseases, 9th Revision, Clinical Modification (ICD-9-CM) every year since 1986. New code assign-ments are the result of year-long efforts of the ICD-9-CM Coordination and Maintenance Committee, which is sponsored jointly by NCHS and CMS. The effective date for issuing new codes is the same every year, October 1 (Centers for Disease Control and Prevention, 2008).
Until ICD-10-CA/CCI was adopted in Canada (in FY 2002 in Ontario), many Canadian hospitals were using ICD-9-CM. As such, CIHI continually updated the ICD-9-CM codes produced by NCHS in Washington each year until 1999. Since the present study used data coded in ICD-10-CA/CCI for FY 2002 to FY 2006, the corresponding ICD-9-CM codes were updated. This information was extracted from the National Center for Health Statistics (NCHS).
3 Since converting ICD-10-CA/CCI to ICD-9-CM is a necessarily imperfect process as a result of changes in the way many diseases/conditions are handled, CIHI assigns grades to describe the quality of each conversion, where:
1 The same methodological approach was applied to the Intervention codes (CCI).

Methodological Appendices / Hospital Report Card: Ontario 2009 / 89
www.fraserinstitute.org / Fraser Institute
1 = Good to excellent match; both coding systems are either identical or the ICD-10-CA/CCI terms are indexed to the ICD-9-CM.
2 = Fair match; the ICD-10-CA/CCI code is not indexed in the same manner in ICD-9-CM. An inclusion term may be present, which has influenced the choice but generally some default decision was made, with the typical default to the “other specified” category.
3 = Poor match. There is no specific code available; for example, the ICD-10-CA/CCI code represents a new concept that was not available in the previous classification.
Only two ICD-10-CA/CCI codes analysed by the AHRQ IQI & PSI indicators are classified as a “3” conversion. They are: 1 S130 (Trauma ruptured cervical intervertebral disc) to 83900
(Cervical Vertebra Dislocation Unspecified). Required for calculating PSIs 2, 6, and 8.
2 G463 (Brain stem stroke syndrome) to 34489 (Other specified paralytic syndrome). Required for calculating PSI 3.
4 As previously mentioned, ICD-10-CA/CCI is a more specific and updated coding classification than ICD-9-CM. Therefore, numerous ICD-10-CA/CCI codes can map to a single ICD-9-CM code. Alternatively, there may be some codes where there is no direct translation from ICD-10-CA/CCI to ICD-9-CM.
All ICD-9-CM codes that did not translate directly from ICD-10-CA were analysed individually with respect to which indicator(s) they appeared in and where the code was located (i.e. in the numerator, denominator, both, or in the exclusions of a given indicator).
In cases where CIHI provided no translation, the CIHI’s International Statistical Classification of Diseases and Related Health Problems, 10th Revision, Tabular List of inclusions and four-character subcategories (Coding/Classification, CIHI, <http://secure.cihi.ca/cihiweb/dispPage.jsp?cw_page=codingclass_e>, as of Dec. 17, 2008) and the Incidence and Prevalence Database ICD-9 and ICD-10 conversion (NCHS International Statistical Classification of Diseases, 9th Revision, Clinical Modification, <http://icd9cm.chrisendres.com/icd9cm/index.php>) were used to determine whether other ICD-10-CCI codes translated to ICD-9-CM contained equivalent informa-tion to that required by the AHRQ indicator.
For example, 00322 (ICD-9-CM—Salmonella Pneumonia) is one of the codes required for calculation of the Pneumonia Mortality Rate (IQI 20). None of the ICD-10-CA/CCI codes listed in CIHI’s conversion table translates directly to 00322. However, there are two ICD-10-CA/CCI codes that would contain this information that do translate to ICD-9-CM codes.
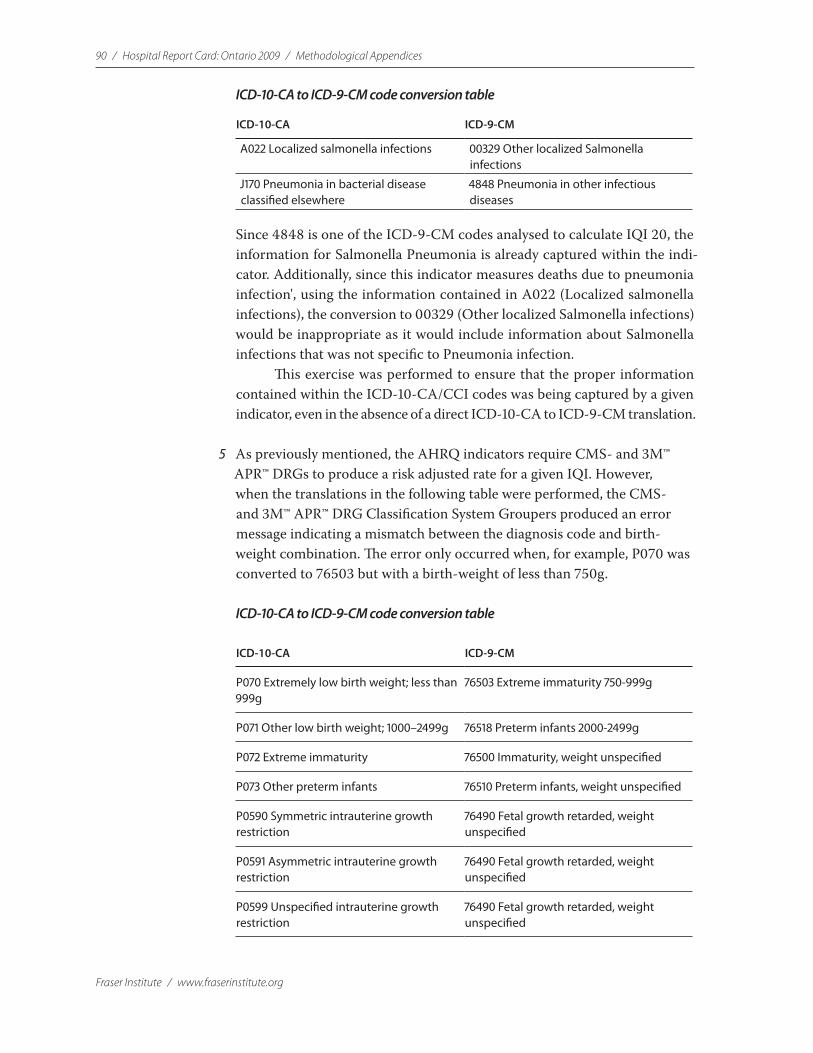
90 / Hospital Report Card: Ontario 2009 / Methodological Appendices
Fraser Institute / www.fraserinstitute.org
ICD-10-CA to ICD-9-CM code conversion table
ICD-10-CA ICD-9-CM
A022 Localized salmonella infections 00329 Other localized Salmonella infections
J170 Pneumonia in bacterial disease classified elsewhere
4848 Pneumonia in other infectious diseases
Since 4848 is one of the ICD-9-CM codes analysed to calculate IQI 20, the information for Salmonella Pneumonia is already captured within the indi-cator. Additionally, since this indicator measures deaths due to pneumonia infection', using the information contained in A022 (Localized salmonella infections), the conversion to 00329 (Other localized Salmonella infections) would be inappropriate as it would include information about Salmonella infections that was not specific to Pneumonia infection.
This exercise was performed to ensure that the proper information contained within the ICD-10-CA/CCI codes was being captured by a given indicator, even in the absence of a direct ICD-10-CA to ICD-9-CM translation.
5 As previously mentioned, the AHRQ indicators require CMS- and 3M™ APR™ DRGs to produce a risk adjusted rate for a given IQI. However, when the translations in the following table were performed, the CMS- and 3M™ APR™ DRG Classification System Groupers produced an error message indicating a mismatch between the diagnosis code and birth-weight combination. The error only occurred when, for example, P070 was converted to 76503 but with a birth-weight of less than 750g.
ICD-10-CA to ICD-9-CM code conversion table
ICD-10-CA ICD-9-CM
P070 Extremely low birth weight; less than 999g
76503 Extreme immaturity 750-999g
P071 Other low birth weight; 1000–2499g 76518 Preterm infants 2000-2499g
P072 Extreme immaturity 76500 Immaturity, weight unspecified
P073 Other preterm infants 76510 Preterm infants, weight unspecified
P0590 Symmetric intrauterine growth restriction
76490 Fetal growth retarded, weight unspecified
P0591 Asymmetric intrauterine growth restriction
76490 Fetal growth retarded, weight unspecified
P0599 Unspecified intrauterine growth restriction
76490 Fetal growth retarded, weight unspecified

Methodological Appendices / Hospital Report Card: Ontario 2009 / 91
www.fraserinstitute.org / Fraser Institute
In order to avoid losing the information contained within these ICD-10-CA codes, the codes were translated as follows.
ICD-10-CA to ICD-9-CM code conversion table2
ICD-10-CA ICD-9-CM
P070 Extremely low birth weight
765.01 Extreme Immaturity <500g
765.02 Extreme Immaturity 500-749g
765.03 Extreme Immaturity 750-999g
P071 Other low birth weight; 1000-2499g
765.14 Preterm NEC* 1000-1249g
765.15 Preterm NEC 1250-1499g
765.16 Preterm infant NEC 1500-1749 g
765.17 Preterm NEC 1750-1999g
765.18 Preterm infant NEC 2000-2499 g
P072 Extreme immaturity
765.01 Extreme Immaturity <500g
765.02 Extreme Immaturity 500-749g
765.03 Extreme Immaturity 750-999g
765.04 Extreme Immaturity1000-1249g
765.05 Extreme Immaturity 1250-1499g
765.06 Extreme Immaturity 1500-1749g
765.07 Extreme Immaturity 1750-1999g
765.08 Extreme Immaturity 2000-2499g
765.09 Extreme Immaturity 2500+g
765.00 Extreme Immaturity Weight NOS*
P073 Other preterm infants
765.10 Other preterm infants Weight NOS
765.16 Other preterm infants NEC 1500-1749 grams
765.18 Other preterm infants NEC 2000-2499 grams
765.19 Other preterm infants NEC 2500+ grams
765.11 Other preterm infants <500g
765.12 Other preterm infants 500-749g
765.13 Other preterm infants 750-999g
765.14 Other preterm infants 1000-1249g
765.15 Other preterm infants 1250-1499g
765.17 Other preterm infants 1750-1999g
2 NEC = not otherwise classified/other; NOS = not otherwise specified/unspecific (weight is unknown or missing)

92 / Hospital Report Card: Ontario 2009 / Methodological Appendices
Fraser Institute / www.fraserinstitute.org
ICD-10-CA ICD-9-CM
P0590 Symmetric intrauterine growth restriction
764.91 Fetal growth retarded <500g
764.92 Fetal growth retarded 500-749g
764.93 Fetal growth retarded 750-999g
764.94 Fetal growth retarded 1000-1249g
764.95 Fetal growth retarded 1250-1499g
764.96 Fetal growth retarded 1500-1749g
764.97 Fetal growth retarded 1750-1999g
764.98 Fetal growth retarded 2000-2499g
764.99 Fetal growth retarded 2500+g
764.90 Fetal growth retard weight NOS
P0591 Asymmetric intrauterine growth restriction
764.91 Fetal growth retarded <500g
764.92 Fetal growth retarded 500-749g
764.93 Fetal growth retarded 750-999g
764.94 Fetal growth retarded 1000-1249g
764.95 Fetal growth retarded 1250-1499g
764.96 Fetal growth retarded 1500-1749g
764.97 Fetal growth retarded 1750-1999g
764.98 Fetal growth retarded 2000-2499g
764.99 Fetal growth retarded 2500+g
764.90 Fetal growth retard weight NOS
P0599 Unspecified intrauterine growth restriction
764.91 Fetal growth retarded <500g
764.92 Fetal growth retarded 500-749g
764.93 Fetal growth retarded 750-999g
764.94 Fetal growth retarded 1000-1249g
764.95 Fetal growth retarded 1250-1499g
764.96 Fetal growth retarded 1500-1749g
764.97 Fetal growth retarded 1750-1999g
764.98 Fetal growth retarded 2000-2499g
764.99 Fetal growth retarded 2500+g
764.90 Fetal growth retard weight NOS
6 ICD-10-CA/CCI is a more specific and updated coding classification than ICD-9-CM. Therefore, numerous ICD-10-CA/CCI codes can map to a single ICD-9-CM code. Alternatively, some codes do not translate directly from ICD-10-CA/CCI to ICD-9-CM. The following table contains the ICD-9CM diagnosis codes required for calculating Congestive Heart Failure (IQI 16). The italicized codes do not translate directly from ICD-10-CA/CCI to ICD-9-CM.
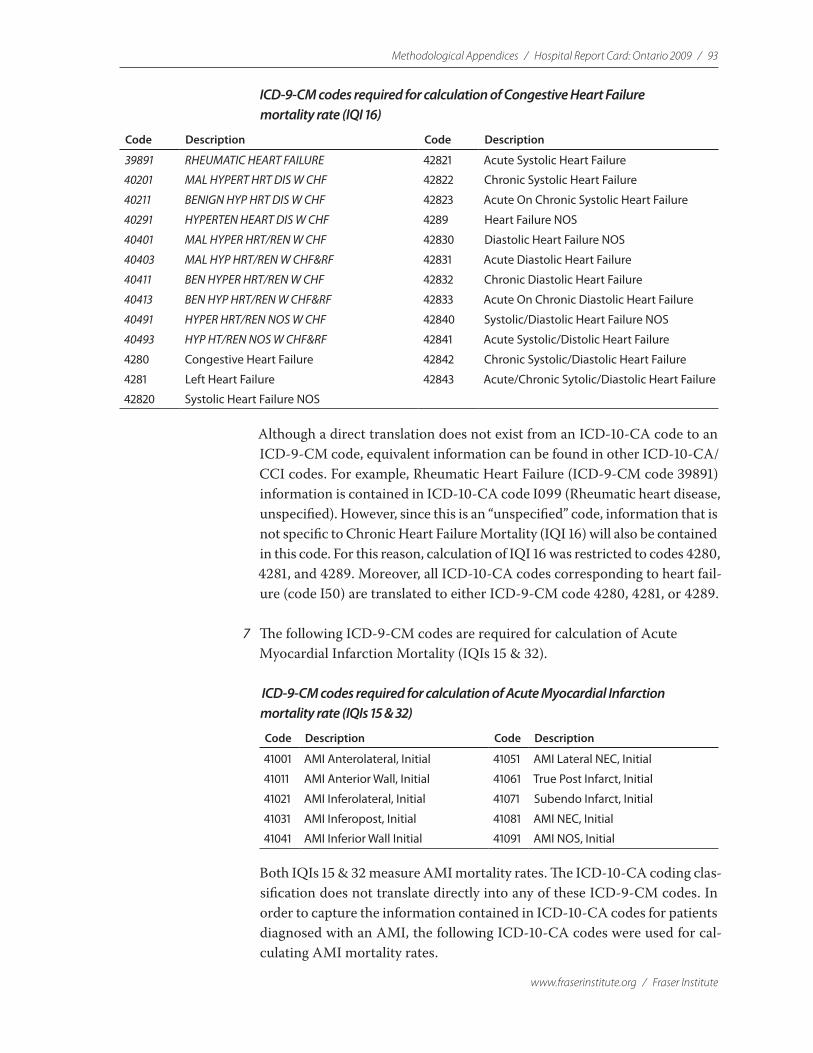
Methodological Appendices / Hospital Report Card: Ontario 2009 / 93
www.fraserinstitute.org / Fraser Institute
ICD-9-CM codes required for calculation of Congestive Heart Failure mortality rate (IQI 16)
Code Description Code Description
39891 RHEUMATIC HEART FAILURE 42821 Acute Systolic Heart Failure
40201 MAL HYPERT HRT DIS W CHF 42822 Chronic Systolic Heart Failure
40211 BENIGN HYP HRT DIS W CHF 42823 Acute On Chronic Systolic Heart Failure
40291 HYPERTEN HEART DIS W CHF 4289 Heart Failure NOS
40401 MAL HYPER HRT/REN W CHF 42830 Diastolic Heart Failure NOS
40403 MAL HYP HRT/REN W CHF&RF 42831 Acute Diastolic Heart Failure
40411 BEN HYPER HRT/REN W CHF 42832 Chronic Diastolic Heart Failure
40413 BEN HYP HRT/REN W CHF&RF 42833 Acute On Chronic Diastolic Heart Failure
40491 HYPER HRT/REN NOS W CHF 42840 Systolic/Diastolic Heart Failure NOS
40493 HYP HT/REN NOS W CHF&RF 42841 Acute Systolic/Distolic Heart Failure
4280 Congestive Heart Failure 42842 Chronic Systolic/Diastolic Heart Failure
4281 Left Heart Failure 42843 Acute/Chronic Sytolic/Diastolic Heart Failure
42820 Systolic Heart Failure NOS
Although a direct translation does not exist from an ICD-10-CA code to an ICD-9-CM code, equivalent information can be found in other ICD-10-CA/CCI codes. For example, Rheumatic Heart Failure (ICD-9-CM code 39891) information is contained in ICD-10-CA code I099 (Rheumatic heart disease, unspecified). However, since this is an “unspecified” code, information that is not specific to Chronic Heart Failure Mortality (IQI 16) will also be contained in this code. For this reason, calculation of IQI 16 was restricted to codes 4280, 4281, and 4289. Moreover, all ICD-10-CA codes corresponding to heart fail-ure (code I50) are translated to either ICD-9-CM code 4280, 4281, or 4289.
7 The following ICD-9-CM codes are required for calculation of Acute Myocardial Infarction Mortality (IQIs 15 & 32).
ICD-9-CM codes required for calculation of Acute Myocardial Infarction mortality rate (IQIs 15 & 32)
Code Description Code Description
41001 AMI Anterolateral, Initial 41051 AMI Lateral NEC, Initial
41011 AMI Anterior Wall, Initial 41061 True Post Infarct, Initial
41021 AMI Inferolateral, Initial 41071 Subendo Infarct, Initial
41031 AMI Inferopost, Initial 41081 AMI NEC, Initial
41041 AMI Inferior Wall Initial 41091 AMI NOS, Initial
Both IQIs 15 & 32 measure AMI mortality rates. The ICD-10-CA coding clas-sification does not translate directly into any of these ICD-9-CM codes. In order to capture the information contained in ICD-10-CA codes for patients diagnosed with an AMI, the following ICD-10-CA codes were used for cal-culating AMI mortality rates.
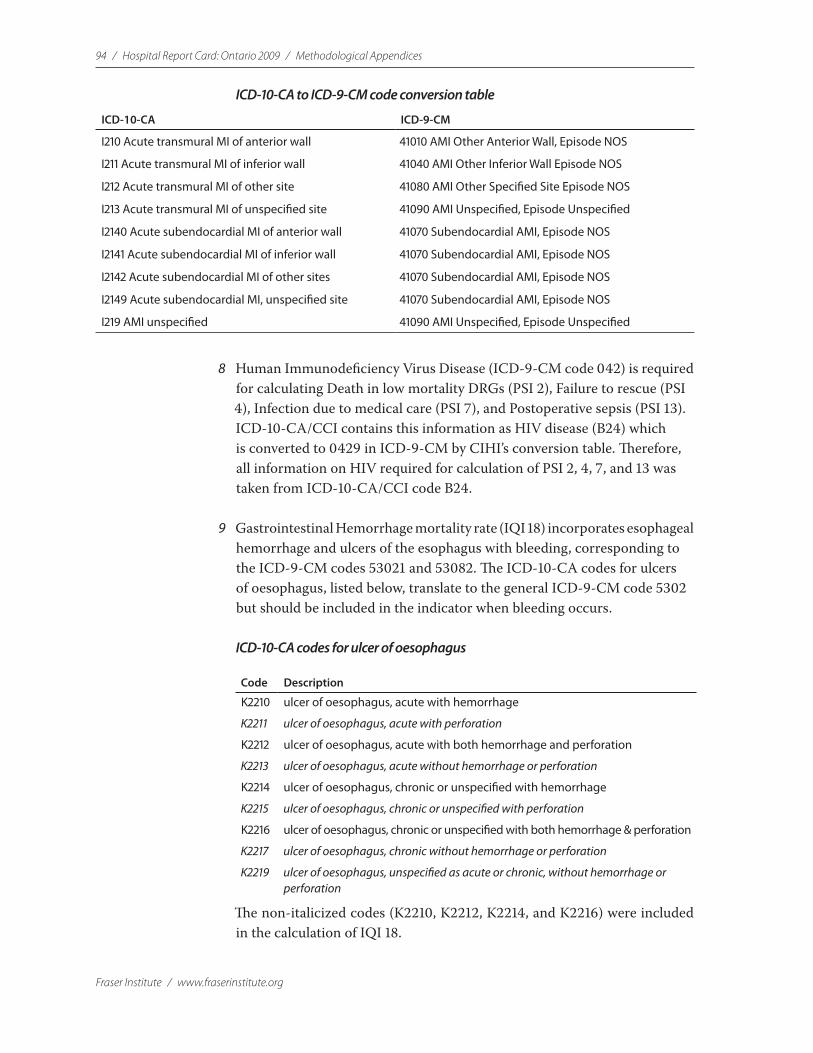
94 / Hospital Report Card: Ontario 2009 / Methodological Appendices
Fraser Institute / www.fraserinstitute.org
ICD-10-CA to ICD-9-CM code conversion table
ICD-10-CA ICD-9-CM
I210 Acute transmural MI of anterior wall 41010 AMI Other Anterior Wall, Episode NOS
I211 Acute transmural MI of inferior wall 41040 AMI Other Inferior Wall Episode NOS
I212 Acute transmural MI of other site 41080 AMI Other Specified Site Episode NOS
I213 Acute transmural MI of unspecified site 41090 AMI Unspecified, Episode Unspecified
I2140 Acute subendocardial MI of anterior wall 41070 Subendocardial AMI, Episode NOS
I2141 Acute subendocardial MI of inferior wall 41070 Subendocardial AMI, Episode NOS
I2142 Acute subendocardial MI of other sites 41070 Subendocardial AMI, Episode NOS
I2149 Acute subendocardial MI, unspecified site 41070 Subendocardial AMI, Episode NOS
I219 AMI unspecified 41090 AMI Unspecified, Episode Unspecified
8 Human Immunodeficiency Virus Disease (ICD-9-CM code 042) is required for calculating Death in low mortality DRGs (PSI 2), Failure to rescue (PSI 4), Infection due to medical care (PSI 7), and Postoperative sepsis (PSI 13). ICD-10-CA/CCI contains this information as HIV disease (B24) which is converted to 0429 in ICD-9-CM by CIHI’s conversion table. Therefore, all information on HIV required for calculation of PSI 2, 4, 7, and 13 was taken from ICD-10-CA/CCI code B24.
9 Gastrointestinal Hemorrhage mortality rate (IQI 18) incorporates esophageal hemorrhage and ulcers of the esophagus with bleeding, corresponding to the ICD-9-CM codes 53021 and 53082. The ICD-10-CA codes for ulcers of oesophagus, listed below, translate to the general ICD-9-CM code 5302 but should be included in the indicator when bleeding occurs.
ICD-10-CA codes for ulcer of oesophagus
Code Description
K2210 ulcer of oesophagus, acute with hemorrhage
K2211 ulcer of oesophagus, acute with perforation
K2212 ulcer of oesophagus, acute with both hemorrhage and perforation
K2213 ulcer of oesophagus, acute without hemorrhage or perforation
K2214 ulcer of oesophagus, chronic or unspecified with hemorrhage
K2215 ulcer of oesophagus, chronic or unspecified with perforation
K2216 ulcer of oesophagus, chronic or unspecified with both hemorrhage & perforation
K2217 ulcer of oesophagus, chronic without hemorrhage or perforation
K2219 ulcer of oesophagus, unspecified as acute or chronic, without hemorrhage or perforation
The non-italicized codes (K2210, K2212, K2214, and K2216) were included in the calculation of IQI 18.
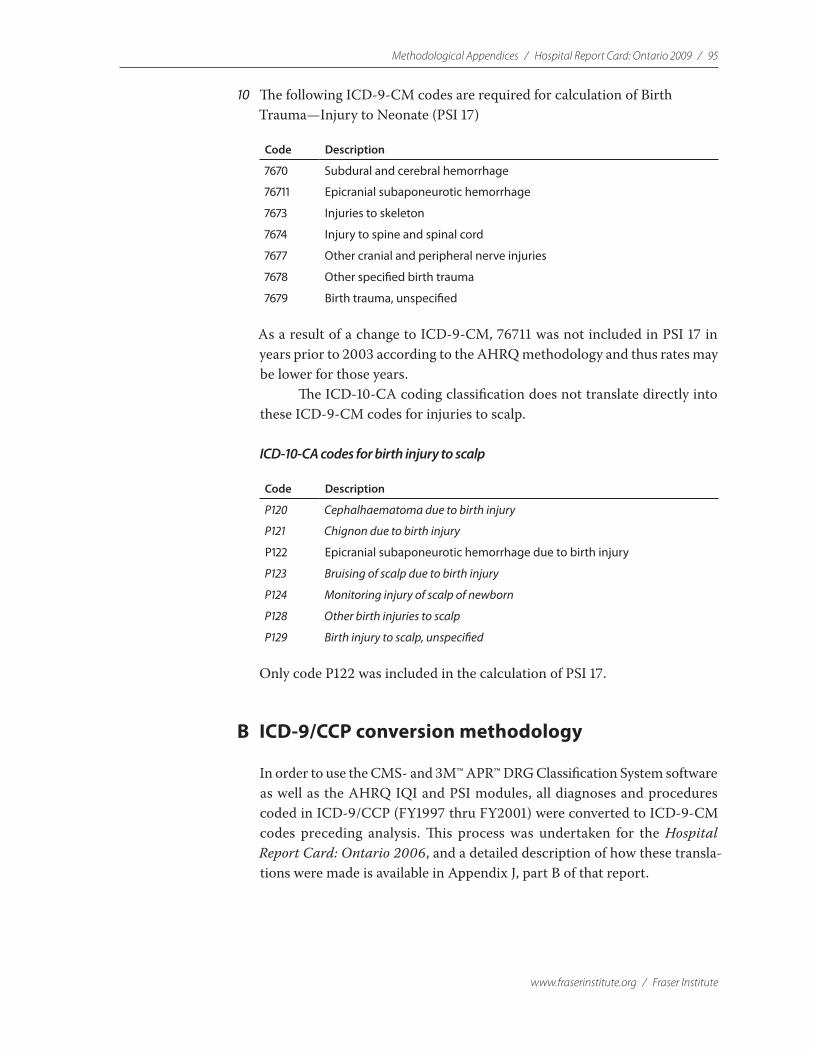
Methodological Appendices / Hospital Report Card: Ontario 2009 / 95
www.fraserinstitute.org / Fraser Institute
10 The following ICD-9-CM codes are required for calculation of Birth Trauma —Injury to Neonate (PSI 17)
Code Description
7670 Subdural and cerebral hemorrhage
76711 Epicranial subaponeurotic hemorrhage
7673 Injuries to skeleton
7674 Injury to spine and spinal cord
7677 Other cranial and peripheral nerve injuries
7678 Other specified birth trauma
7679 Birth trauma, unspecified
As a result of a change to ICD-9-CM, 76711 was not included in PSI 17 in years prior to 2003 according to the AHRQ methodology and thus rates may be lower for those years.
The ICD-10-CA coding classification does not translate directly into these ICD-9-CM codes for injuries to scalp.
ICD-10-CA codes for birth injury to scalp
Code Description
P120 Cephalhaematoma due to birth injury
P121 Chignon due to birth injury
P122 Epicranial subaponeurotic hemorrhage due to birth injury
P123 Bruising of scalp due to birth injury
P124 Monitoring injury of scalp of newborn
P128 Other birth injuries to scalp
P129 Birth injury to scalp, unspecified
Only code P122 was included in the calculation of PSI 17.
B ICD-9/CCP conversion methodology
In order to use the CMS- and 3M™ APR™ DRG Classification System software as well as the AHRQ IQI and PSI modules, all diagnoses and procedures coded in ICD-9/CCP (FY1997 thru FY2001) were converted to ICD-9-CM codes preceding analysis. This process was undertaken for the Hospital Report Card: Ontario 2006, and a detailed description of how these transla-tions were made is available in Appendix J, part B of that report.
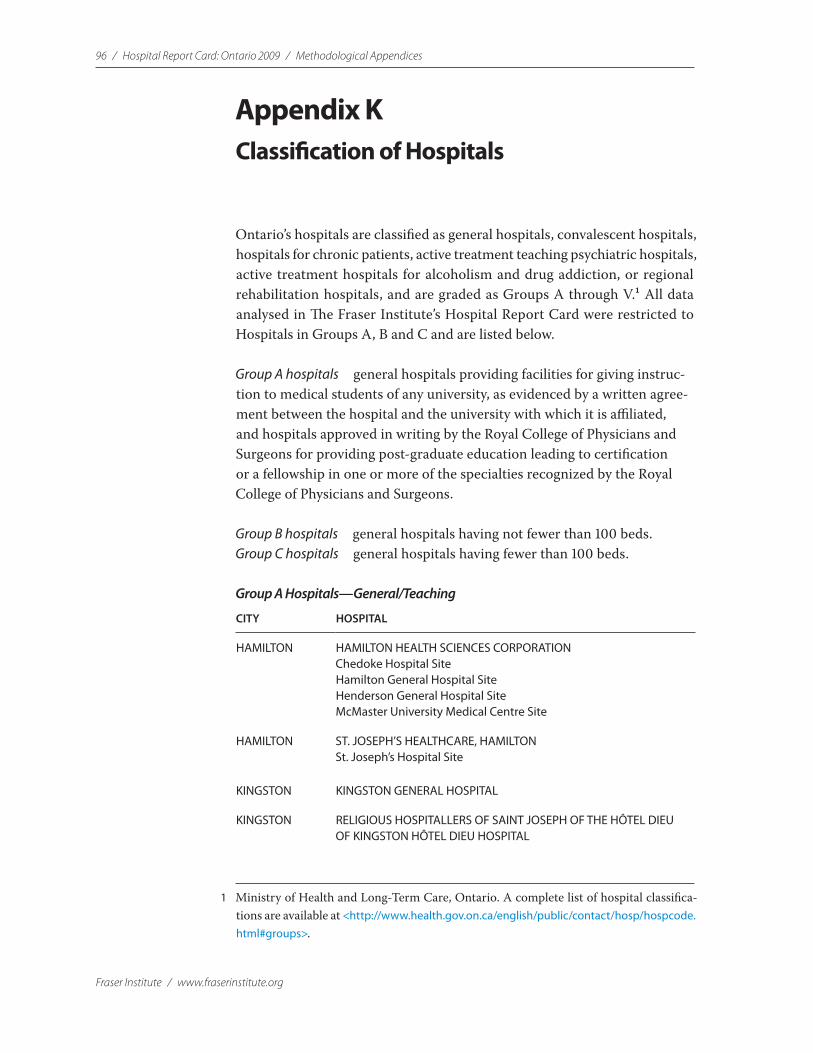
96 / Hospital Report Card: Ontario 2009 / Methodological Appendices
Fraser Institute / www.fraserinstitute.org
Appendix KClassification of Hospitals
Ontario’s hospitals are classified as general hospitals, convalescent hospitals, hospitals for chronic patients, active treatment teaching psychiatric hospitals, active treatment hospitals for alcoholism and drug addiction, or regional rehabilitation hospitals, and are graded as Groups A through V.1 All data analysed in The Fraser Institute’s Hospital Report Card were restricted to Hospitals in Groups A, B and C and are listed below.
Group A hospitals general hospitals providing facilities for giving instruc-tion to medical students of any university, as evidenced by a written agree-ment between the hospital and the university with which it is affiliated, and hospitals approved in writing by the Royal College of Physicians and Surgeons for providing post-graduate education leading to certification or a fellowship in one or more of the specialties recognized by the Royal College of Physicians and Surgeons.
Group B hospitals general hospitals having not fewer than 100 beds.Group C hospitals general hospitals having fewer than 100 beds.
Group A Hospitals —General/Teaching
CITY HOSPITAL
HAMILTON HAMILTON HEALTH SCIENCES CORPORATION Chedoke Hospital Site Hamilton General Hospital Site Henderson General Hospital Site McMaster University Medical Centre Site
HAMILTON ST. JOSEPH’S HEALTHCARE, HAMILTON St. Joseph’s Hospital Site
KINGSTON KINGSTON GENERAL HOSPITAL
KINGSTON RELIGIOUS HOSPITALLERS OF SAINT JOSEPH OF THE HÔTEL DIEU OF KINGSTON HÔTEL DIEU HOSPITAL
1 Ministry of Health and Long-Term Care, Ontario. A complete list of hospital classifica-tions are available at <http://www.health.gov.on.ca/english/public/contact/hosp/hospcode.html#groups>.
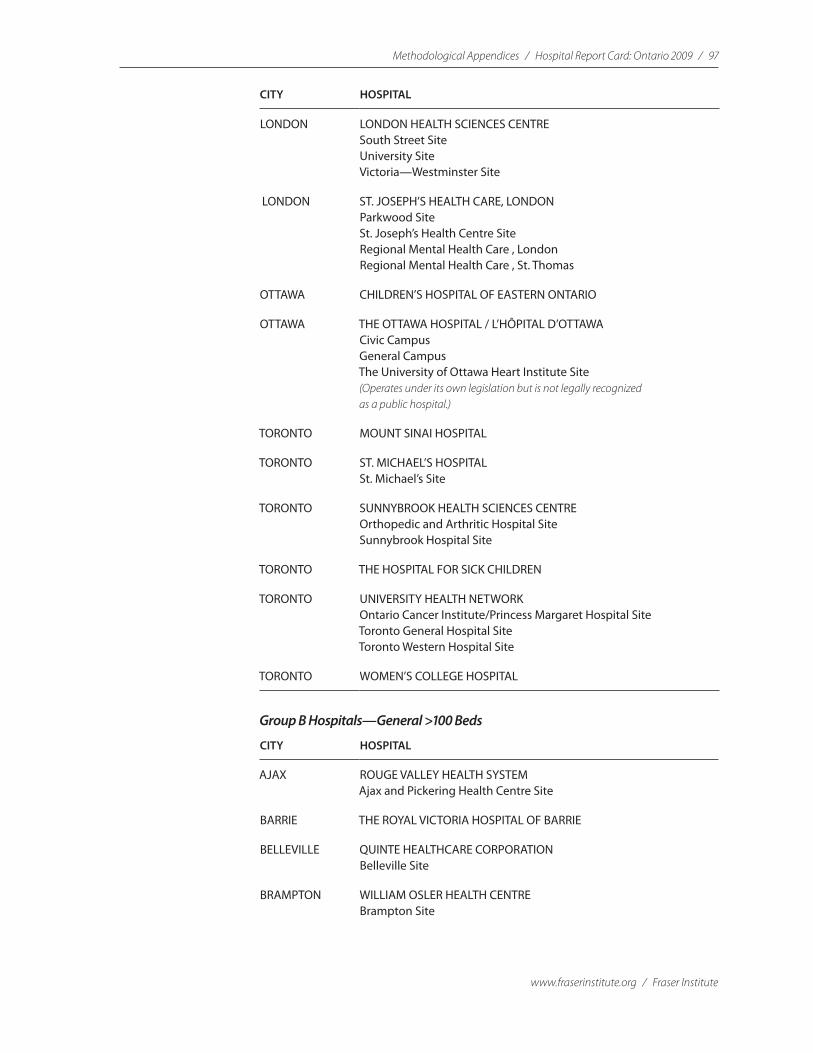
Methodological Appendices / Hospital Report Card: Ontario 2009 / 97
www.fraserinstitute.org / Fraser Institute
CITY HOSPITAL
LONDON LONDON HEALTH SCIENCES CENTRE South Street Site University Site Victoria—Westminster Site
LONDON ST. JOSEPH’S HEALTH CARE, LONDON Parkwood Site St. Joseph’s Health Centre Site Regional Mental Health Care , London Regional Mental Health Care , St. Thomas
OTTAWA CHILDREN’S HOSPITAL OF EASTERN ONTARIO
OTTAWA THE OTTAWA HOSPITAL / L’HÔPITAL D’OTTAWA Civic Campus General Campus The University of Ottawa Heart Institute Site (Operates under its own legislation but is not legally recognized as a public hospital.)
TORONTO MOUNT SINAI HOSPITAL
TORONTO ST. MICHAEL’S HOSPITAL St. Michael’s Site
TORONTO SUNNYBROOK HEALTH SCIENCES CENTRE Orthopedic and Arthritic Hospital Site Sunnybrook Hospital Site
TORONTO THE HOSPITAL FOR SICK CHILDREN
TORONTO UNIVERSITY HEALTH NETWORK Ontario Cancer Institute/Princess Margaret Hospital Site Toronto General Hospital Site Toronto Western Hospital Site
TORONTO WOMEN’S COLLEGE HOSPITAL
Group B Hospitals—General >100 Beds
CITY HOSPITAL
AJAX ROUGE VALLEY HEALTH SYSTEM Ajax and Pickering Health Centre Site
BARRIE THE ROYAL VICTORIA HOSPITAL OF BARRIE
BELLEVILLE QUINTE HEALTHCARE CORPORATION Belleville Site
BRAMPTON WILLIAM OSLER HEALTH CENTRE Brampton Site

98 / Hospital Report Card: Ontario 2009 / Methodological Appendices
Fraser Institute / www.fraserinstitute.org
CITY HOSPITAL
BRANTFORD THE BRANTFORD GENERAL HOSPITAL
BROCKVILLE BROCKVILLE GENERAL HOSPITAL
BURLINGTON JOSEPH BRANT MEMORIAL HOSPITAL CORPORATION
CAMBRIDGE CAMBRIDGE MEMORIAL HOSPITAL
CHATHAM ST. JOSEPH’S HEALTH SERVICES ASSOCIATION OF CHATHAM, INC.
CHATHAM THE PUBLIC GENERAL HOSPITAL SOCIETY OF CHATHAM
COBOURG THE NORTHUMBERLAND HEALTH CARE CORPORATION Cobourg Site
CORNWALL CORNWALL COMMUNITY HOSPITAL McConnell Avenue Site Second Street Site
GUELPH THE GUELPH GENERAL HOSPITAL
KENORA LAKE OF THE WOODS DISTRICT HOSPITAL
KITCHENER GRAND RIVER HOSPITAL CORPORATION Kitchener-Waterloo Health Centre Site
KITCHENER ST. MARY’S GENERAL HOSPITAL
LINDSAY THE ROSS MEMORIAL HOSPITAL
MARKHAM MARKHAM STOUFFVILLE HOSPITAL
MISSISSAUGA THE CREDIT VALLEY HOSPITAL
MISSISSAUGA TRILLIUM HEALTH CENTRE Mississauga Site
NEWMARKET SOUTHLAKE REGIONAL HEALTH CENTRE
NIAGARA FALLS NIAGARA HEALTH SYSTEM Greater Niagara General Site Ontario Street Site
NORTH BAY NORTH BAY GENERAL HOSPITAL Scollard Site Maclaren Site
OAKVILLE HALTON HEALTHCARE SERVICES CORPORATION Oakville Site
ORANGEVILLE HEADWATERS HEALTH CARE CENTRE Orangeville Site
ORILLIA ORILLIA SOLDIERS’ MEMORIAL HOSPITAL
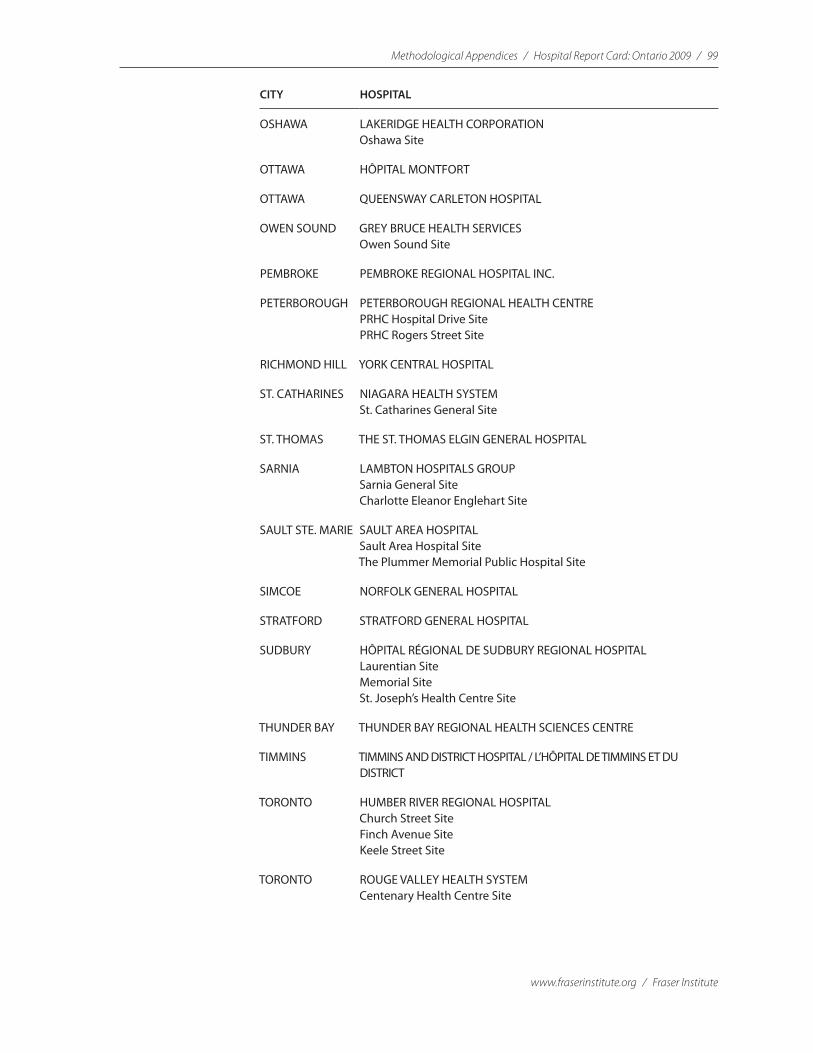
Methodological Appendices / Hospital Report Card: Ontario 2009 / 99
www.fraserinstitute.org / Fraser Institute
CITY HOSPITAL
OSHAWA LAKERIDGE HEALTH CORPORATION Oshawa Site
OTTAWA HÔPITAL MONTFORT
OTTAWA QUEENSWAY CARLETON HOSPITAL
OWEN SOUND GREY BRUCE HEALTH SERVICES Owen Sound Site
PEMBROKE PEMBROKE REGIONAL HOSPITAL INC.
PETERBOROUGH PETERBOROUGH REGIONAL HEALTH CENTRE PRHC Hospital Drive Site PRHC Rogers Street Site
RICHMOND HILL YORK CENTRAL HOSPITAL
ST. CATHARINES NIAGARA HEALTH SYSTEM St. Catharines General Site
ST. THOMAS THE ST. THOMAS ELGIN GENERAL HOSPITAL
SARNIA LAMBTON HOSPITALS GROUP Sarnia General Site Charlotte Eleanor Englehart Site
SAULT STE. MARIE SAULT AREA HOSPITAL Sault Area Hospital Site The Plummer Memorial Public Hospital Site
SIMCOE NORFOLK GENERAL HOSPITAL
STRATFORD STRATFORD GENERAL HOSPITAL
SUDBURY HÔPITAL RÉGIONAL DE SUDBURY REGIONAL HOSPITAL Laurentian Site Memorial Site St. Joseph’s Health Centre Site
THUNDER BAY THUNDER BAY REGIONAL HEALTH SCIENCES CENTRE
TIMMINS TIMMINS AND DISTRICT HOSPITAL / L’HÔPITAL DE TIMMINS ET DU DISTRICT
TORONTO HUMBER RIVER REGIONAL HOSPITAL Church Street Site Finch Avenue Site Keele Street Site
TORONTO ROUGE VALLEY HEALTH SYSTEM Centenary Health Centre Site

100 / Hospital Report Card: Ontario 2009 / Methodological Appendices
Fraser Institute / www.fraserinstitute.org
CITY HOSPITAL
TORONTO THE SCARBOROUGH HOSPITAL General Division Site Grace Division Site
TORONTO WILLIAM OSLER HEALTH CENTRE Etobicoke Site
TORONTO THE TORONTO EAST GENERAL HOSPITAL
TORONTO ST. JOSEPH’S HEALTH CENTRE
TORONTO NORTH YORK GENERAL HOSPITAL General Division Site Branson Division Site
WELLAND NIAGARA HEALTH SYSTEM Welland Hospital Site
WINDSOR HÔTEL DIEU GRACE HOSPITAL Hôtel Dieu Site Grace Site
WINDSOR WINDSOR REGIONAL HOSPITAL Metropolitan Site Western Site
WOODSTOCK WOODSTOCK GENERAL HOSPITAL
Group C Hospitals – General <100 Beds
CITY HOSPITAL
ALEXANDRA GLENGARRY MEMORIAL HOSPITAL
ALLISTON THE STEVENSON MEMORIAL HOSPITAL
ALMONTE ALMONTE GENERAL HOSPITAL
ARNPRIOR THE ARNPRIOR AND DISTRICT MEMORIAL HOSPITAL
ATIKOKAN ATIKOKAN GENERAL HOSPITAL
ATTAWAPISKAT JAMES BAY GENERAL HOSPITAL Attawapiskat Site
BANCROFT QUINTE HEALTHCARE CORPORATION North Hastings Site
BARRY’S BAY ST. FRANCIS MEMORIAL HOSPITAL ASSOCIATION
BLIND RIVER BLIND RIVER DISTRICT HEALTH CENTRE/PAVILLON SANTÉ DU DISTRICT DE BLIND RIVER

Methodological Appendices / Hospital Report Card: Ontario 2009 / 101
www.fraserinstitute.org / Fraser Institute
CITY HOSPITAL
BOWMANVILLE LAKERIDGE HEALTH CORPORATION Bowmanville Site
BRACEBRIDGE SOUTH MUSKOKA MEMORIAL HOSPITAL CORPORATION
BURK’S FALLS HUNTSVILLE DISTRICT MEMORIAL HOSPITAL Burk’s Falls Site
CAMPBELLFORD CAMPBELLFORD MEMORIAL HOSPITAL
CARLETON PLACE THE CARLETON PLACE AND DISTRICT MEMORIAL HOSPITAL
COLLINGWOOD THE COLLINGWOOD GENERAL AND MARINE HOSPITAL
CHAPLEAU CHAPLEAU SERVICES DE SANTÉ DE CHAPLEAU HEALTH SERVICES Chapleau General Site
CHESLEY SOUTH BRUCE GREY HEALTH CENTRE Chesley Site
CLINTON THE CLINTON PUBLIC HOSPITAL
COCHRANE THE LADY MINTO HOSPITAL
DEEP RIVER DEEP RIVER AND DISTRICT HOSPITAL
DRYDEN DRYDEN REGIONAL HEALTH CENTRE
DUNNVILLE HALDIMAND WAR MEMORIAL HOSPITAL
DURHAM SOUTH BRUCE GREY HEALTH CENTRE Durham Site
ELLIOT LAKE ST. JOSEPH’S GENERAL HOSPITAL ELLIOT LAKE
EMO See FORT FRANCES
ENGLEHART ENGLEHART AND DISTRICT HOSPITAL INC.
ESPANOLA ESPANOLA GENERAL HOSPITAL
EXETER SOUTH HURON HOSPITAL ASSOCIATION
FERGUS THE GROVES MEMORIAL COMMUNITY HOSPITAL
FORT ALBANY JAMES BAY GENERAL HOSPITAL Fort Albany Site
FORT ERIE NIAGARA HEALTH SYSTEM Douglas Memorial Hospital Site
FORT FRANCES RIVERSIDE HEALTH CARE FACILITIES INC. La Verendrye Hospital and Health Centre Site Emo Site Rainy River Site

102 / Hospital Report Card: Ontario 2009 / Methodological Appendices
Fraser Institute / www.fraserinstitute.org
CITY HOSPITAL
GEORGETOWN WILLIAM OSLER HEALTH CENTRE Georgetown Site
GERALDTON GERALDTON DISTRICT HOSPITAL
GODERICH ALEXANDRA MARINE AND GENERAL HOSPITAL OF GODERICH
GRIMSBY WEST LINCOLN MEMORIAL HOSPITAL
HAGERSVILLE THE WEST HALDIMAND GENERAL HOSPITAL
HALIBURTON HALIBURTON HIGHLANDS HEALTH SERVICES CORPORATION Haliburton Site
HANOVER HANOVER AND DISTRICT HOSPITAL
HAWKESBURY HÔPITAL GÉNÉRAL DE HAWKESBURY & DISTRICT GENERAL HOSPITAL INC.
HEARST HÔPITAL NOTREDAME HOSPITAL (HEARST)
HORNEPAYNE HORNEPAYNE COMMUNITY HOSPITAL
HUNTSVILLE HUNTSVILLE DISTRICT MEMORIAL HOSPITAL Huntsville Site
INGERSOLL THE ALEXANDRA HOSPITAL INGERSOLL
IROQUOIS FALLS ANSON GENERAL HOSPITAL
KAPUSKASING SENSENBRENNER HOSPITAL
KEMPTVILLE KEMPTVILLE DISTRICT HOSPITAL
KINCARDINE SOUTH BRUCE GREY HEALTH CENTRE Kincardine Site
KIRKLAND LAKE KIRKLAND AND DISTRICT HOSPITAL
LEAMINGTON LEAMINGTON DISTRICT MEMORIAL HOSPITAL
LION’S HEAD LION’S HEAD GREY BRUCE HEALTH SERVICES Lion’s Head Site
LISTOWEL THE LISTOWEL MEMORIAL HOSPITAL
LITTLE CURRENT MANITOULIN HEALTH CENTRE Little Current Site
MANITOUWADGE MANITOUWADGE GENERAL HOSPITAL
MARATHON WILSON MEMORIAL GENERAL HOSPITAL
MARKDALE GREY BRUCE HEALTH SERVICES Markdale Site
MATHESON BINGHAM MEMORIAL HOSPITAL

Methodological Appendices / Hospital Report Card: Ontario 2009 / 103
www.fraserinstitute.org / Fraser Institute
CITY HOSPITAL
MATTAWA MATTAWA GENERAL HOSPITAL INC.
MEAFORD GREY BRUCE HEALTH SERVICES Meaford Site
MIDLAND HURONIA DISTRICT HOSPITAL
MILTON HALTON HEALTHCARE SERVICES CORPORATION Milton Site
MINDEMOYA MANITOULIN HEALTH CENTRE Mindemoya Site
MINDEN HALIBURTON HIGHLANDS HEALTH SERVICES CORPORATION Minden Site
MOUNT FOREST NORTH WELLINGTON HEALTH CARE CORPORATION Mount Forest Site
NAPANEE LENNOX AND ADDINGTON COUNTY GENERAL HOSPITAL
NEWBURY FOUR COUNTIES HEALTH SERVICES CORPORATION
NEW LISKEARD TEMISKAMING HOSPITAL
NIAGARA ON THE LAKE
NIAGARA HEALTH SYSTEM Niagara on the Lake Hospital Site
NIPIGON NIPIGON DISTRICT MEMORIAL HOSPITAL
PALMERSTON NORTH WELLINGTON HEALTH CARE CORPORATION Palmerston Site
PARIS THE WILLETT HOSPITAL
PARRY SOUND WEST PARRY SOUND HEALTH CENTRE
PERTH PERTH AND SMITH FALLS DISTRICT HOSPITAL Great War Memorial Hospital Site
PETROLIA LAMBTON HOSPITALS GROUP Charlotte Eleanor Englehart Site
PICTON QUINTE HEALTHCARE CORPORATION Picton Site
PORT COLBORNE NIAGARA HEALTH SYSTEM Port Colborne General Site
PORT PERRY LAKERIDGE HEALTH CORPORATION Port Colborne Site
RAINY RIVER See FORT FRANCES
RED LAKE THE RED LAKE MARGARET COCHENOUR TOWNSHIP MEMORIAL HOSPITAL CORPORATION

104 / Hospital Report Card: Ontario 2009 / Methodological Appendices
Fraser Institute / www.fraserinstitute.org
CITY HOSPITAL
RENFREW RENFREW VICTORIA HOSPITAL
RICHARD’S LANDING
SAULT AREA HOSPITAL Richard’s Landing Site
ST. MARYS ST. MARYS MEMORIAL HOSPITAL
SEAFORTH SEAFORTH COMMUNITY HOSPITAL
SIOUX LOOKOUT SIOUX LOOKOUT MENO-YA-WIN HEALTH CENTRE 5th Avenue Site 7th Avenue Site
SMITH FALLS PERTH AND SMITH FALLS DISTRICT HOSPITAL
SMOOTH ROCK SMOOTH ROCK FALLS HOSPITAL CORPORATION FALLS
SOUTHAMPTON GREY BRUCE HEALTH SERVICES Southampton Site
STRATHROY STRATHROY MIDDLESEX GENERAL HOSPITAL
STURGEON FALLS HÔPITAL GÉNÉRAL DE NIPISSING OUEST/THE WEST NIPISSING GENERAL HOSPITAL
TERRACE BAY THE MCCAUSLAND HOSPITAL
THESSALON SAULT AREA HOSPITAL Thessalon Site
TILLSONBURG TILLSONBURG DISTRICT MEMORIAL HOSPITAL
TRENTON QUINTE HEALTHCARE CORPORATION Trenton Site
UXBRIDGE UXBRIDGE LAKERIDGE HEALTH CORPORATION Uxbridge Site
WALKERTON SOUTH BRUCE GREY HEALTH CENTRE Walkerton Site
WALLACEBURG SYDENHAM DISTRICT HOSPITAL
WAWA LADY DUNN HEALTH CENTRE
WIARTON GREY BRUCE HEALTH SERVICES Wiarton Site
WINCHESTER WINCHESTER DISTRICT MEMORIAL HOSPITAL
WINGHAM WINGHAM AND DISTRICT HOSPITAL
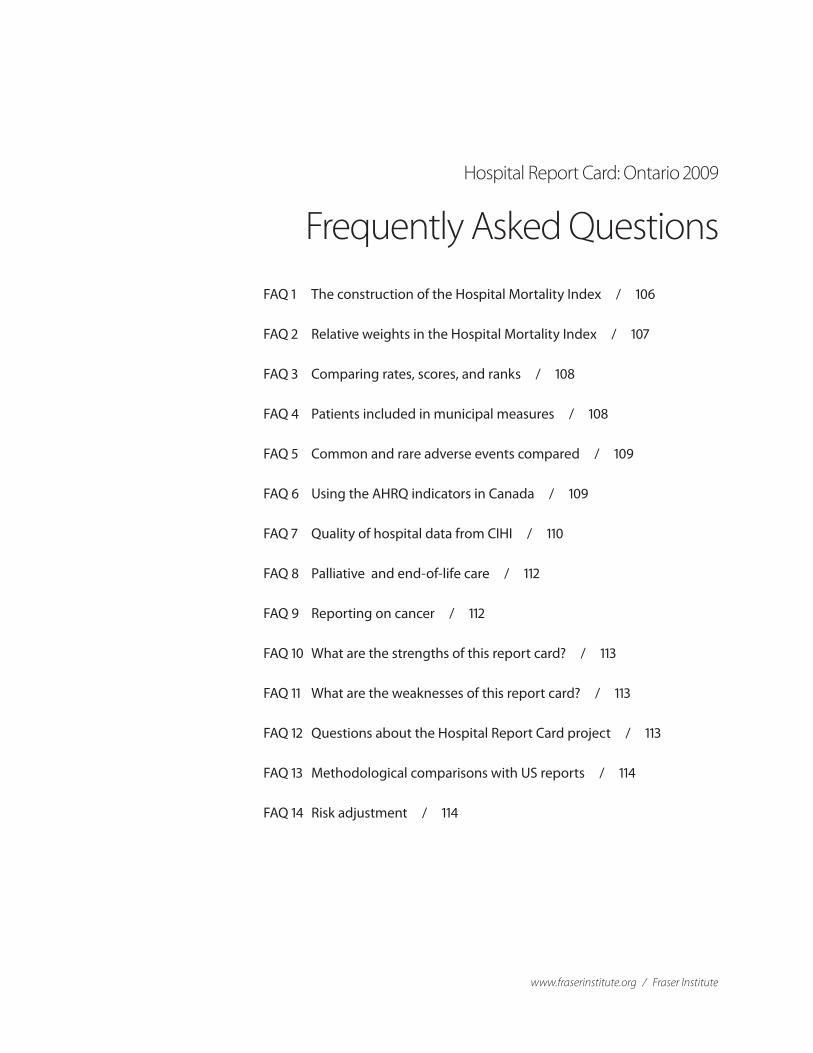
www.fraserinstitute.org / Fraser Institute
Hospital Report Card: Ontario 2009
Frequently Asked Questions
FAQ 1 The construction of the Hospital Mortality Index / 106
FAQ 2 Relative weights in the Hospital Mortality Index / 107
FAQ 3 Comparing rates, scores, and ranks / 108
FAQ 4 Patients included in municipal measures / 108
FAQ 5 Common and rare adverse events compared / 109
FAQ 6 Using the AHRQ indicators in Canada / 109
FAQ 7 Quality of hospital data from CIHI / 110
FAQ 8 Palliative and end-of-life care / 112
FAQ 9 Reporting on cancer / 112
FAQ 10 What are the strengths of this report card? / 113
FAQ 11 What are the weaknesses of this report card? / 113
FAQ 12 Questions about the Hospital Report Card project / 113
FAQ 13 Methodological comparisons with US reports / 114
FAQ 14 Risk adjustment / 114
106 / Hospital Report Card: Ontario 2009 / Frequently Asked Questions
Fraser Institute / www.fraserinstitute.org
FAQ 1 How are some measures (e.g., deaths associated with hip replacement surgery) that do not apply to all hospitals (because they do not perform this type of procedure) handled in calculating an overall mortality score? Did you try to pick things for the Hospital Mortality Index that many hospitals did? This is particularly relevant for smaller hospitals (which may not offer a full range of services), specialty hospitals, and individual sites within a hospital corporation or city (where for quality or efficiency reasons some types of care may be concentrated in some site or another).
The Hospital Mortality Index (HMI) was developed as a result of an interest in a summary measure of patient care outcomes from our study. We started with our full set of indicators and initially hoped to include all of them in an overall index that represented a composite measure of quality and patient safety. This proved impossible for a number of reasons, including the matter of coverage, where not all of the procedures and conditions are found in every hospital. To give examples from 2006/07, we have only 11 hospitals with data for the CABG Mortality Rate indicator and only 24 for Carotid Endarterectomy vol-ume. Through a process of elimination (described in Appendix F), we have ended up with the HMI and its nine measures of mortality.
The coverage provided by the HMI in the latest year is reasonably large: 57 hospitals. To ensure adequate patient-record sample size, an indicator was not used in calculating the HMI if it did not represent at least 75% of patient records for that year. For example, in 2006/07 an indicator had to contain at least 806,412 records in order to be included in the HMI (please see Appendix F for further details on calculating the HMI, ranks and scores). In fact, the HMI does not rank any of the smallest hospitals classified by the Ontario Ministry of Health as “Group C” hospital (i.e., those with fewer than 100 beds) since these hospitals did not pass through the sample-size filter used to create the HMI. We also provide a listing of hospitals by size and type in our report so that hospitals can be compared with their peers, an approach that is regularly done by providers in this sector (please see Appendix K for further information on hospital classifications).
When there are five or fewer cases at a hospital, we have used the AHRQ recommendations and do not show information for reasons of confi-dentiality and comparability. CIHI provided our database and has a standard policy of censoring any data cells that are three or fewer.
Frequently Asked Questions / Hospital Report Card:Ontario 2009 / 107
www.fraserinstitute.org / Fraser Institute
FAQ 2 How are the measures combined to calculate a composite score in the Hospital Mortality Index rankings? Do they receive equal weighting? This may mean that outcomes for an area that very few patients experience (e.g. a highly specialized type of surgery) are given the same weight as those for another type of care that thousands of patients experience each year. On the other hand, if indicators are not equally weighted, the score values some outcomes more than others. Previous research on composite mea-sures in many fields has shown that changing the weights of components often has a large impact on final scores.
The measures in the Hospital Mortality Index (HMI) are equally weighted (for further information on calculating the scores, ranks and HMI, please see Appendix F). This is a standard approach of the Fraser Institute and is used in much of our research when indexing components with unknown weights. One alternative would be to weight according to the populations at risk, the denominator of our indicators. In that case, we would have the largest weight for Death in Low Mortality DRGs, as that is the broadest measure. To take the example of Anonymous Hospital 179, the hospital with the largest number of records, this indicator has 5,784 cases in the denominator, while the other components of the HMI have between 347 (Hip Replacement Mortality) and 693 (AMI Mortality) cases in their denominators.
This then brings up a relevant question: how important are these indi-cators when compared to each other? Is it just a matter of how many patients are treated? There is no obvious answer and so we really want to emphasize that the HMI is a summary measure but people should always look to the individual components and the other indicators of quality and patient safety to understand the circumstances at any given hospital. This is explicitly stated in the Introduction, the Overview and Observations, and the text that is on our website.
108 / Hospital Report Card: Ontario 2009 / Frequently Asked Questions
Fraser Institute / www.fraserinstitute.org
FAQ 3 How precisely are the scores being ranked? How meaningful are the differences based on the scores? Is it fair to say that indicator results tend to be more precise for larger hospitals or municipalities than smaller ones? In producing rankings, it is impor-tant to take into account the extent to which differences in indicator results may be explained by chance alone, as opposed to real differences in care. Statistical tools such as confidence intervals are often used to evaluate how likely it is that observed differ-ences are simply the result of random variation. Likewise, to what extent does a small difference in overall score (which may make a big difference in ranking) represent a true difference in the quality of care and patient safety?
The scores and rankings are a direct result of the underlying indicator rates. We produced both in order to help people understand the relative position of the hospitals for any given indicator (for further information on calculating the scores and ranks, please see Appendix F). In addition, we have compared each institution’s and each municipality’s risk-adjusted rate (per indicator) to the upper and lower bounds of a 95% confidence interval (CI). This additional analysis was performed to measure the statistical significance of each result. Those below the lower CI are statistically “better than average” and those that are above the upper CI are “worse than average” (with the exception of IQIs 22, 23 and 34, where those below the lower CI are “worse than average” and those above the upper CI are “better than average”).
FAQ 4 Whose results are reflected? Are results for municipalities based on patients treated in hospitals in that area or patients from that area regardless of where they were treated? To what extent were results adjusted for the fact that people who live in some communities (e.g. rural or remote regions) may be more likely to be transferred to specialized centres for care? Depending on how indicators were calculated, this may affect mortality and other indicator results.
The municipality results are based on the location of the patient’s residence and this is determined from the first three digits of their postal code (the Forward Sortation Area). There is no exact match of municipality to hospital, as every municipality has patients at more than one hospital. On the other side, every hospital in our study has patients who are from different munici-palities. We have made no adjustment to the municipality measures for the degree to which patients receive care at different hospitals. They are simply measures of results for patients from a given municipality, no matter where the hospital is located in the province.

Frequently Asked Questions / Hospital Report Card:Ontario 2009 / 109
www.fraserinstitute.org / Fraser Institute
FAQ 5 Some types of adverse events are relatively common; others are very rare. In selecting indicators appropriate for a particular level of reporting (e.g. in this case the hospital or municipality level), to what extent has this been taken into account? For example, mea-sures based on rare events (such as foreign objects left in a patient’s body after a procedure) may not be valid for small populations, such as individual hospitals or communities.
It is true that adverse events tend to be rare and smaller places will not always see these consequences of patient care. This was a major reason why only two out of 22 of the patient safety measures were used in the overall Hospital Mortality Index summary measure for the study. It cannot be imputed that a high score on these types of indicators is due to fewer adverse events for those places with relatively low numbers of cases (this is further discussed in Appendix E). Their volume of activity may simply be inadequate to produce the inevitable adverse event. AHRQ can be referenced for work in this regard.
FAQ 6 How were the AHRQ indicators adapted for use in Canada? The ways that Canadian hospitals capture information about the types of health problems and procedures that patients have, differ from the methods used in the United States and have changed over time. For example, the AHRQ indicators used in this study were designed for a classifica-tion system that was used at one time in some, but not all, of Ontario’s hospitals. Other hospitals used a different classification system and all Ontario hospitals have now switched to a new system. Comparing results based on these classification systems is challenging (e.g., because clinical understanding of conditions has changed over time and the level of detail available differs). Also, have the APR-DRGs been adapted for use with the current classification systems in use in Canada?
Appendix J outlines our entire coding methodology. Both the AHRQ indicatorsand 3M risk-adjustment software are measured in the American 9th version of the International Classification of Diseases (ICD-9-CM), whereas in Ontario, the Canadian International Classification of Disease, Version 9 (ICD-9/CCP) was used until FY2001, when the 10th version was implemented (ICD-10-CA/CCI). We are dealing with over 10,000 classification codes in the 9th version and over 30,000 codes in the 10th version. In order to compensate for dif-ferences between ICD-9-CM and the other two systems,, conversion tables were purchased from CIHI and applied to the codes in the DAD. Each code that did not directly translate between the two classifications was individually analyzed with respect to each indicator and other codes that contained the same information. A concentrated effort was applied to this process (which took months to complete) in order to ensure the most accurate translations. All of this is discussed in the Appendices.

110 / Hospital Report Card: Ontario 2009 / Frequently Asked Questions
Fraser Institute / www.fraserinstitute.org
FAQ 7 Has the validity of the data used in calculating specific indicators been assessed? The quality of much hospital data is high but the extent of reporting and consistency of some data varies between institutions and over time. For example, there are known historical issues that may affect the comparability of some of the indicators cited. How likely do you think that there were data processing or coding mistakes in the data you bought from CIHI? Or, did you do the coding yourself?
CIHI’s Discharge Abstract Database (DAD) contains information on hos-pital stays in Canada. Various CIHI publications note that the DAD is used extensively by a variety of stakeholder groups to monitor the use of acute-care health services, conduct analyses of health conditions and injuries, and increasingly to track patient outcomes. The DAD is a major data source used to produce various CIHI reports, including annual reports on the perfor-mance of hospitals and the health care system and for seven of the health indicators adopted by the federal, provincial, and territorial governments (CIHI, 2002). These data have been used extensively in previous reports on health care performance and form the basis for many journal articles (see, e.g., Ontario Hospital Association and the Government of Ontario, 2007; Aubrey-Bassler et al., 2007).
Once a patient is discharged, the data for the patient’s stay is subject to a detailed abstraction process conducted by a health records professional and then results are submitted to CIHI. CIHI applies a comprehensive edit and cor-rection system and inaccuracies or incorrect information are followed up on at the hospital level when the DAD is sent back to the hospitals for data validation.
The data are collected under consistent guidelines, by trained abstrac-tors, in all acute-care hospitals in Ontario. The data undergo extensive edit checks to improve accuracy but all errors cannot be eliminated. However, in order to produce good information about data quality, CIHI established a comprehensive and systematic data quality program, whose framework involves 24 characteristics relating to five data quality dimensions of accuracy, timeliness, relevance, comparability, and usability.
There are a number of publications that have addressed data qual-ity issues that are discussed in our report. Of note are CIHI’s reabstraction studies that go back to the original patient charts and recode the information using a different set of expert coders.1
The reabstraction studies, performed in the province of Ontario, note the following rates of agreement between what was initially coded compared to what was coded on reabstraction:
1 Reabstractors participating in the study were required to have several years of coding experi-ence, experience coding in ICD-10-CA and CCI in particular, experience coding at a tertiary care centre, and attendance at specific CIHI educational workshops. They were also required to attend a one-week training session and to receive a passing score on the inter-rater test.
Frequently Asked Questions / Hospital Report Card:Ontario 2009 / 111
www.fraserinstitute.org / Fraser Institute
a non-medical data: 96%–100% b selection of intervention codes (procedure codes): 90%–95% c selection of diagnosis codes: 83%–94% d selection of most responsible diagnosis: 89%–92% e typing of co-morbidities: pre-admit: 47%–69%; post-admit: 51%–69% f diagnosis typing (which indicates the relationship of the diagnosis to the
patient’s stay in hospital) continues to present a problem; discrepancy rates have not diminished with adoption of ICD-10-CA.
The coding issues in points (e) and (f ) do not affect our results since the most responsible diagnosis is coded with a high degree of agreement and the AHRQ indicators do not discriminate between diagnosis types. Overall, when the rates of agreement in the third year of this reabstraction study (performed on data coded in ICD-10-CA) were compared to the rates of agreement of the previous years’ data (coded in ICD-9/CCP), the rates were as well as or better than the rates previously.
However, with regard to the coding of pneumonia, a potential data quality issue exists because some reabstraction coders selected pneumo-nia instead of chronic obstructive pulmonary disease (COPD) as the most responsible diagnosis (CIHI, 2004b). This could potentially create false posi-tive results for Pneumonia Mortality rate (IQI 20) since this indicator counts deaths due to pneumonia in situations where the primary diagnosis is a pneu-monia diagnosis code. We have noted this proviso in our report.
With respect to specific conditions related to the health indicators examined, those that are procedure driven (i.e. cesarean section (C section), CABG, and total knee replacement) were coded well with low discrepancy rates. The following had less than a 5% rate of discrepancy: C section,coronary artery bypass graft (CABG), hysterectomy, total knee replacement, vaginal birth after cesarean (VBAC), and total hip replacement. The following had greater than 5% discrepancy: acute myocardial infarction (AMI), 8.9%; hip fracture, 6.0%; hospitalization due to pneumonia and influenza, 6.9%; and injury hospitalization, 5.3% (CIHI, 2002).
Discrepancy rates were noted in conditions that are diagnosis driven: AMI (CIHI, 2002: 8), stroke, pneumonia, and COPD (CIHI, 2004b) (as described above). Only the pneumonia codes are potentially affected in our report.
Overall, according to CIHI, findings from their three-year DAD re-abstraction studies have confirmed the strengths of the database, while identi-fying limitations in certain areas resulting from inconsistencies in the coding of some data elements. In addition, the findings from the inter-rater data (that is, comparison between reabstractors) were generally similar to the find-ings from the main study data (that is, comparison between original coder and reabstractor). This suggests that the database is coded as well as can be expected using existing approaches in the hospital system.
112 / Hospital Report Card: Ontario 2009 / Frequently Asked Questions
Fraser Institute / www.fraserinstitute.org
FAQ 8 How was palliative care handled? Some studies suggest that Canadians receiving end-of-life care in hospital (rather than in a hospice or at home) are more likely to die than similar patients in many other countries. Within Canada, the extent to which end-of-life care occurs in hospital varies from community to community. Deaths among these patients are not unexpected and do not necessarily indicate any issues with quality of care. Identifying these patients is complex but important, particularly when calculat-ing results for indicators such as deaths among patients with pneumonia. For exam-ple, about 15% of in-hospital deaths were palliative-care cases in acute-care hospitals. Furthermore, a substantial number of patients who were hospitalized mainly for other conditions also received palliative care services during their stay.
The Discharge Abstract Database (DAD) is a national database for information on all acute-care hospital separations (discharges, deaths, sign-outs, transfers). In Ontario, only discharges for acute-care hospitals are contained in the DAD since day surgery data has been moved to the National Ambulatory Care Reporting System (NACRS), chronic-care data to the Ontario Chronic Care Patient System (OCCPS), and rehabilitation data to the National Rehabilitation Reporting System (NRS). There has been no adjustment for palliative care, in line with the AHRQ methodology. Palliative patients are difficult to diagnose (and much palliative care is given outside the hospital setting) and are often identified as such only in hindsight. Only as recently as June 19, 2006 did CIHI begin instructing institutions on how to best indicate a palliative patient. Previously (and until FY2006/07 in their databases), there was no national coding standard to identify patients with terminal illness who are receiving palliative care in hospital. There is, however, an ICD-10-CA code for palliative care. In FY2006/07, the frequency of this code is 0.6% (or 6,108 of 1,075,216 patient records). We hope to incorporate these improvements in the DAD in subsequent reports, as the information becomes available.
FAQ 9 Why is there so little in the report about cancer? Is it particularly difficult to report?
The treatment of cancer is not included in the AHRQ indicators. We chose the ARHQ methodology because it was objective, backed by a large body of research, in use in a number of jurisdictions, and based on administrative data. We have noted in the report that the indicators are for a very specific portion of hospital care: inpatient acute care. There is nothing directly related to cancer, ambulatory, clinical, ER, and so on, nor are there measures of things like patient satisfaction or the financial performance of hospitals. Comments on hospital performance should be conditioned with the fact that this is not a comprehensive survey of all hospital care. In fact, the main value is probably
Frequently Asked Questions / Hospital Report Card:Ontario 2009 / 113
www.fraserinstitute.org / Fraser Institute
at the individual indicator level because that is most meaningful for a patient concerned with a certain condition or procedure. AHRQ has conducted exten-sive research on assessing performance on certain indicators that studies have shown are related to quality. AHRQ has identified four categories of quality indicators that appear to have relationships to the outcomes of care provided within hospitals: mortality for specific procedures, mortality for specific condi-tions, procedure utilization, and procedure volume. Research has confirmed that the rate of patient deaths for certain procedures and conditions may be associated with quality of care. While research can predict an expected range of patient deaths for a given procedure or condition, mortality rates above or below the expected range may have quality implications. For some procedures, research has shown that overuse, under use, and misuse (utilization) may affect patient outcomes. For certain procedures, the number of times (volume) the procedure is performed in a hospital has been linked to the patient’s outcome.
FAQ 10 What do you see as the strengths of this report card?
The strengths of the report card are its transparency in terms of data and methodology, the detail provided at the hospital and indicator level, and the focus on patient-oriented information as well as the sample size of patient records, which over the ten-year period was more than 10.5 million.
FAQ 11 What about its weaknesses?
The weaknesses of the report card are its limited coverage (applying only to inpatient acute care), the number of anonymous hospitals, and potential issues with data quality.
FAQ 12 What is the timeline on this project? What provinces will you add next year? When will you cover the whole country?
This is the third annual hospital report card for Ontario (earlier editions are 2008 and 2006, updated 2007). One hospital report card for British Columbia has also been produced. We hope to include more participating hospitals from Ontario next year and to have full national coverage within five to seven years.

114 / Hospital Report Card: Ontario 2009 / Frequently Asked Questions
Fraser Institute / www.fraserinstitute.org
FAQ 13 Is this exactly the same methodology that New York and other states used in their hospital care surveys? Or were there some changes?
The AHRQ methodology is the same as that used in more than a dozen US states, including New York, Texas, Colorado, California, Florida, Kentucky, Massachusetts, Maryland, Minnesota, New Jersey, Oregon, Utah, Vermont, and parts of Wisconsin. There is also a recently released report by the Manitoba Center for Health Policy that used the AHRQ Patient Safety Indicators (Bruce et al., 2006).
In order to use the CMS- and APR-DRG software, the DAD data-set received from CIHI required several standard modifications to account for differences in the Canadian and US coding methodologies. All standard modifications are explicitly detailed in Appendices B, C, and J.
FAQ 14 To what extent did the risk adjustment improve the “fit” of the model used to describe the indicators? This is typically measured statistically by measures such as a t-statistic, which tells you how much better you were at predicting which patients would die when you used the risk-adjustment model compared to when you did not.
The AHRQ and 3M risk-adjustment processes are employed to control at least partially for variances in patient health status. The methodology employs three types of adjustments involving age, gender, and co-morbidities. They are not used to predict which patients would die. The risk-adjustment model has not been validated by us. It has been thoroughly validated in the course of developing the AHRQ program over the past decade. It also has addi-tional value because the methodology is transparent, is in use in many other jurisdictions, and is done in an identical and therefore comparable way. The software required to run these programs is in the public domain, in contrast to similar reports, which have a proprietary risk-adjustment technique.

www.fraserinstitute.org / Fraser Institute
Hospital Report Card: Ontario 2009
References
116 / Hospital Report Card: Ontario 2009 / References
Fraser Institute / www.fraserinstitute.org
Aubrey-Bassler, Kris, Sarah Newbery, Len Kelly, Bruce Weaver, and Scott Wilson (2007). Maternal Outcomes of Cesarean Sections: Do Generalists’ Patients Have Different Outcomes Than Specialists’ Patients? Canadian Family Physician 53, 12: 2132–38.
Baker, G.R., et al. (1998). Healthcare Performance Measurement in Canada: Who’s Doing What? Hospital Quarterly 2, 2: 22–26.
Baker, G.R., et al. (2004). The Canadian Adverse Events Study: The Incidence of Adverse Events among Hospital Patients in Canada. Canadian Medical Association Journal 170, 11 (May): 1678–86. <http://www.cmaj.ca/cgi/content/full/170/11/1678>.
Berwick, D.M., and D.L. Wald (1990). Hospital Leaders’ Opinions of the HCFA Mortality Data. JAMA 263, 2: 247–49.
Bruce, S., et al. (2006). Application of Patient Safety Indicators in Manitoba: A First Look. Manitoba Centre for Health Policy.
Canadian Cardiovascular Outcomes Research Team [CCORT] (2004). Quality of Cardiac Care in Ontario. Institute for Clinical Evaluative Sciences [ICES]. <http://www.ices.on.ca/WebBuild/site/ices-internet-upload/file_collection/Ccort%5FFull%5FReport%2Epdf>.
Canadian Institute for Health Information [CIHI] (2002). Discharge Abstract Database Data Quality Re-abstraction Study. Combined Findings for Fiscal Years 1999/2000 and 2000/2001. CIHI.
Canadian Institute for Health Information [CIHI] (2004a). Canadian Coding Standards for ICD-10-CA and CCI. CIHI.
Canadian Institute for Health Information [CIHI] (2004b). Data Quality of the Discharge Abstract Database Following the First-year Implementation of ICD-10-CA/CCI—Final Report. CIHI.
Canadian Institute for Health Information [CIHI] (2005). CIHI Data Quality Framework. June 2005 Revision. CIHI.
Canadian Institute for Health Information [CIHI] (2007). HSMR: A New Approach for Measuring Hospital Mortality Trends in Canada. CIHI.
Canadian Institute for Health Information [CIHI] (2008). Technical Notes, Hospital Standardized Mortality Ratio (HSMR). Updated September 2008. CIHI.
References / Hospital Report Card: Ontario 2009 / 117
www.fraserinstitute.org / Fraser Institute
Centers for Disease Control and Prevention (2008). International Classification of Diseases, Ninth Revision, Clinical Modification, Sixth Edition. <http://www.cdc.gov/nchs/datawh/ftpserv/ftpicd9/ftpicd9.htm#guidelines>.
Cutler, D.M., et al. (2004). The Role of Information in Medical Markets: An Analysis of Publicly Reported Outcomes in Cardiac Surgery. Working Paper No. 10489. National Bureau of Economic Research.
Esmail, Nadeem (2003). Health Information in Hiding. Fraser Forum (May): 12–13.
Esmail, Nadeem, and Maureen Hazel (2008a). Hospital Report Card: British Columbia 2008. Fraser Institute. <http://www.fraserinstitute.org/researchandpublications/publications/5177.aspx>.
Esmail, Nadeem, and Maureen Hazel (2008b). Hospital Report Card: Ontario 2008. Fraser Institute. <http://www.fraserinstitute.org/researchandpublications/publications/5199.aspx>.
Esmail, Nadeem, and Michael Walker (2008). How Good Is Canadian Health Care? 2008 Report. An International Comparison of Health Care Systems. Fraser Institute. <http://www.fraserinstitute.org/researchandpublications/publications/6353.aspx>.
Esmail, Nadeem, and Maureen Hazel, with Michael Walker (2008). Waiting Your Turn: Hospital Waiting Lists in Canada, 18th Edition. Fraser Institute. <http://www.fraserinstitute.org/researchandpublications/publications/6240.aspx>.
Forster, A.J., et al. (2004). Ottawa Hospital Patient Safety Study: Incidence and Timing of Adverse Events in Patients Admitted to a Canadian Teaching Hospital. Canadian Medical Association Journal 170, 8 (April): 1235–40. <http://www.pubmedcentral.gov/articlerender.fcgi?tool=pubmed&pubmedid=15078845>.
GTA/905 Healthcare Alliance (2005). The State of Hospital Care in the GTA/905.
Hannan, E.L., et al. (1994). Improving the Outcomes of Coronary Bypass Surgery in New York State. JAMA 271: 761–66.
Hay Group (2007). Annual Benchmarking Comparison of Canadian Hospitals. The Hay Group and The Canadian Institute for Health Information. <http://www.haygroup.com/ca/Clients/Industry_Expertise.asp?id=10223>.
118 / Hospital Report Card: Ontario 2009 / References
Fraser Institute / www.fraserinstitute.org
Kessler, Daniel P. (2003). Health Care Quality Report Cards. PowerPoint® presentation, May 29, 2003. Stanford University; Hoover Institution; National Bureau of Economic Research. <http://www.ftc.gov/ogc/healthcarehearings/docs/030529kessler.pdf>.
Leyland, A.H., and F.A Boddy (1998). League Tables and Acute Myocardial Infarction. Lancet 351, 9102: 555–58.
London Department of Health (1998). A First Class Service, Quality in the NHS. <http://www.dh.gov.uk/en/Publicationsandstatistics/Publications/PublicationsPolicyAndGuidance/DH_4006902>.
London Department of Health (1999). The NHS Performance Assessment Framework. <http://www.dh.gov.uk/en/Publicationsandstatistics/Publications/PublicationsPolicyAndGuidance/DH_4009190>.
Marshall, M.N., et al. (2003). Public Reporting on Quality in the United States and the United Kingdom. Health Affairs (May/June): 136. <http://content.healthaffairs.org/cgi/reprint/22/3/134.pdf>.
McKee, M., and J. Healy (2000). Monitoring Hospital Performance. Euro Observer 2, 2: 1–3.
Millar, John, Soeren Mattke, and the Members of the OECD Patient Safety Panel (2004). Selecting Indicators for Patient Safety at the Health Systems Level in OECD Countries. <http://www.oecd.org/dataoecd/53/26/33878001.pdf>.
Mullins, Mark, Rena Menaker, and Nadeem Esmail (2006). The Fraser Institute Hospital Report Card: Ontario 2006. Revised Sept. 2007. Fraser Institute. <http://www.fraserinstitute.org/researchandpublications/publications/3149.aspx>.
National Health Service (1991). The Patient’s Charter. Originally issued by Patient’s Charter Unit, Department of Health; abolished 2000; now available at <http://www.pfc.org.uk/node/633#charter>.
New Jersey, Department of Health and Senior Services (2001). Cardiac Surgery in New Jersey: Consumer Report. <http://www.state.nj.us/health/healthcarequality/cabgs01/cabg_consumer01.pdf>.
New York State Department of Health (2005). Adult Cardiac Surgery in New York State 2001–2003. <http://www.nyhealth.gov/nysdoh/heart/pdf/2001-2003_cabg.pdf>. Links to the entire series of reports can be found at <http://www.health.state.ny.us/nysdoh/heart/heart_disease.htm>.
References / Hospital Report Card: Ontario 2009 / 119
www.fraserinstitute.org / Fraser Institute
O’Connor, G.T., et al. (1996). A Regional Intervention to Improve the Hospital Mortality Associated with Coronary Artery Bypass Graft Surgery. The Northern New England Cardiovascular Disease Study Group. JAMA 275, 11: 841–46.
Ontario Hospital Association (1998). The Hospital Report ’98. <http://www.oha.com/oha/reprt5.nsf/40d9775ac5a0199705256c1e0058bc82/a08ac0318c634c0d852568420063535b/$FILE/OHAreport98.pdf>.
Ontario Hospital Association (1999). The Hospital Report ’99. <http://www.oha.com/oha/reprt5.nsf/98fdda767aa464a385256c980064f383/e7631c39b7e1bd08852568460057cfab/$FILE/Full%20Report.pdf>.
Ontario Hospital Association and the Government of Ontario (2006). Hospital Report 2006: Acute Care. <http://www.oha.com/client/OHA/OHA_LP4W_LND_WebStation.nsf/resources/Hospital+Reports/$file/acute_report_2006.pdf>.
Ontario Hospital Association and the Government of Ontario (2007). Hospital Report 2007: Acute Care. <http://www.oha.com/Client/OHA/OHA_LP4W_LND_WebStation.nsf/resources/2007+Hospital+Reports/$file/OHA_Acute07_EN_final.pdf>.
Penfold, Robert B., Stafford Dean, Ward Flemons, and Michael Moffatt (2008). Do Hospital Standardized Mortality Ratios Measure Patient Safety? HSMRs in the Winnipeg Regional Health Authority. HealthcarePapers 8, 4: 9–24.
Pennsylvania Health Care Cost Containment Council [PHC4] (1998). Pennsylvania’s Guide to Coronary Artery Bypass Graft Surgery 1994–1995: Information about Hospitals, Cardiac Surgeons, and Health Plans. Pennsylvania Health Care Cost Containment Council. <http://www.phc4.org>.
Sternberg, Steve, and Anthony DeBarros (2008, August 8). Hospital Death Rates Unveiled for First-Time Comparison. USA Today. <http://www.usatoday.com/news/health/2008-08-20-hospital-death-rates_N.htm>.
Street, A. (2002). The Resurrection of Hospital Mortality Statistics in England. Journal of Health Services Research and Policy 2: 104–10.
Woodward, Graham, Thérèse Stukel, Michael Schull, Nadia Gunraj, and Andreas Laupacis (2004). Utilization of Ontario’s Health System During the 2003 SARS Outbreak. An ICES Investigative Report (May). Institute for Clinical Evaluative Sciences (ICES).
Zinman, D. (1991). Heart Surgeons Rated. State Reveals Patient-Mortality Records. Newsday (December): 34.
Hospital Report Card: Ontario 2009 / 121
www.fraserinstitute.org / Fraser Institute
About the authors
Nadeem EsmailNadeem Esmail is the Director of Health System Performance Studies and Manager of the Alberta Policy Research Centre at the Fraser Institute. He completed his B.A. (Honours) in Economics at the University of Calgary, and received an M.A. in Economics from the University of British Columbia. His recent publications and co-publications for the Fraser Institute include the series Waiting Your Turn: Hospital Waiting Lists in Canada, the How Good Is Canadian Health Care? series, and The Alberta Health Care Advantage: An Accessible, High Quality, and Sustainable System. His articles have appeared in newspapers across Canada, he has spoken internationally on health care policy and reform, and he has been a guest on numerous radio and TV pro-grams across the country.
Maureen HazelMaureen Hazel was a health policy analyst at the Fraser Institute until February of 2009. She completed her B.Com. (first class Honours) and M.A. in Economics at McGill University. Her recent publications and co-publica-tions for the Fraser Institute include the 18th edition of Waiting Your Turn: Hospital Waiting Lists in Canada, Hospital Report Card: British Columbia 2008, and Hospital Report Card: Ontario 2008.

122 / Hospital Report Card: Ontario 2009
Fraser Institute / www.fraserinstitute.org
Acknowledgments
The authors would like to to thank all those involved in the production and release of this study including Melissa Holoday, Kristin McCahon, Wendy Mills, and Dean Pelkey. Additionally, we want to thank Mark Mullins, Rena Menaker, and Ian Vaculik for developing and contributing to the base of knowledge that is incorporated into this publication; and Mark Mullins and Rena Menaker for their work in producing the first version of the Fraser Institute’s Hospital Report Card for Ontario and indeed Canada. Lastly, we would like to thank all the hospitals that participated in validating their data and providing feedback.
The authors, of course, take full and complete responsibility for any remaining errors or omissions. As they have worked independently, the views expressed in this study do not necessarily represent the views of the trustees, supporters, or other staff of the Fraser Institute.
CIHI Acknowledgment & Disclaimer
Parts of this material are based on data and information provided by the Canadian Institute for Health Information. The Canadian Institute for Health Information does not endorse or support the methodology used by the Fraser Institute and, therefore, the analyses, conclusions, opinions, and statements expressed herein are those of the authors and not those of the Canadian Institute for Health Information.

Hospital Report Card: Ontario 2009 / 123
www.fraserinstitute.org / Fraser Institute
About this publication
Periodically, the Fraser Institute publishes timely and comprehensive stud-ies of current issues in economics and public policy. This study is one such example belonging to a series of related publications.
DistributionThese publications are available from <http://www.fraserinstitute.org> in Portable Document Format (PDF) and can be read with Adobe Acrobat® or with Adobe Reader®, which is available free of charge from Adobe Systems Inc. To down-load Adobe Reader, go to this link: <http://get.adobe.com/reader/> with your Browser. We encourage you to install the most recent version.
Ordering publicationsFor information about ordering the printed publications of the Fraser Institute, please contact the publications coordinator
•e-mail: [email protected]
•telephone: 604.688.0221 ext. 580 or, toll free, 1.800.665.3558 ext. 580
•fax: 604.688.8539.
MediaFor media enquiries, please contact our Communications Department
•604.714.4582
•e-mail: [email protected].
DisclaimerThe authors of this publication have worked independently and opinions expressed by them are, therefore, their own, and do not necessarily reflect the opinions of the supporters, trustees, or other staff of the Fraser Institute. This publication in no way implies that the Fraser Institute, its trustees, or staff are in favor of, or oppose the passage of, any bill; or that they support or oppose any particular political party or candidate.
CopyrightCopyright© 2009 by the Fraser Institute. All rights reserved. No part of this publication may be reproduced in any manner whatsoever without written permission except in the case of brief passages quoted in critical articles and reviews.
124 / Hospital Report Card: Ontario 2009
Fraser Institute / www.fraserinstitute.org
ISSN1918-2082 Studies in Health Care Policy (print version)1918-2090 Studies in Health Care Policy (online version)
Trademarks3M and APR are trademarks of 3M, used under license in Canada.
Date of issueMarch 2009This version: update 2 (March 19, 2009)
Editing and designKristin McCahon and Lindsey Thomas Martin.
Cover designBill Ray
Images for cover© KHZ, Fotolia (“Blood Cells”)
© Kristy Pargeter, Fotolia (“Heart Monitor”)
© Robert Byron, iStockphoto (“Blood Sample”)
© Emrah Turudu, iStockphoto (“Test Tube”)
© Andrzej Tokarski, Fotolia (“X-Ray”)
© Vasiliy Yakobchuk, iStockphoto (“Brain”)
Supporting the Fraser Institute
To learn how to support the Fraser Institute, please contact
•Development Department, Fraser InstituteFourth Floor, 1770 Burrard Street Vancouver, British Columbia, V6J 3G7 Canada
•telephone, toll-free: 1.800.665.3558 ext. 586
•e-mail: [email protected].

Hospital Report Card: Ontario 2009 / 125
www.fraserinstitute.org / Fraser Institute
About the Fraser Institute
Our vision is a free and prosperous world where individuals benefit from greater choice, competitive markets, and personal responsibility. Our mission is to measure, study, and communicate the impact of competitive markets and government interventions on the welfare of individuals.
Founded in 1974, we are an independent research and educational organization with locations throughout North America and international partners in over 70 countries. Our work is financed by tax-deductible con-tributions from thousands of individuals, organizations, and foundations. In order to protect its independence, the Institute does not accept grants from government or contracts for research.
菲沙研究所的願景乃一自由而昌盛的世界,當中每個人得以從更豐富的
選擇、具競爭性的市場及自我承擔責任而獲益。我們的使命在於量度、
研究並使人知悉競爭市場及政府干預對個人福祉的影響。
Nous envisageons un monde libre et prospère, où chaque personne bénéfi-cie d’un plus grand choix, de marchés concurrentiels et de responsabilités individuelles. Notre mission consiste à mesurer, à étudier et à communi-quer l’effet des marchés concurrentiels et des interventions gouvernemen-tales sur le bien-être des individus.
Nuestra visión es un mundo libre y próspero donde los individuos se bene-ficien de una mayor oferta, la competencia en los mercados y la responsabi-lidad individual. Nuestra misión es medir, estudiar y comunicar el impacto de la competencia en los mercados y la intervención gubernamental en el bienestar de los individuos.
تتمثل رؤيتنا يف وجود عامل حر ومزدهر يستفيد فيه األفراد من القدرة عىل االختيار بشكل أما رسالتنا فهي قياس، ودراسة، وتوصيل . أكرب، واألسواق التنافسية، واملسؤولية الشخصية
.تأثري األسواق التنافسية والتدخالت الحكومية املتعلقة بالرفاه االجتامعي لألفراد

126 / Hospital Report Card: Ontario 2009
Fraser Institute / www.fraserinstitute.org
Prof. Armen Alchian
Prof. Terry Anderson
Prof. Robert Barro
Prof. Michael Bliss
Prof. James M. Buchanan†
Prof. Jean-Pierre Centi
Prof. Thomas J. Courchene**
Prof. John Chant
Prof. Bev Dahlby
Prof. Erwin Diewert
Prof. Stephen Easton
Prof. J.C. Herbert Emery
Prof. Jack L. Granatstein
Prof. Herbert G. Grubel
Prof. Friedrich A. Hayek* †
Prof. James Gwartney
Prof. H.G. Johnson*
Prof. Ronald W. Jones
Dr. Jerry Jordan
Prof. David Laidler**
Prof. Richard G. Lipsey**
Prof. Ross McKitrick
Prof. Michael Parkin
Prof. F.G. Pennance*
Prof. Friedrich Schneider
Prof. L.B. Smith
Prof. George Stigler* †
Mr. Vito Tanzi
Sir Alan Walters
Prof. Edwin G. West*
Editorial Advisory Board
* deceased; ** withdrawn; † Nobel Laureate