Embed Size (px)
Citation preview
Hospital Prescribing: England 2012
Published 13 November 2013
Hospital Prescribing: England 2012
2 Copyright © 2013, Health and Social Care Information Centre. All rights reserved.
We are the trusted source of authoritative data and information relating to health and care.
www.hscic.gov.uk [email protected]
Author: Prescribing team, Health and Social Care Information Centre
Responsible statistician: Kate Croft, Senior Services Manager
Version: V1.0 Date of publication
13 November 2013
Hospital Prescribing: England 2012
Copyright © 2013, Health and Social Care Information Centre. All rights reserved. 3
Contents Executive Summary 4
Introduction 5
Sources 5
Data collection 5
Coverage 6
Net Ingredient Cost of prescriptions 6
Overall costs 7
Nationally for England 7
Strategic Health Authority level 10
Medicines appraised by NICE 13
Specific therapeutic area 21
Appendix 1: Sources and definitions 25
Hospital Prescribing Audit Index (HPAI) database 25
Primary Care 26
Prescriptions issued in hospitals and dispensed in the community – “FP10(HP)” 26
Methods of medicine supply routes and data collection 27
Definition of Terms 28
Data limitations 28
Appendix 2: Drugs included in the analyses 29
Appendix 3: Projected Populations of SHAs 31
Appendix 4: Limits on Access to Hospital Data 32
Hospital Prescribing: England 2012
4 Copyright © 2013, Health and Social Care Information Centre. All rights reserved.
Executive Summary This bulletin, Hospital Prescribing: England 2012 reports on the use of medicines in hospitals and puts their use into context by comparing it with their use in primary care and with medicines prescribed in hospitals but dispensed in the community. This bulletin also includes a section looking at the medicines positively appraised by the National Institute for Health and Clinical Excellence (NICE) since many are used mainly or exclusively in hospitals. The report also looks at the use of anti-bacterial drugs.
Data for hospital use of medicines is provided by IMS Health, who collects data on issues from pharmacies in the majority of hospitals in England and apply costs to this data using the Drug Tariff and standard price lists. Since hospitals are often able to access NHS negotiated discounted prices for medicines, the costs presented in this report are therefore not necessarily those that hospitals actually paid for medicines. The data for medicine use in the other two sectors, primary care and hospital prescribed medicines dispensed in the community, comes from the Prescription Services Division of the NHS Business Services Authority (BSA) which is responsible for reimbursing those who dispense prescriptions.
• The overall NHS expenditure on medicines in 2012 was £13.3 billion.
• In 2012 hospital use accounted for 36.5 per cent of the total cost, up from 33.3 per cent in 2011.
• The cost of medicines rose by 1.5 per cent overall but by 11.1 per cent in hospitals.
• Of the drugs positively appraised by NICE, the greatest overall cost was for adalimumab, which also incurred the greatest cost in hospitals.
Hospital Prescribing: England 2012
Copyright © 2013, Health and Social Care Information Centre. All rights reserved. 5
Introduction This bulletin presents summary figures relating to medicine use in hospitals in England for 2012 from a data source collected by IMS Health, the Hospital Pharmacy Audit Index (HPAI). The bulletin aims to place the use of medicines in hospital in the context of prescribing in primary care and the wider health economy.
Sources The figures included in this bulletin are derived from both the IMS Health Hospital Pharmacy Audit Index database and the databases maintained by the Prescription Services Division of the BSA. Rather than present the data by the classification used in the British National Formulary (BNF), the document focuses on specific medicines and particular therapeutic areas. This is principally because the HPAI data is classified by the European Pharmaceutical Marketing Research Association (EphMRA) version of the Anatomical Therapeutic Chemical (ATC) system and there is no simple conversion to the BNF system. Access to the HPAI data is regulated by a contract between IMS Health and the Health and Social Care Information Centre (HSCIC). Publication of detailed data extracts will not normally be permitted under the contract. Details of the major conditions imposed by the contract are given in Appendix 4, Limits on access to Hospital data. IMS Health updates historic data as they receive revised figures from individual hospitals. The figures in this report may therefore differ from figures published previously.
Data collection Unlike primary care, there is no central NHS collation of information on medicines issued and used in NHS hospitals. IMS Health collects and collates this data on a commercial basis. The HPAI is based on issues of medicines recorded on hospital pharmacy systems. The information is sent to IMS Health each month electronically by hospital pharmacy departments. Issues refer to all medicines supplied from hospital pharmacies to wards, departments, clinics, theatres, satellite sites and to patients both in out-patient clinics and on discharge. Therefore, the HPAI monitors usage levels by hospitals rather than purchases by trusts. This avoids any bias introduced by some hospitals which purchase on behalf of a consortium of trusts. Data on medicine use is collated as quantities issued (packs) and no financial information is collected. There is no equivalent to the concept of an item as is commonly used in analysing primary care data. Costs are calculated from quantities by IMS Health using the Drug Tariff and other standard price lists. Many hospitals receive discounts from suppliers, particularly for high volume drugs, which are commercially confidential. Therefore, the costs reported in this bulletin do not represent the actual amount paid by hospitals. They are a proxy for utilisation and are not suitable for estimating financial pressures. In this bulletin hospital costs are referred to as estimated costs. However, a comparison between the costs taken from the HPAI database and the returns to the Department of Health (DH) from trusts suggests that the total costs are similar although costs may be different for individual medicines. There are some geographical and supply areas where data collection may not be complete. Further details are provided in Appendix 1: Sources and definitions. When medicines are provided using a prescription, written in primary care or in a hospital and then dispensed in the community, the form is returned to Prescription Services by the
Hospital Prescribing: England 2012
6 Copyright © 2013, Health and Social Care Information Centre. All rights reserved.
dispenser for re-imbursement of the costs incurred by dispensing. The data derived from processing these forms is provided through the Prescription Services Division’s ePACT systems. Hence, ePACT provides data on prescriptions written in primary care and also data on prescriptions written in hospitals but dispensed in the community.
Coverage • Whilst the HPAI does not include all hospitals, over 99 per cent of NHS beds across
England are covered in the data provided. Therefore, the HPAI is grossed up by IMS Health to provide national figures according to the proportion of beds within the sample. However the data at SHA level is not adjusted. For more details see Appendix 1: Sources and definitions.
• Medicines can be supplied to patients through a variety of methods. While the data in this bulletin covers the majority of prescribing activity it does not cover.
• Situations in primary care where a medicine is supplied but no prescription is generated e.g. direct supply to patients under a Patient Group Direction or Minor Ailment Scheme or by an Out of Hours Service.
• All medicines supplied via “homecare”, where the medicines are delivered directly to patients in their home. Some hospitals record such activity in their pharmacy system while others do not. The total value of homecare is estimated by the Commercial Medicines Unit of the Department of Health to exceed £1.5 billion per year. However, we do not know what proportion of this is included in the hospital data reported here.
• Further details of methods of supply and data collection are provided in Appendix 1: Sources and definitions.
This means that these figures may be an under-estimate for some medicines.
Net Ingredient Cost of prescriptions All costs given in this bulletin are net ingredient cost (NIC). This is the basic price of a drug excluding VAT (the price listed in the national Drug Tariff or in standard price lists). It standardises cost throughout prescribing across the whole health economy, and allows comparisons of data from different sources. For hospitals this is not necessarily what they actually paid as the NHS Commercial Medicines Unit (CMU) negotiates NHS contracts providing discounts on many products. Even when trusts purchase medicines outside such contracts they often receive a discount on the price given in the Drug Tariff. Unlike medicines supplied through primary care prescribing, medicines purchased by hospitals are subject to VAT. Due to the methods by which data on hospital medicine use is collated and calculated, hospital and total costs are estimated net ingredient costs. Where hospital and total costs are stated throughout the bulletin the figures refer to estimated net ingredient costs.
Hospital Prescribing: England 2012
Copyright © 2013, Health and Social Care Information Centre. All rights reserved. 7
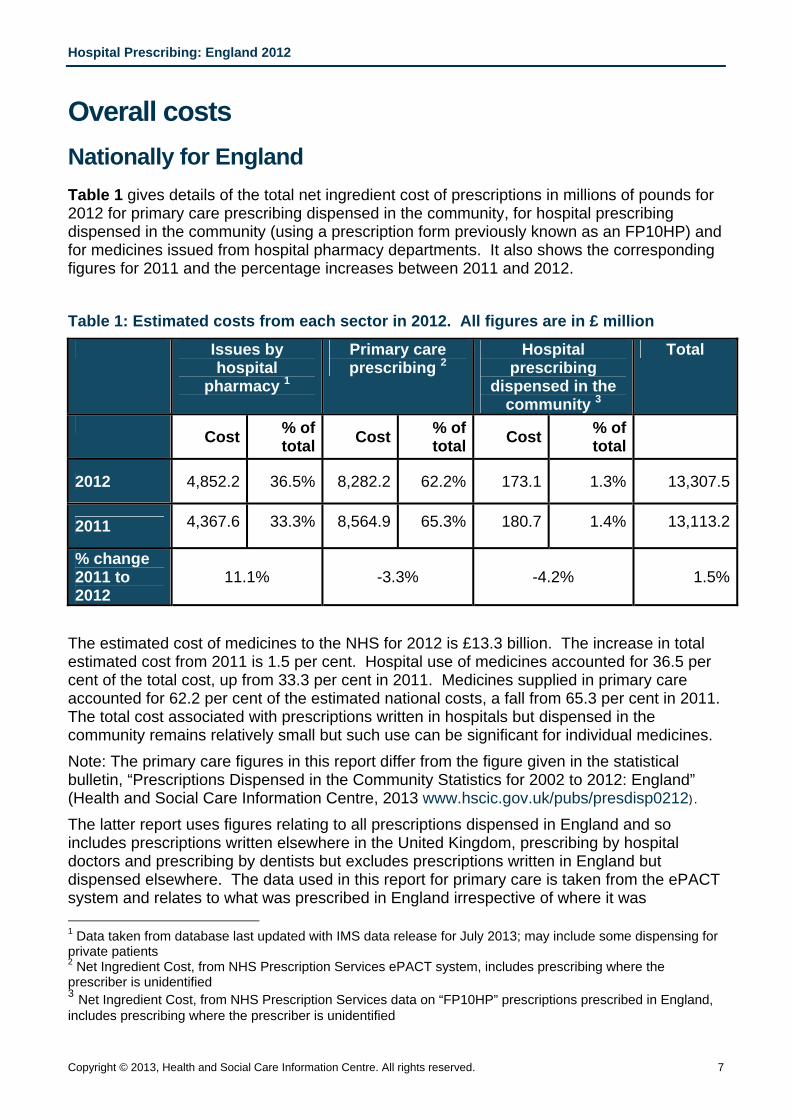
Overall costs Nationally for England Table 1 gives details of the total net ingredient cost of prescriptions in millions of pounds for 2012 for primary care prescribing dispensed in the community, for hospital prescribing dispensed in the community (using a prescription form previously known as an FP10HP) and for medicines issued from hospital pharmacy departments. It also shows the corresponding figures for 2011 and the percentage increases between 2011 and 2012. Table 1: Estimated costs from each sector in 2012. All figures are in £ million
Issues by hospital
pharmacy 1
Primary care prescribing 2
Hospital prescribing
dispensed in the community 3
Total
Cost % of
total Cost % of total Cost % of
total
2012 4,852.2 36.5% 8,282.2 62.2% 173.1 1.3% 13,307.5
2011 4,367.6 33.3% 8,564.9 65.3% 180.7 1.4% 13,113.2
% change 2011 to 2012
11.1% -3.3% -4.2% 1.5%
The estimated cost of medicines to the NHS for 2012 is £13.3 billion. The increase in total estimated cost from 2011 is 1.5 per cent. Hospital use of medicines accounted for 36.5 per cent of the total cost, up from 33.3 per cent in 2011. Medicines supplied in primary care accounted for 62.2 per cent of the estimated national costs, a fall from 65.3 per cent in 2011. The total cost associated with prescriptions written in hospitals but dispensed in the community remains relatively small but such use can be significant for individual medicines. Note: The primary care figures in this report differ from the figure given in the statistical bulletin, “Prescriptions Dispensed in the Community Statistics for 2002 to 2012: England” (Health and Social Care Information Centre, 2013 www.hscic.gov.uk/pubs/presdisp0212). The latter report uses figures relating to all prescriptions dispensed in England and so includes prescriptions written elsewhere in the United Kingdom, prescribing by hospital doctors and prescribing by dentists but excludes prescriptions written in England but dispensed elsewhere. The data used in this report for primary care is taken from the ePACT system and relates to what was prescribed in England irrespective of where it was 1 Data taken from database last updated with IMS data release for July 2013; may include some dispensing for private patients 2 Net Ingredient Cost, from NHS Prescription Services ePACT system, includes prescribing where the prescriber is unidentified 3 Net Ingredient Cost, from NHS Prescription Services data on “FP10HP” prescriptions prescribed in England, includes prescribing where the prescriber is unidentified
H
8
dFoFTa
F
4
Hospital Pre
8
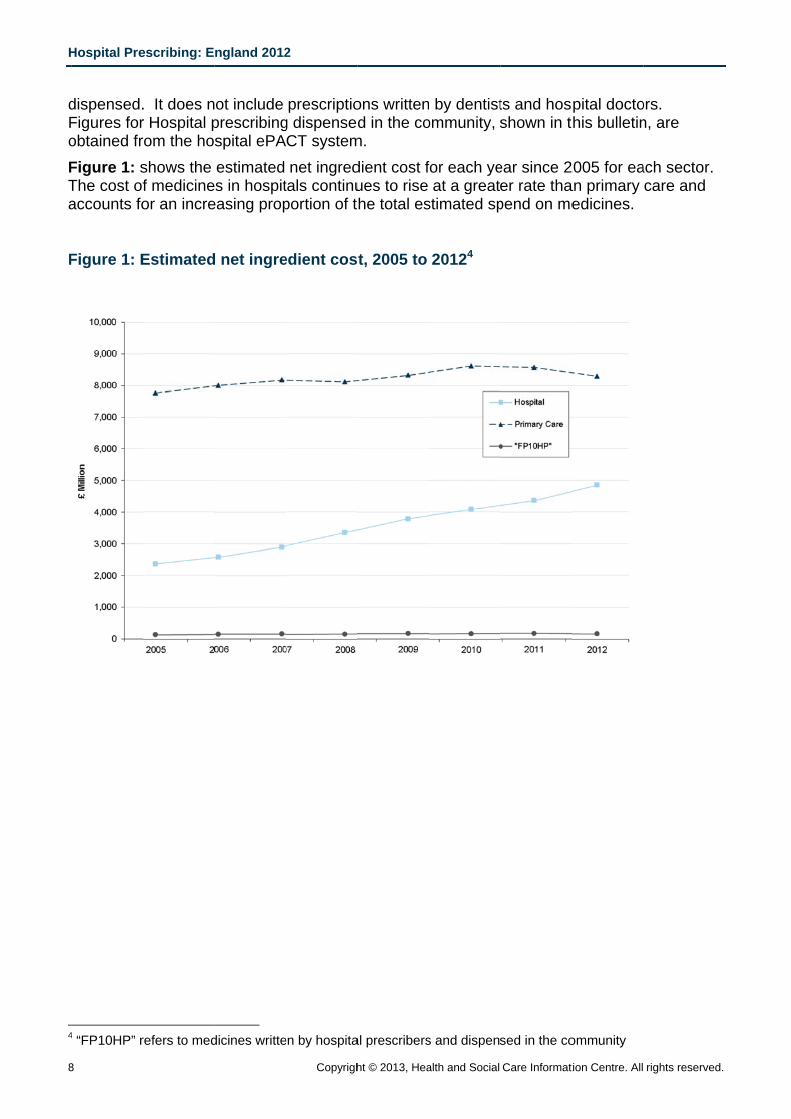
dispensed.Figures forobtained frFigure 1: sThe cost ofaccounts fo
Figure 1: E
4 “FP10HP” r
escribing: E
. It does nr Hospital prom the hoshows the f medicineor an incre
Estimated
refers to med
ngland 2012
ot include prescribingspital ePAestimated s in hospit
easing prop
d net ingre
dicines writte
2
Copyrigh
prescriptiog dispensedCT systemnet ingred
tals continuportion of t
edient cos
en by hospita
ht © 2013, Hea
ons writtend in the co
m. dient cost fues to rise he total es
t, 2005 to
al prescribers
alth and Social
by dentistommunity,
for each yeat a great
stimated sp
20124
s and dispen
Care Informat
ts and hosshown in t
ear since 2er rate thapend on me
sed in the co
tion Centre. All
pital doctothis bulletin
2005 for eaan primary edicines.
ommunity
rights reserve
ors. n, are
ach sector. care and
d.
H
C
Fda2owTiots F
Hospital Pre
Copyright © 20
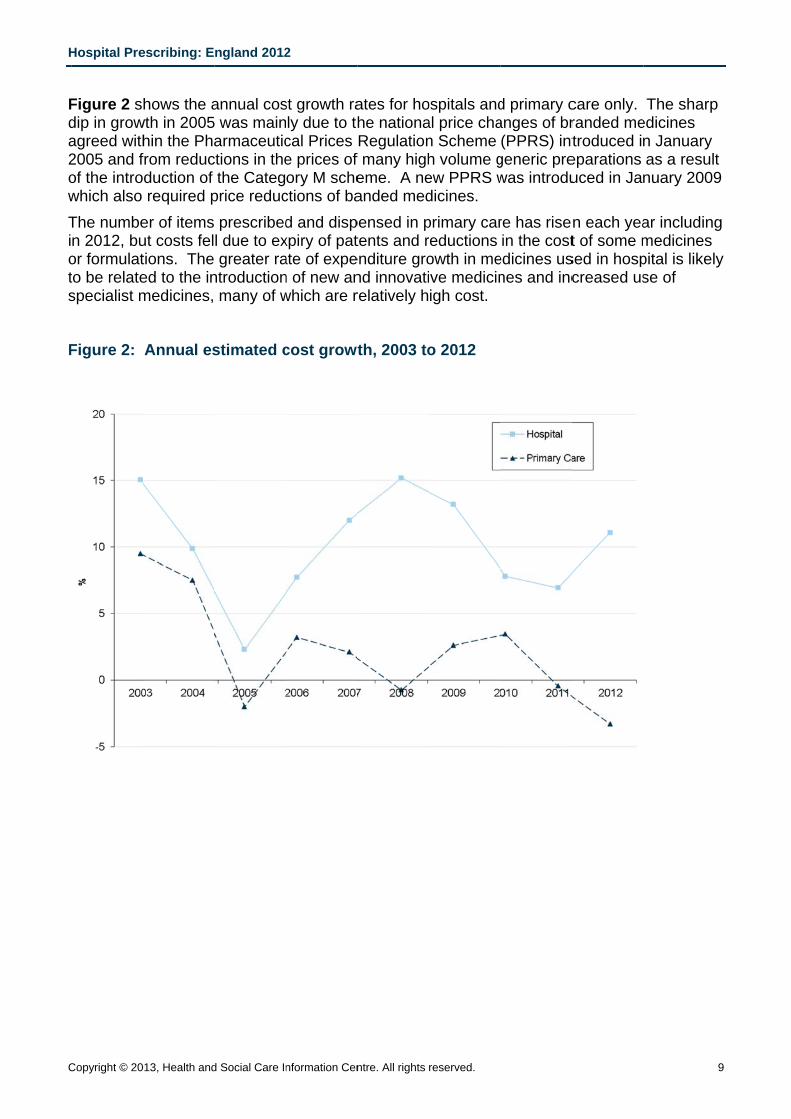
Figure 2 sdip in growagreed with2005 and fof the introwhich also The numben 2012, buor formulatto be relatespecialist m
Figure 2:
escribing: E
013, Health and
hows the awth in 2005hin the Phafrom reducduction of required p
er of items ut costs feltions. The ed to the inmedicines,
Annual es
ngland 2012
d Social Care In
annual cos5 was mainarmaceutic
ctions in thethe Categ
price reducprescribed
l due to exgreater ra
ntroductionmany of w
stimated c
2
nformation Cen
st growth raly due to thcal Prices e prices of ory M sche
ctions of bad and dispxpiry of patate of expen of new anwhich are r
cost growt
ntre. All rights
ates for hohe nationaRegulation
f many higheme. A neanded med
pensed in ptents and r
enditure grond innovatirelatively h
th, 2003 to
reserved.
ospitals andal price chan Scheme h volume gew PPRS wdicines. primary carreductions owth in meve medicinigh cost.
o 2012
d primary canges of br(PPRS) int
generic prewas introdu
re has risein the cost
edicines usnes and inc
care only. randed metroduced in
eparations uced in Jan
n each yeat of some m
sed in hospcreased us
The sharpedicines n January as a resulnuary 2009
ar includingmedicines pital is likelse of
9
p
t 9
g
y
Hospital Prescribing: England 2012
10 Copyright © 2013, Health and Social Care Information Centre. All rights reserved.
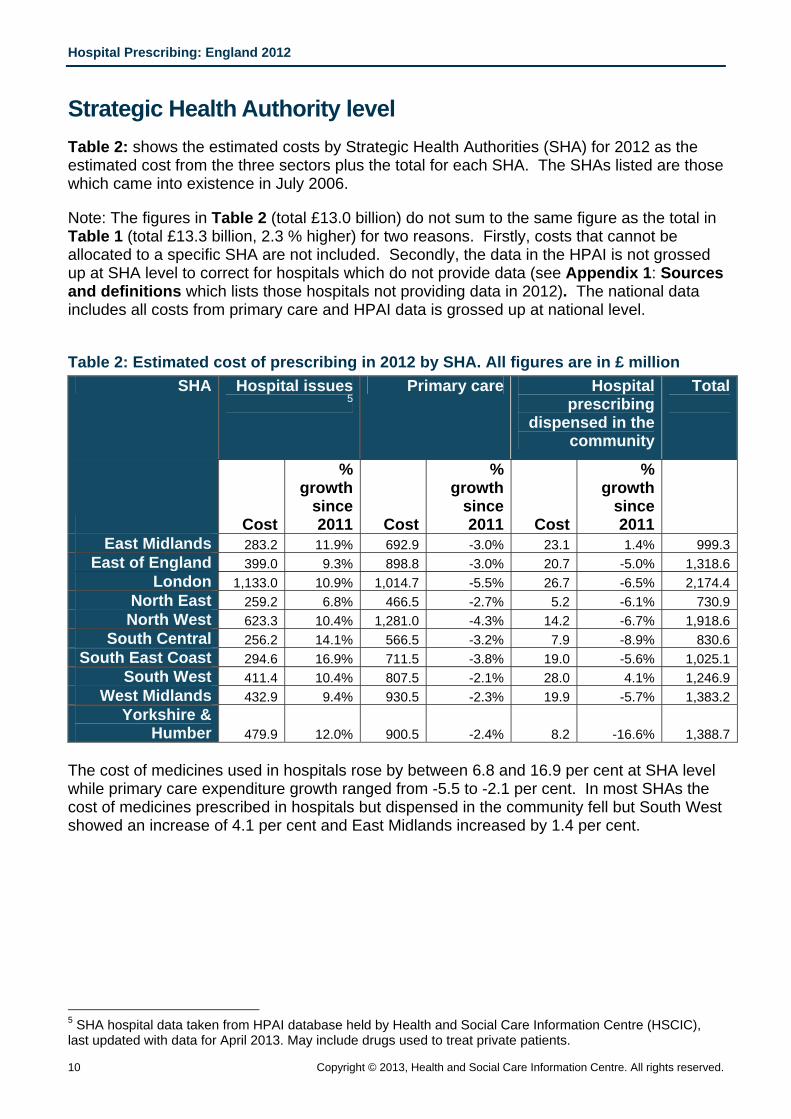
Strategic Health Authority level Table 2: shows the estimated costs by Strategic Health Authorities (SHA) for 2012 as the estimated cost from the three sectors plus the total for each SHA. The SHAs listed are those which came into existence in July 2006.
Note: The figures in Table 2 (total £13.0 billion) do not sum to the same figure as the total in Table 1 (total £13.3 billion, 2.3 % higher) for two reasons. Firstly, costs that cannot be allocated to a specific SHA are not included. Secondly, the data in the HPAI is not grossed up at SHA level to correct for hospitals which do not provide data (see Appendix 1: Sources and definitions which lists those hospitals not providing data in 2012). The national data includes all costs from primary care and HPAI data is grossed up at national level.
Table 2: Estimated cost of prescribing in 2012 by SHA. All figures are in £ million
SHA Hospital issues 5
Primary care Hospital prescribing
dispensed in the community
Total
Cost
% growth
since 2011 Cost
% growth
since 2011 Cost
% growth
since 2011
East Midlands 283.2 11.9% 692.9 -3.0% 23.1 1.4% 999.3East of England 399.0 9.3% 898.8 -3.0% 20.7 -5.0% 1,318.6
London 1,133.0 10.9% 1,014.7 -5.5% 26.7 -6.5% 2,174.4North East 259.2 6.8% 466.5 -2.7% 5.2 -6.1% 730.9
North West 623.3 10.4% 1,281.0 -4.3% 14.2 -6.7% 1,918.6South Central 256.2 14.1% 566.5 -3.2% 7.9 -8.9% 830.6
South East Coast 294.6 16.9% 711.5 -3.8% 19.0 -5.6% 1,025.1South West 411.4 10.4% 807.5 -2.1% 28.0 4.1% 1,246.9
West Midlands 432.9 9.4% 930.5 -2.3% 19.9 -5.7% 1,383.2Yorkshire &
Humber 479.9 12.0% 900.5 -2.4% 8.2 -16.6% 1,388.7 The cost of medicines used in hospitals rose by between 6.8 and 16.9 per cent at SHA level while primary care expenditure growth ranged from -5.5 to -2.1 per cent. In most SHAs the cost of medicines prescribed in hospitals but dispensed in the community fell but South West showed an increase of 4.1 per cent and East Midlands increased by 1.4 per cent.
5 SHA hospital data taken from HPAI database held by Health and Social Care Information Centre (HSCIC), last updated with data for April 2013. May include drugs used to treat private patients.
Hospital Prescribing: England 2012
Copyright © 2013, Health and Social Care Information Centre. All rights reserved. 11
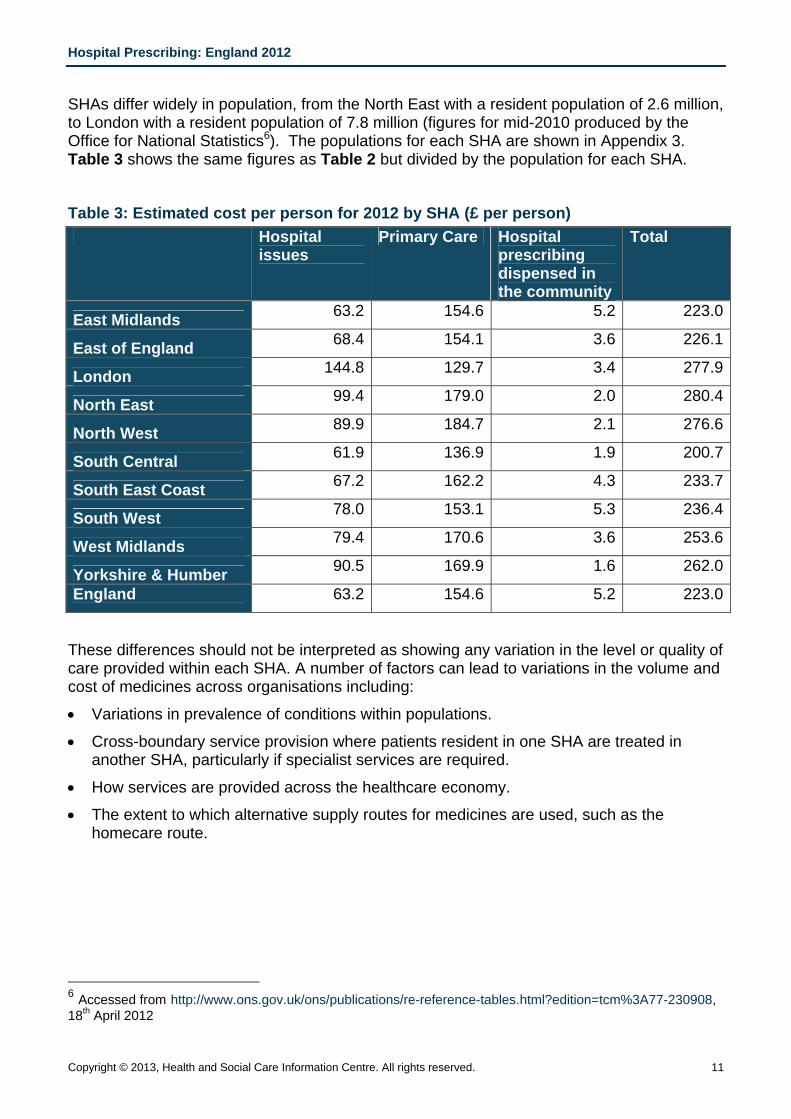
SHAs differ widely in population, from the North East with a resident population of 2.6 million, to London with a resident population of 7.8 million (figures for mid-2010 produced by the Office for National Statistics6). The populations for each SHA are shown in Appendix 3. Table 3 shows the same figures as Table 2 but divided by the population for each SHA.
Table 3: Estimated cost per person for 2012 by SHA (£ per person) Hospital
issues Primary Care Hospital
prescribing dispensed in the community
Total
East Midlands 63.2 154.6 5.2 223.0
East of England 68.4 154.1 3.6 226.1
London 144.8 129.7 3.4 277.9
North East 99.4 179.0 2.0 280.4
North West 89.9 184.7 2.1 276.6
South Central 61.9 136.9 1.9 200.7
South East Coast 67.2 162.2 4.3 233.7
South West 78.0 153.1 5.3 236.4
West Midlands 79.4 170.6 3.6 253.6
Yorkshire & Humber 90.5 169.9 1.6 262.0
England 63.2 154.6 5.2 223.0
These differences should not be interpreted as showing any variation in the level or quality of care provided within each SHA. A number of factors can lead to variations in the volume and cost of medicines across organisations including:
• Variations in prevalence of conditions within populations.
• Cross-boundary service provision where patients resident in one SHA are treated in another SHA, particularly if specialist services are required.
• How services are provided across the healthcare economy.
• The extent to which alternative supply routes for medicines are used, such as the homecare route.
6 Accessed from http://www.ons.gov.uk/ons/publications/re-reference-tables.html?edition=tcm%3A77-230908, 18th April 2012
H
1
F
TfcCcM Tbspsh LSL
Hospital Pre
12
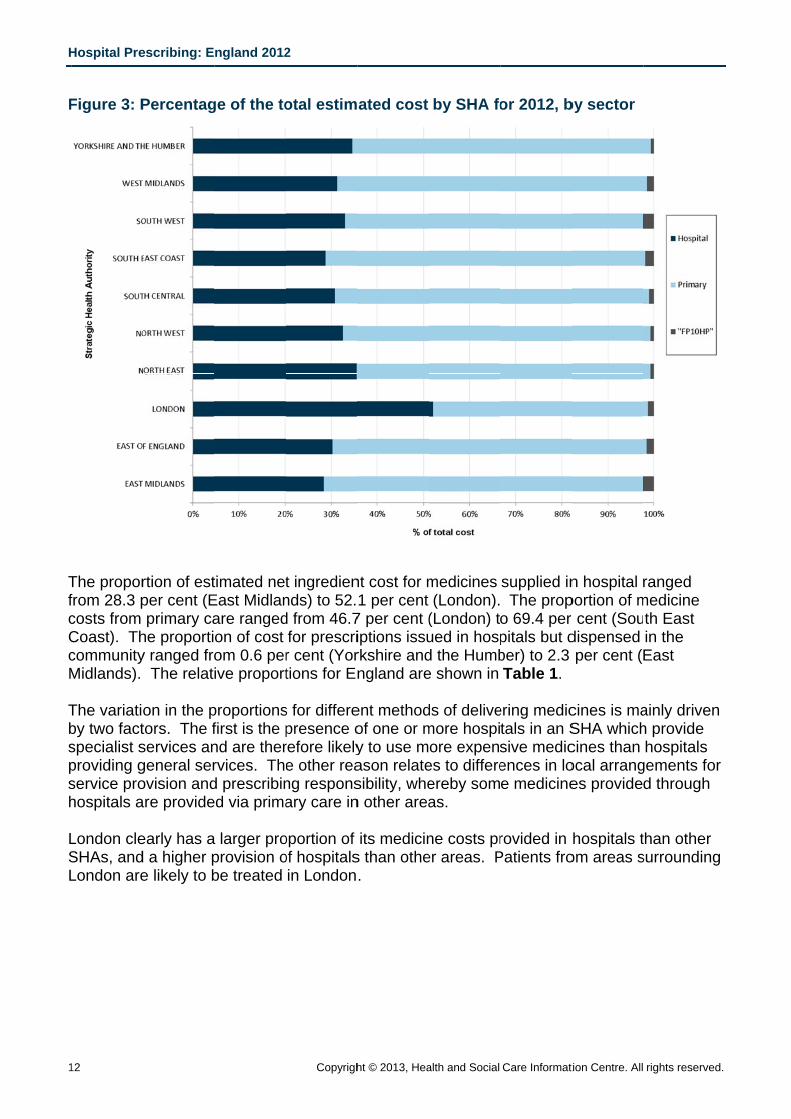
Figure 3: P
The proporfrom 28.3 pcosts from Coast). ThcommunityMidlands).
The variatioby two factspecialist sproviding gservice prohospitals a
London cleSHAs, andLondon are
escribing: E
Percentag
rtion of estper cent (Eprimary ca
he proportiy ranged fro The relat
on in the ptors. The fservices angeneral serovision andare provide
early has ad a higher pe likely to b
ngland 2012
ge of the to
timated netEast Midlanare rangedon of cost om 0.6 perive proport
proportionsfirst is the pnd are therrvices. Thed prescribined via prima
a larger proprovision obe treated
2
Copyrigh
otal estim
t ingrediennds) to 52.d from 46.7for prescrir cent (Yortions for En
s for differepresence orefore likelye other reang responsary care in
oportion of of hospitalsin London
ht © 2013, Hea
ated cost
nt cost for m1 per cent
7 per cent (iptions issurkshire andngland are
ent methodof one or my to use mason relatesibility, when other area
its medicins than othe.
alth and Social
by SHA fo
medicines (London).
(London) tued in hospd the Humbe shown in
ds of delivemore hospiore expen
es to differeereby somas.
ne costs prer areas. P
Care Informat
or 2012, b
supplied in The prop
o 69.4 per pitals but dber) to 2.3 Table 1.
ering medictals in an Ssive medicences in loe medicine
rovided in Patients fro
tion Centre. All
by sector
n hospital rportion of mr cent (Soudispensed per cent (
cines is maSHA whichcines than ocal arranges provide
hospitals tom areas s
rights reserve
ranged medicine th East in the East
ainly drivenh provide hospitals
gements fod through
than other surrounding
d.
n
or
g
Hospital Prescribing: England 2012
Copyright © 2013, Health and Social Care Information Centre. All rights reserved. 13
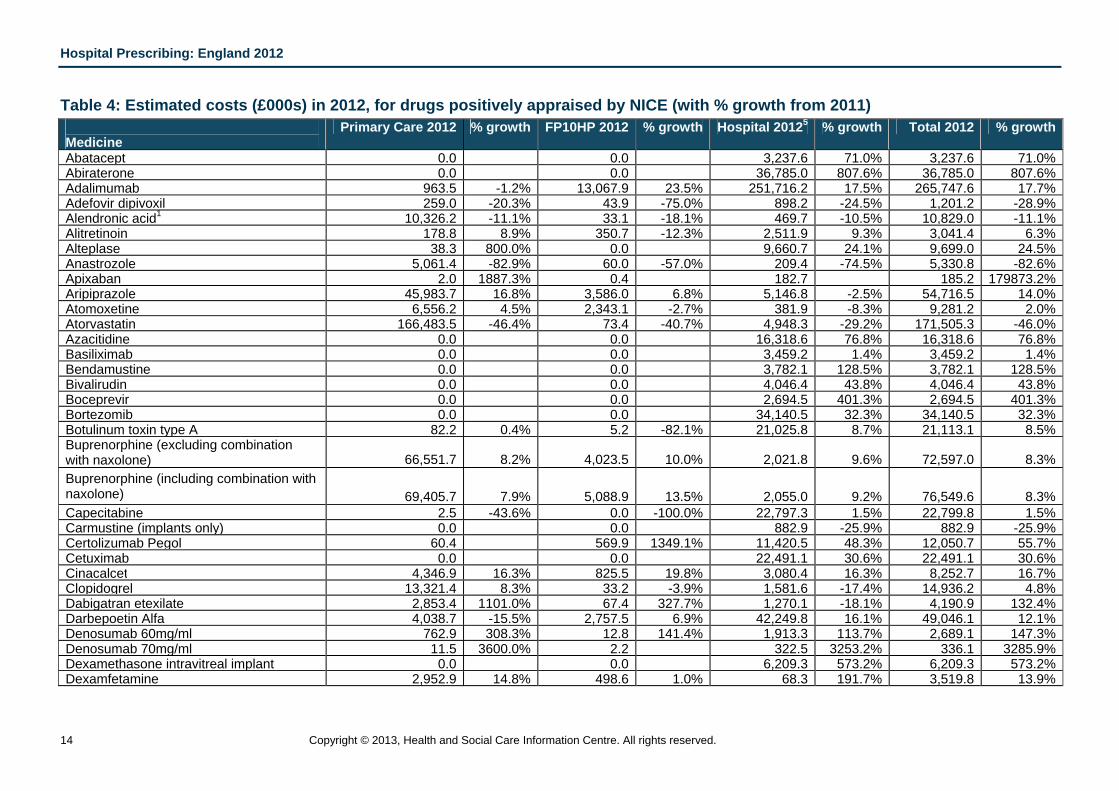
Medicines appraised by NICE The National Institute for Health and Clinical Excellence (NICE) Technology Appraisal process assesses the clinical and cost effectiveness of new and existing medicines and interventions, and provides guidance on their use by the NHS. The guidance issued is intended to provide an authoritative assessment of clinical and cost-effectiveness (http://www.nice.org.uk/). However the guidance commonly recommends a medicine as an option for treatment among other options. Many of these medicines are used for specialist indications, with treatment being initiated in hospital. NICE also develop and publish clinical guidelines which may cover the use of several medicines. The HPAI data enables the usage of the medicines appraised by NICE to be estimated across England.
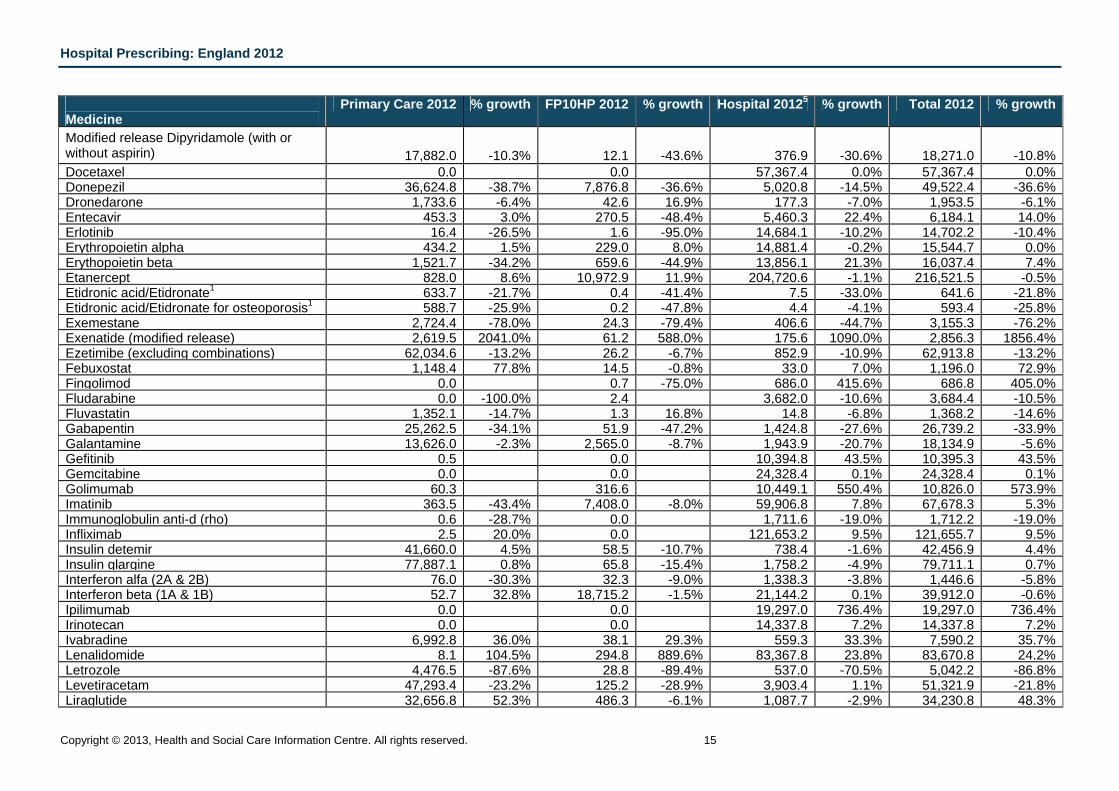
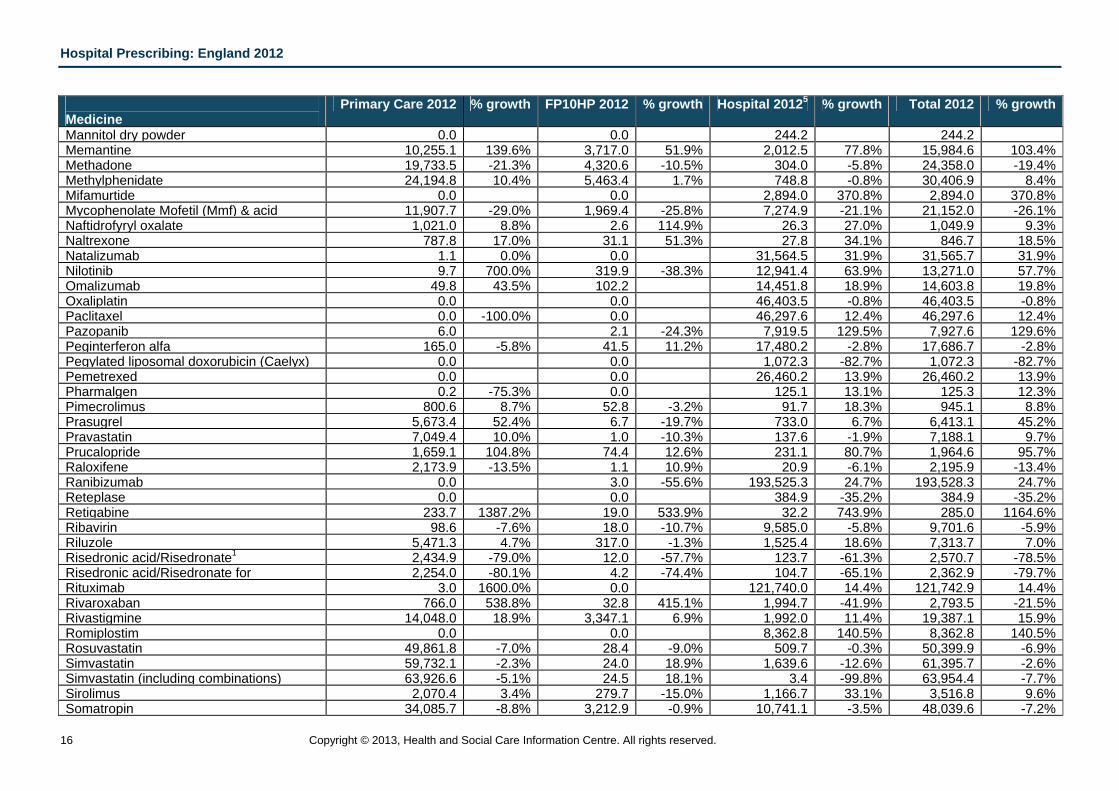
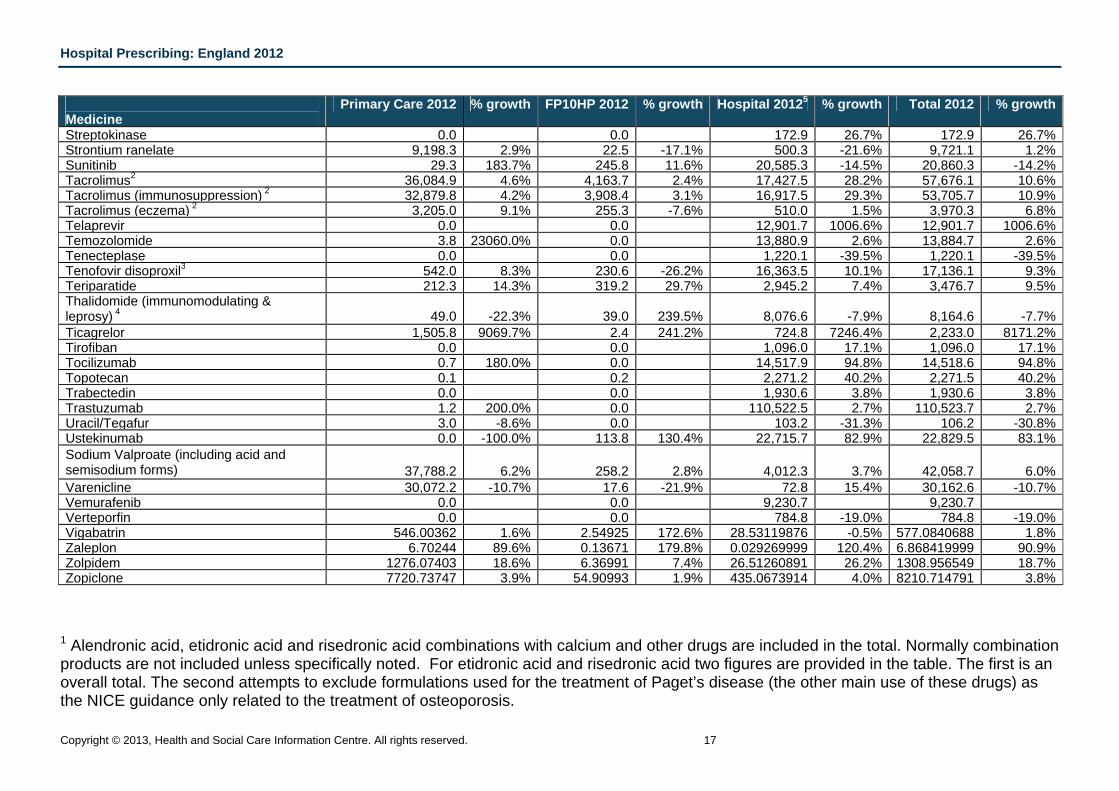
Table 4 shows the estimated cost of medicines positively appraised by NICE. Technology appraisals generally review the use of drugs for specific indications. The figures shown are for all recorded use unless otherwise noted as the data relating to medicine use for specific indications is generally not reported. For example tumour necrosis factor (TNF) alpha inhibitors such as infliximab may be used to treat a number of conditions including rheumatoid arthritis, psoriasis and ulcerative colitis.
Data collection for some medicines is not complete (see Appendix 1: Sources and definitions). Some medicines listed may be issued to patients through care provided within their own home (homecare), and therefore may not have the full usage recorded in the data used here. Some medicines, e.g. anti-smoking products, may be supplied to patients by other supply routes such as via a Patient Group Direction and are therefore not recorded within the data sources reported in this bulletin. This means that these figures may be an under-estimate for some medicines.
NICE may recommend the use of a medicine in combination with one or more other medicine. However, the data used to produce Table 4 cannot identify where a medicine has been used in combination with one or more medicine unless a combination product exists. Unless otherwise noted, all presentations of a medicine have been included.
A blank indicates that there was no use of the drug or that the percentage growth cannot be calculated because there was no use of the drug in the previous year.
A very high growth may be because the drug was recently launched on to the market or was positively appraised late in 2011 or in 2012. Apixiban is an example of this. Negative growth in cost may not mean a reduction in use, but may indicate a price reduction, possibly due to the introduction of a generic version of the medicine. Atorvastatin is an example of this. A new medicine for a specific indication may lead to reduced use of other medicines for the same indication.
The data provided in Table 4 are also available as an Excel spreadsheet to allow for further analysis of the information e.g. sorting in order of cost for a particular sector. Tables 5, 6 and 7 show the top 10 medicines by hospital costs, primary care costs, hospital dispensed in the community costs and Table 8 shows the top 20 by overall costs.
Hospital Prescribing: England 2012
14 Copyright © 2013, Health and Social Care Information Centre. All rights reserved.
Table 4: Estimated costs (£000s) in 2012, for drugs positively appraised by NICE (with % growth from 2011) Medicine
Primary Care 2012 % growth FP10HP 2012 % growth Hospital 20125 % growth Total 2012 % growth
Abatacept 0.0 0.0 3,237.6 71.0% 3,237.6 71.0% Abiraterone 0.0 0.0 36,785.0 807.6% 36,785.0 807.6% Adalimumab 963.5 -1.2% 13,067.9 23.5% 251,716.2 17.5% 265,747.6 17.7% Adefovir dipivoxil 259.0 -20.3% 43.9 -75.0% 898.2 -24.5% 1,201.2 -28.9% Alendronic acid1 10,326.2 -11.1% 33.1 -18.1% 469.7 -10.5% 10,829.0 -11.1% Alitretinoin 178.8 8.9% 350.7 -12.3% 2,511.9 9.3% 3,041.4 6.3% Alteplase 38.3 800.0% 0.0 9,660.7 24.1% 9,699.0 24.5% Anastrozole 5,061.4 -82.9% 60.0 -57.0% 209.4 -74.5% 5,330.8 -82.6% Apixaban 2.0 1887.3% 0.4 182.7 185.2 179873.2% Aripiprazole 45,983.7 16.8% 3,586.0 6.8% 5,146.8 -2.5% 54,716.5 14.0% Atomoxetine 6,556.2 4.5% 2,343.1 -2.7% 381.9 -8.3% 9,281.2 2.0% Atorvastatin 166,483.5 -46.4% 73.4 -40.7% 4,948.3 -29.2% 171,505.3 -46.0% Azacitidine 0.0 0.0 16,318.6 76.8% 16,318.6 76.8% Basiliximab 0.0 0.0 3,459.2 1.4% 3,459.2 1.4% Bendamustine 0.0 0.0 3,782.1 128.5% 3,782.1 128.5% Bivalirudin 0.0 0.0 4,046.4 43.8% 4,046.4 43.8% Boceprevir 0.0 0.0 2,694.5 401.3% 2,694.5 401.3% Bortezomib 0.0 0.0 34,140.5 32.3% 34,140.5 32.3% Botulinum toxin type A 82.2 0.4% 5.2 -82.1% 21,025.8 8.7% 21,113.1 8.5% Buprenorphine (excluding combination with naxolone) 66,551.7 8.2% 4,023.5 10.0% 2,021.8 9.6% 72,597.0 8.3% Buprenorphine (including combination with naxolone) 69,405.7 7.9% 5,088.9 13.5% 2,055.0 9.2% 76,549.6 8.3% Capecitabine 2.5 -43.6% 0.0 -100.0% 22,797.3 1.5% 22,799.8 1.5% Carmustine (implants only) 0.0 0.0 882.9 -25.9% 882.9 -25.9% Certolizumab Pegol 60.4 569.9 1349.1% 11,420.5 48.3% 12,050.7 55.7% Cetuximab 0.0 0.0 22,491.1 30.6% 22,491.1 30.6% Cinacalcet 4,346.9 16.3% 825.5 19.8% 3,080.4 16.3% 8,252.7 16.7% Clopidogrel 13,321.4 8.3% 33.2 -3.9% 1,581.6 -17.4% 14,936.2 4.8% Dabigatran etexilate 2,853.4 1101.0% 67.4 327.7% 1,270.1 -18.1% 4,190.9 132.4% Darbepoetin Alfa 4,038.7 -15.5% 2,757.5 6.9% 42,249.8 16.1% 49,046.1 12.1% Denosumab 60mg/ml 762.9 308.3% 12.8 141.4% 1,913.3 113.7% 2,689.1 147.3% Denosumab 70mg/ml 11.5 3600.0% 2.2 322.5 3253.2% 336.1 3285.9% Dexamethasone intravitreal implant 0.0 0.0 6,209.3 573.2% 6,209.3 573.2% Dexamfetamine 2,952.9 14.8% 498.6 1.0% 68.3 191.7% 3,519.8 13.9%
Hospital Prescribing: England 2012
Copyright © 2013, Health and Social Care Information Centre. All rights reserved. 15
Medicine
Primary Care 2012 % growth FP10HP 2012 % growth Hospital 20125 % growth Total 2012 % growth
Modified release Dipyridamole (with or without aspirin) 17,882.0 -10.3% 12.1 -43.6% 376.9 -30.6% 18,271.0 -10.8% Docetaxel 0.0 0.0 57,367.4 0.0% 57,367.4 0.0% Donepezil 36,624.8 -38.7% 7,876.8 -36.6% 5,020.8 -14.5% 49,522.4 -36.6% Dronedarone 1,733.6 -6.4% 42.6 16.9% 177.3 -7.0% 1,953.5 -6.1% Entecavir 453.3 3.0% 270.5 -48.4% 5,460.3 22.4% 6,184.1 14.0% Erlotinib 16.4 -26.5% 1.6 -95.0% 14,684.1 -10.2% 14,702.2 -10.4% Erythropoietin alpha 434.2 1.5% 229.0 8.0% 14,881.4 -0.2% 15,544.7 0.0% Erythopoietin beta 1,521.7 -34.2% 659.6 -44.9% 13,856.1 21.3% 16,037.4 7.4% Etanercept 828.0 8.6% 10,972.9 11.9% 204,720.6 -1.1% 216,521.5 -0.5% Etidronic acid/Etidronate1 633.7 -21.7% 0.4 -41.4% 7.5 -33.0% 641.6 -21.8% Etidronic acid/Etidronate for osteoporosis1 588.7 -25.9% 0.2 -47.8% 4.4 -4.1% 593.4 -25.8% Exemestane 2,724.4 -78.0% 24.3 -79.4% 406.6 -44.7% 3,155.3 -76.2% Exenatide (modified release) 2,619.5 2041.0% 61.2 588.0% 175.6 1090.0% 2,856.3 1856.4% Ezetimibe (excluding combinations) 62,034.6 -13.2% 26.2 -6.7% 852.9 -10.9% 62,913.8 -13.2% Febuxostat 1,148.4 77.8% 14.5 -0.8% 33.0 7.0% 1,196.0 72.9% Fingolimod 0.0 0.7 -75.0% 686.0 415.6% 686.8 405.0% Fludarabine 0.0 -100.0% 2.4 3,682.0 -10.6% 3,684.4 -10.5% Fluvastatin 1,352.1 -14.7% 1.3 16.8% 14.8 -6.8% 1,368.2 -14.6% Gabapentin 25,262.5 -34.1% 51.9 -47.2% 1,424.8 -27.6% 26,739.2 -33.9% Galantamine 13,626.0 -2.3% 2,565.0 -8.7% 1,943.9 -20.7% 18,134.9 -5.6% Gefitinib 0.5 0.0 10,394.8 43.5% 10,395.3 43.5% Gemcitabine 0.0 0.0 24,328.4 0.1% 24,328.4 0.1% Golimumab 60.3 316.6 10,449.1 550.4% 10,826.0 573.9% Imatinib 363.5 -43.4% 7,408.0 -8.0% 59,906.8 7.8% 67,678.3 5.3% Immunoglobulin anti-d (rho) 0.6 -28.7% 0.0 1,711.6 -19.0% 1,712.2 -19.0% Infliximab 2.5 20.0% 0.0 121,653.2 9.5% 121,655.7 9.5% Insulin detemir 41,660.0 4.5% 58.5 -10.7% 738.4 -1.6% 42,456.9 4.4% Insulin glargine 77,887.1 0.8% 65.8 -15.4% 1,758.2 -4.9% 79,711.1 0.7% Interferon alfa (2A & 2B) 76.0 -30.3% 32.3 -9.0% 1,338.3 -3.8% 1,446.6 -5.8% Interferon beta (1A & 1B) 52.7 32.8% 18,715.2 -1.5% 21,144.2 0.1% 39,912.0 -0.6% Ipilimumab 0.0 0.0 19,297.0 736.4% 19,297.0 736.4% Irinotecan 0.0 0.0 14,337.8 7.2% 14,337.8 7.2% Ivabradine 6,992.8 36.0% 38.1 29.3% 559.3 33.3% 7,590.2 35.7% Lenalidomide 8.1 104.5% 294.8 889.6% 83,367.8 23.8% 83,670.8 24.2% Letrozole 4,476.5 -87.6% 28.8 -89.4% 537.0 -70.5% 5,042.2 -86.8% Levetiracetam 47,293.4 -23.2% 125.2 -28.9% 3,903.4 1.1% 51,321.9 -21.8% Liraglutide 32,656.8 52.3% 486.3 -6.1% 1,087.7 -2.9% 34,230.8 48.3%
Hospital Prescribing: England 2012
16 Copyright © 2013, Health and Social Care Information Centre. All rights reserved.
Medicine
Primary Care 2012 % growth FP10HP 2012 % growth Hospital 20125 % growth Total 2012 % growth
Mannitol dry powder 0.0 0.0 244.2 244.2 Memantine 10,255.1 139.6% 3,717.0 51.9% 2,012.5 77.8% 15,984.6 103.4% Methadone 19,733.5 -21.3% 4,320.6 -10.5% 304.0 -5.8% 24,358.0 -19.4% Methylphenidate 24,194.8 10.4% 5,463.4 1.7% 748.8 -0.8% 30,406.9 8.4% Mifamurtide 0.0 0.0 2,894.0 370.8% 2,894.0 370.8% Mycophenolate Mofetil (Mmf) & acid 11,907.7 -29.0% 1,969.4 -25.8% 7,274.9 -21.1% 21,152.0 -26.1% Naftidrofyryl oxalate 1,021.0 8.8% 2.6 114.9% 26.3 27.0% 1,049.9 9.3% Naltrexone 787.8 17.0% 31.1 51.3% 27.8 34.1% 846.7 18.5% Natalizumab 1.1 0.0% 0.0 31,564.5 31.9% 31,565.7 31.9% Nilotinib 9.7 700.0% 319.9 -38.3% 12,941.4 63.9% 13,271.0 57.7% Omalizumab 49.8 43.5% 102.2 14,451.8 18.9% 14,603.8 19.8% Oxaliplatin 0.0 0.0 46,403.5 -0.8% 46,403.5 -0.8% Paclitaxel 0.0 -100.0% 0.0 46,297.6 12.4% 46,297.6 12.4% Pazopanib 6.0 2.1 -24.3% 7,919.5 129.5% 7,927.6 129.6% Peginterferon alfa 165.0 -5.8% 41.5 11.2% 17,480.2 -2.8% 17,686.7 -2.8% Pegylated liposomal doxorubicin (Caelyx) 0.0 0.0 1,072.3 -82.7% 1,072.3 -82.7% Pemetrexed 0.0 0.0 26,460.2 13.9% 26,460.2 13.9% Pharmalgen 0.2 -75.3% 0.0 125.1 13.1% 125.3 12.3% Pimecrolimus 800.6 8.7% 52.8 -3.2% 91.7 18.3% 945.1 8.8% Prasugrel 5,673.4 52.4% 6.7 -19.7% 733.0 6.7% 6,413.1 45.2% Pravastatin 7,049.4 10.0% 1.0 -10.3% 137.6 -1.9% 7,188.1 9.7% Prucalopride 1,659.1 104.8% 74.4 12.6% 231.1 80.7% 1,964.6 95.7% Raloxifene 2,173.9 -13.5% 1.1 10.9% 20.9 -6.1% 2,195.9 -13.4% Ranibizumab 0.0 3.0 -55.6% 193,525.3 24.7% 193,528.3 24.7% Reteplase 0.0 0.0 384.9 -35.2% 384.9 -35.2% Retigabine 233.7 1387.2% 19.0 533.9% 32.2 743.9% 285.0 1164.6% Ribavirin 98.6 -7.6% 18.0 -10.7% 9,585.0 -5.8% 9,701.6 -5.9% Riluzole 5,471.3 4.7% 317.0 -1.3% 1,525.4 18.6% 7,313.7 7.0% Risedronic acid/Risedronate1 2,434.9 -79.0% 12.0 -57.7% 123.7 -61.3% 2,570.7 -78.5% Risedronic acid/Risedronate for 2,254.0 -80.1% 4.2 -74.4% 104.7 -65.1% 2,362.9 -79.7% Rituximab 3.0 1600.0% 0.0 121,740.0 14.4% 121,742.9 14.4% Rivaroxaban 766.0 538.8% 32.8 415.1% 1,994.7 -41.9% 2,793.5 -21.5% Rivastigmine 14,048.0 18.9% 3,347.1 6.9% 1,992.0 11.4% 19,387.1 15.9% Romiplostim 0.0 0.0 8,362.8 140.5% 8,362.8 140.5% Rosuvastatin 49,861.8 -7.0% 28.4 -9.0% 509.7 -0.3% 50,399.9 -6.9% Simvastatin 59,732.1 -2.3% 24.0 18.9% 1,639.6 -12.6% 61,395.7 -2.6% Simvastatin (including combinations) 63,926.6 -5.1% 24.5 18.1% 3.4 -99.8% 63,954.4 -7.7% Sirolimus 2,070.4 3.4% 279.7 -15.0% 1,166.7 33.1% 3,516.8 9.6% Somatropin 34,085.7 -8.8% 3,212.9 -0.9% 10,741.1 -3.5% 48,039.6 -7.2%
Hospital Prescribing: England 2012
Copyright © 2013, Health and Social Care Information Centre. All rights reserved. 17
Medicine
Primary Care 2012 % growth FP10HP 2012 % growth Hospital 20125 % growth Total 2012 % growth
Streptokinase 0.0 0.0 172.9 26.7% 172.9 26.7% Strontium ranelate 9,198.3 2.9% 22.5 -17.1% 500.3 -21.6% 9,721.1 1.2% Sunitinib 29.3 183.7% 245.8 11.6% 20,585.3 -14.5% 20,860.3 -14.2% Tacrolimus2 36,084.9 4.6% 4,163.7 2.4% 17,427.5 28.2% 57,676.1 10.6% Tacrolimus (immunosuppression) 2 32,879.8 4.2% 3,908.4 3.1% 16,917.5 29.3% 53,705.7 10.9% Tacrolimus (eczema) 2 3,205.0 9.1% 255.3 -7.6% 510.0 1.5% 3,970.3 6.8% Telaprevir 0.0 0.0 12,901.7 1006.6% 12,901.7 1006.6% Temozolomide 3.8 23060.0% 0.0 13,880.9 2.6% 13,884.7 2.6% Tenecteplase 0.0 0.0 1,220.1 -39.5% 1,220.1 -39.5% Tenofovir disoproxil3 542.0 8.3% 230.6 -26.2% 16,363.5 10.1% 17,136.1 9.3% Teriparatide 212.3 14.3% 319.2 29.7% 2,945.2 7.4% 3,476.7 9.5% Thalidomide (immunomodulating & leprosy) 4 49.0 -22.3% 39.0 239.5% 8,076.6 -7.9% 8,164.6 -7.7% Ticagrelor 1,505.8 9069.7% 2.4 241.2% 724.8 7246.4% 2,233.0 8171.2% Tirofiban 0.0 0.0 1,096.0 17.1% 1,096.0 17.1% Tocilizumab 0.7 180.0% 0.0 14,517.9 94.8% 14,518.6 94.8% Topotecan 0.1 0.2 2,271.2 40.2% 2,271.5 40.2% Trabectedin 0.0 0.0 1,930.6 3.8% 1,930.6 3.8% Trastuzumab 1.2 200.0% 0.0 110,522.5 2.7% 110,523.7 2.7% Uracil/Tegafur 3.0 -8.6% 0.0 103.2 -31.3% 106.2 -30.8% Ustekinumab 0.0 -100.0% 113.8 130.4% 22,715.7 82.9% 22,829.5 83.1% Sodium Valproate (including acid and semisodium forms) 37,788.2 6.2% 258.2 2.8% 4,012.3 3.7% 42,058.7 6.0% Varenicline 30,072.2 -10.7% 17.6 -21.9% 72.8 15.4% 30,162.6 -10.7% Vemurafenib 0.0 0.0 9,230.7 9,230.7 Verteporfin 0.0 0.0 784.8 -19.0% 784.8 -19.0% Vigabatrin 546.00362 1.6% 2.54925 172.6% 28.53119876 -0.5% 577.0840688 1.8% Zaleplon 6.70244 89.6% 0.13671 179.8% 0.029269999 120.4% 6.868419999 90.9% Zolpidem 1276.07403 18.6% 6.36991 7.4% 26.51260891 26.2% 1308.956549 18.7% Zopiclone 7720.73747 3.9% 54.90993 1.9% 435.0673914 4.0% 8210.714791 3.8%
1 Alendronic acid, etidronic acid and risedronic acid combinations with calcium and other drugs are included in the total. Normally combination products are not included unless specifically noted. For etidronic acid and risedronic acid two figures are provided in the table. The first is an overall total. The second attempts to exclude formulations used for the treatment of Paget’s disease (the other main use of these drugs) as the NICE guidance only related to the treatment of osteoporosis.
Hospital Prescribing: England 2012
18 Copyright © 2013, Health and Social Care Information Centre. All rights reserved.
2 Tacrolimus figures for the topical versions have been shown for “Tacrolimus (eczema)” on the assumption that only topical versions would be used for eczema. Oral and parenteral versions have been shown for “Tacrolimus (immunosuppression)”. A total for all use of Tacrolimus has also been provided. 3 The NICE appraisal was for the use of this medicine for hepatitis B but it is also licensed for treatment of HIV; it is not possible to separate out the use for each indication 4 Thalidomide has been appraised for its use as an immunomodulating drug and it is not possible to separate out use for this purpose from use for leprosy. Accordingly all use has been shown here. 5 National hospital data taken from HPAI database held by HSCIC, last updated with data for July 2013.
Hospital Prescribing: England 2012
Copyright © 2013, Health and Social Care Information Centre. All rights reserved. 19
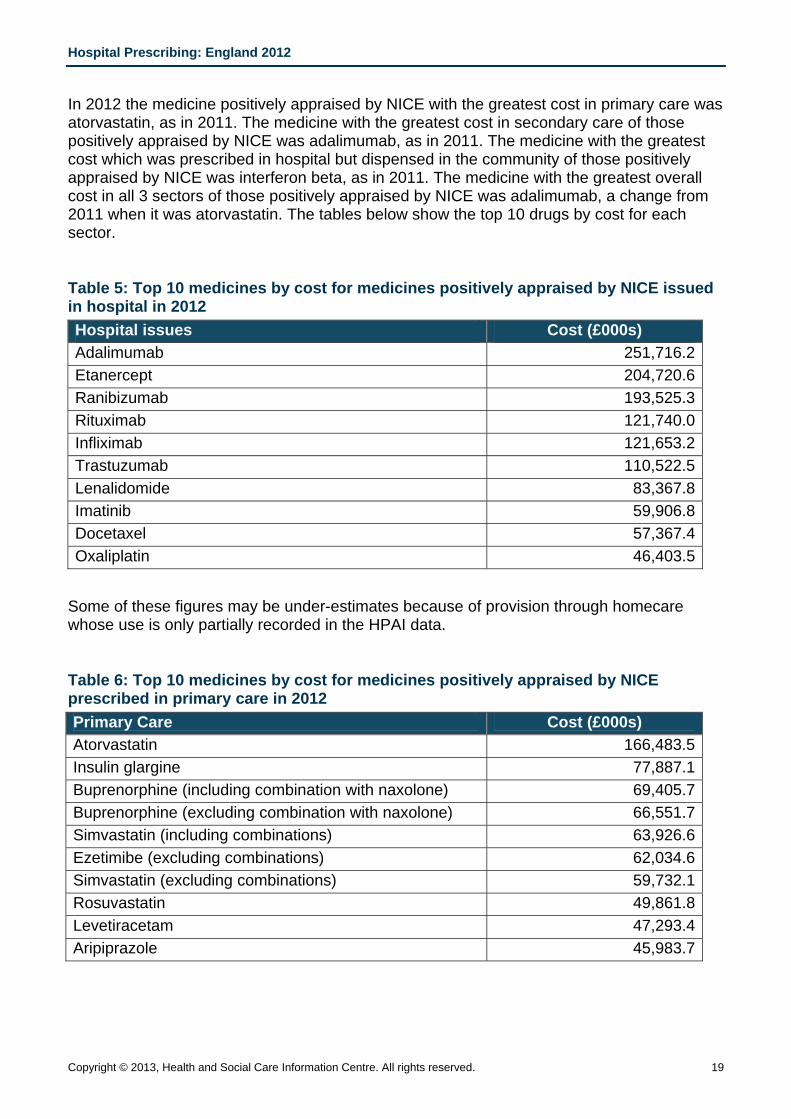
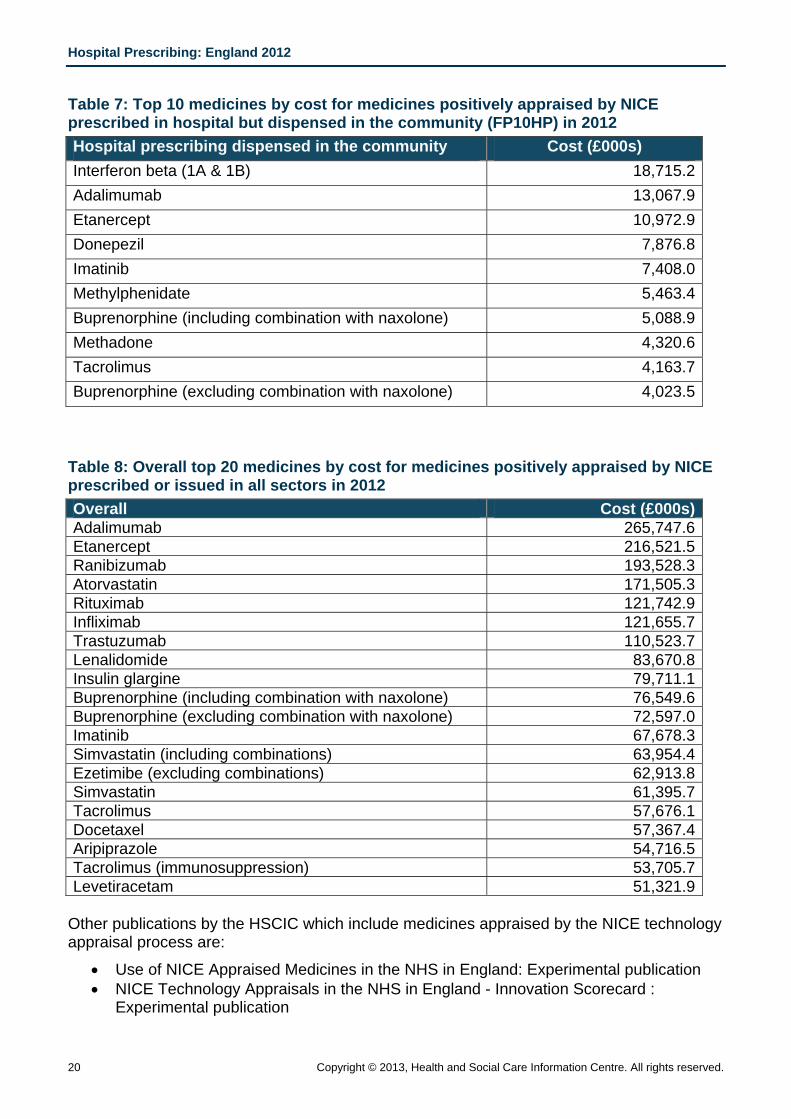
In 2012 the medicine positively appraised by NICE with the greatest cost in primary care was atorvastatin, as in 2011. The medicine with the greatest cost in secondary care of those positively appraised by NICE was adalimumab, as in 2011. The medicine with the greatest cost which was prescribed in hospital but dispensed in the community of those positively appraised by NICE was interferon beta, as in 2011. The medicine with the greatest overall cost in all 3 sectors of those positively appraised by NICE was adalimumab, a change from 2011 when it was atorvastatin. The tables below show the top 10 drugs by cost for each sector.
Table 5: Top 10 medicines by cost for medicines positively appraised by NICE issued in hospital in 2012 Hospital issues Cost (£000s) Adalimumab 251,716.2Etanercept 204,720.6Ranibizumab 193,525.3Rituximab 121,740.0Infliximab 121,653.2Trastuzumab 110,522.5Lenalidomide 83,367.8Imatinib 59,906.8Docetaxel 57,367.4Oxaliplatin 46,403.5
Some of these figures may be under-estimates because of provision through homecare whose use is only partially recorded in the HPAI data.
Table 6: Top 10 medicines by cost for medicines positively appraised by NICE prescribed in primary care in 2012 Primary Care Cost (£000s) Atorvastatin 166,483.5Insulin glargine 77,887.1Buprenorphine (including combination with naxolone) 69,405.7Buprenorphine (excluding combination with naxolone) 66,551.7Simvastatin (including combinations) 63,926.6Ezetimibe (excluding combinations) 62,034.6Simvastatin (excluding combinations) 59,732.1Rosuvastatin 49,861.8Levetiracetam 47,293.4Aripiprazole 45,983.7
Hospital Prescribing: England 2012
20 Copyright © 2013, Health and Social Care Information Centre. All rights reserved.
Table 7: Top 10 medicines by cost for medicines positively appraised by NICE prescribed in hospital but dispensed in the community (FP10HP) in 2012 Hospital prescribing dispensed in the community Cost (£000s) Interferon beta (1A & 1B) 18,715.2Adalimumab 13,067.9Etanercept 10,972.9Donepezil 7,876.8Imatinib 7,408.0Methylphenidate 5,463.4Buprenorphine (including combination with naxolone) 5,088.9Methadone 4,320.6Tacrolimus 4,163.7Buprenorphine (excluding combination with naxolone) 4,023.5
Table 8: Overall top 20 medicines by cost for medicines positively appraised by NICE prescribed or issued in all sectors in 2012 Overall Cost (£000s)Adalimumab 265,747.6Etanercept 216,521.5Ranibizumab 193,528.3Atorvastatin 171,505.3Rituximab 121,742.9Infliximab 121,655.7Trastuzumab 110,523.7Lenalidomide 83,670.8Insulin glargine 79,711.1Buprenorphine (including combination with naxolone) 76,549.6Buprenorphine (excluding combination with naxolone) 72,597.0Imatinib 67,678.3Simvastatin (including combinations) 63,954.4Ezetimibe (excluding combinations) 62,913.8Simvastatin 61,395.7Tacrolimus 57,676.1Docetaxel 57,367.4Aripiprazole 54,716.5Tacrolimus (immunosuppression) 53,705.7Levetiracetam 51,321.9
Other publications by the HSCIC which include medicines appraised by the NICE technology appraisal process are:
• Use of NICE Appraised Medicines in the NHS in England: Experimental publication • NICE Technology Appraisals in the NHS in England - Innovation Scorecard :
Experimental publication
Hospital Prescribing: England 2012
Copyright © 2013, Health and Social Care Information Centre. All rights reserved. 21
Specific therapeutic area The availability of data for hospital issues allows greater understanding of total medicine utilisation than was previously possible with only primary care data. The relative proportion of prescribing which takes place in primary care and hospitals varies considerably depending on the therapeutic area. In some therapeutic areas almost all the prescribing takes place in primary care, so Prescription Services data sources are adequate to understand utilisation. For other therapeutic areas the majority of prescribing takes place in hospitals, particularly for specialist services such as cancer. For some therapeutic areas prescribing activity can take place in both primary and secondary care, and the relative balance between the two sectors can vary between geographical areas due to the local arrangements for the delivery of patient care. As was noted above, there are some therapeutic areas where medicines are supplied to patients outside the routes covered here.
This bulletin reports on the use of anti-bacterial drugs.
Anti-bacterial drugs In March 2013, the Chief Medical Officer, Professor Dame Sally Davies, published the second part of her Annual Report for 2011. This focussed on infection, the use of antimicrobial medicines and resistance to these medicines.
https://www.gov.uk/government/publications/chief-medical-officer-annual-report-volume-2
The report outlines the challenges faced by increasing anti-microbial resistance (AMR) and provides a range of recommendations for action. The use of antimicrobials is a major driver of resistance and antimicrobial stewardship programmes are advocated as a means of improving the quality of prescribing. A better understanding of antimicrobial usage, both in primary and secondary care, and linkage with antimicrobial resistance data is required to better assess the position and the impact of interventions.
In September 2013, a UK Five year Antimicrobial Resistance Strategy was published, developed in collaboration with a wide range of Government Departments, other Government Agencies, the NHS, academia and the scientific community.
https://www.gov.uk/government/publications/uk-5-year-antimicrobial-resistance-strategy-2013-to-2018 The 3 strategic aims are to:
• Improve knowledge and understanding of AMR
• Conserve and steward the effectiveness of existing treatments
• Stimulate the development of new antibiotics, diagnostics and novel therapies Public Health England has developed a new national programme, the English Surveillance Programme for Antimicrobial Utilisation and Resistance (ESPAUR) to establish robust systems to monitor and enhance the use of antimicrobials in the community and in hospitals, In England, HSCIC publishes regular datasets of prescribing by general practices, by CCGs (previously PCTs) and national summaries of primary care dispensing data
Hospital Prescribing: England 2012
22 Copyright © 2013, Health and Social Care Information Centre. All rights reserved.
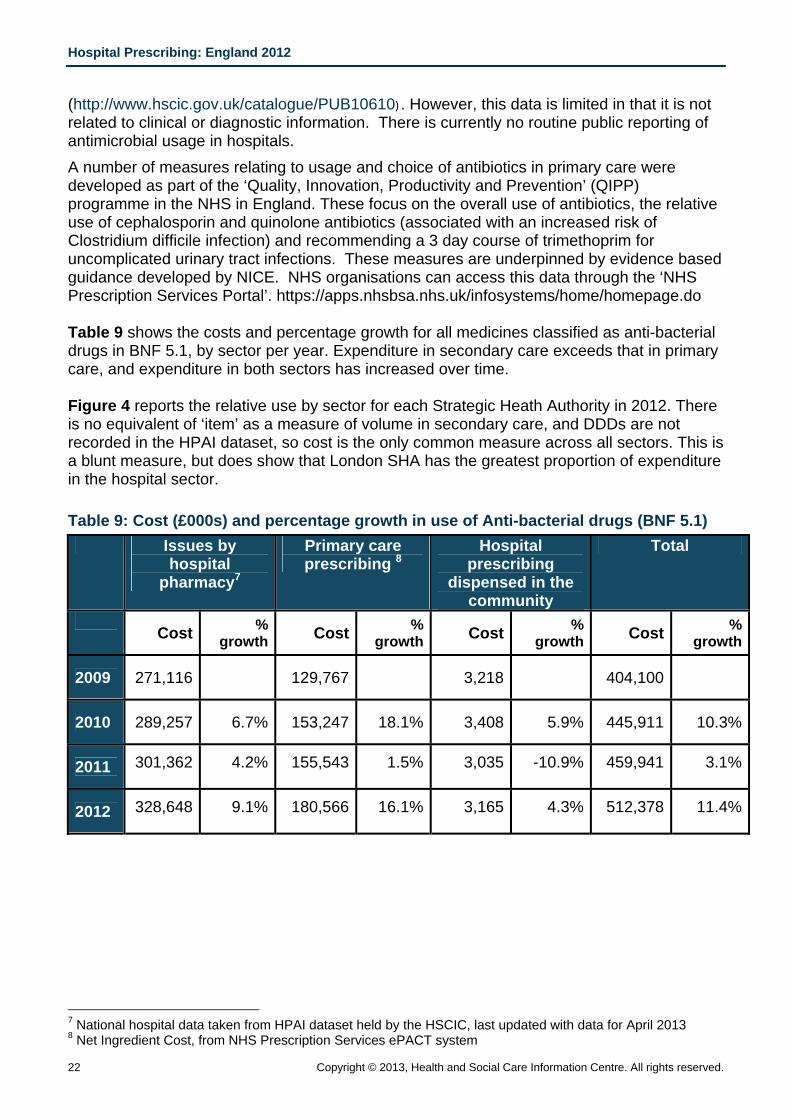
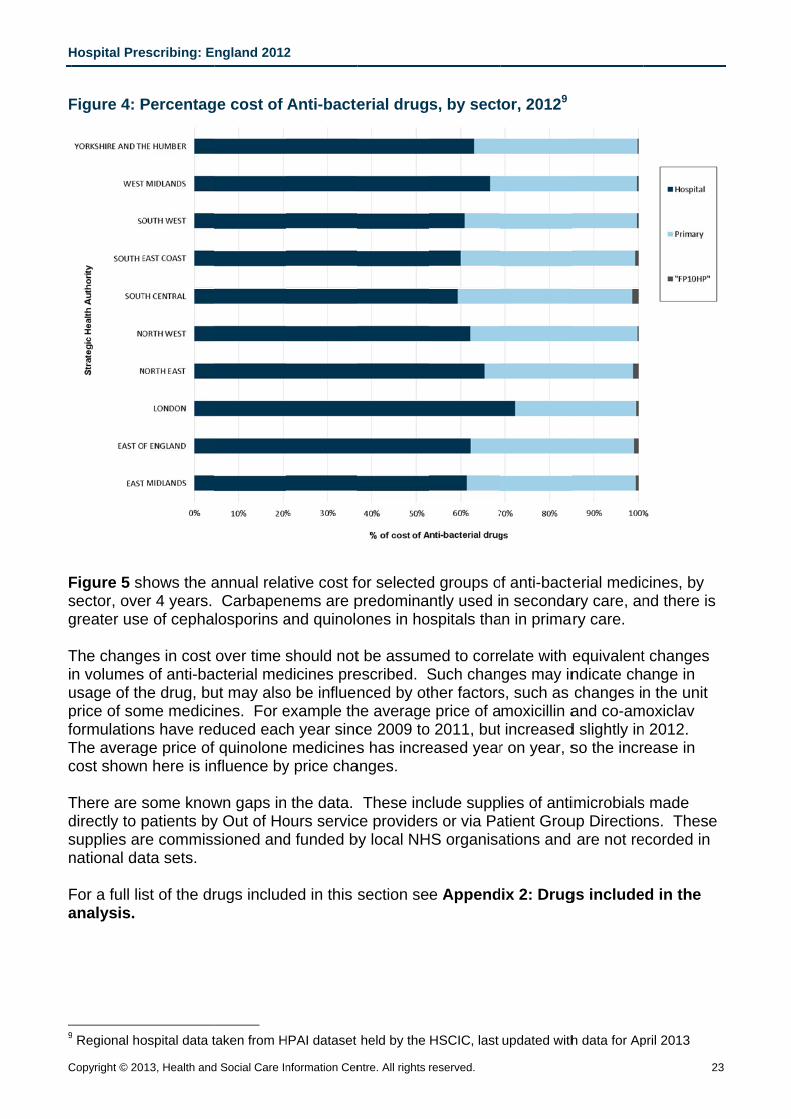
(http://www.hscic.gov.uk/catalogue/PUB10610). However, this data is limited in that it is not related to clinical or diagnostic information. There is currently no routine public reporting of antimicrobial usage in hospitals. A number of measures relating to usage and choice of antibiotics in primary care were developed as part of the ‘Quality, Innovation, Productivity and Prevention’ (QIPP) programme in the NHS in England. These focus on the overall use of antibiotics, the relative use of cephalosporin and quinolone antibiotics (associated with an increased risk of Clostridium difficile infection) and recommending a 3 day course of trimethoprim for uncomplicated urinary tract infections. These measures are underpinned by evidence based guidance developed by NICE. NHS organisations can access this data through the ‘NHS Prescription Services Portal’. https://apps.nhsbsa.nhs.uk/infosystems/home/homepage.do Table 9 shows the costs and percentage growth for all medicines classified as anti-bacterial drugs in BNF 5.1, by sector per year. Expenditure in secondary care exceeds that in primary care, and expenditure in both sectors has increased over time. Figure 4 reports the relative use by sector for each Strategic Heath Authority in 2012. There is no equivalent of ‘item’ as a measure of volume in secondary care, and DDDs are not recorded in the HPAI dataset, so cost is the only common measure across all sectors. This is a blunt measure, but does show that London SHA has the greatest proportion of expenditure in the hospital sector. Table 9: Cost (£000s) and percentage growth in use of Anti-bacterial drugs (BNF 5.1)
Issues by hospital
pharmacy7
Primary care prescribing 8
Hospital prescribing
dispensed in the community
Total
Cost %
growth Cost % growth Cost %
growth Cost % growth
2009 271,116 129,767 3,218 404,100
2010 289,257 6.7% 153,247 18.1% 3,408 5.9% 445,911 10.3%
2011 301,362 4.2% 155,543 1.5% 3,035 -10.9% 459,941 3.1%
2012 328,648 9.1% 180,566 16.1% 3,165 4.3% 512,378 11.4%
7 National hospital data taken from HPAI dataset held by the HSCIC, last updated with data for April 2013 8 Net Ingredient Cost, from NHS Prescription Services ePACT system
H
C
F
Fsg TiupfTc Tdsn Fa
9
Hospital Pre
Copyright © 20
Figure 4: P
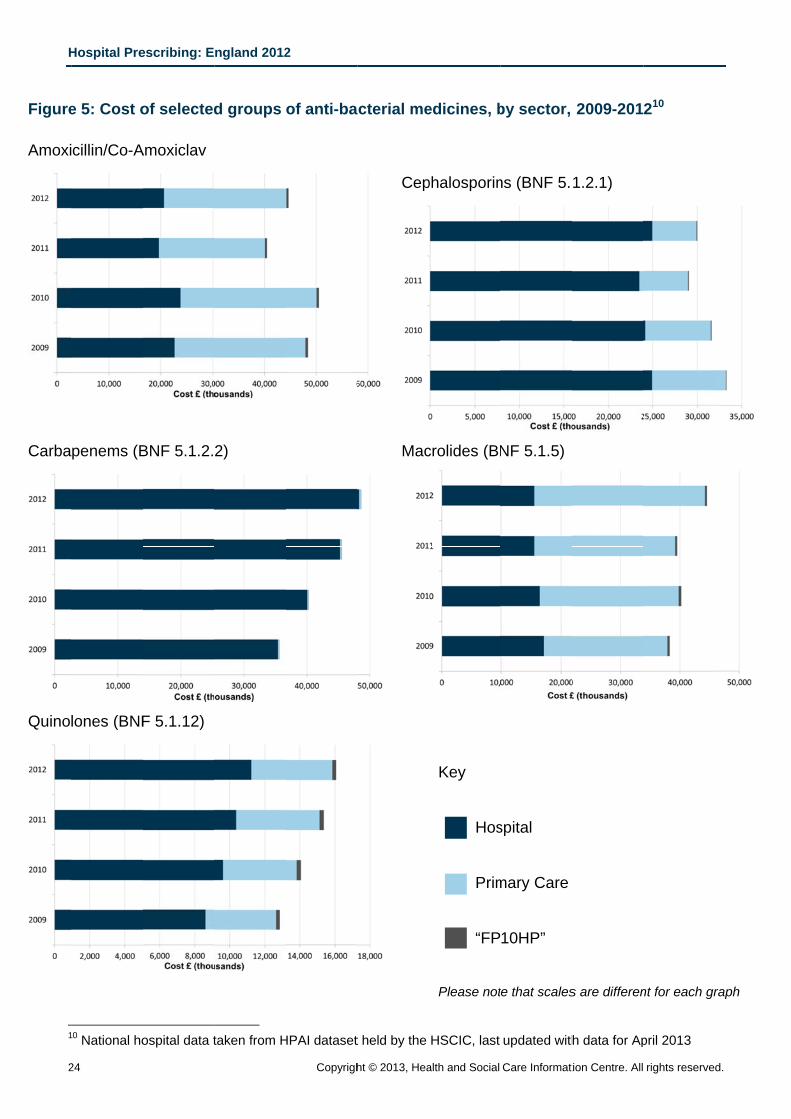
Figure 5 ssector, ovegreater use
The changn volumesusage of thprice of somformulationThe averagcost shown
There are sdirectly to psupplies arnational da
For a full lisanalysis.
9 Regional ho
escribing: E
013, Health and
Percentag
hows the aer 4 years. e of cepha
es in cost s of anti-bahe drug, bume medicins have redge price of n here is in
some knowpatients byre commissata sets.
st of the dr
ospital data t
ngland 2012
d Social Care In
ge cost of
annual rela Carbapenlosporins a
over time sacterial medut may alsones. For educed eacf quinolonenfluence by
wn gaps iny Out of Hosioned and
rugs includ
taken from H
2
nformation Cen
Anti-bacte
ative cost fonems are pand quinolo
should notdicines preo be influenexample thh year sinc
e medicinesy price cha
the data.ours servicd funded b
ded in this s
HPAI dataset
ntre. All rights
erial drug
for selectedpredominaones in ho
t be assumescribed. Snced by ot
he averagece 2009 tos has incre
anges.
These incce providerby local NH
section se
held by the
reserved.
s, by sect
d groups ontly used i
ospitals tha
med to corrSuch chanther factorse price of ao 2011, buteased year
clude supprs or via Pa
HS organisa
e Append
HSCIC, last
tor, 20129
f anti-bacten seconda
an in prima
elate with eges may ins, such as moxicillin aincreased
r on year, s
lies of antiatient Grouations and
ix 2: Drug
updated with
terial medicary care, anry care.
equivalentndicate chchanges inand co-am
d slightly inso the incr
imicrobialsup Directio are not re
gs include
h data for Ap
2
cines, by nd there is
t changes ange in n the unit
moxiclav n 2012. rease in
s made ns. These
ecorded in
ed in the
pril 2013
23
s
e
H
2
Figure Amoxi
Carba
Quino
1
Hospital Pre
24
e 5: Cost o
cillin/Co-A
penems (B
lones (BNF
0 National ho
escribing: E
of selected
Amoxiclav
BNF 5.1.2.
F 5.1.12)
ospital data t
ngland 2012
d groups
2)
taken from H
2
Copyrigh
of anti-ba
HPAI dataset
ht © 2013, Hea
cterial me
Cep
Mac
t held by the
alth and Social
edicines, b
phalosporin
crolides (BN
Key
Hos
Prim
“FP
Please not
HSCIC, last
Care Informat
by sector,
ns (BNF 5.
NF 5.1.5)
spital
mary Care
10HP”
te that scales
updated with
tion Centre. All
2009-201
1.2.1)
s are differen
h data for Ap
rights reserve
210
nt for each gr
pril 2013
d.
raph
Hospital Prescribing: England 2012
Copyright © 2013, Health and Social Care Information Centre. All rights reserved. 25
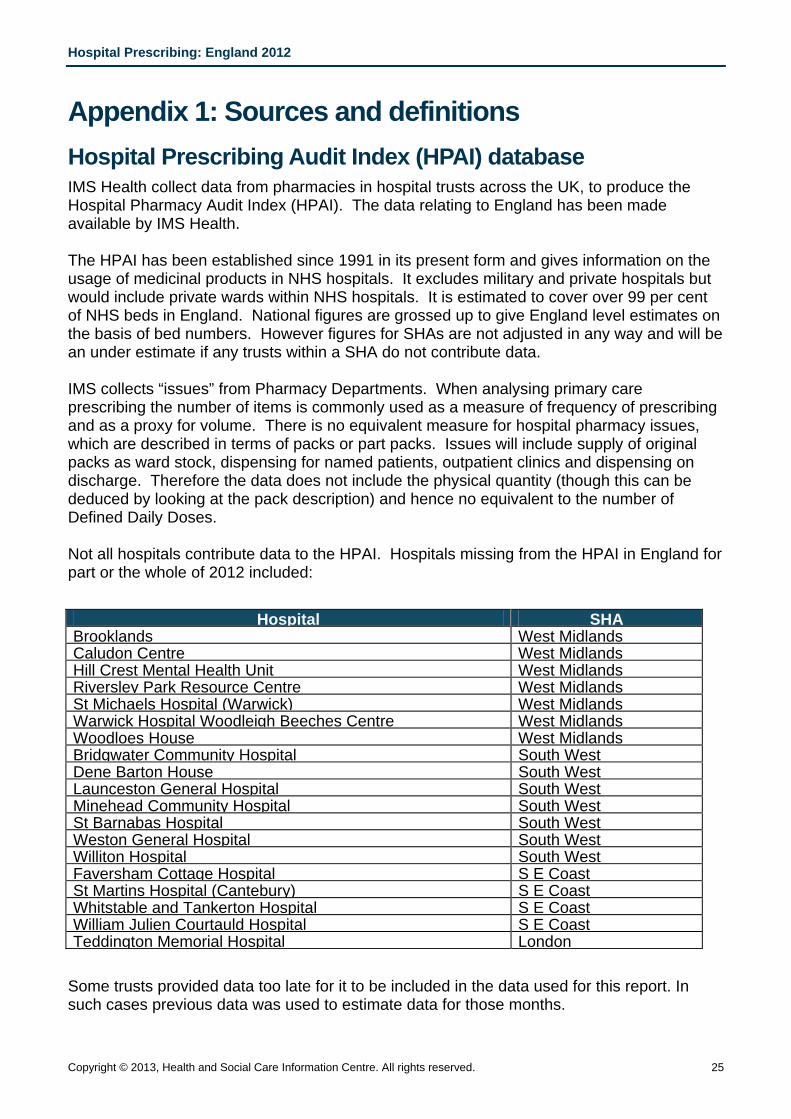
Appendix 1: Sources and definitions Hospital Prescribing Audit Index (HPAI) database IMS Health collect data from pharmacies in hospital trusts across the UK, to produce the Hospital Pharmacy Audit Index (HPAI). The data relating to England has been made available by IMS Health. The HPAI has been established since 1991 in its present form and gives information on the usage of medicinal products in NHS hospitals. It excludes military and private hospitals but would include private wards within NHS hospitals. It is estimated to cover over 99 per cent of NHS beds in England. National figures are grossed up to give England level estimates on the basis of bed numbers. However figures for SHAs are not adjusted in any way and will be an under estimate if any trusts within a SHA do not contribute data. IMS collects “issues” from Pharmacy Departments. When analysing primary care prescribing the number of items is commonly used as a measure of frequency of prescribing and as a proxy for volume. There is no equivalent measure for hospital pharmacy issues, which are described in terms of packs or part packs. Issues will include supply of original packs as ward stock, dispensing for named patients, outpatient clinics and dispensing on discharge. Therefore the data does not include the physical quantity (though this can be deduced by looking at the pack description) and hence no equivalent to the number of Defined Daily Doses. Not all hospitals contribute data to the HPAI. Hospitals missing from the HPAI in England for part or the whole of 2012 included:
Hospital SHA Brooklands West Midlands Caludon Centre West Midlands Hill Crest Mental Health Unit West Midlands Riversley Park Resource Centre West Midlands St Michaels Hospital (Warwick) West Midlands Warwick Hospital Woodleigh Beeches Centre West Midlands Woodloes House West Midlands Bridgwater Community Hospital South West Dene Barton House South West Launceston General Hospital South West Minehead Community Hospital South West St Barnabas Hospital South West Weston General Hospital South West Williton Hospital South West Faversham Cottage Hospital S E Coast St Martins Hospital (Cantebury) S E Coast Whitstable and Tankerton Hospital S E Coast William Julien Courtauld Hospital S E Coast Teddington Memorial Hospital London
Some trusts provided data too late for it to be included in the data used for this report. In such cases previous data was used to estimate data for those months.
Hospital Prescribing: England 2012
26 Copyright © 2013, Health and Social Care Information Centre. All rights reserved.
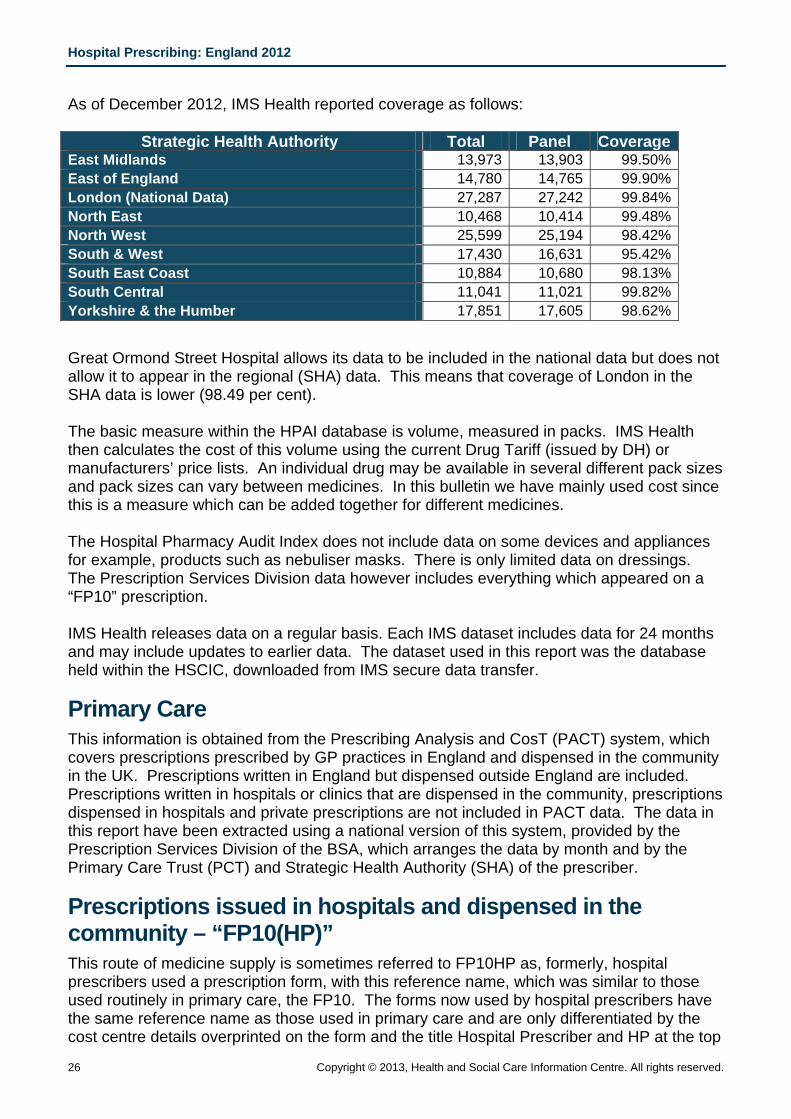
As of December 2012, IMS Health reported coverage as follows:
Strategic Health Authority Total Panel CoverageEast Midlands 13,973 13,903 99.50%East of England 14,780 14,765 99.90%London (National Data) 27,287 27,242 99.84%North East 10,468 10,414 99.48%North West 25,599 25,194 98.42%South & West 17,430 16,631 95.42%South East Coast 10,884 10,680 98.13%South Central 11,041 11,021 99.82%Yorkshire & the Humber 17,851 17,605 98.62%
Great Ormond Street Hospital allows its data to be included in the national data but does not allow it to appear in the regional (SHA) data. This means that coverage of London in the SHA data is lower (98.49 per cent). The basic measure within the HPAI database is volume, measured in packs. IMS Health then calculates the cost of this volume using the current Drug Tariff (issued by DH) or manufacturers’ price lists. An individual drug may be available in several different pack sizes and pack sizes can vary between medicines. In this bulletin we have mainly used cost since this is a measure which can be added together for different medicines. The Hospital Pharmacy Audit Index does not include data on some devices and appliances for example, products such as nebuliser masks. There is only limited data on dressings. The Prescription Services Division data however includes everything which appeared on a “FP10” prescription. IMS Health releases data on a regular basis. Each IMS dataset includes data for 24 months and may include updates to earlier data. The dataset used in this report was the database held within the HSCIC, downloaded from IMS secure data transfer.
Primary Care This information is obtained from the Prescribing Analysis and CosT (PACT) system, which covers prescriptions prescribed by GP practices in England and dispensed in the community in the UK. Prescriptions written in England but dispensed outside England are included. Prescriptions written in hospitals or clinics that are dispensed in the community, prescriptions dispensed in hospitals and private prescriptions are not included in PACT data. The data in this report have been extracted using a national version of this system, provided by the Prescription Services Division of the BSA, which arranges the data by month and by the Primary Care Trust (PCT) and Strategic Health Authority (SHA) of the prescriber.
Prescriptions issued in hospitals and dispensed in the community – “FP10(HP)” This route of medicine supply is sometimes referred to FP10HP as, formerly, hospital prescribers used a prescription form, with this reference name, which was similar to those used routinely in primary care, the FP10. The forms now used by hospital prescribers have the same reference name as those used in primary care and are only differentiated by the cost centre details overprinted on the form and the title Hospital Prescriber and HP at the top
Hospital Prescribing: England 2012
Copyright © 2013, Health and Social Care Information Centre. All rights reserved. 27
of the prescribing section of the form. The term FP10(HP) is continued to be used in the bulletin as a convenient way of referring to this method where the prescription is written by a hospital prescriber when it is intended that the patient will have the prescription dispensed in the community. The cost of the prescription is charged to the hospital. The data within this report at SHA level has been extracted from a hospital version of the ePACT system provided by Prescription Services Division of the BSA.
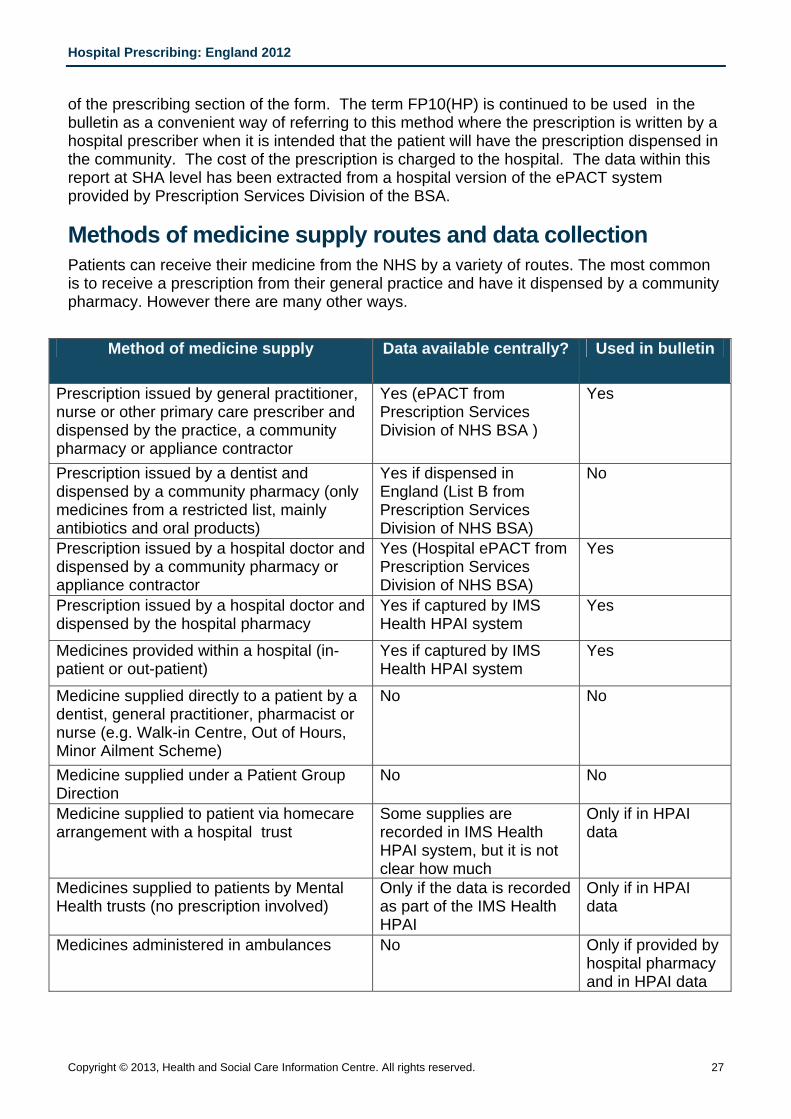
Methods of medicine supply routes and data collection Patients can receive their medicine from the NHS by a variety of routes. The most common is to receive a prescription from their general practice and have it dispensed by a community pharmacy. However there are many other ways.
Method of medicine supply Data available centrally? Used in bulletin
Prescription issued by general practitioner, nurse or other primary care prescriber and dispensed by the practice, a community pharmacy or appliance contractor
Yes (ePACT from Prescription Services Division of NHS BSA )
Yes
Prescription issued by a dentist and dispensed by a community pharmacy (only medicines from a restricted list, mainly antibiotics and oral products)
Yes if dispensed in England (List B from Prescription Services Division of NHS BSA)
No
Prescription issued by a hospital doctor and dispensed by a community pharmacy or appliance contractor
Yes (Hospital ePACT from Prescription Services Division of NHS BSA)
Yes
Prescription issued by a hospital doctor and dispensed by the hospital pharmacy
Yes if captured by IMS Health HPAI system
Yes
Medicines provided within a hospital (in-patient or out-patient)
Yes if captured by IMS Health HPAI system
Yes
Medicine supplied directly to a patient by a dentist, general practitioner, pharmacist or nurse (e.g. Walk-in Centre, Out of Hours, Minor Ailment Scheme)
No No
Medicine supplied under a Patient Group Direction
No No
Medicine supplied to patient via homecare arrangement with a hospital trust
Some supplies are recorded in IMS Health HPAI system, but it is not clear how much
Only if in HPAI data
Medicines supplied to patients by Mental Health trusts (no prescription involved)
Only if the data is recorded as part of the IMS Health HPAI
Only if in HPAI data
Medicines administered in ambulances No Only if provided by hospital pharmacy and in HPAI data
Hospital Prescribing: England 2012
28 Copyright © 2013, Health and Social Care Information Centre. All rights reserved.
Definition of Terms Technology Appraisal: Technology appraisals are recommendations from NICE on the use of new and existing medicines and treatments within the NHS in England and Wales. Recommendations are based on a review of clinical and economic evidence. Net Ingredient Cost (NIC): This is the basic price of a drug, i.e. the price listed in the national Drug Tariff or in standard price lists. NIC is used in Prescription Services reports and other analyses, as it standardises cost throughout prescribing nationally. The actual price paid by the NHS takes into account any discounts. Issue: when a hospital pharmacy supplies medication to a ward or operating theatre or to a patient who is being discharged. This supply is usually termed an ‘issue’. Defined Daily Dose: The World Health organisation define this as the assumed average maintenance dose per day for a drug used for its main indication in adults.
Data limitations Estimated cost: The prices used in the HPAI are the published prices from the Drug Tariff and other standard price lists. This is not a true reflection of the actual expenditure by hospitals as many purchases are made on contract with individual manufacturers or wholesalers at lower prices. Private usage: The HPAI includes no information taken directly from private hospitals. The data used in this report will however include usage in private wards within NHS hospitals, or where the NHS hospital supplies a private hospital. Clinical trial usage: Where the data received can be linked to a valid UK pack, clinical trial usage will be incorporated. This is not always possible as clinical trial packs may not be issued from or recorded within the hospital pharmacy system. Unlicensed products: Information on unlicensed products is not included within the HPAI. Drugs issues through aseptic units: Certain types of drug, notably some cytotoxics and intravenous nutrition, are prepared in aseptic conditions. This may be carried out at a separate site by an outside contractor. There is one site in England where IMS are not able to collect such data. If the data relate to issues from an aseptic unit, it is sometimes not possible to determine the quantity of drugs used. In such instances an average quantity is substituted. Medicines supplied via companies providing care at home: A number of specialist medicines are not only provided in hospital or by community pharmacies but are also delivered directly to the patient’s home by various commercial companies. No homecare supplies are recorded in ePACT data and it is recorded within hospital pharmacy systems to a variable extent. Homecare supplies are generally initiated and commissioned by a hospital but the supply to the patient is made by the company and the hospital is invoiced for this service. Information from the NHS Commercial Medicines Unit, in conjunction with the National Homecare Medicines Committee, indicates that medicines that may be delivered by companies providing care at home include some preparations of the following medicines. They estimate that the cost of homecare in England is approximately £1.5 billion per year.
Hospital Prescribing: England 2012
Copyright © 2013, Health and Social Care Information Centre. All rights reserved. 29
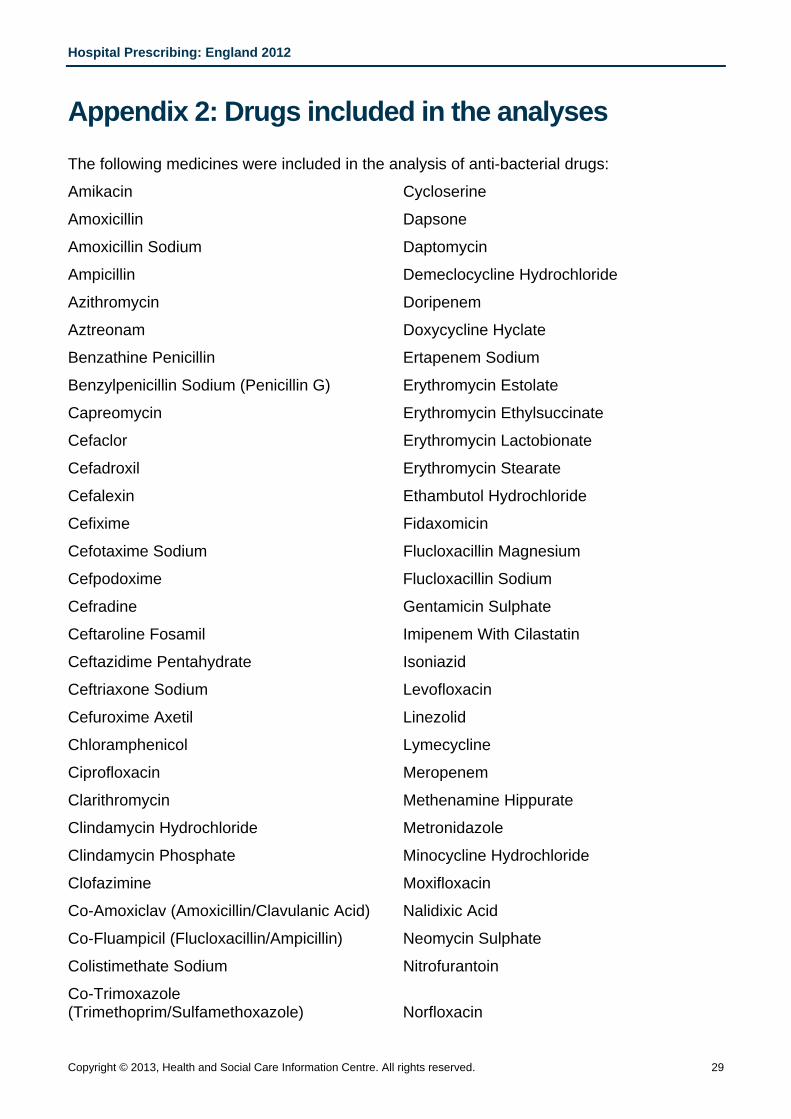
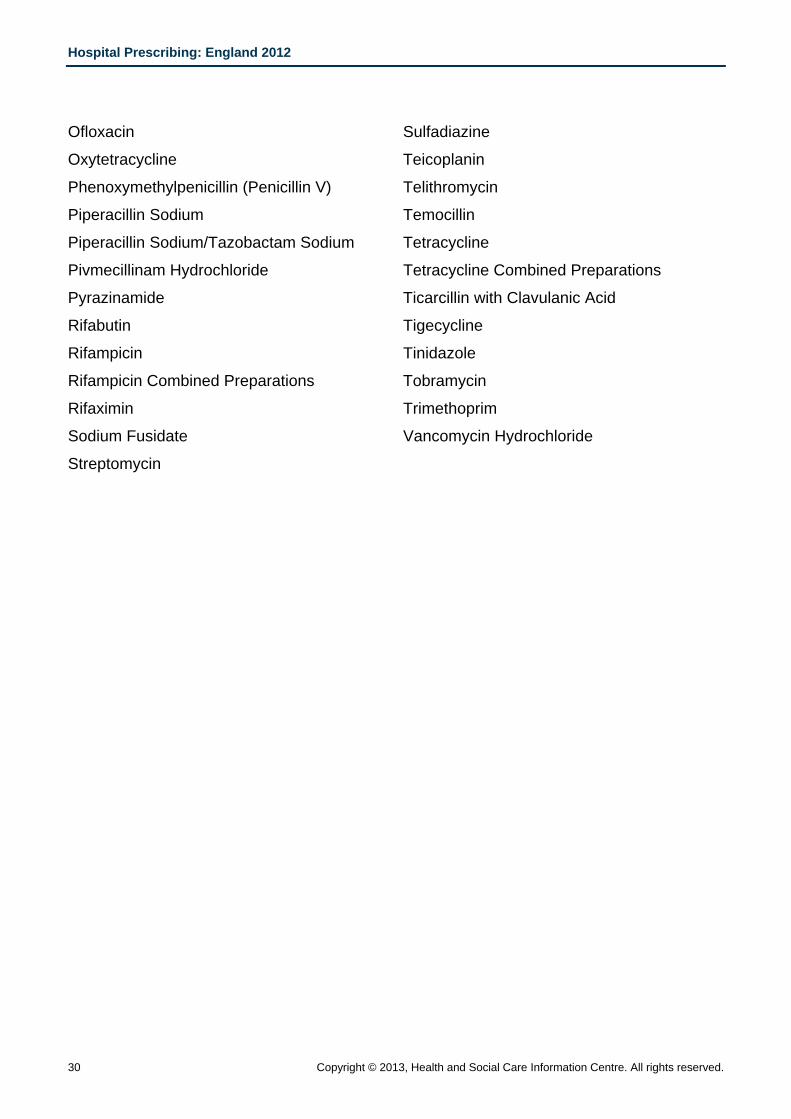
Appendix 2: Drugs included in the analyses
The following medicines were included in the analysis of anti-bacterial drugs:
Amikacin Cycloserine
Amoxicillin Dapsone
Amoxicillin Sodium Daptomycin
Ampicillin Demeclocycline Hydrochloride
Azithromycin Doripenem
Aztreonam Doxycycline Hyclate
Benzathine Penicillin Ertapenem Sodium
Benzylpenicillin Sodium (Penicillin G) Erythromycin Estolate
Capreomycin Erythromycin Ethylsuccinate
Cefaclor Erythromycin Lactobionate
Cefadroxil Erythromycin Stearate
Cefalexin Ethambutol Hydrochloride
Cefixime Fidaxomicin
Cefotaxime Sodium Flucloxacillin Magnesium
Cefpodoxime Flucloxacillin Sodium
Cefradine Gentamicin Sulphate
Ceftaroline Fosamil Imipenem With Cilastatin
Ceftazidime Pentahydrate Isoniazid
Ceftriaxone Sodium Levofloxacin
Cefuroxime Axetil Linezolid
Chloramphenicol Lymecycline
Ciprofloxacin Meropenem
Clarithromycin Methenamine Hippurate
Clindamycin Hydrochloride Metronidazole
Clindamycin Phosphate Minocycline Hydrochloride
Clofazimine Moxifloxacin
Co-Amoxiclav (Amoxicillin/Clavulanic Acid) Nalidixic Acid
Co-Fluampicil (Flucloxacillin/Ampicillin) Neomycin Sulphate
Colistimethate Sodium Nitrofurantoin
Co-Trimoxazole (Trimethoprim/Sulfamethoxazole) Norfloxacin
Hospital Prescribing: England 2012
30 Copyright © 2013, Health and Social Care Information Centre. All rights reserved.
Ofloxacin Sulfadiazine
Oxytetracycline Teicoplanin
Phenoxymethylpenicillin (Penicillin V) Telithromycin
Piperacillin Sodium Temocillin
Piperacillin Sodium/Tazobactam Sodium Tetracycline
Pivmecillinam Hydrochloride Tetracycline Combined Preparations
Pyrazinamide Ticarcillin with Clavulanic Acid
Rifabutin Tigecycline
Rifampicin Tinidazole
Rifampicin Combined Preparations Tobramycin
Rifaximin Trimethoprim
Sodium Fusidate Vancomycin Hydrochloride
Streptomycin
Hospital Prescribing: England 2012
Copyright © 2013, Health and Social Care Information Centre. All rights reserved. 31
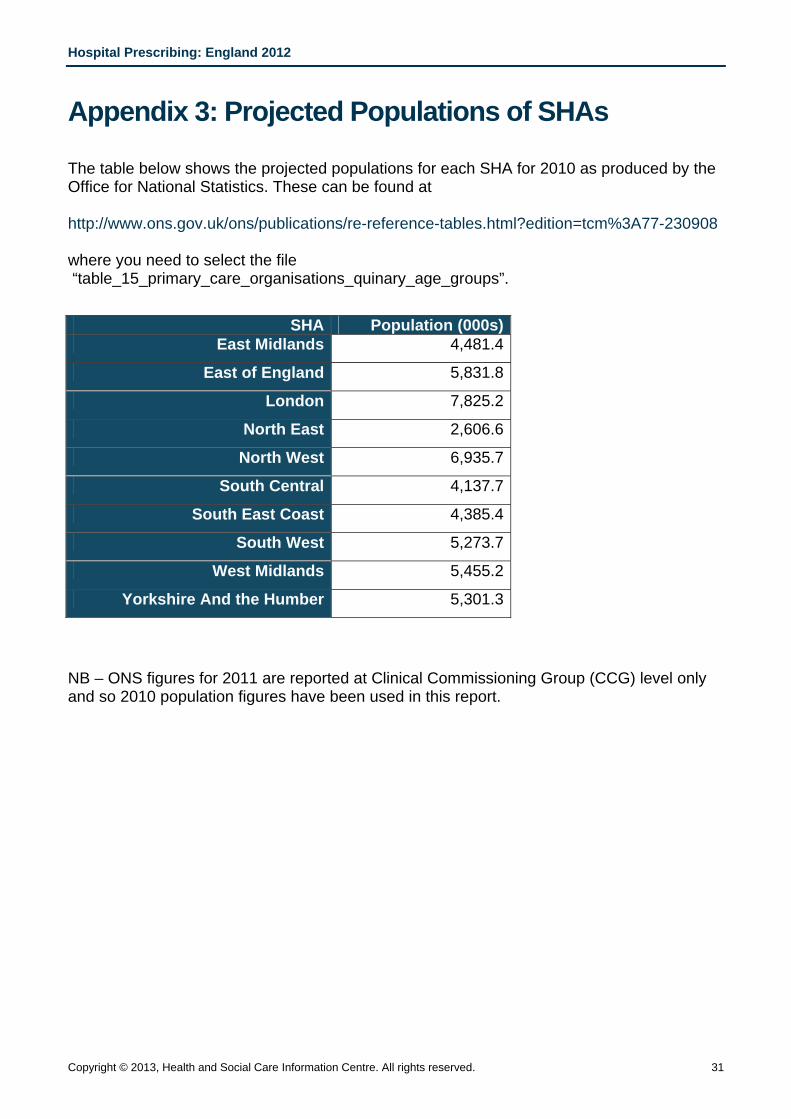
Appendix 3: Projected Populations of SHAs The table below shows the projected populations for each SHA for 2010 as produced by the Office for National Statistics. These can be found at http://www.ons.gov.uk/ons/publications/re-reference-tables.html?edition=tcm%3A77-230908 where you need to select the file “table_15_primary_care_organisations_quinary_age_groups”.
SHA Population (000s)East Midlands 4,481.4
East of England 5,831.8
London 7,825.2
North East 2,606.6
North West 6,935.7
South Central 4,137.7
South East Coast 4,385.4
South West 5,273.7
West Midlands 5,455.2
Yorkshire And the Humber 5,301.3
NB – ONS figures for 2011 are reported at Clinical Commissioning Group (CCG) level only and so 2010 population figures have been used in this report.
Hospital Prescribing: England 2012
32 Copyright © 2013, Health and Social Care Information Centre. All rights reserved.
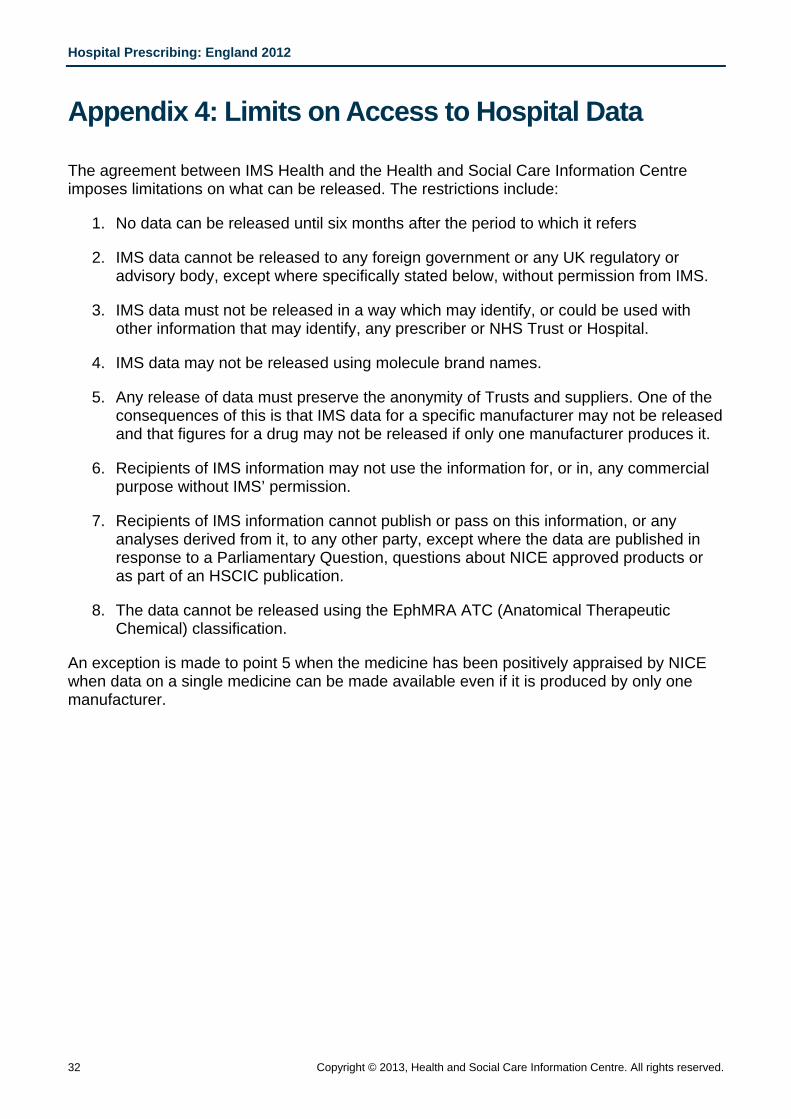
Appendix 4: Limits on Access to Hospital Data
The agreement between IMS Health and the Health and Social Care Information Centre imposes limitations on what can be released. The restrictions include:
1. No data can be released until six months after the period to which it refers
2. IMS data cannot be released to any foreign government or any UK regulatory or advisory body, except where specifically stated below, without permission from IMS.
3. IMS data must not be released in a way which may identify, or could be used with other information that may identify, any prescriber or NHS Trust or Hospital.
4. IMS data may not be released using molecule brand names.
5. Any release of data must preserve the anonymity of Trusts and suppliers. One of the consequences of this is that IMS data for a specific manufacturer may not be released and that figures for a drug may not be released if only one manufacturer produces it.
6. Recipients of IMS information may not use the information for, or in, any commercial purpose without IMS’ permission.
7. Recipients of IMS information cannot publish or pass on this information, or any analyses derived from it, to any other party, except where the data are published in response to a Parliamentary Question, questions about NICE approved products or as part of an HSCIC publication.
8. The data cannot be released using the EphMRA ATC (Anatomical Therapeutic Chemical) classification.
An exception is made to point 5 when the medicine has been positively appraised by NICE when data on a single medicine can be made available even if it is produced by only one manufacturer.
Hospital Prescribing: England 2012
Copyright © 2013, Health and Social Care Information Centre. All rights reserved. 33
Published by the Health and Social Care Information Centre Part of the Government Statistical Service Responsible Statistician Kate Croft, Senior Services Manager ISBN 978-1-84636-781-6 This publication may be requested in large print or other formats.
For further information:
www.hscic.gov.uk 0845 300 6016
Copyright © 2013 Health and Social Care Information Centre. All rights reserved.
This work remains the sole and exclusive property of the Health and Social Care Information Centre and may only be reproduced where there is explicit reference to the ownership of the Health and Social Care Information Centre.
This work may be re-used by NHS and government organisations without permission.