Embed Size (px)
Citation preview

HOSPITAL LANGUAGE SERVICES
FOR PATIENTS WITH LIMITED ENGLISH PROFICIENCY:
RESULTS FROM A NATIONAL SURVEY
Romana Hasnain-Wynia | Julie Yonek | Debra Pierce | Ray Kang | Cynthia Hedges Greising

Health Research and Educational Trust/AHAOne North Franklin, 30th FloorChicago, IL 60606www.hret.org
National Health Law Program1101 14th St NW, Suite 405Washington, DC 20005www.healthlaw.org
Acknowledgments
The development of this report was funded by The California Endowment.
We would like to thank Steve Hitov and Mara Youdelman of the National Health Law Program andEllen Pryga of the American Hospital Association for their substantial and detailed comments on thedevelopment on all aspects of this report.
©October 2006 by the Health Research and Educational Trust

T A B L E O F C O N T E N T S
EXECUTIVE SUMMARY ............................................................................................i
I. INTRODUCTION ............................................................................................1
II. CHARACTERISTICS OF RESPONDENTS............................................................2
III. RESULTS FROM THE SURVEY..........................................................................21. Language Needs of Populations Served ........................................................................2
2. Resources Used to Provide Language Services ............................................................5
3. Providing Language Services Off-hours........................................................................9
4. Covering the Cost of Language Services ......................................................................9
5. Need for Tools and Resources ....................................................................................10
6. Tools and Training That Hospitals Would Find Useful in Providing Language Services ......................................................................................11
7. Engagement in Initiatives to Improve Language Services ............................................13
8. Comparing LEP Needs and Language Services Provision Among Hospitals in LEP Growth States and Non-LEP Growth States ......................14
IV. METHODS ..................................................................................................14
V. STATISTICAL ANALYSIS..................................................................................16
VI. HOSPITAL CHARACTERISTICS ......................................................................16
1. Region ......................................................................................................................16
2. Hospital Size Based Upon Number of Beds ..............................................................17
3.Teaching Status ..........................................................................................................17
4. System Membership ..................................................................................................17
5. Hospital Ownership (Control)....................................................................................17
6. Urban/Rural Status ....................................................................................................17
7. Medicare’s Special Rural Designations ........................................................................17
VII. CONCLUSION ..............................................................................................17
RESOURCES AND TOOLS........................................................................................19
REFERENCES ........................................................................................................20


Health care providers from across the country havereported language difficulties and inadequatefunding of language services to be major barriersto limited English proficiency (LEP) individuals’access to quality health care.Almost 52 millionpeople—over 19% of the U.S. population—speak a language other than English at home.TheCensus Bureau’s 2005 American CommunitySurvey documented that over 29% of all Spanishspeakers, 22% of Asian and Pacific Island languagespeakers, and 13% of Indo-European languagespeakers speak English “not well” or “not at all.”Estimates of the number of people with LEP rangefrom a low of about 12 million, or 4.5% of theU.S. population—who speak English “not well” or“not at all”—to over 23 million people, or 8.6% ofthe U.S. population—if one includes those whospeak English less than “very well.”
The Health Research and Educational Trust(HRET), the research and educational affiliate of the American Hospital Association, incollaboration with the National Health LawProgram, conducted a national survey of hospitalsin the United States to seek information aboutpatient language services in hospitals.The purposeof the survey was to better understand theprocesses and resources available to hospitals inproviding language services to patients with LEP.
This report describes current practices, commonbarriers, and the specific resources and toolsneeded to provide language services to patientswith LEP.The results of the survey will informfederal policymakers, practitioners, providers, and
others of the issues and potential solutions facinghospitals as they work to improve languageservices for all patients with LEP.
KEY FINDINGS• 63% of hospitals encountered patients with LEP
either daily or weekly; an additional 17%encountered LEP patients at least monthly.
• Hospitals used a wide variety of sources toassess the language needs of communitiesincluding using census data and collectinglanguage information directly from patients.
• The most common approach for creatingpolices and procedures to provide languageservices was through hospital management.
• 82% of hospitals indicated that staff interpreterswere the most frequently used resource forproviding language services.
• 92% of hospitals indicated that telephonicservices were the most available resource forproviding language services.
• 88% of hospitals reported providing languageservices during off-hours.
• 3% of hospitals indicated receiving directreimbursement for providing language services.
• Of the 3% of hospitals that received directreimbursement, 78% indicated receivingreimbursement from Medicaid.
• The most frequent barrier hospitals faced inproviding language services was that staff hadno means of identifying patients who neededlanguage services before they arrived at thehospital.
• Tools that hospital staff would find useful forproviding language services included packaged
i
E X E C U T I V E S U M M A R Y
ii
in-service training programs and modelapproaches and promising practicesdemonstrated by other health care institutionsserving LEP patients.
• Training that hospital staff would find mostuseful for providing language services includedhow to respond to patients and family memberswho did not speak English and culturalcompetency training.
• 33% of hospitals were engaged in initiatives toimprove language services, and 72% of thoseengaged indicated that they would be willingto share information about their initiatives.
Evidence shows that effective communicationbetween patients and clinicians is a criticalcomponent of providing high-quality health care.When communication is compromised bylanguage barriers, the quality of care is alsocompromised. Consequently, providing individualswith LEP the means to communicate effectivelywith their health care providers is critical to
improving their experience in the health caresetting, the quality of care they receive, and theirhealth outcomes.
As racial and ethnic diversity in the United Statescontinues to increase, so does the demand forappropriate and effective language services.With80% of hospitals encountering individuals withLEP frequently, and only 3% receiving directreimbursement for providing language services, thequestion and challenge are:Who will pay for theseservices?
Hospitals that commit to providing high-qualitylanguage services to their patients likely will berewarded with greater patient and staff satisfaction,which can provide them with a competitiveadvantage as the demographics of the UnitedStates continue to change. Resources should betargeted toward monitoring and improvinglanguage services for all patients with LEP.
1
I. INTRODUCTIONThe Health Research and Educational Trust(HRET), the research and educational affiliate ofthe American Hospital Association, conducted anational survey of hospitals to seek informationabout patient language services in hospitals.Thepurpose of the survey was to better understand theprocesses and resources available to hospitals inproviding language services to patients withlimited English proficiency (LEP). Lookingforward, the results of the survey will informfederal policymakers, practitioners, and providers ofthe issues and potential solutions facing hospitals asthey work to improve language services for theirpatients and communities.
Nearly 52 million people—over 19% of the U.S.population—speak a language other than Englishat home.i The Census Bureau’s 2005 AmericanCommunity Survey documented that over 29% of all Spanish speakers, 22% of Asian and PacificIsland language speakers, and 13% of Indo-Europeanlanguage speakers speak English “not well” or “not at all.”ii Estimates of the number of peoplewith LEP range from a low of about 12 million, or4.5% of the U.S. population—who speak English“not well” or “not at all”—to over 23 millionpeople, or 8.6% of the U.S. population—if oneincludes those who speak English less than “very well.”iii
Health care providers from across the country havereported language difficulties and inadequatefunding of language services to be major barriersto LEP individuals’ access to health care and a
serious threat to the quality of the care theyreceive.iv Demographic trends continue todocument the diversity of the country,underscoring the challenge for health careproviders,v who must determine which languageservices are most appropriate based on theirsetting, type, and size; the frequency of contactwith LEP patients; and the variety of languagesencountered. But without adequate attention andresources being applied to address the problem, thehealth care system cannot hope to meet thechallenge of providing LEP individuals appropriateaccess to quality health care.
A report by the Access Project found that 161uninsured patients who received health care at 23primarily safety net hospitals had differingexperiences based on access to an interpreter.vi
Patients who needed and got an interpreter ratedtheir hospital experience and the care theyreceived more positively than those patients whoneeded an interpreter but did not get one. Otherstudies have found that racial and ethnic minoritiestended to report worse care than Whites butlinguistic minorities of any race reported worsecare than did English-speaking racial and ethnicminorities.vii Beyond patient satisfaction, solidevidence shows that language barriers canadversely affect quality of care. Poor patientoutcomes that have been attributed to languagebarriers include increased use of expensivediagnostic tests, increased use of emergencyservices and decreased use of primary care services,and poor or no patient follow-up when follow-upis indicated.viii
H O S P I T A L L A N G U A G E S E R V I C E S
2
In addition, several laws require hospitals toprovide language assistance to individuals withLEP.These include Title VI of the Civil Rights Actof 1964, the Emergency Medical Treatment andActive Labor Act, the Hill-Burton Act, andMedicaid and Medicare regulations.ix
This report describes the findings from a nationalsurvey of hospitals with the goal of understandingcurrent practices, common barriers, and thespecific resources and tools needed to providelanguage services to patients with LEP.The reportaims to provide information that can be actedupon by policymakers, health care providers,practitioners, and others to improve languageservices for all patients with LEP.
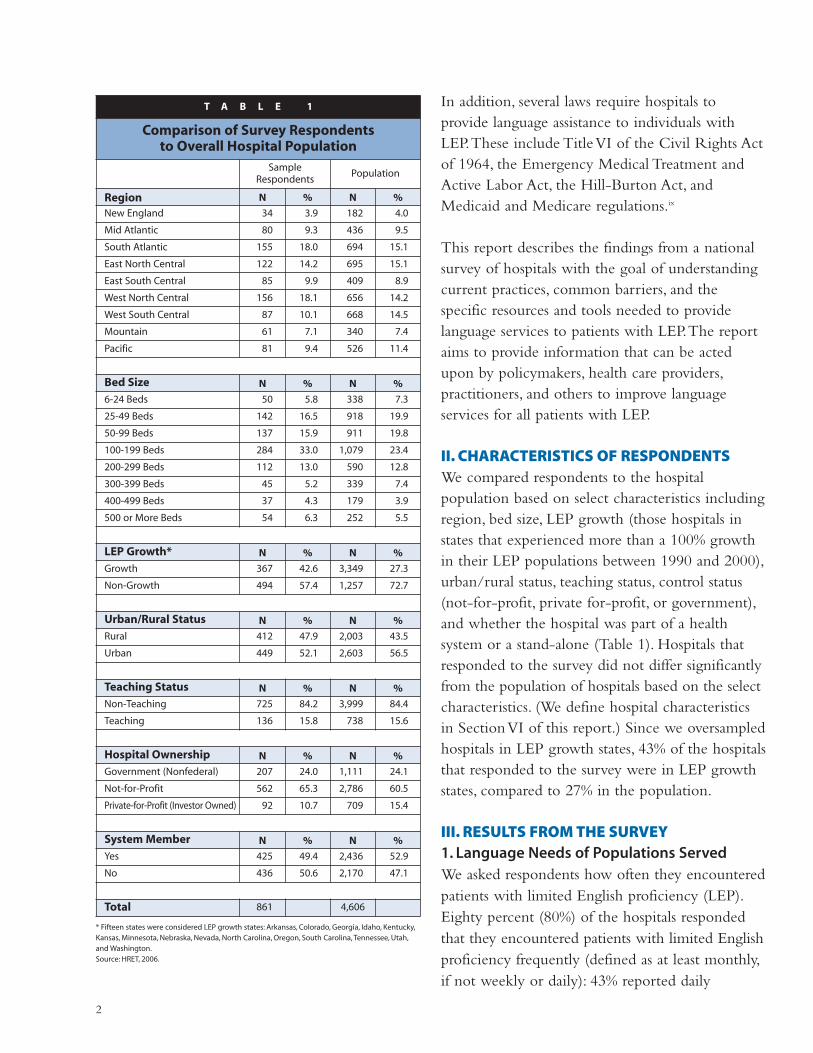
II. CHARACTERISTICS OF RESPONDENTSWe compared respondents to the hospitalpopulation based on select characteristics includingregion, bed size, LEP growth (those hospitals instates that experienced more than a 100% growthin their LEP populations between 1990 and 2000),urban/rural status, teaching status, control status(not-for-profit, private for-profit, or government),and whether the hospital was part of a healthsystem or a stand-alone (Table 1). Hospitals thatresponded to the survey did not differ significantlyfrom the population of hospitals based on the selectcharacteristics. (We define hospital characteristicsin Section VI of this report.) Since we oversampledhospitals in LEP growth states, 43% of the hospitalsthat responded to the survey were in LEP growthstates, compared to 27% in the population.
III. RESULTS FROM THE SURVEY1. Language Needs of Populations ServedWe asked respondents how often they encounteredpatients with limited English proficiency (LEP).Eighty percent (80%) of the hospitals respondedthat they encountered patients with limited Englishproficiency frequently (defined as at least monthly,if not weekly or daily): 43% reported daily
T A B L E 1
Comparison of Survey Respondentsto Overall Hospital Population
SampleRespondents
Population
Region N % N %
New England 34 3.9 182 4.0
Mid Atlantic 80 9.3 436 9.5
South Atlantic 155 18.0 694 15.1
East North Central 122 14.2 695 15.1
East South Central 85 9.9 409 8.9
West North Central 156 18.1 656 14.2
West South Central 87 10.1 668 14.5
Mountain 61 7.1 340 7.4
Pacific 81 9.4 526 11.4
Bed Size N % N %
6-24 Beds 50 5.8 338 7.3
25-49 Beds 142 16.5 918 19.9
50-99 Beds 137 15.9 911 19.8
100-199 Beds 284 33.0 1,079 23.4
200-299 Beds 112 13.0 590 12.8
300-399 Beds 45 5.2 339 7.4
400-499 Beds 37 4.3 179 3.9
500 or More Beds 54 6.3 252 5.5
LEP Growth* N % N %
Growth 367 42.6 3,349 27.3
Non-Growth 494 57.4 1,257 72.7
Urban/Rural Status N % N %
Rural 412 47.9 2,003 43.5
Urban 449 52.1 2,603 56.5
Teaching Status N % N %
Non-Teaching 725 84.2 3,999 84.4
Teaching 136 15.8 738 15.6
Hospital Ownership N % N %
Government (Nonfederal) 207 24.0 1,111 24.1
Not-for-Profit 562 65.3 2,786 60.5
Private-for-Profit (Investor Owned) 92 10.7 709 15.4
System Member N % N %
Yes 425 49.4 2,436 52.9
No 436 50.6 2,170 47.1
Total 861 4,606
* Fifteen states were considered LEP growth states: Arkansas, Colorado, Georgia, Idaho, Kentucky,Kansas, Minnesota, Nebraska, Nevada, North Carolina, Oregon, South Carolina, Tennessee, Utah,and Washington.Source: HRET, 2006.

3
encounters, 20% reported weekly encounters, and17% reported monthly encounters.Table 2 showsthe frequency of LEP encounters by hospital typeand region.The size, urban/rural status, region,teaching status, and whether the hospital was asystem member or a stand-alone were significantlyrelated to the frequency of LEP encounters. Largeand teaching hospitals and those in urban settingswere more likely to see a higher number ofpatients with LEP.
Table 3 shows languages that at least 20% ofhospitals encountered frequently. In addition to 32listed languages, we provided a write-in responseoption. Eleven percent (11%) of hospitals wrote ina language (labeled as “other” in Table 3), and 17hospitals specified American Sign Language as awrite-in response.
We asked hospitals to identify the sources ofinformation they used to assess the language needsof the communities they serve. Hospitals weremore likely to use census data or collect languageinformation directly from patients to assesslanguage needs of the community (Figure 1).Forty-six percent (46%) of hospitals collectlanguage information from patients and over 50%collect language information from the community(31% of data comes from local communityorganizations and 21% comes from a hospitalconducting a community needs assessment).
In January 2006, the Joint Commission onAccreditation of Healthcare Organizationsinstituted a new standard requiring hospitals tocollect and document language information abouttheir patients as part of its accreditation process.In addition, according to a newly released consensusreport Improving Communication—Improving Careby the Ethical Force Program,1 which focuses onimproving communication with diversepopulations, hospitals should collect information
T A B L E 2
Encounters with LEP Patients by Hospital Characteristics
N
% Hospitals that encounter
LEP patientsmonthly, weekly,
or daily
Total 858 80
Hospital Ownership
Government (Nonfederal) 207 77
Not-for-Profit 559 81
Private-for-Profit (Investor Owned) 92 74
Size*
Small 328 64
Medium 395 90
Large 135 97
Urban/Rural Status*
Rural 410 66
Urban 448 89
Census Region*
Northeast 113 82
South 326 83
Midwest 277 69
West 142 88
Teaching Status*
Non-Teaching 722 75
Teaching 136 98
System Member*
Yes 424 80
No 434 78
Critical Access Hospital* 187 53
Sole Community Hospital* 122 70
Rural Referral Center* 106 93
*Significance level, p<.05.Percents are weighted using hospital weights.Source: HRET, 2006.
1 The report represents a consensus of the members of the Ethical Force ProgramTM OversightBody. The Ethical Force ProgramTM is a collaborative project led by the Institute for Ethics of theAmerican Medical Association. For a complete list of Ethical Force ProgramTM Oversight Bodymembers, go to http: //www.ama-assn.org/ama/pub/category/3652.html.
from patients about their primary language as wellas information from local groups about thelanguages spoken in the community.x Both data

4
collection activities facilitate effective communicationwith diverse populations as well as enable hospitalsto make the case for improving resources forproviding language services. In addition,community-level information can help hospitals inguiding strategic planning. For example, if a hospitalis inadvertently failing to meet the language needsof a specific group, and as a result the majority ofthe population avoids receiving care at thathospital, it may be missing an opportunity.xi
The results of the survey indicate that hospitals aregathering information both at the individual level(from patients) and at the community level (fromcensus data, local community organizations, andcommunity needs assessment). However, since thetwo most common sources of collecting these dataare from the census and directly from patients, weshow these results by hospital characteristics inTable 4.
We saw significant differences by hospitalcharacteristics. For example, not-for-profit hospitalswere significantly more likely to use census data
T A B L E 3
Languages That 20 Percent or Moreof the Hospitals Indicated
They Encountered Frequently
Spanish 93%
Chinese 47%
Vietnamese 39%
Japanese 37%
Korean 37%
Russian 37%
German 36%
French 31%
Arabic 26%
Italian 26%
Laotian 23%
Hindi 22%
Polish 22%
Tagalog 21%
Thai 20%
Other 11%
F I G U R E 1
Sources That Hospitals Use to Assess Language Needs of Communities
Census data
Hospital collects language data from patients
Data comes from local community organizations
Hospital conducts community needs assessment
Other sources
Do not know
46%
46%
31%
21%
10%
5%
Does not total 100% – respondents were asked to check “all that apply.”19% of hospitals indicated that they had not assessed the language needs of the community.
Source: HRET, 2006.
0 10 20 30 40 50
Source: HRET, 2006.

5
while for-profit hospitals were more likely tocollect the information from patients. Large andurban hospitals were significantly more likely touse census data and information from patients.There was not a significant difference by region.Teaching hospitals were significantly more likelythan non-teaching hospitals to use both sources forgetting information. Critical access hospitals,which tend to be small (no more than 15 inpatientbeds), were the least likely of all hospitals to useboth as sources for getting information.
2. Resources Used to Provide LanguageServicesWe asked hospitals about the approaches (e.g., bymanagement, internal committees, etc.) they usedto create policies and procedures related toproviding language services to patients (Figure 2).Respondents were asked to select all that apply.
Hospitals used a variety of approaches for creatingpolicies and procedures to provide languageservices.The most common approach was to usehospital management followed by a designated staffperson.The use of external/internal committeeswas much lower compared to other approaches.Atotal of 95 hospitals (11% of the sample) indicatedthat they used combined external/internalcommittees.As a hospital develops or expands itslanguage service programs, increasing communityparticipation may be a highly effective strategy.
Approaches used to create policies and proceduresvaried by hospital characteristics. For-profithospitals were more likely than government ornot-for-profit hospitals to use hospitalmanagement or internal committees to createpolicies and procedures for language services.Large and urban hospitals were more likely thanmidsize and small hospitals in rural settings to useinternal committees.Teaching hospitals were morelikely to use combined external/internal
committees. Government, not-for-profit, andurban hospitals were more likely than for-profithospitals to use a designated staff person.Teachinghospitals were more likely than non-teachinghospitals to use a designated staff person to create
*Significance level, p<.05.Source: HRET, 2006.
T A B L E 4
Using Census Data and Collecting InformationFrom Patients Varies by Hospital Type
Use CensusData (%)
CollectInformation
from Patients(%)
Hospital Ownership
Government (Nonfederal) 41* 38*
Not-for-Profit 52 48
Private-for-Profit (InvestorOwned)
33 52
Size
Small 38* 36*
Medium 52 50
Large 64 64
Urban/Rural Status
Rural 38* 32*
Urban 55 56
Census Region
Northeast 60* 51
South 39 45
Midwest 42 42
West 62 52
Teaching Status
Non-Teaching 45* 41*
Teaching 58 66
System Member
Yes 45 48
No 51 43
Critical Access Hospitals 38* 25*
Sole Community Hospitals 42 34*
Rural Referral Center 44 40

6
policies and procedures for language services. Large,not-for-profit, and urban hospitals and those withteaching/residency training programs were morelikely than other hospitals to use language servicesdepartments to create policies and procedures.We asked hospitals to identify the types of
resources available to them for providing languageservices and the frequency of resource use. Figures3A and 3B show the results.Telephonic serviceswere the most cited resource available forproviding language services.The frequency ofresource use was based only on those respondents
0 10 20 30 40 50 60 70
F I G U R E 2
Approaches Used to Create Policies and Procedures to Provide Language Services
Hospital management
Designated staff person
Internal committee
Language services department
Other
Combined external/internal committee
Do not know
66%
37%
31%
21%
13%
11%
2%
Does not total 100% – respondents were asked to check “all that apply.”
0 20 40 60 80 100
F I G U R E 3 A
Resources and Methods Available for Providing Language Services
Staff interpreters
Independent freelance interpreters
External interpretation agencies
Bilingual clinical staff
Bilingual nonclinical staff
Community language bank
Telephonic services
68%
63%
66%
82%
74%
18%
92%
Percents are based upon respondents for whom the resource is available.
F I G U R E 3 B
Staff interpreters
Independent freelance interpreters
External interpretation agencies
Bilingual clinical staff
Bilingual nonclinical staff
Community language bank
Telephonic services
82%
57%
65%
77%
70%
46%
77%
Does not total 100% – respondents were asked to check “all that apply.”Percents are based upon respondents for whom the resource is available.
Frequency of Resource Use
0 20 40 60 80 100
Source: HRET, 2006.
Source: HRET, 2006.
Source: HRET, 2006.

7
who indicated that the resource was available.Themost cited method used was staff interpreters.Table 5 shows the types of resources available tohospitals for providing language services byhospital characteristics.
Staff interpretersFor-profit, urban, and teaching hospitals and thosein the western region of the country and systemmembers indicated greater availability of staffinterpreters compared to other hospitals. Of thethree types of rural hospitals, sole community
T A B L E 5
Resources Available to Hospitals for Providing Language Services by Hospital Characteristics and Region (%)
StaffInterpreters
FreelanceInterpreters
InterpretationAgencies
BilingualClinical Staff
BilingualNonclinical
Staff
CommunityLanguage
bankTelephonic
Hospital Ownership
Government (Nonfederal) 69* 57 51* 77* 69 14* 84*
Not-for-Profit 65 66 70 82 74 17 93
Private-for-Profit (Investor Owned) 82 61 76 91 80 35 90
Size
Small 65 60 52* 68* 59* 19 83*
Medium 68 64 73 90 82 17 96
Large 76 70 85 97 93 16 99
Urban/Rural Status
Rural 63* 60 46* 70* 57* 18 85*
Urban 71 66 79 90 85 18 95
Census Region
Northeast 69* 62 73 93* 85* 14 95*
South 73 64 61 86 80 19 85
Midwest 55 66 68 66 53 18 93
West 82 58 63 93 89 20 93
Teaching Status
Non-Teaching 66* 61* 61* 79* 70* 18 89*
Teaching 76 73 87 96 90 18 99
System Member
Yes 71 66 73* 83 74 21* 94*
No 65 61 59 79 74 15 87
CAH 54* 57* 44* 57* 45* 18 80*
SCH 75 53* 42* 77 70 16 91
RRC 65 71 52* 82 82 15 91
*Significance level, p<.05.Percents are weighted using hospital weights.CAH – Critical Access Hospital; SCH – Sole Community Hospital; RRC – Regional Referral Center.Freelance interpreters are hired by hospitals as independent contractors to provide language services. They are not employees of an interpretation agency. Interpretationagencies are external organizations that provide interpreter services to hospitals. Community language bank consists of a group of bilingual individuals who provideinterpreter services to a variety of organizations within a community, typically on a volunteer basis.Source: HRET, 2006.

hospitals were the most likely to have staffinterpreters.
Freelance InterpretersTeaching hospitals and regional referral centerswere more likely to indicate the availability offreelance interpreters. Critical access hospitals were
the least likely to indicate availability of freelanceinterpreters.
Interpretation AgenciesLarge, teaching, and urban hospitals and systemmembers were more likely to indicate availabilityof interpretation agencies. Critical access hospitals,sole community hospitals, and regional referralcenters were less likely to indicate availability ofinterpretation agencies.
Bilingual Clinical StaffFor-profit, large, urban, and teaching hospitals andhospitals in the northeast and the western regionsof the country were more were more likely toindicate availability of bilingual clinical staff.Critical access hospitals were the least likely toindicate availability of bilingual clinical staff.
Bilingual Nonclinical StaffLarge, urban, and teaching hospitals and those inthe western region of the country were morelikely to indicate availability of bilingual
8
F I G U R E 4
Degree of Difficulty in Providing Language Services Off-hours
Very difficult . . . . . . . . . . . . . . . . . . . . . . . . . . . . . . . . 7%Somewhat difficult . . . . . . . . . . . . . . . . . . . . . . . . . 22%About the same as during the week . . . . . . . . 27%Somewhat easy . . . . . . . . . . . . . . . . . . . . . . . . . . . . . 9%Very easy . . . . . . . . . . . . . . . . . . . . . . . . . . . . . . . . . . 21%
27%
22%
9%
21%7%
T A B L E 6
Percentage of Hospitals Receiving DirectReimbursement for Language Services
by Hospital Characteristics
% HospitalsReceiving
Reimbursement
TOTAL 3
Hospital Ownership
Government (Nonfederal) 2
Not-for-Profit 5
Private-for-Profit (Investor Owned) 0
Size
Small 2
Medium 5
Large 5
Urban/Rural Status*
Rural 1
Urban 5
Census Region*
Northeast 11
South .9
Midwest 2
West 4
Teaching Status*
Non-Teaching 2
Teaching 10
System Member
Yes 3
No 4
CAH* 2
SCH 1
RRC 0
*Significance level, p<.05.Percents are weighted using hospital weights.CAH – Critical Access Hospital; SCH – Sole Community Hospital;RRC – Regional Referral Center.Source: HRET, 2006.
Source: HRET, 2006.

9
nonclinical staff. Critical access hospitals were theleast likely to indicate availability of bilingualnonclinical staff.
Community Language BankFor-profit hospitals and system members weremore likely to indicate availability of a communitylanguage bank.
Telephonic ServicesLarge, not-for-profit, urban, and teaching hospitals,and system members in the northeast region of thecountry were more likely to indicate availability oftelephonic services. Critical access hospitals wereleast likely to indicate availability of telephonicservices but still indicated availability at high levels(83%). Overall, telephonic services were the mostcommonly available resource, and communitylanguage banks were the least available resource.
3. Providing Language Services Off-hours We asked hospitals if they provide languageservices during off-hours (i.e., 24 hours a day,7 days per week) and 88% of hospitals responded“yes.” However, critical access hospitals and solecommunity hospitals were less likely than other
hospitals to provide language services during off-hours (CAH 76%, SCH 85%). But 96% of ruralreferral centers indicated that they provided languageservices during off-hours. Figure 4 shows the degreeof difficulty hospital respondents perceived inproviding language services off-hours.Twenty-ninepercent (29%) indicated it was difficult to providelanguage services 24 hours a day, 7 days per week.
4. Covering the Cost of Language ServicesVirtually all hospitals are required by law toprovide language services to patients with LEP, andthey are prohibited from asking patients to pay forthese services. But a very small percentage receiveddirect reimbursement for providing languageservices, as indicated in Figure 6.The first pie chartshows that only 3% of hospitals received directreimbursement for language services.The secondpie chart, based upon the 3% that indicatedreceiving reimbursement, shows the sources ofdirect reimbursement. Medicaid was the largestsource of direct reimbursement (78%) whileprivate payers were the smallest source (2%).Table 6 shows the percentage of hospitals receivingdirect reimbursement by hospital characteristics.
0 10 20 30 40 50 60
F I G U R E 5
How Hospitals Pay for Language Services
Per-hour charges
Subscription or retainer to external agency
Hospital funds staff to provide language services
Other
Do not know
Annual or monthly support payment(e.g., to language bank or volunteer service)
57%
33%
22%
17%
6%
4%
Does not total 100% – respondents were asked to check “all that apply.”
Source: HRET, 2006.

Large and medium-sized hospitals were significantlymore likely to get reimbursement than smallhospitals. Urban, teaching, and hospitals in thenortheast were more likely to receive reimbursementfor language services compared to other hospitals.
Figure 5 shows how hospitals pay for languageservices.The most frequent response (57%) wasthrough “per-hour charges,” which means thathospitals contract with or pay externalinterpretation agencies for freelance interpreters on a per-hour basis for language services.This isdifferent from paying external agencies through aretainer or subscription mechanism, which 33% ofthe respondents indicated using.
We wanted to know the aggregate annual cost tohospitals for providing language services and foundthat a large percentage (41%) could not providethis information. Because hospitals are not directly
10
reimbursed for providing language services, mostdo not have a specific line item in their budget totrack these costs. It is likely that they spread thecosts over a variety of departments, making itdifficult to identify what is actually spent onlanguage services on an annual basis.
5. Need for Tools and ResourcesWe asked hospitals about the types of barriers theyface in providing language services.As illustrated inFigure 7, the most commonly cited barrier was theinability of staff to identify patients who needlanguage services, before they arrive at the hospital(53%), followed by concerns over cost andreimbursement for providing language services(48%). Hospitals found it more difficult to obtaincommunity-level data than obtaining informationfrom patients about the primary language theyspeak.As illustrated in Figure 8, 18% of hospitalsfound it difficult to obtain information directly
F I G U R E 6
Percent of Hospitals Receiving Direct Reimbursement for Language Services
Hospitals receiving direct reimbursementYes. . . . . . . . . . . . . . . . . . . . . . . . . . . . . . . . . . . . . . . . . . 3%No . . . . . . . . . . . . . . . . . . . . . . . . . . . . . . . . . . . . . . . . . 86%Do not know. . . . . . . . . . . . . . . . . . . . . . . . . . . . . . . 11%
3%
11%86%
Percentage of direct sources of reimbursementMedicaid. . . . . . . . . . . . . . . . . . . . . . . . . . . . . . . . . . . 78%Private payers . . . . . . . . . . . . . . . . . . . . . . . . . . . . . . . 2%Other . . . . . . . . . . . . . . . . . . . . . . . . . . . . . . . . . . . . . . 34%Do not know . . . . . . . . . . . . . . . . . . . . . . . . . . . . . . . . 2%
Does not total 100% – respondents were asked to check “all that apply.”
Percentages are based upon 3% of participants who indicatedreceiving direct reimbursement.
2%34%
78%
Source: HRET, 2006.

11
from patients. In contrast, almost double of thatpercentage (33%) found it difficult to obtaincommunity-level data (Figure 9).
6. Tools and Training That Hospitals Would Find Useful in Providing Language ServicesMany hospitals identified the need for tools and
training for hospital staff that would be useful inproviding language services. Fifty-eight (58%)indicated that packaged in-service training programswould be a helpful tool. In addition, 50% believedmodel approaches/promising practicesdemonstrated by other health care institutionsserving LEP patients would also be useful (Figure 10).
0 10 20 30 40 50 60
F I G U R E 7
Barriers That Hospitals Face in Providing Language Services
Staff have no means of identifying patients who needlanguage services before they arrive at the hospital
Cost/reimbursement concerns
Lack of tools and training resources
Other barriers
Lack of community-level data
Staff feel uncomfortable asking patients to provideinformation about their primary language
53%
48%
41%
39%
27%
11%
Does not total 100% – respondents were asked to check “all that apply.”
F I G U R E 8
0 5 10 15 20 25 30 35
Degree of Difficulty Hospitals Experience in Obtaining Information From Patients About the Primary Language They Speak
Very difficult
Somewhat difficult
Neither difficult nor easy
Somewhat easy
Very easy
Do not know
2%
16%
22%
33%
24%
3%
Source: HRET, 2006.
Source: HRET, 2006.

12
Hospitals identified that specific training on thecollection and use of data would be helpful. Inaddition, 79% of respondents indicated thattraining on how to respond to patients/familymembers who do not speak English wouldfacilitate providing language services, as wouldcultural competency training (77%) (Figure 11).
Though a larger number of hospitals maintaininformation about patients’ primary language inmedical records, far fewer maintain a database of patients’ primary languages that can be trackedover time. It may be that hospitals with ElectronicMedical Records (EMR) are the ones that are ableto track patients’ primary language over time but,in this survey, we did not ask about whetherhospitals had EMR (Figure 12).
0 10 20 30 40 50 60
F I G U R E 1 0
Tools That Hospital Staff Would Find Useful for Providing Language Services
Packaged in-service training programs
Model approaches/promising practices
Self-assessment tools
Sample case studies
58%
50%
44%
30%
Does not total 100% – respondents were asked to check “all that apply.”
0 5 10 15 20 25
Degree of Difficulty Hospitals Experience in Obtaining Community-level Data to Design Language Services Programs
Very difficult
Somewhat difficult
Neither difficult nor easy
Somewhat easy
Very easy
Do not know
Not applicable
9%
24%
21%
13%
6%
11%
16%
F I G U R E 9
Source: HRET, 2006.
Source: HRET, 2006.

13
7. Engagement in Initiatives to ImproveLanguage ServicesWe asked hospitals whether they were currentlyengaged in any specific initiative focused onimproving access to language services and whethersuch engaged hospitals would be willing to share
information regarding these initiatives (Figure 13).Thirty-three percent (33%) responded that theywere engaged in some type of initiative, and 72%of these hospitals indicated that they would bewilling to share information.
0 10 20 30 40 50 60 70 80
F I G U R E 1 1
Training That Hospital Staff Would Find Useful for Providing Language Services
How to respond to patients/familymembers who do not speak English
Cultural competency training
How to use data
How to collect primary language information from patients
79%
77%
45%
42%
Does not total 100% – respondents were asked to check “all that apply.”
F I G U R E 1 2
Tracking Patients’ Primary Language
Percentage of hospitals that maintain informationabout patients’ primary language in medicalrecords
Yes . . . . . . . . . . . . . . . . . . . . . . . . . . . . . . . . . . . . . . . . 66%No . . . . . . . . . . . . . . . . . . . . . . . . . . . . . . . . . . . . . . . . . 24%Do not know. . . . . . . . . . . . . . . . . . . . . . . . . . . . . . . 10%
24%
66%
Percentage of hospitals that maintain a databaseof patients’ primary language that can betracked over time
Yes . . . . . . . . . . . . . . . . . . . . . . . . . . . . . . . . . . . . . . . . 38%No . . . . . . . . . . . . . . . . . . . . . . . . . . . . . . . . . . . . . . . . . 47%Do not know. . . . . . . . . . . . . . . . . . . . . . . . . . . . . . . 13%
38%
47%
10% 13%
Source: HRET, 2006.
Source: HRET, 2006.

14
8. Comparing LEP Needs and LanguageServices Provision Among Hospitals in LEPGrowth States and Non-LEP Growth StatesTo determine whether hospitals in LEP growthstates differ from those in non-LEP growth stateswith respect to LEP needs and their ability toprovide language services, we compared answers toa subset of survey questions.Table 7 shows that thefrequency with which hospitals encounter LEPpatients is identical between hospitals in LEPgrowth and non-LEP growth states (79%).Similarly, there is no difference between the twogroups with regard to the difficulty in providinglanguage services off-hours. However, fewerhospitals in LEP growth states (86%) offerlanguage services around the clock compared tohospitals in non-LEP growth states (92%).
The sources of information hospitals use to assessthe language needs in a community vary betweenLEP growth and LEP non-growth states (Table 8).More hospitals in non-LEP growth states rely oncensus data and information from a community
needs assessment compared to hospitals in LEPgrowth states.The use of data from localcommunity organizations, patients themselves, andother sources does not differ with respect to LEPgrowth status.
Although the availability of resources used toprovide language services does not varysignificantly between hospitals in LEP growth andLEP non-growth states, telephonic services weremost readily available for both groups as shown inTable 9 (89% and 92%, respectively) followed bybilingual clinical staff (71% and 86%).
IV. METHODSThe Health Research and Educational Trust(HRET) conducted a survey in 2005-2006 tocollect information about patient language servicesin hospitals.We identified hospitals from the 2004American Hospital Association Annual SurveyDatabase.All general medical and surgical hospitalswithin the United States were eligible.The samplewas drawn to ensure a variety of hospitals including:
F I G U R E 1 3
Hospitals Engaged in Initiatives to Improve Language Services
Percentage of hospitals engaged in initiatives
Yes . . . . . . . . . . . . . . . . . . . . . . . . . . . . . . . . . . . . . . . . 33%No . . . . . . . . . . . . . . . . . . . . . . . . . . . . . . . . . . . . . . . . . 62%Do not know . . . . . . . . . . . . . . . . . . . . . . . . . . . . . . . . 4%
62%
33%
Percentage of hospitals willing to shareinformation about their initiatives
Yes . . . . . . . . . . . . . . . . . . . . . . . . . . . . . . . . . . . . . . . . 72%No . . . . . . . . . . . . . . . . . . . . . . . . . . . . . . . . . . . . . . . . . 10%Do not know. . . . . . . . . . . . . . . . . . . . . . . . . . . . . . . 18%
72%
18%
4%
10%
Source: HRET, 2006.

15
• Hospitals in states that had experienced morethan a 100% growth in their LEP populationsbetween 1990 and 2000
• Hospitals in large urban areas with diversepopulations
• Rural hospitals with a focus on examiningcritical access hospitals, sole communityhospitals, and rural referral centers
T A B L E 7
Hospitals in States With Over 100% Growth in Their LEP Populations Between 1990 and 2000 Compared to Hospitals in Non-LEP Growth States
Hospitals in Encounter LEP patientsmonthly, weekly, or daily
Offer language services 24 hours/day, 7days/week
Find it difficult to providelanguage services off-hours
LEP Growth States 79% 86%* 35%
Non-LEP Growth States 79% 92% 36%
*Significance level, p<.05.Percents are weighted using hospital weights.Hospitals in LEP growth states encounter LEP patients with about the same frequency as all hospitals that participated in the survey (79% of hospitals in LEP growth states
and 80% of all hospitals).Source: HRET, 2006.
T A B L E 8
Sources of Information Used by Hospitals to Assess the Language Needs of the Communities They Serve
Hospitals in Censusdata
Local communityorganizations
Communityneeds
assessment
Collect frompatients
Other Do not know
LEP Growth States 42%* 28% 18%* 42% 6% 4%
Non-LEP GrowthStates 50% 33% 25% 47% 5% 4%
*Significance level, p<.05.Percents are weighted using hospital weights.Source: HRET, 2006.
T A B L E 9
Resources Available to Hospitals for Providing Language Services
Hospitals in Staffinterpreters
Independentfreelance
interpreters
Externalagencies
Bilingualclinical staff
Bilingual nonclinical
staff
Communitylanguage
bank
Telephonicservices
LEP Growth States 63% 69% 61% 71% 63% 21% 89%
Non-LEP Growth States 70% 61% 67% 86% 77% 16% 92%
Percents are weighted using hospital weights.Source: HRET, 2006.

HRET surveyed 1,983 hospitals. In total, 861hospitals responded to the survey resulting in a43% response rate. Hospital-based respondentscompleted the survey either by paper questionnaireor electronically via the Internet.The surveyconsisted of 21 questions covering the languageneeds of the populations served, resources used,and the types of tools, resources, and other supporthospitals could use to support language services.The survey cover letter requested that individualswho were most knowledgeable about theprovision of language services in the hospitalcomplete the survey. Individuals with diverse titlesin various departments responded to the survey.Respondents included individuals from interpreterservices, quality and risk management, humanresources, social services, and hospital administrationdepartments. Respondents held titles such as chiefexecutive officer, chief nursing officer, director ofcustomer relations, patient advocate, director ofplanning and business development, andcompliance officer.
V. STATISTICAL ANALYSISWe used sampling weights in the analysis to takeinto account the sampling design. For this study,we used a stratified sample design to create stratabased upon specific demographic characteristicsfrom which hospitals were then selected.Theweights represent the ratio between the stratum-specific selection probabilities in the totalpopulation and in the final sample of respondents.For example, we oversampled a number of stateswith high LEP growth (defined as 100% growth inthe LEP population between 1990-2000),therefore we weighted the results to correct forthis oversampling.
We conducted descriptive and bivariate analyses ofthe data. In order to identify characteristicsassociated with provision of language services in
hospitals, we examined the following hospitalcharacteristics: region of the country, hospital size,teaching status, system membership, hospitalownership, and urban/rural status. For ruralhospitals we examined critical access hospitals, solecommunity hospitals, and rural referral centers.The characteristics are described below.
Hospital characteristics in this survey were derivedfrom the 2004 American Hospital Association’sAnnual Survey Database of health care providers,which was the most recent version available at thetime of this survey. Below we describe AHA’sdefinitions and categories for each of thesecharacteristics. In some instances, we modified theAHA categories for reporting purposes.We clearlyidentify the types of modifications we made.
VI. HOSPITAL CHARACTERISTICS1. RegionHospital region is defined in the AHA database as
New England (Maine, New Hampshire,Vermont,Massachusetts, Rhode Island and Connecticut),Mid Atlantic (New York, New Jersey, andPennsylvania), South Atlantic (Delaware, Maryland,District of Columbia,Virginia,West Virginia,North Carolina, South Carolina, Georgia, andFlorida), East North Central (Ohio, Indiana,Illinois, Michigan, and Wisconsin), East SouthCentral (Kentucky,Tennessee,Alabama, andMississippi),West North Central (Minnesota, Iowa,Missouri, North Dakota, South Dakota, Nebraska,and Kansas),West South Central (Arkansas,Louisiana, Oklahoma, and Texas), Mountain(Montana, Idaho,Wyoming, Colorado, NewMexico,Arizona, Utah, and Nevada), and Pacific(Washington, Oregon, California,Alaska, andHawaii).
We modified these categories to the following:Northeast, Midwest, South, and West.
16

17
2. Hospital Size Based Upon Number of BedsThe number of beds is used to determine hospitalsize:• 6-24 beds• 25-49 beds• 50-99 beds• 100-199 beds• 200-299 beds• 300-399 beds• 400-499 beds• 500 or more beds
We modified the above categories and definedhospitals by size using the following criteria:• Small hospitals: 0-99 beds• Medium hospitals: 100-299 beds• Large hospitals: 300 or more beds
3. Teaching StatusThe hospital is considered a teaching hospital if itis a member of the Council of Teaching Hospitalsof the American Medical Association or if it hasresidency training approval by the AccreditationCouncil for Graduate Medical Education.
4. System MembershipSystem hospitals are part of a corporate body thatowns, leases, religiously sponsors, or manageshealth provider facilities. Freestanding hospitals areindividually owned and operated.
5. Hospital Ownership (Control)Hospital ownership is captured in one of threecategories: government (public), not-for-profit, andfor-profit.1. Government (public) hospitals are nonfederal
hospitals that are controlled by an agency ofstate, county, city, city-county, or hospitaldistrict or authority.
2. Not-for-profit hospitals are church-operated orother not-for-profit.
3. For-profit hospitals are owned by individual,partnership, or corporation investors.
6. Urban/Rural StatusIf a hospital is located in a Metropolitan StatisticalArea (MSA), then it is an urban hospital. If is notlocated in a MSA, then it is designated as a ruralfacility.
7. Medicare’s Special Rural Designations1. Critical access hospitals: These facilities have no
more than 15 inpatient beds, offer 24-houremergency care, and are located more than a35-mile drive from any other hospital.They arereimbursed based on what they spend for eachpatient, rather than on the average expectedcost for specific diagnoses that most hospitalsare paid.
2. Sole community hospitals: These facilities serve asthe sole source of inpatient care in a community,either because they are geographically isolated,or because severe weather conditions or localtopography prevents travel to another hospital.They can be paid higher rates based on theirown previous costs.
3. Rural referral centers: These facilities are locatedin rural areas, have 275 or more beds, andprovide services primarily to Medicarebeneficiaries, 60% of whom live more than 25 miles from the hospital.At least 50% ofthese beneficiaries are referred from otherhospitals or physicians who are not on the staffof the hospital. Rural referral centers receivehigher pay to assist in caring for low-incomepatients and can more easily qualify for higherpayments based on nearby urban wage rates.
VII. ConclusionEvidence shows that effective communicationbetween patients and clinicians is a criticalcomponent of providing high-quality health care.When communication is compromised bylanguage barriers, the quality of care is alsocompromised. Consequently, providing individualswith LEP the means to communicate effectively

18
with their health care providers is critical toimproving their experience in the health caresetting, the quality of care they receive, and theirhealth outcomes.As racial and ethnic diversity inthe United States continues to increase, so does the demand for appropriate and effective languageservices.With 80% of hospitals encounteringindividuals with LEP frequently, and only 3%receiving direct reimbursement for providinglanguage services, the question and challenge
are:Who will pay for these services? Hospitals that commit to providing high-quality languageservices to their patients likely will be rewardedwith greater patient and staff satisfaction, whichcan provide them with a competitive advantage as the demographics of the United States continueto change. Resources should be targeted towardmonitoring and improving language services for all patients with LEP.

19
R E S O U R C E S A N D T O O L S
American Hospital Association (AHA)AHA key issue page on racial and ethnic disparities
provides a wide variety of resources for hospitals
from AHA and other sources including self-
assessments, case examples, and tools to address
cultural competency and the elimination of racial
and ethnic disparities.
http://www.aha.org/aha_app/issues/Disparities/
index.jsp
Health Research and Educational Trust (HRET)HRET is the research and educational affiliate of the
AHA. The HRET Web site provides information about
HRET’s research on racial and ethnic disparities in
health care; collecting race, ethnicity, and primary
language data; and linking data to quality of care
measures.
http://www.hret.org
HRET Disparities ToolkitThe toolkit is designed to help hospitals and health
systems, community health centers, health plans,
and other potential users in understanding the
importance of accurate data collection, assessing
organizational capacity to do so, and implementing
a framework designed specifically for obtaining
information from patients/enrollees about their race,
ethnicity, and primary language efficiently,
effectively, and respectfully.
http://www.hretdisparities.org
Institute for Diversity in Health Management(IFD)The Institute works to promote greater racial and
ethnic diversity in the management and executive
ranks of health care organizations, cosponsors
studies in this area, supports a minority internship
program, and presents employment opportunities
through its Internet site.
http://www.diversityconnection.org/
Joint Commission on Accreditation ofHealthcare Organizations (JCAHO)JCAHO works to continuously improve the safety and
quality of care provided to the public through the
provision of health care accreditation and related
services that support performance improvement in
health care organizations. Visit the Web site below
for information about its “Hospital, Language, and
Culture” project.
http://www.jointcommission.org/ HLC/
Resources_Standards.htm
National Health Law Program (NHeLP)The National Health Law Program is a national public
interest law firm that seeks to improve health care
for America’s working and unemployed poor,
minorities, the elderly, and people with disabilities.
Its language access Web page includes a variety of
information, reports, and resources.
http://www.healthlaw.org/
White Coats and Many Colors: PopulationDiversity and Its Implications for Health Care Issue briefing report by Emily Friedman
The report focuses on how the United States
population is becoming more diverse racially and
ethnically and how these changes are occurring in
areas of society other than those traditionally
associated with diversity. Two sectors are always
affected first: health care and education.
http://www.aha.org/aha/content/2005/pdf/
WhiteCoatsManyColors.pdf
i U.S. Bureau of the Census, American Community Survey (2005)Language Spoken at Home (Table S1601), available athttp://factfinder.census.gov. See also Institute of Medicine, UnequalTreatment: Confronting Racial and Ethnic Disparities in Health Care at70-71 (2002) (reporting that more than one in four Hispanicindividuals in the U.S. live in language-isolated households where noperson over age 14 speaks English “very well,” over half of Laotian,Cambodian, and Hmong families are in language-isolatedhouseholds, as well as 26%-42% of Thai, Chinese, Korean, andVietnamese).
ii See U.S. Bureau of Census, American Community Survey (2005), Age byLanguage Spoken at Home by Ability to Speak English for the Population5 Years and Over (Table 16004) available at http://factfinder.census.gov.
iii Ibid.
iv Kaiser Commission on Medicaid and the Uninsured, Caring forImmigrants: Health Care Safety Nets in Los Angeles, New York, Miami,and Houston at ii-iii (Feb. 2001) (prepared by Leighton Ku and AlyseFreilich, The Urban Institute, Washington, DC). See also Institute ofMedicine, Unequal Treatment: Confronting Racial and Ethnic Disparitiesin Health Care 71–72 (2002) (describing recent survey finding that51% of providers that believed patients did not adhere to treatmentbecause of culture or language, but 56% reported no culturalcompetency training).
v For the purposes of this document,“providers” includes health careinstitutions such as hospitals and nursing homes; managed careorganizations; insurers; and individual clinicians and practitioners.
vi The Access Project.“What a Difference an Interpreter Can Make.” April2002.
vii Weech-Maldonado, R, Morales, LS, Elliot, M, Spritzer, K, Marshall, G, andHays, RD. “Race, Ethnicity, Language, and Patients’ Assessments ofCare in Medicaid Managed Care.” Health Services Research 38(3). June2003.
viii Timmins, CL.“The Impact of Language Barriers on Health Care ofLatinos in the United States: A Review of the Literature andGuidelines for Practice.” Journal Of Midwifery and Women’s Health.Vol. 47(2). 80-96. March/April 2002.
ix National Health Law Program and The Access Project, LanguageServices Action Kit: Interpreter Services in Health Care Settings forPeople with Limited English Proficiency. 2004. www.healthlaw.org.
x Ethical Force Program Oversight Body. Improving Communication-Improving Care: How health care organizations can ensure effective,patient-centered communication with people from diverse populations.Chicago, IL: The Institute for Ethics at the American MedicalAssociation. June 2006.
xi Ibid.
20
R E F E R E N C E S


One North Franklin | Chicago, Illinois 60606 | 312.422.2600 | www.hret.org