Embed Size (px)
Citation preview
HORTICULTURAL ENTOMOLOGY
Impact of Insecticide Efficacy on Developing Action Thresholds forPest Management: A Case Study of Onion Thrips (Thysanoptera:
Thripidae) on Onion
BRIAN A. NAULT1 AND ANTHONY M. SHELTON
Department of Entomology, New York State Agricultural Experiment Station, Cornell University, 630 W. North Street,Geneva, NY 14456
J. Econ. Entomol. 103(4): 1315Ð1326 (2010); DOI: 10.1603/EC10096
ABSTRACT An action threshold (AT) is one of the most important decision-making elements inintegrated pest management. Unlike economic thresholds, ATs are not typically derived from aneconomic injury level model, but they are more commonly used. ATs may be identiÞed fromresearch-based, pestÐcrop relationships, but they also may be based on experience. ATs may beadjusted depending on, e.g., weather and plant variety, but modifying ATs to accommodate differencesin insecticide efÞcacy has received little attention. To examine this point, several combinations of ATsand insecticides were evaluated against onion thrips, Thrips tabaci Lindeman (Thysanoptera: Thripi-dae), a major pest of onion (Allium cepa L.). Studies were conducted in New York onion Þelds from2006 to 2008 by using registered insecticides for T. tabaci on onions. We hypothesized that the mostefÞcacious insecticides would provide acceptable control of thrips populations regardless of AT (one,three, and Þve thrips per leaf), whereas less effective products would only control populations usingthe lowest AT (one thrips per leaf). Results indicated that T. tabaci infestations were managedeffectively when spinetoram was applied after a three larvae per leaf threshold, but not when usinglambda-cyhalothrin, methomyl or formetanate hydrochloride. However, T. tabaci infestations weremanaged well when methomyl and formetanate hydrochloride were applied after a one larva per leafthreshold. T. tabaci infestations were never controlled using lambda-cyhalothrin, regardless of the ATused. None of the products reduced T. tabaci populations to an acceptable level when applied at a Þvelarvae per leaf threshold. Implications of adjusting ATs based on efÞcacy of different insecticides arediscussed.
KEY WORDS Thrips tabaci, action threshold, insecticide, Allium cepa
More than 50 yr have passed since Stern et al. (1959)published their seminal article on the economic injurylevel (EIL) concept as a basis for integrated pestmanagement (IPM). The EIL is deÞned as the lowestpopulation density that will cause economic damage(Pedigo et al. 1986). Advancements in the theory andpractice of EILs in IPM have been described in severalprominent publications (Stone and Pedigo 1972; Nor-ton 1976; Poston et al. 1983; Pedigo et al. 1986; Onstad1987; Higley and Wintersteen 1992; Pedigo and Higley1992; Higley and Pedigo 1993, 1996; Peterson and Hunt2003). Over 225 articles on EILs were published by theearly 1990s (Peterson 1996), and many more havebeen published since, reßecting the importance of theEIL concept on IPM.
The EIL model most commonly referred to is EIL �C/VIDK, where C is cost of the management tactic, Vis the market value per production unit, I is injury unitsper pest, D is damage per injury unit, and K is theproportional reduction in the pest population (Pedigo
et al. 1986). Calculating EILs is difÞcult for manyreasons (Hammond 1996), but one of the most prob-lematic reason is describing and interpreting the re-lationship between crop yield loss and insect densityor feeding damage (components I and D) (Nault andKennedy 1998). Many factors can affect this relation-ship, including weather, crop variety, partial plantresistance, crop phenology, and the insect stage tar-geted (Ostlie and Pedigo 1985, Bystrak et al. 1994,Fournier et al. 1995, Rueda et al. 2007). Models havebeen used to resolve uncertainty in levels of param-eters in the EIL model (probabilistic EIL) (Petersonand Hunt 2003), and they have been modiÞed toconsider impacts of additional factors, such as theenvironment (environmental EIL; Higley and Win-tersteen 1992, Pedigo and Higley 1992, Higley andPedigo 1993), the potential control by natural enemies(Naranjo et al. 2002, Musser et al. 2006), esthetics(Sadof and Raupp 1986), and plant quality (Hutchins1986).
The economic threshold (ET) is a pest density orinjury level below the EIL. Curative control tactics are1 Corresponding author, e-mail: [email protected].
0022-0493/10/1315Ð1326$04.00/0 � 2010 Entomological Society of America
applied when pest densities or damage levels reach theET to prevent pest damage from reaching the EIL andcausing economic loss. For many of the reasons men-tioned above, calculating research-based ETs are asdifÞcult as determining EILs. The terms action thresh-old (AT) and ET are often used synonymously eventhough ATs are typically not derived from an EILmodel. Like ETs, ATs may be identiÞed from research-based Þeld trials that evaluate pest-crop relationships,but they also may be best estimates based on experi-ence. ATs generally do not include the full set ofcomplexities of an ET. In many situations, ATs aremore commonly available than ETs. This is especiallytrue in situations where future pest damage to a highvalue crop is far greater than the cost of the treatment.In addition, ATs may be developed in cases where itis too difÞcult, for example, to quantify future pricesof the commodity, yield loss, and damage by subse-quent generations.
In our experience as entomologists working in veg-etable IPM, it is common for crop consultants, exten-sion educators and growers to ask us to provide a pestdensity at which they should treat their crop. Yet,research-based ATs are not available for many of theserious arthropod pests that attack major vegetablecrops in the United States. Although we have notconducted a thorough literature review to illustratethe infrequency of ATs recommended for vegetableinsect pests, the two references below offer a reason-able representation of such literature. In VegetableInsect Management edited by Foster and Flood(2005), only 77 of 167 important arthropod pests arelisted as having ATs. Of these 77 pests, thresholds havebeen adjusted to account for differences in plant phe-nology (n � 19), variety (n � 13) and stage of theinsect targeted (n � 3). In Cornell UniversityÕs Inte-grated Crop and Pest Management Guidelines forCommercial Vegetable Production, only 35 of 79 tar-get arthropod pests of the primary vegetable crops orcrop groups listed have recommended ATs (Reinersand Petzoldt 2009). For these 35 pests, ATs have beenadjusted for differences in plant phenology (n � 8),variety (n� 6), and stage of the insect targeted (n�2). No ATs were modiÞed based on the efÞcacy of theinsecticide used to control the pest, nor are we awareof any such examples.
Recommendations for arthropod pest managementin vegetable crops are typically made with the expec-tation that a highly effective insecticide will be used.Because most vegetable crops are high in value, grow-ers are generally risk adverse and they rarely considerusing an insecticide or management activity unless itcontrols �90% of the pest population and protects thecrop from economic damage. Such highly efÞcaciouspractices Þt in well with the value K in most EILmodels because it is Þxed at 1.0 or 100% control. Yet,many factors can affect the efÞcacy of a potentiallyhighly effective insecticide including rate, applicationmethod and amount of coverage, stage and age of thepest, plant type and growth stage, timing, insecticideresistance, behavior of the pest, mortality by naturalenemies and weather. Many of these issues are critical
to consider when developing management strategiesfor thrips (Parrella and Lewis 1997), including one ofthe most serious thrips pests worldwide, the onionthrips,Thrips tabaciLindeman (Thysanoptera: Thripi-dae) (Lewis 1997).T. tabaci adults and larvae feed on onion leaves,
thereby compromising photosynthesis and water re-tention, often resulting in the production of smallerand less valuable bulbs. This insect also is a vector ofIris yellow spot virus (family Bunyaviridae, genus To-spovirus), which also may reduce bulb yield and couldadd another layer of complexity to the development ofan AT. Infestations of T. tabaci span 2 mo in mostonion-growing regions in North America (Cranshawet al. 2005), and as few as one and as many as 12 foliarapplications of insecticides may be used to mitigateeconomic loss (Stivers 1997). Some onion growers useATs to determine when to spray insecticides. In north-eastern North America, ATs of 0.9 and 2.2 thrips perleaf were recommended for drought and normal sea-sons, respectively (Fournier et al. 1995). In other lo-cations throughout North America, ATs reported varyfrom one thrips per plant in Texas (Edelson et al.1989), three thrips per leaf in Michigan (Quartey1982), 15Ð30 thrips per plant in Utah (Alston and Drost2008), and 30 per plant in California (Anonymous2002). Lower ATs are often recommended for thrips-susceptible varieties and for onions in the bulbingstage, whereas higher ATs are recommended for mod-erately tolerant varieties, young plants, and those nearmaturity (Cranshaw et al. 2005). In New York, an ATof three thrips per leaf was recommended (Shelton etal. 1987) when pyrethroids were Þrst introduced andthey provided excellent control.
Insecticides vary in their effectiveness against T.tabaci based on their inherent toxicity to this insect aswell as evolving resistance due to overdependence ona single insecticide or class of insecticides. In small-plot onion studies in New York in 2005 (Nault andHessney 2006) and 2007 (Nault and Hessney 2008b),potential and currently registered insecticides wereevaluated against onion thrips, and the following in-secticides were shown to reduce the T. tabaci infes-tation by a wide range of values relative to the un-treated control: lambda-cyhalothrin by only 20%(2005), acetamiprid by 50% (2005) and 38% (2007),oxydemeton-methyl by 54% (2007), methomyl by 59%(2005) and 68% (2007), spinosad by 84% (2005), andformetanate hydrochloride by 98% (2005) and 97%(2007). Spinetoram, the only highly effective productregistered in New York, reduced the population by95% (2005) and 97% (2007) relative to the untreatedcontrol.
Not all insecticides, even when newly introduced,probably provide the �90% mortality desired by grow-ers (Buntin 1986). Furthermore, their efÞcacy nor-mally declines over time because of the evolution ofinsecticide resistance. An example of this phenome-non is that management of T. tabaci in onion by usinginsecticides has become difÞcult in northeasternNorth America since the late 1990s. Although initiallyeffective, some populations of T. tabaci have devel-
1316 JOURNAL OF ECONOMIC ENTOMOLOGY Vol. 103, no. 4
oped some level of resistance to lambda-cyhalothrin,deltamethrin, and diazinon (Shelton et al. 2003,MacIntyre-Allen et al. 2005, Shelton et al. 2006). How-ever, the threat of resistance to other classes of insec-ticides has forced growers to use less effective insec-ticides as part of an insecticide resistance managementstrategy to preserve more effective insecticides. Thispresents problems when applications are timed usingthe three thrips per leaf threshold, which works wellfor spinetoram, but may not be appropriate for otherinsecticides that are less effective. When this occurs,growers have resorted to either using lower ATs (e.g.,one thrips per leaf) or ignoring thresholds altogetherand spraying on a weekly basis (B.A.N., personal ob-servation).
Onion growers are keenly interested in managingT.tabaci infestations in onion by using insecticides thatare applied according to research-based ATs. A singleAT is not likely to be appropriate for all insecticidesregistered for use on the onion crop, suggesting thatATs may have to be developed independently for eachinsecticide. For example, a lower AT (e.g., �1 thripsper leaf) might be appropriate for a mediocre-per-forming insecticide, whereas a higher AT (e.g., 3Ð5thrips per leaf) could work well for a highly effectiveproduct. To investigate this concept and its ramiÞca-tions, we compared levels of T. tabaci control by usinghighly effective and less effective insecticides appliedafter ATs ranging from one to Þve thrips per leaf. Ourhypothesis was that the most efÞcacious insecticideswould provide acceptable control of thrips infesta-tions regardless of threshold (one, three, and Þvethrips per leaf), whereas less effective products wouldonly provide control using the lowest threshold (onethrips per leaf).
Materials and Methods
Study Site and Experimental Design. Experimentswere conducted in commercial onion Þelds in thePotter Muck region of Yates County, NY. Dry bulbonion seeds were planted on 3 April 2006, 1 May 2007,and 16 April 2008. Cultivars were ÔBarrageÕ, ÔSedonaÕ,and ÔBGS 229� for the years above, respectively. Eachplot consisted of four 3.05-m-long onion rows, androws were spaced every 38 cm. Plots were separatedwithin rows by 0.9 m. Experimental sites were ßankedon all sides by at least 1.5 m of insecticide-free onionswithin the growerÕs Þeld. Onions in our studies wereprotected from onion maggot, Delia antiqua (Mei-gen), the only other insect pest of signiÞcance, by thenonsystemic insecticide seed treatment cyromazine(Trigard 75 WP). Diseases and weeds were controlledusing several pesticides recommended for onion pro-duction in New York (Reiners and Petzoldt 2009). T.tabaciwas not affected by these pesticide applicationsand onions were never irrigated.
Three insecticides (listed below) and three ATswere included in each year of this study. ATs includedone, three, and Þve T. tabaci larvae per leaf. Treat-ments included all combinations of insecticides andthresholds plus an untreated control (10 treatments
total). Treatments were arranged in a randomizedcomplete block design with four replications.Insecticides and Application Technique. Insecti-
cides chosen for this study were either registeredagainst T. tabaci on onions in New York or ones thatwe anticipated would soon be registered. In 2006 and2007, lambda-cyhalothrin (Warrior, Syngenta CropProtection, Greensboro, NC), methomyl (LannateLV, DuPont Crop Protection, Wilmington, DE), andformetanate hydrochloride (Carzol SP, Gowan Com-pany, Yuma, AZ) were chosen and expected to pro-vide mediocre, good, and excellent control ofT. tabaci,respectively. In 2008, methomyl, formetanate hydro-chloride and spinetoram (Radiant SC, Dow Agro-Sciences, Indianapolis, IN) were used as the leasteffective, moderately effective, and most efÞcaciousinsecticide, respectively. High recommended labeledrates for all products were used. Lambda-cyhalothrinwas applied at a rate of 33.5 g (AI) ha�1, methomyl at1,009 g (AI) ha�1, formetanate hydrochloride at 64.4 g(AI) ha�1, and spinetoram at 70 g (AI) ha�1. Appli-cations were made using a CO2-pressurized backpacksprayer equipped with a single-row boom and a singlenozzle. In 2006, the sprayer was calibrated to deliver842 liters ha�1 at 276 kPa through a ßat-fan nozzle(8004VS; TeeJet Harrisburg, Dillsburg, PA). In 2007and 2008, the sprayer was calibrated to deliver 393liters ha�1 at 276 kPa through a twin ßat-fan nozzle(TJ60Ð8004VS; TeeJet Harrisburg). All treatments in-cluded the nonionic surfactant Induce (HelenaChemical Co., Collierville, TN) at 0.5% (vol:vol).Sampling Thrips and Damage. T. tabaci is the dom-
inant thrips species that colonizes onion Þelds in NewYork (Gangloff 1999). T. tabaci population densitieswere monitored weekly throughout the season untilonions matured and �50Ð75% of the leaves hadlodged. The total number of thrips larvae per plant wascounted visually from 15 randomly selected plantswithin the center rows of each plot. Adults were notrecorded because they move between plots and theirpresence does not always reßect the efÞcacy of thetreatment. To determine the number of thrips perleaf each week, the number of green leaves per plantwas recorded each week by randomly sampling 20plants within the test site. T. tabaci voucher speci-mens are located in the Department of Entomologyat the New York State Agricultural Experiment Sta-tion in Geneva, NY.
In 2006 and 2007, plots were visually rated for thripsdamage using a scale ranging from 1 to 10: 1, nodamage; 2, 1Ð10% of the leaves were white as a con-sequence of feeding damage; 3, 11Ð20% damage; 4,21Ð35% damage; 5, 36Ð50% damage; 6, 51Ð65% dam-age; 7, 66Ð80% damage; 8, 81Ð90% damage; 9, 91Ð99%damage; and 10, complete damage (100% leaveswhite). An average rating of �2.0 was consideredcommercially acceptable. Visual ratings of damagewere made on 7 August 2006 and 31 August 2007. Nothrips damage ratings were made in 2008 because haildamaged plants near the end of the season and im-paired the ability to assess damage made only bythrips.
August 2010 NAULT AND SHELTON: IMPACT OF INSECTICIDES ON ACTION THRESHOLDS 1317
MakingControlDecisions Based onActionThresh-olds. Thrips population densities were estimated bycalculating the mean number of larvae per leaf acrossall four plots. If the mean reached or exceeded thetarget AT, all plots in the treatment were sprayed.Thrips sampling frequency occurred every 6Ð7 d. Ifthe mean thrips density for a treatment was within 0.1larva per leaf for a targeted threshold, a decision wasoften made to spray that treatment rather than waitinguntil the following week to make the decision. Sprayswere made the same day plots were sampled.Statistical Analyses.Mean densities of thrips larvae
per leaf over the entire season were calculated bydividing the total number of thrips per leaf by thenumber of sampling dates. Mean number of thrips perleaf per sampling date was the response variable andwas analyzed using regression analysis (PROCMIXED, SAS Institute 2008), which considered insec-ticide and AT as main effects and Þxed in the modeland replication as a random factor. All mean treatmentcomparisons were made using LSMEANS at P � 0.05(SAS Institute 2008). No transformations were neededto stabilize variance in these data sets.
Results
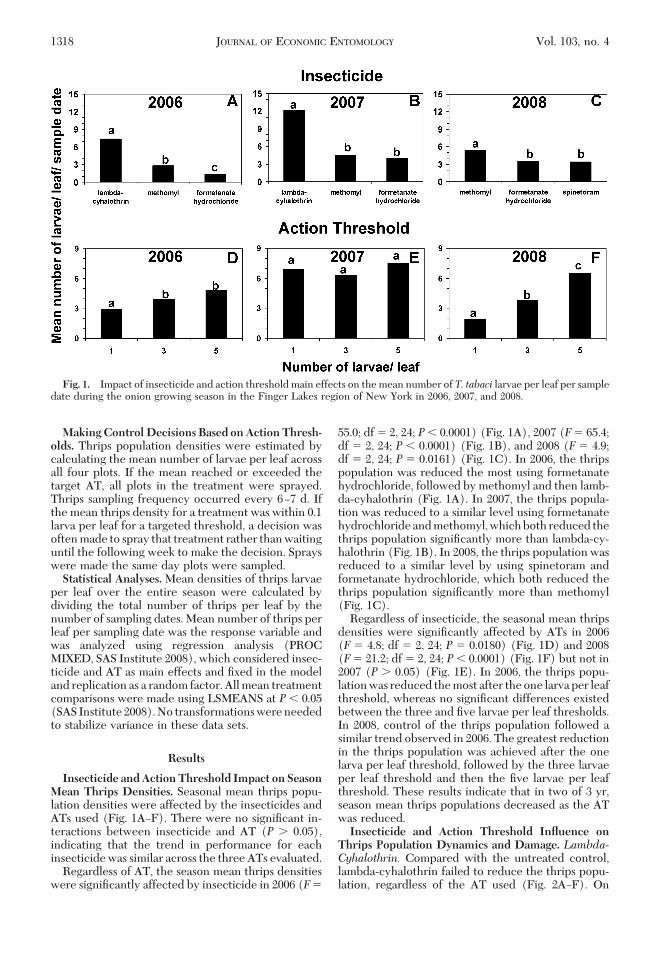
Insecticide andActionThreshold Impact on SeasonMean Thrips Densities. Seasonal mean thrips popu-lation densities were affected by the insecticides andATs used (Fig. 1AÐF). There were no signiÞcant in-teractions between insecticide and AT (P � 0.05),indicating that the trend in performance for eachinsecticide was similar across the three ATs evaluated.
Regardless of AT, the season mean thrips densitieswere signiÞcantly affected by insecticide in 2006 (F�
55.0; df � 2, 24; P� 0.0001) (Fig. 1A), 2007 (F� 65.4;df � 2, 24; P � 0.0001) (Fig. 1B), and 2008 (F � 4.9;df � 2, 24; P � 0.0161) (Fig. 1C). In 2006, the thripspopulation was reduced the most using formetanatehydrochloride, followed by methomyl and then lamb-da-cyhalothrin (Fig. 1A). In 2007, the thrips popula-tion was reduced to a similar level using formetanatehydrochlorideandmethomyl,whichboth reduced thethrips population signiÞcantly more than lambda-cy-halothrin (Fig. 1B). In 2008, the thrips population wasreduced to a similar level by using spinetoram andformetanate hydrochloride, which both reduced thethrips population signiÞcantly more than methomyl(Fig. 1C).
Regardless of insecticide, the seasonal mean thripsdensities were signiÞcantly affected by ATs in 2006(F � 4.8; df � 2, 24; P � 0.0180) (Fig. 1D) and 2008(F� 21.2; df � 2, 24; P� 0.0001) (Fig. 1F) but not in2007 (P � 0.05) (Fig. 1E). In 2006, the thrips popu-lation was reduced the most after the one larva per leafthreshold, whereas no signiÞcant differences existedbetween the three and Þve larvae per leaf thresholds.In 2008, control of the thrips population followed asimilar trend observed in 2006. The greatest reductionin the thrips population was achieved after the onelarva per leaf threshold, followed by the three larvaeper leaf threshold and then the Þve larvae per leafthreshold. These results indicate that in two of 3 yr,season mean thrips populations decreased as the ATwas reduced.Insecticide and Action Threshold Influence onThrips Population Dynamics and Damage. Lambda-Cyhalothrin. Compared with the untreated control,lambda-cyhalothrin failed to reduce the thrips popu-lation, regardless of the AT used (Fig. 2AÐF). On
Fig. 1. Impact of insecticide and action threshold main effects on the mean number of T. tabaci larvae per leaf per sampledate during the onion growing season in the Finger Lakes region of New York in 2006, 2007, and 2008.
1318 JOURNAL OF ECONOMIC ENTOMOLOGY Vol. 103, no. 4
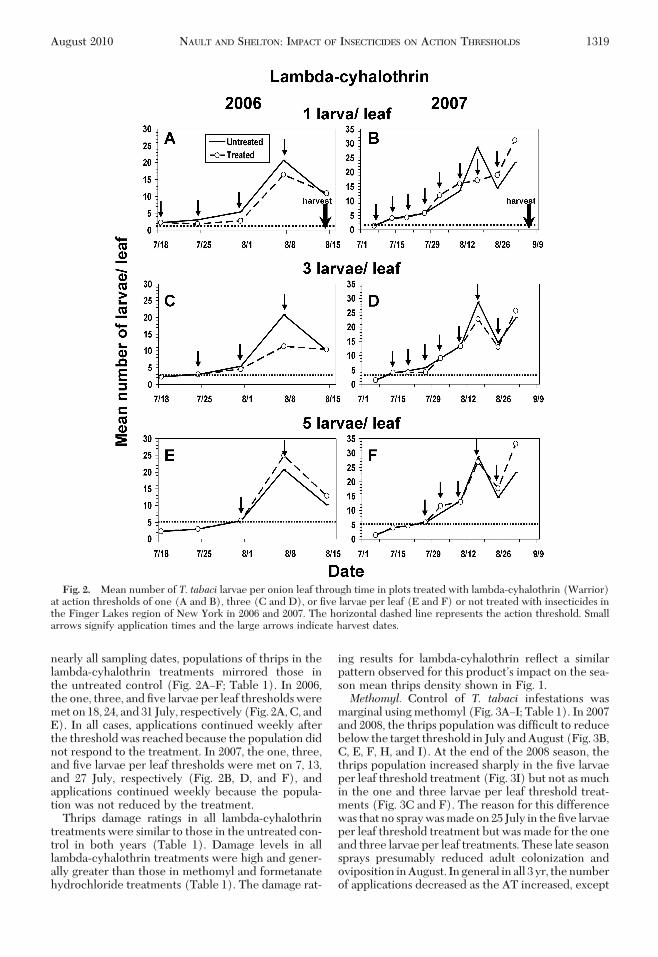
nearly all sampling dates, populations of thrips in thelambda-cyhalothrin treatments mirrored those inthe untreated control (Fig. 2AÐF; Table 1). In 2006,the one, three, and Þve larvae per leaf thresholds weremet on 18, 24, and 31 July, respectively (Fig. 2A, C, andE). In all cases, applications continued weekly afterthe threshold was reached because the population didnot respond to the treatment. In 2007, the one, three,and Þve larvae per leaf thresholds were met on 7, 13,and 27 July, respectively (Fig. 2B, D, and F), andapplications continued weekly because the popula-tion was not reduced by the treatment.
Thrips damage ratings in all lambda-cyhalothrintreatments were similar to those in the untreated con-trol in both years (Table 1). Damage levels in alllambda-cyhalothrin treatments were high and gener-ally greater than those in methomyl and formetanatehydrochloride treatments (Table 1). The damage rat-
ing results for lambda-cyhalothrin reßect a similarpattern observed for this productÕs impact on the sea-son mean thrips density shown in Fig. 1.Methomyl. Control of T. tabaci infestations was
marginal using methomyl (Fig. 3AÐI; Table 1). In 2007and 2008, the thrips population was difÞcult to reducebelow the target threshold in July and August (Fig. 3B,C, E, F, H, and I). At the end of the 2008 season, thethrips population increased sharply in the Þve larvaeper leaf threshold treatment (Fig. 3I) but not as muchin the one and three larvae per leaf threshold treat-ments (Fig. 3C and F). The reason for this differencewas that no spray was made on 25 July in the Þve larvaeper leaf threshold treatment but was made for the oneand three larvae per leaf treatments. These late seasonsprays presumably reduced adult colonization andoviposition in August. In general in all 3 yr, the numberof applications decreased as the AT increased, except
Fig. 2. Mean number of T. tabaci larvae per onion leaf through time in plots treated with lambda-cyhalothrin (Warrior)at action thresholds of one (A and B), three (C and D), or Þve larvae per leaf (E and F) or not treated with insecticides inthe Finger Lakes region of New York in 2006 and 2007. The horizontal dashed line represents the action threshold. Smallarrows signify application times and the large arrows indicate harvest dates.
August 2010 NAULT AND SHELTON: IMPACT OF INSECTICIDES ON ACTION THRESHOLDS 1319
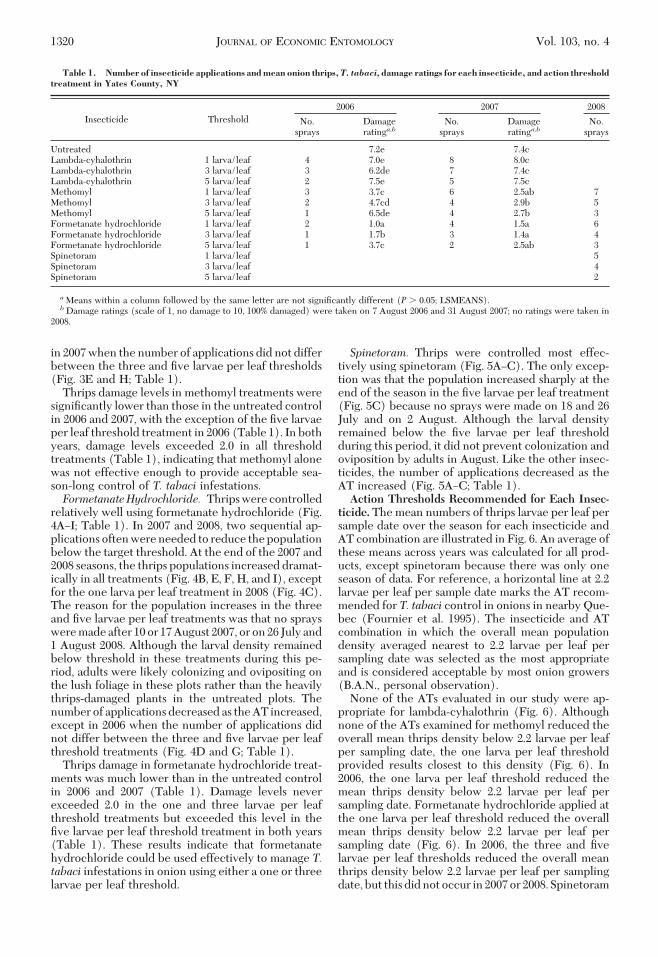
in 2007 when the number of applications did not differbetween the three and Þve larvae per leaf thresholds(Fig. 3E and H; Table 1).
Thrips damage levels in methomyl treatments weresigniÞcantly lower than those in the untreated controlin 2006 and 2007, with the exception of the Þve larvaeper leaf threshold treatment in 2006 (Table 1). In bothyears, damage levels exceeded 2.0 in all thresholdtreatments (Table 1), indicating that methomyl alonewas not effective enough to provide acceptable sea-son-long control of T. tabaci infestations.FormetanateHydrochloride. Thrips were controlled
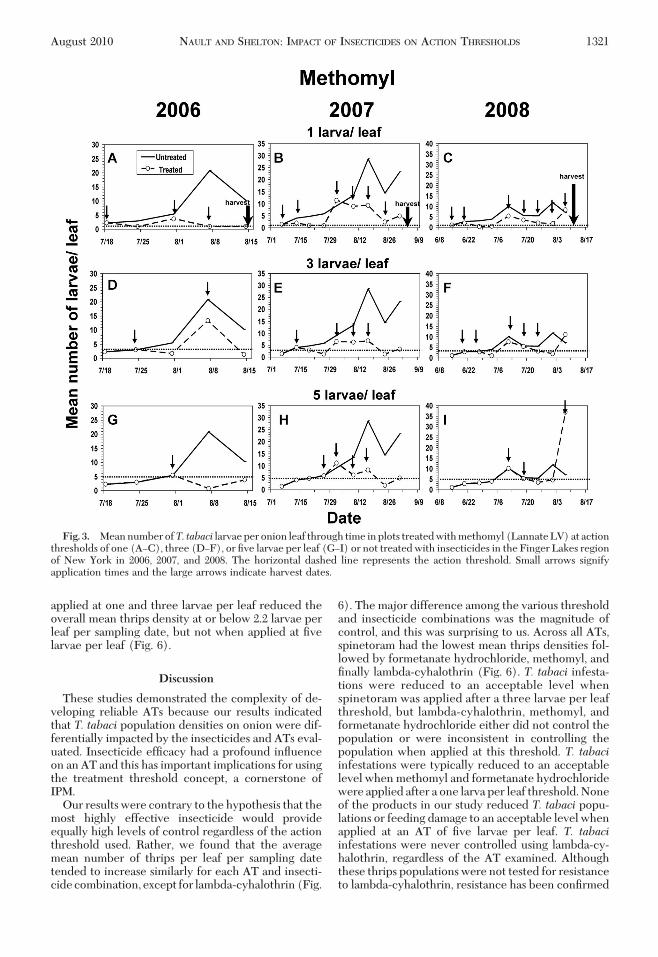
relatively well using formetanate hydrochloride (Fig.4AÐI; Table 1). In 2007 and 2008, two sequential ap-plications often were needed to reduce the populationbelow the target threshold. At the end of the 2007 and2008 seasons, the thrips populations increased dramat-ically in all treatments (Fig. 4B, E, F, H, and I), exceptfor the one larva per leaf treatment in 2008 (Fig. 4C).The reason for the population increases in the threeand Þve larvae per leaf treatments was that no sprayswere made after 10 or 17 August 2007, or on 26 July and1 August 2008. Although the larval density remainedbelow threshold in these treatments during this pe-riod, adults were likely colonizing and ovipositing onthe lush foliage in these plots rather than the heavilythrips-damaged plants in the untreated plots. Thenumber of applications decreased as the AT increased,except in 2006 when the number of applications didnot differ between the three and Þve larvae per leafthreshold treatments (Fig. 4D and G; Table 1).
Thrips damage in formetanate hydrochloride treat-ments was much lower than in the untreated controlin 2006 and 2007 (Table 1). Damage levels neverexceeded 2.0 in the one and three larvae per leafthreshold treatments but exceeded this level in theÞve larvae per leaf threshold treatment in both years(Table 1). These results indicate that formetanatehydrochloride could be used effectively to manage T.tabaci infestations in onion using either a one or threelarvae per leaf threshold.
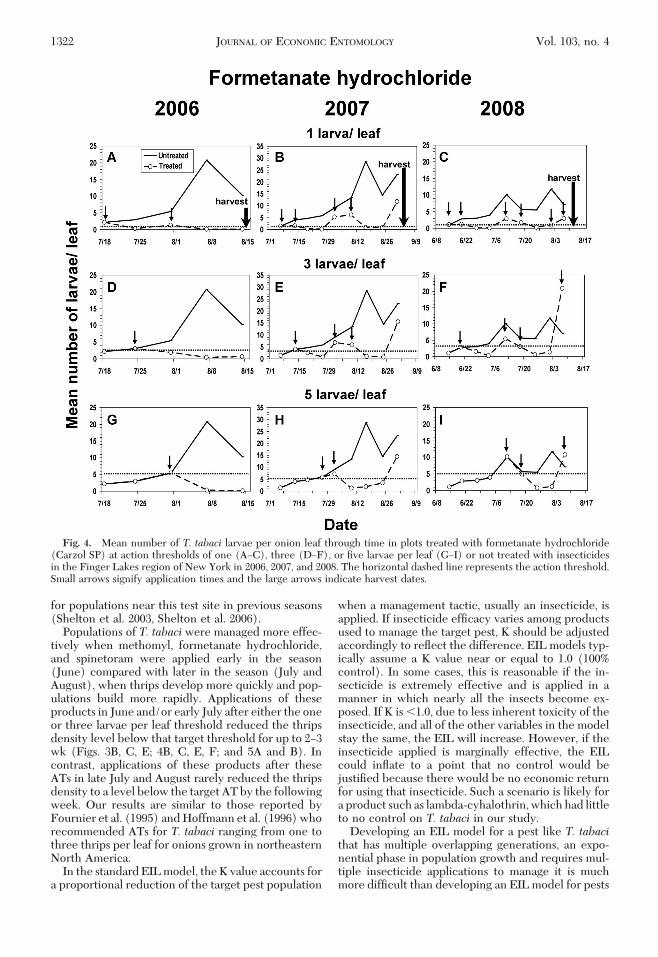
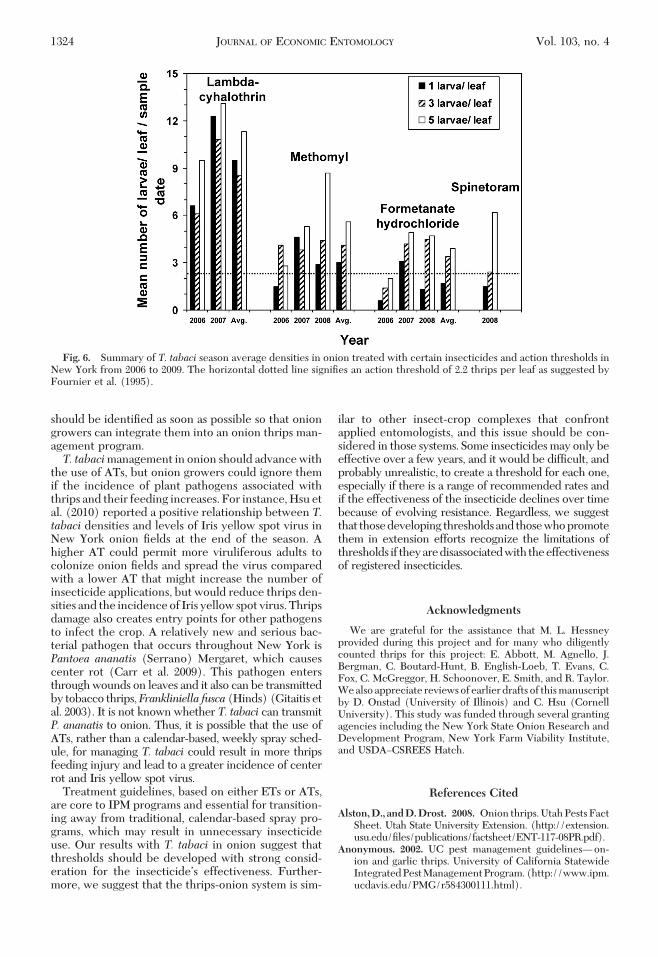
Spinetoram. Thrips were controlled most effec-tively using spinetoram (Fig. 5AÐC). The only excep-tion was that the population increased sharply at theend of the season in the Þve larvae per leaf treatment(Fig. 5C) because no sprays were made on 18 and 26July and on 2 August. Although the larval densityremained below the Þve larvae per leaf thresholdduring this period, it did not prevent colonization andoviposition by adults in August. Like the other insec-ticides, the number of applications decreased as theAT increased (Fig. 5AÐC; Table 1).Action Thresholds Recommended for Each Insec-ticide. The mean numbers of thrips larvae per leaf persample date over the season for each insecticide andAT combination are illustrated in Fig. 6. An average ofthese means across years was calculated for all prod-ucts, except spinetoram because there was only oneseason of data. For reference, a horizontal line at 2.2larvae per leaf per sample date marks the AT recom-mended for T. tabaci control in onions in nearby Que-bec (Fournier et al. 1995). The insecticide and ATcombination in which the overall mean populationdensity averaged nearest to 2.2 larvae per leaf persampling date was selected as the most appropriateand is considered acceptable by most onion growers(B.A.N., personal observation).
None of the ATs evaluated in our study were ap-propriate for lambda-cyhalothrin (Fig. 6). Althoughnone of the ATs examined for methomyl reduced theoverall mean thrips density below 2.2 larvae per leafper sampling date, the one larva per leaf thresholdprovided results closest to this density (Fig. 6). In2006, the one larva per leaf threshold reduced themean thrips density below 2.2 larvae per leaf persampling date. Formetanate hydrochloride applied atthe one larva per leaf threshold reduced the overallmean thrips density below 2.2 larvae per leaf persampling date (Fig. 6). In 2006, the three and Þvelarvae per leaf thresholds reduced the overall meanthrips density below 2.2 larvae per leaf per samplingdate, but this did not occur in 2007 or 2008. Spinetoram
Table 1. Number of insecticide applications and mean onion thrips, T. tabaci, damage ratings for each insecticide, and action thresholdtreatment in Yates County, NY
Insecticide Threshold
2006 2007 2008
No.sprays
Damageratinga,b
No.sprays
Damageratinga,b
No.sprays
Untreated 7.2e 7.4cLambda-cyhalothrin 1 larva/leaf 4 7.0e 8 8.0cLambda-cyhalothrin 3 larva/leaf 3 6.2de 7 7.4cLambda-cyhalothrin 5 larva/leaf 2 7.5e 5 7.5cMethomyl 1 larva/leaf 3 3.7c 6 2.5ab 7Methomyl 3 larva/leaf 2 4.7cd 4 2.9b 5Methomyl 5 larva/leaf 1 6.5de 4 2.7b 3Formetanate hydrochloride 1 larva/leaf 2 1.0a 4 1.5a 6Formetanate hydrochloride 3 larva/leaf 1 1.7b 3 1.4a 4Formetanate hydrochloride 5 larva/leaf 1 3.7c 2 2.5ab 3Spinetoram 1 larva/leaf 5Spinetoram 3 larva/leaf 4Spinetoram 5 larva/leaf 2
aMeans within a column followed by the same letter are not signiÞcantly different (P � 0.05; LSMEANS).bDamage ratings (scale of 1, no damage to 10, 100% damaged) were taken on 7 August 2006 and 31 August 2007; no ratings were taken in
2008.
1320 JOURNAL OF ECONOMIC ENTOMOLOGY Vol. 103, no. 4
applied at one and three larvae per leaf reduced theoverall mean thrips density at or below 2.2 larvae perleaf per sampling date, but not when applied at Þvelarvae per leaf (Fig. 6).
Discussion
These studies demonstrated the complexity of de-veloping reliable ATs because our results indicatedthat T. tabaci population densities on onion were dif-ferentially impacted by the insecticides and ATs eval-uated. Insecticide efÞcacy had a profound inßuenceon an AT and this has important implications for usingthe treatment threshold concept, a cornerstone ofIPM.
Our results were contrary to the hypothesis that themost highly effective insecticide would provideequally high levels of control regardless of the actionthreshold used. Rather, we found that the averagemean number of thrips per leaf per sampling datetended to increase similarly for each AT and insecti-cidecombination, except for lambda-cyhalothrin(Fig.
6). The major difference among the various thresholdand insecticide combinations was the magnitude ofcontrol, and this was surprising to us. Across all ATs,spinetoram had the lowest mean thrips densities fol-lowed by formetanate hydrochloride, methomyl, andÞnally lambda-cyhalothrin (Fig. 6). T. tabaci infesta-tions were reduced to an acceptable level whenspinetoram was applied after a three larvae per leafthreshold, but lambda-cyhalothrin, methomyl, andformetanate hydrochloride either did not control thepopulation or were inconsistent in controlling thepopulation when applied at this threshold. T. tabaciinfestations were typically reduced to an acceptablelevel when methomyl and formetanate hydrochloridewere applied after a one larva per leaf threshold. Noneof the products in our study reduced T. tabaci popu-lations or feeding damage to an acceptable level whenapplied at an AT of Þve larvae per leaf. T. tabaciinfestations were never controlled using lambda-cy-halothrin, regardless of the AT examined. Althoughthese thrips populations were not tested for resistanceto lambda-cyhalothrin, resistance has been conÞrmed
Fig. 3. Mean number ofT. tabaci larvae per onion leaf through time in plots treated with methomyl (Lannate LV) at actionthresholds of one (AÐC), three (DÐF), or Þve larvae per leaf (GÐI) or not treated with insecticides in the Finger Lakes regionof New York in 2006, 2007, and 2008. The horizontal dashed line represents the action threshold. Small arrows signifyapplication times and the large arrows indicate harvest dates.
August 2010 NAULT AND SHELTON: IMPACT OF INSECTICIDES ON ACTION THRESHOLDS 1321
for populations near this test site in previous seasons(Shelton et al. 2003, Shelton et al. 2006).
Populations of T. tabaci were managed more effec-tively when methomyl, formetanate hydrochloride,and spinetoram were applied early in the season(June) compared with later in the season (July andAugust), when thrips develop more quickly and pop-ulations build more rapidly. Applications of theseproducts in June and/or early July after either the oneor three larvae per leaf threshold reduced the thripsdensity level below that target threshold for up to 2Ð3wk (Figs. 3B, C, E; 4B, C, E, F; and 5A and B). Incontrast, applications of these products after theseATs in late July and August rarely reduced the thripsdensity to a level below the target AT by the followingweek. Our results are similar to those reported byFournier et al. (1995) and Hoffmann et al. (1996) whorecommended ATs for T. tabaci ranging from one tothree thrips per leaf for onions grown in northeasternNorth America.
In the standard EIL model, the K value accounts fora proportional reduction of the target pest population
when a management tactic, usually an insecticide, isapplied. If insecticide efÞcacy varies among productsused to manage the target pest, K should be adjustedaccordingly to reßect the difference. EIL models typ-ically assume a K value near or equal to 1.0 (100%control). In some cases, this is reasonable if the in-secticide is extremely effective and is applied in amanner in which nearly all the insects become ex-posed. If K is �1.0, due to less inherent toxicity of theinsecticide, and all of the other variables in the modelstay the same, the EIL will increase. However, if theinsecticide applied is marginally effective, the EILcould inßate to a point that no control would bejustiÞed because there would be no economic returnfor using that insecticide. Such a scenario is likely fora product such as lambda-cyhalothrin, which had littleto no control on T. tabaci in our study.
Developing an EIL model for a pest like T. tabacithat has multiple overlapping generations, an expo-nential phase in population growth and requires mul-tiple insecticide applications to manage it is muchmore difÞcult than developing an EIL model for pests
Fig. 4. Mean number of T. tabaci larvae per onion leaf through time in plots treated with formetanate hydrochloride(Carzol SP) at action thresholds of one (AÐC), three (DÐF), or Þve larvae per leaf (GÐI) or not treated with insecticidesin the Finger Lakes region of New York in 2006, 2007, and 2008. The horizontal dashed line represents the action threshold.Small arrows signify application times and the large arrows indicate harvest dates.
1322 JOURNAL OF ECONOMIC ENTOMOLOGY Vol. 103, no. 4
that have discrete generations on a crop and mayrequire only a single curative measure for control.Onstad (1987) developed a more complex EIL modelthat would account for some of these parameters, butdeveloping an EIL model for T. tabaci on onion wouldstill be difÞcult for several reasons. Identifying thevalue of fresh-market onions is challenging becauseprices ßuctuate greatly during the year. Generally,growers receive the highest prices for the portion oftheir crop that is sold soon after harvest, but prices candrop considerably for the remainder of the crop thatis stored and sold the following winter and spring.Yield loss caused by T. tabaci and damage per future
living larva are hard to predict because the yield-damage relationship varies based on growing condi-tions for the crop (e.g., edaphic factors, rainfall, tem-perature) (Rueda et al. 2007), temperature-drivendevelopment of the thrips populations (Mo et al. 2009)and date of onion harvest (Hsu et al. 2010). Conse-quently, the relatively straightforward developmentof ATs for T. tabaci management in onion outweighsthe complications of calculating the parameters men-tioned above to develop an EIL model and an ET. Still,for the reasons noted herein, even the complexities ofdeveloping “simplistic” ATs are not fully appreciatedand have impeded the development of robust ATs forthis pest in onion production systems.
In 1986 and 1993, New York onion growers averaged8.9 and 7.6 insecticide applications per season, respec-tively, to manage T. tabaci (Hoffmann et al. 1995).Currently, onion growers average eight applicationsper season. Past attempts to convert onion growers toan AT-based, decision-making system for T. tabacicontrol in onion were promising. A group of New Yorkonion growers followed ATs of three thrips per leaf in1986 and 1.5 thrips per leaf in 1993 to determine whento make insecticide applications. Ethyl parathion andpermethrin were the most commonly used products in1986 and 1993, respectively. The result was a 52 and38% reduction in the number of applications made in1986 and 1993, respectively, to manage the infestations(1986: 4.3 applications and 1993: 4.8 applications)(Hoffmann et al. 1995). Thrips presumably were man-aged effectively using these ATs, but no data werepresented. Results from our study showed that onlyfour applications of spinetoram by using a three thripsper leaf threshold were needed to provide acceptablecontrol of the thrips infestation, whereas an average ofÞve applications of formetanate hydrochloride and anaverage of 6.5 applications of methomyl after a onethrips per leaf threshold were needed. Onion growerscan clearly gain equivalent levels of T. tabaci controlin onion Þelds using fewer insecticide applicationsafter our ATs compared with a calendar-based deci-sion system, if they use a highly efÞcacious insecticidesuch as spinetoram.
Currently, there are few highly effective productsregistered to manage T. tabaci in onion in the UnitedStates (Nault and Hessney 2006, 2008a,b). In additionto spinetoram, there are several other effective prod-ucts such as spirotetramat, abamectin, and cyantranil-iprole (Nault et al. 2010), but they are in various stagesof the registration process. If these new products be-come registered for use on onion, the number of ap-plications permitted may be limited to mitigate thepossibility of resistance development in thrips popu-lations. In 2009 and 2010, Emergency Use Permits forspirotetramat and abamectin were granted by the En-vironmental Protection Agency in several major on-ion-producing states in the United States. Both activeingredients were limited to two consecutive applica-tions. Because the period of protection against T.tabaci in onion spans 6 to 8 wk, multiple products willbe needed and used in a sequence to provide season-long protection of the crop. ATs for these products
Fig. 5. Mean number of T. tabaci larvae per onion leafthrough time in plots treated with spinetoram (Radiant SC)at action thresholds of one (A), three (B), or Þve larvae perleaf (D) in 2008 or three larvae per leaf (C) in 2009 or nottreated with insecticides in the Finger Lakes region of NewYork. The horizontal dashed line represents the actionthreshold. Small arrows signify application times and thelarge arrows indicate harvest dates.
August 2010 NAULT AND SHELTON: IMPACT OF INSECTICIDES ON ACTION THRESHOLDS 1323
should be identiÞed as soon as possible so that oniongrowers can integrate them into an onion thrips man-agement program.T. tabacimanagement in onion should advance with
the use of ATs, but onion growers could ignore themif the incidence of plant pathogens associated withthrips and their feeding increases. For instance, Hsu etal. (2010) reported a positive relationship between T.tabaci densities and levels of Iris yellow spot virus inNew York onion Þelds at the end of the season. Ahigher AT could permit more viruliferous adults tocolonize onion Þelds and spread the virus comparedwith a lower AT that might increase the number ofinsecticide applications, but would reduce thrips den-sities and the incidence of Iris yellow spot virus. Thripsdamage also creates entry points for other pathogensto infect the crop. A relatively new and serious bac-terial pathogen that occurs throughout New York isPantoea ananatis (Serrano) Mergaret, which causescenter rot (Carr et al. 2009). This pathogen entersthrough wounds on leaves and it also can be transmittedby tobacco thrips,Frankliniella fusca (Hinds) (Gitaitis etal. 2003). It is not known whether T. tabaci can transmitP. ananatis to onion. Thus, it is possible that the use ofATs, rather than a calendar-based, weekly spray sched-ule, for managing T. tabaci could result in more thripsfeeding injury and lead to a greater incidence of centerrot and Iris yellow spot virus.
Treatment guidelines, based on either ETs or ATs,are core to IPM programs and essential for transition-ing away from traditional, calendar-based spray pro-grams, which may result in unnecessary insecticideuse. Our results with T. tabaci in onion suggest thatthresholds should be developed with strong consid-eration for the insecticideÕs effectiveness. Further-more, we suggest that the thrips-onion system is sim-
ilar to other insect-crop complexes that confrontapplied entomologists, and this issue should be con-sidered in those systems. Some insecticides may only beeffective over a few years, and it would be difÞcult, andprobably unrealistic, to create a threshold for each one,especially if there is a range of recommended rates andif the effectiveness of the insecticide declines over timebecause of evolving resistance. Regardless, we suggestthat thosedevelopingthresholdsandthosewhopromotethem in extension efforts recognize the limitations ofthresholds if theyaredisassociatedwiththeeffectivenessof registered insecticides.
Acknowledgments
We are grateful for the assistance that M. L. Hessneyprovided during this project and for many who diligentlycounted thrips for this project: E. Abbott, M. Agnello, J.Bergman, C. Boutard-Hunt, B. English-Loeb, T. Evans, C.Fox, C. McGreggor, H. Schoonover, E. Smith, and R. Taylor.We also appreciate reviews of earlier drafts of this manuscriptby D. Onstad (University of Illinois) and C. Hsu (CornellUniversity). This study was funded through several grantingagencies including the New York State Onion Research andDevelopment Program, New York Farm Viability Institute,and USDAÐCSREES Hatch.
References Cited
Alston,D., andD.Drost. 2008. Onion thrips. Utah Pests FactSheet. Utah State University Extension. (http://extension.usu.edu/Þles/publications/factsheet/ENT-117-08PR.pdf).
Anonymous. 2002. UC pest management guidelinesÑon-ion and garlic thrips. University of California StatewideIntegratedPestManagementProgram.(http://www.ipm.ucdavis.edu/PMG/r584300111.html).
Fig. 6. Summary of T. tabaci season average densities in onion treated with certain insecticides and action thresholds inNew York from 2006 to 2009. The horizontal dotted line signiÞes an action threshold of 2.2 thrips per leaf as suggested byFournier et al. (1995).
1324 JOURNAL OF ECONOMIC ENTOMOLOGY Vol. 103, no. 4
Buntin, G. D. 1986. Economic thresholds for insect man-agement, pp. 128Ð147. In L. G. Higley and L. P. Pedigo[eds.], Economic thresholds for integrated pest manage-ment. University of Nebraska Press, Lincoln, NE.
Bystrak, P. G., S. Sanborn, and G. Zehnder. 1994. Methodsfor optimizing Þeld performance of Bacillus thuringiensisendotoxins against Colorado potato beetle, pp. 386Ð402.InG. W. Zehnder, M. L. Powelson, R. K. Jansson, and K. V.Raman [eds.], Advances in potato pest biology and man-agement. APS Press, St. Paul, MN.
Carr, E. A., J. W. Lorbeer, and S. V. Beer. 2009. Detectionof Pantoea ananatis in New York grown onions and de-velopment of pathogenicity tests for P. ananatis on onion,pp. 96Ð110. In Proceedings of the 2009 National AlliumResearch Conference, Savannah, GA. University of Geor-gia Cooperative Extension, Athens, GA.
Cranshaw, W., E. Grafius, T.-X. Liu, B. Nault, and D. Riley.2005. Onions, 188Ð197. In R. Foster and B. Flood [eds.],Vegetable insect management. Meister Media World-wide, Willoughby, OH.
Edelson, J. V., B. Cartwright, and T. A. Royer. 1989. Eco-nomics of controlling onion thrips (Thysanoptera: Thripi-dae) on onions with insecticides in south Texas. J. Econ.Entomol. 82: 561Ð564.
Foster, R., and B. Flood. 2005. Vegetable insect manage-ment. Meister Media Worldwide, Willoughby. OH.
Fournier, F., G. Boivin, and R. Stewart. 1995. Effect ofThrips tabaci (Thysanoptera: Thripidae) on yellow onionyields and economic thresholds for its management. J.Econ. Entomol. 88: 1401Ð1407.
Gitaitis, R. D., R. R. Walcott, M. L. Wells, J. C. Diaz Perez,and F. H. Sanders. 2003. Transmission of Pantoea anana-tis, causal agent of center rot of onion, by tobacco thrips,Frankliniella fusca. Plant Dis. 87: 675Ð678.
Hammond, R. B. 1996. Limitations to EILs and thresholds,pp. 58Ð73. In L. G. Higley and L. P. Pedigo [eds.], Eco-nomic thresholds for integrated pest management. Uni-versity of Nebraska Press, Lincoln, NE.
Higley, L. G., and L. P. Pedigo. 1993. Economic injury levelconcepts and their use in sustaining environmental qual-ity. Agric. Ecosyst. Environ. 46: 233Ð243.
Higley, L. G., and L. P. Pedigo. 1996. Economic thresholdsfor integrated pest management. University of NebraskaPress, Lincoln, NE.
Higley, L. G., and W. K. Wintersteen. 1992. A novel ap-proach to environmental risk assessment of pesticides asa basis for incorporating environmental costs into eco-nomic injury levels. Am. Entomol. 38: 34Ð39.
Hoffmann, M. P., C. H. Petzoldt, and A. C. Frodsham. 1996.Integrated pest management for onions. Cornell Coop-erative Extension. New York State IPM Program Publi-cation No. 119.
Hoffmann, M. P., C. H. Petzoldt, C. R. MacNeil, J. J. Mis-hanec, M. S. Orfanedes, and D. H. Young. 1995. Evalu-ation of an onion thrips pest management program foronions in New York. Agric. Ecosys. Environ. 55: 51Ð60.
Hsu,C. L., C. A.Hoepting,M. Fuchs, A.M. Shelton, andB. A.Nault. 2010. Temporal dynamics of Iris yellow spot virusand its vector, Thrips tabaci (Thysanoptera: Thripidae),in seeded and transplanted onion Þelds. Environ. Ento-mol. 39: 266Ð277.
Hutchins, S.H. 1986. Thresholds involving plant quality andphonological disruption, pp. 275Ð290. In L. G. Higley andL. P. Pedigo [eds.], Economic thresholds for integratedpest management. University of Nebraska Press, Lincoln,NE.
Gangloff, J. L. 1999. Population dynamics and insecticideresistance of onion thrips, Thrips tabaciLindeman (Thys-
anoptera: Thripidae) in onions. Ph.D. dissertation, Cor-nell University, Ithaca, NY.
Lewis, T. 1997. Chemical control, pp. 567Ð593. In T. Lewis[ed.], Thrips as crop pests. CAB International, Walling-ford, United Kingdom.
MacIntyre-Allen, J. K., C.D. Scott-Dupree, J.H. Tolman, andC. R. Harris. 2005. Resistance of Thrips tabaci to pyre-throid and organophosphorous insecticides in Ontario,Canada. Pest Manag. Sci. 61: 809Ð815.
Mo, J., M. Stevens, D. L. Liu, and G. Herron. 2009. Inves-tigating the effect of invasion characteristics on onionthrips (Thysanoptera: Thripidae) populations in onionswith a temperature-driven process model. Environ. En-tomol. 38: 1575Ð1584.
Musser, F. R., J. P. Nyrop, and A. M. Shelton. 2006. Inte-grating biological and chemical controls in decision mak-ing: European corn borer (Lepidoptera: Crambidae)control in sweet corn as an example. J. Econ. Entomol. 99:1538Ð1549.
Naranjo, S. E., P. C. Ellsworth, C. C. Chu, and T. J. Hen-neberry. 2002. Conservation of predatory arthropods incotton: role of action thresholds for Bemisia tabaci (Ho-moptera: Aleyrodidae). J. Econ. Entomol. 95: 682Ð691.
Norton, G. A. 1976. Analysis of decision making in cropprotection. Agroecosystems 3: 27Ð44.
Nault, B. A., and M. L. Hessney. 2006. Onion thrips controlin onion, 2005. Arthropod Manag. Tests 31: E39.
Nault, B. A., andM. L.Hessney. 2008a. Onion thrips controlin onion, 2007. Arthropod Manag. Tests 33: E20.
Nault, B. A., andM.L.Hessney. 2008b. Onion thrips controlin onion, 2006. Arthropod Manag. Tests 33: E19.
Nault, B. A., and G. G. Kennedy. 1998. Limitations of usingregression and mean separation analyses for describingthe response of crop yield to defoliation: a case study ofthe Colorado potato beetle (Coleoptera: Chrysomelidae)on potato. J. Econ. Entomol. 91: 7Ð20.
Nault, B. A., C. L. Hsu, E. A. Smith,M. L. Hessney,M. Fuchs,and A.M. Shelton. 2010. Managing onion thrips and sta-tus of Iris yellow spot virus in New York, pp. 113Ð117. InProceedings of the 2010 Empire State Fruit and VegetableExpo, 25Ð27 January 2010, Syracuse, NY. Cornell Coop-erative Extension and New York State Vegetable GrowersAssociation.
Onstad, D. W. 1987. Calculation of economic-injury levelsand economic thresholds for pest management. J. Econ.Entomol. 80: 297Ð303.
Ostlie, K. R., and L. P. Pedigo. 1985. Soybean response tosimulated green cloverworm (Lepidoptera: Noctuidae)defoliation: progress toward determining comprehensiveeconomic injury levels. J. Econ. Entomol. 78: 437Ð444.
Parrella, M., and T. Lewis. 1997. Integrated pest manage-ment (IPM) in Þeld crops, pp. 595Ð614. InT. Lewis [ed.],Thrips as crop pests. CAB International, Wallingford,United Kingdom.
Pedigo, L. P., and L. G. Higley. 1992. A new perspective onthe economic injury level concept and environmentalquality. Am. Entomol. 38: 12Ð21.
Pedigo, L. P., S. H. Hutchins, and L. G. Higley. 1986. Eco-nomic injury levels in theory and practice. Annu. Rev.Entomol. 31: 341Ð368.
Peterson, R.K.D. 1996. The status of economic-decision-level development, pp. 151Ð178. In L. G. Higley and L. P.Pedigo [eds.], Economic thresholds for integrated pestmanagement. University of Nebraska Press, Lincoln, NE.
Peterson, R.K.D., and T. E. Hunt. 2003. The probabilisticeconomic injury level: incorporating uncertainty intopest management decision-making. J. Econ. Entomol. 96:536Ð542.
August 2010 NAULT AND SHELTON: IMPACT OF INSECTICIDES ON ACTION THRESHOLDS 1325
Poston,F.L., L. P. Pedigo, andS.M.Welch. 1983. Economicinjury levels: reality and practicality. Bull. Entomol. Soc.Am. 29: 49Ð53.
Quartey, S. Q. 1982. Population dynamics of the onionthrips, Thrips tabaci Lindeman, on onions. Ph.D. disser-tation. Michigan State University, East Lansing. MI.
Reiners, S., and C. H. Petzoldt. 2009. Integrated crop andpest management guidelines for commercial vegetableproduction. Cornell Cooperative Extension, Ithaca, NY.
Rueda, A., F. R. Badenes-Perez, and A. M. Shelton. 2007.Developing economic thresholds for onion thrips in Hon-duras. Crop Prot. 26: 1099Ð1107.
Sadof, C. S., andM. J. Raupp. 1986. Aesthetic thresholds andtheir development, pp. 203Ð226. In L. G. Higley and L. P.Pedigo [eds.], Economic thresholds for integrated pestmanagement. University of Nebraska Press, Lincoln, NE.
SAS Institute. 2008. SAS version 9.2. SAS Institute, Cary, NC.Shelton, A. M., J. P. Nyrop, R. C. Petzoldt, and R. Foster.1987. Development and use of a dynamic sequentialsampling program for onion thrips, Thrips tabaci (Thys-
anoptera: Thripidae), on onion. J. Econ. Entomol. 80:1051Ð1056.
Shelton, A. M., B. A. Nault, J. Plate, and J.-Z. Zhao. 2003.Regional and temporal variation in susceptibility to lamb-da-cyhalothrin in onion thrips, Thrips tabaci (Thysan-optera: Thripidae), in onion Þelds in New York. J. Econ.Entomol. 96: 1843Ð1848.
Shelton, A. M., J. Z. Zhao, B. A. Nault, J. Plate, F. R. Musser,and E. Larentzaki. 2006. Patterns of insecticide resis-tance in onion thrips (Thysanoptera: Thripidae) in onionÞelds in New York. J. Econ. Entomol. 99: 1798Ð1804.
Stern, V. M., R. F. Smith, R. van den Bosch, and K. S. Hagen.1959. The integrated control concept. Hilgardia 29: 81Ð101.
Stivers, L. 1997. Crop proÞle: onions in New York. (http://pmep.cce.cornell.edu/fqpa/crop-proÞles/onion.html).
Stone, J. D., and L. P. Pedigo. 1972. Development and eco-nomic-injury level of the green cloverworm on soybeanin Iowa. J. Econ. Entomol. 65: 197Ð201.
Received 16 March 2010; accepted 11 May 2010.
1326 JOURNAL OF ECONOMIC ENTOMOLOGY Vol. 103, no. 4