Embed Size (px)
Citation preview
Page 1 of 28
THIS REPORT CONTAINS ASSESSMENTS OF COMMODITY AND TRADE ISSUES MADE BY
USDA STAFF AND NOT NECESSARILY STATEMENTS OF OFFICIAL U.S. GOVERNMENT
POLICY
Date:
GAIN Report Number:
Approved By:
Prepared By:
Report Highlights:
U.S. exports of high value food products to Hong Kong reached a record level of US$2.1 billion in
2010, consolidating Hong Kong’s position as our 4th largest market for these products after
Canada, Mexico and Japan. Benefiting from the strong economic growth in Mainland China, Hong
Kong enjoyed 7.8% economic growth in 2010. In addition, it is expected that Hong Kong will
maintain its position as one of the top 4 markets for U.S. consumer ready food products in 2011,
as it continues to be a major buying center and transshipment point for China and Southeast Asia.
Economic growth in Hong Kong is forecast to be 4.5% in 2011. Post expects that U.S. products will
continue to fair well due to competitive prices and consumer confidence in the quality and safety
of U.S. products.
Chris Li
Erich Kuss
HRI Food Service Sector
Food Service - Hotel Restaurant Institutional
Hong Kong
HK1107
3/9/2011
Required Report - public distribution
Page 2 of 28
HRI Food Service Sector
1. Restaurants
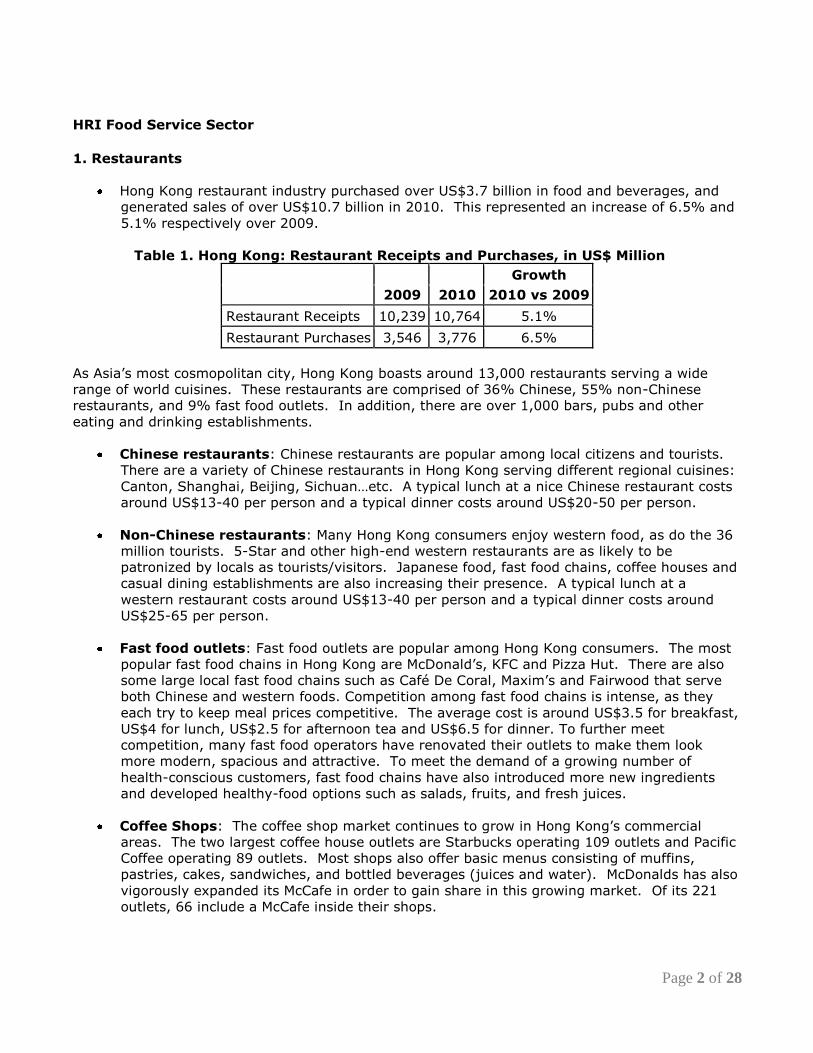
Hong Kong restaurant industry purchased over US$3.7 billion in food and beverages, and
generated sales of over US$10.7 billion in 2010. This represented an increase of 6.5% and
5.1% respectively over 2009.
Table 1. Hong Kong: Restaurant Receipts and Purchases, in US$ Million
Growth
2009 2010 2010 vs 2009
Restaurant Receipts 10,239 10,764 5.1%
Restaurant Purchases 3,546 3,776 6.5%
As Asia’s most cosmopolitan city, Hong Kong boasts around 13,000 restaurants serving a wide
range of world cuisines. These restaurants are comprised of 36% Chinese, 55% non-Chinese
restaurants, and 9% fast food outlets. In addition, there are over 1,000 bars, pubs and other
eating and drinking establishments.
Chinese restaurants: Chinese restaurants are popular among local citizens and tourists.
There are a variety of Chinese restaurants in Hong Kong serving different regional cuisines:
Canton, Shanghai, Beijing, Sichuan…etc. A typical lunch at a nice Chinese restaurant costs
around US$13-40 per person and a typical dinner costs around US$20-50 per person.
Non-Chinese restaurants: Many Hong Kong consumers enjoy western food, as do the 36
million tourists. 5-Star and other high-end western restaurants are as likely to be
patronized by locals as tourists/visitors. Japanese food, fast food chains, coffee houses and
casual dining establishments are also increasing their presence. A typical lunch at a
western restaurant costs around US$13-40 per person and a typical dinner costs around
US$25-65 per person.
Fast food outlets: Fast food outlets are popular among Hong Kong consumers. The most
popular fast food chains in Hong Kong are McDonald’s, KFC and Pizza Hut. There are also
some large local fast food chains such as Café De Coral, Maxim’s and Fairwood that serve
both Chinese and western foods. Competition among fast food chains is intense, as they
each try to keep meal prices competitive. The average cost is around US$3.5 for breakfast,
US$4 for lunch, US$2.5 for afternoon tea and US$6.5 for dinner. To further meet
competition, many fast food operators have renovated their outlets to make them look
more modern, spacious and attractive. To meet the demand of a growing number of
health-conscious customers, fast food chains have also introduced more new ingredients
and developed healthy-food options such as salads, fruits, and fresh juices.
Coffee Shops: The coffee shop market continues to grow in Hong Kong’s commercial
areas. The two largest coffee house outlets are Starbucks operating 109 outlets and Pacific
Coffee operating 89 outlets. Most shops also offer basic menus consisting of muffins,
pastries, cakes, sandwiches, and bottled beverages (juices and water). McDonalds has also
vigorously expanded its McCafe in order to gain share in this growing market. Of its 221
outlets, 66 include a McCafe inside their shops.
Page 3 of 28
Growing Trend – Healthy Eating: Hong Kong’s food culture is “fresh”. Consumer
preference for fresh and live products is due to tradition, as well as concern about food
safety. Hong Kong consumers are increasingly health conscious. Hong Kong has over 50
small to medium size health food stores. The two leading supermarket chains (Wellcome
and ParknShop) and drug store chains (Manning’s and Watson’s) also sell natural/organic
products at their outlets. The growth of “Mix” – a juice bar that also serves food is a good
example of a successful “healthy” restaurant chain. Organic foods are also gaining
popularity as evidenced by the growth of specialized retail outlets for organic foods. There
is increasing opportunity for U.S. products and ingredients in this sector.
2. Hotels
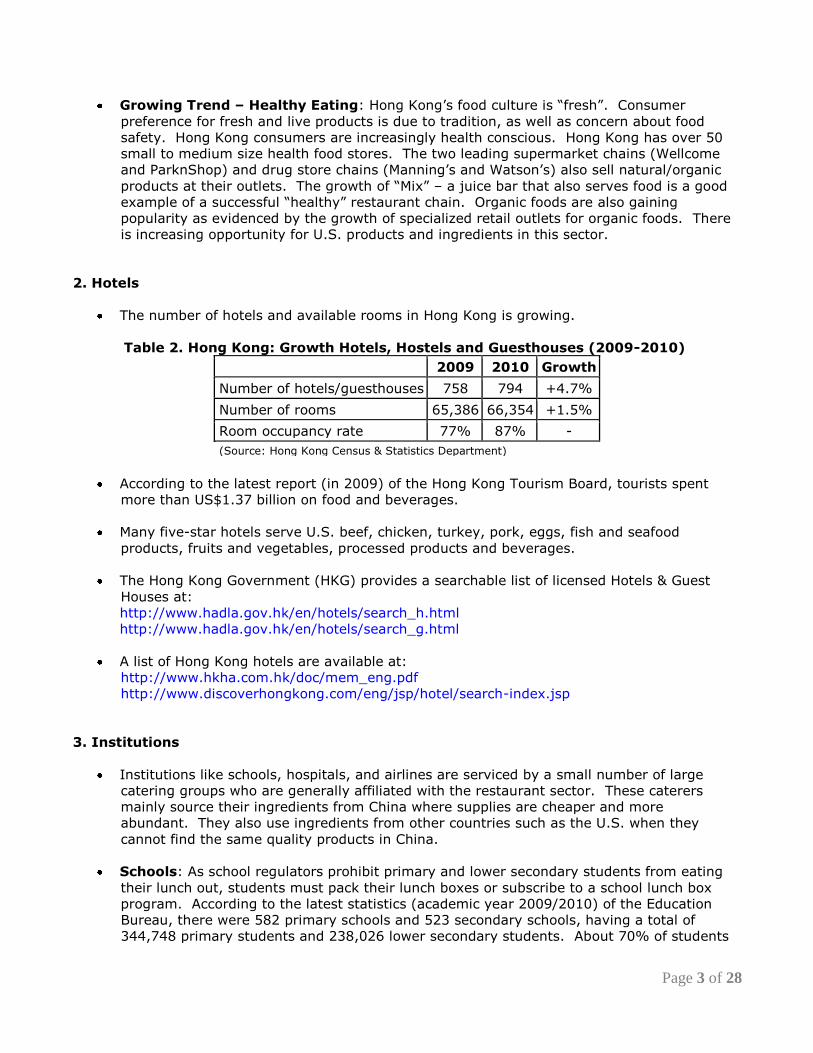
The number of hotels and available rooms in Hong Kong is growing.
Table 2. Hong Kong: Growth Hotels, Hostels and Guesthouses (2009-2010)
2009 2010 Growth
Number of hotels/guesthouses 758 794 +4.7%
Number of rooms 65,386 66,354 +1.5%
Room occupancy rate 77% 87% -
(Source: Hong Kong Census & Statistics Department)
According to the latest report (in 2009) of the Hong Kong Tourism Board, tourists spent
more than US$1.37 billion on food and beverages.
Many five-star hotels serve U.S. beef, chicken, turkey, pork, eggs, fish and seafood
products, fruits and vegetables, processed products and beverages.
The Hong Kong Government (HKG) provides a searchable list of licensed Hotels & Guest
Houses at:
http://www.hadla.gov.hk/en/hotels/search_h.html
http://www.hadla.gov.hk/en/hotels/search_g.html
A list of Hong Kong hotels are available at:
http://www.hkha.com.hk/doc/mem_eng.pdf
http://www.discoverhongkong.com/eng/jsp/hotel/search-index.jsp
3. Institutions
Institutions like schools, hospitals, and airlines are serviced by a small number of large
catering groups who are generally affiliated with the restaurant sector. These caterers
mainly source their ingredients from China where supplies are cheaper and more
abundant. They also use ingredients from other countries such as the U.S. when they
cannot find the same quality products in China.
Schools: As school regulators prohibit primary and lower secondary students from eating
their lunch out, students must pack their lunch boxes or subscribe to a school lunch box
program. According to the latest statistics (academic year 2009/2010) of the Education
Bureau, there were 582 primary schools and 523 secondary schools, having a total of
344,748 primary students and 238,026 lower secondary students. About 70% of students
Page 4 of 28
join a school lunch program. A typical lunch box consists of some kind of meat, rice and
some cooked vegetables. The annual cost of Hong Kong’s school lunch program is
estimated at US$250 million. Healthy eating programs are underway to encourage a change
in eating trends for school children. Caterers must register with the Hong Kong Food and
Environmental Hygiene Department (FEHD) before they are eligible to bid tenders provided
by individual schools. ATO Hong Kong can provide U.S. exporters with the list of registered
caterers for school lunch boxes.
Hospitals: The Hospital Authority operates 41 hospitals with a total of around 27,000 beds
and staff size of 58,000. The catering services for hospitals are outsourced on a tender
basis; many of which also operate restaurants, fast food chains or school lunch catering
services.
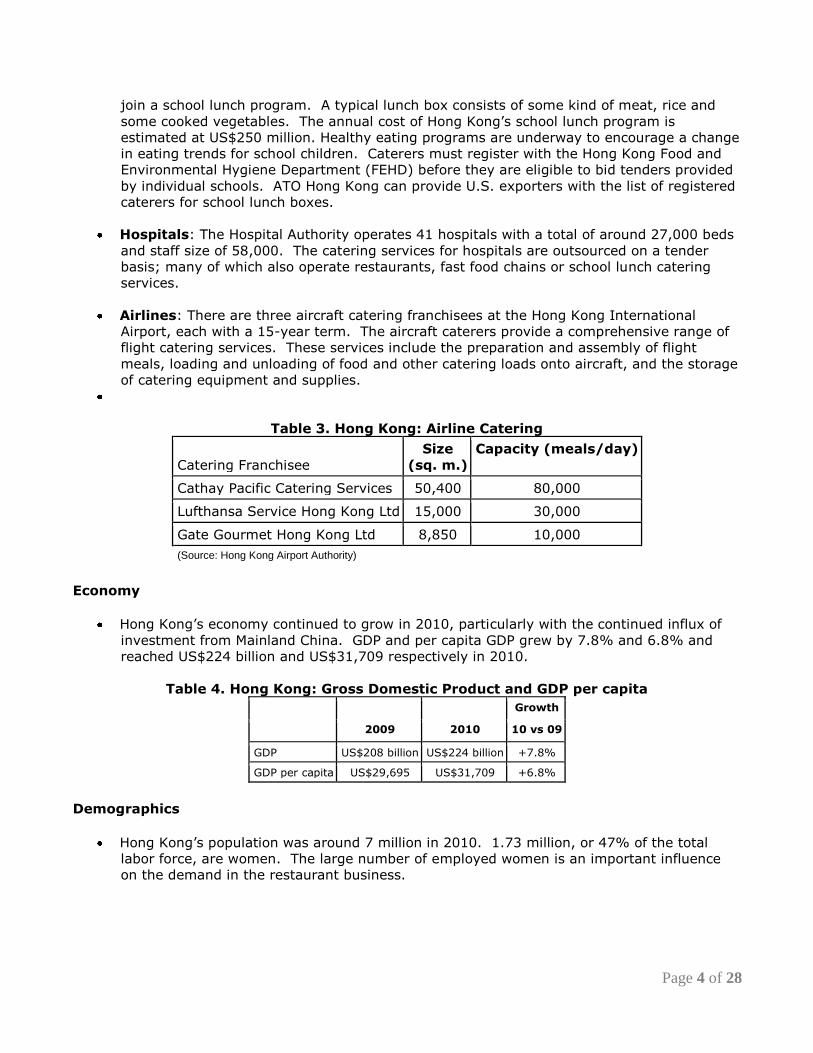
Airlines: There are three aircraft catering franchisees at the Hong Kong International
Airport, each with a 15-year term. The aircraft caterers provide a comprehensive range of
flight catering services. These services include the preparation and assembly of flight
meals, loading and unloading of food and other catering loads onto aircraft, and the storage
of catering equipment and supplies.
Table 3. Hong Kong: Airline Catering
Catering Franchisee
Size
(sq. m.)
Capacity (meals/day)
Cathay Pacific Catering Services 50,400 80,000
Lufthansa Service Hong Kong Ltd 15,000 30,000
Gate Gourmet Hong Kong Ltd 8,850 10,000
(Source: Hong Kong Airport Authority)
Economy
Hong Kong’s economy continued to grow in 2010, particularly with the continued influx of
investment from Mainland China. GDP and per capita GDP grew by 7.8% and 6.8% and
reached US$224 billion and US$31,709 respectively in 2010.
Table 4. Hong Kong: Gross Domestic Product and GDP per capita
Growth
2009 2010 10 vs 09
GDP US$208 billion US$224 billion +7.8%
GDP per capita US$29,695 US$31,709 +6.8%
Demographics
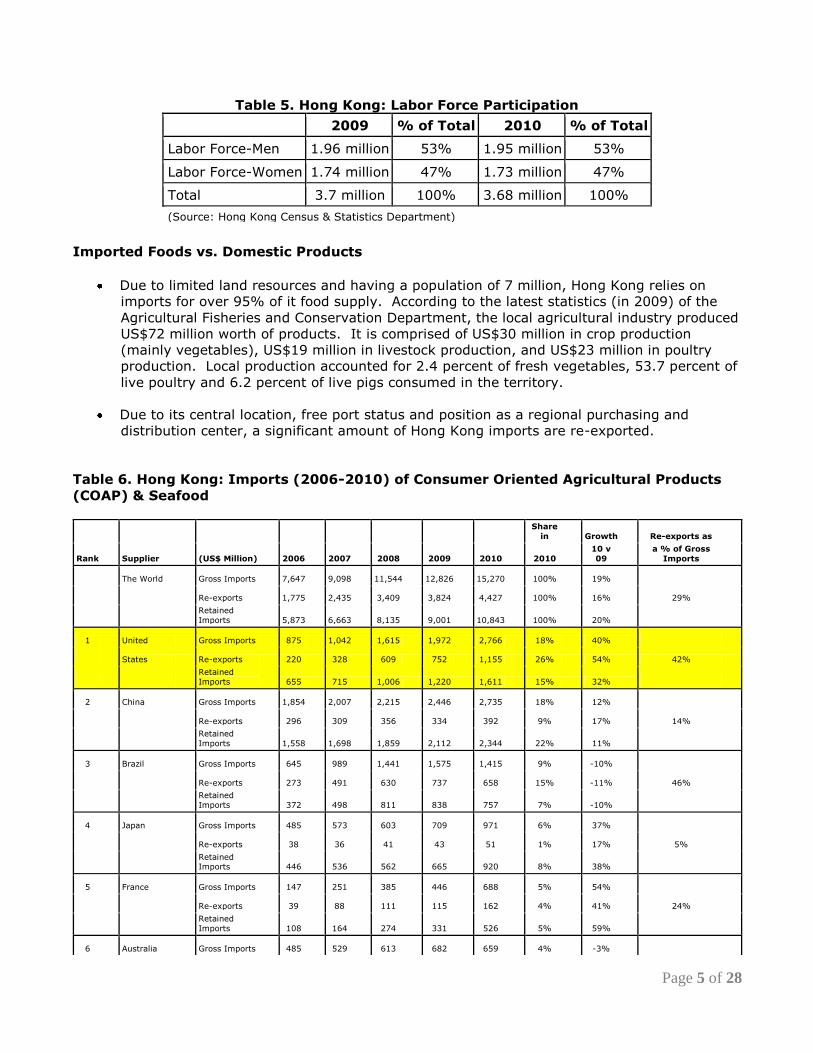
Hong Kong’s population was around 7 million in 2010. 1.73 million, or 47% of the total
labor force, are women. The large number of employed women is an important influence
on the demand in the restaurant business.
Page 5 of 28
Table 5. Hong Kong: Labor Force Participation
2009 % of Total 2010 % of Total
Labor Force-Men 1.96 million 53% 1.95 million 53%
Labor Force-Women 1.74 million 47% 1.73 million 47%
Total 3.7 million 100% 3.68 million 100%
(Source: Hong Kong Census & Statistics Department)
Imported Foods vs. Domestic Products
Due to limited land resources and having a population of 7 million, Hong Kong relies on
imports for over 95% of it food supply. According to the latest statistics (in 2009) of the
Agricultural Fisheries and Conservation Department, the local agricultural industry produced
US$72 million worth of products. It is comprised of US$30 million in crop production
(mainly vegetables), US$19 million in livestock production, and US$23 million in poultry
production. Local production accounted for 2.4 percent of fresh vegetables, 53.7 percent of
live poultry and 6.2 percent of live pigs consumed in the territory.
Due to its central location, free port status and position as a regional purchasing and
distribution center, a significant amount of Hong Kong imports are re-exported.
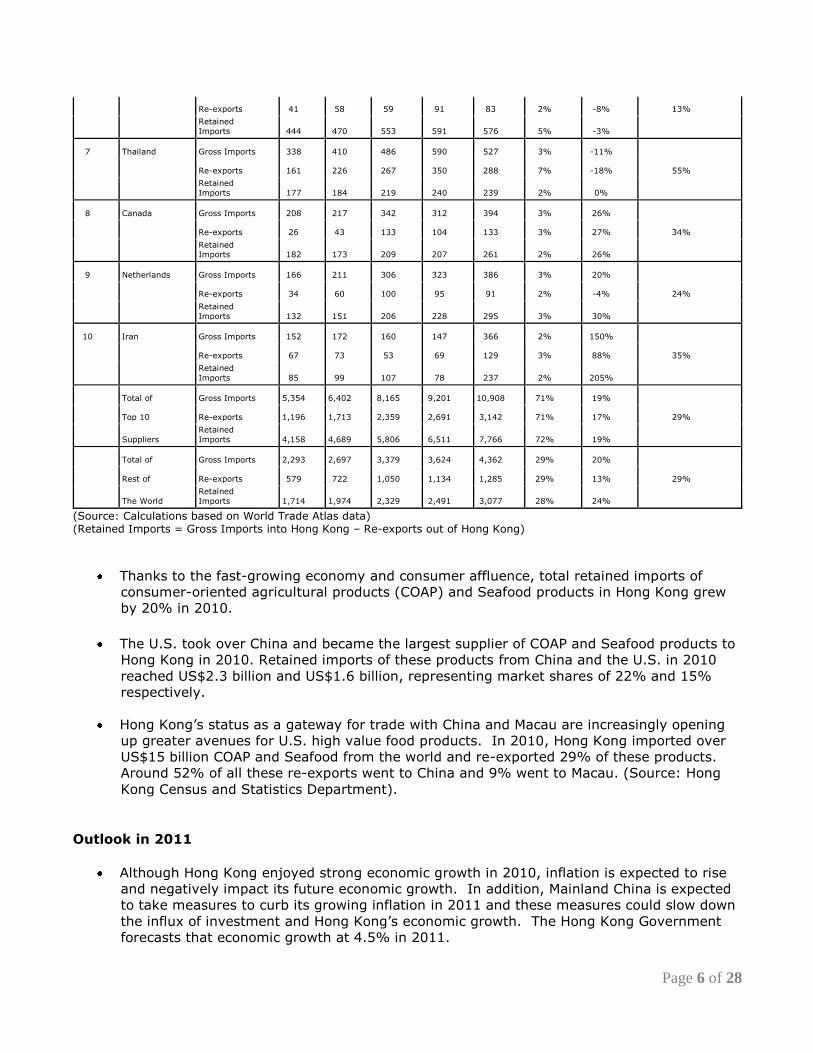
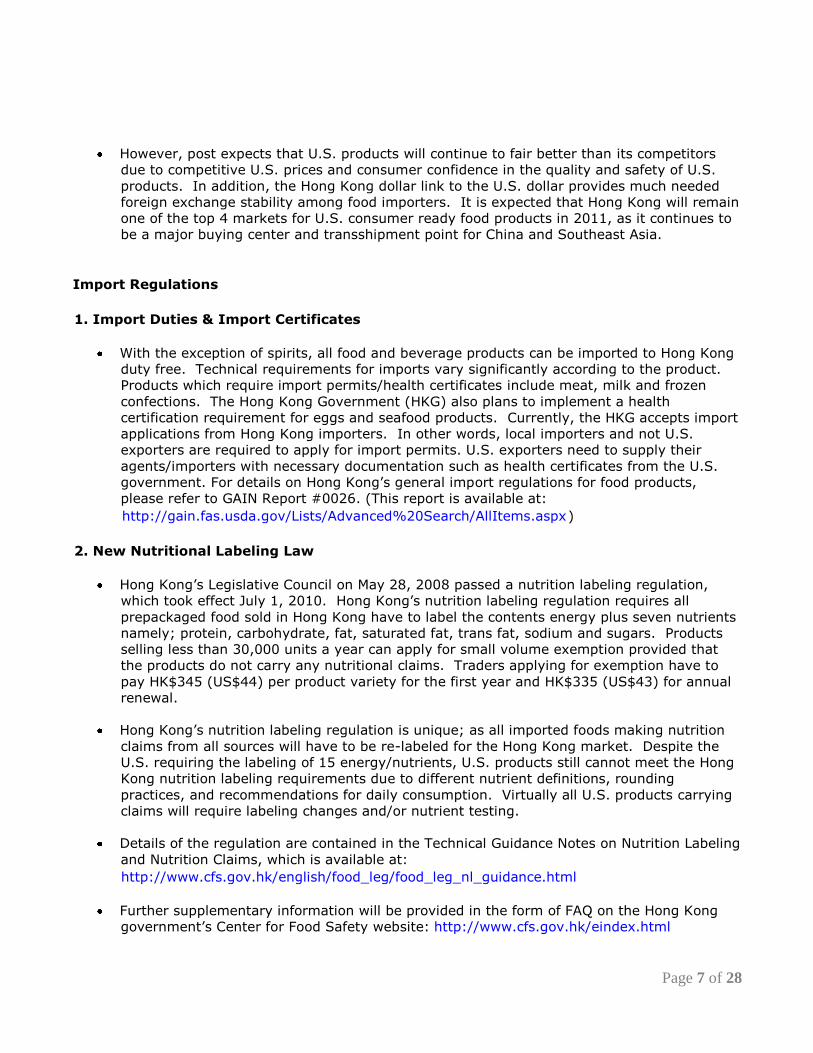
Table 6. Hong Kong: Imports (2006-2010) of Consumer Oriented Agricultural Products
(COAP) & Seafood
Share
in Growth Re-exports as
Rank Supplier (US$ Million) 2006 2007 2008 2009 2010 2010 10 v
09 a % of Gross
Imports
The World Gross Imports 7,647 9,098 11,544 12,826 15,270 100% 19%
Re-exports 1,775 2,435 3,409 3,824 4,427 100% 16% 29%
Retained
Imports 5,873 6,663 8,135 9,001 10,843 100% 20%
1 United Gross Imports 875 1,042 1,615 1,972 2,766 18% 40%
States Re-exports 220 328 609 752 1,155 26% 54% 42%
Retained
Imports 655 715 1,006 1,220 1,611 15% 32%
2 China Gross Imports 1,854 2,007 2,215 2,446 2,735 18% 12%
Re-exports 296 309 356 334 392 9% 17% 14%
Retained
Imports 1,558 1,698 1,859 2,112 2,344 22% 11%
3 Brazil Gross Imports 645 989 1,441 1,575 1,415 9% -10%
Re-exports 273 491 630 737 658 15% -11% 46%
Retained
Imports 372 498 811 838 757 7% -10%
4 Japan Gross Imports 485 573 603 709 971 6% 37%
Re-exports 38 36 41 43 51 1% 17% 5%
Retained Imports 446 536 562 665 920 8% 38%
5 France Gross Imports 147 251 385 446 688 5% 54%
Re-exports 39 88 111 115 162 4% 41% 24%
Retained
Imports 108 164 274 331 526 5% 59%
6 Australia Gross Imports 485 529 613 682 659 4% -3%
Page 6 of 28
Re-exports 41 58 59 91 83 2% -8% 13%
Retained
Imports 444 470 553 591 576 5% -3%
7 Thailand Gross Imports 338 410 486 590 527 3% -11%
Re-exports 161 226 267 350 288 7% -18% 55%
Retained
Imports 177 184 219 240 239 2% 0%
8 Canada Gross Imports 208 217 342 312 394 3% 26%
Re-exports 26 43 133 104 133 3% 27% 34%
Retained Imports 182 173 209 207 261 2% 26%
9 Netherlands Gross Imports 166 211 306 323 386 3% 20%
Re-exports 34 60 100 95 91 2% -4% 24%
Retained
Imports 132 151 206 228 295 3% 30%
10 Iran Gross Imports 152 172 160 147 366 2% 150%
Re-exports 67 73 53 69 129 3% 88% 35%
Retained
Imports 85 99 107 78 237 2% 205%
Total of Gross Imports 5,354 6,402 8,165 9,201 10,908 71% 19%
Top 10 Re-exports 1,196 1,713 2,359 2,691 3,142 71% 17% 29%
Suppliers Retained
Imports 4,158 4,689 5,806 6,511 7,766 72% 19%
Total of Gross Imports 2,293 2,697 3,379 3,624 4,362 29% 20%
Rest of Re-exports 579 722 1,050 1,134 1,285 29% 13% 29%
The World Retained
Imports 1,714 1,974 2,329 2,491 3,077 28% 24%
(Source: Calculations based on World Trade Atlas data) (Retained Imports = Gross Imports into Hong Kong – Re-exports out of Hong Kong)
Thanks to the fast-growing economy and consumer affluence, total retained imports of
consumer-oriented agricultural products (COAP) and Seafood products in Hong Kong grew
by 20% in 2010.
The U.S. took over China and became the largest supplier of COAP and Seafood products to
Hong Kong in 2010. Retained imports of these products from China and the U.S. in 2010
reached US$2.3 billion and US$1.6 billion, representing market shares of 22% and 15%
respectively.
Hong Kong’s status as a gateway for trade with China and Macau are increasingly opening
up greater avenues for U.S. high value food products. In 2010, Hong Kong imported over
US$15 billion COAP and Seafood from the world and re-exported 29% of these products.
Around 52% of all these re-exports went to China and 9% went to Macau. (Source: Hong
Kong Census and Statistics Department).
Outlook in 2011
Although Hong Kong enjoyed strong economic growth in 2010, inflation is expected to rise
and negatively impact its future economic growth. In addition, Mainland China is expected
to take measures to curb its growing inflation in 2011 and these measures could slow down
the influx of investment and Hong Kong’s economic growth. The Hong Kong Government
forecasts that economic growth at 4.5% in 2011.
Page 7 of 28
However, post expects that U.S. products will continue to fair better than its competitors
due to competitive U.S. prices and consumer confidence in the quality and safety of U.S.
products. In addition, the Hong Kong dollar link to the U.S. dollar provides much needed
foreign exchange stability among food importers. It is expected that Hong Kong will remain
one of the top 4 markets for U.S. consumer ready food products in 2011, as it continues to
be a major buying center and transshipment point for China and Southeast Asia.
Import Regulations
1. Import Duties & Import Certificates
With the exception of spirits, all food and beverage products can be imported to Hong Kong
duty free. Technical requirements for imports vary significantly according to the product.
Products which require import permits/health certificates include meat, milk and frozen
confections. The Hong Kong Government (HKG) also plans to implement a health
certification requirement for eggs and seafood products. Currently, the HKG accepts import
applications from Hong Kong importers. In other words, local importers and not U.S.
exporters are required to apply for import permits. U.S. exporters need to supply their
agents/importers with necessary documentation such as health certificates from the U.S.
government. For details on Hong Kong’s general import regulations for food products,
please refer to GAIN Report #0026. (This report is available at:
http://gain.fas.usda.gov/Lists/Advanced%20Search/AllItems.aspx)
2. New Nutritional Labeling Law
Hong Kong’s Legislative Council on May 28, 2008 passed a nutrition labeling regulation,
which took effect July 1, 2010. Hong Kong’s nutrition labeling regulation requires all
prepackaged food sold in Hong Kong have to label the contents energy plus seven nutrients
namely; protein, carbohydrate, fat, saturated fat, trans fat, sodium and sugars. Products
selling less than 30,000 units a year can apply for small volume exemption provided that
the products do not carry any nutritional claims. Traders applying for exemption have to
pay HK$345 (US$44) per product variety for the first year and HK$335 (US$43) for annual
renewal.
Hong Kong’s nutrition labeling regulation is unique; as all imported foods making nutrition
claims from all sources will have to be re-labeled for the Hong Kong market. Despite the
U.S. requiring the labeling of 15 energy/nutrients, U.S. products still cannot meet the Hong
Kong nutrition labeling requirements due to different nutrient definitions, rounding
practices, and recommendations for daily consumption. Virtually all U.S. products carrying
claims will require labeling changes and/or nutrient testing.
Details of the regulation are contained in the Technical Guidance Notes on Nutrition Labeling
and Nutrition Claims, which is available at:
http://www.cfs.gov.hk/english/food_leg/food_leg_nl_guidance.html
Further supplementary information will be provided in the form of FAQ on the Hong Kong
government’s Center for Food Safety website: http://www.cfs.gov.hk/eindex.html
Page 8 of 28
For more information on the impact of Hong Kong’s nutrition labeling regulation, please see
reports HK0011, HK8017, HK7011, & HK0011. (These reports are available at:
http://www.fas.usda.gov/scriptsw/AttacheRep/legacy.asp)
3. Preservatives Regulations
Hong Kong amended its Preservatives Regulation, which became effective July 1, 2008. A
two-year transitional period for compliance ended on June 30, 2010. Compared to the
original regulation, the new regulation no longer allows for the use of propyl para-
hydroxybenzoate, but additionally allows the use of the following preservatives:
Guaiac resin
Isopropyl citrates
Stannous chloride
Tertiary butylhydroquinone (TBHQ)
Thiodipropionic acid
Dimethyl dicarbonate
Ferrous gluconate
Formic acid
Hexamethylene tetramine
Lysozyme
Pimaricin
Another change brought about by the amendment to the regulation is the adoption of a food
category system based on Codex’s General Standard for Food Additives (GSFA) and the
incorporation of those preservatives and antioxidants, as well as their permitted levels of
use, in GSFA.
To help trade better understand the amended regulation, the HKG issued a “User
Guideline”, which provides the definition of each food category of the newly adopted food
category system. Also, the Guidelines include some questions and answers pertaining to
the amended regulations. The full Guidelines are available at the following website:
http://www.cfs.gov.hk/english/whatsnew/whatsnew_fstr/files/User_Guideline_e.pdf
Hong Kong’s Preservatives Regulation adopts the principle of a positive list. In other words,
Hong Kong does not allow any preservatives or antioxidants in foods if they are not
expressly permitted by the Preservatives Regulation. The list of permitted preservatives
and their maximum permitted levels may be retrieved from the following website:
http://www.legco.gov.hk/yr07-08/english/subleg/negative/ln085-08-e.pdf
More information on the amended Preservatives Regulation, please see gain reports
HK#8021 & HK#7018. (These reports are available at:
http://www.fas.usda.gov/scriptsw/AttacheRep/legacy.asp)
Page 9 of 28
4. Biotech Food Related Regulations
The HKG does not have any specific biotechnology regulations with regard to the labeling of
biotech food products. The HKG makes no distinction between conventional and biotech
foods. All are subject to the same food safety regulation.
The HKG, after evaluating the impact of its voluntary labeling scheme for biotech food
products, released its conclusions to the Legislative Council on July 8, 2008, suggesting
there is no need for a mandatory labeling law in Hong Kong. The HKG noted difficulty in
carrying out a law that currently does not have an international standard to back it up. As
a result of its evaluation, the HKG plans to continue to promote voluntary labeling of GMO
products as a viable alternative for the trade.
The HKG released a set of guidelines on voluntary labeling for biotech foods in 2006. The
guidelines on labeling for biotech foods are advisory in nature and do not have any legal
effect. Adoption is entirely voluntary and is not binding. The guidelines apply to
prepackaged food and are based on the following four principles:
The labeling of biotech food will comply with the existing food legislation.
The threshold level applied in the guideline for labeling purpose is 5 percent, in
respect of individual food ingredient.
Additional declaration on the food label is recommended when significant
modifications of the food, e.g. composition, nutrition value, level of anti-nutritional
factors, natural toxicant, presence of allergen, intended use, introduction of an
animal gene, etc, have taken place.
Negative labeling is not recommended.
As the guideline is voluntary, U.S. food exports should not be affected if they choose not to
have any biotech labeling. However, it should be noted that the HKG does not encourage
negative labeling particularly for the use of the following terms:
GMO free
Free from GM ingredients, etc
For products with such definite negative labeling, the HKG may take the initiative to test the
products against GM ingredients and zero tolerance will be adopted for testing purposes. If
products are found to have misleading labeling, a retailer may be subject to prosecution
under Section 61 – False Labeling and Advertisement of Food or Drugs of Chapter 132
Public Health and Municipal Services Ordinance. (Available at
http://www.legislation.gov.hk/eng/home.htm)
If the trade chooses to apply negative labeling, the government advises to use less definite
terms such as “sourced from non-GM sources” (which contains less than 5 percent of GM
content) and to have documentation to substantiate such declaration.
For more details on the voluntary labeling guidelines and biotechnology in Hong Kong,
Page 10 of 28
please refer to Gain Report HK#0009 & HK#6026 respectively. (These reports are available
at: http://www.fas.usda.gov/scriptsw/AttacheRep/legacy.asp)
Hong Kong passed a Genetically Modified Organisms (Control of Release) Ordinance and the
Genetically Modified Organisms (Documentation for Import and Export) Regulation in March
2010 and November 2010 respectively. With the expected commencement of the
Ordinance and the Regulation in March 2011, there will be documentation requirements for
shipments containing genetically modified organisms (GMOs). GMOs in the Ordinance are
referred to as LMOs or living modified organisms. Shipments containing GMOs will need to
be accompanied by documentation containing the following information:
If the identity of the GMO is known, the shipment contains such a GMO; if the
identity of the GMO is not known, the shipment may contain such a GMO;
The GMO is not intended for release into the environment;
The common name, scientific name and, where available, commercial name of the
GMO;
The transformation event code of the GMO or, where available, its unique identifier
code; and,
The details of the importer or exporter (such as name, address and contact
information) for further information.
There is no specific requirement regarding the form of documentation accompanying GMO
shipments. The use of a commercial invoice or other documents required by existing
documentation systems would be sufficient.
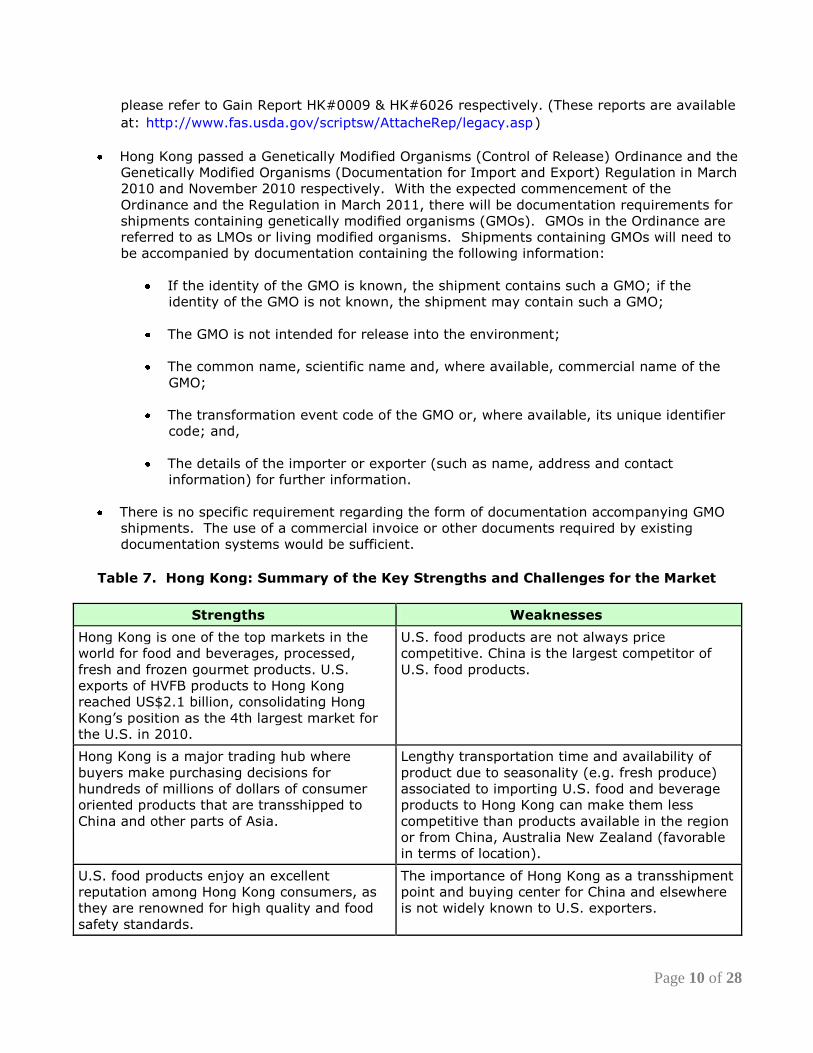
Table 7. Hong Kong: Summary of the Key Strengths and Challenges for the Market
Strengths Weaknesses
Hong Kong is one of the top markets in the
world for food and beverages, processed,
fresh and frozen gourmet products. U.S.
exports of HVFB products to Hong Kong
reached US$2.1 billion, consolidating Hong
Kong’s position as the 4th largest market for
the U.S. in 2010.
U.S. food products are not always price
competitive. China is the largest competitor of
U.S. food products.
Hong Kong is a major trading hub where
buyers make purchasing decisions for
hundreds of millions of dollars of consumer
oriented products that are transshipped to
China and other parts of Asia.
Lengthy transportation time and availability of
product due to seasonality (e.g. fresh produce)
associated to importing U.S. food and beverage
products to Hong Kong can make them less
competitive than products available in the region
or from China, Australia New Zealand (favorable
in terms of location).
U.S. food products enjoy an excellent
reputation among Hong Kong consumers, as
they are renowned for high quality and food
safety standards.
The importance of Hong Kong as a transshipment
point and buying center for China and elsewhere
is not widely known to U.S. exporters.
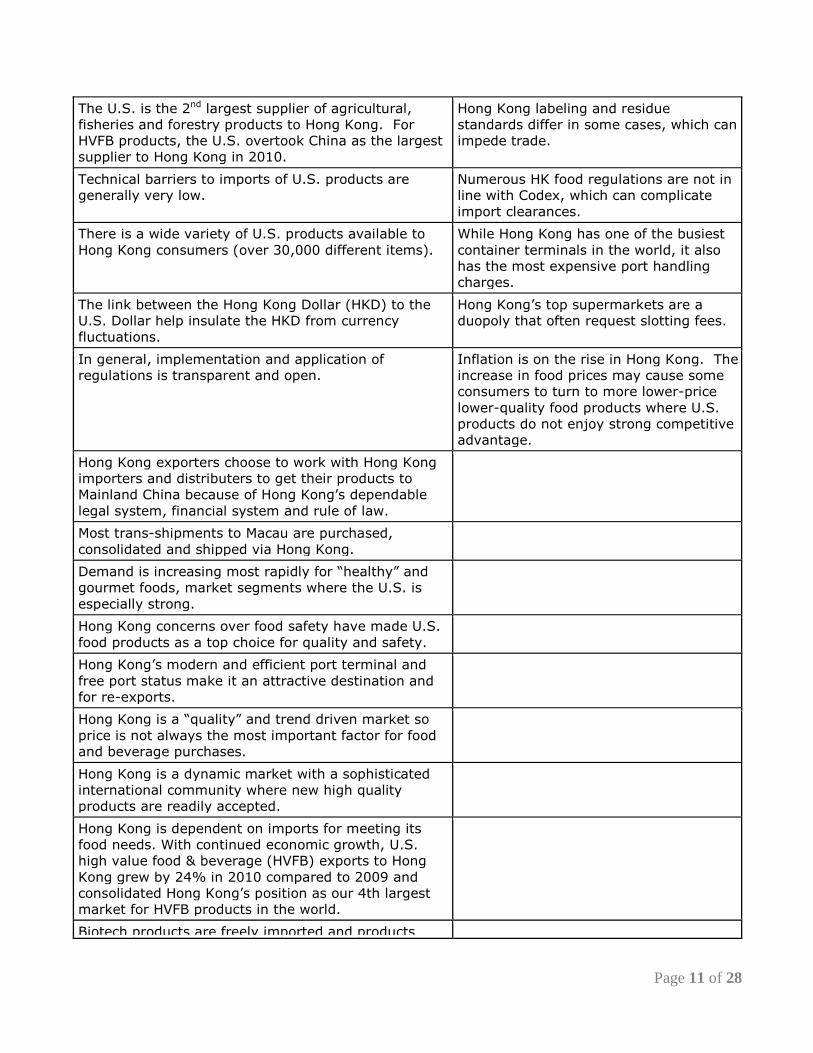
Page 11 of 28
The U.S. is the 2nd largest supplier of agricultural,
fisheries and forestry products to Hong Kong. For
HVFB products, the U.S. overtook China as the largest
supplier to Hong Kong in 2010.
Hong Kong labeling and residue
standards differ in some cases, which can
impede trade.
Technical barriers to imports of U.S. products are
generally very low.
Numerous HK food regulations are not in
line with Codex, which can complicate
import clearances.
There is a wide variety of U.S. products available to
Hong Kong consumers (over 30,000 different items).
While Hong Kong has one of the busiest
container terminals in the world, it also
has the most expensive port handling
charges.
The link between the Hong Kong Dollar (HKD) to the
U.S. Dollar help insulate the HKD from currency
fluctuations.
Hong Kong’s top supermarkets are a
duopoly that often request slotting fees.
In general, implementation and application of
regulations is transparent and open.
Inflation is on the rise in Hong Kong. The
increase in food prices may cause some
consumers to turn to more lower-price
lower-quality food products where U.S.
products do not enjoy strong competitive
advantage.
Hong Kong exporters choose to work with Hong Kong
importers and distributers to get their products to
Mainland China because of Hong Kong’s dependable
legal system, financial system and rule of law.
Most trans-shipments to Macau are purchased,
consolidated and shipped via Hong Kong.
Demand is increasing most rapidly for “healthy” and
gourmet foods, market segments where the U.S. is
especially strong.
Hong Kong concerns over food safety have made U.S.
food products as a top choice for quality and safety.
Hong Kong’s modern and efficient port terminal and
free port status make it an attractive destination and
for re-exports.
Hong Kong is a “quality” and trend driven market so
price is not always the most important factor for food
and beverage purchases.
Hong Kong is a dynamic market with a sophisticated
international community where new high quality
products are readily accepted.
Hong Kong is dependent on imports for meeting its
food needs. With continued economic growth, U.S.
high value food & beverage (HVFB) exports to Hong
Kong grew by 24% in 2010 compared to 2009 and
consolidated Hong Kong’s position as our 4th largest
market for HVFB products in the world.
Biotech products are freely imported and products
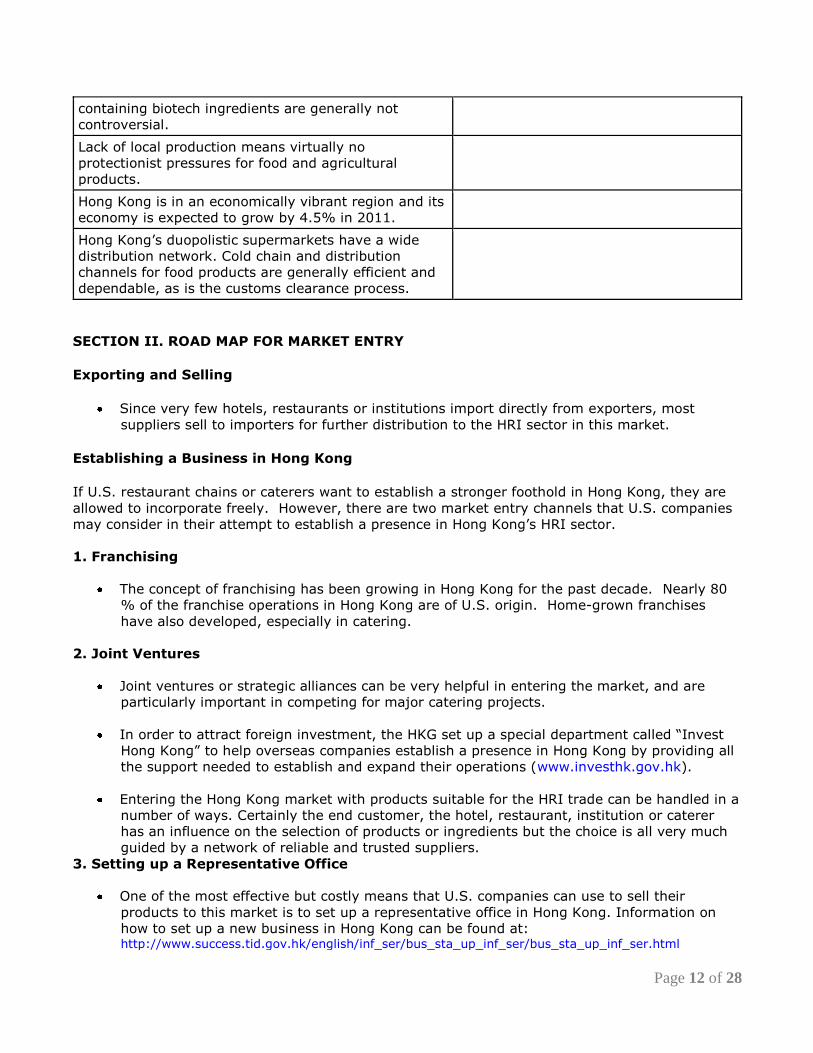
Page 12 of 28
containing biotech ingredients are generally not
controversial.
Lack of local production means virtually no
protectionist pressures for food and agricultural
products.
Hong Kong is in an economically vibrant region and its
economy is expected to grow by 4.5% in 2011.
Hong Kong’s duopolistic supermarkets have a wide
distribution network. Cold chain and distribution
channels for food products are generally efficient and
dependable, as is the customs clearance process.
SECTION II. ROAD MAP FOR MARKET ENTRY
Exporting and Selling
Since very few hotels, restaurants or institutions import directly from exporters, most
suppliers sell to importers for further distribution to the HRI sector in this market.
Establishing a Business in Hong Kong
If U.S. restaurant chains or caterers want to establish a stronger foothold in Hong Kong, they are
allowed to incorporate freely. However, there are two market entry channels that U.S. companies
may consider in their attempt to establish a presence in Hong Kong’s HRI sector.
1. Franchising
The concept of franchising has been growing in Hong Kong for the past decade. Nearly 80
% of the franchise operations in Hong Kong are of U.S. origin. Home-grown franchises
have also developed, especially in catering.
2. Joint Ventures
Joint ventures or strategic alliances can be very helpful in entering the market, and are
particularly important in competing for major catering projects.
In order to attract foreign investment, the HKG set up a special department called “Invest
Hong Kong” to help overseas companies establish a presence in Hong Kong by providing all
the support needed to establish and expand their operations (www.investhk.gov.hk).
Entering the Hong Kong market with products suitable for the HRI trade can be handled in a
number of ways. Certainly the end customer, the hotel, restaurant, institution or caterer
has an influence on the selection of products or ingredients but the choice is all very much
guided by a network of reliable and trusted suppliers.
3. Setting up a Representative Office
One of the most effective but costly means that U.S. companies can use to sell their
products to this market is to set up a representative office in Hong Kong. Information on
how to set up a new business in Hong Kong can be found at: http://www.success.tid.gov.hk/english/inf_ser/bus_sta_up_inf_ser/bus_sta_up_inf_ser.html
Page 13 of 28
4. Appointing Agents
U.S. exporters may consider hiring a local agent. A key consideration is whether the
prospective agent has a good marketing record and widespread distribution network. The
advantage of having an agent is that it can help with marketing and distribution. Some
companies may secure a very competitive price package with TV, magazine and radio for
advertisements. In addition, well-established companies have extensive distribution
networks not limited to the HRI sector but also to retail outlets.
Importers and distributors tend to focus on specific categories of products and end
markets. Research should be carried out to ensure the importer/distributor selected is
appropriate for your products.
Marketing Strategies
Identify key players for the products - ATO Hong Kong can provide lists of importers,
distributors, commodity cooperators and regional business groups.
Test marketing maybe required prior to establishing a presence in the market.
Communicate product benefits to end-users - although distributors maintain the
relationships with their customers, end users assert influence over the buying decisions. It
is important to directly educate all stakeholders as to the features and benefits of your
products.
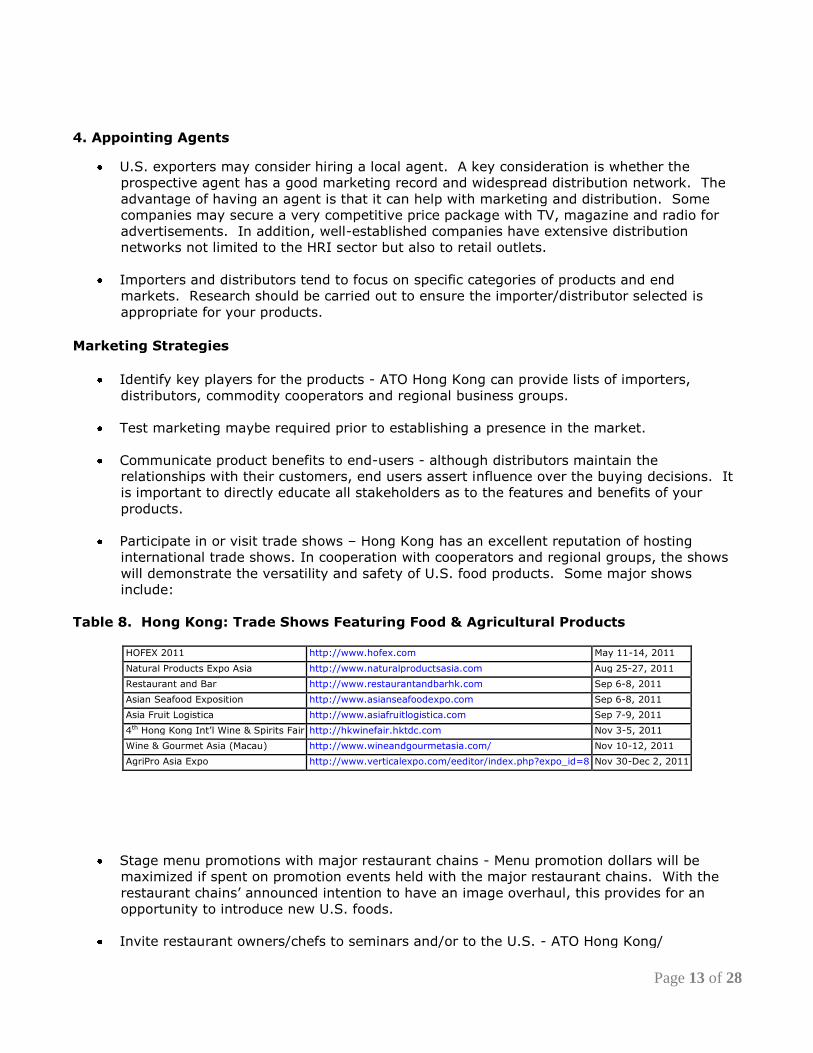
Participate in or visit trade shows – Hong Kong has an excellent reputation of hosting
international trade shows. In cooperation with cooperators and regional groups, the shows
will demonstrate the versatility and safety of U.S. food products. Some major shows
include:
Table 8. Hong Kong: Trade Shows Featuring Food & Agricultural Products
HOFEX 2011 http://www.hofex.com May 11-14, 2011 Natural Products Expo Asia http://www.naturalproductsasia.com Aug 25-27, 2011 Restaurant and Bar http://www.restaurantandbarhk.com Sep 6-8, 2011 Asian Seafood Exposition http://www.asianseafoodexpo.com Sep 6-8, 2011 Asia Fruit Logistica http://www.asiafruitlogistica.com Sep 7-9, 2011 4th Hong Kong Int’l Wine & Spirits Fair http://hkwinefair.hktdc.com Nov 3-5, 2011 Wine & Gourmet Asia (Macau) http://www.wineandgourmetasia.com/ Nov 10-12, 2011 AgriPro Asia Expo http://www.verticalexpo.com/eeditor/index.php?expo_id=8 Nov 30-Dec 2, 2011
Stage menu promotions with major restaurant chains - Menu promotion dollars will be
maximized if spent on promotion events held with the major restaurant chains. With the
restaurant chains’ announced intention to have an image overhaul, this provides for an
opportunity to introduce new U.S. foods.
Invite restaurant owners/chefs to seminars and/or to the U.S. - ATO Hong Kong/
Page 14 of 28
cooperators organize seminars and trade missions to the U.S. with an intention to introduce
U.S. products, meet U.S. exporters, and share with them food service operations in the U.S.
MAP Program
Small to medium sized U.S. food companies wishing to export their products can get funding
assistance from the USDA Market Access Program (MAP). The reimbursement rates for branded
promotions are equal to the percentage of U.S. origin content of the promoted agricultural
commodity or a rate of 50 percent, whichever is the lesser. If you are a producer or exporter and
want to participate in the MAP, please contact a trade association that represents your specific
product. If no trade association is applicable, please contact one of the four State regional trade
groups: Food Export USA - Northeast (FEUSA), Food Export Association of the Midwest USA (FEA),
Southern US Trade Association (SUSTA), and Western US Agricultural Trade Association
(WUSATA). For details of the MAP program and a list of trade associations, please contact our
office or visit the website: http://www.fas.usda.gov/mos/programs/maptoc.html
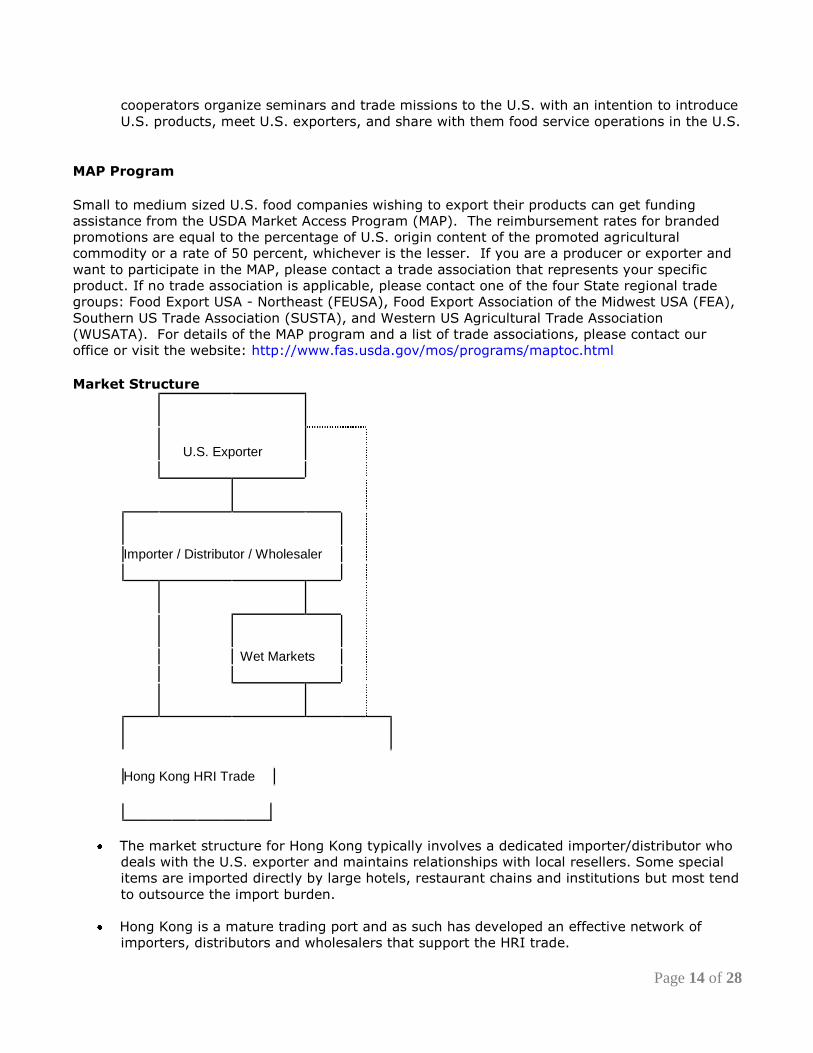
Market Structure
U.S. Exporter
Importer / Distributor / Wholesaler
Wet Markets
Hong Kong HRI Trade
The market structure for Hong Kong typically involves a dedicated importer/distributor who
deals with the U.S. exporter and maintains relationships with local resellers. Some special
items are imported directly by large hotels, restaurant chains and institutions but most tend
to outsource the import burden.
Hong Kong is a mature trading port and as such has developed an effective network of
importers, distributors and wholesalers that support the HRI trade.
Page 15 of 28
Most major importers/distributors service multiple reseller sectors including HRI/food
service, retail and wet markets.
ATO Hong Kong has a resourceful database of Hong Kong importers servicing the HRI
trade. For information regarding specific category suppliers, the ATO Hong Kong can
provide additional information.
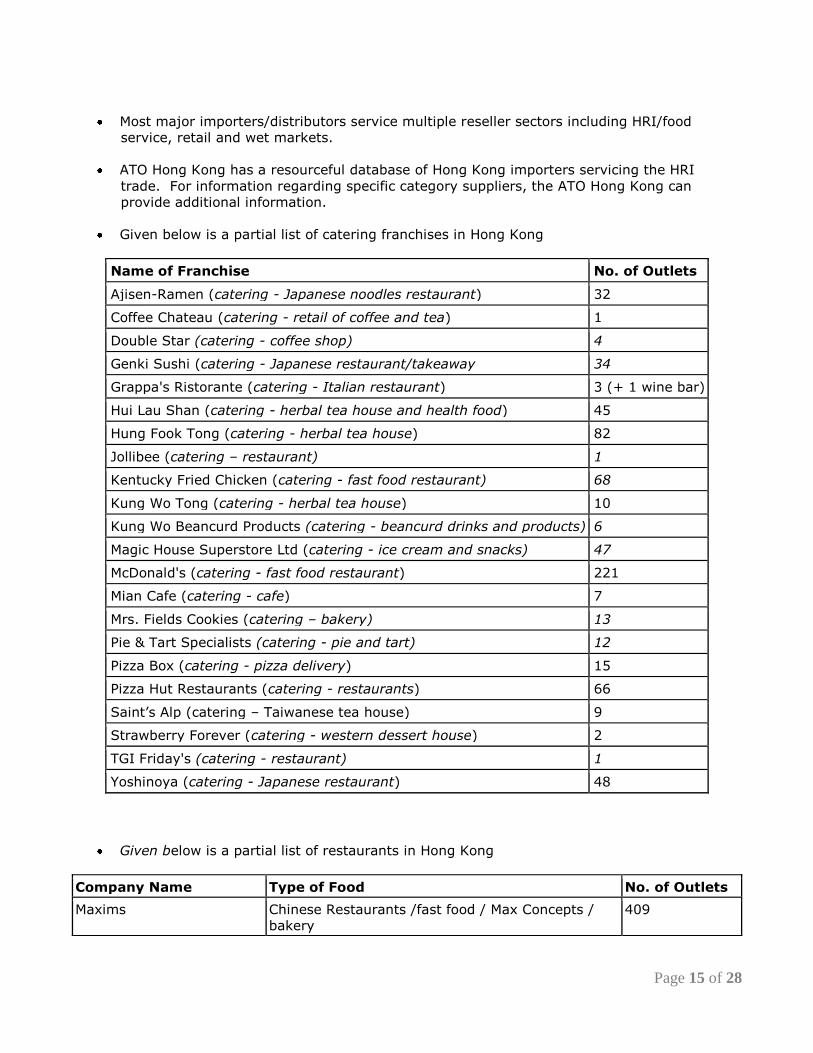
Given below is a partial list of catering franchises in Hong Kong
Name of Franchise No. of Outlets
Ajisen-Ramen (catering - Japanese noodles restaurant) 32
Coffee Chateau (catering - retail of coffee and tea) 1
Double Star (catering - coffee shop) 4
Genki Sushi (catering - Japanese restaurant/takeaway 34
Grappa's Ristorante (catering - Italian restaurant) 3 (+ 1 wine bar)
Hui Lau Shan (catering - herbal tea house and health food) 45
Hung Fook Tong (catering - herbal tea house) 82
Jollibee (catering – restaurant) 1
Kentucky Fried Chicken (catering - fast food restaurant) 68
Kung Wo Tong (catering - herbal tea house) 10
Kung Wo Beancurd Products (catering - beancurd drinks and products) 6
Magic House Superstore Ltd (catering - ice cream and snacks) 47
McDonald's (catering - fast food restaurant) 221
Mian Cafe (catering - cafe) 7
Mrs. Fields Cookies (catering – bakery) 13
Pie & Tart Specialists (catering - pie and tart) 12
Pizza Box (catering - pizza delivery) 15
Pizza Hut Restaurants (catering - restaurants) 66
Saint’s Alp (catering – Taiwanese tea house) 9
Strawberry Forever (catering - western dessert house) 2
TGI Friday's (catering - restaurant) 1
Yoshinoya (catering - Japanese restaurant) 48
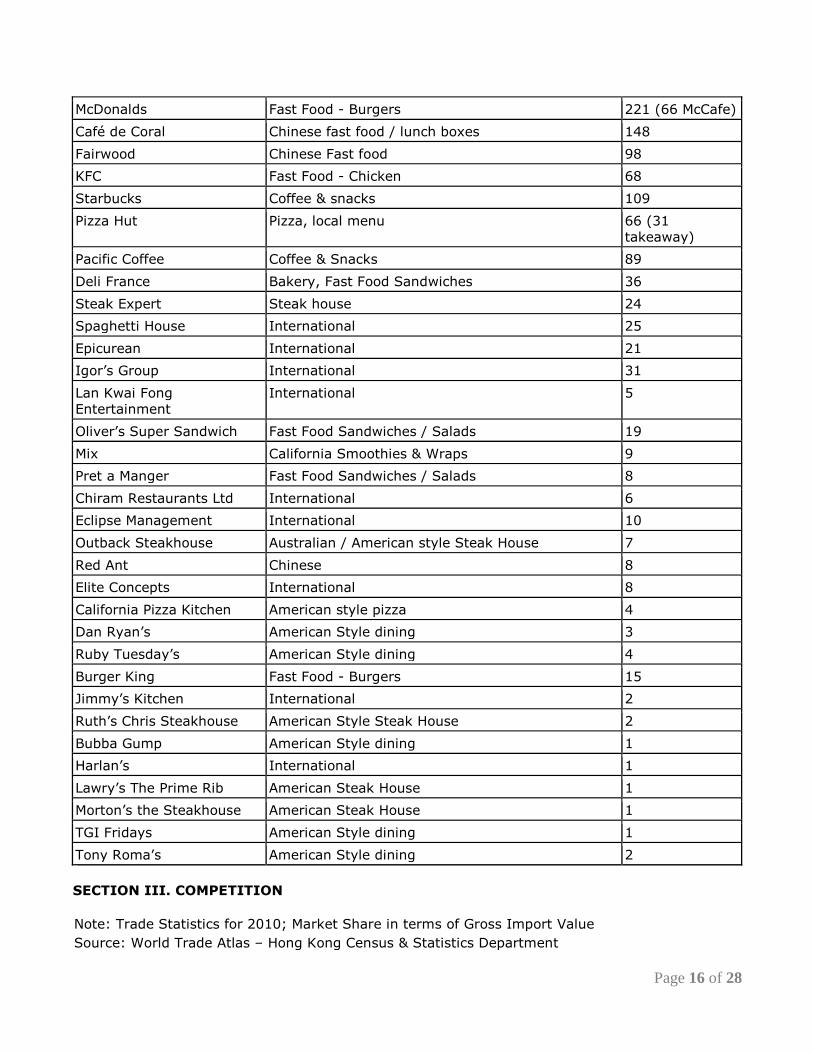
Given below is a partial list of restaurants in Hong Kong
Company Name Type of Food No. of Outlets
Maxims Chinese Restaurants /fast food / Max Concepts /
bakery
409
Page 16 of 28
McDonalds Fast Food - Burgers 221 (66 McCafe)
Café de Coral Chinese fast food / lunch boxes 148
Fairwood Chinese Fast food 98
KFC Fast Food - Chicken 68
Starbucks Coffee & snacks 109
Pizza Hut Pizza, local menu 66 (31
takeaway)
Pacific Coffee Coffee & Snacks 89
Deli France Bakery, Fast Food Sandwiches 36
Steak Expert Steak house 24
Spaghetti House International 25
Epicurean International 21
Igor’s Group International 31
Lan Kwai Fong
Entertainment
International 5
Oliver’s Super Sandwich Fast Food Sandwiches / Salads 19
Mix California Smoothies & Wraps 9
Pret a Manger Fast Food Sandwiches / Salads 8
Chiram Restaurants Ltd International 6
Eclipse Management International 10
Outback Steakhouse Australian / American style Steak House 7
Red Ant Chinese 8
Elite Concepts International 8
California Pizza Kitchen American style pizza 4
Dan Ryan’s American Style dining 3
Ruby Tuesday’s American Style dining 4
Burger King Fast Food - Burgers 15
Jimmy’s Kitchen International 2
Ruth’s Chris Steakhouse American Style Steak House 2
Bubba Gump American Style dining 1
Harlan’s International 1
Lawry’s The Prime Rib American Steak House 1
Morton’s the Steakhouse American Steak House 1
TGI Fridays American Style dining 1
Tony Roma’s American Style dining 2
SECTION III. COMPETITION
Note: Trade Statistics for 2010; Market Share in terms of Gross Import Value
Source: World Trade Atlas – Hong Kong Census & Statistics Department
Page 17 of 28
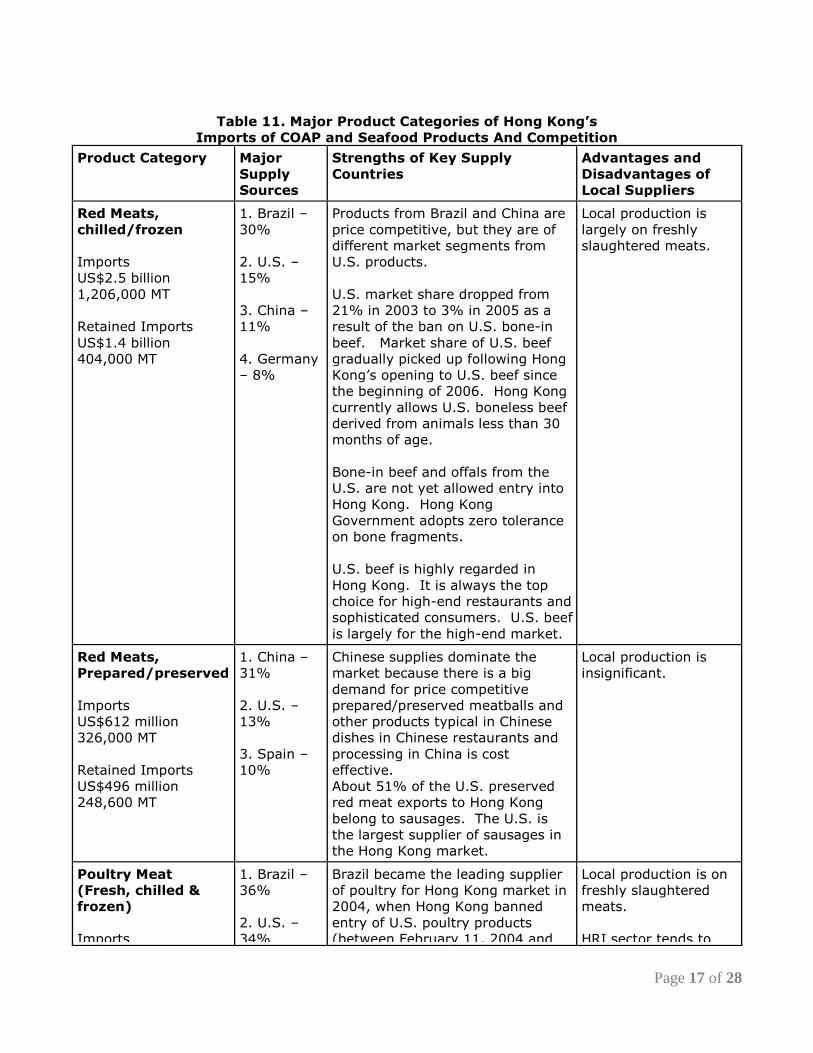
Table 11. Major Product Categories of Hong Kong’s
Imports of COAP and Seafood Products And Competition
Product Category Major
Supply
Sources
Strengths of Key Supply
Countries
Advantages and
Disadvantages of
Local Suppliers
Red Meats,
chilled/frozen
Imports
US$2.5 billion
1,206,000 MT
Retained Imports
US$1.4 billion
404,000 MT
1. Brazil –
30%
2. U.S. –
15%
3. China –
11%
4. Germany
– 8%
Products from Brazil and China are
price competitive, but they are of
different market segments from
U.S. products.
U.S. market share dropped from
21% in 2003 to 3% in 2005 as a
result of the ban on U.S. bone-in
beef. Market share of U.S. beef
gradually picked up following Hong
Kong’s opening to U.S. beef since
the beginning of 2006. Hong Kong
currently allows U.S. boneless beef
derived from animals less than 30
months of age.
Bone-in beef and offals from the
U.S. are not yet allowed entry into
Hong Kong. Hong Kong
Government adopts zero tolerance
on bone fragments.
U.S. beef is highly regarded in
Hong Kong. It is always the top
choice for high-end restaurants and
sophisticated consumers. U.S. beef
is largely for the high-end market.
Local production is
largely on freshly
slaughtered meats.
Red Meats,
Prepared/preserved
Imports
US$612 million
326,000 MT
Retained Imports
US$496 million
248,600 MT
1. China –
31%
2. U.S. –
13%
3. Spain –
10%
Chinese supplies dominate the
market because there is a big
demand for price competitive
prepared/preserved meatballs and
other products typical in Chinese
dishes in Chinese restaurants and
processing in China is cost
effective.
About 51% of the U.S. preserved
red meat exports to Hong Kong
belong to sausages. The U.S. is
the largest supplier of sausages in
the Hong Kong market.
Local production is
insignificant.
Poultry Meat
(Fresh, chilled &
frozen)
Imports
1. Brazil –
36%
2. U.S. –
34%
Brazil became the leading supplier
of poultry for Hong Kong market in
2004, when Hong Kong banned
entry of U.S. poultry products
(between February 11, 2004 and
Local production is on
freshly slaughtered
meats.
HRI sector tends to
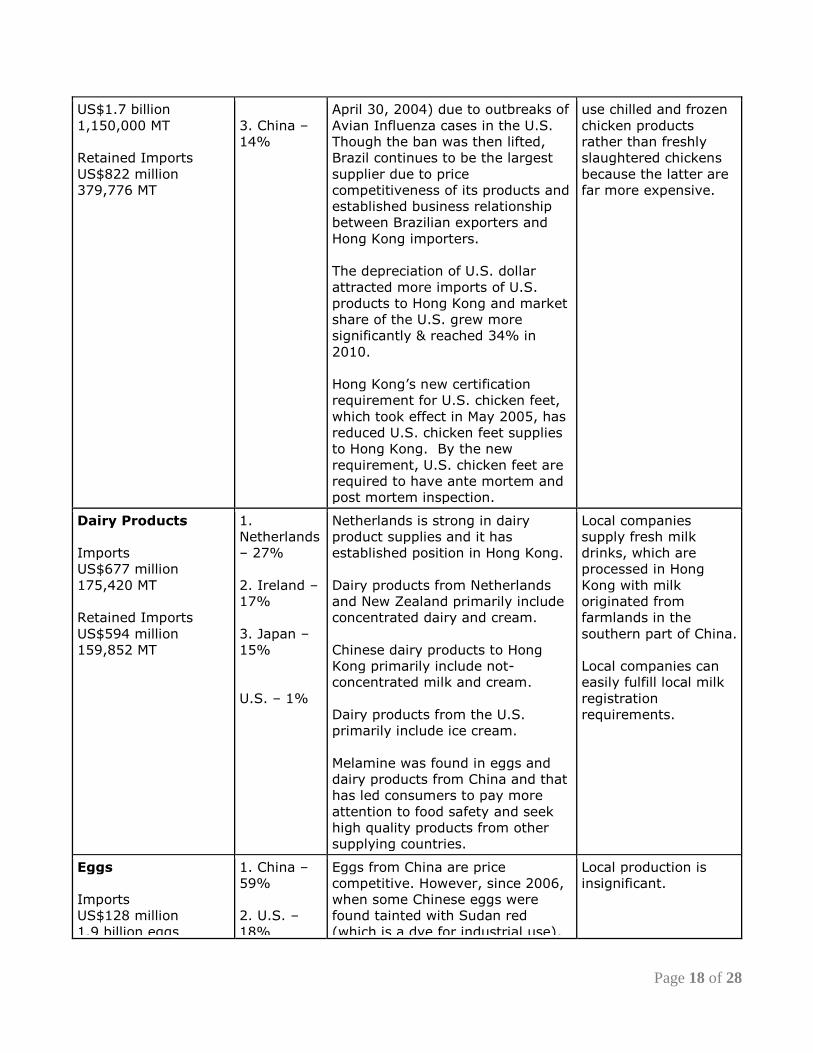
Page 18 of 28
US$1.7 billion
1,150,000 MT
Retained Imports
US$822 million
379,776 MT
3. China –
14%
April 30, 2004) due to outbreaks of
Avian Influenza cases in the U.S.
Though the ban was then lifted,
Brazil continues to be the largest
supplier due to price
competitiveness of its products and
established business relationship
between Brazilian exporters and
Hong Kong importers.
The depreciation of U.S. dollar
attracted more imports of U.S.
products to Hong Kong and market
share of the U.S. grew more
significantly & reached 34% in
2010.
Hong Kong’s new certification
requirement for U.S. chicken feet,
which took effect in May 2005, has
reduced U.S. chicken feet supplies
to Hong Kong. By the new
requirement, U.S. chicken feet are
required to have ante mortem and
post mortem inspection.
use chilled and frozen
chicken products
rather than freshly
slaughtered chickens
because the latter are
far more expensive.
Dairy Products
Imports
US$677 million
175,420 MT
Retained Imports
US$594 million
159,852 MT
1.
Netherlands
– 27%
2. Ireland –
17%
3. Japan –
15%
U.S. – 1%
Netherlands is strong in dairy
product supplies and it has
established position in Hong Kong.
Dairy products from Netherlands
and New Zealand primarily include
concentrated dairy and cream.
Chinese dairy products to Hong
Kong primarily include not-
concentrated milk and cream.
Dairy products from the U.S.
primarily include ice cream.
Melamine was found in eggs and
dairy products from China and that
has led consumers to pay more
attention to food safety and seek
high quality products from other
supplying countries.
Local companies
supply fresh milk
drinks, which are
processed in Hong
Kong with milk
originated from
farmlands in the
southern part of China.
Local companies can
easily fulfill local milk
registration
requirements.
Eggs
Imports
US$128 million
1.9 billion eggs
1. China –
59%
2. U.S. –
18%
Eggs from China are price
competitive. However, since 2006,
when some Chinese eggs were
found tainted with Sudan red
(which is a dye for industrial use),
Local production is
insignificant.
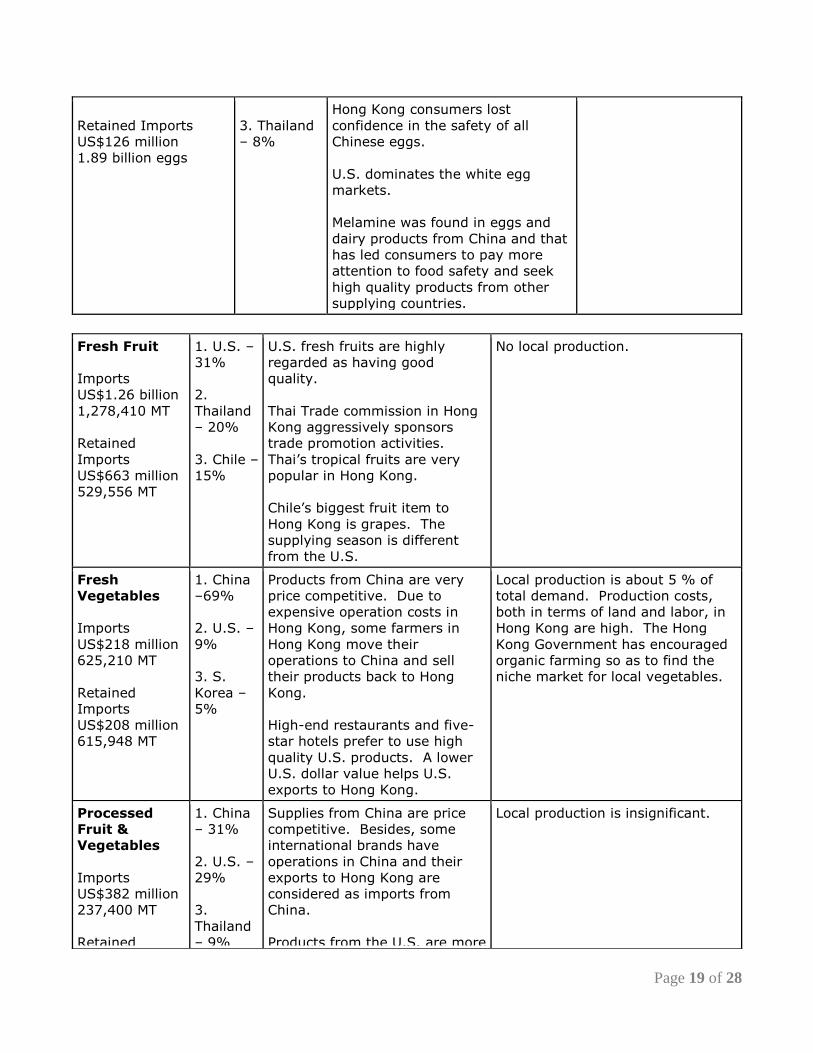
Page 19 of 28
Retained Imports
US$126 million
1.89 billion eggs
3. Thailand
– 8%
Hong Kong consumers lost
confidence in the safety of all
Chinese eggs.
U.S. dominates the white egg
markets.
Melamine was found in eggs and
dairy products from China and that
has led consumers to pay more
attention to food safety and seek
high quality products from other
supplying countries.
Fresh Fruit
Imports
US$1.26 billion
1,278,410 MT
Retained
Imports
US$663 million
529,556 MT
1. U.S. –
31%
2.
Thailand
– 20%
3. Chile –
15%
U.S. fresh fruits are highly
regarded as having good
quality.
Thai Trade commission in Hong
Kong aggressively sponsors
trade promotion activities.
Thai’s tropical fruits are very
popular in Hong Kong.
Chile’s biggest fruit item to
Hong Kong is grapes. The
supplying season is different
from the U.S.
No local production.
Fresh
Vegetables
Imports
US$218 million
625,210 MT
Retained
Imports
US$208 million
615,948 MT
1. China
–69%
2. U.S. –
9%
3. S.
Korea –
5%
Products from China are very
price competitive. Due to
expensive operation costs in
Hong Kong, some farmers in
Hong Kong move their
operations to China and sell
their products back to Hong
Kong.
High-end restaurants and five-
star hotels prefer to use high
quality U.S. products. A lower
U.S. dollar value helps U.S.
exports to Hong Kong.
Local production is about 5 % of
total demand. Production costs,
both in terms of land and labor, in
Hong Kong are high. The Hong
Kong Government has encouraged
organic farming so as to find the
niche market for local vegetables.
Processed
Fruit &
Vegetables
Imports
US$382 million
237,400 MT
Retained
1. China
– 31%
2. U.S. –
29%
3.
Thailand
– 9%
Supplies from China are price
competitive. Besides, some
international brands have
operations in China and their
exports to Hong Kong are
considered as imports from
China.
Products from the U.S. are more
Local production is insignificant.
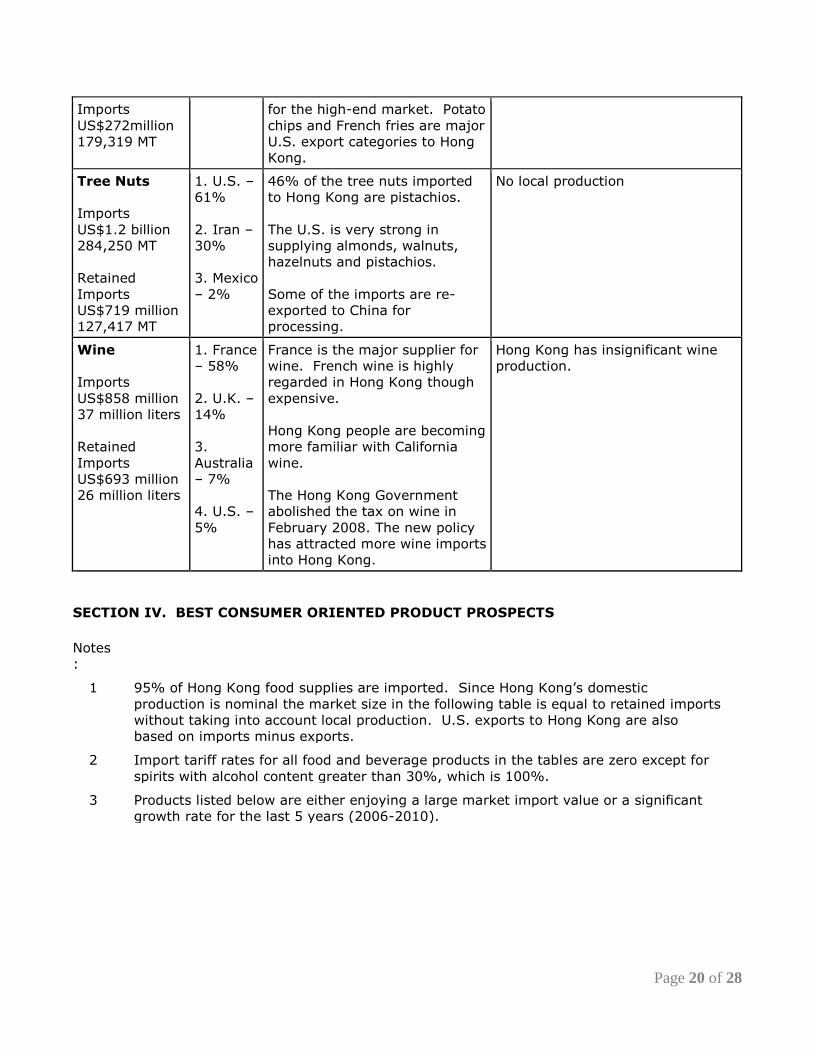
Page 20 of 28
Imports
US$272million
179,319 MT
for the high-end market. Potato
chips and French fries are major
U.S. export categories to Hong
Kong.
Tree Nuts
Imports
US$1.2 billion
284,250 MT
Retained
Imports
US$719 million
127,417 MT
1. U.S. –
61%
2. Iran –
30%
3. Mexico
– 2%
46% of the tree nuts imported
to Hong Kong are pistachios.
The U.S. is very strong in
supplying almonds, walnuts,
hazelnuts and pistachios.
Some of the imports are re-
exported to China for
processing.
No local production
Wine
Imports
US$858 million
37 million liters
Retained
Imports
US$693 million
26 million liters
1. France
– 58%
2. U.K. –
14%
3.
Australia
– 7%
4. U.S. –
5%
France is the major supplier for
wine. French wine is highly
regarded in Hong Kong though
expensive.
Hong Kong people are becoming
more familiar with California
wine.
The Hong Kong Government
abolished the tax on wine in
February 2008. The new policy
has attracted more wine imports
into Hong Kong.
Hong Kong has insignificant wine
production.
SECTION IV. BEST CONSUMER ORIENTED PRODUCT PROSPECTS
Notes
:
1 95% of Hong Kong food supplies are imported. Since Hong Kong’s domestic
production is nominal the market size in the following table is equal to retained imports
without taking into account local production. U.S. exports to Hong Kong are also
based on imports minus exports.
2 Import tariff rates for all food and beverage products in the tables are zero except for
spirits with alcohol content greater than 30%, which is 100%.
3 Products listed below are either enjoying a large market import value or a significant
growth rate for the last 5 years (2006-2010).
Page 21 of 28
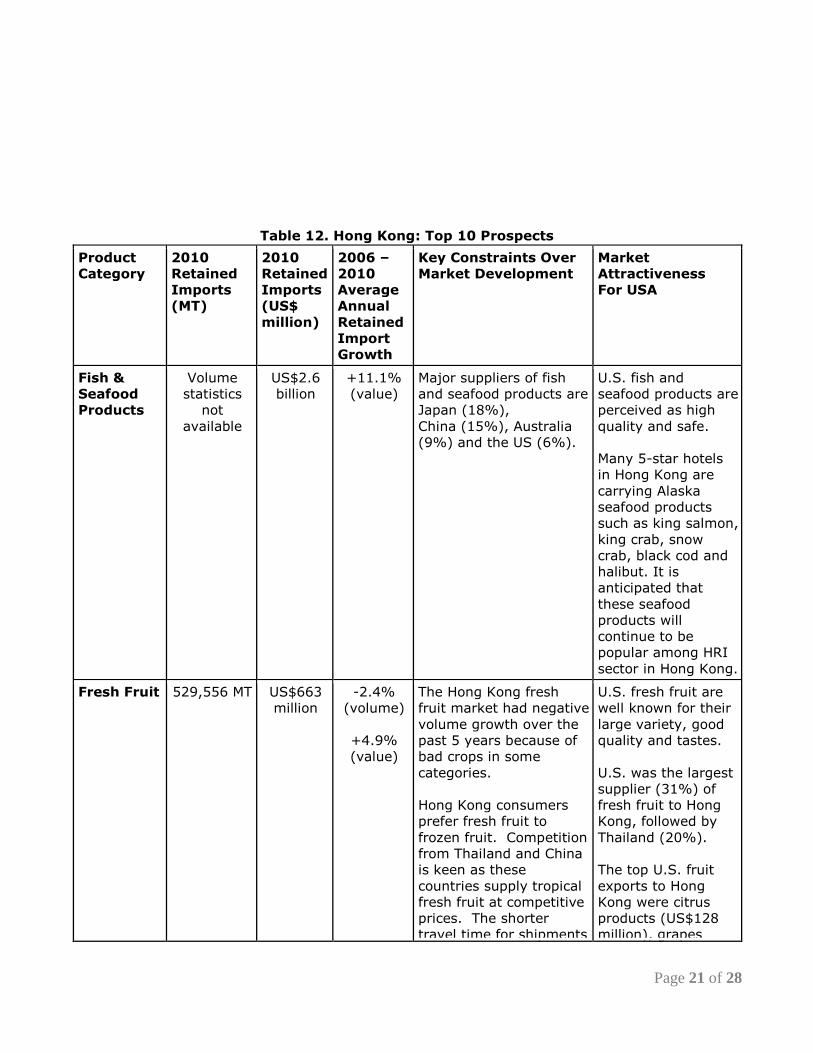
Table 12. Hong Kong: Top 10 Prospects
Product
Category
2010
Retained
Imports
(MT)
2010
Retained
Imports
(US$
million)
2006 –
2010
Average
Annual
Retained
Import
Growth
Key Constraints Over
Market Development
Market
Attractiveness
For USA
Fish &
Seafood
Products
Volume
statistics
not
available
US$2.6
billion
+11.1%
(value)
Major suppliers of fish
and seafood products are
Japan (18%),
China (15%), Australia
(9%) and the US (6%).
U.S. fish and
seafood products are
perceived as high
quality and safe.
Many 5-star hotels
in Hong Kong are
carrying Alaska
seafood products
such as king salmon,
king crab, snow
crab, black cod and
halibut. It is
anticipated that
these seafood
products will
continue to be
popular among HRI
sector in Hong Kong.
Fresh Fruit 529,556 MT
US$663
million
-2.4%
(volume)
+4.9%
(value)
The Hong Kong fresh
fruit market had negative
volume growth over the
past 5 years because of
bad crops in some
categories.
Hong Kong consumers
prefer fresh fruit to
frozen fruit. Competition
from Thailand and China
is keen as these
countries supply tropical
fresh fruit at competitive
prices. The shorter
travel time for shipments
U.S. fresh fruit are
well known for their
large variety, good
quality and tastes.
U.S. was the largest
supplier (31%) of
fresh fruit to Hong
Kong, followed by
Thailand (20%).
The top U.S. fruit
exports to Hong
Kong were citrus
products (US$128
million), grapes
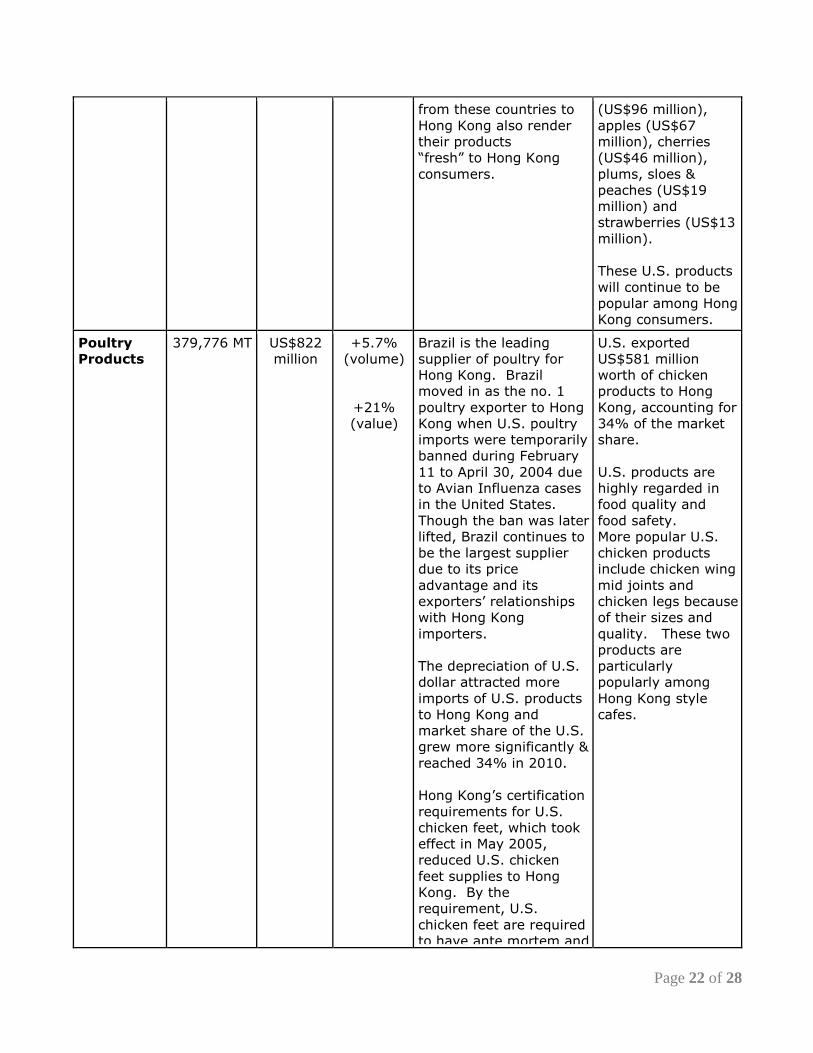
Page 22 of 28
from these countries to
Hong Kong also render
their products
“fresh” to Hong Kong
consumers.
(US$96 million),
apples (US$67
million), cherries
(US$46 million),
plums, sloes &
peaches (US$19
million) and
strawberries (US$13
million).
These U.S. products
will continue to be
popular among Hong
Kong consumers.
Poultry
Products
379,776 MT
US$822
million
+5.7%
(volume)
+21%
(value)
Brazil is the leading
supplier of poultry for
Hong Kong. Brazil
moved in as the no. 1
poultry exporter to Hong
Kong when U.S. poultry
imports were temporarily
banned during February
11 to April 30, 2004 due
to Avian Influenza cases
in the United States.
Though the ban was later
lifted, Brazil continues to
be the largest supplier
due to its price
advantage and its
exporters’ relationships
with Hong Kong
importers.
The depreciation of U.S.
dollar attracted more
imports of U.S. products
to Hong Kong and
market share of the U.S.
grew more significantly &
reached 34% in 2010.
Hong Kong’s certification
requirements for U.S.
chicken feet, which took
effect in May 2005,
reduced U.S. chicken
feet supplies to Hong
Kong. By the
requirement, U.S.
chicken feet are required
to have ante mortem and
U.S. exported
US$581 million
worth of chicken
products to Hong
Kong, accounting for
34% of the market
share.
U.S. products are
highly regarded in
food quality and
food safety.
More popular U.S.
chicken products
include chicken wing
mid joints and
chicken legs because
of their sizes and
quality. These two
products are
particularly
popularly among
Hong Kong style
cafes.
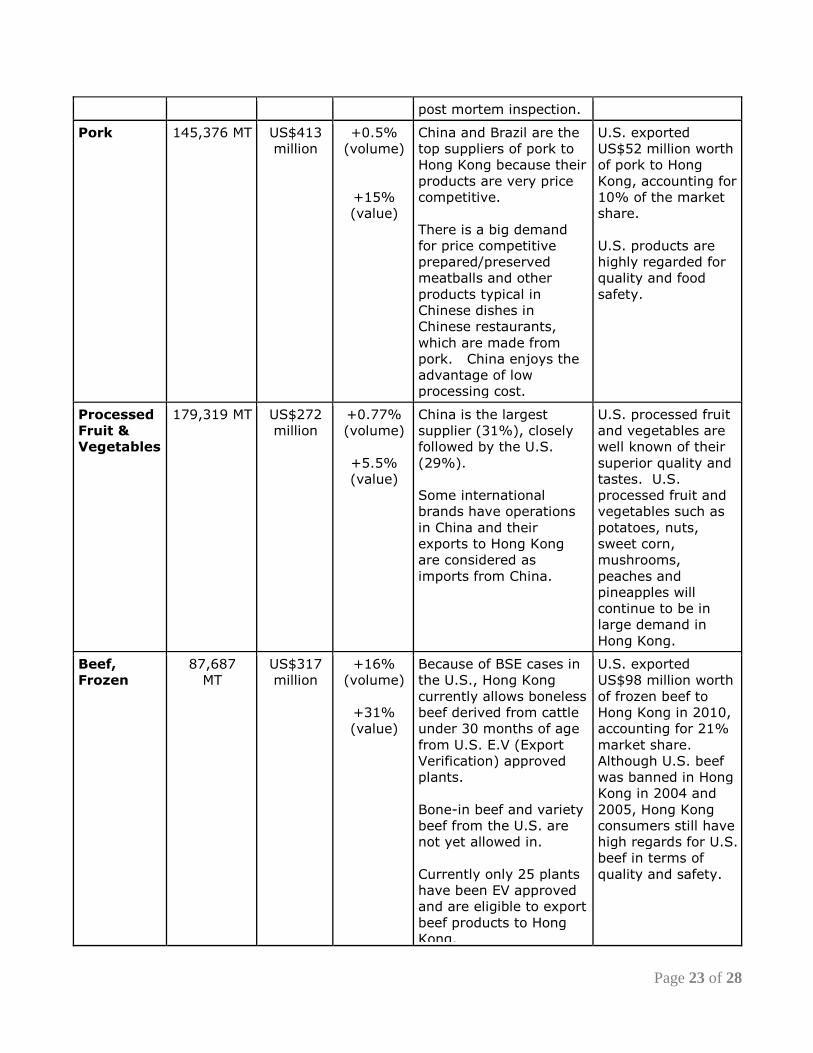
Page 23 of 28
post mortem inspection.
Pork 145,376 MT
US$413
million
+0.5%
(volume)
+15%
(value)
China and Brazil are the
top suppliers of pork to
Hong Kong because their
products are very price
competitive.
There is a big demand
for price competitive
prepared/preserved
meatballs and other
products typical in
Chinese dishes in
Chinese restaurants,
which are made from
pork. China enjoys the
advantage of low
processing cost.
U.S. exported
US$52 million worth
of pork to Hong
Kong, accounting for
10% of the market
share.
U.S. products are
highly regarded for
quality and food
safety.
Processed
Fruit &
Vegetables
179,319 MT
US$272
million
+0.77%
(volume)
+5.5%
(value)
China is the largest
supplier (31%), closely
followed by the U.S.
(29%).
Some international
brands have operations
in China and their
exports to Hong Kong
are considered as
imports from China.
U.S. processed fruit
and vegetables are
well known of their
superior quality and
tastes. U.S.
processed fruit and
vegetables such as
potatoes, nuts,
sweet corn,
mushrooms,
peaches and
pineapples will
continue to be in
large demand in
Hong Kong.
Beef,
Frozen
87,687
MT
US$317
million
+16%
(volume)
+31%
(value)
Because of BSE cases in
the U.S., Hong Kong
currently allows boneless
beef derived from cattle
under 30 months of age
from U.S. E.V (Export
Verification) approved
plants.
Bone-in beef and variety
beef from the U.S. are
not yet allowed in.
Currently only 25 plants
have been EV approved
and are eligible to export
beef products to Hong
Kong.
U.S. exported
US$98 million worth
of frozen beef to
Hong Kong in 2010,
accounting for 21%
market share.
Although U.S. beef
was banned in Hong
Kong in 2004 and
2005, Hong Kong
consumers still have
high regards for U.S.
beef in terms of
quality and safety.
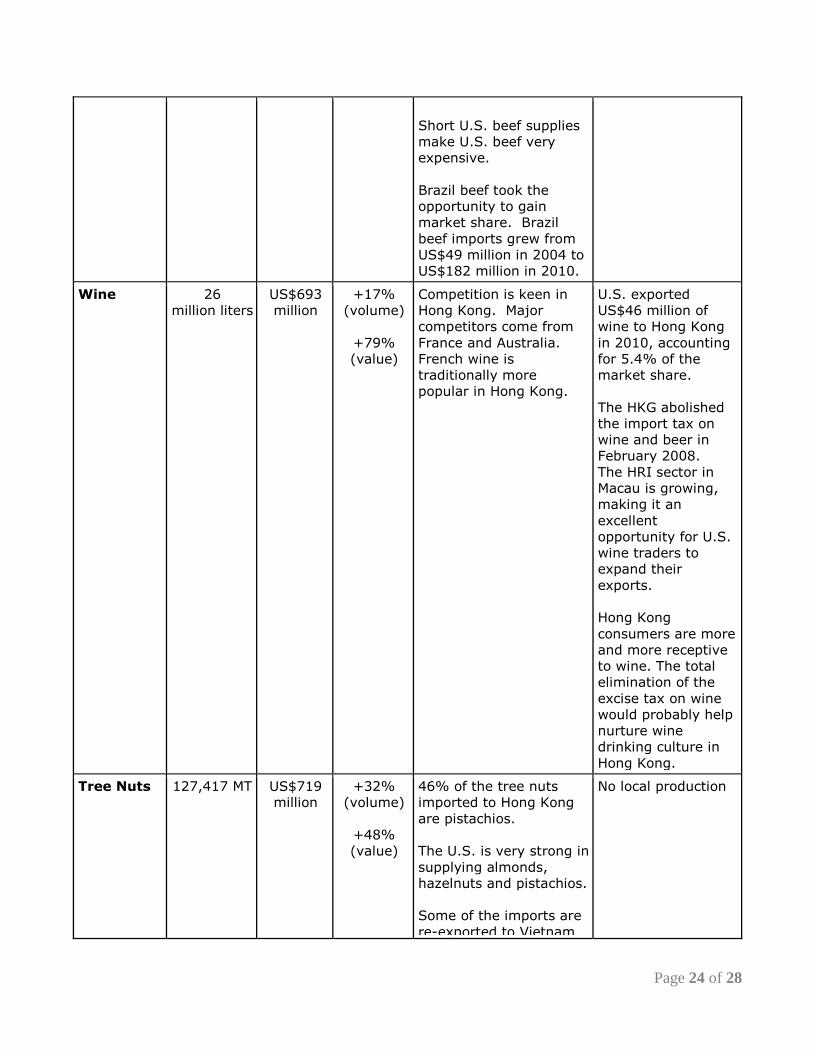
Page 24 of 28
Short U.S. beef supplies
make U.S. beef very
expensive.
Brazil beef took the
opportunity to gain
market share. Brazil
beef imports grew from
US$49 million in 2004 to
US$182 million in 2010.
Wine 26
million liters
US$693
million
+17%
(volume)
+79%
(value)
Competition is keen in
Hong Kong. Major
competitors come from
France and Australia.
French wine is
traditionally more
popular in Hong Kong.
U.S. exported
US$46 million of
wine to Hong Kong
in 2010, accounting
for 5.4% of the
market share.
The HKG abolished
the import tax on
wine and beer in
February 2008.
The HRI sector in
Macau is growing,
making it an
excellent
opportunity for U.S.
wine traders to
expand their
exports.
Hong Kong
consumers are more
and more receptive
to wine. The total
elimination of the
excise tax on wine
would probably help
nurture wine
drinking culture in
Hong Kong.
Tree Nuts 127,417 MT
US$719
million
+32%
(volume)
+48%
(value)
46% of the tree nuts
imported to Hong Kong
are pistachios.
The U.S. is very strong in
supplying almonds,
hazelnuts and pistachios.
Some of the imports are
re-exported to Vietnam
No local production
Page 25 of 28
and China for processing.
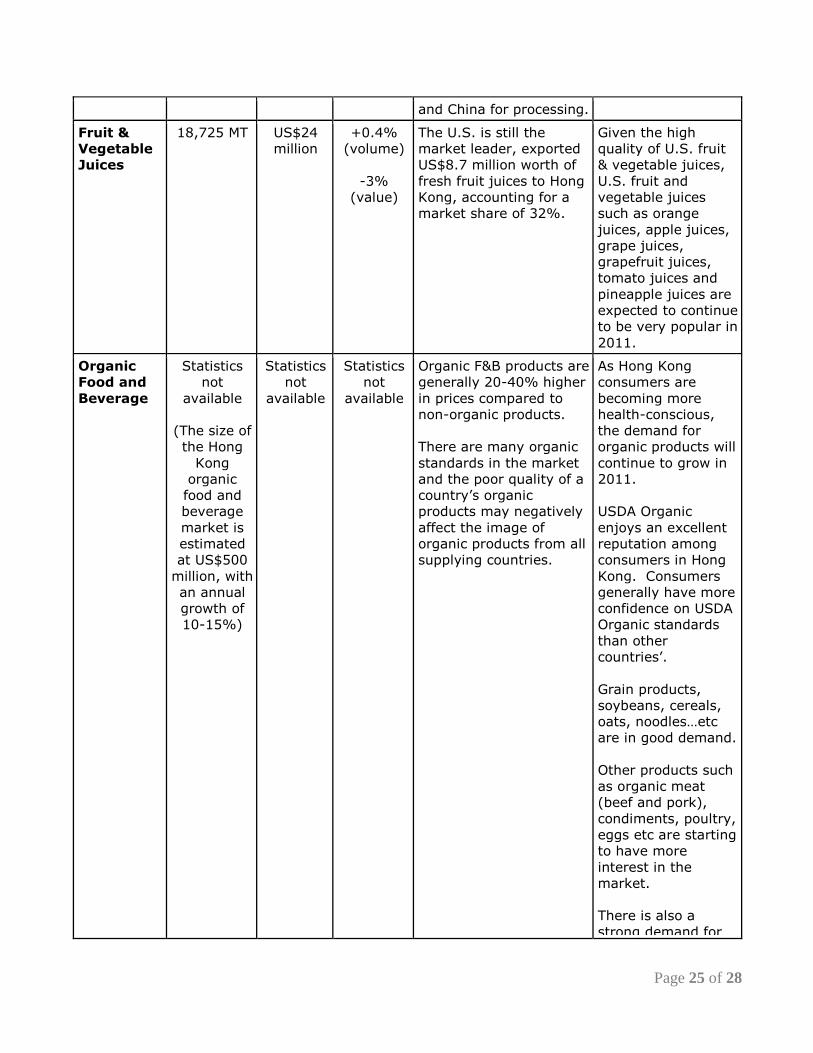
Fruit &
Vegetable
Juices
18,725 MT
US$24
million
+0.4%
(volume)
-3%
(value)
The U.S. is still the
market leader, exported
US$8.7 million worth of
fresh fruit juices to Hong
Kong, accounting for a
market share of 32%.
Given the high
quality of U.S. fruit
& vegetable juices,
U.S. fruit and
vegetable juices
such as orange
juices, apple juices,
grape juices,
grapefruit juices,
tomato juices and
pineapple juices are
expected to continue
to be very popular in
2011.
Organic
Food and
Beverage
Statistics
not
available
(The size of
the Hong
Kong
organic
food and
beverage
market is
estimated
at US$500
million, with
an annual
growth of
10-15%)
Statistics
not
available
Statistics
not
available
Organic F&B products are
generally 20-40% higher
in prices compared to
non-organic products.
There are many organic
standards in the market
and the poor quality of a
country’s organic
products may negatively
affect the image of
organic products from all
supplying countries.
As Hong Kong
consumers are
becoming more
health-conscious,
the demand for
organic products will
continue to grow in
2011.
USDA Organic
enjoys an excellent
reputation among
consumers in Hong
Kong. Consumers
generally have more
confidence on USDA
Organic standards
than other
countries’.
Grain products,
soybeans, cereals,
oats, noodles…etc
are in good demand.
Other products such
as organic meat
(beef and pork),
condiments, poultry,
eggs etc are starting
to have more
interest in the
market.
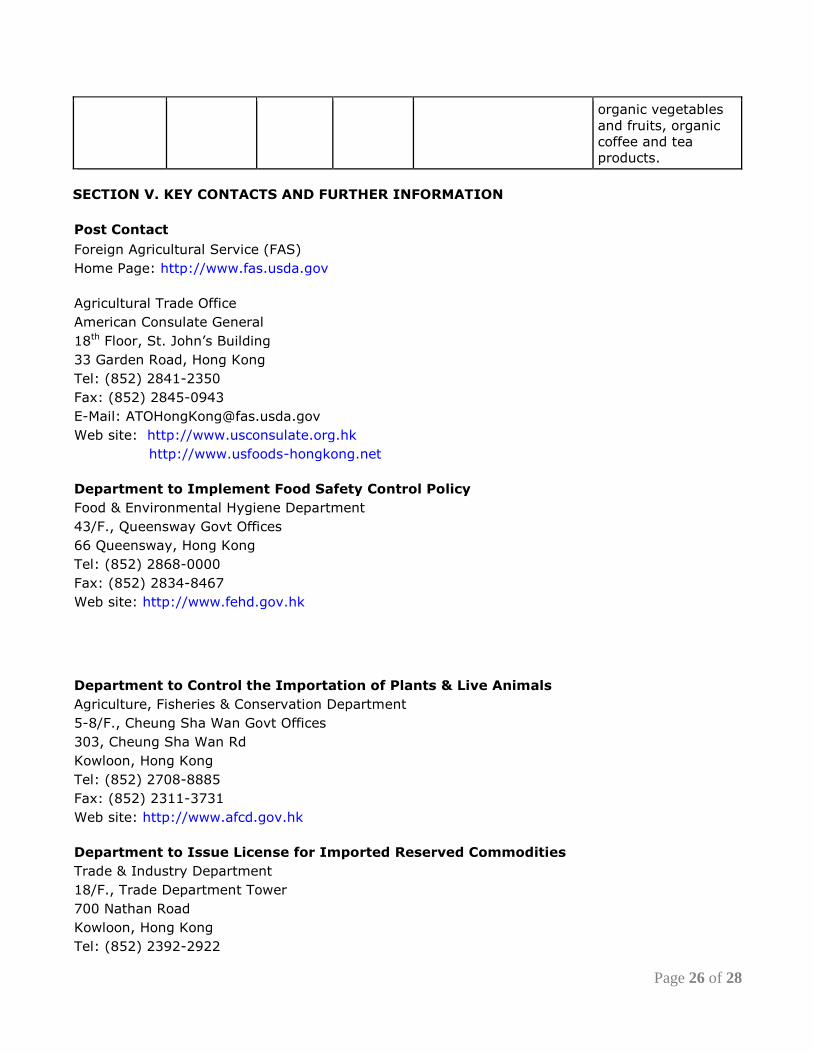
There is also a
strong demand for
Page 26 of 28
organic vegetables
and fruits, organic
coffee and tea
products.
SECTION V. KEY CONTACTS AND FURTHER INFORMATION
Post Contact
Foreign Agricultural Service (FAS)
Home Page: http://www.fas.usda.gov
Agricultural Trade Office
American Consulate General
18th Floor, St. John’s Building
33 Garden Road, Hong Kong
Tel: (852) 2841-2350
Fax: (852) 2845-0943
E-Mail: [email protected]
Web site: http://www.usconsulate.org.hk
http://www.usfoods-hongkong.net
Department to Implement Food Safety Control Policy
Food & Environmental Hygiene Department
43/F., Queensway Govt Offices
66 Queensway, Hong Kong
Tel: (852) 2868-0000
Fax: (852) 2834-8467
Web site: http://www.fehd.gov.hk
Department to Control the Importation of Plants & Live Animals
Agriculture, Fisheries & Conservation Department
5-8/F., Cheung Sha Wan Govt Offices
303, Cheung Sha Wan Rd
Kowloon, Hong Kong
Tel: (852) 2708-8885
Fax: (852) 2311-3731
Web site: http://www.afcd.gov.hk
Department to Issue License for Imported Reserved Commodities
Trade & Industry Department
18/F., Trade Department Tower
700 Nathan Road
Kowloon, Hong Kong
Tel: (852) 2392-2922
Page 27 of 28
Fax: (852) 2789-2491
Web site: http://www.tid.gov.hk
Department to Register Health Foods Containing Medicine Ingredients
Department of Health
Pharmaceuticals Registration
Import & Export Control Section
18th Floor, Wu Chung House
213 Queen’s Road East, Wanchai, Hong Kong
Tel: (852) 2961-8754
Fax: (852) 2834-5117
Web site: http://www.dh.gov.hk
Department to Issue License for Imported Dutiable Commodities
Hong Kong Customs & Excise Department
Office of Dutiable Commodities Administration
6-9th floors, Harbor Building
38 Pier Road, Central, Hong Kong
Tel: (852) 2815-7711
Fax: (852) 2581-0218
Web site: http://www.customs.gov.hk
Department for Trade Mark Registration
Intellectual Property Department
Trade Marks Registry
24th and 25th Floors, Wu Chung House
213 Queen’s Road East
Wan Chai, Hong Kong
Tel: (852) 2803-5860
Fax: (852) 2838-6082
Web site: http://www.ipd.gov.hk
Semi-Government Organization Providing Travel Information
Hong Kong Tourist Board
9th - 11th floors, Citicorp Center,
18 Whitfield Road, North Point, Hong Kong
Tel: (852) 2807-6543
Fax: (852) 2806-0303
Web site: www.hktourismboard.com
Semi-Government Organization Providing Hong Kong Trade Information
Hong Kong Trade Development Council
38th Floor, Office Tower, Convention Plaza
1 Harbor Road, Wanchai, Hong Kong
Tel: (852) 2584-4188
Fax: (852) 2824-0249
Web site: http://www.tdctrade.com

Page 28 of 28