Embed Size (px)
Citation preview

Page 1 of 24
THIS REPORT CONTAINS ASSESSMENTS OF COMMODITY AND TRADE ISSUES MADE BY
USDA STAFF AND NOT NECESSARILY STATEMENTS OF OFFICIAL U.S. GOVERNMENT
POLICY
Date:
GAIN Report Number:
Approved By:
Prepared By:
Report Highlights:
Hong Kong food service sector recorded modest growth in 2012, with restaurant receipts reached
US$12 billion, an increase of 5% over 2011. Hong Kong imports of high value food products from
the U.S. reached US$3.45 billion in 2012, consolidating our position as the leading food supplier to
Hong Kong. It is expected that Hong Kong will maintain its position as one of the top 5 markets
for U.S. consumer ready food products in 2013, as it continues to be a major buying center and
transshipment point for other markets in the region. Economic growth in Hong Kong is forecast to
be 3% in 2013. Post expects that U.S. products will continue to fair well due to competitive prices
and consumer confidence in the quality and safety of U.S. products.
Chris Li
Erich Kuss
2013
Food Service - Hotel Restaurant Institutional
Hong Kong
HK1319
5/1/2013
Required Report - public distribution
Page 2 of 24
SECTION I. HONG KONG MARKET PROFILE
HRI Food Service Sector
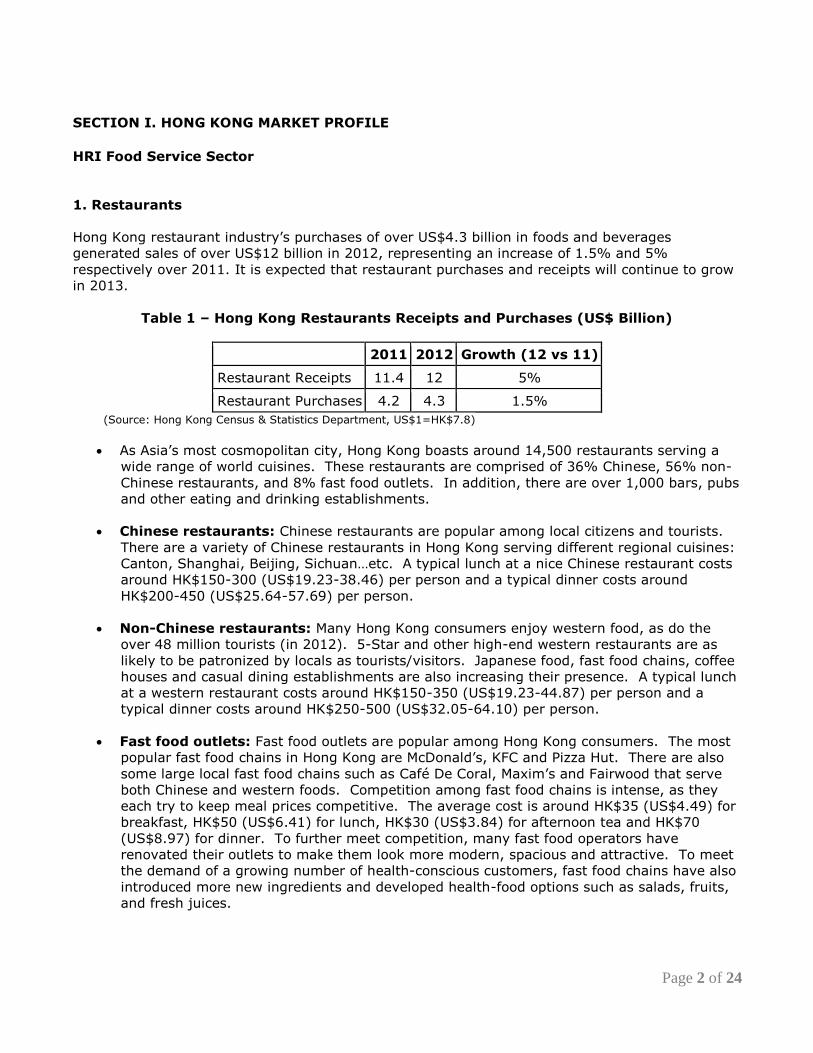
1. Restaurants
Hong Kong restaurant industry’s purchases of over US$4.3 billion in foods and beverages
generated sales of over US$12 billion in 2012, representing an increase of 1.5% and 5%
respectively over 2011. It is expected that restaurant purchases and receipts will continue to grow
in 2013.
Table 1 – Hong Kong Restaurants Receipts and Purchases (US$ Billion)
2011 2012 Growth (12 vs 11)
Restaurant Receipts 11.4 12 5%
Restaurant Purchases 4.2 4.3 1.5%
(Source: Hong Kong Census & Statistics Department, US$1=HK$7.8)
As Asia’s most cosmopolitan city, Hong Kong boasts around 14,500 restaurants serving a
wide range of world cuisines. These restaurants are comprised of 36% Chinese, 56% non-
Chinese restaurants, and 8% fast food outlets. In addition, there are over 1,000 bars, pubs
and other eating and drinking establishments.
Chinese restaurants: Chinese restaurants are popular among local citizens and tourists.
There are a variety of Chinese restaurants in Hong Kong serving different regional cuisines:
Canton, Shanghai, Beijing, Sichuan…etc. A typical lunch at a nice Chinese restaurant costs
around HK$150-300 (US$19.23-38.46) per person and a typical dinner costs around
HK$200-450 (US$25.64-57.69) per person.
Non-Chinese restaurants: Many Hong Kong consumers enjoy western food, as do the
over 48 million tourists (in 2012). 5-Star and other high-end western restaurants are as
likely to be patronized by locals as tourists/visitors. Japanese food, fast food chains, coffee
houses and casual dining establishments are also increasing their presence. A typical lunch
at a western restaurant costs around HK$150-350 (US$19.23-44.87) per person and a
typical dinner costs around HK$250-500 (US$32.05-64.10) per person.
Fast food outlets: Fast food outlets are popular among Hong Kong consumers. The most
popular fast food chains in Hong Kong are McDonald’s, KFC and Pizza Hut. There are also
some large local fast food chains such as Café De Coral, Maxim’s and Fairwood that serve
both Chinese and western foods. Competition among fast food chains is intense, as they
each try to keep meal prices competitive. The average cost is around HK$35 (US$4.49) for
breakfast, HK$50 (US$6.41) for lunch, HK$30 (US$3.84) for afternoon tea and HK$70
(US$8.97) for dinner. To further meet competition, many fast food operators have
renovated their outlets to make them look more modern, spacious and attractive. To meet
the demand of a growing number of health-conscious customers, fast food chains have also
introduced more new ingredients and developed health-food options such as salads, fruits,
and fresh juices.
Page 3 of 24
Coffee Shops: The coffee shop market continues to grow in Hong Kong’s commercial
areas. The two largest coffee house outlets are Starbucks – operating 125 outlets and
Pacific Coffee 120 outlets. Most shops also offer basic menus consisting of muffins,
pastries, cakes, sandwiches, and bottled beverages (juices and water). McDonald’s has
also vigorously expanded its McCafe in order to gain share in this growing market. Of its
235 outlets, 84 include a McCafe inside their shops.
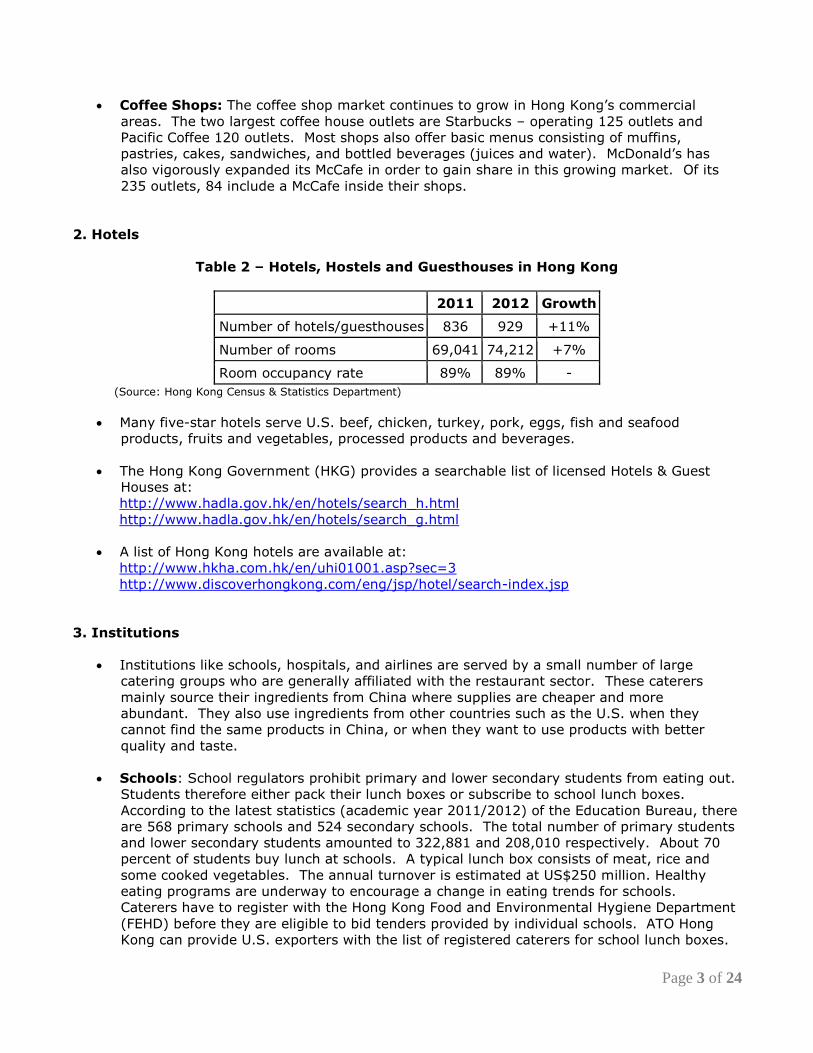
2. Hotels
Table 2 – Hotels, Hostels and Guesthouses in Hong Kong
2011 2012 Growth
Number of hotels/guesthouses 836 929 +11%
Number of rooms 69,041 74,212 +7%
Room occupancy rate 89% 89% -
(Source: Hong Kong Census & Statistics Department)
Many five-star hotels serve U.S. beef, chicken, turkey, pork, eggs, fish and seafood
products, fruits and vegetables, processed products and beverages.
The Hong Kong Government (HKG) provides a searchable list of licensed Hotels & Guest
Houses at:
http://www.hadla.gov.hk/en/hotels/search_h.html
http://www.hadla.gov.hk/en/hotels/search_g.html
A list of Hong Kong hotels are available at:
http://www.hkha.com.hk/en/uhi01001.asp?sec=3
http://www.discoverhongkong.com/eng/jsp/hotel/search-index.jsp
3. Institutions
Institutions like schools, hospitals, and airlines are served by a small number of large
catering groups who are generally affiliated with the restaurant sector. These caterers
mainly source their ingredients from China where supplies are cheaper and more
abundant. They also use ingredients from other countries such as the U.S. when they
cannot find the same products in China, or when they want to use products with better
quality and taste.
Schools: School regulators prohibit primary and lower secondary students from eating out.
Students therefore either pack their lunch boxes or subscribe to school lunch boxes.
According to the latest statistics (academic year 2011/2012) of the Education Bureau, there
are 568 primary schools and 524 secondary schools. The total number of primary students
and lower secondary students amounted to 322,881 and 208,010 respectively. About 70
percent of students buy lunch at schools. A typical lunch box consists of meat, rice and
some cooked vegetables. The annual turnover is estimated at US$250 million. Healthy
eating programs are underway to encourage a change in eating trends for schools.
Caterers have to register with the Hong Kong Food and Environmental Hygiene Department
(FEHD) before they are eligible to bid tenders provided by individual schools. ATO Hong
Kong can provide U.S. exporters with the list of registered caterers for school lunch boxes.
Page 4 of 24
Hospitals: The Hospital Authority operates 41 hospitals and medical centers, with a total of
over 27,000 beds and staff size of 59,600. The catering services for hospitals are
outsourced on a tender basis. The hospitals are served by catering groups, many of which
also operate restaurants, fast food chains or school lunch catering services.
Airlines: There are three aircraft catering franchisees at the Hong Kong International
Airport, each with a 15-year term:
- Cathay Pacific Catering Services
- Lufthansa Service Hong Kong Ltd
- Gate Gourmet Hong Kong Ltd
The three airline caterers have a combined capacity of 135,000 meals per day, providing a
whole range of in-flight catering services, from preparation and assembly of in-flight dishes
to logistics of food delivery and storage of catering utensils.
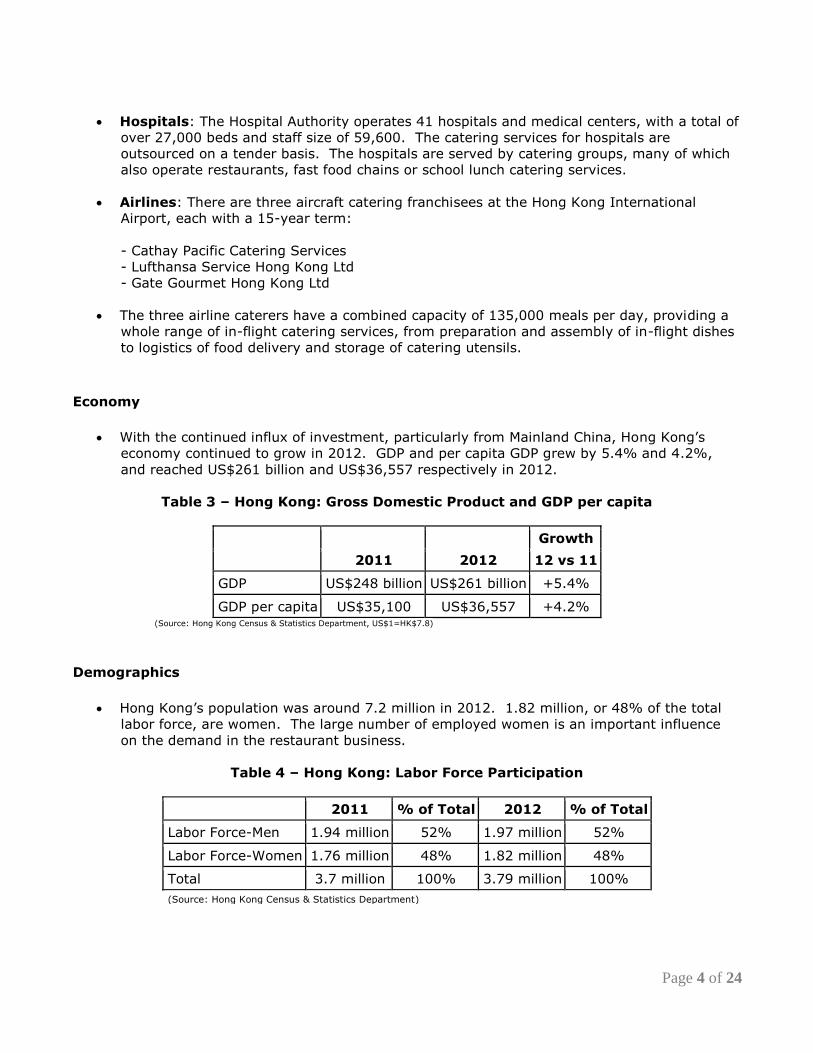
Economy
With the continued influx of investment, particularly from Mainland China, Hong Kong’s
economy continued to grow in 2012. GDP and per capita GDP grew by 5.4% and 4.2%,
and reached US$261 billion and US$36,557 respectively in 2012.
Table 3 – Hong Kong: Gross Domestic Product and GDP per capita
Growth
2011 2012 12 vs 11
GDP US$248 billion US$261 billion +5.4%
GDP per capita US$35,100 US$36,557 +4.2% (Source: Hong Kong Census & Statistics Department, US$1=HK$7.8)
Demographics
Hong Kong’s population was around 7.2 million in 2012. 1.82 million, or 48% of the total
labor force, are women. The large number of employed women is an important influence
on the demand in the restaurant business.
Table 4 – Hong Kong: Labor Force Participation
2011 % of Total 2012 % of Total
Labor Force-Men 1.94 million 52% 1.97 million 52%
Labor Force-Women 1.76 million 48% 1.82 million 48%
Total 3.7 million 100% 3.79 million 100%
(Source: Hong Kong Census & Statistics Department)
Page 5 of 24
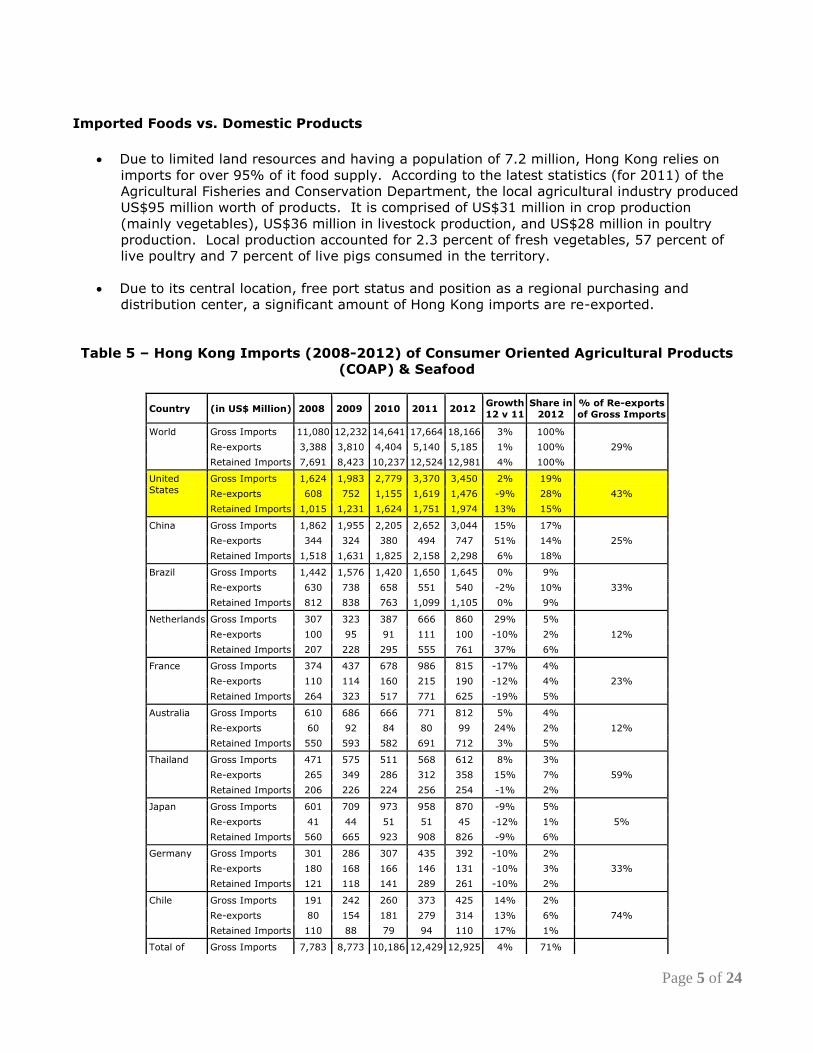
Imported Foods vs. Domestic Products
Due to limited land resources and having a population of 7.2 million, Hong Kong relies on
imports for over 95% of it food supply. According to the latest statistics (for 2011) of the
Agricultural Fisheries and Conservation Department, the local agricultural industry produced
US$95 million worth of products. It is comprised of US$31 million in crop production
(mainly vegetables), US$36 million in livestock production, and US$28 million in poultry
production. Local production accounted for 2.3 percent of fresh vegetables, 57 percent of
live poultry and 7 percent of live pigs consumed in the territory.
Due to its central location, free port status and position as a regional purchasing and
distribution center, a significant amount of Hong Kong imports are re-exported.
Table 5 – Hong Kong Imports (2008-2012) of Consumer Oriented Agricultural Products
(COAP) & Seafood
Country (in US$ Million) 2008 2009 2010 2011 2012 Growth
12 v 11
Share in
2012
% of Re-exports
of Gross Imports
World Gross Imports 11,080 12,232 14,641 17,664 18,166 3% 100%
Re-exports 3,388 3,810 4,404 5,140 5,185 1% 100% 29%
Retained Imports 7,691 8,423 10,237 12,524 12,981 4% 100%
United
States
Gross Imports 1,624 1,983 2,779 3,370 3,450 2% 19%
Re-exports 608 752 1,155 1,619 1,476 -9% 28% 43%
Retained Imports 1,015 1,231 1,624 1,751 1,974 13% 15%
China Gross Imports 1,862 1,955 2,205 2,652 3,044 15% 17%
Re-exports 344 324 380 494 747 51% 14% 25%
Retained Imports 1,518 1,631 1,825 2,158 2,298 6% 18%
Brazil Gross Imports 1,442 1,576 1,420 1,650 1,645 0% 9%
Re-exports 630 738 658 551 540 -2% 10% 33%
Retained Imports 812 838 763 1,099 1,105 0% 9%
Netherlands Gross Imports 307 323 387 666 860 29% 5%
Re-exports 100 95 91 111 100 -10% 2% 12%
Retained Imports 207 228 295 555 761 37% 6%
France Gross Imports 374 437 678 986 815 -17% 4%
Re-exports 110 114 160 215 190 -12% 4% 23%
Retained Imports 264 323 517 771 625 -19% 5%
Australia Gross Imports 610 686 666 771 812 5% 4%
Re-exports 60 92 84 80 99 24% 2% 12%
Retained Imports 550 593 582 691 712 3% 5%
Thailand Gross Imports 471 575 511 568 612 8% 3%
Re-exports 265 349 286 312 358 15% 7% 59%
Retained Imports 206 226 224 256 254 -1% 2%
Japan Gross Imports 601 709 973 958 870 -9% 5%
Re-exports 41 44 51 51 45 -12% 1% 5%
Retained Imports 560 665 923 908 826 -9% 6%
Germany Gross Imports 301 286 307 435 392 -10% 2%
Re-exports 180 168 166 146 131 -10% 3% 33%
Retained Imports 121 118 141 289 261 -10% 2%
Chile Gross Imports 191 242 260 373 425 14% 2%
Re-exports 80 154 181 279 314 13% 6% 74%
Retained Imports 110 88 79 94 110 17% 1%
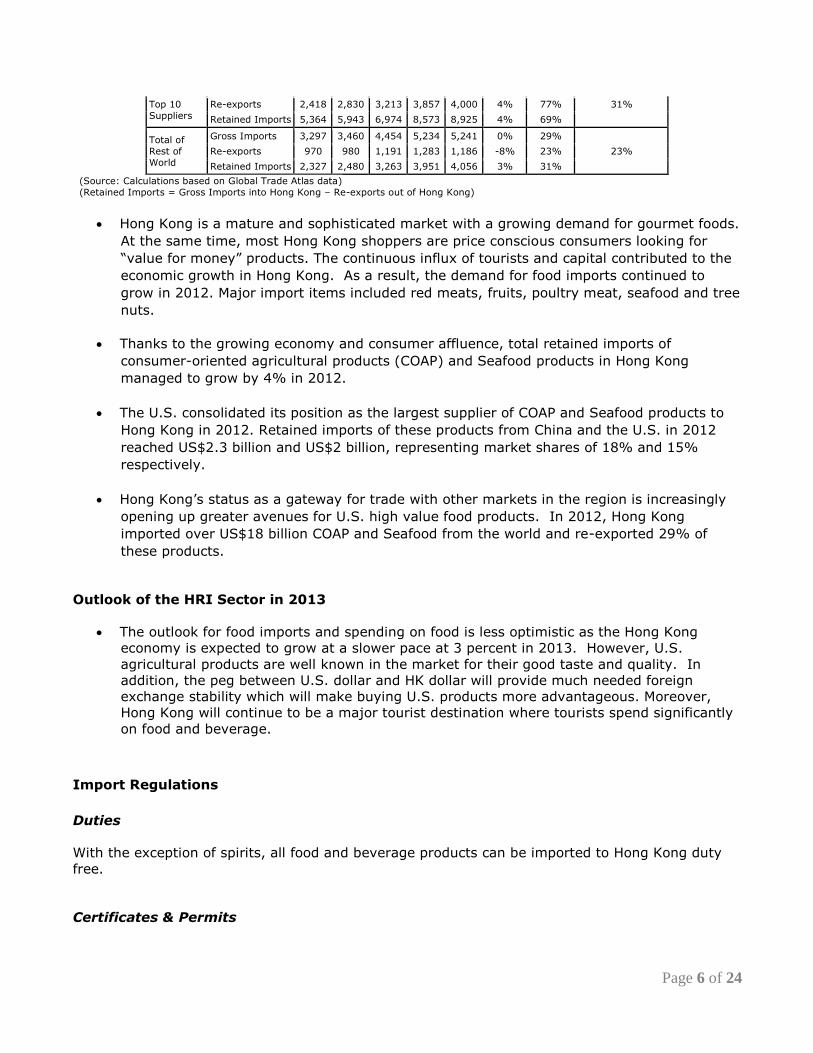
Total of Gross Imports 7,783 8,773 10,186 12,429 12,925 4% 71%
Page 6 of 24
Top 10
Suppliers
Re-exports 2,418 2,830 3,213 3,857 4,000 4% 77% 31%
Retained Imports 5,364 5,943 6,974 8,573 8,925 4% 69%
Total of
Rest of
World
Gross Imports 3,297 3,460 4,454 5,234 5,241 0% 29%
Re-exports 970 980 1,191 1,283 1,186 -8% 23% 23%
Retained Imports 2,327 2,480 3,263 3,951 4,056 3% 31%
(Source: Calculations based on Global Trade Atlas data)
(Retained Imports = Gross Imports into Hong Kong – Re-exports out of Hong Kong)
Hong Kong is a mature and sophisticated market with a growing demand for gourmet foods.
At the same time, most Hong Kong shoppers are price conscious consumers looking for
“value for money” products. The continuous influx of tourists and capital contributed to the
economic growth in Hong Kong. As a result, the demand for food imports continued to
grow in 2012. Major import items included red meats, fruits, poultry meat, seafood and tree
nuts.
Thanks to the growing economy and consumer affluence, total retained imports of
consumer-oriented agricultural products (COAP) and Seafood products in Hong Kong
managed to grow by 4% in 2012.
The U.S. consolidated its position as the largest supplier of COAP and Seafood products to
Hong Kong in 2012. Retained imports of these products from China and the U.S. in 2012
reached US$2.3 billion and US$2 billion, representing market shares of 18% and 15%
respectively.
Hong Kong’s status as a gateway for trade with other markets in the region is increasingly
opening up greater avenues for U.S. high value food products. In 2012, Hong Kong
imported over US$18 billion COAP and Seafood from the world and re-exported 29% of
these products.
Outlook of the HRI Sector in 2013
The outlook for food imports and spending on food is less optimistic as the Hong Kong
economy is expected to grow at a slower pace at 3 percent in 2013. However, U.S.
agricultural products are well known in the market for their good taste and quality. In
addition, the peg between U.S. dollar and HK dollar will provide much needed foreign
exchange stability which will make buying U.S. products more advantageous. Moreover,
Hong Kong will continue to be a major tourist destination where tourists spend significantly
on food and beverage.
Import Regulations
Duties
With the exception of spirits, all food and beverage products can be imported to Hong Kong duty
free.
Certificates & Permits
Page 7 of 24
In Hong Kong, the legal framework for food safety control is defined in part V of the Public Health
and Municipal Services Ordinance and the Food Safety Ordinance. The basic tenet is that no food
intended for sale should be unfit for human consumption. Technical requirements for imports vary
significantly according to the product. Products which require import permits/health certificates
include meat, milk and frozen confections. The Hong Kong Government (HKG) also plans to
implement a health certification requirement for eggs and seafood products. The HKG accepts
import applications from Hong Kong importers. In other words, local importers and not U.S.
exporters are required to apply for import permits. U.S. exporters need to supply their
agents/importers with necessary documentation such as health certificates from the U.S.
government.
Labeling
All prepackaged food products in Hong Kong have to comply with Hong Kong’s labeling regulation.
There are also labeling requirements for allergens and nutrients. U.S. labels may not be able to
meet with Hong Kong labeling requirements particularly for products with nutritional claims.
However, the Hong Kong government allows stick-on food labels, which could be arranged by Hong
Kong importers with the permission of the manufacturers.
The marking or labeling of prepackaged food can be in either the English or the Chinese language
or in both languages. If both languages are used in the marking and labeling of prepackaged food,
the name of the food, ingredient lists and nutrition information have to be provided in both
languages.
Labeling for Biotech Food
The HKG does not have any specific biotechnology regulations with regard to the labeling of
biotech food products. It makes no distinction between conventional and biotech foods. All are
subject to the same food safety regulation. The HKG continues to promote voluntary labeling of
GMO products as a viable alternative for the trade. The guidelines on labeling for biotech foods,
released in 2006, are advisory in nature and do not have any legal effect. The threshold level
applied in the guidelines for labeling purpose is 5 percent, in respect of individual food ingredient.
Negative labeling is not recommended.
Organic Certification
While the Hong Kong Organic Center provides organic certification for local produce, Hong Kong
does not have a law regulating organic food products. U.S. organic products can be sold in Hong
Kong with the USDA organic logo.
Others
Under the food ordinances, there are regulations governing the use of sweeteners, preservatives,
coloring matters, and metallic contaminants. The Hong Kong government enforces its food safety
control according to Hong Kong’s food regulations. In the absence of a particular provision in Hong
Kong food regulations, the HKG would draw reference from Codex and/or conduct risk assessments
to determine whether a food meets the food safety standard.
In 2012, Hong Kong enacted its first-ever pesticide residue regulation, which will be implemented
in August 2014. Its framework is largely built on Codex’s standard, supplemented by standards
adopted in China, Thailand the U.S.
Page 8 of 24
For details on Hong Kong’s general import regulations for food products, please refer to GAIN
Report #1233.
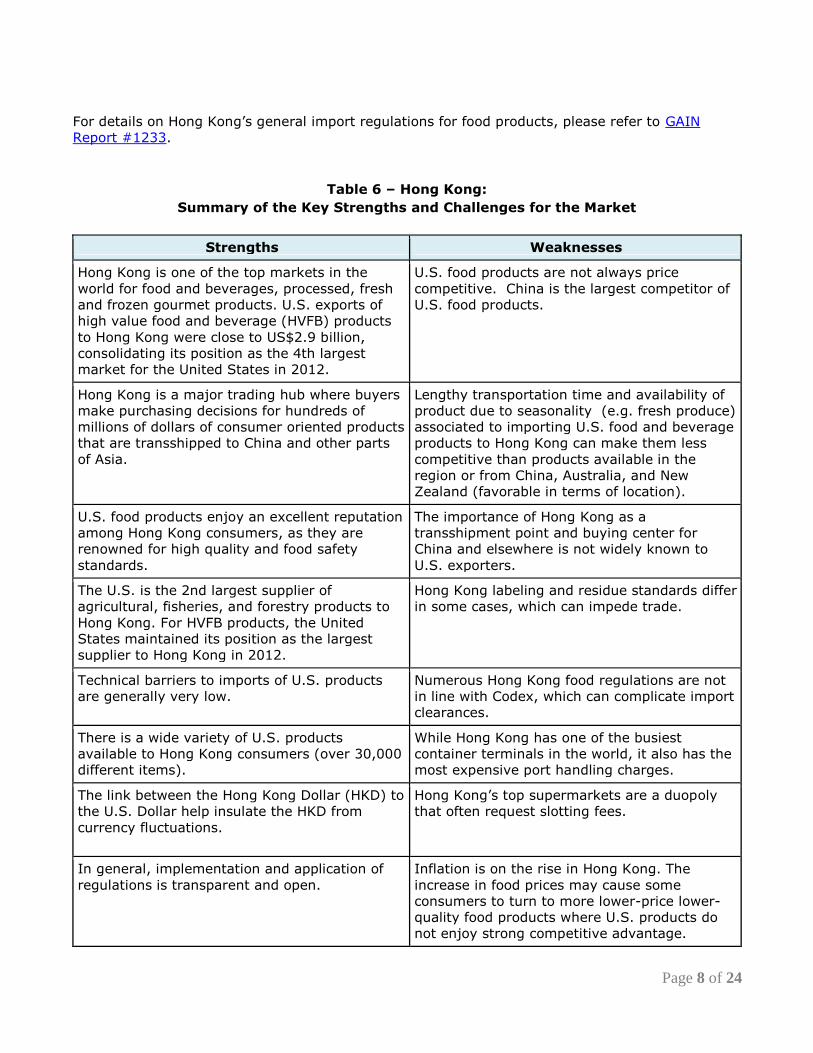
Table 6 – Hong Kong:
Summary of the Key Strengths and Challenges for the Market
Strengths Weaknesses
Hong Kong is one of the top markets in the
world for food and beverages, processed, fresh
and frozen gourmet products. U.S. exports of
high value food and beverage (HVFB) products
to Hong Kong were close to US$2.9 billion,
consolidating its position as the 4th largest
market for the United States in 2012.
U.S. food products are not always price
competitive. China is the largest competitor of
U.S. food products.
Hong Kong is a major trading hub where buyers
make purchasing decisions for hundreds of
millions of dollars of consumer oriented products
that are transshipped to China and other parts
of Asia.
Lengthy transportation time and availability of
product due to seasonality (e.g. fresh produce)
associated to importing U.S. food and beverage
products to Hong Kong can make them less
competitive than products available in the
region or from China, Australia, and New
Zealand (favorable in terms of location).
U.S. food products enjoy an excellent reputation
among Hong Kong consumers, as they are
renowned for high quality and food safety
standards.
The importance of Hong Kong as a
transshipment point and buying center for
China and elsewhere is not widely known to
U.S. exporters.
The U.S. is the 2nd largest supplier of
agricultural, fisheries, and forestry products to
Hong Kong. For HVFB products, the United
States maintained its position as the largest
supplier to Hong Kong in 2012.
Hong Kong labeling and residue standards differ
in some cases, which can impede trade.
Technical barriers to imports of U.S. products
are generally very low. Numerous Hong Kong food regulations are not
in line with Codex, which can complicate import
clearances.
There is a wide variety of U.S. products
available to Hong Kong consumers (over 30,000
different items).
While Hong Kong has one of the busiest
container terminals in the world, it also has the
most expensive port handling charges.
The link between the Hong Kong Dollar (HKD) to
the U.S. Dollar help insulate the HKD from
currency fluctuations.
Hong Kong’s top supermarkets are a duopoly
that often request slotting fees.
In general, implementation and application of
regulations is transparent and open. Inflation is on the rise in Hong Kong. The
increase in food prices may cause some
consumers to turn to more lower-price lower-
quality food products where U.S. products do
not enjoy strong competitive advantage.
Page 9 of 24
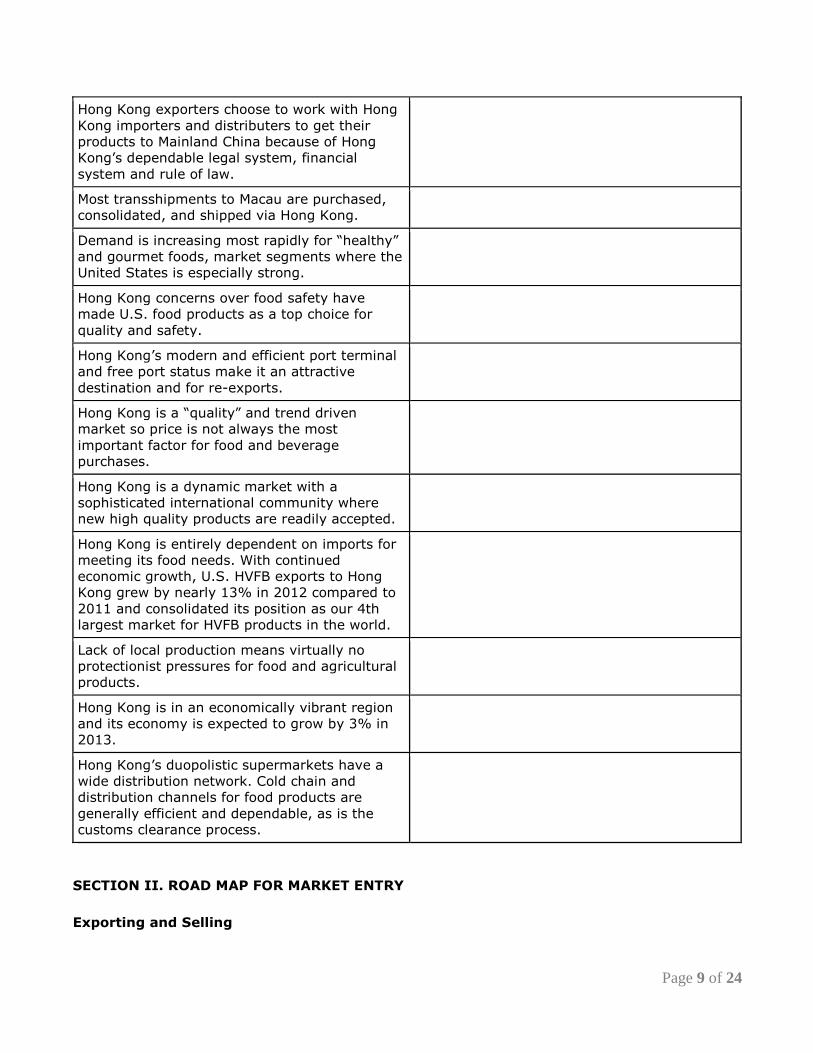
Hong Kong exporters choose to work with Hong
Kong importers and distributers to get their
products to Mainland China because of Hong
Kong’s dependable legal system, financial
system and rule of law.
Most transshipments to Macau are purchased,
consolidated, and shipped via Hong Kong.
Demand is increasing most rapidly for “healthy”
and gourmet foods, market segments where the
United States is especially strong.
Hong Kong concerns over food safety have
made U.S. food products as a top choice for
quality and safety.
Hong Kong’s modern and efficient port terminal
and free port status make it an attractive
destination and for re-exports.
Hong Kong is a “quality” and trend driven
market so price is not always the most
important factor for food and beverage
purchases.
Hong Kong is a dynamic market with a
sophisticated international community where
new high quality products are readily accepted.
Hong Kong is entirely dependent on imports for
meeting its food needs. With continued
economic growth, U.S. HVFB exports to Hong
Kong grew by nearly 13% in 2012 compared to
2011 and consolidated its position as our 4th
largest market for HVFB products in the world.
Lack of local production means virtually no
protectionist pressures for food and agricultural
products.
Hong Kong is in an economically vibrant region
and its economy is expected to grow by 3% in
2013.
Hong Kong’s duopolistic supermarkets have a
wide distribution network. Cold chain and
distribution channels for food products are
generally efficient and dependable, as is the
customs clearance process.
SECTION II. ROAD MAP FOR MARKET ENTRY
Exporting and Selling
Page 10 of 24
Since very few hotels, restaurants or institutions import directly from exporters, most
suppliers sell to importers for further distribution to the HRI sector in this market.
Establishing a Business in Hong Kong
If U.S. restaurant chains or caterers want to establish a stronger foothold in Hong Kong, they are
allowed to incorporate freely. However, there are two market entry channels that U.S. companies
may consider in their attempt to establish a presence in Hong Kong’s HRI sector.
1. Franchising
The concept of franchising has been growing in Hong Kong for the past decade. Nearly 80
% of the franchise operations in Hong Kong are of U.S. origin. Home-grown franchises
have also developed, especially in catering.
2. Joint Ventures
Joint ventures or strategic alliances can be very helpful in entering the market, and are
particularly important in competing for major catering projects.
In order to attract foreign investment, the HKG set up a special department called “Invest
Hong Kong” to help overseas companies establish a presence in Hong Kong by providing all
the support needed to establish and expand their operations (www.investhk.gov.hk).
Entering the Hong Kong market with products suitable for the HRI trade can be handled in a
number of ways. Certainly the end customer, the hotel, restaurant, institution or caterer
has an influence on the selection of products or ingredients but the choice is all very much
guided by a network of reliable and trusted suppliers.
3. Setting up a Representative Office
One of the most effective but costly means that U.S. companies can use to sell their
products to this market is to set up a representative office in Hong Kong. Information on
how to set up a new business in Hong Kong can be found at:
http://www.success.tid.gov.hk/english/inf_ser/bus_sta_up_inf_ser/bus_sta_up_inf_ser.htm
l
4. Appointing Agents
U.S. exporters may consider hiring a local agent. A key consideration is whether the
prospective agent has a good marketing record and widespread distribution network. The
advantage of having an agent is that it can help with marketing and distribution. Some
companies may secure a very competitive price package with TV, magazine and radio for
advertisements. In addition, well-established companies have extensive distribution
networks not limited to the HRI sector but also to retail outlets.
Importers and distributors tend to focus on specific categories of products and end
markets. Research should be carried out to ensure the importer/distributor selected is
appropriate for your products.
Page 11 of 24
Marketing Strategies
Identify key players for the products - ATO Hong Kong can provide lists of importers,
distributors, commodity cooperators and regional business groups.
Test marketing maybe required prior to establishing a presence in the market.
Communicate product benefits to end-users - although distributors maintain the
relationships with their customers, end users assert influence over the buying decisions. It
is important to directly educate all stakeholders as to the features and benefits of your
products.
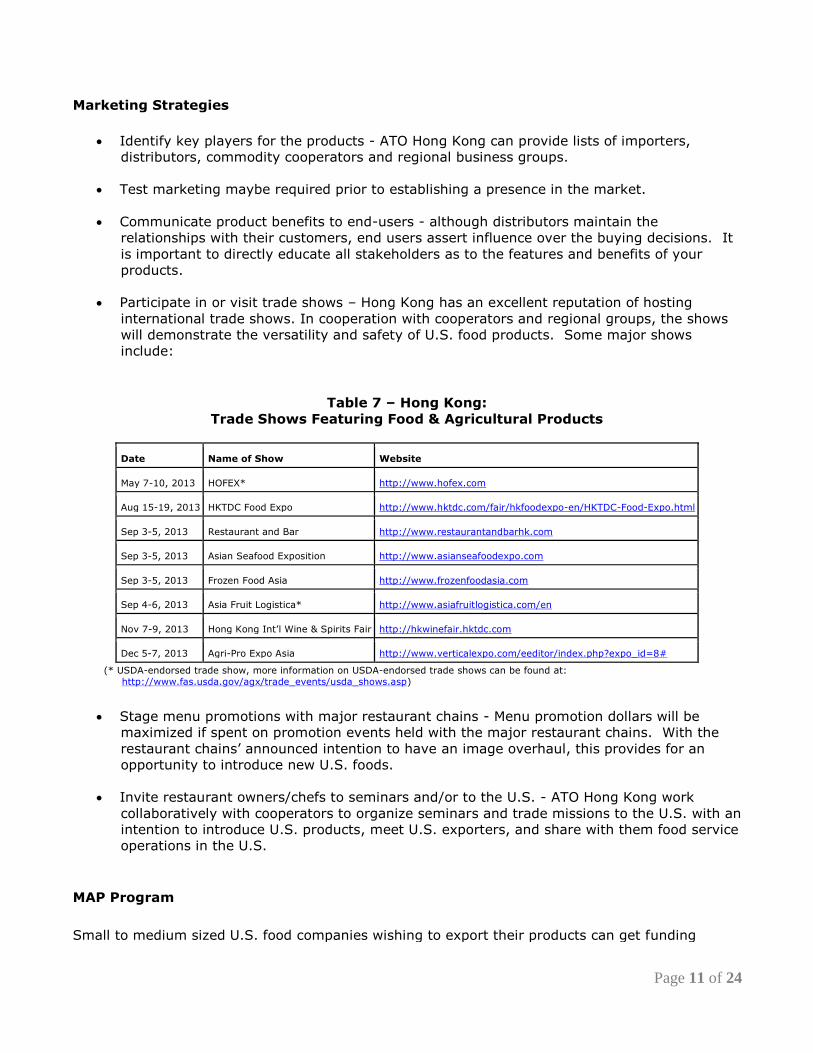
Participate in or visit trade shows – Hong Kong has an excellent reputation of hosting
international trade shows. In cooperation with cooperators and regional groups, the shows
will demonstrate the versatility and safety of U.S. food products. Some major shows
include:
Table 7 – Hong Kong:
Trade Shows Featuring Food & Agricultural Products
Date Name of Show Website
May 7-10, 2013 HOFEX* http://www.hofex.com
Aug 15-19, 2013 HKTDC Food Expo http://www.hktdc.com/fair/hkfoodexpo-en/HKTDC-Food-Expo.html
Sep 3-5, 2013 Restaurant and Bar http://www.restaurantandbarhk.com
Sep 3-5, 2013 Asian Seafood Exposition http://www.asianseafoodexpo.com
Sep 3-5, 2013 Frozen Food Asia http://www.frozenfoodasia.com
Sep 4-6, 2013 Asia Fruit Logistica* http://www.asiafruitlogistica.com/en
Nov 7-9, 2013 Hong Kong Int’l Wine & Spirits Fair http://hkwinefair.hktdc.com
Dec 5-7, 2013 Agri-Pro Expo Asia http://www.verticalexpo.com/eeditor/index.php?expo_id=8#
(* USDA-endorsed trade show, more information on USDA-endorsed trade shows can be found at:
http://www.fas.usda.gov/agx/trade_events/usda_shows.asp)
Stage menu promotions with major restaurant chains - Menu promotion dollars will be
maximized if spent on promotion events held with the major restaurant chains. With the
restaurant chains’ announced intention to have an image overhaul, this provides for an
opportunity to introduce new U.S. foods.
Invite restaurant owners/chefs to seminars and/or to the U.S. - ATO Hong Kong work
collaboratively with cooperators to organize seminars and trade missions to the U.S. with an
intention to introduce U.S. products, meet U.S. exporters, and share with them food service
operations in the U.S.
MAP Program
Small to medium sized U.S. food companies wishing to export their products can get funding
Page 12 of 24
assistance from the USDA Market Access Program (MAP). The reimbursement rates for branded
promotions are equal to the percentage of U.S. origin content of the promoted agricultural
commodity or a rate of 50 percent, whichever is the lesser. If you are a producer or exporter and
want to participate in the MAP, please contact a trade association that represents your specific
product. If no trade association is applicable, please contact one of the four State regional trade
groups: Food Export USA - Northeast (FEUSA), Food Export Association of the Midwest USA (FEA),
Southern US Trade Association (SUSTA), and Western US Agricultural Trade Association
(WUSATA). For details of the MAP program and a list of trade associations, please contact our
office or visit the website: http://www.fas.usda.gov/mos/programs/maptoc.html
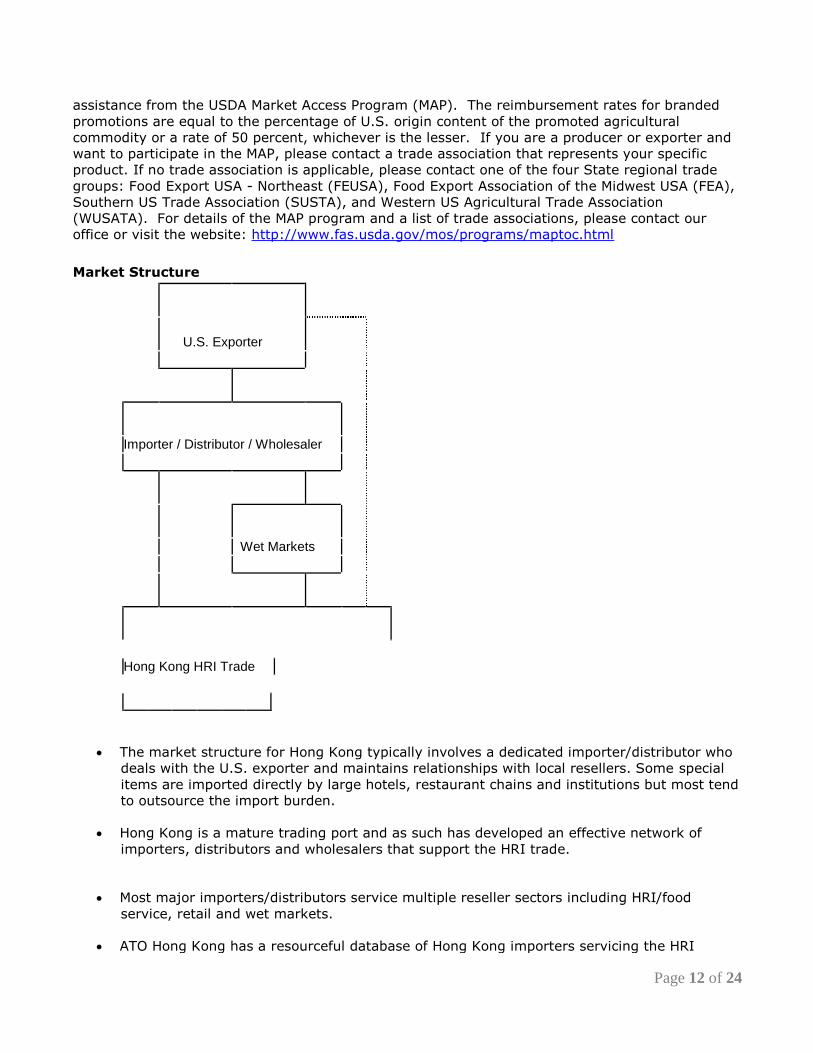
Market Structure
U.S. Exporter
Importer / Distributor / Wholesaler
Wet Markets
Hong Kong HRI Trade
The market structure for Hong Kong typically involves a dedicated importer/distributor who
deals with the U.S. exporter and maintains relationships with local resellers. Some special
items are imported directly by large hotels, restaurant chains and institutions but most tend
to outsource the import burden.
Hong Kong is a mature trading port and as such has developed an effective network of
importers, distributors and wholesalers that support the HRI trade.
Most major importers/distributors service multiple reseller sectors including HRI/food
service, retail and wet markets.
ATO Hong Kong has a resourceful database of Hong Kong importers servicing the HRI
Page 13 of 24
trade. For information regarding specific category suppliers, the ATO Hong Kong can
provide additional information.
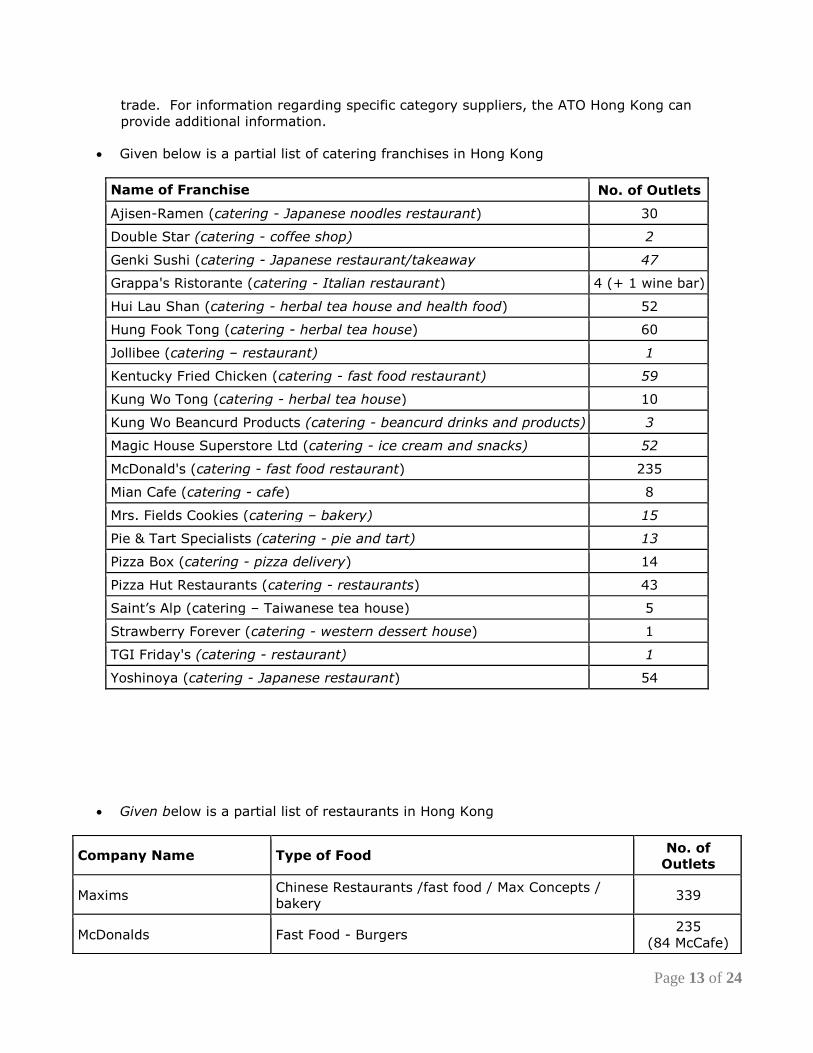
Given below is a partial list of catering franchises in Hong Kong
Name of Franchise No. of Outlets
Ajisen-Ramen (catering - Japanese noodles restaurant) 30
Double Star (catering - coffee shop) 2
Genki Sushi (catering - Japanese restaurant/takeaway 47
Grappa's Ristorante (catering - Italian restaurant) 4 (+ 1 wine bar)
Hui Lau Shan (catering - herbal tea house and health food) 52
Hung Fook Tong (catering - herbal tea house) 60
Jollibee (catering – restaurant) 1
Kentucky Fried Chicken (catering - fast food restaurant) 59
Kung Wo Tong (catering - herbal tea house) 10
Kung Wo Beancurd Products (catering - beancurd drinks and products) 3
Magic House Superstore Ltd (catering - ice cream and snacks) 52
McDonald's (catering - fast food restaurant) 235
Mian Cafe (catering - cafe) 8
Mrs. Fields Cookies (catering – bakery) 15
Pie & Tart Specialists (catering - pie and tart) 13
Pizza Box (catering - pizza delivery) 14
Pizza Hut Restaurants (catering - restaurants) 43
Saint’s Alp (catering – Taiwanese tea house) 5
Strawberry Forever (catering - western dessert house) 1
TGI Friday's (catering - restaurant) 1
Yoshinoya (catering - Japanese restaurant) 54
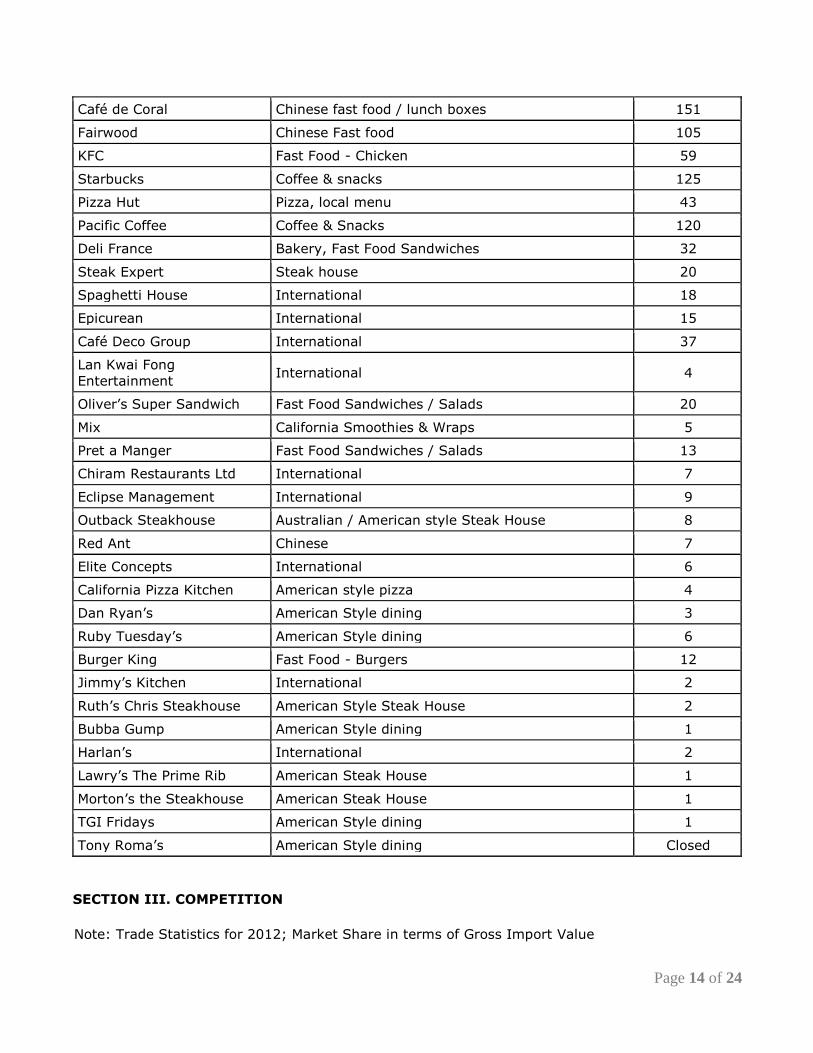
Given below is a partial list of restaurants in Hong Kong
Company Name Type of Food No. of
Outlets
Maxims Chinese Restaurants /fast food / Max Concepts /
bakery 339
McDonalds Fast Food - Burgers 235
(84 McCafe)
Page 14 of 24
Café de Coral Chinese fast food / lunch boxes 151
Fairwood Chinese Fast food 105
KFC Fast Food - Chicken 59
Starbucks Coffee & snacks 125
Pizza Hut Pizza, local menu 43
Pacific Coffee Coffee & Snacks 120
Deli France Bakery, Fast Food Sandwiches 32
Steak Expert Steak house 20
Spaghetti House International 18
Epicurean International 15
Café Deco Group International 37
Lan Kwai Fong
Entertainment International 4
Oliver’s Super Sandwich Fast Food Sandwiches / Salads 20
Mix California Smoothies & Wraps 5
Pret a Manger Fast Food Sandwiches / Salads 13
Chiram Restaurants Ltd International 7
Eclipse Management International 9
Outback Steakhouse Australian / American style Steak House 8
Red Ant Chinese 7
Elite Concepts International 6
California Pizza Kitchen American style pizza 4
Dan Ryan’s American Style dining 3
Ruby Tuesday’s American Style dining 6
Burger King Fast Food - Burgers 12
Jimmy’s Kitchen International 2
Ruth’s Chris Steakhouse American Style Steak House 2
Bubba Gump American Style dining 1
Harlan’s International 2
Lawry’s The Prime Rib American Steak House 1
Morton’s the Steakhouse American Steak House 1
TGI Fridays American Style dining 1
Tony Roma’s American Style dining Closed
SECTION III. COMPETITION
Note: Trade Statistics for 2012; Market Share in terms of Gross Import Value
Page 15 of 24
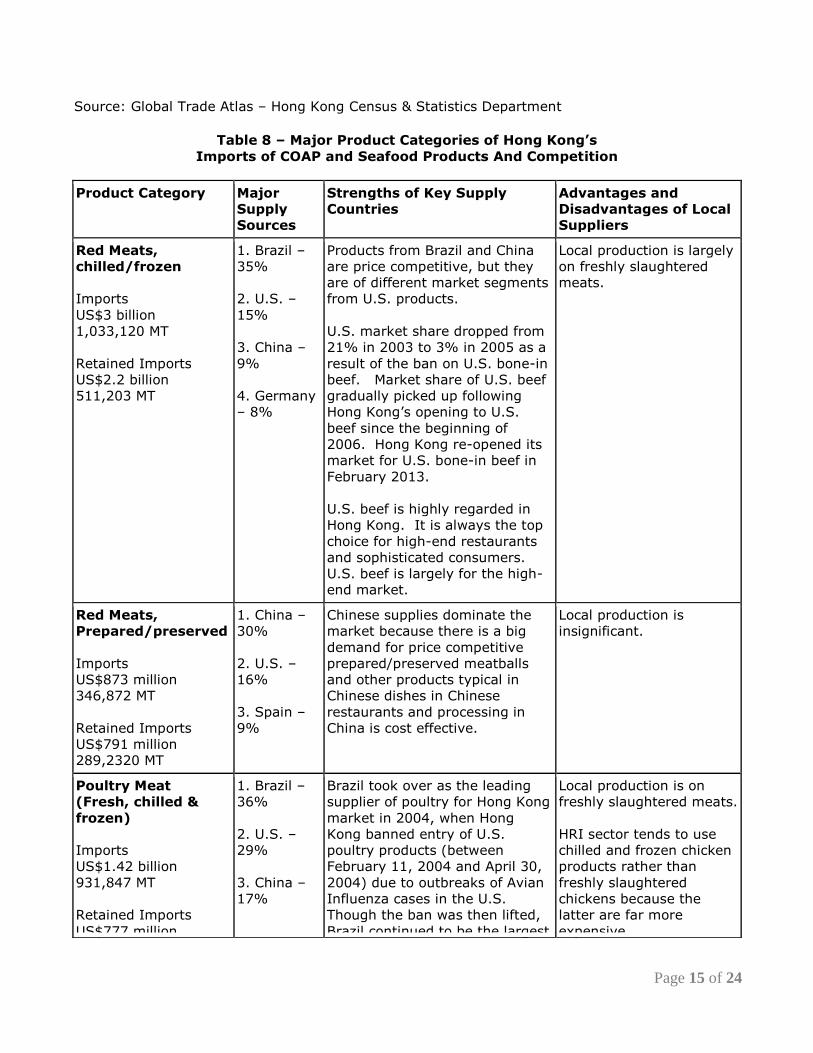
Source: Global Trade Atlas – Hong Kong Census & Statistics Department
Table 8 – Major Product Categories of Hong Kong’s
Imports of COAP and Seafood Products And Competition
Product Category Major
Supply
Sources
Strengths of Key Supply
Countries
Advantages and
Disadvantages of Local
Suppliers
Red Meats,
chilled/frozen
Imports
US$3 billion
1,033,120 MT
Retained Imports
US$2.2 billion
511,203 MT
1. Brazil –
35%
2. U.S. –
15%
3. China –
9%
4. Germany
– 8%
Products from Brazil and China
are price competitive, but they
are of different market segments
from U.S. products.
U.S. market share dropped from
21% in 2003 to 3% in 2005 as a
result of the ban on U.S. bone-in
beef. Market share of U.S. beef
gradually picked up following
Hong Kong’s opening to U.S.
beef since the beginning of
2006. Hong Kong re-opened its
market for U.S. bone-in beef in
February 2013.
U.S. beef is highly regarded in
Hong Kong. It is always the top
choice for high-end restaurants
and sophisticated consumers.
U.S. beef is largely for the high-
end market.
Local production is largely
on freshly slaughtered
meats.
Red Meats,
Prepared/preserved
Imports
US$873 million
346,872 MT
Retained Imports
US$791 million
289,2320 MT
1. China –
30%
2. U.S. –
16%
3. Spain –
9%
Chinese supplies dominate the
market because there is a big
demand for price competitive
prepared/preserved meatballs
and other products typical in
Chinese dishes in Chinese
restaurants and processing in
China is cost effective.
Local production is
insignificant.
Poultry Meat
(Fresh, chilled &
frozen)
Imports
US$1.42 billion
931,847 MT
Retained Imports
US$777 million
1. Brazil –
36%
2. U.S. –
29%
3. China –
17%
Brazil took over as the leading
supplier of poultry for Hong Kong
market in 2004, when Hong
Kong banned entry of U.S.
poultry products (between
February 11, 2004 and April 30,
2004) due to outbreaks of Avian
Influenza cases in the U.S.
Though the ban was then lifted,
Brazil continued to be the largest
Local production is on
freshly slaughtered meats.
HRI sector tends to use
chilled and frozen chicken
products rather than
freshly slaughtered
chickens because the
latter are far more
expensive.
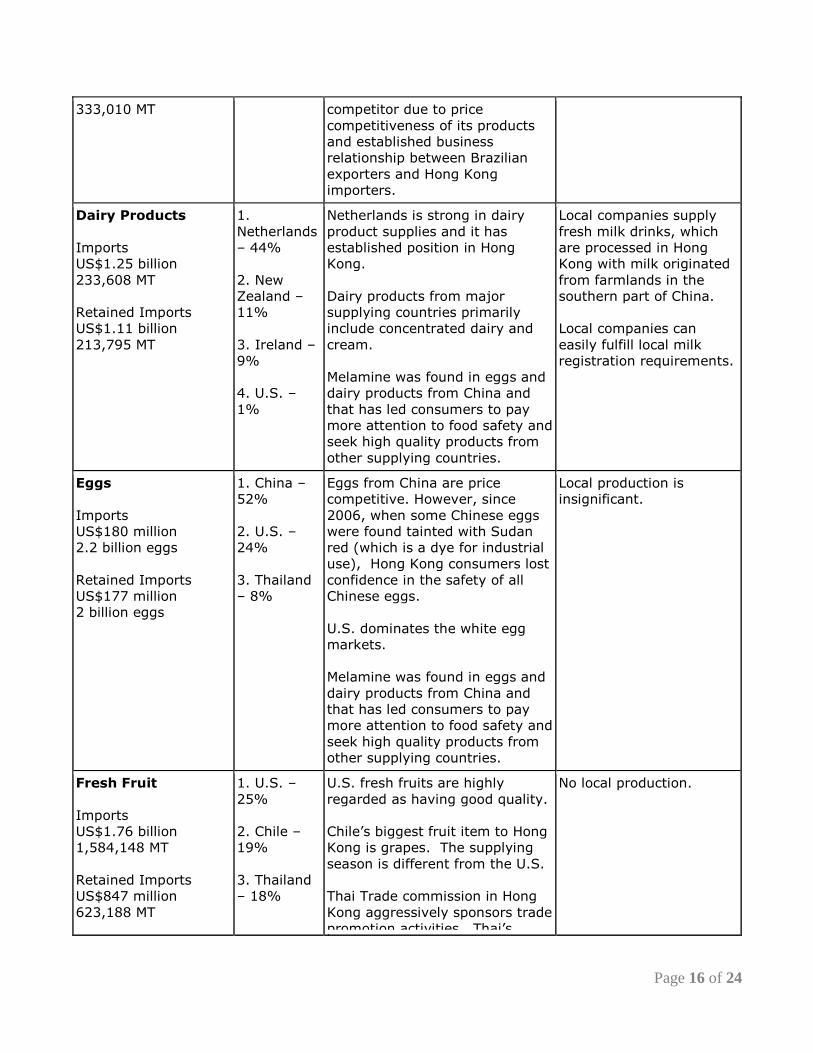
Page 16 of 24
333,010 MT competitor due to price
competitiveness of its products
and established business
relationship between Brazilian
exporters and Hong Kong
importers.
Dairy Products
Imports
US$1.25 billion
233,608 MT
Retained Imports
US$1.11 billion
213,795 MT
1.
Netherlands
– 44%
2. New
Zealand –
11%
3. Ireland –
9%
4. U.S. –
1%
Netherlands is strong in dairy
product supplies and it has
established position in Hong
Kong.
Dairy products from major
supplying countries primarily
include concentrated dairy and
cream.
Melamine was found in eggs and
dairy products from China and
that has led consumers to pay
more attention to food safety and
seek high quality products from
other supplying countries.
Local companies supply
fresh milk drinks, which
are processed in Hong
Kong with milk originated
from farmlands in the
southern part of China.
Local companies can
easily fulfill local milk
registration requirements.
Eggs
Imports
US$180 million
2.2 billion eggs
Retained Imports
US$177 million
2 billion eggs
1. China –
52%
2. U.S. –
24%
3. Thailand
– 8%
Eggs from China are price
competitive. However, since
2006, when some Chinese eggs
were found tainted with Sudan
red (which is a dye for industrial
use), Hong Kong consumers lost
confidence in the safety of all
Chinese eggs.
U.S. dominates the white egg
markets.
Melamine was found in eggs and
dairy products from China and
that has led consumers to pay
more attention to food safety and
seek high quality products from
other supplying countries.
Local production is
insignificant.
Fresh Fruit
Imports
US$1.76 billion
1,584,148 MT
Retained Imports
US$847 million
623,188 MT
1. U.S. –
25%
2. Chile –
19%
3. Thailand
– 18%
U.S. fresh fruits are highly
regarded as having good quality.
Chile’s biggest fruit item to Hong
Kong is grapes. The supplying
season is different from the U.S.
Thai Trade commission in Hong
Kong aggressively sponsors trade
promotion activities. Thai’s
No local production.
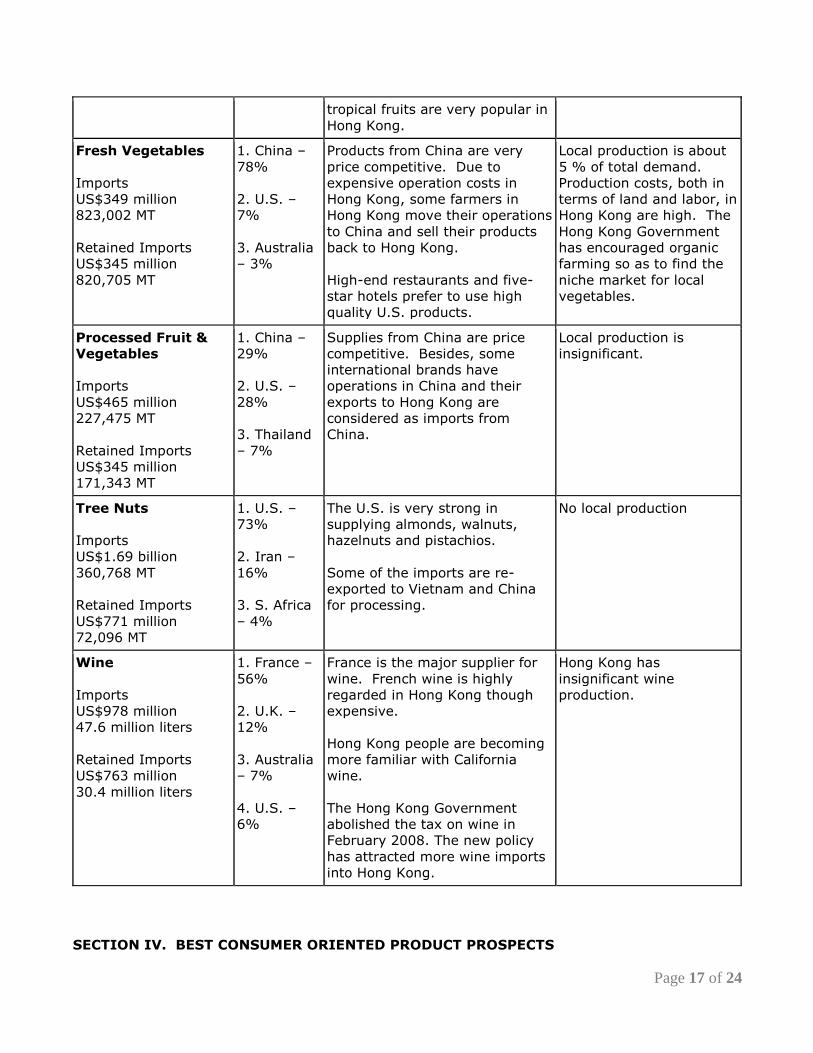
Page 17 of 24
tropical fruits are very popular in
Hong Kong.
Fresh Vegetables
Imports
US$349 million
823,002 MT
Retained Imports
US$345 million
820,705 MT
1. China –
78%
2. U.S. –
7%
3. Australia
– 3%
Products from China are very
price competitive. Due to
expensive operation costs in
Hong Kong, some farmers in
Hong Kong move their operations
to China and sell their products
back to Hong Kong.
High-end restaurants and five-
star hotels prefer to use high
quality U.S. products.
Local production is about
5 % of total demand.
Production costs, both in
terms of land and labor, in
Hong Kong are high. The
Hong Kong Government
has encouraged organic
farming so as to find the
niche market for local
vegetables.
Processed Fruit &
Vegetables
Imports
US$465 million
227,475 MT
Retained Imports
US$345 million
171,343 MT
1. China –
29%
2. U.S. –
28%
3. Thailand
– 7%
Supplies from China are price
competitive. Besides, some
international brands have
operations in China and their
exports to Hong Kong are
considered as imports from
China.
Local production is
insignificant.
Tree Nuts
Imports
US$1.69 billion
360,768 MT
Retained Imports
US$771 million
72,096 MT
1. U.S. –
73%
2. Iran –
16%
3. S. Africa
– 4%
The U.S. is very strong in
supplying almonds, walnuts,
hazelnuts and pistachios.
Some of the imports are re-
exported to Vietnam and China
for processing.
No local production
Wine
Imports
US$978 million
47.6 million liters
Retained Imports
US$763 million
30.4 million liters
1. France –
56%
2. U.K. –
12%
3. Australia
– 7%
4. U.S. –
6%
France is the major supplier for
wine. French wine is highly
regarded in Hong Kong though
expensive.
Hong Kong people are becoming
more familiar with California
wine.
The Hong Kong Government
abolished the tax on wine in
February 2008. The new policy
has attracted more wine imports
into Hong Kong.
Hong Kong has
insignificant wine
production.
SECTION IV. BEST CONSUMER ORIENTED PRODUCT PROSPECTS
Page 18 of 24
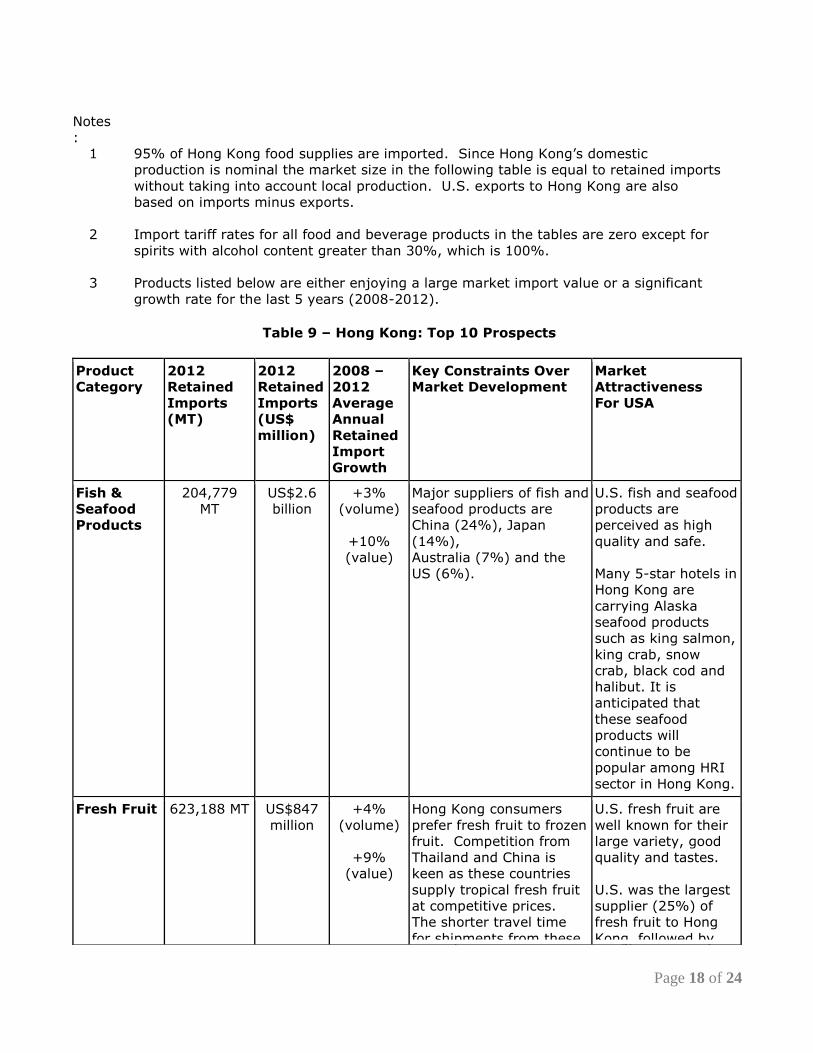
Notes
:
1 95% of Hong Kong food supplies are imported. Since Hong Kong’s domestic
production is nominal the market size in the following table is equal to retained imports
without taking into account local production. U.S. exports to Hong Kong are also
based on imports minus exports.
2 Import tariff rates for all food and beverage products in the tables are zero except for
spirits with alcohol content greater than 30%, which is 100%.
3 Products listed below are either enjoying a large market import value or a significant
growth rate for the last 5 years (2008-2012).
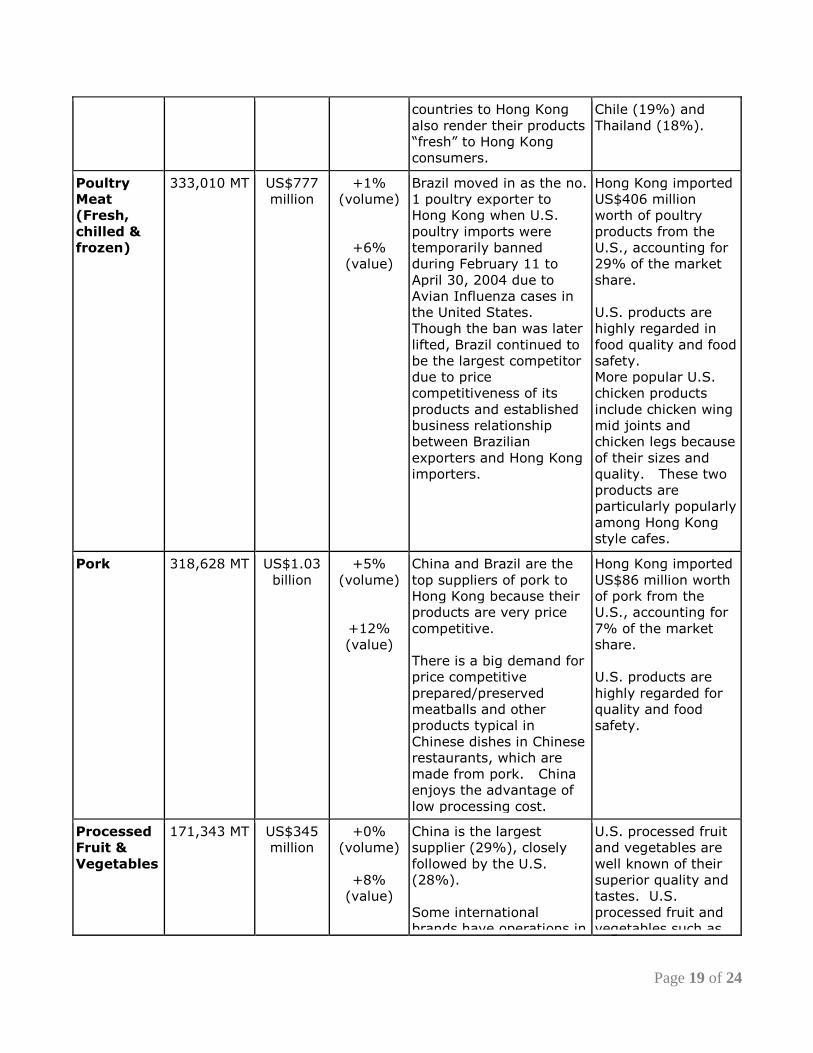
Table 9 – Hong Kong: Top 10 Prospects
Product
Category
2012
Retained
Imports
(MT)
2012
Retained
Imports
(US$
million)
2008 –
2012
Average
Annual
Retained
Import
Growth
Key Constraints Over
Market Development
Market
Attractiveness
For USA
Fish &
Seafood
Products
204,779
MT
US$2.6
billion
+3%
(volume)
+10%
(value)
Major suppliers of fish and
seafood products are
China (24%), Japan
(14%),
Australia (7%) and the
US (6%).
U.S. fish and seafood
products are
perceived as high
quality and safe.
Many 5-star hotels in
Hong Kong are
carrying Alaska
seafood products
such as king salmon,
king crab, snow
crab, black cod and
halibut. It is
anticipated that
these seafood
products will
continue to be
popular among HRI
sector in Hong Kong.
Fresh Fruit 623,188 MT US$847
million
+4%
(volume)
+9%
(value)
Hong Kong consumers
prefer fresh fruit to frozen
fruit. Competition from
Thailand and China is
keen as these countries
supply tropical fresh fruit
at competitive prices.
The shorter travel time
for shipments from these
U.S. fresh fruit are
well known for their
large variety, good
quality and tastes.
U.S. was the largest
supplier (25%) of
fresh fruit to Hong
Kong, followed by
Page 19 of 24
countries to Hong Kong
also render their products
“fresh” to Hong Kong
consumers.
Chile (19%) and
Thailand (18%).
Poultry
Meat
(Fresh,
chilled &
frozen)
333,010 MT US$777
million
+1%
(volume)
+6%
(value)
Brazil moved in as the no.
1 poultry exporter to
Hong Kong when U.S.
poultry imports were
temporarily banned
during February 11 to
April 30, 2004 due to
Avian Influenza cases in
the United States.
Though the ban was later
lifted, Brazil continued to
be the largest competitor
due to price
competitiveness of its
products and established
business relationship
between Brazilian
exporters and Hong Kong
importers.
Hong Kong imported
US$406 million
worth of poultry
products from the
U.S., accounting for
29% of the market
share.
U.S. products are
highly regarded in
food quality and food
safety.
More popular U.S.
chicken products
include chicken wing
mid joints and
chicken legs because
of their sizes and
quality. These two
products are
particularly popularly
among Hong Kong
style cafes.
Pork 318,628 MT US$1.03
billion
+5%
(volume)
+12%
(value)
China and Brazil are the
top suppliers of pork to
Hong Kong because their
products are very price
competitive.
There is a big demand for
price competitive
prepared/preserved
meatballs and other
products typical in
Chinese dishes in Chinese
restaurants, which are
made from pork. China
enjoys the advantage of
low processing cost.
Hong Kong imported
US$86 million worth
of pork from the
U.S., accounting for
7% of the market
share.
U.S. products are
highly regarded for
quality and food
safety.
Processed
Fruit &
Vegetables
171,343 MT US$345
million
+0%
(volume)
+8%
(value)
China is the largest
supplier (29%), closely
followed by the U.S.
(28%).
Some international
brands have operations in
U.S. processed fruit
and vegetables are
well known of their
superior quality and
tastes. U.S.
processed fruit and
vegetables such as
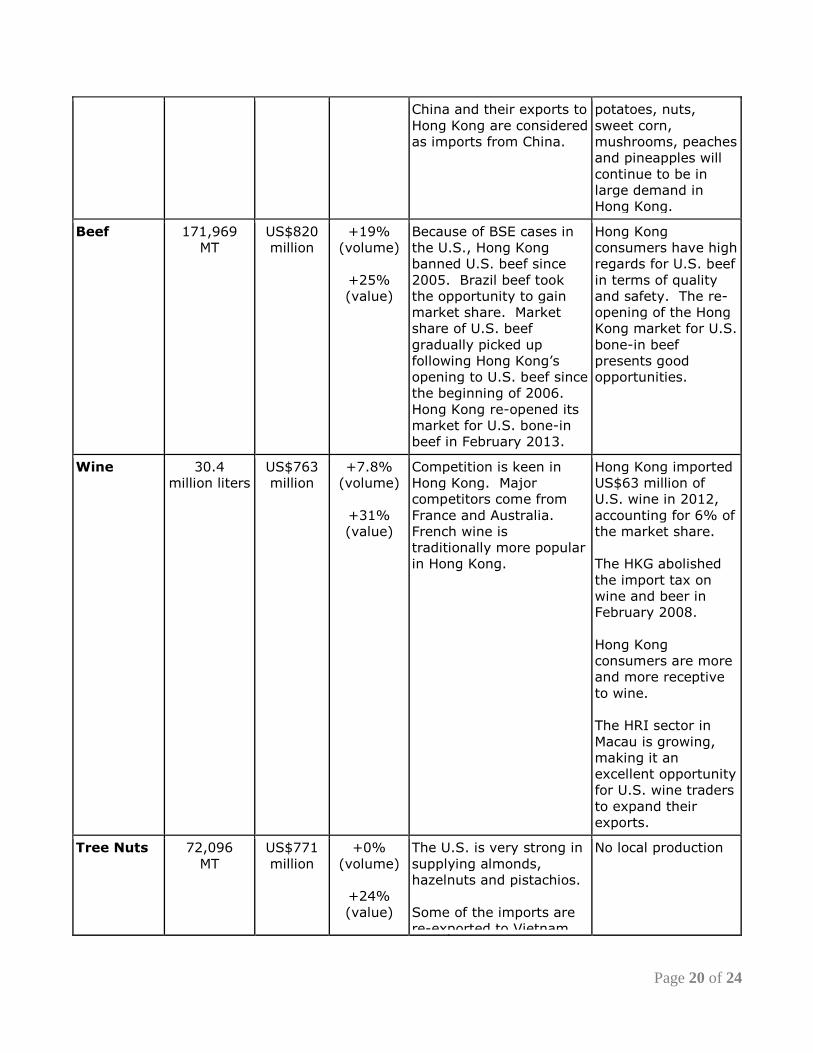
Page 20 of 24
China and their exports to
Hong Kong are considered
as imports from China.
potatoes, nuts,
sweet corn,
mushrooms, peaches
and pineapples will
continue to be in
large demand in
Hong Kong.
Beef 171,969
MT
US$820
million
+19%
(volume)
+25%
(value)
Because of BSE cases in
the U.S., Hong Kong
banned U.S. beef since
2005. Brazil beef took
the opportunity to gain
market share. Market
share of U.S. beef
gradually picked up
following Hong Kong’s
opening to U.S. beef since
the beginning of 2006.
Hong Kong re-opened its
market for U.S. bone-in
beef in February 2013.
Hong Kong
consumers have high
regards for U.S. beef
in terms of quality
and safety. The re-
opening of the Hong
Kong market for U.S.
bone-in beef
presents good
opportunities.
Wine 30.4
million liters
US$763
million
+7.8%
(volume)
+31%
(value)
Competition is keen in
Hong Kong. Major
competitors come from
France and Australia.
French wine is
traditionally more popular
in Hong Kong.
Hong Kong imported
US$63 million of
U.S. wine in 2012,
accounting for 6% of
the market share.
The HKG abolished
the import tax on
wine and beer in
February 2008.
Hong Kong
consumers are more
and more receptive
to wine.
The HRI sector in
Macau is growing,
making it an
excellent opportunity
for U.S. wine traders
to expand their
exports.
Tree Nuts 72,096
MT
US$771
million
+0%
(volume)
+24%
(value)
The U.S. is very strong in
supplying almonds,
hazelnuts and pistachios.
Some of the imports are
re-exported to Vietnam
No local production
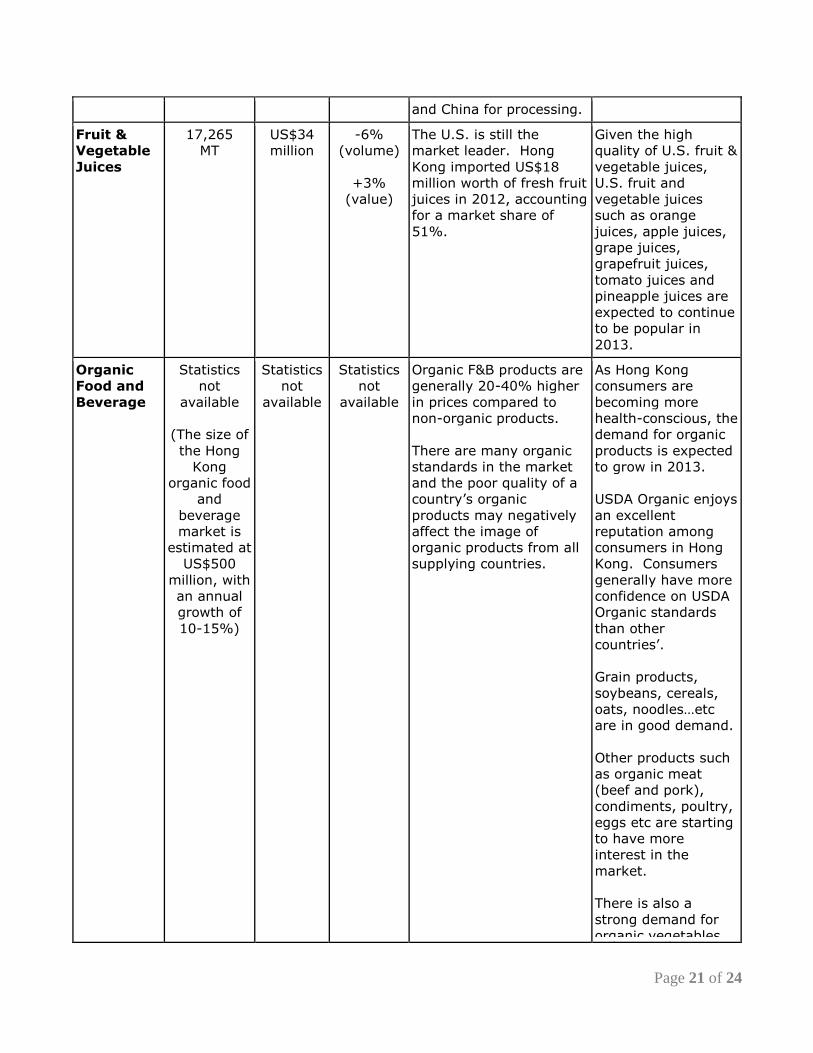
Page 21 of 24
and China for processing.
Fruit &
Vegetable
Juices
17,265
MT
US$34
million
-6%
(volume)
+3%
(value)
The U.S. is still the
market leader. Hong
Kong imported US$18
million worth of fresh fruit
juices in 2012, accounting
for a market share of
51%.
Given the high
quality of U.S. fruit &
vegetable juices,
U.S. fruit and
vegetable juices
such as orange
juices, apple juices,
grape juices,
grapefruit juices,
tomato juices and
pineapple juices are
expected to continue
to be popular in
2013.
Organic
Food and
Beverage
Statistics
not
available
(The size of
the Hong
Kong
organic food
and
beverage
market is
estimated at
US$500
million, with
an annual
growth of
10-15%)
Statistics
not
available
Statistics
not
available
Organic F&B products are
generally 20-40% higher
in prices compared to
non-organic products.
There are many organic
standards in the market
and the poor quality of a
country’s organic
products may negatively
affect the image of
organic products from all
supplying countries.
As Hong Kong
consumers are
becoming more
health-conscious, the
demand for organic
products is expected
to grow in 2013.
USDA Organic enjoys
an excellent
reputation among
consumers in Hong
Kong. Consumers
generally have more
confidence on USDA
Organic standards
than other
countries’.
Grain products,
soybeans, cereals,
oats, noodles…etc
are in good demand.
Other products such
as organic meat
(beef and pork),
condiments, poultry,
eggs etc are starting
to have more
interest in the
market.
There is also a
strong demand for
organic vegetables
Page 22 of 24
and fruits, organic
coffee and tea
products.
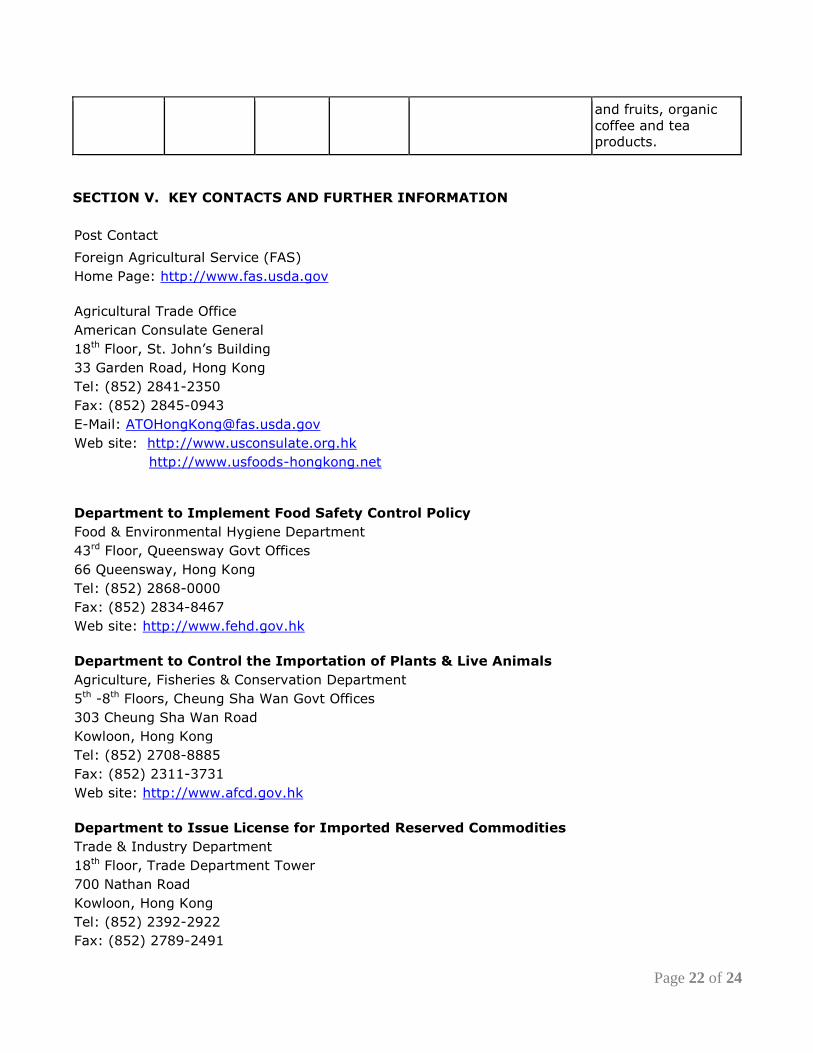
SECTION V. KEY CONTACTS AND FURTHER INFORMATION
Post Contact
Foreign Agricultural Service (FAS)
Home Page: http://www.fas.usda.gov
Agricultural Trade Office
American Consulate General
18th Floor, St. John’s Building
33 Garden Road, Hong Kong
Tel: (852) 2841-2350
Fax: (852) 2845-0943
E-Mail: [email protected]
Web site: http://www.usconsulate.org.hk
http://www.usfoods-hongkong.net
Department to Implement Food Safety Control Policy
Food & Environmental Hygiene Department
43rd Floor, Queensway Govt Offices
66 Queensway, Hong Kong
Tel: (852) 2868-0000
Fax: (852) 2834-8467
Web site: http://www.fehd.gov.hk
Department to Control the Importation of Plants & Live Animals
Agriculture, Fisheries & Conservation Department
5th -8th Floors, Cheung Sha Wan Govt Offices
303 Cheung Sha Wan Road
Kowloon, Hong Kong
Tel: (852) 2708-8885
Fax: (852) 2311-3731
Web site: http://www.afcd.gov.hk
Department to Issue License for Imported Reserved Commodities
Trade & Industry Department
18th Floor, Trade Department Tower
700 Nathan Road
Kowloon, Hong Kong
Tel: (852) 2392-2922
Fax: (852) 2789-2491
Page 23 of 24
Web site: http://www.tid.gov.hk
Department to Register Health Foods Containing Medicine Ingredients
Department of Health
Pharmaceuticals Registration
Import & Export Control Section
18th Floor, Wu Chung House
213 Queen’s Road East, Wanchai, Hong Kong
Tel: (852) 2961-8754
Fax: (852) 2834-5117
Web site: http://www.dh.gov.hk
Department to Issue License for Imported Dutiable Commodities
Hong Kong Customs & Excise Department
Office of Dutiable Commodities Administration
6th -9th Floors, Harbor Building
38 Pier Road, Central, Hong Kong
Tel: (852) 2815-7711
Fax: (852) 2581-0218
Web site: http://www.customs.gov.hk
Department for Trade Mark Registration
Intellectual Property Department
Trade Marks Registry
24th and 25th Floors, Wu Chung House
213 Queen’s Road East
Wan Chai, Hong Kong
Tel: (852) 2803-5860
Fax: (852) 2838-6082
Web site: http://www.ipd.gov.hk
Semi-Government Organization Providing Travel Information
Hong Kong Tourist Board
9th - 11th Floors, Citicorp Center,
18 Whitfield Road, North Point, Hong Kong
Tel: (852) 2807-6543
Fax: (852) 2806-0303
Home Page: http://www.hktourismboard.com
Semi-Government Organization Providing Hong Kong Trade Information
Hong Kong Trade Development Council
38th Floor, Office Tower, Convention Plaza
1 Harbor Road, Wan Chai, Hong Kong
Tel: (852) 2584-4188
Fax: (852) 2824-0249