Embed Size (px)
Citation preview

Homelessness in Alameda County, CATrends, Assistance, Funding, and Recommendations
Sam BatkoMary CunninghamJosh Leopold
November 21, 2017

• Urban Institute: Washington, DC based social research firm
• Homelessness consulting services for Alameda County August-December 2017
• Recommendations to address recent reported increase in homelessness based on:
• Interviews with county officials and partner organizations•Review of local data• Survey of county and city agencies and community-based
organizations•Review of national best practices
Background
2
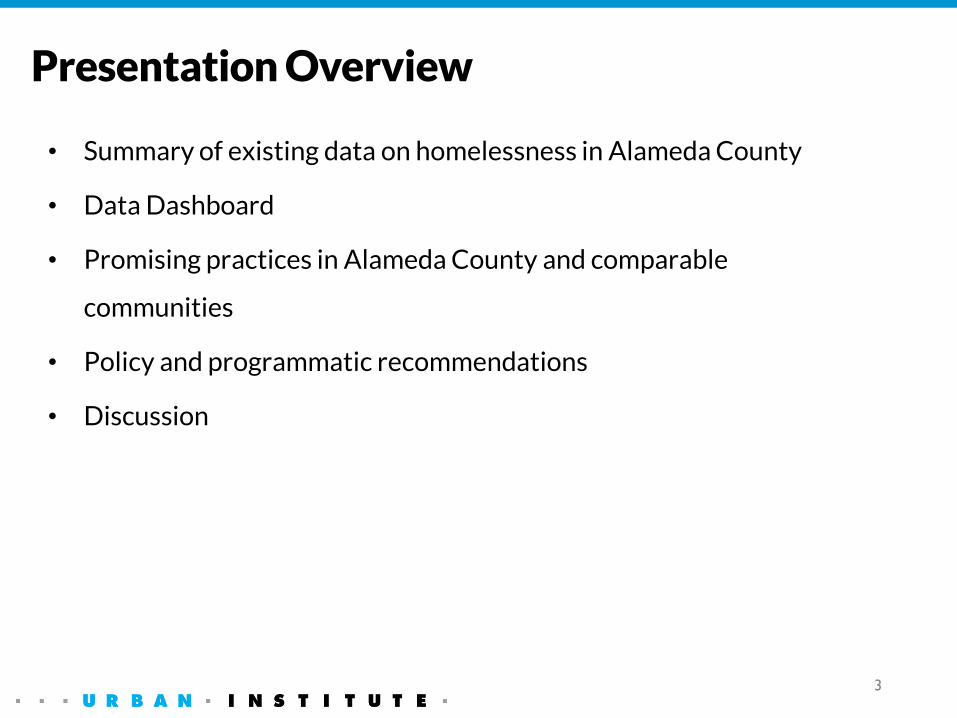
• Summary of existing data on homelessness in Alameda County
• Data Dashboard
• Promising practices in Alameda County and comparable
communities
• Policy and programmatic recommendations
• Discussion
Presentation Overview
3
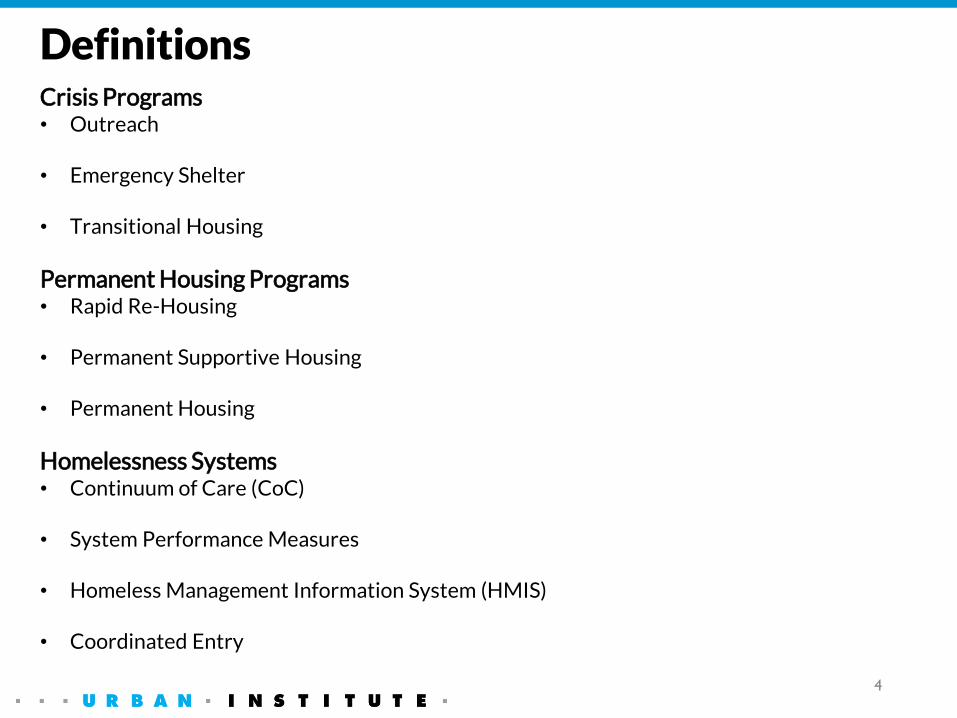
Crisis Programs• Outreach
• Emergency Shelter
• Transitional Housing
Permanent Housing Programs• Rapid Re-Housing
• Permanent Supportive Housing
• Permanent Housing
Homelessness Systems• Continuum of Care (CoC)
• System Performance Measures
• Homeless Management Information System (HMIS)
• Coordinated Entry
Definitions
4
Homelessness in Alameda County
2017 Snapshot and Trends
5
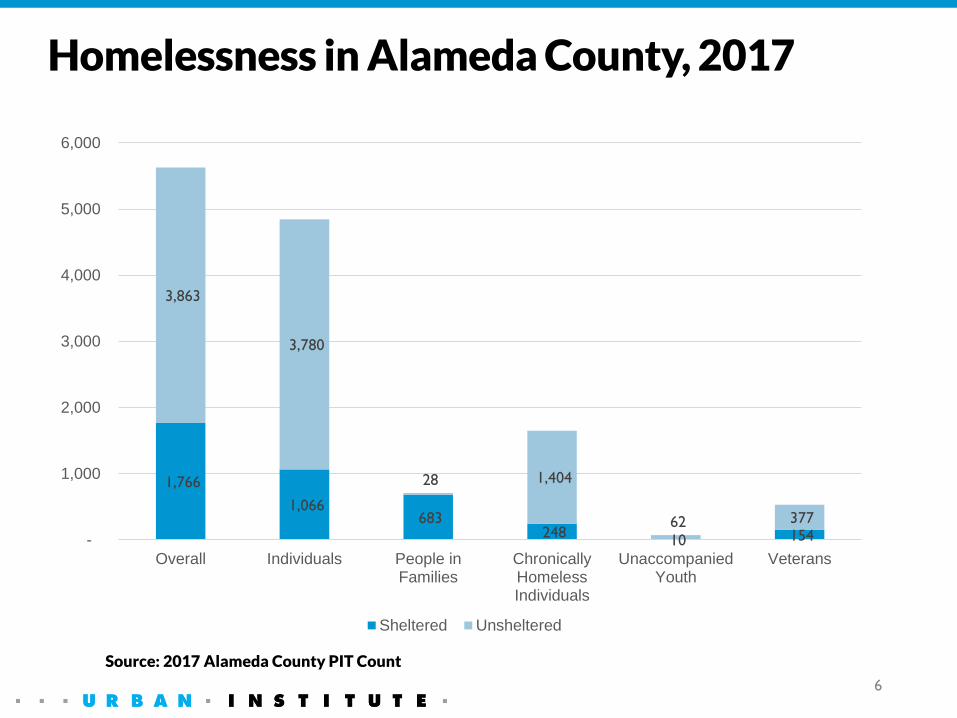
Homelessness in Alameda County, 2017
1,766
1,066 683
248 10 154
3,863
3,780
28 1,404
62 377
-
1,000
2,000
3,000
4,000
5,000
6,000
Overall Individuals People inFamilies
ChronicallyHomelessIndividuals
UnaccompaniedYouth
Veterans
Sheltered Unsheltered
6
Source: 2017 Alameda County PIT Count

Rates of Homelessness in Alameda County and Other California CountiesCounty Rate of Homelessness, 2017 (per 10,000)San Francisco County 86.1Los Angeles County 57.0Santa Clara County 38.5San Diego County 27.5Alameda County 34.2
Berkeley 80.2Oakland 65.7Albany 33.5Livermore 27.3Alameda (city) 25.9Hayward 25.0Emeryville 24.8Fremont 20.5Newark 15.3Alameda County (unincorporated) 14.6San Leandro 12.0Union City 5.3Dublin 3.5Pleasanton 2.2Piedmont 07
Source: 2017 PIT count; 2016 Census Bureau population estimates
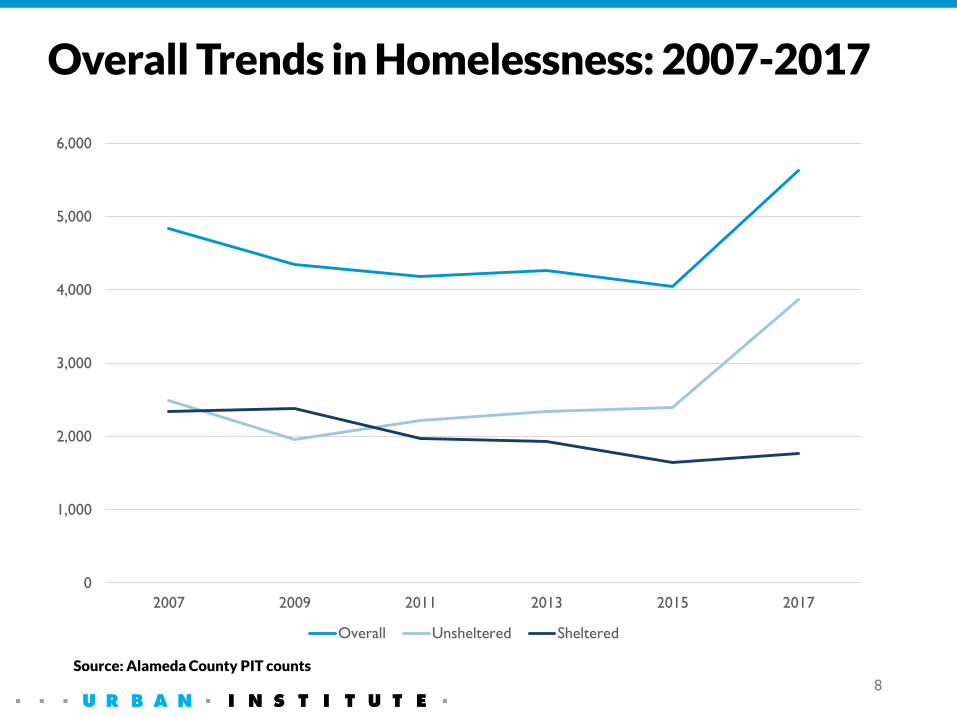
Overall Trends in Homelessness: 2007-2017
0
1,000
2,000
3,000
4,000
5,000
6,000
2007 2009 2011 2013 2015 2017
Overall Unsheltered Sheltered
8
Source: Alameda County PIT counts
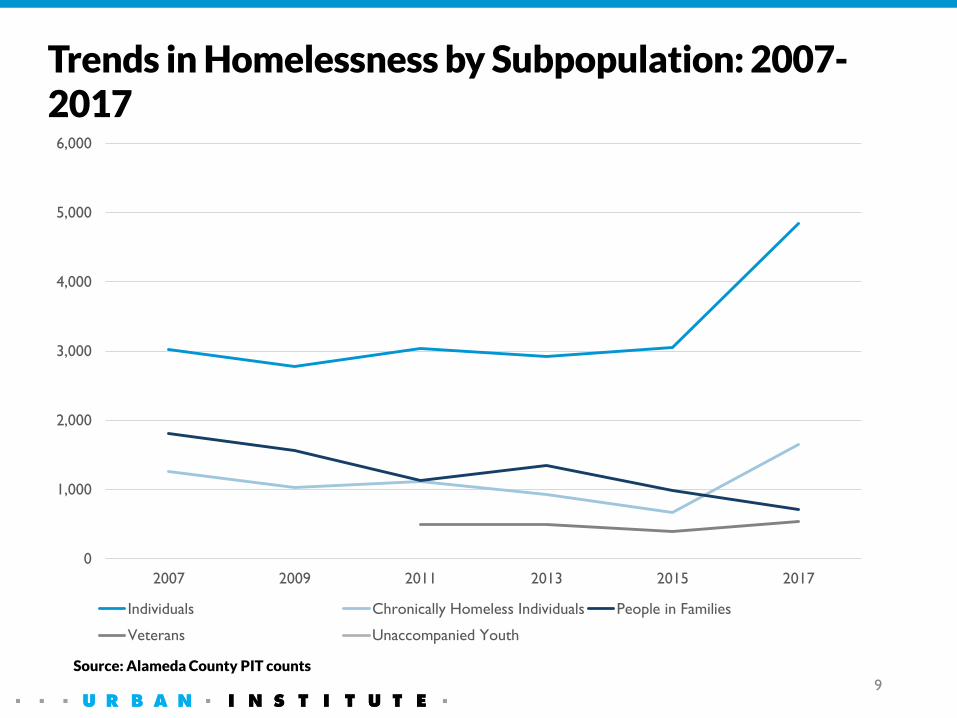
Trends in Homelessness by Subpopulation: 2007-2017
0
1,000
2,000
3,000
4,000
5,000
6,000
2007 2009 2011 2013 2015 2017
Individuals Chronically Homeless Individuals People in Families
Veterans Unaccompanied Youth
9
Source: Alameda County PIT counts

Trends in Unsheltered Homelessness: 2007-2017
-
500
1,000
1,500
2,000
2,500
2007 2009 2011 2013 2015 2017
Non-Chronically Homeless Individuals Chronically Homeless Individuals People in Families
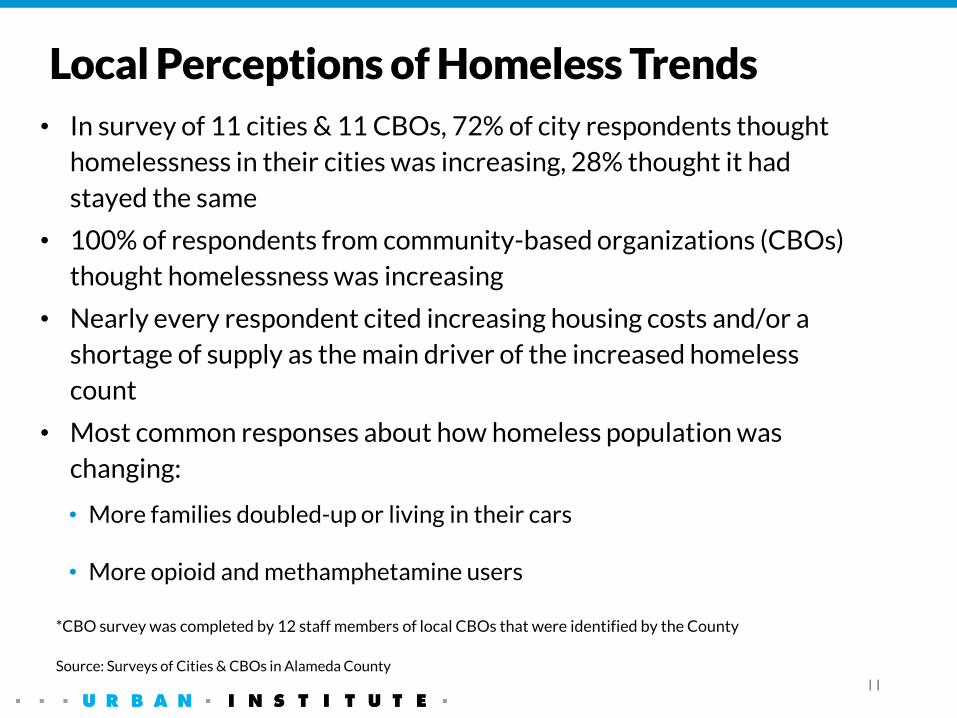
• In survey of 11 cities & 11 CBOs, 72% of city respondents thought
homelessness in their cities was increasing, 28% thought it had
stayed the same
• 100% of respondents from community-based organizations (CBOs)
thought homelessness was increasing
• Nearly every respondent cited increasing housing costs and/or a
shortage of supply as the main driver of the increased homeless
count
• Most common responses about how homeless population was
changing:
• More families doubled-up or living in their cars
• More opioid and methamphetamine users
*CBO survey was completed by 12 staff members of local CBOs that were identified by the County
Source: Surveys of Cities & CBOs in Alameda County
Local Perceptions of Homeless Trends
11
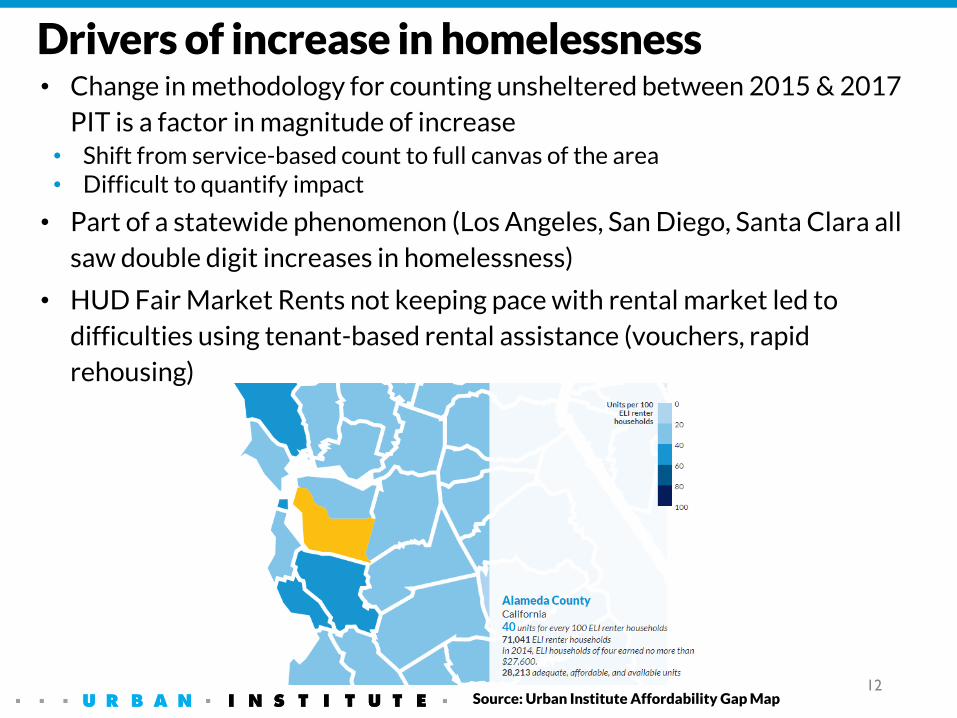
• Change in methodology for counting unsheltered between 2015 & 2017
PIT is a factor in magnitude of increase• Shift from service-based count to full canvas of the area• Difficult to quantify impact
• Part of a statewide phenomenon (Los Angeles, San Diego, Santa Clara all
saw double digit increases in homelessness)
• HUD Fair Market Rents not keeping pace with rental market led to
difficulties using tenant-based rental assistance (vouchers, rapid
rehousing)
Drivers of increase in homelessness
12Source: Urban Institute Affordability Gap Map
Homeless Assistance in Alameda County
Housing Inventory, Funding, and Performance
13
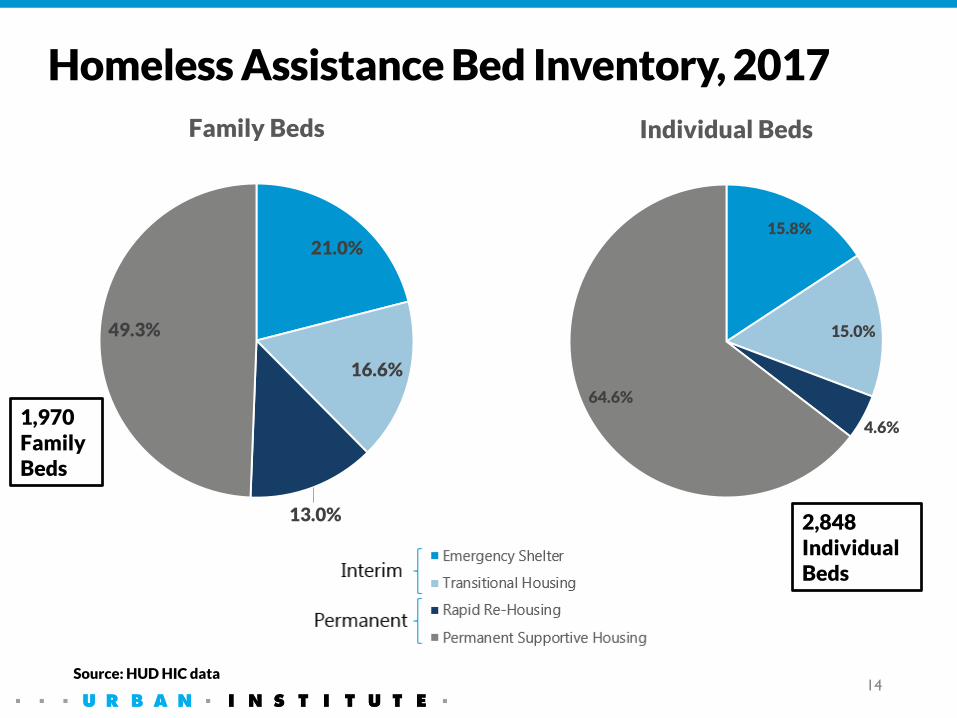
Homeless Assistance Bed Inventory, 2017
21.0%
16.6%
13.0%
49.3%
Family Beds
15.8%
15.0%
4.6%
64.6%
Individual Beds
14Source: HUD HIC data
1,970 Family Beds
2,848 Individual Beds
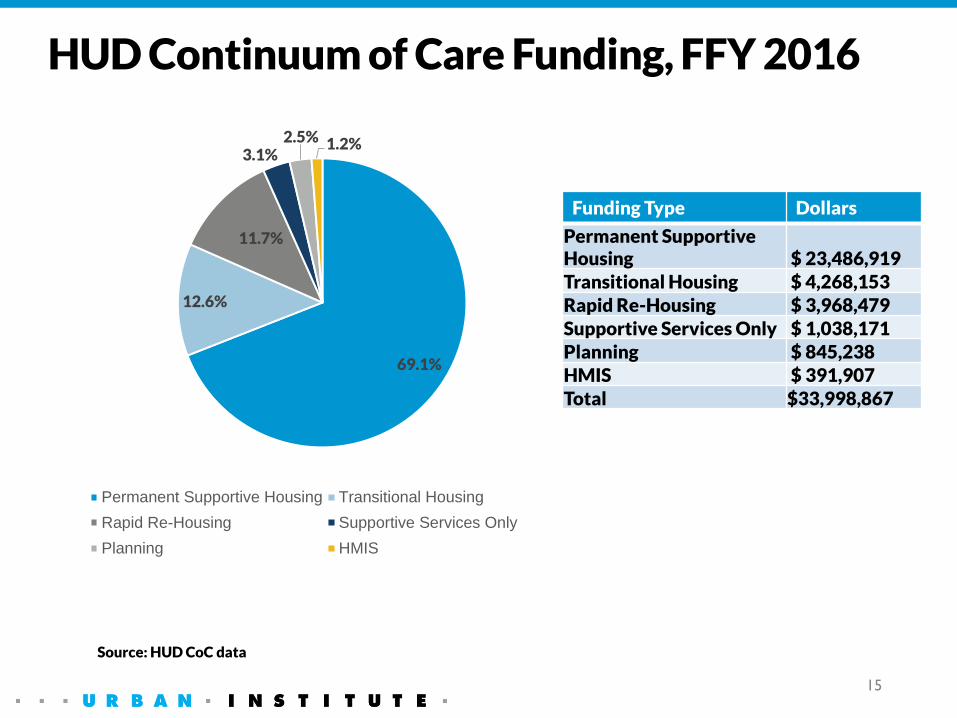
HUD Continuum of Care Funding, FFY 2016
69.1%
12.6%
11.7%
3.1%2.5% 1.2%
Permanent Supportive Housing Transitional Housing
Rapid Re-Housing Supportive Services Only
Planning HMIS
15
Source: HUD CoC data
Funding Type Dollars
Permanent Supportive Housing $ 23,486,919
Transitional Housing $ 4,268,153 Rapid Re-Housing $ 3,968,479
Supportive Services Only $ 1,038,171 Planning $ 845,238 HMIS $ 391,907 Total $33,998,867
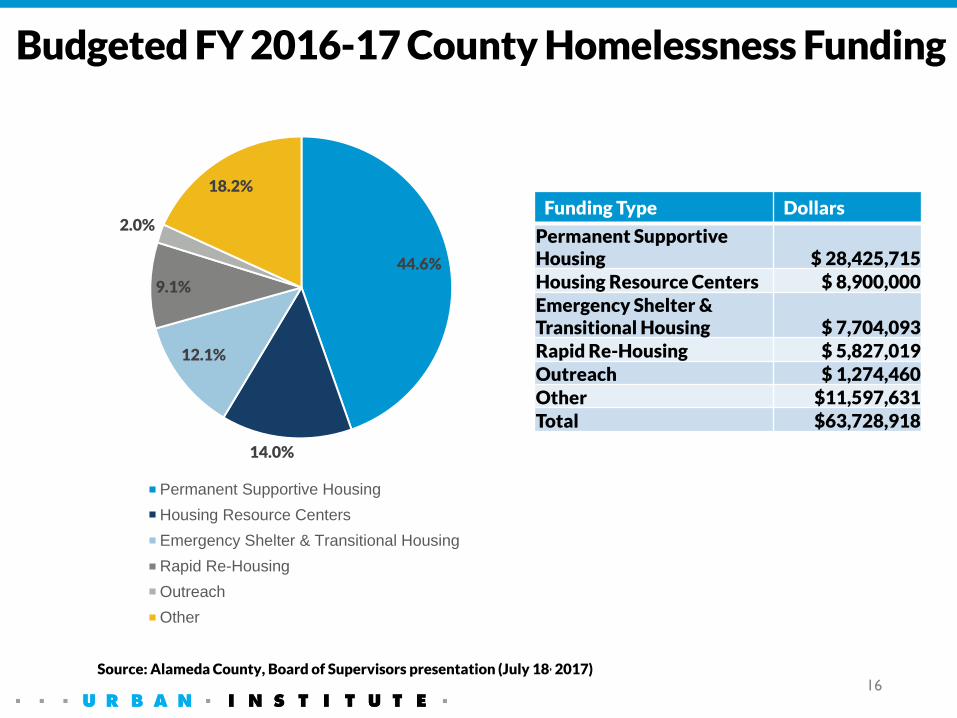
Budgeted FY 2016-17 County Homelessness Funding
44.6%
14.0%
12.1%
9.1%
2.0%
18.2%
Permanent Supportive Housing
Housing Resource Centers
Emergency Shelter & Transitional Housing
Rapid Re-Housing
Outreach
Other
16Source: Alameda County, Board of Supervisors presentation (July 18, 2017)
Funding Type Dollars
Permanent Supportive Housing $ 28,425,715
Housing Resource Centers $ 8,900,000Emergency Shelter & Transitional Housing $ 7,704,093
Rapid Re-Housing $ 5,827,019Outreach $ 1,274,460
Other $11,597,631Total $63,728,918
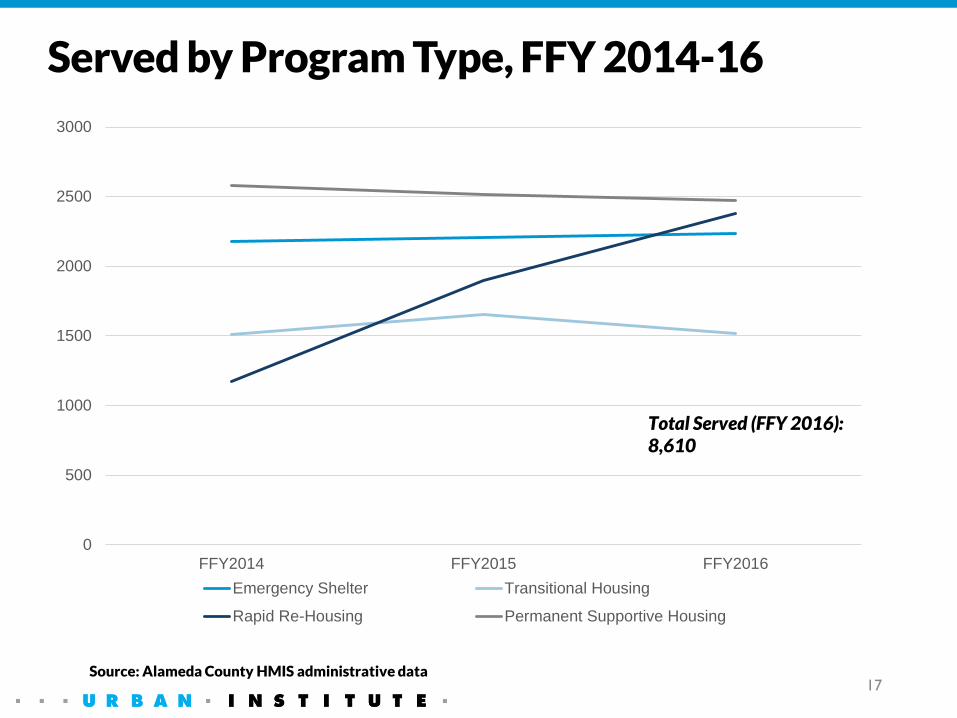
Served by Program Type, FFY 2014-16
0
500
1000
1500
2000
2500
3000
FFY2014 FFY2015 FFY2016
Emergency Shelter Transitional Housing
Rapid Re-Housing Permanent Supportive Housing
Total Served (FFY 2016): 8,610
17Source: Alameda County HMIS administrative data
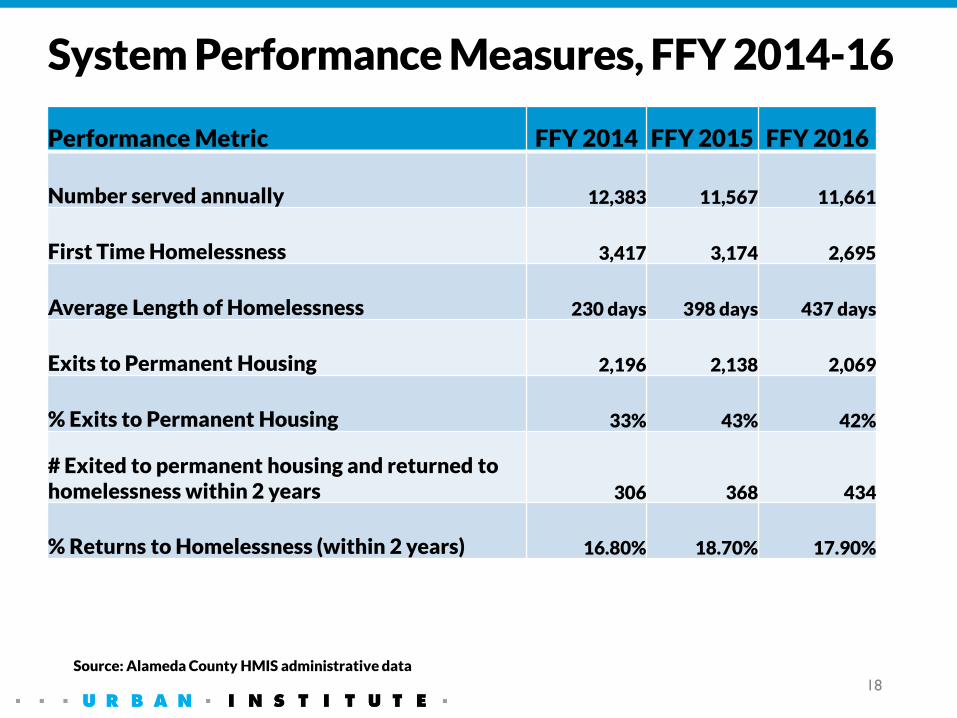
System Performance Measures, FFY 2014-16
Performance Metric FFY 2014 FFY 2015 FFY 2016
Number served annually 12,383 11,567 11,661
First Time Homelessness 3,417 3,174 2,695
Average Length of Homelessness 230 days 398 days 437 days
Exits to Permanent Housing 2,196 2,138 2,069
% Exits to Permanent Housing 33% 43% 42%
# Exited to permanent housing and returned to homelessness within 2 years 306 368 434
% Returns to Homelessness (within 2 years) 16.80% 18.70% 17.90%
18
Source: Alameda County HMIS administrative data
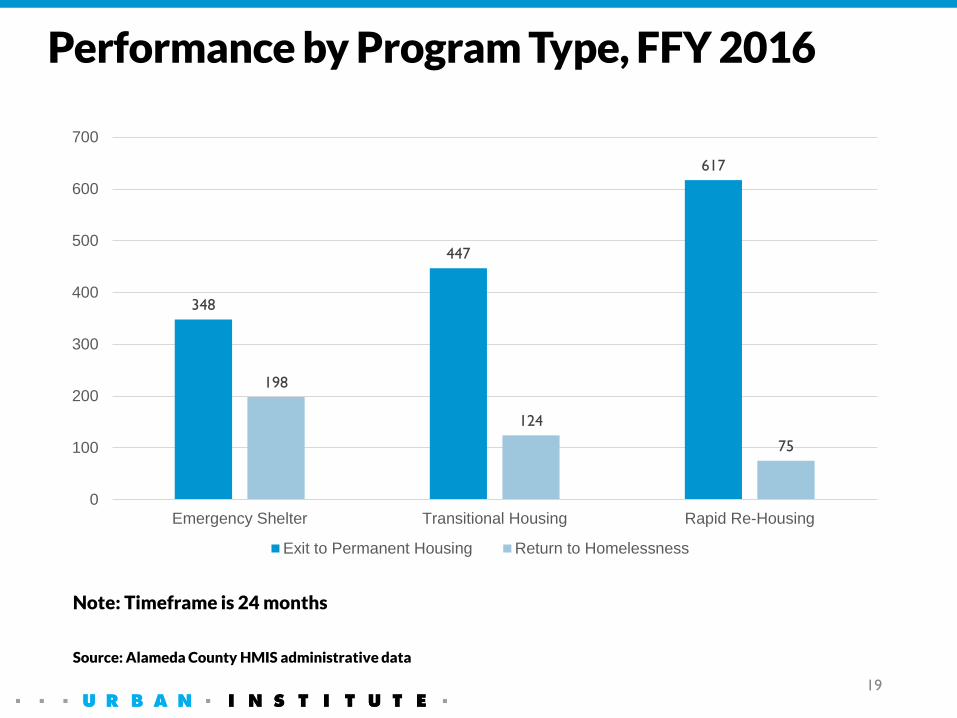
Performance by Program Type, FFY 2016
348
447
617
198
124
75
0
100
200
300
400
500
600
700
Emergency Shelter Transitional Housing Rapid Re-Housing
Exit to Permanent Housing Return to Homelessness
19
Note: Timeframe is 24 months
Source: Alameda County HMIS administrative data
Data Dashboard
20
Population Need, Performance, and Resources

•HUD data on housing inventory & CoC funding
•EveryOne Home
•HCD, SSA, HCSA budgets and documents
•Survey of city agencies
Dashboard Data Sources
21

Can we add a slide here showing how much each city is spending, by program
type, on homeless funding based on survey results?
Alameda County funding by City & Program Type
22
City OutreachEmergency Shelter
Transitional Housing
Rapid Re-Housing
Permanent Supportive Housing
Supportive Services
Coordinated entry Prevention
Other Program Type Total
Oakland $365,000 $569,949 $17.4m $2m $1.96m $547,603 $5.3m $1.5m $30.2m
Berkeley $450,000 $748,226 $231,426 $5.2m $490,019 $1.3m $250,000 $108,528 $8.7m
Fremont $500,000 $210,000 $60,000 $100,000 $100,000 $240,000 $1.2m
Livermore $79,684 $75,000 $25,000 $50,000 $165,263 $394,947
Alameda (city) $125,000 $74,401 $199,401
Albany $16,000 $8,000 $218,000 $242,000
San Leandro $35,000 $1.75m $100,000 $186,000 $2.1m
Union City $20,000 $16,000 $305,000 $70,000 $411,000
Emeryville $60,000 $60,000
Dublin $21,179 $206,602 $227,781 $455,562
Pleasanton $50,000 $46,000 $20,000 $50,000 $10,000 $176,000 Unincorporated Alameda County (HCD only) $80,000 $81,320 $43,358 $85,788 $16,000 $306,466
Source: City survey responses from most recent fiscal year. Missing data for Newark, Piedmont, and Hayward.
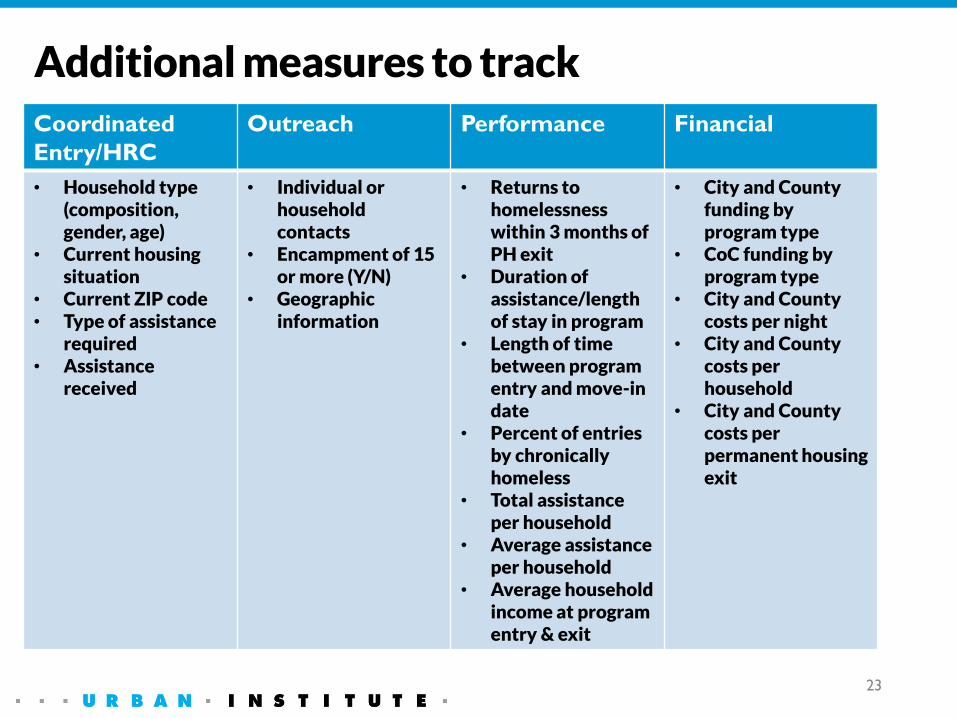
Coordinated
Entry/HRC
Outreach Performance Financial
• Household type (composition, gender, age)
• Current housing situation
• Current ZIP code• Type of assistance
required• Assistance
received
• Individual or household contacts
• Encampment of 15 or more (Y/N)
• Geographic information
• Returns to homelessness within 3 months of PH exit
• Duration of assistance/length of stay in program
• Length of time between program entry and move-in date
• Percent of entries by chronically homeless
• Total assistance per household
• Average assistance per household
• Average household income at program entry & exit
• City and County funding byprogram type
• CoC funding by program type
• City and County costs per night
• City and County costs per household
• City and Countycosts per permanent housing exit
Additional measures to track
23
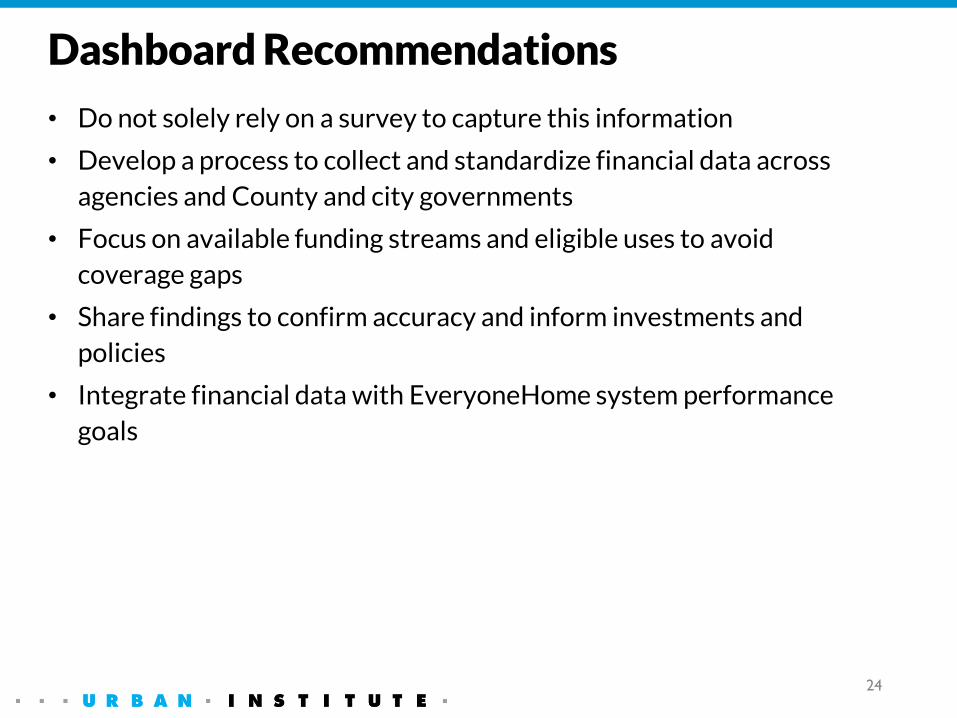
• Do not solely rely on a survey to capture this information
• Develop a process to collect and standardize financial data across
agencies and County and city governments
• Focus on available funding streams and eligible uses to avoid
coverage gaps
• Share findings to confirm accuracy and inform investments and
policies
• Integrate financial data with EveryoneHome system performance
goals
Dashboard Recommendations
24
Profiles of Promising Practices in Comparable Communities
25
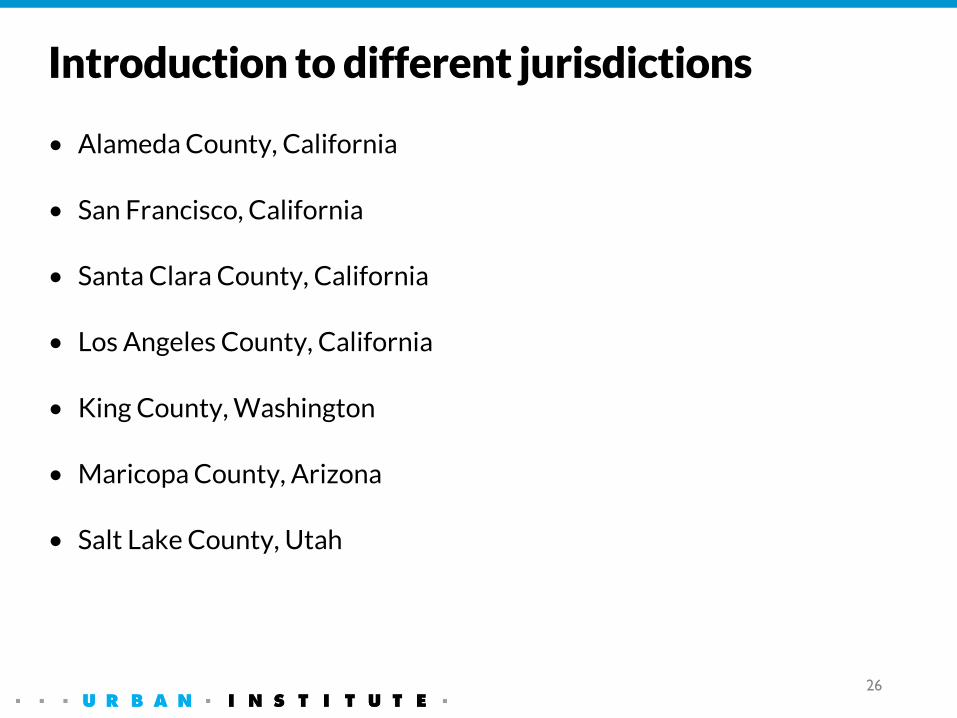
Introduction to different jurisdictions
• Alameda County, California
• San Francisco, California
• Santa Clara County, California
• Los Angeles County, California
• King County, Washington
• Maricopa County, Arizona
• Salt Lake County, Utah
26
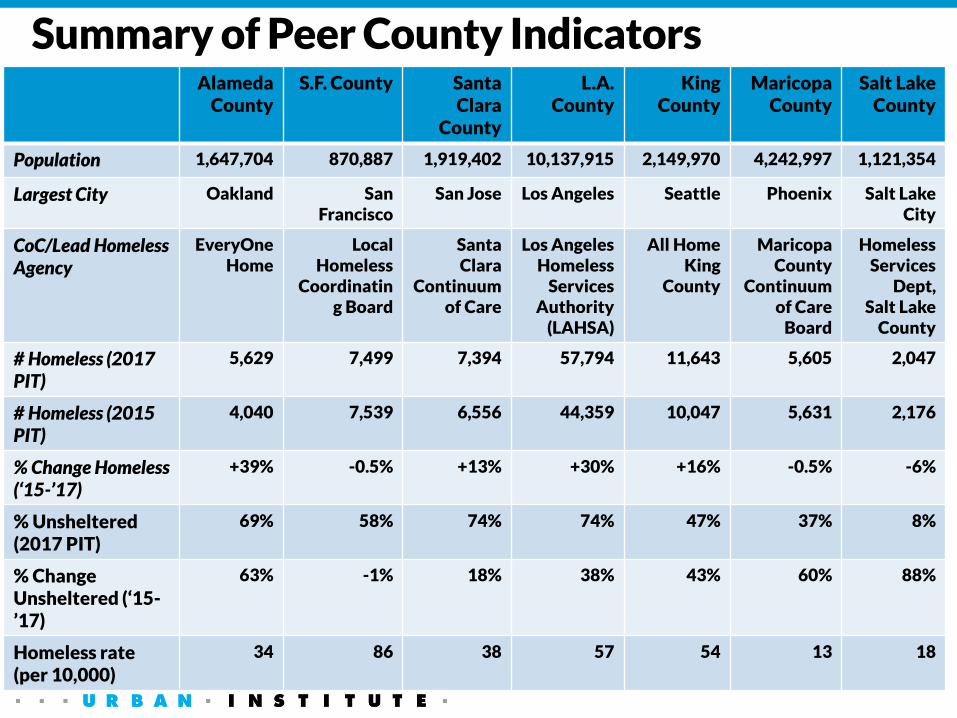
Summary of Peer County Indicators
27
Alameda County
S.F. County Santa Clara
County
L.A. County
King County
MaricopaCounty
Salt Lake County
Population 1,647,704 870,887 1,919,402 10,137,915 2,149,970 4,242,997 1,121,354
Largest City Oakland San Francisco
San Jose Los Angeles Seattle Phoenix Salt Lake City
CoC/Lead Homeless Agency
EveryOneHome
Local Homeless
Coordinating Board
Santa Clara
Continuumof Care
Los Angeles Homeless
Services Authority
(LAHSA)
All Home King
County
Maricopa County
Continuumof Care
Board
HomelessServices
Dept, Salt Lake
County
# Homeless (2017 PIT)
5,629 7,499 7,394 57,794 11,643 5,605 2,047
# Homeless (2015 PIT)
4,040 7,539 6,556 44,359 10,047 5,631 2,176
% Change Homeless (‘15-’17)
+39% -0.5% +13% +30% +16% -0.5% -6%
% Unsheltered (2017 PIT)
69% 58% 74% 74% 47% 37% 8%
% Change Unsheltered (‘15-’17)
63% -1% 18% 38% 43% 60% 88%
Homeless rate (per 10,000)
34 86 38 57 54 13 18
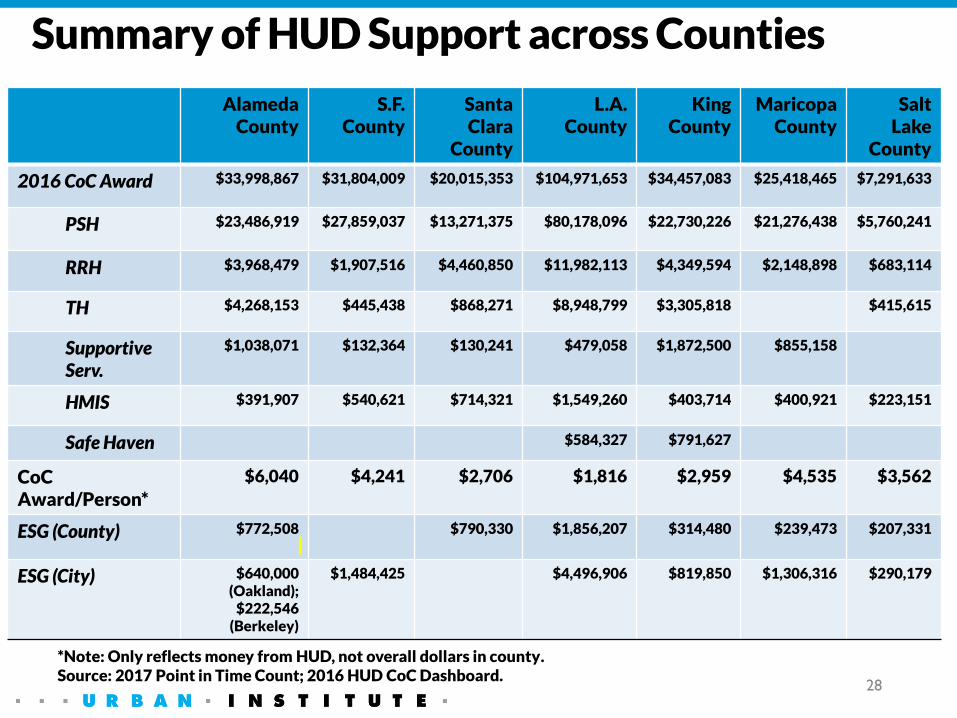
Summary of HUD Support across Counties
28
Alameda County
S.F. County
Santa Clara
County
L.A. County
King County
MaricopaCounty
SaltLake
County
2016 CoC Award $33,998,867 $31,804,009 $20,015,353 $104,971,653 $34,457,083 $25,418,465 $7,291,633
PSH $23,486,919 $27,859,037 $13,271,375 $80,178,096 $22,730,226 $21,276,438 $5,760,241
RRH $3,968,479 $1,907,516 $4,460,850 $11,982,113 $4,349,594 $2,148,898 $683,114
TH $4,268,153 $445,438 $868,271 $8,948,799 $3,305,818 $415,615
Supportive Serv.
$1,038,071 $132,364 $130,241 $479,058 $1,872,500 $855,158
HMIS $391,907 $540,621 $714,321 $1,549,260 $403,714 $400,921 $223,151
Safe Haven $584,327 $791,627
CoCAward/Person*
$6,040 $4,241 $2,706 $1,816 $2,959 $4,535 $3,562
ESG (County) $772,508 $790,330 $1,856,207 $314,480 $239,473 $207,331
ESG (City) $640,000 (Oakland);
$222,546(Berkeley)
$1,484,425 $4,496,906 $819,850 $1,306,316 $290,179
*Note: Only reflects money from HUD, not overall dollars in county.Source: 2017 Point in Time Count; 2016 HUD CoC Dashboard.
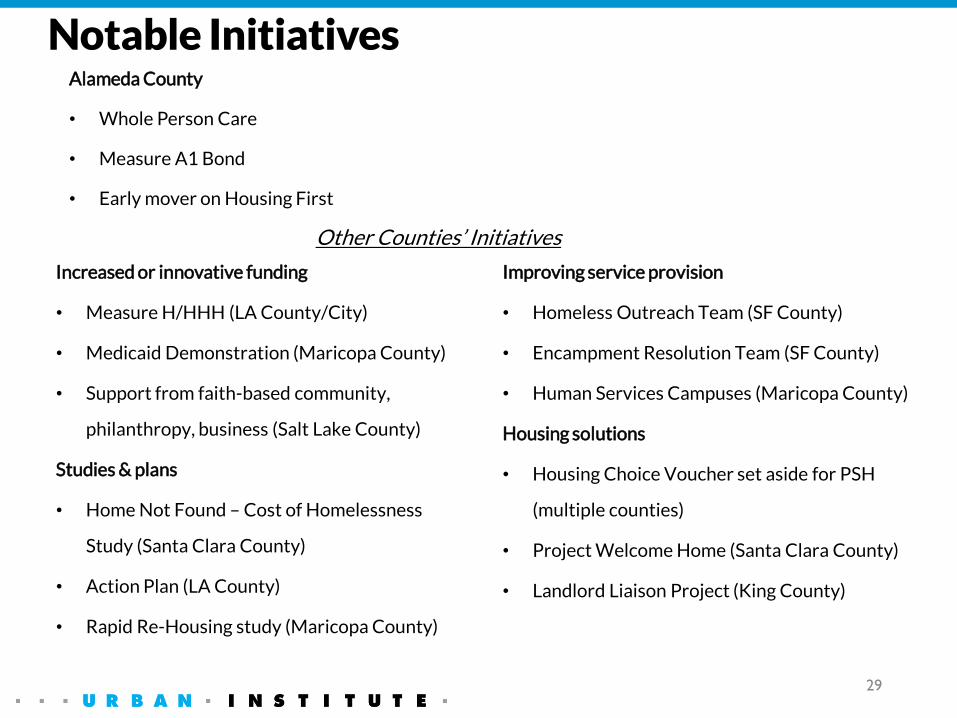
Notable Initiatives
Increased or innovative funding
• Measure H/HHH (LA County/City)
• Medicaid Demonstration (Maricopa County)
• Support from faith-based community,
philanthropy, business (Salt Lake County)
Studies & plans
• Home Not Found – Cost of Homelessness
Study (Santa Clara County)
• Action Plan (LA County)
• Rapid Re-Housing study (Maricopa County)
29
Improving service provision
• Homeless Outreach Team (SF County)
• Encampment Resolution Team (SF County)
• Human Services Campuses (Maricopa County)
Housing solutions
• Housing Choice Voucher set aside for PSH
(multiple counties)
• Project Welcome Home (Santa Clara County)
• Landlord Liaison Project (King County)
Alameda County
• Whole Person Care
• Measure A1 Bond
• Early mover on Housing First
Other Counties’ Initiatives
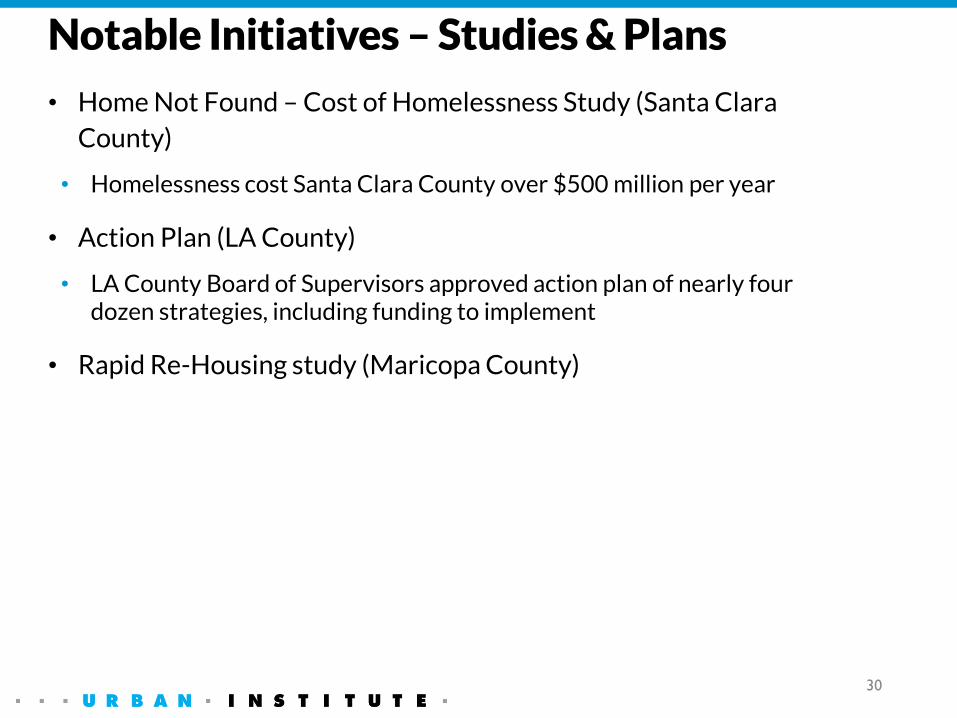
Notable Initiatives – Studies & Plans
• Home Not Found – Cost of Homelessness Study (Santa Clara
County)
• Homelessness cost Santa Clara County over $500 million per year
• Action Plan (LA County)
• LA County Board of Supervisors approved action plan of nearly four dozen strategies, including funding to implement
• Rapid Re-Housing study (Maricopa County)
30
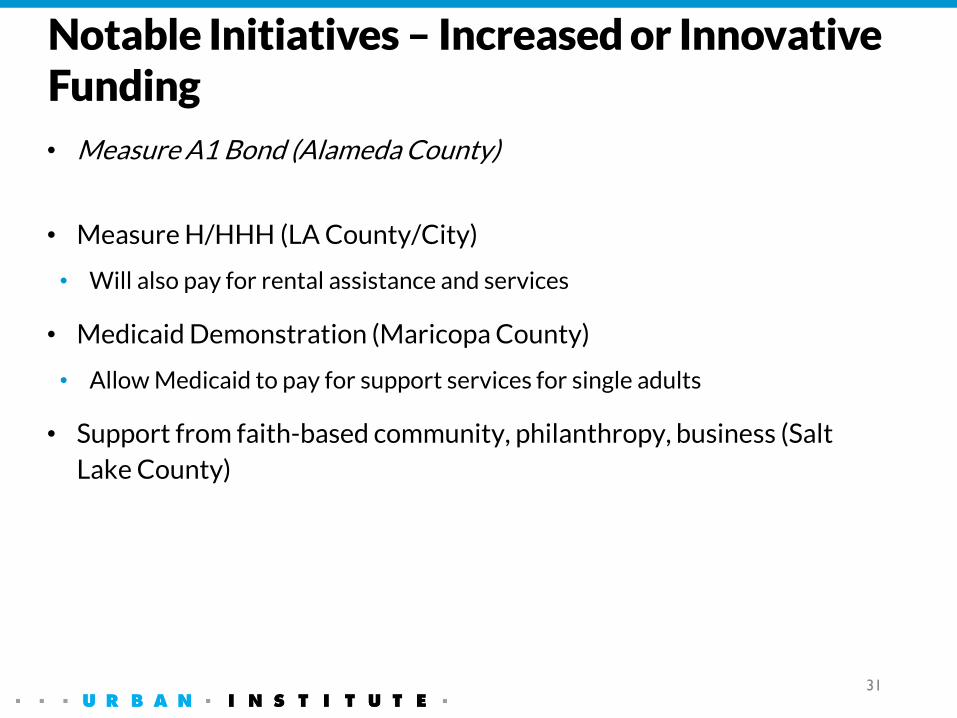
Notable Initiatives – Increased or Innovative Funding
• Measure A1 Bond (Alameda County)
• Measure H/HHH (LA County/City)
• Will also pay for rental assistance and services
• Medicaid Demonstration (Maricopa County)
• Allow Medicaid to pay for support services for single adults
• Support from faith-based community, philanthropy, business (Salt
Lake County)
31
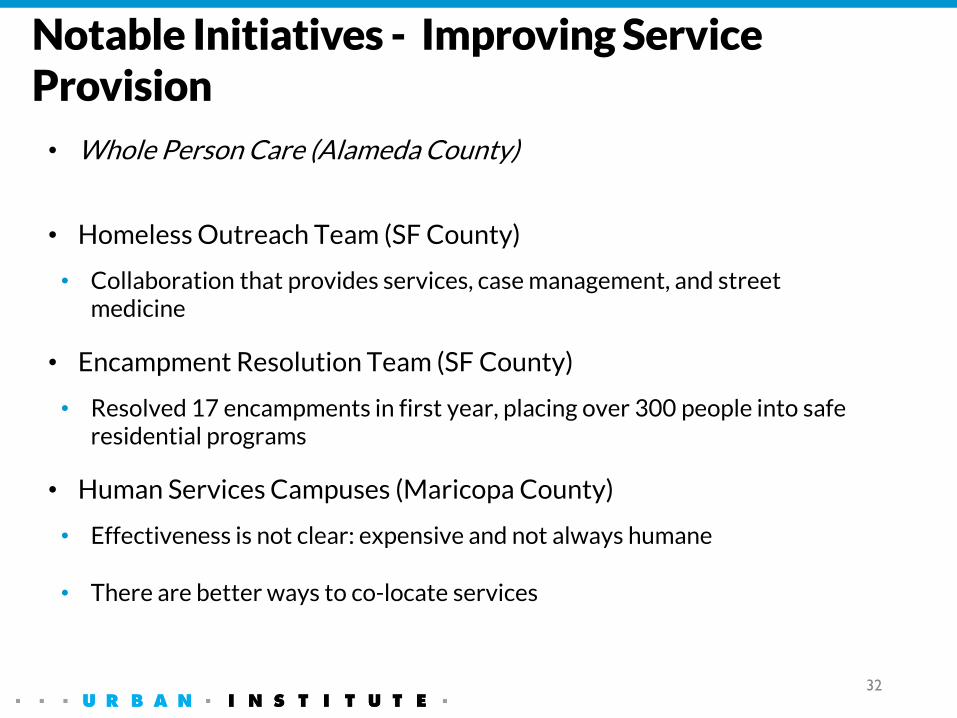
Notable Initiatives - Improving Service Provision
32
• Whole Person Care (Alameda County)
• Homeless Outreach Team (SF County)
• Collaboration that provides services, case management, and street medicine
• Encampment Resolution Team (SF County)
• Resolved 17 encampments in first year, placing over 300 people into safe residential programs
• Human Services Campuses (Maricopa County)
• Effectiveness is not clear: expensive and not always humane
• There are better ways to co-locate services
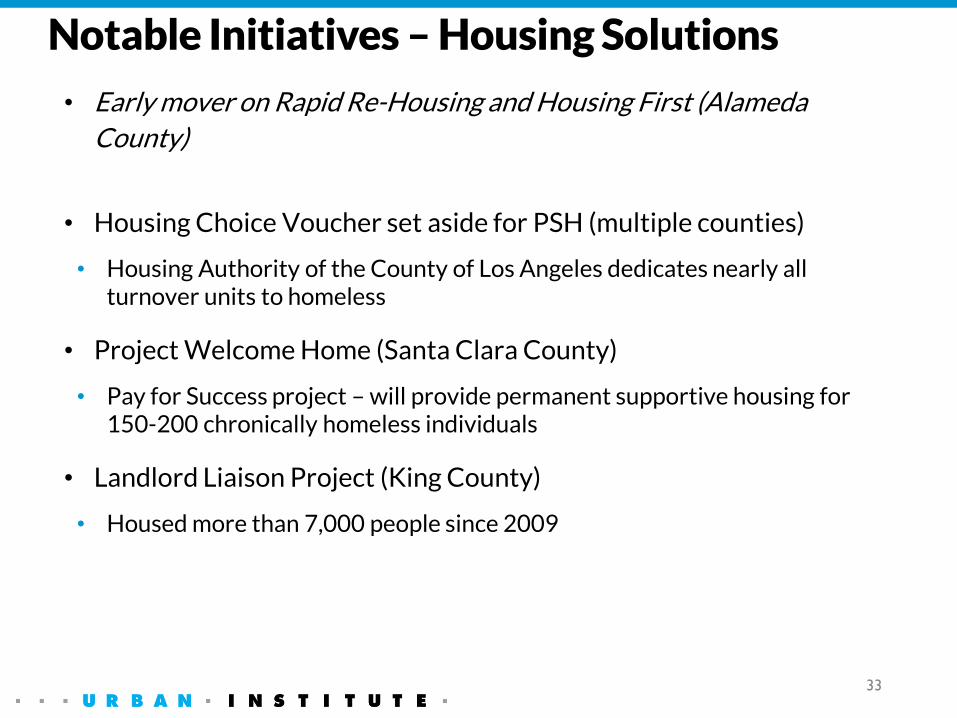
Notable Initiatives – Housing Solutions
33
• Early mover on Rapid Re-Housing and Housing First (Alameda
County)
• Housing Choice Voucher set aside for PSH (multiple counties)
• Housing Authority of the County of Los Angeles dedicates nearly all turnover units to homeless
• Project Welcome Home (Santa Clara County)
• Pay for Success project – will provide permanent supportive housing for 150-200 chronically homeless individuals
• Landlord Liaison Project (King County)
• Housed more than 7,000 people since 2009

Recommendations
34
Synthesis of:
• Recommendations provided by respondents from CBO and city
agency survey
• Interviews with county agency staff
• Review of best practices in comparable communities
Basis for recommendations
35
• Expand current efforts to coordinate funding priorities between
agencies
• Clarify roles and responsibilities between EveryOne Home, County,
cities, and CBOs
• Establish formal data sharing process between city and County
agencies to share information on funding by revenue source and
program
• Ensure that ranking and rating process for CoC funding is clearly
understood by key stakeholders
Improve coordination and data sharing
36
• Continue focus on permanent housing as solution for homelessness
• Identify operating and service subsides to target a greater share of affordable units to homeless and extremely low income
• Conduct a thorough needs assessment of # of units and estimated cost to prevent and end homelessness
• Develop a housing affordability plan to reach that unit target
• To increase housing supply, County could consider
• local, dedicated funding stream for operations and services for supportive housing
• Land-use reform to encourage micro-units and accessory dwelling units
Take bold action on housing
37
• Continue support for implementing coordinated entry as it rolls out
• Establish a shared vision for how coordinated entry will improve
system
• Clear accountability for implementation progress
• Transparency on how resources are allocated
• Clear policies on how vacant housing units are filled
• Make sure HRCs have permanent housing resources to connect
people to
• Continue to align contracts and other leverage points to increase
participation among non-HUD funded providers, particularly outside
of Oakland and Berkeley, including outreach teams
Maximize potential of housing resource centers
38
• Create a plan to regularly analyze the data collected through
coordinated entry to:
• Inform systems-level analysis of gaps and inefficiencies in the homelessness response system
• Identify and address resource differences across regions to ensure equitable access of services across county
• Monitor efficiency of coordinated entry system and functionality of the assessment tool
• Develop system for sharing this data and using it for decision-making
Use coordinated entry for systems planning
39
• Most homeless funding goes to existing supportive housing tenants
• Assess ongoing service needs for longer-term supportive housing tenants
• When appropriate, offer regular voucher with connection to mainstream services
• Encourage PHA preferences for “stable” supportive housing tenants
• Identify Medi-Cal or other non-homeless targeted funding for housing navigation and tenancy supports
• Provide training to interested CBOs to bill Medi-Cal for eligible activities
Find new funding streams for long-term supportive housing tenants
40
• Support ongoing process to coordinate outreach efforts throughout
the County and with cities
• Standardize practice across County regions
• Collect and use data collected by outreach teams in HMIS, integrate
outreach into coordinated entry
• Assign outreach leads by geography
• Reward outreach providers for placements into temporary and
permanent housing
• Increase oversight and monitoring of outreach teams
Coordinate outreach efforts
41
Encourage humane and efficient responses to unsheltered population• Increase shelter capacity, with investment in housing resources
needed for exit
• Be mindful of the 3 P’s: partners, pets, and personal belongings
• Adopt humane responses for people who are outdoors now
• Establish county-wide policies and procedures for encampment
clearing
• Work with cities to carefully monitor any sanctioned encampments
42
Clarify leadership and collective vision• Strengthen the governance capacity and coordination of policies and
funding decisions across the county
• Clarify roles and responsibilities between EveryOne Home and
County and city governments
• Ensure every entity has needed resources, skill sets, and authority to fill their assigned roles
• Opportunities for electeds, business leaders, philanthropists to show
leadership on this issue
• Work to connect systems improvements at the front-door to
housing opportunities at the backdoor
43

Discussion
44