Embed Size (px)
Citation preview
June 2003
A L A M E D A C O U N T Y
Hydrology and Hydraulics Manual
Alameda County Flood Control District 399 Elmhurst Street, Hayward, CA 94544
June 2003

June 2003
June 2003
ALAMEDA COUNTY HYDROLOGY AND HYDRAULICS MANUAL
HYDROLOGY MANUAL Alameda County, California (2003)
Issued by: Alameda County
Public Works Agency
_________________ Donald J. LaBelle
Director
_________________ Ousama H. Kawar Assistant Director
Alameda County Public Works Agency 399 Elmhurst Street Hayward, CA 94544
June 2003
ALAMEDA COUNTY HYDROLOGY AND HYDRAULICS MANUAL
ACKNOWLEDGEMENTS
Preparation of this manual was aided by the review and comments of staff members of the Public Works Agency.
This manual was prepared at the direction of:
Donald J. LaBelle Director Ousama H. Kawar Assistant Director
Under the supervision of: Scott A. Swanson Principal Civil Engineer Hank Ackerman Supervising Civil Engineer Report prepared by: Rohin Saleh Watershed Studies Program Manager Lawrence Johmann Assistant Civil Engineer Graphics and illustrations by: Jane Ringot Engineering CAD/D Technician II

June 2003
ALAMEDA COUNTY HYDROLOGY AND HYDRAULICS MANUAL
DISCLAIMER The design criteria and the hydrologic computation techniques described in this man-ual have been developed based upon the hydrologic and meteorological data in Ala-meda County and the surrounding area. Therefore, this manual is intended to be used for Alameda County only. The guidelines and the hydrologic computation techniques in this manual are applica-ble for hydrologic and hydraulic studies and design beginning January 1994 and there-after. Studies and designs prior to this date are subject to the usage and guidelines set forth in previous hydrologic and hydraulic criteria summary reports.

June 2003
June 2003
ALAMEDA COUNTY HYDROLOGY AND HYDRAULICS MANUAL
TABLE OF CONTENTS
Chapter One: Background 1-4
Chapter Two: Rational Method 5-9
Chapter Three: Synthetic unit Hydrograph Method 11-22
Chapter Four: Hydraulic Design 23-31
Chapter Five: Stormwater Holdings Facilities 33-35
References 37
Introduction i
Attachments

June 2003
June 2003
TABLES
Table 1: Frequency factors of selected recurrence intervals 7
Table 2: Runoff coefficients 8
Table 3: Frequency Factors for selected recurrence intervals 12
Table 4: Initial Loss Rates 13
Table 5: Uniform Loss Rates (in/hr.) 14
Table 6: Adopted values of perviousness/imperviousness for Alameda County
16
Table 7: Typical basin N-factor for rural watershed conditions 19
ALAMEDA COUNTY HYDROLOGY AND HYDRAULICS MANUAL

June 2003
June 2003
FIGURES
Figure 1: Determining MAP of a basin (19 1/2” in this example) 12
Figure 2: Determining uniform loss rate with a composite map 15
Figure 3: Computation of S, average stream slope 18
Figure 4: Determining basin lag time 20
ALAMEDA COUNTY HYDROLOGY AND HYDRAULICS MANUAL

June 2003
June 2003
ALAMEDA COUNTY HYDROLOGY AND HYDRAULICS MANUAL
This Summary defines current District practice in the hydrologic and hydraulic design of flood control facilities in western Alameda County, and is written as a guide to be used by District engineers and engineers performing work for District review. The criteria summarized here will be updated on a continual basis to reflect changes in District practice. The revision date of the Summary is shown on the front cover and the bottom left corner of each page. It is the responsibility of the user to determine that the Criteria Summary used for design is the current edition. This Summary is intended for use by engineers familiar with generally accepted hy-drology and hydraulic engineering design practice. Criteria not specifically detailed herein shall be determined in accordance with sound engineering practice. The Design Engineer should contact the Development Division in room 240 of the Public Works Agency with any questions regarding site specific design considerations. The Summary applies to western Alameda County only (Flood Control Zones 2, 2A, 3A, 4, 5, 6, 9, 12 and 13). It does not apply to eastern Alameda County (Flood Control Zone 7). For information concerning Flood Control Zone 7 (eastern Alameda County) contact the Zone 7 offices located at 5997 Parkside Drive, Pleasanton, 94566, telephone (415) 484-2600. Copies of this Summary are available for $5.00 each in room 240 of the Public Works Building, 399 Elmhurst Street, Hayward. Telephone (510) 670-5480.
INTRODUCTION
i

June 2003
June 2003
SCOPE Continuing development throughout Alameda County causes an increasing amount of stormwater runoff to occur, thereby increasing the risk of flooding. As the collection of rainfall and runoff data grows, the ability to assess this risk improves. Alameda County Flood Control District (District) has performed drainage studies using the best available information and has developed a representative hydrologic model for Alameda County. This model is intended to be used to assess the potential hazards associated with the existing system and to provide a standardized means for new facility design. The procedures in this manual are applicable to District projects and to those subject to District approval. The western Alameda County area in which the District maintains flood control facilities is shown on Attachment 1. Subsequent to the adoption of this manual by the District, the applicable procedures described herein shall be used by engineers to demonstrate that new facilities in the subject area meet the requisite criteria. Facilities designed prior to the adoption of this manual are not necessarily subject to the current criteria. The procedures in this manual are to be used by responsible engineers in their design of flood control and/or drainage facilities that are subject to District approval. The use of these procedures in no way obviates or replaces the individual design engineer’s adherence to the profession’s “standard of care” in the design. PURPOSE The purpose of this manual is to provide easy-to-follow procedures for use by engineers familiar with generally accepted hydrology and hydraulic design practices. These procedures apply to the design of typical facilities. Where unusual circumstances result in requirements beyond the scope of this manual, the engineer should contact the District for additional guidance. These procedures, including data and criteria, allow for evaluations and designs to be performed efficiently and with consistency. Criteria not specifically detailed herein shall be determined in accordance with sound engineering practices. The design engineer should contact the District with any questions regarding site-specific design considerations.
Page 1
CHAPTER ONE: BACKGROUND
ALAMEDA COUNTY HYDROLOGY AND HYDRAULICS MANUAL
June 2003
This manual provides the computational techniques and criteria for determining design runoff for new storm facilities. It also includes criteria and acceptable methodology for calculating water surface profiles and hydraulic grade lines associated with design runoff in conveyance elements (pipes and channels). This manual includes procedures to determine required storage volume detention and retention basin design. The design engineer should contact the District to determine if detention is required at a specific site. FREQUENCY DEFINITIONS Hydrology relies heavily on probability and statistics. The frequency of flood events and precipitation events will be described in this manual using two complementary terminologies. The first is the “exceedance frequency” terminology. This terminology uses the probability of exceedance in any water year to describe an event. For example, a “10 Percent Peak Discharge” for a particular location on a creek, river or channel would be that discharge that is expected to be equaled or exceeded with a 10 percent chance during any water year. A “1 Percent, 6-Hour Precipitation Depth” would be that 6-Hour depth of rainfall that has a 1 percent probability (chance) of being equaled or exceeded during any water year. The alternate terminology used in this manual is the “recurrence interval” (sometimes called “return period) terminology. This terminology uses a number of years to specify a flood event. For example a “10-year Peak Discharge” would be that discharge which would be expected to be equaled or exceeded once every ten years on the average. The “100-year 6-Hour Precipitation Depth” would be that 6-Hour depth of rainfall that would be expected to be equaled or exceeded once every one hundred years on the average. These two terminologies are related in that one is the reciprocal of the other. For example the 10 percent event (0.10 in frequency terms) is the 10-year event because the reciprocal of 0.10 is 10. Similarly the 1 percent event (0.01 in frequency terms) is the 100-year event. Both terminologies will be used in this manual. GENERAL PROCEDURE The general procedure for design of flood control facilities starts by establishing a required level of protection. From a hydrologic standpoint, this involves ascertaining the recurrence interval to be used for design. The level of protection is associated with the necessary freeboard above the design water surface elevation (or, hydraulic grade line, HGL). The method used to calculate the design discharge used to size facilities and determine the HGL depends on the area tributary to the subject flood control facility. The recurrence interval for which the facility is to be designed also depends on the tributary area as well as other factors described below.
Page 2
ALAMEDA COUNTY HYDROLOGY AND HYDRAULICS MANUAL
June 2003
CATEGORIES OF FLOOD CONTROL FACILITIES Design level of protection and calculation procedures depend on the location and type of the facility and the tributary area. District considers three categories of flood control facilities based on tributary area. These are:
Major Facilities. These have drainage areas of 25 square miles or more. Only Alameda Creek, San Lorenzo Creek, and San Leandro Creek fall into this category. Primary Facilities. These have drainage areas greater than or equal to fifty acres and less than 25 square-miles. Secondary Facilities. These have drainage areas less than fifty acres and are generally maintained by the local jurisdiction.
The design of major waterways is beyond the scope of this summary. Their design shall be subject to the criteria established by the Deputy Director of Public Works - Design, at the time of design. DESIGN DISCHARGES AND TAILWATER ELEVATIONS Primary Facilities:
1. Within Federal Emergency Management Agency (FEMA) study areas: Improvements to facilities that are part of a FEMA Flood Insurance Study must be designed to contain the FEMA 100-year water surface elevation using FEMA criteria. In addition, the following cases must be checked to determine whether they produce higher elevation than FEMA:
a. The design water surface elevation determined by a profile based on the 5-year recurrence
interval peak discharge with the 100-year tide elevation at the Bay, and b. A 15-year (25-year in Zone 12) recurrence interval peak discharge with a Mean Higher High
Water (MHHW) elevation at the Bay.
2. Outside FEMA study areas: The design water surface elevation for primary facilities is determined by the higher of a profile based on the 5-year recurrence interval peak discharge with the 100-year tide level at the Bay and that based on a 15-year recurrence interval peak discharge with an elevation at the Bay equal to the MHHW (25-year in Zone 12).
Secondary Facilities: All secondary facilities shall be designed for a 10-year recurrence interval peak discharge. The design tailwater elevation for secondary facilities shall be the design water surface elevation of the
Page 3
ALAMEDA COUNTY HYDROLOGY AND HYDRAULICS MANUAL
June 2003
receiving waterway. The 100-year tide shall be used as the design tailwater elevation for those secondary facilities draining directly into the Bay. ELEVATION DATUM Currently there are a number of different vertical datum systems in use in Alameda County. These include: NGVD 29, NAVD 88, MLLW as well as local city datum systems. The engineer must be certain that all elevations used for tides, cross sections, tailwater elevations and bridge geometry are on the same vertical datum systems. (See Attachment 13)
RUNOFF DETERMINATION METHOD Due to a wide variety of land development practices and drainage area sizes in Alameda County, two hydrologic computation techniques are used for runoff determination. A modified Rational Method is used for drainage areas less than 0.5 square miles (320 acres). A synthetic unit hydrograph method is used for drainage areas greater than 0.5 square miles, and also for detention basin design. DATA ACCESS This report and all attachments can be found on the Alameda County Web site and may be downloaded free of charge. In addition, detailed data for mean annual precipitation, slope, and hydrologic soil group can be found on the same Web site. This detailed data can be downloaded and used with GIS software to perform hydrologic overlay computations.
Page 4
ALAMEDA COUNTY HYDROLOGY AND HYDRAULICS MANUAL
June 2003
GENERAL OVERVIEW A modified Rational Formula may be used to determine the peak discharge of a watershed for areas up to 320 acres (0.5 square miles). Data used in Rational Method calculations shall be entered into Form R1-97 for District-maintained projects and for in-tract drainage submittals. A reduced copy of this form is shown in Attachment 2. Copies of the form to be used are available at the District's Elmhurst Street offices. The overall watershed shall be broken down into smaller areas that contribute to hydraulically significant points of concentration. The boundaries shall be established based upon local topographic boundaries such as ridges, streets, existing drainage systems, etc., using good engineering practice. The design flow rate shall be calculated using the District’s Modified Rational Formula:
Q = i (C’A) (1) where:
Q = design runoff flow rate (cfs) I = rainfall intensity (in/hr) C’ = runoff coefficient modified by slope and rainfall intensity A = drainage area (acres)
TIME OF CONCENTRATION The time of concentration is the time required for the runoff from the most remote region of the watershed to reach the point of concentration at which the flow is to be calculated. It is composed of two parts, the initial time of concentration, sometimes referred to as the inlet time, and the conduit time. A minimum time of concentration based upon hydraulic conditions that maximize flow velocities (i.e. minimum n-values) shall be used to design the flood control system.
CHAPTER TWO: RATIONAL METHOD
Page 5
ALAMEDA COUNTY HYDROLOGY AND HYDRAULICS MANUAL
June 2003
Page 6
INITIAL TIME OF CONCENTRATION The initial time of concentration (InitialTc) is that time required for runoff to travel from the most remote point in the drainage area to the first point of concentration. Often, this first point of concentration is the first inlet of the stormwater system or the upstream end of a defined ditch or swale. This time will seldom be less than three minutes nor more than 20 minutes. The Initial Time of Concentration shall be determined using the criteria below:
Undeveloped Watersheds
Initial Tc = L / (60 V) (2)
where: Tc = Time of concentration in minutes L = Overland flow length in feet V = Overland flow velocity in feet per second from Attachment 3.
Urbanized Watersheds In urbanized watersheds the initial time of concentration shall be taken as “roof-to-gutter” time plus the time required for the water to flow from the street gutter at the uppermost part of the drainage ba-sin to the first inlet of the stormwater system. Roof-to-gutter time is a function of ground slope and type of development. For typical post-1980 residential areas, five minutes shall be used for roof-to-gutter time. Sound engineering practices shall be used where other than typical residential areas form the uppermost part of the watershed. The time for the water to flow from the upstream end of the gutter to the first inlet shall be estimated using the gutter flow chart (Attachment 4). Other charts used by the engineer, that may be used in other than typical residential situations, such as those for flow in small conduits or gullies, shall be referenced. For typical urbanized watersheds, the Initial Tc equals the roof-to-gutter time plus the travel time from the upstream end of the gutter to the first inlet.
CONDUIT TIME Conduit time is the length of time required for the water to flow from one point of concentration, or inlet, to the next. The calculated average velocity, or weighted incremental velocities, must accu-
ALAMEDA COUNTY HYDROLOGY AND HYDRAULICS MANUAL
June 2003
Page 7
rately reflect the hydraulic conditions (i.e. pressure or open channel) within the stormwater system. Where the flow takes place in natural streams, the velocity may be determined using Attachment 5 or other appropriate method.
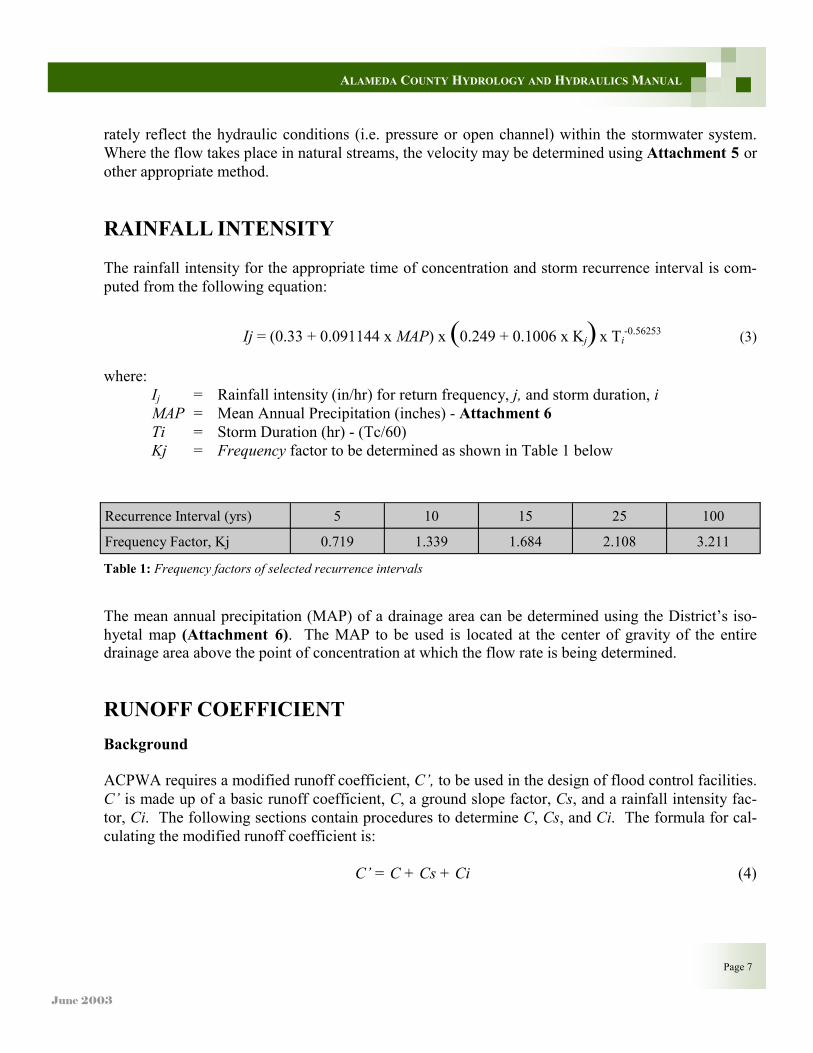
RAINFALL INTENSITY The rainfall intensity for the appropriate time of concentration and storm recurrence interval is com-puted from the following equation:
Ij = (0.33 + 0.091144 x MAP) x (0.249 + 0.1006 x Kj) x Ti-0.56253 (3)
where:
Ij = Rainfall intensity (in/hr) for return frequency, j, and storm duration, i MAP = Mean Annual Precipitation (inches) - Attachment 6 Ti = Storm Duration (hr) - (Tc/60) Kj = Frequency factor to be determined as shown in Table 1 below
ALAMEDA COUNTY HYDROLOGY AND HYDRAULICS MANUAL
RUNOFF COEFFICIENT Background ACPWA requires a modified runoff coefficient, C’, to be used in the design of flood control facilities. C’ is made up of a basic runoff coefficient, C, a ground slope factor, Cs, and a rainfall intensity fac-tor, Ci. The following sections contain procedures to determine C, Cs, and Ci. The formula for cal-culating the modified runoff coefficient is:
C’ = C + Cs + Ci (4)
The mean annual precipitation (MAP) of a drainage area can be determined using the District’s iso-hyetal map (Attachment 6). The MAP to be used is located at the center of gravity of the entire drainage area above the point of concentration at which the flow rate is being determined.
Recurrence Interval (yrs) 5 10 15 25 100
Frequency Factor, Kj 0.719 1.339 1.684 2.108 3.211
Table 1: Frequency factors of selected recurrence intervals
June 2003
Page 8
ALAMEDA COUNTY HYDROLOGY AND HYDRAULICS MANUAL
Percent
Land Use Description Impervious A B C D
Undeveloped land, Parks Golf Courses 0% 0.15 0.20 0.25 0.30
Older Residential 1/8 Ac. (5000—7900 SF lots) 24% 0.33 0.37 0.41 0.44
1980 and Newer Residential 1/8 Ac. 50% 0.53 0.55 0.58 0.60
Older Residential 1/4 Ac. (8000—11050 SF lots) 22% 0.32 0.35 0.39 0.43
1980 and Newer Residential 1/4 Ac. 40% 0.45 0.48 0.51 0.54
Residential Zero Lot Line 3600 SF lots 75% 0.71 0.73 0.74 0.75
Residential Duets 4500 SF lots 69% 0.67 0.68 0.70 0.71
Commercial / Industrial * 85% 0.79 0.80 0.80 0.81
Townhouse 68% 0.66 0.68 0.69 0.71
Apartment 89% 0.82 0.82 0.83 0.83
Rural Housing 11% 0.23 0.28 0.32 0.37
Freeway 100% 0.90 0.90 0.90 0.90
C by Soil Group
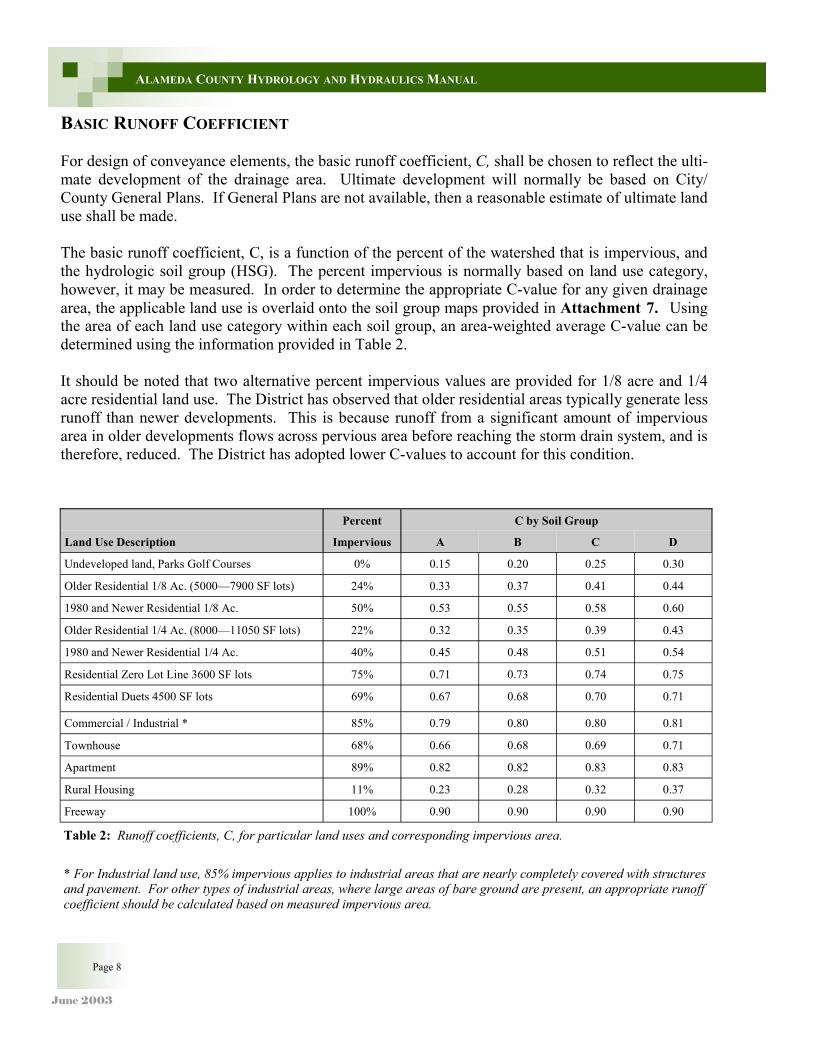
Table 2: Runoff coefficients, C, for particular land uses and corresponding impervious area.
BASIC RUNOFF COEFFICIENT For design of conveyance elements, the basic runoff coefficient, C, shall be chosen to reflect the ulti-mate development of the drainage area. Ultimate development will normally be based on City/County General Plans. If General Plans are not available, then a reasonable estimate of ultimate land use shall be made. The basic runoff coefficient, C, is a function of the percent of the watershed that is impervious, and the hydrologic soil group (HSG). The percent impervious is normally based on land use category, however, it may be measured. In order to determine the appropriate C-value for any given drainage area, the applicable land use is overlaid onto the soil group maps provided in Attachment 7. Using the area of each land use category within each soil group, an area-weighted average C-value can be determined using the information provided in Table 2. It should be noted that two alternative percent impervious values are provided for 1/8 acre and 1/4 acre residential land use. The District has observed that older residential areas typically generate less runoff than newer developments. This is because runoff from a significant amount of impervious area in older developments flows across pervious area before reaching the storm drain system, and is therefore, reduced. The District has adopted lower C-values to account for this condition.
* For Industrial land use, 85% impervious applies to industrial areas that are nearly completely covered with structures and pavement. For other types of industrial areas, where large areas of bare ground are present, an appropriate runoff coefficient should be calculated based on measured impervious area.
June 2003
Page 9
ALAMEDA COUNTY HYDROLOGY AND HYDRAULICS MANUAL
Table 2 applies to typical land use situations. For conditions not covered by Table 2, the engineer shall calculate an appropriate runoff coefficient based on impervious area determined using aerial photographs and site plans. The runoff coefficient is calculated based on an area weighted average using C=0.9 for all impervious areas and the appropriate pervious area C-value for soil groups present from the first row of Table 2.
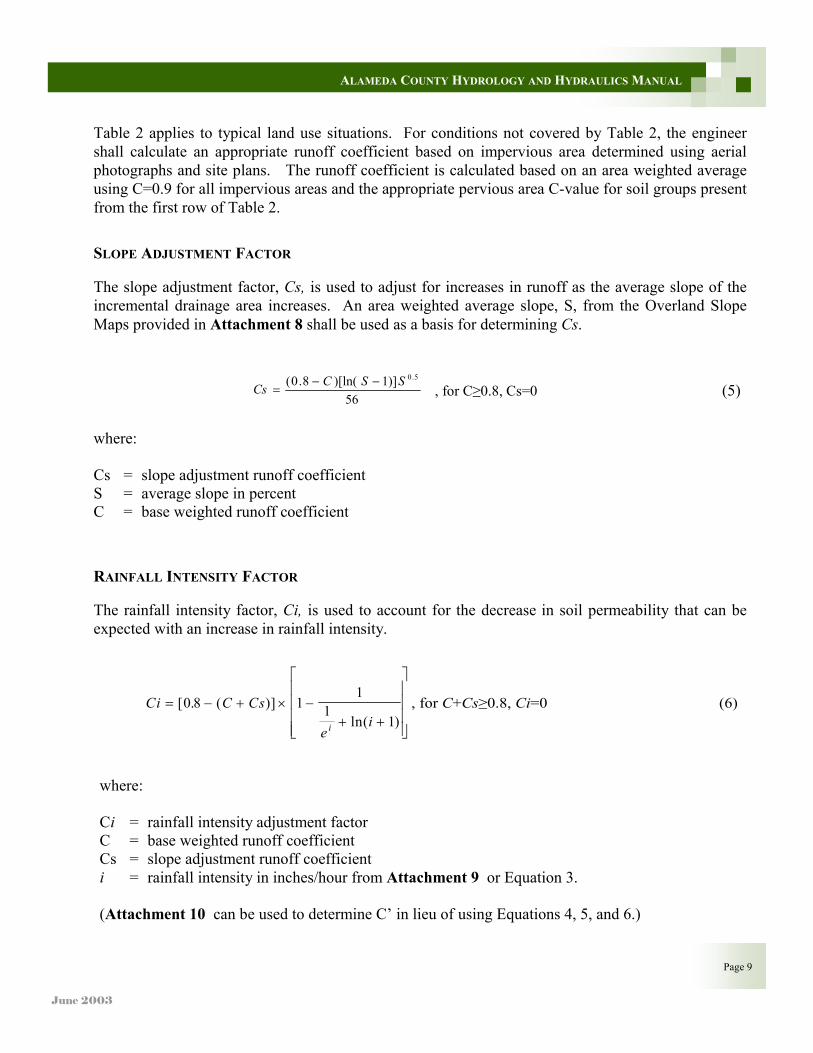
SLOPE ADJUSTMENT FACTOR
The slope adjustment factor, Cs, is used to adjust for increases in runoff as the average slope of the incremental drainage area increases. An area weighted average slope, S, from the Overland Slope Maps provided in Attachment 8 shall be used as a basis for determining Cs.
56)]1)[ln(8.0( 5.0SSCCs −−
= , for C≥0.8, Cs=0 (5)
where: Cs = slope adjustment runoff coefficient S = average slope in percent C = base weighted runoff coefficient
RAINFALL INTENSITY FACTOR
The rainfall intensity factor, Ci, is used to account for the decrease in soil permeability that can be expected with an increase in rainfall intensity.
where: Ci = rainfall intensity adjustment factor C = base weighted runoff coefficient Cs = slope adjustment runoff coefficient i = rainfall intensity in inches/hour from Attachment 9 or Equation 3. (Attachment 10 can be used to determine C’ in lieu of using Equations 4, 5, and 6.)
Ci C Cs
eii
= − + × −+ +
[ . ( )]ln( )
0 8 11
11
, for C+Cs≥0.8, Ci=0 (6)

June 2003
PEAK DISCHARGES When using the modified Rational Method, the peak discharge of a tributary area must be compared to the peak discharge in the main stem downstream of the tributary. The higher of the two peak discharges is the governing peak discharge in the main stem downstream of the tributary.
ALAMEDA COUNTY HYDROLOGY AND HYDRAULICS MANUAL
Page 10
June 2003
Page 11
ALAMEDA COUNTY HYDROLOGY AND HYDRAULICS MANUAL
GENERAL A synthetic unit hydrograph method transforms a hypothetical rainfall distribution and design rainfall depth into a design runoff hydrograph. The District has adopted a modified Snyder Unit Hydrograph method that was found to work well within the hydrologic and topographic variations found in the County. This method provides the engineer with peak discharge information necessary to design conveyance as well as detention facilities. The commonly used US Army Corps of Engineers flood hydrograph computer programs, HEC-1 or HEC-HMS, shall be used for all rainfall-to-runoff transformations. This manual assumes that the engineer is familiar with HEC-1 and/or HEC-HMS. Therefore, detailed procedures for using HEC-1 or HEC-HMS are not discussed. APPLICATION The District has adopted a 6-hour design storm distribution for calculation of peak discharges from watersheds larger than one square mile up to twenty square miles. The 6-hour distribution shall be used to determine design discharges for all primary facilities with drainage areas greater than one square mile. The District has adopted a 24-hour design storm distribution for calculation of peak discharges from watersheds larger than twenty square miles, and for use in detention basin design. The procedures for using the synthetic unit hydrograph for design of detention basins are described in Chapter 5, Stormwater Holding Facilities. DESIGN RAINFALL Attachment 11 provides the adopted 6-hour and 24-hour cumulative rainfall distribution patterns based on a 15-minute time increment. The 15-minute time increment is adequate for determining peak design flow rates for the range of applicability of this synthetic unit hydrograph method. The 24-hour distribution, used for determining required design volume for detention basins, is not used for peak discharge rates associated with these facilities.
CHAPTER THREE: SYNTHETIC UNIT HYDROGRAPH METHOD
June 2003
Page 12
ALAMEDA COUNTY HYDROLOGY AND HYDRAULICS MANUAL
(7)
The total rainfall depth of the design storm can be found using Attachment 12 or the following equation:
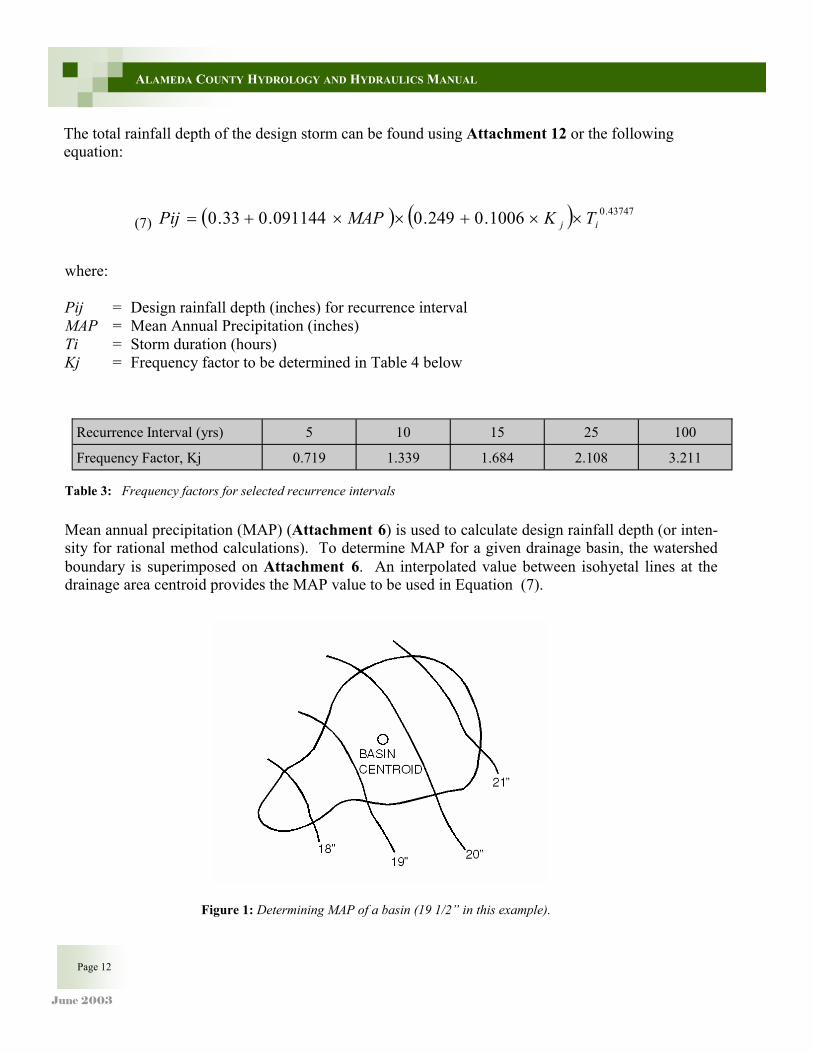
Figure 1: Determining MAP of a basin (19 1/2” in this example).
Mean annual precipitation (MAP) (Attachment 6) is used to calculate design rainfall depth (or inten-sity for rational method calculations). To determine MAP for a given drainage basin, the watershed boundary is superimposed on Attachment 6. An interpolated value between isohyetal lines at the drainage area centroid provides the MAP value to be used in Equation (7).
Table 3: Frequency factors for selected recurrence intervals
where: Pij = Design rainfall depth (inches) for recurrence interval MAP = Mean Annual Precipitation (inches) Ti = Storm duration (hours) Kj = Frequency factor to be determined in Table 4 below
( ) ( ) 43747.01006.0249.0091144.033.0 ij TKMAPPij ××+××+=
Recurrence Interval (yrs) 5 10 15 25 100
Frequency Factor, Kj 0.719 1.339 1.684 2.108 3.211
June 2003
UNIFORM LOSS RATE Uniform loss (constant infiltration) rate is a function of hydrologic soil group and soil cover. Maps showing the areas of hydrologic soil groups A, B, C and D based on Natural Resource Conservation Service (NRCS – formally Soil Conservation Service, SCS) mapping are provided in Attachment 7. The type of vegetation or general soil cover in a watershed significantly affects the rate of infiltration. It has been determined that infiltration rates for well established urban landscaping are higher than new urban coverage. ACPWA uses a lower uniform loss rate for new urban landscaping in order to account for the potentially higher flow rates that could be experienced before the new landscaping becomes well established.
Page 13
ALAMEDA COUNTY HYDROLOGY AND HYDRAULICS MANUAL
LOSS RATES Rainfall that does not result in runoff is accounted for by estimating losses. Losses include surface ponding and infiltration. Appropriate selection of loss rates is critical in determining design dis-charges. The District has adopted the initial and uniform loss rate method for design runoff calculations. Loss rates are applicable only to pervious areas of the drainage area. The following procedures are for determining initial and uniform loss rates, as well as impervious area as a function of land use.
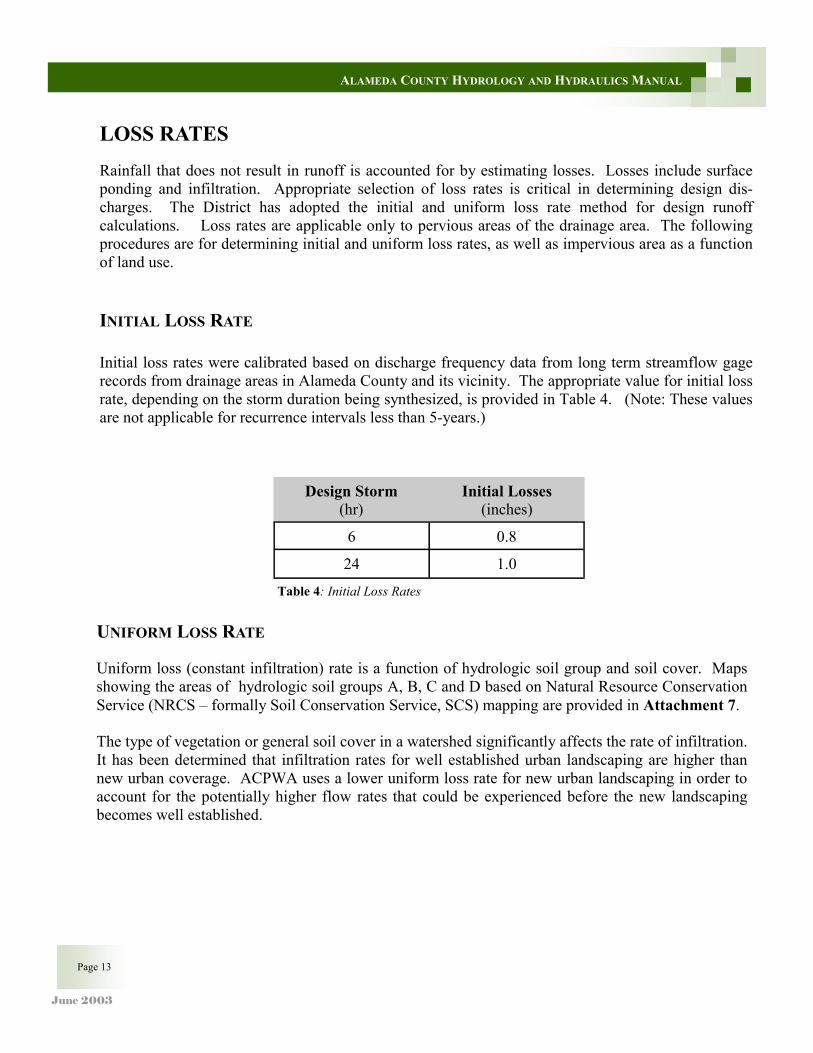
INITIAL LOSS RATE Initial loss rates were calibrated based on discharge frequency data from long term streamflow gage records from drainage areas in Alameda County and its vicinity. The appropriate value for initial loss rate, depending on the storm duration being synthesized, is provided in Table 4. (Note: These values are not applicable for recurrence intervals less than 5-years.)
Design Storm (hr)
Initial Losses (inches)
6 0.8
24 1.0
Table 4: Initial Loss Rates
June 2003
Page 14
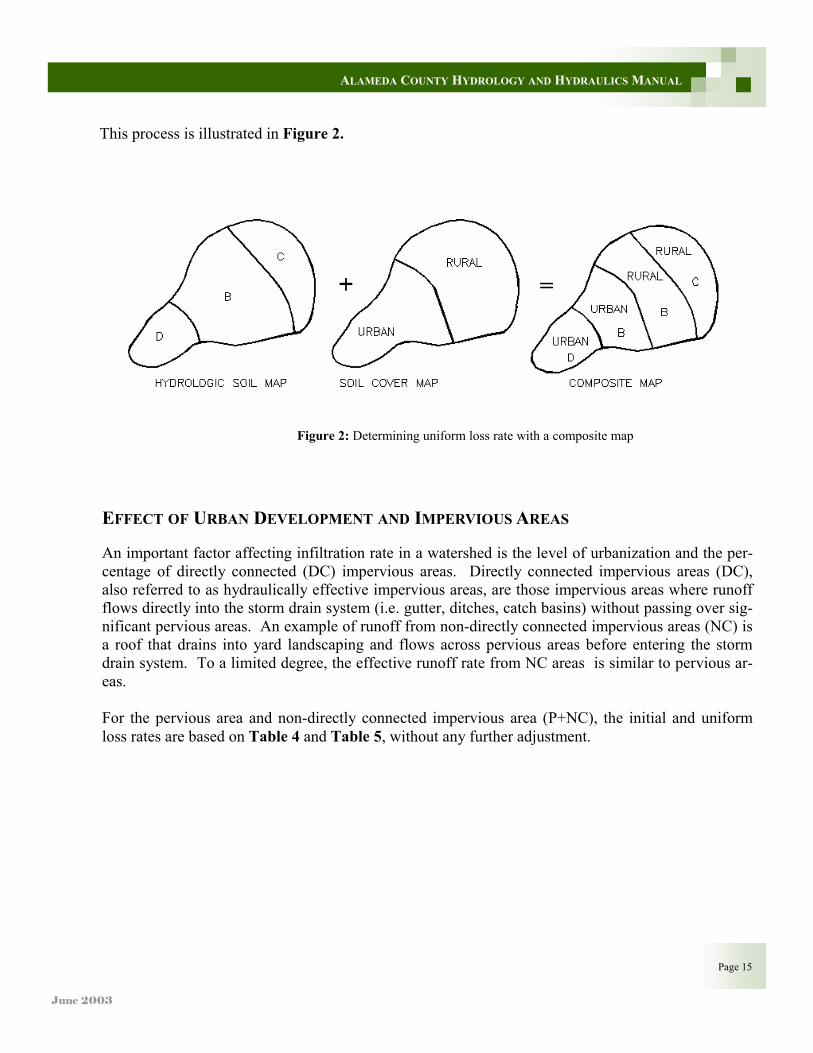
To compute the uniform loss rate for a particular catchment, an engineer should superimpose the hydrologic soil map of the area together with the soil cover map and the drainage area map. A composite map should be developed and the proper loss rates based on the above table should be assigned to each area. Finally, an area weighted average of the uniform loss rate should be computed based upon the type of coverage, hydrologic soil group, and the area sizes on the composite map.
ALAMEDA COUNTY HYDROLOGY AND HYDRAULICS MANUAL
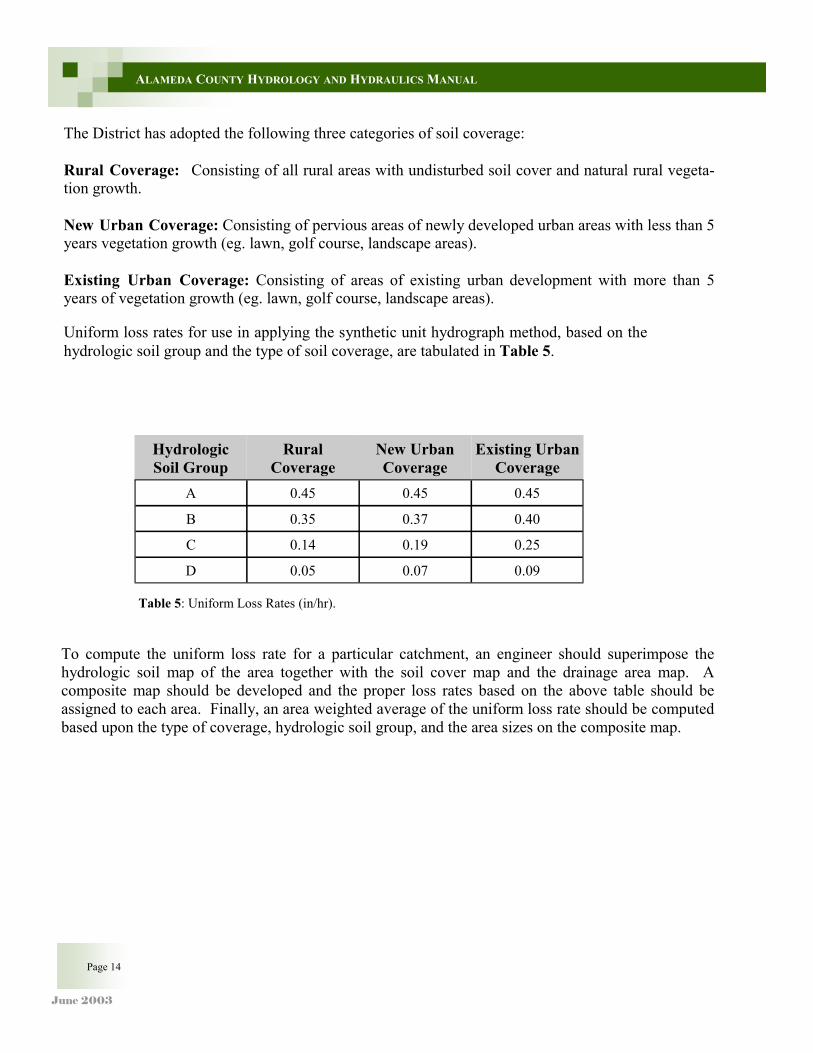
Hydrologic Soil Group
Rural Coverage
New Urban Coverage
Existing Urban Coverage
A 0.45 0.45 0.45
B 0.35 0.37 0.40
C 0.14 0.19 0.25
D 0.05 0.07 0.09
Table 5: Uniform Loss Rates (in/hr).
The District has adopted the following three categories of soil coverage: Rural Coverage: Consisting of all rural areas with undisturbed soil cover and natural rural vegeta-tion growth. New Urban Coverage: Consisting of pervious areas of newly developed urban areas with less than 5 years vegetation growth (eg. lawn, golf course, landscape areas). Existing Urban Coverage: Consisting of areas of existing urban development with more than 5 years of vegetation growth (eg. lawn, golf course, landscape areas).
Uniform loss rates for use in applying the synthetic unit hydrograph method, based on the hydrologic soil group and the type of soil coverage, are tabulated in Table 5.
June 2003
Page 15
ALAMEDA COUNTY HYDROLOGY AND HYDRAULICS MANUAL
Figure 2: Determining uniform loss rate with a composite map
EFFECT OF URBAN DEVELOPMENT AND IMPERVIOUS AREAS An important factor affecting infiltration rate in a watershed is the level of urbanization and the per-centage of directly connected (DC) impervious areas. Directly connected impervious areas (DC), also referred to as hydraulically effective impervious areas, are those impervious areas where runoff flows directly into the storm drain system (i.e. gutter, ditches, catch basins) without passing over sig-nificant pervious areas. An example of runoff from non-directly connected impervious areas (NC) is a roof that drains into yard landscaping and flows across pervious areas before entering the storm drain system. To a limited degree, the effective runoff rate from NC areas is similar to pervious ar-eas. For the pervious area and non-directly connected impervious area (P+NC), the initial and uniform loss rates are based on Table 4 and Table 5, without any further adjustment.
This process is illustrated in Figure 2.
June 2003
Page 16
ALAMEDA COUNTY HYDROLOGY AND HYDRAULICS MANUAL
However, if more than 40% of the (P+NC) area is impervious, then the initial and uniform loss rates are adjusted based on the following relationship:
L = L(1-0.8Ai) (8)
Where: L = Adjusted loss rate for P+ NC L = Loss rate for pervious area Ai: = Decimal fraction of non directly connected impervious area (NC)
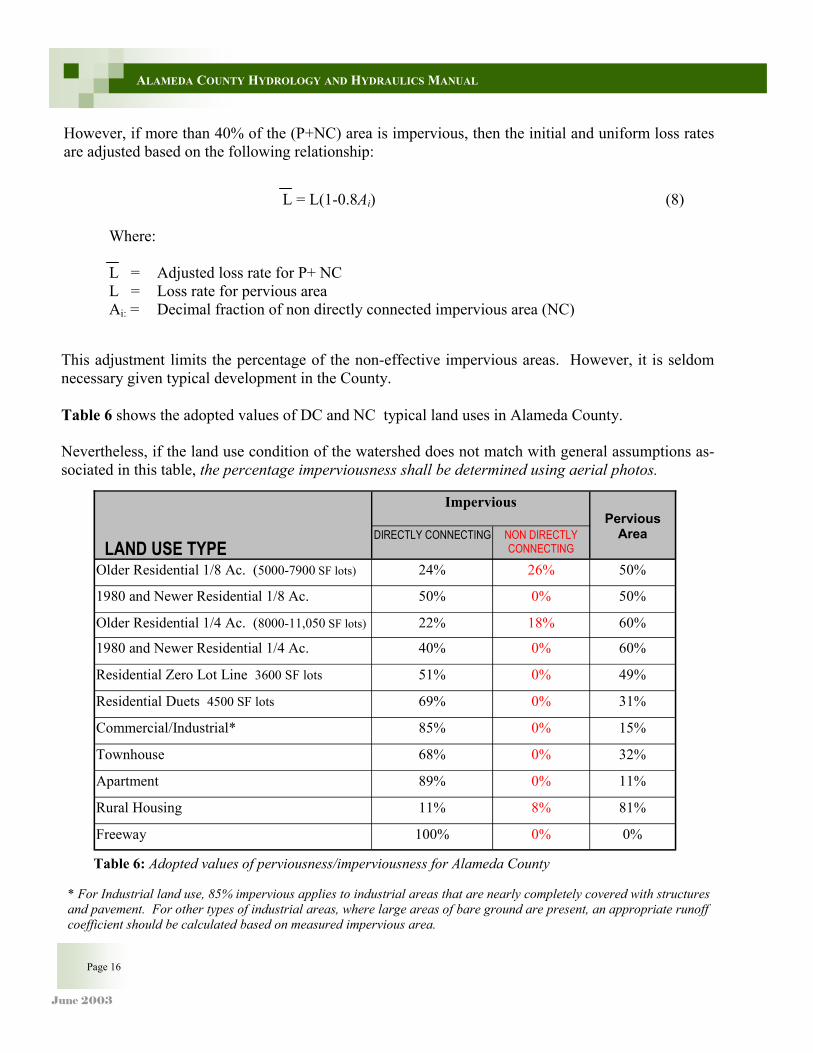
This adjustment limits the percentage of the non-effective impervious areas. However, it is seldom necessary given typical development in the County. Table 6 shows the adopted values of DC and NC typical land uses in Alameda County. Nevertheless, if the land use condition of the watershed does not match with general assumptions as-sociated in this table, the percentage imperviousness shall be determined using aerial photos.
Table 6: Adopted values of perviousness/imperviousness for Alameda County
* For Industrial land use, 85% impervious applies to industrial areas that are nearly completely covered with structures and pavement. For other types of industrial areas, where large areas of bare ground are present, an appropriate runoff coefficient should be calculated based on measured impervious area.
LAND USE TYPE
Impervious Pervious
Area DIRECTLY CONNECTING NON DIRECTLY CONNECTING
Older Residential 1/8 Ac. (5000-7900 SF lots) 24% 26% 50%
1980 and Newer Residential 1/8 Ac. 50% 0% 50%
Older Residential 1/4 Ac. (8000-11,050 SF lots) 22% 18% 60%
1980 and Newer Residential 1/4 Ac. 40% 0% 60%
Residential Zero Lot Line 3600 SF lots 51% 0% 49%
Residential Duets 4500 SF lots 69% 0% 31%
Commercial/Industrial* 85% 0% 15%
Townhouse 68% 0% 32%
Apartment 89% 0% 11%
Rural Housing 11% 8% 81%
Freeway 100% 0% 0%
June 2003
Page 17
ALAMEDA COUNTY HYDROLOGY AND HYDRAULICS MANUAL
Residential 1/8 & 1/4 Ac.: Only applicable if roofs are non directly connecting. For new develop-ment the sum of directly connected and non directly connected impervious area shall be used as total effective impervious area. Residential Zero Lot Line & Duets: Roofs are considered to be directly connecting as they are con-nected directly to the gutters. Commercial: Include stores, churches, libraries, schools, trailer parks, etc. May use this cover type for townhouse if the roofs are directly connecting and green areas are less than 15%. Any large green areas under commercial should be removed and treated separately as "open space". Small green areas can be left under this classification as long as the total green area does not exceed 15%, otherwise a new proportion should be developed. "Industrial" may fall under this classification unless the area surrounding buildings is dirt/gravel, in which case a new proportion should be developed. Townhouse: For use if there is more than 30% pervious area throughout complex and roofs are di-rectly connecting, otherwise use "commercial" or develop a new proportion. Apartment: For use when there is less than 15% green areas and roofs are directly connecting, oth-erwise develop a new proportion. Rural Housing: (1.1 lots/acre) have mostly dirt sidewalks, and large green/dirt area surrounding house. Freeway: Main freeways and highways. All other roadways are included in their land use category.
SYNTHETIC UNIT HYDROGRAPH The Snyder Unit Hydrograph method in HEC-1 or HEC-HMS is formulated with two input parame-ters; the basin lag time and the basin peaking factor. The adopted ACPWA procedures for calculating these parameters are based on regionally calibrated equations and therefore does not necessarily re-flect Snyder Unit Hydrograph procedures described elsewhere.
June 2003
Page 18
ALAMEDA COUNTY HYDROLOGY AND HYDRAULICS MANUAL
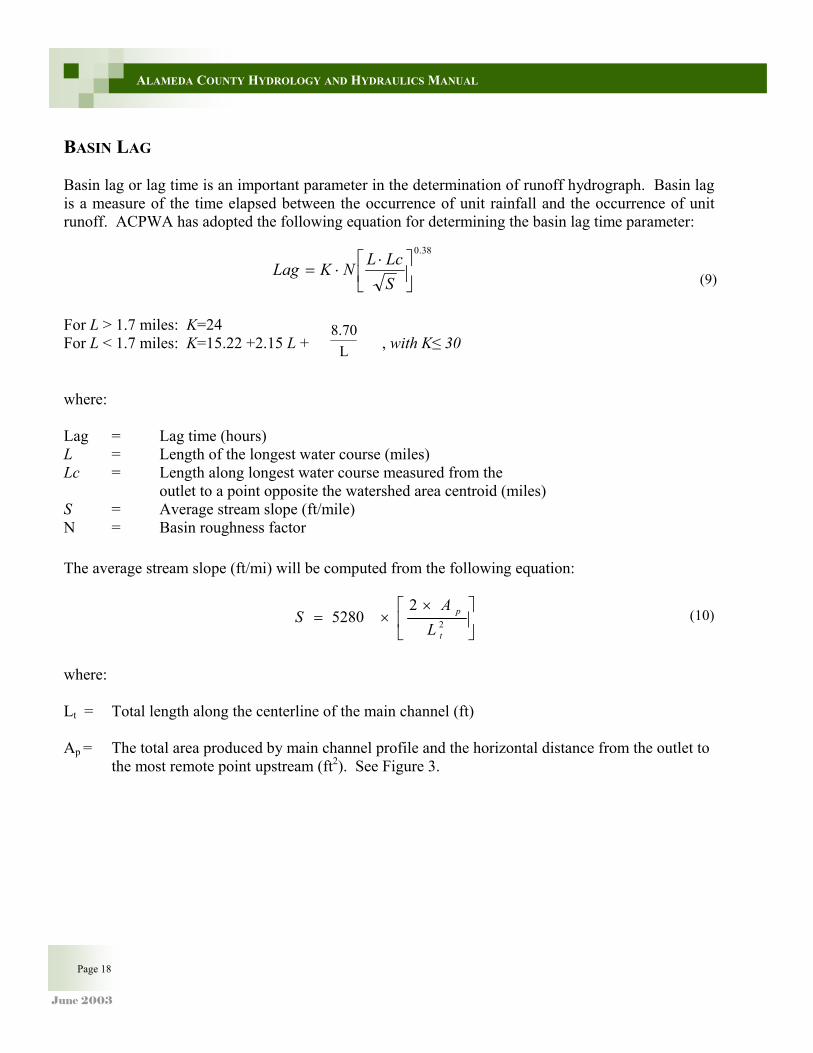
where: Lag = Lag time (hours) L = Length of the longest water course (miles) Lc = Length along longest water course measured from the outlet to a point opposite the watershed area centroid (miles) S = Average stream slope (ft/mile) N = Basin roughness factor The average stream slope (ft/mi) will be computed from the following equation:
××= 2
25280
t
p
LA
S
(10)
where: Lt = Total length along the centerline of the main channel (ft) Ap = The total area produced by main channel profile and the horizontal distance from the outlet to the most remote point upstream (ft2). See Figure 3.
BASIN LAG Basin lag or lag time is an important parameter in the determination of runoff hydrograph. Basin lag is a measure of the time elapsed between the occurrence of unit rainfall and the occurrence of unit runoff. ACPWA has adopted the following equation for determining the basin lag time parameter:
38.0
⋅⋅=
SLcLNKLag
(9)
For L > 1.7 miles: K=24 For L < 1.7 miles: K=15.22 +2.15 L +
L8.70
, with K≤ 30
June 2003
Page 19
ALAMEDA COUNTY HYDROLOGY AND HYDRAULICS MANUAL
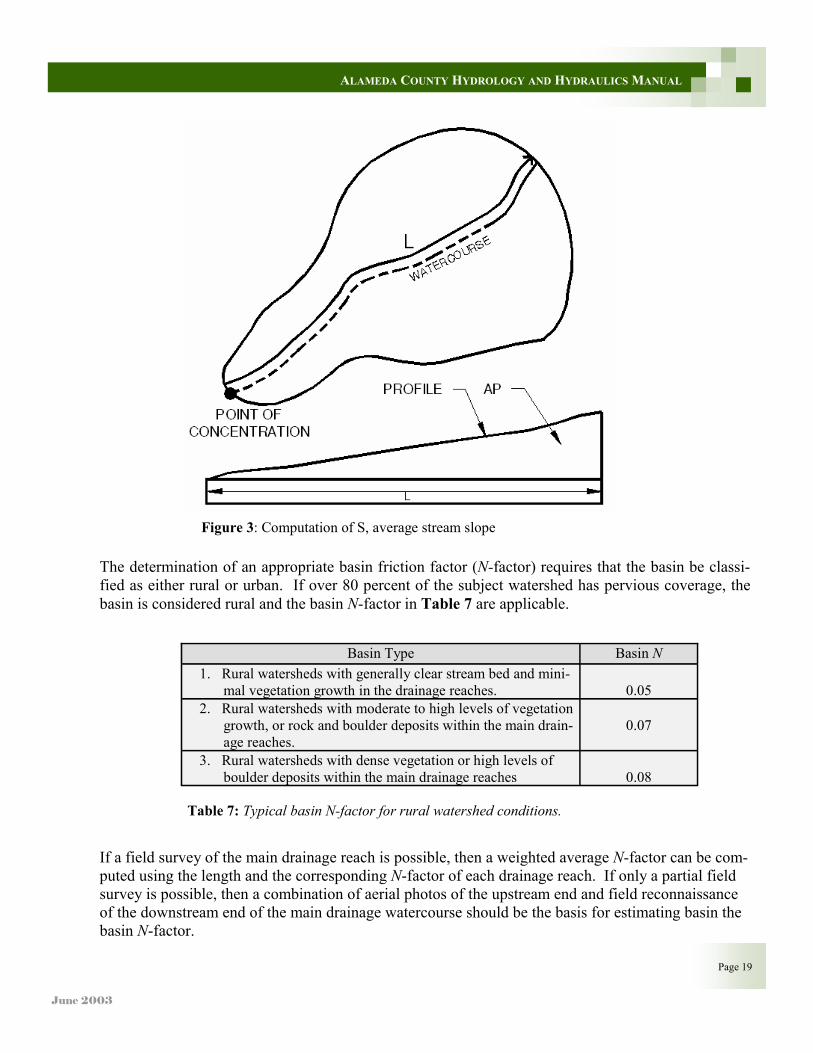
The determination of an appropriate basin friction factor (N-factor) requires that the basin be classi-fied as either rural or urban. If over 80 percent of the subject watershed has pervious coverage, the basin is considered rural and the basin N-factor in Table 7 are applicable.
Basin Type Basin N
1. Rural watersheds with generally clear stream bed and mini-mal vegetation growth in the drainage reaches.
0.05
2. Rural watersheds with moderate to high levels of vegetation growth, or rock and boulder deposits within the main drain-age reaches.
0.07
3. Rural watersheds with dense vegetation or high levels of boulder deposits within the main drainage reaches
0.08
Table 7: Typical basin N-factor for rural watershed conditions.
Figure 3: Computation of S, average stream slope
If a field survey of the main drainage reach is possible, then a weighted average N-factor can be com-puted using the length and the corresponding N-factor of each drainage reach. If only a partial field survey is possible, then a combination of aerial photos of the upstream end and field reconnaissance of the downstream end of the main drainage watercourse should be the basis for estimating basin the basin N-factor.
June 2003
Page 20
ALAMEDA COUNTY HYDROLOGY AND HYDRAULICS MANUAL
For urban watersheds, where various types of conveyance systems are present, the following equation relates the Manning’s n-value of the main drainage network and the basin N-factor:
N = 0.3318 n 0.6328 (11)
Where: N = Basin roughness factor n = Manning’s n-value
The lower end of the range of applicable N-factors shall be used for drainage reaches with minimal transition structures (<2) and the higher values of N-factors are applicable to drainage reaches with more structures, such as bends, manholes, junctions, etc. Transition structures include various forms of contractions, expansions, bridges, culvert crossings, manholes and inlets.
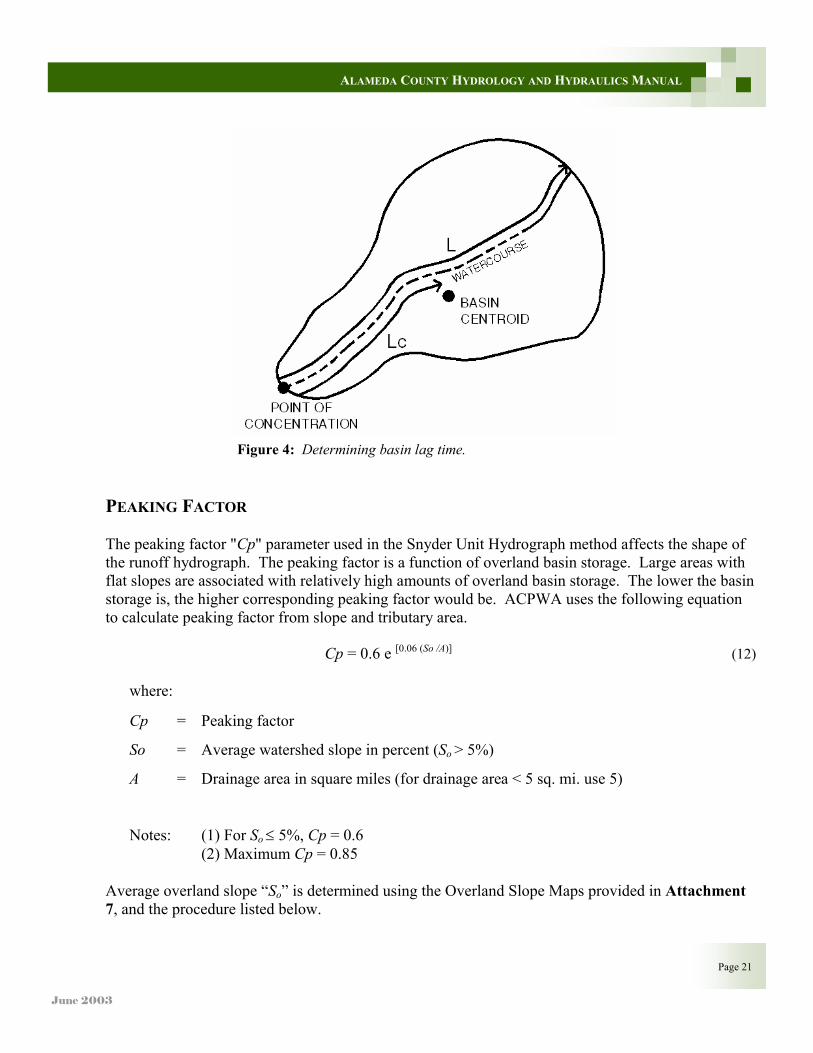
Lag Time Determination Procedure: 1. Delineate drainage basin’s main watercourse or main drainage network. 2. Determine centroid of the drainage area. 3. Measure the main watercourse length L and the centroidal length Lc on a scale map.
(see figure 4) 4. Calculate average watercourse slope S using Equation (10). 5. Estimate Basin “N” using Table 8 for rural catchments and Equation (11) for urban catchment. 6. Calculate lag time using lag Equation (9).
June 2003
ALAMEDA COUNTY HYDROLOGY AND HYDRAULICS MANUAL
Page 21
Figure 4: Determining basin lag time.
PEAKING FACTOR The peaking factor "Cp" parameter used in the Snyder Unit Hydrograph method affects the shape of the runoff hydrograph. The peaking factor is a function of overland basin storage. Large areas with flat slopes are associated with relatively high amounts of overland basin storage. The lower the basin storage is, the higher corresponding peaking factor would be. ACPWA uses the following equation to calculate peaking factor from slope and tributary area.
Cp = 0.6 e [0.06 (So /A)] (12)
where:
Cp = Peaking factor
So = Average watershed slope in percent (So > 5%)
A = Drainage area in square miles (for drainage area < 5 sq. mi. use 5)
Notes: (1) For So ≤ 5%, Cp = 0.6 (2) Maximum Cp = 0.85
Average overland slope “So” is determined using the Overland Slope Maps provided in Attachment 7, and the procedure listed below.
June 2003
Peaking Factor Determination Procedure: 1. Locate your study watershed and delineate its boundary over the slope maps provided in Attach-
ment 8.
2. If the watershed was found to be within the flat urban area with less than 5% average slope use Cp = 0.6.
3. Otherwise, continue with the next step.
4. Using the overland slope maps calculate a weighted average slope for the study drainage area.
5. Use Equation (12) to calculate peaking factor for the study watershed. BASE FLOW A base flow component was not used during the design discharge calibration process. Therefore, it is not used for peak flow analysis of mid-size drainage areas. However, if a considerable base flow ex-ists due to high water table, reservoir releases, or other circumstances, then it shall be considered as an addition to the design flood hydrograph. Base flow, however, is to be used when designing/sizing stormwater detention basins as shown in Chapter Five.
June 2003
ALAMEDA COUNTY HYDROLOGY AND HYDRAULICS MANUAL
Page 23
BACKGROUND The District generally uses Manning’s equation to calculate friction losses to determine water surface profiles and hydraulic grade lines (HGL’s). In addition to friction losses, the District also requires that Primary Facilities serve two basic purposes: To contain large (100-year recurrence interval) floods, and to provide a design flood water surface that is adequate for the positive drainage of secondary facilities. Secondary Facilities drain smaller watersheds and are designed to drain positively to the design flood water surface in the primary facility. Some secondary facilities drain directly to the San Francisco Bay. These facilities are designed to drain to the 100-year tide elevation. The beginning water surface to be used in calculating hydraulic profiles is dependent on the type of facility (primary or secondary), the design storm recurrence interval, and whether the facility is subject to tidal backwater effects. Attachment 13 is a list of the various datum planes used by different jurisdictions in the Bay Area. Attachments 14a and 14b illustrates tidal elevations to be used in design. Attachment 15 is a summary of the design water surfaces described in this chapter. DESIGN WATER SURFACE FOR PRIMARY FACILITIES The following beginning water surfaces shall be used when calculating design water surfaces for primary facilities that flow to San Francisco Bay: No Outflow. Use the 100-year tide. 5-Year Storm. Use the 100-year tide. 15/25-Year Storm. Use MHHW.
CHAPTER FOUR: HYDRAULIC DESIGN
June 2003
Page 24
ALAMEDA COUNTY HYDROLOGY AND HYDRAULICS MANUAL
No Tidal Influence. Use the closest known downstream water surface for the required design storm. If no water surface is known in the primary facility, one shall be calculated beginning at the nearest point of hydraulic control or at the Bay, if necessary, using the above criteria. DESIGN WATER SURFACE FOR SECONDARY AND OTHER FACILITIES The design water surface for all secondary facilities is the 10-Year Hydraulic Grade Line. The following beginning water surfaces shall be used when calculating water surfaces for secondary facilities. Secondary Facilities Draining to Primary Facilities Use the current ACPWA Design Water Surface. If none is available, design shall conform to the Freeboard Requirements listed on the following page. Secondary Facilities Draining Directly to the Bay Use the 100-Year Tide.
Primary and Secondary Facilities Draining to Major Facilities (Alameda, San Leandro and San Lorenzo Creeks) Use the current ACPWA Design Water Surface. NOTE: For Secondary Facilities draining to Primary Facilities in FEMA studied areas only, the HGL(10) shall also be calculated using the FEMA HGL(100) in the Primary Facility as a starting water surface. The HGL(10) in the Secondary Facility shall not exceed Top of Curb.
June 2003
Page 25
ALAMEDA COUNTY HYDROLOGY AND HYDRAULICS MANUAL
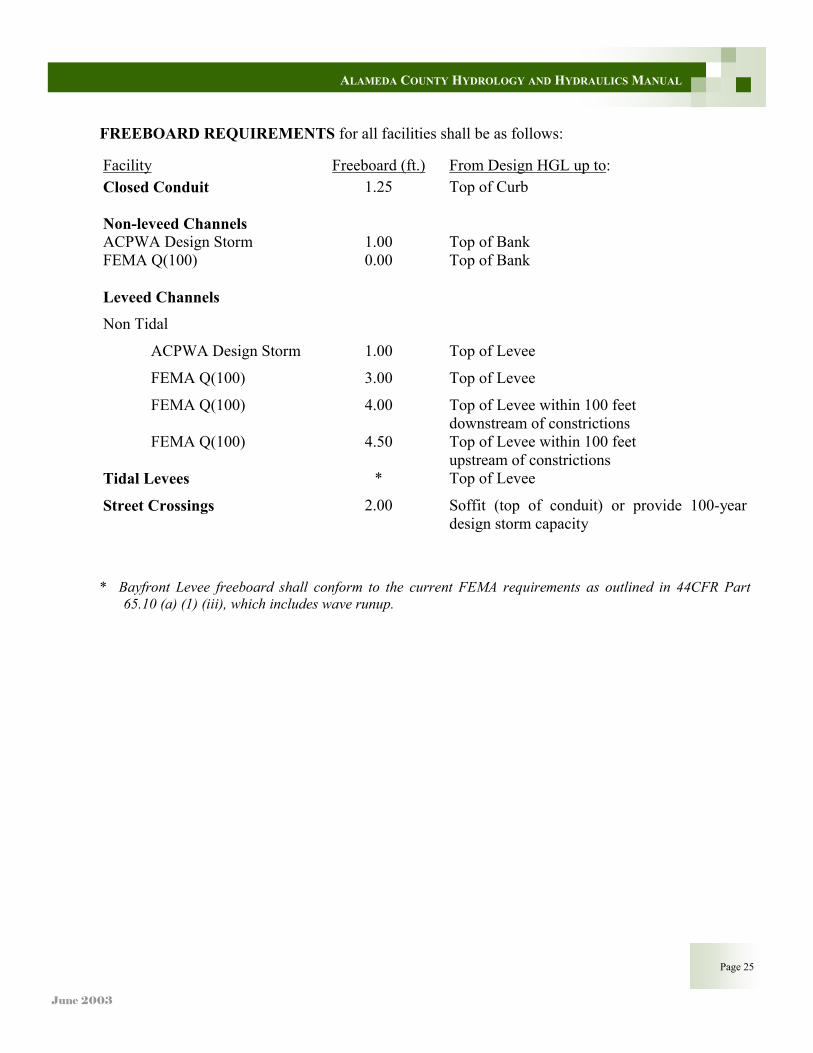
* Bayfront Levee freeboard shall conform to the current FEMA requirements as outlined in 44CFR Part 65.10 (a) (1) (iii), which includes wave runup.
Facility Freeboard (ft.) From Design HGL up to: Closed Conduit
1.25 Top of Curb
Non-leveed Channels ACPWA Design Storm FEMA Q(100)
1.00 0.00
Top of Bank Top of Bank
Leveed Channels
Non Tidal
ACPWA Design Storm 1.00 Top of Levee
FEMA Q(100) 3.00 Top of Levee
FEMA Q(100) 4.00 Top of Levee within 100 feet downstream of constrictions
FEMA Q(100) 4.50 Top of Levee within 100 feet upstream of constrictions
Tidal Levees * Top of Levee
Street Crossings 2.00 Soffit (top of conduit) or provide 100-year design storm capacity
FREEBOARD REQUIREMENTS for all facilities shall be as follows:
June 2003
Page 26
ALAMEDA COUNTY HYDROLOGY AND HYDRAULICS MANUAL
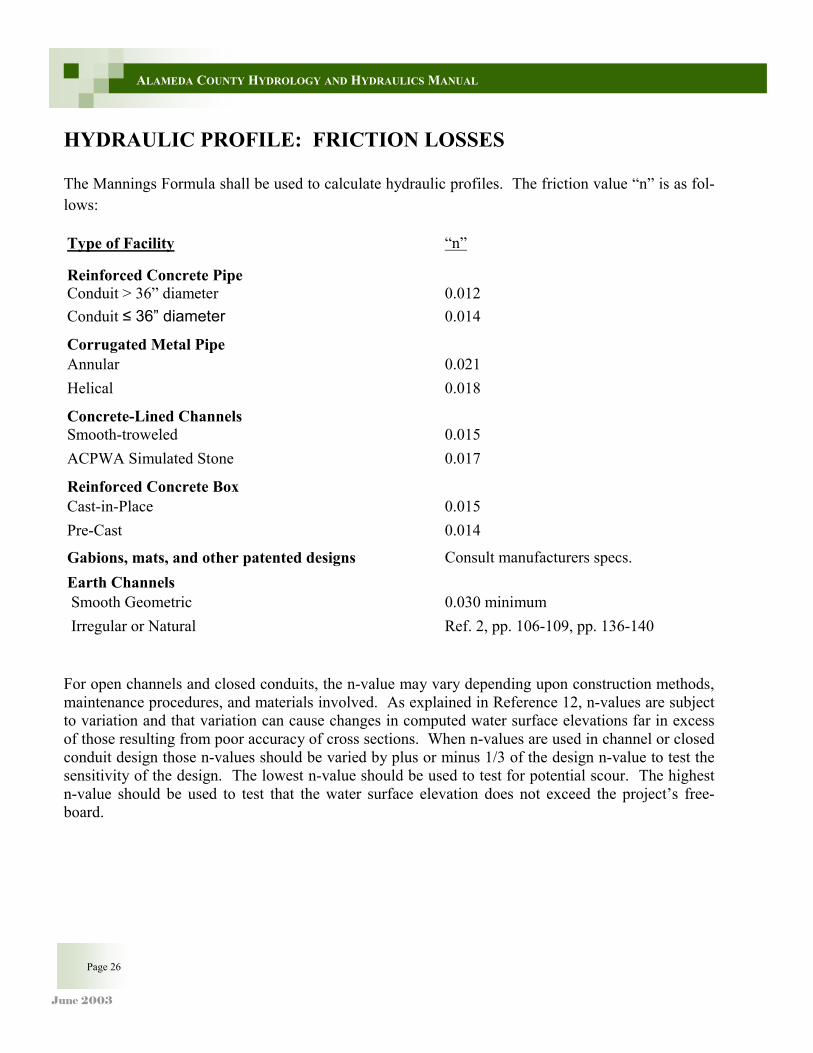
HYDRAULIC PROFILE: FRICTION LOSSES The Mannings Formula shall be used to calculate hydraulic profiles. The friction value “n” is as fol-lows:
Type of Facility “n”
Reinforced Concrete Pipe Conduit > 36” diameter 0.012 Conduit ≤ 36” diameter 0.014
Corrugated Metal Pipe Annular 0.021 Helical 0.018
Concrete-Lined Channels Smooth-troweled 0.015 ACPWA Simulated Stone 0.017
Reinforced Concrete Box Cast-in-Place 0.015 Pre-Cast 0.014
Gabions, mats, and other patented designs Consult manufacturers specs. Earth Channels Smooth Geometric 0.030 minimum Irregular or Natural Ref. 2, pp. 106-109, pp. 136-140
For open channels and closed conduits, the n-value may vary depending upon construction methods, maintenance procedures, and materials involved. As explained in Reference 12, n-values are subject to variation and that variation can cause changes in computed water surface elevations far in excess of those resulting from poor accuracy of cross sections. When n-values are used in channel or closed conduit design those n-values should be varied by plus or minus 1/3 of the design n-value to test the sensitivity of the design. The lowest n-value should be used to test for potential scour. The highest n-value should be used to test that the water surface elevation does not exceed the project’s free-board.
June 2003
Page 27
ALAMEDA COUNTY HYDROLOGY AND HYDRAULICS MANUAL
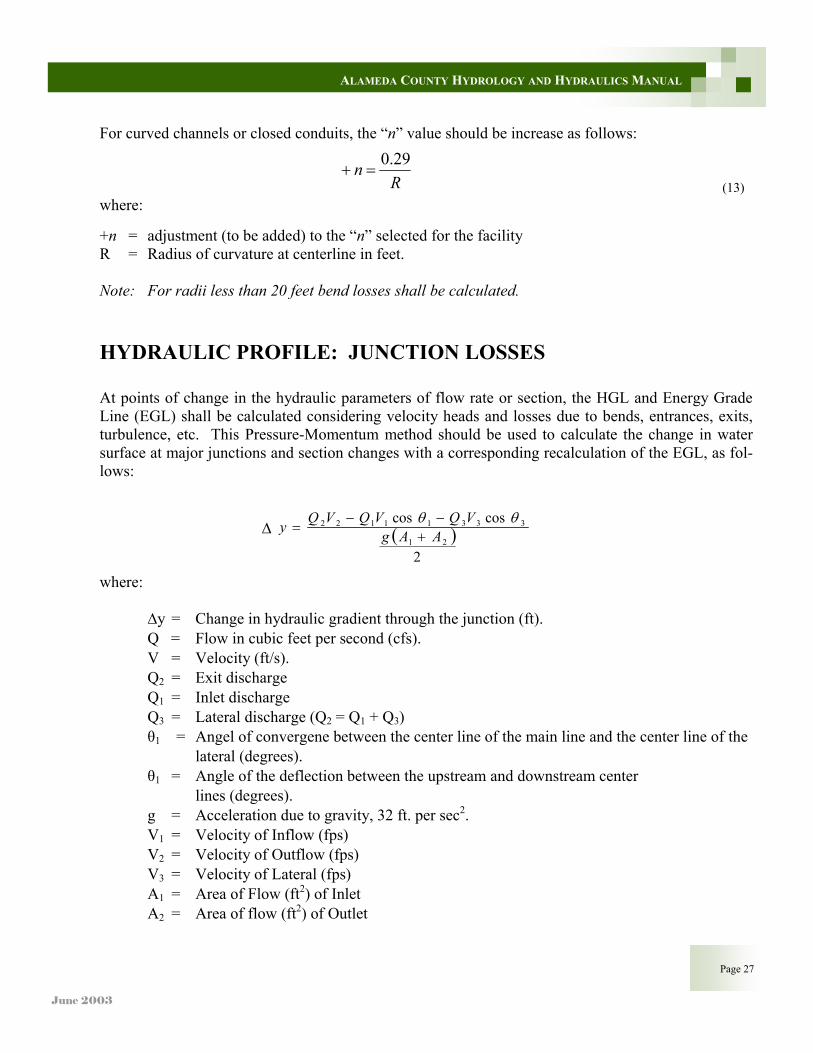
HYDRAULIC PROFILE: JUNCTION LOSSES At points of change in the hydraulic parameters of flow rate or section, the HGL and Energy Grade Line (EGL) shall be calculated considering velocity heads and losses due to bends, entrances, exits, turbulence, etc. This Pressure-Momentum method should be used to calculate the change in water surface at major junctions and section changes with a corresponding recalculation of the EGL, as fol-lows:
( )2
coscos21
33311122
AAgVQVQVQy
+−−
=θθ
∆
where: ∆y = Change in hydraulic gradient through the junction (ft). Q = Flow in cubic feet per second (cfs). V = Velocity (ft/s). Q2 = Exit discharge Q1 = Inlet discharge Q3 = Lateral discharge (Q2 = Q1 + Q3) θ1 = Angel of convergene between the center line of the main line and the center line of the lateral (degrees). θ1 = Angle of the deflection between the upstream and downstream center lines (degrees). g = Acceleration due to gravity, 32 ft. per sec2. V1 = Velocity of Inflow (fps) V2 = Velocity of Outflow (fps) V3 = Velocity of Lateral (fps) A1 = Area of Flow (ft2) of Inlet A2 = Area of flow (ft2) of Outlet
(13) Rn 29.0
=+
where: +n = adjustment (to be added) to the “n” selected for the facility R = Radius of curvature at centerline in feet. Note: For radii less than 20 feet bend losses shall be calculated.
For curved channels or closed conduits, the “n” value should be increase as follows:
June 2003
Page 28
ALAMEDA COUNTY HYDROLOGY AND HYDRAULICS MANUAL
Energy equations should be used to calculate the effect a section change has on the EGL and then compared with the Pressure-Momentum results. The higher of the two is to be used. HYDRAULIC PROFILE: HYDRAULIC JUMPS Hydraulic jumps occur when the depth of flow changes rapidly from a low stage to a high stage. Where hydraulic jumps are likely to occur, such as where the slope or cross section of the facility changes in supercritical flow, their location and energy losses shall be determined and considered in the design. See Reference 2, pp. 393-434.
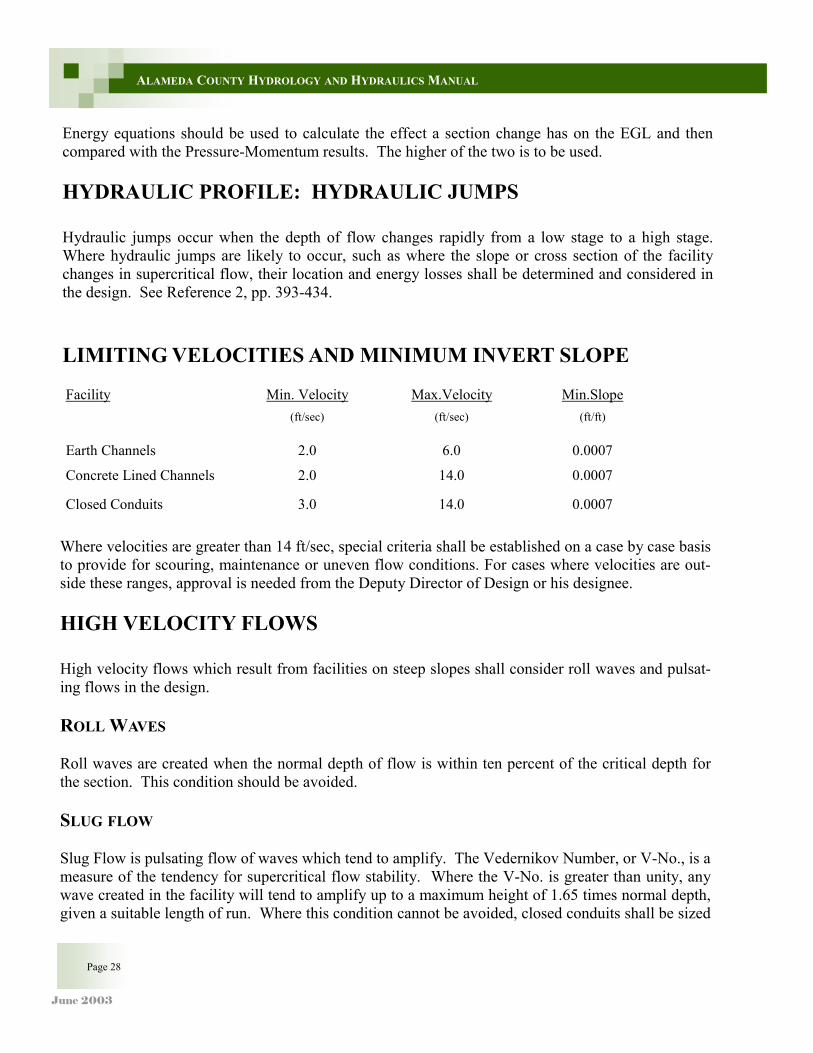
LIMITING VELOCITIES AND MINIMUM INVERT SLOPE
Where velocities are greater than 14 ft/sec, special criteria shall be established on a case by case basis to provide for scouring, maintenance or uneven flow conditions. For cases where velocities are out-side these ranges, approval is needed from the Deputy Director of Design or his designee. HIGH VELOCITY FLOWS High velocity flows which result from facilities on steep slopes shall consider roll waves and pulsat-ing flows in the design. ROLL WAVES Roll waves are created when the normal depth of flow is within ten percent of the critical depth for the section. This condition should be avoided. SLUG FLOW Slug Flow is pulsating flow of waves which tend to amplify. The Vedernikov Number, or V-No., is a measure of the tendency for supercritical flow stability. Where the V-No. is greater than unity, any wave created in the facility will tend to amplify up to a maximum height of 1.65 times normal depth, given a suitable length of run. Where this condition cannot be avoided, closed conduits shall be sized
Facility Min. Velocity Max.Velocity Min.Slope
(ft/sec) (ft/sec) (ft/ft)
Earth Channels 2.0 6.0 0.0007
Concrete Lined Channels 2.0 14.0 0.0007
Closed Conduits 3.0 14.0 0.0007
June 2003
Page 29
ALAMEDA COUNTY HYDROLOGY AND HYDRAULICS MANUAL
AIR ENTRAINMENT Velocities above 14 ft/sec entrain air. An increase depth may result, with this depth being related di-rectly to the increase in the volume of water.
5.02
12.010
−⋅=
gRVAa
(16)
where: Aa = increase in flow area attributable to air entrainment (percent) V = velocity at normal depth (ft/s) R = hydraulic radius without air entrainment g = acceleration due to gravity, 32.2 ft per sec2 See Reference 2, p. 37.
cgrbVh
2
2
= (15)
where: ∆h = rise in water surface (ft) b = channel width at the water surface V = velocity (ft/s) rc = radius of channel centerline’s curve g = gravity constant
Cross waves occur in supercritical flow and should be considered in design. See Ref 2, Page 448.
such that normal depth does not exceed half the depth of the conduit, and open channels shall be lined at least to 1.70 times normal depth. See Reference 2, pp. 210-211. EFFECTS OF CURVATURE In open channels of curved alignment, the rise in the water surface due to superelevation and cross waves shall be considered. Super-elevation is the rise in water surface around a bend in a channel due to centrifugal force. The rise in the water surface is given by:

June 2003
Page 30
ALAMEDA COUNTY HYDROLOGY AND HYDRAULICS MANUAL
DEBRIS AND SEDIMENT BASINS Debris and sediment basins may be required in the design of certain flood control facilities. The need for such structures shall be determined on a site by site basis by the Director of Public Works. MISCELLANEOUS STANDARDS DISTRICT SPECIFICATIONS AND STANDARDS District Specifications and standards for backfill, concrete products, pipe, etc., and District Design Guidelines shall be used where applicable. Minimums: These minimums cover items not covered elsewhere in this manual. Minimum pipe size shall be 18 inches in diameter.
Minimum reinforced concrete box height shall be seven feet where grades permit.
Minimum bottom width for open channels and boxes shall be four feet for earth sections and six feet for concrete sections whenever possible. Maximums. These maximums cover items not covered elsewhere in this manual. Maximum EGL elevation shall be below the top of bank in channels and below ground in closed con-duit systems wherever possible. Manhole spacing for underground conduits shall not exceed 400 feet on center. Side drain spacing for open channels shall be such that a minimum to percent (2%) slope is main-tained between grade break and side drain inlet, and in no case shall be greater than 400 feet. The ratio of side slope for earth channels shall be no steeper than two and one half (2 1/2) horizontal units to one (1) vertical unit. FUTURE CROSSINGS Future Crossings of District open channels shall be either clear span or shall not adversely increase the water surface elevation for any cross-section of the channel upstream of the crossing for the ap-propriate design storm.
June 2003
Page 31
ALAMEDA COUNTY HYDROLOGY AND HYDRAULICS MANUAL
UNDERGROUNDING OF EXISTING ACPWA OPEN CHANNELS Undergrounding of Existing District Open Channels shall not adversely increase the water surface elevation for any cross-section of the channel upstream for the appropriate design storm. Under-grounding are generally not encouraged. CAST-IN-PLACE CONCRETE PIPE Precast reinforced concrete pipe is the accepted material for concrete culverts. The use of Cast-In-Place pipe is subject to the approval of the Deputy Director of Public Works - Design, on a case by case basis. RIGHT-OF-WAY Minimum Right-of-Way Requirements District Maintained Project Minimum Right-of-Way Requirements are shown on Attachments 16a and 16b for District projects. Minimum Set Back Requirements Under the Alameda County Watercourse Protection Ordinance, the minimum requirements for set backs are shown in Attachment 17. See Reference 10. PIPE SIZES Pipes shall not decrease in area or diameter in the downstream direction. Pipelines with area and/or diameter reductions in the downstream direction shall be treated as detention basins (see Chapter 5).

June 2003
June 2003
DETENTION FACILITIES Background Detention facilities are those facilities designed to reduce the rate of discharge from a drainage area into a receiving waterway. One of the common uses for a detention facility is to limit the augmented discharge rate from a development site. When such a facility be-comes a permanent drainage feature, assurances for the continued maintenance of its design capacity must be provided for; i.e., main-tenance by the District, another public agency, or private party through a maintenance agreement. Several types of detention facilities are acceptable to the District for controlling on-site the augmented storm discharge:
Page 33
ALAMEDA COUNTY HYDROLOGY AND HYDRAULICS MANUAL
RETENTION FACILITIES Retention facilities are designed to contain approximately 25 percent of the mean annual precipitation regardless of the design storm fre-quency of the drainage facilities entering the facility. Retention fa-cilities do not have surface outflow but rely instead on percolation and/or evaporation to dispose of runoff. The facility shall be designed such that the water surface returns to its original elevation within 24 hours, after the cessation of a 100-year, 24-hour rainstorm over the contributory watershed. The volume of storm water shall be calcu-lated as follows:
( )( )APV w 021.0= (11)
where: Vw = volume of water to be stored (acre-feet) P = annual precipitation at the center of gravity of the watershed
basin (inches) A = drainage area (acres) There must be 1.0 foot of freeboard between the elevation of the stor-age volume (Vw) and the lowest adjacent ground.
CHAPTER FIVE: STORMWATER HOLDINGS FACILITIES
June 2003
Page 34
ALAMEDA COUNTY HYDROLOGY AND HYDRAULICS MANUAL
• Parking lot detention for industrial/business development. Using this method requires the filing
of notice that the area is subject to storm water ponding. Parking lots shall provide pedestrian access through the ponded areas. Depths of ponding shall not exceed four inches (4”).
• Conduit storage can be utilized by oversizing the underground drainage facilities. Care should be
taken to prevent siltation problems. • Channel storage can be utilized by oversizing the open channel facilities. Care again should be
taken to prevent siltation problems, and allowances must be made for a minimum capacity at a maximum silt buildup.
• Multi-purpose facilities can be used as detention facilities such as park areas, tennis courts, park-
ing areas, existing ponds and wetland areas, and landscaped areas. The detention pond shall be designed such that the water surface returns to its base or starting eleva-tion within 24 hours after the cessation of a 24-hour, 100-year storm. DESIGN PROCEDURE The following detention basin design procedure shall be used where a detention basin is required by the District, for drainage basins less than one-half square mile, unless a specific modification has been approved or required. For drainage basins greater than one-half square mile, specific require-ments must be obtained from the District. A detention basin will generally be designed for and con-structed at the downstream end of the project site. Detention basins shall be designed to store urban runoff from the site such that the post-project discharge rate is maintained at a rate less than or equal to the pre-project peak discharges for the 15- and 100-year flood events. In certain cases, as directed by the District, the maximum allowable outflow may be specified to provide for maintenance of downstream level. The District will notify the applicant if discharges less than the pre-project 15-year peak discharge is required. DETENTION BASIN DESIGN The following design procedure is proposed. (1) For drainage areas less than 640 acres, calculate the 15- and 100-year existing conditions peak
discharges based on the Alameda County modified rational formula. For drainage areas greater than 640 acres, calculate the 15-year and 100-year existing conditions peak discharges using the Synthetic Hydrograph Method.
June 2003
Page 35
ALAMEDA COUNTY HYDROLOGY AND HYDRAULICS MANUAL
(2) Develop future conditions runoff hydrographs for the 15- and 100-year flood events based on the Alameda County unit hydrograph methodology. Use a Base Flow of 7cfs per square mile of drainage area for the 15-year hydrograph and 10 cfs per square mile of drainage area for the 100-year hydrograph.
(3) Calculate the required detention basin storage based on the 100-year hydrograph. Determine the volume in the future conditions runoff hydrograph (2) that exceeds the existing conditions peak discharge (1) and multiply by a factor of 3. This is the first estimate of the required volume in the detention basin. Estimate the dimensions of the base and compute storage-elevation causes.
(4) Size the outlet facility such that the existing conditions peak discharges for the 15- and the 100-year events (1) would not be exceeded given the inflow hydrographs (3). Size the outlet pipe(s) to discharge the 15-year existing conditions peak discharge with approximately 1-2 feet between top of pipe and spillway crest. Design an overflow spillway to pass the 100-year existing peak discharge at approximately 2 feet of freeboard above the spillway crest to the lowest adjacent grade.
(5) Route the 15-year future land use conditions runoff hydrograph from (2) through the detention basin to verify that the maximum outflow through the storage and outlet pipe combination does not exceed the existing 15-year existing discharge.
(6) Route the 100-year future land use conditions hydrograph from (2) through the detention basin to verify that the maximum outflow through the storage outlet pipe and spillway does not ex-ceed the existing 100-year discharge. Be certain that the detention basin returns to its starting elevation used in the analysis within 24 hours of the end of the 100-year 24-hour storm event.

June 2003
June 2003
Page 37
ALAMEDA COUNTY HYDROLOGY AND HYDRAULICS MANUAL
REFERENCES
1. U.S. Department of Agriculture Soil Conservation Service, “A Method for Estimating Volume and Rate of Runoff in Small Watersheds, SCS - TP - 149”.
2. Chow, Ven Te, Open-Channel Hydraulics, 1959, McGraw-Hill Book Company, New York.
3. Water Resources Council, “A Uniform Technique for Determining Flood Flow Frequencies”, December 1967.
4. Department of Water Resources, “Rainfall Analysis for Drainage Design Volume I, II, & III”, October 1976.
5. Department of Water Resources, “Rainfall Depth-Duration-Frequency for California”.
6. U.S. Weather Bureau and Soil Conservation Service, “Rainfall Intensities for Local Drainage Design in Western United States, Technical Paper No. 28”.
7. U.S. Department of Agriculture, Soil Conservation Service, “National Engineering Handbook, Section 4, Hydrology,” March, 1985, 210-VI-NEH-4.
8. Barnes, Harry H., Jr., Roughness Coefficients of Natural Channels, U.S. Geological Survey, Water Supply Paper No. 1849, Second Printing, 1977.
9. United States Department of Agriculture, Soil Conservation Service, “Engineering Handbook No. 5, Hy-draulics, Supplement B, “ 1956.
10. County of Alameda, “Watercourse Protection Ordinance of Alameda County,” Ordinance Code of Ala-meda County, Title 7, Chapter 10.
11. U.S. Army Corps of Engineers, San Francisco District, “San Francisco Bay Tidal Stage vs. Frequency Study,” October 1984.
12. U.S. Army Corps of Engineers, Hydrologic Engineering Center, “Accuracy of Computed Water Surface Profiles,” December 1986.

June 2003
June 2003
ATTACHMENTS
Attachment 1: Zone Boundary Map
Attachment 2: Data Table - Modified Rational Method
Attachment 3: Overland Flow Velocity
Attachment 4: Roof to Gutter Time
Attachment 5: Natural Channel Flow
Attachment 6: Mean Annual Precipitation Map
Attachment 7: Soils
Attachment 8: Slope
Attachment 9: Rainfall Intensity (in/hr)
Attachment 10: Runoff Coefficient Adjustment
Attachment 11: 6-hr and 24-hr Rainfall Distribution
Attachment 12: Total Rainfall Depth
Attachment 13: Datum Planes
Attachment 14A: Tidal Summary - Adopted 100-yr Tidal Elevation (NGVD
Attachment 14B: Tidal Summary - Adopted MHHW Tidal Elevations (NGVD)
Attachment 15: Design Water Surface Summary
Attachment 16A: Design Guidelines
Attachment 16B: Design Guidelines
Attachment 17: Setback Criteria
ALAMEDA COUNTY HYDROLOGY AND HYDRAULICS MANUAL