Embed Size (px)
Citation preview
On behalf of Transport Scotland
Project Ref: 48966 | Rev: AA | Date: March 2021
Registered Office: Buckingham Court Kingsmead Business Park, London Road, High Wycombe, Buckinghamshire, HP11 1JU Office Address: 3rd Floor, Randolph House, 4 Charlotte Lane, Edinburgh EH2 4QZ T: +44 (0)131 297 7010 E: [email protected]
Home Working
Socio-Economic Analysis Research Findings
Research Findings
Home Working – Socio-Economic Analysis
ii
Document Control Sheet
Project Name: Home Working – Socio-Economic Analysis
Project Ref: 48966
Report Title: Research Findings
Date: 31 March 2021
Name Position Signature Date
Prepared by: Emily Seaman Scott Leitham
Associate Director of Transport Planning
26/03/21
Reviewed by: Scott Leitham Director of Transport Planning 30/03/21
Approved by: Scott Leitham Director of Transport Planning 31/03/21
For and on behalf of Stantec UK Limited
Revision Date Description Prepared Reviewed Approved
This report has been prepared by Stantec UK Limited (‘Stantec’) on behalf of its client to whom this report is addressed (‘Client’) in connection with the project described in this report and takes into account the Client's particular instructions and requirements. This report was prepared in accordance with the professional services appointment under which Stantec was appointed by its Client. This report is not intended for and should not be relied on by any third party (i.e. parties other than the Client). Stantec accepts no duty or responsibility (including in negligence) to any party other than the Client and disclaims all liability of any nature whatsoever to any such party in respect of this report.
Research Findings
Home Working – Socio-Economic Analysis
iii
Contents
Executive Summary .............................................................................................................................. 7
1 Introduction ............................................................................................................................. 12
1.1 Overview ...................................................................................................................... 12
1.2 Methodology ................................................................................................................ 12
2 Understanding the Trends ..................................................................................................... 13
2.1 Introduction .................................................................................................................. 13
2.2 Transport Data ............................................................................................................. 13
2.3 Level of home working and commuting data ............................................................... 26
2.4 Economic Impacts ....................................................................................................... 36
3 Future Home Working Scenarios and Consequences for Travel ...................................... 45
3.1 Introduction .................................................................................................................. 45
3.2 Longer-Term Trends and Commuting in the Context of All Travel ............................. 45
3.3 Scenarios for Future Home Working ........................................................................... 48
3.4 Impacts on Travel Volumes by Mode .......................................................................... 51
4 Impacts of Increased Home Working ................................................................................... 61
4.1 Introduction .................................................................................................................. 61
4.2 Mind Mapping .............................................................................................................. 61
5 Potential Policy Responses .................................................................................................. 69
5.1 Introduction .................................................................................................................. 69
5.2 Mapping the Policy Response ..................................................................................... 69
5.3 Summary of Impacts of Increased Home Working ...................................................... 84
5.4 Summary of Potential Areas where a Policy Response may be Required ................. 85
6 Summary and Conclusions ................................................................................................... 88
Figures
Figure 2-1: Transport Demand by mode during the COVID-19 pandemic (indexed against equivalent time period in 2019)1 (Source: Transport Scotland) .............................................................................. 14 Figure 2-2: Traffic Index for Shanghai (2019 vs 2020)3 (Source: TomTom) ......................................... 15 Figure 2-3: Traffic Index for Auckland (2019 vs 2020) (Source: Stats NZ) ........................................... 15 Figure 2-4: Auckland public transport year on year patronage levels (Source: Stats NZ) .................... 17 Figure 2-5: Transport Demand for Walking and Cycling during the COVID-19 pandemic (indexed against a pre-lockdown period of 9th-15th March 2020)1 (Source: Transport Scotland) ........................ 18 Figure 2-6: % change in cycling by cycle route type (March to May 2020, with a 2nd March 2020 baseline) (Source: Glasgow Centre for Population Health) .................................................................. 19 Figure 2-7: Cycling behaviour in Aberdeen City and Aberdeenshire (July to December 2020)16
(Source: Nestrans) ................................................................................................................................ 20 Figure 2-8: Walking behaviour in Aberdeen City and Aberdeenshire (7 day moving average July to December 2020, indexed against 2nd March) (Source: Glasgow Centre for Population Health) ......... 21 Figure 2-9: Walking behaviour in Aberdeen City and Aberdeenshire (July to December 2020)16
(Source: Nestrans) ................................................................................................................................ 22 Figure 2-10: Attitudes towards future walking and cycling20 (Source: Transport Scotland Public Attitudes Survey) ................................................................................................................................... 23
Research Findings
Home Working – Socio-Economic Analysis
iv
Figure 2-11: Public positivity towards ways of travelling (Source: Nestrans behaviour and attitude surveys)16 .......................................................................................................................................... 24 Figure 2-12: Homeworking rates by occupation, of those in employment (aged 16yrs and over) (April 2020) (Source: ONS) ............................................................................................................................. 26 Figure 2-13: Public Attitudes towards future homewokring20 (Source: Transport Scotland Public Attitudes Survey) ................................................................................................................................... 28 Figure 2-14: Public Attitudes towards future homeworking – Commuting Trips (Source: Nestrans behaviour and attitude surveys)16 .......................................................................................................... 29 Figure 2-15: Business types participating in Transport Scotland / ClimateXChange survey ................ 30 Figure 2-16: Average business response by sector to ‘Has your business had more staff working from home as a result of the coronavirus (COVID-19) pandemic’ (Wave 14 – Wave 22)40 (Source: ONS) . 33 Figure 2-17: Average business response by sector to ‘Does your business intend to use increased homeworking as a permanent business model going forward‘ (Wave 14 – Wave 22) 40 (Source: ONS) . .......................................................................................................................................... 34 Figure 2-18: All industry sector response to ‘Why do you intend to increase home working as a permanent business model going forward?’ (Wave 14 – Wave 22) 40 (Source: ONS) ......................... 34 Figure 2-19: All industry sector response to ‘Why do you not intend to increase home working as a permanent business model going forward (Wave 14 – Wave 22) 40 (Source: ONS) ............................ 35 Figure 2-21: Sectoral impact of recession (Source: OBR) .................................................................... 37 Figure 2-22: OBR Economic Forecast (Source: OBR) .......................................................................... 37 Figure 2-23: High Street vs Retail park vs Shopping Centre footfall (Source: SpringBoard and the Department for Business, Energy and Industrial Space)60 .................................................................... 40 Figure 2-24: Edinburgh Workers Index (Source: Centre for Cities)60 .................................................... 40 Figure 2-25: Glasgow Workers Index (Source: Centre for Cities)60 ...................................................... 41 Figure 2-26: Changes in Household Savings Ratio since 1955, in the United Kingdom 70 (Source: ONS) .......................................................................................................................................... 43 Figure 2-27: Change in Household Saving Ratio over last 3 years in the United Kingdom70 (Source: ONS) .......................................................................................................................................... 44 Figure 2-28: Household Saving Ratio forecast (Source: ONS and Office of Budget Responsibility) .... 44 Figure 3-1: Trips per year (Source: DfT National Travel Survey).......................................................... 45 Figure 3-2: Miles per person per year by purpose and mode (Source: DfT National Travel Survey, 2018) .......................................................................................................................................... 46 Figure 3-3: Proportion of travel by mode accounted for by commuting (Source: DfT National Travel Survey, 2018) ........................................................................................................................................ 47 Figure 3-4: Commuting mode share, trips and distance (Source: DfT National Travel Survey, 2018) . 47 Figure 3-5: Proportion of travel by hour of day by purpose, all modes (Source: DfT National Travel Survey, 2018) ........................................................................................................................................ 48 Figure 3-6: Forecast reduction in travel by mode with TS survey scenario, all modes ......................... 52 Figure 3-7: Location independent jobs – Edinburgh (Source: BRES) ................................................... 53 Figure 3-8: Location independent jobs – Glasgow (Source: BRES) ..................................................... 53 Figure 3-9: TTW mode share across Scotland (Source: 2011 Census) ............................................... 54 Figure 3-10: Forecast reduction in person-miles by mode, TS survey scenario, mode share variants (Source: 2011 Census) .......................................................................................................................... 55 Figure 3-11: Forecast reduction in person-trips by mode, TS survey scenario, mode share variants .. 55 Figure 3-12: Commuting as a proportion of travel by mode (all and car), by hour of day (Derived from DfT NTS data) ....................................................................................................................................... 57 Figure 3-13: Reduction in car / van driver trips by time of day (Derived from DfT NTS data) .............. 57 Figure 3-16: Commuting as a proportion of travel by mode (all and bus), by hour of day (Derived from DfT NTS data) ....................................................................................................................................... 58 Figure 3-17: Reduction in bus trips by time of day (Derived from DfT NTS data) ................................. 58 Figure 3-14: Commuting as a proportion of travel by mode (all and rail), by hour of day (Derived from DfT NTS data) ....................................................................................................................................... 59 Figure 3-15: Reduction in rail trips by time of day (Derived from DfT NTS data).................................. 59 Figure 4-1: Reduced Commuting Travel: Car ....................................................................................... 62 Figure 4-2: Reduced Commuting Travel: Public Transport ................................................................... 63 Figure 4-3: Reduced Commuting Travel: Active Travel ........................................................................ 64 Figure 4-4: Impact of travel time and cost reductions ........................................................................... 65 Figure 4-5: Impact of not being at place of work and being home instead ........................................... 66
Research Findings
Home Working – Socio-Economic Analysis
v
Figure 4-6: Employers perspective and response ................................................................................. 67 Figure 4-7: Home and work independence (impact of residential choice) ............................................ 68
Tables
Table 3.1 Jobs in Scotland by Sector with the Potential for Home Working ......................................... 49 Table 5.1: Potential Policy Responses – Car: Reduced Commuting Travel ......................................... 71 Table 5.2: Potential Policy Responses – Public Transport: Reduced Commuting Travel .................... 74 Table 5.3: Potential Policy Responses – Active Travel: Reduced Commuting Travel .......................... 76 Table 5.4: Potential Policy Responses – Impact of Travel Time & Cost Reductions ............................ 77 Impact of Travel Time & Cost Reductions ............................................................................................. 77 Table 5.5: Potential Policy Responses – Impact of not being at place of work and being home instead . .......................................................................................................................................... 78 Table 5.6: Potential Policy Responses – Employers’ perspective and response ................................. 80 Table 5.7: Potential Policy Responses – Home and work independence (impact of residential choice).. .......................................................................................................................................... 82

Research Findings
Home Working – Socio-Economic Analysis
vi
Research Findings
Home Working – Socio-Economic Analysis
7
Executive Summary
Stantec was commissioned by Transport Scotland to undertake initial analysis of the transport and socio-economic impacts of higher levels of home working in the wake of the 2020-21 Covid-19 pandemic. The main areas considered here are:
Trends in travel volumes and home working during the pandemic
How this may evolve once restrictions are ended and the pandemic is over
The consequences for travel volumes of increased levels of home working
Scoping of how increased levels of home working could impact society and the economy
Identifying which of these impacts may require a policy response to prevent an undesirable outcome from a public policy perspective
It should be noted that this area of research is one where data sources and reports are many and are emerging on an almost daily basis. This report should be seen in this context as a snapshot of the multitude of data available at the time of writing.
Travel and the Economy During Lockdown
Travel volumes by mode during lockdown have been monitored throughout the pandemic and are well established. Whilst the level of car travel ‘recovered’ to pre pandemic levels in summer 2020, after an initial drop to around 15% bus and train travel only returned to around 50% and 25% of normal level respectively until dropping sharply again with the lockdown of January 2021. Bus and rail services have been reduced in line with this reduction in demand, itself a reflection of government advice to avoid public transport. There is some international evidence (e.g., New Zealand) that train and bus travel is remaining subdued compared to car travel when restrictions are lifted, but this does not relate to a ‘post-vaccination’ society so there is likely to be residual reluctance to use public transport in New Zealand as there still are sporadic outbreaks. Walking and cycling have increased during this period, both as a substitute for other modes and purely for leisure.
Level of Home Working
There is a range of survey data and analysis which explores individuals’ and companies’ home working intentions post-pandemic. The results vary widely and will depend on the nature of the question asked and the sample characteristics. It is therefore difficult to reach a consensus on the likely percentage of individuals who will adopt new home working and the frequency with which they will do this. There is therefore substantial uncertainty as to the level of home working which will ultimately emerge after the pandemic ends and people’s behaviours have fully stabilised. In particular there is uncertainty around:
the degree to which people who can work from home will want to do so, and how this may change as some people return to the workplace – will there be a domino effect where more will follow and so on?
the degree to which companies (and public bodies) will look to encourage / make home working compulsory in part or in full (or indeed work from anywhere) to attract / retain staff and / or to reduce overhead costs associated with their office estate. So for some the decision as to whether to adopt home working or not will be taken out of their hands.
The evidence around which industries / occupations lend themselves to home working is however fairly well developed through a number of surveys which have been undertaken during the pandemic.
Research Findings
Home Working – Socio-Economic Analysis
8
The location of these jobs can be readily established via BRES and these jobs are typically prominent in city centres and business parks – town and city centre based jobs are the locations with the highest mode share of more sustainable modes and analysis of census travel to work data has confirmed the scale of this. The residential location of those who are most likely to be home workers can also be obtained albeit from ageing census data. These areas are typically more prosperous than other areas.
Transport Scotland’s series of COVID-19 Public Attitudes Survey Data has been fairly stable with (at the time of writing) 37% of respondents indicating that they intend to work from home more often after the pandemic. For the purposes of the figures that follow, it is assumed that 37% of workers will work from home 50% of the time, although as noted above there is a lot of uncertainty around these figures.
Impacts on traffic and travel volumes
The potential impact of reduced commuting on the overall volume of travel by mode has been analysed based on well-established DfT National Travel Survey data which provides a long-running time series of trip rates and distance by purpose and mode of travel.
Commuting to work accounts for around a quarter of all car / van traffic and bus travel but over one third of rail travel - at its simplest therefore, if car commuting reduced by say 20% due to increased home working, then total car traffic would reduce by 25% * 20% = 5%.
Based on the Transport Scotland survey (and the associated assumptions) and from analysis undertaken for this study, the table below shows the implied reduction in travel by mode associated with increased home working from three different perspectives:
Impact on total travel volumes based on... Car Traffic (veh-
km) Bus Passengers
(trips) Rail Passengers
(trips)
Reduction in commuting based on Scotland-wide travel to work mode share
-5% -7% -6%
Reduction in commuting based on travel to work mode share derived from locations with high numbers of location independent jobs
-4% -11% -14%
Based on Scotland-wide travel to work mode share, peak hour impact, up to….
-19% -19% -27%
In normal times, a 4%-5% reduction in car traffic would equate to perhaps 3-5 years of traffic growth so whilst this in itself does not represent a fundamental change, it would make a material difference to emissions at the Scotland-wide level. However, when the geography of ‘location independent’ jobs is taken into account, the impact on car traffic reduces but the impact on public transport is greater, at 11% and 19% reductions for bus and rail respectively. Given that the majority of jobs where home working is more likely are office-based, for most people this implies travel during AM and PM peak periods. The potential impact on peak hour traffic volumes is therefore much higher with car and bus reductions of up to around 20% and rail passengers dropping by over 25%.
Impacts of increased home working
Many of the socio-economic impacts of increased home working will be a mixture of positive and negative impacts, most fundamentally associated with a redistribution of where people spend time and money. The main impacts are summarised below in five categories.
Transport behaviour impacts
Reduced peak hour travel by all modes and associated reductions in emissions, noise etc., traffic congestion, accidents and crowding on public transport services – this will be offset by
Research Findings
Home Working – Socio-Economic Analysis
9
any travel generated in the course of the day when home working or during any increased leisure time
Benefits in the shape of reduced peak hour journey times and improved journey time reliability due to lower traffic levels for those still making trips by car or bus
Reduced demand for public transport services
Reduced levels of walking and cycling associated with commuting - again this will be offset by any walking and cycling generated in the course of the day when home working or during any increased leisure time
Impacts of reductions in commuting travel time and costs
Reduced money spent on travelling to / from work – this will result in a range of winners and losers as this money is either e.g., spent elsewhere, saved, used to pay down debt, or spent on imported goods
Reduced time spent travelling to / from work – can be used for leisure, flexible working, additional working etc. so there would be a range of impacts associated with each of these
Impacts of spending time at home and not at the workplace
Distributional impacts of change in daytime spending from the workplace to the home area - will affect businesses which rely on workplace footfall and benefit those more locally
Requirement for good digital connectivity and increased home fuel use (implications for household costs and emissions)
Some people’s domestic arrangements are not conducive to home working with implications for continuing employment
Personal productivity may be positively or negatively affected – some will also have a negative well-being impact due to decreased personal interaction with colleagues
Reduced demand for employment floorspace – with major implications for support services, the commercial property market and city centres / business parks
Employers’ perspective
Availability of labour could both broaden and contract due to loosening of geographical constraints but some being locked out of the job market due to unsuitable domestic arrangements
Productivity – again pros and cons, although digital approaches should bring gains, there may be issues incorporating new and particularly young staff into organisations and providing effective training and career development
Costs – presents an opportunity to significantly reduce overheads by cutting back on office space and replacing business travel with virtual meetings
Adaptation – there may be an element of competition between employers to provide the best balance of workplace / work from anywhere arrangements
Research Findings
Home Working – Socio-Economic Analysis
10
Loosening or breaking of link between home and the workplace
This could bring a substantial change in the distribution of population across Scotland as people move further away from their workplace. There would be a range of social and economic impacts in terms of communities affected and provision of public services in areas which see in-migration.
Potential Areas where a Policy Response may be Required
We have identified four broad areas where policy responses may be required in the light of this range of impacts and these are summarised below.
Transport
Loss of public transport revenue (and particularly season tickets in their current form) will undermine commercial services and imply increased subsidy or fares to maintain existing services – there is a risk of a spiralling impact of reduced patronage leading to reduced service levels leading to reduced patronage and so on
The form of the public transport ‘offer’ based on high capacity peak hour provision to serve city centres may have to be reviewed – the nature of the network of services may also have to evolve in line with changing demand
Additional car use may have become embedded for some throughout the pandemic increasing traffic and emissions – a policy response may be required to encourage these people back onto public transport. This increase in car use (mode shift) could offset the reduction in car use caused by decreased commuting.
For some there will have been a loss of physical activity which was previously integrated into their daily routines whilst commuting. Although there is evidence that people are more willing to walk / cycle for leisure and as a substitute for other modes, this may be transient, so a policy response may be required to reinforce the ‘good’ habits people developed during lockdown.
Future investments in ‘mass transit’ and infrastructure aimed at alleviating congestion hotspots during peak commuting times may need to be reviewed as they may longer represent value for money. It may be possible to re-allocate 'surplus' capacity (resulting from reduced peak hour traffic flows) for other purposes.
Any net reduction in car use will reduce fuel duty and VAT and could have an impact on the viability of some filling stations
As the relationship between supply and demand could be materially changed, parking provision and charging policies may need to be reviewed, potentially including proposed workplace charging levies
Digital infrastructure and energy
Some parts of the country are not able to meet the increased demand for broadband, high speeds and bandwidth. This will disadvantage those living in poorly served areas, have a labour market effect and also impact on productivity where the level of connectivity affects performance.
Those now working from home will see increased home energy costs and this could be problematic for some at the margin – grants or tax policies could address this
Domestic emissions will be increased – this could hasten the requirement for alternatives to gas for domestic heating in particular
Research Findings
Home Working – Socio-Economic Analysis
11
Labour market
For some the absence of a suitable home working environment, allied to the expectation that work will be undertaken from home for some roles will affect access to the job market. A proportion of potential employees would then be excluded from some jobs introducing a new inequality.
Those with a sub-optimal domestic working environment may see their productivity drop, and / or their wellbeing suffer. For some there may also be a degree of social isolation resulting from home working which again could impact on wellbeing.
A policy response may therefore be required to provide flexible workspaces for individuals whose domestic arrangements do not lend themselves to home working. The market may however provide a solution under some circumstances.
Planning & economic development
One of the biggest impacts could be on larger town and city centres and business parks. These locations host high numbers of jobs which could be undertaken from home or elsewhere. If there is a material reduction in commuting to, and therefore footfall in these areas, those providing retail, hospitality and support services based on this will be negatively affected. The commercial property market will see a sharp drop in demand which would feed through to other areas such as retail. A substantial planning and economic development policy response may be required to facilitate a re-purposing of these areas.
There could also be significant impacts on the housing market which would likely require a planning policy response. Over time there could be significant change in the distribution of where people want to live with the assumption being that people may wish to move to more rural locations to obtain larger properties, or indeed access to more green space in the event of another pandemic. This will create development pressures in new areas which can bring tensions to the communities there and pressure on local public services. House price inflation in desirable hot spots could have an impact on local families being priced out of their local property markets. Allied to this could be further issues with second homes policy. The added work / home flexibility could make second home ownership more attractive for some adding to some of the policy issues which emerge from existing levels of second home ownership in parts of the country.
This report has scoped out a range of potential transport and socio-economic impacts of increased home working. The key issue therefore is one of scale. If home working does not materialise on the scale envisaged by some, then these impacts could be minor. On the other hand if home working is adopted at scale, then there would be fundamental impacts across a wide range of areas and the requirement for a range of policy responses.
Given the uncertainty around the potential scale of home working post pandemic, it would be beneficial to monitor the level of actual home working on a regular basis as the country emerges from the pandemic. This information could be collected together with basic demographic details, industry and occupation to develop a clear picture of the types of jobs and types of people now working from home who were not doing so before. To prepare for and provide evidence around increase home working, there would also be value in considering implementing a medium-term monitoring programme drawing on some of the logic set out in this report to gauge the scale of home working and the severity of its impacts, both positive and negative.
Research Findings
Home Working – Socio-Economic Analysis
12
1 Introduction
1.1 Overview
1.1.1 In March 2020, the UK entered into a national lockdown in order to address the spread of the COVID19 virus pandemic. As a result, hundreds of thousands of people in Scotland moved their working life from the office to their home. This has resulted in wide-ranging societal and economic repercussions with the potential for significant medium to longer term, permanent behavioural changes in the way people work and travel. The impacts of widespread, permanently higher levels of home working are potentially far reaching with a range of knock-on effects which could materially impact the economy and society in Scotland.
1.1.2 Transport Scotland wishes to gain a fuller understanding of: (i) the scale of home working resulting from the pandemic and its economic impact; (ii) the potential for this to evolve in the medium and longer term and the associated socio-economic impacts; and (iii) how these changes may feed into future policy making.
1.1.3 This research exercise is focussed solely on increased home working, rather than other travel related pandemic impacts such as increased online shopping, other than where increased home working might directly affect other travel purposes. For example, home working has greatly accelerated the use of online platforms for business meetings, and this will likely have a significant impact on the quantum of business travel post-pandemic.
1.1.4 It should be noted that this whole area of research is one where data sources and reports are many and are emerging on an almost daily basis. This report should be seen in this context as a snapshot of the multitude of data available at the time of writing.
1.2 Methodology
1.2.1 This research has been undertaken following steps:
Collating the key evidence to clearly understand what has happened since March 2020 when the UK went into the first national lockdown
Considering future scenarios representing the scope and scale of future home working and the implications on travel volumes by mode
Using mind mapping to graphically set out the array of potential social and economic impacts resulting from these scenarios (positive and negative) and therefore establishing an Impacts Framework
Identifying areas where policy may have to respond to prevent negative outcomes or lock in the benefits of positive changes.
1.2.2 Details of the work undertaken and the findings of each of these steps are presented in the remainder of this report.
Research Findings
Home Working – Socio-Economic Analysis
13
2 Understanding the Trends
2.1 Introduction
2.1.1 To set out and the impacts of home working and provide the evidence of what has occurred since March 2020, a range of data has been collated and analysed with respect to transport, the level of home working and related economic impacts. This task has been on-going throughout this research work as Scotland has eased and reimposed various lockdowns and social distancing measures throughout the course of 2020 and into 2021.
2.1.2 Three strands of data have been collated and considered:
Transport data
Level of home working and commuting data
Economic data
2.1.3 The data and findings from the collation and analysis of these three strands are presented below. As noted above, data sources and reports on this topic are many and are emerging on an almost daily basis. The key elements and findings from a selection of the data sources considered are presented here.
2.2 Transport Data
Transport Volumes
2.2.1 Transport Scotland have been monitoring transport data through the pandemic1. The data provides a record of travel across the main travel modes compared to the equivalent time the previous year.
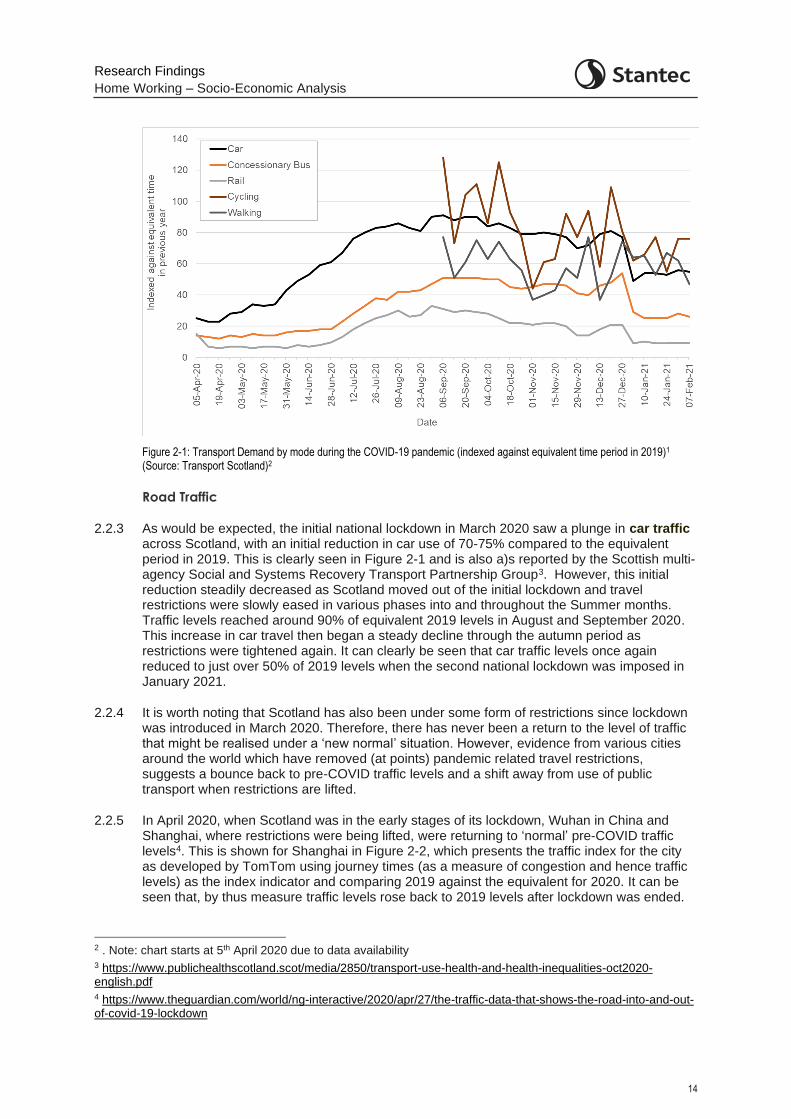
2.2.2 Figure 2-1 presents the data across the various transport modes up to 7th February 2021. Note that bus data is only representative of concessionary fares travel and cycling and walking data was not available with indexing against the equivalent time the previous year until September 2020.
1 https://www.transport.gov.scot/publication/covid-19-transport-trend-data-1-7-february-2021/
Research Findings
Home Working – Socio-Economic Analysis
14
Figure 2-1: Transport Demand by mode during the COVID-19 pandemic (indexed against equivalent time period in 2019)1
(Source: Transport Scotland)2
Road Traffic
2.2.3 As would be expected, the initial national lockdown in March 2020 saw a plunge in car traffic across Scotland, with an initial reduction in car use of 70-75% compared to the equivalent period in 2019. This is clearly seen in Figure 2-1 and is also a)s reported by the Scottish multi-agency Social and Systems Recovery Transport Partnership Group3. However, this initial reduction steadily decreased as Scotland moved out of the initial lockdown and travel restrictions were slowly eased in various phases into and throughout the Summer months. Traffic levels reached around 90% of equivalent 2019 levels in August and September 2020. This increase in car travel then began a steady decline through the autumn period as restrictions were tightened again. It can clearly be seen that car traffic levels once again reduced to just over 50% of 2019 levels when the second national lockdown was imposed in January 2021.
2.2.4 It is worth noting that Scotland has also been under some form of restrictions since lockdown was introduced in March 2020. Therefore, there has never been a return to the level of traffic that might be realised under a ‘new normal’ situation. However, evidence from various cities around the world which have removed (at points) pandemic related travel restrictions, suggests a bounce back to pre-COVID traffic levels and a shift away from use of public transport when restrictions are lifted.
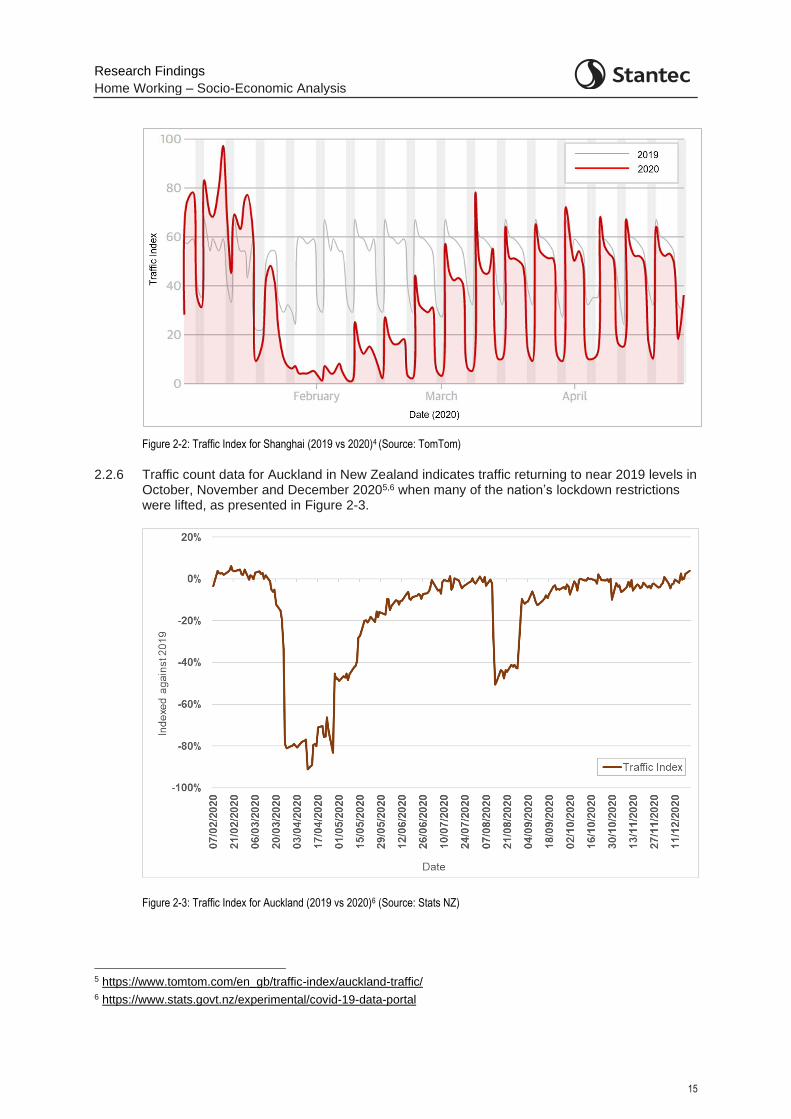
2.2.5 In April 2020, when Scotland was in the early stages of its lockdown, Wuhan in China and Shanghai, where restrictions were being lifted, were returning to ‘normal’ pre-COVID traffic levels4. This is shown for Shanghai in Figure 2-2, which presents the traffic index for the city as developed by TomTom using journey times (as a measure of congestion and hence traffic levels) as the index indicator and comparing 2019 against the equivalent for 2020. It can be seen that, by thus measure traffic levels rose back to 2019 levels after lockdown was ended.
2 . Note: chart starts at 5th April 2020 due to data availability 3 https://www.publichealthscotland.scot/media/2850/transport-use-health-and-health-inequalities-oct2020-english.pdf 4 https://www.theguardian.com/world/ng-interactive/2020/apr/27/the-traffic-data-that-shows-the-road-into-and-out-of-covid-19-lockdown
Research Findings
Home Working – Socio-Economic Analysis
15
Figure 2-2: Traffic Index for Shanghai (2019 vs 2020)4 (Source: TomTom)
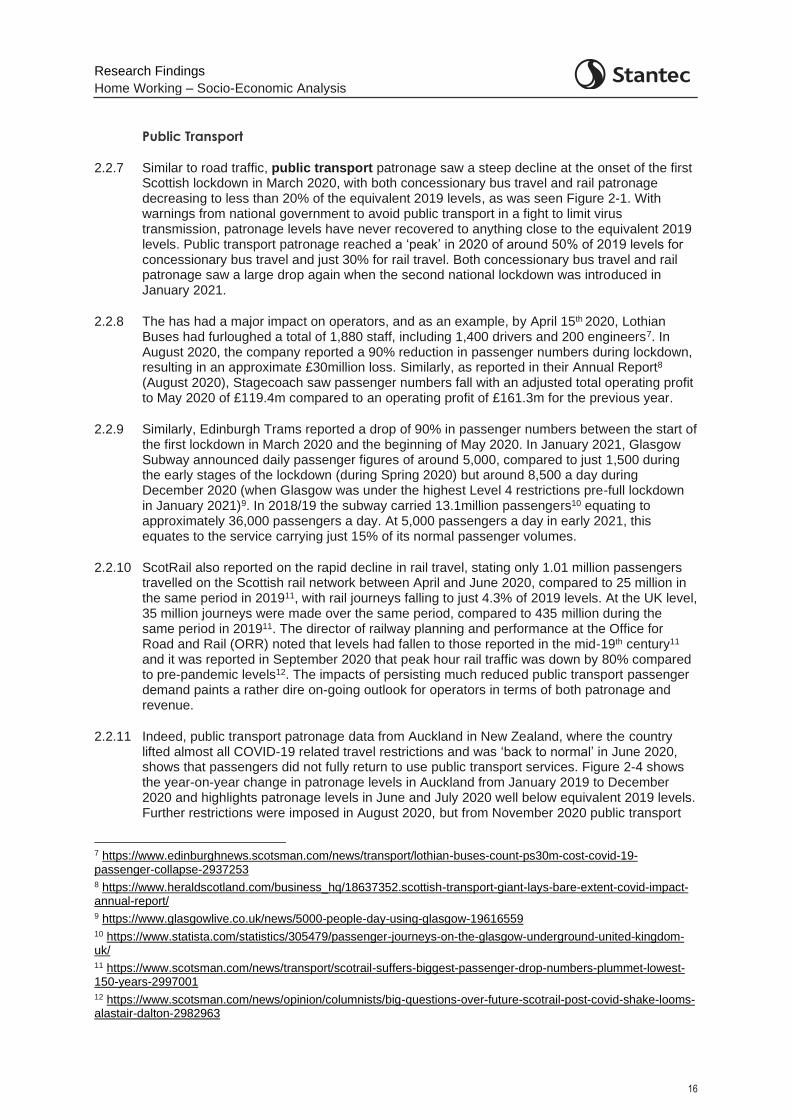
2.2.6 Traffic count data for Auckland in New Zealand indicates traffic returning to near 2019 levels in October, November and December 20205,6 when many of the nation’s lockdown restrictions were lifted, as presented in Figure 2-3.
Figure 2-3: Traffic Index for Auckland (2019 vs 2020)6 (Source: Stats NZ)
5 https://www.tomtom.com/en_gb/traffic-index/auckland-traffic/ 6 https://www.stats.govt.nz/experimental/covid-19-data-portal
Research Findings
Home Working – Socio-Economic Analysis
16
Public Transport
2.2.7 Similar to road traffic, public transport patronage saw a steep decline at the onset of the first Scottish lockdown in March 2020, with both concessionary bus travel and rail patronage decreasing to less than 20% of the equivalent 2019 levels, as was seen Figure 2-1. With warnings from national government to avoid public transport in a fight to limit virus transmission, patronage levels have never recovered to anything close to the equivalent 2019 levels. Public transport patronage reached a ‘peak’ in 2020 of around 50% of 2019 levels for concessionary bus travel and just 30% for rail travel. Both concessionary bus travel and rail patronage saw a large drop again when the second national lockdown was introduced in January 2021.
2.2.8 The has had a major impact on operators, and as an example, by April 15th 2020, Lothian Buses had furloughed a total of 1,880 staff, including 1,400 drivers and 200 engineers7. In August 2020, the company reported a 90% reduction in passenger numbers during lockdown, resulting in an approximate £30million loss. Similarly, as reported in their Annual Report8 (August 2020), Stagecoach saw passenger numbers fall with an adjusted total operating profit to May 2020 of £119.4m compared to an operating profit of £161.3m for the previous year.
2.2.9 Similarly, Edinburgh Trams reported a drop of 90% in passenger numbers between the start of the first lockdown in March 2020 and the beginning of May 2020. In January 2021, Glasgow Subway announced daily passenger figures of around 5,000, compared to just 1,500 during the early stages of the lockdown (during Spring 2020) but around 8,500 a day during December 2020 (when Glasgow was under the highest Level 4 restrictions pre-full lockdown in January 2021)9. In 2018/19 the subway carried 13.1million passengers10 equating to approximately 36,000 passengers a day. At 5,000 passengers a day in early 2021, this equates to the service carrying just 15% of its normal passenger volumes.
2.2.10 ScotRail also reported on the rapid decline in rail travel, stating only 1.01 million passengers travelled on the Scottish rail network between April and June 2020, compared to 25 million in the same period in 201911, with rail journeys falling to just 4.3% of 2019 levels. At the UK level, 35 million journeys were made over the same period, compared to 435 million during the same period in 201911. The director of railway planning and performance at the Office for Road and Rail (ORR) noted that levels had fallen to those reported in the mid-19th century11
and it was reported in September 2020 that peak hour rail traffic was down by 80% compared to pre-pandemic levels12. The impacts of persisting much reduced public transport passenger demand paints a rather dire on-going outlook for operators in terms of both patronage and revenue.
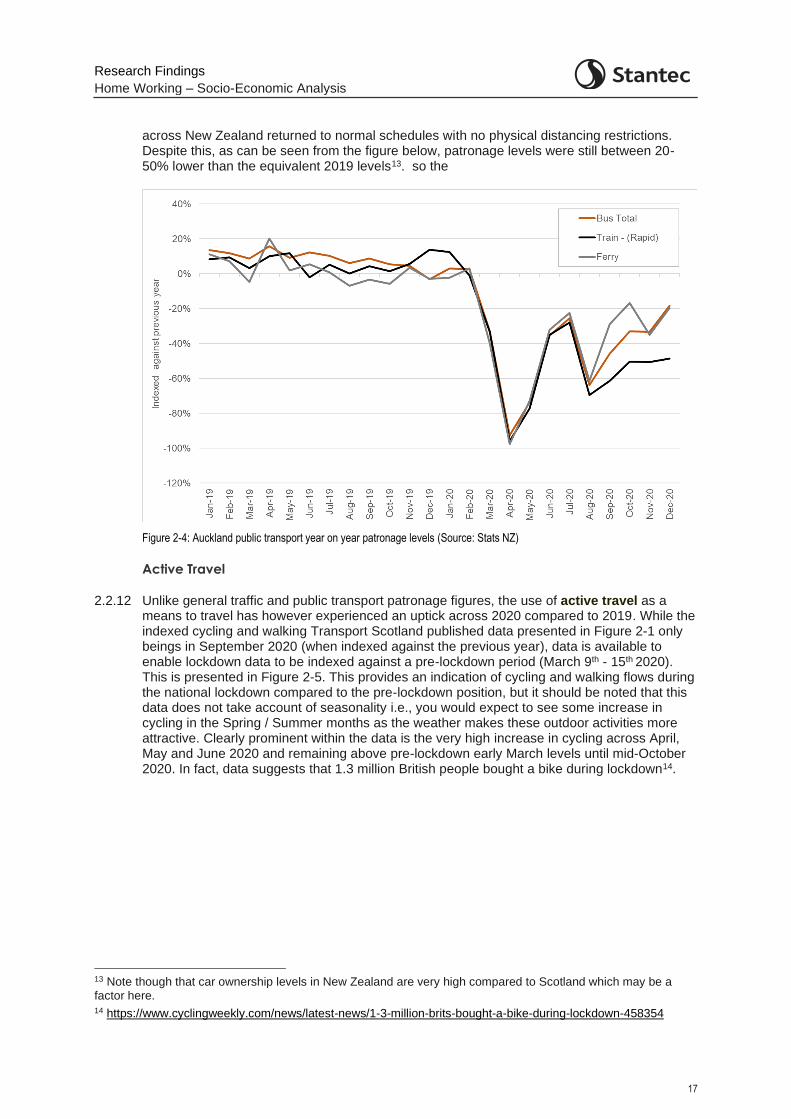
2.2.11 Indeed, public transport patronage data from Auckland in New Zealand, where the country lifted almost all COVID-19 related travel restrictions and was ‘back to normal’ in June 2020, shows that passengers did not fully return to use public transport services. Figure 2-4 shows the year-on-year change in patronage levels in Auckland from January 2019 to December 2020 and highlights patronage levels in June and July 2020 well below equivalent 2019 levels. Further restrictions were imposed in August 2020, but from November 2020 public transport
7 https://www.edinburghnews.scotsman.com/news/transport/lothian-buses-count-ps30m-cost-covid-19-passenger-collapse-2937253 8 https://www.heraldscotland.com/business_hq/18637352.scottish-transport-giant-lays-bare-extent-covid-impact-annual-report/ 9 https://www.glasgowlive.co.uk/news/5000-people-day-using-glasgow-19616559 10 https://www.statista.com/statistics/305479/passenger-journeys-on-the-glasgow-underground-united-kingdom-uk/ 11 https://www.scotsman.com/news/transport/scotrail-suffers-biggest-passenger-drop-numbers-plummet-lowest-150-years-2997001 12 https://www.scotsman.com/news/opinion/columnists/big-questions-over-future-scotrail-post-covid-shake-looms-alastair-dalton-2982963
Research Findings
Home Working – Socio-Economic Analysis
17
across New Zealand returned to normal schedules with no physical distancing restrictions. Despite this, as can be seen from the figure below, patronage levels were still between 20-50% lower than the equivalent 2019 levels13. so the
Figure 2-4: Auckland public transport year on year patronage levels (Source: Stats NZ)
Active Travel
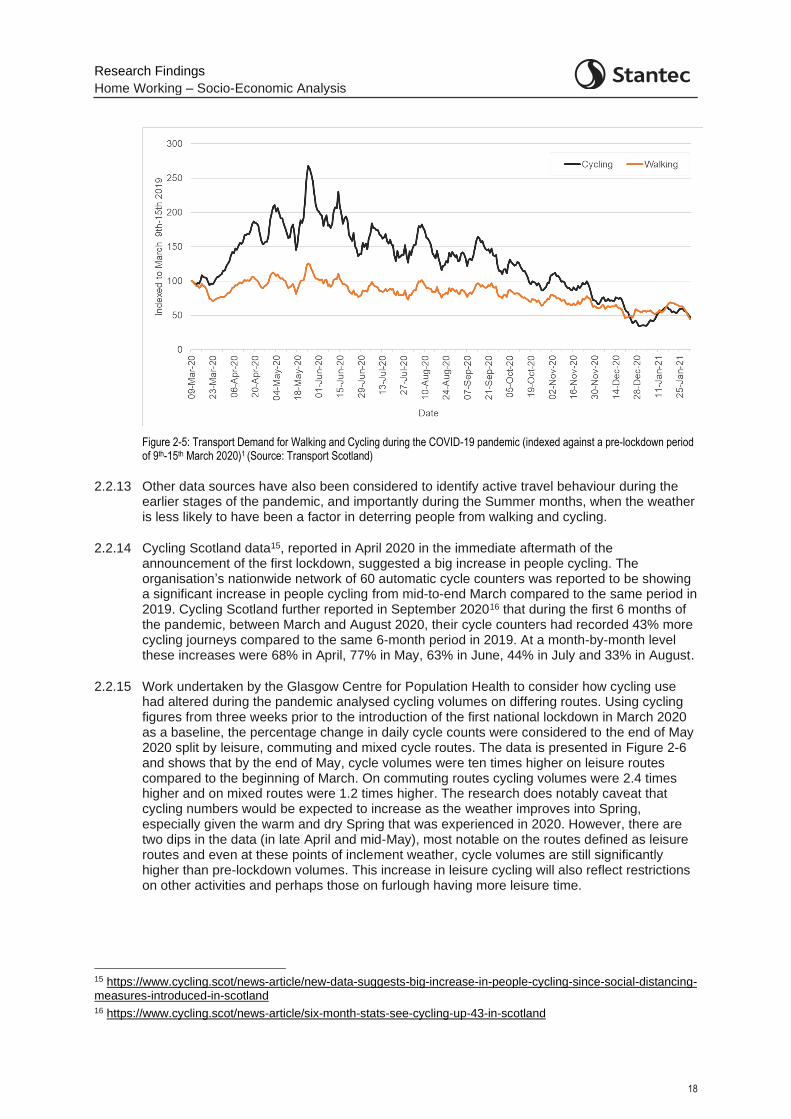
2.2.12 Unlike general traffic and public transport patronage figures, the use of active travel as a means to travel has however experienced an uptick across 2020 compared to 2019. While the indexed cycling and walking Transport Scotland published data presented in Figure 2-1 only beings in September 2020 (when indexed against the previous year), data is available to enable lockdown data to be indexed against a pre-lockdown period (March 9th - 15th 2020). This is presented in Figure 2-5. This provides an indication of cycling and walking flows during the national lockdown compared to the pre-lockdown position, but it should be noted that this data does not take account of seasonality i.e., you would expect to see some increase in cycling in the Spring / Summer months as the weather makes these outdoor activities more attractive. Clearly prominent within the data is the very high increase in cycling across April, May and June 2020 and remaining above pre-lockdown early March levels until mid-October 2020. In fact, data suggests that 1.3 million British people bought a bike during lockdown14.
13 Note though that car ownership levels in New Zealand are very high compared to Scotland which may be a factor here. 14 https://www.cyclingweekly.com/news/latest-news/1-3-million-brits-bought-a-bike-during-lockdown-458354
Research Findings
Home Working – Socio-Economic Analysis
18
Figure 2-5: Transport Demand for Walking and Cycling during the COVID-19 pandemic (indexed against a pre-lockdown period of 9th-15th March 2020)1 (Source: Transport Scotland)
2.2.13 Other data sources have also been considered to identify active travel behaviour during the earlier stages of the pandemic, and importantly during the Summer months, when the weather is less likely to have been a factor in deterring people from walking and cycling.
2.2.14 Cycling Scotland data15, reported in April 2020 in the immediate aftermath of the announcement of the first lockdown, suggested a big increase in people cycling. The organisation’s nationwide network of 60 automatic cycle counters was reported to be showing a significant increase in people cycling from mid-to-end March compared to the same period in 2019. Cycling Scotland further reported in September 202016 that during the first 6 months of the pandemic, between March and August 2020, their cycle counters had recorded 43% more cycling journeys compared to the same 6-month period in 2019. At a month-by-month level these increases were 68% in April, 77% in May, 63% in June, 44% in July and 33% in August.
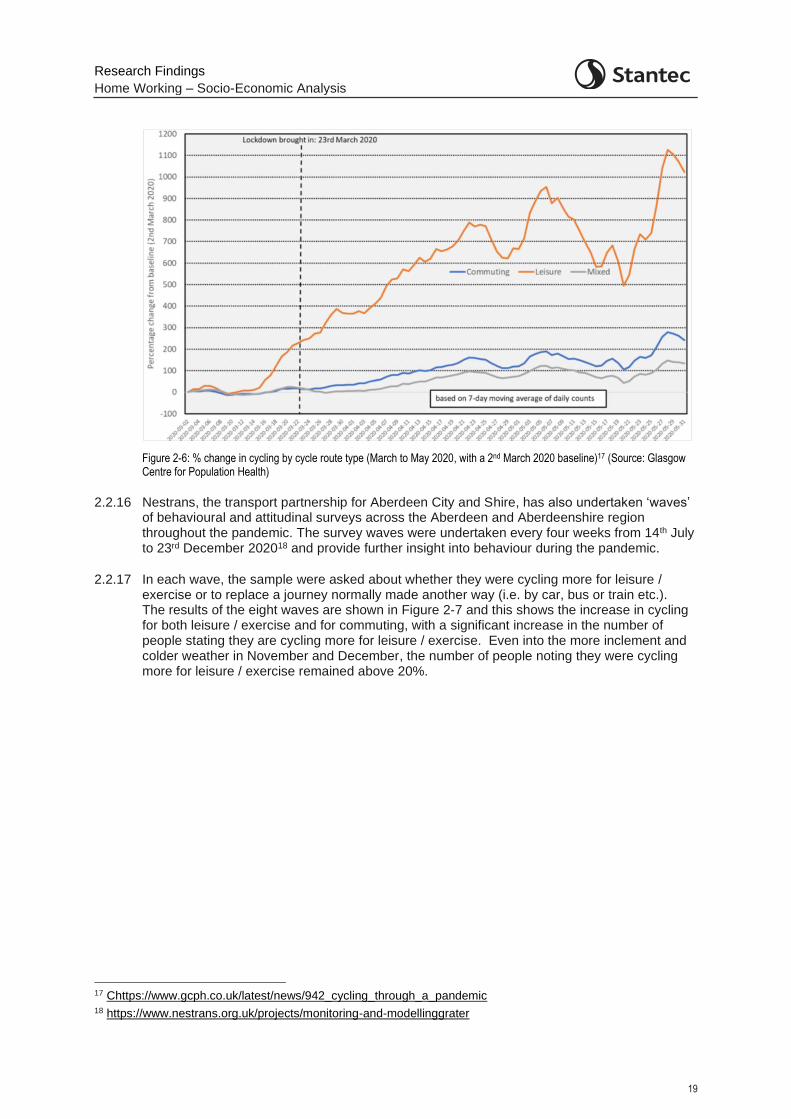
2.2.15 Work undertaken by the Glasgow Centre for Population Health to consider how cycling use had altered during the pandemic analysed cycling volumes on differing routes. Using cycling figures from three weeks prior to the introduction of the first national lockdown in March 2020 as a baseline, the percentage change in daily cycle counts were considered to the end of May 2020 split by leisure, commuting and mixed cycle routes. The data is presented in Figure 2-6 and shows that by the end of May, cycle volumes were ten times higher on leisure routes compared to the beginning of March. On commuting routes cycling volumes were 2.4 times higher and on mixed routes were 1.2 times higher. The research does notably caveat that cycling numbers would be expected to increase as the weather improves into Spring, especially given the warm and dry Spring that was experienced in 2020. However, there are two dips in the data (in late April and mid-May), most notable on the routes defined as leisure routes and even at these points of inclement weather, cycle volumes are still significantly higher than pre-lockdown volumes. This increase in leisure cycling will also reflect restrictions on other activities and perhaps those on furlough having more leisure time.
15 https://www.cycling.scot/news-article/new-data-suggests-big-increase-in-people-cycling-since-social-distancing-measures-introduced-in-scotland 16 https://www.cycling.scot/news-article/six-month-stats-see-cycling-up-43-in-scotland
Research Findings
Home Working – Socio-Economic Analysis
19
Figure 2-6: % change in cycling by cycle route type (March to May 2020, with a 2nd March 2020 baseline)17 (Source: Glasgow Centre for Population Health)
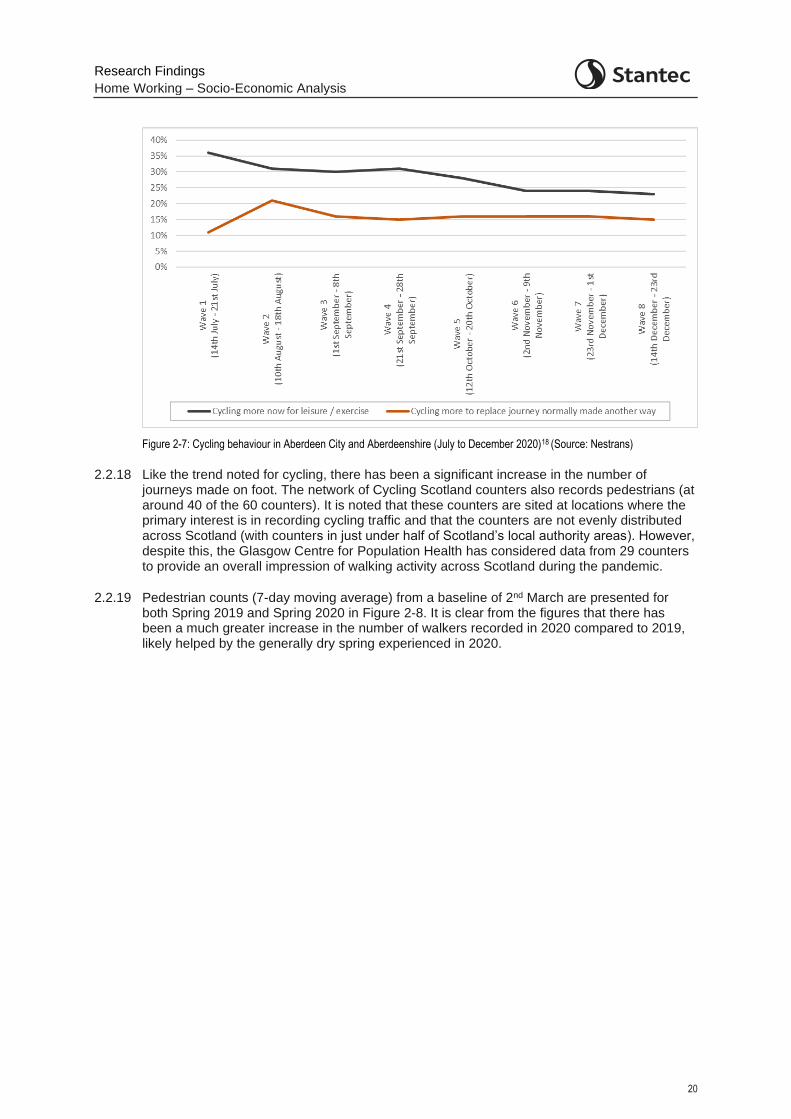
2.2.16 Nestrans, the transport partnership for Aberdeen City and Shire, has also undertaken ‘waves’ of behavioural and attitudinal surveys across the Aberdeen and Aberdeenshire region throughout the pandemic. The survey waves were undertaken every four weeks from 14th July to 23rd December 202018 and provide further insight into behaviour during the pandemic.
2.2.17 In each wave, the sample were asked about whether they were cycling more for leisure / exercise or to replace a journey normally made another way (i.e. by car, bus or train etc.). The results of the eight waves are shown in Figure 2-7 and this shows the increase in cycling for both leisure / exercise and for commuting, with a significant increase in the number of people stating they are cycling more for leisure / exercise. Even into the more inclement and colder weather in November and December, the number of people noting they were cycling more for leisure / exercise remained above 20%.
17 Chttps://www.gcph.co.uk/latest/news/942_cycling_through_a_pandemic 18 https://www.nestrans.org.uk/projects/monitoring-and-modellinggrater
Research Findings
Home Working – Socio-Economic Analysis
20
Figure 2-7: Cycling behaviour in Aberdeen City and Aberdeenshire (July to December 2020)18 (Source: Nestrans)
2.2.18 Like the trend noted for cycling, there has been a significant increase in the number of journeys made on foot. The network of Cycling Scotland counters also records pedestrians (at around 40 of the 60 counters). It is noted that these counters are sited at locations where the primary interest is in recording cycling traffic and that the counters are not evenly distributed across Scotland (with counters in just under half of Scotland’s local authority areas). However, despite this, the Glasgow Centre for Population Health has considered data from 29 counters to provide an overall impression of walking activity across Scotland during the pandemic.
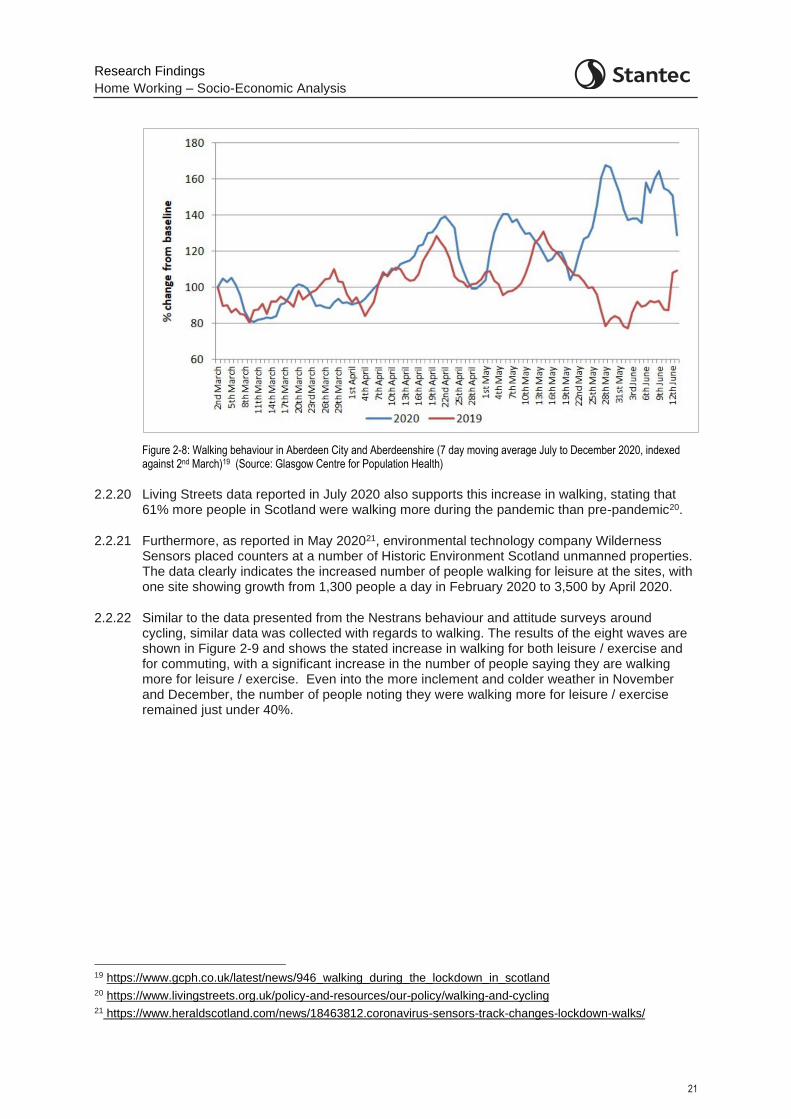
2.2.19 Pedestrian counts (7-day moving average) from a baseline of 2nd March are presented for both Spring 2019 and Spring 2020 in Figure 2-8. It is clear from the figures that there has been a much greater increase in the number of walkers recorded in 2020 compared to 2019, likely helped by the generally dry spring experienced in 2020.
Research Findings
Home Working – Socio-Economic Analysis
21
Figure 2-8: Walking behaviour in Aberdeen City and Aberdeenshire (7 day moving average July to December 2020, indexed against 2nd March)19 (Source: Glasgow Centre for Population Health)
2.2.20 Living Streets data reported in July 2020 also supports this increase in walking, stating that 61% more people in Scotland were walking more during the pandemic than pre-pandemic20.
2.2.21 Furthermore, as reported in May 202021, environmental technology company Wilderness Sensors placed counters at a number of Historic Environment Scotland unmanned properties. The data clearly indicates the increased number of people walking for leisure at the sites, with one site showing growth from 1,300 people a day in February 2020 to 3,500 by April 2020.
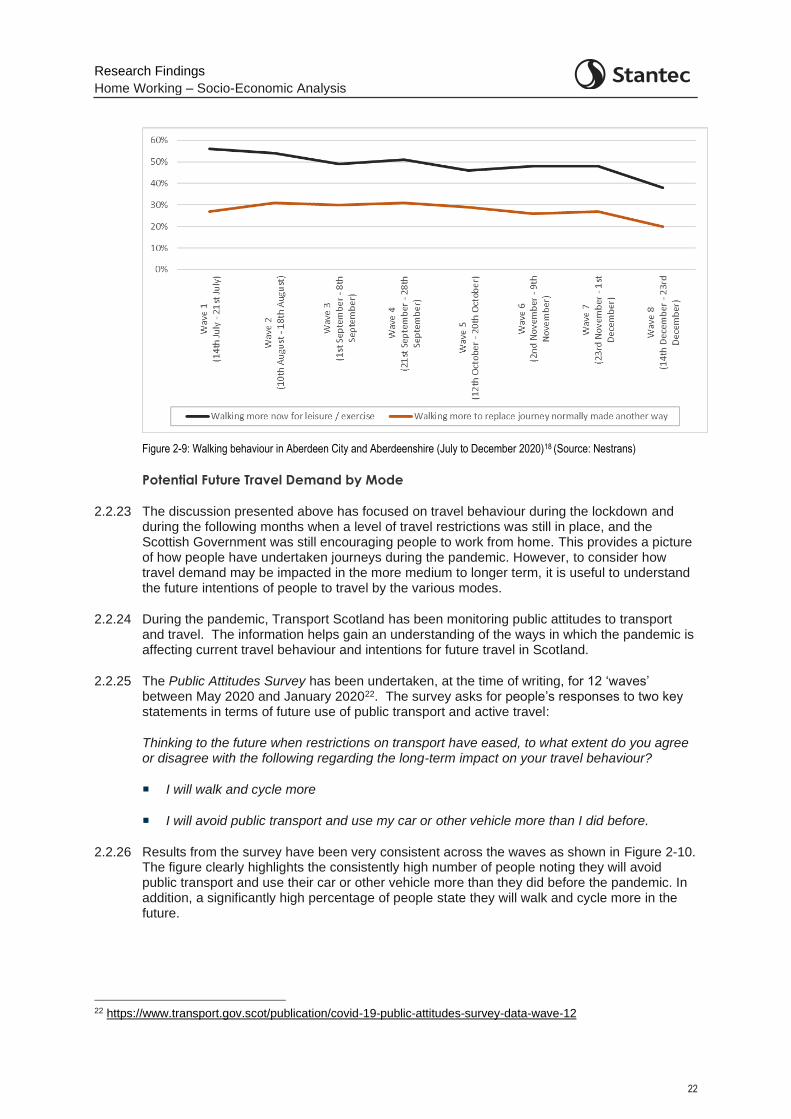
2.2.22 Similar to the data presented from the Nestrans behaviour and attitude surveys around cycling, similar data was collected with regards to walking. The results of the eight waves are shown in Figure 2-9 and shows the stated increase in walking for both leisure / exercise and for commuting, with a significant increase in the number of people saying they are walking more for leisure / exercise. Even into the more inclement and colder weather in November and December, the number of people noting they were walking more for leisure / exercise remained just under 40%.
19 https://www.gcph.co.uk/latest/news/946_walking_during_the_lockdown_in_scotland 20 https://www.livingstreets.org.uk/policy-and-resources/our-policy/walking-and-cycling 21 https://www.heraldscotland.com/news/18463812.coronavirus-sensors-track-changes-lockdown-walks/
Research Findings
Home Working – Socio-Economic Analysis
22
Figure 2-9: Walking behaviour in Aberdeen City and Aberdeenshire (July to December 2020)18 (Source: Nestrans)
Potential Future Travel Demand by Mode
2.2.23 The discussion presented above has focused on travel behaviour during the lockdown and during the following months when a level of travel restrictions was still in place, and the Scottish Government was still encouraging people to work from home. This provides a picture of how people have undertaken journeys during the pandemic. However, to consider how travel demand may be impacted in the more medium to longer term, it is useful to understand the future intentions of people to travel by the various modes.
2.2.24 During the pandemic, Transport Scotland has been monitoring public attitudes to transport and travel. The information helps gain an understanding of the ways in which the pandemic is affecting current travel behaviour and intentions for future travel in Scotland.
2.2.25 The Public Attitudes Survey has been undertaken, at the time of writing, for 12 ‘waves’ between May 2020 and January 202022. The survey asks for people’s responses to two key statements in terms of future use of public transport and active travel:
Thinking to the future when restrictions on transport have eased, to what extent do you agree or disagree with the following regarding the long-term impact on your travel behaviour?
I will walk and cycle more
I will avoid public transport and use my car or other vehicle more than I did before.
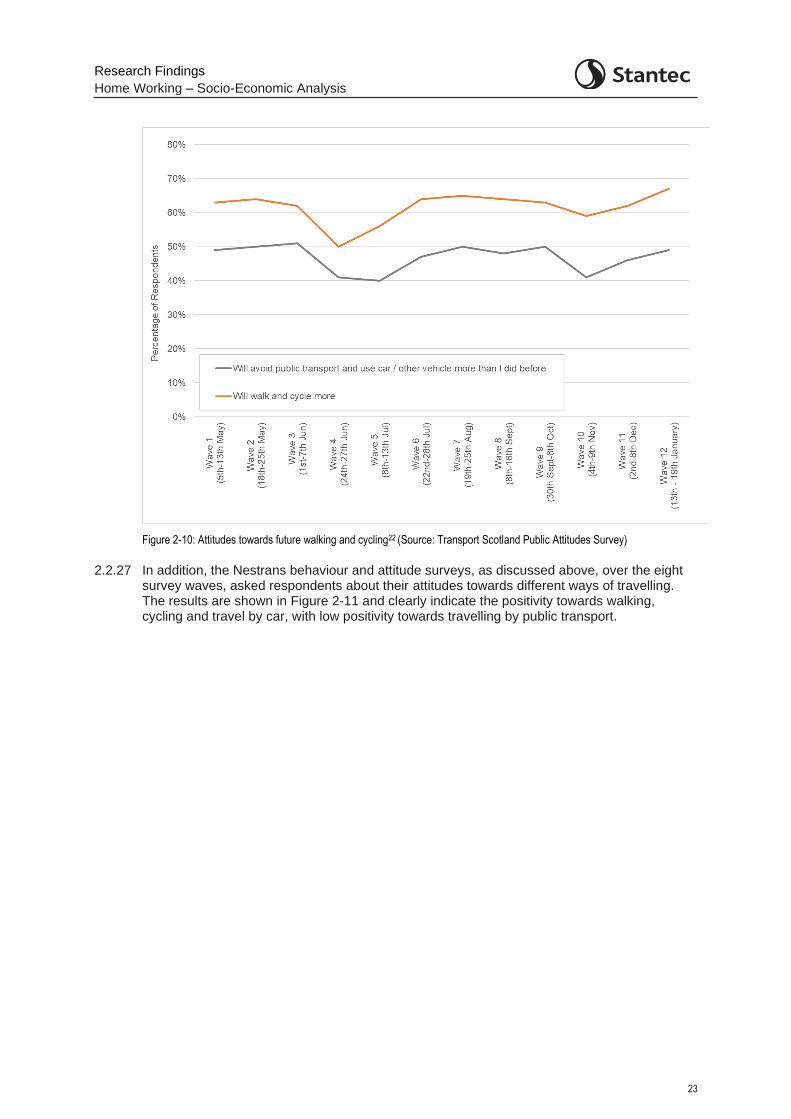
2.2.26 Results from the survey have been very consistent across the waves as shown in Figure 2-10. The figure clearly highlights the consistently high number of people noting they will avoid public transport and use their car or other vehicle more than they did before the pandemic. In addition, a significantly high percentage of people state they will walk and cycle more in the future.
22 https://www.transport.gov.scot/publication/covid-19-public-attitudes-survey-data-wave-12
Research Findings
Home Working – Socio-Economic Analysis
23
Figure 2-10: Attitudes towards future walking and cycling22 (Source: Transport Scotland Public Attitudes Survey)
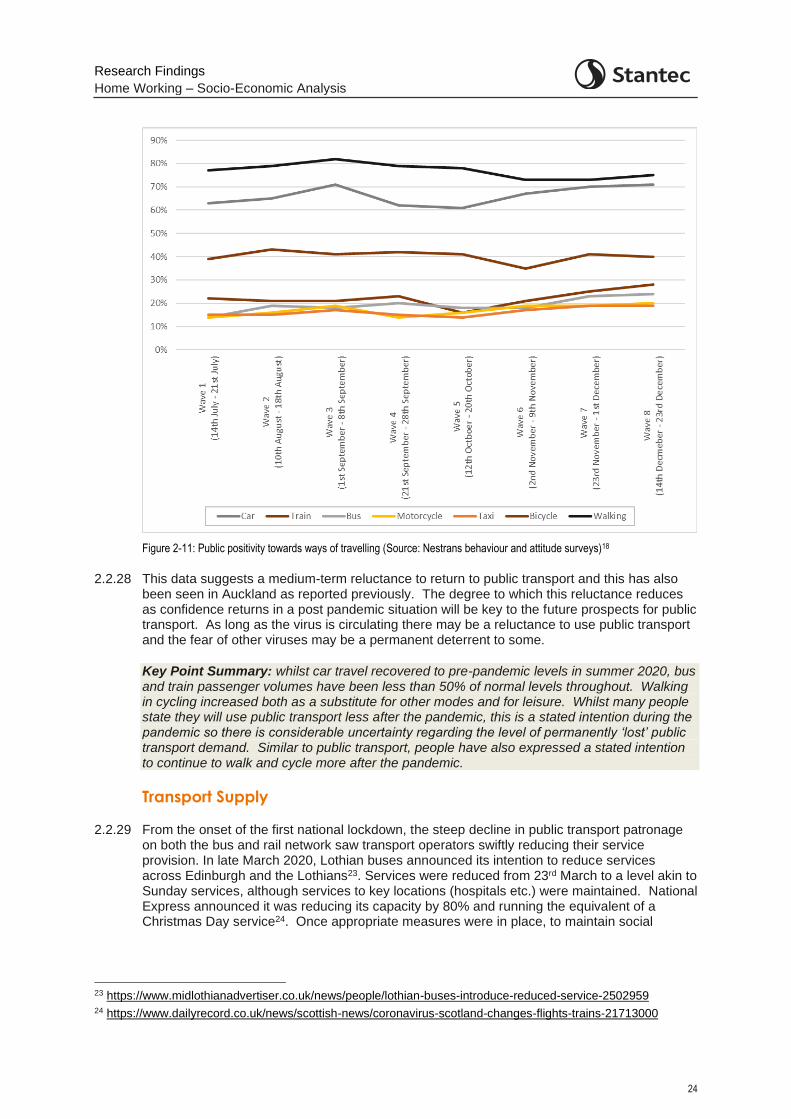
2.2.27 In addition, the Nestrans behaviour and attitude surveys, as discussed above, over the eight survey waves, asked respondents about their attitudes towards different ways of travelling. The results are shown in Figure 2-11 and clearly indicate the positivity towards walking, cycling and travel by car, with low positivity towards travelling by public transport.
Research Findings
Home Working – Socio-Economic Analysis
24
Figure 2-11: Public positivity towards ways of travelling (Source: Nestrans behaviour and attitude surveys)18
2.2.28 This data suggests a medium-term reluctance to return to public transport and this has also been seen in Auckland as reported previously. The degree to which this reluctance reduces as confidence returns in a post pandemic situation will be key to the future prospects for public transport. As long as the virus is circulating there may be a reluctance to use public transport and the fear of other viruses may be a permanent deterrent to some.
Key Point Summary: whilst car travel recovered to pre-pandemic levels in summer 2020, bus and train passenger volumes have been less than 50% of normal levels throughout. Walking in cycling increased both as a substitute for other modes and for leisure. Whilst many people state they will use public transport less after the pandemic, this is a stated intention during the pandemic so there is considerable uncertainty regarding the level of permanently ‘lost’ public transport demand. Similar to public transport, people have also expressed a stated intention to continue to walk and cycle more after the pandemic.
Transport Supply
2.2.29 From the onset of the first national lockdown, the steep decline in public transport patronage on both the bus and rail network saw transport operators swiftly reducing their service provision. In late March 2020, Lothian buses announced its intention to reduce services across Edinburgh and the Lothians23. Services were reduced from 23rd March to a level akin to Sunday services, although services to key locations (hospitals etc.) were maintained. National Express announced it was reducing its capacity by 80% and running the equivalent of a Christmas Day service24. Once appropriate measures were in place, to maintain social
23 https://www.midlothianadvertiser.co.uk/news/people/lothian-buses-introduce-reduced-service-2502959 24 https://www.dailyrecord.co.uk/news/scottish-news/coronavirus-scotland-changes-flights-trains-21713000
Research Findings
Home Working – Socio-Economic Analysis
25
distancing on buses, most operators were only able to operate at around 50% capacity or less but given the patronage this did not represent a constraint on travel.
2.2.30 In July 2020, West Lothian Council reported on the long-term consequences for bus services in West Lothian as commercial operators looked at survival plans25. It was noted that the main commercial operators in the local authority area had cut services. In the same month, Stagecoach reported it was planning job cuts to provide £9m of savings, amid predictions that bus passenger reductions would continue in the long term26. The company noted they were running around 80% of the daily miles before the pandemic and it was operating unprofitable services with government support to ensure suitable connectivity for key workers.
2.2.31 In October 2020, the Scottish Transport Secretary announced a further £52.6m to cover lost bus operator income between November 2020 and January 2021. This was in addition to support up to June 2020 and meaning a total of £109.7m of funding has been allocated to operators. In addition, Edinburgh Tram and Glasgow Subway have27 received funding to help them continue to run services.
2.2.32 Responding to the March 2020 lockdown, ScotRail reduced services to a near Sunday service with some additional first and last trains for key workers but with reduced off peak passenger services25. As lockdown eased over the Summer of 2020, from August 23rd, ScotRail was running 90% of its normal services28. However, as restrictions were tightened again in Winter 2020, ScotRail announced that from December 13th they would be reducing service frequencies again to 81% of pre-COVID operational levels29. This was further reduced in February 2021 when ScotRail announced the number of trains running in Scotland would be reduced to 65% of pre-pandemic levels30. Additionally, from 27th December 2020 until late March 2021, Caledonian Sleeper services to Fort William and Aberdeen were cancelled completely31.
2.2.33 Conversely, given the increase in active travel during the pandemic, and the need for local authorities to provide street-spaces which enable people to socially distance, many local authorities applied for Scottish Government ‘Spaces for People’ funding (reallocated funding from the ‘Places for Everyone’ budget). The £10m pop-up active travel infrastructure fund, provided full funding for pop-up walking and cycling routes or temporary improvement to existing routes, such as widened pavement and cycle lanes. Many of these schemes saw road space being reallocated to cyclists and pedestrians. In September 2020, the Scottish Government committed to £500m in active travel funding over the next five years, noting the funding could support local authorities in making some of the temporary changes permanent where appropriate32.
Key Point Summary: in line with reductions in demand, public transport services have been scaled back during the pandemic. There has been considerable additional government support to bus, rail and ferry operators during this period. The ‘Spaces for People’ programme in response to the pandemic has seen significant changes in towns and cities to roadspace
25 https://www.dailyrecord.co.uk/news/local-news/covid-19-lockdown-long-term-22333665 services - Daily Record 26 https://www.theguardian.com/business/2020/jul/22/stagecoach-plans-job-cuts-and-predicts-bus-passenger-reduction-is-long-term 27 https://www.insider.co.uk/news/bus-operators-share-52m-costs-22844348 crisis - Business Insider 28 https://www.bbc.com/news/uk-scotland-scotland-business-53567449 29 https://www.edinburghnews.scotsman.com/news/transport/scotrail-cut-hundreds-trains-day-passenger-slump-continues-3031563 30 Chttps://www.bbc.com/news/uk-scotland-55808783 31 https://www.sleeper.scot/coronavirus-covid-19/ 32 https://www.pressandjournal.co.uk/fp/news/specials/2477590/programme-for-government-whats-next-for-active-travel-in-scotland/
Research Findings
Home Working – Socio-Economic Analysis
26
and parking. There is some uncertainty as to the public acceptability of some of these measures as we emerge from the pandemic.
2.3 Level of home working and commuting data
2.3.1 To establish the trends in home working and commuting, the present situation as well as how both employee and businesses foresee things developing post-pandemic have been considered.
Who can work from home?
2.3.2 It is first useful to consider the number of people who work in professions which may enable them to work from home and the percentage the workforce this represents.
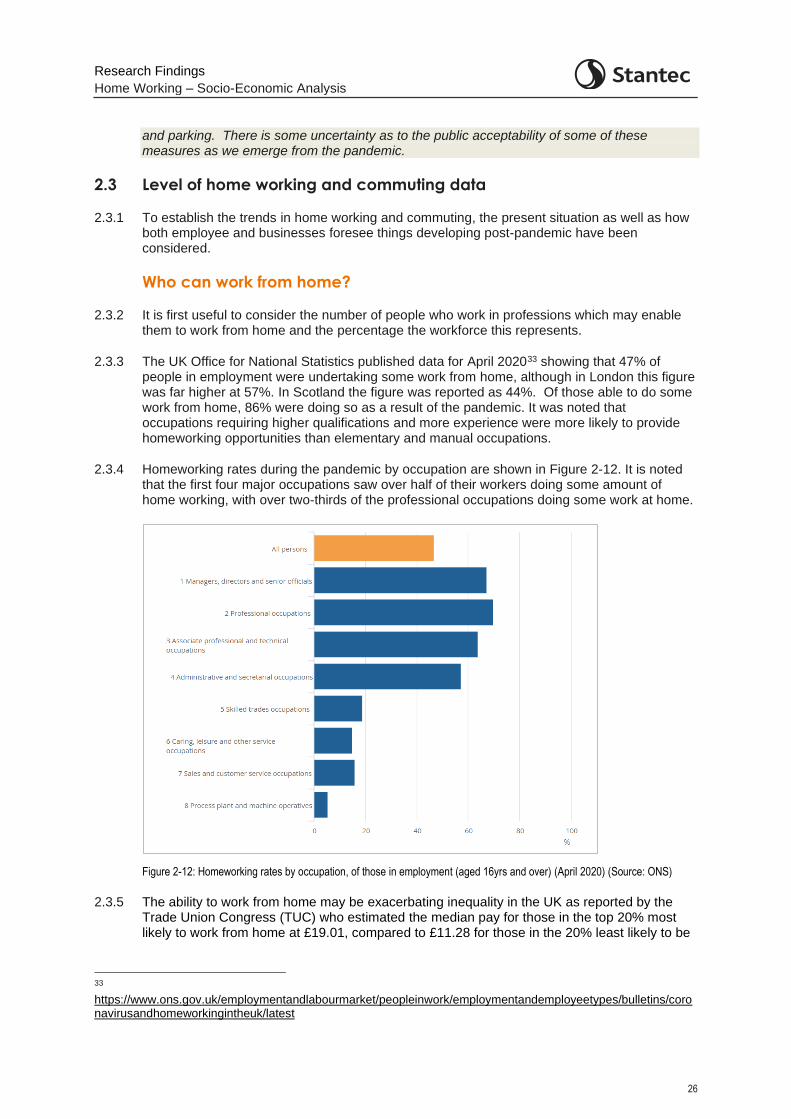
2.3.3 The UK Office for National Statistics published data for April 202033 showing that 47% of people in employment were undertaking some work from home, although in London this figure was far higher at 57%. In Scotland the figure was reported as 44%. Of those able to do some work from home, 86% were doing so as a result of the pandemic. It was noted that occupations requiring higher qualifications and more experience were more likely to provide homeworking opportunities than elementary and manual occupations.
2.3.4 Homeworking rates during the pandemic by occupation are shown in Figure 2-12. It is noted that the first four major occupations saw over half of their workers doing some amount of home working, with over two-thirds of the professional occupations doing some work at home.
Figure 2-12: Homeworking rates by occupation, of those in employment (aged 16yrs and over) (April 2020) (Source: ONS)
2.3.5 The ability to work from home may be exacerbating inequality in the UK as reported by the Trade Union Congress (TUC) who estimated the median pay for those in the top 20% most likely to work from home at £19.01, compared to £11.28 for those in the 20% least likely to be
33 https://www.ons.gov.uk/employmentandlabourmarket/peopleinwork/employmentandemployeetypes/bulletins/coronavirusandhomeworkingintheuk/latest
Research Findings
Home Working – Socio-Economic Analysis
27
able to work from home34. This is reflected in the higher figure noted above for those in London able to work from home.
2.3.6 The closure of businesses during lockdown has impacted most greatly on those in the bottom tenth of income distribution, with 80% of these people unable to work from home, with those in higher paying roles, such as managers and directors, and those in IT and business professions, mostly being able to work from home35. Younger workers and those without university level qualifications are less likely to be able to work remotely, amplifying intergenerational and other inequalities which already exist36. Additionally, women are more likely than males to be financially impacted by the pandemic37.
2.3.7 One US Department of Labour survey, in which 25,000 respondents in more than 1,000 occupations were surveyed, estimated that 97% of legal work and 77% of financial occupations could be done from home38, and that 37% of jobs which can be done from home account for 46% of all wages. These better paid jobs were also found to be geographically concentrated.
Key Point Summary: around 40-50% of UK employees have worked from home at times during the ‘forced’ conditions of the pandemic. People who can most effectively work from home are typically in higher paid occupations.
Employee Perspectives
2.3.8 While working from home has benefits for some (no commute, more time with family, more disposable income etc.), there are a range of disbenefits to both working practices and mental health.
2.3.9 In September 2020, the Chartered Institute of Personnel and Development (CIPD) published a report into the Impact of COVID-19 on working lives39. They surveyed a representative sample of the UK working population in the ‘UK Working Lives Survey’. It was found that more people attending work find that work was having a positive impact on their physical health (28%) compared to those working remotely (23%). Meanwhile, they found that 50% of those not attending work experienced a decline in their social connections, with just under half of employees believing that their mental health has worsened since the start of the pandemic (43%).
2.3.10 As noted previously, during the pandemic, Transport Scotland have been monitoring public attitudes to transport and travel to gain an understanding of the ways in which the pandemic is affecting current travel behaviour and the implications for future travel in Scotland.
2.3.11 The Public Attitudes Survey has been undertaken to date for 12 ‘waves’ between May 2020 and January 202022. The survey asks about people’s expectations of future home working:
Thinking to the future when restrictions on transport have eased, to what extent do you agree or disagree with the following regarding the long-term impact on your travel behaviour?
I expect to work from home more often in the future
34 https://www.tuc.org.uk/blogs/new-class-divide-how-covid-19-exposed-and-exacerbated-workplace-inequality-uk 35 https://blogs.imf.org/2020/07/07/teleworking-is-not-working-for-the-poor-the-young-and-the-women/ 36 https://theconversation.com/remote-work-worsens-inequality-by-mostly-helping-high-income-earners-136160 37 https://www.express.co.uk/finance/personalfinance/1280788/coronavirus-crisis-women-gender-pay-gap-UK-employment-covid19-turn2us 38 https://www.bbc.com/worklife/article/20200921-what-remote-jobs-tell-us-about-inequality 39 https://www.cipd.co.uk/knowledge/work/trends/goodwork/covid-impact
Research Findings
Home Working – Socio-Economic Analysis
28
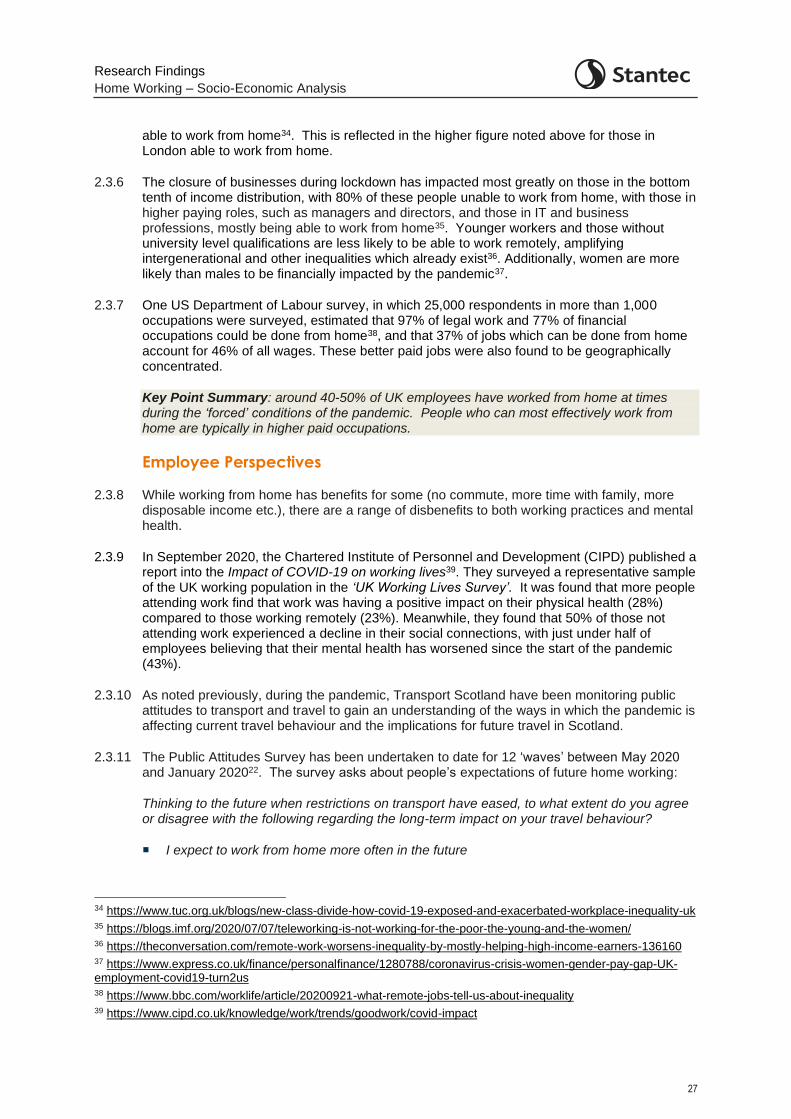
2.3.12 Results from the survey have been very consistent across the waves as shown in Figure 2-13. Note that this question was only asked from Wave 4 onwards.
Figure 2-13: Public Attitudes towards future homewokring22 (Source: Transport Scotland Public Attitudes Survey)
2.3.13 The results of the surveys clearly indicate a degree on consistency in the responses through the pandemic with just under 40% of those surveyed indicating they would expect to work from home more often in the future. It would be useful to analyse a cross tabulation of this data for home working intentions versus industry or occupation type.
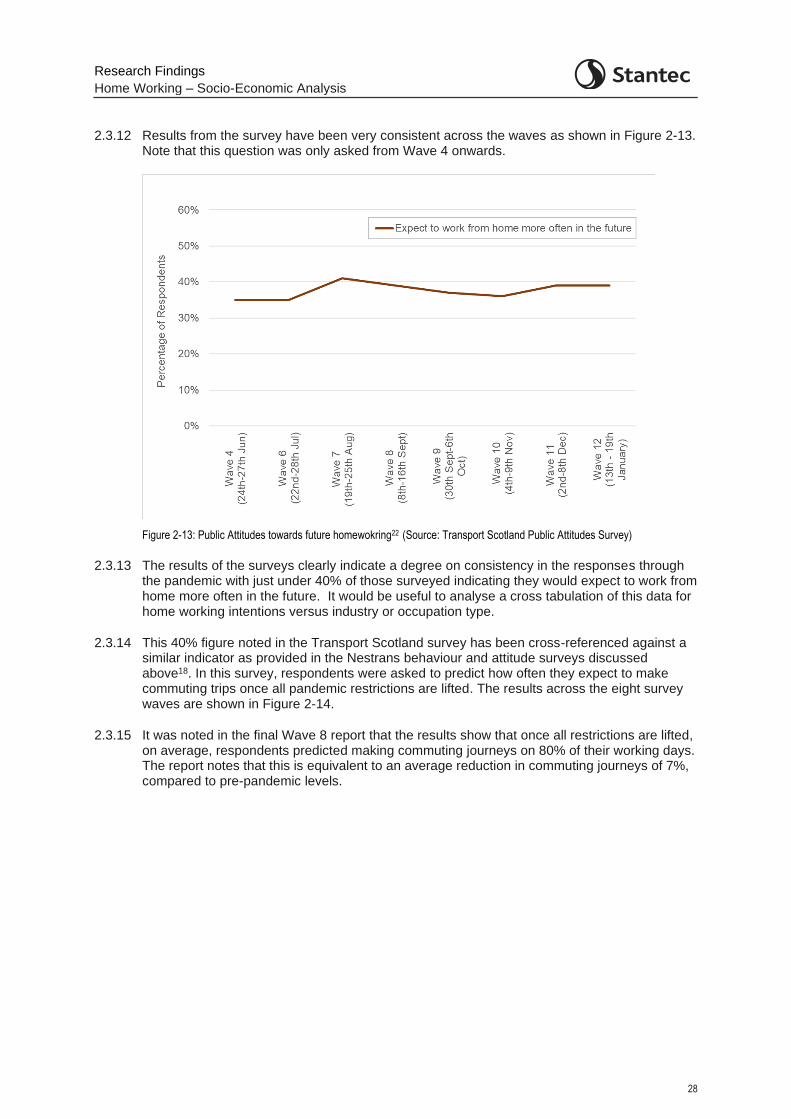
2.3.14 This 40% figure noted in the Transport Scotland survey has been cross-referenced against a similar indicator as provided in the Nestrans behaviour and attitude surveys discussed above18. In this survey, respondents were asked to predict how often they expect to make commuting trips once all pandemic restrictions are lifted. The results across the eight survey waves are shown in Figure 2-14.
2.3.15 It was noted in the final Wave 8 report that the results show that once all restrictions are lifted, on average, respondents predicted making commuting journeys on 80% of their working days. The report notes that this is equivalent to an average reduction in commuting journeys of 7%, compared to pre-pandemic levels.
Research Findings
Home Working – Socio-Economic Analysis
29
Figure 2-14: Public Attitudes towards future homeworking – Commuting Trips (Source: Nestrans behaviour and attitude surveys)18
2.3.16 The results from the Nestrans survey clearly show a lower percentage of respondents stating they will continue to work from home post lockdown. It is however recognised that this figure will reflect, to some degree, the type of industries prevalent in the Aberdeen and Aberdeenshire region, which may be influencing the ability of people to easily work from home. This potential differing magnitude of shift to home working / reduced commuting will be reflected in the development of scenarios in Section 3.
2.3.17 A survey of London office workers found that employees want to spend an average of 2.7 days back in the office once all COVID-19 restrictions have been lifted40, with one in ten workers noting they didn’t want to go back to the office at all. Pre-pandemic, workers spent an average of 4.2 days in the office. So for this group this would imply a reduction of around 35%.
Key Point Summary: there are a range of positive and negative impacts of home working from an employee’s perspectives. In terms of the future intentions of workers, there are a range of values around the anticipated future level of home working from a number of surveys – this will reflect the exact nature of the question asked and the sample. There is no obvious consensus emerging around this figure. From an employee’s perspective there is also the uncertainty surrounding how your employer may respond and therefore what your personal options might be.
Business (Employer) Perspectives
2.3.18 Various business surveys have been undertaken throughout the pandemic to gauge business responses to the lockdown. The survey has explored the shift to homeworking by industry sector and future business intentions with regards to a medium to longer term permanent move to increased working from home.
40 http://hrnews.co.uk/unused-office-space-after-coronavirus-could-cost-london-businesses-almost-13bn/
Research Findings
Home Working – Socio-Economic Analysis
30
2.3.19 Two of these surveys have been considered in detail, one undertaken by LUC and the University of Edinburgh on behalf of Transport Scotland and ClimateXChange41, and another by the Office for National Statistics (ONS).
2.3.20 The Business Working Practices, travel and COVID-19 survey, undertaken on behalf of Transport Scotland and ClimateXChange, provides a snapshot of employers’ experience of working from home / flexible working, business travel and commuting before the COVID-19 pandemic, during the first lockdown (March – June 2020), and in the longer term.
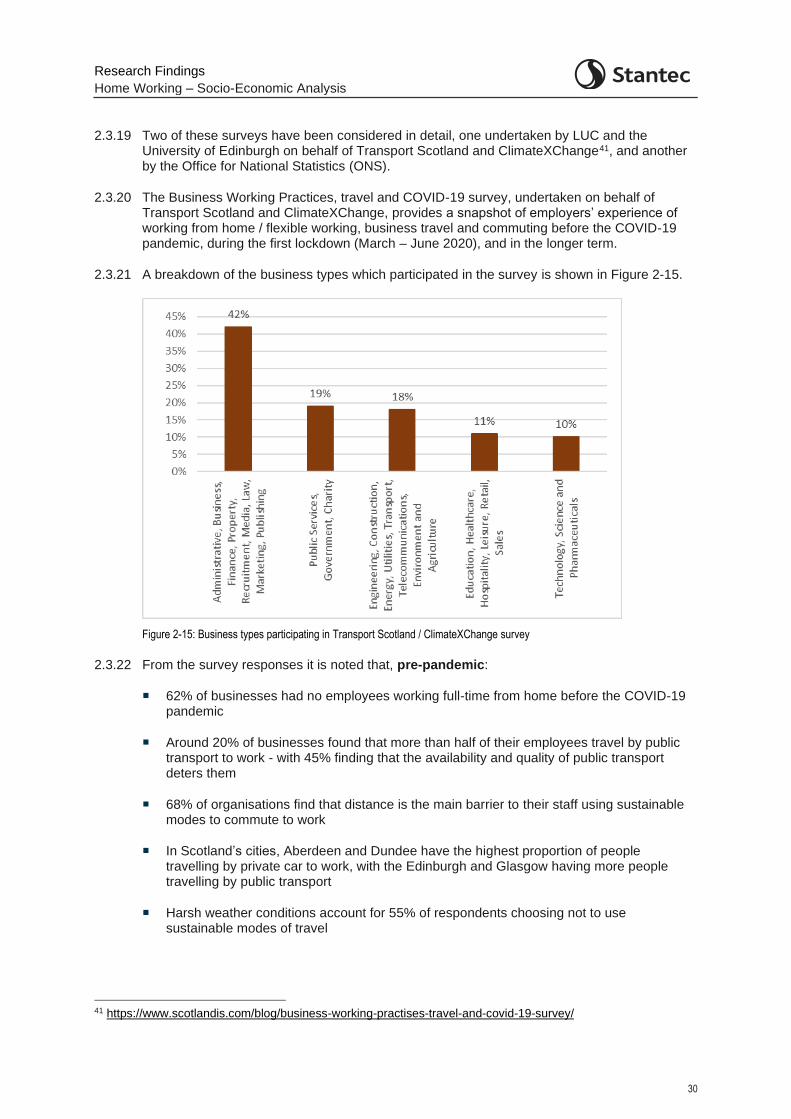
2.3.21 A breakdown of the business types which participated in the survey is shown in Figure 2-15.
Figure 2-15: Business types participating in Transport Scotland / ClimateXChange survey
2.3.22 From the survey responses it is noted that, pre-pandemic:
62% of businesses had no employees working full-time from home before the COVID-19 pandemic
Around 20% of businesses found that more than half of their employees travel by public transport to work - with 45% finding that the availability and quality of public transport deters them
68% of organisations find that distance is the main barrier to their staff using sustainable modes to commute to work
In Scotland’s cities, Aberdeen and Dundee have the highest proportion of people travelling by private car to work, with the Edinburgh and Glasgow having more people travelling by public transport
Harsh weather conditions account for 55% of respondents choosing not to use sustainable modes of travel
41 https://www.scotlandis.com/blog/business-working-practises-travel-and-covid-19-survey/
Research Findings
Home Working – Socio-Economic Analysis
31
For all sizes of organisations, distance, availability of public transport, safety of active travel and the weather are the main obstacles for sustainable travel
In terms of business travel:
o 64% of businesses reported that up to half of their meetings or conferences were conducted online, while only 2% of organisations reported 100% of their meetings were conducted online
2.3.23 During the first national lockdown (March – June 2020), survey responses indicate that:
54% of businesses had more than three quarters of their staff fully working from home
Organisations in the Public Services, Government and Charity and Technology, Science and Pharmaceuticals sectors made the most complete shift to home working
The changes in working patterns were strongest in Edinburgh while more staff were furloughed or made redundant in Glasgow
The decline in the number of people travelling to work was most noticeable in public transport and car sharing, with public transport dropping to 1%
The percentage travelling to work via active travel modes remained the same at 8%
In terms of business travel:
o Around a third of organisations saw an increase in frequency or contact with clients, with 60% of businesses being able to move to online meetings/conferences without significant problems
o 5% said they were unable to move online
In term of the potential longer term business intentions post-pandemic, the survey revealed that:
o 35% of businesses expect to have more than half their workforce partly based in the office and partly at home
o 37% of businesses are ‘very likely’ or ‘likely’ to alter the start and finish times to avoid peak travel on public transport
o 70% of the organisations are unlikely to increase car parking facilities post-pandemic - larger companies are more likely to offer more support for sustainable travel (e.g., flexible start/finish times and cycling schemes)
In terms of longer-term business intentions towards business travel:
o 80% of businesses noted they would be ‘much more/more likely’ to attend virtual events while 71% noted their intention to change client arrangements such that less travel is required
o 22% of businesses suggested they will be more likely to travel for business purposes by private car, 53% says it will remain the same, and 31% will be less likely to use private cars due to the risk of COVID-19
o 90% noted that there were benefits of in person face to face contact, which deters staff from remote meetings/conferences
In terms of continued increased home working, it was noted that:
Research Findings
Home Working – Socio-Economic Analysis
32
o Home working had a positive impact on the businesses’ carbon footprint (an 80% reduction)
o Larger companies noted they were well equipped to move their employees to home working with positive impacts on communications, both internal and external - smaller businesses also noted they experienced few barriers to home working
o The key barriers to effective home working were perceived to be working conditions and broadband/internet connections
o Businesses found a ‘very positive’ or ‘positive’ aspect of working from home was the effect on commuting costs (89%) and commuting time saving (88%)
o 30% of respondents noted a negative impact on staff finances (broadband, heating and lighting) due to working from home
o 75% of businesses reported a ‘mixed’ or ‘negative’ effect on health and wellbeing due to social isolation
o It is widely considered that those who have caring responsibilities were most disadvantaged with the move to working from home
o More than two thirds of the respondents currently encourage working from home or will do in the future
o Government incentives, such as tax relief and subsidies, was a common response theme with businesses noting that better broadband connections (especially in rural areas) is a key area where a policy response was required
o Many organisations noted they were considering the consolidation of many of their offices and a reduction in office space
2.3.24 As noted above, the ONS has also been engaging with businesses regarding homeworking and future business intentions. It has been undertaking regular survey ‘waves’ from July 2020, of the Business Impact of Coronavirus (COVID-19) Survey (BICS)42. During each wave, the survey was sent to around 40,000 UK businesses (>250 employees) and obtained around 10,000 responses (around 25% of those the survey was issued to), with the survey undertaken fortnightly. Note that in Wave 17, the sample design was refreshed to improve coverage of smaller sized businesses (<250 employees).
2.3.25 The following industries were however excluded from the survey.
Agriculture
Public administration and defence
Public provision of education and health
Finance and insurance
2.3.26 It is noted that the exclusion of finance and insurance is likely to skew the results somewhat as these industries are generally likely to have more employees able to work from home.
42 https://www.ons.gov.uk/economy/economicoutputandproductivity/output/datasets/businessinsightsandimpactontheukeconomy
Research Findings
Home Working – Socio-Economic Analysis
33
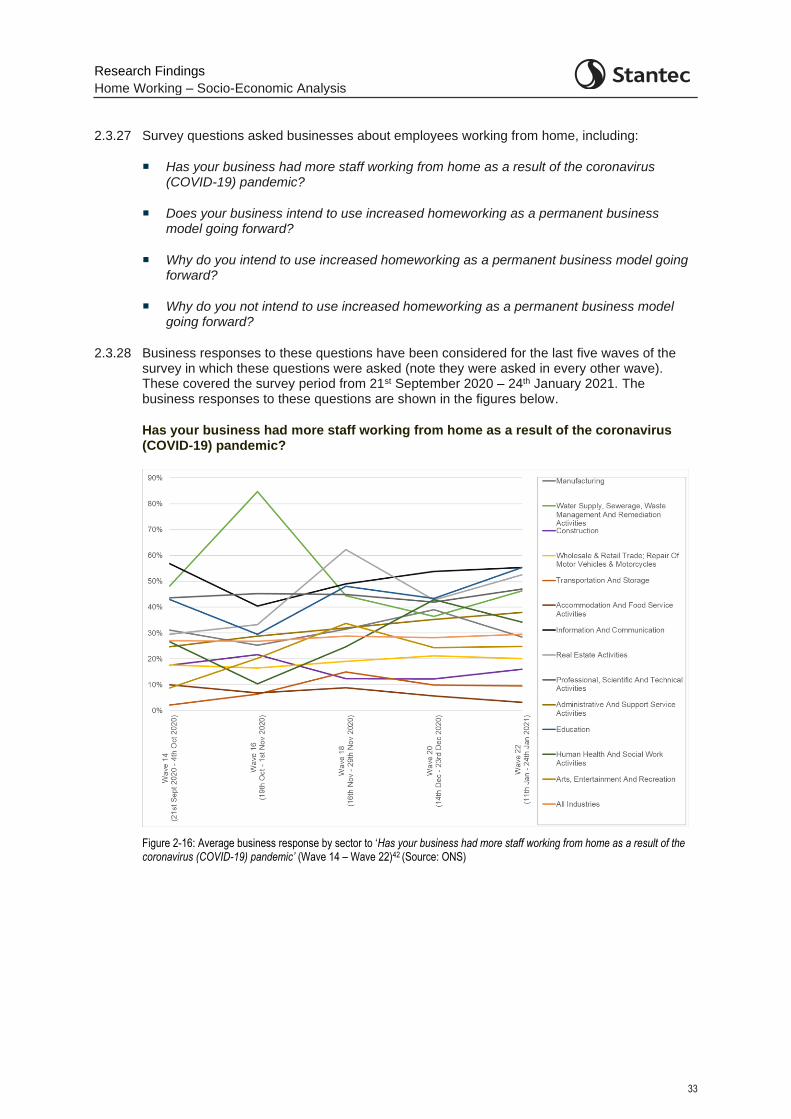
2.3.27 Survey questions asked businesses about employees working from home, including:
Has your business had more staff working from home as a result of the coronavirus (COVID-19) pandemic?
Does your business intend to use increased homeworking as a permanent business model going forward?
Why do you intend to use increased homeworking as a permanent business model going forward?
Why do you not intend to use increased homeworking as a permanent business model going forward?
2.3.28 Business responses to these questions have been considered for the last five waves of the survey in which these questions were asked (note they were asked in every other wave). These covered the survey period from 21st September 2020 – 24th January 2021. The business responses to these questions are shown in the figures below.
Has your business had more staff working from home as a result of the coronavirus (COVID-19) pandemic?
Figure 2-16: Average business response by sector to ‘Has your business had more staff working from home as a result of the coronavirus (COVID-19) pandemic’ (Wave 14 – Wave 22)42 (Source: ONS)
Research Findings
Home Working – Socio-Economic Analysis
34
Does your business intend to use increased homeworking as a permanent business model going forward?
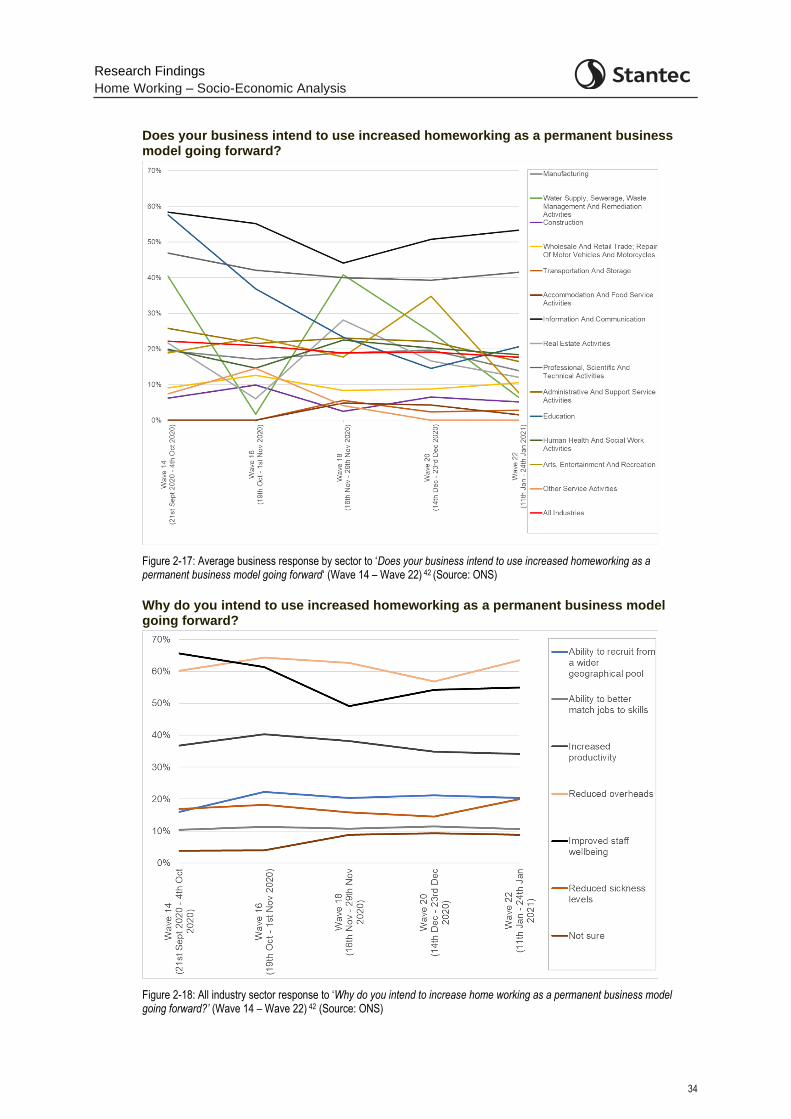
Figure 2-17: Average business response by sector to ‘Does your business intend to use increased homeworking as a permanent business model going forward‘ (Wave 14 – Wave 22) 42 (Source: ONS)
Why do you intend to use increased homeworking as a permanent business model going forward?
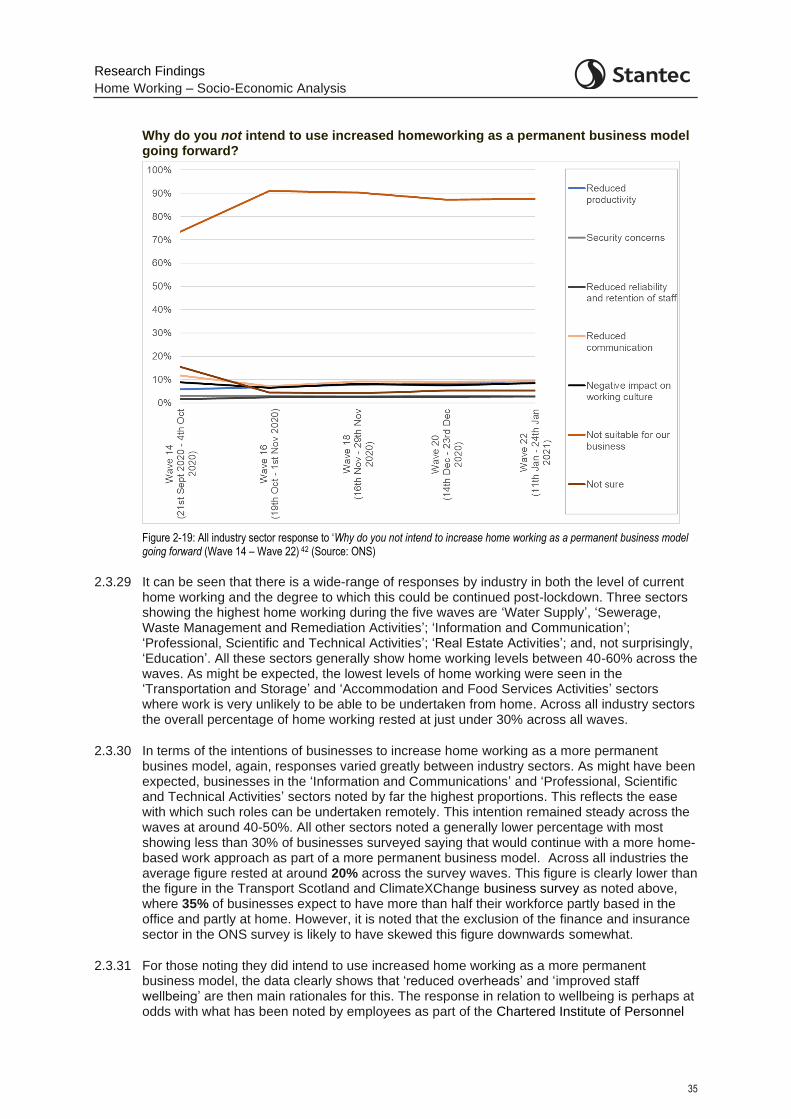
Figure 2-18: All industry sector response to ‘Why do you intend to increase home working as a permanent business model going forward?’ (Wave 14 – Wave 22) 42 (Source: ONS)
Research Findings
Home Working – Socio-Economic Analysis
35
Why do you not intend to use increased homeworking as a permanent business model going forward?
Figure 2-19: All industry sector response to ‘Why do you not intend to increase home working as a permanent business model going forward (Wave 14 – Wave 22) 42 (Source: ONS)
2.3.29 It can be seen that there is a wide-range of responses by industry in both the level of current home working and the degree to which this could be continued post-lockdown. Three sectors showing the highest home working during the five waves are ‘Water Supply’, ‘Sewerage, Waste Management and Remediation Activities’; ‘Information and Communication’; ‘Professional, Scientific and Technical Activities’; ‘Real Estate Activities’; and, not surprisingly, ‘Education’. All these sectors generally show home working levels between 40-60% across the waves. As might be expected, the lowest levels of home working were seen in the ‘Transportation and Storage’ and ‘Accommodation and Food Services Activities’ sectors where work is very unlikely to be able to be undertaken from home. Across all industry sectors the overall percentage of home working rested at just under 30% across all waves.
2.3.30 In terms of the intentions of businesses to increase home working as a more permanent busines model, again, responses varied greatly between industry sectors. As might have been expected, businesses in the ‘Information and Communications’ and ‘Professional, Scientific and Technical Activities’ sectors noted by far the highest proportions. This reflects the ease with which such roles can be undertaken remotely. This intention remained steady across the waves at around 40-50%. All other sectors noted a generally lower percentage with most showing less than 30% of businesses surveyed saying that would continue with a more home-based work approach as part of a more permanent business model. Across all industries the average figure rested at around 20% across the survey waves. This figure is clearly lower than the figure in the Transport Scotland and ClimateXChange business survey as noted above, where 35% of businesses expect to have more than half their workforce partly based in the office and partly at home. However, it is noted that the exclusion of the finance and insurance sector in the ONS survey is likely to have skewed this figure downwards somewhat.
2.3.31 For those noting they did intend to use increased home working as a more permanent business model, the data clearly shows that ‘reduced overheads’ and ‘improved staff wellbeing’ are then main rationales for this. The response in relation to wellbeing is perhaps at odds with what has been noted by employees as part of the Chartered Institute of Personnel
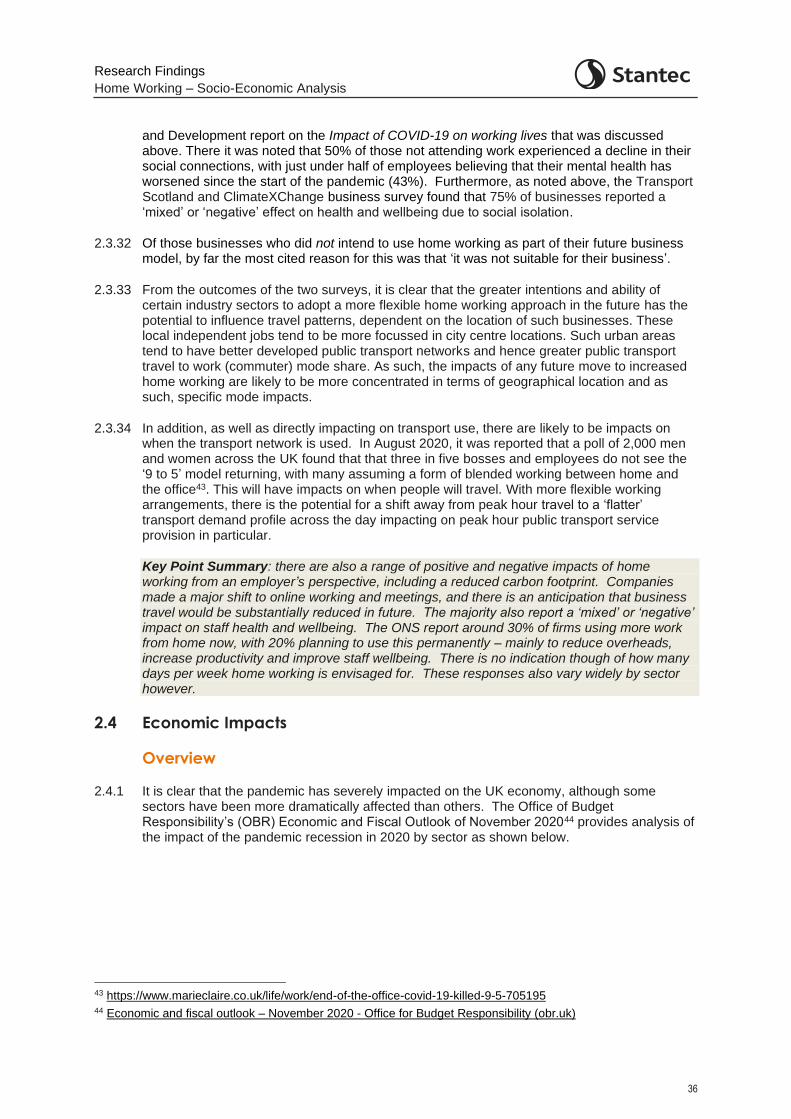
Research Findings
Home Working – Socio-Economic Analysis
36
and Development report on the Impact of COVID-19 on working lives that was discussed above. There it was noted that 50% of those not attending work experienced a decline in their social connections, with just under half of employees believing that their mental health has worsened since the start of the pandemic (43%). Furthermore, as noted above, the Transport Scotland and ClimateXChange business survey found that 75% of businesses reported a ‘mixed’ or ‘negative’ effect on health and wellbeing due to social isolation.
2.3.32 Of those businesses who did not intend to use home working as part of their future business model, by far the most cited reason for this was that ‘it was not suitable for their business’.
2.3.33 From the outcomes of the two surveys, it is clear that the greater intentions and ability of certain industry sectors to adopt a more flexible home working approach in the future has the potential to influence travel patterns, dependent on the location of such businesses. These local independent jobs tend to be more focussed in city centre locations. Such urban areas tend to have better developed public transport networks and hence greater public transport travel to work (commuter) mode share. As such, the impacts of any future move to increased home working are likely to be more concentrated in terms of geographical location and as such, specific mode impacts.
2.3.34 In addition, as well as directly impacting on transport use, there are likely to be impacts on when the transport network is used. In August 2020, it was reported that a poll of 2,000 men and women across the UK found that that three in five bosses and employees do not see the ‘9 to 5’ model returning, with many assuming a form of blended working between home and the office43. This will have impacts on when people will travel. With more flexible working arrangements, there is the potential for a shift away from peak hour travel to a ‘flatter’ transport demand profile across the day impacting on peak hour public transport service provision in particular.
Key Point Summary: there are also a range of positive and negative impacts of home working from an employer’s perspective, including a reduced carbon footprint. Companies made a major shift to online working and meetings, and there is an anticipation that business travel would be substantially reduced in future. The majority also report a ‘mixed’ or ‘negative’ impact on staff health and wellbeing. The ONS report around 30% of firms using more work from home now, with 20% planning to use this permanently – mainly to reduce overheads, increase productivity and improve staff wellbeing. There is no indication though of how many days per week home working is envisaged for. These responses also vary widely by sector however.
2.4 Economic Impacts
Overview
2.4.1 It is clear that the pandemic has severely impacted on the UK economy, although some sectors have been more dramatically affected than others. The Office of Budget Responsibility’s (OBR) Economic and Fiscal Outlook of November 202044 provides analysis of the impact of the pandemic recession in 2020 by sector as shown below.
43 https://www.marieclaire.co.uk/life/work/end-of-the-office-covid-19-killed-9-5-705195 44 Economic and fiscal outlook – November 2020 - Office for Budget Responsibility (obr.uk)
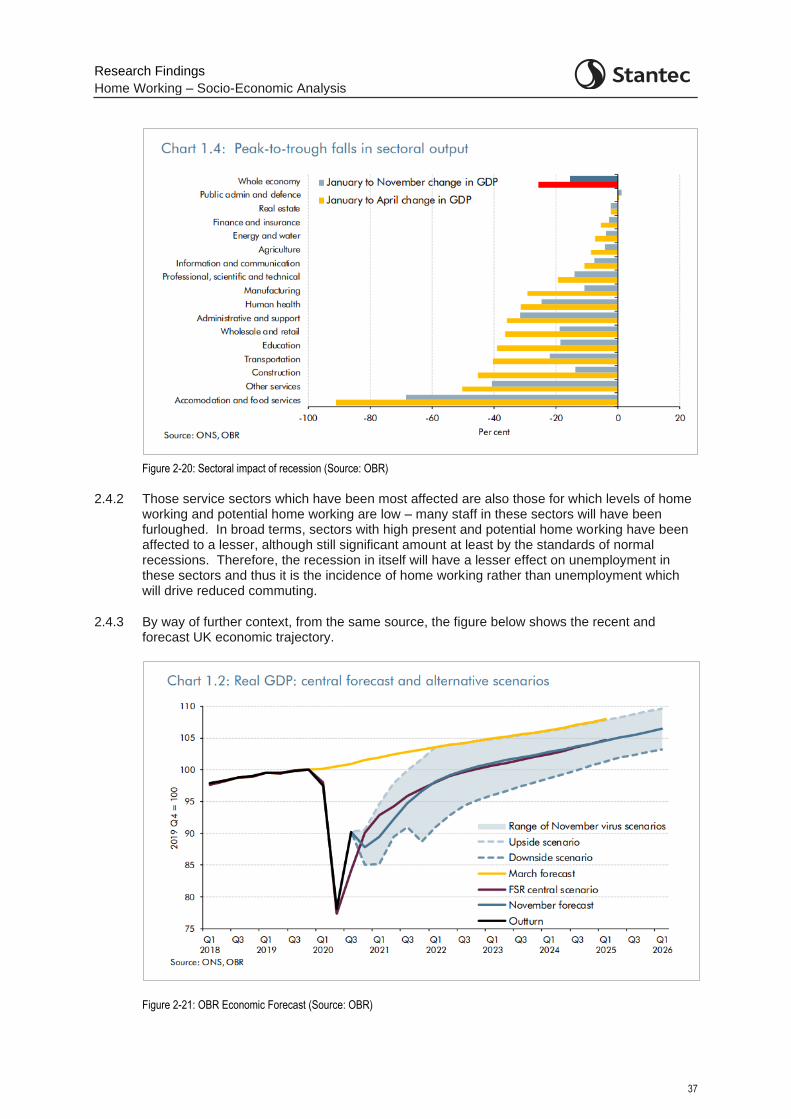
Research Findings
Home Working – Socio-Economic Analysis
37
Figure 2-20: Sectoral impact of recession (Source: OBR)
2.4.2 Those service sectors which have been most affected are also those for which levels of home working and potential home working are low – many staff in these sectors will have been furloughed. In broad terms, sectors with high present and potential home working have been affected to a lesser, although still significant amount at least by the standards of normal recessions. Therefore, the recession in itself will have a lesser effect on unemployment in these sectors and thus it is the incidence of home working rather than unemployment which will drive reduced commuting.
2.4.3 By way of further context, from the same source, the figure below shows the recent and forecast UK economic trajectory.
Figure 2-21: OBR Economic Forecast (Source: OBR)
Research Findings
Home Working – Socio-Economic Analysis
38
2.4.4 Using the central scenario, this forecast suggests that the UK economy will have recovered to pre Covid19 levels by Quarter 4 of 2022.
2.4.5 The impact of the recession has also varied geographically reflecting the sectoral mix and evidence shows that Edinburgh has not been impacted by COVID-19 as severely as other cities (due to the high number of financial businesses which have continued to work from home45). Glasgow however was hit hardest in 2020 with a 10.4% reduction in the size of the economy. It is also predicted to have one of the slowest recoveries46.
2.4.6 There are a range of potential economic impacts arising from increased home working which will differ between industry sectors based on the ability of these sectors to adapt and the impact they have already experienced due to the pandemic. There are also likely to be local economic impacts within regions where there is a strong dependence on certain sectors. Some of the key impacts are discussed here with a wider range of economic impacts (alongside social impacts) presented in the mind mapping exercise in Section 4.
Key Point Summary: the economy has been through a period unprecedented in modern history. Service industries have been particularly affected and their medium-term prospects are unclear e.g., retail. The economy is expected to return to pre-pandemic levels by Q4 2022.
Commercial Space
2.4.7 The likely maintaining of some level of increased home working across certain industry sectors will have secondary impacts beyond those directly related to travel.
2.4.8 Indeed, the sectoral and associated locational impacts of increased home working were reported in October 2020 when a survey by CBI and PwC noted that 74% of financial firms were reviewing their office space needs47. This included businesses either using office space differently or getting rid of it altogether. Indeed, it was reported in October 2020 that one third of companies are preparing to abandon their offices permanently48.
2.4.9 In Scotland specifically, the now retired CEO of Standard Life Aberdeen said he did not expect their offices to ever be at more than 40% capacity in the future. Large businesses elsewhere have also publicly stated their intention to reduce office space. In October 2020, Deloitte announced the permanent closure of four of its UK offices (Nottingham, Southampton, Gatwick and Liverpool) noting their staff will shift to permanent work-from-home contracts49. In addition, in May 2020, Twitter announced to 5,000 of its employees in the UK that they do not have to return to the office50. BT has also suggested that their call centre workers will be able to work from home from now on50, law firm Slater and Gordon have permanently closed their London office with staff working from home from Autumn 202051 and Capita has announced it is to close over one third of their offices permanently, ending over 100 office leases across the UK52.
45 https://www.scottishfinancialnews.com/article/edinburgh-survived-covid-19-impact-better-than-most-uk-cities 46 https://www.bbc.co.uk/news/uk-scotland-scotland-business-55726875 47 https://www.bbc.co.uk/news/business-54461218 48 https://standpointmag.co.uk/remote-working-will-exacerbate-inequality/ 49 https://www.businessinsider.com/deloitte-offices-covid-work-from-home-remote-working-2020-10?r=US&IR=T 50 https://www.dailymail.co.uk/news/article-8315099/Twitter-BT-make-working-home-permanent-amid-concern-demise-traditional-offices.html 51 https://www.law.com/international-edition/2020/05/27/slater-and-gordon-to-close-london-office-staff-to-work-from-home-permanently/?slreturn=20201111084911 52 https://www.bbc.com/news/business-53968213
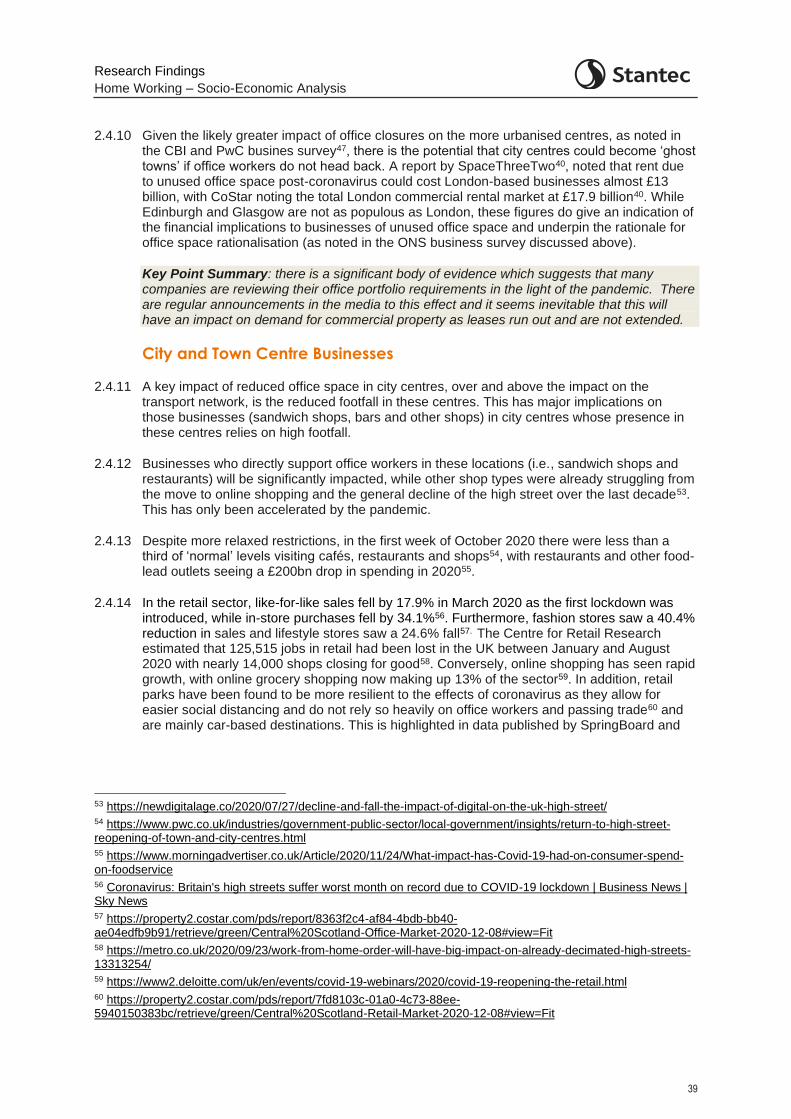
Research Findings
Home Working – Socio-Economic Analysis
39
2.4.10 Given the likely greater impact of office closures on the more urbanised centres, as noted in the CBI and PwC busines survey47, there is the potential that city centres could become ‘ghost towns’ if office workers do not head back. A report by SpaceThreeTwo40, noted that rent due to unused office space post-coronavirus could cost London-based businesses almost £13 billion, with CoStar noting the total London commercial rental market at £17.9 billion40. While Edinburgh and Glasgow are not as populous as London, these figures do give an indication of the financial implications to businesses of unused office space and underpin the rationale for office space rationalisation (as noted in the ONS business survey discussed above).
Key Point Summary: there is a significant body of evidence which suggests that many companies are reviewing their office portfolio requirements in the light of the pandemic. There are regular announcements in the media to this effect and it seems inevitable that this will have an impact on demand for commercial property as leases run out and are not extended.
City and Town Centre Businesses
2.4.11 A key impact of reduced office space in city centres, over and above the impact on the transport network, is the reduced footfall in these centres. This has major implications on those businesses (sandwich shops, bars and other shops) in city centres whose presence in these centres relies on high footfall.
2.4.12 Businesses who directly support office workers in these locations (i.e., sandwich shops and restaurants) will be significantly impacted, while other shop types were already struggling from the move to online shopping and the general decline of the high street over the last decade53. This has only been accelerated by the pandemic.
2.4.13 Despite more relaxed restrictions, in the first week of October 2020 there were less than a third of ‘normal’ levels visiting cafés, restaurants and shops54, with restaurants and other food-lead outlets seeing a £200bn drop in spending in 202055.
2.4.14 In the retail sector, like-for-like sales fell by 17.9% in March 2020 as the first lockdown was introduced, while in-store purchases fell by 34.1%56. Furthermore, fashion stores saw a 40.4% reduction in sales and lifestyle stores saw a 24.6% fall57. The Centre for Retail Research estimated that 125,515 jobs in retail had been lost in the UK between January and August 2020 with nearly 14,000 shops closing for good58. Conversely, online shopping has seen rapid growth, with online grocery shopping now making up 13% of the sector59. In addition, retail parks have been found to be more resilient to the effects of coronavirus as they allow for easier social distancing and do not rely so heavily on office workers and passing trade60 and are mainly car-based destinations. This is highlighted in data published by SpringBoard and
53 https://newdigitalage.co/2020/07/27/decline-and-fall-the-impact-of-digital-on-the-uk-high-street/ 54 https://www.pwc.co.uk/industries/government-public-sector/local-government/insights/return-to-high-street-reopening-of-town-and-city-centres.html 55 https://www.morningadvertiser.co.uk/Article/2020/11/24/What-impact-has-Covid-19-had-on-consumer-spend-on-foodservice 56 Coronavirus: Britain's high streets suffer worst month on record due to COVID-19 lockdown | Business News | Sky News 57 https://property2.costar.com/pds/report/8363f2c4-af84-4bdb-bb40-ae04edfb9b91/retrieve/green/Central%20Scotland-Office-Market-2020-12-08#view=Fit 58 https://metro.co.uk/2020/09/23/work-from-home-order-will-have-big-impact-on-already-decimated-high-streets-13313254/ 59 https://www2.deloitte.com/uk/en/events/covid-19-webinars/2020/covid-19-reopening-the-retail.html 60 https://property2.costar.com/pds/report/7fd8103c-01a0-4c73-88ee-5940150383bc/retrieve/green/Central%20Scotland-Retail-Market-2020-12-08#view=Fit
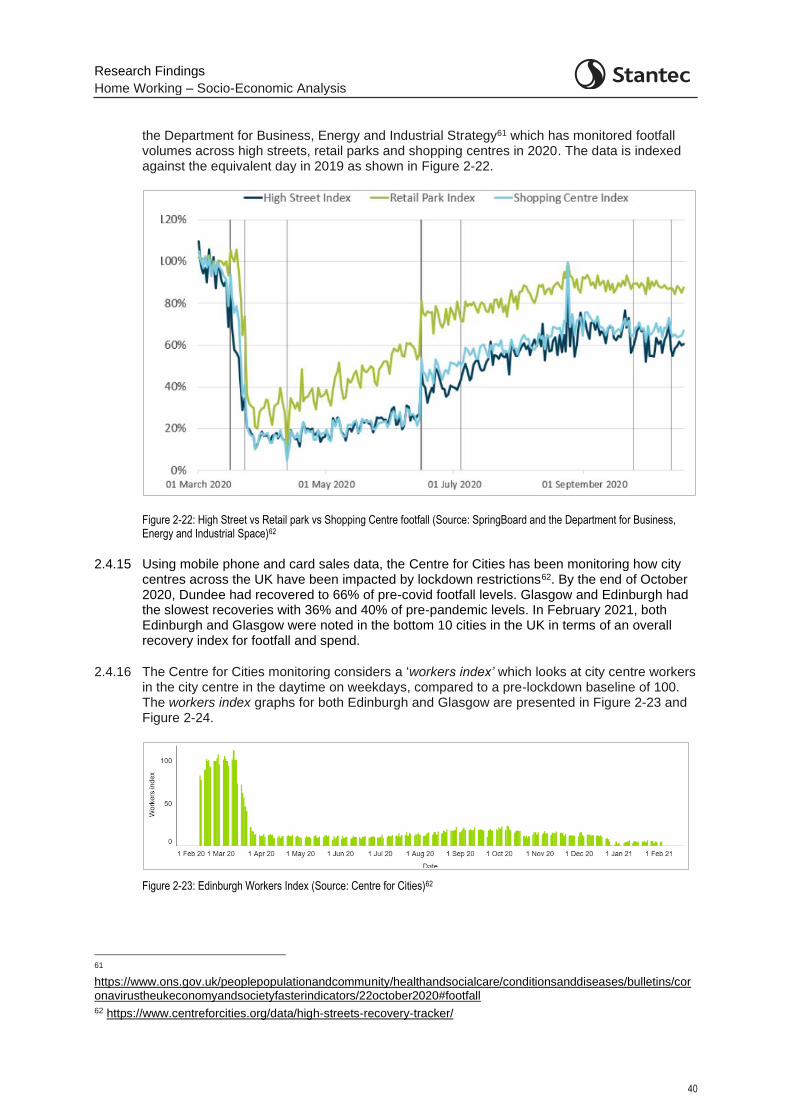
Research Findings
Home Working – Socio-Economic Analysis
40
the Department for Business, Energy and Industrial Strategy61 which has monitored footfall volumes across high streets, retail parks and shopping centres in 2020. The data is indexed against the equivalent day in 2019 as shown in Figure 2-22.
Figure 2-22: High Street vs Retail park vs Shopping Centre footfall (Source: SpringBoard and the Department for Business, Energy and Industrial Space)62
2.4.15 Using mobile phone and card sales data, the Centre for Cities has been monitoring how city centres across the UK have been impacted by lockdown restrictions62. By the end of October 2020, Dundee had recovered to 66% of pre-covid footfall levels. Glasgow and Edinburgh had the slowest recoveries with 36% and 40% of pre-pandemic levels. In February 2021, both Edinburgh and Glasgow were noted in the bottom 10 cities in the UK in terms of an overall recovery index for footfall and spend.
2.4.16 The Centre for Cities monitoring considers a ‘workers index’ which looks at city centre workers in the city centre in the daytime on weekdays, compared to a pre-lockdown baseline of 100. The workers index graphs for both Edinburgh and Glasgow are presented in Figure 2-23 and Figure 2-24.
Figure 2-23: Edinburgh Workers Index (Source: Centre for Cities)62
61 https://www.ons.gov.uk/peoplepopulationandcommunity/healthandsocialcare/conditionsanddiseases/bulletins/coronavirustheukeconomyandsocietyfasterindicators/22october2020#footfall 62 https://www.centreforcities.org/data/high-streets-recovery-tracker/
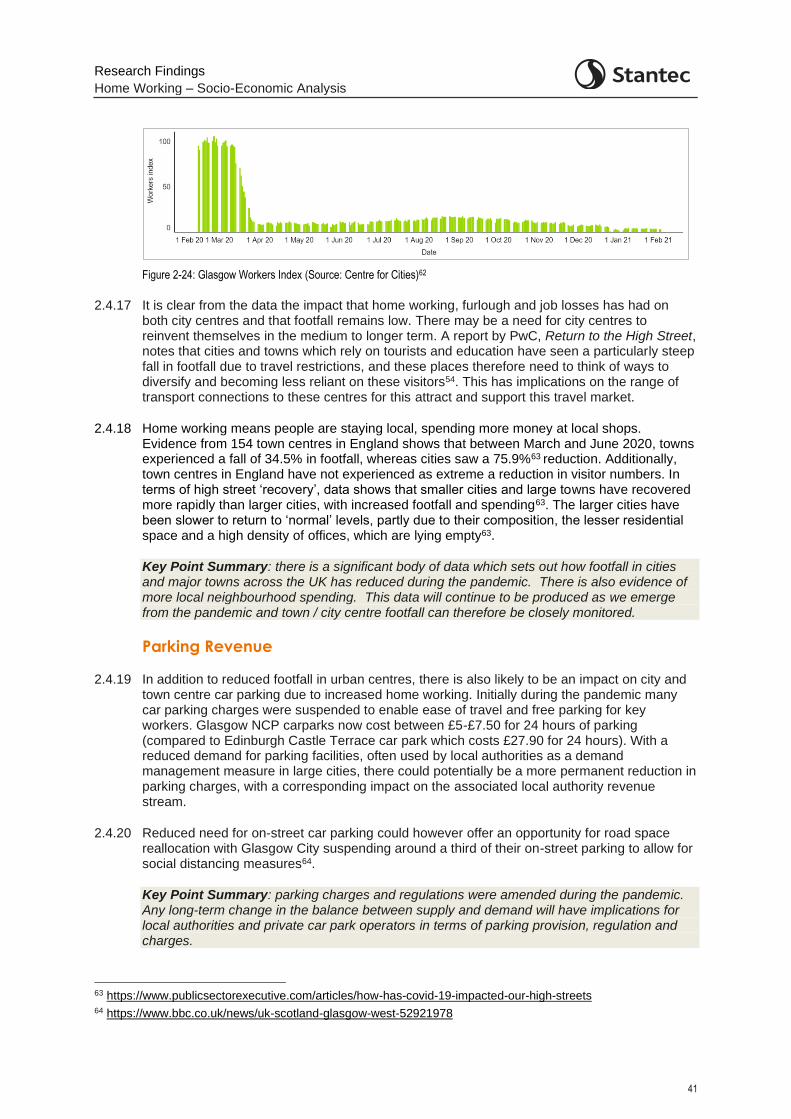
Research Findings
Home Working – Socio-Economic Analysis
41
Figure 2-24: Glasgow Workers Index (Source: Centre for Cities)62
2.4.17 It is clear from the data the impact that home working, furlough and job losses has had on both city centres and that footfall remains low. There may be a need for city centres to reinvent themselves in the medium to longer term. A report by PwC, Return to the High Street, notes that cities and towns which rely on tourists and education have seen a particularly steep fall in footfall due to travel restrictions, and these places therefore need to think of ways to diversify and becoming less reliant on these visitors54. This has implications on the range of transport connections to these centres for this attract and support this travel market.
2.4.18 Home working means people are staying local, spending more money at local shops. Evidence from 154 town centres in England shows that between March and June 2020, towns experienced a fall of 34.5% in footfall, whereas cities saw a 75.9%63 reduction. Additionally, town centres in England have not experienced as extreme a reduction in visitor numbers. In terms of high street ‘recovery’, data shows that smaller cities and large towns have recovered more rapidly than larger cities, with increased footfall and spending63. The larger cities have been slower to return to ‘normal’ levels, partly due to their composition, the lesser residential space and a high density of offices, which are lying empty63.
Key Point Summary: there is a significant body of data which sets out how footfall in cities and major towns across the UK has reduced during the pandemic. There is also evidence of more local neighbourhood spending. This data will continue to be produced as we emerge from the pandemic and town / city centre footfall can therefore be closely monitored.
Parking Revenue
2.4.19 In addition to reduced footfall in urban centres, there is also likely to be an impact on city and town centre car parking due to increased home working. Initially during the pandemic many car parking charges were suspended to enable ease of travel and free parking for key workers. Glasgow NCP carparks now cost between £5-£7.50 for 24 hours of parking (compared to Edinburgh Castle Terrace car park which costs £27.90 for 24 hours). With a reduced demand for parking facilities, often used by local authorities as a demand management measure in large cities, there could potentially be a more permanent reduction in parking charges, with a corresponding impact on the associated local authority revenue stream.
2.4.20 Reduced need for on-street car parking could however offer an opportunity for road space reallocation with Glasgow City suspending around a third of their on-street parking to allow for social distancing measures64.
Key Point Summary: parking charges and regulations were amended during the pandemic. Any long-term change in the balance between supply and demand will have implications for local authorities and private car park operators in terms of parking provision, regulation and charges.
63 https://www.publicsectorexecutive.com/articles/how-has-covid-19-impacted-our-high-streets 64 https://www.bbc.co.uk/news/uk-scotland-glasgow-west-52921978
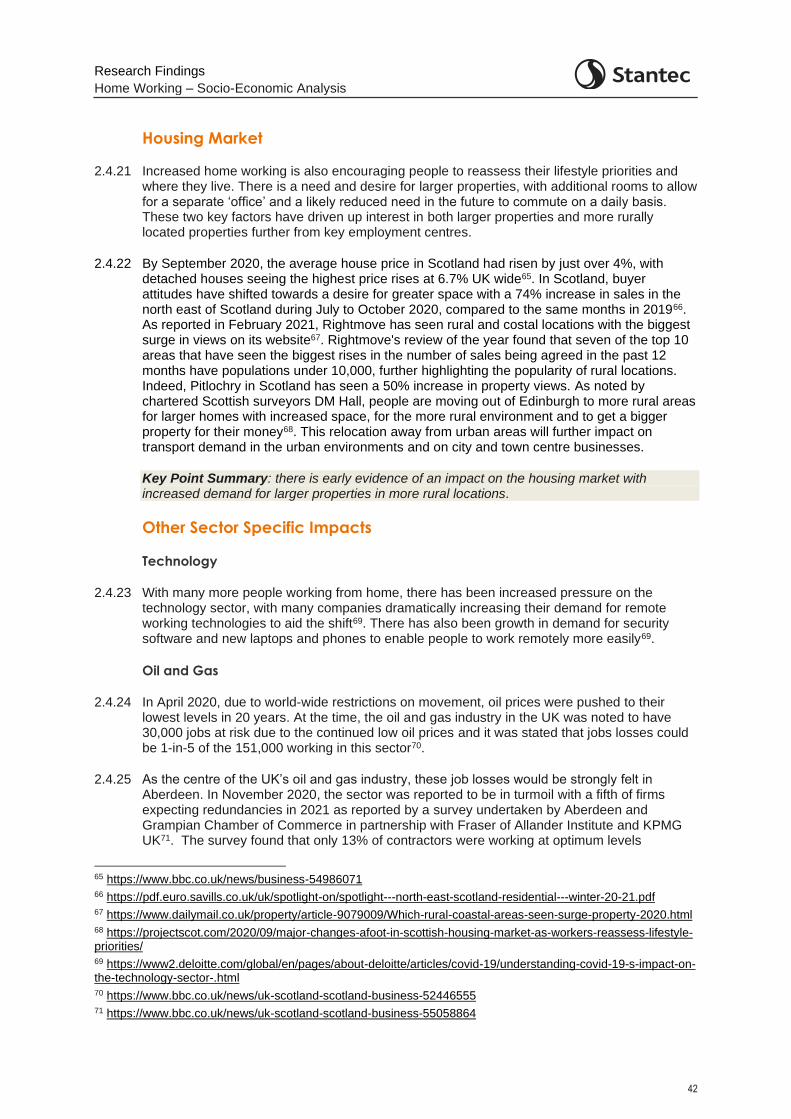
Research Findings
Home Working – Socio-Economic Analysis
42
Housing Market
2.4.21 Increased home working is also encouraging people to reassess their lifestyle priorities and where they live. There is a need and desire for larger properties, with additional rooms to allow for a separate ‘office’ and a likely reduced need in the future to commute on a daily basis. These two key factors have driven up interest in both larger properties and more rurally located properties further from key employment centres.
2.4.22 By September 2020, the average house price in Scotland had risen by just over 4%, with detached houses seeing the highest price rises at 6.7% UK wide65. In Scotland, buyer attitudes have shifted towards a desire for greater space with a 74% increase in sales in the north east of Scotland during July to October 2020, compared to the same months in 201966. As reported in February 2021, Rightmove has seen rural and costal locations with the biggest surge in views on its website67. Rightmove's review of the year found that seven of the top 10 areas that have seen the biggest rises in the number of sales being agreed in the past 12 months have populations under 10,000, further highlighting the popularity of rural locations. Indeed, Pitlochry in Scotland has seen a 50% increase in property views. As noted by chartered Scottish surveyors DM Hall, people are moving out of Edinburgh to more rural areas for larger homes with increased space, for the more rural environment and to get a bigger property for their money68. This relocation away from urban areas will further impact on transport demand in the urban environments and on city and town centre businesses.
Key Point Summary: there is early evidence of an impact on the housing market with increased demand for larger properties in more rural locations.
Other Sector Specific Impacts
Technology
2.4.23 With many more people working from home, there has been increased pressure on the technology sector, with many companies dramatically increasing their demand for remote working technologies to aid the shift69. There has also been growth in demand for security software and new laptops and phones to enable people to work remotely more easily69.
Oil and Gas
2.4.24 In April 2020, due to world-wide restrictions on movement, oil prices were pushed to their lowest levels in 20 years. At the time, the oil and gas industry in the UK was noted to have 30,000 jobs at risk due to the continued low oil prices and it was stated that jobs losses could be 1-in-5 of the 151,000 working in this sector70.
2.4.25 As the centre of the UK’s oil and gas industry, these job losses would be strongly felt in Aberdeen. In November 2020, the sector was reported to be in turmoil with a fifth of firms expecting redundancies in 2021 as reported by a survey undertaken by Aberdeen and Grampian Chamber of Commerce in partnership with Fraser of Allander Institute and KPMG UK71. The survey found that only 13% of contractors were working at optimum levels
65 https://www.bbc.co.uk/news/business-54986071 66 https://pdf.euro.savills.co.uk/uk/spotlight-on/spotlight---north-east-scotland-residential---winter-20-21.pdf 67 https://www.dailymail.co.uk/property/article-9079009/Which-rural-coastal-areas-seen-surge-property-2020.html 68 https://projectscot.com/2020/09/major-changes-afoot-in-scottish-housing-market-as-workers-reassess-lifestyle-priorities/ 69 https://www2.deloitte.com/global/en/pages/about-deloitte/articles/covid-19/understanding-covid-19-s-impact-on-the-technology-sector-.html 70 https://www.bbc.co.uk/news/uk-scotland-scotland-business-52446555 71 https://www.bbc.co.uk/news/uk-scotland-scotland-business-55058864

Research Findings
Home Working – Socio-Economic Analysis
43
compared to 47% the previous year. Half of the contractors surveyed reported a decline in their workforce, with 22% of those surveyed saying reductions equated to more than 10% of their workforce. Around a fifth of surveyed firms said they expected to make further reductions in 2021.
Savings Ratio
2.4.26 The household savings ratio is calculated by subtracting housing expenditure from disposable income. The switch to home working, while increasing energy costs for those working from home (particularly in the winter months) will have, for many, reduced overall household expenditure through removing commuting costs (be that petrol or public transport fares) as well as the likelihood of reduce expenditure on food / coffee etc. at lunchtimes. The saving rate in the UK reached a new high of 26.5% in the second quarter of 2020 and was at its highest rate since 1995, as shown in Figure 2-25.
Figure 2-25: Changes in Household Savings Ratio since 1955, in the United Kingdom 73 (Source: ONS)
2.4.27 Although saving have risen, a larger proportion of higher-income households have accumulated savings (42%) than lower income households (22%)72.
2.4.28 The savings ratio was predicted to decrease to 16.5% in the third quarter of 2020 and be around 10% in 2021 and 7% in 202273, as shown in Figure 2-26, with the longer-term forecast presented in Figure 2-27.
72 How has Covid affected household savings? | Bank of England 73 tradingeconomics.com
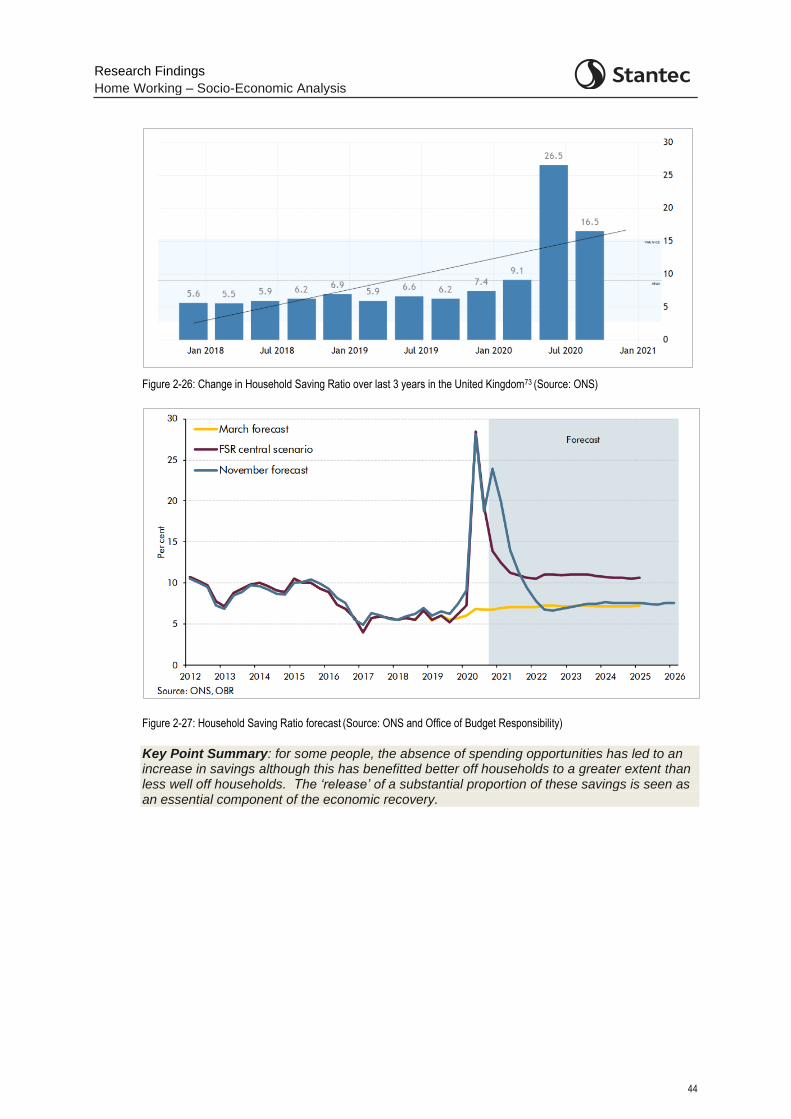
Research Findings
Home Working – Socio-Economic Analysis
44
Figure 2-26: Change in Household Saving Ratio over last 3 years in the United Kingdom73 (Source: ONS)
Figure 2-27: Household Saving Ratio forecast (Source: ONS and Office of Budget Responsibility)
Key Point Summary: for some people, the absence of spending opportunities has led to an increase in savings although this has benefitted better off households to a greater extent than less well off households. The ‘release’ of a substantial proportion of these savings is seen as an essential component of the economic recovery.
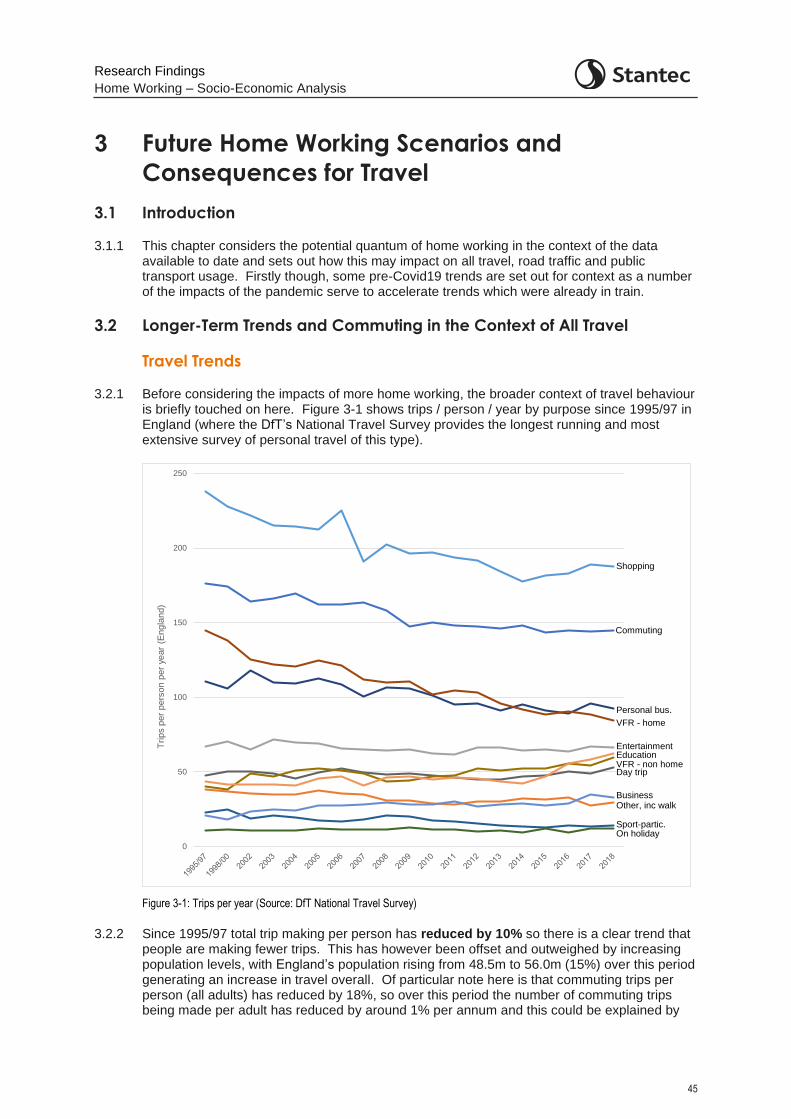
Research Findings
Home Working – Socio-Economic Analysis
45
3 Future Home Working Scenarios and
Consequences for Travel
3.1 Introduction
3.1.1 This chapter considers the potential quantum of home working in the context of the data available to date and sets out how this may impact on all travel, road traffic and public transport usage. Firstly though, some pre-Covid19 trends are set out for context as a number of the impacts of the pandemic serve to accelerate trends which were already in train.
3.2 Longer-Term Trends and Commuting in the Context of All Travel
Travel Trends
3.2.1 Before considering the impacts of more home working, the broader context of travel behaviour is briefly touched on here. Figure 3-1 shows trips / person / year by purpose since 1995/97 in England (where the DfT’s National Travel Survey provides the longest running and most extensive survey of personal travel of this type).
Figure 3-1: Trips per year (Source: DfT National Travel Survey)
3.2.2 Since 1995/97 total trip making per person has reduced by 10% so there is a clear trend that people are making fewer trips. This has however been offset and outweighed by increasing population levels, with England’s population rising from 48.5m to 56.0m (15%) over this period generating an increase in travel overall. Of particular note here is that commuting trips per person (all adults) has reduced by 18%, so over this period the number of commuting trips being made per adult has reduced by around 1% per annum and this could be explained by
0
50
100
150
200
250
Trip
s p
er
pers
on p
er
year
(En
gla
nd
)
Shopping
Entertainment
Personal bus.
VFR - home
Commuting
EducationVFR - non homeDay trip
BusinessOther, inc walk
Sport-partic.On holiday
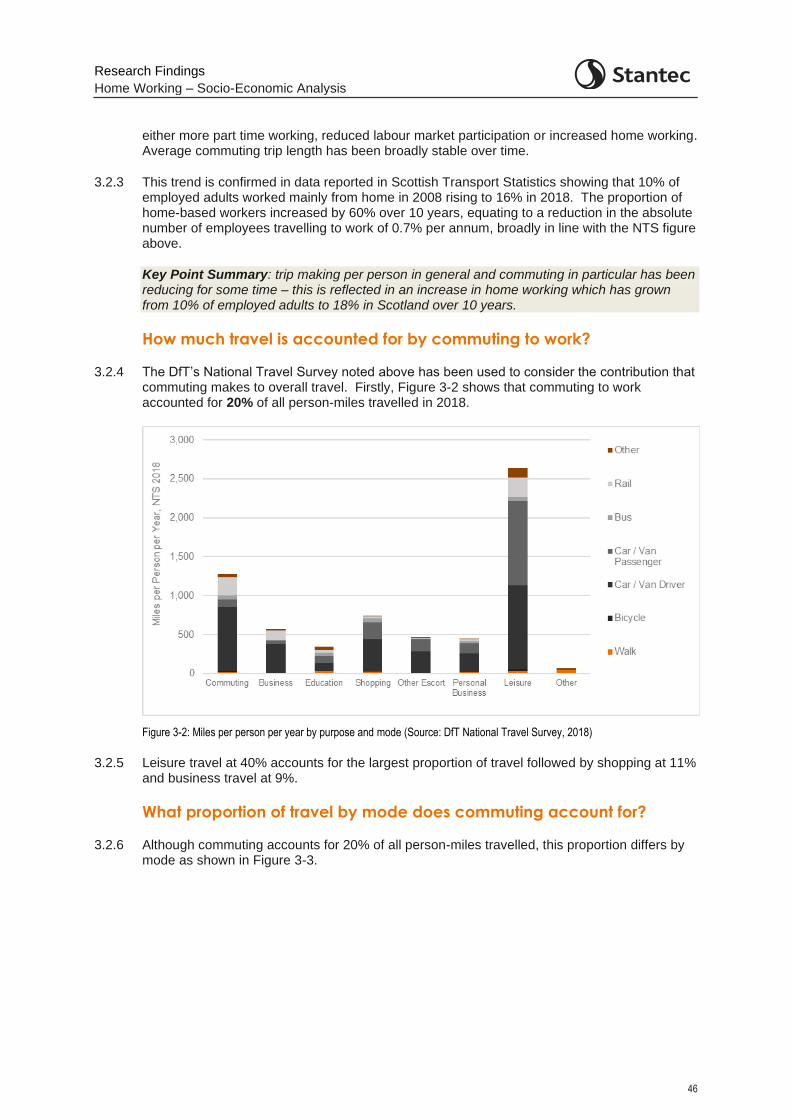
Research Findings
Home Working – Socio-Economic Analysis
46
either more part time working, reduced labour market participation or increased home working. Average commuting trip length has been broadly stable over time.
3.2.3 This trend is confirmed in data reported in Scottish Transport Statistics showing that 10% of employed adults worked mainly from home in 2008 rising to 16% in 2018. The proportion of home-based workers increased by 60% over 10 years, equating to a reduction in the absolute number of employees travelling to work of 0.7% per annum, broadly in line with the NTS figure above.
Key Point Summary: trip making per person in general and commuting in particular has been reducing for some time – this is reflected in an increase in home working which has grown from 10% of employed adults to 18% in Scotland over 10 years.
How much travel is accounted for by commuting to work?
3.2.4 The DfT’s National Travel Survey noted above has been used to consider the contribution that commuting makes to overall travel. Firstly, Figure 3-2 shows that commuting to work accounted for 20% of all person-miles travelled in 2018.
Figure 3-2: Miles per person per year by purpose and mode (Source: DfT National Travel Survey, 2018)
3.2.5 Leisure travel at 40% accounts for the largest proportion of travel followed by shopping at 11% and business travel at 9%.
What proportion of travel by mode does commuting account for?
3.2.6 Although commuting accounts for 20% of all person-miles travelled, this proportion differs by mode as shown in Figure 3-3.
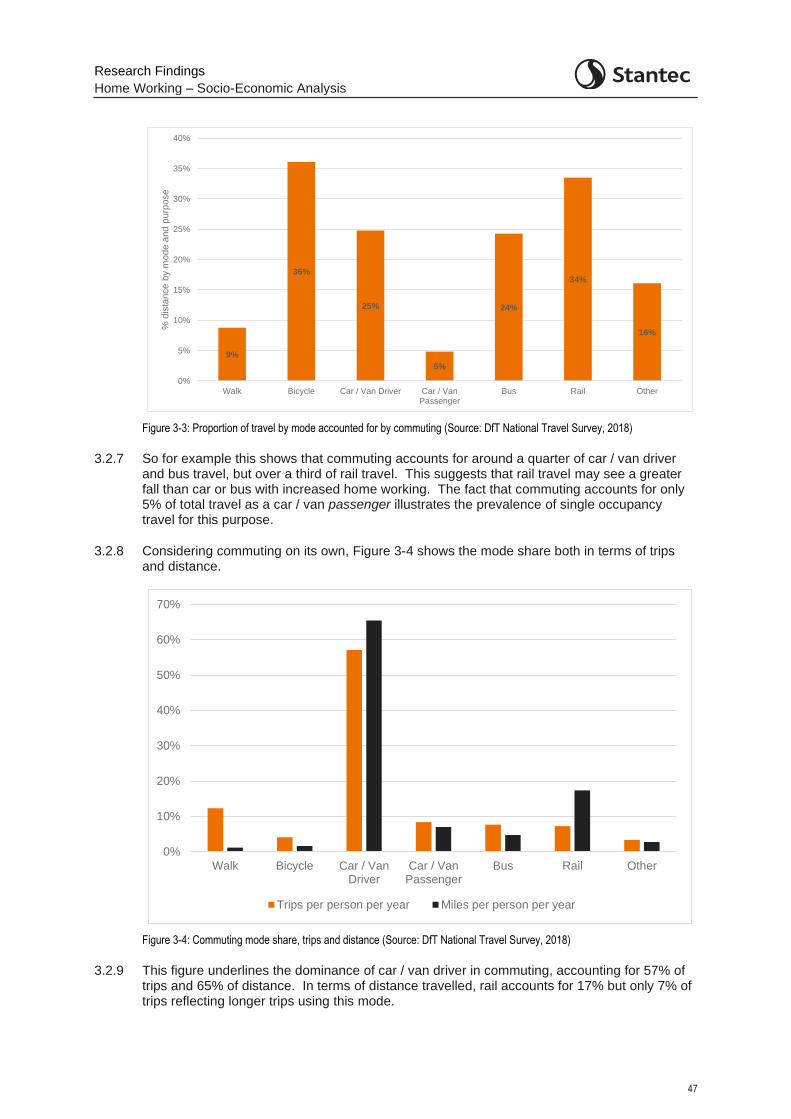
Research Findings
Home Working – Socio-Economic Analysis
47
Figure 3-3: Proportion of travel by mode accounted for by commuting (Source: DfT National Travel Survey, 2018)
3.2.7 So for example this shows that commuting accounts for around a quarter of car / van driver and bus travel, but over a third of rail travel. This suggests that rail travel may see a greater fall than car or bus with increased home working. The fact that commuting accounts for only 5% of total travel as a car / van passenger illustrates the prevalence of single occupancy travel for this purpose.
3.2.8 Considering commuting on its own, Figure 3-4 shows the mode share both in terms of trips and distance.
Figure 3-4: Commuting mode share, trips and distance (Source: DfT National Travel Survey, 2018)
3.2.9 This figure underlines the dominance of car / van driver in commuting, accounting for 57% of trips and 65% of distance. In terms of distance travelled, rail accounts for 17% but only 7% of trips reflecting longer trips using this mode.
9%
36%
25%
5%
24%
34%
16%
0%
5%
10%
15%
20%
25%
30%
35%
40%
Walk Bicycle Car / Van Driver Car / VanPassenger
Bus Rail Other
% d
ista
nce
by
mo
de
and
purp
ose
0%
10%
20%
30%
40%
50%
60%
70%
Walk Bicycle Car / VanDriver
Car / VanPassenger
Bus Rail Other
Trips per person per year Miles per person per year
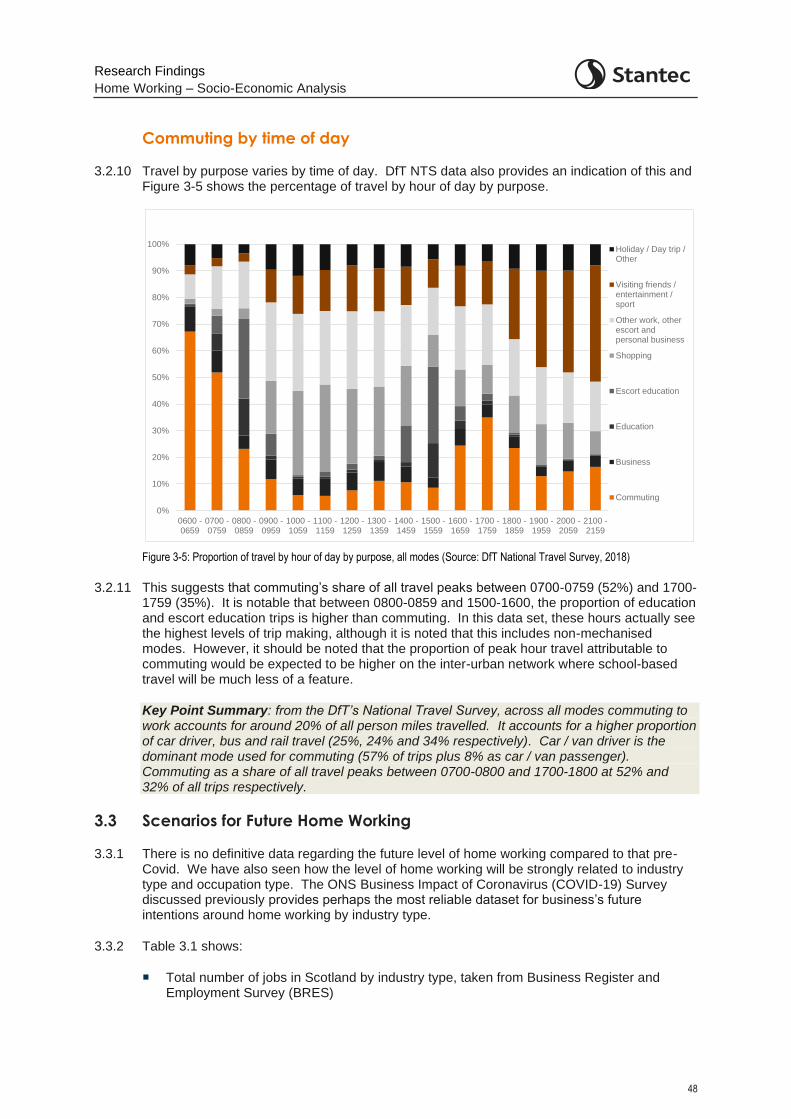
Research Findings
Home Working – Socio-Economic Analysis
48
Commuting by time of day
3.2.10 Travel by purpose varies by time of day. DfT NTS data also provides an indication of this and Figure 3-5 shows the percentage of travel by hour of day by purpose.
Figure 3-5: Proportion of travel by hour of day by purpose, all modes (Source: DfT National Travel Survey, 2018)
3.2.11 This suggests that commuting’s share of all travel peaks between 0700-0759 (52%) and 1700-1759 (35%). It is notable that between 0800-0859 and 1500-1600, the proportion of education and escort education trips is higher than commuting. In this data set, these hours actually see the highest levels of trip making, although it is noted that this includes non-mechanised modes. However, it should be noted that the proportion of peak hour travel attributable to commuting would be expected to be higher on the inter-urban network where school-based travel will be much less of a feature.
Key Point Summary: from the DfT’s National Travel Survey, across all modes commuting to work accounts for around 20% of all person miles travelled. It accounts for a higher proportion of car driver, bus and rail travel (25%, 24% and 34% respectively). Car / van driver is the dominant mode used for commuting (57% of trips plus 8% as car / van passenger). Commuting as a share of all travel peaks between 0700-0800 and 1700-1800 at 52% and 32% of all trips respectively.
3.3 Scenarios for Future Home Working
3.3.1 There is no definitive data regarding the future level of home working compared to that pre-Covid. We have also seen how the level of home working will be strongly related to industry type and occupation type. The ONS Business Impact of Coronavirus (COVID-19) Survey discussed previously provides perhaps the most reliable dataset for business’s future intentions around home working by industry type.
3.3.2 Table 3.1 shows:
Total number of jobs in Scotland by industry type, taken from Business Register and Employment Survey (BRES)
0%
10%
20%
30%
40%
50%
60%
70%
80%
90%
100%
0600 -0659
0700 -0759
0800 -0859
0900 -0959
1000 -1059
1100 -1159
1200 -1259
1300 -1359
1400 -1459
1500 -1559
1600 -1659
1700 -1759
1800 -1859
1900 -1959
2000 -2059
2100 -2159
Holiday / Day trip /Other
Visiting friends /entertainment /sport
Other work, otherescort andpersonal business
Shopping
Escort education
Education
Business
Commuting
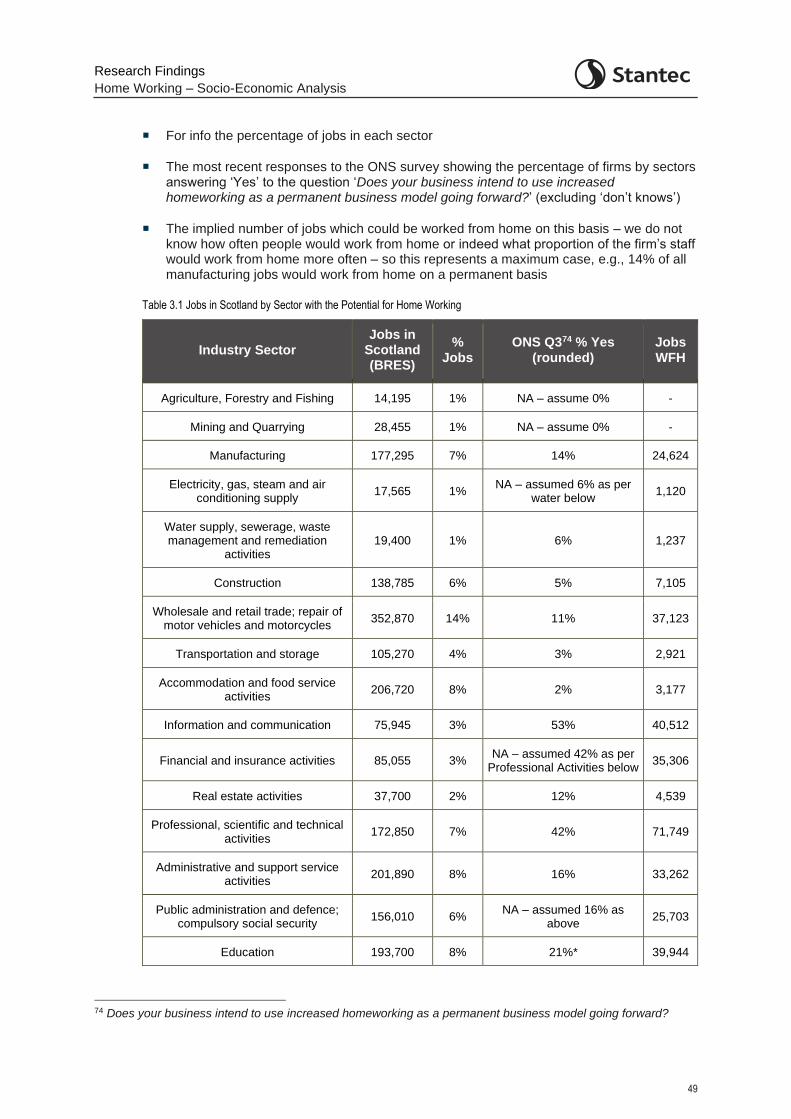
Research Findings
Home Working – Socio-Economic Analysis
49
For info the percentage of jobs in each sector
The most recent responses to the ONS survey showing the percentage of firms by sectors answering ‘Yes’ to the question ‘Does your business intend to use increased homeworking as a permanent business model going forward?’ (excluding ‘don’t knows’)
The implied number of jobs which could be worked from home on this basis – we do not know how often people would work from home or indeed what proportion of the firm’s staff would work from home more often – so this represents a maximum case, e.g., 14% of all manufacturing jobs would work from home on a permanent basis
Table 3.1 Jobs in Scotland by Sector with the Potential for Home Working
Industry Sector Jobs in
Scotland (BRES)
% Jobs
ONS Q374 % Yes (rounded)
Jobs WFH
Agriculture, Forestry and Fishing 14,195 1% NA – assume 0% -
Mining and Quarrying 28,455 1% NA – assume 0% -
Manufacturing 177,295 7% 14% 24,624
Electricity, gas, steam and air conditioning supply
17,565 1% NA – assumed 6% as per
water below 1,120
Water supply, sewerage, waste management and remediation
activities 19,400 1% 6% 1,237
Construction 138,785 6% 5% 7,105
Wholesale and retail trade; repair of motor vehicles and motorcycles
352,870 14% 11% 37,123
Transportation and storage 105,270 4% 3% 2,921
Accommodation and food service activities
206,720 8% 2% 3,177
Information and communication 75,945 3% 53% 40,512
Financial and insurance activities 85,055 3% NA – assumed 42% as per
Professional Activities below 35,306
Real estate activities 37,700 2% 12% 4,539
Professional, scientific and technical activities
172,850 7% 42% 71,749
Administrative and support service activities
201,890 8% 16% 33,262
Public administration and defence; compulsory social security
156,010 6% NA – assumed 16% as
above 25,703
Education 193,700 8% 21%* 39,944
74 Does your business intend to use increased homeworking as a permanent business model going forward?
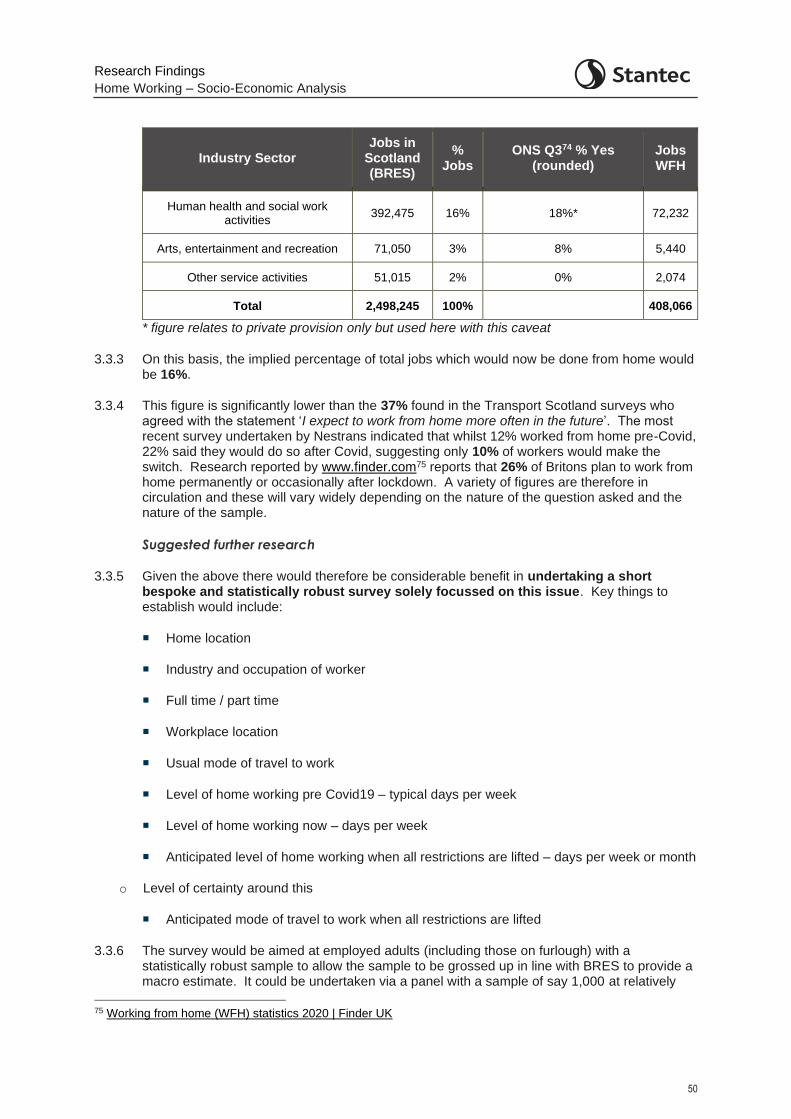
Research Findings
Home Working – Socio-Economic Analysis
50
Industry Sector Jobs in
Scotland (BRES)
% Jobs
ONS Q374 % Yes (rounded)
Jobs WFH
Human health and social work activities
392,475 16% 18%* 72,232
Arts, entertainment and recreation 71,050 3% 8% 5,440
Other service activities 51,015 2% 0% 2,074
Total 2,498,245 100% 408,066
* figure relates to private provision only but used here with this caveat
3.3.3 On this basis, the implied percentage of total jobs which would now be done from home would be 16%.
3.3.4 This figure is significantly lower than the 37% found in the Transport Scotland surveys who agreed with the statement ‘I expect to work from home more often in the future’. The most recent survey undertaken by Nestrans indicated that whilst 12% worked from home pre-Covid, 22% said they would do so after Covid, suggesting only 10% of workers would make the switch. Research reported by www.finder.com75 reports that 26% of Britons plan to work from home permanently or occasionally after lockdown. A variety of figures are therefore in circulation and these will vary widely depending on the nature of the question asked and the nature of the sample.
Suggested further research
3.3.5 Given the above there would therefore be considerable benefit in undertaking a short bespoke and statistically robust survey solely focussed on this issue. Key things to establish would include:
Home location
Industry and occupation of worker
Full time / part time
Workplace location
Usual mode of travel to work
Level of home working pre Covid19 – typical days per week
Level of home working now – days per week
Anticipated level of home working when all restrictions are lifted – days per week or month
o Level of certainty around this
Anticipated mode of travel to work when all restrictions are lifted
3.3.6 The survey would be aimed at employed adults (including those on furlough) with a statistically robust sample to allow the sample to be grossed up in line with BRES to provide a macro estimate. It could be undertaken via a panel with a sample of say 1,000 at relatively
75 Working from home (WFH) statistics 2020 | Finder UK
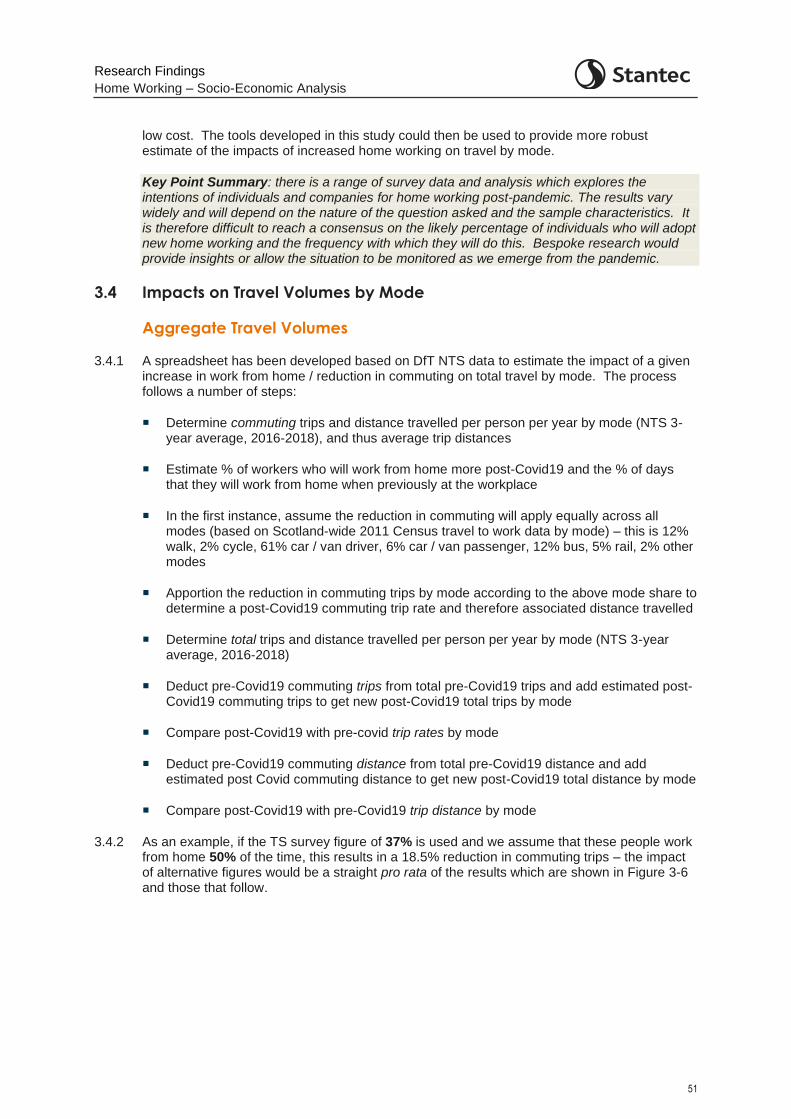
Research Findings
Home Working – Socio-Economic Analysis
51
low cost. The tools developed in this study could then be used to provide more robust estimate of the impacts of increased home working on travel by mode.
Key Point Summary: there is a range of survey data and analysis which explores the intentions of individuals and companies for home working post-pandemic. The results vary widely and will depend on the nature of the question asked and the sample characteristics. It is therefore difficult to reach a consensus on the likely percentage of individuals who will adopt new home working and the frequency with which they will do this. Bespoke research would provide insights or allow the situation to be monitored as we emerge from the pandemic.
3.4 Impacts on Travel Volumes by Mode
Aggregate Travel Volumes
3.4.1 A spreadsheet has been developed based on DfT NTS data to estimate the impact of a given increase in work from home / reduction in commuting on total travel by mode. The process follows a number of steps:
Determine commuting trips and distance travelled per person per year by mode (NTS 3-year average, 2016-2018), and thus average trip distances
Estimate % of workers who will work from home more post-Covid19 and the % of days that they will work from home when previously at the workplace
In the first instance, assume the reduction in commuting will apply equally across all modes (based on Scotland-wide 2011 Census travel to work data by mode) – this is 12% walk, 2% cycle, 61% car / van driver, 6% car / van passenger, 12% bus, 5% rail, 2% other modes
Apportion the reduction in commuting trips by mode according to the above mode share to determine a post-Covid19 commuting trip rate and therefore associated distance travelled
Determine total trips and distance travelled per person per year by mode (NTS 3-year average, 2016-2018)
Deduct pre-Covid19 commuting trips from total pre-Covid19 trips and add estimated post-Covid19 commuting trips to get new post-Covid19 total trips by mode
Compare post-Covid19 with pre-covid trip rates by mode
Deduct pre-Covid19 commuting distance from total pre-Covid19 distance and add estimated post Covid commuting distance to get new post-Covid19 total distance by mode
Compare post-Covid19 with pre-Covid19 trip distance by mode
3.4.2 As an example, if the TS survey figure of 37% is used and we assume that these people work from home 50% of the time, this results in a 18.5% reduction in commuting trips – the impact of alternative figures would be a straight pro rata of the results which are shown in Figure 3-6 and those that follow.
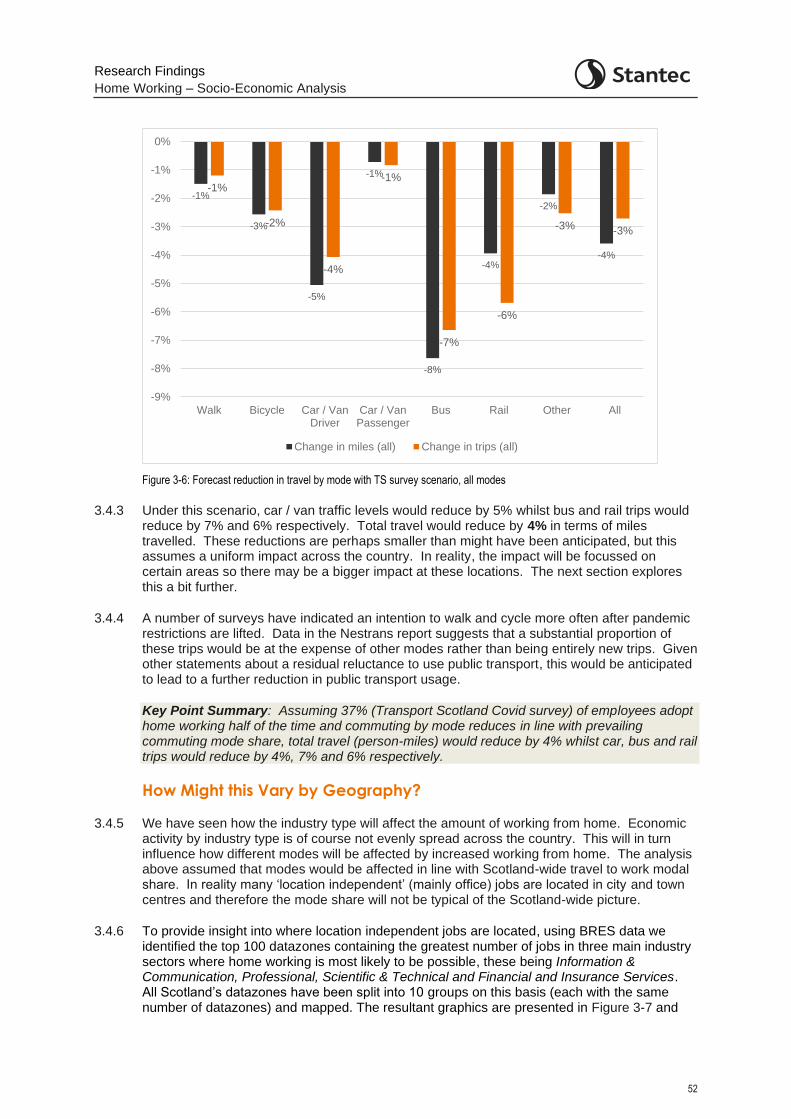
Research Findings
Home Working – Socio-Economic Analysis
52
Figure 3-6: Forecast reduction in travel by mode with TS survey scenario, all modes
3.4.3 Under this scenario, car / van traffic levels would reduce by 5% whilst bus and rail trips would reduce by 7% and 6% respectively. Total travel would reduce by 4% in terms of miles travelled. These reductions are perhaps smaller than might have been anticipated, but this assumes a uniform impact across the country. In reality, the impact will be focussed on certain areas so there may be a bigger impact at these locations. The next section explores this a bit further.
3.4.4 A number of surveys have indicated an intention to walk and cycle more often after pandemic restrictions are lifted. Data in the Nestrans report suggests that a substantial proportion of these trips would be at the expense of other modes rather than being entirely new trips. Given other statements about a residual reluctance to use public transport, this would be anticipated to lead to a further reduction in public transport usage.
Key Point Summary: Assuming 37% (Transport Scotland Covid survey) of employees adopt home working half of the time and commuting by mode reduces in line with prevailing commuting mode share, total travel (person-miles) would reduce by 4% whilst car, bus and rail trips would reduce by 4%, 7% and 6% respectively.
How Might this Vary by Geography?
3.4.5 We have seen how the industry type will affect the amount of working from home. Economic activity by industry type is of course not evenly spread across the country. This will in turn influence how different modes will be affected by increased working from home. The analysis above assumed that modes would be affected in line with Scotland-wide travel to work modal share. In reality many ‘location independent’ (mainly office) jobs are located in city and town centres and therefore the mode share will not be typical of the Scotland-wide picture.
3.4.6 To provide insight into where location independent jobs are located, using BRES data we identified the top 100 datazones containing the greatest number of jobs in three main industry sectors where home working is most likely to be possible, these being Information & Communication, Professional, Scientific & Technical and Financial and Insurance Services. All Scotland’s datazones have been split into 10 groups on this basis (each with the same number of datazones) and mapped. The resultant graphics are presented in Figure 3-7 and
-1%
-3%
-5%
-1%
-8%
-4%
-2%
-4%
-1%
-2%
-4%
-1%
-7%
-6%
-3% -3%
-9%
-8%
-7%
-6%
-5%
-4%
-3%
-2%
-1%
0%
Walk Bicycle Car / VanDriver
Car / VanPassenger
Bus Rail Other All
Change in miles (all) Change in trips (all)
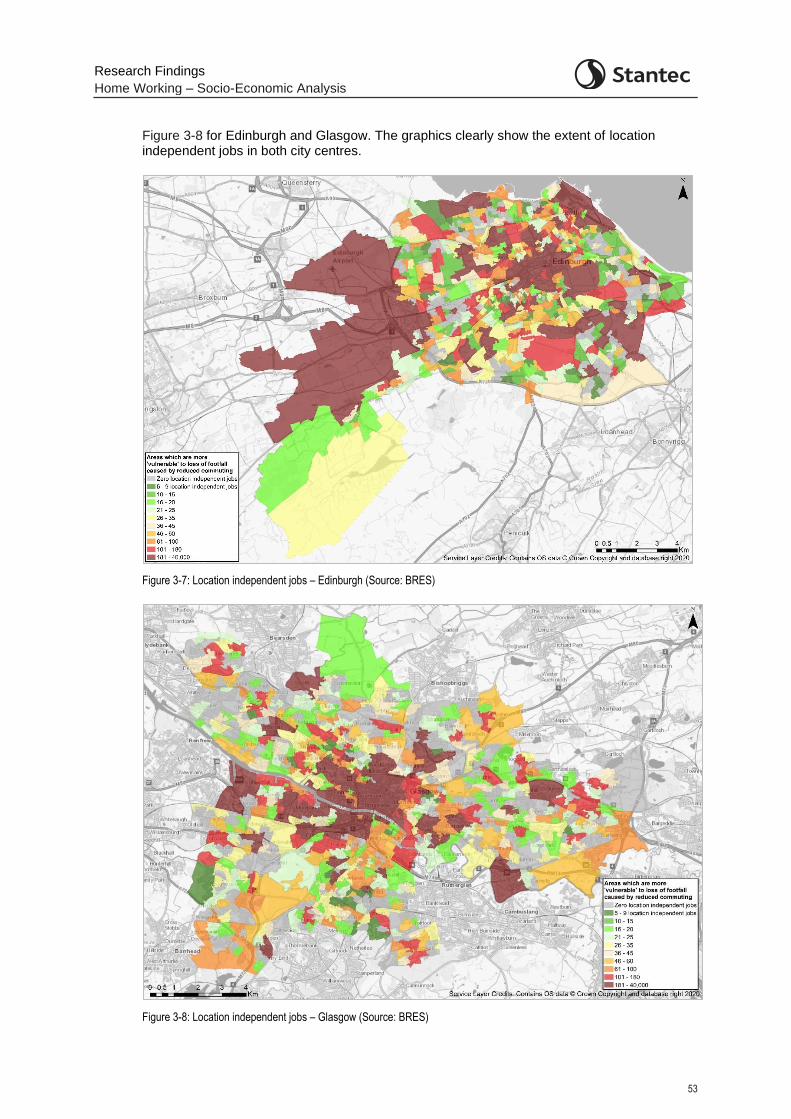
Research Findings
Home Working – Socio-Economic Analysis
53
Figure 3-8 for Edinburgh and Glasgow. The graphics clearly show the extent of location independent jobs in both city centres.
Figure 3-7: Location independent jobs – Edinburgh (Source: BRES)
Figure 3-8: Location independent jobs – Glasgow (Source: BRES)
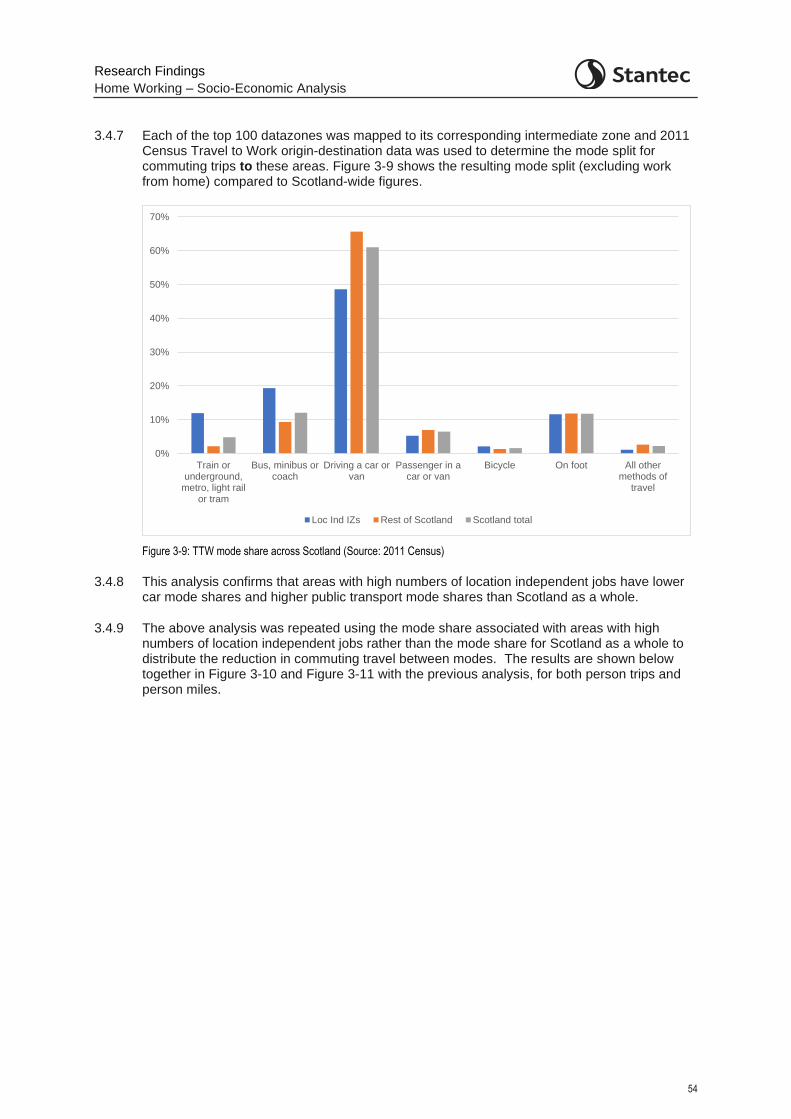
Research Findings
Home Working – Socio-Economic Analysis
54
3.4.7 Each of the top 100 datazones was mapped to its corresponding intermediate zone and 2011 Census Travel to Work origin-destination data was used to determine the mode split for commuting trips to these areas. Figure 3-9 shows the resulting mode split (excluding work from home) compared to Scotland-wide figures.
Figure 3-9: TTW mode share across Scotland (Source: 2011 Census)
3.4.8 This analysis confirms that areas with high numbers of location independent jobs have lower car mode shares and higher public transport mode shares than Scotland as a whole.
3.4.9 The above analysis was repeated using the mode share associated with areas with high numbers of location independent jobs rather than the mode share for Scotland as a whole to distribute the reduction in commuting travel between modes. The results are shown below together in Figure 3-10 and Figure 3-11 with the previous analysis, for both person trips and person miles.
0%
10%
20%
30%
40%
50%
60%
70%
Train orunderground,
metro, light railor tram
Bus, minibus orcoach
Driving a car orvan
Passenger in acar or van
Bicycle On foot All othermethods of
travel
Loc Ind IZs Rest of Scotland Scotland total
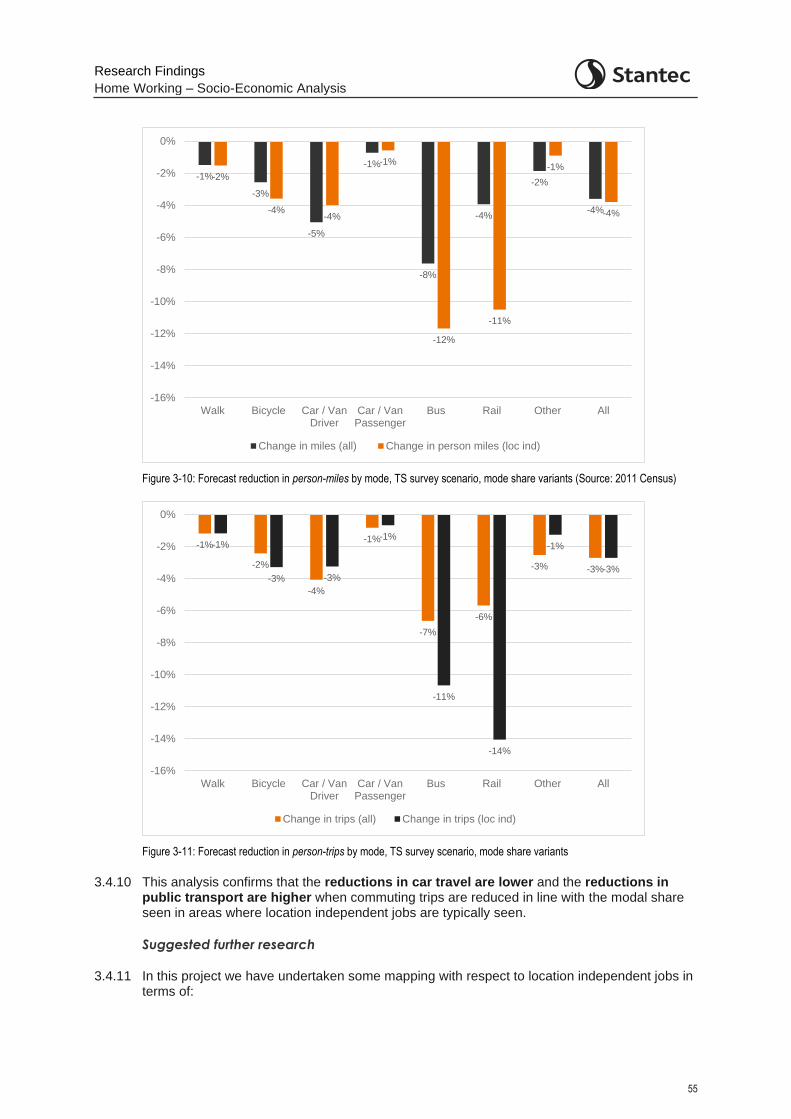
Research Findings
Home Working – Socio-Economic Analysis
55
Figure 3-10: Forecast reduction in person-miles by mode, TS survey scenario, mode share variants (Source: 2011 Census)
Figure 3-11: Forecast reduction in person-trips by mode, TS survey scenario, mode share variants
3.4.10 This analysis confirms that the reductions in car travel are lower and the reductions in public transport are higher when commuting trips are reduced in line with the modal share seen in areas where location independent jobs are typically seen.
Suggested further research
3.4.11 In this project we have undertaken some mapping with respect to location independent jobs in terms of:
-1%
-3%
-5%
-1%
-8%
-4%
-2%
-4%
-2%
-4%-4%
-1%
-12%
-11%
-1%
-4%
-16%
-14%
-12%
-10%
-8%
-6%
-4%
-2%
0%
Walk Bicycle Car / VanDriver
Car / VanPassenger
Bus Rail Other All
Change in miles (all) Change in person miles (loc ind)
-1%
-2%
-4%
-1%
-7%
-6%
-3% -3%
-1%
-3% -3%
-1%
-11%
-14%
-1%
-3%
-16%
-14%
-12%
-10%
-8%
-6%
-4%
-2%
0%
Walk Bicycle Car / VanDriver
Car / VanPassenger
Bus Rail Other All
Change in trips (all) Change in trips (loc ind)
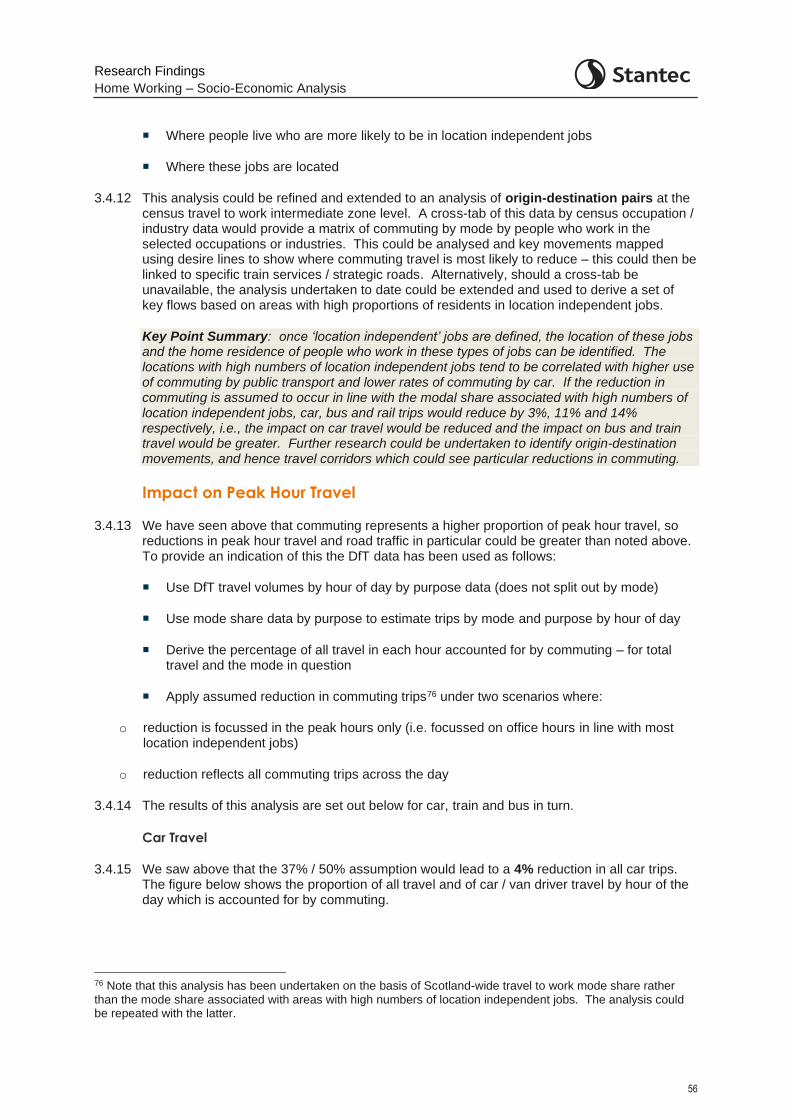
Research Findings
Home Working – Socio-Economic Analysis
56
Where people live who are more likely to be in location independent jobs
Where these jobs are located
3.4.12 This analysis could be refined and extended to an analysis of origin-destination pairs at the census travel to work intermediate zone level. A cross-tab of this data by census occupation / industry data would provide a matrix of commuting by mode by people who work in the selected occupations or industries. This could be analysed and key movements mapped using desire lines to show where commuting travel is most likely to reduce – this could then be linked to specific train services / strategic roads. Alternatively, should a cross-tab be unavailable, the analysis undertaken to date could be extended and used to derive a set of key flows based on areas with high proportions of residents in location independent jobs.
Key Point Summary: once ‘location independent’ jobs are defined, the location of these jobs and the home residence of people who work in these types of jobs can be identified. The locations with high numbers of location independent jobs tend to be correlated with higher use of commuting by public transport and lower rates of commuting by car. If the reduction in commuting is assumed to occur in line with the modal share associated with high numbers of location independent jobs, car, bus and rail trips would reduce by 3%, 11% and 14% respectively, i.e., the impact on car travel would be reduced and the impact on bus and train travel would be greater. Further research could be undertaken to identify origin-destination movements, and hence travel corridors which could see particular reductions in commuting.
Impact on Peak Hour Travel
3.4.13 We have seen above that commuting represents a higher proportion of peak hour travel, so reductions in peak hour travel and road traffic in particular could be greater than noted above. To provide an indication of this the DfT data has been used as follows:
Use DfT travel volumes by hour of day by purpose data (does not split out by mode)
Use mode share data by purpose to estimate trips by mode and purpose by hour of day
Derive the percentage of all travel in each hour accounted for by commuting – for total travel and the mode in question
Apply assumed reduction in commuting trips76 under two scenarios where:
o reduction is focussed in the peak hours only (i.e. focussed on office hours in line with most location independent jobs)
o reduction reflects all commuting trips across the day
3.4.14 The results of this analysis are set out below for car, train and bus in turn.
Car Travel
3.4.15 We saw above that the 37% / 50% assumption would lead to a 4% reduction in all car trips. The figure below shows the proportion of all travel and of car / van driver travel by hour of the day which is accounted for by commuting.
76 Note that this analysis has been undertaken on the basis of Scotland-wide travel to work mode share rather than the mode share associated with areas with high numbers of location independent jobs. The analysis could be repeated with the latter.
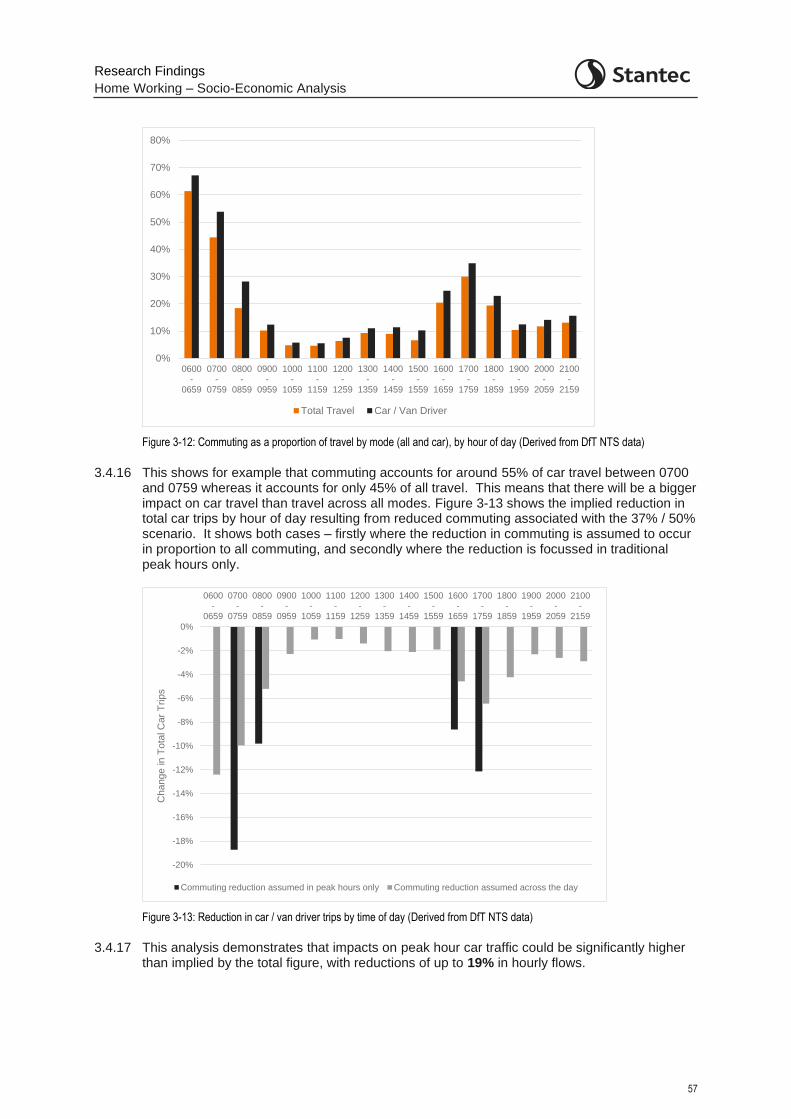
Research Findings
Home Working – Socio-Economic Analysis
57
Figure 3-12: Commuting as a proportion of travel by mode (all and car), by hour of day (Derived from DfT NTS data)
3.4.16 This shows for example that commuting accounts for around 55% of car travel between 0700 and 0759 whereas it accounts for only 45% of all travel. This means that there will be a bigger impact on car travel than travel across all modes. Figure 3-13 shows the implied reduction in total car trips by hour of day resulting from reduced commuting associated with the 37% / 50% scenario. It shows both cases – firstly where the reduction in commuting is assumed to occur in proportion to all commuting, and secondly where the reduction is focussed in traditional peak hours only.
Figure 3-13: Reduction in car / van driver trips by time of day (Derived from DfT NTS data)
3.4.17 This analysis demonstrates that impacts on peak hour car traffic could be significantly higher than implied by the total figure, with reductions of up to 19% in hourly flows.
0%
10%
20%
30%
40%
50%
60%
70%
80%
0600-
0659
0700-
0759
0800-
0859
0900-
0959
1000-
1059
1100-
1159
1200-
1259
1300-
1359
1400-
1459
1500-
1559
1600-
1659
1700-
1759
1800-
1859
1900-
1959
2000-
2059
2100-
2159
Total Travel Car / Van Driver
-20%
-18%
-16%
-14%
-12%
-10%
-8%
-6%
-4%
-2%
0%
0600-
0659
0700-
0759
0800-
0859
0900-
0959
1000-
1059
1100-
1159
1200-
1259
1300-
1359
1400-
1459
1500-
1559
1600-
1659
1700-
1759
1800-
1859
1900-
1959
2000-
2059
2100-
2159
Ch
ang
e in
To
tal C
ar
Trip
s
Commuting reduction assumed in peak hours only Commuting reduction assumed across the day
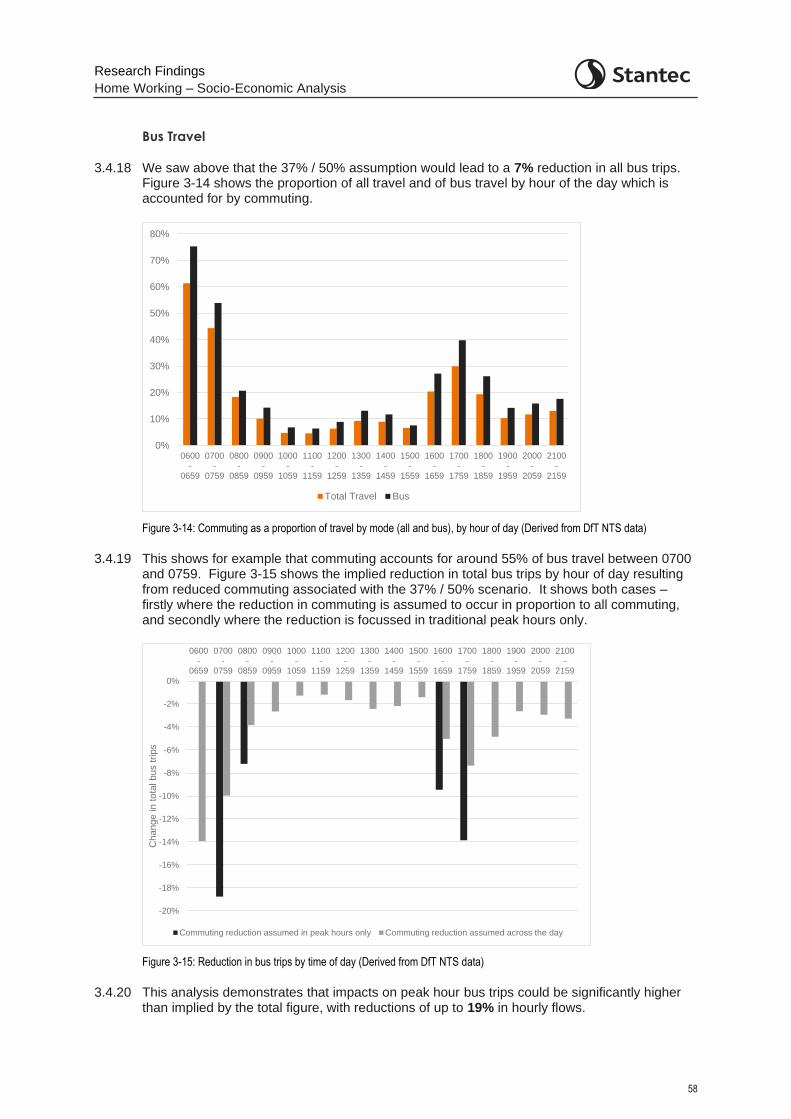
Research Findings
Home Working – Socio-Economic Analysis
58
Bus Travel
3.4.18 We saw above that the 37% / 50% assumption would lead to a 7% reduction in all bus trips. Figure 3-14 shows the proportion of all travel and of bus travel by hour of the day which is accounted for by commuting.
Figure 3-14: Commuting as a proportion of travel by mode (all and bus), by hour of day (Derived from DfT NTS data)
3.4.19 This shows for example that commuting accounts for around 55% of bus travel between 0700 and 0759. Figure 3-15 shows the implied reduction in total bus trips by hour of day resulting from reduced commuting associated with the 37% / 50% scenario. It shows both cases – firstly where the reduction in commuting is assumed to occur in proportion to all commuting, and secondly where the reduction is focussed in traditional peak hours only.
Figure 3-15: Reduction in bus trips by time of day (Derived from DfT NTS data)
3.4.20 This analysis demonstrates that impacts on peak hour bus trips could be significantly higher than implied by the total figure, with reductions of up to 19% in hourly flows.
0%
10%
20%
30%
40%
50%
60%
70%
80%
0600-
0659
0700-
0759
0800-
0859
0900-
0959
1000-
1059
1100-
1159
1200-
1259
1300-
1359
1400-
1459
1500-
1559
1600-
1659
1700-
1759
1800-
1859
1900-
1959
2000-
2059
2100-
2159
Total Travel Bus
-20%
-18%
-16%
-14%
-12%
-10%
-8%
-6%
-4%
-2%
0%
0600-
0659
0700-
0759
0800-
0859
0900-
0959
1000-
1059
1100-
1159
1200-
1259
1300-
1359
1400-
1459
1500-
1559
1600-
1659
1700-
1759
1800-
1859
1900-
1959
2000-
2059
2100-
2159
Chang
e in t
ota
l b
us trips
Commuting reduction assumed in peak hours only Commuting reduction assumed across the day
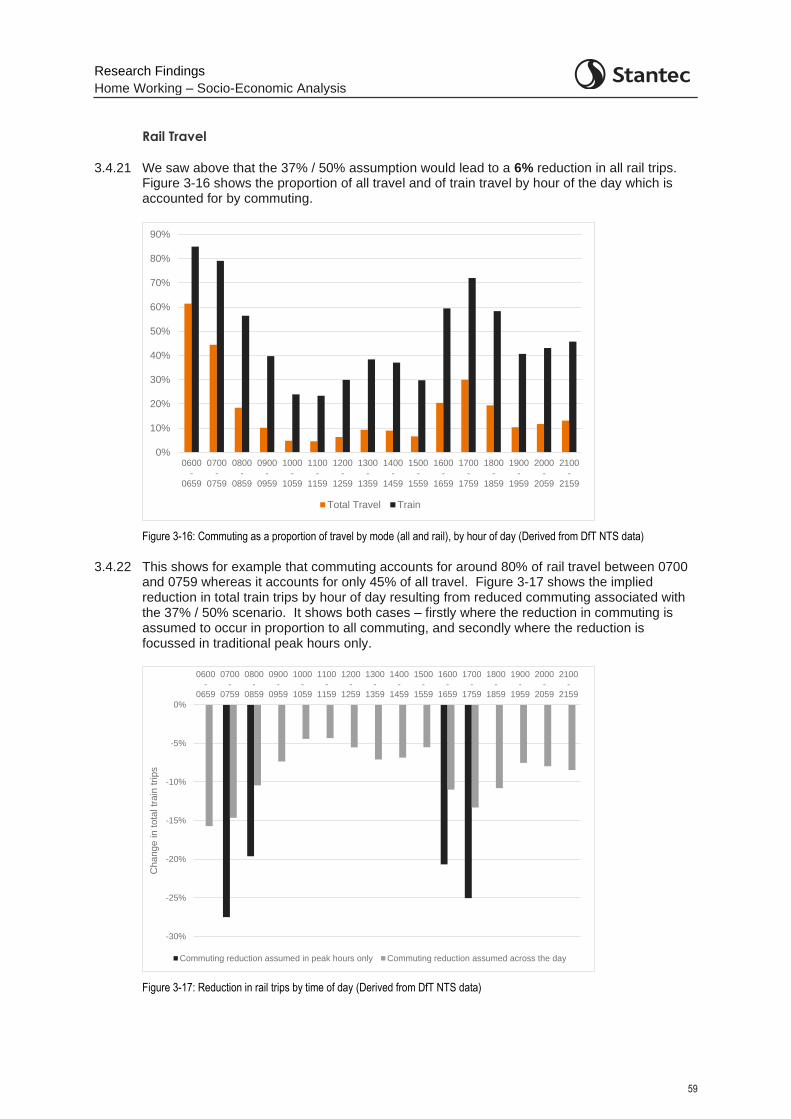
Research Findings
Home Working – Socio-Economic Analysis
59
Rail Travel
3.4.21 We saw above that the 37% / 50% assumption would lead to a 6% reduction in all rail trips. Figure 3-16 shows the proportion of all travel and of train travel by hour of the day which is accounted for by commuting.
Figure 3-16: Commuting as a proportion of travel by mode (all and rail), by hour of day (Derived from DfT NTS data)
3.4.22 This shows for example that commuting accounts for around 80% of rail travel between 0700 and 0759 whereas it accounts for only 45% of all travel. Figure 3-17 shows the implied reduction in total train trips by hour of day resulting from reduced commuting associated with the 37% / 50% scenario. It shows both cases – firstly where the reduction in commuting is assumed to occur in proportion to all commuting, and secondly where the reduction is focussed in traditional peak hours only.
Figure 3-17: Reduction in rail trips by time of day (Derived from DfT NTS data)
0%
10%
20%
30%
40%
50%
60%
70%
80%
90%
0600-
0659
0700-
0759
0800-
0859
0900-
0959
1000-
1059
1100-
1159
1200-
1259
1300-
1359
1400-
1459
1500-
1559
1600-
1659
1700-
1759
1800-
1859
1900-
1959
2000-
2059
2100-
2159
Total Travel Train
-30%
-25%
-20%
-15%
-10%
-5%
0%
0600-
0659
0700-
0759
0800-
0859
0900-
0959
1000-
1059
1100-
1159
1200-
1259
1300-
1359
1400-
1459
1500-
1559
1600-
1659
1700-
1759
1800-
1859
1900-
1959
2000-
2059
2100-
2159
Ch
ang
e in
to
tal tr
ain
trip
s
Commuting reduction assumed in peak hours only Commuting reduction assumed across the day
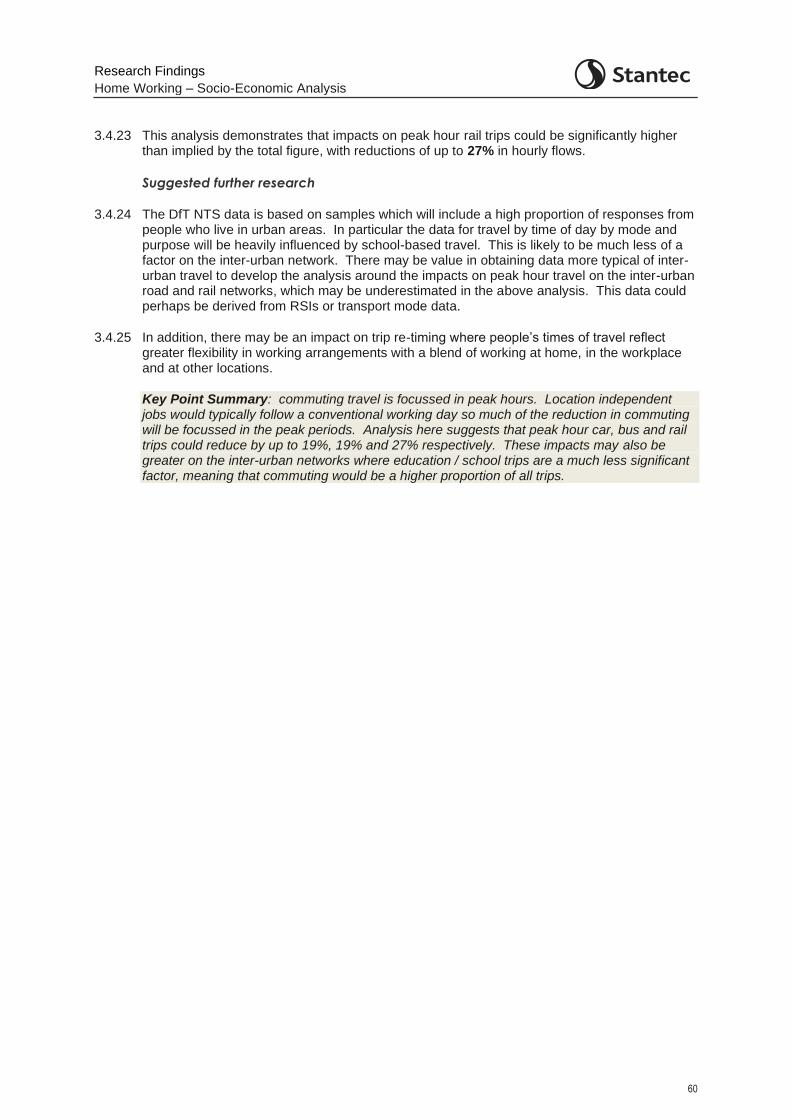
Research Findings
Home Working – Socio-Economic Analysis
60
3.4.23 This analysis demonstrates that impacts on peak hour rail trips could be significantly higher than implied by the total figure, with reductions of up to 27% in hourly flows.
Suggested further research
3.4.24 The DfT NTS data is based on samples which will include a high proportion of responses from people who live in urban areas. In particular the data for travel by time of day by mode and purpose will be heavily influenced by school-based travel. This is likely to be much less of a factor on the inter-urban network. There may be value in obtaining data more typical of inter-urban travel to develop the analysis around the impacts on peak hour travel on the inter-urban road and rail networks, which may be underestimated in the above analysis. This data could perhaps be derived from RSIs or transport mode data.
3.4.25 In addition, there may be an impact on trip re-timing where people’s times of travel reflect greater flexibility in working arrangements with a blend of working at home, in the workplace and at other locations.
Key Point Summary: commuting travel is focussed in peak hours. Location independent jobs would typically follow a conventional working day so much of the reduction in commuting will be focussed in the peak periods. Analysis here suggests that peak hour car, bus and rail trips could reduce by up to 19%, 19% and 27% respectively. These impacts may also be greater on the inter-urban networks where education / school trips are a much less significant factor, meaning that commuting would be a higher proportion of all trips.
Research Findings
Home Working – Socio-Economic Analysis
61
4 Impacts of Increased Home Working
4.1 Introduction
4.1.1 The earlier sections of this report have established a baseline and forecast scenarios for the potential impacts of increased home working. This section logically considers and sets out the potential scope and scale of economic, environmental, wellbeing, population / demographic and social consequences of increased home working.
4.1.2 In order to present the full range of potential impacts, mind-mapping has been used to set out the range of potential cause and effect of the consequences of increased levels of home working. This approach provides a structured Framework within which all potential impacts can be understood and which can evolve as the situation crystalises over time.
4.1.3 The consequences of increased home working could be far reaching with economic, social, population / demographic, environmental and health & wellbeing aspects. These consequences are also likely to be complex and interwoven. They will however be driven by the decisions and actions of individuals and employers, and the mind mapping process has been undertaken from that perspective.
4.1.4 In some cases there may be spiralling impacts, e.g., reduced demand for public transport leads to reductions in public transport services which in turn leads to further reductions in demand, further reductions in services, and so on. There may be a role for policy to step in to halt this type of spiral of decline.
4.2 Mind Mapping
4.2.1 Five key themes of potential consequences have been considered in the mind-mapping exercise:
Reduced Commuting Travel:
o Car
o Public Transport
o Active Travel
Impact of travel time and cost reductions
Impact of being at home and not at place of work
Employer perspective and response
Home and work independence (impact of residential choice)
4.2.2 The mind-maps relating to these key themes are presented in the following figures. Note that the colours in the figures simply represent the ‘levels’ of cause and effect in the logic chains.
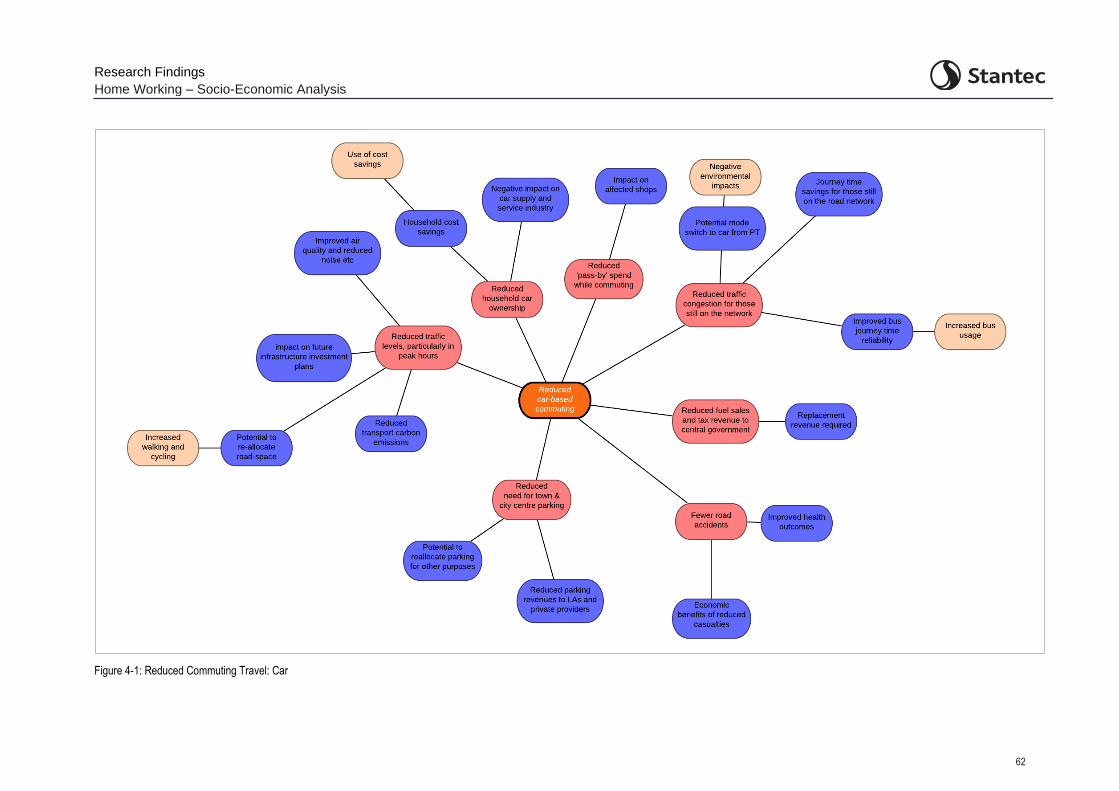
Research Findings
Home Working – Socio-Economic Analysis
62
Figure 4-1: Reduced Commuting Travel: Car
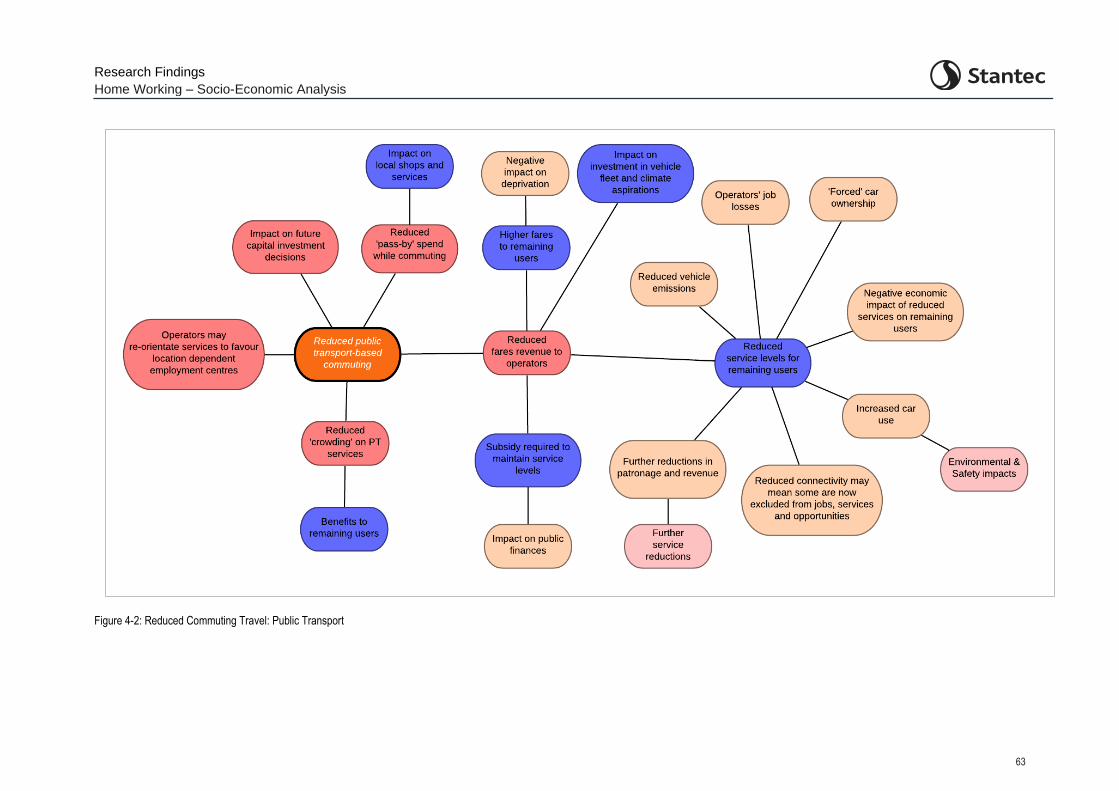
Research Findings
Home Working – Socio-Economic Analysis
63
Figure 4-2: Reduced Commuting Travel: Public Transport
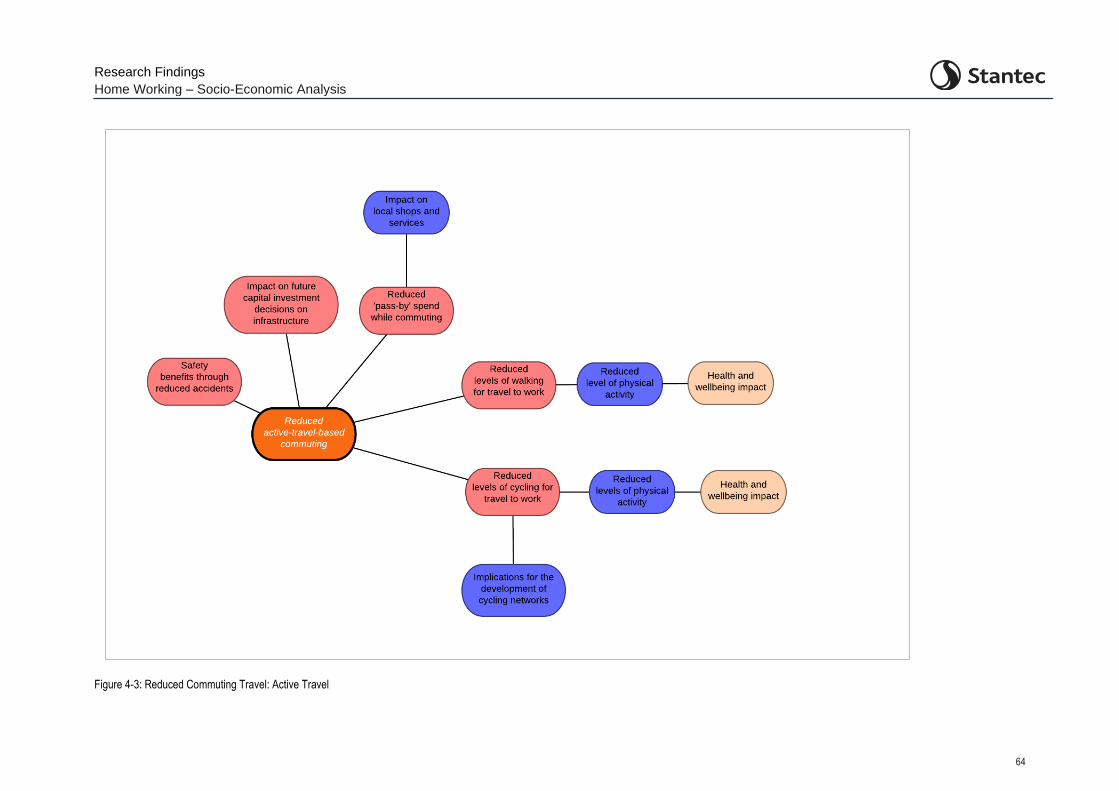
Research Findings
Home Working – Socio-Economic Analysis
64
Figure 4-3: Reduced Commuting Travel: Active Travel
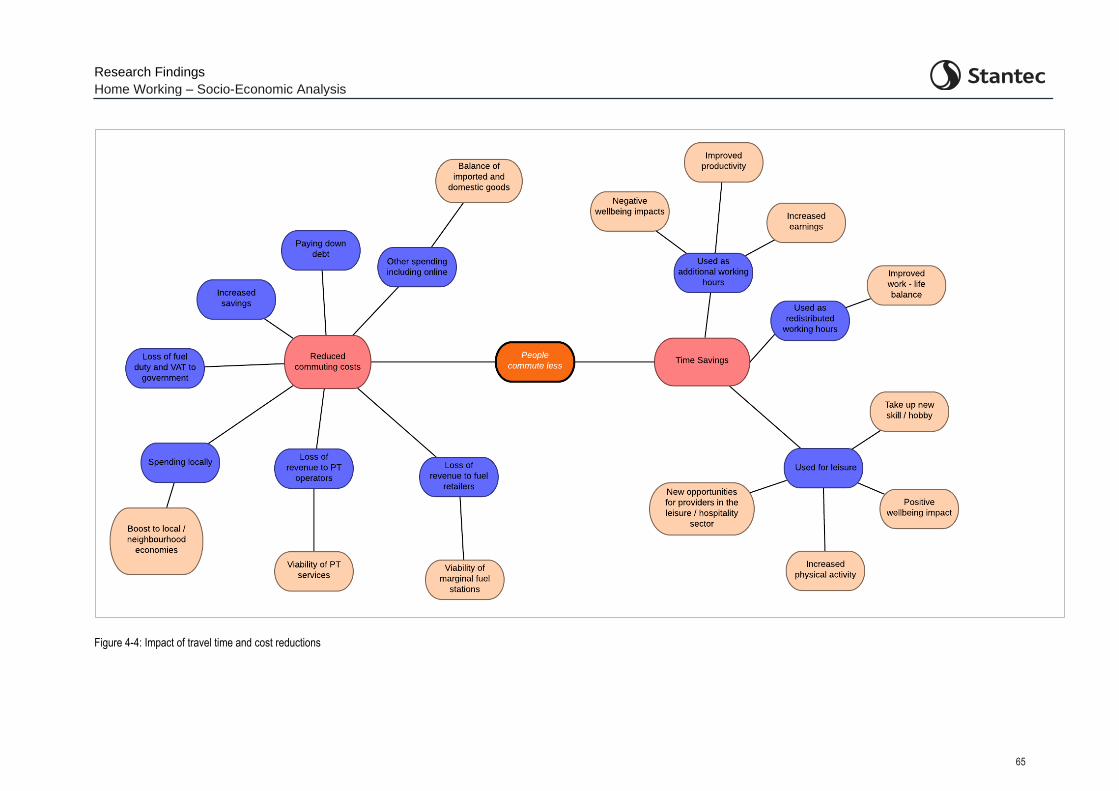
Research Findings
Home Working – Socio-Economic Analysis
65
Figure 4-4: Impact of travel time and cost reductions
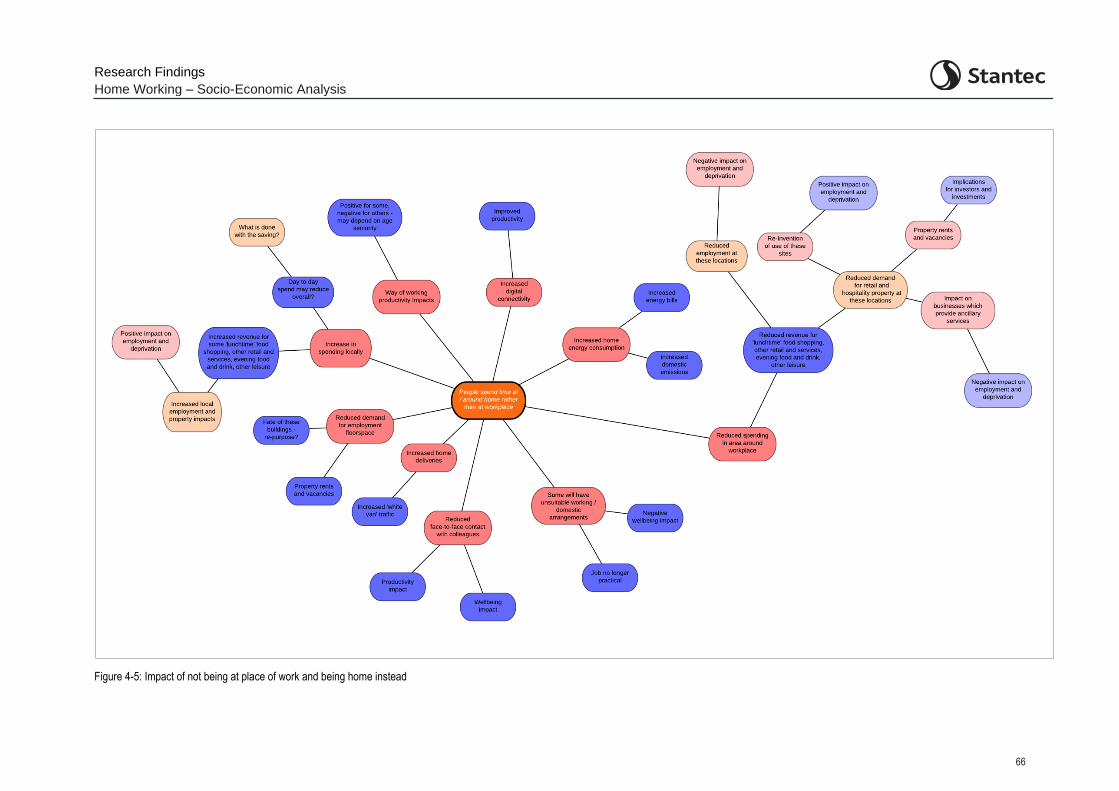
Research Findings
Home Working – Socio-Economic Analysis
66
Figure 4-5: Impact of not being at place of work and being home instead
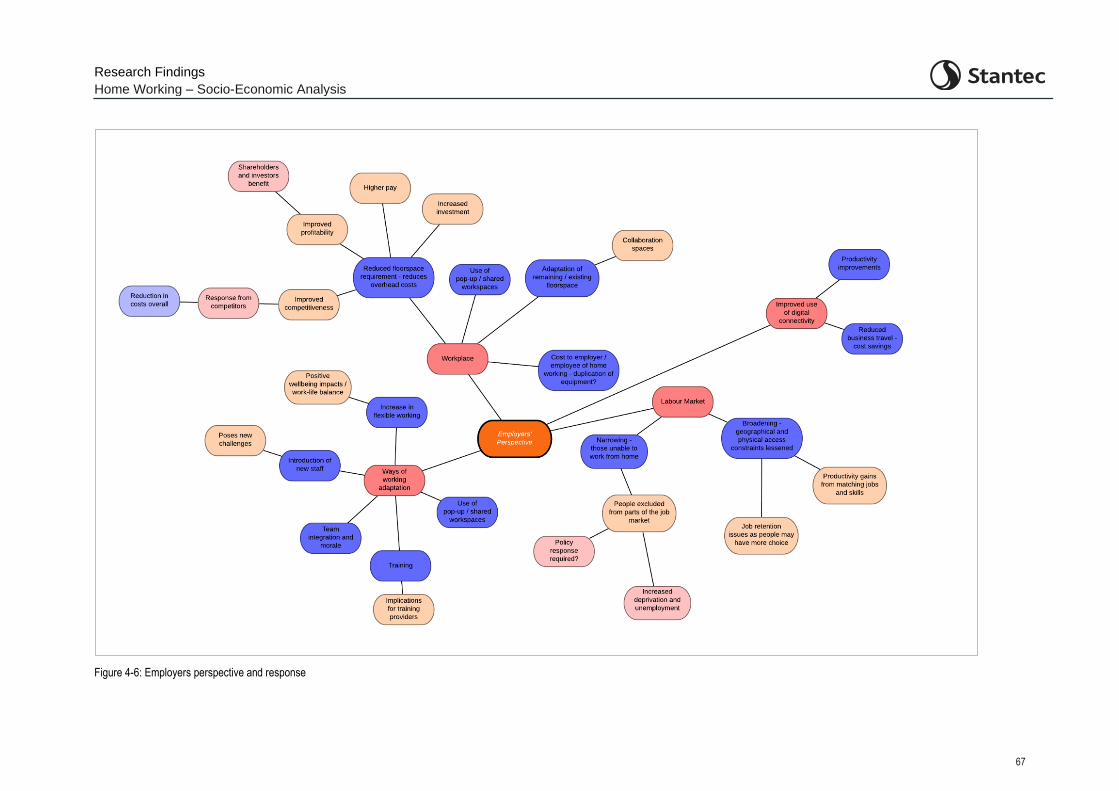
Research Findings
Home Working – Socio-Economic Analysis
67
Figure 4-6: Employers perspective and response
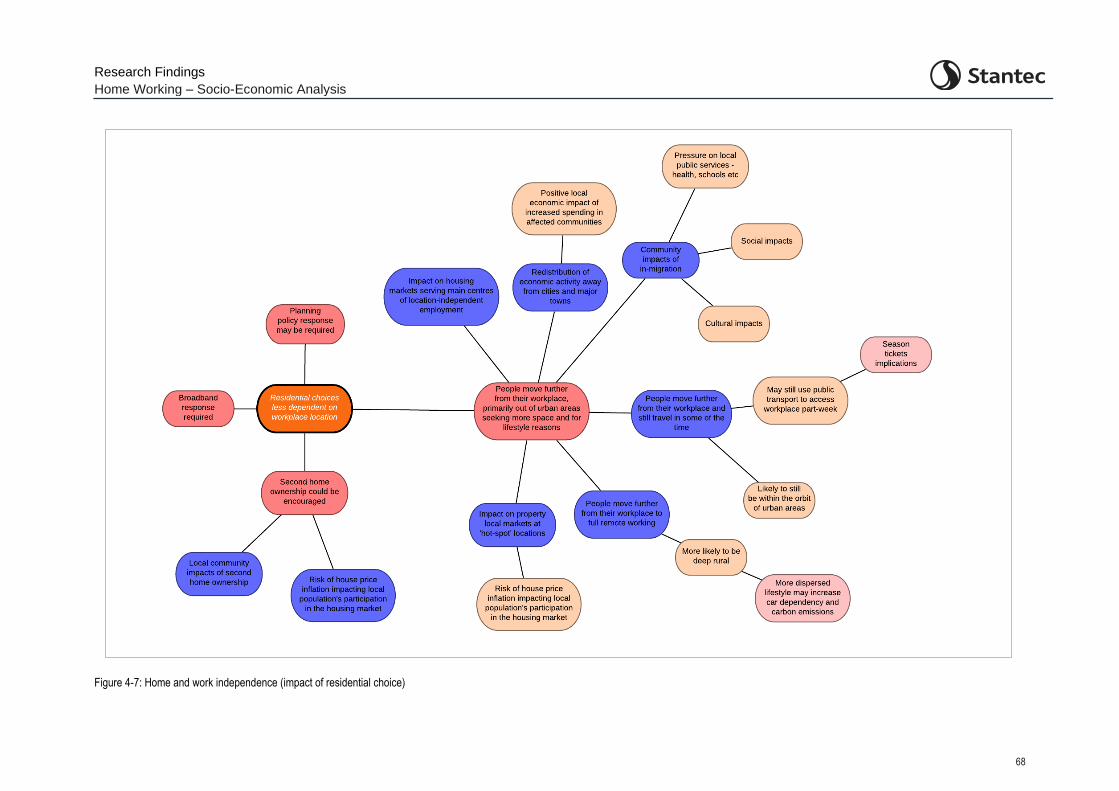
Research Findings
Home Working – Socio-Economic Analysis
68
Figure 4-7: Home and work independence (impact of residential choice)
Research Findings
Home Working – Socio-Economic Analysis
69
5 Potential Policy Responses
5.1 Introduction
5.1.1 As presented in the mind-mapping in Section 4, there are a wide range of transport network and travel behaviour consequences as well as potential social and economic consequences of increased home working. Some consequences can be viewed as positive for society at large and some as negative. Others can be viewed as both positive and negative depending on the impact to different parts of society.
5.1.2 There are some resultant changes emerging which present new opportunities for society and / or a policy response may be required by government with respect to either market failure or undesirable economic, environmental or societal outcomes. There are also opportunities to lock in positive changes. These have been considered and collated here to understand what those policy responses may comprise.
5.2 Mapping the Policy Response
5.2.1 Scotland National Transport Strategy 2 (NTS2) was published in February 2020 and sets out a vision for the transport system in Scotland, underpinned by four Priorities, each with associated Outcomes:
Reduced inequalities
o Will provide fair access to services we need
o Will be easy to use for all
o Will be affordable for all
Takes climate action
o Will help deliver our net-zero target
o Will adapt to the effects of climate change
o Will promote greener, cleaner choices
Helps deliver inclusive economic growth
o Will get people and goods where they need to get to
o Will be reliable, efficient and high quality
o Will use beneficial innovation
Improves our health and wellbeing
o Will be safe and secure for all
o Will enable us to make healthy travel choices
o Will help make our communities great places to live
5.2.2 For the first three mind-maps presented in Section 4, these relate directly to changes to commuting travel by the differing modes. For the impacts identified within these mind-maps,

Research Findings
Home Working – Socio-Economic Analysis
70
the range of potential impacts have been mapped against the four NTS2 Priorities and their associated Outcomes. The potential need for a policy response has then been identified.
5.2.3 For the four remaining mind-maps which are more focussed on social and economic impacts, mapping against the NTS2 Priorities and their associated Outcomes is not appropriate. In this case, a general commentary is provided and the potential need for a policy response has then been identified.
5.2.4 The outcomes of this mapping and policy response identification are presented in Table 5.1 to Table 5.7.
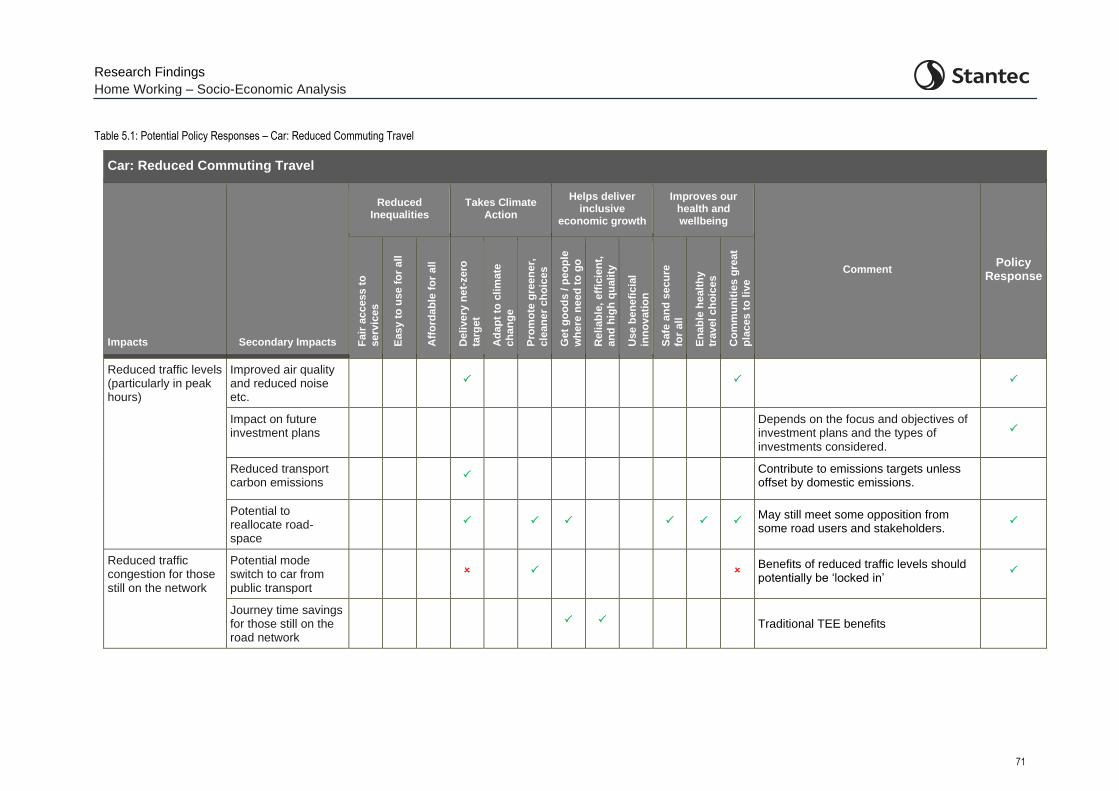
Research Findings
Home Working – Socio-Economic Analysis
71
Table 5.1: Potential Policy Responses – Car: Reduced Commuting Travel
Car: Reduced Commuting Travel
Impacts Secondary Impacts
Reduced Inequalities
Takes Climate Action
Helps deliver inclusive
economic growth
Improves our health and wellbeing
Comment Policy
Response
Fa
ir a
ccess t
o
serv
ices
Easy t
o u
se f
or
all
Aff
ord
ab
le f
or
all
Deli
very
ne
t-zero
targ
et
Ad
ap
t to
clim
ate
ch
an
ge
Pro
mo
te g
reen
er,
cle
an
er
ch
oic
es
Get
go
od
s / p
eo
ple
wh
ere
ne
ed
to
go
Reli
ab
le,
eff
icie
nt,
an
d h
igh
qu
ali
ty
Use b
en
efi
cia
l
inn
ov
ati
on
Safe
an
d s
ecu
re
for
all
En
ab
le h
ealt
hy
travel
ch
oic
es
Co
mm
un
itie
s g
reat
pla
ces t
o liv
e
Reduced traffic levels (particularly in peak hours)
Improved air quality and reduced noise etc.
Impact on future investment plans
Depends on the focus and objectives of investment plans and the types of investments considered.
Reduced transport carbon emissions
Contribute to emissions targets unless
offset by domestic emissions.
Potential to reallocate road-space
May still meet some opposition from some road users and stakeholders.
Reduced traffic congestion for those still on the network
Potential mode switch to car from public transport
Benefits of reduced traffic levels should potentially be ‘locked in’
Journey time savings for those still on the road network
Traditional TEE benefits
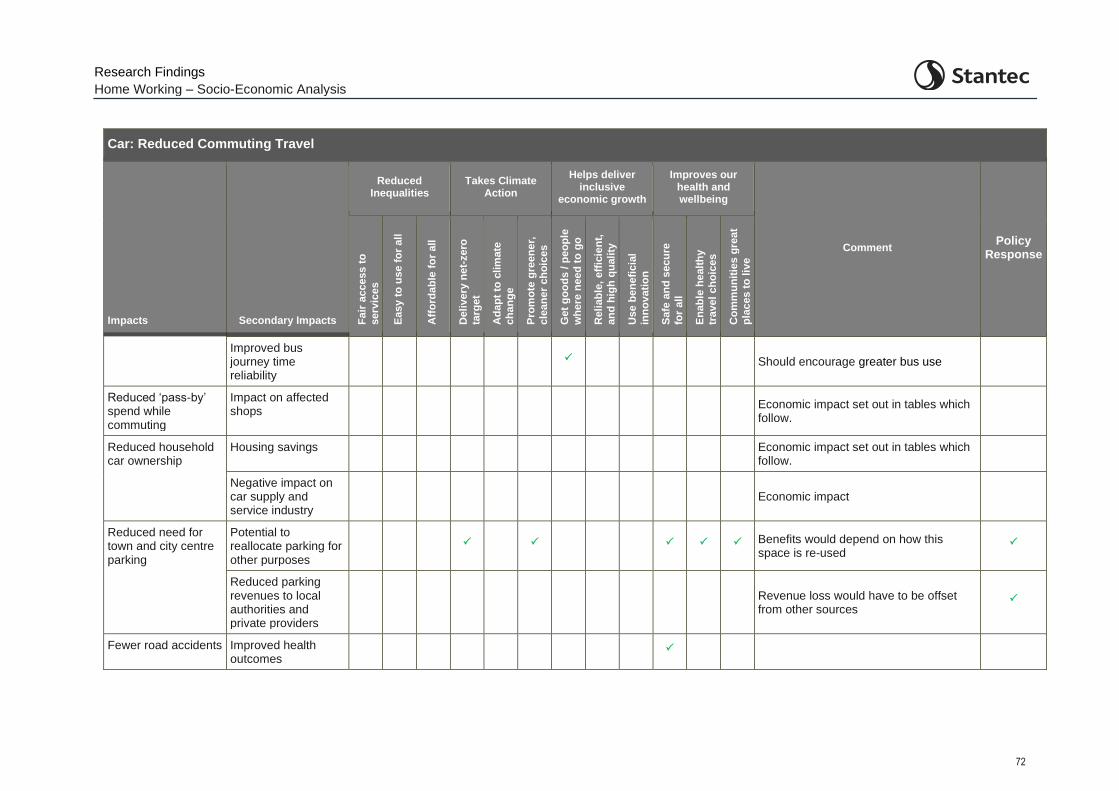
Research Findings
Home Working – Socio-Economic Analysis
72
Car: Reduced Commuting Travel
Impacts Secondary Impacts
Reduced Inequalities
Takes Climate Action
Helps deliver inclusive
economic growth
Improves our health and wellbeing
Comment Policy
Response
Fa
ir a
ccess t
o
serv
ices
Easy t
o u
se f
or
all
Aff
ord
ab
le f
or
all
Deli
very
ne
t-zero
targ
et
Ad
ap
t to
clim
ate
ch
an
ge
Pro
mo
te g
reen
er,
cle
an
er
ch
oic
es
Get
go
od
s / p
eo
ple
wh
ere
ne
ed
to
go
Reli
ab
le,
eff
icie
nt,
an
d h
igh
qu
ali
ty
Use b
en
efi
cia
l
inn
ov
ati
on
Safe
an
d s
ecu
re
for
all
En
ab
le h
ealt
hy
travel
ch
oic
es
Co
mm
un
itie
s g
reat
pla
ces t
o liv
e
Improved bus journey time reliability
Should encourage greater bus use
Reduced ‘pass-by’ spend while commuting
Impact on affected shops Economic impact set out in tables which
follow.
Reduced household car ownership
Housing savings Economic impact set out in tables which follow.
Negative impact on car supply and service industry
Economic impact
Reduced need for town and city centre parking
Potential to reallocate parking for other purposes
Benefits would depend on how this space is re-used
Reduced parking revenues to local authorities and private providers
Revenue loss would have to be offset from other sources
Fewer road accidents Improved health outcomes
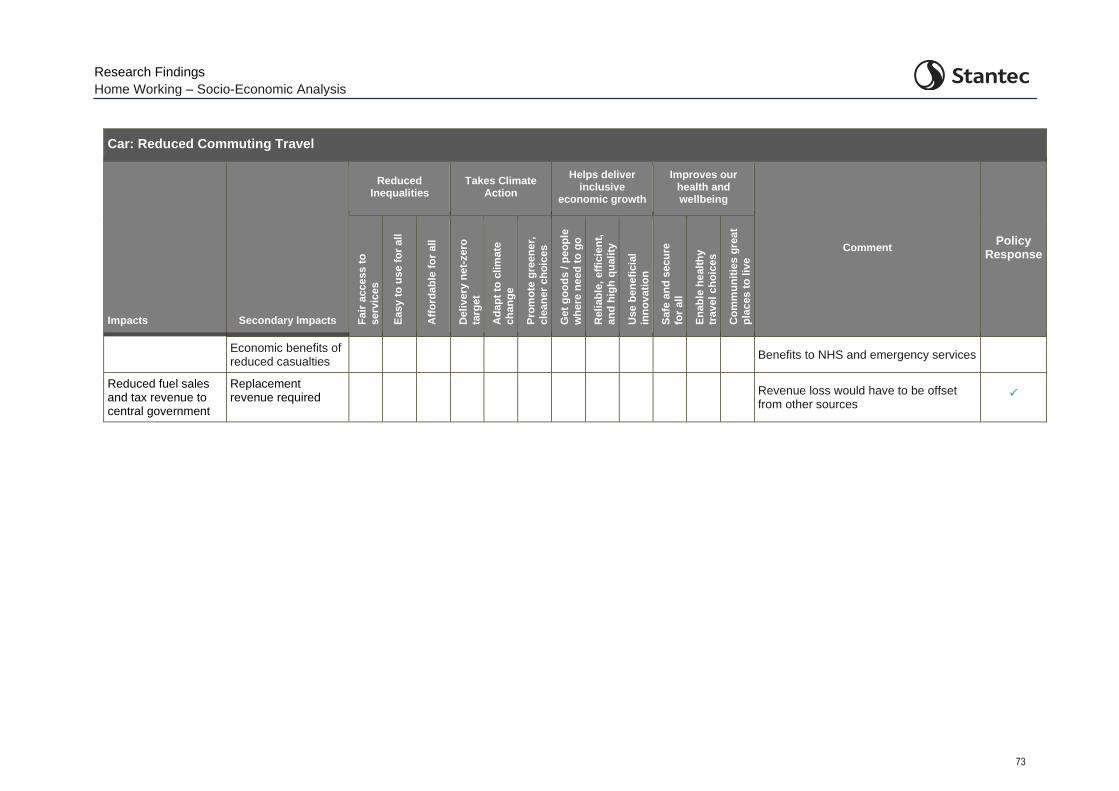
Research Findings
Home Working – Socio-Economic Analysis
73
Car: Reduced Commuting Travel
Impacts Secondary Impacts
Reduced Inequalities
Takes Climate Action
Helps deliver inclusive
economic growth
Improves our health and wellbeing
Comment Policy
Response
Fa
ir a
ccess t
o
serv
ices
Easy t
o u
se f
or
all
Aff
ord
ab
le f
or
all
Deli
very
ne
t-zero
targ
et
Ad
ap
t to
clim
ate
ch
an
ge
Pro
mo
te g
reen
er,
cle
an
er
ch
oic
es
Get
go
od
s / p
eo
ple
wh
ere
ne
ed
to
go
Reli
ab
le,
eff
icie
nt,
an
d h
igh
qu
ali
ty
Use b
en
efi
cia
l
inn
ov
ati
on
Safe
an
d s
ecu
re
for
all
En
ab
le h
ealt
hy
travel
ch
oic
es
Co
mm
un
itie
s g
reat
pla
ces t
o liv
e
Economic benefits of reduced casualties
Benefits to NHS and emergency services
Reduced fuel sales and tax revenue to central government
Replacement revenue required
Revenue loss would have to be offset from other sources
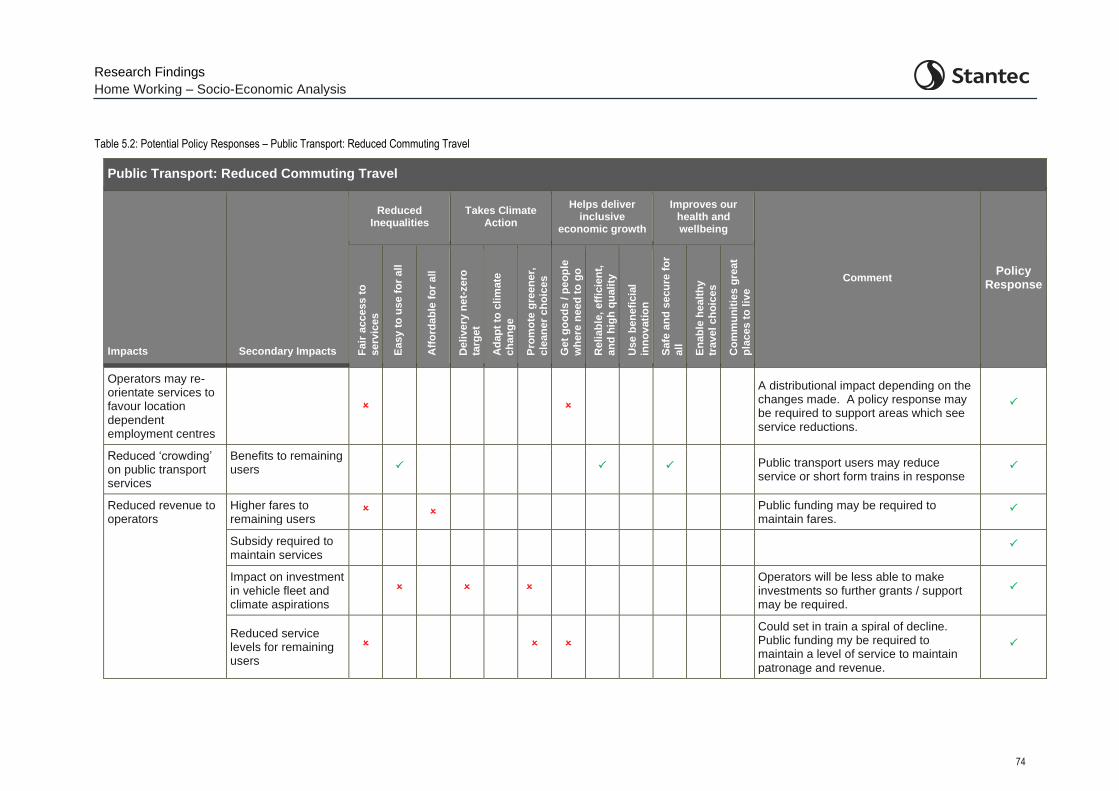
Research Findings
Home Working – Socio-Economic Analysis
74
Table 5.2: Potential Policy Responses – Public Transport: Reduced Commuting Travel
Public Transport: Reduced Commuting Travel
Impacts Secondary Impacts
Reduced Inequalities
Takes Climate Action
Helps deliver inclusive
economic growth
Improves our health and wellbeing
Comment Policy
Response
Fa
ir a
ccess t
o
serv
ices
Easy t
o u
se f
or
all
Aff
ord
ab
le f
or
all
Deli
very
ne
t-zero
targ
et
Ad
ap
t to
clim
ate
ch
an
ge
Pro
mo
te g
reen
er,
cle
an
er
ch
oic
es
Get
go
od
s / p
eo
ple
wh
ere
ne
ed
to
go
Reli
ab
le,
eff
icie
nt,
an
d h
igh
qu
ali
ty
Use b
en
efi
cia
l
inn
ov
ati
on
Safe
an
d s
ecu
re f
or
all
En
ab
le h
ealt
hy
travel
ch
oic
es
Co
mm
un
itie
s g
reat
pla
ces t
o liv
e
Operators may re-orientate services to favour location dependent employment centres
A distributional impact depending on the changes made. A policy response may be required to support areas which see service reductions.
Reduced ‘crowding’ on public transport services
Benefits to remaining users Public transport users may reduce
service or short form trains in response
Reduced revenue to operators
Higher fares to remaining users
Public funding may be required to maintain fares.
Subsidy required to maintain services
Impact on investment in vehicle fleet and climate aspirations
Operators will be less able to make investments so further grants / support may be required.
Reduced service levels for remaining users
Could set in train a spiral of decline. Public funding my be required to maintain a level of service to maintain patronage and revenue.
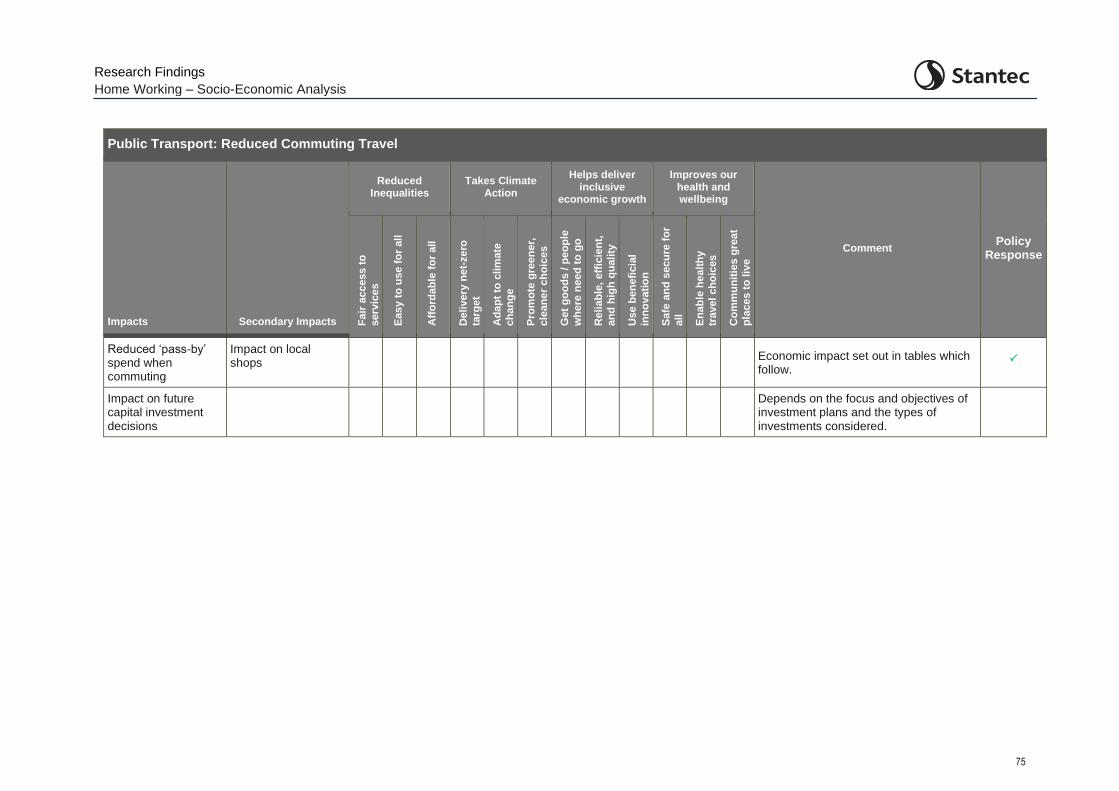
Research Findings
Home Working – Socio-Economic Analysis
75
Public Transport: Reduced Commuting Travel
Impacts Secondary Impacts
Reduced Inequalities
Takes Climate Action
Helps deliver inclusive
economic growth
Improves our health and wellbeing
Comment Policy
Response
Fa
ir a
ccess t
o
serv
ices
Easy t
o u
se f
or
all
Aff
ord
ab
le f
or
all
Deli
very
ne
t-zero
targ
et
Ad
ap
t to
clim
ate
ch
an
ge
Pro
mo
te g
reen
er,
cle
an
er
ch
oic
es
Get
go
od
s / p
eo
ple
wh
ere
ne
ed
to
go
Reli
ab
le,
eff
icie
nt,
an
d h
igh
qu
ali
ty
Use b
en
efi
cia
l
inn
ov
ati
on
Safe
an
d s
ecu
re f
or
all
En
ab
le h
ealt
hy
travel
ch
oic
es
Co
mm
un
itie
s g
reat
pla
ces t
o liv
e
Reduced ‘pass-by’ spend when commuting
Impact on local shops Economic impact set out in tables which
follow.
Impact on future capital investment decisions
Depends on the focus and objectives of investment plans and the types of investments considered.
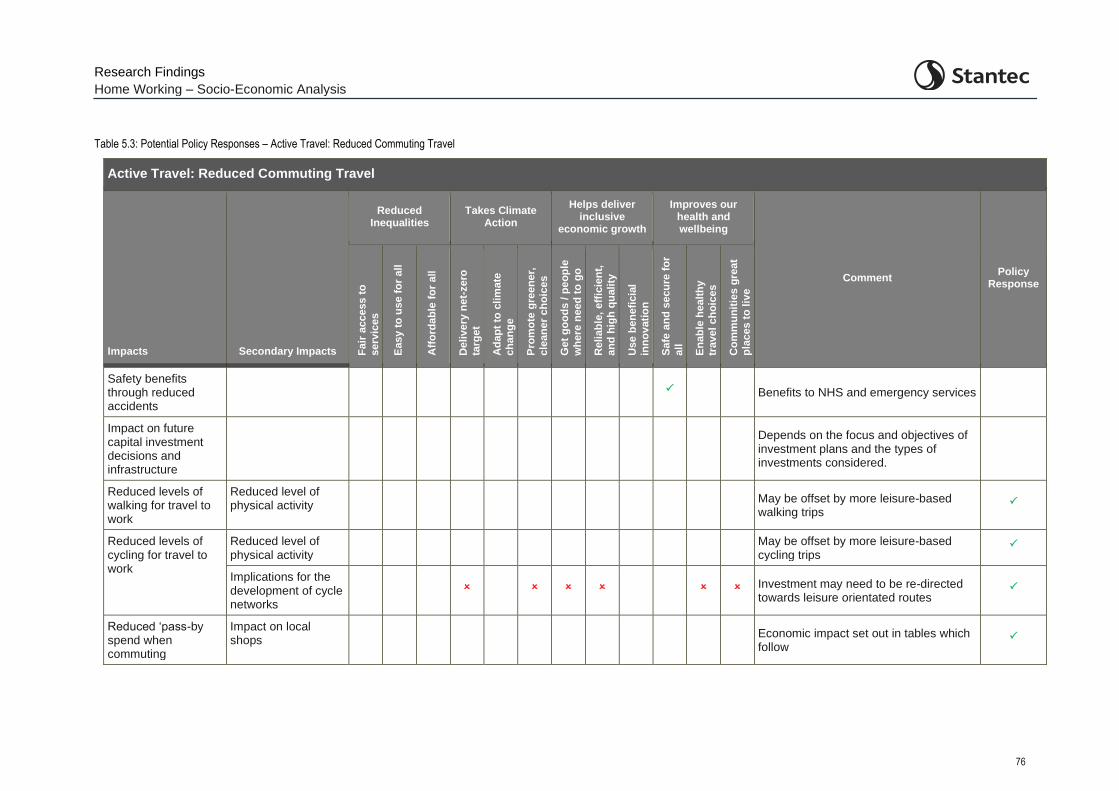
Research Findings
Home Working – Socio-Economic Analysis
76
Table 5.3: Potential Policy Responses – Active Travel: Reduced Commuting Travel
Active Travel: Reduced Commuting Travel
Impacts Secondary Impacts
Reduced Inequalities
Takes Climate Action
Helps deliver inclusive
economic growth
Improves our health and wellbeing
Comment Policy
Response
Fa
ir a
ccess t
o
serv
ices
Easy t
o u
se f
or
all
Aff
ord
ab
le f
or
all
Deli
very
ne
t-zero
targ
et
Ad
ap
t to
clim
ate
ch
an
ge
Pro
mo
te g
reen
er,
cle
an
er
ch
oic
es
Get
go
od
s / p
eo
ple
wh
ere
ne
ed
to
go
Reli
ab
le,
eff
icie
nt,
an
d h
igh
qu
ali
ty
Use b
en
efi
cia
l
inn
ov
ati
on
Safe
an
d s
ecu
re f
or
all
En
ab
le h
ealt
hy
travel
ch
oic
es
Co
mm
un
itie
s g
reat
pla
ces t
o liv
e
Safety benefits through reduced accidents
Benefits to NHS and emergency services
Impact on future capital investment decisions and infrastructure
Depends on the focus and objectives of investment plans and the types of investments considered.
Reduced levels of walking for travel to work
Reduced level of physical activity May be offset by more leisure-based
walking trips
Reduced levels of cycling for travel to work
Reduced level of physical activity
May be offset by more leisure-based cycling trips
Implications for the development of cycle networks
Investment may need to be re-directed towards leisure orientated routes
Reduced ‘pass-by spend when commuting
Impact on local shops Economic impact set out in tables which
follow
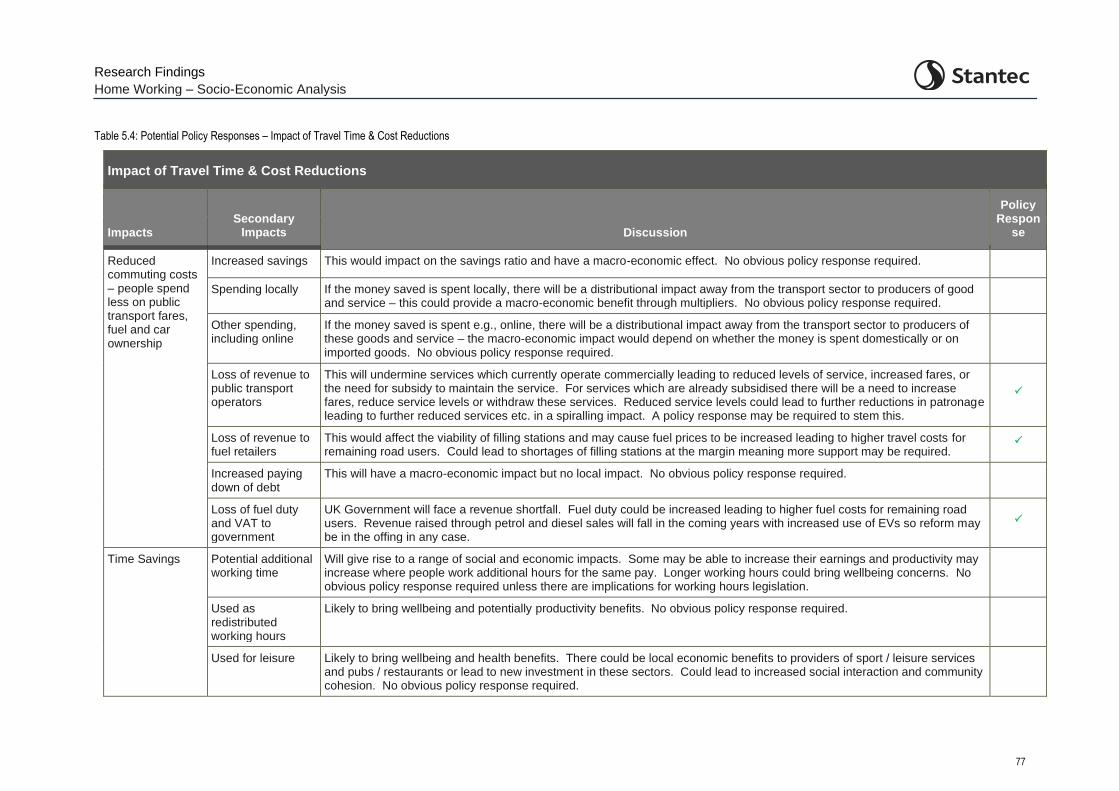
Research Findings
Home Working – Socio-Economic Analysis
77
Table 5.4: Potential Policy Responses – Impact of Travel Time & Cost Reductions
Impact of Travel Time & Cost Reductions
Impacts Secondary
Impacts Discussion
Policy Respon
se
Reduced commuting costs – people spend less on public transport fares, fuel and car ownership
Increased savings This would impact on the savings ratio and have a macro-economic effect. No obvious policy response required.
Spending locally If the money saved is spent locally, there will be a distributional impact away from the transport sector to producers of good and service – this could provide a macro-economic benefit through multipliers. No obvious policy response required.
Other spending, including online
If the money saved is spent e.g., online, there will be a distributional impact away from the transport sector to producers of these goods and service – the macro-economic impact would depend on whether the money is spent domestically or on imported goods. No obvious policy response required.
Loss of revenue to public transport operators
This will undermine services which currently operate commercially leading to reduced levels of service, increased fares, or the need for subsidy to maintain the service. For services which are already subsidised there will be a need to increase fares, reduce service levels or withdraw these services. Reduced service levels could lead to further reductions in patronage leading to further reduced services etc. in a spiralling impact. A policy response may be required to stem this.
Loss of revenue to fuel retailers
This would affect the viability of filling stations and may cause fuel prices to be increased leading to higher travel costs for remaining road users. Could lead to shortages of filling stations at the margin meaning more support may be required.
Increased paying down of debt
This will have a macro-economic impact but no local impact. No obvious policy response required.
Loss of fuel duty and VAT to government
UK Government will face a revenue shortfall. Fuel duty could be increased leading to higher fuel costs for remaining road users. Revenue raised through petrol and diesel sales will fall in the coming years with increased use of EVs so reform may be in the offing in any case.
Time Savings Potential additional working time
Will give rise to a range of social and economic impacts. Some may be able to increase their earnings and productivity may increase where people work additional hours for the same pay. Longer working hours could bring wellbeing concerns. No obvious policy response required unless there are implications for working hours legislation.
Used as redistributed working hours
Likely to bring wellbeing and potentially productivity benefits. No obvious policy response required.
Used for leisure Likely to bring wellbeing and health benefits. There could be local economic benefits to providers of sport / leisure services and pubs / restaurants or lead to new investment in these sectors. Could lead to increased social interaction and community cohesion. No obvious policy response required.
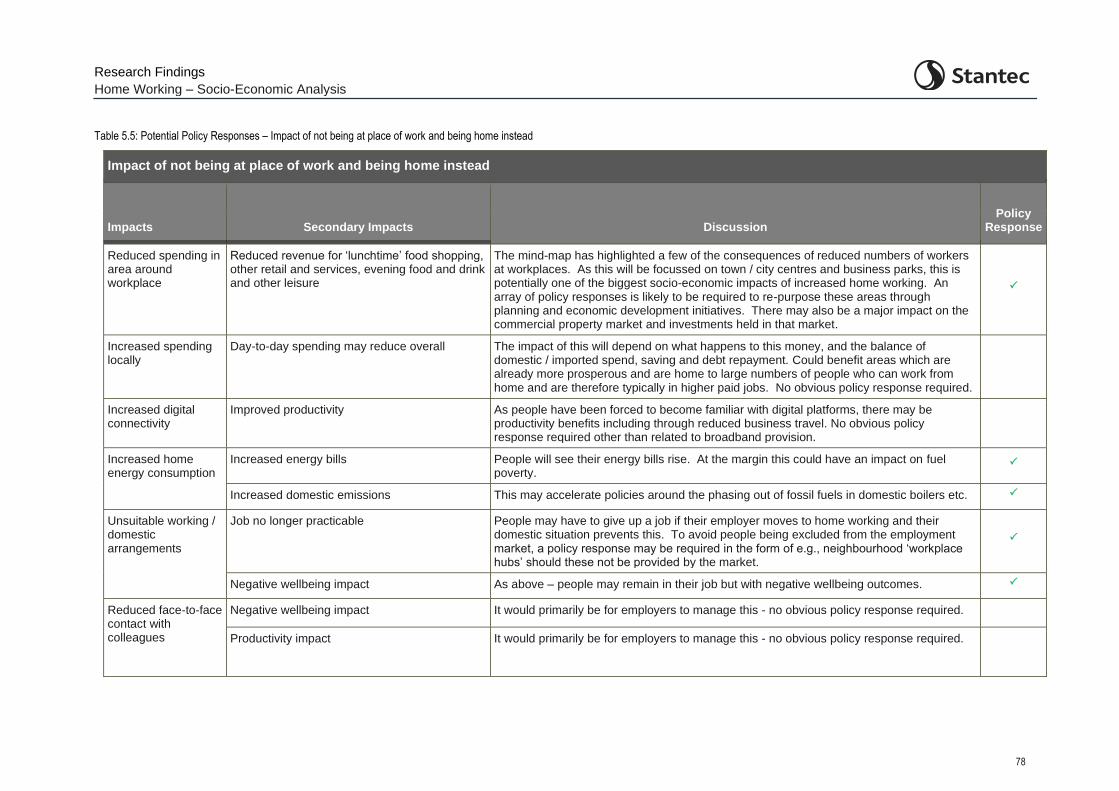
Research Findings
Home Working – Socio-Economic Analysis
78
Table 5.5: Potential Policy Responses – Impact of not being at place of work and being home instead
Impact of not being at place of work and being home instead
Impacts Secondary Impacts Discussion Policy
Response
Reduced spending in area around workplace
Reduced revenue for ‘lunchtime’ food shopping, other retail and services, evening food and drink and other leisure
The mind-map has highlighted a few of the consequences of reduced numbers of workers at workplaces. As this will be focussed on town / city centres and business parks, this is potentially one of the biggest socio-economic impacts of increased home working. An array of policy responses is likely to be required to re-purpose these areas through planning and economic development initiatives. There may also be a major impact on the commercial property market and investments held in that market.
Increased spending locally
Day-to-day spending may reduce overall The impact of this will depend on what happens to this money, and the balance of domestic / imported spend, saving and debt repayment. Could benefit areas which are already more prosperous and are home to large numbers of people who can work from home and are therefore typically in higher paid jobs. No obvious policy response required.
Increased digital connectivity
Improved productivity As people have been forced to become familiar with digital platforms, there may be productivity benefits including through reduced business travel. No obvious policy response required other than related to broadband provision.
Increased home energy consumption
Increased energy bills People will see their energy bills rise. At the margin this could have an impact on fuel poverty.
Increased domestic emissions This may accelerate policies around the phasing out of fossil fuels in domestic boilers etc.
Unsuitable working / domestic arrangements
Job no longer practicable People may have to give up a job if their employer moves to home working and their domestic situation prevents this. To avoid people being excluded from the employment market, a policy response may be required in the form of e.g., neighbourhood ‘workplace hubs’ should these not be provided by the market.
Negative wellbeing impact As above – people may remain in their job but with negative wellbeing outcomes.
Reduced face-to-face contact with colleagues
Negative wellbeing impact It would primarily be for employers to manage this - no obvious policy response required.
Productivity impact
It would primarily be for employers to manage this - no obvious policy response required.
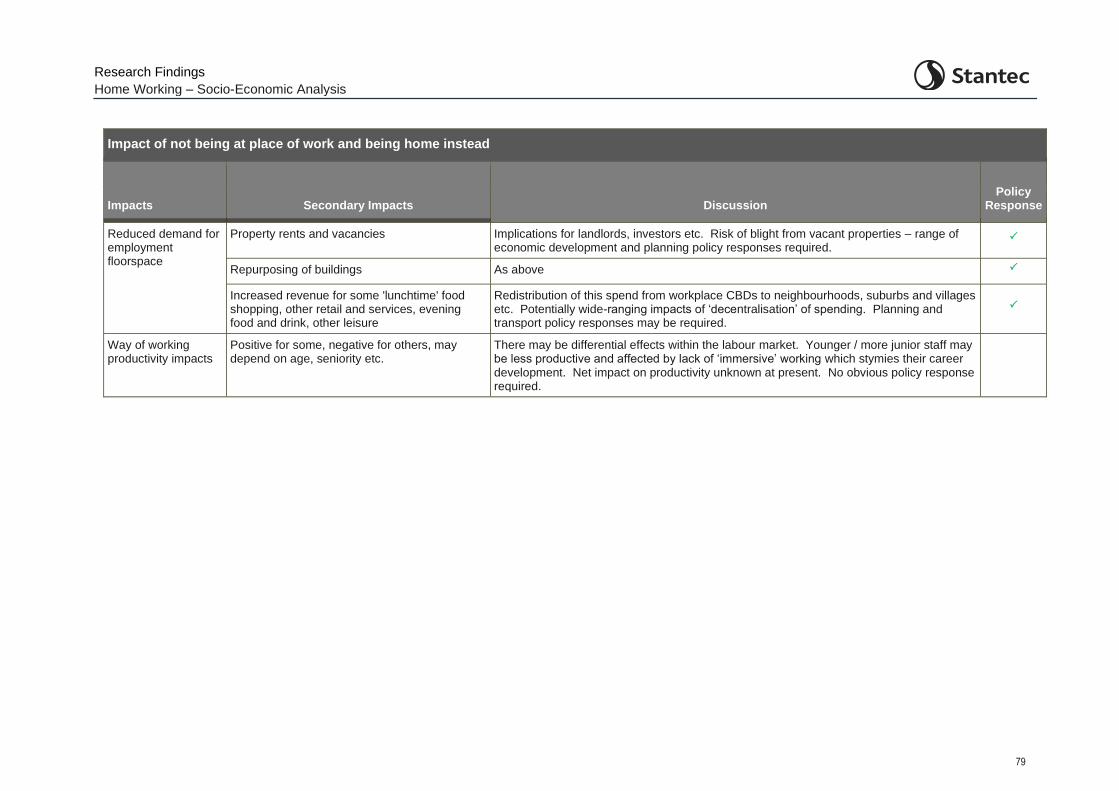
Research Findings
Home Working – Socio-Economic Analysis
79
Impact of not being at place of work and being home instead
Impacts Secondary Impacts Discussion Policy
Response
Reduced demand for employment floorspace
Property rents and vacancies Implications for landlords, investors etc. Risk of blight from vacant properties – range of economic development and planning policy responses required.
Repurposing of buildings As above
Increased revenue for some 'lunchtime' food shopping, other retail and services, evening food and drink, other leisure
Redistribution of this spend from workplace CBDs to neighbourhoods, suburbs and villages etc. Potentially wide-ranging impacts of ‘decentralisation’ of spending. Planning and transport policy responses may be required.
Way of working productivity impacts
Positive for some, negative for others, may depend on age, seniority etc.
There may be differential effects within the labour market. Younger / more junior staff may be less productive and affected by lack of ‘immersive’ working which stymies their career development. Net impact on productivity unknown at present. No obvious policy response required.
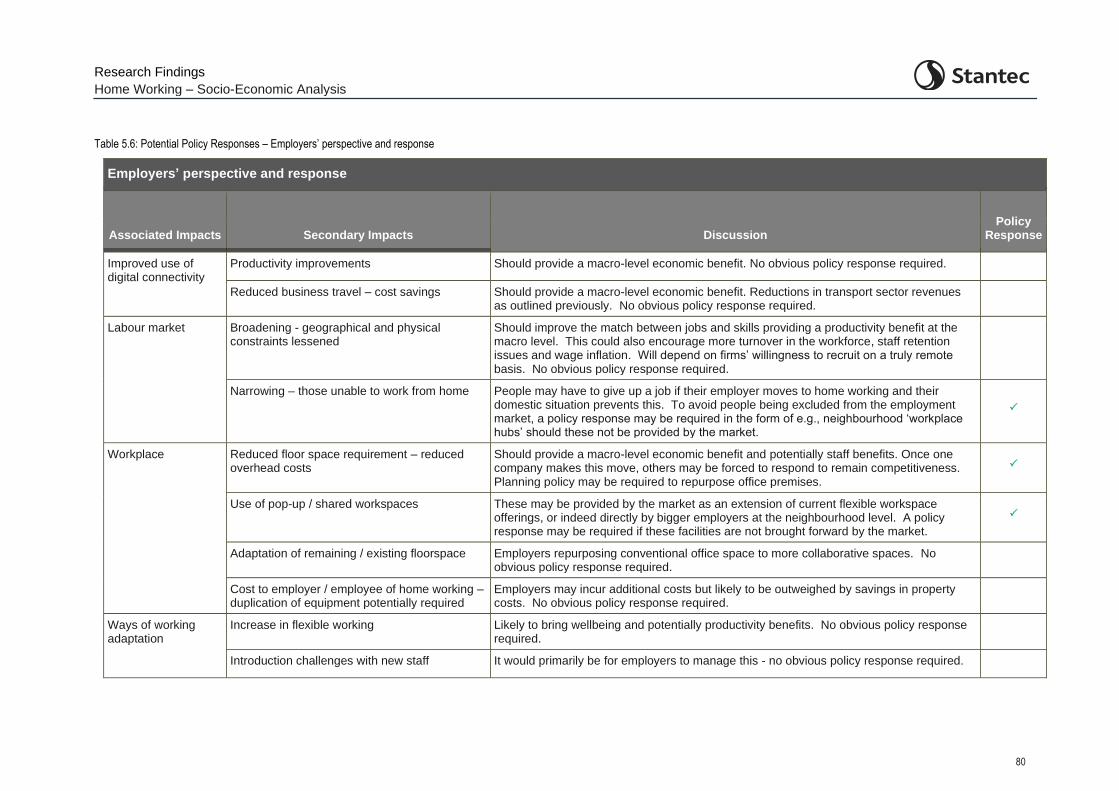
Research Findings
Home Working – Socio-Economic Analysis
80
Table 5.6: Potential Policy Responses – Employers’ perspective and response
Employers’ perspective and response
Associated Impacts Secondary Impacts Discussion Policy
Response
Improved use of digital connectivity
Productivity improvements Should provide a macro-level economic benefit. No obvious policy response required.
Reduced business travel – cost savings Should provide a macro-level economic benefit. Reductions in transport sector revenues as outlined previously. No obvious policy response required.
Labour market Broadening - geographical and physical constraints lessened
Should improve the match between jobs and skills providing a productivity benefit at the macro level. This could also encourage more turnover in the workforce, staff retention issues and wage inflation. Will depend on firms’ willingness to recruit on a truly remote basis. No obvious policy response required.
Narrowing – those unable to work from home People may have to give up a job if their employer moves to home working and their domestic situation prevents this. To avoid people being excluded from the employment market, a policy response may be required in the form of e.g., neighbourhood ‘workplace hubs’ should these not be provided by the market.
Workplace Reduced floor space requirement – reduced overhead costs
Should provide a macro-level economic benefit and potentially staff benefits. Once one company makes this move, others may be forced to respond to remain competitiveness. Planning policy may be required to repurpose office premises.
Use of pop-up / shared workspaces These may be provided by the market as an extension of current flexible workspace offerings, or indeed directly by bigger employers at the neighbourhood level. A policy response may be required if these facilities are not brought forward by the market.
Adaptation of remaining / existing floorspace Employers repurposing conventional office space to more collaborative spaces. No obvious policy response required.
Cost to employer / employee of home working – duplication of equipment potentially required
Employers may incur additional costs but likely to be outweighed by savings in property costs. No obvious policy response required.
Ways of working adaptation
Increase in flexible working Likely to bring wellbeing and potentially productivity benefits. No obvious policy response required.
Introduction challenges with new staff It would primarily be for employers to manage this - no obvious policy response required.
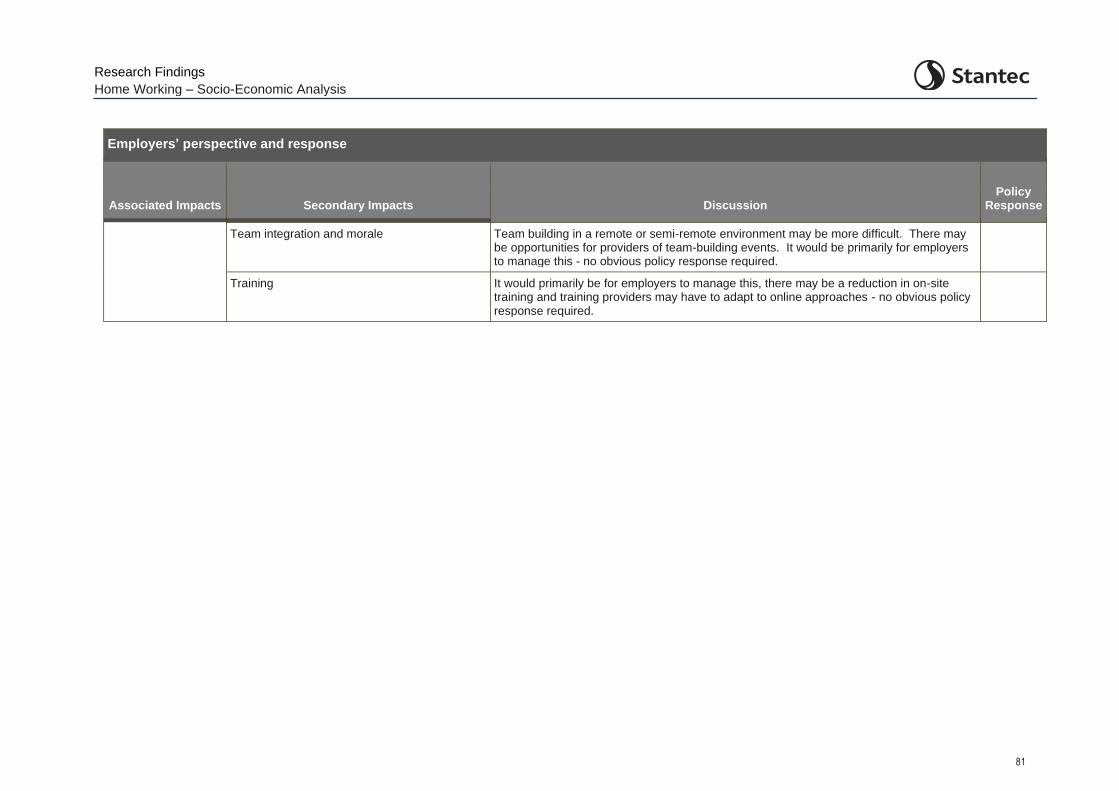
Research Findings
Home Working – Socio-Economic Analysis
81
Employers’ perspective and response
Associated Impacts Secondary Impacts Discussion Policy
Response
Team integration and morale Team building in a remote or semi-remote environment may be more difficult. There may be opportunities for providers of team-building events. It would be primarily for employers to manage this - no obvious policy response required.
Training It would primarily be for employers to manage this, there may be a reduction in on-site training and training providers may have to adapt to online approaches - no obvious policy response required.
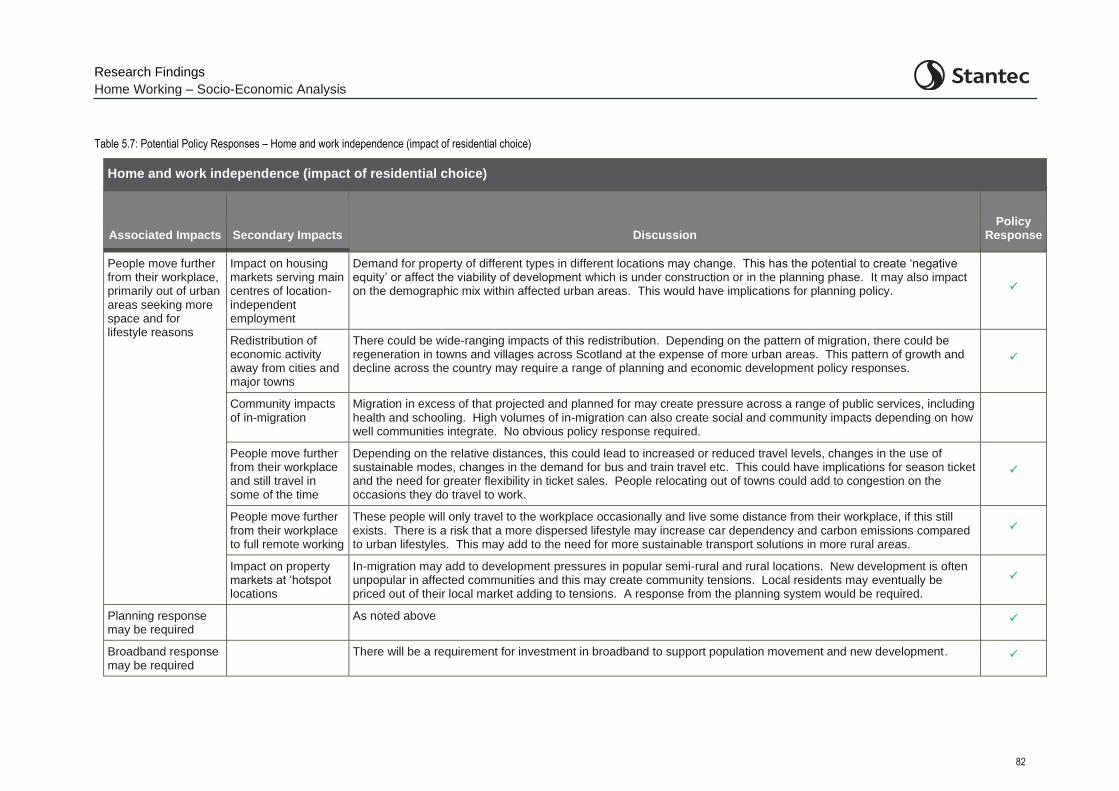
Research Findings
Home Working – Socio-Economic Analysis
82
Table 5.7: Potential Policy Responses – Home and work independence (impact of residential choice)
Home and work independence (impact of residential choice)
Associated Impacts Secondary Impacts Discussion Policy
Response
People move further from their workplace, primarily out of urban areas seeking more space and for lifestyle reasons
Impact on housing markets serving main centres of location-independent employment
Demand for property of different types in different locations may change. This has the potential to create ‘negative equity’ or affect the viability of development which is under construction or in the planning phase. It may also impact on the demographic mix within affected urban areas. This would have implications for planning policy.
Redistribution of economic activity away from cities and major towns
There could be wide-ranging impacts of this redistribution. Depending on the pattern of migration, there could be regeneration in towns and villages across Scotland at the expense of more urban areas. This pattern of growth and decline across the country may require a range of planning and economic development policy responses.
Community impacts of in-migration
Migration in excess of that projected and planned for may create pressure across a range of public services, including health and schooling. High volumes of in-migration can also create social and community impacts depending on how well communities integrate. No obvious policy response required.
People move further from their workplace and still travel in some of the time
Depending on the relative distances, this could lead to increased or reduced travel levels, changes in the use of sustainable modes, changes in the demand for bus and train travel etc. This could have implications for season ticket and the need for greater flexibility in ticket sales. People relocating out of towns could add to congestion on the occasions they do travel to work.
People move further from their workplace to full remote working
These people will only travel to the workplace occasionally and live some distance from their workplace, if this still exists. There is a risk that a more dispersed lifestyle may increase car dependency and carbon emissions compared to urban lifestyles. This may add to the need for more sustainable transport solutions in more rural areas.
Impact on property markets at ‘hotspot locations
In-migration may add to development pressures in popular semi-rural and rural locations. New development is often unpopular in affected communities and this may create community tensions. Local residents may eventually be priced out of their local market adding to tensions. A response from the planning system would be required.
Planning response may be required
As noted above
Broadband response may be required
There will be a requirement for investment in broadband to support population movement and new development.
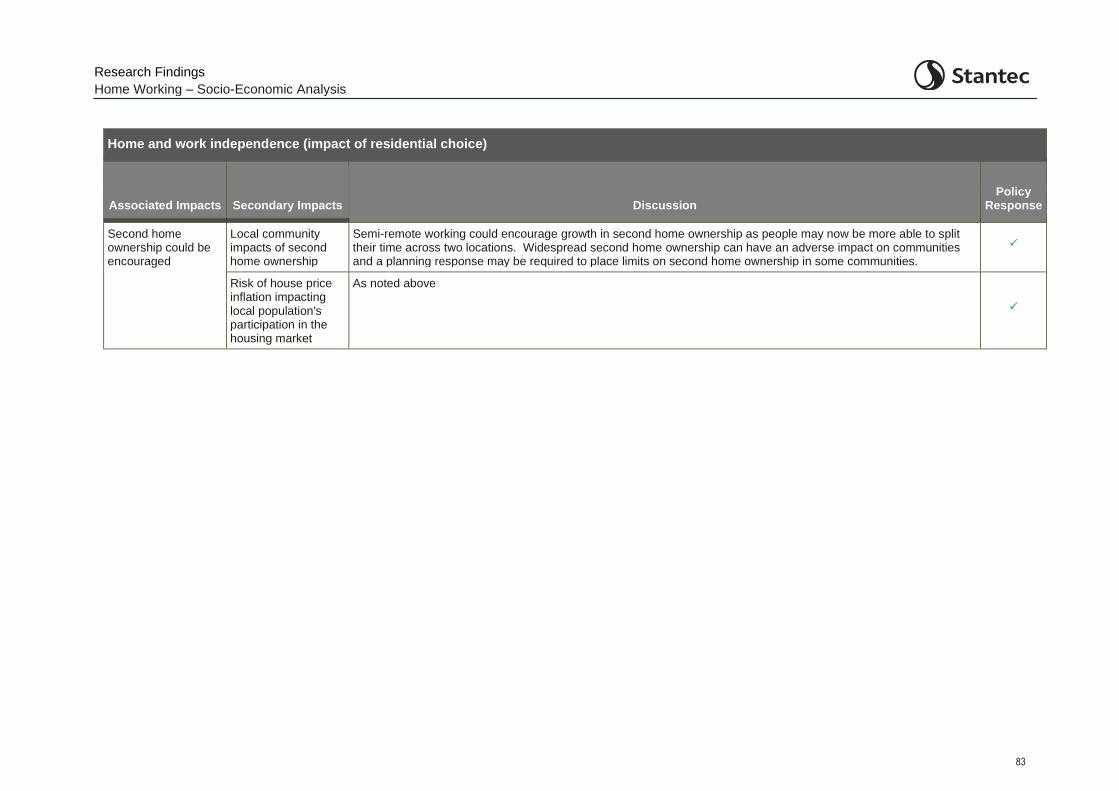
Research Findings
Home Working – Socio-Economic Analysis
83
Home and work independence (impact of residential choice)
Associated Impacts Secondary Impacts Discussion Policy
Response
Second home ownership could be encouraged
Local community impacts of second home ownership
Semi-remote working could encourage growth in second home ownership as people may now be more able to split their time across two locations. Widespread second home ownership can have an adverse impact on communities and a planning response may be required to place limits on second home ownership in some communities.
Risk of house price inflation impacting local population's participation in the housing market
As noted above
Research Findings
Home Working – Socio-Economic Analysis
84
5.3 Summary of Impacts of Increased Home Working
5.3.1 A wide range of potential impacts and associated policy responses which may be required has been identified above. Many of the socio-economic impacts of increased home working will be a mixture of positive and negative impacts, most fundamentally associated with a redistribution of where people spend time and money. The main impacts are summarised below.
Transport behaviour impacts
Reduced peak hour travel by all modes and associated reductions in emissions, noise etc., traffic congestion, accidents and crowding on public transport services – this will be offset by any travel generated in the course of the day when home working or during any increased leisure time
Benefits in the shape of reduced peak hour journey times and improved journey time reliability due to lower traffic levels for those still making trips
Reduced demand for public transport services
Reduced levels of walking and cycling associated with commuting - again this will be offset by any walking and cycling generated in the course of the day when home working or during any increased leisure time
Impacts of reductions in commuting travel time and costs
Reduced money spent on travelling to / from work – this will result in a range of winners and losers as this money is either e.g., spent elsewhere, saved, used to pay down debt, or spent on imported goods
Reduced time spent travelling to / from work – can be used for leisure, flexible working, additional working etc. so there would be a range of impacts associated with each of these
Impacts of spending time at home and not at the workplace
Distributional impacts of change in daytime spending from the workplace to the home area - will affect businesses which rely on workplace footfall and benefit those more locally
Requirement for good digital connectivity and increased home fuel use (implications for household costs and emissions)
Some people’s domestic arrangements are not conducive to home working with implications for continuing employment for them
Personal productivity may be positively or negatively affected – some will also have a negative well-being impact due to decreased personal interaction with colleagues
Reduced demand for employment floorspace – with major implications for support services, the commercial property market and the future role of city centres / business parks
Research Findings
Home Working – Socio-Economic Analysis
85
Employers’ perspective
Availability of labour could both broaden and contract due to loosening of geographical constraints but some being locked out of the job market due to unsuitable domestic arrangements
Productivity – again pros and cons, although digital approaches should bring gains, there may be issues incorporating new and particularly young staff into organisations and providing effective training, career development and team building
Costs – presents an opportunity to significantly reduce overheads by cutting back on office space and replacing business travel with virtual meetings
Adaptation – there may be an element of competition between employers to provide the best balance of workplace / work from anywhere arrangements
Loosening or breaking of link between home and the workplace
This could bring a substantial change in the distribution of population across Scotland as people move further away from their workplace to take advantage of cheaper property and / or larger property and / or to live in a more attractive location. There would be a range of social and economic impacts in terms of communities affected and provision of public services in areas which see significant in-migration.
5.4 Summary of Potential Areas where a Policy Response may be Required
5.4.1 The potential areas where policy responses may be required are summarised below.
Transport
Loss of public transport revenue (and particularly season tickets in their current form) will undermine commercial services and imply increased subsidy or fares to maintain existing services – there is a risk of a spiralling impact of reduced patronage leading to reduced service levels leading to reduced patronage and so on
The form of the public transport ‘offer’ based on high capacity peak hour provision to serve city centres may have to be reviewed – the nature of the network of services may also have to evolve in line with changing demand
Additional car use may have become embedded for some throughout the pandemic increasing traffic and emissions – a policy response may be required to encourage these people back onto public transport. This increase in car use (mode shift) could offset the reduction in car use caused by decreased commuting.
For some there will have been a loss of physical activity which was previously integrated into their daily routines whilst commuting. Although there is evidence that people are more willing to walk / cycle for leisure and as a substitute for other modes, this may be transient, so a policy response may be required to reinforce the ‘good’ habits people developed during lockdown.
Future investments in ‘mass transit’ and infrastructure aimed at alleviating congestion hotspots during peak commuting times may need to be reviewed
It may be possible to re-allocate 'surplus' capacity (resulting from reduced peak hour traffic flows) for other purposes
Research Findings
Home Working – Socio-Economic Analysis
86
Any net reduction in car use will reduce fuel duty and VAT and could have an impact on the viability of some filling stations, particularly in rural areas
As the relationship between supply and demand could be materially changed, parking provision and charging policies may need to be reviewed, potentially including proposed workplace charging levies
Digital infrastructure and energy
Some parts of the country are not able to meet the increased demand for broadband, high speeds and bandwidth. This will disadvantage those living in poorly served areas, have a labour market effect and also impact on productivity where the level of connectivity affects performance.
Those now working from home will see increased home energy costs and this could be problematic for some at the margin – grants or tax policies could address this
Domestic emissions will be increased – this could hasten the requirement for alternatives to gas for domestic heating in particular
Labour market
For some the absence of a suitable home working environment, allied to the expectation that work will be undertaken from home for some roles will affect access to the job market. A proportion of potential employees would then be excluded from some jobs introducing a new inequality.
Those with a sub-optimal domestic working environment may see their productivity drop, and / or their wellbeing suffer
For some there may be a degree of social isolation resulting from home working which again could impact on wellbeing
A policy response may therefore be required to provide flexible workspaces for individuals whose domestic arrangements do not lend themselves to home working. The market may however provide a solution under some circumstances.
Planning & economic development
One of the biggest impacts could be on larger town and city centres and business parks. These locations host high numbers of jobs which could be undertaken from home or elsewhere. If there is a material reduction in commuting to, and therefore footfall in these areas, those providing retail, hospitality and support services based on this will be negatively affected. The commercial property market will see a sharp drop in demand which would feed through to other areas such as retail. A substantial planning and economic development policy response may be required to facilitate a re-purposing of these areas.
There could also be significant impacts on the housing market which would likely require a planning policy response. For some, the dependency between place of work and home will be diminished or broken completely. Over time there could be significant change in the distribution of where people want to live with the assumption being that people may wish to move to more rural locations to obtain larger properties, or indeed access to more green space in the event of another pandemic. This will create development pressures in new areas which can bring tensions to the communities there and pressure on local public services. House price inflation in desirable hot spots could have an impact on local families being priced out of their local property markets. Allied to this could be further

Research Findings
Home Working – Socio-Economic Analysis
87
issues with second homes policy. For some the added work / home flexibility could make second home ownership more attractive. This could add to some of the policy issues which emerge from existing levels of second home ownership in parts of the country.
Research Findings
Home Working – Socio-Economic Analysis
88
6 Summary and Conclusions
6.1.1 This report has considered a range of issues associated with the anticipated permanent increase in home working which will likely occur as we emerge from the Covid-19 pandemic and a ‘new normal’ is established. Some of the main points to emerge are summarised below by topic.
Travel behaviour during lockdown
6.1.2 Travel volumes by mode during the lockdown period have been closely monitored and have been summarised in this report. Key findings include:
Volumes of travel by mode have fluctuated throughout the pandemic reflecting the changing level of restrictions in place at a given time. Whilst the volume of car travel did reach pre-pandemic level, bus and train patronage has remained at best around half of pre-pandemic levels. In part the above is due to mode switch from public transport to car and some of these behaviours may have become embedded as there is evidence that some people intend to use public transport less after the pandemic.
The has been an increase in walking and cycling as a result of mode switch and new leisure trips. There is an opportunity to capitalise on this as some people intend to continue this behaviour post-pandemic.
Level of home working
6.1.3 A number of surveys and data sources have been examined to provide an indication of the level of home working which may emerge post-pandemic.
The number of people working wholly or mostly from home has been growing prior to the pandemic. There is still significant uncertainty surrounding the level of home working which will ultimately emerge when the pandemic is behind us. There is more certainty around the types of industries and occupations where home working is possible and there are good data sources to identify these areas geographically.
There is evidence that some major companies are reviewing their office portfolios and employees’ terms and conditions to incorporate part or fully flexible working, so for some the decision as to whether to adopt home working or not will be taken out of their hands.
Travel impacts
6.1.4 The potential impact of reduced commuting on the overall volume of travel by mode has been analysed based on well-established DfT National Travel Survey data.
Increased levels of home working have the potential to significantly reduced the volume of personal travel across all modes. The significance of this will however only be known as the amount of new home working crystalises once the pandemic is over and a new stable level is reached.
The types of job which are suited to home working are typically located in town and city centres and business parks. Town and city centre locations typically see high levels of commuting by public transport, reflecting congestion and parking constraints. It is therefore likely that public transport will be disproportionately affected by increased home working.
In addition, these jobs often involve travel at peak times. As a result, whilst the overall reduction in travel may not be a game-changer, the impact on peak period travel will be
Research Findings
Home Working – Socio-Economic Analysis
89
much greater as commuting comprises a high proportion of travel during these periods. Inter-urban peak hour travel may see even higher reductions given the prominence of commuting there.
Socio-economic impacts of increased home working
6.1.5 Logic maps have been developed to scope out some of the potential consequences of increased home working. These have been developed to set out some of the social and economic consequences of:
Reduced commuting by car, public transport and active travel (separately) – and the impact of this on the transport supply side
Reduced time and money spent commuting – key here is what people do with this money and time
Employees spending time at home rather than at the workplace – a distributional impact away from employment centres to neighbourhoods and other settlements
How employers may respond to the new circumstances – based on staff considerations and cost savings
The link between home and the workplace being loosened or broken – meaning people have greater freedom in where they want to live
Potential policy responses
6.1.6 For each impact identified above, the appropriateness of a public policy response has been considered. Areas for a potential policy response have been identified as:
Transport – the major issue here will be associated with dropping public transport revenue associated with reduced commuting and mode switch to car, and the implications of this for the level of government support required to maintain services. There may also be implications for future investment programmes where the objectives had been focussed on peak period capacity on road or public transport.
Digital infrastructure and energy – home working will bring demands for better broadband provision and the need to accelerate the decarbonisation of the home energy market
Labour markets – there will be a potentially major impact on the balance of the labour market and there is a risk of growing inequalities if some people are excluded from large parts of the job market due to their unsuitable domestic arrangements
Planning and economic development – if companies do progress with plans to reduce office space, footfall could be materially reduced in these areas and the impacts of this would be many and varied if it occurs at scale. A range of policy responses would be required to aid the re-purposing or re-invention of city centres and other areas affected by their main role in the urban sphere being compromised. In extremis, this could be seen as being analogous to the de-industrialisation seen in previous generations. If there is a redistribution of population over time, further planning and public service responses may be required.
6.1.7 This report has scoped out a range of potential transport and socio-economic impacts of increased home working. The key issue therefore is one of scale. If home working does not materialise on the scale envisaged by some, then these impacts could be minor. On the other

Research Findings
Home Working – Socio-Economic Analysis
90
hand if home working is adopted at scale, then there would be fundamental impacts across a wide range of areas and the requirement for a range of policy responses.
6.1.8 Given the uncertainty around the potential scale of home working post pandemic, it would be beneficial to monitor the level of actual home working on a regular basis as the country emerges from the pandemic. This information could be collected together with basic demographic details, industry and occupation to develop a clear picture of the types of jobs and types of people now working from home who were not doing so before.
6.1.9 To prepare for and provide evidence around increase home working, there would also be value in considering implementing a medium-term monitoring programme drawing on some of the logic set out in this report to gauge the scale of home working and the severity of its impacts, both positive and negative.