Embed Size (px)
Citation preview

HOME STRUCTURE FIRES BY EQUIPMENT INVOLVED IN IGNITION
John R. Hall, Jr.
February 2013
National Fire Protection Association Fire Analysis and Research Division

Acknowledgements The National Fire Protection Association thanks all the fire departments and state fire authorities who participate in the National Fire Incident Reporting System (NFIRS) and the annual NFPA fire experience survey. These firefighters are the original sources of the detailed data that make this analysis possible. Their contributions allow us to estimate the size of the fire problem. We are also grateful to the U.S. Fire Administration for its work in developing, coordinating, and maintaining NFIRS. For more information about the National Fire Protection Association, visit www.nfpa.org or call 617-770-3000. To learn more about the One-Stop Data Shop go to www.nfpa.org/osds or call 617-984-7443. Copies of this analysis are available from: National Fire Protection Association One-Stop Data Shop 1 Batterymarch Park Quincy, MA 02169-7471 www.nfpa.org e-mail: [email protected] phone: 617-984-7443 NFPA No. USS87 Copyright© 2013, National Fire Protection Association, Quincy, MA
Home Structure Fires by Equipment Involved, 2/13 2 NFPA Fire Analysis and Research Division, Quincy, MA
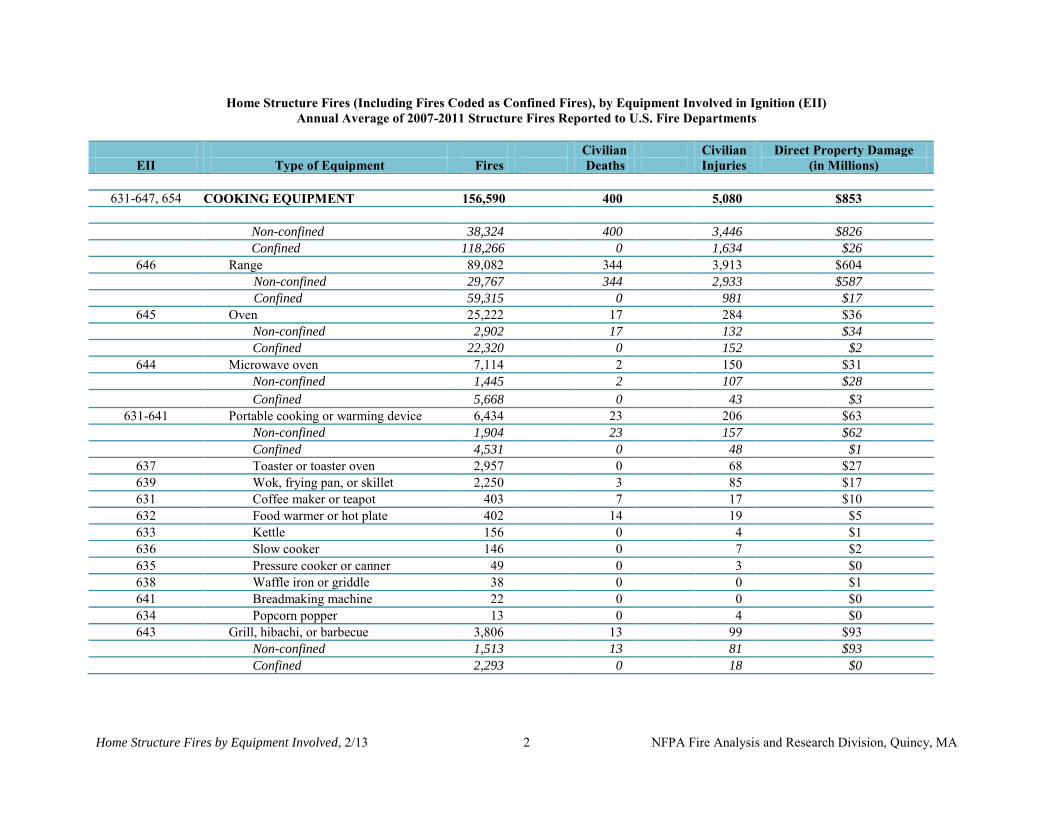
Home Structure Fires (Including Fires Coded as Confined Fires), by Equipment Involved in Ignition (EII) Annual Average of 2007-2011 Structure Fires Reported to U.S. Fire Departments
Civilian Civilian Direct Property Damage
EII Type of Equipment Fires Deaths Injuries (in Millions)
631-647, 654 COOKING EQUIPMENT 156,590 400 5,080 $853 Non-confined 38,324 400 3,446 $826 Confined 118,266 0 1,634 $26
646 Range 89,082 344 3,913 $604 Non-confined 29,767 344 2,933 $587 Confined 59,315 0 981 $17
645 Oven 25,222 17 284 $36 Non-confined 2,902 17 132 $34 Confined 22,320 0 152 $2
644 Microwave oven 7,114 2 150 $31 Non-confined 1,445 2 107 $28 Confined 5,668 0 43 $3
631-641 Portable cooking or warming device 6,434 23 206 $63 Non-confined 1,904 23 157 $62 Confined 4,531 0 48 $1
637 Toaster or toaster oven 2,957 0 68 $27 639 Wok, frying pan, or skillet 2,250 3 85 $17 631 Coffee maker or teapot 403 7 17 $10 632 Food warmer or hot plate 402 14 19 $5 633 Kettle 156 0 4 $1 636 Slow cooker 146 0 7 $2 635 Pressure cooker or canner 49 0 3 $0 638 Waffle iron or griddle 38 0 0 $1 641 Breadmaking machine 22 0 0 $0 634 Popcorn popper 13 0 4 $0 643 Grill, hibachi, or barbecue 3,806 13 99 $93
Non-confined 1,513 13 81 $93 Confined 2,293 0 18 $0
Home Structure Fires by Equipment Involved, 2/13 3 NFPA Fire Analysis and Research Division, Quincy, MA
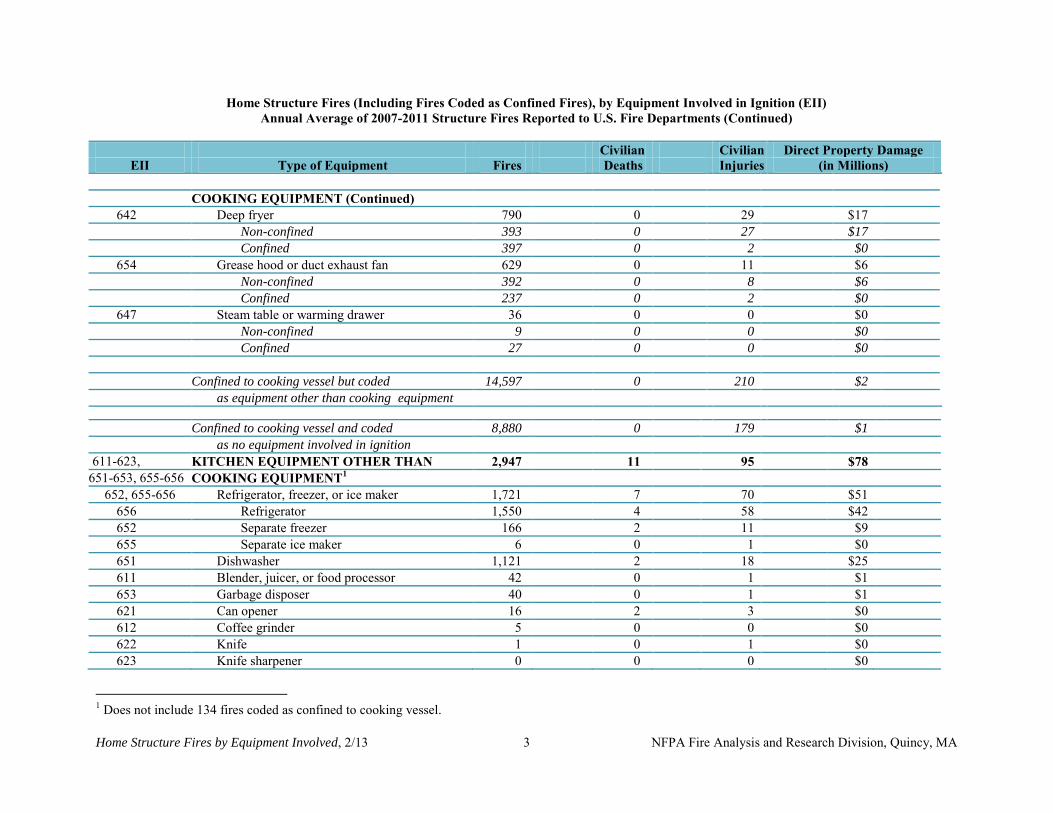
Home Structure Fires (Including Fires Coded as Confined Fires), by Equipment Involved in Ignition (EII) Annual Average of 2007-2011 Structure Fires Reported to U.S. Fire Departments (Continued)
Civilian Civilian Direct Property Damage
EII Type of Equipment Fires Deaths Injuries (in Millions) COOKING EQUIPMENT (Continued)
642 Deep fryer 790 0 29 $17 Non-confined 393 0 27 $17
Confined 397 0 2 $0
654 Grease hood or duct exhaust fan 629 0 11 $6 Non-confined 392 0 8 $6
Confined 237 0 2 $0
647 Steam table or warming drawer 36 0 0 $0 Non-confined 9 0 0 $0
Confined 27 0 0 $0
Confined to cooking vessel but coded 14,597 0 210 $2
as equipment other than cooking equipment Confined to cooking vessel and coded 8,880 0 179 $1
as no equipment involved in ignition
611-623, KITCHEN EQUIPMENT OTHER THAN 2,947 11 95 $78 651-653, 655-656 COOKING EQUIPMENT1
652, 655-656 Refrigerator, freezer, or ice maker 1,721 7 70 $51 656 Refrigerator 1,550 4 58 $42 652 Separate freezer 166 2 11 $9 655 Separate ice maker 6 0 1 $0 651 Dishwasher 1,121 2 18 $25 611 Blender, juicer, or food processor 42 0 1 $1 653 Garbage disposer 40 0 1 $1 621 Can opener 16 2 3 $0 612 Coffee grinder 5 0 0 $0 622 Knife 1 0 1 $0 623 Knife sharpener 0 0 0 $0
1 Does not include 134 fires coded as confined to cooking vessel.

Home Structure Fires by Equipment Involved, 2/13 4 NFPA Fire Analysis and Research Division, Quincy, MA
Home Structure Fires (Including Fires Coded as Confined Fires), by Equipment Involved in Ignition (EII) Annual Average of 2007-2011 Structure Fires Reported to U.S. Fire Departments (Continued)
Civilian Civilian Direct Property Damage
EII Type of Equipment Fires Deaths Injuries (in Millions)
121-152 HEATING EQUIPMENT 60,407 488 1,621 $913 Non-confined 25,914 488 1,540 $905 Confined 34,493 0 81 $8
125-127 Fireplace, chimney or chimney connector 22,711 32 111 $226 Non-confined 3,978 32 92 $222
Confined 6,787 0 6 $1
Confined to chimney or flue; no
equipment involved in ignition
11,945 0 13 $3
120 Unspecified fireplace or chimney 3,232 2 27 $73 127 Metal chimney 2,533 14 10 $57 126 Brick or stone chimney 2,089 2 12 $19 121 Masonry fireplace 1,768 6 29 $42 122 Factory-built fireplace 808 6 18 $24 125 Chimney connector 335 0 3 $9
123-124, 131,141-143 Space heater 19,937 397 1,136 $466 Non-confined 14,144 397 1,107 $465
Confined 5,793 0 29 $1
124 Heating stove 8,337 101 528 $163 141 Heater excluding oil-filled or 4,423 216 414 $167
catalytic 131 Local heating furnace 3,365 25 71 $46 123 Fireplace with insert 2,520 18 49 $52 143 Oil-filled heater 886 26 53 $25 142 Catalytic heater 405 11 21 $13
132-133 Furnace 8,848 22 95 $72 Non-confined 2,308 22 78 $71
Confined 6,247 0 15 $2
Confined to boiler or burner; no
equipment involved in ignition
294 0 2 $0
132 Central furnace 5,982 19 79 $64 133 Boiler 2,278 2 12 $8

Home Structure Fires by Equipment Involved, 2/13 5 NFPA Fire Analysis and Research Division, Quincy, MA
Home Structure Fires (Including Fires Coded as Confined Fires), by Equipment Involved in Ignition (EII) Annual Average of 2007-2011 Structure Fires Reported to U.S. Fire Departments (Continued)
Civilian Civilian Direct Property Damage
EII Type of Equipment Fires Deaths Injuries (in Millions)
151 Water heater 6,414 31 236 $113 Non-confined 4,739 31 234 $113
Confined 1,675 0 2 $0
144 Heat lamp 449 4 22 $24 Non-confined 449 4 22 $24
Confined 0 0 0 $0
145 Heat tape 264 2 7 $10 Non-confined 264 2 7 $10
Confined 0 0 0 $0
152 Steamline, heat pipe, or hot air duct 40 0 0 $1 Non-confined 31 0 0 $1
Confined 9 0 0 $0
Confined to chimney, flue, fuel burner, or boiler but coded as
equipment other than 2,037 0 16 $0
heating equipment
111-117 AIR CONDITIONING, FAN, OR RELATED EQUIPMENT2 6,864 23 251 $158
113 Fan 3,811 14 125 $73 111 Air conditioner 2,350 9 98 $58 112 Heat pump 340 0 5 $12 116 Dehumidifier 217 0 13 $10 114 Humidifier 69 0 9 $2 117 Evaporative cooler or cooling tower 54 0 0 $1 115 Ionizer 23 0 1 $2
2 Does not include 553 confined fires, including 325 confined to fuel burner or boiler and 57 confined to chimney or flue.

Home Structure Fires by Equipment Involved, 2/13 6 NFPA Fire Analysis and Research Division, Quincy, MA
Home Structure Fires (Including Fires Coded as Confined Fires), by Equipment Involved in Ignition (EII) Annual Average of 2007-2011 Structure Fires Reported to U.S. Fire Departments (Continued)
Civilian Civilian Direct Property Damage
EII Type of Equipment Fires Deaths Injuries (in Millions)
210-263 ELECTRICAL DISTRIBUTION AND LIGHTING EQUIPMENT 22,407 325 950 $817 210-219 Wiring and related equipment 14,052 162 413 $474
210 Unclassified wiring or related equipment 5,872 87 186 $195 217 Outlet or receptacle 2,508 16 84 $71 216 Branch circuit wiring 1,959 30 37 $80 215 Panelboard or switchboard 1,274 17 34 $33 212 Service supply wiring from utility 675 5 12 $30 213 Meter or meter box 593 0 21 $13 214 Wiring from meter box to circuit breaker 509 5 14 $29 211 Power (utility) line 449 2 16 $15 218 Wall switch 178 0 5 $4 219 Ground fault circuit interceptor (GFCI) 35 0 5 $4
231-244 Lamp, light bulb or light fixture 4,491 54 260 $180 230 Unclassified lamp or lighting equipment 1,260 9 54 $51 231 Table, floor, or desktop lamp 898 11 73 $48 233 Incandescent light fixture 894 2 36 $24 238 Light bulb 359 13 18 $7 235 Halogen light fixture 342 3 12 $13 234 Fluorescent light fixture 263 5 26 $14 237 Work or trouble light 174 0 11 $9 242 Decorative light on line voltage 152 9 16 $8 243 Decorative or landscape lighting 49 0 1 $2
on low voltage 241 Nightlight 43 0 6 $1 232 Lantern or flashlight 30 2 5 $1 236 Sodium or mercury vapor light 23 0 1 $1 244 Sign 4 0 0 $0

Home Structure Fires by Equipment Involved, 2/13 7 NFPA Fire Analysis and Research Division, Quincy, MA
Home Structure Fires (Including Fires Coded as Confined Fires), by Equipment Involved in Ignition (EII) Annual Average of 2007-2011 Structure Fires Reported to U.S. Fire Departments (Continued)
Civilian Civilian Direct Property Damage
EII Type of Equipment Fires Deaths Injuries (in Millions) ELECTRICAL DISTRIBUTION AND
LIGHTING EQUIPMENT (Continued) 260-263 Cord or plug 2,527 98 203 $97
263 Extension cord 1,368 64 143 $56 260 Unclassified cord or plug 437 23 29 $16 262 Permanent power cord or plug 416 4 12 $12 261 Detachable power cord or plug 305 7 19 $13
221-229 Transformer or power supply 1,310 11 75 $64 227 Surge protector 470 4 24 $21 228 Battery charger or rectifier 244 0 17 $15 224 Generator 237 7 24 $15 223 Low voltage transformer 123 0 1 $6 229 Battery 77 0 5 $4 221 Distribution type transformer 70 0 0 $2 222 Overcurrent or disconnect equipment 67 0 2 $2 226 Uninterrupted power supply 18 0 0 $0 225 Inverter 5 0 1 $0 251 Electric fence 15 0 0 $1 253 Lightning rod or arrester 12 0 0 $0 252 Traffic control device 0 0 0 $0
Home Structure Fires by Equipment Involved, 2/13 8 NFPA Fire Analysis and Research Division, Quincy, MA
Home Structure Fires (Including Fires Coded as Confined Fires), by Equipment Involved in Ignition (EII) Annual Average of 2007-2011 Structure Fires Reported to U.S. Fire Departments (Continued)
Civilian Civilian Direct Property Damage
EII Type of Equipment Fires Deaths Injuries (in Millions)
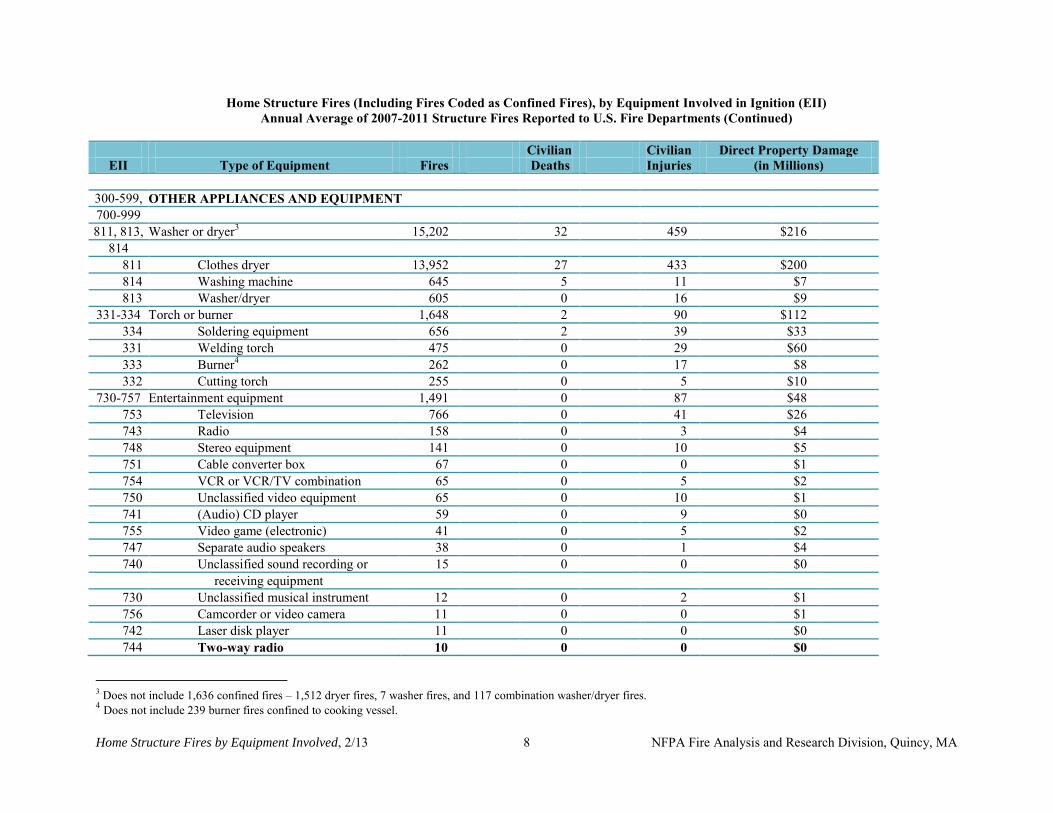
300-599, OTHER APPLIANCES AND EQUIPMENT 700-999 811, 813, Washer or dryer3 15,202 32 459 $216
814 811 Clothes dryer 13,952 27 433 $200 814 Washing machine 645 5 11 $7 813 Washer/dryer 605 0 16 $9
331-334 Torch or burner 1,648 2 90 $112 334 Soldering equipment 656 2 39 $33 331 Welding torch 475 0 29 $60 333 Burner4 262 0 17 $8 332 Cutting torch 255 0 5 $10
730-757 Entertainment equipment 1,491 0 87 $48 753 Television 766 0 41 $26 743 Radio 158 0 3 $4 748 Stereo equipment 141 0 10 $5 751 Cable converter box 67 0 0 $1 754 VCR or VCR/TV combination 65 0 5 $2 750 Unclassified video equipment 65 0 10 $1 741 (Audio) CD player 59 0 9 $0 755 Video game (electronic) 41 0 5 $2 747 Separate audio speakers 38 0 1 $4 740 Unclassified sound recording or 15 0 0 $0
receiving equipment 730 Unclassified musical instrument 12 0 2 $1 756 Camcorder or video camera 11 0 0 $1 742 Laser disk player 11 0 0 $0 744 Two-way radio 10 0 0 $0
3 Does not include 1,636 confined fires – 1,512 dryer fires, 7 washer fires, and 117 combination washer/dryer fires. 4 Does not include 239 burner fires confined to cooking vessel.

Home Structure Fires by Equipment Involved, 2/13 9 NFPA Fire Analysis and Research Division, Quincy, MA
Home Structure Fires (Including Fires Coded as Confined Fires), by Equipment Involved in Ignition (EII) Annual Average of 2007-2011 Structure Fires Reported to U.S. Fire Departments (Continued)
Civilian Civilian Direct Property Damage
EII Type of Equipment Fires Deaths Injuries (in Millions) OTHER APPLIANCES AND EQUIPMENT (Continued) Entertainment equipment (continued)
732 Piano or organ 9 0 0 $0 745 Phonograph, record player or 8 0 1 $0
turntable 733 Musical synthesizer or keyboard 8 0 0 $0 749 Tape recorder or player 6 0 0 $0 731 Guitar 2 0 0 $0 757 Photographic camera or equipment 0 0 0 $0 752 Film or slide projector 0 0 0 $0
850-855 Portable appliance designed to produce 1,218 43 118 $48
controlled heat
850 Unclassified portable appliance designed to produce controlled heat 548 29 57 $25
855 Clothes iron 318 0 8 $10 852 Electric blanket 209 10 29 $6 853 Heating pad 135 5 24 $7 854 Clothes steamer 9 0 0 $1 851 Baby bottle warmer 0 0 0 $0
812 Trash compactor 1,096 0 0 $0 812 Non-confined fire 16 0 0 $0
Confined fire 1,080 0 0 $0
873, 877 Cigarette, pipe or novelty lighter5 804 32 161 $29
873 Cigarette or pipe lighter 785 32 157 $28 877 Novelty lighter 19 0 4 $1
5 Home structure fires involving lighters are estimated much higher using the Heat Source field: 9,423 fires (including 2,518 confined fires), 153 civilian deaths, 855 civilian injuries, and $231 million in direct property damage.

Home Structure Fires by Equipment Involved, 2/13 10 NFPA Fire Analysis and Research Division, Quincy, MA
Home Structure Fires (Including Fires Coded as Confined Fires), by Equipment Involved in Ignition (EII) Annual Average of 2007-2011 Structure Fires Reported to U.S. Fire Departments (Continued)
Civilian Civilian Direct Property Damage
EII Type of Equipment Fires Deaths Injuries (in Millions)
OTHER APPLIANCES AND EQUIPMENT
(Continued) 710-728 Office equipment 732 11 51 $28 710-716 Computers and related equipment 575 11 32 $22
711 Computer 350 0 12 $13 710 Unclassified computer device 98 11 13 $4 715 Computer printer 61 0 3 $2 714 Computer monitor 46 0 4 $1 712 External computer storage device 7 0 0 $0 716 Computer projection device 6 0 0 $1 713 External computer modem 6 0 0 $1
720-721, 723-728
Other office equipment, not computer or telephone-related 86 0 8 $3
720 Unclassified office equipment 33 0 1 $1 726 Paper shredder 32 0 4 $2 725 Fax machine 12 0 3 $0 728 Typewriter 4 0 0 $0 721 Adding machine or calculator 4 0 0 $0 724 Copier 2 0 0 $0 723 Cash register 0 0 0 $0 727 Postage or shipping meter equipment 0 0 0 $0 722 Telephone or answering machine 71 0 11 $2 352 Incinerator 582 0 4 $0 352 Non-confined 4 0 0 $0
Confined to incinerator6 578 0 4 $0
6 Does not include 26 incinerator fires coded as confined to compactor.
Home Structure Fires by Equipment Involved, 2/13 11 NFPA Fire Analysis and Research Division, Quincy, MA
Home Structure Fires (Including Fires Coded as Confined Fires), by Equipment Involved in Ignition (EII) Annual Average of 2007-2011 Structure Fires Reported to U.S. Fire Departments (Continued)
Civilian Civilian Direct Property Damage
EII Type of Equipment Fires Deaths Injuries (in Millions) OTHER APPLIANCES AND EQUIPMENT (Continued)
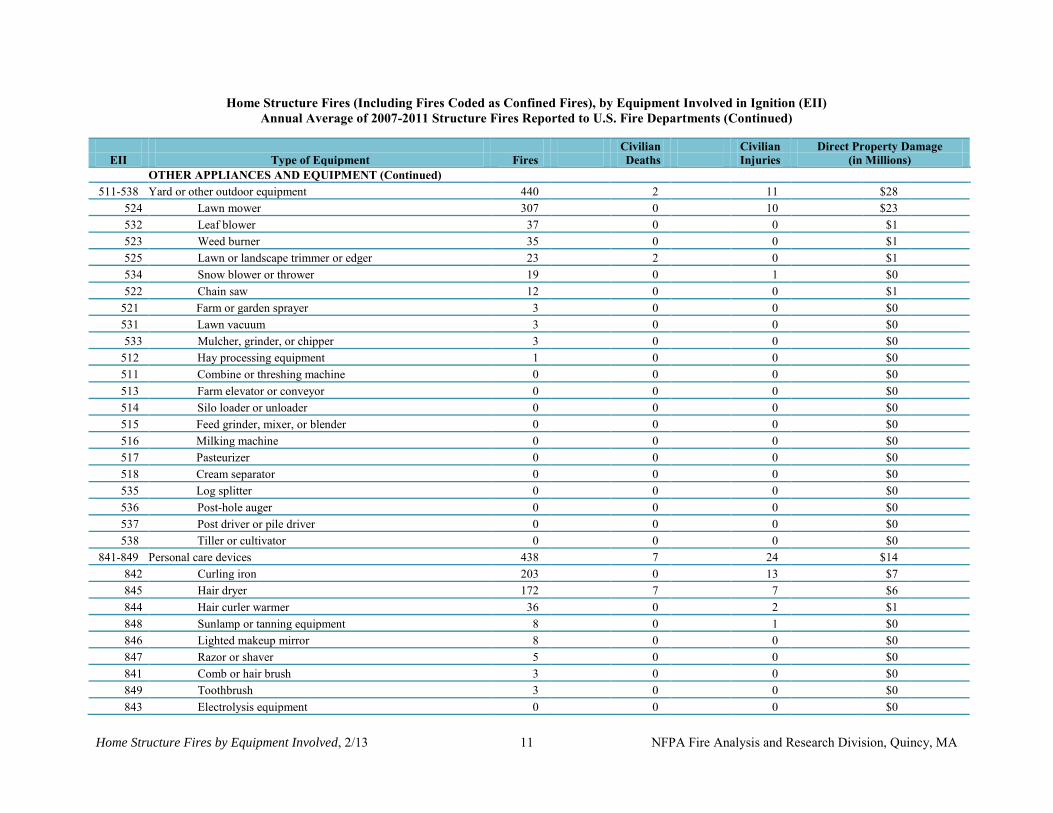
511-538 Yard or other outdoor equipment 440 2 11 $28 524 Lawn mower 307 0 10 $23 532 Leaf blower 37 0 0 $1 523 Weed burner 35 0 0 $1 525 Lawn or landscape trimmer or edger 23 2 0 $1 534 Snow blower or thrower 19 0 1 $0 522 Chain saw 12 0 0 $1
521 Farm or garden sprayer 3 0 0 $0 531 Lawn vacuum 3 0 0 $0 533 Mulcher, grinder, or chipper 3 0 0 $0
512 Hay processing equipment 1 0 0 $0 511 Combine or threshing machine 0 0 0 $0 513 Farm elevator or conveyor 0 0 0 $0 514 Silo loader or unloader 0 0 0 $0 515 Feed grinder, mixer, or blender 0 0 0 $0 516 Milking machine 0 0 0 $0 517 Pasteurizer 0 0 0 $0 518 Cream separator 0 0 0 $0 535 Log splitter 0 0 0 $0 536 Post-hole auger 0 0 0 $0 537 Post driver or pile driver 0 0 0 $0 538 Tiller or cultivator 0 0 0 $0
841-849 Personal care devices 438 7 24 $14 842 Curling iron 203 0 13 $7 845 Hair dryer 172 7 7 $6 844 Hair curler warmer 36 0 2 $1 848 Sunlamp or tanning equipment 8 0 1 $0 846 Lighted makeup mirror 8 0 0 $0 847 Razor or shaver 5 0 0 $0 841 Comb or hair brush 3 0 0 $0 849 Toothbrush 3 0 0 $0 843 Electrolysis equipment 0 0 0 $0

Home Structure Fires by Equipment Involved, 2/13 12 NFPA Fire Analysis and Research Division, Quincy, MA
Home Structure Fires (Including Fires Coded as Confined Fires), by Equipment Involved in Ignition (EII) Annual Average of 2007-2011 Structure Fires Reported to U.S. Fire Departments (Continued)
Civilian Civilian Direct Property Damage
EII Type of Equipment Fires Deaths Injuries (in Millions) OTHER APPLIANCES AND EQUIPMENT (Continued)
311-318 Power tools 352 2 22 $13 316 Power sander, grinder, buffer 142 0 9 $8
or polisher 310 Unclassified power tool 87 0 9 $2 315 Power drill or screwdriver 77 2 5 $2 311 Power saw 72 0 5 $1 314 Power cutting tool 57 0 3 $1 313 Power shaper, router, joiner, or 2 0 0 $0
planer 312 Power lathe 1 0 0 $0 318 Power nail gun 1 0 0 $0 317 Power hammer 0 0 0 $0
341-342, Pump or compressor 287 2 6 $7 344 344 Pump 179 0 4 $2 341 Air compressor 104 0 1 $4
342 Gas compressor 4 2 1 $0 410-419 Biomedical equipment 263 85 129 $13
416 Oxygen administration 223 77 115 $10 equipment
410 Unclassified medical equipment 22 4 6 $0 419 Therapeutic equipment 11 0 1 $2 411 Dental, medical or other powered 5 4 6 $1
bed or chair 412 Unclassified dental equipment 1 0 0 $0 413 Dialysis equipment 0 0 0 $0 414 Medical imaging equipment 0 0 0 $0 415 Medical monitoring equipment 0 0 0 $0 417 X-ray or other radiological 0 0 0 $0
equipment 418 Medical sterilizer 0 0 0 $0

Home Structure Fires by Equipment Involved, 2/13 13 NFPA Fire Analysis and Research Division, Quincy, MA
Home Structure Fires (Including Fires Coded as Confined Fires), by Equipment Involved in Ignition (EII) Annual Average of 2007-2011 Structure Fires Reported to U.S. Fire Departments (Continued)
Civilian Civilian Direct Property Damage
EII Type of Equipment Fires Deaths Injuries (in Millions) OTHER APPLIANCES AND EQUIPMENT (Continued)
830-834 Floor care equipment 153 0 5 $7 834 Vacuum cleaner 134 0 5 $5 832 Carpet cleaning equipment 8 0 0 $0
including rug shampooer 833 Floor buffer or waxer 5 0 0 $0 830 Unclassified floor care equipment 4 0 0 $1 831 Electric broom 3 0 0 $0 373 Control and detection equipment 150 2 5 $10
861-864,866,868, 876 863 Garage door opener 63 0 3 $3 868 Thermostat 52 0 0 $0 866 Smoke or heat detector 40 0 1 $5 373 Gas regulator 28 2 0 $1 876 Timer 10 0 1 $0 862 Burglar alarm 4 0 0 $0 864 Gas detector 3 0 0 $0 861 Automatic door opener (not garage) 1 0 0 $0
821 Hot tub, whirlpool, or spa 138 0 4 $11 871 Ashtray 124 0 5 $3 351 Heat treating equipment 113 0 17 $19
320-325 Painting or coating equipment 74 0 21 $1 320 Unclassified painting tool 40 0 3 $0 324 Paint sprayer 25 0 19 $0 325 Coating machine 8 0 0 $0 323 Paint mixing machine 1 0 0 $0 321 Paint dipper 0 0 0 $0 322 Paint flow coating machine 0 0 0 $0

Home Structure Fires by Equipment Involved, 2/13 14 NFPA Fire Analysis and Research Division, Quincy, MA
Home Structure Fires (Including Fires Coded as Confined Fires), by Equipment Involved in Ignition (EII) Annual Average of 2007-2011 Structure Fires Reported to U.S. Fire Departments (Continued)
Civilian Civilian Direct Property Damage
EII Type of Equipment Fires Deaths Injuries (in Millions) OTHER APPLIANCES AND EQUIPMENT (Continued)
423 TV monitor array 54 0 1 $2 882 Powered toy 47 0 0 $2 433 Elevator or lift 45 0 0 $0 822 Swimming pool equipment 44 0 1 $2 872 Charcoal lighter 41 3 4 $2 345 Wet/dry vacuum or shop vac 39 0 7 $1 891 Clock 39 0 0 $1 374 Separate motor 37 0 0 $0 375 Internal combustion engine 30 0 0 $1 883 Woodburning kit 24 0 3 $1 895 Sewing machine 24 0 0 $1 354 Tarpot or tar kettle 19 0 0 $0 353 Industrial furnace or kiln 15 0 1 $0 445 Water fountain or water cooler 13 0 0 $0 881 Model vehicle 9 0 0 $0 340 Unclassified hydraulic equipment 8 0 0 $0 875 Insect trap 8 0 0 $0 343 Atomizing equipment 7 0 1 $0 348 Drilling machinery or equipment 7 0 0 $0 346 Hoist or lift 6 0 0 $0 450 Unclassified laboratory equipment 5 0 0 $0 865 Intercom 4 0 0 $0 892 Gun 4 0 0 $0 896 Shoe polisher 3 0 0 $0 443 Vending machine 3 0 0 $0 422 Telephone switching gear 3 0 0 $0 444 Non-video arcade game 3 0 0 $0 897 Sterilizer 2 0 0 $0 425 Studio type sound recording equipment 1 0 0 $0 358 Extractor or waste recovery equipment 1 0 0 $0 377 Car washing equipment 1 0 0 $0

Home Structure Fires by Equipment Involved, 2/13 15 NFPA Fire Analysis and Research Division, Quincy, MA
Home Structure Fires (Including Fires Coded as Confined Fires), by Equipment Involved in Ignition (EII) Annual Average of 2007-2011 Structure Fires Reported to U.S. Fire Departments (Continued)
Civilian Civilian Direct Property Damage
EII Type of Equipment Fires Deaths Injuries (in Millions) OTHER APPLIANCES AND EQUIPMENT (Continued) 893 Jewelry cleaning machine 1 0 0 $0 894 Scissors 1 0 0 $0 362 Power transfer equipment 1 0 0 $0
(rope, cable, or block) 355 Casting, molding or forging equipment 1 0 0 $0 361 Conveyor 1 0 0 $0 372 Testing equipment 1 0 0 $0 376 Printing press 1 0 0 $0
Contained trash or rubbish fire 14,733 0 59 $2
000 Unclassified equipment 1,640 21 60 $65
NNN No equipment involved; specific 74,946 1,084 3,840 $3,697
non-equipment heat sources reported
Total 366,554 2,575 13,207 $7,208
Additional equipment with no reported home structure fires in 2007-2011.
Equipment Involved in Ignition Equipment Involved in Ignition 347 Powered jacking equipment 431 Amusement ride equipment 356 Distilling equipment 432 Ski lift 357 Digester or reactor 434 Escalator 363 Power take-off 441 Microfilm or microfiche 364 Powered valve viewing equipment 365 Bearing or brake 442 Photo processing equipment 371 Picking, carding or weaving machine 446 Telescope 421 Transmitter 451 Electron microscope 424 Studio type TV camera 874 Fire extinguishing equipment 426 Radar equipment

Home Structure Fires by Equipment Involved, 2/13 16 NFPA Fire Analysis and Research Division, Quincy, MA
Home Structure Fires (Including Fires Coded as Confined Fires), by Equipment Involved in Ignition (EII) Annual Average of 2007-2011 Structure Fires Reported to U.S. Fire Departments (Continued)
Notes on Formats: Types and groups of equipment whose names are indented are parts of the equipment group they are listed under. Equipment types that belong to a listed group are shown with that group, even if they had no reported fires estimated for the period. Notes on Statistical Methodology: These are national estimates of fires reported to U.S. municipal fire departments and so exclude fires reported only to Federal or sate agencies or industrial fire brigades. National estimates are projections. Casualty and loss projections can be heavily influenced by the inclusion or exclusion of one unusually serious fire. Fires and civilian deaths and injuries are rounded to the nearest one, and direct property damage is rounded to the nearest million dollars. Damage has not been adjusted for inflation. Figures reflect a proportional share of home fires with equipment involved in ignition unknown, and partial unknowns have been allocated as indicated below. Fires reported as “no equipment” but lacking a confirming specific heat source (codes 40-99) are also treated as unknown equipment and allocated. Fires reported as “no equipment” and having a confirming specific heat source are not shown on the table. Totals may not equal sums because of rounding error. Notes on Allocations: Equipment Involved in Ignition 100, 200, 300, 400, 500, 600, 700, and 800 are partial unknowns that are proportionally allocated over the known equipment categories defined by the same initial digit (e.g., EII 100 over 101-199). Incident Type 113 (confined cooking vessel fires) are allocated over all known equipment codes, with the fires allocated to cooking equipment shown with those equipment types and the other fires shown together as fires confined to cooking vessel but coded as non-cooking equipment. Incident Types 114 and 116 (confined chimney and boiler fires) are similarly and separately allocated over all known equipment codes, with the fires allocated to heating equipment shown with those equipment types and the other fires shown together as fires confined to heating equipment but coded as non-heating equipment. Incident Types 115 (confined to incinerator) and 117 (confined to trash compactor) are shown with those two types of equipment. Incident Type 118 (confined trash fire) is shown by itself. Source: NFIRS Version 5.0 and NFPA survey.

Home Structure Fires by Equipment Involved, 2/13 17 NFPA Fire Analysis and Research Division, Quincy, MA
Appendix A. How National Estimates Statistics Are Calculated
The statistics in this analysis are estimates derived from the U.S. Fire Administration’s (USFA’s) National Fire Incident Reporting System (NFIRS) and the National Fire Protection Association’s (NFPA’s) annual survey of U.S. fire departments. NFIRS is a voluntary system by which participating fire departments report detailed factors about the fires to which they respond. Roughly two-thirds of U.S. fire departments participate, although not all of these departments provide data every year. Fires reported to federal or state fire departments or industrial fire brigades are not included in these estimates. NFIRS provides the most detailed incident information of any national database not limited to large fires. NFIRS is the only database capable of addressing national patterns for fires of all sizes by specific property use and specific fire cause. NFIRS also captures information on the extent of flame spread, and automatic detection and suppression equipment. For more information about NFIRS visit http://www.nfirs.fema.gov/. Copies of the paper forms may be downloaded from http://www.nfirs.fema.gov/documentation/design/NFIRS_Paper_Forms_2008.pdf. NFIRS has a wide variety of data elements and code choices. The NFIRS database contains coded information. Many code choices describe several conditions. These cannot be broken down further. For example, area of origin code 83 captures fires starting in vehicle engine areas, running gear areas or wheel areas. It is impossible to tell the portion of each from the coded data. Methodology may change slightly from year to year. NFPA is continually examining its methodology to provide the best possible answers to specific questions, methodological and definitional changes can occur. Earlier editions
of the same report may have used different methodologies to produce the same analysis,
meaning that the estimates are not directly comparable from year to year.
NFPA’s fire department experience survey provides estimates of the big picture. Each year, NFPA conducts an annual survey of fire departments which enables us to capture a summary of fire department experience on a larger scale. Surveys are sent to all municipal departments protecting populations of 50,000 or more and a random sample, stratified by community size, of the smaller departments. Typically, a total of roughly 3,000 surveys are returned, representing about one of every ten U.S. municipal fire departments and about one third of the U.S. population. The survey is stratified by size of population protected to reduce the uncertainty of the final estimate. Small rural communities have fewer people protected per department and are less likely to respond to the survey. A larger number must be surveyed to obtain an adequate sample of those departments. (NFPA also makes follow-up calls to a sample of the smaller fire departments that do not respond, to confirm that those that did respond are truly representative of fire departments their size.) On the other hand, large city departments are so few in number and protect such a large proportion of the total U.S.

Home Structure Fires by Equipment Involved, 2/13 18 NFPA Fire Analysis and Research Division, Quincy, MA
population that it makes sense to survey all of them. Most respond, resulting in excellent precision for their part of the final estimate. The survey includes the following information: (1) the total number of fire incidents, civilian deaths, and civilian injuries, and the total estimated property damage (in dollars), for each of the major property use classes defined in NFIRS; (2) the number of on-duty firefighter injuries, by type of duty and nature of illness; 3) the number and nature of non-fire incidents; and (4) information on the type of community protected (e.g., county versus township versus city) and the size of the population protected, which is used in the statistical formula for projecting national totals from sample results. The results of the survey are published in the annual report Fire Loss in the United States. To download a free copy of the report, visit http://www.nfpa.org/assets/files/PDF/OS.fireloss.pdf. Projecting NFIRS to National Estimates As noted, NFIRS is a voluntary system. Different states and jurisdictions have different reporting requirements and practices. Participation rates in NFIRS are not necessarily uniform across regions and community sizes, both factors correlated with frequency and severity of fires. This means NFIRS may be susceptible to systematic biases. No one at present can quantify the size of these deviations from the ideal, representative sample, so no one can say with confidence that they are or are not serious problems. But there is enough reason for concern so that a second database -- the NFPA survey -- is needed to project NFIRS to national estimates and to project different parts of NFIRS separately. This multiple calibration approach makes use of the annual NFPA survey where its statistical design advantages are strongest. Scaling ratios are obtained by comparing NFPA’s projected totals of residential structure fires, non-residential structure fires, vehicle fires, and outside and other fires, and associated civilian deaths, civilian injuries, and direct property damage with comparable totals in NFIRS. Estimates of specific fire problems and circumstances are obtained by multiplying the NFIRS data by the scaling ratios. Reports for incidents in which mutual aid was given are excluded from NFPA’s analyses. Analysts at the NFPA, the USFA and the Consumer Product Safety Commission developed the specific basic analytical rules used for this procedure. “The National Estimates Approach to U.S. Fire Statistics,” by John R. Hall, Jr. and Beatrice Harwood, provides a more detailed explanation of national estimates. A copy of the article is available online at http://www.nfpa.org/osds or through NFPA's One-Stop Data Shop. Version 5.0 of NFIRS, first introduced in 1999, used a different coding structure for many data elements, added some property use codes, and dropped others. The essentials of the approach described by Hall and Harwood are still used, but some modifications have been necessary to accommodate the changes in NFIRS 5.0. Figure A.1 shows the percentage of fires originally collected in the NFIRS 5.0 system. Each year’s release version of NFIRS data also includes data collected in older versions of NFIRS that were converted to NFIRS 5.0 codes.

Home Structure Fires by Equipment Involved, 2/13 19 NFPA Fire Analysis and Research Division, Quincy, MA
Figure A.1. Fires Originally Collected in NFIRS 5.0 by Year
From 1999 data on, analyses are based on scaling ratios using only data originally collected in NFIRS 5.0:
NFPA survey projections NFIRS totals (Version 5.0)
For 1999 to 2001, the same rules may be applied, but estimates for these years in this form will be less reliable due to the smaller amount of data originally collected in NFIRS 5.0; they should be viewed with extreme caution. NFIRS 5.0 introduced six categories of confined structure fires, including:
cooking fires confined to the cooking vessel, confined chimney or flue fires, confined incinerator fire, confined fuel burner or boiler fire or delayed ignition, confined commercial compactor fire, and trash or rubbish fires in a structure with no flame damage to the structure or its contents.
Although causal and other detailed information is typically not required for these incidents, it is provided in some cases. Some analyses, particularly those that examine cooking equipment, heating equipment, fires caused by smoking materials, and fires started by playing with fire, may examine the confined fires in greater detail. Because the confined fire incident types describe certain scenarios, the distribution of unknown data differs from that of all fires. Consequently, allocation of unknowns must be done separately. Some analyses of structure fires show only non-confined fires. In these tables, percentages shown are of non-confined structure fires rather than all structure fires. This approach has the advantage of showing the frequency of specific factors in fire causes, but the disadvantage of
7%
21%
48%
65%
79%
88% 94% 94% 97% 99% 100%
0%
20%
40%
60%
80%
100%
1999 2000 2001 2002 2003 2004 2005 2006 2007 2008 2009

Home Structure Fires by Equipment Involved, 2/13 20 NFPA Fire Analysis and Research Division, Quincy, MA
possibly overstating the percentage of factors that are seldom seen in the confined fire incident types and of understating the factors specifically associated with the confined fire incident types. Other analyses include entries for confined fire incident types in the causal tables and show percentages based on total structure fires. In these cases, the confined fire incident type is treated as a general causal factor. For most fields other than Property Use and Incident Type, NFPA allocates unknown data proportionally among known data. This approach assumes that if the missing data were known, it would be distributed in the same manner as the known data. NFPA makes additional adjustments to several fields. Casualty and loss projections can be heavily influenced by the
inclusion or exclusion of unusually serious fire.
In the formulas that follow, the term “all fires” refers to all fires in NFIRS on the dimension studied. The percentages of fires with known or unknown data are provided for non-confined fires and associated losses, and for confined fires only. Cause of Ignition: This field is used chiefly to identify intentional fires. “Unintentional” in this field is a specific entry and does not include other fires that were not intentionally set: failure of equipment or heat source, act of nature, or “other” (unclassified).” The last should be used for exposures but has been used for other situations as well. Fires that were coded as under investigation and those that were coded as undetermined after investigation were treated as unknown. Factor Contributing to Ignition: In this field, the code “none” is treated as an unknown and allocated proportionally. For Human Factor Contributing to Ignition, NFPA enters a code for “not reported” when no factors are recorded. “Not reported” is treated as an unknown, but the code “none” is treated as a known code and not allocated. Multiple entries are allowed in both of these fields. Percentages are calculated on the total number of fires, not entries, resulting in sums greater than 100%. Although Factor Contributing to Ignition is only required when the cause of ignition was coded as: 2) unintentional, 3) failure of equipment or heat source; or 4) act of nature, data is often present when not required. Consequently, any fire in which no factor contributing to ignition was entered was treated as unknown. In some analyses, all entries in the category of mechanical failure, malfunction (factor contributing to ignition 20-29) are combined and shown as one entry, “mechanical failure or malfunction.” This category includes:
21. Automatic control failure; 22. Manual control failure; 23. Leak or break. Includes leaks or breaks from containers or pipes. Excludes operational
deficiencies and spill mishaps; 25. Worn out; 26. Backfire. Excludes fires originating as a result of hot catalytic converters; 27. Improper fuel used; Includes the use of gasoline in a kerosene heater and the like; and 20. Mechanical failure or malfunction, other.

Home Structure Fires by Equipment Involved, 2/13 21 NFPA Fire Analysis and Research Division, Quincy, MA
Entries in “electrical failure, malfunction” (factor contributing to ignition 30-39) may also be combined into one entry, “electrical failure or malfunction.” This category includes:
31. Water-caused short circuit arc; 32. Short-circuit arc from mechanical damage; 33. Short-circuit arc from defective or worn insulation; 34. Unspecified short circuit arc; 35. Arc from faulty contact or broken connector, including broken power lines and loose
connections; 36. Arc or spark from operating equipment, switch, or electric fence; 37. Fluorescent light ballast; and 30. Electrical failure or malfunction, other.
Heat Source. In NFIRS 5.0, one grouping of codes encompasses various types of open flames and smoking materials. In the past, these had been two separate groupings. A new code was added to NFIRS 5.0, which is code 60: “Heat from open flame or smoking material, other.” NFPA treats this code as a partial unknown and allocates it proportionally across the codes in the 61-69 range, shown below.
61. Cigarette; 62. Pipe or cigar; 63. Heat from undetermined smoking material; 64. Match; 65. Lighter: cigarette lighter, cigar lighter; 66. Candle; 67 Warning or road flare, fuse; 68. Backfire from internal combustion engine. Excludes flames and sparks from an exhaust
system, (11); and 69. Flame/torch used for lighting. Includes gas light and gas-/liquid-fueled lantern.
In addition to the conventional allocation of missing and undetermined fires, NFPA multiplies fires with codes in the 61-69 range by
All fires in range 60-69 All fires in range 61-69
The downside of this approach is that heat sources that are truly a different type of open flame or smoking material are erroneously assigned to other categories. The grouping “smoking materials” includes codes 61-63 (cigarettes, pipes or cigars, and heat from undetermined smoking material, with a proportional share of the code 60s and true unknown data. Equipment Involved in Ignition (EII). NFIRS 5.0 originally defined EII as the piece of equipment that provided the principal heat source to cause ignition if the equipment malfunctioned or was used improperly. In 2006, the definition was modified to “the piece of equipment that provided the principal heat source to cause ignition.” However, much of the data predates the change. Individuals who have already been trained with the older definition may

Home Structure Fires by Equipment Involved, 2/13 22 NFPA Fire Analysis and Research Division, Quincy, MA
not change their practices. To compensate, NFPA treats fires in which EII = NNN and heat source is not in the range of 40-99 as an additional unknown. To allocate unknown data for EII, the known data is multiplied by
All fires (All fires – blank – undetermined – [fires in which EII =NNN and heat source <>40-99])
In addition, the partially unclassified codes for broad equipment groupings (i.e., code 100 - heating, ventilation, and air conditioning, other; code 200 - electrical distribution, lighting and power transfer, other; etc.) were allocated proportionally across the individual code choices in their respective broad groupings (heating, ventilation, and air conditioning; electrical distribution, lighting and power transfer, other; etc.). Equipment that is totally unclassified is not allocated further. This approach has the same downside as the allocation of heat source 60 described above. Equipment that is truly different is erroneously assigned to other categories. In some analyses, various types of equipment are grouped together.
Code Grouping EII Code NFIRS definitions Central heat 132 Furnace or central heating unit 133 Boiler (power, process or heating) Fixed or portable space heater 131 Furnace, local heating unit, built-in 123 Fireplace with insert or stove 124 Heating stove 141 Heater, excluding catalytic and oil-filled 142 Catalytic heater 143 Oil-filled heater Fireplace or chimney 120 Fireplace or chimney 121 Fireplace, masonry 122 Fireplace, factory-built 125 Chimney connector or vent connector 126 Chimney – brick, stone or masonry 127 Chimney-metal, including stovepipe or flue Fixed wiring and related equipment 210 Unclassified electrical wiring 211 Electrical power or utility line 212 Electrical service supply wires from utility 213 Electric meter or meter box 214 Wiring from meter box to circuit breaker 215 Panel board, switch board or circuit breaker board 216 Electrical branch circuit 217 Outlet or receptacle 218 Wall switch 219 Ground fault interrupter Transformers and power supplies 221 Distribution-type transformer 222 Overcurrent, disconnect equipment 223 Low-voltage transformer 224 Generator 225 Inverter

Home Structure Fires by Equipment Involved, 2/13 23 NFPA Fire Analysis and Research Division, Quincy, MA
226 Uninterrupted power supply (UPS) 227 Surge protector 228 Battery charger or rectifier 229 Battery (all types) Lamp, bulb or lighting 230 Unclassified lamp or lighting 231 Lamp-tabletop, floor or desk 232 Lantern or flashlight 233 Incandescent lighting fixture 234 Fluorescent light fixture or ballast 235 Halogen light fixture or lamp 236 Sodium or mercury vapor light fixture or lamp 237 Work or trouble light 238 Light bulb 241 Nightlight 242 Decorative lights – line voltage 243 Decorative or landscape lighting – low voltage 244 Sign Cord or plug 260 Unclassified cord or plug 261 Power cord or plug, detachable from appliance 262 Power cord or plug- permanently attached 263 Extension cord Torch, burner or soldering iron 331 Welding torch 332 Cutting torch 333 Burner, including Bunsen burners 334 Soldering equipment Portable cooking or warming equipment 631 Coffee maker or teapot 632 Food warmer or hot plate 633 Kettle 634 Popcorn popper 635 Pressure cooker or canner 636 Slow cooker 637 Toaster, toaster oven, counter-top broiler 638 Waffle iron, griddle 639 Wok, frying pan, skillet 641 Breadmaking machine Equipment was not analyzed separately for confined fires. Instead, each confined fire incident type was listed with the equipment or as other known equipment. Item First Ignited. In most analyses, mattress and pillows (item first ignited 31) and bedding, blankets, sheets, and comforters (item first ignited 32) are combined and shown as “mattresses and bedding.” In many analyses, wearing apparel not on a person (code 34) and wearing apparel on a person (code 35) are combined and shown as “clothing.” In some analyses, flammable and combustible liquids and gases, piping and filters (item first ignited 60-69) are combined and shown together. Area of Origin. Two areas of origin: bedroom for more than five people (code 21) and bedroom for less than five people (code 22) are combined and shown as simply “bedroom.” Chimney is no longer a valid area of origin code for non-confined fires.

Home Structure Fires by Equipment Involved, 2/13 24 NFPA Fire Analysis and Research Division, Quincy, MA
Rounding and percentages. The data shown are estimates and generally rounded. An entry of zero may be a true zero or it may mean that the value rounds to zero. Percentages are calculated from unrounded values. It is quite possible to have a percentage entry of up to 100% even if the rounded number entry is zero. The same rounded value may account for a slightly different percentage share. Because percentages are expressed in integers and not carried out to several decimal places, percentages that appear identical may be associated with slightly different values.


![Atmospheric states associated with the ignition of lightning … · Title: Atmospheric states associated with the ignition of lightning-attributed fires [electronic resource] / Andrew](https://img.pdfslide.us/doc/110x75/5b6081c97f8b9a54488b5479/atmospheric-states-associated-with-the-ignition-of-lightning-title-atmospheric.jpg)