Embed Size (px)
Citation preview

annual report | 2011
the heart of your life

In our unwavering commitment to be a bank
that offers the opportunity to each and every
Mauritian to help their potential grow, we have
further enhanced our approach in the crafting of
what defines true banking.
Through state-of-the-art, yet approachable
technology and a sharpened array of offers,
we thrive to offer a seamless experience with
the boldest of objectives: weave a smile on our
customers’ faces. Every day.
the heart of your life
To be the leading provider of integrated
financial services in the regions of SBM operations
through a dedicated and competent
professional team.
Vision
Value creation for all stakeholders by achieving
consistent improvement in returns and continued enhancement
in customer satisfaction levels.
Mission
GoalTo continuously improve and innovate
SBM’s lines of business and achieve strong and sustainable returns for the shareholders. SBM aims to achieve its goals by continuously
enhancing customer service, capacities, capabilities, competencies, delivery channels and operating efficiencies as well as maintaining a balanced,
acceptable and quality risk profile while effectively managing
its balance sheet.
annual report | 2011 5
Contents Pages
Key financial highlights & charts 6-7
Corporate profile 10-13
Board of directors 14-15
Board committees 16
Directors of SBM subsidiaries 17
Report of the directors 20-23
Statement of directors’ responsibilities 26
Company Secretary certificate 26
Corporate governance report 27-40
Risk management report 44-63
Executive management 64-67
Management discussion and analysis 70-85
Review of the operating environment 70-74
Business review 74-77
Financial review 78-85
Financial Statements 88-156
Statement of management’s responsibility for financial reporting 89
Independent auditor’s report to the shareholders of State Bank of Mauritius Ltd 90-91
SBM Group addresses 158
annual report | 2011 7annual report | 2011 6
Key Financial HigHligHTS & cHarTS
2007 2008 2009 2010 2011
Rs
0
5
10
15
20
25
30
2007 2008 2009 2010 2011
%
0.0
0.5
1.0
1.5
2.0
2.5
3.0
2007 2008 2009 2010 2011
%
0
500
1,000
1,500
2,000
2,500
Rs m
2007 2008 2009 2010 2011 0
200
400
600
800
1,000
2007 2008 2009 2010 2011
Cent
s
Earnings per share Dividend per share
0
20
40
60
80
100
0
2
4
6
8
10
12
14
2007 2008 2009 2010 2011
Tim
es
0 10 20 30 40 50 60 70
2007 2008 2009 2010 2011
Rs
0
10
20
30
40
50
2007 2008 2009 2010 2011
%
Keyfinancialhighlights
2011 2010 2009 2008a 2007a
Shareholders’ equity (Rs m) 15,971 14,656 12,943 10,974 9,515
Capital adequacy ratio (%)b 22.42 26.49 24.04 21.61 20.58
Earnings per share (cents) 780 720 784 819c 503
Economic value added (Rs m) 272 398 482 432 478
Profit before income tax (Rs m) 2,475 2,212 2,345 2,397 1,740
Profit attributable to equity holders of the parent (Rs m) 2,013 1,859 2,025 2,114 1,506
Return on average assets (%)d 2.33 2.41 2.83 3.47 2.74
Return on average risk-weighted assets (%)e 3.80 4.10 4.62 5.12 4.25
Return on average shareholders' equity (%)d 13.32 14.75 17.24 21.43 17.73
Return on average Tier 1 capital (%)d 19.54 20.41 25.48 30.85 27.81
Credit deposit ratio (%) 81.83 72.83 64.17 66.03 62.87
Cost to income (%) 38.55 39.03 38.43 37.08 40.06
Cost to income, before depreciation (%) 33.82 34.30 30.06 29.05 29.89
Gross impaired advances to gross advances (%) 1.40 1.87 2.00 2.42 2.79
Net impaired advances to net advances (%) 0.46 0.81 0.47 0.48 1.28
Dividend payout ratio (%) 38.47 38.20 35.06 31.14 36.00
Electronic to gross transactions (%) 87 85 84 82 85
a Restated for comparative purposes.b Risk-weighted assets are computed as per the then prevailing guidelines existing as at the respective
year ends. The 2009, 2010 and 2011 ratios are computed based on the Basel II methodology advocated by the Bank of Mauritius, and earlier years are based on Basel I.
c EPS, excluding the increase in dividend receipt in 2008, would have been Rs 6.05.d Averages are based on daily and monthly average balances where applicable.e Average risk-weighted assets are calculated using as at year-end balances.
Keyfinancialcharts
Profit for the year Earnings per share and dividend per share
Market price per share Price earnings ratio
Net asset value per share Capital adequacy ratio
Cost to income ratio Gross impaired advances to gross advances ratio

@ the heart of your strategies
Our business: to help you explore the
bgi picture with our
Corporate Solutions
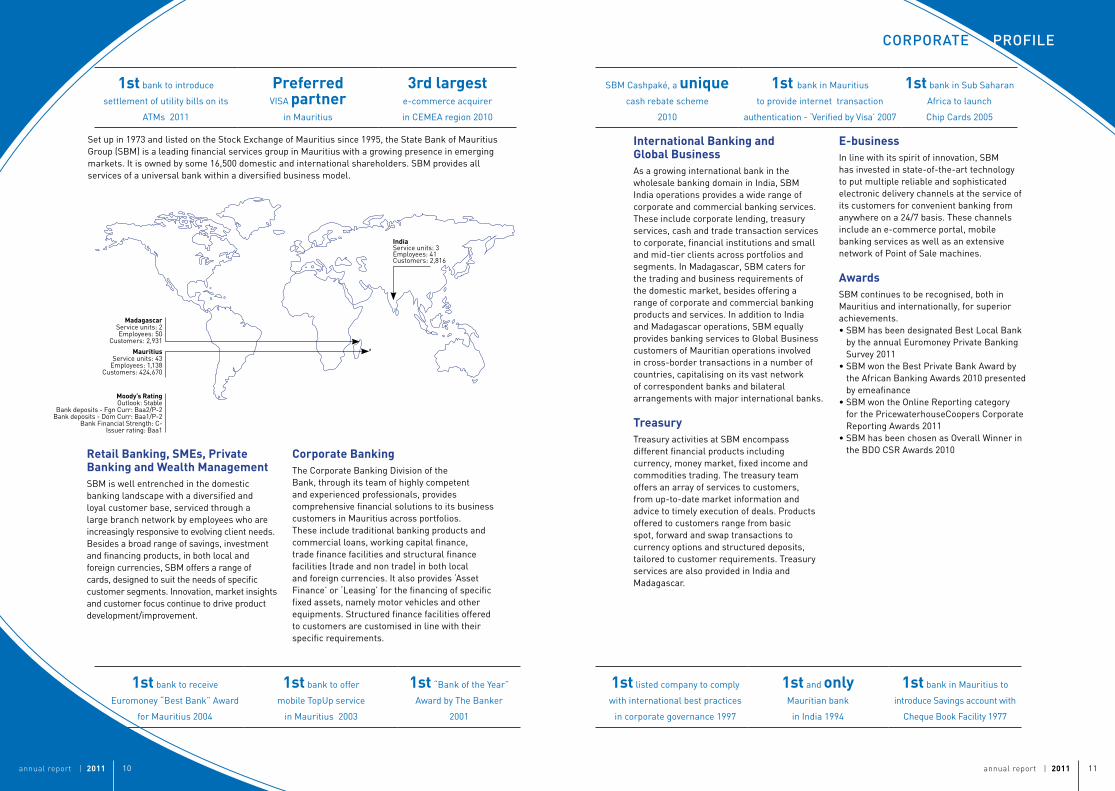
1st bank to introduce
settlement of utility bills on its
ATMs 2011
Preferred VISA partner
in Mauritius
3rdlargest e-commerce acquirer
in CEMEA region 2010
SBM Cashpaké, a unique
cash rebate scheme
2010
1stbank in Mauritius
to provide internet transaction
authentication - ‘Verified by Visa’ 2007
1st bank in Sub Saharan
Africa to launch
Chip Cards 2005
1st bank to receive
Euromoney “Best Bank” Award
for Mauritius 2004
1st bank to offer
mobile TopUp service
in Mauritius 2003
1st “Bank of the Year”
Award by The Banker
2001
1st listed company to comply
with international best practices
in corporate governance 1997
1st and onlyMauritian bank
in India 1994
1st bank in Mauritius to
introduce Savings account with
Cheque Book Facility 1977
annual report | 2011 11annual report | 2011 10
Mauritius Service units: 43
Employees: 1,138 Customers: 424,670
Madagascar Service units: 2 Employees: 50
Customers: 2,931
Moody’sRatingOutlook: Stable
Bank deposits - Fgn Curr: Baa2/P-2Bank deposits - Dom Curr: Baa1/P-2
Bank Financial Strength: C-Issuer rating: Baa1
IndiaService units: 3 Employees: 41 Customers: 2,816
InternationalBankingandGlobalBusinessAs a growing international bank in the wholesale banking domain in India, SBM India operations provides a wide range of corporate and commercial banking services. These include corporate lending, treasury services, cash and trade transaction services to corporate, financial institutions and small and mid-tier clients across portfolios and segments. In Madagascar, SBM caters for the trading and business requirements of the domestic market, besides offering a range of corporate and commercial banking products and services. In addition to India and Madagascar operations, SBM equally provides banking services to Global Business customers of Mauritian operations involved in cross-border transactions in a number of countries, capitalising on its vast network of correspondent banks and bilateral arrangements with major international banks.
TreasuryTreasury activities at SBM encompass different financial products including currency, money market, fixed income and commodities trading. The treasury team offers an array of services to customers, from up-to-date market information and advice to timely execution of deals. Products offered to customers range from basic spot, forward and swap transactions to currency options and structured deposits, tailored to customer requirements. Treasury services are also provided in India and Madagascar.
Set up in 1973 and listed on the Stock Exchange of Mauritius since 1995, the State Bank of Mauritius Group (SBM) is a leading financial services group in Mauritius with a growing presence in emerging markets. It is owned by some 16,500 domestic and international shareholders. SBM provides all services of a universal bank within a diversified business model.
RetailBanking,SMEs,PrivateBankingandWealthManagementSBM is well entrenched in the domestic banking landscape with a diversified and loyal customer base, serviced through a large branch network by employees who are increasingly responsive to evolving client needs. Besides a broad range of savings, investment and financing products, in both local and foreign currencies, SBM offers a range of cards, designed to suit the needs of specific customer segments. Innovation, market insights and customer focus continue to drive product development/improvement.
E-businessIn line with its spirit of innovation, SBM has invested in state-of-the-art technology to put multiple reliable and sophisticated electronic delivery channels at the service of its customers for convenient banking from anywhere on a 24/7 basis. These channels include an e-commerce portal, mobile banking services as well as an extensive network of Point of Sale machines.
AwardsSBM continues to be recognised, both in Mauritius and internationally, for superior achievements. • SBM has been designated Best Local Bank
by the annual Euromoney Private Banking Survey 2011
• SBM won the Best Private Bank Award by the African Banking Awards 2010 presented by emeafinance
• SBM won the Online Reporting category for the PricewaterhouseCoopers Corporate Reporting Awards 2011
• SBM has been chosen as Overall Winner in the BDO CSR Awards 2010 CorporateBanking
The Corporate Banking Division of the Bank, through its team of highly competent and experienced professionals, provides comprehensive financial solutions to its business customers in Mauritius across portfolios. These include traditional banking products and commercial loans, working capital finance, trade finance facilities and structural finance facilities (trade and non trade) in both local and foreign currencies. It also provides ‘Asset Finance’ or ‘Leasing’ for the financing of specific fixed assets, namely motor vehicles and other equipments. Structured finance facilities offered to customers are customised in line with their specific requirements.
corporaTe proFile
annual report | 2011 13annual report | 2011 12
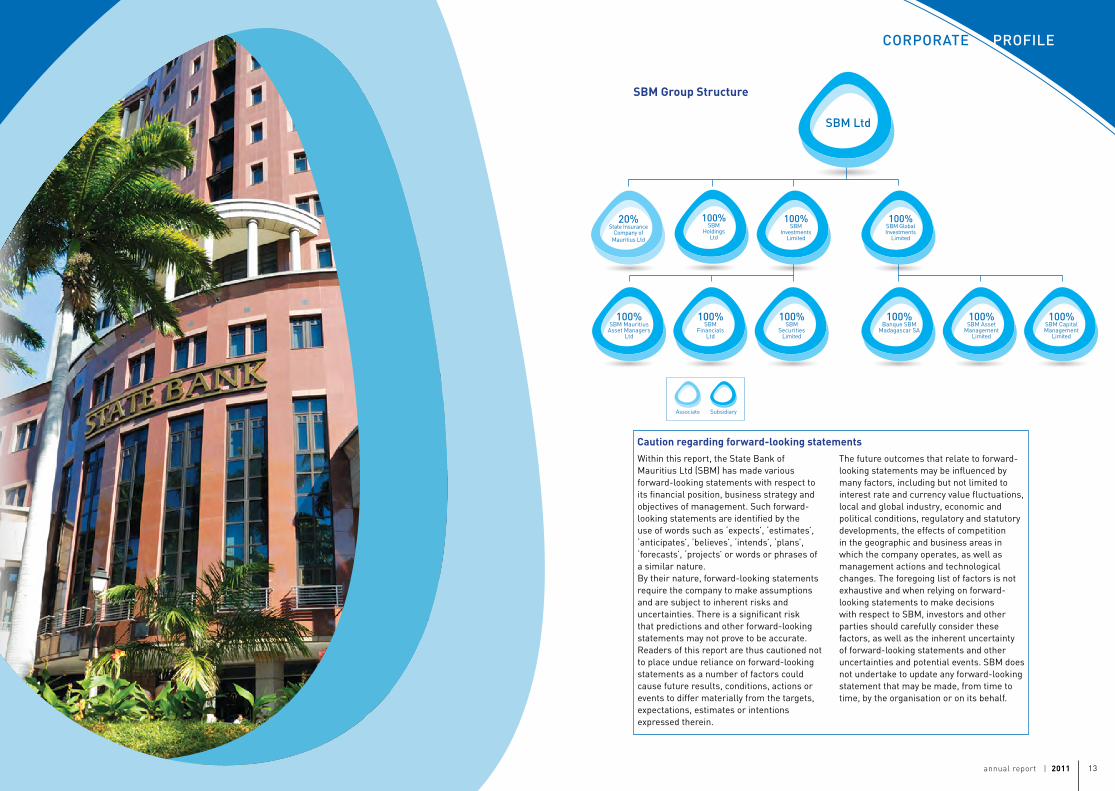
SBMGroupStructure
SubsidiaryAssociate
100%SBM
Securities Limited
100%SBM
Financials Ltd
100%SBM Mauritius
Asset Managers Ltd
20%State Insurance
Company of Mauritius Ltd
100%SBM
Investments Limited
SBM ltd
100%Banque SBM
Madagascar SA
100%SBM Asset
Management Limited
100%SBM Capital Management
Limited
100%SBM Global Investments
Limited
Within this report, the State Bank of Mauritius Ltd (SBM) has made various forward-looking statements with respect to its financial position, business strategy and objectives of management. Such forward-looking statements are identified by the use of words such as ‘expects’, ‘estimates’, ‘anticipates’, ‘believes’, ‘intends’, ‘plans’, ‘forecasts’, ‘projects’ or words or phrases of a similar nature. By their nature, forward-looking statements require the company to make assumptions and are subject to inherent risks and uncertainties. There is a significant risk that predictions and other forward-looking statements may not prove to be accurate. Readers of this report are thus cautioned not to place undue reliance on forward-looking statements as a number of factors could cause future results, conditions, actions or events to differ materially from the targets, expectations, estimates or intentions expressed therein.
The future outcomes that relate to forward-looking statements may be influenced by many factors, including but not limited to interest rate and currency value fluctuations, local and global industry, economic and political conditions, regulatory and statutory developments, the effects of competition in the geographic and business areas in which the company operates, as well as management actions and technological changes. The foregoing list of factors is not exhaustive and when relying on forward-looking statements to make decisions with respect to SBM, investors and other parties should carefully consider these factors, as well as the inherent uncertainty of forward-looking statements and other uncertainties and potential events. SBM does not undertake to update any forward-looking statement that may be made, from time to time, by the organisation or on its behalf.
Cautionregardingforward-lookingstatements
corporaTe proFile
100%SBM
Holdings Ltd

annual report | 2011 15annual report | 2011 14
Board oF direcTorS
AzimFakhruddinCurrimjeeBa (Mathematics), MBa Mr Currimjee is currently the CEO and Managing Director of Quality Beverages Ltd, Vital Water Bottling Co Ltd and Margarine Industries Ltd, and is a director of various companies in the Currimjee Group. He was previously President of the Mauritius Chamber of Commerce and Industry.
He joined the Board in December 2008 and is an independent non-executive director.
DheerendraKumarDabeeSc, llB (Hons) Mr Dabee, a Birmingham University graduate in Law and Political Science, Barrister at Law of Middle Temple since 1981 and a Senior Counsel, is currently the Solicitor-General in the Attorney General’s Office. He is a director of Air Mauritius Ltd and Mauritius Telecom and acts as Legal Adviser to
a number of public organisations. He joined the Board in May 2008 and is a non-executive director.
GeorgeJohnDumbellaciB (UK)Mr Dumbell has extensive financial and commercial experience over more than 35 years, having served in Senior Management positions within the HSBC Group in nine countries across Asia, the Middle East, Europe and the Bahamas. He is currently the Chairman of the Constance Group
of Companies and sits on the founding Board of the Mauritius Institute of Directors. Mr Dumbell is also a director of Anglo Mauritius Assurance Society Ltd, Swan Insurance Co Ltd and the Chrys Capital Group of Companies. In 2003 he undertook a two-year contract with the Mauritius Commercial Bank Ltd in the field of Risk Management. He joined the Board in February 2008 and is an independent non-executive director.
MuniKrishnaTReddyg.o.S.K, MSc agriculture
ChairmanMr Muni Krishna T. Reddy has a master’s degree with over 40 years of experience in the financial services industry. He was the Chief Executive Officer of the State Bank of Mauritius Ltd (SBM) for over 16 years until October 2003
when he was elected as Director and Chairman of the Board of SBM. During his tenure as Chief Executive, SBM was listed on the Mauritian Stock Exchange in 1995, implemented for the first time the bank’s automation of its operations and other infrastructure, including SBM tower. SBM also expanded into Madagascar and India. Prior to joining SBM, Mr Reddy has worked in the banking sector in India and Singapore for 17 years. He is a director of various boards of large companies both in Mauritius and outside Mauritius, including Arcelor Mittal Point Lisas Limited (Trinidad), Arcelor Mittal Steel USA Inc (Chicago), Global Capital PLC (Malta) and was a director of Mauritius Telecom (Mauritius), Air Mauritius, NEDC etc. Mr Reddy was conferred with the title Grand Officer of the Star and Key of the Indian Ocean (G.O.S.K) by the Government of Mauritius coinciding with the first anniversary of the Republic of Mauritius in 1993 for distinguished services in the banking industry and for significant contribution to the economic development of Mauritius. Mr Reddy has been, once again, elected as an independent non-executive director on 17 December 2010 and was designated as Chairman of the SBM Group.
KalindeeBhanji,Ba (Hons) economics, MSc public Sector Management Mrs Bhanji has held senior positions in various ministries of the Government of Mauritius and is currently the Permanent Secretary at the Prime Minister’s Office. She joined the Board in December 2006 and is a non-executive director.
AliMichaelMansoorMSc (Mathematical economics and econometrics), Master in public policy Mr Mansoor has wide-ranging technical and managerial experience at the World Bank, European Commission, COMESA Clearing House and the International Monetary
Fund. He was a lead economist at the World Bank with a geographical focus on Eastern Europe and sector attention in public finance, banking and finance, trade and private sector. He is currently the Financial Secretary at the Ministry of Finance and Economic Development of Mauritius and a director of various companies. He joined the Board in December 2006 and is a non-executive director.
RohitRamnawazFcca, llB Mr Ramnawaz is a Fellow of the Association of Chartered Certified Accountants and also holds a degree in law. He has over 25 years’ experience in the fields of banking, finance, accounting, tax advisory and financial services. He is currently
the Managing Director of African Links Ltd, a consultancy firm principally engaged in providing value-added services to clients and multinationals in the Global Business sector. He also acts as independent director on the board of various companies in the Global Business sector. He has previously been a freelance country note sender for Mauritius for the Economist Intelligence Unit. Mr Ramnawaz joined the Board in December 2006 and is an independent non-executive director.
AlfredJosephGerardRobertAlainReyBSc (Hons) economics, aca Mr Rey is a graduate in Economics from the London School of Economics and qualified as a Chartered Accountant in 1985. He is currently Project Director as well as a director of various companies. Mr Rey has
wide financial experience having served as Chief Financial Officer of a NASDAQ listed company as well as Regional Corporate Director of a leading bank in Mauritius. He joined the Board in December 2009 and is an independent non-executive director.
ProfessorAndrewScottBa, MSc, d philProfessor Scott is Professor and Deputy Dean at the London Business School. He holds a Doctorate in Philosophy from Oxford University, was a Fellow of All Souls, Oxford and has taught at Harvard and Oxford Universities. He is a non-executive director of the UK’s Financial
Services Authority. Also Economic Advisor to the Prime Minister of Mauritius. He joined the Board in December 2009 and is an independent non-executive director.
PaulineSybilleChehSeeyaveMa (cantab), acaMs Seeyave was previously managing a portfolio of clients in Audit and Business Assurance in an international firm of Chartered Accountants in London before joining SBM in 2002. She is currently in charge of Corporate Banking and
has previously headed various functions within SBM including Risk Management, Value Based Performance Management and Finance. She is a director of the State Insurance Company of Mauritius Ltd, SICOM General Insurance Ltd and Club Mediterranee Albion Resort Ltd. She joined the Board in December 2010 and is an executive director.
GautamVirBa (Hons), MBaMr Vir joined SBM as Chief Executive in May 2009. He has over 32 years of banking experience and has worked in India, Asia Pacific, the Middle East, North America and Europe. Mr Vir has previously worked for Citibank, Bank of America and Standard Chartered, and was Chief
Executive of Hebros Bank in Bulgaria. From 2005 to 2009, he served as Managing Director and Chief Executive Officer of the Development Credit Bank Ltd, India, a bank he helped list on the Bombay Stock Exchange in 2006. Mr Vir is an executive director.
annual report | 2011 17annual report | 2011 16
direcTorS oF SBM SUBSidiarieSBoard coMMiTTeeS
SBMAssetManagementLimitedGautam Vir (Chairman)Veronique Lim Hoye YeeDaniel Ng TseungSoopaya Parianen
SBMCapitalManagementLimitedGautam Vir (Chairman)Chandradev AppadooSoopaya ParianenPauline Seeyave
SBMFinancialsLimitedGautam Vir (Chairman) Pauline Seeyave
SBMGlobalInvestmentsLimitedGautam Vir (Chairman)Soopaya ParianenPauline Seeyave
SBMInvestmentsLimitedGautam Vir (Chairman)Chandradev Appadoo Soopaya ParianenPauline Seeyave
SBMMauritiusAssetManagersLtdGautam Vir (Chairman)Vishal Joyram Anil KundanVeronique Lim Hoye YeeSoopaya Parianen
SBMSecuritiesLtdGautam Vir (Chairman)Vishal JoyramDaniel Ng TseungSoopaya Parianen
BanqueSBMMadagascarSAMuni Krishna T Reddy, G.O.S.K (Chairman)Chandradev AppadooVeronique Lim Hoye YeeSoopaya ParianenPauline SeeyaveGautam Vir
SBMHoldingsLtdGautam Vir (Chairman)Soopaya Parianen
AuditCommitteeAlain Rey (Chairman) Azim Fakhruddin CurrimjeeDheerendra Kumar Dabee, S.CGeorge Dumbell Rohit Ramnawaz
CreditCommitteeMuni Krishna T Reddy, G.O.S.K (Chairman) Dheerendra Kumar Dabee, S.CDaniel Ng Tseung (attended up to August 2011)Rohit Ramnawaz Alain ReyPauline Seeyave (attended up to August 2011)Gautam Vir
CorporateGovernance&ConductReviewCommitteeDheerendra Kumar Dabee, S.C (Chairman) Kalindee BhanjiAzim Fakhruddin CurrimjeeGeorge DumbellRohit RamnawazMuni Krishna T Reddy, G.O.S.K
Nomination&RemunerationCommitteeMuni Krishna T Reddy, G.O.S.K (Chairman) Kalindee BhanjiAzim Fakhruddin CurrimjeeDheerendra Kumar Dabee, S.CAlain Rey
RiskManagementCommitteeGeorge Dumbell (Chairman) Ali Michael MansoorRohit RamnawazMuni Krishna T Reddy, G.O.S.KAndrew ScottPauline SeeyaveGautam Vir
StrategicPlanningCommitteeMuni Krishna T Reddy, G.O.S.K (Chairman) Kalindee BhanjiAli Michael MansoorAndrew ScottPauline SeeyaveGautam Vir

@ the heart of your future
d
a e
2
d
a
a
a
a
bcefd
g
1
11
2
3hki
lmm
2
nopqrs vwxyz
45
5
6
6
789tu
i
ii
i
b
b
f
1
1
2
24
ilesm Our promise: to help you make
m
upon her
g tomorrow
1
26
annual report | 2011 21annual report | 2011 20
reporT oF THe direcTorS
year. SBM’s approach of consistently remaining close to customers has been in fact one of the factors that enabled it to bounce back rapidly and decisively from last year’s downturn. As SBM expands overseas, it will continue to be guided by the same urge to be close to its customers, a policy that has been particularly valuable in Mauritius.
RobustriskmanagementandgovernanceProximity with customers not only allows SBM to boost business volumes but also to proactively understand risks and thus better manage them, in line with international best practice. SBM’s commendable asset quality metrics, which improved further during the financial year under review, testify to its sound credit risk management practices. SBM is conscious that the risk environment is fast evolving and remains alert to the changes that are being envisaged in the international scene, particularly in relation to Basel III, with a view to continuously improving its already solid risk management framework and adhering to prudential and regulatory norms. A more detailed discussion of SBM’s risk management framework and related performance indicators may be found in the Risk Management Report, contained at pages 44 to 63 of the Annual Report.
SBM also prides itself in respect of its strong governance structure. The Code of Ethics and Business Conduct and the Code of Banking Practice, together with established internal policies and procedures, ensure that SBM conducts business with a high level of ethics, integrity and professionalism. SBM was in fact the first listed company in Mauritius to adhere to corporate governance best practices. It is deemed that SBM’s corporate governance structure enhances its ability to generate sustainable value to shareholders. The Corporate Governance Report, at pages 27 to 40 of the Annual Report, explains SBM’s corporate governance framework in more details, accompanied by relevant disclosures.
Dear shareholders,
The financial year ended 30 June 2011 has been encouraging for SBM. Whilst the market environment has remained volatile, SBM has successfully bounced back from the previous year’s contraction to achieve a net profit of over Rs 2 billion including a one time capital gain on disposal of equity investment, representing a growth of 8.3%. The upturn was underpinned by a rise in the market share of advances in both the retail and the corporate segments in Mauritius and a noticeable increase in fee-based income. On the strength of its positive performance in an uncertain economic context globally, SBM has reintegrated into the top 1,000 global banks list of The Banker and remains the highest rated bank in Mauritius by Moody’s Investors Service.
PersistingeconomicheadwindsWhile the first half of the financial year saw a general recovery in major advanced economies, performance in the second half was mitigated, with the waning of the effect of stimulus, resurging concerns regarding debt sustainability, notably in the US and the euro zone, and unanticipated shocks like the devastating Japanese earthquake and political unrest in the Middle East and North Africa regions. Emerging markets such as China and India have, for their part, continued to post strong growth, albeit at a slowing pace in the second half of the financial year linked to policy tightening in response to mounting inflation.
The Mauritian economy has depicted a fair degree of resilience, and has on an annual average basis posted an upturn in FY 2011. However, the recovery has been uneven – with a weaker performance in the second half – and remains fragile, not least because of persisting difficulties in the country’s main markets. Banking sector credit has picked up but has not gathered significant momentum especially in the corporate segment as
uncertainty over the outlook has dimmed private sector investment while a persisting high liquidity situation has put pressure on interest margins.
As for the Indian economy, notwithstanding a slowdown in the latter half of FY 2011, it has continued to deliver one of the strongest growth rates in the world, which is driving solid banking sector performance. On the other hand, the Madagascar economy remains marred by a political impasse, which is having an adverse impact on growth and investment, but is otherwise offering higher rates of return on placements.
Relationship–keytobusinessbuildingWithin a difficult economic context, it is deemed to be all the more important to be close to customers. This has translated into a series of events including open days at SBM branches, targeted networking events, organized customer visits, revamped complaints management and tailor-made products and services to accompany clients through their business and life cycles. Among the new products launched by SBM during FY 2011 figure SBM BILLPAY, which allows customers to settle utility bills through debit and credit cards at SBM ATMs and selected Point of Sale terminals; SBM BRICT INVESTMENTS, which is a capital guaranteed product that enables clients to benefit from the upside potential in well performing emerging markets; SBM ECOLOAN, designed to finance the purchase of solar panels; and Bancassurance services, whereby the countrywide presence of SBM is leveraged to offer life insurance products to customers.
Proximity with clients has enabled SBM to increase its market share in both the retail and corporate segments, even as competition within the banking sector intensified within a high liquidity environment. It has also resulted in a noteworthy expansion of the customer base to over 420,000, representing an increase of more than 30,000 clients over the financial
ContinuedfocusonefficiencyIn a difficult context characterized by pressures on business volumes and margins, SBM’s continued focus on productivity has helped to hold up results, enabling it to practise competitive pricing to its customers while offering good risk-adjusted returns to its shareholders. Efficiency is underpinned by a lean structure with centralization of support functions, streamlined processes and an optimal use of technology. SBM’s cost to income ratio, which has consistently remained low by international standards, bears evidence of an efficiently-run organization.
FinancialresultsTotal on-balance sheet assets went up by 19.9% to reach Rs 95.7 Bn over FY 2011, driven by a 29.5% rise in the advances book to Rs 58.0 Bn, with strong performances in all segments namely retail, corporate and international. On the other hand, the gilt-edged securities portfolio declined by 16.3% to Rs 16.9 Bn, as lower margins on average made this asset class less attractive. Deposits recovered from last year’s drop to reach Rs 70.9 Bn, representing a 15.3% growth. Notwithstanding this commendable performance, net interest income was flat from the previous financial year as a notable share of advances growth occurred in the latter part of FY 2011 – which will positively impact next year’s results – while margins were under pressure.
Encouragingly, non interest income went up by a healthy 26.9% to reach Rs 1,706 m, boosted by strong fees and commissions and a robust recovery in e-commerce income. Hence, gross operating income rose by 9.6% to reach Rs 4,205 m in FY 2011. Operating expenses increased by 9% to Rs 1,498 m, mainly on account of higher staff cost as SBM continued to build its human capital for future growth, while impairment charges declined. Hence, the cost to income ratio improved to 38.5%, which highlights strong levels of efficiency by international standards. Against this background, profit before tax increased by 11.9% to reach Rs 2,475 m in FY 2011 while
annual report | 2011 23annual report | 2011 22
reporT oF THe direcTorS
SBM won the Best Private Bank Award from the African Banking Awards 2010 for its unique services tailored to clients’ needs and aspirations including innovative investment funds. The good standing of SBM’s private banking services also gained recognition during the annual Euromoney Private Banking Survey which designated SBM as the Best Local Bank.
SBM’s policy of fair, clear and quality reporting was recognised by PricewaterhouseCoopers during the Corporate Reporting Awards 2011 where SBM won the Online Reporting Award for effective communication with its shareholders and potential investors through its website.
Moreover, SBM’s engagement to the society, reflected in various CSR initiatives undertaken, led SBM to emerge as the Overall Winner in the BDO CSR Awards 2010.
OutlookThe Bank is confident in its focused strategy emphasizing pro-active customer proximity, efficiency and re-engineering of the Bank’s balance sheet. SBM aims to consolidate existing domestic markets and explore cross border avenues to significantly expand the India business taking into consideration the excellent prospects that this market offers and building on the experience and expertise garnered in Mauritius. One of the important investments that the Bank will make over the coming periods relates to banking technology strategy to gear up for the futuristic banking needs. This should help improve processes and develop new capabilities to serve better clients in a more cost-efficient manner in the medium to long term, whether in terms of new and enhanced products and services, faster turnaround or more convenience. SBM will continue to focus on cost management as pressures on revenue margins are expected to persist in the years to come besides uncertainties in the financial industry.
profit after tax rose by 8.3% to Rs 2,013 m including a one time capital gain on disposal of equity investment and after accounting for a large increase in the taxation charge.
Besides enhanced profitability and efficiency, SBM continues to deliver a strong and balanced outcome in respect of other performance areas. Asset quality has continued to improve, with the gross and net impairment ratios standing at 1.4% (2010: 1.9%) and 0.5% (2010: 0.8%) respectively while capital adequacy and liquidity metrics were maintained at comfortable levels.
A detailed review of this year’s achievements is set out in the Management Discussion and Analysis section of the Annual Report, at pages 78 to 85.
CapitalanddividendsThe Board of Directors approved an interim dividend of Rs 3.00 per share for the financial year ended 30 June 2011, payable on 3 October 2011. This represents an increase in dividend of 25 cents per share as compared to the previous financial year. The dividend payout ratio stood at 38.5% in FY 2011 (2010: 38.2%).
Shareholders’ equity rose by 9.0% to reach Rs 16.0 Bn as at June 2011 while Tier 1 capital was further strengthened, increasing from Rs 9.9 Bn as at June 2010 to Rs 11.2 Bn as at June 2011. The capital adequacy ratio stood at 22.4%, much above the regulatory capital requirement.
SBM maintains sufficient capital to support its plans to pursue both domestic as well as overseas expansion.
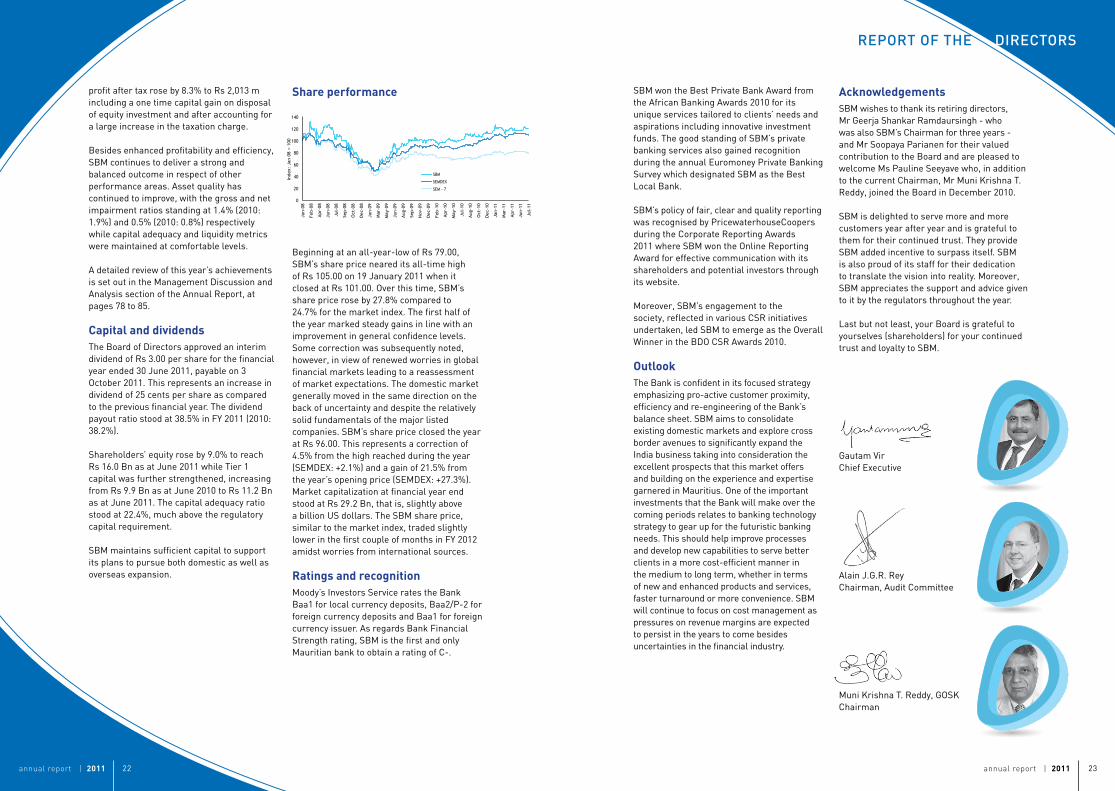
Shareperformance
Beginning at an all-year-low of Rs 79.00, SBM’s share price neared its all-time high of Rs 105.00 on 19 January 2011 when it closed at Rs 101.00. Over this time, SBM’s share price rose by 27.8% compared to 24.7% for the market index. The first half of the year marked steady gains in line with an improvement in general confidence levels. Some correction was subsequently noted, however, in view of renewed worries in global financial markets leading to a reassessment of market expectations. The domestic market generally moved in the same direction on the back of uncertainty and despite the relatively solid fundamentals of the major listed companies. SBM’s share price closed the year at Rs 96.00. This represents a correction of 4.5% from the high reached during the year (SEMDEX: +2.1%) and a gain of 21.5% from the year’s opening price (SEMDEX: +27.3%). Market capitalization at financial year end stood at Rs 29.2 Bn, that is, slightly above a billion US dollars. The SBM share price, similar to the market index, traded slightly lower in the first couple of months in FY 2012 amidst worries from international sources.
RatingsandrecognitionMoody’s Investors Service rates the Bank Baa1 for local currency deposits, Baa2/P-2 for foreign currency deposits and Baa1 for foreign currency issuer. As regards Bank Financial Strength rating, SBM is the first and only Mauritian bank to obtain a rating of C-.
AcknowledgementsSBM wishes to thank its retiring directors, Mr Geerja Shankar Ramdaursingh - who was also SBM’s Chairman for three years - and Mr Soopaya Parianen for their valued contribution to the Board and are pleased to welcome Ms Pauline Seeyave who, in addition to the current Chairman, Mr Muni Krishna T. Reddy, joined the Board in December 2010.
SBM is delighted to serve more and more customers year after year and is grateful to them for their continued trust. They provide SBM added incentive to surpass itself. SBM is also proud of its staff for their dedication to translate the vision into reality. Moreover, SBM appreciates the support and advice given to it by the regulators throughout the year.
Last but not least, your Board is grateful to yourselves (shareholders) for your continued trust and loyalty to SBM.
Gautam VirChief Executive
Alain J.G.R. ReyChairman, Audit Committee
Muni Krishna T. Reddy, GOSKChairman
2005 06 07 08 09 10
121086420
-2-4-6-8
-10
121086420
-2-4-6-8
-10
Emerging and developing economies
World
Advancedeconomies
Food
Industrial Inputs
Metals
Crude Oil
0
20
40
60
80
100
120
140
160
180
200
Jun-07
Aug-07
Oct-07
Dec-07
Feb-08
Apr-08
Jun-08
Aug-08
Oct-08
Dec-08
Feb-09
Apr-09
Jun-09
Aug-09
Inde
x: J
un-0
7=10
0
Evolution of International Commodity Prices
Source: IMF, SBM estimates
Evolution of International Commodity Prices
Source: IMF, SBM estimates
Global GDP Growth - Quarter-over-Quarter, Annualised
Source: IMF World Economic Outlook, July 2009 update
0
20
40
60
80
100
120
140
Jan-
08
Feb-0
8
Apr-
08
Jun-
08
Jul-
08
Sep-0
8
Oct
-08
Dec
-08
Jan-
09
Mar
-09
May
-09
Jun-
09
Aug
-09
Sep-0
9
Nov
-09
Dec
-09
Feb-1
0
Apr-
10
May
-10
Jul-
10
Aug
-10
Oct
-10
Dec
-10
Jan-
11
Mar
-11
Apr-
11
Jun-
11
Jul-
11
Index
: Ja
n 08
= 1
00
SBM
SEMDEX
SEM - 7

@ the heart of your assets
Wealth Management solutions
$
Our
€€
€€
€
€ ¥¥
¥¥¥ Rs Rs
££
£ £
Rs£
$
$
$$
Rs
$$$$
$
$$
€Rs
€
€
€
Rs€
¥¥
Rs
¥¥
¥ ¥
¥
¥
¥¥
¥££ £
£
££
£ £
$$$
$$
$$LoLTHNX
(-.-)
Rs:call gni
to help you grow your hard-earned savings with our
CertificatefromtheCompanySecretaryI certify that, to the best of my knowledge and belief, the company has filed with the Registrar of Companies all such returns as are required of the Company under the Companies Act 2001
Chandradev AppadooCompany Secretary
annual report | 2011 27annual report | 2011 26
corporaTe goVernance reporT
STaTeMenT oF direcTorS’ reSponSiBiliTieS
StatementonCorporateGovernanceCorporate governance refers to the system by which companies are directed and controlled. The shareholders’ role in governance is to appoint the directors and the auditors. The Board of Directors is responsible for the governance of the organisation.
Corporate governance involves managing and controlling relations shared among different stakeholders, including shareholders, the Board of Directors, employees, customers, suppliers and the community at large. Corporate governance is also about commitment to values and ethical business conduct.
The Board plays a key role in the setting up of the system of corporate governance within an organisation to assist in safeguarding policies and procedures, and aligning the incentives of managers with those of shareholders. The Board sets SBM’s strategy, develops directional policy, provides the leadership to put them into effect, appoints and supervises the management, and ensures accountability of the organisation to its owners and relevant authorities.
TheCodeofCorporateGovernanceforMauritiusThe Code of Corporate Governance for Mauritius (the Code) published in October 2003 subsequently became mandatory as from July 2009. Public interest entities including bank and non bank financial institutions and listed companies must comply with the Code and are required to provide explanations for not adopting any of the provisions of the Code in their financial statements or reports.
The Board of Directors ensures through its system of governance, including the structure of Board Committees, that appropriate internal controls and risk management processes are set in place for the proper running of the business. The Board Risk Management Committee has the responsibility to ensure that effective structures and processes are put in place to properly identify, evaluate, measure, monitor and manage key risks faced by the business. Amongst others, it reviews policies for the management of risks particularly in the areas of credit, market, interest, liquidity, operational and technological risks, ensuring that adequate procedures and limits as well as appropriate methodologies and systems are in place. The Audit Committee monitors the integrity of the Financial Statements and is responsible, amongst others, for reviewing the systems of internal controls and for ascertaining its adequacy. It examines and discusses weaknesses that may be identified in controls and, if necessary, recommends additional procedures to enhance the system of internal controls. An internal audit function, whose Head reports directly to the Chairman of the Audit Committee, is in place to ensure that SBM’s operations are conducted according to the established practices by providing an independent and objective assurance, and by advising on best practice. The Audit Committee reviews reports from internal and external auditors and monitors relevant actions taken by management. The Risk Management Report contained in the Annual Report provides further details on the processes for risk management and internal controls.
The directors confirm that (i) an effective system of internal controls and risk
management has been maintained to safeguard the assets and for the prevention and detection of fraud, (ii) there is no reason to believe that the business will not be a going concern in the year ahead and the Financial Statements have been prepared on this basis, and in accordance and in compliance with the International Financial Reporting Standards, the Banking Act 2004, applicable Bank of Mauritius guidelines, and appropriate accounting policies. These were supported by reasonable and prudent judgements, and estimates have been used consistently, (iii) the Financial Statements fairly present the financial position of the Company and the SBM Group as at the end of the financial year ended 30 June 2011 and the financial performance and cash flows for FY 2011, (iv) proper accounting records have been kept, in accordance with the Companies Act 2001, disclosing with reasonable accuracy at any time the financial position of the Company and the SBM Group. The external auditors, Deloitte Chartered Accountants have independently reported on whether the Financial Statements are fairly presented.
Alain J.G.R.ReyChairman, Audit Committee
Muni Krishna T. Reddy, GOSK Chairman
SBMCorporateGovernanceframeworkSBM was among the first companies in Mauritius and the first listed one to comply with international best practices in corporate governance as far back as 1997, well ahead of the Bank of Mauritius Guideline on Corporate Governance issued in 2001 and the introduction of the Code in 2003.
SBM’s corporate governance framework includes its Board of Directors, Board Committees, management forums, management, employees, internal and external auditors, and other stakeholders. It follows industry best practices as well as established policies and procedures. SBM is highly committed to and embraces the highest standards of effective good governance practices throughout its operations. This framework is crucial in developing and sustaining a successful business and SBM requires all its employees to adopt the highest standard of business integrity, transparency, professionalism and ethical behaviour, and monitors compliance with policies and with the best practices, laws, regulations and standards while conducting business.
SBM’s Board Corporate Governance & Conduct Review Committee reviews the corporate governance framework and compliance thereof. This Committee reviews the Board charter and policies on matters such as management or disclosure of conflict of interests and related party transactions on an ongoing basis. At least once annually, it reviews and, if appropriate, recommends new policies to enhance the governance framework and/or comply with new regulations or laws. The Committee also recommends measures to the Board for promoting corporate social responsibility.
Directors’statementofcomplianceThe directors confirm that the Company has complied in all material respects with the principles of the Code.
annual report | 2011 29annual report | 2011 28
corporaTe goVernance reporT
• Approve the terms and conditions of service contract of directors including compensation benefits for their services;
• Approve the recruitment or promotion to senior executive and the remuneration, benefits and other terms and conditions of the service contract of such officers;
• Ensure effective communication with shareholders and relevant stakeholders;
• Approve strategic capital investment of the Bank, including new business lines;
• Assess both internal and external auditors’ work;
• Exercise leadership, enterprise, integrity and judgement in directing SBM.
The approval of the shareholders is sought for crucial matters including changes to the Bank’s constitution, acquisition and disposal of major assets/investments and raising capital upon recommendation of the Board.
The annual calendar of board meetings is agreed upon at the beginning of the year. The Board meets at least once quarterly, and additional meetings, including those for approval of budget and policies, are held as and when required. The executive management team is invited to Board and Board Committee meetings.
BoardCommitteesThe Board has established Board Committees as well as various management committees/forums to assist it in the discharge of its duties and responsibilities.
The current Board Committees are as follows: • Audit Committee • Corporate Governance & Conduct Review
Committee • Credit Committee • Nomination & Remuneration Committee • Risk Management Committee • Strategic Planning Committee
BoardofDirectorsThe Board of Directors comprises a body of elected non-executive and executive directors appointed as per SBM’s constitution. The Board oversees the activities of SBM Group, focusing more on strategy, performance, management of risk and sustainability besides the oversight of operations. As per the Code, the Board of Directors remains the focal point of contact between shareholders and the Company. The Board is fully committed to ensuring that the highest standards of corporate governance are observed throughout SBM so that the affairs of SBM are conducted with integrity and professionalism with the objective of safeguarding and enhancing the value of shareholders’ investments.
The Code requires the Board to have an optimum combination of executive, non-executive and independent non-executive directors to ensure that the corporate objectives are attained in an efficient, transparent and professional way, and in the best interest of the shareholders and other stakeholders.
SBM’s Board has a unitary structure currently comprised of 11 directors of which 6 are independent non-executive directors, 3 non-executive directors and 2 executive directors. The independent non-executive directors and non-executive directors are elected or re-elected annually at the meeting of the shareholders by a separate resolution upon recommendation of the Board following assessment by the Board Nomination & Remuneration Committee. The Bank circulates the profiles of the directors standing for election or re-election to the shareholders along with the notice of the annual meeting.
The Board of Directors’ key purpose is to ensure the company’s prosperity by collectively directing the company’s affairs, whilst meeting the appropriate interests of its
shareholders and stakeholders. In addition to business and financial issues, the Board of Directors must deal with challenges and issues relating to corporate governance, corporate social responsibility and corporate ethics. It should discharge this responsibility through ensuring compliance with applicable laws, rules and regulations, the Code, directives and guidelines. The members of the Board provide SBM with a wealth of expertise and experience in banking, finance, law, commerce and industry at both local and international levels. The profiles of the current directors are given at pages 14 to 15.
Good governance requires that the performance of the Board is evaluated at least once a year. The evaluation process is a constructive mechanism for improving board effectiveness, maximising strengths and tackling weaknesses. The SBM’s board charter sets out the roles and responsibilities of the Board as follows: • Formulate strategic objectives of SBM, and
set its corporate objectives, mission, values and budget;
• Delegate authority to executive management to implement strategies, policies and plans approved by the Board ;
• Monitor and evaluate management’s implementation of strategies, policies, and performance management;
• Ensure that policies, procedures and a healthy risk management framework and system of internal controls are in place to safeguard SBM’s assets and reputation;
• Identify key risk areas and key performance indicators of the business;
• Ensure that the Company and its subsidiaries comply with all relevant laws, rules, regulations, policies, the Code and best business practice, and establish mechanisms by which breaches of policies, laws, controls and good corporate governance practices are reported and acted upon;
• Ensure adequate succession planning for senior management;
Each Board Committee operates under approved terms of reference in line with the Code and international best practices which are reviewed at least once a year by the Board. The main terms of reference of the Board Committees are as follows:
Audit Committee• Critically review the financial performance,
the audited Financial Statements and interim financial reports, prospectus and other financial circulars/documents;
• Consider the appropriateness of the accounting policies applied and whether they are prudent and consistent with prior practice and comply with regulations and legal requirements;
• Review and monitor the adequacy of provisions including provision for credit impairment losses;
• Consider any difference of opinion between auditors and management on the level of provisions, on accounting treatment or on disclosure;
• Make recommendations for the appointment and retention of the external auditors;
• Review and discuss the scope of internal and external audit and of the audit plan, including for the subsidiaries;
• Review the internal controls systems to ensure their adequacy and effectiveness;
• Recommend dividend payment to the Board;• Review significant matters reported by the
external auditors;• Evaluate the performance and view objectivity
and independence of the external auditor;• Review the cooperation and coordination
between the internal and external auditors.
Corporate Governance & Conduct Review Committee• Advise the Board on all aspects of
corporate governance and corporate social responsibility and recommend the adoption of best practices as appropriate for SBM;
annual report | 2011 31annual report | 2011 30
corporaTe goVernance reporT
- Ensuring appropriate methodologies and systems are in place to identify and adequately assess and manage operational and other risks;
• Monitor enterprise-wide risk, portfolio risk profile and the portfolio management plan;
• Review major cases of fraud, irregularities and any legal matters that could have a significant impact on the company’s business, together with the legal advisor if necessary;
• Review and recommend to the Board other products and services;
• Review and approve the methodologies for assessing country risks and bank risks, portfolio and line of business;
• Ensure adequate controls and information systems are in place to implement SBM’s policies;
• Review and approve the Risk Management Report to be published in SBM’s Annual Report;
• Review adequacy of insurance coverage.
Strategic Planning Committee• Review the effectiveness of SBM strategies; • Review strategic plans and annual or
quarterly corporate objectives and budgets; • Review the issues of fundamental
importance to SBM and proposals from management that are material to SBM’s objectives;
• Recommend large projects to the Board and monitor their implementation;
• Ensure that capital is fully optimised/capital management;
• Review and monitor the investment in information technology and strategic assets and ensure that they are prioritised according to SBM’s strategy.
• Determine, agree and develop SBM’s general policy on corporate governance in accordance with the Bank of Mauritius guidelines and the Code;
• Review and recommend to the Board the Directors’ Report and approve the Corporate Governance Report to be published in SBM’s Annual Report;
• Review the board charter on an annual basis;
• Ascertain from management that all reporting requirements and disclosures made in the Annual Report and on an ongoing basis are in compliance with the disclosure provisions in the Code;
• Ensure that adequate policies and procedures are in place for the conduct of business with related parties, and for monitoring the flow of business and exposure to such related parties, in the light of regulatory requirements and best practices.
Credit Committee• Ascertain that concentration of risks is
within the risk tolerance of SBM; • Review and approve all facilities exceeding
the delegated authority of the Management Credit Forum as stipulated in the Credit Policy;
• Review and approve the restructure of credit facilities as per the Credit Policy;
• Review and recommend all non strategic equity investments to the Board/Board of subsidiaries for approval subject to legal compliance of respective countries;
• Approve appropriate country exposure limits;
• Approve appropriate bank limits in accordance with the risk management framework;
• Take note of/review the minutes of proceedings of the Management Credit Forum and the process.
Nomination & Remuneration Committee• Review the reward policy to ensure that the
senior management are fairly rewarded for their contribution to SBM’s overall performance;
• Review and recommend to the Board SBM’s plan for orderly succession of management;
• Review and approve policy on staff welfare and benefits;
• Review and recommend to the Board for approval the recruitment, and promotion to the position of senior executives and their remuneration, benefits and other terms and conditions of the service contracts of such officers;
• Approve overall conditions of other employees of SBM, taking into consideration proposals of trade unions;
• Determine the level of Board fees for directors to be recommended to the shareholders;
• Review and recommend to the Board the terms and conditions of the service contracts of other directors both executive and non-executive if any, including compensation benefits for those services;
• Review and recommend nomination of directors to the Board based on a proper director selection process.
Risk Management Committee• Identify, evaluate, measure and monitor
major risks; • Review policy for management of risks
particularly in the areas of credit, market and operational risks, namely: - Ensuring adequate prudent credit policies
and procedures with clear delegated lending authority and framework, credit concentration limits, credit risk mitigation techniques and credit diversification are in place;
- Ensuring adequate market risk management policies and procedures are in place;
SeparationofpowersbetweenChairmanandChiefExecutiveThe Code requires that the division of responsibilities between the Chairman and Chief Executive should be clearly established in writing and agreed by the Board to ensure balance of power and authority.
The SBM’s Board is led by the Chairman who is responsible for leadership of the Board whilst the Chief Executive is responsible for leadership of the business and managing it within the authorities delegated by the Board. However, the Chairman and Chief Executive do meet regularly to review issues, opportunities and problems on an ongoing basis.
Directors’orientationNew directors are apprised on SBM and its operations as well as their responsibilities as directors through an induction course at the time of joining the Board. Directors are provided with a pack containing relevant documents and changes/updates on regulations/bank policies, on an ongoing basis.
AssessmentoftheeffectivenessoftheBoard/BoardCommitteesIn order to assess the effectiveness of the Board and Board Committees, a self-evaluation by the directors is conducted annually post the financial year end. The scores given by the individual directors for each of the parameters being assessed are consolidated and these results are presented to the Board and the respective Board Committees with appropriate measures being taken to refine the governance structure and responsibilities based on feedback and comments received from the members on these results.
annual report | 2011 33annual report | 2011 32
corporaTe goVernance reporT
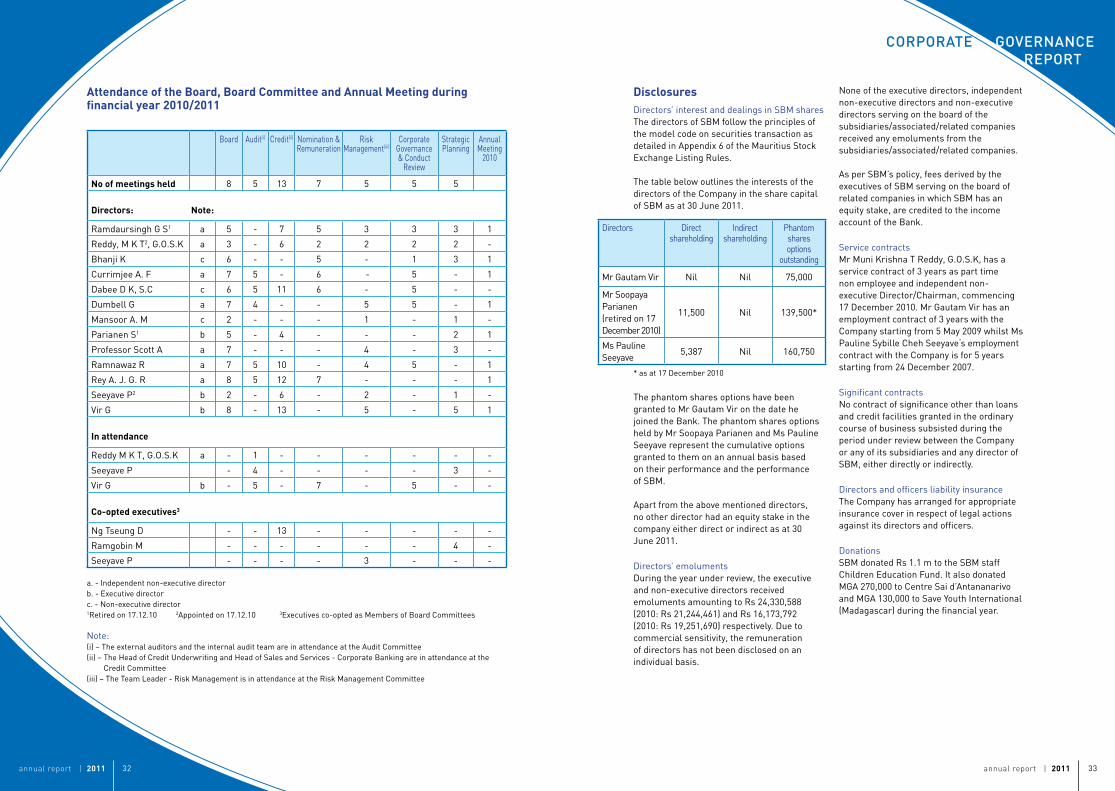
DisclosuresDirectors’ interest and dealings in SBM sharesThe directors of SBM follow the principles of the model code on securities transaction as detailed in Appendix 6 of the Mauritius Stock Exchange Listing Rules.
The table below outlines the interests of the directors of the Company in the share capital of SBM as at 30 June 2011.
The phantom shares options have been granted to Mr Gautam Vir on the date he joined the Bank. The phantom shares options held by Mr Soopaya Parianen and Ms Pauline Seeyave represent the cumulative options granted to them on an annual basis based on their performance and the performance of SBM.
Apart from the above mentioned directors, no other director had an equity stake in the company either direct or indirect as at 30 June 2011.
Directors’ emolumentsDuring the year under review, the executive and non-executive directors received emoluments amounting to Rs 24,330,588 (2010: Rs 21,244,461) and Rs 16,173,792 (2010: Rs 19,251,690) respectively. Due to commercial sensitivity, the remuneration of directors has not been disclosed on an individual basis.
AttendanceoftheBoard,BoardCommitteeandAnnualMeetingduringfinancialyear2010/2011
Board Audit(i) Credit(ii) Nomination & Remuneration
Risk Management(iii)
Corporate Governance & Conduct
Review
Strategic Planning
Annual Meeting
2010
Noofmeetingsheld 8 5 13 7 5 5 5
Directors: Note:
Ramdaursingh G S1 a 5 - 7 5 3 3 3 1
Reddy, M K T2, G.O.S.K a 3 - 6 2 2 2 2 -
Bhanji K c 6 - - 5 - 1 3 1
Currimjee A. F a 7 5 - 6 - 5 - 1
Dabee D K, S.C c 6 5 11 6 - 5 - -
Dumbell G a 7 4 - - 5 5 - 1
Mansoor A. M c 2 - - - 1 - 1 -
Parianen S1 b 5 - 4 - - - 2 1
Professor Scott A a 7 - - - 4 - 3 -
Ramnawaz R a 7 5 10 - 4 5 - 1
Rey A. J. G. R a 8 5 12 7 - - - 1
Seeyave P2 b 2 - 6 - 2 - 1 -
Vir G b 8 - 13 - 5 - 5 1
Inattendance
Reddy M K T, G.O.S.K a - 1 - - - - - -
Seeyave P - 4 - - - - 3 -
Vir G b - 5 - 7 - 5 - -
Co-optedexecutives3
Ng Tseung D - - 13 - - - - -
Ramgobin M - - - - - - 4 -
Seeyave P - - - - 3 - - -
a. - Independent non-executive directorb. - Executive directorc. - Non-executive director1Retired on 17.12.10 2Appointed on 17.12.10 3Executives co-opted as Members of Board Committees
Note:(i) – The external auditors and the internal audit team are in attendance at the Audit Committee(ii) – The Head of Credit Underwriting and Head of Sales and Services - Corporate Banking are in attendance at the
Credit Committee(iii) – The Team Leader - Risk Management is in attendance at the Risk Management Committee
None of the executive directors, independent non-executive directors and non-executive directors serving on the board of the subsidiaries/associated/related companies received any emoluments from the subsidiaries/associated/related companies.
As per SBM’s policy, fees derived by the executives of SBM serving on the board of related companies in which SBM has an equity stake, are credited to the income account of the Bank.
Service contractsMr Muni Krishna T Reddy, G.O.S.K, has a service contract of 3 years as part time non employee and independent non-executive Director/Chairman, commencing 17 December 2010. Mr Gautam Vir has an employment contract of 3 years with the Company starting from 5 May 2009 whilst Ms Pauline Sybille Cheh Seeyave‘s employment contract with the Company is for 5 years starting from 24 December 2007.
Significant contractsNo contract of significance other than loans and credit facilities granted in the ordinary course of business subsisted during the period under review between the Company or any of its subsidiaries and any director of SBM, either directly or indirectly.
Directors and officers liability insuranceThe Company has arranged for appropriate insurance cover in respect of legal actions against its directors and officers.
DonationsSBM donated Rs 1.1 m to the SBM staff Children Education Fund. It also donated MGA 270,000 to Centre Sai d’Antananarivo and MGA 130,000 to Save Youth International (Madagascar) during the financial year.
Directors Direct shareholding
Indirect shareholding
Phantom shares options
outstanding
Mr Gautam Vir Nil Nil 75,000
Mr Soopaya Parianen (retired on 17 December 2010)
11,500 Nil 139,500*
Ms Pauline Seeyave
5,387 Nil 160,750
* as at 17 December 2010
annual report | 2011 35annual report | 2011 34
corporaTe goVernance reporT
Operational Risk Forum It reviews, inter alia, the reports of the internal auditors and external auditors, flaws in credit documentation, operational policies, standards and practices, and IT related issues. Meets monthly.
Forum on Disclosure It reviews the adequacy of SBM’s disclosures with respect to regulatory requirements and best practices. Meets at least quarterly.
The profiles of the management team are given at pages 64 to 67.
RelatedpartytransactionsThe Board Corporate Governance & Conduct Review Committee reviews all related party transactions conducted during the previous quarter under review in accordance with the Bank of Mauritius guidelines and international best practices. The Committee meets on a quarterly basis and matters reviewed by same are reported to the Board of Directors.
Note 34 to the Financial Statements outlines the on and off-balance items and other related party transactions for the past years. None of the advances to related parties were impaired as at 30 June 2011. Exposure to major related parties are given at page 50.
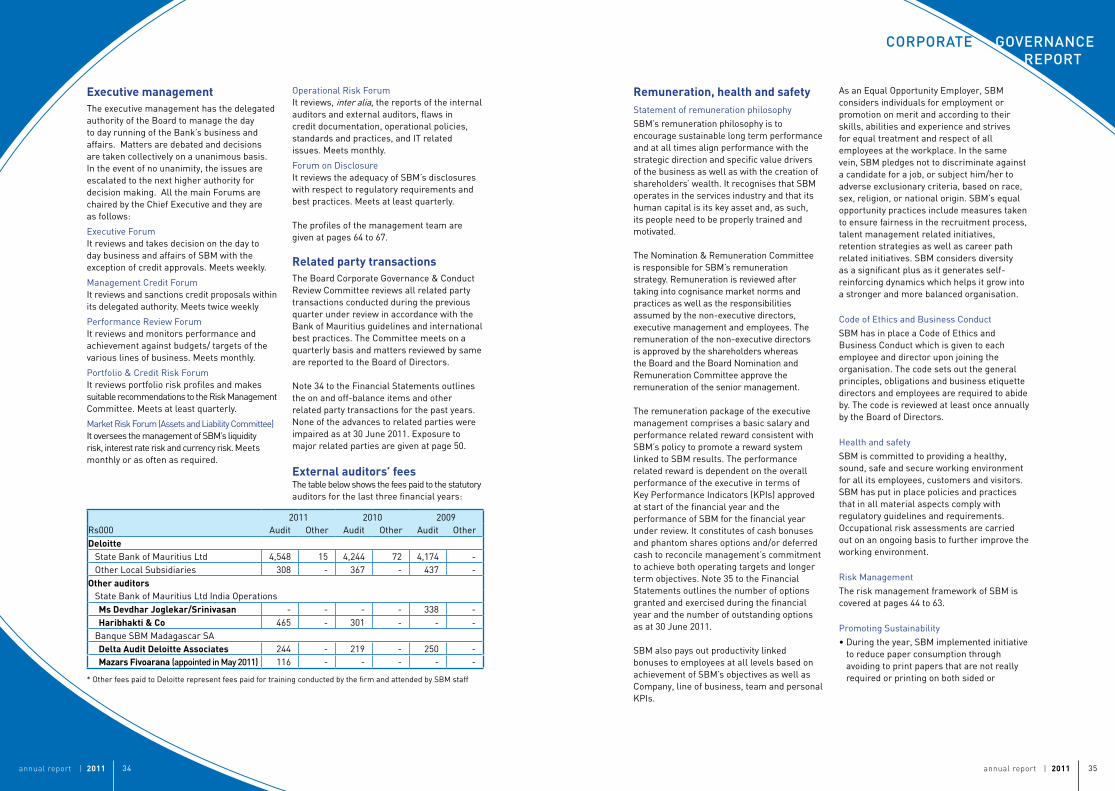
Externalauditors’feesThe table below shows the fees paid to the statutory auditors for the last three financial years:
ExecutivemanagementThe executive management has the delegated authority of the Board to manage the day to day running of the Bank’s business and affairs. Matters are debated and decisions are taken collectively on a unanimous basis. In the event of no unanimity, the issues are escalated to the next higher authority for decision making. All the main Forums are chaired by the Chief Executive and they are as follows:
Executive Forum It reviews and takes decision on the day to day business and affairs of SBM with the exception of credit approvals. Meets weekly.
Management Credit ForumIt reviews and sanctions credit proposals within its delegated authority. Meets twice weekly
Performance Review Forum It reviews and monitors performance and achievement against budgets/ targets of the various lines of business. Meets monthly.
Portfolio & Credit Risk Forum It reviews portfolio risk profiles and makes suitable recommendations to the Risk Management Committee. Meets at least quarterly.
Market Risk Forum (Assets and Liability Committee) It oversees the management of SBM’s liquidity risk, interest rate risk and currency risk. Meets monthly or as often as required.
Remuneration,healthandsafetyStatement of remuneration philosophySBM’s remuneration philosophy is to encourage sustainable long term performance and at all times align performance with the strategic direction and specific value drivers of the business as well as with the creation of shareholders’ wealth. It recognises that SBM operates in the services industry and that its human capital is its key asset and, as such, its people need to be properly trained and motivated.
The Nomination & Remuneration Committee is responsible for SBM’s remuneration strategy. Remuneration is reviewed after taking into cognisance market norms and practices as well as the responsibilities assumed by the non-executive directors, executive management and employees. The remuneration of the non-executive directors is approved by the shareholders whereas the Board and the Board Nomination and Remuneration Committee approve the remuneration of the senior management.
The remuneration package of the executive management comprises a basic salary and performance related reward consistent with SBM’s policy to promote a reward system linked to SBM results. The performance related reward is dependent on the overall performance of the executive in terms of Key Performance Indicators (KPIs) approved at start of the financial year and the performance of SBM for the financial year under review. It constitutes of cash bonuses and phantom shares options and/or deferred cash to reconcile management’s commitment to achieve both operating targets and longer term objectives. Note 35 to the Financial Statements outlines the number of options granted and exercised during the financial year and the number of outstanding options as at 30 June 2011.
SBM also pays out productivity linked bonuses to employees at all levels based on achievement of SBM’s objectives as well as Company, line of business, team and personal KPIs.
As an Equal Opportunity Employer, SBM considers individuals for employment or promotion on merit and according to their skills, abilities and experience and strives for equal treatment and respect of all employees at the workplace. In the same vein, SBM pledges not to discriminate against a candidate for a job, or subject him/her to adverse exclusionary criteria, based on race, sex, religion, or national origin. SBM’s equal opportunity practices include measures taken to ensure fairness in the recruitment process, talent management related initiatives, retention strategies as well as career path related initiatives. SBM considers diversity as a significant plus as it generates self-reinforcing dynamics which helps it grow into a stronger and more balanced organisation.
Code of Ethics and Business ConductSBM has in place a Code of Ethics and Business Conduct which is given to each employee and director upon joining the organisation. The code sets out the general principles, obligations and business etiquette directors and employees are required to abide by. The code is reviewed at least once annually by the Board of Directors.
Health and safetySBM is committed to providing a healthy, sound, safe and secure working environment for all its employees, customers and visitors. SBM has put in place policies and practices that in all material aspects comply with regulatory guidelines and requirements. Occupational risk assessments are carried out on an ongoing basis to further improve the working environment.
Risk ManagementThe risk management framework of SBM is covered at pages 44 to 63.
Promoting Sustainability• During the year, SBM implemented initiative
to reduce paper consumption through avoiding to print papers that are not really required or printing on both sided or
2011 2010 2009Rs000 Audit Other Audit Other Audit OtherDeloitte
State Bank of Mauritius Ltd 4,548 15 4,244 72 4,174 -Other Local Subsidiaries 308 - 367 - 437 -
OtherauditorsState Bank of Mauritius Ltd India OperationsMsDevdharJoglekar/Srinivasan - - - - 338 -Haribhakti&Co 465 - 301 - - -
Banque SBM Madagascar SADeltaAuditDeloitteAssociates 244 - 219 - 250 -MazarsFivoarana(appointed in May 2011) 116 - - - - -
* Other fees paid to Deloitte represent fees paid for training conducted by the firm and attended by SBM staff

annual report | 2011 37annual report | 2011 36
corporaTe goVernance reporT
splitting pages. SBM also introduced emailing statement of accounts to its customers;
• SBM introduced the ECOLOAN whereby funding is provided to customers to install solar panel to generate electricity for own use plus selling to the national grid;
• SBM also availed of line of credit from the Agence Française de Développement to finance green projects.
CorporateSocialResponsibilitySBM’s priority areas of intervention are based on Empowerment through Education and Social Housing. In line with SBM’s strategy of providing skills through education to combat poverty, a unique Scholarship Scheme for bright and needy students was launched through The SBM Education Fund in FY 2010. From 57 scholarships awarded (including 5 students from Rodrigues Island) in FY 2010, the number of scholarships has almost doubled to 100 at tertiary level in FY 2011. In addition, a special scheme has been set up for the Vocational sector where 122 scholarships are being awarded in collaboration with the Mauritius Institute of Training and Development (MITD). In addition, SBM launched an IT Project with the e-Inclusion Foundation for the distribution of free refurbished PCs to around 3,000 needy students presently studying at HSC or at university level. In line with Government defined priority areas, SBM is also supporting the Social Housing project of the National Empowerment Foundation (NEF). Other major projects have been support to ABAIM (acquisition of skills to underprivileged children and youth through music, arts, culture and sports), Association Kinouété (training programme for 40 women ex-detainees), Gandhian Basic School (extension project to accommodate a multimedia room and library, a Fashion and Fabrics Workshop and a Demonstration Room as well as the provision of a daily balanced meal for some 120 students), Club Maurice (Indian Ocean Island Games) and the SSR National Cricket Grounds Trust (training of 200 youngsters from vulnerable groups). Most of the projects focus on providing tools and opportunities to vulnerable groups so that they acquire the required skills to enhance their
employability and thus become economically independent. The CSR initiatives of SBM and its commitment to the community have been recognised at National level with SBM being awarded the ‘Overall Winner’ of the First Edition of the BDO CSR Awards 2010 as well as the Winner of the Education and Sports category.
ShareholderinformationandcommunicationSBM recognises the importance of maintaining accountability and transparency to its shareholders through effective communication with them. In addition to press communiqués and letters to shareholders, the website, hosted at http://www.sbmgroup.mu, is regularly updated with share information, interim and audited Financial Statements, products and corporate events. The shareholders are apprised on SBM results for the period under review and initiatives/projects at the Annual Meeting.
Material clauses of the constitution of the CompanyShareholding The Bank’s constitution requires that no shareholder shall hold more than 3%, either direct or indirect, of the Company’s issued share capital less treasury shares of the Company without previous authorisation of the Board of Directors of the Company. No authorisation shall be given to that effect unless a Special Notice has been sent to the directors specifying that such a question is included in the Agenda of a Meeting of the said Board. Shareholders holding more than 3% of the issued share capital prior to adoption of the new constitution are entitled to continue to hold their existing shareholdings.
Shareholders’ agreementThere is no shareholders’ agreement.
Share capitalRegister Date : 30 June 2011Authorised Share Capital : 1,000,000,000 sharesIssued Share Capital : 303,740,223 shares
annual report | 2011 39annual report | 2011 38
corporaTe goVernance reporT
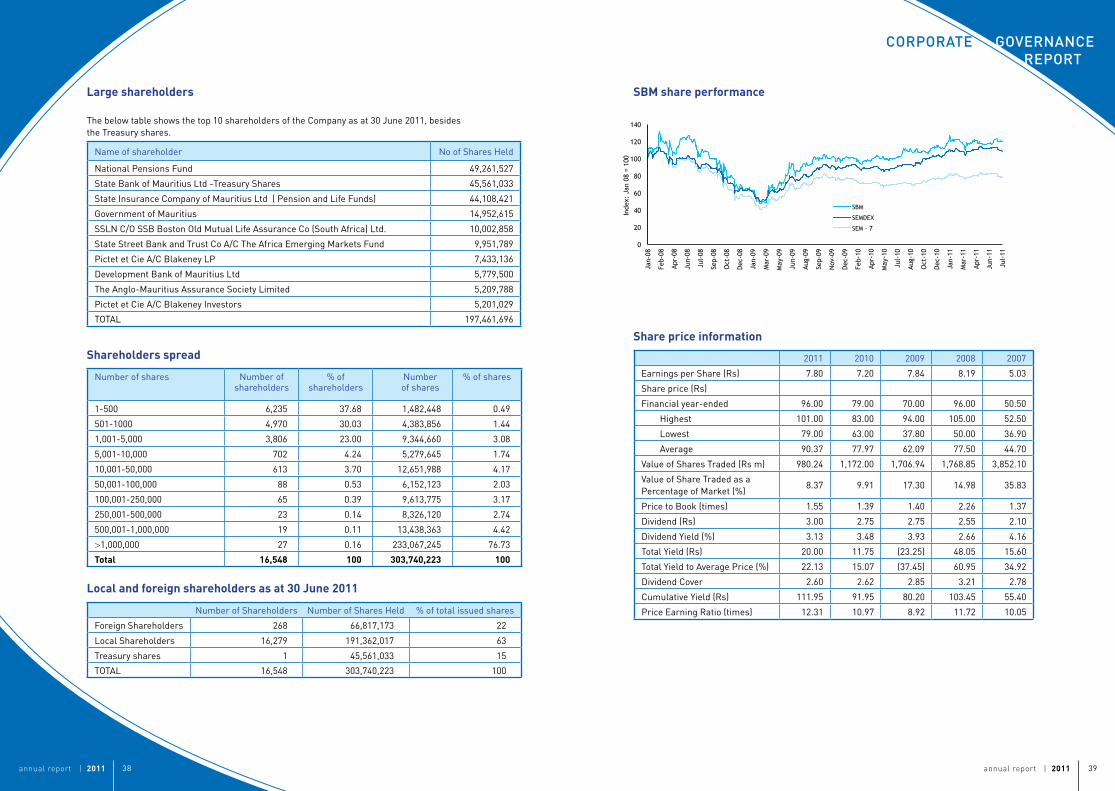
SBMshareperformance
Sharepriceinformation
2011 2010 2009 2008 2007
Earnings per Share (Rs) 7.80 7.20 7.84 8.19 5.03
Share price (Rs)
Financial year-ended 96.00 79.00 70.00 96.00 50.50
Highest 101.00 83.00 94.00 105.00 52.50
Lowest 79.00 63.00 37.80 50.00 36.90
Average 90.37 77.97 62.09 77.50 44.70
Value of Shares Traded (Rs m) 980.24 1,172.00 1,706.94 1,768.85 3,852.10
Value of Share Traded as a Percentage of Market (%)
8.37 9.91 17.30 14.98 35.83
Price to Book (times) 1.55 1.39 1.40 2.26 1.37
Dividend (Rs) 3.00 2.75 2.75 2.55 2.10
Dividend Yield (%) 3.13 3.48 3.93 2.66 4.16
Total Yield (Rs) 20.00 11.75 (23.25) 48.05 15.60
Total Yield to Average Price (%) 22.13 15.07 (37.45) 60.95 34.92
Dividend Cover 2.60 2.62 2.85 3.21 2.78
Cumulative Yield (Rs) 111.95 91.95 80.20 103.45 55.40
Price Earning Ratio (times) 12.31 10.97 8.92 11.72 10.05
Largeshareholders
The below table shows the top 10 shareholders of the Company as at 30 June 2011, besides the Treasury shares.
Name of shareholder No of Shares Held
National Pensions Fund 49,261,527
State Bank of Mauritius Ltd -Treasury Shares 45,561,033
State Insurance Company of Mauritius Ltd ( Pension and Life Funds) 44,108,421
Government of Mauritius 14,952,615
SSLN C/O SSB Boston Old Mutual Life Assurance Co (South Africa) Ltd. 10,002,858
State Street Bank and Trust Co A/C The Africa Emerging Markets Fund 9,951,789
Pictet et Cie A/C Blakeney LP 7,433,136
Development Bank of Mauritius Ltd 5,779,500
The Anglo-Mauritius Assurance Society Limited 5,209,788
Pictet et Cie A/C Blakeney Investors 5,201,029
TOTAL 197,461,696
Shareholdersspread
Number of shares Number of shareholders
% of shareholders
Number of shares
% of shares
1-500 6,235 37.68 1,482,448 0.49
501-1000 4,970 30.03 4,383,856 1.44
1,001-5,000 3,806 23.00 9,344,660 3.08
5,001-10,000 702 4.24 5,279,645 1.74
10,001-50,000 613 3.70 12,651,988 4.17
50,001-100,000 88 0.53 6,152,123 2.03
100,001-250,000 65 0.39 9,613,775 3.17
250,001-500,000 23 0.14 8,326,120 2.74
500,001-1,000,000 19 0.11 13,438,363 4.42
>1,000,000 27 0.16 233,067,245 76.73
Total 16,548 100 303,740,223 100
Localandforeignshareholdersasat30June2011
Number of Shareholders Number of Shares Held % of total issued shares
Foreign Shareholders 268 66,817,173 22
Local Shareholders 16,279 191,362,017 63
Treasury shares 1 45,561,033 15
TOTAL 16,548 303,740,223 100
2005 06 07 08 09 10
121086420
-2-4-6-8
-10
121086420
-2-4-6-8
-10
Emerging and developing economies
World
Advancedeconomies
Food
Industrial Inputs
Metals
Crude Oil
0
20
40
60
80
100
120
140
160
180
200
Jun-07
Aug-07
Oct-07
Dec-07
Feb-08
Apr-08
Jun-08
Aug-08
Oct-08
Dec-08
Feb-09
Apr-09
Jun-09
Aug-09
Inde
x: J
un-0
7=10
0
Evolution of International Commodity Prices
Source: IMF, SBM estimates
Evolution of International Commodity Prices
Source: IMF, SBM estimates
Global GDP Growth - Quarter-over-Quarter, Annualised
Source: IMF World Economic Outlook, July 2009 update
0
20
40
60
80
100
120
140
Jan-
08
Feb-
08
Apr-
08
Jun-
08
Jul-
08
Sep-
08
Oct
-08
Dec
-08
Jan-
09
Mar
-09
May
-09
Jun-
09
Aug-
09
Sep-
09
Nov
-09
Dec
-09
Feb-
10
Apr-
10
May
-10
Jul-
10
Aug-
10
Oct
-10
Dec
-10
Jan-
11
Mar
-11
Apr-
11
Jun-
11
Jul-
11
Inde
x: J
an 0
8 =
100
SBM
SEMDEX
SEM - 7

annual report | 2011 41annual report | 2011 40
reporTriSK ManageMenT
DividendpolicySBM’s dividend policy requires the distribution of a minimum of 25% of its net income available to shareholders for the year subject to approval from Bank of Mauritius and the solvency test under the S61(2) of the Companies Act 2001 being satisfied.
The Board authorised an interim and final dividend of Rs 3.00 per ordinary share for the financial year 2011, representing an increase of 9.1% from the previous year, payable on 3 October 2011. The dividend payout ratio increased from 38.2% to 38.5%.
ShareholderdiaryFinancialyear2010/11
Financial year-end : 30 June 2011
Dividend payment : 3 October 2011
Annual Meeting : 16 December 2011
Financialyear2011/12
Unaudited quarterly earnings report : within 45 days from the quarter ending September, December and March
Audited Financial Statement for the year ending 30 June 2012
: within three months from end of June 2012
Dividend payment : during October 2012
Annual Meeting : during December 2012
SBMCreditRatingCategory Moody’srating
Bank deposits – foreign currency Baa2/P-2
Bank deposits – local currency deposits Baa1/P-2
Bank Financial Strength* C-
Issuer Rating Baa1
*the highest rating assigned by Moody’s to a domestic bank in Mauritius
ContactDetailsforShareholderRelationshipCompany SecretarySBM Tower,1, Queen Elizabeth II AvenuePort LouisMauritiusPhone: (230) 202 1560Fax: (230) 211 8838Email: [email protected]

annual report | 2012| 05
@ the heart of your business
i
e
dgh
k ilm
mnp s x
s vg
gw
yz
t b bh
b
qrx na
Rs RsxOur aim:
to allow your creativity to
blos os mwith our SME solutions
annual report | 2011 45annual report | 2011 44
riSK ManageMenT reporT
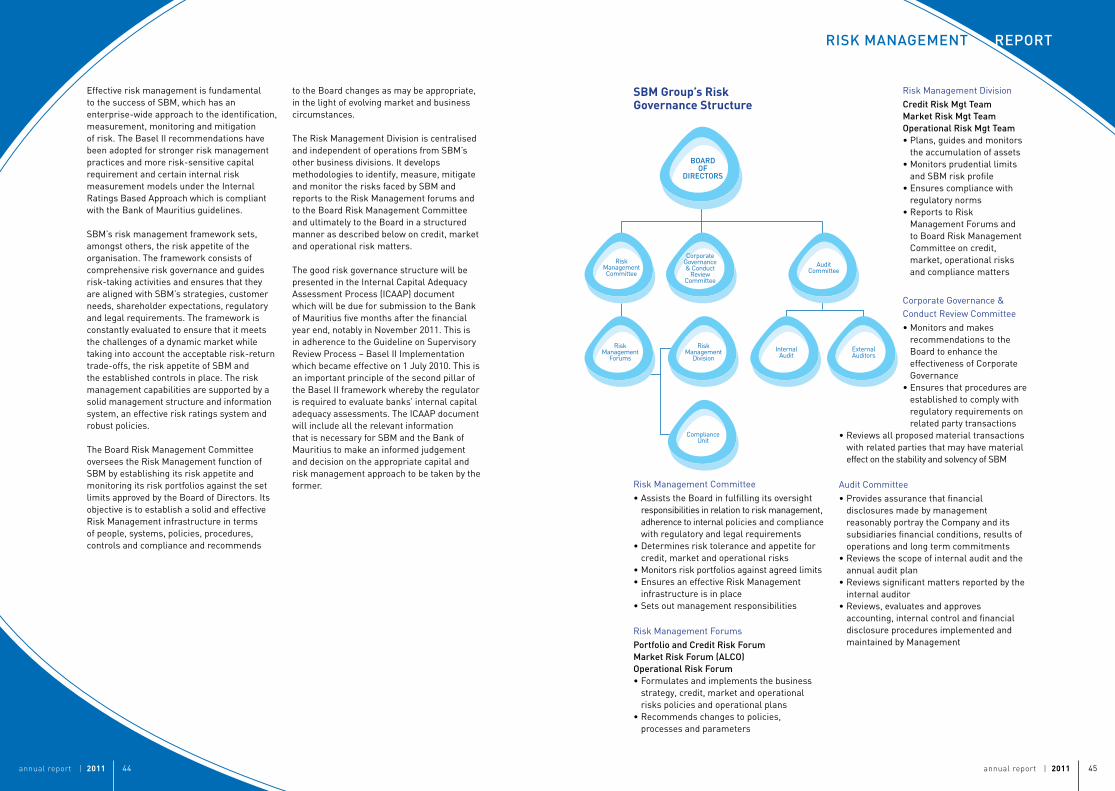
SBMGroup’sRiskGovernanceStructure
Risk Management Committee• Assists the Board in fulfilling its oversight
responsibilities in relation to risk management, adherence to internal policies and compliance with regulatory and legal requirements
• Determines risk tolerance and appetite for credit, market and operational risks
• Monitors risk portfolios against agreed limits• Ensures an effective Risk Management
infrastructure is in place • Sets out management responsibilities
Risk Management Forumsportfolio and credit risk ForumMarket risk Forum (alco)operational risk Forum• Formulates and implements the business
strategy, credit, market and operational risks policies and operational plans
• Recommends changes to policies, processes and parameters
Risk Management Divisioncredit risk Mgt TeamMarket risk Mgt Teamoperational risk Mgt Team• Plans, guides and monitors
the accumulation of assets • Monitors prudential limits
and SBM risk profile• Ensures compliance with
regulatory norms • Reports to Risk
Management Forums and to Board Risk Management Committee on credit, market, operational risks and compliance matters
Corporate Governance & Conduct Review Committee• Monitors and makes
recommendations to the Board to enhance the effectiveness of Corporate Governance
• Ensures that procedures are established to comply with regulatory requirements on related party transactions
• Reviews all proposed material transactions with related parties that may have material effect on the stability and solvency of SBM
Audit Committee• Provides assurance that financial
disclosures made by management reasonably portray the Company and its subsidiaries financial conditions, results of operations and long term commitments
• Reviews the scope of internal audit and the annual audit plan
• Reviews significant matters reported by the internal auditor
• Reviews, evaluates and approves accounting, internal control and financial disclosure procedures implemented and maintained by Management
RiskManagementCommittee
RiskManagement
Forums
RiskManagement
DivisionInternal
AuditExternalAuditors
ComplianceUnit
BoardoF
direcTorS
CorporateGovernance& Conduct
ReviewCommittee
AuditCommittee
Effective risk management is fundamental to the success of SBM, which has an enterprise-wide approach to the identification, measurement, monitoring and mitigation of risk. The Basel II recommendations have been adopted for stronger risk management practices and more risk-sensitive capital requirement and certain internal risk measurement models under the Internal Ratings Based Approach which is compliant with the Bank of Mauritius guidelines.
SBM’s risk management framework sets, amongst others, the risk appetite of the organisation. The framework consists of comprehensive risk governance and guides risk-taking activities and ensures that they are aligned with SBM’s strategies, customer needs, shareholder expectations, regulatory and legal requirements. The framework is constantly evaluated to ensure that it meets the challenges of a dynamic market while taking into account the acceptable risk-return trade-offs, the risk appetite of SBM and the established controls in place. The risk management capabilities are supported by a solid management structure and information system, an effective risk ratings system and robust policies.
The Board Risk Management Committee oversees the Risk Management function of SBM by establishing its risk appetite and monitoring its risk portfolios against the set limits approved by the Board of Directors. Its objective is to establish a solid and effective Risk Management infrastructure in terms of people, systems, policies, procedures, controls and compliance and recommends
to the Board changes as may be appropriate, in the light of evolving market and business circumstances.
The Risk Management Division is centralised and independent of operations from SBM’s other business divisions. It develops methodologies to identify, measure, mitigate and monitor the risks faced by SBM and reports to the Risk Management forums and to the Board Risk Management Committee and ultimately to the Board in a structured manner as described below on credit, market and operational risk matters.
The good risk governance structure will be presented in the Internal Capital Adequacy Assessment Process (ICAAP) document which will be due for submission to the Bank of Mauritius five months after the financial year end, notably in November 2011. This is in adherence to the Guideline on Supervisory Review Process – Basel II Implementation which became effective on 1 July 2010. This is an important principle of the second pillar of the Basel II framework whereby the regulator is required to evaluate banks’ internal capital adequacy assessments. The ICAAP document will include all the relevant information that is necessary for SBM and the Bank of Mauritius to make an informed judgement and decision on the appropriate capital and risk management approach to be taken by the former.
annual report | 2011 47annual report | 2011 46
riSK ManageMenT reporT
CREDITRISKMANAGEMENTCredit risk is the risk of loss resulting from the failure of a borrower or counterparty to honour its financial or contractual obligations to SBM as and when they fall due. Credit risk arises from direct lending, trade finance activities, and also from off-balance sheet transactions. Amongst the risks faced by SBM, credit risk generates the largest regulatory capital requirement, accounting for approximately 90% of SBM’s economic capital.
The management of SBM’s credit risk exposure is based on a well-defined portfolio management approach with a strong adherence to risk diversification across various geographical boundaries, sectors, borrower groups and products with the main objective of maximising shareholder value.
CreditapprovalprocessThe credit approval process is segregated from loan origination in order to maintain the independence and integrity of credit decision making. Credit approval authority is delegated within a structure that is tiered according to borrower rating, exposures, credit risk type and facility type. Key parameters associated with credit structuring and approval are periodically reviewed to ensure their continued relevance.
CreditriskmeasurementSBM’s main objective of credit risk measurement is to use various tools to support quantitative risk assessment from the level of individual facilities up to the total portfolio, including element of the credit approval process, ongoing credit risk management, monitoring and reporting and portfolio analysis.
Measurement tools include the use of rating system which are used in the calculation of regulatory and economic capital, expected/unexpected loss and stress testing. However, SBM considers sound and experienced judgement to be the most effective risk mitigation against any risk, and avoids over reliance on quantitative risk methodologies and models.
Internal Rating SystemsCredit risk rating is a summary indicator of a bank’s individual credit exposure. SBM’s internal rating system categorizes all credits into various classes on the basis of underlying credit quality.
SBM has different internal rating tools to assess the credit risk on Corporate Banking clients, SME clients and Retail Banking clients. SBM’s default risk management is characterised by a well calibrated risk rating scale. SBM uses a rating scale ranging from 1–10 whereby the 1–6 risk rates are tagged as acceptable risks whilst 7–10 risk rates are considered as high risk.
Monitoring and ReportingSBM’s Credit Risk Policy sets out the diverse standards by which its assets are prudently managed. They reflect industry best practices and any regulatory requirements. These policies are guided by SBM’s risk appetite, and set the limits and controls within which SBM can operate. It is reviewed at least once a year by the Board Risk Management Committee with required changes recommended to the Board for approval.
SBM regularly monitors its risk exposures to ensure business activities are operating within approved limits or guidelines, and SBM’s strategies and risk appetite. A risk report is submitted to the Portfolio and Credit Risk Forum at least on a quarterly basis and to the Board Risk Management Committee on a quarterly basis to assess the credit risk profile of SBM. Stress TestingStress testing is an important risk management tool that is used by SBM as part of its internal risk management based on the Basel II capital adequacy framework, to set its risk tolerance. It is also a requirement of the Bank of Mauritius for financial institutions to stress their portfolios with respect to factors that would impact their earnings, asset value and capital base.
SBM generates specific forward-looking scenarios and analyses how well its profitability would be maintained, whether its levels of capital would be adequate to absorb potential losses from abnormal events and what could be done in advance to mitigate the risk. It also enables SBM to set up its risk tolerance.
CreditriskmitigationSBM employs a wide variety of structures and techniques to mitigate credit risk on its lending book:• Assessment is primarily based on the
ability of the borrowers to service their loans. Adequate security is taken to further mitigate the risk. The amount and type of collateral taken depends on the counterparty credit quality and repayment capacity. Collaterals taken by SBM are well documented to ensure that credit risk mitigation is legally effective and enforceable.
• Netting agreements as well as financial guarantees are used to offset balances with customers, in certain circumstances, to minimise the exposure at default. They are utilised in accordance with relevant regulatory and internal policies and require a formal agreement with the customer to net the balances.
• SBM has a set of prudential limits approved by the Board to address concentration of risk by counterparties, e.g. country, sovereign, bank and corporate customer. These allow higher exposures to better rated customers and lower exposures to lower rated customers. Excesses are considered on a case by case basis at the time of credit sanctioning, and are reported quarterly to the Board beyond tolerance limits.
CreditriskexposureSBM regularly reviews the diversification of its credit portfolio, taking into consideration changes to the economic and financial environment, by varying the exposures by business segments, geographical borders, industries and size of exposures which are the strategies for managing its credit risk.
The majority of SBM’s exposure is in Mauritius Operations, with 67.6% of the exposures being to Segment A and 20.8% to Segment B. The remaining SBM exposure is in India (10.2%) and Madagascar (1.3%).
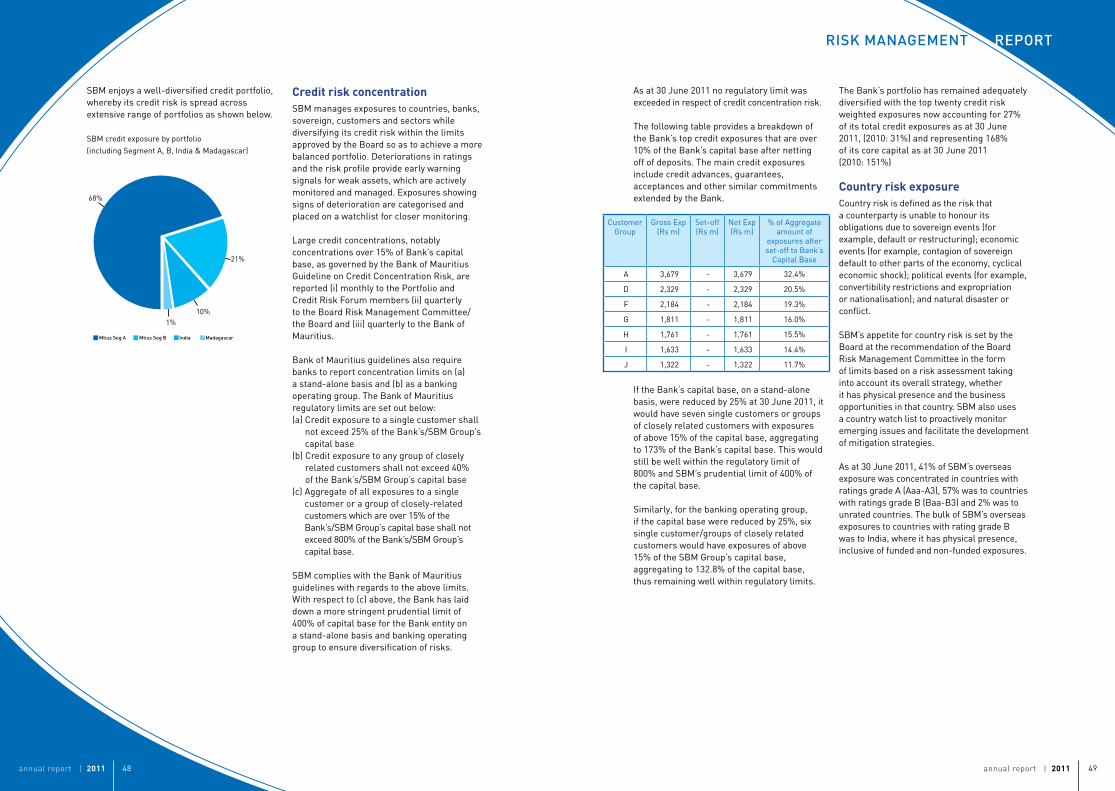
annual report | 2011 49annual report | 2011 48
riSK ManageMenT reporT
SBM enjoys a well-diversified credit portfolio, whereby its credit risk is spread across extensive range of portfolios as shown below.
SBM credit exposure by portfolio (including Segment A, B, India & Madagascar)
CreditriskconcentrationSBM manages exposures to countries, banks, sovereign, customers and sectors while diversifying its credit risk within the limits approved by the Board so as to achieve a more balanced portfolio. Deteriorations in ratings and the risk profile provide early warning signals for weak assets, which are actively monitored and managed. Exposures showing signs of deterioration are categorised and placed on a watchlist for closer monitoring.
Large credit concentrations, notably concentrations over 15% of Bank’s capital base, as governed by the Bank of Mauritius Guideline on Credit Concentration Risk, are reported (i) monthly to the Portfolio and Credit Risk Forum members (ii) quarterly to the Board Risk Management Committee/ the Board and (iii) quarterly to the Bank of Mauritius.
Bank of Mauritius guidelines also require banks to report concentration limits on (a) a stand-alone basis and (b) as a banking operating group. The Bank of Mauritius regulatory limits are set out below:(a) Credit exposure to a single customer shall
not exceed 25% of the Bank’s/SBM Group’s capital base
(b) Credit exposure to any group of closely related customers shall not exceed 40% of the Bank’s/SBM Group’s capital base
(c) Aggregate of all exposures to a single customer or a group of closely-related customers which are over 15% of the Bank’s/SBM Group’s capital base shall not exceed 800% of the Bank’s/SBM Group’s capital base.
SBM complies with the Bank of Mauritius guidelines with regards to the above limits. With respect to (c) above, the Bank has laid down a more stringent prudential limit of 400% of capital base for the Bank entity on a stand-alone basis and banking operating group to ensure diversification of risks.
68%
21%
10%1%
Mtius Seg a Mtius Seg B india Madagascar
As at 30 June 2011 no regulatory limit was exceeded in respect of credit concentration risk.
The following table provides a breakdown of the Bank’s top credit exposures that are over 10% of the Bank’s capital base after netting off of deposits. The main credit exposures include credit advances, guarantees, acceptances and other similar commitments extended by the Bank.
If the Bank’s capital base, on a stand-alone basis, were reduced by 25% at 30 June 2011, it would have seven single customers or groups of closely related customers with exposures of above 15% of the capital base, aggregating to 173% of the Bank’s capital base. This would still be well within the regulatory limit of 800% and SBM’s prudential limit of 400% of the capital base.
Similarly, for the banking operating group, if the capital base were reduced by 25%, six single customer/groups of closely related customers would have exposures of above 15% of the SBM Group’s capital base, aggregating to 132.8% of the capital base, thus remaining well within regulatory limits.
Customer Group
Gross Exp (Rs m)
Set-off (Rs m)
Net Exp (Rs m)
% of Aggregate amount of
exposures after set-off to Bank’s
Capital Base
A 3,679 - 3,679 32.4%
D 2,329 - 2,329 20.5%
F 2,184 - 2,184 19.3%
G 1,811 - 1,811 16.0%
H 1,761 - 1,761 15.5%
I 1,633 - 1,633 14.4%
J 1,322 - 1,322 11.7%
The Bank’s portfolio has remained adequately diversified with the top twenty credit risk weighted exposures now accounting for 27% of its total credit exposures as at 30 June 2011, (2010: 31%) and representing 168% of its core capital as at 30 June 2011 (2010: 151%)
CountryriskexposureCountry risk is defined as the risk that a counterparty is unable to honour its obligations due to sovereign events (for example, default or restructuring); economic events (for example, contagion of sovereign default to other parts of the economy, cyclical economic shock); political events (for example, convertibility restrictions and expropriation or nationalisation); and natural disaster or conflict.
SBM’s appetite for country risk is set by the Board at the recommendation of the Board Risk Management Committee in the form of limits based on a risk assessment taking into account its overall strategy, whether it has physical presence and the business opportunities in that country. SBM also uses a country watch list to proactively monitor emerging issues and facilitate the development of mitigation strategies.
As at 30 June 2011, 41% of SBM’s overseas exposure was concentrated in countries with ratings grade A (Aaa-A3), 57% was to countries with ratings grade B (Baa-B3) and 2% was to unrated countries. The bulk of SBM’s overseas exposures to countries with rating grade B was to India, where it has physical presence, inclusive of funded and non-funded exposures.
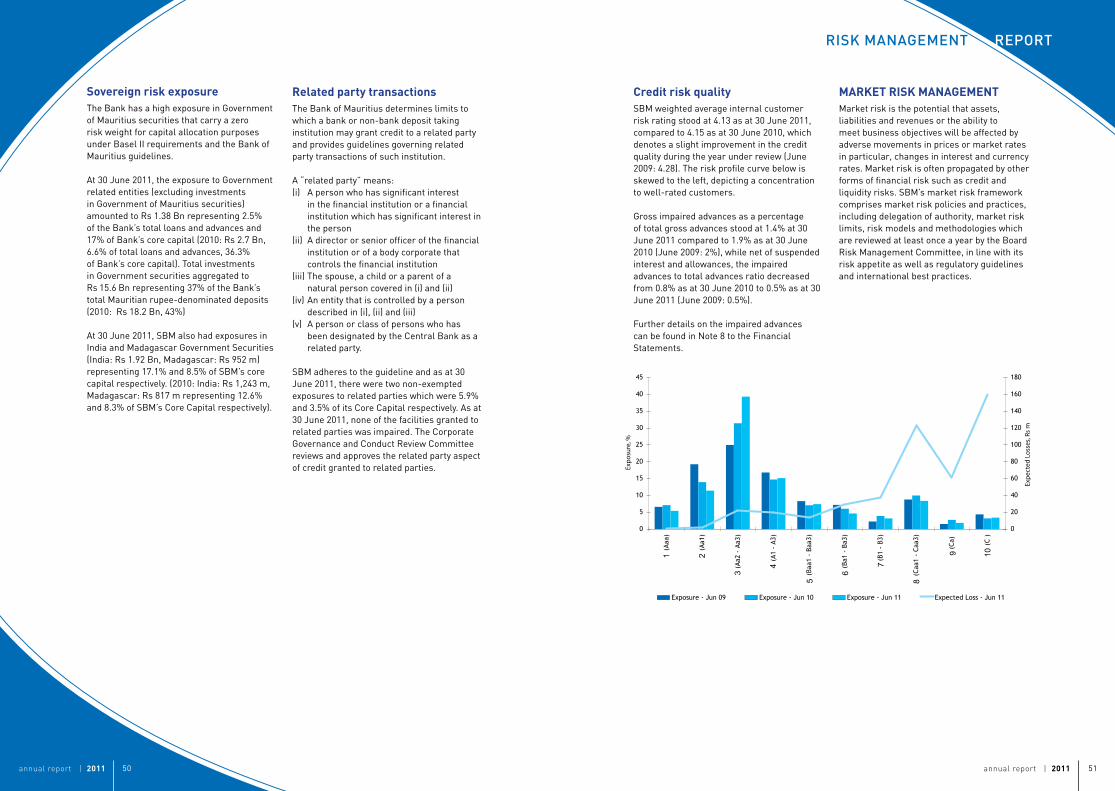
annual report | 2011 51annual report | 2011 50
riSK ManageMenT reporT
SovereignriskexposureThe Bank has a high exposure in Government of Mauritius securities that carry a zero risk weight for capital allocation purposes under Basel II requirements and the Bank of Mauritius guidelines.
At 30 June 2011, the exposure to Government related entities (excluding investments in Government of Mauritius securities) amounted to Rs 1.38 Bn representing 2.5% of the Bank’s total loans and advances and 17% of Bank’s core capital (2010: Rs 2.7 Bn, 6.6% of total loans and advances, 36.3% of Bank’s core capital). Total investments in Government securities aggregated to Rs 15.6 Bn representing 37% of the Bank’s total Mauritian rupee-denominated deposits (2010: Rs 18.2 Bn, 43%)
At 30 June 2011, SBM also had exposures in India and Madagascar Government Securities (India: Rs 1.92 Bn, Madagascar: Rs 952 m) representing 17.1% and 8.5% of SBM’s core capital respectively. (2010: India: Rs 1,243 m, Madagascar: Rs 817 m representing 12.6% and 8.3% of SBM’s Core Capital respectively).
RelatedpartytransactionsThe Bank of Mauritius determines limits to which a bank or non-bank deposit taking institution may grant credit to a related party and provides guidelines governing related party transactions of such institution.
A “related party” means:(i) A person who has significant interest
in the financial institution or a financial institution which has significant interest in the person
(ii) A director or senior officer of the financial institution or of a body corporate that controls the financial institution
(iii) The spouse, a child or a parent of a natural person covered in (i) and (ii)
(iv) An entity that is controlled by a person described in (i), (ii) and (iii)
(v) A person or class of persons who has been designated by the Central Bank as a related party.
SBM adheres to the guideline and as at 30 June 2011, there were two non-exempted exposures to related parties which were 5.9% and 3.5% of its Core Capital respectively. As at 30 June 2011, none of the facilities granted to related parties was impaired. The Corporate Governance and Conduct Review Committee reviews and approves the related party aspect of credit granted to related parties.
CreditriskqualitySBM weighted average internal customer risk rating stood at 4.13 as at 30 June 2011, compared to 4.15 as at 30 June 2010, which denotes a slight improvement in the credit quality during the year under review (June 2009: 4.28). The risk profile curve below is skewed to the left, depicting a concentration to well-rated customers.
Gross impaired advances as a percentage of total gross advances stood at 1.4% at 30 June 2011 compared to 1.9% as at 30 June 2010 (June 2009: 2%), while net of suspended interest and allowances, the impaired advances to total advances ratio decreased from 0.8% as at 30 June 2010 to 0.5% as at 30 June 2011 (June 2009: 0.5%).
Further details on the impaired advances can be found in Note 8 to the Financial Statements.
MARKETRISKMANAGEMENTMarket risk is the potential that assets, liabilities and revenues or the ability to meet business objectives will be affected by adverse movements in prices or market rates in particular, changes in interest and currency rates. Market risk is often propagated by other forms of financial risk such as credit and liquidity risks. SBM’s market risk framework comprises market risk policies and practices, including delegation of authority, market risk limits, risk models and methodologies which are reviewed at least once a year by the Board Risk Management Committee, in line with its risk appetite as well as regulatory guidelines and international best practices.
Expo
sure
, %
Expe
cted
Los
ses,
Rs m
6.1%1.3%
0.0%0.8%
18.3%
65.3%
6.4%
1.9%
AfricaAsia Paci�c - OthersAsia Paci�c - India onlyEastern Asia and Oceania
EuropeMiddle EastNorth America
8.8%
6.3%
17.4%
1.5%
0.1%
0.6%
65.3%
-1
0
1
2
3
4
5
6
7
8
9
-1
0
1
2
3
4
5
6
7
8
Up to 3 Mths
3 - 6 Mths
6 - 12 Mths
1 - 2 Yrs
2 - 5 Yrs Yrs
> 5
Cum Repricing Gap Cum Repricing Gap as a % of T.Assets
0
10
20
30
40
50
60
70
0
10
20
30
40
50
60
1 2
3
4
5
6
7
8
9 10
Up to 3 3 - 6 Mths Mths
6 - 12 Mths
1 - 2 Yrs
2 - 5 Yrs
> 5 Yrs
Rs
Bn
%Rs
Bn
%
Cumulative Gap Cumulative Gap as a % of T.Assets
Average Year end
As a % of liabilities
2008 2009 2010 2011
30
25
20
15
10
5
0
annual report | 2011 53annual report | 2011 52
riSK ManageMenT reporT
InterestrateriskInterest rate risk is the exposure of SBM’s financial condition to adverse movements in interest rates arising from repricing and/or maturity mismatches, changes in underlying rates and other characteristics of assets and liabilities in the normal course of business. Excessive interest rate risk can pose a significant threat to a bank’s earnings and capital base. In managing interest rate risk, SBM strives to achieve a desired profile taking into account strategic considerations and market conditions. To assess and manage the impact of interest rates on the assets, liabilities and off-balance sheet items, SBM uses a combination of gap analysis, sensitivity analysis, simulated modeling of earnings at risk and hedging instruments. In line with the Bank of Mauritius Guideline on the Measurement and Management of Market Risk, SBM conducts repricing gap analysis for individual currencies accounting for 5% or more of the Bank’s banking book total assets or liabilities. As at 30 June 2011, foreign currencies which accounted for over 5% of the total assets are: USD (22.43%), EUR (8.29%), and GBP (7.56%). The interest rate risk gaps for these currencies were managed within a set of prudential limits set by the Board and with the aim to achieve the desired risk profile.
Earnings at risk measures the sensitivity of net interest income over the next 12 months, and highlights exposures to various rate sensitive factors such as change in the key repo rate, and in pricing strategies on deposits. A 200 basis point change in interest rate would have an impact equal to 0.11% of Bank’s core capital at 30 June 2011 compared to 0.39% at 30 June 2010.
CurrencyriskCurrency risk is the potential that movements in exchange rates might adversely affect the value of SBM’s holdings and, thus, its financial condition. Currency rates can be subject to large and sudden swings, and understanding and managing the risk associated with exchange rate volatility can be especially complex.
SBM exercises strict control over its currency exposures by setting conservative prudential limits over its currency exposures in order to mitigate currency risk.
In order to manage their currency exposures, the Treasury dealers operate within regulatory limit as prescribed by the Bank of Mauritius and also within prudential limits approved by the Board including the intraday/overnight open position limits, deal size limit, and stop losses. The regulatory limit was revised down from 20% to 15% of the Bank’s Tier 1 Capital in January 2011.
Independent of the Treasury Front Office, the Middle Office closely monitors the Front Office and reports any excesses and deviations from approved limits to the Head of Risk, Chief Executive and on a periodic basis to the Market Risk Forum and to the Board Risk Management Committee.
The Bank also uses Value-at-Risk (VaR) to quantify the potential loss arising from adverse currency movements under normal market conditions. Given that currency positions are also subject to exceptional market movements, crisis situations and worst case scenarios are used as part of the stress testing exercise.
Stress testing captures the Bank’s exposure to unlikely but plausible events in abnormal market conditions, while VaR reflects the potential losses in a normal market environment. The methodology used to calculate VaR is based on historical data and assumes that historical changes in market values are representative of future movements. The VaR is based on data for the previous twelve months. SBM calculates VaR using a ten days holding period and based on a 99% one-tailed confidence interval. This implies that losses greater than the VaR estimates would be incurred only once in every 100 trading days, or about two to three times a year. The methodology of using ten days holding period and a one year historical observation period are in line with Basel II recommendations on quantitative standards for market risk measurement.
The average VaR for SBM was Rs 0.64 m for the year ended 30 June 2011 (2010: Rs 1.77 m) and was insignificant relative to its core capital.
The table below shows the minimum, maximum and year-end VaR values for the last three years.
2011 2010 2009
Rs ‘000 Min Max June Min Max June Min Max June
Bank 169 8,289 634 115 9,067 328 120 6,352 930
SBM Group 172 8,690 639 116 9,293 342 121 6,434 955
The Bank also simulates for a one-day time horizon at 99% confidence level that best reflects the market environment.
PriceriskThe Bank trades in international bonds, futures on commodities and bonds, currency derivatives, interest rate derivatives and in shares quoted on the Stock Exchange of Mauritius with the objective to further diversify its earnings stream and be in line with customers’ demands and preferences for different structured products. All open positions are marked-to-market on a daily basis and reported to management.
The dealers are closely monitored by the Middle Office to ensure that trades are within a framework of trading limits set in accordance with the risk appetite of the Bank, dealers’ experience and prevailing market volatilities. Any excesses and deviations from approved limits are reported to the Head of Risk, the Chief Executive and, on a periodic basis, to the Market Risk Forum and to the Board Risk Management Committee. At 30 June 2011, the Bank’s trading book exposures were insignificant and within the prudential limits set by the Board.
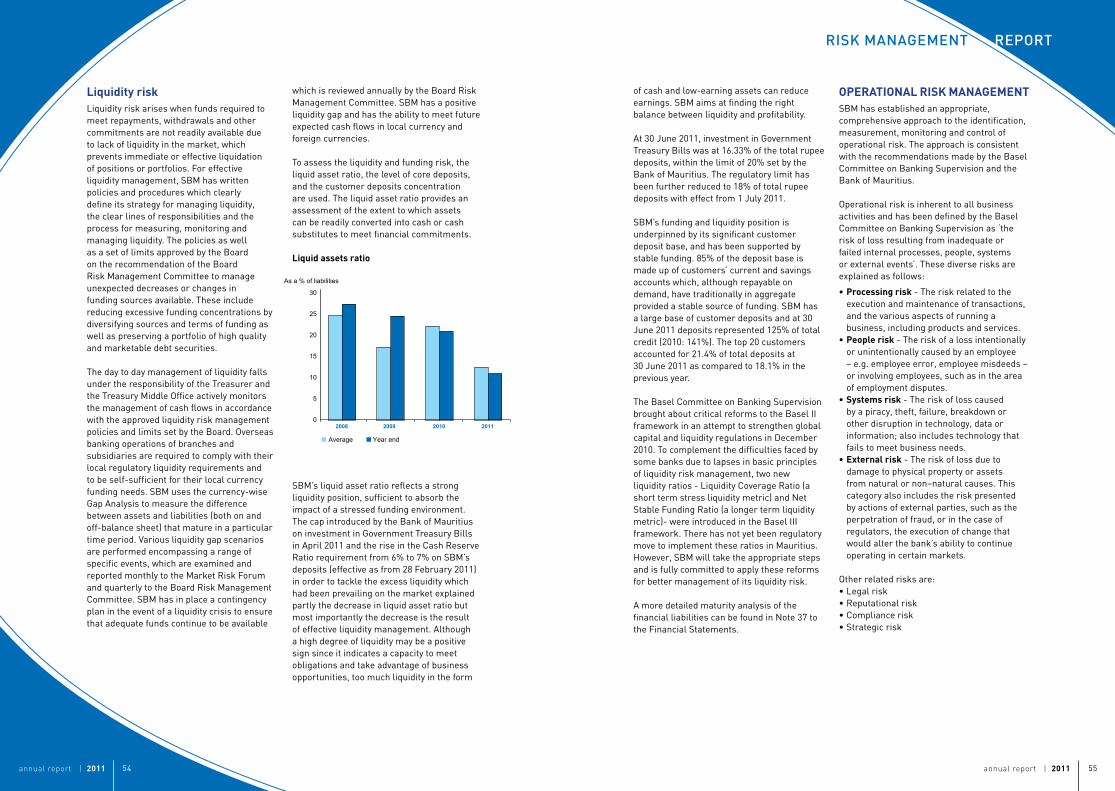
annual report | 2011 55annual report | 2011 54
Expo
sure
, %
Expe
cted
Los
ses,
Rs m
6.1%1.3%
0.0%0.8%
18.3%
65.3%
6.4%
1.9%
AfricaAsia Paci�c - OthersAsia Paci�c - India onlyEastern Asia and Oceania
EuropeMiddle EastNorth America
8.8%
6.3%
17.4%
1.5%
0.1%
0.6%
65.3%
-1
0
1
2
3
4
5
6
7
8
9
-1
0
1
2
3
4
5
6
7
8
Up to 3 Mths
3 - 6 Mths
6 - 12 Mths
1 - 2 Yrs
2 - 5 Yrs Yrs
> 5
Cum Repricing Gap Cum Repricing Gap as a % of T.Assets
0
10
20
30
40
50
60
70
0
10
20
30
40
50
60
1 2
3
4
5
6
7
8
9 10
Up to 3 3 - 6 Mths Mths
6 - 12 Mths
1 - 2 Yrs
2 - 5 Yrs
> 5 Yrs
Rs
Bn
%Rs
Bn
%
Cumulative Gap Cumulative Gap as a % of T.Assets
Average Year end
As a % of liabilities
2008 2009 2010 2011
30
25
20
15
10
5
0
LiquidityriskLiquidity risk arises when funds required to meet repayments, withdrawals and other commitments are not readily available due to lack of liquidity in the market, which prevents immediate or effective liquidation of positions or portfolios. For effective liquidity management, SBM has written policies and procedures which clearly define its strategy for managing liquidity, the clear lines of responsibilities and the process for measuring, monitoring and managing liquidity. The policies as well as a set of limits approved by the Board on the recommendation of the Board Risk Management Committee to manage unexpected decreases or changes in funding sources available. These include reducing excessive funding concentrations by diversifying sources and terms of funding as well as preserving a portfolio of high quality and marketable debt securities.
The day to day management of liquidity falls under the responsibility of the Treasurer and the Treasury Middle Office actively monitors the management of cash flows in accordance with the approved liquidity risk management policies and limits set by the Board. Overseas banking operations of branches and subsidiaries are required to comply with their local regulatory liquidity requirements and to be self-sufficient for their local currency funding needs. SBM uses the currency-wise Gap Analysis to measure the difference between assets and liabilities (both on and off-balance sheet) that mature in a particular time period. Various liquidity gap scenarios are performed encompassing a range of specific events, which are examined and reported monthly to the Market Risk Forum and quarterly to the Board Risk Management Committee. SBM has in place a contingency plan in the event of a liquidity crisis to ensure that adequate funds continue to be available
which is reviewed annually by the Board Risk Management Committee. SBM has a positive liquidity gap and has the ability to meet future expected cash flows in local currency and foreign currencies.
To assess the liquidity and funding risk, the liquid asset ratio, the level of core deposits, and the customer deposits concentration are used. The liquid asset ratio provides an assessment of the extent to which assets can be readily converted into cash or cash substitutes to meet financial commitments.
Liquidassetsratio
SBM’s liquid asset ratio reflects a strong liquidity position, sufficient to absorb the impact of a stressed funding environment. The cap introduced by the Bank of Mauritius on investment in Government Treasury Bills in April 2011 and the rise in the Cash Reserve Ratio requirement from 6% to 7% on SBM’s deposits (effective as from 28 February 2011) in order to tackle the excess liquidity which had been prevailing on the market explained partly the decrease in liquid asset ratio but most importantly the decrease is the result of effective liquidity management. Although a high degree of liquidity may be a positive sign since it indicates a capacity to meet obligations and take advantage of business opportunities, too much liquidity in the form
of cash and low-earning assets can reduce earnings. SBM aims at finding the right balance between liquidity and profitability.
At 30 June 2011, investment in Government Treasury Bills was at 16.33% of the total rupee deposits, within the limit of 20% set by the Bank of Mauritius. The regulatory limit has been further reduced to 18% of total rupee deposits with effect from 1 July 2011.
SBM’s funding and liquidity position is underpinned by its significant customer deposit base, and has been supported by stable funding. 85% of the deposit base is made up of customers’ current and savings accounts which, although repayable on demand, have traditionally in aggregate provided a stable source of funding. SBM has a large base of customer deposits and at 30 June 2011 deposits represented 125% of total credit (2010: 141%). The top 20 customers accounted for 21.4% of total deposits at 30 June 2011 as compared to 18.1% in the previous year.
The Basel Committee on Banking Supervision brought about critical reforms to the Basel II framework in an attempt to strengthen global capital and liquidity regulations in December 2010. To complement the difficulties faced by some banks due to lapses in basic principles of liquidity risk management, two new liquidity ratios - Liquidity Coverage Ratio (a short term stress liquidity metric) and Net Stable Funding Ratio (a longer term liquidity metric)- were introduced in the Basel III framework. There has not yet been regulatory move to implement these ratios in Mauritius. However, SBM will take the appropriate steps and is fully committed to apply these reforms for better management of its liquidity risk.
A more detailed maturity analysis of the financial liabilities can be found in Note 37 to the Financial Statements.
OPERATIONALRISKMANAGEMENTSBM has established an appropriate, comprehensive approach to the identification, measurement, monitoring and control of operational risk. The approach is consistent with the recommendations made by the Basel Committee on Banking Supervision and the Bank of Mauritius.
Operational risk is inherent to all business activities and has been defined by the Basel Committee on Banking Supervision as ‘the risk of loss resulting from inadequate or failed internal processes, people, systems or external events’. These diverse risks are explained as follows:
•Processingrisk - The risk related to the execution and maintenance of transactions, and the various aspects of running a business, including products and services.
•Peoplerisk - The risk of a loss intentionally or unintentionally caused by an employee – e.g. employee error, employee misdeeds – or involving employees, such as in the area of employment disputes.
•Systemsrisk - The risk of loss caused by a piracy, theft, failure, breakdown or other disruption in technology, data or information; also includes technology that fails to meet business needs.
•Externalrisk - The risk of loss due to damage to physical property or assets from natural or non–natural causes. This category also includes the risk presented by actions of external parties, such as the perpetration of fraud, or in the case of regulators, the execution of change that would alter the bank’s ability to continue operating in certain markets.
Other related risks are:• Legal risk• Reputational risk• Compliance risk• Strategic risk
Expo
sure
, %
Expe
cted
Los
ses,
Rs m
6.1%1.3%
0.0%0.8%
18.3%
65.3%
6.4%
1.9%
AfricaAsia Paci�c - OthersAsia Paci�c - India onlyEastern Asia and Oceania
EuropeMiddle EastNorth America
8.8%
6.3%
17.4%
1.5%
0.1%
0.6%
65.3%
-1
0
1
2
3
4
5
6
7
8
9
-1
0
1
2
3
4
5
6
7
8
Up to 3 Mths
3 - 6 Mths
6 - 12 Mths
1 - 2 Yrs
2 - 5 Yrs Yrs
> 5
Cum Repricing Gap Cum Repricing Gap as a % of T.Assets
0
10
20
30
40
50
60
70
0
10
20
30
40
50
60
1 2
3
4
5
6
7
8
9 10
Up to 3 3 - 6 Mths Mths
6 - 12 Mths
1 - 2 Yrs
2 - 5 Yrs
> 5 Yrs
Rs
Bn
%Rs
Bn
%
Cumulative Gap Cumulative Gap as a % of T.Assets
Average Year end
As a % of liabilities
2008 2009 2010 2011
30
25
20
15
10
5
0
riSK ManageMenT reporT
annual report | 2011 57annual report | 2011 56
riSK ManageMenT reporT
For the effective and efficient identification and management of operational risks, SBM has in place the following:
1.LossEventsandIncidentsDatabase:Since 2004, the operational risk team has continuously collated loss data including causal information. Events and incidents are analysed to assess the effectiveness of controls in place within SBM. Operational loss data is reported and major incidents are discussed monthly at the Operational Risk Forum and quarterly at the Board Risk Management Committee.
During the financial year 2010/2011, the operational risk events had no material financial impact on SBM. An analysis of operational loss events by count for the year ended 30 June 2011 highlights the fact that the highest frequency of events occurred in Business disruption and system failure (53%), Execution, delivery and process risk (38%) followed by Internal fraud (6%). In terms of loss events by value, Execution, delivery and process risk represented 87% of total operational losses followed by Internal Fraud (8%).
2.KeyRiskIndicatorsA set of key risk indicators (KRIs) is tracked by the Operational Risk team, which can provide early warning signal of increased risk associated with non-attainment of control objectives. The aim is to enable early detection and quick response to a wide range of operational risks. Major KRIs are reported to the Operational Risk Forum on a monthly basis and quarterly to the Board Risk Management Committee.
3.RiskAssessmentRisk assessments of the businesses and support functions are conducted periodically to ensure a forward-looking view on the operational risk profile. The businesses are required to conduct self risk assessments and report their respective highest perceived risks on a monthly basis to the Operational Risk team. The Operational Risk team ensures the objectivity and comprehensiveness of the risk assessments and recommends corrective measures.
4.RiskRegisterA risk register is being developed and reviewed periodically to record all risks identified in a specific process or procedure. A brief description of the risk, the likelihood of occurrence, the potential impact on the business and controls in place are included in the risk register. The aim is to determine high risk areas within the organisation.
Other methods used by SBM to mitigate operational risks include: (i) Insurance policies to cover potential financial loss (ii) Outsourcing of non-key processes (iii) Business Continuity Management.
SBM promotes an organisational structure that stresses high ethical behaviour and integrity across all levels of the organisation whereby each and every employee has a defined level of responsibility for the management of risk, with additional encumbrance on managers and specialised units to ensure full adherence to internal policies, procedures, regulations and best practices.
Processes and procedures are continuously updated with the introduction of new products and services as well as changing regulations. The Operational Risk team reviews all the procedures and ensures adequate controls are in place before providing sign-off.
Quarterly staff appraisals are conducted to ensure that performance standards are met and corrective actions are taken where necessary. In addition, SBM has an established Code of Ethics and Business Conduct, a Conflict of Interest Policy and a Fit and Proper Person Policy to ensure that staff with required skills and qualifications are selected for appropriate positions.
SBM is aware of the business opportunities as well as the criticality of information security and the emerging threats linked to the growth of its e-business activities. As such, SBM is aligned with existing best practices such as ISO 27001 and ISO 27002 and has in place an Information Security Policy which defines the framework, management and staff responsibilities as well as the security directives that apply to it. On the e-business front, the use of a Proactive Risk Manager tool to detect suspicious transaction patterns on a 24-hour basis has greatly contributed to reducing card related losses year-on-year.
In line with the Central Bank requirements and local legislation, the compliance and anti-money laundering tasks are carried out by an independent Compliance team. The independent Anti-Money Laundering (AML) Reporting Officers track transactions on a daily basis and report all identified suspicious transactions to the appropriate authorities. SBM has made it mandatory for all staff to attend an AML training programme to mitigate compliance risks as required by the
Guidance Notes on AML/CFT by the Central Bank. Subsequently, all staff are assessed by way of written test. The Compliance team monitors compliance with laws, regulations, SBM’s policies, procedures and central banks’ guidelines. The team conducts in-depth review of areas where compliance with laws/regulations is critical and makes recommendations for enhancement in processes and controls. The Compliance team also provides guidance and acts as a contact point within SBM for compliance queries from staff members. Compliance matters are reported monthly to the Operational Risk Forum and quarterly to the Board Risk Management Committee.
InternalauditThe internal audit function at SBM ensures that its operations are conducted according to the highest standards of best practice by providing an independent, objective assurance to the Management and to the Board. Through a systematic and disciplined approach, internal audit helps SBM to accomplish its objectives by evaluating and recommending improvements to the effectiveness of risk management, control and governance process. The internal audit department is governed by an internal audit charter approved by the Audit Committee. The department reports to the Audit Committee functionally while reporting to the Chief Executive administratively. It maintains a close working relationship with the Risk Management Division, the Compliance Unit and the external auditors.
annual report | 2011 59annual report | 2011 58
riSK ManageMenT reporT
The objective of the internal audit department is to assist various levels of management in the effective discharge of their responsibilities. Internal audit undertakes reliable assessments and value adding services relating to systems, internal controls and procedures. It also provides a key independent support service to management by identifying and evaluating potential risks in their businesses.
Audits are conducted following the risk-based audit methodology which is in line with global best practices. All businesses of SBM are audited to assess control adequacy and effectiveness from a process perspective. In addition, internal audit has internationally certified information systems auditors to audit the information technology used by SBM.
As outlined in its charter, the internal audit function covers various types of audits, notably process, system, IT and compliance audits, and others, such as product and continuous analytical audits. The work performed by internal audit is taken into consideration by the statutory auditors for the purpose of forming an opinion on the Financial Statements of the Bank.
During the year under review, the SBM internal audit function completed audits of internal control systems, information systems and governance processes in accordance with its pre-approved audit plan. Material or significant control weaknesses and proposed management corrective actions were reported to the Audit Committee on a quarterly basis.
CAPITALRESOURCESCapitalstructureandmanagementSBM’s policy is to maintain a strong capital base and to utilise it efficiently throughout its activities with the objective of optimising the return to shareholders while maintaining a prudent relationship between the capital base and the underlying risks of the business. The capital management process ensures that each entity/segment maintains sufficient capital levels for legal/regulatory compliance purposes and in accordance with the Basel II requirements besides keeping a cushion for uncertainties and for supporting depositors’ confidence.
BaselIIandregulatorycapitalSBM needs to comply with capital requirements set by the Bank of Mauritius in accordance with the Basel II framework of the Basel Committee on Banking Supervision while its overseas operations in India and Madagascar must also adhere to their host country regulators, namely Reserve Bank of India and Banque Centrale de Madagascar respectively. The Bank of Mauritius has issued a series of guidelines in line with the Basel II regulations which must be adhered to by all commercial banks in Mauritius.
The Basel II framework is based on three pillars, which are viewed as mutually reinforcing:• Pillar 1: Minimum Capital Requirements
– spells out the different approaches that banks may adopt, with due approval of their supervisor, for the computation of capital adequacy ratio to cover for credit, market and operational risks and eligible capital.
• Pillar 2: Supervisory Review Process – discusses the role of supervisors in ensuring that banks have in place a proper process for assessing and maintaining their capital ratios above the minimum requirements to cater for other risks
within their business not covered under Pillar 1. It also sets out specific oversight responsibilities for the Board and Senior Management, thus reinforcing principles of internal controls and other corporate governance practices.
• Pillar 3: Market Discipline - sets out the minimum disclosure standards on a bank’s capital structure, risk exposures and capital adequacy allowing market participants to assess key information about a bank’s risk profile and level of capitalisation. Pillar 3 is intended to act as a complement to the other two pillars.
The Bank of Mauritius Guideline on the Scope of Application of Basel II requires a home banking group – one whose centre of economic interest is in Mauritius – to adhere to capital adequacy requirements on a consolidated basis for SBM and on a stand-alone basis for each majority owned entity as the different entities within SBM may have an impact on the overall risk profile. SBM’s subsidiary and foreign branches are also subject to risk based capital guidelines issued by their host countries regulators.
Regulatory capital adequacy is measured by two risk-based ratios; Tier 1 and total capital, stated as a percentage of risk-weighted assets. The Bank of Mauritius Guideline on Eligible Capital defines instruments that are eligible for inclusion in regulatory capital and they are grouped under two tiers.
• Tier 1 Capital refers to core capital and consists of ordinary share capital and retained earnings reduced by disallowed intangible assets and deducting 50% of investment in Associates.
• ‘Supplementary’ Tier 2 Capital includes 45% of revaluation reserves, undisclosed reserves, general banking reserves, portfolio allowance for credit losses limited to a maximum of 1.25% of total risk weighted assets and deducting remaining 50% of investment in Associates.
The risk weighted assets are principally derived from application of the risk based capital guidelines related to the measurement of credit risk. Pursuant to these guidelines, on-balance sheet assets and the credit equivalent amount of off-balance sheet exposures are assigned to one of several prescribed risk-weight categories based upon the perceived credit risk associated with the obligor, or if relevant, the guarantor, the nature of the collateral, or external credit ratings. SBM has adopted the following approach for computation of total risk-weighted assets for regulatory purpose:
• Credit risk – based on standardised approach as stipulated in the Guideline on Standardised Approach to Credit Risk issued by the Bank of Mauritius. Banks may use the credit ratings of External Credit Assessment Institutions (ECAIs) to determine the risk weights applicable to claims on sovereign, central banks, banks and rated corporates. SBM uses ratings assigned by the following recognised agencies: Standard & Poor’s, Moody’s Investors Service and Fitch to determine the relevant risk weights applicable for its claims on banks and overseas sovereign. As regards other claims, SBM has applied standard risk weights as proposed in the above mentioned guideline
• Market risk – the Standardized Measurement Approach as per the Guideline on Measurement and Management of Market Risk issued by the Bank of Mauritius
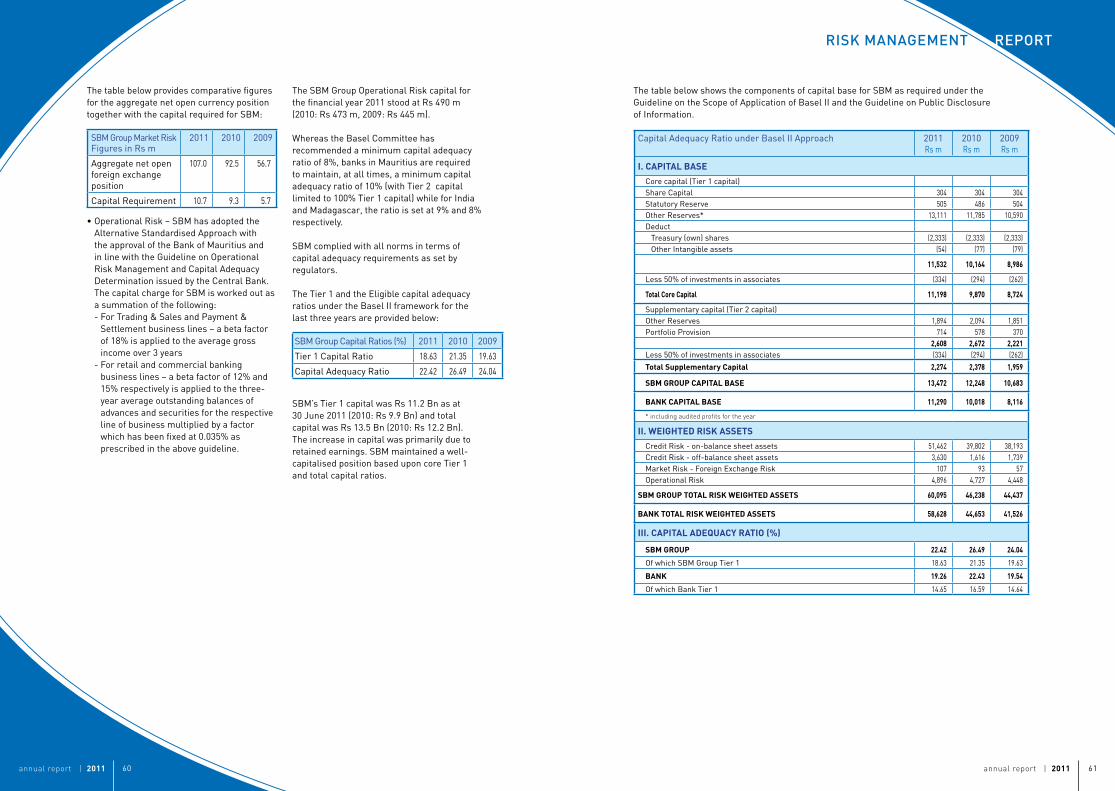
annual report | 2011 61annual report | 2011 60
riSK ManageMenT reporT
The table below provides comparative figures for the aggregate net open currency position together with the capital required for SBM:
SBM Group Market RiskFigures in Rs m
2011 2010 2009
Aggregate net open foreign exchange position
107.0 92.5 56.7
Capital Requirement 10.7 9.3 5.7
• Operational Risk – SBM has adopted the Alternative Standardised Approach with the approval of the Bank of Mauritius and in line with the Guideline on Operational Risk Management and Capital Adequacy Determination issued by the Central Bank. The capital charge for SBM is worked out as a summation of the following:- For Trading & Sales and Payment &
Settlement business lines – a beta factor of 18% is applied to the average gross income over 3 years
- For retail and commercial banking business lines – a beta factor of 12% and 15% respectively is applied to the three-year average outstanding balances of advances and securities for the respective line of business multiplied by a factor which has been fixed at 0.035% as prescribed in the above guideline.
Capital Adequacy Ratio under Basel II Approach 2011Rs m
2010Rs m
2009Rs m
I.CAPITALBASE
Core capital (Tier 1 capital)Share Capital 304 304 304 Statutory Reserve 505 486 504 Other Reserves* 13,111 11,785 10,590 Deduct
Treasury (own) shares (2,333) (2,333) (2,333)Other Intangible assets (54) (77) (79)
11,532 10,164 8,986
Less 50% of investments in associates (334) (294) (262)
TotalCoreCapital 11,198 9,870 8,724
Supplementary capital (Tier 2 capital)Other Reserves 1,894 2,094 1,851 Portfolio Provision 714 578 370
2,608 2,672 2,221Less 50% of investments in associates (334) (294) (262)
TotalSupplementaryCapital 2,274 2,378 1,959
SBMGROUPCAPITALBASE 13,472 12,248 10,683
BANKCAPITALBASE 11,290 10,018 8,116
* including audited profits for the year
II.WEIGHTEDRISKASSETS
Credit Risk - on-balance sheet assets 51,462 39,802 38,193 Credit Risk - off-balance sheet assets 3,630 1,616 1,739 Market Risk - Foreign Exchange Risk 107 93 57 Operational Risk 4,896 4,727 4,448
SBMGROUPTOTALRISKWEIGHTEDASSETS 60,095 46,238 44,437
BANKTOTALRISKWEIGHTEDASSETS 58,628 44,653 41,526
III.CAPITALADEQUACYRATIO(%)
SBMGROUP 22.42 26.49 24.04
Of which SBM Group Tier 1 18.63 21.35 19.63
BANK 19.26 22.43 19.54
Of which Bank Tier 1 14.65 16.59 14.64
The SBM Group Operational Risk capital for the financial year 2011 stood at Rs 490 m (2010: Rs 473 m, 2009: Rs 445 m).
Whereas the Basel Committee has recommended a minimum capital adequacy ratio of 8%, banks in Mauritius are required to maintain, at all times, a minimum capital adequacy ratio of 10% (with Tier 2 capital limited to 100% Tier 1 capital) while for India and Madagascar, the ratio is set at 9% and 8% respectively.
SBM complied with all norms in terms of capital adequacy requirements as set by regulators.
The Tier 1 and the Eligible capital adequacy ratios under the Basel II framework for the last three years are provided below:
SBM Group Capital Ratios (%) 2011 2010 2009
Tier 1 Capital Ratio 18.63 21.35 19.63
Capital Adequacy Ratio 22.42 26.49 24.04
SBM’s Tier 1 capital was Rs 11.2 Bn as at 30 June 2011 (2010: Rs 9.9 Bn) and total capital was Rs 13.5 Bn (2010: Rs 12.2 Bn). The increase in capital was primarily due to retained earnings. SBM maintained a well-capitalised position based upon core Tier 1 and total capital ratios.
The table below shows the components of capital base for SBM as required under the Guideline on the Scope of Application of Basel II and the Guideline on Public Disclosure of Information.
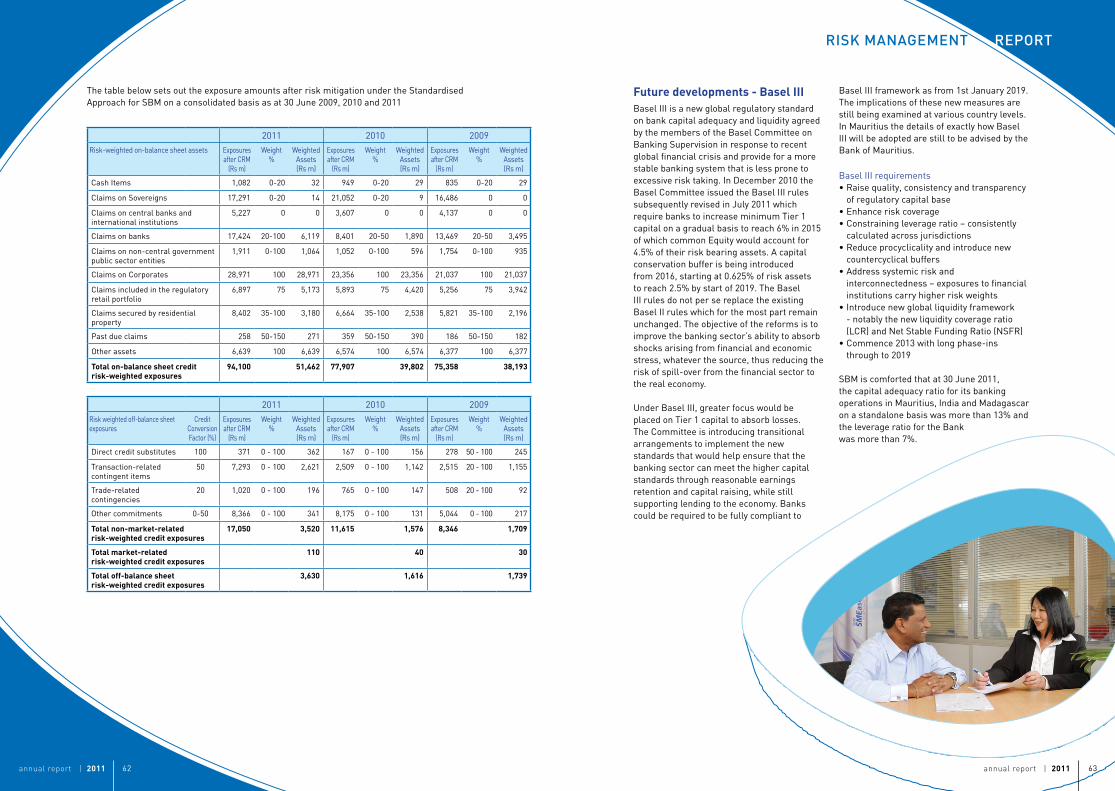
annual report | 2011 63annual report | 2011 62
riSK ManageMenT reporT
Futuredevelopments-BaselIIIBasel III is a new global regulatory standard on bank capital adequacy and liquidity agreed by the members of the Basel Committee on Banking Supervision in response to recent global financial crisis and provide for a more stable banking system that is less prone to excessive risk taking. In December 2010 the Basel Committee issued the Basel III rules subsequently revised in July 2011 which require banks to increase minimum Tier 1 capital on a gradual basis to reach 6% in 2015 of which common Equity would account for 4.5% of their risk bearing assets. A capital conservation buffer is being introduced from 2016, starting at 0.625% of risk assets to reach 2.5% by start of 2019. The Basel III rules do not per se replace the existing Basel II rules which for the most part remain unchanged. The objective of the reforms is to improve the banking sector’s ability to absorb shocks arising from financial and economic stress, whatever the source, thus reducing the risk of spill-over from the financial sector to the real economy.
Under Basel III, greater focus would be placed on Tier 1 capital to absorb losses. The Committee is introducing transitional arrangements to implement the new standards that would help ensure that the banking sector can meet the higher capital standards through reasonable earnings retention and capital raising, while still supporting lending to the economy. Banks could be required to be fully compliant to
2011 2010 2009Risk-weighted on-balance sheet assets Exposures
after CRM (Rs m)
Weight %
Weighted Assets (Rs m)
Exposures after CRM
(Rs m)
Weight %
Weighted Assets (Rs m)
Exposures after CRM
(Rs m)
Weight %
Weighted Assets (Rs m)
Cash Items 1,082 0-20 32 949 0-20 29 835 0-20 29
Claims on Sovereigns 17,291 0-20 14 21,052 0-20 9 16,486 0 0
Claims on central banks and international institutions
5,227 0 0 3,607 0 0 4,137 0 0
Claims on banks 17,424 20-100 6,119 8,401 20-50 1,890 13,469 20-50 3,495
Claims on non-central government public sector entities
1,911 0-100 1,064 1,052 0-100 596 1,754 0-100 935
Claims on Corporates 28,971 100 28,971 23,356 100 23,356 21,037 100 21,037
Claims included in the regulatory retail portfolio
6,897 75 5,173 5,893 75 4,420 5,256 75 3,942
Claims secured by residential property
8,402 35-100 3,180 6,664 35-100 2,538 5,821 35-100 2,196
Past due claims 258 50-150 271 359 50-150 390 186 50-150 182
Other assets 6,639 100 6,639 6,574 100 6,574 6,377 100 6,377
Totalon-balancesheetcreditrisk-weightedexposures
94,100 51,462 77,907 39,802 75,358 38,193
2011 2010 2009Risk weighted off-balance sheet exposures
Credit Conversion Factor (%)
Exposures after CRM
(Rs m)
Weight %
Weighted Assets (Rs m)
Exposures after CRM
(Rs m)
Weight %
Weighted Assets (Rs m)
Exposures after CRM
(Rs m)
Weight %
Weighted Assets (Rs m)
Direct credit substitutes 100 371 0 - 100 362 167 0 - 100 156 278 50 - 100 245
Transaction-related contingent items
50 7,293 0 - 100 2,621 2,509 0 - 100 1,142 2,515 20 - 100 1,155
Trade-related contingencies
20 1,020 0 - 100 196 765 0 - 100 147 508 20 - 100 92
Other commitments 0-50 8,366 0 - 100 341 8,175 0 - 100 131 5,044 0 - 100 217
Totalnon-market-relatedrisk-weightedcreditexposures
17,050 3,520 11,615 1,576 8,346 1,709
Totalmarket-relatedrisk-weightedcreditexposures
110 40 30
Totaloff-balancesheetrisk-weightedcreditexposures
3,630 1,616 1,739
The table below sets out the exposure amounts after risk mitigation under the Standardised Approach for SBM on a consolidated basis as at 30 June 2009, 2010 and 2011
Basel III framework as from 1st January 2019. The implications of these new measures are still being examined at various country levels. In Mauritius the details of exactly how Basel III will be adopted are still to be advised by the Bank of Mauritius.
Basel III requirements• Raise quality, consistency and transparency
of regulatory capital base• Enhance risk coverage• Constraining leverage ratio – consistently
calculated across jurisdictions• Reduce procyclicality and introduce new
countercyclical buffers• Address systemic risk and
interconnectedness – exposures to financial institutions carry higher risk weights
• Introduce new global liquidity framework - notably the new liquidity coverage ratio (LCR) and Net Stable Funding Ratio (NSFR)
• Commence 2013 with long phase-ins through to 2019
SBM is comforted that at 30 June 2011, the capital adequacy ratio for its banking operations in Mauritius, India and Madagascar on a standalone basis was more than 13% and the leverage ratio for the Bank was more than 7%.

annual report | 2011 65annual report | 2011 64
execUTiVe ManageMenT
Suvalaxmi Chakraborty, B.Com (Hons), CA Chief Executive Officer SBM India Operations Has 23 years of work experience, out of which 22 years have been spent in the banking and financial
sector. Worked for ICICI Bank in various senior positions (in Corporate Finance, Project finance, Treasury, General Manager - Corporate Banking and her last assignment in ICICI Bank was Head- Rural and Agri Banking) and was Commercial Banking Director of the Indian Operations of Barclays Bank PLC before joining SBM. Reports to the Chief Executive.
Sridhar Guru, Bachelors Degree in Computer Science Engineering, Executive Masters in International Business Administration Chief Information OfficerHas held several successful IT roles within banking,
insurance, financial services, e-commerce and commercial technology industries. Over 20 years of experience, he has acquired global work exposure in the US, UK, India, Australia and New Zealand. Prior to joining SBM, he was the Regional CIO (India & Indian Ocean) - Global Retail and Commercial Banking for Barclays Bank PLC where he set up and managed technology to support one of the fastest growing business franchise in the region. Before that he was, amongst other roles, Senior Vice President & Head of Global IT Delivery Centre of Expertise for Bank of America, Director of Financial Services & Insurance Practice for American Financial Group Inc. and Head of IT Delivery - Institutional and Business Banking for ANZ (Bank). He is a member of The Association of Professional Engineers, Scientists & Managers of Australia and Computer Society of India. He joined the Bank in October 2010 and reports to the Chief Executive.
Anil Kumar Kundan, B.A (Humanities), Diploma in Automobile Engineering Credit UnderwritingHas worked in various positions in the credit department of the largest bank in India for 22 years and also in
Mauritius as Chief Credit Officer for 4 years. The experience spans from heading branch operations to credit appraisal, loan syndication and control, supervision and credit approval for overseas operations of the bank in the earlier assignment. Currently, providing leadership to credit function with primary focus on corporate, SME and Retail, including training to staff, presentation of proposals to various forums and Board Committees. Reports to the Chief Executive.
Veronique Lim Hoye Yee, BSc (Hons) Economics & Accounting, MSc Economics and Finance, CFACredit Administration & LegalHas 14 years of work experience, including 13 years within SBM Group.
Was previously Head of Credit Underwriting Division, Head of Intensive Care Team and Research Department and Head of Risk Management. Currently, Divisional Leader in charge of Credit Administration & Legal. Reports to the Chief Executive.
Bishwajit Mazumder, CA, LLB, MBA, CIA, CISA, CISSP, CFE, CAIIB, ISSMPOperations Management & Trade FinanceHas worked for 28 years in the banking sector in different positions and geographies,
before joining the Bank in February 2010 as Chief Internal Auditor. Has worked as Chief Audit Executive for ING Vysya Bank in India, as Chief Internal Auditor for Central Bank of Oman for five years (till 2007) and for IDBI Bank for 4 years (till 2002) as Assistant Vice
President. Also, held various positions in front office, back office, branch head and corporate office and Information Technology processes at multiple banks. Currently, Divisional Leader in charge of Operations Management & Trade Finance and also oversees the Quality & Customer Service Department. Reports to the Chief Executive.
Louis Nallet, DES – Institut Technique de Banque / CNAM Paris Directeur Général Banque SBM Madagascar SAHas over 46 years of banking experience and has held senior positions in major international
financial institutions, including Citibank and Standard Bank. Before joining SBM in 2010 he was Director of Stanbic Africa, a member of the Standard Bank Group, and Managing Director of Stanbic in the Democratic Republic of Congo. Reports to the Chief Executive.
Daniel Ng Tseung, BSc EconomicsTreasuryHas worked for 9 years as Treasurer at HSBC before joining SBM as Group Treasurer in December 2000. Was also overseeing the e-business
activities. Has been a member of the Board. Reports to the Chief Executive.
Pauline Seeyave, MA (Cantab), ACACorporate BankingThe profile of Ms Pauline Seeyave is found at page 15.
ChiefExecutiveOfficerGautam Vir, BA (Hons), MBAThe profile of Mr Gautam Vir is found at page 15.
HeadRetailBankingSoopaya Parianen, BA (Hons) – EconomicsMr Parianen has 34 years experience in banking out of which 27 years are at Senior Management level.
He was previously the Group Divisional Leader for Corporate Banking, the Group Divisional Leader Retail Banking and Credit Management Support Services and was also overseeing the overall operations management of SBM. Since February 2010, he is heading the Retail Banking Division of SBM. Reports to the Chief Executive.
DivisionalLeadersChandradev Appadoo, FCCA, ACIBCorporate Affairs & Finance and Company Secretary Has worked for 26 years in the Bank at various levels including branches, Corporate
Banking, Finance, Legal, Compliance and Risk Management. Currently the Company Secretary and also heading Facilities Management, Corporate Affairs and Finance Division. Reports to the Chairman and the Chief Executive.

annual report | 2011 67annual report | 2011 66
execUTiVe ManageMenT
TeamLeadersEshan AmiranBST - E-business, Alternative Channels & International Markets
Vikash Bheem SinghQuality & Customer Service
Anand BhugunSales and Service - Retail
Hemant Kumar DursunFacilities Management
Kanand GoolySmall & Medium Enterprise
Rita GujadhurValue Based Performance Management
Bhuvanesh HingoraneyBST - Banking & Treasury
Geneviève Anne Ho ShunInternal Audit
Arvind JhaInternational Banking & Global Business
Vishal Kumar JoyramPrivate Banking & Wealth Management
Liliane Li Chiu LimFinance
Kwon Li Pak ManRisk Management & Compliance
Grant MackenzieE-business
Nandrajen MooneesawmyCredit Services
Darrma Rajan MoorooganData Centre & IT Production Platforms
Soopaya PareathumbyTechnology Operations
Suren Ramchurn Card Issuing
Poorunduth RamgoolamSales and Services – Retail
Amaresh RamluganMarketing & Communications
Satyamurti RavikumarSenior Vice President – SBM India Operations
Shailen Sreekeessoon Strategic Planning and Research
Aslam Mohamud Hassim TaherCorporate Banking
Parvataneni Venkateswara RaoHead of Treasury – SBM India Operations
SeniorOfficersFeriel Aumeerally Corporate Banking
Avinash Asheesh AutarCorporate Banking
Anand BabbeaE-business
Shailendra BheekaIT Audit
Ashvin BhuruthBST - Corporate Support Systems & Analytics
Sudhir DabeedooalRetail Credit
Shyam DamreeCorporate Credit
Bye Samah GhoorahCurrency Unit
Deochand GonpotHuman Resources
Ravi GunessRecovery & Workout
Dharmendranath HurkooCorporate Banking
Balkrishna JhurryInternational Banking & Global Business
Rajnish LutchmahCorporate Banking
Rishy Raj LutchmanTreasury
Veeren ManikionE-business
Carlo Parmasiven PoliahBancassurance
Ravindranath RamdhanOperations Management
Malinee Devi RamlagunCorporate Credit
Hemraj RubeeAsset Finance
Leena SeetamoneeHuman Resources
Chrisnen VythilingumTechnology Operations

@ the heart of your aspirations
sgb kradeyour life U gpOur ability:
with high-end technology services through Internet Banking & Mobile Banking
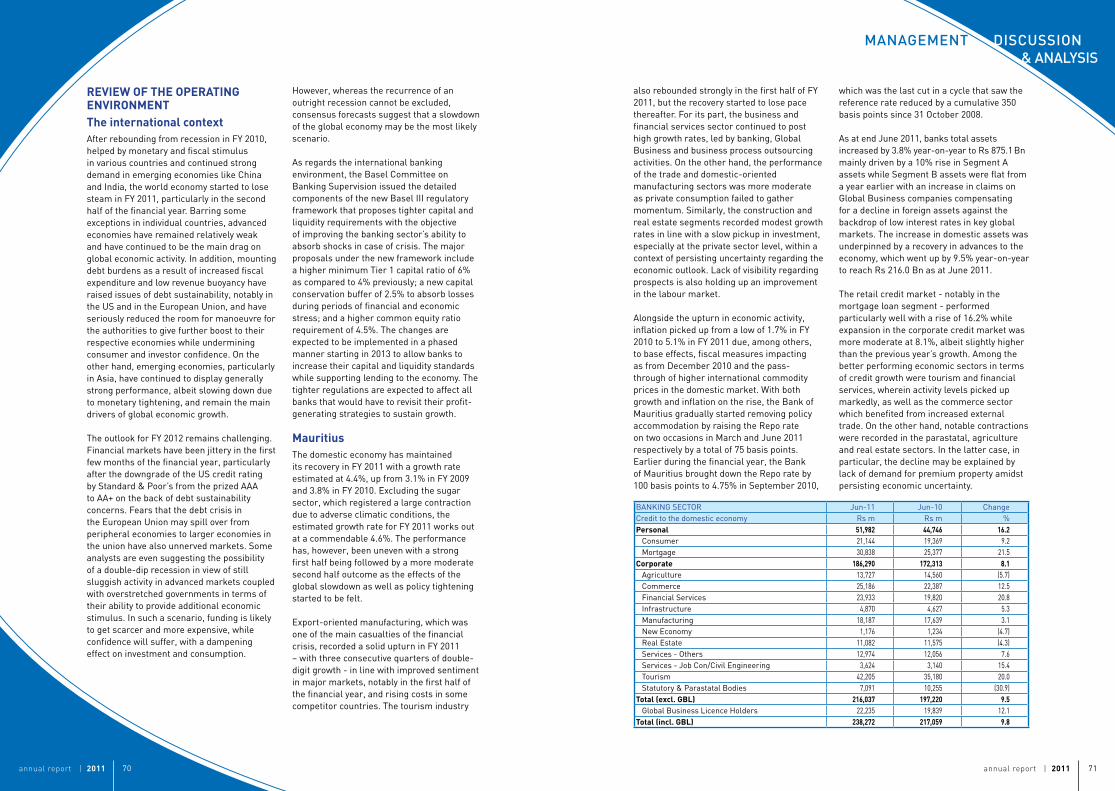
annual report | 2011 71annual report | 2011 70
ManageMenT diScUSSion & analySiS
REVIEWOFTHEOPERATINGENVIRONMENTTheinternationalcontextAfter rebounding from recession in FY 2010, helped by monetary and fiscal stimulus in various countries and continued strong demand in emerging economies like China and India, the world economy started to lose steam in FY 2011, particularly in the second half of the financial year. Barring some exceptions in individual countries, advanced economies have remained relatively weak and have continued to be the main drag on global economic activity. In addition, mounting debt burdens as a result of increased fiscal expenditure and low revenue buoyancy have raised issues of debt sustainability, notably in the US and in the European Union, and have seriously reduced the room for manoeuvre for the authorities to give further boost to their respective economies while undermining consumer and investor confidence. On the other hand, emerging economies, particularly in Asia, have continued to display generally strong performance, albeit slowing down due to monetary tightening, and remain the main drivers of global economic growth.
The outlook for FY 2012 remains challenging. Financial markets have been jittery in the first few months of the financial year, particularly after the downgrade of the US credit rating by Standard & Poor’s from the prized AAA to AA+ on the back of debt sustainability concerns. Fears that the debt crisis in the European Union may spill over from peripheral economies to larger economies in the union have also unnerved markets. Some analysts are even suggesting the possibility of a double-dip recession in view of still sluggish activity in advanced markets coupled with overstretched governments in terms of their ability to provide additional economic stimulus. In such a scenario, funding is likely to get scarcer and more expensive, while confidence will suffer, with a dampening effect on investment and consumption.
However, whereas the recurrence of an outright recession cannot be excluded, consensus forecasts suggest that a slowdown of the global economy may be the most likely scenario.
As regards the international banking environment, the Basel Committee on Banking Supervision issued the detailed components of the new Basel III regulatory framework that proposes tighter capital and liquidity requirements with the objective of improving the banking sector’s ability to absorb shocks in case of crisis. The major proposals under the new framework include a higher minimum Tier 1 capital ratio of 6% as compared to 4% previously; a new capital conservation buffer of 2.5% to absorb losses during periods of financial and economic stress; and a higher common equity ratio requirement of 4.5%. The changes are expected to be implemented in a phased manner starting in 2013 to allow banks to increase their capital and liquidity standards while supporting lending to the economy. The tighter regulations are expected to affect all banks that would have to revisit their profit-generating strategies to sustain growth.
MauritiusThe domestic economy has maintained its recovery in FY 2011 with a growth rate estimated at 4.4%, up from 3.1% in FY 2009 and 3.8% in FY 2010. Excluding the sugar sector, which registered a large contraction due to adverse climatic conditions, the estimated growth rate for FY 2011 works out at a commendable 4.6%. The performance has, however, been uneven with a strong first half being followed by a more moderate second half outcome as the effects of the global slowdown as well as policy tightening started to be felt.
Export-oriented manufacturing, which was one of the main casualties of the financial crisis, recorded a solid upturn in FY 2011 – with three consecutive quarters of double-digit growth - in line with improved sentiment in major markets, notably in the first half of the financial year, and rising costs in some competitor countries. The tourism industry
also rebounded strongly in the first half of FY 2011, but the recovery started to lose pace thereafter. For its part, the business and financial services sector continued to post high growth rates, led by banking, Global Business and business process outsourcing activities. On the other hand, the performance of the trade and domestic-oriented manufacturing sectors was more moderate as private consumption failed to gather momentum. Similarly, the construction and real estate segments recorded modest growth rates in line with a slow pickup in investment, especially at the private sector level, within a context of persisting uncertainty regarding the economic outlook. Lack of visibility regarding prospects is also holding up an improvement in the labour market.
Alongside the upturn in economic activity, inflation picked up from a low of 1.7% in FY 2010 to 5.1% in FY 2011 due, among others, to base effects, fiscal measures impacting as from December 2010 and the pass-through of higher international commodity prices in the domestic market. With both growth and inflation on the rise, the Bank of Mauritius gradually started removing policy accommodation by raising the Repo rate on two occasions in March and June 2011 respectively by a total of 75 basis points. Earlier during the financial year, the Bank of Mauritius brought down the Repo rate by 100 basis points to 4.75% in September 2010,
which was the last cut in a cycle that saw the reference rate reduced by a cumulative 350 basis points since 31 October 2008.
As at end June 2011, banks total assets increased by 3.8% year-on-year to Rs 875.1 Bn mainly driven by a 10% rise in Segment A assets while Segment B assets were flat from a year earlier with an increase in claims on Global Business companies compensating for a decline in foreign assets against the backdrop of low interest rates in key global markets. The increase in domestic assets was underpinned by a recovery in advances to the economy, which went up by 9.5% year-on-year to reach Rs 216.0 Bn as at June 2011.
The retail credit market - notably in the mortgage loan segment - performed particularly well with a rise of 16.2% while expansion in the corporate credit market was more moderate at 8.1%, albeit slightly higher than the previous year’s growth. Among the better performing economic sectors in terms of credit growth were tourism and financial services, wherein activity levels picked up markedly, as well as the commerce sector which benefited from increased external trade. On the other hand, notable contractions were recorded in the parastatal, agriculture and real estate sectors. In the latter case, in particular, the decline may be explained by lack of demand for premium property amidst persisting economic uncertainty.
BANKING SECTOR Jun-11 Jun-10 ChangeCredit to the domestic economy Rs m Rs m %Personal 51,982 44,746 16.2 Consumer 21,144 19,369 9.2 Mortgage 30,838 25,377 21.5 Corporate 186,290 172,313 8.1 Agriculture 13,727 14,560 (5.7) Commerce 25,186 22,387 12.5 Financial Services 23,933 19,820 20.8 Infrastructure 4,870 4,627 5.3 Manufacturing 18,187 17,639 3.1 New Economy 1,176 1,234 (4.7) Real Estate 11,082 11,575 (4.3) Services - Others 12,974 12,056 7.6 Services - Job Con/Civil Engineering 3,624 3,140 15.4 Tourism 42,205 35,180 20.0 Statutory & Parastatal Bodies 7,091 10,255 (30.9)Total(excl.GBL) 216,037 197,220 9.5 Global Business Licence Holders 22,235 19,839 12.1 Total(incl.GBL) 238,272 217,059 9.8
annual report | 2011 73annual report | 2011 72
ManageMenT diScUSSion & analySiS
In contrast to the increase in advances, investment in gilt-edged securities declined in FY 2011 in line with lower Government borrowing requirements. The weak supply of Government paper engendered a high liquidity situation in the market, even though deposit growth was relatively moderate, and depressed yields for a large part of the financial year, with troughs of 2.40% and 2.25% in the Bank rate (which is the weighted average rate on 3-month, 6-month and 12-month Treasury bills) on 3 September 2010 and 25 March 2011 respectively. With a view to reducing excess liquidity in the system, the Bank of Mauritius raised the cash reserve ratio on three occasions since June 2010, from 4.5% to 5.0% on 18 June 2010, from 5.0% to 6.0% on 8 October 2010 and from 6.0% to 7.0% on 25 February 2011.
In an attempt to encourage banks to increase lending and to develop a secondary market for Treasury bills, the Bank of Mauritius introduced a new limit on the holdings of Treasury bills by banks. With effect from 8 April 2011, banks have been required to maintain in their banking book Treasury bills equivalent to a maximum of 20% of their average rupee deposits over a two-week period. The cap has been brought down to 18% effective 1 July 2011. The new limits imposed have encouraged banks to shift towards longer maturity paper. These moves seem to have had some effect on tempering liquidity as gauged by a decline in banks’ excess reserve holdings with the central bank to Rs 3.5 Bn for the fortnight ending 30 June 2011 as compared to a high of Rs 6.9 Bn for the fortnight ending 24 February 2011.
On the funding side, segment A (resident) deposits went up by 8.2% year on year to reach Rs 284.1 Bn as at June 2011, on the back of a rise of 16.9% in foreign currency denominated deposits. Within the rupee-denominated deposits, which account for 77% of segment A deposits, notable increases of 16.1% and 11.8% were recorded in demand and savings deposits respectively while time deposits dropped as banks focused on
In July 2010, India’s wholesale price inflation (WPI) stood at 10.0% and has been on a general declining trend up to November 2010 when it reached 7.5%. The trend reversed as from December 2010 as inflation moved above the 8% mark again to reach 9.4% in June 2011 and becoming more generalised as reflected by higher prices of fuel and non-food manufactured products. The average WPI rate between July 2010 and June 2011 was 9.3% as compared to 6.2% during the same period of the previous year. Upside risks to inflation led to a continuation in the monetary policy tightening process by the Reserve Bank of India with the key interest rate being raised from 5.75% as at end July 2010 to 7.50% as at end June 2011 in a number of steps.
Going ahead, the Indian economy is expected to continue to expand strongly at around 8.2% in fiscal year 2011/12, but slightly milder than the 8.5% recorded in 2010/11 partly on account of tighter monetary policy and uncertainties that prevail on the global scene especially in the US which is a major export destination of the country. In terms of sectoral growth rates, agriculture is projected to grow by 3.0%, industry by 7.1% and services by a robust 10.0%. FDI inflows are estimated to rise to USD 35 Bn in 2011/12 and even higher if substantial improvement in investment conditions materialise.
Reflecting a robust economic performance and outlook, credit to the Indian economy has remained upbeat, with an expansion of 19.6% in June 2011 as credit to industry, services and personal categories expanded further. Credit to the industrial sector continued to be led by infrastructure. The higher interest rates led to sharper deposits growth of 17.7% in June 2011 as compared to 15.9% in March 2011. Credit growth for 2011/12 is expected to remain around 18.0%.
Future changes in the banking sector regulatory environment are being considered by the Reserve Bank of India relating to the mode of presence of foreign banks in the country. With the aim of promoting greater stability and control within the banking system in India, the RBI would favour local incorporation by foreign banks such that these will be wholly-owned subsidiaries of foreign parents as opposed to branches of
reducing their cost of funds within a highly liquid and low yield environment. Segment B deposits were relatively flat on a point to point basis from June 2010 to June 2011.
The performance of the banking sector in FY 2012 will continue to depend on the health of the broader economy which is expected to slow down in FY 2012 in line with persisting weakness in the country’s main markets. In fact, conditions could rapidly deteriorate should the slowdown in the world economy be far more severe than anticipated taking into consideration that the recovery of the domestic economy has been largely export led, with private consumption and investment being relatively weak. The tourism and textiles segments are particularly at risk, and a broader spill-over to the domestic economy cannot be excluded through both the income and confidence channels. Encouragingly, the authorities will still have some policy room, on both the monetary and fiscal fronts, to respond to a downturn in activity, albeit not as much as in 2008-2009. Credit granted by banks is expected to remain below trend unless a sustained recovery begins to take hold and, crucially, investor and consumer confidence edge up significantly.
IndiaThe Indian economy grew by a robust 8.9% in 3Q10 as the services sector expanded by 9.9% led by “trade, hotels, restaurants, transport and communication”, agricultural sector growth picked up to 5.4% due to supportive weather while industrial sector growth moderated to a still high 8.4%. Although GDP growth eased thereafter to 8.3% in 4Q 10 and 7.8% in 1Q 11 partly on account of a further slowdown of the industrial sector as activity in certain core industries including cement and natural gas declined, there were no evidence of any broad-based deceleration. On the expenditure side, growth continued to be supported by strong private consumption while investment growth slowed down markedly (from 11.9% in 3Q 10 to 0.4% in 1Q 11) against the backdrop of a tighter monetary policy stance. Corporate earnings growth and profit margins in 1Q 11 were broadly comparable to the previous two quarters, suggesting that demand remained steady, and in the face of sharp increases in input costs, pricing power remained unaltered.
foreign banks. To this end, changes to the operating environment for foreign banks have been proposed to encourage them to incorporate locally. SBM will carefully assess the prospects pertaining to the new RBI proposals and review its strategy in India accordingly.
MadagascarAfter contracting by 4.1% in 2009, the Malagasy economy grew by a modest 0.5% in 2010 driven by significant expansion in the extractive industry (+54.7%), an upturn in tourist related activities and a rebound in activity in a number of sectors including energy and transport. Growth for 2011 is projected at around 0.6% and is likely to improve further should the political situation improve.
The primary sector, which accounted for some 26.7% of GDP in 2009, contracted by 3.3% in 2010 as opposed to a solid growth of 8.5% registered in 2009. Despite favourable climatic conditions, the agricultural sector contracted by 0.2% in 2010 but is projected to return to growth in 2011 on the back of supportive government initiatives, the emergence of new entrepreneurs and the rehabilitation of irrigation facilities. The extractive industries are expected to maintain robust growth with the production of cobalt and nickel, and on announced plans to boost output of ilmenite, a major input in the manufacture of paints. After contracting sharply by 24.6% in 2009 on account of the suspension from trade preferences under the US Africa Growth and Opportunities Act, the textile industry rebounded in 2010 and posted a positive growth of 7.3%. The construction and public works sector grew by 2.6% following a contraction of 17.7% in 2009. The tertiary sector was driven by the banking and insurance sectors which expanded by 9.8% and 16.7%, respectively, while further support came from the tourism sector. In 2010, tourist arrivals reached 196,052 as compared to 162,687 in 2009. Over the first half of 2011, tourist arrivals and tourism receipts both expanded by 16.0% year-on-year. The commerce sector, on the other hand, contracted by 1.3% in 2010.
annual report | 2011 75annual report | 2011 74
ManageMenT diScUSSion & analySiS
Private consumption contracted by about 2.3% in 2010 mainly on account of the loss in formal jobs and is projected to contract by 1.3% in 2011. Private investment contracted by about 7.0% as a result of the completion of major projects while lack of funding led to declining public investment.
Between June 2010 and June 2011, credit to the Malagasy economy expanded by a modest 6.2% to about MGA 2,156 Bn as investment projects remained limited amidst the political standoff. As at end March 2011, the deposit base of banks stood at MGA 3,763 Bn as compared to MGA 3,469 Bn a year ago. As a whole, the performance of the banking sector improved as reflected by a rise in pre-tax profit by about 11% to MGA 31 Bn as at end March 2011.
BUSINESSREVIEWDespite a highly competitive environment within the context of a sluggish economic recovery, SBM increased its market share in both the corporate and retail segments in Mauritius thanks to enhanced relationship building and continued proximity with customers as well as a proactive response to changing market conditions. SBM has also added more than 30,000 relationships to its customer base. Understanding customer needs and providing high-quality service will continue to underpin SBM’s strategy to grow the business and the number of clients.
In line with its spirit of innovation, SBM has also revamped its product portfolio with the launch of a new SBM ECOLOAN to finance the purchase of solar panels and the SBM BILLPAY which allows customers to settle their electricity and phone bills on SBM ATMs and selected POS terminals and retailers. Besides, a new investment product, SBM BRICT INVESTMENTS, was introduced while Bancassurance was launched in August 2011. Other products were also reviewed taking into consideration evolving market preferences.
In India, additional capital of USD 33 million was injected and human capital upgraded
to pressures on both volumes and rates. Nonetheless, SBM’s corporate banking arm achieved a robust performance with strong growth rates in advances, deposits and fees in FY 2011 as it focused on client proximity, relationship building and value added services, enabling SBM to significantly increase its market share and penetrate new business areas.
Persisting uncertainty regarding the economic climate – notably with debt sustainability concerns in the US and Europe – is likely to undermine investor confidence and thus dampen an eventual recovery in private sector investment in Mauritius in FY 2012, which does not bode well for the corporate banking market. As a major player in the domestic market and in line with its strategic objectives, SBM will continue to be close to its clients and accompany them with their financing needs in both good times and in downturns. SBM will also harness new growth opportunities by capitalising on the continuous enhancement of service delivery, notably through the ongoing upgrade in human capital and in business processes.
Retail Banking, SMEs and Wealth ManagementIn spite of a slowdown in consumption expenditure at national level, the retail banking market has sustained an upturn driven by the mortgage segment, as banks have been aggressively promoting their products with reduced rates and increased benefits to customers. Notwithstanding this competitive environment, SBM has achieved a noteworthy performance during FY 2011, with an increase of 22.6% in advances, which enabled it to gain market share in both the consumer and mortgage segments. In the same vein, retail banking fees increased by a significant 23.8%.
This achievement bears the result of a number of initiatives aimed at better understanding and meeting customer needs. These include training in customer service and product knowledge; proximity events such as ‘Get Connected Activities’ and ‘SBM in the Community’ whereby closer contact with customers is favoured; improved complaints resolution and the setting up of a mobile sales team. Moreover, leveraging its extensive
to give a boost to operations. Early results in terms of growth in advances, deposits and profitability are encouraging. With the Indian economy presenting bright prospects for years to come, SBM plans to ambitiously grow the business in India, taking into account opportunities offered by proposed changes on the regulatory front.
Conscious that its people are key to the growth of its business, SBM has continued to invest heavily in human capital development. As an indication, the number of training hours increased by nearly 40% over FY 2011. SBM has also launched a Service Excellence Award to reward employees who go the extra mile to provide superior service to customers and colleagues. Besides, SBM pursued its policy of strengthening its human capital with the coming on board of a new Chief Information Officer in October 2010. He will play an important part in the upgrade of SBM’s technology platform over the coming years. Through this major initiative and building on its past experience of using technology as a competitive differentiator, SBM aims to bolster its capabilities for delivering new and enhanced products, better customer service and improved efficiency.
In the same vein, SBM is continuously encouraging customers to shift to electronic channels. The share of electronic to total transactions has thus pursued an upward trend to reach 86.9% in FY 2011. Furthermore, the Bank launched the e-statement initiative in August 2011, whereby customers are encouraged to opt for receiving their bank statements through email rather than by post. Besides improving efficiency, this initiative fosters greater eco-friendliness.
ReviewoflinesofbusinessCorporate Banking The corporate market has remained challenging with only a slow pickup in credit demand amidst lacklustre private sector investment, notably in relation to large projects. Against this background, the corporate banking sector witnessed heightened competition, particularly given that liquidity in the banking system remained high throughout the financial year, leading
distribution network, the Bank embarked upon bancassurance services towards the end of the financial year through the distribution model. This should support fee income in the coming years. Recognising the opportunity in the ‘green’ segment in line with the Government’s vision, a new product, SBM ECOLOAN, was designed to enable customers to finance the purchase of solar panels. The above host of initiatives was buttressed by innovative marketing campaigns aimed at enhancing visibility of SBM products and its brand. Reflective of continued confidence in the SBM brand, the number of retail banking customers increased by more than 30,000 over FY 2011. On the funding side, retail banking deposits grew by some 3.2% as SBM was not very active in pursuing deposit growth given the highly liquid market. Looking ahead, SBM expects to build on the momentum generated to further increase its market share in the retail segment, with continued focus on customer service, product development and market knowledge.
SBM’s wealth management arm also performed well, with brokerage and asset management fees going up by 34.7% on the back of a 28% increase in assets under management. This was underpinned by several innovations particularly the launch of SBM BRICT INVESTMENTS, an in house structured product denominated in MUR with capital guarantee in MUR and guaranteed return in USD. SBM also introduced international trading including through exchange traded funds as well as a ‘Daily Brief’ to update its high net-worth clients on major global economic and financial events and indicators. Whereas jittery financial markets, if they persist, could be a constraint to growth in the wealth management segment in FY 2012, SBM will strive to carefully assess the potential of different regions and product classes and optimise return of funds with a view to providing value addition to clients.
As regards small and medium enterprises (SMEs), the Bank launched a new product, SBM SMEase, to provide them with a range of facilities encompassing advances, deposits, trade finance, payments capabilities
annual report | 2011 77annual report | 2011 76
ManageMenT diScUSSion & analySiS
and advisory services. Supported by an enhancement of human capital and access to the extensive branch network, the SBM SMEase product suite should support growth of the SME segment in coming periods. Besides, a training programme was organized in collaboration with the International Finance Corporation allowing some 60 SME clients to improve their business and managerial skills.
Cross-border business in Mauritius operationsSignificant growth in the Global Business segment was recorded during FY 2011 with advances expanding robustly as low domestic interest rates and the uptick in global investor confidence, particularly during the first half of the financial year, encouraged higher borrowing. Deposits from customers also went up following efforts to attract more Global Business Companies within the customer base and to enhance the image of SBM as a serious and long-term player in the Global Business segment. Besides, significant growth was recorded in fee-based income as the tariff structure was reviewed alongside an expansion of the product offering in relation to the India business, taking advantage of SBM’s Foreign Institutional Investor (FII) licence.
The way forward will, nonetheless, prove to be testing in the context of the resurgence of uncertainty globally which could impact the banking environment negatively in terms of an increase in risk spreads and a drying up of global liquidity as a result of reluctance on the part of banks to lend on the interbank markets. In addition, the potential renegotiation of the Double Taxation Avoidance Agreement with India has again been brought to the fore. On the positive side, the consolidation of the SBM India operations represents untapped opportunities for the international business in terms of trade finance, loan syndication and fee and commission income. Moreover, SBM’s reinforced internal capabilities and higher
heightened competitive pressures are playing against profit margins.
Treasury income grew, albeit insignificantly, over the last year mainly driven by the growth in overseas operations. Mauritius, which contributes over 85% to total revenue, continues to feel the ripples of the financial crisis. As a result of some policy changes by the Bank of Mauritius, a significant drop was witnessed in the volume of transactions. The Central Bank has also raised the cash reserve requirement twice this year and introduced a cap in holdings of Treasury bills in an attempt to control the excess liquidity on the local market. Treasury is raising funds competently in the open market to accommodate SBM’s growing asset base and managing the market risks of the Bank efficiently. Mauritius Treasury is the leading provider of rupee and rupee denominated products. With yields rising, the local securities market is expected to be more active this year. As China relaxed their remittance rules, SBM has provided itself the capability to trade in Yuan in line with customers needs.
As opportunities are limited on the domestic market, Treasury is capitalising on overseas operations to increasingly contribute towards total income. Madagascar has been focusing on market penetration, driving currency income higher by 8% during the course of last year. Following the recent restructuring in the Indian operations, a positive contribution to total income has been witnessed this year. SBM has also embarked on new incentives to maintain and improve returns.
E-businessThe card issuing business achieved a notable performance despite heightened competition with two additional banks launching their own credit cards. In effect, credit card balances and card usage (both debit and credit) at point of sales increased by 18% and 12% respectively, while the number of credit cards in issue went up by nearly 20%. Overall, the net contribution of the credit card business rose by nearly 50% in FY 2011 while
visibility on the market should boost its foreign currency deposit garnering capacity.
International operations
SBM India On account of the bright prospects being offered by the Indian economy, significant attention and resources are being devoted to SBM India operations. Indeed, alongside a major upgrade in human resource capacity in SBM India, some USD 33 million additional capital has been injected therein to boost its lending and deposit mobilisation capacity. The strategy has paid off with the loan book nearly doubling and deposits increasing at a strong pace. Going forward, SBM will be evaluating the prospects opened by the decision of the RBI to review the guidelines that govern foreign banks’ presence in India and will adjust its strategy accordingly, if required.
SBM MadagascarGiven the uncertainty surrounding the Madagascar economy with the prevailing political impasse, the focus has been more on consolidating operations and preserving asset quality rather than aggressively growing the advances book. Consequently provision for impairment was lower in the current year. TreasuryTreasury provides its customers with an extensive suite of financial instruments ranging from plain vanilla to more complex products and in-depth market information. SBM strives to maintain a close relationship with customers to better understand and satisfy their evolving needs.
Currency income remains the key driver of revenue in the line of business of Treasury. Over the previous years, the income stream has been diversified and SBM is now present in the commodities, equities, futures and securities markets. The challenging operating conditions have directly impacted Treasury’s local revenue. Indeed, the domestic economic environment, the complex and difficult external economic climate, the changing financial landscape, subdued demand and
impairment has been maintained at a very low level. The good performance was mainly due to the implementation of various acquisition and usage campaigns, supported by tie-ups with specific merchants, the expansion of the Merchant Discount Programme with the addition of some key retailers, the revamp of the existing Cash Rebate (Cashpaké) programme, the widening of the product range and the rollout of new card designs.
On the acquiring side, a strong rebound has been recorded in the e-commerce business, largely contributing to a more than doubling of card-related fee income, as new lines of business have been underwritten while relationships with e-commerce partners have been reinforced through better customer service and e-gateway availability. Going forward, SBM aims to cement its position as one of the largest players in e-commerce regionally by continuously enhancing the technological platform while maintaining a stringent risk framework. SBM also plans to capitalise on its presence in the Indian market to explore the booming e-commerce market therein.
The point of sale and mobile recharge businesses, for their part, recorded moderate expansion rates in line with a slowdown in domestic consumption and increasingly competitive conditions. To retain and expand its merchant base, SBM has been focusing on value added services such as migrating high traffic outlets to faster response technology and support through proximity to merchants. The launch of the innovative bill payment product, SBM BILLPAY, which enables the settling of electricity and phone bills on SBM ATMs and selected POS terminals and retailers, has also provided a competitive advantage in the POS merchant acquiring market while generating fee income on its own. In coming periods, SBM will increasingly focus on similar innovations to provide increased convenience to clients for their payments services.
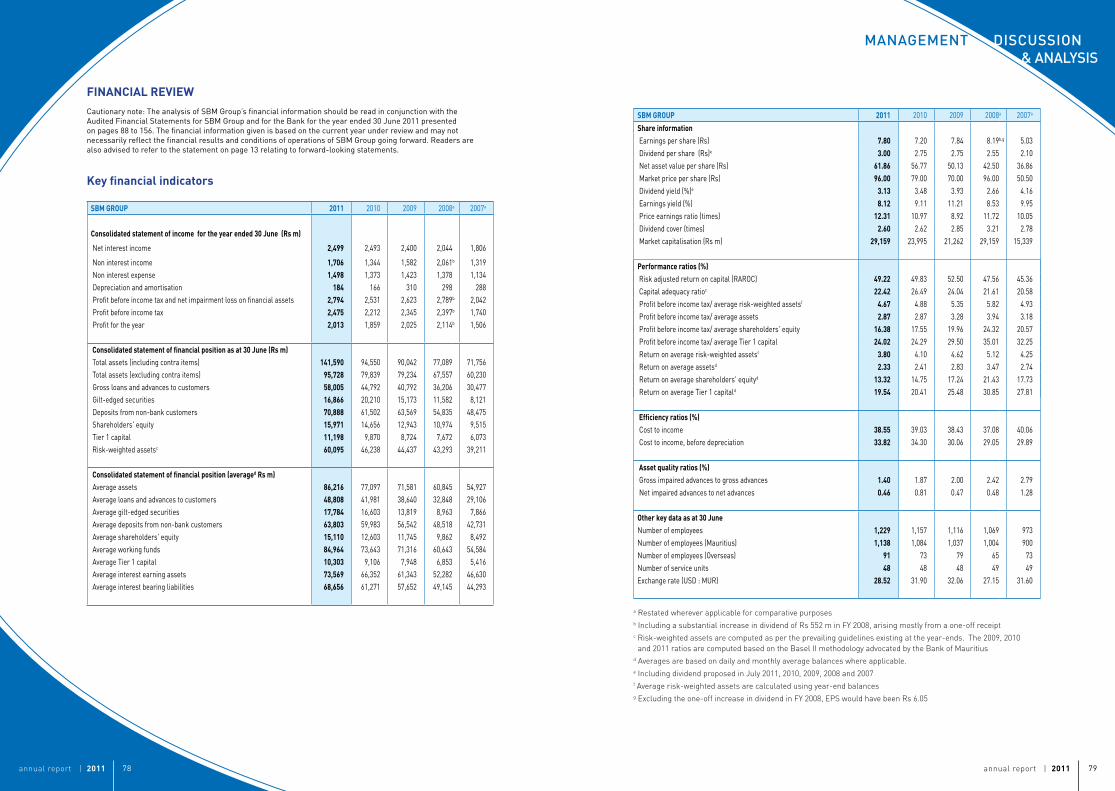
annual report | 2011 79annual report | 2011 78
ManageMenT diScUSSion & analySiS
FINANCIALREVIEW
Keyfinancialindicators
Cautionary note: The analysis of SBM Group’s financial information should be read in conjunction with the Audited Financial Statements for SBM Group and for the Bank for the year ended 30 June 2011 presented on pages 88 to 156. The financial information given is based on the current year under review and may not necessarily reflect the financial results and conditions of operations of SBM Group going forward. Readers are also advised to refer to the statement on page 13 relating to forward-looking statements.
a Restated wherever applicable for comparative purposes b Including a substantial increase in dividend of Rs 552 m in FY 2008, arising mostly from a one-off receipt c Risk-weighted assets are computed as per the prevailing guidelines existing at the year-ends. The 2009, 2010
and 2011 ratios are computed based on the Basel II methodology advocated by the Bank of Mauritius d Averages are based on daily and monthly average balances where applicable.e Including dividend proposed in July 2011, 2010, 2009, 2008 and 2007f Average risk-weighted assets are calculated using year-end balances g Excluding the one-off increase in dividend in FY 2008, EPS would have been Rs 6.05
SBMGROUP 2011 2010 2009 2008a 2007a
Shareinformation Earnings per share (Rs) 7.80 7.20 7.84 8.19 b,g 5.03 Dividend per share (Rs)e 3.00 2.75 2.75 2.55 2.10 Net asset value per share (Rs) 61.86 56.77 50.13 42.50 36.86 Market price per share (Rs) 96.00 79.00 70.00 96.00 50.50 Dividend yield (%)e 3.13 3.48 3.93 2.66 4.16 Earnings yield (%) 8.12 9.11 11.21 8.53 9.95 Price earnings ratio (times) 12.31 10.97 8.92 11.72 10.05 Dividend cover (times) 2.60 2.62 2.85 3.21 2.78 Market capitalisation (Rs m) 29,159 23,995 21,262 29,159 15,339
Performanceratios(%) Risk adjusted return on capital (RAROC) 49.22 49.83 52.50 47.56 45.36 Capital adequacy ratioc 22.42 26.49 24.04 21.61 20.58 Profit before income tax/ average risk-weighted assetsf 4.67 4.88 5.35 5.82 4.93 Profit before income tax/ average assets 2.87 2.87 3.28 3.94 3.18 Profit before income tax/ average shareholders' equity 16.38 17.55 19.96 24.32 20.57 Profit before income tax/ average Tier 1 capital 24.02 24.29 29.50 35.01 32.25 Return on average risk-weighted assetsf 3.80 4.10 4.62 5.12 4.25 Return on average assetsd 2.33 2.41 2.83 3.47 2.74 Return on average shareholders' equityd 13.32 14.75 17.24 21.43 17.73 Return on average Tier 1 capitald 19.54 20.41 25.48 30.85 27.81
Efficiencyratios(%) Cost to income 38.55 39.03 38.43 37.08 40.06 Cost to income, before depreciation 33.82 34.30 30.06 29.05 29.89
Assetqualityratios(%) Gross impaired advances to gross advances 1.40 1.87 2.00 2.42 2.79 Net impaired advances to net advances 0.46 0.81 0.47 0.48 1.28
Otherkeydataasat30JuneNumber of employees 1,229 1,157 1,116 1,069 973 Number of employees (Mauritius) 1,138 1,084 1,037 1,004 900 Number of employees (Overseas) 91 73 79 65 73 Number of service units 48 48 48 49 49 Exchange rate (USD : MUR) 28.52 31.90 32.06 27.15 31.60
SBMGROUP 2011 2010 2009 2008a 2007a
Consolidatedstatementofincomefortheyearended30June(Rsm)
Net interest income 2,499 2,493 2,400 2,044 1,806
Non interest income 1,706 1,344 1,582 2,061b 1,319 Non interest expense 1,498 1,373 1,423 1,378 1,134 Depreciation and amortisation 184 166 310 298 288 Profit before income tax and net impairment loss on financial assets 2,794 2,531 2,623 2,789b 2,042 Profit before income tax 2,475 2,212 2,345 2,397b 1,740 Profit for the year 2,013 1,859 2,025 2,114b 1,506
Consolidatedstatementoffinancialpositionasat30June(Rsm) Total assets (including contra items) 141,590 94,550 90,042 77,089 71,756 Total assets (excluding contra items) 95,728 79,839 79,234 67,557 60,230 Gross loans and advances to customers 58,005 44,792 40,792 36,206 30,477 Gilt-edged securities 16,866 20,210 15,173 11,582 8,121 Deposits from non-bank customers 70,888 61,502 63,569 54,835 48,475 Shareholders' equity 15,971 14,656 12,943 10,974 9,515 Tier 1 capital 11,198 9,870 8,724 7,672 6,073 Risk-weighted assetsc 60,095 46,238 44,437 43,293 39,211
Consolidatedstatementoffinancialposition(averagedRsm) Average assets 86,216 77,097 71,581 60,845 54,927 Average loans and advances to customers 48,808 41,981 38,640 32,848 29,106 Average gilt-edged securities 17,784 16,603 13,819 8,963 7,866 Average deposits from non-bank customers 63,803 59,983 56,542 48,518 42,731 Average shareholders' equity 15,110 12,603 11,745 9,862 8,492 Average working funds 84,964 73,643 71,316 60,643 54,584 Average Tier 1 capital 10,303 9,106 7,948 6,853 5,416 Average interest earning assets 73,569 66,352 61,343 52,282 46,630 Average interest bearing liabilities 68,656 61,271 57,652 49,145 44,293
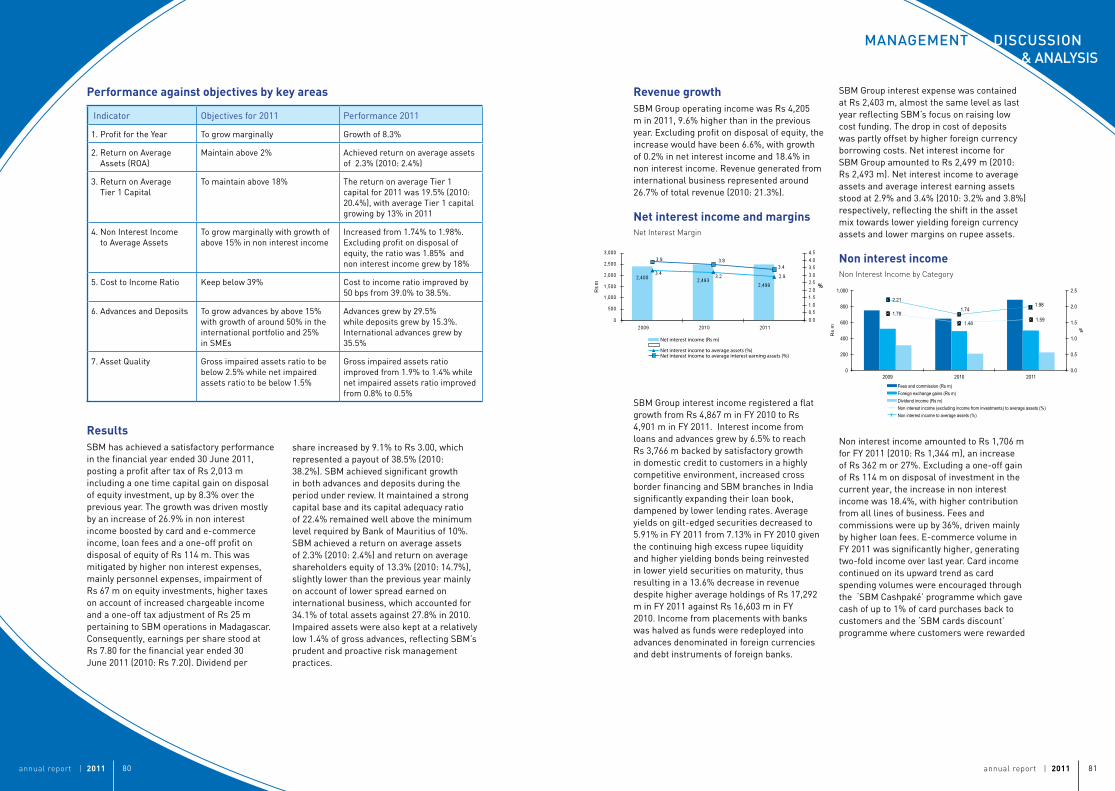
annual report | 2011 81annual report | 2011 80
ManageMenT diScUSSion & analySiS
Performanceagainstobjectivesbykeyareas
Indicator Objectives for 2011 Performance 2011
1. Profit for the Year To grow marginally Growth of 8.3%
2. Return on Average Assets (ROA)
Maintain above 2% Achieved return on average assets of 2.3% (2010: 2.4%)
3. Return on Average Tier 1 Capital
To maintain above 18% The return on average Tier 1 capital for 2011 was 19.5% (2010: 20.4%), with average Tier 1 capital growing by 13% in 2011
4. Non Interest Income to Average Assets
To grow marginally with growth of above 15% in non interest income
Increased from 1.74% to 1.98%. Excluding profit on disposal of equity, the ratio was 1.85% and non interest income grew by 18%
5. Cost to Income Ratio Keep below 39% Cost to income ratio improved by 50 bps from 39.0% to 38.5%.
6. Advances and Deposits To grow advances by above 15% with growth of around 50% in the international portfolio and 25% in SMEs
Advances grew by 29.5% while deposits grew by 15.3%. International advances grew by 35.5%
7. Asset Quality Gross impaired assets ratio to be below 2.5% while net impaired assets ratio to be below 1.5%
Gross impaired assets ratio improved from 1.9% to 1.4% while net impaired assets ratio improved from 0.8% to 0.5%
ResultsSBM has achieved a satisfactory performance in the financial year ended 30 June 2011, posting a profit after tax of Rs 2,013 m including a one time capital gain on disposal of equity investment, up by 8.3% over the previous year. The growth was driven mostly by an increase of 26.9% in non interest income boosted by card and e-commerce income, loan fees and a one-off profit on disposal of equity of Rs 114 m. This was mitigated by higher non interest expenses, mainly personnel expenses, impairment of Rs 67 m on equity investments, higher taxes on account of increased chargeable income and a one-off tax adjustment of Rs 25 m pertaining to SBM operations in Madagascar. Consequently, earnings per share stood at Rs 7.80 for the financial year ended 30 June 2011 (2010: Rs 7.20). Dividend per
RevenuegrowthSBM Group operating income was Rs 4,205 m in 2011, 9.6% higher than in the previous year. Excluding profit on disposal of equity, the increase would have been 6.6%, with growth of 0.2% in net interest income and 18.4% in non interest income. Revenue generated from international business represented around 26.7% of total revenue (2010: 21.3%).
NetinterestincomeandmarginsNet Interest Margin
SBM Group interest income registered a flat growth from Rs 4,867 m in FY 2010 to Rs 4,901 m in FY 2011. Interest income from loans and advances grew by 6.5% to reach Rs 3,766 m backed by satisfactory growth in domestic credit to customers in a highly competitive environment, increased cross border financing and SBM branches in India significantly expanding their loan book, dampened by lower lending rates. Average yields on gilt-edged securities decreased to 5.91% in FY 2011 from 7.13% in FY 2010 given the continuing high excess rupee liquidity and higher yielding bonds being reinvested in lower yield securities on maturity, thus resulting in a 13.6% decrease in revenue despite higher average holdings of Rs 17,292 m in FY 2011 against Rs 16,603 m in FY 2010. Income from placements with banks was halved as funds were redeployed into advances denominated in foreign currencies and debt instruments of foreign banks.
SBM Group interest expense was contained at Rs 2,403 m, almost the same level as last year reflecting SBM’s focus on raising low cost funding. The drop in cost of deposits was partly offset by higher foreign currency borrowing costs. Net interest income for SBM Group amounted to Rs 2,499 m (2010: Rs 2,493 m). Net interest income to average assets and average interest earning assets stood at 2.9% and 3.4% (2010: 3.2% and 3.8%) respectively, reflecting the shift in the asset mix towards lower yielding foreign currency assets and lower margins on rupee assets.
NoninterestincomeNon Interest Income by Category
Non interest income amounted to Rs 1,706 m for FY 2011 (2010: Rs 1,344 m), an increase of Rs 362 m or 27%. Excluding a one-off gain of Rs 114 m on disposal of investment in the current year, the increase in non interest income was 18.4%, with higher contribution from all lines of business. Fees and commissions were up by 36%, driven mainly by higher loan fees. E-commerce volume in FY 2011 was significantly higher, generating two-fold income over last year. Card income continued on its upward trend as card spending volumes were encouraged through the ‘SBM Cashpaké’ programme which gave cash of up to 1% of card purchases back to customers and the ‘SBM cards discount’ programme where customers were rewarded
Net interest income (Rs m)
Net interest income to average assets (%)Net interest income to average interest earning assets (%)
Impaired advances (Rs m)Speci�c allowance held (Rs m)Portfolio allowance held (Rs m)Net impaired advances/Net advances (%)Gross impaired advances/Gross advances (%)
Tier 1 Capital (Rs m)Tier 1 Capital ratio (%)
Tier 2 Capital (Rs m)Capital adequacy ratio (%)
1.78
1.48 1.59
2.21
1.74 1.98
0.0
0.5
1.0
1.5
2.0
2.5
0
200
400
600
800
1,000
2009 2010 2011
%
Rs
m
Non interest income by category
Fees and commission (Rs m) Foreign exchange gains (Rs m) Dividend income (Rs m) Non interest income (excluding income from investments) to average assets (%) Non interest income to average assets (%)
37.5
38.0
38.5
39.0
39.5
40.0
0
200
400
600
800
1,000
2009 2010 2011
%
Rs
m
Non interest expense by category
Personnel expenses (Rs m) Other expenses (Rs m) Depreciation and amortisation (Rs m) Cost to income ratio (%)
share increased by 9.1% to Rs 3.00, which represented a payout of 38.5% (2010: 38.2%). SBM achieved significant growth in both advances and deposits during the period under review. It maintained a strong capital base and its capital adequacy ratio of 22.4% remained well above the minimum level required by Bank of Mauritius of 10%. SBM achieved a return on average assets of 2.3% (2010: 2.4%) and return on average shareholders equity of 13.3% (2010: 14.7%), slightly lower than the previous year mainly on account of lower spread earned on international business, which accounted for 34.1% of total assets against 27.8% in 2010. Impaired assets were also kept at a relatively low 1.4% of gross advances, reflecting SBM’s prudent and proactive risk management practices.
Net interest income (Rs m)
Net interest income to average assets (%)Net interest income to average interest earning assets (%)
Impaired advances (Rs m)Speci�c allowance held (Rs m)Portfolio allowance held (Rs m)Net impaired advances/Net advances (%)Gross impaired advances/Gross advances (%)
Tier 1 Capital (Rs m)Tier 1 Capital ratio (%)
Tier 2 Capital (Rs m)Capital adequacy ratio (%)
1.78
1.48 1.59
2.21
1.74 1.98
0.0
0.5
1.0
1.5
2.0
2.5
0
200
400
600
800
1,000
2009 2010 2011
%
Rs
m
Non interest income by category
Fees and commission (Rs m) Foreign exchange gains (Rs m) Dividend income (Rs m) Non interest income (excluding income from investments) to average assets (%) Non interest income to average assets (%)
37.5
38.0
38.5
39.0
39.5
40.0
0
200
400
600
800
1,000
2009 2010 2011
%
Rs
m
Non interest expense by category
Personnel expenses (Rs m) Other expenses (Rs m) Depreciation and amortisation (Rs m) Cost to income ratio (%)
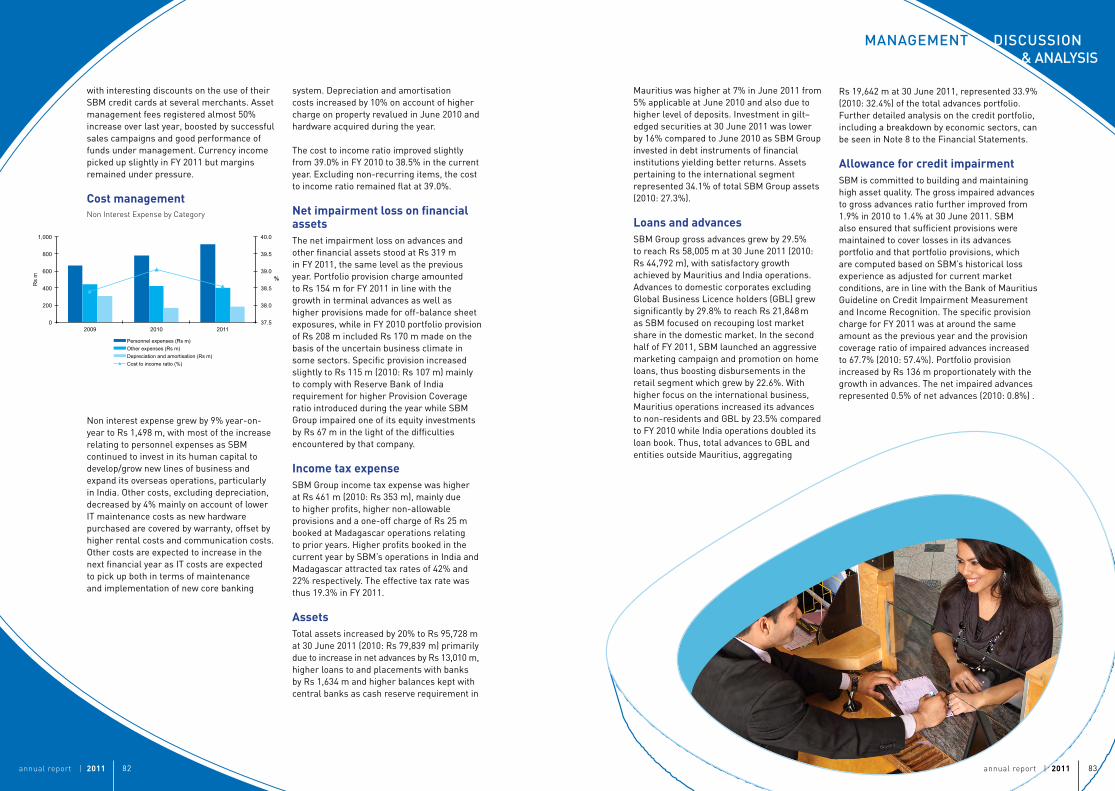
annual report | 2011 83annual report | 2011 82
ManageMenT diScUSSion & analySiS
with interesting discounts on the use of their SBM credit cards at several merchants. Asset management fees registered almost 50% increase over last year, boosted by successful sales campaigns and good performance of funds under management. Currency income picked up slightly in FY 2011 but margins remained under pressure.
CostmanagementNon Interest Expense by Category
Non interest expense grew by 9% year-on-year to Rs 1,498 m, with most of the increase relating to personnel expenses as SBM continued to invest in its human capital to develop/grow new lines of business and expand its overseas operations, particularly in India. Other costs, excluding depreciation, decreased by 4% mainly on account of lower IT maintenance costs as new hardware purchased are covered by warranty, offset by higher rental costs and communication costs. Other costs are expected to increase in the next financial year as IT costs are expected to pick up both in terms of maintenance and implementation of new core banking
system. Depreciation and amortisation costs increased by 10% on account of higher charge on property revalued in June 2010 and hardware acquired during the year.
The cost to income ratio improved slightly from 39.0% in FY 2010 to 38.5% in the current year. Excluding non-recurring items, the cost to income ratio remained flat at 39.0%.
NetimpairmentlossonfinancialassetsThe net impairment loss on advances and other financial assets stood at Rs 319 m in FY 2011, the same level as the previous year. Portfolio provision charge amounted to Rs 154 m for FY 2011 in line with the growth in terminal advances as well as higher provisions made for off-balance sheet exposures, while in FY 2010 portfolio provision of Rs 208 m included Rs 170 m made on the basis of the uncertain business climate in some sectors. Specific provision increased slightly to Rs 115 m (2010: Rs 107 m) mainly to comply with Reserve Bank of India requirement for higher Provision Coverage ratio introduced during the year while SBM Group impaired one of its equity investments by Rs 67 m in the light of the difficulties encountered by that company.
IncometaxexpenseSBM Group income tax expense was higher at Rs 461 m (2010: Rs 353 m), mainly due to higher profits, higher non-allowable provisions and a one-off charge of Rs 25 m booked at Madagascar operations relating to prior years. Higher profits booked in the current year by SBM’s operations in India and Madagascar attracted tax rates of 42% and 22% respectively. The effective tax rate was thus 19.3% in FY 2011.
AssetsTotal assets increased by 20% to Rs 95,728 m at 30 June 2011 (2010: Rs 79,839 m) primarily due to increase in net advances by Rs 13,010 m, higher loans to and placements with banks by Rs 1,634 m and higher balances kept with central banks as cash reserve requirement in
Mauritius was higher at 7% in June 2011 from 5% applicable at June 2010 and also due to higher level of deposits. Investment in gilt–edged securities at 30 June 2011 was lower by 16% compared to June 2010 as SBM Group invested in debt instruments of financial institutions yielding better returns. Assets pertaining to the international segment represented 34.1% of total SBM Group assets (2010: 27.3%).
LoansandadvancesSBM Group gross advances grew by 29.5% to reach Rs 58,005 m at 30 June 2011 (2010: Rs 44,792 m), with satisfactory growth achieved by Mauritius and India operations. Advances to domestic corporates excluding Global Business Licence holders (GBL) grew significantly by 29.8% to reach Rs 21,848m as SBM focused on recouping lost market share in the domestic market. In the second half of FY 2011, SBM launched an aggressive marketing campaign and promotion on home loans, thus boosting disbursements in the retail segment which grew by 22.6%. With higher focus on the international business, Mauritius operations increased its advances to non-residents and GBL by 23.5% compared to FY 2010 while India operations doubled its loan book. Thus, total advances to GBL and entities outside Mauritius, aggregating
Net interest income (Rs m)
Net interest income to average assets (%)Net interest income to average interest earning assets (%)
Impaired advances (Rs m)Speci�c allowance held (Rs m)Portfolio allowance held (Rs m)Net impaired advances/Net advances (%)Gross impaired advances/Gross advances (%)
Tier 1 Capital (Rs m)Tier 1 Capital ratio (%)
Tier 2 Capital (Rs m)Capital adequacy ratio (%)
1.78
1.48 1.59
2.21
1.74 1.98
0.0
0.5
1.0
1.5
2.0
2.5
0
200
400
600
800
1,000
2009 2010 2011
%
Rs
m
Non interest income by category
Fees and commission (Rs m) Foreign exchange gains (Rs m) Dividend income (Rs m) Non interest income (excluding income from investments) to average assets (%) Non interest income to average assets (%)
37.5
38.0
38.5
39.0
39.5
40.0
0
200
400
600
800
1,000
2009 2010 2011
%
Rs
m
Non interest expense by category
Personnel expenses (Rs m) Other expenses (Rs m) Depreciation and amortisation (Rs m) Cost to income ratio (%)
Rs 19,642 m at 30 June 2011, represented 33.9% (2010: 32.4%) of the total advances portfolio. Further detailed analysis on the credit portfolio, including a breakdown by economic sectors, can be seen in Note 8 to the Financial Statements.
AllowanceforcreditimpairmentSBM is committed to building and maintaining high asset quality. The gross impaired advances to gross advances ratio further improved from 1.9% in 2010 to 1.4% at 30 June 2011. SBM also ensured that sufficient provisions were maintained to cover losses in its advances portfolio and that portfolio provisions, which are computed based on SBM’s historical loss experience as adjusted for current market conditions, are in line with the Bank of Mauritius Guideline on Credit Impairment Measurement and Income Recognition. The specific provision charge for FY 2011 was at around the same amount as the previous year and the provision coverage ratio of impaired advances increased to 67.7% (2010: 57.4%). Portfolio provision increased by Rs 136 m proportionately with the growth in advances. The net impaired advances represented 0.5% of net advances (2010: 0.8%) .
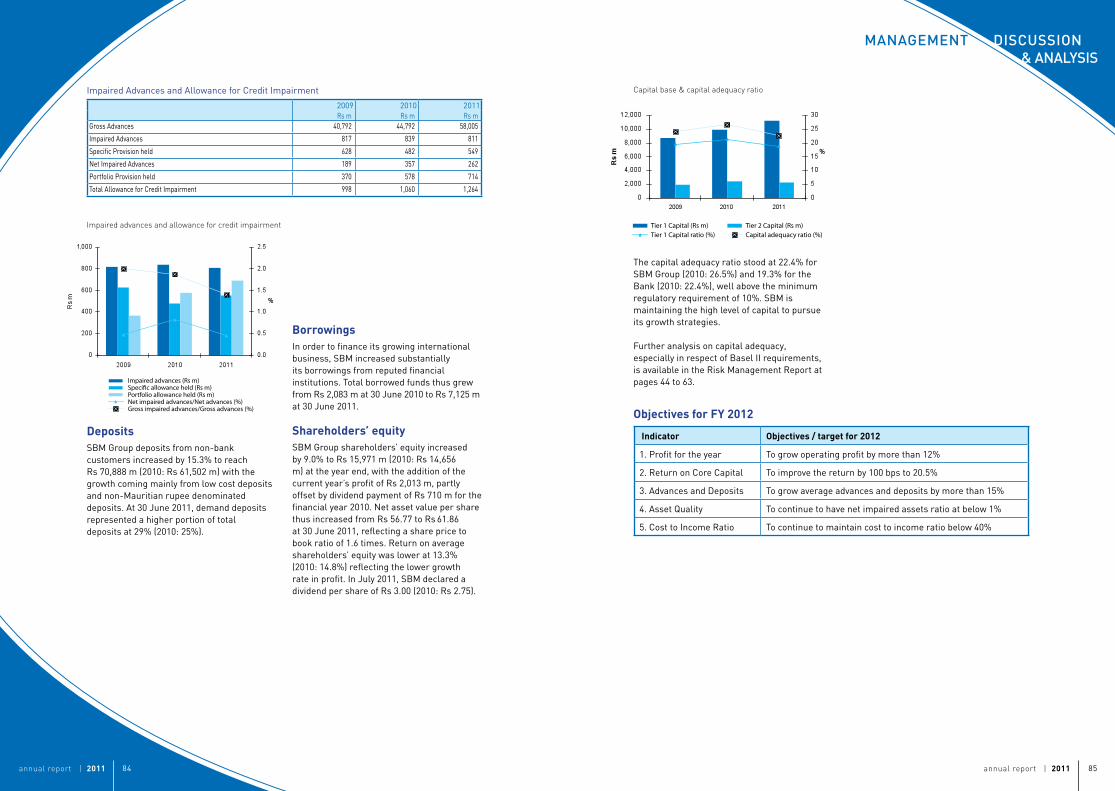
annual report | 2011 85annual report | 2011 84
ManageMenT diScUSSion & analySiS
Impaired Advances and Allowance for Credit Impairment
2009 2010 2011Rs m Rs m Rs m
Gross Advances 40,792 44,792 58,005
Impaired Advances 817 839 811
Specific Provision held 628 482 549
Net Impaired Advances 189 357 262
Portfolio Provision held 370 578 714
Total Allowance for Credit Impairment 998 1,060 1,264
Impaired advances and allowance for credit impairment
BorrowingsIn order to finance its growing international business, SBM increased substantially its borrowings from reputed financial institutions. Total borrowed funds thus grew from Rs 2,083 m at 30 June 2010 to Rs 7,125 m at 30 June 2011.
Shareholders’equitySBM Group shareholders’ equity increased by 9.0% to Rs 15,971 m (2010: Rs 14,656 m) at the year end, with the addition of the current year’s profit of Rs 2,013 m, partly offset by dividend payment of Rs 710 m for the financial year 2010. Net asset value per share thus increased from Rs 56.77 to Rs 61.86 at 30 June 2011, reflecting a share price to book ratio of 1.6 times. Return on average shareholders’ equity was lower at 13.3% (2010: 14.8%) reflecting the lower growth rate in profit. In July 2011, SBM declared a dividend per share of Rs 3.00 (2010: Rs 2.75).
DepositsSBM Group deposits from non-bank customers increased by 15.3% to reach Rs 70,888 m (2010: Rs 61,502 m) with the growth coming mainly from low cost deposits and non-Mauritian rupee denominated deposits. At 30 June 2011, demand deposits represented a higher portion of total deposits at 29% (2010: 25%).
Capital base & capital adequacy ratio
The capital adequacy ratio stood at 22.4% for SBM Group (2010: 26.5%) and 19.3% for the Bank (2010: 22.4%), well above the minimum regulatory requirement of 10%. SBM is maintaining the high level of capital to pursue its growth strategies.
Further analysis on capital adequacy, especially in respect of Basel II requirements, is available in the Risk Management Report at pages 44 to 63.
Net interest income (Rs m)
Net interest income to average assets (%)Net interest income to average interest earning assets (%)
Impaired advances (Rs m)Speci�c allowance held (Rs m)Portfolio allowance held (Rs m)Net impaired advances/Net advances (%)Gross impaired advances/Gross advances (%)
Tier 1 Capital (Rs m)Tier 1 Capital ratio (%)
Tier 2 Capital (Rs m)Capital adequacy ratio (%)
1.78
1.48 1.59
2.21
1.74 1.98
0.0
0.5
1.0
1.5
2.0
2.5
0
200
400
600
800
1,000
2009 2010 2011
%
Rs
m
Non interest income by category
Fees and commission (Rs m) Foreign exchange gains (Rs m) Dividend income (Rs m) Non interest income (excluding income from investments) to average assets (%) Non interest income to average assets (%)
37.5
38.0
38.5
39.0
39.5
40.0
0
200
400
600
800
1,000
2009 2010 2011
%
Rs
m
Non interest expense by category
Personnel expenses (Rs m) Other expenses (Rs m) Depreciation and amortisation (Rs m) Cost to income ratio (%)
ObjectivesforFY2012
Indicator Objectives/targetfor2012
1. Profit for the year To grow operating profit by more than 12%
2. Return on Core Capital To improve the return by 100 bps to 20.5%
3. Advances and Deposits To grow average advances and deposits by more than 15%
4. Asset Quality To continue to have net impaired assets ratio at below 1%
5. Cost to Income Ratio To continue to maintain cost to income ratio below 40%

re
p
t
s
l
dre with our Homeloan & Mortgage solutions
Our desire: build your
ams
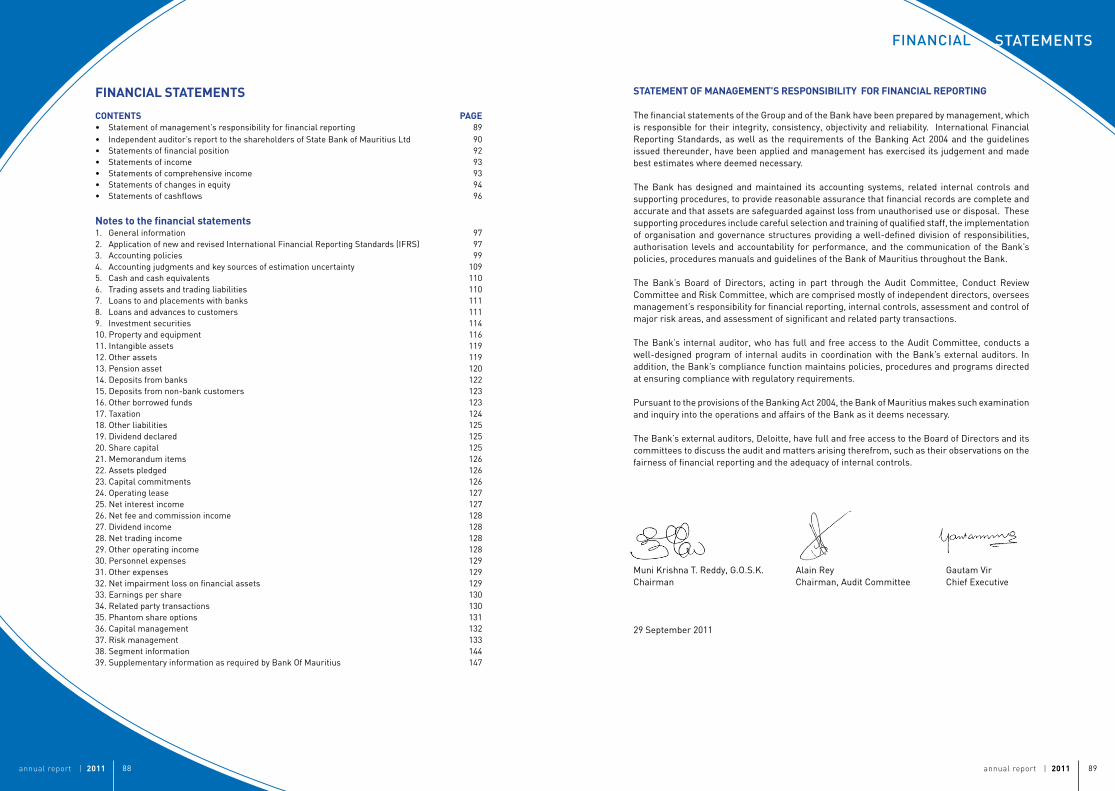
annual report | 2011 89annual report | 2011 88
STaTeMenTSFinancial
STATEMENTOFMANAGEMENT’SRESPONSIBILITYFORFINANCIALREPORTING
The financial statements of the Group and of the Bank have been prepared by management, which is responsible for their integrity, consistency, objectivity and reliability. International Financial Reporting Standards, as well as the requirements of the Banking Act 2004 and the guidelines issued thereunder, have been applied and management has exercised its judgement and made best estimates where deemed necessary.
The Bank has designed and maintained its accounting systems, related internal controls and supporting procedures, to provide reasonable assurance that financial records are complete and accurate and that assets are safeguarded against loss from unauthorised use or disposal. These supporting procedures include careful selection and training of qualified staff, the implementation of organisation and governance structures providing a well-defined division of responsibilities, authorisation levels and accountability for performance, and the communication of the Bank’s policies, procedures manuals and guidelines of the Bank of Mauritius throughout the Bank.
The Bank’s Board of Directors, acting in part through the Audit Committee, Conduct Review Committee and Risk Committee, which are comprised mostly of independent directors, oversees management’s responsibility for financial reporting, internal controls, assessment and control of major risk areas, and assessment of significant and related party transactions.
The Bank’s internal auditor, who has full and free access to the Audit Committee, conducts a well-designed program of internal audits in coordination with the Bank’s external auditors. In addition, the Bank’s compliance function maintains policies, procedures and programs directed at ensuring compliance with regulatory requirements.
Pursuant to the provisions of the Banking Act 2004, the Bank of Mauritius makes such examination and inquiry into the operations and affairs of the Bank as it deems necessary.
The Bank’s external auditors, Deloitte, have full and free access to the Board of Directors and its committees to discuss the audit and matters arising therefrom, such as their observations on the fairness of financial reporting and the adequacy of internal controls.
Muni Krishna T. Reddy, G.O.S.K. Alain Rey Gautam VirChairman Chairman, Audit Committee Chief Executive
29 September 2011
FINANCIALSTATEMENTS
CONTENTS PAGE• Statement of management’s responsibility for financial reporting 89• Independent auditor’s report to the shareholders of State Bank of Mauritius Ltd 90• Statements of financial position 92• Statements of income 93• Statements of comprehensive income 93• Statements of changes in equity 94• Statements of cashflows 96
Notestothefinancialstatements1. General information 972. Application of new and revised International Financial Reporting Standards (IFRS) 973. Accounting policies 994. Accounting judgments and key sources of estimation uncertainty 1095. Cash and cash equivalents 1106. Trading assets and trading liabilities 1107. Loans to and placements with banks 1118. Loans and advances to customers 1119. Investment securities 11410. Property and equipment 11611. Intangible assets 11912. Other assets 11913. Pension asset 12014. Deposits from banks 12215. Deposits from non-bank customers 12316. Other borrowed funds 12317. Taxation 12418. Other liabilities 12519. Dividend declared 12520. Share capital 12521. Memorandum items 12622. Assets pledged 12623. Capital commitments 12624. Operating lease 12725. Net interest income 12726. Net fee and commission income 12827. Dividend income 12828. Net trading income 12829. Other operating income 12830. Personnel expenses 12931. Other expenses 12932. Net impairment loss on financial assets 12933. Earnings per share 13034. Related party transactions 13035. Phantom share options 13136. Capital management 13237. Risk management 13338. Segment information 14439. Supplementary information as required by Bank Of Mauritius 147
annual report | 2011 91annual report | 2011 90
STaTeMenTSFinancial
INDEPENDENTAUDITOR’SREPORTTOTHESHAREHOLDERSOFSTATEBANKOFMAURITIUSLTDThis report is made solely to the shareholders of State Bank of Mauritius Ltd (the “Bank”), as a body, in accordance with section 205 of the Mauritius Companies Act 2001. Our audit work has been undertaken so that we might state to the Bank’s shareholders those matters we are required to state to them in an auditor’s report and for no other purpose. To the fullest extent permitted by law, we do not accept or assume responsibility to anyone other than the Bank and the Bank’s shareholders as a body, for our audit work, for this report, or for the opinions we have formed.
ReportonthefinancialstatementsWe have audited the financial statements of the Group and of the Bank set out on pages 92 to 156 which comprise the statements of financial position as at 30 June 2011 and the statements of income, statements of comprehensive income, statements of changes in equity and cash flow statements for the year then ended and a summary of significant accounting policies and other explanatory information.
Directors’ responsibility for the financial statementsThe Bank’s directors are responsible for the preparation and fair presentation of these financial statements in accordance with International Financial Reporting Standards and in compliance with the requirements of the Mauritius Companies Act 2001, the Banking Act 2004 and the Financial Reporting Act 2004. They are also responsible for such internal control as they determine is necessary to enable the preparation of financial statements that are free from material misstatement, whether due to fraud or error.
Auditors’ responsibilityOur responsibility is to express an opinion on these financial statements based on our audit. We conducted our audit in accordance with International Standards on Auditing. Those standards require that we comply with ethical requirements and plan and perform the audit to obtain reasonable assurance whether the financial statements are free from material misstatement.
An audit involves performing procedures to obtain audit evidence about the amounts and disclosures in the financial statements. The procedures selected depend on the auditors’ judgment, including the assessment of the risks of material misstatement of the financial statements, whether due to fraud or error. In making those risk assessments, the auditors consider internal control relevant to the Bank’s preparation and fair presentation of the financial statements in order to design audit procedures that are appropriate in the circumstances, but not for the purpose of expressing an opinion on the effectiveness of the Bank’s internal control. An audit also includes evaluating the appropriateness of accounting policies used and the reasonableness of accounting estimates made by the directors, as well as evaluating the overall presentation of the financial statements.
We believe that the audit evidence we have obtained is sufficient and appropriate to provide a basis for our audit opinion.
INDEPENDENTAUDITOR’SREPORTTOTHESHAREHOLDERSOFSTATEBANKOFMAURITIUSLTD(CONT’D)OpinionIn our opinion, the financial statements on pages 92 to 156 give a true and fair view of the financial position of the Group and of the Bank as at 30 June 2011 and of their financial performance and cash flows for the year then ended in accordance with International Financial Reporting Standards and comply with the requirements of the Mauritius Companies Act 2001 applicable to banks and the Financial Reporting Act 2004.
ReportonotherlegalandregulatoryrequirementsMauritius Companies Act 2001We have no relationship with, or interests in, the Bank or any of its subsidiaries, other than in our capacities as auditors and arm’s length dealings in the ordinary course of business.
We have obtained all information and explanations that we have required.
In our opinion, proper accounting records have been kept by the Bank as far as appears from our examination of those records.
Banking Act 2004In our opinion, the financial statements have been prepared on a basis consistent with that of the preceding year and are complete, fair and properly drawn up and comply with the provisions of the Banking Act 2004 and the regulations and guidelines of the Bank of Mauritius.
The explanations or information called for or given to us by the officers or agents of the Bank were satisfactory.
The Financial Reporting Act 2004 The directors are responsible for preparing the Corporate Governance Report and making the disclosures required by Section 8.4 of the Code of Corporate Governance of Mauritius (“Code”). Our responsibility is to report on these disclosures.
In our opinion, the disclosures in the Corporate Governance Report are consistent with the requirements of the Code.
Deloitte M.J. Burgess, ACAChartered Accountants Licensed by FRC
29 September 2011
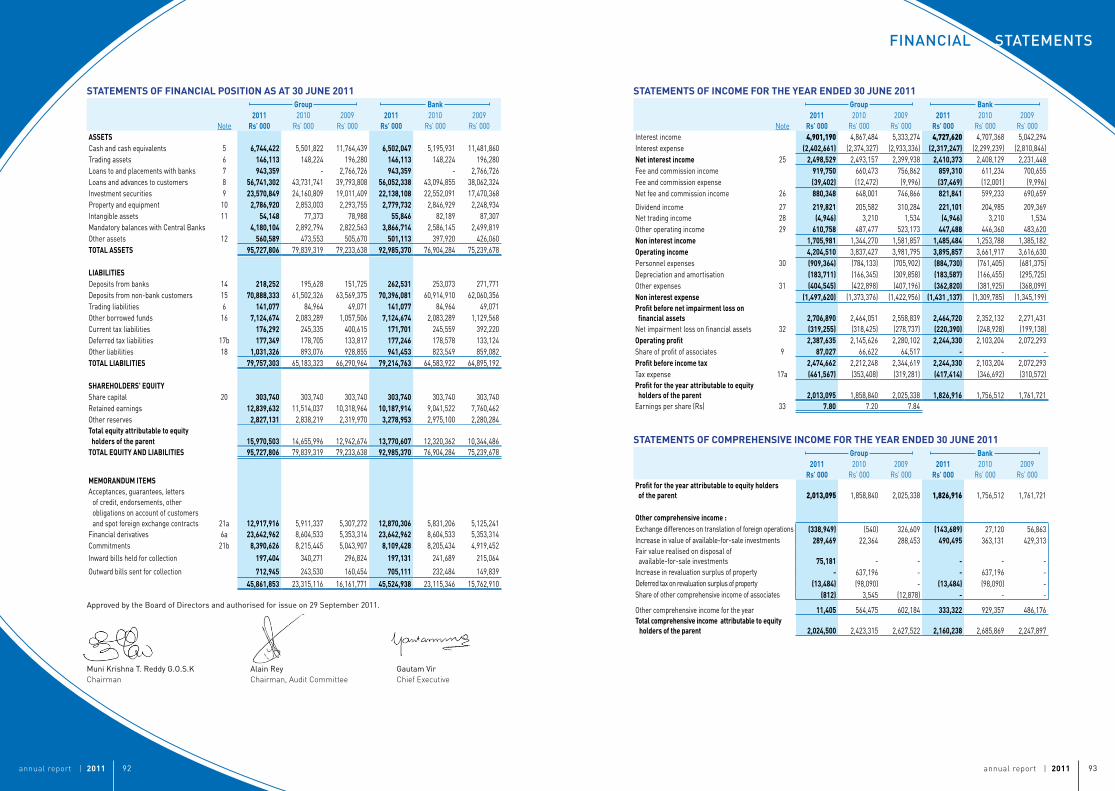
annual report | 2011 93annual report | 2011 92
STaTeMenTSFinancial
STATEMENTSOFFINANCIALPOSITIONASAT30JUNE2011Group Bank
Note2011
Rs’0002010
Rs’ 0002009
Rs’ 0002011
Rs’0002010
Rs’ 0002009
Rs’ 000ASSETSCash and cash equivalents 5 6,744,422 5,501,822 11,764,439 6,502,047 5,195,931 11,481,860Trading assets 6 146,113 148,224 196,280 146,113 148,224 196,280Loans to and placements with banks 7 943,359 - 2,766,726 943,359 - 2,766,726Loans and advances to customers 8 56,741,302 43,731,741 39,793,808 56,052,338 43,094,855 38,062,324Investment securities 9 23,570,849 24,160,809 19,011,409 22,138,108 22,552,091 17,470,368Property and equipment 10 2,786,920 2,853,003 2,293,755 2,779,732 2,846,929 2,248,934Intangible assets 11 54,148 77,373 78,988 55,846 82,189 87,307Mandatory balances with Central Banks 4,180,104 2,892,794 2,822,563 3,866,714 2,586,145 2,499,819Other assets 12 560,589 473,553 505,670 501,113 397,920 426,060TOTALASSETS 95,727,806 79,839,319 79,233,638 92,985,370 76,904,284 75,239,678
LIABILITIESDeposits from banks 14 218,252 195,628 151,725 262,531 253,073 271,771Deposits from non-bank customers 15 70,888,333 61,502,326 63,569,375 70,396,081 60,914,910 62,060,356Trading liabilities 6 141,077 84,964 49,071 141,077 84,964 49,071Other borrowed funds 16 7,124,674 2,083,289 1,057,506 7,124,674 2,083,289 1,129,568Current tax liabilities 176,292 245,335 400,615 171,701 245,559 392,220Deferred tax liabilities 17b 177,349 178,705 133,817 177,246 178,578 133,124Other liabilities 18 1,031,326 893,076 928,855 941,453 823,549 859,082TOTALLIABILITIES 79,757,303 65,183,323 66,290,964 79,214,763 64,583,922 64,895,192
SHAREHOLDERS'EQUITYShare capital 20 303,740 303,740 303,740 303,740 303,740 303,740Retained earnings 12,839,632 11,514,037 10,318,964 10,187,914 9,041,522 7,760,462Other reserves 2,827,131 2,838,219 2,319,970 3,278,953 2,975,100 2,280,284Totalequityattributabletoequityholdersoftheparent 15,970,503 14,655,996 12,942,674 13,770,607 12,320,362 10,344,486TOTALEQUITYANDLIABILITIES 95,727,806 79,839,319 79,233,638 92,985,370 76,904,284 75,239,678
MEMORANDUMITEMSA cceptances, guarantees, letters
of credit, endorsements, other obligations on account of customers and spot foreign exchange contracts 21a 12,917,916 5,911,337 5,307,272 12,870,306 5,831,206 5,125,241
Financial derivatives 6a 23,642,962 8,604,533 5,353,314 23,642,962 8,604,533 5,353,314Commitments 21b 8,390,626 8,215,445 5,043,907 8,109,428 8,205,434 4,919,452Inward bills held for collection 197,404 340,271 296,824 197,131 241,689 215,064
Outward bills sent for collection 712,945 243,530 160,454 705,111 232,484 149,83945,861,853 23,315,116 16,161,771 45,524,938 23,115,346 15,762,910
Approved by the Board of Directors and authorised for issue on 29 September 2011.
Muni Krishna T. Reddy G.O.S.K Alain Rey Gautam VirChairman Chairman, Audit Committee Chief Executive
STATEMENTSOFINCOMEFORTHEYEARENDED30JUNE2011Group Bank
Note2011
Rs’0002010
Rs’ 0002009
Rs’ 0002011
Rs’0002010
Rs’ 0002009
Rs’ 000Interest income 4,901,190 4,867,484 5,333,274 4,727,620 4,707,368 5,042,294Interest expense (2,402,661) (2,374,327) (2,933,336) (2,317,247) (2,299,239) (2,810,846)Netinterestincome 25 2,498,529 2,493,157 2,399,938 2,410,373 2,408,129 2,231,448Fee and commission income 919,750 660,473 756,862 859,310 611,234 700,655Fee and commission expense (39,402) (12,472) (9,996) (37,469) (12,001) (9,996)Net fee and commission income 26 880,348 648,001 746,866 821,841 599,233 690,659
Dividend income 27 219,821 205,582 310,284 221,101 204,985 209,369Net trading income 28 (4,946) 3,210 1,534 (4,946) 3,210 1,534Other operating income 29 610,758 487,477 523,173 447,488 446,360 483,620Noninterestincome 1,705,981 1,344,270 1,581,857 1,485,484 1,253,788 1,385,182Operatingincome 4,204,510 3,837,427 3,981,795 3,895,857 3,661,917 3,616,630Personnel expenses 30 (909,364) (784,133) (705,902) (884,730) (761,405) (681,375)Depreciation and amortisation (183,711) (166,345) (309,858) (183,587) (166,455) (295,725)Other expenses 31 (404,545) (422,898) (407,196) (362,820) (381,925) (368,099)Noninterestexpense (1,497,620) (1,373,376) (1,422,956) (1,431,137) (1,309,785) (1,345,199)Profitbeforenetimpairmentlossonfinancialassets 2,706,890 2,464,051 2,558,839 2,464,720 2,352,132 2,271,431Net impairment loss on financial assets 32 (319,255) (318,425) (278,737) (220,390) (248,928) (199,138)Operatingprofit 2,387,635 2,145,626 2,280,102 2,244,330 2,103,204 2,072,293Share of profit of associates 9 87,027 66,622 64,517 - - - Profitbeforeincometax 2,474,662 2,212,248 2,344,619 2,244,330 2,103,204 2,072,293Tax expense 17a (461,567) (353,408) (319,281) (417,414) (346,692) (310,572)Profitfortheyearattributabletoequityholdersoftheparent 2,013,095 1,858,840 2,025,338 1,826,916 1,756,512 1,761,721Earnings per share (Rs) 33 7.80 7.20 7.84
STATEMENTSOFCOMPREHENSIVEINCOMEFORTHEYEARENDED30JUNE2011Group Bank
2011Rs’000
2010Rs’ 000
2009Rs’ 000
2011Rs’000
2010Rs’ 000
2009Rs’ 000
Profitfortheyearattributabletoequityholdersoftheparent 2,013,095 1,858,840 2,025,338 1,826,916 1,756,512 1,761,721
Othercomprehensiveincome:Exchange differences on translation of foreign operations (338,949) (540) 326,609 (143,689) 27,120 56,863Increase in value of available-for-sale investments 289,469 22,364 288,453 490,495 363,131 429,313Fair value realised on disposal of available-for-sale investments 75,181 - - - - - Increase in revaluation surplus of property - 637,196 - - 637,196 - Deferred tax on revaluation surplus of property (13,484) (98,090) - (13,484) (98,090) - Share of other comprehensive income of associates (812) 3,545 (12,878) - - -
Other comprehensive income for the year 11,405 564,475 602,184 333,322 929,357 486,176Totalcomprehensiveincomeattributabletoequityholdersoftheparent 2,024,500 2,423,315 2,627,522 2,160,238 2,685,869 2,247,897

annual report | 2011 95annual report | 2011 94
STaTeMenTSFinancial
94annual report | 2011
STATEMENTSOFCHANGESINEQUITYFORTHEYEARENDED30JUNE2011 STATEMENTSOFCHANGESINEQUITYFORTHEYEARENDED30JUNE2011(CONT’D)
Shar
eca
pita
lTr
easu
rysh
ares
Stat
utor
yre
serv
eRe
venu
ere
serv
e
Inve
stm
ent
fluct
uatio
nre
serv
e
Net
unre
alis
ed
inve
stm
ent
fair
valu
ere
serv
e
Net
prop
erty
reva
luat
ion
rese
rve
Net
tran
slat
ion
rese
rve
Tota
leq
uity
Rs' 0
00Rs
' 000
Rs' 0
00Rs
' 000
Rs' 0
00Rs
' 000
Rs' 0
00Rs
' 000
Rs' 0
00Ba
nkAt
01
July
2008
303,
740
(2,3
33,2
86)
439,
141
6,64
0,52
035
,122
2,58
3,98
51,
037,
217
48,5
078,
754,
946
Profi
t for
the
year
- -
- 1,
761,
721
- -
- -
1,76
1,72
1Ot
her c
ompr
ehen
sive
inco
me
for t
he ye
ar -
- -
- -
429,
313
- 56
,863
486,
176
Tran
sfer
to re
tain
ed e
arni
ngs
- -
- 26
,280
- -
(26,
280)
- -
Tran
sfer
to st
atut
ory r
eser
ve -
- 9,
702
(9,7
02)
- -
- -
- Di
viden
d -
- -
(658
,357
) -
- -
- (6
58,3
57)
At 3
0 Ju
ne 2
009
303,
740
(2,3
33,2
86)
448,
843
7,76
0,46
235
,122
3,01
3,29
81,
010,
937
105,
370
10,3
44,4
86
At 0
1 Ju
ly 20
0930
3,74
0(2
,333
,286
)44
8,84
37,
760,
462
35,1
223,
013,
298
1,01
0,93
710
5,37
010
,344
,486
Profi
t for
the
year
- -
- 1,
756,
512
- -
- -
1,75
6,51
2Ot
her c
ompr
ehen
sive
inco
me
for t
he ye
ar -
- -
- -
363,
131
539,
106
27,1
2092
9,35
7Am
alga
mat
ion
with
subs
idia
ry -
- -
206,
967
- (2
06,9
67)
- -
- Tr
ansf
er to
reta
ined
ear
ning
s -
- -
27,5
74 -
- (2
7,57
4) -
- Di
viden
d -
- -
(709
,993
) -
- -
- (7
09,9
93)
At 3
0 Ju
ne 2
010
303,
740
(2,3
33,2
86)
448,
843
9,04
1,52
235
,122
3,16
9,46
21,
522,
469
132,
490
12,3
20,3
62
At 0
1 Ju
ly 20
1030
3,74
0(2
,333
,286
)44
8,84
39,
041,
522
35,1
223,
169,
462
1,52
2,46
913
2,49
012
,320
,362
Profi
t for
the
year
--
-1,
826,
916
--
--
1,82
6,91
6Ot
her c
ompr
ehen
sive
inco
me
for t
he ye
ar-
--
--
490,
495
(13,
484)
(143
,689
)33
3,32
2Tr
ansf
er to
reta
ined
ear
ning
s-
--
41,5
32-
-(4
1,53
2)-
-Tr
ansf
er to
stat
utor
y res
erve
--
12,0
63(1
2,06
3)-
--
--
Divid
end
--
-(7
09,9
93)
--
--
(709
,993
)At
30
June
201
130
3,74
0(2
,333
,286
)46
0,90
610
,187
,914
35,1
223,
659,
957
1,46
7,45
3(1
1,19
9)13
,770
,607
Shar
eca
pita
lTr
easu
rysh
ares
Rese
rve
aris
ing
on
shar
eb
uyb
ack
Stat
utor
yre
serv
eRe
venu
ere
serv
e
Inve
stm
ent
fluct
uatio
nre
serv
e
Net
unre
alis
ed
inve
stm
ent
fair
valu
ere
serv
e
Net
prop
erty
reva
luat
ion
rese
rve
Net
tran
slat
ion
rese
rve
Net
ot
her
rese
rve
Tota
leq
uity
Rs' 0
00Rs
' 000
Rs' 0
00Rs
' 000
Rs' 0
00Rs
' 000
Rs' 0
00Rs
' 000
Rs' 0
00Rs
' 000
Rs' 0
00Gr
oup
At 0
1 Ju
ly 20
0830
3,74
0(2
,333
,286
)23
6,07
148
8,63
38,
941,
255
35,1
222,
385,
444
1,03
7,21
7(2
03,5
03)
82,8
1610
,973
,509
Profi
t for
the
year
- -
- -
2,02
5,33
8 -
- -
- -
2,02
5,33
8Ot
her c
ompr
ehen
sive
inco
me
for t
he ye
ar -
- -
- -
- 28
8,45
3 -
326,
609
(12,
878)
602,
184
Tran
sfer
to re
tain
ed e
arni
ngs
- -
- -
26,2
80 -
- (2
6,28
0) -
- -
Tran
sfer
to st
atut
ory r
eser
ve -
- -
15,5
52(1
5,55
2) -
- -
- -
- Di
viden
d -
- -
- (6
58,3
57)
- -
- -
- (6
58,3
57)
At 3
0 Ju
ne 2
009
303,
740
(2,3
33,2
86)
236,
071
504,
185
10,3
18,9
6435
,122
2,67
3,89
71,
010,
937
123,
106
69,9
3812
,942
,674
At 0
1 Ju
ly 20
0930
3,74
0(2
,333
,286
)23
6,07
150
4,18
510
,318
,964
35,1
222,
673,
897
1,01
0,93
712
3,10
669
,938
12,9
42,6
74Pr
ofit f
or th
e ye
ar -
- -
- 1,
858,
840
- -
- -
- 1,
858,
840
Othe
r com
preh
ensiv
e in
com
e fo
r the
year
- -
- -
- -
22,3
6453
9,10
6(5
40)
3,54
556
4,47
5Tr
ansf
er to
reta
ined
ear
ning
s -
- -
(21,
786)
49,3
60 -
- (2
7,57
4) -
- -
Tran
sfer
to st
atut
ory r
eser
ve -
- -
3,13
4(3
,134
) -
- -
- -
- Di
viden
d -
- -
- (7
09,9
93)
- -
- -
- (7
09,9
93)
At 3
0 Ju
ne 2
010
303,
740
(2,3
33,2
86)
236,
071
485,
533
11,5
14,0
3735
,122
2,69
6,26
11,
522,
469
122,
566
73,4
8314
,655
,996
At 0
1 Ju
ly 20
1030
3,74
0(2
,333
,286
)23
6,07
148
5,53
311
,514
,037
35,1
222,
696,
261
1,52
2,46
912
2,56
673
,483
14,6
55,9
96Pr
ofit f
or th
e ye
ar-
--
-2,
013,
095
--
--
-2,
013,
095
Othe
r com
preh
ensiv
e in
com
e fo
r the
year
--
--
--
364,
650
(13,
484)
(338
,949
)(8
12)
11,4
05Tr
ansf
er to
reta
ined
ear
ning
s-
--
-41
,532
--
(41,
532)
--
-Tr
ansf
er to
stat
utor
y res
erve
--
-19
,039
(19,
039)
--
--
--
Divid
end
--
--
(709
,993
)-
--
--
(709
,993
)At
30
June
201
130
3,74
0(2
,333
,286
)23
6,07
150
4,57
212
,839
,632
35,1
223,
060,
911
1,46
7,45
3(2
16,3
83)
72,6
7115
,970
,503
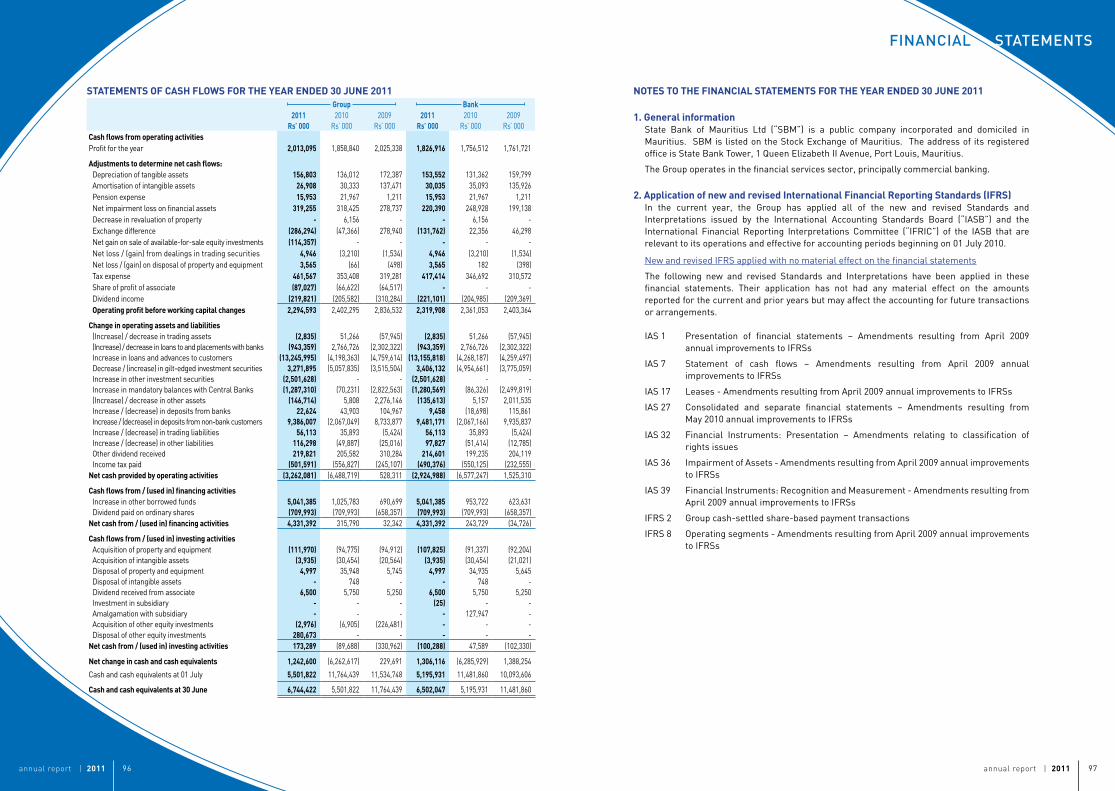
STATEMENTSOFCASHFLOWSFORTHEYEARENDED30JUNE2011Group Bank
2011Rs’000
2010Rs’ 000
2009Rs’ 000
2011Rs’000
2010Rs’ 000
2009Rs’ 000
CashflowsfromoperatingactivitiesProfit for the year 2,013,095 1,858,840 2,025,338 1,826,916 1,756,512 1,761,721
Adjustmentstodeterminenetcashflows:Depreciation of tangible assets 156,803 136,012 172,387 153,552 131,362 159,799Amortisation of intangible assets 26,908 30,333 137,471 30,035 35,093 135,926Pension expense 15,953 21,967 1,211 15,953 21,967 1,211Net impairment loss on financial assets 319,255 318,425 278,737 220,390 248,928 199,138Decrease in revaluation of property - 6,156 - - 6,156 - Exchange difference (286,294) (47,366) 278,940 (131,762) 22,356 46,298Net gain on sale of available-for-sale equity investments (114,357) - - - - - Net loss / (gain) from dealings in trading securities 4,946 (3,210) (1,534) 4,946 (3,210) (1,534)Net loss / (gain) on disposal of property and equipment 3,565 (66) (498) 3,565 182 (398)Tax expense 461,567 353,408 319,281 417,414 346,692 310,572Share of profit of associate (87,027) (66,622) (64,517) - - - Dividend income (219,821) (205,582) (310,284) (221,101) (204,985) (209,369)Operatingprofitbeforeworkingcapitalchanges 2,294,593 2,402,295 2,836,532 2,319,908 2,361,053 2,403,364
Changeinoperatingassetsandliabilities(Increase) / decrease in trading assets (2,835) 51,266 (57,945) (2,835) 51,266 (57,945)(Increase) / decrease in loans to and placements with banks (943,359) 2,766,726 (2,302,322) (943,359) 2,766,726 (2,302,322)Increase in loans and advances to customers (13,245,995) (4,198,363) (4,759,614) (13,155,818) (4,268,187) (4,259,497)Decrease / (increase) in gilt-edged investment securities 3,271,895 (5,057,835) (3,515,504) 3,406,132 (4,954,661) (3,775,059)Increase in other investment securities (2,501,628) - - (2,501,628) - - Increase in mandatory balances with Central Banks (1,287,310) (70,231) (2,822,563) (1,280,569) (86,326) (2,499,819)(Increase) / decrease in other assets (146,714) 5,808 2,276,146 (135,613) 5,157 2,011,535Increase / (decrease) in deposits from banks 22,624 43,903 104,967 9,458 (18,698) 115,861Increase / (decrease) in deposits from non-bank customers 9,386,007 (2,067,049) 8,733,877 9,481,171 (2,067,166) 9,935,837Increase / (decrease) in trading liabilities 56,113 35,893 (5,424) 56,113 35,893 (5,424)Increase / (decrease) in other liabilities 116,298 (49,887) (25,016) 97,827 (51,414) (12,785)Other dividend received 219,821 205,582 310,284 214,601 199,235 204,119Income tax paid (501,591) (556,827) (245,107) (490,376) (550,125) (232,555)
Netcashprovidedbyoperatingactivities (3,262,081) (6,488,719) 528,311 (2,924,988) (6,577,247) 1,525,310
Cashflowsfrom/(usedin)financingactivitiesIncrease in other borrowed funds 5,041,385 1,025,783 690,699 5,041,385 953,722 623,631Dividend paid on ordinary shares (709,993) (709,993) (658,357) (709,993) (709,993) (658,357)
Netcashfrom/(usedin)financingactivities 4,331,392 315,790 32,342 4,331,392 243,729 (34,726)
Cashflowsfrom/(usedin)investingactivitiesAcquisition of property and equipment (111,970) (94,775) (94,912) (107,825) (91,337) (92,204)Acquisition of intangible assets (3,935) (30,454) (20,564) (3,935) (30,454) (21,021)Disposal of property and equipment 4,997 35,948 5,745 4,997 34,935 5,645Disposal of intangible assets - 748 - - 748 - Dividend received from associate 6,500 5,750 5,250 6,500 5,750 5,250Investment in subsidiary - - - (25) - - Amalgamation with subsidiary - - - - 127,947 - Acquisition of other equity investments (2,976) (6,905) (226,481) - - - Disposal of other equity investments 280,673 - - - - -
Netcashfrom/(usedin)investingactivities 173,289 (89,688) (330,962) (100,288) 47,589 (102,330)
Netchangeincashandcashequivalents 1,242,600 (6,262,617) 229,691 1,306,116 (6,285,929) 1,388,254
Cash and cash equivalents at 01 July 5,501,822 11,764,439 11,534,748 5,195,931 11,481,860 10,093,606
Cashandcashequivalentsat30June 6,744,422 5,501,822 11,764,439 6,502,047 5,195,931 11,481,860
annual report | 2011 97annual report | 2011 96
STaTeMenTSFinancial
NOTESTOTHEFINANCIALSTATEMENTSFORTHEYEARENDED30JUNE2011
1.GeneralinformationState Bank of Mauritius Ltd (“SBM”) is a public company incorporated and domiciled in Mauritius. SBM is listed on the Stock Exchange of Mauritius. The address of its registered office is State Bank Tower, 1 Queen Elizabeth II Avenue, Port Louis, Mauritius.
The Group operates in the financial services sector, principally commercial banking.
2.ApplicationofnewandrevisedInternationalFinancialReportingStandards(IFRS)In the current year, the Group has applied all of the new and revised Standards and Interpretations issued by the International Accounting Standards Board (“IASB”) and the International Financial Reporting Interpretations Committee (“IFRIC”) of the IASB that are relevant to its operations and effective for accounting periods beginning on 01 July 2010.
New and revised IFRS applied with no material effect on the financial statements
The following new and revised Standards and Interpretations have been applied in these financial statements. Their application has not had any material effect on the amounts reported for the current and prior years but may affect the accounting for future transactions or arrangements.
IAS 1 Presentation of financial statements – Amendments resulting from April 2009 annual improvements to IFRSs
IAS 7 Statement of cash flows – Amendments resulting from April 2009 annual improvements to IFRSs
IAS 17 Leases - Amendments resulting from April 2009 annual improvements to IFRSs
IAS 27 Consolidated and separate financial statements – Amendments resulting from May 2010 annual improvements to IFRSs
IAS 32 Financial Instruments: Presentation – Amendments relating to classification of rights issues
IAS 36 Impairment of Assets - Amendments resulting from April 2009 annual improvements to IFRSs
IAS 39 Financial Instruments: Recognition and Measurement - Amendments resulting from April 2009 annual improvements to IFRSs
IFRS 2 Group cash-settled share-based payment transactions
IFRS 8 Operating segments - Amendments resulting from April 2009 annual improvements to IFRSs
annual report | 2011 99annual report | 2011 98
STaTeMenTSFinancial
NOTESTOTHEFINANCIALSTATEMENTSFORTHEYEARENDED30JUNE2011(CONT’D)2.ApplicationofnewandrevisedInternationalFinancialReportingStandards(IFRS)
(Cont’d)New and revised IFRS in issue but not yet effectiveAt the date of authorisation of these financial statements, the following relevant standards and Interpretations were in issue but effective on annual periods beginning on or after the respective dates as indicated.
IAS 1 Presentation of financial statements – Amendments resulting from May 2010 annual improvements to IFRSs (effective 1 January 2011)
IAS 1 Presentation of financial statements – Amendments to revise the way other comprehensive income is presented (effective 1 July 2012)
IAS 12 Income taxes – Limited scope amendment (recovery of underlying assets) (effective 1 January 2012)
IAS 19 Employee benefits – Amended standard resulting from the post-employment benefits and termination benefits projects (effective 1 January 2013)
IAS 24 Related party disclosures – Revised definition of related parties (effective 1 January 2011)
IAS 27 Consolidated and separate financial statements – Amendments resulting from May 2010 annual improvements to IFRSs (effective 1 July 2010)
IAS 28 Investments in associates and joint ventures (effective 1 January 2013)
IAS 34 Interim financial reporting – Amendments resulting from May 2010 annual improvements to IFRSs (effective 1 January 2011)
IFRS 7 Financial instruments: Disclosures – Amendments resulting from May 2010 annual improvements to IFRSs (effective 1 January 2011)
IFRS 7 Financial instruments: Disclosures – Amendments enhancing disclosures about transfers of financial assets (effective 1 July 2011)
IFRS 9 Financial instruments – Classification and measurement (effective 1 January 2013)
IFRS 10 Consolidated financial statements (effective 1 January 2013)
IFRS 12 Disclosure of interests in other entities (effective 1 January 2013)
IFRS 13 Fair value measurement (effective 1 January 2013)
IFRIC 14 IAS 19 – Amendment with respect to voluntary prepaid contributions (effective 1 January 2011)
The directors anticipate that these amendments will be applied in the financial statements of the Group and the Company at the above effective dates in future periods. The directors have not yet had an opportunity to consider the potential impact of the application of these amendments.
NOTESTOTHEFINANCIALSTATEMENTSFORTHEYEARENDED30JUNE2011(CONT’D)3.Accountingpolicies
The principal accounting policies adopted by the Group and the Bank are as follows:(a) Basis of preparation
The financial statements have been prepared on the historical cost basis, as modified by the revaluation of certain tangible fixed assets and financial instruments, and in accordance with International Financial Reporting Standards (“IFRSs”) and the guidelines of Bank of Mauritius.
(b) Basis of consolidationThe consolidated financial statements include the state of affairs and results of the Bank and those of its subsidiaries and its associates. Subsidiaries are all entities over which the Group has the power to govern the financial and operating policies, generally accompanying a shareholding of more than one half of the voting rights. The existence and effect of potential voting rights that are currently exercisable are considered when assessing whether the Group controls another entity. Subsidiaries are fully consolidated from the date on which control is transferred to the Group. They are de-consolidated from the date on which control ceases. Intragroup transactions are eliminated on consolidation.
The purchase method of accounting is used to account for the acquisition of subsidiaries by the Group. The cost of an acquisition is measured as the fair value of the assets given, equity instruments issued and liabilities incurred or assumed at the date of exchange. Acquisition-related costs are recognised as an expense in profit or loss as incurred. Identifiable assets acquired and liabilities and contingent liabilities assumed in a business combination are measured initially at their fair values at the acquisition date, irrespective of the extent of any minority interest. The excess of the cost of acquisition over the fair value of the Group’s share of the identifiable net assets acquired is recorded as goodwill. If the cost of acquisition is less than the fair value of the net assets of the subsidiary acquired, the difference is recognised directly in the Statement of income. Goodwill is tested annually for impairment and carried at cost less any accumulated impairment losses.
Associates are all entities over which the Group has significant influence but not control, generally accompanying a shareholding of between 20% to 50% of the voting rights. Investments in associates are accounted for by the equity method of accounting and are initially recognised at cost. The Group’s investment in associates includes goodwill (net of any accumulated impairment loss) identified on acquisition.
The Group’s share of its associates’ post-acquisition profits or losses is recognised in the Statement of income; its share of post-acquisition movements in reserves is recognised in reserves. The cumulative post-acquisition movements are adjusted against the carrying amount of the investment. When the Group’s share of losses in an associate equals or exceeds its interest in the associate, including any other unsecured receivables, the Group does not recognise further losses, unless it has incurred obligations or made payments on behalf of the associate. Gains and losses arising from disposal of investments in associates are recorded as Other operating income in the Statement of income.
It is the policy of the holding company to have a coterminous financial year end for all its operations and subsidiaries except in jurisdictions where regulations impose different dates. However, in such cases, the state of affairs and results of these branches and subsidiaries are consolidated using financial statements drawn up to correspond with the financial year end of the holding Bank.
annual report | 2011 101annual report | 2011 100
STaTeMenTSFinancial
NOTESTOTHEFINANCIALSTATEMENTSFORTHEYEARENDED30JUNE2011(CONT’D)3.Accountingpolicies(Cont’d)(c) Revenue recognition
Revenue is generally recognised on an accrual basis. Interest income is generally recognised on performing interest-earning financial assets using the effective interest method. Dividend income from equity investments is accounted for in the Statement of income when the right to receive payment is established. Fees and commissions are generally recognised on an accrual basis when the service has been provided.
(d) Foreign currency translationAssets, liabilities, income and expense items denominated in other currencies are translated into Mauritian Rupees in accordance with IAS 21.
(i) The assets and liabilities of the overseas branches, subsidiaries and associates denominated in foreign currencies are translated into Mauritian Rupees at the rates of exchange ruling at the reporting date. Their statements of income are translated into Mauritian Rupees at weighted average rates. Any translation differences arising are classified as equity and transferred to the Net translation reserve. Such translation differences are recognised in the Statement of income as part of Other operating income in the period in which the foreign entity is disposed of.
(ii) Transactions denominated in foreign currency are converted at the rate prevailing at the date of the transactions.
(iii) Monetary assets and liabilities denominated in foreign currency at the reporting date are translated into Mauritian Rupees at the rates of exchange ruling at that date.
(iv) Non-monetary assets and liabilities denominated in foreign currency are reported using the exchange rates at the date of the transactions, if carried at cost, or the exchange rates that existed when the fair values were determined, if carried at fair value.
(v) Exchange differences arising on the settlement of monetary items, and on the translation of monetary items, are included in the Statement of income for the period. Exchange differences arising on the translation of non-monetary items carried at fair value are included in the Statement of income for the period except for the differences arising on the translation of non-monetary items in respect of which gains and losses are recognised directly in equity. For such non-monetary items, any exchange component of that gain or loss is also recognised directly in equity.
(vi) Goodwill and fair value adjustments arising on the acquisition of a foreign operation are treated as assets and liabilities of the foreign operation and translated at closing rate.
NOTESTOTHEFINANCIALSTATEMENTSFORTHEYEARENDED30JUNE2011(CONT’D)3.Accountingpolicies(Cont’d)(e) Investment securities(i) Investments in gilt-edged securities
Investments in gilt-edged securities reported under Investment securities are classified in the following categories: Loans-and-Receivables (“L&R”), Held-to-Maturity (“HTM”) and Available-for-Sale (“AFS”). The classification depends on the nature and purpose of the financial assets and is determined at the time of initial recognition. Gilt-edged securities that are not held for trading purposes and that are not quoted in an active market are classified as L&R. Those gilt-edged securities that are purchased on the secondary market and that are not held for trading purposes are classified as HTM where management has the intent and ability to hold the securities to their maturity. Otherwise they are classified as AFS.
Investments in gilt-edged securities are recognised on a trade-date basis and are initially measured at fair value plus transaction costs. At subsequent reporting dates, securities classified as L&R or HTM are measured at amortised cost using the effective interest method, less any impairment loss. The impairment loss for investments carried at amortised cost is measured as the difference between the investment’s carrying amount and the present value of estimated future cash flows, discounted at the investment’s original effective rate.
Securities classified as AFS are subsequently remeasured to fair value based on quoted prices at the reporting date and the unrealised gains and losses on revaluation are recognised directly in equity (Net unrealised investment fair value reserve), until the security is disposed of or is determined to be impaired, at which time the cumulative gain or loss previously recognised in equity in respect of that security is included in the Statement of income as Other operating income. Financial assets are impaired where there is objective evidence that, as a result of one or more events that occurred after the initial recognition of the financial asset, the estimated future cash flows of the investment has been impacted.
The interest accrued on Investment in gilt-edged securities is recorded as Interest Income in the Statement of income and any gains or losses on disposal are recorded as Other operating income.
(ii) Equity investments
In the Bank’s separate financial statements, the equity investments in subsidiaries and associates are classified as AFS and reported under Investment securities in the Statement of financial position. In the Group’s and Bank’s financial statements, other equity investments, which are not classified as trading securities, are reported under Investment securities and classified as AFS. They are recognised on a trade-date basis and are initially measured at fair value plus transaction costs. At subsequent reporting dates, listed equity investments are remeasured at fair value based on quoted prices at that date while the fair value of unlisted equity investments are determined based on valuation techniques. However, AFS equity investments which do not have a quoted market price and whose fair value cannot be reliably measured are subsequently measured at cost less any impairment loss.
annual report | 2011 103annual report | 2011 102
STaTeMenTSFinancial
NOTESTOTHEFINANCIALSTATEMENTSFORTHEYEARENDED30JUNE2011(CONT’D)3.Accountingpolicies(Cont’d)(e) Investment securities (Cont’d)
Unrealised gains and losses are recognised directly in Other comprehensive income, until the investment is disposed of or is determined to be impaired, at which time the cumulative gain or loss previously recognised in Other comprehensive income in respect of that investment is included in the Statement of income as Other operating income. Objective evidence of impairment of an AFS equity investment includes a significant and prolonged decline in the fair value of the security below its cost. Any increase in fair value of an equity investment subsequent to an impairment loss is recognised directly through the Statement of comprehensive income.
(f) Financial assets at Fair Value through Profit or Loss (FVTPL)Financial assets are classified as FVTPL where it is either held for trading or it is designated as FVTPL.
A financial asset is classified as held for trading (HFT) if:
• it has been acquired principally for the purpose of selling in the near future; or
• it is part of a portfolio of identified financial instruments that is managed together and for which there is evidence of a recent actual pattern of short-term profit-taking; or
• it is a derivative that is not designated or effective as a hedging instrument.
A financial asset is designated as FVTPL because either:• It eliminates or significantly reduces a measurement or recognition inconsistency that
would otherwise arise from measuring assets or recognising the gains and losses on them on different bases; or
• A group of financial assets is managed and its performance is evaluated on a fair value basis, in accordance with a documented risk management or investment strategy and information about the group is provided internally on that basis to key management personnel.
Investments in gilt-edged securities and equity investments that are held for trading purposes are classified as HFT. They are recognised on a trade-date basis and are initially measured at fair value. Subsequently, they are remeasured to fair value with the unrealised gains and losses on revaluation and the realised gains and losses on disposal included in the Statement of income as Net trading income.
Interest accrued on gilt-edged securities held for trading purposes is accounted for in the Statement of income as Interest income.
Gains and losses arising from changes in the fair value of derivatives that are managed in conjunction with designated financial assets or financial liabilities are included in Net trading income.
NOTESTOTHEFINANCIALSTATEMENTSFORTHEYEARENDED30JUNE2011(CONT’D)3.Accountingpolicies(Cont’d)(g) Loans and advances and allowance for credit impairment(i) Loans and advances are classified under L&R and are measured at amortised cost, less
allowance for credit impairment. Allowance for credit impairment consists of specific and portfolio allowances.
Specific allowances are made on impaired advances and are calculated as the shortfall between the carrying amounts of the advances and their recoverable amounts. The recoverable amount is the present value of expected future cash flows discounted at the original effective interest rate of the advance.
Loans that are either subject to collective impairment assessment or are individually significant and whose terms have been renegotiated are no longer considered to be past due but are treated as new loans.
(ii) A portfolio allowance for credit impairment is maintained on the aggregate amount of all loans and advances to allow for potential losses not specifically identified but which experience indicates are present in the portfolio of loans and advances. The portfolio allowance is estimated based upon historical patterns of losses in each component of the portfolio of loans and advances as well as on current economic and other relevant conditions. The Bank of Mauritius Guideline on Credit Impairment Measurement and Income Recognition prescribes that the portfolio allowance should be no less than 1 per cent of the aggregate amount of loans and advances excluding impaired advances, excluding loans granted to or guaranteed by the Government of Mauritius and excluding loans to the extent that they are supported by collateral of liquid assets held by the Group. The charge for portfolio allowance is recognised in the Statement of income.
(iii) Allowance for credit impairment in respect of on-balance sheet items is deducted from the applicable asset whereas the allowance for credit impairment in respect of off balance sheet items is included in Other liabilities in the Statement of financial position. Changes in the carrying amount of the allowance accounts are recognised in the Statement of income. When an advance is uncollectible, it is written off against the specific allowance. Subsequent recoveries of amounts previously written off are credited to the Net impairment loss on financial assets in the Statement of income.
(iv) Interest income is recognised after impairment based on the recoverable amount and the
rate of interest used to discount the future cash flows to determine the recoverable amount.
(h) Placements and other receivablesPlacements and other receivables that have fixed or determinable payments and that are not quoted in an active market are classified as L&R. They are measured at amortised cost, less any impairment loss. Interest income is recognised applying the effective interest rate, except for short term receivables when the recognition of interest would be immaterial. Interest accrued on placements is accounted for in the Statement of income as Interest income.
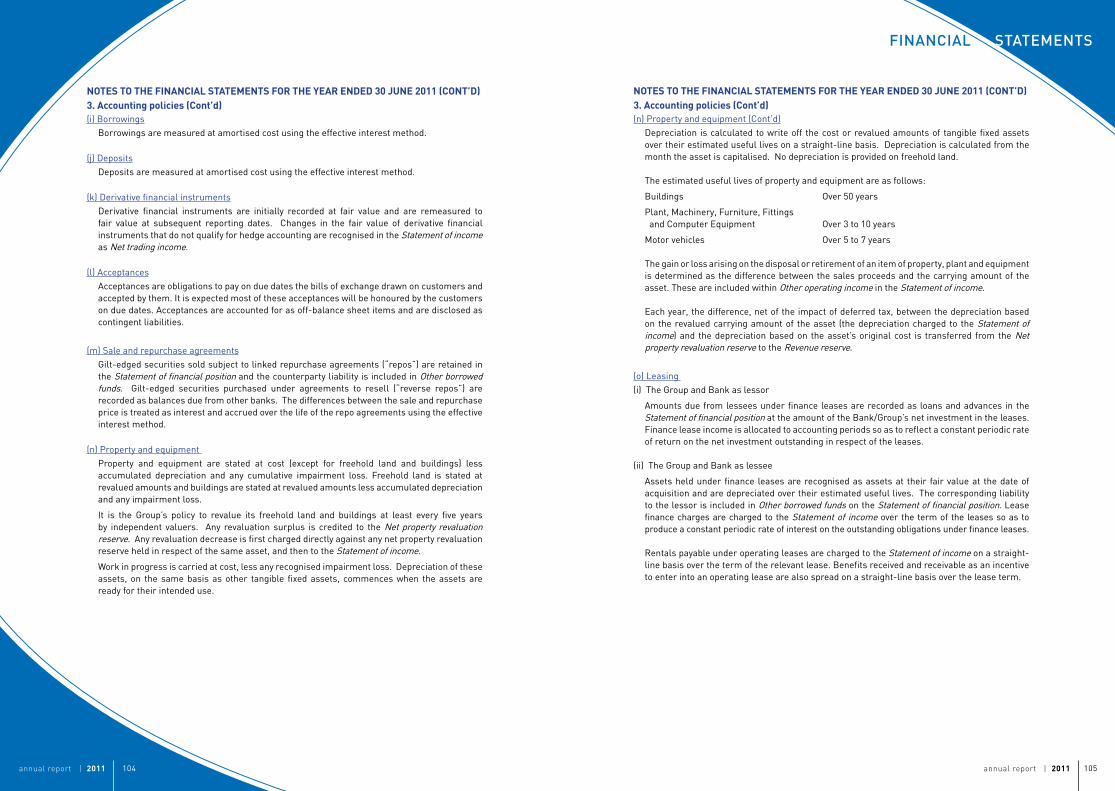
annual report | 2011 105annual report | 2011 104
STaTeMenTSFinancial
NOTESTOTHEFINANCIALSTATEMENTSFORTHEYEARENDED30JUNE2011(CONT’D)3.Accountingpolicies(Cont’d)(i) Borrowings
Borrowings are measured at amortised cost using the effective interest method.
(j) DepositsDeposits are measured at amortised cost using the effective interest method.
(k) Derivative financial instrumentsDerivative financial instruments are initially recorded at fair value and are remeasured to fair value at subsequent reporting dates. Changes in the fair value of derivative financial instruments that do not qualify for hedge accounting are recognised in the Statement of income as Net trading income.
(l) AcceptancesAcceptances are obligations to pay on due dates the bills of exchange drawn on customers and accepted by them. It is expected most of these acceptances will be honoured by the customers on due dates. Acceptances are accounted for as off-balance sheet items and are disclosed as contingent liabilities.
(m) Sale and repurchase agreementsGilt-edged securities sold subject to linked repurchase agreements (“repos”) are retained in the Statement of financial position and the counterparty liability is included in Other borrowed funds. Gilt-edged securities purchased under agreements to resell (“reverse repos”) are recorded as balances due from other banks. The differences between the sale and repurchase price is treated as interest and accrued over the life of the repo agreements using the effective interest method.
(n) Property and equipment Property and equipment are stated at cost (except for freehold land and buildings) less accumulated depreciation and any cumulative impairment loss. Freehold land is stated at revalued amounts and buildings are stated at revalued amounts less accumulated depreciation and any impairment loss.
It is the Group’s policy to revalue its freehold land and buildings at least every five years by independent valuers. Any revaluation surplus is credited to the Net property revaluation reserve. Any revaluation decrease is first charged directly against any net property revaluation reserve held in respect of the same asset, and then to the Statement of income.
Work in progress is carried at cost, less any recognised impairment loss. Depreciation of these assets, on the same basis as other tangible fixed assets, commences when the assets are ready for their intended use.
NOTESTOTHEFINANCIALSTATEMENTSFORTHEYEARENDED30JUNE2011(CONT’D)3.Accountingpolicies(Cont’d)(n) Property and equipment (Cont’d)
Depreciation is calculated to write off the cost or revalued amounts of tangible fixed assets over their estimated useful lives on a straight-line basis. Depreciation is calculated from the month the asset is capitalised. No depreciation is provided on freehold land. The estimated useful lives of property and equipment are as follows:
Buildings Over 50 years
Plant, Machinery, Furniture, Fittings and Computer Equipment Over 3 to 10 years
Motor vehicles Over 5 to 7 years
The gain or loss arising on the disposal or retirement of an item of property, plant and equipment is determined as the difference between the sales proceeds and the carrying amount of the asset. These are included within Other operating income in the Statement of income.
Each year, the difference, net of the impact of deferred tax, between the depreciation based on the revalued carrying amount of the asset (the depreciation charged to the Statement of income) and the depreciation based on the asset’s original cost is transferred from the Net property revaluation reserve to the Revenue reserve.
(o) Leasing (i) The Group and Bank as lessor
Amounts due from lessees under finance leases are recorded as loans and advances in the Statement of financial position at the amount of the Bank/Group’s net investment in the leases. Finance lease income is allocated to accounting periods so as to reflect a constant periodic rate of return on the net investment outstanding in respect of the leases.
(ii) The Group and Bank as lessee
Assets held under finance leases are recognised as assets at their fair value at the date of acquisition and are depreciated over their estimated useful lives. The corresponding liability to the lessor is included in Other borrowed funds on the Statement of financial position. Lease finance charges are charged to the Statement of income over the term of the leases so as to produce a constant periodic rate of interest on the outstanding obligations under finance leases.
Rentals payable under operating leases are charged to the Statement of income on a straight-line basis over the term of the relevant lease. Benefits received and receivable as an incentive to enter into an operating lease are also spread on a straight-line basis over the lease term.
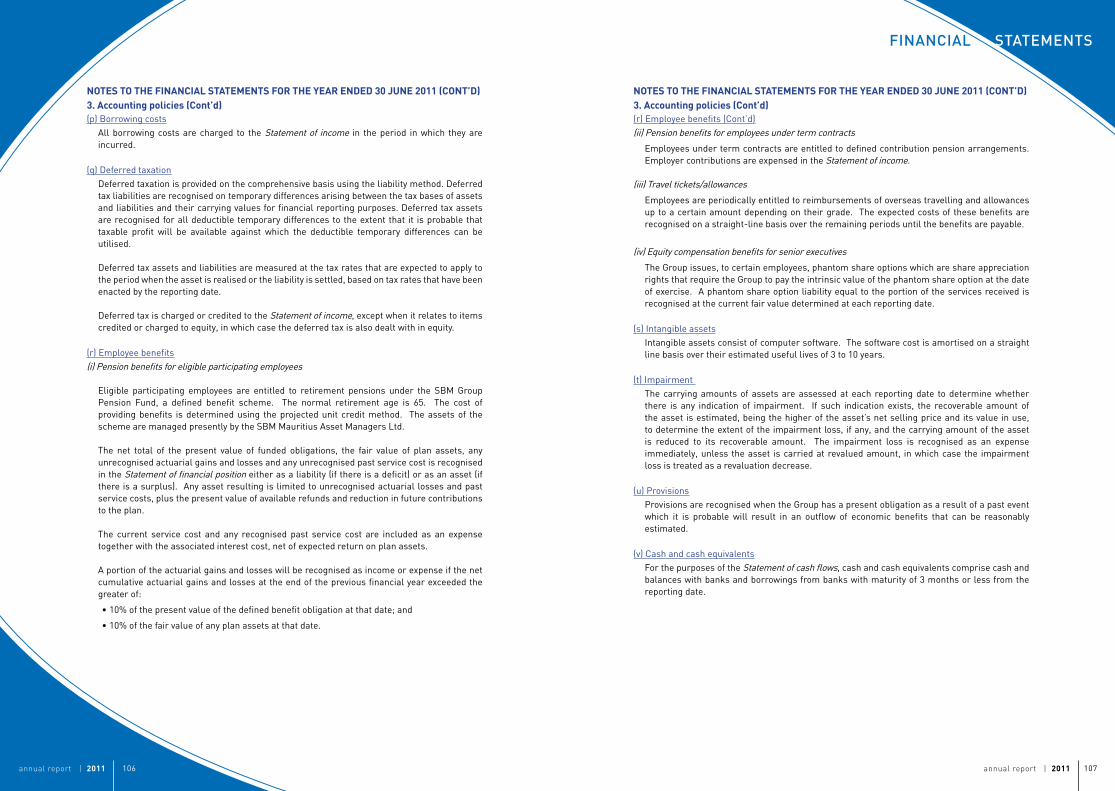
annual report | 2011 107annual report | 2011 106
STaTeMenTSFinancial
NOTESTOTHEFINANCIALSTATEMENTSFORTHEYEARENDED30JUNE2011(CONT’D)3.Accountingpolicies(Cont’d)(p) Borrowing costs
All borrowing costs are charged to the Statement of income in the period in which they are incurred.
(q) Deferred taxationDeferred taxation is provided on the comprehensive basis using the liability method. Deferred tax liabilities are recognised on temporary differences arising between the tax bases of assets and liabilities and their carrying values for financial reporting purposes. Deferred tax assets are recognised for all deductible temporary differences to the extent that it is probable that taxable profit will be available against which the deductible temporary differences can be utilised.
Deferred tax assets and liabilities are measured at the tax rates that are expected to apply to the period when the asset is realised or the liability is settled, based on tax rates that have been enacted by the reporting date.
Deferred tax is charged or credited to the Statement of income, except when it relates to items credited or charged to equity, in which case the deferred tax is also dealt with in equity.
(r) Employee benefits(i) Pension benefits for eligible participating employees
Eligible participating employees are entitled to retirement pensions under the SBM Group Pension Fund, a defined benefit scheme. The normal retirement age is 65. The cost of providing benefits is determined using the projected unit credit method. The assets of the scheme are managed presently by the SBM Mauritius Asset Managers Ltd.
The net total of the present value of funded obligations, the fair value of plan assets, any unrecognised actuarial gains and losses and any unrecognised past service cost is recognised in the Statement of financial position either as a liability (if there is a deficit) or as an asset (if there is a surplus). Any asset resulting is limited to unrecognised actuarial losses and past service costs, plus the present value of available refunds and reduction in future contributions to the plan.
The current service cost and any recognised past service cost are included as an expense together with the associated interest cost, net of expected return on plan assets.
A portion of the actuarial gains and losses will be recognised as income or expense if the net cumulative actuarial gains and losses at the end of the previous financial year exceeded the greater of:
• 10% of the present value of the defined benefit obligation at that date; and
• 10% of the fair value of any plan assets at that date.
NOTESTOTHEFINANCIALSTATEMENTSFORTHEYEARENDED30JUNE2011(CONT’D)3.Accountingpolicies(Cont’d)(r) Employee benefits (Cont’d)(ii) Pension benefits for employees under term contracts
Employees under term contracts are entitled to defined contribution pension arrangements. Employer contributions are expensed in the Statement of income.
(iii) Travel tickets/allowances
Employees are periodically entitled to reimbursements of overseas travelling and allowances up to a certain amount depending on their grade. The expected costs of these benefits are recognised on a straight-line basis over the remaining periods until the benefits are payable.
(iv) Equity compensation benefits for senior executives
The Group issues, to certain employees, phantom share options which are share appreciation rights that require the Group to pay the intrinsic value of the phantom share option at the date of exercise. A phantom share option liability equal to the portion of the services received is recognised at the current fair value determined at each reporting date.
(s) Intangible assetsIntangible assets consist of computer software. The software cost is amortised on a straight line basis over their estimated useful lives of 3 to 10 years.
(t) Impairment The carrying amounts of assets are assessed at each reporting date to determine whether there is any indication of impairment. If such indication exists, the recoverable amount of the asset is estimated, being the higher of the asset’s net selling price and its value in use, to determine the extent of the impairment loss, if any, and the carrying amount of the asset is reduced to its recoverable amount. The impairment loss is recognised as an expense immediately, unless the asset is carried at revalued amount, in which case the impairment loss is treated as a revaluation decrease.
(u) ProvisionsProvisions are recognised when the Group has a present obligation as a result of a past event which it is probable will result in an outflow of economic benefits that can be reasonably estimated.
(v) Cash and cash equivalentsFor the purposes of the Statement of cash flows, cash and cash equivalents comprise cash and balances with banks and borrowings from banks with maturity of 3 months or less from the reporting date.
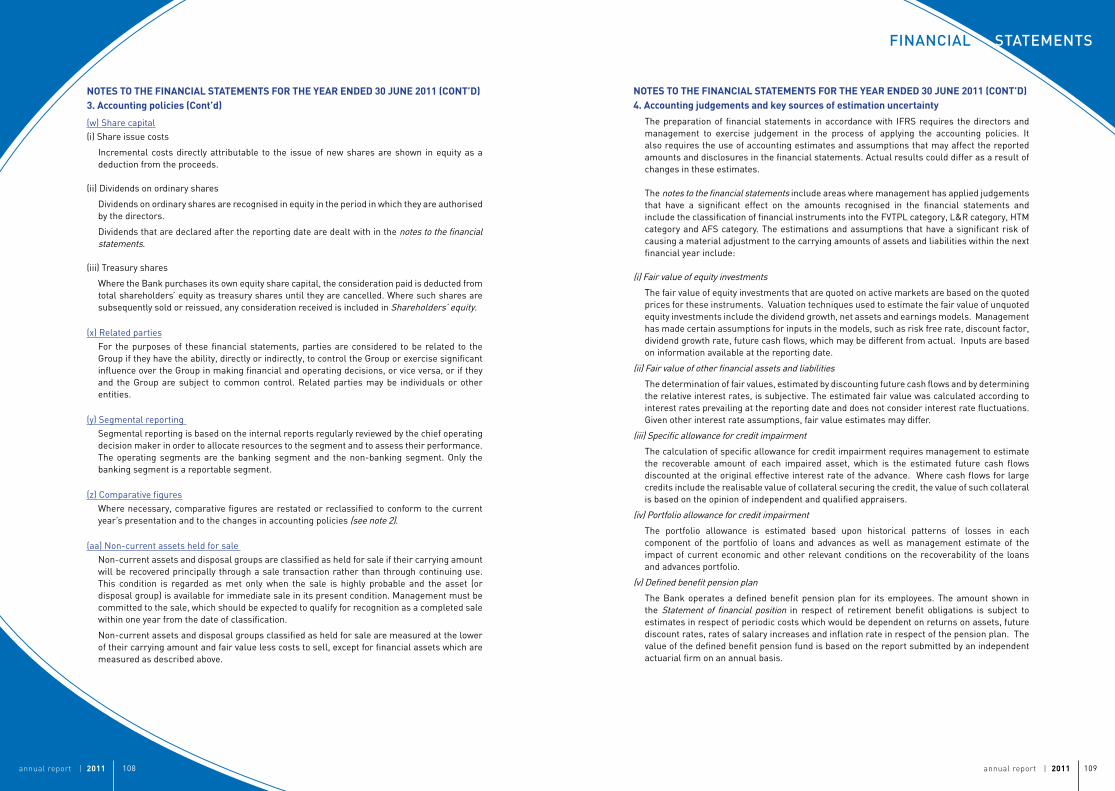
annual report | 2011 109annual report | 2011 108
STaTeMenTSFinancial
NOTESTOTHEFINANCIALSTATEMENTSFORTHEYEARENDED30JUNE2011(CONT’D)3.Accountingpolicies(Cont’d)
(w) Share capital(i) Share issue costs
Incremental costs directly attributable to the issue of new shares are shown in equity as a deduction from the proceeds.
(ii) Dividends on ordinary shares
Dividends on ordinary shares are recognised in equity in the period in which they are authorised by the directors.
Dividends that are declared after the reporting date are dealt with in the notes to the financial statements.
(iii) Treasury shares
Where the Bank purchases its own equity share capital, the consideration paid is deducted from total shareholders’ equity as treasury shares until they are cancelled. Where such shares are subsequently sold or reissued, any consideration received is included in Shareholders’ equity.
(x) Related partiesFor the purposes of these financial statements, parties are considered to be related to the Group if they have the ability, directly or indirectly, to control the Group or exercise significant influence over the Group in making financial and operating decisions, or vice versa, or if they and the Group are subject to common control. Related parties may be individuals or other entities.
(y) Segmental reporting Segmental reporting is based on the internal reports regularly reviewed by the chief operating decision maker in order to allocate resources to the segment and to assess their performance. The operating segments are the banking segment and the non-banking segment. Only the banking segment is a reportable segment.
(z) Comparative figuresWhere necessary, comparative figures are restated or reclassified to conform to the current year’s presentation and to the changes in accounting policies (see note 2).
(aa) Non-current assets held for sale Non-current assets and disposal groups are classified as held for sale if their carrying amount will be recovered principally through a sale transaction rather than through continuing use. This condition is regarded as met only when the sale is highly probable and the asset (or disposal group) is available for immediate sale in its present condition. Management must be committed to the sale, which should be expected to qualify for recognition as a completed sale within one year from the date of classification.
Non-current assets and disposal groups classified as held for sale are measured at the lower of their carrying amount and fair value less costs to sell, except for financial assets which are measured as described above.
NOTESTOTHEFINANCIALSTATEMENTSFORTHEYEARENDED30JUNE2011(CONT’D)4.Accountingjudgementsandkeysourcesofestimationuncertainty
The preparation of financial statements in accordance with IFRS requires the directors and management to exercise judgement in the process of applying the accounting policies. It also requires the use of accounting estimates and assumptions that may affect the reported amounts and disclosures in the financial statements. Actual results could differ as a result of changes in these estimates.
The notes to the financial statements include areas where management has applied judgements that have a significant effect on the amounts recognised in the financial statements and include the classification of financial instruments into the FVTPL category, L&R category, HTM category and AFS category. The estimations and assumptions that have a significant risk of causing a material adjustment to the carrying amounts of assets and liabilities within the next financial year include:
(i) Fair value of equity investments
The fair value of equity investments that are quoted on active markets are based on the quoted prices for these instruments. Valuation techniques used to estimate the fair value of unquoted equity investments include the dividend growth, net assets and earnings models. Management has made certain assumptions for inputs in the models, such as risk free rate, discount factor, dividend growth rate, future cash flows, which may be different from actual. Inputs are based on information available at the reporting date.
(ii) Fair value of other financial assets and liabilities
The determination of fair values, estimated by discounting future cash flows and by determining the relative interest rates, is subjective. The estimated fair value was calculated according to interest rates prevailing at the reporting date and does not consider interest rate fluctuations. Given other interest rate assumptions, fair value estimates may differ.
(iii) Specific allowance for credit impairment
The calculation of specific allowance for credit impairment requires management to estimate the recoverable amount of each impaired asset, which is the estimated future cash flows discounted at the original effective interest rate of the advance. Where cash flows for large credits include the realisable value of collateral securing the credit, the value of such collateral is based on the opinion of independent and qualified appraisers.
(iv) Portfolio allowance for credit impairment
The portfolio allowance is estimated based upon historical patterns of losses in each component of the portfolio of loans and advances as well as management estimate of the impact of current economic and other relevant conditions on the recoverability of the loans and advances portfolio.
(v) Defined benefit pension plan
The Bank operates a defined benefit pension plan for its employees. The amount shown in the Statement of financial position in respect of retirement benefit obligations is subject to estimates in respect of periodic costs which would be dependent on returns on assets, future discount rates, rates of salary increases and inflation rate in respect of the pension plan. The value of the defined benefit pension fund is based on the report submitted by an independent actuarial firm on an annual basis.
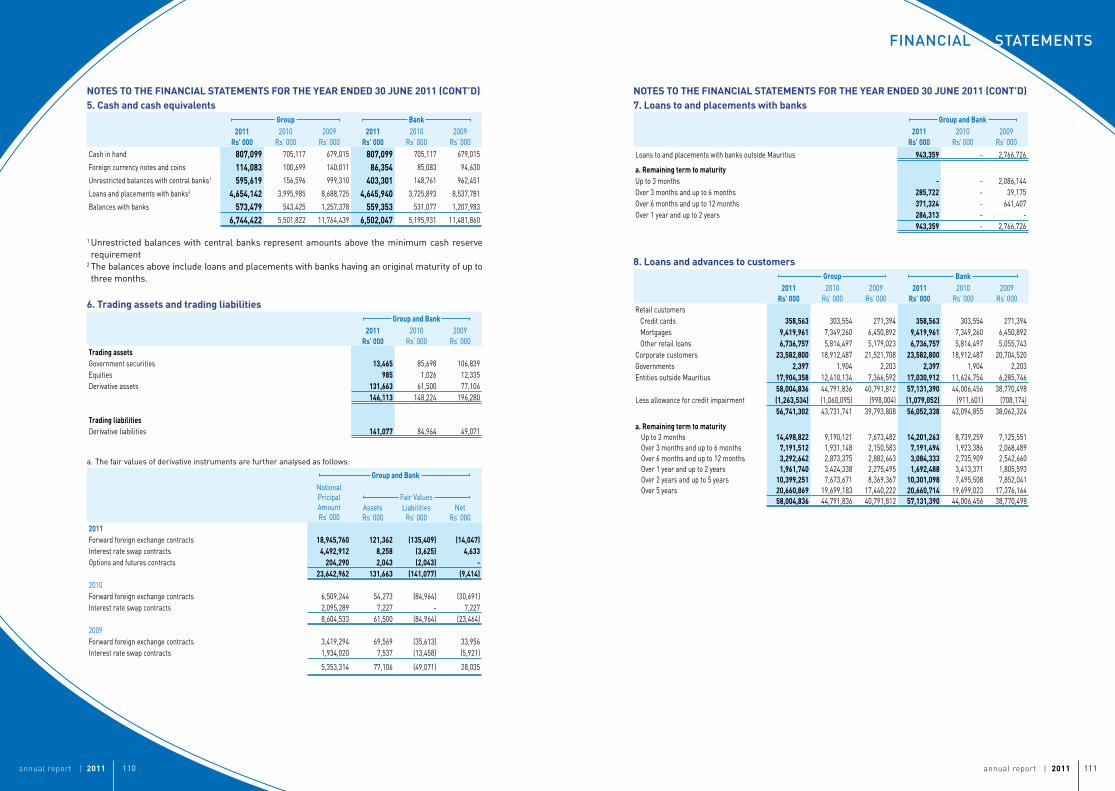
annual report | 2011 111annual report | 2011 110
STaTeMenTSFinancial
NOTESTOTHEFINANCIALSTATEMENTSFORTHEYEARENDED30JUNE2011(CONT’D)5.Cashandcashequivalents
Group Bank2011
Rs’0002010
Rs’ 0002009
Rs’ 0002011
Rs’0002010
Rs’ 0002009
Rs’ 000Cash in hand 807,099 705,117 679,015 807,099 705,117 679,015
Foreign currency notes and coins 114,083 100,699 140,011 86,354 85,083 94,630
Unrestricted balances with central banks1 595,619 156,596 999,310 403,301 148,761 962,451
Loans and placements with banks2 4,654,142 3,995,985 8,688,725 4,645,940 3,725,893 8,537,781
Balances with banks 573,479 543,425 1,257,378 559,353 531,077 1,207,983
6,744,422 5,501,822 11,764,439 6,502,047 5,195,931 11,481,860
1 Unrestricted balances with central banks represent amounts above the minimum cash reserve requirement
2 The balances above include loans and placements with banks having an original maturity of up to three months.
6.TradingassetsandtradingliabilitiesGroupandBank
2011Rs’000
2010Rs’ 000
2009Rs’ 000
TradingassetsGovernment securities 13,465 85,698 106,839Equities 985 1,026 12,335Derivative assets 131,663 61,500 77,106
146,113 148,224 196,280
TradingliabilitiesDerivative liabilities 141,077 84,964 49,071
a. The fair values of derivative instruments are further analysed as follows:
GroupandBankNotional Pricipal AmountRs’ 000
Fair Values AssetsRs’ 000
LiabilitiesRs’ 000
NetRs’ 000
2011Forward foreign exchange contracts 18,945,760 121,362 (135,409) (14,047)Interest rate swap contracts 4,492,912 8,258 (3,625) 4,633Options and futures contracts 204,290 2,043 (2,043) -
23,642,962 131,663 (141,077) (9,414)2010Forward foreign exchange contracts 6,509,244 54,273 (84,964) (30,691)Interest rate swap contracts 2,095,289 7,227 - 7,227
8,604,533 61,500 (84,964) (23,464)2009Forward foreign exchange contracts 3,419,294 69,569 (35,613) 33,956Interest rate swap contracts 1,934,020 7,537 (13,458) (5,921)
5,353,314 77,106 (49,071) 28,035
NOTESTOTHEFINANCIALSTATEMENTSFORTHEYEARENDED30JUNE2011(CONT’D)7.Loanstoandplacementswithbanks
GroupandBank2011
Rs’0002010
Rs’ 0002009
Rs’ 000
Loans to and placements with banks outside Mauritius 943,359 - 2,766,726
a.RemainingtermtomaturityUp to 3 months - - 2,086,144Over 3 months and up to 6 months 285,722 - 39,175Over 6 months and up to 12 months 371,324 - 641,407Over 1 year and up to 2 years 286,313 - -
943,359 - 2,766,726
8.LoansandadvancestocustomersGroup Bank
2011Rs’000
2010Rs’ 000
2009Rs’ 000
2011Rs’000
2010Rs’ 000
2009Rs’ 000
Retail customers Credit cards 358,563 303,554 271,394 358,563 303,554 271,394 Mortgages 9,419,961 7,349,260 6,450,892 9,419,961 7,349,260 6,450,892 Other retail loans 6,736,757 5,814,497 5,179,023 6,736,757 5,814,497 5,055,743Corporate customers 23,582,800 18,912,487 21,521,708 23,582,800 18,912,487 20,704,520Governments 2,397 1,904 2,203 2,397 1,904 2,203Entities outside Mauritius 17,904,358 12,410,134 7,366,592 17,030,912 11,624,754 6,285,746
58,004,836 44,791,836 40,791,812 57,131,390 44,006,456 38,770,498Less allowance for credit impairment (1,263,534) (1,060,095) (998,004) (1,079,052) (911,601) (708,174)
56,741,302 43,731,741 39,793,808 56,052,338 43,094,855 38,062,324
a.RemainingtermtomaturityUp to 3 months 14,498,822 9,190,121 7,673,482 14,201,263 8,739,259 7,125,551Over 3 months and up to 6 months 7,191,512 1,931,148 2,150,583 7,191,494 1,923,386 2,068,489Over 6 months and up to 12 months 3,292,642 2,873,375 2,882,663 3,084,333 2,735,909 2,542,660Over 1 year and up to 2 years 1,961,740 3,424,338 2,275,495 1,692,488 3,413,371 1,805,593Over 2 years and up to 5 years 10,399,251 7,673,671 8,369,367 10,301,098 7,495,508 7,852,041Over 5 years 20,660,869 19,699,183 17,440,222 20,660,714 19,699,023 17,376,164
58,004,836 44,791,836 40,791,812 57,131,390 44,006,456 38,770,498
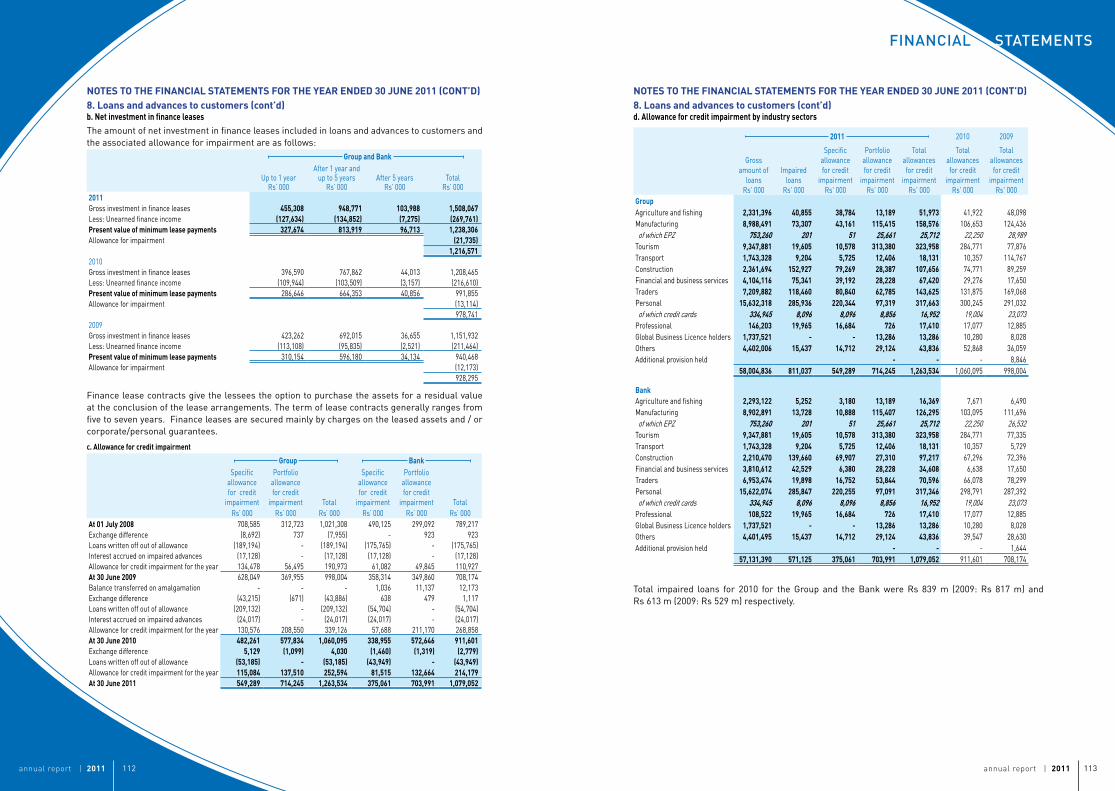
NOTESTOTHEFINANCIALSTATEMENTSFORTHEYEARENDED30JUNE2011(CONT’D)8.Loansandadvancestocustomers(cont’d)b.NetinvestmentinfinanceleasesThe amount of net investment in finance leases included in loans and advances to customers and the associated allowance for impairment are as follows:
GroupandBank
Up to 1 yearRs’ 000
After 1 year and up to 5 years
Rs’ 000After 5 years
Rs’ 000Total
Rs’ 0002011Gross investment in finance leases 455,308 948,771 103,988 1,508,067Less: Unearned finance income (127,634) (134,852) (7,275) (269,761)Presentvalueofminimumleasepayments 327,674 813,919 96,713 1,238,306Allowance for impairment (21,735)
1,216,5712010Gross investment in finance leases 396,590 767,862 44,013 1,208,465Less: Unearned finance income (109,944) (103,509) (3,157) (216,610)Presentvalueofminimumleasepayments 286,646 664,353 40,856 991,855Allowance for impairment (13,114)
978,7412009Gross investment in finance leases 423,262 692,015 36,655 1,151,932Less: Unearned finance income (113,108) (95,835) (2,521) (211,464)Presentvalueofminimumleasepayments 310,154 596,180 34,134 940,468Allowance for impairment (12,173)
928,295
Finance lease contracts give the lessees the option to purchase the assets for a residual value at the conclusion of the lease arrangements. The term of lease contracts generally ranges from five to seven years. Finance leases are secured mainly by charges on the leased assets and / or corporate/personal guarantees.
c.AllowanceforcreditimpairmentGroup Bank
Specific allowancefor credit
impairment
Portfolio allowancefor credit
impairment Total
Specific allowancefor credit
impairment
Portfolio allowancefor credit
impairment TotalRs’ 000 Rs’ 000 Rs’ 000 Rs’ 000 Rs’ 000 Rs’ 000
At01July2008 708,585 312,723 1,021,308 490,125 299,092 789,217Exchange difference (8,692) 737 (7,955) - 923 923Loans written off out of allowance (189,194) - (189,194) (175,765) - (175,765)Interest accrued on impaired advances (17,128) - (17,128) (17,128) - (17,128)Allowance for credit impairment for the year 134,478 56,495 190,973 61,082 49,845 110,927At30June2009 628,049 369,955 998,004 358,314 349,860 708,174Balance transferred on amalgamation - - - 1,036 11,137 12,173Exchange difference (43,215) (671) (43,886) 638 479 1,117Loans written off out of allowance (209,132) - (209,132) (54,704) - (54,704)Interest accrued on impaired advances (24,017) - (24,017) (24,017) - (24,017)Allowance for credit impairment for the year 130,576 208,550 339,126 57,688 211,170 268,858At30June2010 482,261 577,834 1,060,095 338,955 572,646 911,601Exchange difference 5,129 (1,099) 4,030 (1,460) (1,319) (2,779)Loans written off out of allowance (53,185) - (53,185) (43,949) - (43,949)Allowance for credit impairment for the year 115,084 137,510 252,594 81,515 132,664 214,179At30June2011 549,289 714,245 1,263,534 375,061 703,991 1,079,052
annual report | 2011 113annual report | 2011 112
STaTeMenTSFinancial
NOTESTOTHEFINANCIALSTATEMENTSFORTHEYEARENDED30JUNE2011(CONT’D)8.Loansandadvancestocustomers(cont’d)d.Allowanceforcreditimpairmentbyindustrysectors
2011 2010 2009
Grossamount of
loansRs' 000
Impairedloans
Rs' 000
Specificallowancefor credit
impairmentRs' 000
Portfolio allowancefor credit
impairmentRs' 000
Totalallowancesfor credit
impairmentRs' 000
Totalallowancesfor credit
impairmentRs' 000
Totalallowancesfor credit
impairmentRs' 000
GroupAgriculture and fishing 2,331,396 40,855 38,784 13,189 51,973 41,922 48,098Manufacturing 8,988,491 73,307 43,161 115,415 158,576 106,653 124,436 of which EPZ 753,260 201 51 25,661 25,712 22,250 28,989Tourism 9,347,881 19,605 10,578 313,380 323,958 284,771 77,876Transport 1,743,328 9,204 5,725 12,406 18,131 10,357 114,767Construction 2,361,694 152,927 79,269 28,387 107,656 74,771 89,259Financial and business services 4,104,116 75,341 39,192 28,228 67,420 29,276 17,650Traders 7,209,882 118,460 80,840 62,785 143,625 131,875 169,068Personal 15,632,318 285,936 220,344 97,319 317,663 300,245 291,032 of which credit cards 334,945 8,096 8,096 8,856 16,952 19,004 23,073Professional 146,203 19,965 16,684 726 17,410 17,077 12,885Global Business Licence holders 1,737,521 - - 13,286 13,286 10,280 8,028Others 4,402,006 15,437 14,712 29,124 43,836 52,868 36,059Additional provision held - - - 8,846
58,004,836 811,037 549,289 714,245 1,263,534 1,060,095 998,004
BankAgriculture and fishing 2,293,122 5,252 3,180 13,189 16,369 7,671 6,490Manufacturing 8,902,891 13,728 10,888 115,407 126,295 103,095 111,696 of which EPZ 753,260 201 51 25,661 25,712 22,250 26,532Tourism 9,347,881 19,605 10,578 313,380 323,958 284,771 77,335Transport 1,743,328 9,204 5,725 12,406 18,131 10,357 5,729Construction 2,210,470 139,660 69,907 27,310 97,217 67,296 72,396Financial and business services 3,810,612 42,529 6,380 28,228 34,608 6,638 17,650Traders 6,953,474 19,898 16,752 53,844 70,596 66,078 78,299Personal 15,622,074 285,847 220,255 97,091 317,346 298,791 287,392 of which credit cards 334,945 8,096 8,096 8,856 16,952 19,004 23,073Professional 108,522 19,965 16,684 726 17,410 17,077 12,885Global Business Licence holders 1,737,521 - - 13,286 13,286 10,280 8,028Others 4,401,495 15,437 14,712 29,124 43,836 39,547 28,630Additional provision held - - - 1,644
57,131,390 571,125 375,061 703,991 1,079,052 911,601 708,174
Total impaired loans for 2010 for the Group and the Bank were Rs 839 m (2009: Rs 817 m) and Rs 613 m (2009: Rs 529 m) respectively.
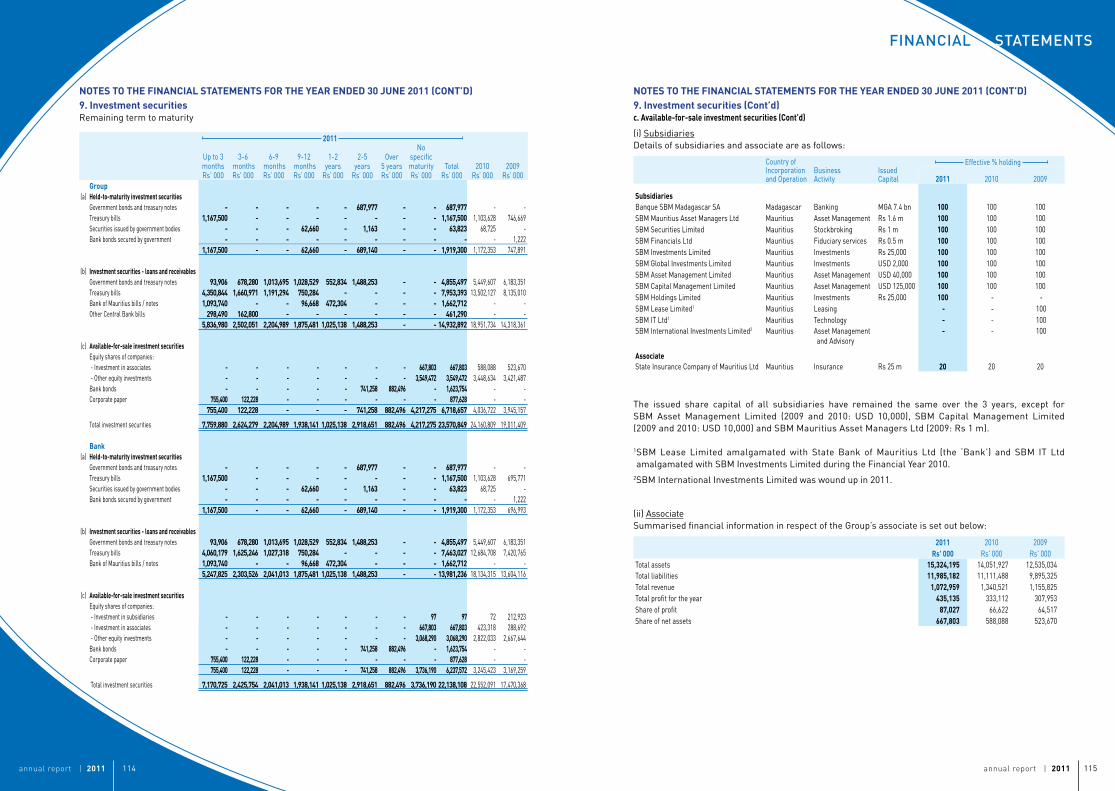
annual report | 2011 115annual report | 2011 114
STaTeMenTSFinancial
NOTESTOTHEFINANCIALSTATEMENTSFORTHEYEARENDED30JUNE2011(CONT’D)9.InvestmentsecuritiesRemaining term to maturity
NOTESTOTHEFINANCIALSTATEMENTSFORTHEYEARENDED30JUNE2011(CONT’D)9.Investmentsecurities(Cont’d)c.Available-for-saleinvestmentsecurities(Cont’d)
(i) SubsidiariesDetails of subsidiaries and associate are as follows:
Country ofIncorporationand Operation
BusinessActivity
Issued Capital
Effective % holding
2011 2010 2009
SubsidiariesBanque SBM Madagascar SA Madagascar Banking MGA 7.4 bn 100 100 100SBM Mauritius Asset Managers Ltd Mauritius Asset Management Rs 1.6 m 100 100 100SBM Securities Limited Mauritius Stockbroking Rs 1 m 100 100 100SBM Financials Ltd Mauritius Fiduciary services Rs 0.5 m 100 100 100SBM Investments Limited Mauritius Investments Rs 25,000 100 100 100SBM Global Investments Limited Mauritius Investments USD 2,000 100 100 100SBM Asset Management Limited Mauritius Asset Management USD 40,000 100 100 100SBM Capital Management Limited Mauritius Asset Management USD 125,000 100 100 100SBM Holdings Limited Mauritius Investments Rs 25,000 100 - - SBM Lease Limited1 Mauritius Leasing - - 100 SBM IT Ltd1 Mauritius Technology - - 100 SBM International Investments Limited2 Mauritius Asset Management
and Advisory- - 100
AssociateState Insurance Company of Mauritius Ltd Mauritius Insurance Rs 25 m 20 20 20
(ii) AssociateSummarised financial information in respect of the Group’s associate is set out below:
2011 2010 2009Rs'000 Rs' 000 Rs' 000
Total assets 15,324,195 14,051,927 12,535,034Total liabilities 11,985,182 11,111,488 9,895,325Total revenue 1,072,959 1,340,521 1,155,825Total profit for the year 435,135 333,112 307,953Share of profit 87,027 66,622 64,517Share of net assets 667,803 588,088 523,670
The issued share capital of all subsidiaries have remained the same over the 3 years, except for SBM Asset Management Limited (2009 and 2010: USD 10,000), SBM Capital Management Limited (2009 and 2010: USD 10,000) and SBM Mauritius Asset Managers Ltd (2009: Rs 1 m).
1 SBM Lease Limited amalgamated with State Bank of Mauritius Ltd (the ‘Bank’) and SBM IT Ltd amalgamated with SBM Investments Limited during the Financial Year 2010.
2SBM International Investments Limited was wound up in 2011.
2011
Up to 3 monthsRs' 000
3-6 monthsRs' 000
6-9 monthsRs’ 000
9-12 monthsRs’ 000
1-2 years
Rs’ 000
2-5 years
Rs’ 000
Over 5 yearsRs’ 000
No specific maturityRs’ 000
TotalRs’ 000
2010Rs’ 000
2009Rs’ 000
Group(a) Held-to-maturityinvestmentsecurities
Government bonds and treasury notes - - - - - 687,977 - - 687,977 - - Treasury bills 1,167,500 - - - - - - - 1,167,500 1,103,628 746,669Securities issued by government bodies - - - 62,660 - 1,163 - - 63,823 68,725 - Bank bonds secured by government - - - - - - - - - - 1,222
1,167,500 - - 62,660 - 689,140 - - 1,919,300 1,172,353 747,891
(b) Investmentsecurities-loansandreceivablesGovernment bonds and treasury notes 93,906 678,280 1,013,695 1,028,529 552,834 1,488,253 - - 4,855,497 5,449,607 6,183,351Treasury bills 4,350,844 1,660,971 1,191,294 750,284 - - - - 7,953,393 13,502,127 8,135,010Bank of Mauritius bills / notes 1,093,740 - - 96,668 472,304 - - - 1,662,712 - - Other Central Bank bills 298,490 162,800 - - - - - - 461,290 - -
5,836,980 2,502,051 2,204,989 1,875,481 1,025,138 1,488,253 - -14,932,892 18,951,734 14,318,361
(c) Available-for-saleinvestmentsecuritiesEquity shares of companies: - Investment in associates - - - - - - - 667,803 667,803 588,088 523,670 - Other equity investments - - - - - - - 3,549,472 3,549,472 3,448,634 3,421,487Bank bonds - - - - - 741,258 882,496 - 1,623,754 - - Corporate paper 755,400 122,228 - - - - - - 877,628 - -
755,400 122,228 - - - 741,258 882,496 4,217,275 6,718,657 4,036,722 3,945,157
Total investment securities 7,759,880 2,624,279 2,204,989 1,938,141 1,025,138 2,918,651 882,496 4,217,275 23,570,849 24,160,809 19,011,409
Bank(a) Held-to-maturityinvestmentsecurities
Government bonds and treasury notes - - - - - 687,977 - - 687,977 - - Treasury bills 1,167,500 - - - - - - - 1,167,500 1,103,628 695,771Securities issued by government bodies - - - 62,660 - 1,163 - - 63,823 68,725 - Bank bonds secured by government - - - - - - - - - - 1,222
1,167,500 - - 62,660 - 689,140 - - 1,919,300 1,172,353 696,993
(b) Investmentsecurities-loansandreceivablesGovernment bonds and treasury notes 93,906 678,280 1,013,695 1,028,529 552,834 1,488,253 - - 4,855,497 5,449,607 6,183,351Treasury bills 4,060,179 1,625,246 1,027,318 750,284 - - - - 7,463,027 12,684,708 7,420,765Bank of Mauritius bills / notes 1,093,740 - - 96,668 472,304 - - - 1,662,712 - -
5,247,825 2,303,526 2,041,013 1,875,481 1,025,138 1,488,253 - -13,981,236 18,134,315 13,604,116
(c) Available-for-saleinvestmentsecuritiesEquity shares of companies: - Investment in subsidiaries - - - - - - - 97 97 72 212,923 - Investment in associates - - - - - - - 667,803 667,803 423,318 288,692 - Other equity investments - - - - - - - 3,068,290 3,068,290 2,822,033 2,667,644Bank bonds - - - - - 741,258 882,496 - 1,623,754 - - Corporate paper 755,400 122,228 - - - - - - 877,628 - -
755,400 122,228 - - - 741,258 882,496 3,736,190 6,237,572 3,245,423 3,169,259
Total investment securities 7,170,725 2,425,754 2,041,013 1,938,141 1,025,138 2,918,651 882,496 3,736,190 22,138,108 22,552,091 17,470,368
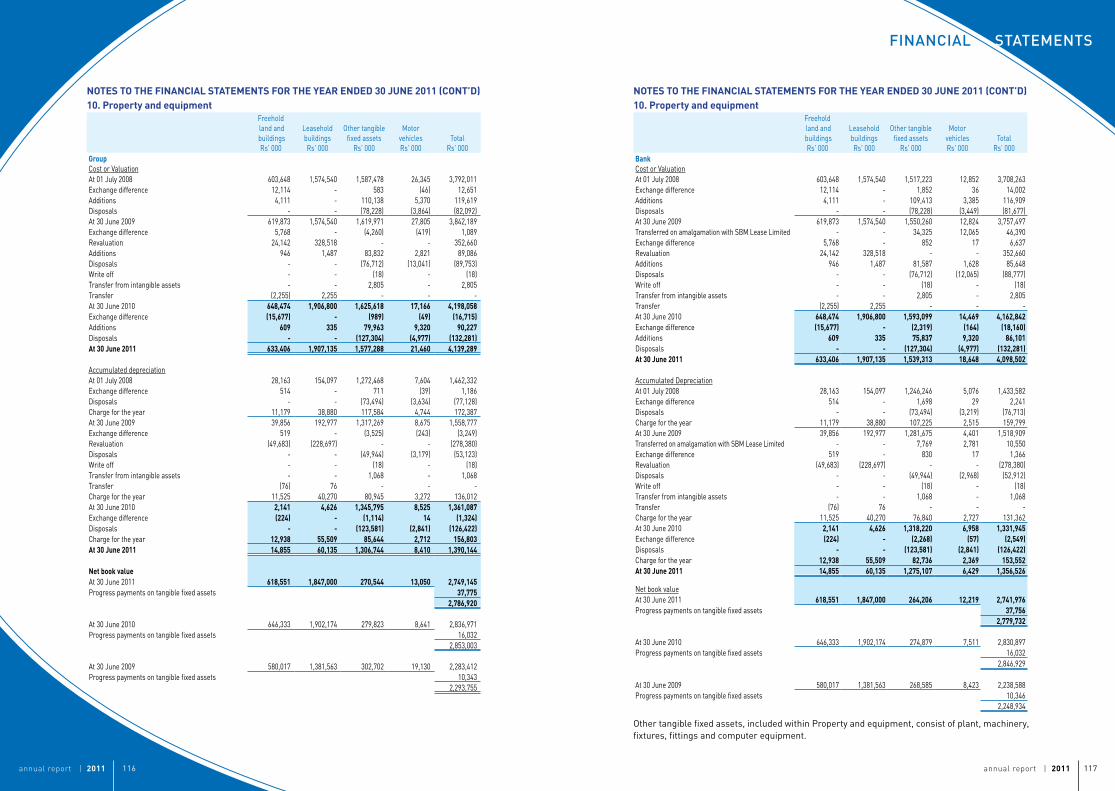
NOTESTOTHEFINANCIALSTATEMENTSFORTHEYEARENDED30JUNE2011(CONT’D)10.Propertyandequipment
Freehold land and buildings
Rs' 000
LeaseholdbuildingsRs' 000
Other tangible fixed assets
Rs' 000
MotorvehiclesRs' 000
TotalRs' 000
GroupCost or ValuationAt 01 July 2008 603,648 1,574,540 1,587,478 26,345 3,792,011 Exchange difference 12,114 - 583 (46) 12,651 Additions 4,111 - 110,138 5,370 119,619 Disposals - - (78,228) (3,864) (82,092)At 30 June 2009 619,873 1,574,540 1,619,971 27,805 3,842,189 Exchange difference 5,768 - (4,260) (419) 1,089 Revaluation 24,142 328,518 - - 352,660 Additions 946 1,487 83,832 2,821 89,086 Disposals - - (76,712) (13,041) (89,753)Write off - - (18) - (18)Transfer from intangible assets - - 2,805 - 2,805 Transfer (2,255) 2,255 - - - At 30 June 2010 648,474 1,906,800 1,625,618 17,166 4,198,058Exchange difference (15,677) - (989) (49) (16,715)Additions 609 335 79,963 9,320 90,227Disposals - - (127,304) (4,977) (132,281)At30June2011 633,406 1,907,135 1,577,288 21,460 4,139,289
Accumulated depreciationAt 01 July 2008 28,163 154,097 1,272,468 7,604 1,462,332 Exchange difference 514 - 711 (39) 1,186 Disposals - - (73,494) (3,634) (77,128)Charge for the year 11,179 38,880 117,584 4,744 172,387 At 30 June 2009 39,856 192,977 1,317,269 8,675 1,558,777 Exchange difference 519 - (3,525) (243) (3,249)Revaluation (49,683) (228,697) - - (278,380)Disposals - - (49,944) (3,179) (53,123)Write off - - (18) - (18)Transfer from intangible assets - - 1,068 - 1,068 Transfer (76) 76 - - - Charge for the year 11,525 40,270 80,945 3,272 136,012 At 30 June 2010 2,141 4,626 1,345,795 8,525 1,361,087Exchange difference (224) - (1,114) 14 (1,324)Disposals - - (123,581) (2,841) (126,422)Charge for the year 12,938 55,509 85,644 2,712 156,803At30June2011 14,855 60,135 1,306,744 8,410 1,390,144
NetbookvalueAt 30 June 2011 618,551 1,847,000 270,544 13,050 2,749,145Progress payments on tangible fixed assets 37,775
2,786,920
At 30 June 2010 646,333 1,902,174 279,823 8,641 2,836,971 Progress payments on tangible fixed assets 16,032
2,853,003
At 30 June 2009 580,017 1,381,563 302,702 19,130 2,283,412 Progress payments on tangible fixed assets 10,343
2,293,755
annual report | 2011 117annual report | 2011 116
STaTeMenTSFinancial
NOTESTOTHEFINANCIALSTATEMENTSFORTHEYEARENDED30JUNE2011(CONT’D)10.Propertyandequipment
Freehold land and buildings
Rs' 000
LeaseholdbuildingsRs' 000
Other tangible fixed assets
Rs' 000
MotorvehiclesRs' 000
TotalRs' 000
BankCost or ValuationAt 01 July 2008 603,648 1,574,540 1,517,223 12,852 3,708,263 Exchange difference 12,114 - 1,852 36 14,002 Additions 4,111 - 109,413 3,385 116,909 Disposals - - (78,228) (3,449) (81,677)At 30 June 2009 619,873 1,574,540 1,550,260 12,824 3,757,497 Transferred on amalgamation with SBM Lease Limited - - 34,325 12,065 46,390 Exchange difference 5,768 - 852 17 6,637 Revaluation 24,142 328,518 - - 352,660 Additions 946 1,487 81,587 1,628 85,648 Disposals - - (76,712) (12,065) (88,777)Write off - - (18) - (18)Transfer from intangible assets - - 2,805 - 2,805 Transfer (2,255) 2,255 - - - At 30 June 2010 648,474 1,906,800 1,593,099 14,469 4,162,842Exchange difference (15,677) - (2,319) (164) (18,160)Additions 609 335 75,837 9,320 86,101Disposals - - (127,304) (4,977) (132,281)At30June2011 633,406 1,907,135 1,539,313 18,648 4,098,502
Accumulated DepreciationAt 01 July 2008 28,163 154,097 1,246,246 5,076 1,433,582 Exchange difference 514 - 1,698 29 2,241 Disposals - - (73,494) (3,219) (76,713)Charge for the year 11,179 38,880 107,225 2,515 159,799 At 30 June 2009 39,856 192,977 1,281,675 4,401 1,518,909 Transferred on amalgamation with SBM Lease Limited - - 7,769 2,781 10,550 Exchange difference 519 - 830 17 1,366 Revaluation (49,683) (228,697) - - (278,380)Disposals - - (49,944) (2,968) (52,912)Write off - - (18) - (18)Transfer from intangible assets - - 1,068 - 1,068 Transfer (76) 76 - - - Charge for the year 11,525 40,270 76,840 2,727 131,362 At 30 June 2010 2,141 4,626 1,318,220 6,958 1,331,945Exchange difference (224) - (2,268) (57) (2,549)Disposals - - (123,581) (2,841) (126,422)Charge for the year 12,938 55,509 82,736 2,369 153,552At30June2011 14,855 60,135 1,275,107 6,429 1,356,526
Net book valueAt 30 June 2011 618,551 1,847,000 264,206 12,219 2,741,976Progress payments on tangible fixed assets 37,756
2,779,732
At 30 June 2010 646,333 1,902,174 274,879 7,511 2,830,897 Progress payments on tangible fixed assets 16,032
2,846,929
At 30 June 2009 580,017 1,381,563 268,585 8,423 2,238,588 Progress payments on tangible fixed assets 10,346
2,248,934
Other tangible fixed assets, included within Property and equipment, consist of plant, machinery, fixtures, fittings and computer equipment.
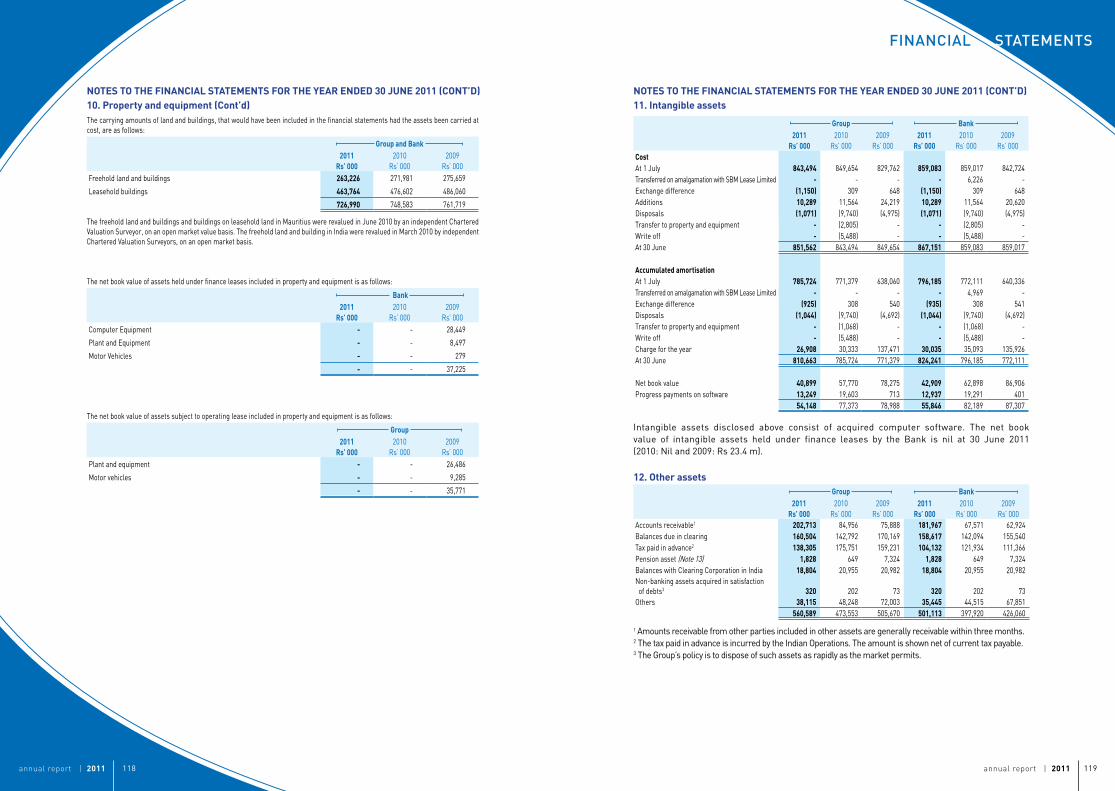
annual report | 2011 119annual report | 2011 118
STaTeMenTSFinancial
NOTESTOTHEFINANCIALSTATEMENTSFORTHEYEARENDED30JUNE2011(CONT’D)10.Propertyandequipment(Cont’d)
NOTESTOTHEFINANCIALSTATEMENTSFORTHEYEARENDED30JUNE2011(CONT’D)11.Intangibleassets
Group Bank2011
Rs’0002010
Rs’ 0002009
Rs’ 0002011
Rs’0002010
Rs’ 0002009
Rs’ 000CostAt 1 July 843,494 849,654 829,762 859,083 859,017 842,724 Transferred on amalgamation with SBM Lease Limited - - - - 6,226 - Exchange difference (1,150) 309 648 (1,150) 309 648 Additions 10,289 11,564 24,219 10,289 11,564 20,620 Disposals (1,071) (9,740) (4,975) (1,071) (9,740) (4,975)Transfer to property and equipment - (2,805) - - (2,805) - Write off - (5,488) - - (5,488) - At 30 June 851,562 843,494 849,654 867,151 859,083 859,017
AccumulatedamortisationAt 1 July 785,724 771,379 638,060 796,185 772,111 640,336 Transferred on amalgamation with SBM Lease Limited - - - - 4,969 - Exchange difference (925) 308 540 (935) 308 541 Disposals (1,044) (9,740) (4,692) (1,044) (9,740) (4,692)Transfer to property and equipment - (1,068) - - (1,068) - Write off - (5,488) - - (5,488) - Charge for the year 26,908 30,333 137,471 30,035 35,093 135,926 At 30 June 810,663 785,724 771,379 824,241 796,185 772,111
Net book value 40,899 57,770 78,275 42,909 62,898 86,906 Progress payments on software 13,249 19,603 713 12,937 19,291 401
54,148 77,373 78,988 55,846 82,189 87,307
Intangible assets disclosed above consist of acquired computer software. The net book value of intangible assets held under finance leases by the Bank is nil at 30 June 2011 (2010: Nil and 2009: Rs 23.4 m).
12.OtherassetsGroup Bank
2011Rs’000
2010Rs’ 000
2009Rs’ 000
2011Rs’000
2010Rs’ 000
2009Rs’ 000
Accounts receivable1 202,713 84,956 75,888 181,967 67,571 62,924 Balances due in clearing 160,504 142,792 170,169 158,617 142,094 155,540 Tax paid in advance2 138,305 175,751 159,231 104,132 121,934 111,366 Pension asset (Note 13) 1,828 649 7,324 1,828 649 7,324 Balances with Clearing Corporation in India 18,804 20,955 20,982 18,804 20,955 20,982 Non-banking assets acquired in satisfaction of debts3 320 202 73 320 202 73 Others 38,115 48,248 72,003 35,445 44,515 67,851
560,589 473,553 505,670 501,113 397,920 426,060
1 Amounts receivable from other parties included in other assets are generally receivable within three months.2 The tax paid in advance is incurred by the Indian Operations. The amount is shown net of current tax payable.3 The Group’s policy is to dispose of such assets as rapidly as the market permits.
The carrying amounts of land and buildings, that would have been included in the financial statements had the assets been carried at cost, are as follows:
GroupandBank2011
Rs’0002010
Rs’ 0002009
Rs’ 000Freehold land and buildings 263,226 271,981 275,659
Leasehold buildings 463,764 476,602 486,060
726,990 748,583 761,719
The freehold land and buildings and buildings on leasehold land in Mauritius were revalued in June 2010 by an independent Chartered Valuation Surveyor, on an open market value basis. The freehold land and building in India were revalued in March 2010 by independent Chartered Valuation Surveyors, on an open market basis.
The net book value of assets held under finance leases included in property and equipment is as follows:
Bank2011
Rs’0002010
Rs’ 0002009
Rs’ 000Computer Equipment - - 28,449
Plant and Equipment - - 8,497
Motor Vehicles - - 279
- - 37,225
The net book value of assets subject to operating lease included in property and equipment is as follows:
Group2011
Rs’0002010
Rs’ 0002009
Rs’ 000Plant and equipment - - 26,486
Motor vehicles - - 9,285
- - 35,771
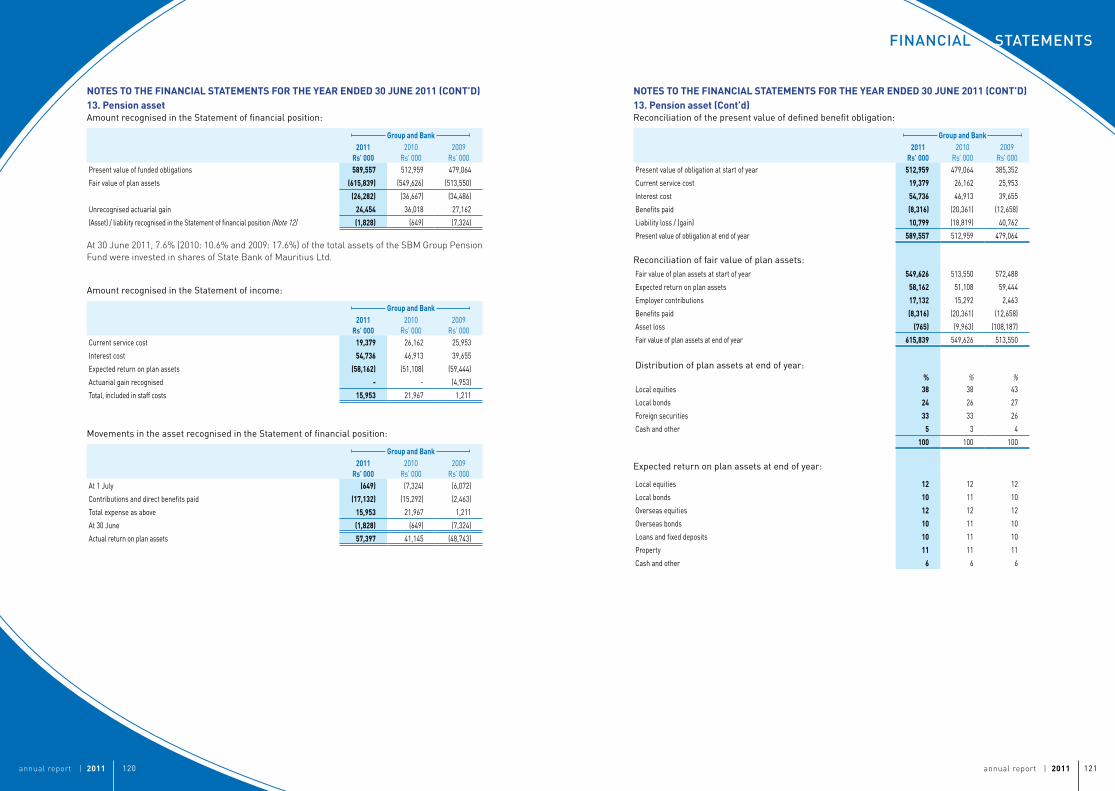
annual report | 2011 121annual report | 2011 120
STaTeMenTSFinancial
NOTESTOTHEFINANCIALSTATEMENTSFORTHEYEARENDED30JUNE2011(CONT’D)13.PensionassetAmount recognised in the Statement of financial position:
GroupandBank2011
Rs’0002010
Rs’ 0002009
Rs’ 000Present value of funded obligations 589,557 512,959 479,064
Fair value of plan assets (615,839) (549,626) (513,550)
(26,282) (36,667) (34,486)
Unrecognised actuarial gain 24,454 36,018 27,162
(Asset) / liability recognised in the Statement of financial position (Note 12) (1,828) (649) (7,324)
At 30 June 2011, 7.6% (2010: 10.6% and 2009: 17.6%) of the total assets of the SBM Group Pension Fund were invested in shares of State Bank of Mauritius Ltd.
Amount recognised in the Statement of income:
GroupandBank2011
Rs’0002010
Rs’ 0002009
Rs’ 000Current service cost 19,379 26,162 25,953
Interest cost 54,736 46,913 39,655
Expected return on plan assets (58,162) (51,108) (59,444)
Actuarial gain recognised - - (4,953)
Total, included in staff costs 15,953 21,967 1,211
Movements in the asset recognised in the Statement of financial position:
GroupandBank2011
Rs’0002010
Rs’ 0002009
Rs’ 000At 1 July (649) (7,324) (6,072)
Contributions and direct benefits paid (17,132) (15,292) (2,463)
Total expense as above 15,953 21,967 1,211
At 30 June (1,828) (649) (7,324)
Actual return on plan assets 57,397 41,145 (48,743)
NOTESTOTHEFINANCIALSTATEMENTSFORTHEYEARENDED30JUNE2011(CONT’D)13.Pensionasset(Cont’d)Reconciliation of the present value of defined benefit obligation:
GroupandBank2011
Rs’0002010
Rs’ 0002009
Rs’ 000Present value of obligation at start of year 512,959 479,064 385,352
Current service cost 19,379 26,162 25,953
Interest cost 54,736 46,913 39,655
Benefits paid (8,316) (20,361) (12,658)
Liability loss / (gain) 10,799 (18,819) 40,762
Present value of obligation at end of year 589,557 512,959 479,064
Reconciliation of fair value of plan assets:Fair value of plan assets at start of year 549,626 513,550 572,488
Expected return on plan assets 58,162 51,108 59,444
Employer contributions 17,132 15,292 2,463
Benefits paid (8,316) (20,361) (12,658)
Asset loss (765) (9,963) (108,187)
Fair value of plan assets at end of year 615,839 549,626 513,550
Distribution of plan assets at end of year:% % %
Local equities 38 38 43
Local bonds 24 26 27
Foreign securities 33 33 26
Cash and other 5 3 4
100 100 100
Expected return on plan assets at end of year:
Local equities 12 12 12
Local bonds 10 11 10
Overseas equities 12 12 12
Overseas bonds 10 11 10
Loans and fixed deposits 10 11 10
Property 11 11 11
Cash and other 6 6 6
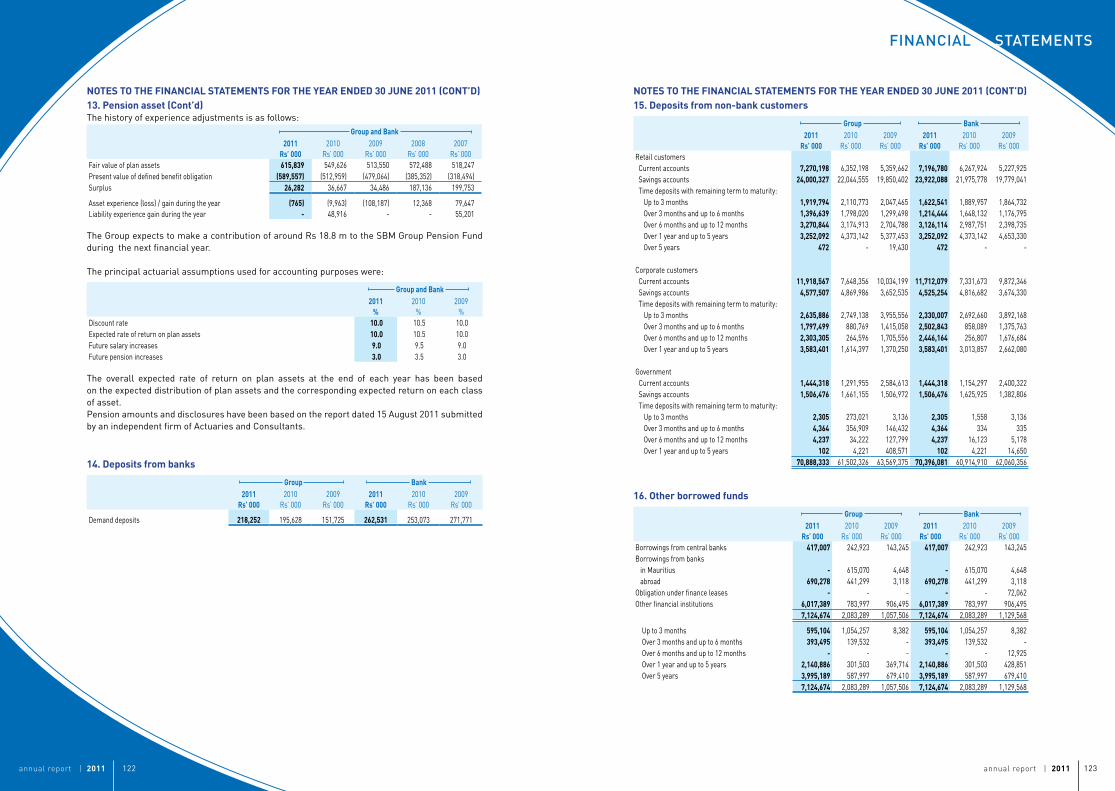
annual report | 2011 123annual report | 2011 122
STaTeMenTSFinancial
NOTESTOTHEFINANCIALSTATEMENTSFORTHEYEARENDED30JUNE2011(CONT’D)13.Pensionasset(Cont’d)The history of experience adjustments is as follows:
GroupandBank2011
Rs’0002010
Rs’ 0002009
Rs’ 0002008
Rs’ 0002007
Rs’ 000Fair value of plan assets 615,839 549,626 513,550 572,488 518,247 Present value of defined benefit obligation (589,557) (512,959) (479,064) (385,352) (318,494)Surplus 26,282 36,667 34,486 187,136 199,753
Asset experience (loss) / gain during the year (765) (9,963) (108,187) 12,368 79,647 Liability experience gain during the year - 48,916 - - 55,201
The Group expects to make a contribution of around Rs 18.8 m to the SBM Group Pension Fund during the next financial year.
The principal actuarial assumptions used for accounting purposes were:
GroupandBank2011
%2010
%2009
%Discount rate 10.0 10.5 10.0 Expected rate of return on plan assets 10.0 10.5 10.0 Future salary increases 9.0 9.5 9.0 Future pension increases 3.0 3.5 3.0
The overall expected rate of return on plan assets at the end of each year has been based on the expected distribution of plan assets and the corresponding expected return on each class of asset.Pension amounts and disclosures have been based on the report dated 15 August 2011 submitted by an independent firm of Actuaries and Consultants.
14.Depositsfrombanks
Group Bank2011
Rs’0002010
Rs’ 0002009
Rs’ 0002011
Rs’0002010
Rs’ 0002009
Rs’ 000
Demand deposits 218,252 195,628 151,725 262,531 253,073 271,771
NOTESTOTHEFINANCIALSTATEMENTSFORTHEYEARENDED30JUNE2011(CONT’D)15.Depositsfromnon-bankcustomers
Group Bank2011
Rs’0002010
Rs’ 0002009
Rs’ 0002011
Rs’0002010
Rs’ 0002009
Rs’ 000Retail customers Current accounts 7,270,198 6,352,198 5,359,662 7,196,780 6,267,924 5,227,925 Savings accounts 24,000,327 22,044,555 19,850,402 23,922,088 21,975,778 19,779,041 Time deposits with remaining term to maturity: Up to 3 months 1,919,794 2,110,773 2,047,465 1,622,541 1,889,957 1,864,732 Over 3 months and up to 6 months 1,396,639 1,798,020 1,299,498 1,214,444 1,648,132 1,176,795 Over 6 months and up to 12 months 3,270,844 3,174,913 2,704,788 3,126,114 2,987,751 2,398,735 Over 1 year and up to 5 years 3,252,092 4,373,142 5,377,453 3,252,092 4,373,142 4,653,330 Over 5 years 472 - 19,430 472 - -
Corporate customers Current accounts 11,918,567 7,648,356 10,034,199 11,712,079 7,331,673 9,872,346 Savings accounts 4,577,507 4,869,986 3,652,535 4,525,254 4,816,682 3,674,330 Time deposits with remaining term to maturity: Up to 3 months 2,635,886 2,749,138 3,955,556 2,330,007 2,692,660 3,892,168 Over 3 months and up to 6 months 1,797,499 880,769 1,415,058 2,502,843 858,089 1,375,763 Over 6 months and up to 12 months 2,303,305 264,596 1,705,556 2,446,164 256,807 1,676,684 Over 1 year and up to 5 years 3,583,401 1,614,397 1,370,250 3,583,401 3,013,857 2,662,080
Government Current accounts 1,444,318 1,291,955 2,584,613 1,444,318 1,154,297 2,400,322 Savings accounts 1,506,476 1,661,155 1,506,972 1,506,476 1,625,925 1,382,806 Time deposits with remaining term to maturity: Up to 3 months 2,305 273,021 3,136 2,305 1,558 3,136 Over 3 months and up to 6 months 4,364 356,909 146,432 4,364 334 335 Over 6 months and up to 12 months 4,237 34,222 127,799 4,237 16,123 5,178 Over 1 year and up to 5 years 102 4,221 408,571 102 4,221 14,650
70,888,333 61,502,326 63,569,375 70,396,081 60,914,910 62,060,356
16.Otherborrowedfunds
Group Bank2011
Rs’0002010
Rs’ 0002009
Rs’ 0002011
Rs’0002010
Rs’ 0002009
Rs’ 000Borrowings from central banks 417,007 242,923 143,245 417,007 242,923 143,245 Borrowings from banks in Mauritius - 615,070 4,648 - 615,070 4,648 abroad 690,278 441,299 3,118 690,278 441,299 3,118 Obligation under finance leases - - - - - 72,062 Other financial institutions 6,017,389 783,997 906,495 6,017,389 783,997 906,495
7,124,674 2,083,289 1,057,506 7,124,674 2,083,289 1,129,568
Up to 3 months 595,104 1,054,257 8,382 595,104 1,054,257 8,382 Over 3 months and up to 6 months 393,495 139,532 - 393,495 139,532 - Over 6 months and up to 12 months - - - - - 12,925 Over 1 year and up to 5 years 2,140,886 301,503 369,714 2,140,886 301,503 428,851 Over 5 years 3,995,189 587,997 679,410 3,995,189 587,997 679,410
7,124,674 2,083,289 1,057,506 7,124,674 2,083,289 1,129,568
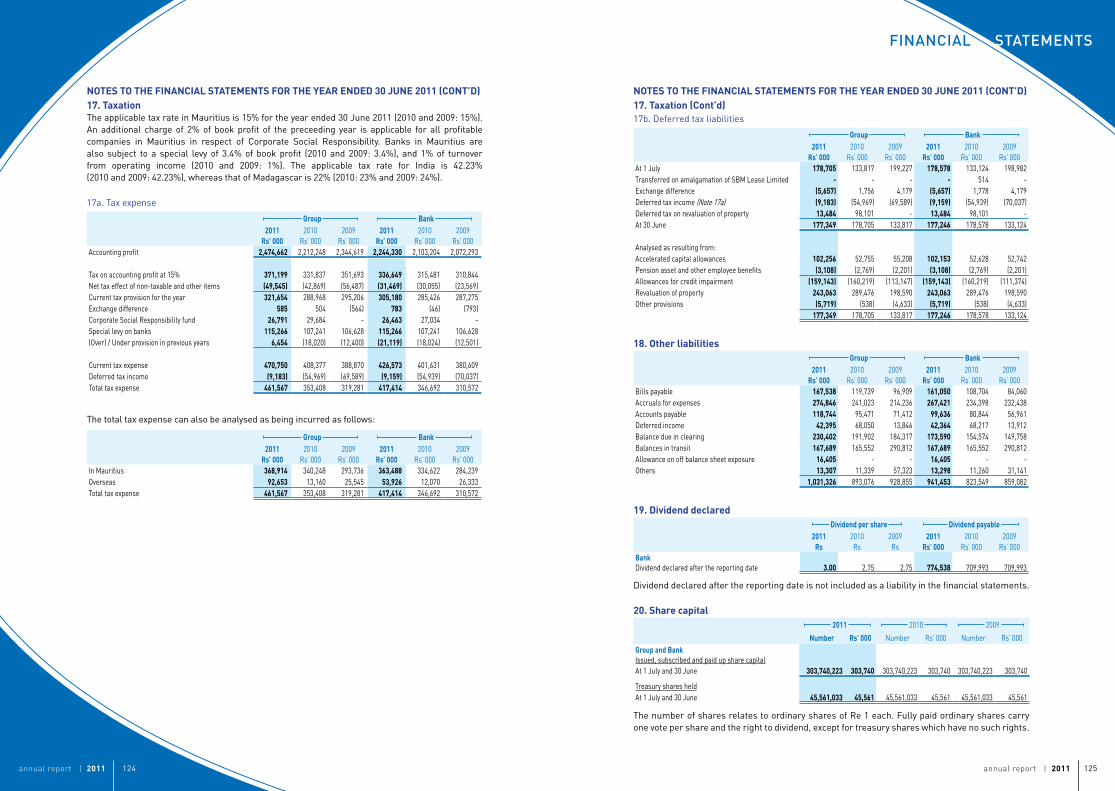
annual report | 2011 125annual report | 2011 124
STaTeMenTSFinancial
NOTESTOTHEFINANCIALSTATEMENTSFORTHEYEARENDED30JUNE2011(CONT’D)17.TaxationThe applicable tax rate in Mauritius is 15% for the year ended 30 June 2011 (2010 and 2009: 15%). An additional charge of 2% of book profit of the preceeding year is applicable for all profitable companies in Mauritius in respect of Corporate Social Responsibility. Banks in Mauritius are also subject to a special levy of 3.4% of book profit (2010 and 2009: 3.4%), and 1% of turnover from operating income (2010 and 2009: 1%). The applicable tax rate for India is 42.23% (2010 and 2009: 42.23%), whereas that of Madagascar is 22% (2010: 23% and 2009: 24%).
17a. Tax expense
Group Bank2011
Rs’0002010
Rs’ 0002009
Rs’ 0002011
Rs’0002010
Rs’ 0002009
Rs’ 000Accounting profit 2,474,662 2,212,248 2,344,619 2,244,330 2,103,204 2,072,293
Tax on accounting profit at 15% 371,199 331,837 351,693 336,649 315,481 310,844 Net tax effect of non-taxable and other items (49,545) (42,869) (56,487) (31,469) (30,055) (23,569)Current tax provision for the year 321,654 288,968 295,206 305,180 285,426 287,275 Exchange difference 585 504 (564) 783 (46) (793)Corporate Social Responsibility fund 26,791 29,684 - 26,463 27,034 - Special levy on banks 115,266 107,241 106,628 115,266 107,241 106,628 (Over) / Under provision in previous years 6,454 (18,020) (12,400) (21,119) (18,024) (12,501)
Current tax expense 470,750 408,377 388,870 426,573 401,631 380,609 Deferred tax income (9,183) (54,969) (69,589) (9,159) (54,939) (70,037)Total tax expense 461,567 353,408 319,281 417,414 346,692 310,572
The total tax expense can also be analysed as being incurred as follows:
Group Bank2011
Rs’0002010
Rs’ 0002009
Rs’ 0002011
Rs’0002010
Rs’ 0002009
Rs’ 000In Mauritius 368,914 340,248 293,736 363,488 334,622 284,239 Overseas 92,653 13,160 25,545 53,926 12,070 26,333 Total tax expense 461,567 353,408 319,281 417,414 346,692 310,572
NOTESTOTHEFINANCIALSTATEMENTSFORTHEYEARENDED30JUNE2011(CONT’D)17.Taxation(Cont’d)17b. Deferred tax liabilities
Group Bank2011
Rs’0002010
Rs’ 0002009
Rs’ 0002011
Rs’0002010
Rs’ 0002009
Rs’ 000At 1 July 178,705 133,817 199,227 178,578 133,124 198,982 Transferred on amalgamation of SBM Lease Limited - - - - 514 - Exchange difference (5,657) 1,756 4,179 (5,657) 1,778 4,179 Deferred tax income (Note 17a) (9,183) (54,969) (69,589) (9,159) (54,939) (70,037)Deferred tax on revaluation of property 13,484 98,101 - 13,484 98,101 - At 30 June 177,349 178,705 133,817 177,246 178,578 133,124
Analysed as resulting from:Accelerated capital allowances 102,256 52,755 55,208 102,153 52,628 52,742 Pension asset and other employee benefits (3,108) (2,769) (2,201) (3,108) (2,769) (2,201)Allowances for credit impairment (159,143) (160,219) (113,147) (159,143) (160,219) (111,374)Revaluation of property 243,063 289,476 198,590 243,063 289,476 198,590 Other provisions (5,719) (538) (4,633) (5,719) (538) (4,633)
177,349 178,705 133,817 177,246 178,578 133,124
18.OtherliabilitiesGroup Bank
2011Rs’000
2010Rs’ 000
2009Rs’ 000
2011Rs’000
2010Rs’ 000
2009Rs’ 000
Bills payable 167,538 119,739 96,909 161,050 108,704 84,060 Accruals for expenses 274,846 241,023 214,236 267,421 234,398 232,438 Accounts payable 118,744 95,471 71,412 99,636 80,844 56,961 Deferred income 42,395 68,050 13,846 42,364 68,217 13,912 Balance due in clearing 230,402 191,902 184,317 173,590 154,574 149,758 Balances in transit 167,689 165,552 290,812 167,689 165,552 290,812 Allowance on off balance sheet exposure 16,405 - - 16,405 - - Others 13,307 11,339 57,323 13,298 11,260 31,141
1,031,326 893,076 928,855 941,453 823,549 859,082
19.DividenddeclaredDividendpershare Dividendpayable
2011Rs
2010Rs
2009Rs
2011Rs’000
2010Rs’ 000
2009Rs’ 000
BankDividend declared after the reporting date 3.00 2.75 2.75 774,538 709,993 709,993
Dividend declared after the reporting date is not included as a liability in the financial statements.
20.Sharecapital2011 2010 2009
Number Rs’000 Number Rs’ 000 Number Rs’ 000GroupandBankIssued, subscribed and paid up share capitalAt 1 July and 30 June 303,740,223 303,740 303,740,223 303,740 303,740,223 303,740
Treasury shares heldAt 1 July and 30 June 45,561,033 45,561 45,561,033 45,561 45,561,033 45,561
The number of shares relates to ordinary shares of Re 1 each. Fully paid ordinary shares carry one vote per share and the right to dividend, except for treasury shares which have no such rights.
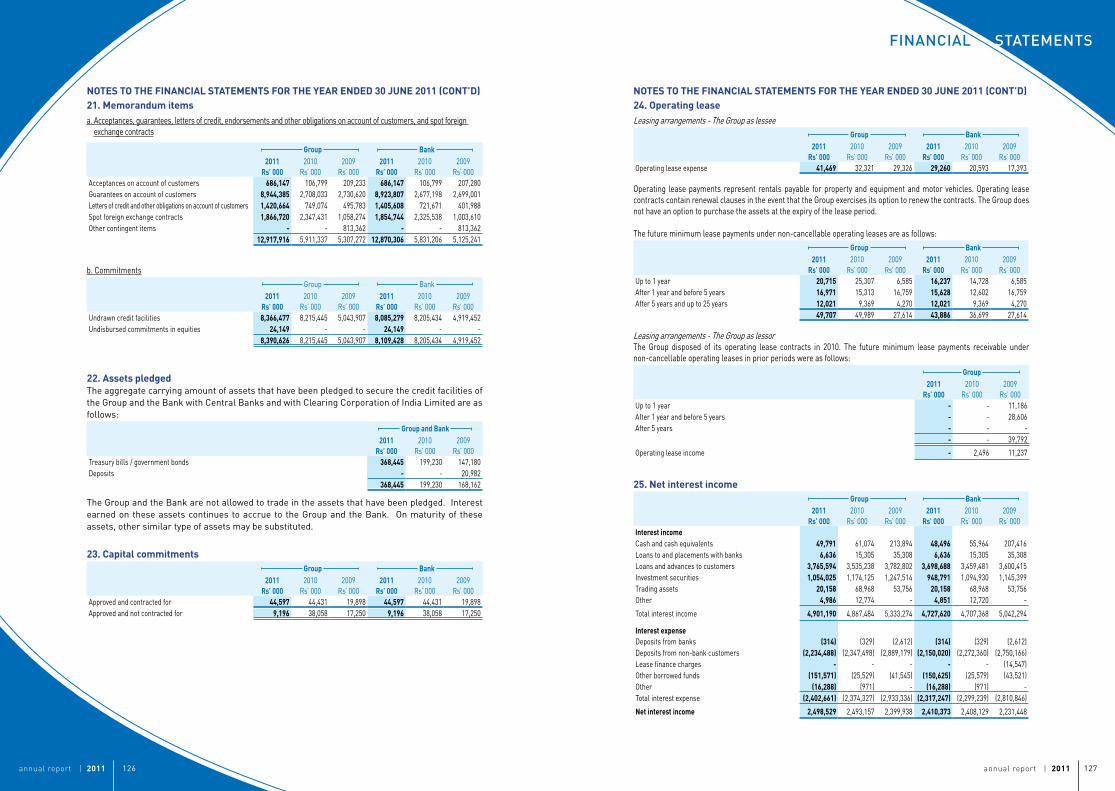
annual report | 2011 127annual report | 2011 126
STaTeMenTSFinancial
NOTESTOTHEFINANCIALSTATEMENTSFORTHEYEARENDED30JUNE2011(CONT’D)21.Memorandumitemsa. Acceptances, guarantees, letters of credit, endorsements and other obligations on account of customers, and spot foreign
exchange contracts
Group Bank2011
Rs’0002010
Rs’ 0002009
Rs’ 0002011
Rs’0002010
Rs’ 0002009
Rs’ 000Acceptances on account of customers 686,147 106,799 209,233 686,147 106,799 207,280 Guarantees on account of customers 8,944,385 2,708,033 2,730,620 8,923,807 2,677,198 2,699,001 Letters of credit and other obligations on account of customers 1,420,664 749,074 495,783 1,405,608 721,671 401,988 Spot foreign exchange contracts 1,866,720 2,347,431 1,058,274 1,854,744 2,325,538 1,003,610 Other contingent items - - 813,362 - - 813,362
12,917,916 5,911,337 5,307,272 12,870,306 5,831,206 5,125,241
b. Commitments Group Bank
2011Rs’000
2010Rs’ 000
2009Rs’ 000
2011Rs’000
2010Rs’ 000
2009Rs’ 000
Undrawn credit facilities 8,366,477 8,215,445 5,043,907 8,085,279 8,205,434 4,919,452 Undisbursed commitments in equities 24,149 - - 24,149 - -
8,390,626 8,215,445 5,043,907 8,109,428 8,205,434 4,919,452
22.AssetspledgedThe aggregate carrying amount of assets that have been pledged to secure the credit facilities of the Group and the Bank with Central Banks and with Clearing Corporation of India Limited are as follows:
GroupandBank2011
Rs’0002010
Rs’ 0002009
Rs’ 000Treasury bills / government bonds 368,445 199,230 147,180 Deposits - - 20,982
368,445 199,230 168,162
The Group and the Bank are not allowed to trade in the assets that have been pledged. Interest earned on these assets continues to accrue to the Group and the Bank. On maturity of these assets, other similar type of assets may be substituted.
23.CapitalcommitmentsGroup Bank
2011Rs’000
2010Rs’ 000
2009Rs’ 000
2011Rs’000
2010Rs’ 000
2009Rs’ 000
Approved and contracted for 44,597 44,431 19,898 44,597 44,431 19,898 Approved and not contracted for 9,196 38,058 17,250 9,196 38,058 17,250
NOTESTOTHEFINANCIALSTATEMENTSFORTHEYEARENDED30JUNE2011(CONT’D)24.OperatingleaseLeasing arrangements - The Group as lessee
Group Bank2011
Rs’0002010
Rs’ 0002009
Rs’ 0002011
Rs’0002010
Rs’ 0002009
Rs’ 000Operating lease expense 41,469 32,321 29,326 29,260 20,593 17,393
Operating lease payments represent rentals payable for property and equipment and motor vehicles. Operating lease contracts contain renewal clauses in the event that the Group exercises its option to renew the contracts. The Group does not have an option to purchase the assets at the expiry of the lease period.
The future minimum lease payments under non-cancellable operating leases are as follows:Group Bank
2011Rs’000
2010Rs’ 000
2009Rs’ 000
2011Rs’000
2010Rs’ 000
2009Rs’ 000
Up to 1 year 20,715 25,307 6,585 16,237 14,728 6,585 After 1 year and before 5 years 16,971 15,313 16,759 15,628 12,602 16,759 After 5 years and up to 25 years 12,021 9,369 4,270 12,021 9,369 4,270
49,707 49,989 27,614 43,886 36,699 27,614
Leasing arrangements - The Group as lessorThe Group disposed of its operating lease contracts in 2010. The future minimum lease payments receivable under non-cancellable operating leases in prior periods were as follows:
Group2011
Rs’0002010
Rs’ 0002009
Rs’ 000Up to 1 year - - 11,186 After 1 year and before 5 years - - 28,606 After 5 years - - - - - 39,792
Operating lease income - 2,496 11,237
25.NetinterestincomeGroup Bank
2011Rs’000
2010Rs’ 000
2009Rs’ 000
2011Rs’000
2010Rs’ 000
2009Rs’ 000
InterestincomeCash and cash equivalents 49,791 61,074 213,894 48,496 55,964 207,416 Loans to and placements with banks 6,636 15,305 35,308 6,636 15,305 35,308 Loans and advances to customers 3,765,594 3,535,238 3,782,802 3,698,688 3,459,481 3,600,415 Investment securities 1,054,025 1,174,125 1,247,514 948,791 1,094,930 1,145,399 Trading assets 20,158 68,968 53,756 20,158 68,968 53,756 Other 4,986 12,774 - 4,851 12,720 -
Total interest income 4,901,190 4,867,484 5,333,274 4,727,620 4,707,368 5,042,294
InterestexpenseDeposits from banks (314) (329) (2,612) (314) (329) (2,612)Deposits from non-bank customers (2,234,488) (2,347,498) (2,889,179) (2,150,020) (2,272,360) (2,750,166)Lease finance charges - - - - - (14,547)Other borrowed funds (151,571) (25,529) (41,545) (150,625) (25,579) (43,521)Other (16,288) (971) - (16,288) (971) - Total interest expense (2,402,661) (2,374,327) (2,933,336) (2,317,247) (2,299,239) (2,810,846)
Netinterestincome 2,498,529 2,493,157 2,399,938 2,410,373 2,408,129 2,231,448
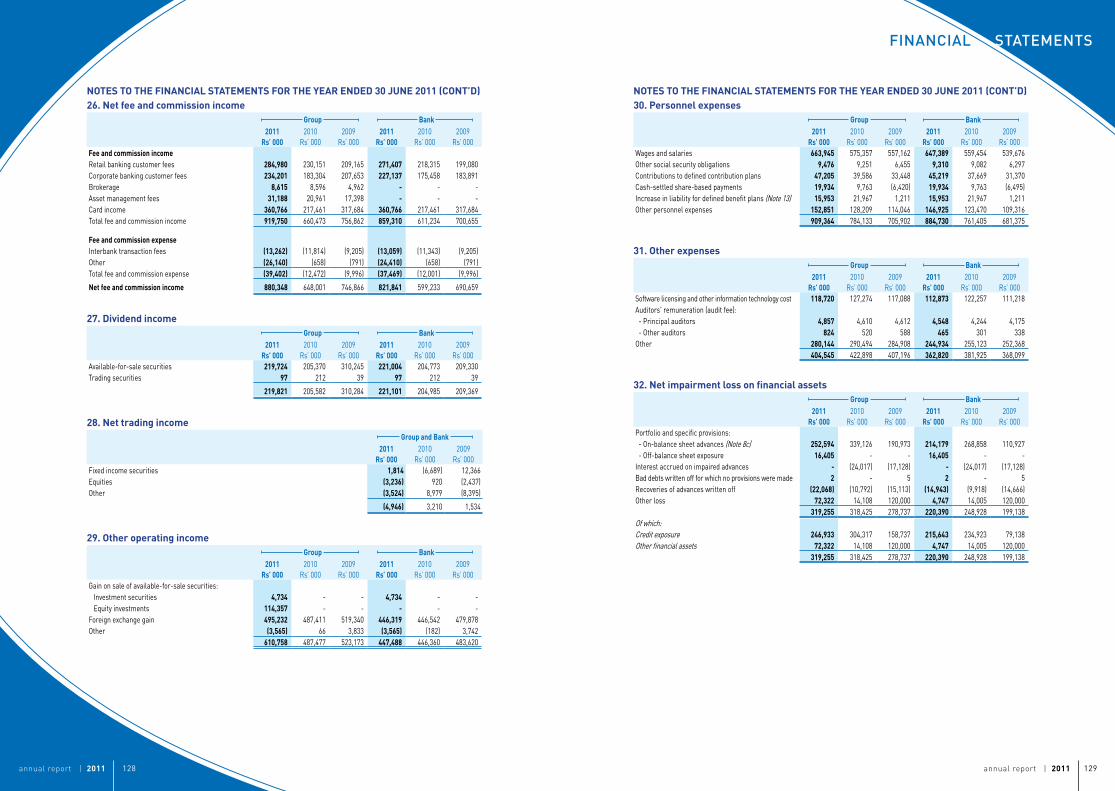
annual report | 2011 129annual report | 2011 128
STaTeMenTSFinancial
NOTESTOTHEFINANCIALSTATEMENTSFORTHEYEARENDED30JUNE2011(CONT’D)26.Netfeeandcommissionincome
Group Bank2011
Rs’0002010
Rs’ 0002009
Rs’ 0002011
Rs’0002010
Rs’ 0002009
Rs’ 000FeeandcommissionincomeRetail banking customer fees 284,980 230,151 209,165 271,407 218,315 199,080 Corporate banking customer fees 234,201 183,304 207,653 227,137 175,458 183,891 Brokerage 8,615 8,596 4,962 - - - Asset management fees 31,188 20,961 17,398 - - - Card income 360,766 217,461 317,684 360,766 217,461 317,684 Total fee and commission income 919,750 660,473 756,862 859,310 611,234 700,655
FeeandcommissionexpenseInterbank transaction fees (13,262) (11,814) (9,205) (13,059) (11,343) (9,205)Other (26,140) (658) (791) (24,410) (658) (791)Total fee and commission expense (39,402) (12,472) (9,996) (37,469) (12,001) (9,996)
Netfeeandcommissionincome 880,348 648,001 746,866 821,841 599,233 690,659
27.DividendincomeGroup Bank
2011Rs’000
2010Rs’ 000
2009Rs’ 000
2011Rs’000
2010Rs’ 000
2009Rs’ 000
Available-for-sale securities 219,724 205,370 310,245 221,004 204,773 209,330 Trading securities 97 212 39 97 212 39
219,821 205,582 310,284 221,101 204,985 209,369
28.NettradingincomeGroupandBank
2011Rs’000
2010Rs’ 000
2009Rs’ 000
Fixed income securities 1,814 (6,689) 12,366 Equities (3,236) 920 (2,437)Other (3,524) 8,979 (8,395)
(4,946) 3,210 1,534
29.OtheroperatingincomeGroup Bank
2011Rs’000
2010Rs’ 000
2009Rs’ 000
2011Rs’000
2010Rs’ 000
2009Rs’ 000
Gain on sale of available-for-sale securities: Investment securities 4,734 - - 4,734 - - Equity investments 114,357 - - - - - Foreign exchange gain 495,232 487,411 519,340 446,319 446,542 479,878 Other (3,565) 66 3,833 (3,565) (182) 3,742
610,758 487,477 523,173 447,488 446,360 483,620
NOTESTOTHEFINANCIALSTATEMENTSFORTHEYEARENDED30JUNE2011(CONT’D)30.Personnelexpenses
Group Bank2011
Rs’0002010
Rs’ 0002009
Rs’ 0002011
Rs’0002010
Rs’ 0002009
Rs’ 000Wages and salaries 663,945 575,357 557,162 647,389 559,454 539,676 Other social security obligations 9,476 9,251 6,455 9,310 9,082 6,297 Contributions to defined contribution plans 47,205 39,586 33,448 45,219 37,669 31,370 Cash-settled share-based payments 19,934 9,763 (6,420) 19,934 9,763 (6,495)Increase in liability for defined benefit plans (Note 13) 15,953 21,967 1,211 15,953 21,967 1,211 Other personnel expenses 152,851 128,209 114,046 146,925 123,470 109,316
909,364 784,133 705,902 884,730 761,405 681,375
31.OtherexpensesGroup Bank
2011Rs’000
2010Rs’ 000
2009Rs’ 000
2011Rs’000
2010Rs’ 000
2009Rs’ 000
Software licensing and other information technology cost 118,720 127,274 117,088 112,873 122,257 111,218 Auditors' remuneration (audit fee): - Principal auditors 4,857 4,610 4,612 4,548 4,244 4,175 - Other auditors 824 520 588 465 301 338 Other 280,144 290,494 284,908 244,934 255,123 252,368
404,545 422,898 407,196 362,820 381,925 368,099
32.NetimpairmentlossonfinancialassetsGroup Bank
2011Rs’000
2010Rs’ 000
2009Rs’ 000
2011Rs’000
2010Rs’ 000
2009Rs’ 000
Portfolio and specific provisions: - On-balance sheet advances (Note 8c) 252,594 339,126 190,973 214,179 268,858 110,927 - Off-balance sheet exposure 16,405 - - 16,405 - - Interest accrued on impaired advances - (24,017) (17,128) - (24,017) (17,128)Bad debts written off for which no provisions were made 2 - 5 2 - 5 Recoveries of advances written off (22,068) (10,792) (15,113) (14,943) (9,918) (14,666)Other loss 72,322 14,108 120,000 4,747 14,005 120,000
319,255 318,425 278,737 220,390 248,928 199,138 Of which:Credit exposure 246,933 304,317 158,737 215,643 234,923 79,138 Other financial assets 72,322 14,108 120,000 4,747 14,005 120,000
319,255 318,425 278,737 220,390 248,928 199,138
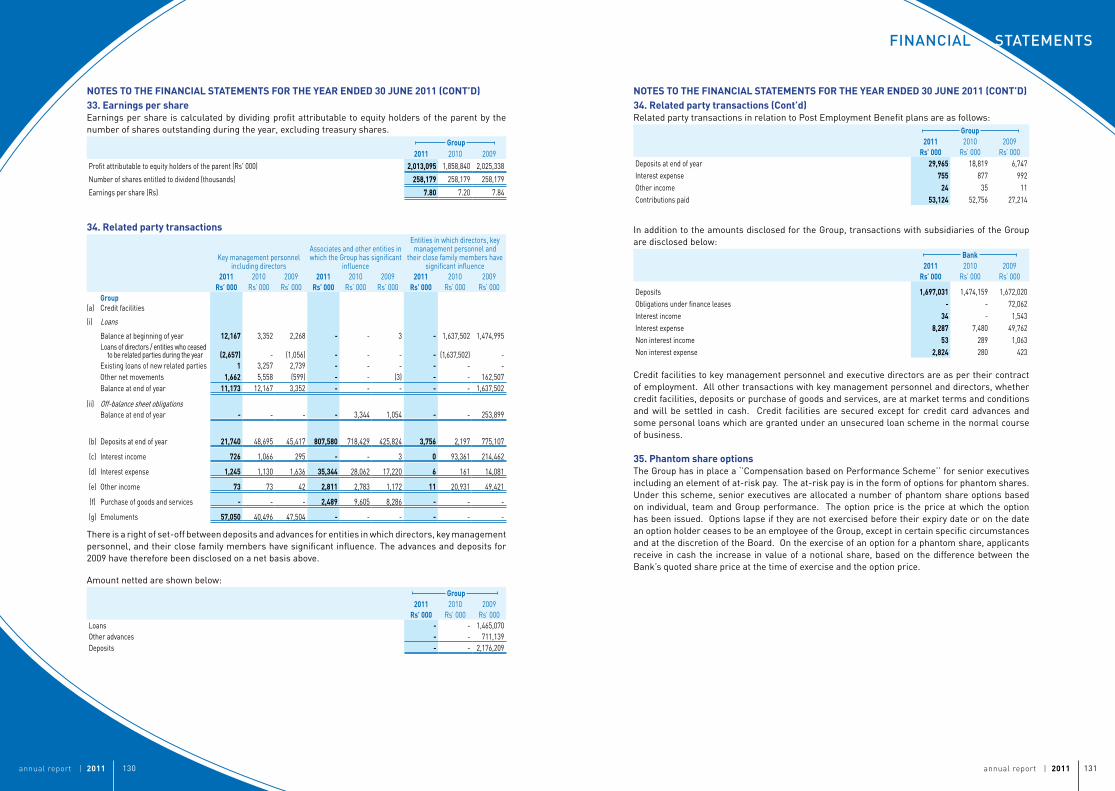
annual report | 2011 131annual report | 2011 130
STaTeMenTSFinancial
NOTESTOTHEFINANCIALSTATEMENTSFORTHEYEARENDED30JUNE2011(CONT’D)33.EarningspershareEarnings per share is calculated by dividing profit attributable to equity holders of the parent by the number of shares outstanding during the year, excluding treasury shares.
Group2011 2010 2009
Profit attributable to equity holders of the parent (Rs' 000) 2,013,095 1,858,840 2,025,338
Number of shares entitled to dividend (thousands) 258,179 258,179 258,179
Earnings per share (Rs) 7.80 7.20 7.84
34.Relatedpartytransactions
Key management personnelincluding directors
Associates and other entities in which the Group has significant
influence
Entities in which directors, key management personnel and
their close family members have significant influence
2011Rs’000
2010Rs’ 000
2009Rs’ 000
2011Rs’000
2010Rs’ 000
2009Rs’ 000
2011Rs’000
2010Rs’ 000
2009Rs’ 000
(a) GroupCredit facilities
(i) Loans
Balance at beginning of year 12,167 3,352 2,268 - - 3 - 1,637,502 1,474,995 Loans of directors / entities who ceased to be related parties during the year (2,657) - (1,056) - - - - (1,637,502) - Existing loans of new related parties 1 3,257 2,739 - - - - - - Other net movements 1,662 5,558 (599) - - (3) - - 162,507 Balance at end of year 11,173 12,167 3,352 - - - - - 1,637,502
(ii) Off-balance sheet obligations Balance at end of year - - - - 3,344 1,054 - - 253,899
(b) Deposits at end of year 21,740 48,695 45,417 807,580 718,429 425,824 3,756 2,197 775,107
(c) Interest income 726 1,066 295 - - 3 0 93,361 214,462
(d) Interest expense 1,245 1,130 1,636 35,344 28,062 17,220 6 161 14,081
(e) Other income 73 73 42 2,811 2,783 1,172 11 20,931 49,421
(f) Purchase of goods and services - - - 2,489 9,605 8,286 - - -
(g) Emoluments 57,050 40,496 47,504 - - - - - -
There is a right of set-off between deposits and advances for entities in which directors, key management personnel, and their close family members have significant influence. The advances and deposits for 2009 have therefore been disclosed on a net basis above.
Amount netted are shown below:Group
2011Rs’000
2010Rs’ 000
2009Rs’ 000
Loans - - 1,465,070 Other advances - - 711,139 Deposits - - 2,176,209
NOTESTOTHEFINANCIALSTATEMENTSFORTHEYEARENDED30JUNE2011(CONT’D)34.Relatedpartytransactions(Cont’d)Related party transactions in relation to Post Employment Benefit plans are as follows:
Group2011
Rs’0002010
Rs’ 0002009
Rs’ 000Deposits at end of year 29,965 18,819 6,747 Interest expense 755 877 992 Other income 24 35 11 Contributions paid 53,124 52,756 27,214
In addition to the amounts disclosed for the Group, transactions with subsidiaries of the Group are disclosed below:
Bank2011
Rs’0002010
Rs’ 0002009
Rs’ 000
Deposits 1,697,031 1,474,159 1,672,020 Obligations under finance leases - - 72,062 Interest income 34 - 1,543 Interest expense 8,287 7,480 49,762 Non interest income 53 289 1,063 Non interest expense 2,824 280 423
Credit facilities to key management personnel and executive directors are as per their contract of employment. All other transactions with key management personnel and directors, whether credit facilities, deposits or purchase of goods and services, are at market terms and conditions and will be settled in cash. Credit facilities are secured except for credit card advances and some personal loans which are granted under an unsecured loan scheme in the normal course of business.
35.PhantomshareoptionsThe Group has in place a ‘’Compensation based on Performance Scheme’’ for senior executives including an element of at-risk pay. The at-risk pay is in the form of options for phantom shares. Under this scheme, senior executives are allocated a number of phantom share options based on individual, team and Group performance. The option price is the price at which the option has been issued. Options lapse if they are not exercised before their expiry date or on the date an option holder ceases to be an employee of the Group, except in certain specific circumstances and at the discretion of the Board. On the exercise of an option for a phantom share, applicants receive in cash the increase in value of a notional share, based on the difference between the Bank’s quoted share price at the time of exercise and the option price.
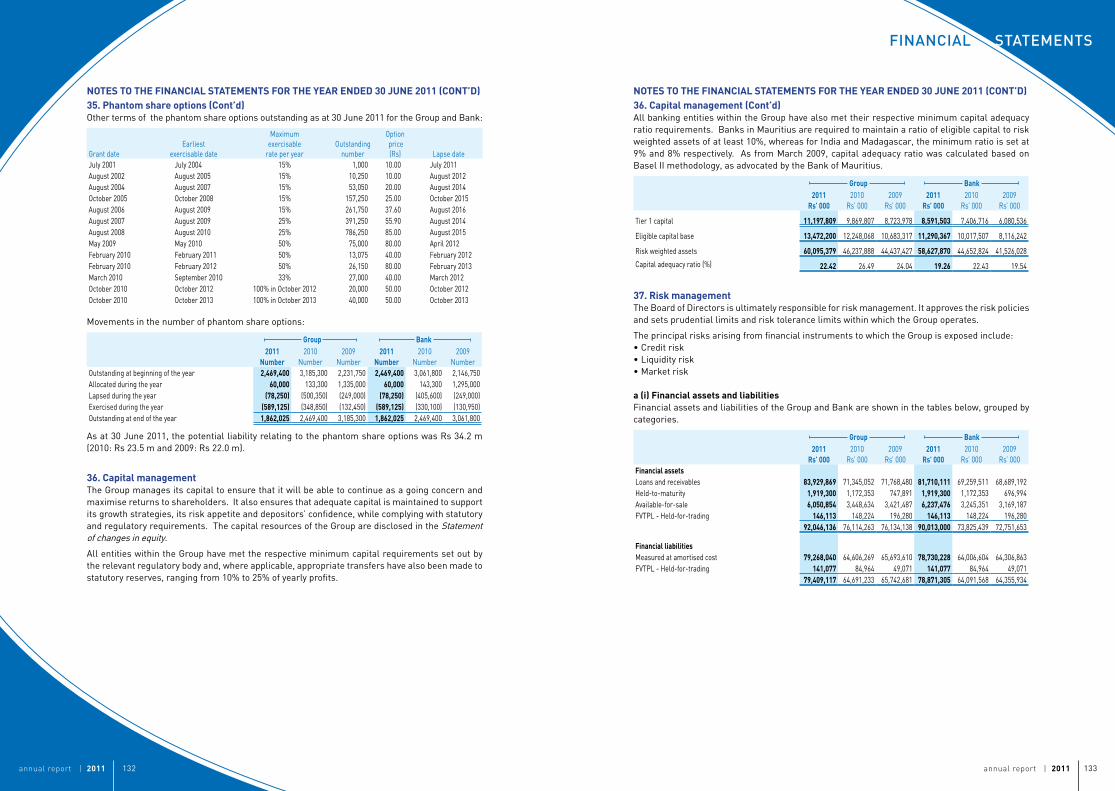
annual report | 2011 133annual report | 2011 132
STaTeMenTSFinancial
NOTESTOTHEFINANCIALSTATEMENTSFORTHEYEARENDED30JUNE2011(CONT’D)35.Phantomshareoptions(Cont’d)Other terms of the phantom share options outstanding as at 30 June 2011 for the Group and Bank:
Grant dateEarliest
exercisable date
Maximum exercisable
rate per yearOutstanding
number
Option price(Rs) Lapse date
July 2001 July 2004 15% 1,000 10.00 July 2011August 2002 August 2005 15% 10,250 10.00 August 2012August 2004 August 2007 15% 53,050 20.00 August 2014October 2005 October 2008 15% 157,250 25.00 October 2015August 2006 August 2009 15% 261,750 37.60 August 2016August 2007 August 2009 25% 391,250 55.90 August 2014August 2008 August 2010 25% 786,250 85.00 August 2015May 2009 May 2010 50% 75,000 80.00 April 2012February 2010 February 2011 50% 13,075 40.00 February 2012February 2010 February 2012 50% 26,150 80.00 February 2013March 2010 September 2010 33% 27,000 40.00 March 2012October 2010 October 2012 100% in October 2012 20,000 50.00 October 2012October 2010 October 2013 100% in October 2013 40,000 50.00 October 2013
Movements in the number of phantom share options:
Group Bank2011
Number2010
Number2009
Number2011
Number2010
Number2009
NumberOutstanding at beginning of the year 2,469,400 3,185,300 2,231,750 2,469,400 3,061,800 2,146,750 Allocated during the year 60,000 133,300 1,335,000 60,000 143,300 1,295,000 Lapsed during the year (78,250) (500,350) (249,000) (78,250) (405,600) (249,000)Exercised during the year (589,125) (348,850) (132,450) (589,125) (330,100) (130,950)Outstanding at end of the year 1,862,025 2,469,400 3,185,300 1,862,025 2,469,400 3,061,800
As at 30 June 2011, the potential liability relating to the phantom share options was Rs 34.2 m (2010: Rs 23.5 m and 2009: Rs 22.0 m).
36.CapitalmanagementThe Group manages its capital to ensure that it will be able to continue as a going concern and maximise returns to shareholders. It also ensures that adequate capital is maintained to support its growth strategies, its risk appetite and depositors’ confidence, while complying with statutory and regulatory requirements. The capital resources of the Group are disclosed in the Statement of changes in equity.
All entities within the Group have met the respective minimum capital requirements set out by the relevant regulatory body and, where applicable, appropriate transfers have also been made to statutory reserves, ranging from 10% to 25% of yearly profits.
NOTESTOTHEFINANCIALSTATEMENTSFORTHEYEARENDED30JUNE2011(CONT’D)36.Capitalmanagement(Cont’d)All banking entities within the Group have also met their respective minimum capital adequacy ratio requirements. Banks in Mauritius are required to maintain a ratio of eligible capital to risk weighted assets of at least 10%, whereas for India and Madagascar, the minimum ratio is set at 9% and 8% respectively. As from March 2009, capital adequacy ratio was calculated based on Basel II methodology, as advocated by the Bank of Mauritius.
Group Bank2011
Rs’0002010
Rs’ 0002009
Rs’ 0002011
Rs’0002010
Rs’ 0002009
Rs’ 000
Tier 1 capital 11,197,809 9,869,807 8,723,978 8,591,503 7,406,716 6,080,536
Eligible capital base 13,472,200 12,248,068 10,683,317 11,290,367 10,017,507 8,116,242
Risk weighted assets 60,095,379 46,237,888 44,437,427 58,627,870 44,652,824 41,526,028
Capital adequacy ratio (%) 22.42 26.49 24.04 19.26 22.43 19.54
37.RiskmanagementThe Board of Directors is ultimately responsible for risk management. It approves the risk policies and sets prudential limits and risk tolerance limits within which the Group operates.
The principal risks arising from financial instruments to which the Group is exposed include:• Credit risk• Liquidity risk• Market risk
a(i)FinancialassetsandliabilitiesFinancial assets and liabilities of the Group and Bank are shown in the tables below, grouped by categories.
Group Bank2011
Rs’0002010
Rs’ 0002009
Rs’ 0002011
Rs’0002010
Rs’ 0002009
Rs’ 000FinancialassetsLoans and receivables 83,929,869 71,345,052 71,768,480 81,710,111 69,259,511 68,689,192Held-to-maturity 1,919,300 1,172,353 747,891 1,919,300 1,172,353 696,994Available-for-sale 6,050,854 3,448,634 3,421,487 6,237,476 3,245,351 3,169,187FVTPL - Held-for-trading 146,113 148,224 196,280 146,113 148,224 196,280
92,046,136 76,114,263 76,134,138 90,013,000 73,825,439 72,751,653
FinancialliabilitiesMeasured at amortised cost 79,268,040 64,606,269 65,693,610 78,730,228 64,006,604 64,306,863FVTPL - Held-for-trading 141,077 84,964 49,071 141,077 84,964 49,071
79,409,117 64,691,233 65,742,681 78,871,305 64,091,568 64,355,934
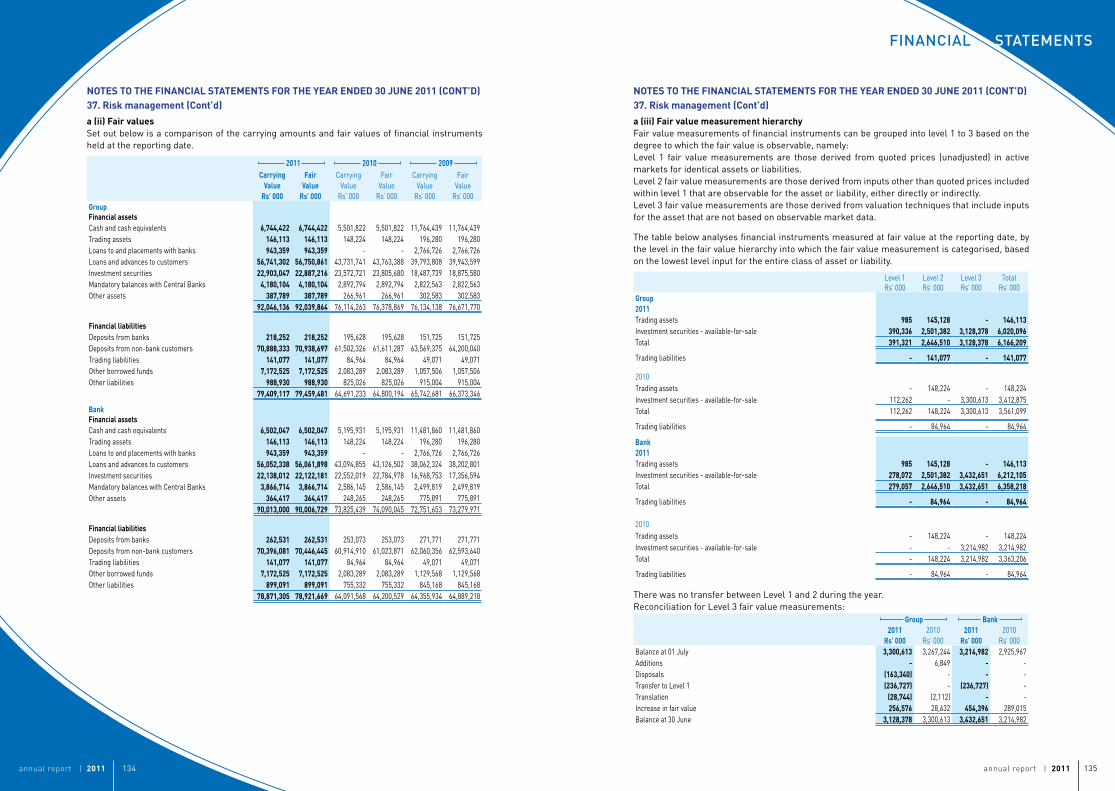
annual report | 2011 135annual report | 2011 134
STaTeMenTSFinancial
NOTESTOTHEFINANCIALSTATEMENTSFORTHEYEARENDED30JUNE2011(CONT’D)37.Riskmanagement(Cont’d)
a(ii)FairvaluesSet out below is a comparison of the carrying amounts and fair values of financial instruments held at the reporting date.
2011 2010 2009Carrying
ValueRs’000
FairValue
Rs’000
Carrying Value
Rs’ 000
Fair Value
Rs’ 000
Carrying Value
Rs’ 000
Fair Value
Rs’ 000GroupFinancialassetsCash and cash equivalents 6,744,422 6,744,422 5,501,822 5,501,822 11,764,439 11,764,439Trading assets 146,113 146,113 148,224 148,224 196,280 196,280Loans to and placements with banks 943,359 943,359 - - 2,766,726 2,766,726Loans and advances to customers 56,741,302 56,750,861 43,731,741 43,763,388 39,793,808 39,943,599Investment securities 22,903,047 22,887,216 23,572,721 23,805,680 18,487,739 18,875,580Mandatory balances with Central Banks 4,180,104 4,180,104 2,892,794 2,892,794 2,822,563 2,822,563Other assets 387,789 387,789 266,961 266,961 302,583 302,583
92,046,136 92,039,864 76,114,263 76,378,869 76,134,138 76,671,770
FinancialliabilitiesDeposits from banks 218,252 218,252 195,628 195,628 151,725 151,725Deposits from non-bank customers 70,888,333 70,938,697 61,502,326 61,611,287 63,569,375 64,200,040Trading liabilities 141,077 141,077 84,964 84,964 49,071 49,071Other borrowed funds 7,172,525 7,172,525 2,083,289 2,083,289 1,057,506 1,057,506Other liabilities 988,930 988,930 825,026 825,026 915,004 915,004
79,409,117 79,459,481 64,691,233 64,800,194 65,742,681 66,373,346
BankFinancialassetsCash and cash equivalents 6,502,047 6,502,047 5,195,931 5,195,931 11,481,860 11,481,860Trading assets 146,113 146,113 148,224 148,224 196,280 196,280Loans to and placements with banks 943,359 943,359 - - 2,766,726 2,766,726Loans and advances to customers 56,052,338 56,061,898 43,094,855 43,126,502 38,062,324 38,202,801Investment securities 22,138,012 22,122,181 22,552,019 22,784,978 16,968,753 17,356,594Mandatory balances with Central Banks 3,866,714 3,866,714 2,586,145 2,586,145 2,499,819 2,499,819Other assets 364,417 364,417 248,265 248,265 775,891 775,891
90,013,000 90,006,729 73,825,439 74,090,045 72,751,653 73,279,971
FinancialliabilitiesDeposits from banks 262,531 262,531 253,073 253,073 271,771 271,771Deposits from non-bank customers 70,396,081 70,446,445 60,914,910 61,023,871 62,060,356 62,593,640Trading liabilities 141,077 141,077 84,964 84,964 49,071 49,071Other borrowed funds 7,172,525 7,172,525 2,083,289 2,083,289 1,129,568 1,129,568Other liabilities 899,091 899,091 755,332 755,332 845,168 845,168
78,871,305 78,921,669 64,091,568 64,200,529 64,355,934 64,889,218
NOTESTOTHEFINANCIALSTATEMENTSFORTHEYEARENDED30JUNE2011(CONT’D)37.Riskmanagement(Cont’d)
a(iii)FairvaluemeasurementhierarchyFair value measurements of financial instruments can be grouped into level 1 to 3 based on the degree to which the fair value is observable, namely:Level 1 fair value measurements are those derived from quoted prices (unadjusted) in active markets for identical assets or liabilities.Level 2 fair value measurements are those derived from inputs other than quoted prices included within level 1 that are observable for the asset or liability, either directly or indirectly.Level 3 fair value measurements are those derived from valuation techniques that include inputs for the asset that are not based on observable market data.
The table below analyses financial instruments measured at fair value at the reporting date, by the level in the fair value hierarchy into which the fair value measurement is categorised, based on the lowest level input for the entire class of asset or liability.
Level 1Rs’ 000
Level 2Rs’ 000
Level 3Rs’ 000
TotalRs’ 000
Group2011Trading assets 985 145,128 - 146,113Investment securities - available-for-sale 390,336 2,501,382 3,128,378 6,020,096Total 391,321 2,646,510 3,128,378 6,166,209
Trading liabilities - 141,077 - 141,077
2010Trading assets - 148,224 - 148,224Investment securities - available-for-sale 112,262 - 3,300,613 3,412,875Total 112,262 148,224 3,300,613 3,561,099
Trading liabilities - 84,964 - 84,964
Bank2011Trading assets 985 145,128 - 146,113Investment securities - available-for-sale 278,072 2,501,382 3,432,651 6,212,105Total 279,057 2,646,510 3,432,651 6,358,218
Trading liabilities - 84,964 - 84,964
2010Trading assets - 148,224 - 148,224Investment securities - available-for-sale - - 3,214,982 3,214,982Total - 148,224 3,214,982 3,363,206
Trading liabilities - 84,964 - 84,964
There was no transfer between Level 1 and 2 during the year.Reconciliation for Level 3 fair value measurements:
Group Bank2011
Rs’0002010
Rs’ 0002011
Rs’0002010
Rs’ 000Balance at 01 July 3,300,613 3,267,244 3,214,982 2,925,967Additions - 6,849 - - Disposals (163,340) - - - Transfer to Level 1 (236,727) - (236,727) - Translation (28,744) (2,112) - - Increase in fair value 256,576 28,632 454,396 289,015Balance at 30 June 3,128,378 3,300,613 3,432,651 3,214,982
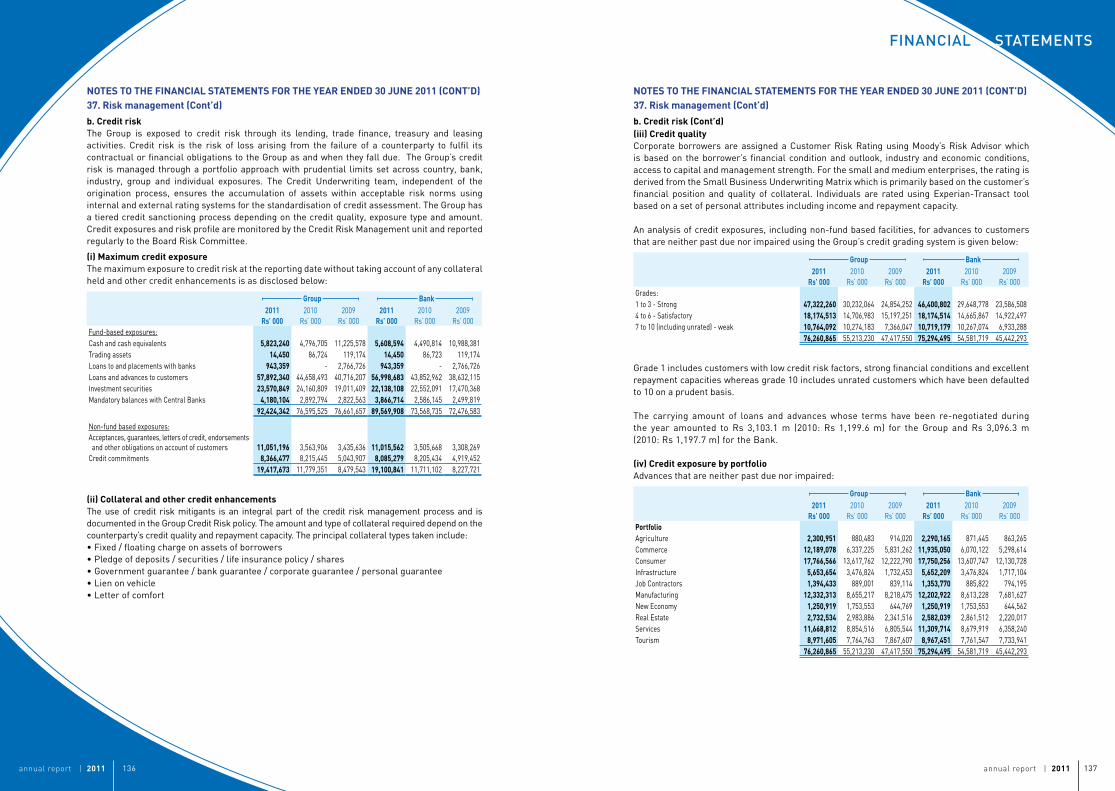
annual report | 2011 137annual report | 2011 136
STaTeMenTSFinancial
NOTESTOTHEFINANCIALSTATEMENTSFORTHEYEARENDED30JUNE2011(CONT’D)37.Riskmanagement(Cont’d)
b.CreditriskThe Group is exposed to credit risk through its lending, trade finance, treasury and leasing activities. Credit risk is the risk of loss arising from the failure of a counterparty to fulfil its contractual or financial obligations to the Group as and when they fall due. The Group’s credit risk is managed through a portfolio approach with prudential limits set across country, bank, industry, group and individual exposures. The Credit Underwriting team, independent of the origination process, ensures the accumulation of assets within acceptable risk norms using internal and external rating systems for the standardisation of credit assessment. The Group has a tiered credit sanctioning process depending on the credit quality, exposure type and amount. Credit exposures and risk profile are monitored by the Credit Risk Management unit and reported regularly to the Board Risk Committee.
(i)MaximumcreditexposureThe maximum exposure to credit risk at the reporting date without taking account of any collateral held and other credit enhancements is as disclosed below:
Group Bank2011
Rs’0002010
Rs’ 0002009
Rs’ 0002011
Rs’0002010
Rs’ 0002009
Rs’ 000Fund-based exposures:Cash and cash equivalents 5,823,240 4,796,705 11,225,578 5,608,594 4,490,814 10,988,381Trading assets 14,450 86,724 119,174 14,450 86,723 119,174Loans to and placements with banks 943,359 - 2,766,726 943,359 - 2,766,726Loans and advances to customers 57,892,340 44,658,493 40,716,207 56,998,683 43,852,962 38,632,115Investment securities 23,570,849 24,160,809 19,011,409 22,138,108 22,552,091 17,470,368Mandatory balances with Central Banks 4,180,104 2,892,794 2,822,563 3,866,714 2,586,145 2,499,819
92,424,342 76,595,525 76,661,657 89,569,908 73,568,735 72,476,583
Non-fund based exposures:Acceptances, guarantees, letters of credit, endorsements and other obligations on account of customers 11,051,196 3,563,906 3,435,636 11,015,562 3,505,668 3,308,269Credit commitments 8,366,477 8,215,445 5,043,907 8,085,279 8,205,434 4,919,452
19,417,673 11,779,351 8,479,543 19,100,841 11,711,102 8,227,721
(ii)Collateralandothercreditenhancements The use of credit risk mitigants is an integral part of the credit risk management process and is documented in the Group Credit Risk policy. The amount and type of collateral required depend on the counterparty’s credit quality and repayment capacity. The principal collateral types taken include:• Fixed / floating charge on assets of borrowers• Pledge of deposits / securities / life insurance policy / shares • Government guarantee / bank guarantee / corporate guarantee / personal guarantee • Lien on vehicle • Letter of comfort
NOTESTOTHEFINANCIALSTATEMENTSFORTHEYEARENDED30JUNE2011(CONT’D)37.Riskmanagement(Cont’d)
b.Creditrisk(Cont’d)(iii)CreditqualityCorporate borrowers are assigned a Customer Risk Rating using Moody’s Risk Advisor which is based on the borrower’s financial condition and outlook, industry and economic conditions, access to capital and management strength. For the small and medium enterprises, the rating is derived from the Small Business Underwriting Matrix which is primarily based on the customer’s financial position and quality of collateral. Individuals are rated using Experian-Transact tool based on a set of personal attributes including income and repayment capacity.
An analysis of credit exposures, including non-fund based facilities, for advances to customers that are neither past due nor impaired using the Group’s credit grading system is given below:
Group Bank2011
Rs’0002010
Rs’ 0002009
Rs’ 0002011
Rs’0002010
Rs’ 0002009
Rs’ 000Grades:1 to 3 - Strong 47,322,260 30,232,064 24,854,252 46,400,802 29,648,778 23,586,5084 to 6 - Satisfactory 18,174,513 14,706,983 15,197,251 18,174,514 14,665,867 14,922,4977 to 10 (including unrated) - weak 10,764,092 10,274,183 7,366,047 10,719,179 10,267,074 6,933,288
76,260,865 55,213,230 47,417,550 75,294,495 54,581,719 45,442,293
Grade 1 includes customers with low credit risk factors, strong financial conditions and excellent repayment capacities whereas grade 10 includes unrated customers which have been defaulted to 10 on a prudent basis. The carrying amount of loans and advances whose terms have been re-negotiated during the year amounted to Rs 3,103.1 m (2010: Rs 1,199.6 m) for the Group and Rs 3,096.3 m (2010: Rs 1,197.7 m) for the Bank.
(iv)CreditexposurebyportfolioAdvances that are neither past due nor impaired:
Group Bank2011
Rs’0002010
Rs’ 0002009
Rs’ 0002011
Rs’0002010
Rs’ 0002009
Rs’ 000PortfolioAgriculture 2,300,951 880,483 914,020 2,290,165 871,445 863,265Commerce 12,189,078 6,337,225 5,831,262 11,935,050 6,070,122 5,298,614Consumer 17,766,566 13,617,762 12,222,790 17,750,256 13,607,747 12,130,728Infrastructure 5,653,654 3,476,824 1,732,453 5,652,209 3,476,824 1,717,104Job Contractors 1,394,433 889,001 839,114 1,353,770 885,822 794,195Manufacturing 12,332,313 8,655,217 8,218,475 12,202,922 8,613,228 7,681,627New Economy 1,250,919 1,753,553 644,769 1,250,919 1,753,553 644,562Real Estate 2,732,534 2,983,886 2,341,516 2,582,039 2,861,512 2,220,017Services 11,668,812 8,854,516 6,805,544 11,309,714 8,679,919 6,358,240Tourism 8,971,605 7,764,763 7,867,607 8,967,451 7,761,547 7,733,941
76,260,865 55,213,230 47,417,550 75,294,495 54,581,719 45,442,293
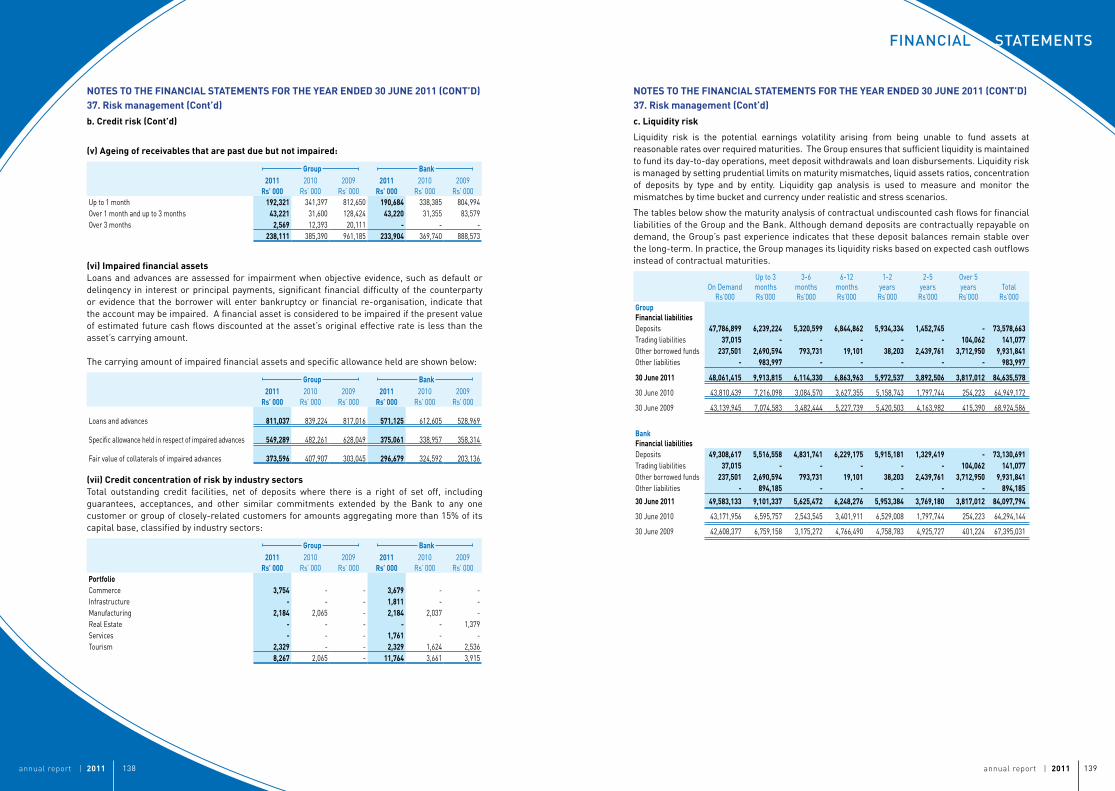
annual report | 2011 139annual report | 2011 138
STaTeMenTSFinancial
NOTESTOTHEFINANCIALSTATEMENTSFORTHEYEARENDED30JUNE2011(CONT’D)37.Riskmanagement(Cont’d)
b.Creditrisk(Cont’d)
(v)Ageingofreceivablesthatarepastduebutnotimpaired:
Group Bank2011
Rs’0002010
Rs’ 0002009
Rs’ 0002011
Rs’0002010
Rs’ 0002009
Rs’ 000Up to 1 month 192,321 341,397 812,650 190,684 338,385 804,994Over 1 month and up to 3 months 43,221 31,600 128,424 43,220 31,355 83,579Over 3 months 2,569 12,393 20,111 - - -
238,111 385,390 961,185 233,904 369,740 888,573
(vi)ImpairedfinancialassetsLoans and advances are assessed for impairment when objective evidence, such as default or delinqency in interest or principal payments, significant financial difficulty of the counterparty or evidence that the borrower will enter bankruptcy or financial re-organisation, indicate that the account may be impaired. A financial asset is considered to be impaired if the present value of estimated future cash flows discounted at the asset’s original effective rate is less than the asset’s carrying amount.
The carrying amount of impaired financial assets and specific allowance held are shown below:
Group Bank2011
Rs’0002010
Rs’ 0002009
Rs’ 0002011
Rs’0002010
Rs’ 0002009
Rs’ 000
Loans and advances 811,037 839,224 817,016 571,125 612,605 528,969
Specific allowance held in respect of impaired advances 549,289 482,261 628,049 375,061 338,957 358,314
Fair value of collaterals of impaired advances 373,596 407,907 303,045 296,679 324,592 203,136
(vii)CreditconcentrationofriskbyindustrysectorsTotal outstanding credit facilities, net of deposits where there is a right of set off, including guarantees, acceptances, and other similar commitments extended by the Bank to any one customer or group of closely-related customers for amounts aggregating more than 15% of its capital base, classified by industry sectors:
Group Bank2011
Rs’0002010
Rs’ 0002009
Rs’ 0002011
Rs’0002010
Rs’ 0002009
Rs’ 000PortfolioCommerce 3,754 - - 3,679 - - Infrastructure - - - 1,811 - - Manufacturing 2,184 2,065 - 2,184 2,037 - Real Estate - - - - - 1,379 Services - - - 1,761 - - Tourism 2,329 - - 2,329 1,624 2,536
8,267 2,065 - 11,764 3,661 3,915
NOTESTOTHEFINANCIALSTATEMENTSFORTHEYEARENDED30JUNE2011(CONT’D)37.Riskmanagement(Cont’d)
c.Liquidityrisk
Liquidity risk is the potential earnings volatility arising from being unable to fund assets at reasonable rates over required maturities. The Group ensures that sufficient liquidity is maintained to fund its day-to-day operations, meet deposit withdrawals and loan disbursements. Liquidity risk is managed by setting prudential limits on maturity mismatches, liquid assets ratios, concentration of deposits by type and by entity. Liquidity gap analysis is used to measure and monitor the mismatches by time bucket and currency under realistic and stress scenarios.
The tables below show the maturity analysis of contractual undiscounted cash flows for financial liabilities of the Group and the Bank. Although demand deposits are contractually repayable on demand, the Group’s past experience indicates that these deposit balances remain stable over the long-term. In practice, the Group manages its liquidity risks based on expected cash outflows instead of contractual maturities.
On DemandRs’000
Up to 3 monthsRs’000
3-6 monthsRs’000
6-12monthsRs’000
1-2years
Rs’000
2-5years
Rs’000
Over 5years
Rs’000Total
Rs’000GroupFinancialliabilitiesDeposits 47,786,899 6,239,224 5,320,599 6,844,862 5,934,334 1,452,745 - 73,578,663Trading liabilities 37,015 - - - - - 104,062 141,077Other borrowed funds 237,501 2,690,594 793,731 19,101 38,203 2,439,761 3,712,950 9,931,841Other liabilities - 983,997 - - - - - 983,997
30June2011 48,061,415 9,913,815 6,114,330 6,863,963 5,972,537 3,892,506 3,817,012 84,635,578
30 June 2010 43,810,439 7,216,098 3,084,570 3,627,355 5,158,743 1,797,744 254,223 64,949,172
30 June 2009 43,139,945 7,074,583 3,482,444 5,227,739 5,420,503 4,163,982 415,390 68,924,586
BankFinancialliabilitiesDeposits 49,308,617 5,516,558 4,831,741 6,229,175 5,915,181 1,329,419 - 73,130,691Trading liabilities 37,015 - - - - - 104,062 141,077Other borrowed funds 237,501 2,690,594 793,731 19,101 38,203 2,439,761 3,712,950 9,931,841Other liabilities - 894,185 - - - - - 894,185
30June2011 49,583,133 9,101,337 5,625,472 6,248,276 5,953,384 3,769,180 3,817,012 84,097,794
30 June 2010 43,171,956 6,595,757 2,543,545 3,401,911 6,529,008 1,797,744 254,223 64,294,144
30 June 2009 42,608,377 6,759,158 3,175,272 4,766,490 4,758,783 4,925,727 401,224 67,395,031
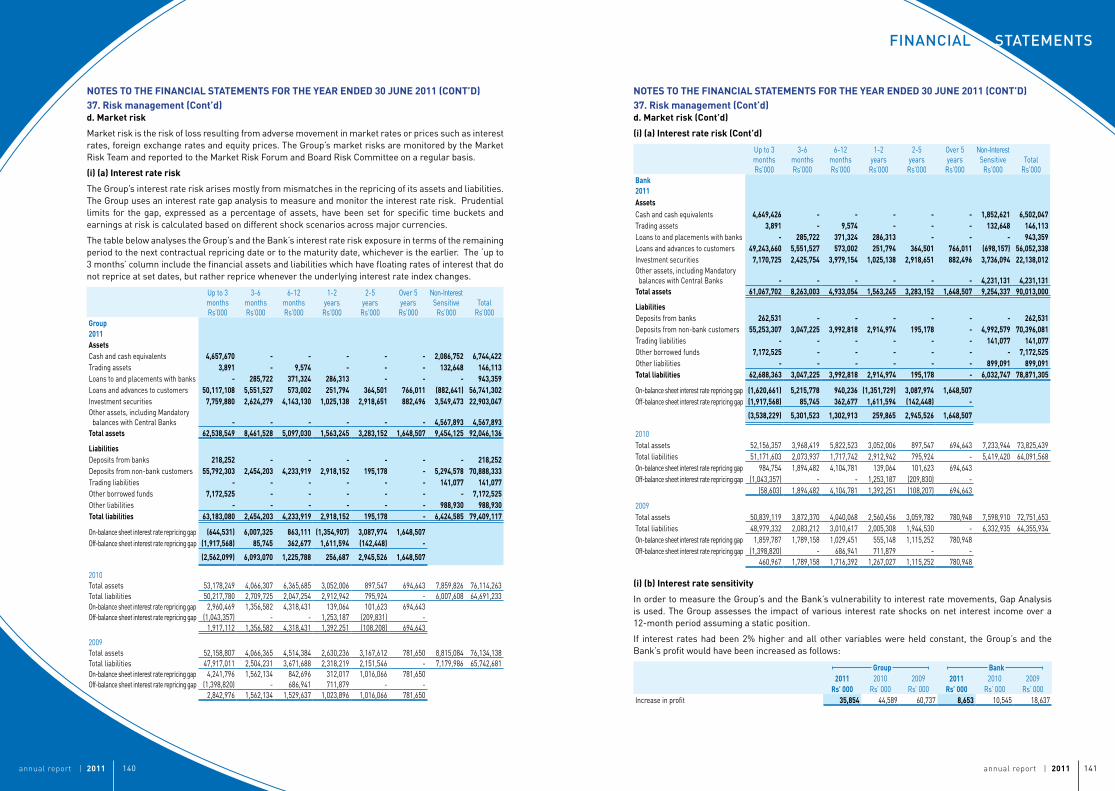
annual report | 2011 141annual report | 2011 140
STaTeMenTSFinancial
NOTESTOTHEFINANCIALSTATEMENTSFORTHEYEARENDED30JUNE2011(CONT’D)37.Riskmanagement(Cont’d)d.Marketrisk(Cont’d)
(i)(a)Interestraterisk(Cont’d)
Up to 3 monthsRs’000
3-6 monthsRs’000
6-12monthsRs’000
1-2years
Rs’000
2-5years
Rs’000
Over 5years
Rs’000
Non-InterestSensitive
Rs’000Total
Rs’000Bank2011AssetsCash and cash equivalents 4,649,426 - - - - - 1,852,621 6,502,047Trading assets 3,891 - 9,574 - - - 132,648 146,113Loans to and placements with banks - 285,722 371,324 286,313 - - - 943,359Loans and advances to customers 49,243,660 5,551,527 573,002 251,794 364,501 766,011 (698,157) 56,052,338Investment securities 7,170,725 2,425,754 3,979,154 1,025,138 2,918,651 882,496 3,736,094 22,138,012Other assets, including Mandatory balances with Central Banks - - - - - - 4,231,131 4,231,131Totalassets 61,067,702 8,263,003 4,933,054 1,563,245 3,283,152 1,648,507 9,254,337 90,013,000
LiabilitiesDeposits from banks 262,531 - - - - - - 262,531Deposits from non-bank customers 55,253,307 3,047,225 3,992,818 2,914,974 195,178 - 4,992,579 70,396,081Trading liabilities - - - - - - 141,077 141,077Other borrowed funds 7,172,525 - - - - - - 7,172,525Other liabilities - - - - - - 899,091 899,091Totalliabilities 62,688,363 3,047,225 3,992,818 2,914,974 195,178 - 6,032,747 78,871,305
On-balance sheet interest rate repricing gap (1,620,661) 5,215,778 940,236 (1,351,729) 3,087,974 1,648,507Off-balance sheet interest rate repricing gap (1,917,568) 85,745 362,677 1,611,594 (142,448) -
(3,538,229) 5,301,523 1,302,913 259,865 2,945,526 1,648,507
2010Total assets 52,156,357 3,968,419 5,822,523 3,052,006 897,547 694,643 7,233,944 73,825,439Total liabilities 51,171,603 2,073,937 1,717,742 2,912,942 795,924 - 5,419,420 64,091,568On-balance sheet interest rate repricing gap 984,754 1,894,482 4,104,781 139,064 101,623 694,643Off-balance sheet interest rate repricing gap (1,043,357) - - 1,253,187 (209,830) -
(58,603) 1,894,482 4,104,781 1,392,251 (108,207) 694,643
2009Total assets 50,839,119 3,872,370 4,040,068 2,560,456 3,059,782 780,948 7,598,910 72,751,653Total liabilities 48,979,332 2,083,212 3,010,617 2,005,308 1,944,530 - 6,332,935 64,355,934On-balance sheet interest rate repricing gap 1,859,787 1,789,158 1,029,451 555,148 1,115,252 780,948Off-balance sheet interest rate repricing gap (1,398,820) - 686,941 711,879 - -
460,967 1,789,158 1,716,392 1,267,027 1,115,252 780,948
(i)(b)Interestratesensitivity
In order to measure the Group’s and the Bank’s vulnerability to interest rate movements, Gap Analysis is used. The Group assesses the impact of various interest rate shocks on net interest income over a 12-month period assuming a static position.
If interest rates had been 2% higher and all other variables were held constant, the Group’s and the Bank’s profit would have been increased as follows:
Group Bank2011
Rs’0002010
Rs’ 0002009
Rs’ 0002011
Rs’0002010
Rs’ 0002009
Rs’ 000Increase in profit 35,854 44,589 60,737 8,653 10,545 18,637
NOTESTOTHEFINANCIALSTATEMENTSFORTHEYEARENDED30JUNE2011(CONT’D)37.Riskmanagement(Cont’d)d.Marketrisk
Market risk is the risk of loss resulting from adverse movement in market rates or prices such as interest rates, foreign exchange rates and equity prices. The Group’s market risks are monitored by the Market Risk Team and reported to the Market Risk Forum and Board Risk Committee on a regular basis.
(i)(a)Interestraterisk
The Group’s interest rate risk arises mostly from mismatches in the repricing of its assets and liabilities. The Group uses an interest rate gap analysis to measure and monitor the interest rate risk. Prudential limits for the gap, expressed as a percentage of assets, have been set for specific time buckets and earnings at risk is calculated based on different shock scenarios across major currencies.
The table below analyses the Group’s and the Bank’s interest rate risk exposure in terms of the remaining period to the next contractual repricing date or to the maturity date, whichever is the earlier. The ‘up to 3 months’ column include the financial assets and liabilities which have floating rates of interest that do not reprice at set dates, but rather reprice whenever the underlying interest rate index changes.
Up to 3 monthsRs’000
3-6 monthsRs’000
6-12monthsRs’000
1-2years
Rs’000
2-5years
Rs’000
Over 5years
Rs’000
Non-InterestSensitive
Rs’000Total
Rs’000Group2011AssetsCash and cash equivalents 4,657,670 - - - - - 2,086,752 6,744,422Trading assets 3,891 - 9,574 - - - 132,648 146,113Loans to and placements with banks - 285,722 371,324 286,313 - - - 943,359Loans and advances to customers 50,117,108 5,551,527 573,002 251,794 364,501 766,011 (882,641) 56,741,302Investment securities 7,759,880 2,624,279 4,143,130 1,025,138 2,918,651 882,496 3,549,473 22,903,047Other assets, including Mandatory balances with Central Banks - - - - - - 4,567,893 4,567,893Totalassets 62,538,549 8,461,528 5,097,030 1,563,245 3,283,152 1,648,507 9,454,125 92,046,136
LiabilitiesDeposits from banks 218,252 - - - - - - 218,252Deposits from non-bank customers 55,792,303 2,454,203 4,233,919 2,918,152 195,178 - 5,294,578 70,888,333Trading liabilities - - - - - - 141,077 141,077Other borrowed funds 7,172,525 - - - - - - 7,172,525Other liabilities - - - - - - 988,930 988,930Totalliabilities 63,183,080 2,454,203 4,233,919 2,918,152 195,178 - 6,424,585 79,409,117
On-balance sheet interest rate repricing gap (644,531) 6,007,325 863,111 (1,354,907) 3,087,974 1,648,507Off-balance sheet interest rate repricing gap (1,917,568) 85,745 362,677 1,611,594 (142,448) -
(2,562,099) 6,093,070 1,225,788 256,687 2,945,526 1,648,507
2010Total assets 53,178,249 4,066,307 6,365,685 3,052,006 897,547 694,643 7,859,826 76,114,263Total liabilities 50,217,780 2,709,725 2,047,254 2,912,942 795,924 - 6,007,608 64,691,233On-balance sheet interest rate repricing gap 2,960,469 1,356,582 4,318,431 139,064 101,623 694,643Off-balance sheet interest rate repricing gap (1,043,357) - - 1,253,187 (209,831) -
1,917,112 1,356,582 4,318,431 1,392,251 (108,208) 694,643
2009Total assets 52,158,807 4,066,365 4,514,384 2,630,236 3,167,612 781,650 8,815,084 76,134,138Total liabilities 47,917,011 2,504,231 3,671,688 2,318,219 2,151,546 - 7,179,986 65,742,681On-balance sheet interest rate repricing gap 4,241,796 1,562,134 842,696 312,017 1,016,066 781,650Off-balance sheet interest rate repricing gap (1,398,820) - 686,941 711,879 - -
2,842,976 1,562,134 1,529,637 1,023,896 1,016,066 781,650
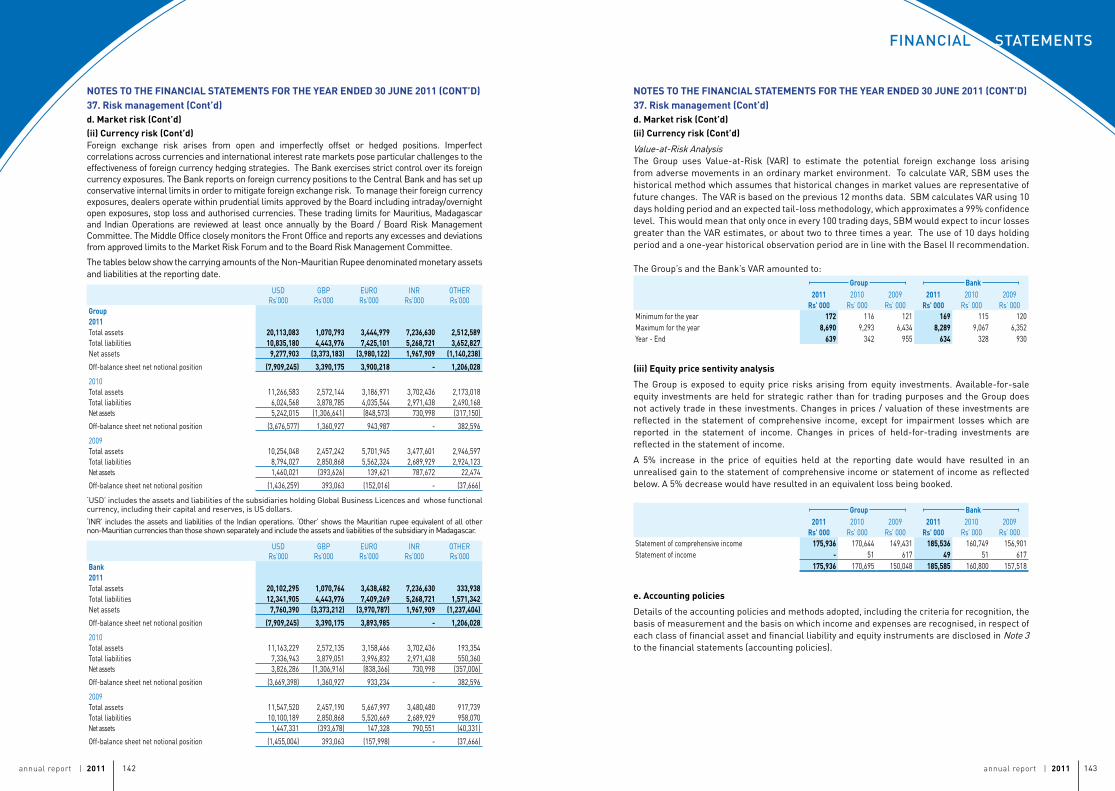
annual report | 2011 143
STaTeMenTSFinancial
142annual report | 2011
NOTESTOTHEFINANCIALSTATEMENTSFORTHEYEARENDED30JUNE2011(CONT’D)37.Riskmanagement(Cont’d)d.Marketrisk(Cont’d)(ii)Currencyrisk(Cont’d)Foreign exchange risk arises from open and imperfectly offset or hedged positions. Imperfect correlations across currencies and international interest rate markets pose particular challenges to the effectiveness of foreign currency hedging strategies. The Bank exercises strict control over its foreign currency exposures. The Bank reports on foreign currency positions to the Central Bank and has set up conservative internal limits in order to mitigate foreign exchange risk. To manage their foreign currency exposures, dealers operate within prudential limits approved by the Board including intraday/overnight open exposures, stop loss and authorised currencies. These trading limits for Mauritius, Madagascar and Indian Operations are reviewed at least once annually by the Board / Board Risk Management Committee. The Middle Office closely monitors the Front Office and reports any excesses and deviations from approved limits to the Market Risk Forum and to the Board Risk Management Committee.
The tables below show the carrying amounts of the Non-Mauritian Rupee denominated monetary assets and liabilities at the reporting date.
USDRs’000
GBPRs’000
EURO Rs’000
INRRs’000
OTHERRs’000
Group2011Total assets 20,113,083 1,070,793 3,444,979 7,236,630 2,512,589Total liabilities 10,835,180 4,443,976 7,425,101 5,268,721 3,652,827Net assets 9,277,903 (3,373,183) (3,980,122) 1,967,909 (1,140,238)
Off-balance sheet net notional position (7,909,245) 3,390,175 3,900,218 - 1,206,028
2010Total assets 11,266,583 2,572,144 3,186,971 3,702,436 2,173,018Total liabilities 6,024,568 3,878,785 4,035,544 2,971,438 2,490,168Net assets 5,242,015 (1,306,641) (848,573) 730,998 (317,150)
Off-balance sheet net notional position (3,676,577) 1,360,927 943,987 - 382,596
2009Total assets 10,254,048 2,457,242 5,701,945 3,477,601 2,946,597Total liabilities 8,794,027 2,850,868 5,562,324 2,689,929 2,924,123Net assets 1,460,021 (393,626) 139,621 787,672 22,474
Off-balance sheet net notional position (1,436,259) 393,063 (152,016) - (37,666)
‘USD’ includes the assets and liabilities of the subsidiaries holding Global Business Licences and whose functional currency, including their capital and reserves, is US dollars.
‘INR’ includes the assets and liabilities of the Indian operations. ‘Other’ shows the Mauritian rupee equivalent of all other non-Mauritian currencies than those shown separately and include the assets and liabilities of the subsidiary in Madagascar.
USDRs’000
GBPRs’000
EURO Rs’000
INRRs’000
OTHERRs’000
Bank2011Total assets 20,102,295 1,070,764 3,438,482 7,236,630 333,938Total liabilities 12,341,905 4,443,976 7,409,269 5,268,721 1,571,342Net assets 7,760,390 (3,373,212) (3,970,787) 1,967,909 (1,237,404)
Off-balance sheet net notional position (7,909,245) 3,390,175 3,893,985 - 1,206,028
2010Total assets 11,163,229 2,572,135 3,158,466 3,702,436 193,354Total liabilities 7,336,943 3,879,051 3,996,832 2,971,438 550,360Net assets 3,826,286 (1,306,916) (838,366) 730,998 (357,006)
Off-balance sheet net notional position (3,669,398) 1,360,927 933,234 - 382,596
2009Total assets 11,547,520 2,457,190 5,667,997 3,480,480 917,739Total liabilities 10,100,189 2,850,868 5,520,669 2,689,929 958,070Net assets 1,447,331 (393,678) 147,328 790,551 (40,331)
Off-balance sheet net notional position (1,455,004) 393,063 (157,998) - (37,666)
NOTESTOTHEFINANCIALSTATEMENTSFORTHEYEARENDED30JUNE2011(CONT’D)37.Riskmanagement(Cont’d)d.Marketrisk(Cont’d)(ii)Currencyrisk(Cont’d)
Value-at-Risk AnalysisThe Group uses Value-at-Risk (VAR) to estimate the potential foreign exchange loss arising from adverse movements in an ordinary market environment. To calculate VAR, SBM uses the historical method which assumes that historical changes in market values are representative of future changes. The VAR is based on the previous 12 months data. SBM calculates VAR using 10 days holding period and an expected tail-loss methodology, which approximates a 99% confidence level. This would mean that only once in every 100 trading days, SBM would expect to incur losses greater than the VAR estimates, or about two to three times a year. The use of 10 days holding period and a one-year historical observation period are in line with the Basel II recommendation. The Group’s and the Bank’s VAR amounted to:
Group Bank2011
Rs’0002010
Rs’ 0002009
Rs’ 0002011
Rs’0002010
Rs’ 0002009
Rs’ 000Minimum for the year 172 116 121 169 115 120Maximum for the year 8,690 9,293 6,434 8,289 9,067 6,352Year - End 639 342 955 634 328 930
(iii)Equitypricesentivityanalysis
The Group is exposed to equity price risks arising from equity investments. Available-for-sale equity investments are held for strategic rather than for trading purposes and the Group does not actively trade in these investments. Changes in prices / valuation of these investments are reflected in the statement of comprehensive income, except for impairment losses which are reported in the statement of income. Changes in prices of held-for-trading investments are reflected in the statement of income.
A 5% increase in the price of equities held at the reporting date would have resulted in an unrealised gain to the statement of comprehensive income or statement of income as reflected below. A 5% decrease would have resulted in an equivalent loss being booked.
Group Bank2011
Rs’0002010
Rs’ 0002009
Rs’ 0002011
Rs’0002010
Rs’ 0002009
Rs’ 000Statement of comprehensive income 175,936 170,644 149,431 185,536 160,749 156,901Statement of income - 51 617 49 51 617
175,936 170,695 150,048 185,585 160,800 157,518
e.Accountingpolicies
Details of the accounting policies and methods adopted, including the criteria for recognition, the basis of measurement and the basis on which income and expenses are recognised, in respect of each class of financial asset and financial liability and equity instruments are disclosed in Note 3 to the financial statements (accounting policies).
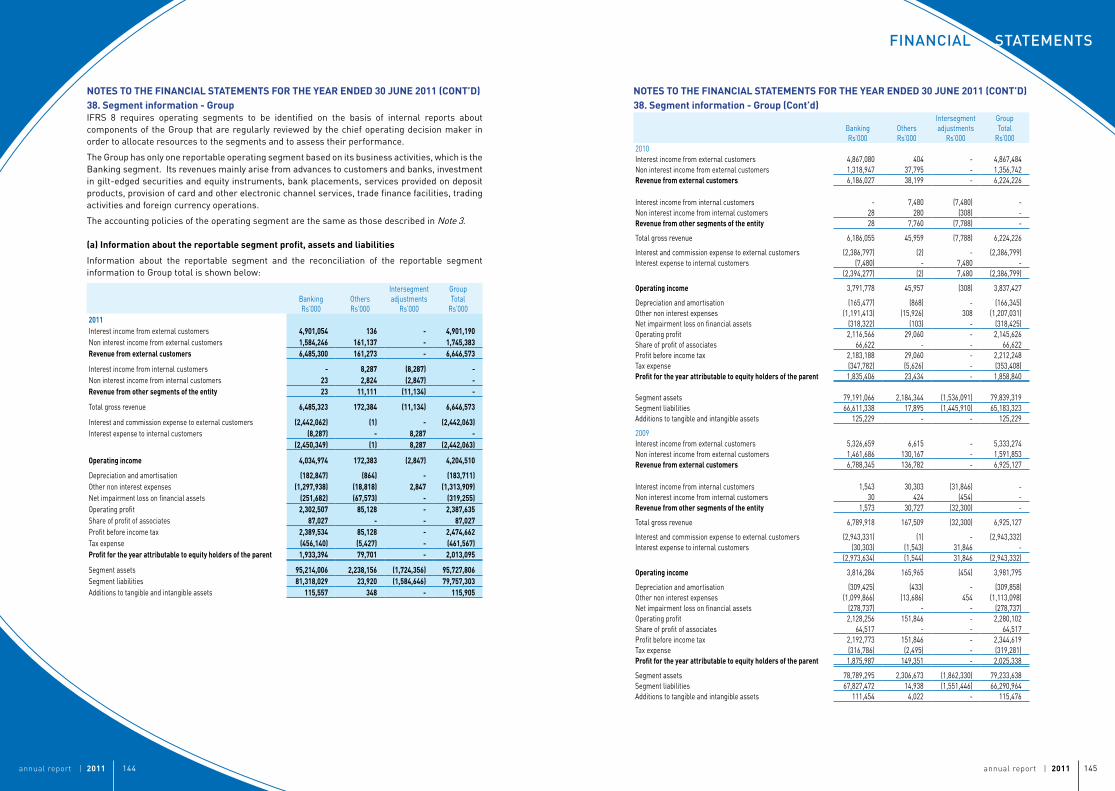
annual report | 2011 145annual report | 2011 144
STaTeMenTSFinancial
NOTESTOTHEFINANCIALSTATEMENTSFORTHEYEARENDED30JUNE2011(CONT’D)38.Segmentinformation-Group IFRS 8 requires operating segments to be identified on the basis of internal reports about components of the Group that are regularly reviewed by the chief operating decision maker in order to allocate resources to the segments and to assess their performance.
The Group has only one reportable operating segment based on its business activities, which is the Banking segment. Its revenues mainly arise from advances to customers and banks, investment in gilt-edged securities and equity instruments, bank placements, services provided on deposit products, provision of card and other electronic channel services, trade finance facilities, trading activities and foreign currency operations.
The accounting policies of the operating segment are the same as those described in Note 3.
(a)Informationaboutthereportablesegmentprofit,assetsandliabilities
Information about the reportable segment and the reconciliation of the reportable segment information to Group total is shown below:
BankingRs’000
OthersRs’000
Intersegmentadjustments
Rs’000
GroupTotal
Rs’0002011Interest income from external customers 4,901,054 136 - 4,901,190Non interest income from external customers 1,584,246 161,137 - 1,745,383Revenuefromexternalcustomers 6,485,300 161,273 - 6,646,573
Interest income from internal customers - 8,287 (8,287) -Non interest income from internal customers 23 2,824 (2,847) -Revenuefromothersegmentsoftheentity 23 11,111 (11,134) -
Total gross revenue 6,485,323 172,384 (11,134) 6,646,573
Interest and commission expense to external customers (2,442,062) (1) - (2,442,063)Interest expense to internal customers (8,287) - 8,287 -
(2,450,349) (1) 8,287 (2,442,063)
Operatingincome 4,034,974 172,383 (2,847) 4,204,510
Depreciation and amortisation (182,847) (864) - (183,711)Other non interest expenses (1,297,938) (18,818) 2,847 (1,313,909)Net impairment loss on financial assets (251,682) (67,573) - (319,255)Operating profit 2,302,507 85,128 - 2,387,635Share of profit of associates 87,027 - - 87,027Profit before income tax 2,389,534 85,128 - 2,474,662Tax expense (456,140) (5,427) - (461,567)Profitfortheyearattributabletoequityholdersoftheparent 1,933,394 79,701 - 2,013,095
Segment assets 95,214,006 2,238,156 (1,724,356) 95,727,806Segment liabilities 81,318,029 23,920 (1,584,646) 79,757,303Additions to tangible and intangible assets 115,557 348 - 115,905
NOTESTOTHEFINANCIALSTATEMENTSFORTHEYEARENDED30JUNE2011(CONT’D)38.Segmentinformation-Group(Cont’d)
BankingRs’000
OthersRs’000
Intersegmentadjustments
Rs’000
GroupTotal
Rs’0002010Interest income from external customers 4,867,080 404 - 4,867,484Non interest income from external customers 1,318,947 37,795 - 1,356,742Revenuefromexternalcustomers 6,186,027 38,199 - 6,224,226
Interest income from internal customers - 7,480 (7,480) - Non interest income from internal customers 28 280 (308) - Revenuefromothersegmentsoftheentity 28 7,760 (7,788) -
Total gross revenue 6,186,055 45,959 (7,788) 6,224,226
Interest and commission expense to external customers (2,386,797) (2) - (2,386,799)Interest expense to internal customers (7,480) - 7,480 -
(2,394,277) (2) 7,480 (2,386,799)
Operatingincome 3,791,778 45,957 (308) 3,837,427
Depreciation and amortisation (165,477) (868) - (166,345)Other non interest expenses (1,191,413) (15,926) 308 (1,207,031)Net impairment loss on financial assets (318,322) (103) - (318,425)Operating profit 2,116,566 29,060 - 2,145,626Share of profit of associates 66,622 - - 66,622Profit before income tax 2,183,188 29,060 - 2,212,248Tax expense (347,782) (5,626) - (353,408)Profitfortheyearattributabletoequityholdersoftheparent 1,835,406 23,434 - 1,858,840
Segment assets 79,191,066 2,184,344 (1,536,091) 79,839,319Segment liabilities 66,611,338 17,895 (1,445,910) 65,183,323Additions to tangible and intangible assets 125,229 - - 125,229
2009Interest income from external customers 5,326,659 6,615 - 5,333,274Non interest income from external customers 1,461,686 130,167 - 1,591,853Revenuefromexternalcustomers 6,788,345 136,782 - 6,925,127
Interest income from internal customers 1,543 30,303 (31,846) - Non interest income from internal customers 30 424 (454) - Revenuefromothersegmentsoftheentity 1,573 30,727 (32,300) -
Total gross revenue 6,789,918 167,509 (32,300) 6,925,127
Interest and commission expense to external customers (2,943,331) (1) - (2,943,332)Interest expense to internal customers (30,303) (1,543) 31,846 -
(2,973,634) (1,544) 31,846 (2,943,332)
Operatingincome 3,816,284 165,965 (454) 3,981,795
Depreciation and amortisation (309,425) (433) - (309,858)Other non interest expenses (1,099,866) (13,686) 454 (1,113,098)Net impairment loss on financial assets (278,737) - - (278,737)Operating profit 2,128,256 151,846 - 2,280,102Share of profit of associates 64,517 - - 64,517Profit before income tax 2,192,773 151,846 - 2,344,619Tax expense (316,786) (2,495) - (319,281)Profitfortheyearattributabletoequityholdersoftheparent 1,875,987 149,351 - 2,025,338
Segment assets 78,789,295 2,306,673 (1,862,330) 79,233,638Segment liabilities 67,827,472 14,938 (1,551,446) 66,290,964Additions to tangible and intangible assets 111,454 4,022 - 115,476
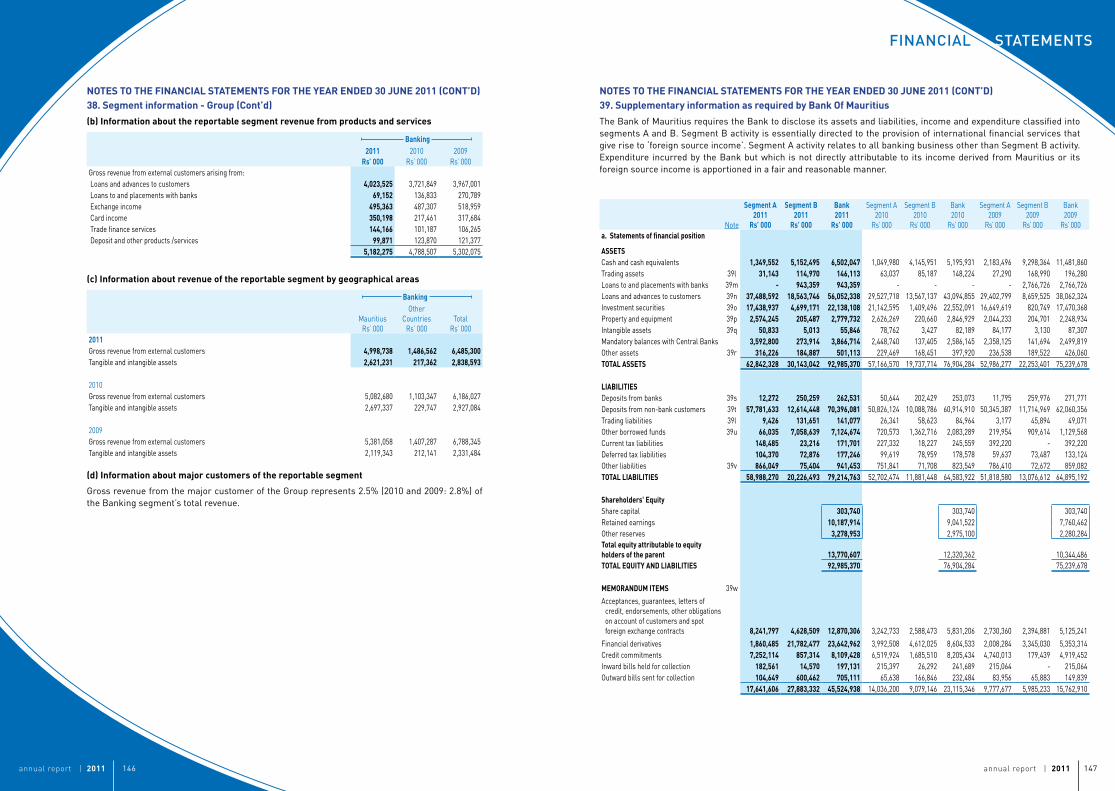
annual report | 2011 147annual report | 2011 146
STaTeMenTSFinancial
NOTESTOTHEFINANCIALSTATEMENTSFORTHEYEARENDED30JUNE2011(CONT’D)38.Segmentinformation-Group(Cont’d)
(b)Informationaboutthereportablesegmentrevenuefromproductsandservices
Banking2011
Rs’0002010
Rs’ 0002009
Rs’ 000Gross revenue from external customers arising from: Loans and advances to customers 4,023,525 3,721,849 3,967,001 Loans to and placements with banks 69,152 136,833 270,789 Exchange income 495,363 487,307 518,959 Card income 350,198 217,461 317,684 Trade finance services 144,166 101,187 106,265 Deposit and other products /services 99,871 123,870 121,377
5,182,275 4,788,507 5,302,075
(c)Informationaboutrevenueofthereportablesegmentbygeographicalareas
Banking
MauritiusRs’ 000
Other Countries
Rs’ 000Total
Rs’ 0002011Gross revenue from external customers 4,998,738 1,486,562 6,485,300Tangible and intangible assets 2,621,231 217,362 2,838,593
2010Gross revenue from external customers 5,082,680 1,103,347 6,186,027Tangible and intangible assets 2,697,337 229,747 2,927,084
2009Gross revenue from external customers 5,381,058 1,407,287 6,788,345Tangible and intangible assets 2,119,343 212,141 2,331,484
(d)Informationaboutmajorcustomersofthereportablesegment
Gross revenue from the major customer of the Group represents 2.5% (2010 and 2009: 2.8%) of the Banking segment’s total revenue.
NOTESTOTHEFINANCIALSTATEMENTSFORTHEYEARENDED30JUNE2011(CONT’D)39.SupplementaryinformationasrequiredbyBankOfMauritius
The Bank of Mauritius requires the Bank to disclose its assets and liabilities, income and expenditure classified into segments A and B. Segment B activity is essentially directed to the provision of international financial services that give rise to ‘foreign source income’. Segment A activity relates to all banking business other than Segment B activity. Expenditure incurred by the Bank but which is not directly attributable to its income derived from Mauritius or its foreign source income is apportioned in a fair and reasonable manner.
Note
SegmentA2011
Rs’000
SegmentB2011
Rs’000
Bank2011
Rs’000
Segment A2010
Rs’ 000
Segment B2010
Rs’ 000
Bank2010
Rs’ 000
Segment A2009
Rs’ 000
Segment B2009
Rs’ 000
Bank2009
Rs’ 000a.Statementsoffinancialposition
ASSETSCash and cash equivalents 1,349,552 5,152,495 6,502,047 1,049,980 4,145,951 5,195,931 2,183,496 9,298,364 11,481,860Trading assets 39l 31,143 114,970 146,113 63,037 85,187 148,224 27,290 168,990 196,280Loans to and placements with banks 39m - 943,359 943,359 - - - - 2,766,726 2,766,726Loans and advances to customers 39n 37,488,592 18,563,746 56,052,338 29,527,718 13,567,137 43,094,855 29,402,799 8,659,525 38,062,324Investment securities 39o 17,438,937 4,699,171 22,138,108 21,142,595 1,409,496 22,552,091 16,649,619 820,749 17,470,368Property and equipment 39p 2,574,245 205,487 2,779,732 2,626,269 220,660 2,846,929 2,044,233 204,701 2,248,934Intangible assets 39q 50,833 5,013 55,846 78,762 3,427 82,189 84,177 3,130 87,307Mandatory balances with Central Banks 3,592,800 273,914 3,866,714 2,448,740 137,405 2,586,145 2,358,125 141,694 2,499,819Other assets 39r 316,226 184,887 501,113 229,469 168,451 397,920 236,538 189,522 426,060TOTALASSETS 62,842,328 30,143,042 92,985,370 57,166,570 19,737,714 76,904,284 52,986,277 22,253,401 75,239,678
LIABILITIESDeposits from banks 39s 12,272 250,259 262,531 50,644 202,429 253,073 11,795 259,976 271,771Deposits from non-bank customers 39t 57,781,633 12,614,448 70,396,081 50,826,124 10,088,786 60,914,910 50,345,387 11,714,969 62,060,356Trading liabilities 39l 9,426 131,651 141,077 26,341 58,623 84,964 3,177 45,894 49,071Other borrowed funds 39u 66,035 7,058,639 7,124,674 720,573 1,362,716 2,083,289 219,954 909,614 1,129,568Current tax liabilities 148,485 23,216 171,701 227,332 18,227 245,559 392,220 - 392,220Deferred tax liabilities 104,370 72,876 177,246 99,619 78,959 178,578 59,637 73,487 133,124Other liabilities 39v 866,049 75,404 941,453 751,841 71,708 823,549 786,410 72,672 859,082TOTALLIABILITIES 58,988,270 20,226,493 79,214,763 52,702,474 11,881,448 64,583,922 51,818,580 13,076,612 64,895,192
Shareholders'EquityShare capital 303,740 303,740 303,740Retained earnings 10,187,914 9,041,522 7,760,462Other reserves 3,278,953 2,975,100 2,280,284Totalequityattributabletoequityholdersoftheparent 13,770,607 12,320,362 10,344,486TOTALEQUITYANDLIABILITIES 92,985,370 76,904,284 75,239,678
MEMORANDUMITEMS 39w
Acceptances, guarantees, letters ofcredit, endorsements, other obligations on account of customers and spot foreign exchange contracts 8,241,797 4,628,509 12,870,306 3,242,733 2,588,473 5,831,206 2,730,360 2,394,881 5,125,241
Financial derivatives 1,860,485 21,782,477 23,642,962 3,992,508 4,612,025 8,604,533 2,008,284 3,345,030 5,353,314Credit commitments 7,252,114 857,314 8,109,428 6,519,924 1,685,510 8,205,434 4,740,013 179,439 4,919,452Inward bills held for collection 182,561 14,570 197,131 215,397 26,292 241,689 215,064 - 215,064Outward bills sent for collection 104,649 600,462 705,111 65,638 166,846 232,484 83,956 65,883 149,839
17,641,606 27,883,332 45,524,938 14,036,200 9,079,146 23,115,346 9,777,677 5,985,233 15,762,910
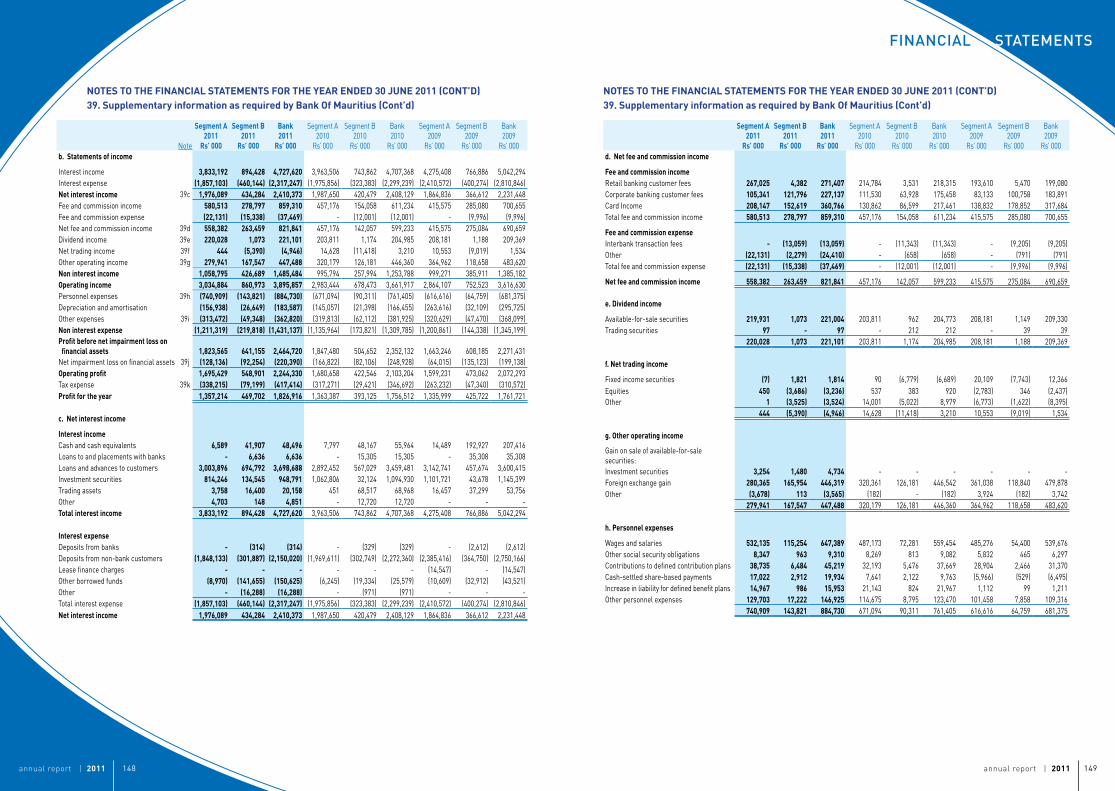
annual report | 2011 149annual report | 2011 148
STaTeMenTSFinancial
NOTESTOTHEFINANCIALSTATEMENTSFORTHEYEARENDED30JUNE2011(CONT’D)39.SupplementaryinformationasrequiredbyBankOfMauritius(Cont’d)
Note
SegmentA2011
Rs’000
SegmentB2011
Rs’000
Bank2011
Rs’000
Segment A2010
Rs’ 000
Segment B2010
Rs’ 000
Bank2010
Rs’ 000
Segment A2009
Rs’ 000
Segment B2009
Rs’ 000
Bank2009
Rs’ 000b.Statementsofincome
Interest income 3,833,192 894,428 4,727,620 3,963,506 743,862 4,707,368 4,275,408 766,886 5,042,294Interest expense (1,857,103) (460,144) (2,317,247) (1,975,856) (323,383) (2,299,239) (2,410,572) (400,274) (2,810,846)Netinterestincome 39c 1,976,089 434,284 2,410,373 1,987,650 420,479 2,408,129 1,864,836 366,612 2,231,448Fee and commission income 580,513 278,797 859,310 457,176 154,058 611,234 415,575 285,080 700,655Fee and commission expense (22,131) (15,338) (37,469) - (12,001) (12,001) - (9,996) (9,996)Net fee and commission income 39d 558,382 263,459 821,841 457,176 142,057 599,233 415,575 275,084 690,659Dividend income 39e 220,028 1,073 221,101 203,811 1,174 204,985 208,181 1,188 209,369Net trading income 39f 444 (5,390) (4,946) 14,628 (11,418) 3,210 10,553 (9,019) 1,534Other operating income 39g 279,941 167,547 447,488 320,179 126,181 446,360 364,962 118,658 483,620Noninterestincome 1,058,795 426,689 1,485,484 995,794 257,994 1,253,788 999,271 385,911 1,385,182Operatingincome 3,034,884 860,973 3,895,857 2,983,444 678,473 3,661,917 2,864,107 752,523 3,616,630Personnel expenses 39h (740,909) (143,821) (884,730) (671,094) (90,311) (761,405) (616,616) (64,759) (681,375)Depreciation and amortisation (156,938) (26,649) (183,587) (145,057) (21,398) (166,455) (263,616) (32,109) (295,725)Other expenses 39i (313,472) (49,348) (362,820) (319,813) (62,112) (381,925) (320,629) (47,470) (368,099)Noninterestexpense (1,211,319) (219,818) (1,431,137) (1,135,964) (173,821) (1,309,785) (1,200,861) (144,338) (1,345,199)Profitbeforenetimpairmentlossonfinancialassets 1,823,565 641,155 2,464,720 1,847,480 504,652 2,352,132 1,663,246 608,185 2,271,431Net impairment loss on financial assets 39j (128,136) (92,254) (220,390) (166,822) (82,106) (248,928) (64,015) (135,123) (199,138)Operatingprofit 1,695,429 548,901 2,244,330 1,680,658 422,546 2,103,204 1,599,231 473,062 2,072,293Tax expense 39k (338,215) (79,199) (417,414) (317,271) (29,421) (346,692) (263,232) (47,340) (310,572)Profitfortheyear 1,357,214 469,702 1,826,916 1,363,387 393,125 1,756,512 1,335,999 425,722 1,761,721
c.Netinterestincome
InterestincomeCash and cash equivalents 6,589 41,907 48,496 7,797 48,167 55,964 14,489 192,927 207,416Loans to and placements with banks - 6,636 6,636 - 15,305 15,305 - 35,308 35,308Loans and advances to customers 3,003,896 694,792 3,698,688 2,892,452 567,029 3,459,481 3,142,741 457,674 3,600,415Investment securities 814,246 134,545 948,791 1,062,806 32,124 1,094,930 1,101,721 43,678 1,145,399Trading assets 3,758 16,400 20,158 451 68,517 68,968 16,457 37,299 53,756Other 4,703 148 4,851 - 12,720 12,720 - - - Totalinterestincome 3,833,192 894,428 4,727,620 3,963,506 743,862 4,707,368 4,275,408 766,886 5,042,294
InterestexpenseDeposits from banks - (314) (314) - (329) (329) - (2,612) (2,612)Deposits from non-bank customers (1,848,133) (301,887) (2,150,020) (1,969,611) (302,749) (2,272,360) (2,385,416) (364,750) (2,750,166)Lease finance charges - - - - - - (14,547) - (14,547)Other borrowed funds (8,970) (141,655) (150,625) (6,245) (19,334) (25,579) (10,609) (32,912) (43,521)Other - (16,288) (16,288) - (971) (971) - - - Total interest expense (1,857,103) (460,144) (2,317,247) (1,975,856) (323,383) (2,299,239) (2,410,572) (400,274) (2,810,846)Netinterestincome 1,976,089 434,284 2,410,373 1,987,650 420,479 2,408,129 1,864,836 366,612 2,231,448
NOTESTOTHEFINANCIALSTATEMENTSFORTHEYEARENDED30JUNE2011(CONT’D)39.SupplementaryinformationasrequiredbyBankOfMauritius(Cont’d)
SegmentA2011
Rs’000
SegmentB2011
Rs’000
Bank2011
Rs’000
Segment A2010
Rs’ 000
Segment B2010
Rs’ 000
Bank2010
Rs’ 000
Segment A2009
Rs’ 000
Segment B2009
Rs’ 000
Bank2009
Rs’ 000d.Netfeeandcommissionincome
FeeandcommissionincomeRetail banking customer fees 267,025 4,382 271,407 214,784 3,531 218,315 193,610 5,470 199,080Corporate banking customer fees 105,341 121,796 227,137 111,530 63,928 175,458 83,133 100,758 183,891Card Income 208,147 152,619 360,766 130,862 86,599 217,461 138,832 178,852 317,684Total fee and commission income 580,513 278,797 859,310 457,176 154,058 611,234 415,575 285,080 700,655
FeeandcommissionexpenseInterbank transaction fees - (13,059) (13,059) - (11,343) (11,343) - (9,205) (9,205)Other (22,131) (2,279) (24,410) - (658) (658) - (791) (791)Total fee and commission expense (22,131) (15,338) (37,469) - (12,001) (12,001) - (9,996) (9,996)
Netfeeandcommissionincome 558,382 263,459 821,841 457,176 142,057 599,233 415,575 275,084 690,659
e.Dividendincome
Available-for-sale securities 219,931 1,073 221,004 203,811 962 204,773 208,181 1,149 209,330Trading securities 97 - 97 - 212 212 - 39 39
220,028 1,073 221,101 203,811 1,174 204,985 208,181 1,188 209,369
f.Nettradingincome
Fixed income securities (7) 1,821 1,814 90 (6,779) (6,689) 20,109 (7,743) 12,366Equities 450 (3,686) (3,236) 537 383 920 (2,783) 346 (2,437)Other 1 (3,525) (3,524) 14,001 (5,022) 8,979 (6,773) (1,622) (8,395)
444 (5,390) (4,946) 14,628 (11,418) 3,210 10,553 (9,019) 1,534
g.Otheroperatingincome
Gain on sale of available-for-sale securities:Investment securities 3,254 1,480 4,734 - - - - - -Foreign exchange gain 280,365 165,954 446,319 320,361 126,181 446,542 361,038 118,840 479,878Other (3,678) 113 (3,565) (182) - (182) 3,924 (182) 3,742
279,941 167,547 447,488 320,179 126,181 446,360 364,962 118,658 483,620
h.Personnelexpenses
Wages and salaries 532,135 115,254 647,389 487,173 72,281 559,454 485,276 54,400 539,676Other social security obligations 8,347 963 9,310 8,269 813 9,082 5,832 465 6,297Contributions to defined contribution plans 38,735 6,484 45,219 32,193 5,476 37,669 28,904 2,466 31,370Cash-settled share-based payments 17,022 2,912 19,934 7,641 2,122 9,763 (5,966) (529) (6,495)Increase in liability for defined benefit plans 14,967 986 15,953 21,143 824 21,967 1,112 99 1,211Other personnel expenses 129,703 17,222 146,925 114,675 8,795 123,470 101,458 7,858 109,316
740,909 143,821 884,730 671,094 90,311 761,405 616,616 64,759 681,375
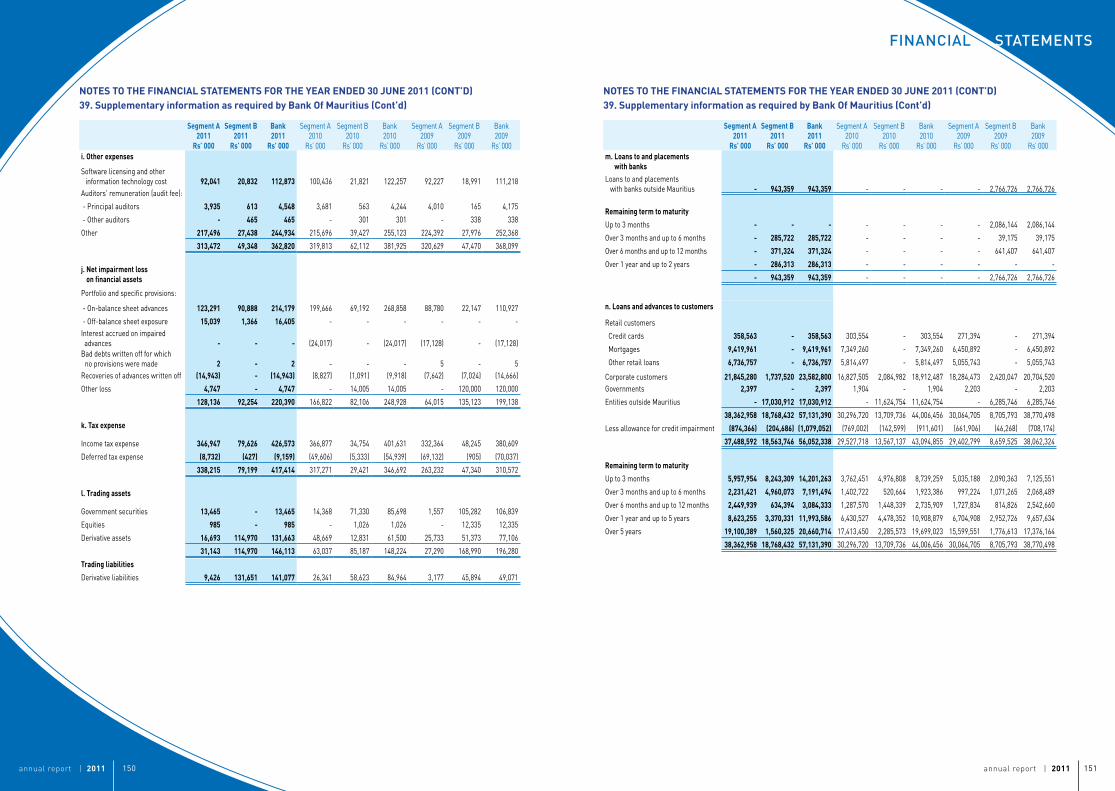
annual report | 2011 151annual report | 2011 150
STaTeMenTSFinancial
NOTESTOTHEFINANCIALSTATEMENTSFORTHEYEARENDED30JUNE2011(CONT’D)39.SupplementaryinformationasrequiredbyBankOfMauritius(Cont’d)
SegmentA2011
Rs’000
SegmentB2011
Rs’000
Bank2011
Rs’000
Segment A2010
Rs’ 000
Segment B2010
Rs’ 000
Bank2010
Rs’ 000
Segment A2009
Rs’ 000
Segment B2009
Rs’ 000
Bank2009
Rs’ 000i.Otherexpenses
Software licensing and other information technology cost 92,041 20,832 112,873 100,436 21,821 122,257 92,227 18,991 111,218Auditors' remuneration (audit fee):
- Principal auditors 3,935 613 4,548 3,681 563 4,244 4,010 165 4,175
- Other auditors - 465 465 - 301 301 - 338 338
Other 217,496 27,438 244,934 215,696 39,427 255,123 224,392 27,976 252,368
313,472 49,348 362,820 319,813 62,112 381,925 320,629 47,470 368,099
j.Netimpairmentlossonfinancialassets
Portfolio and specific provisions:
- On-balance sheet advances 123,291 90,888 214,179 199,666 69,192 268,858 88,780 22,147 110,927
- Off-balance sheet exposure 15,039 1,366 16,405 - - - - - -Interest accrued on impaired advances - - - (24,017) - (24,017) (17,128) - (17,128)Bad debts written off for which no provisions were made 2 - 2 - - - 5 - 5Recoveries of advances written off (14,943) - (14,943) (8,827) (1,091) (9,918) (7,642) (7,024) (14,666)
Other loss 4,747 - 4,747 - 14,005 14,005 - 120,000 120,000
128,136 92,254 220,390 166,822 82,106 248,928 64,015 135,123 199,138
k.Taxexpense
Income tax expense 346,947 79,626 426,573 366,877 34,754 401,631 332,364 48,245 380,609
Deferred tax expense (8,732) (427) (9,159) (49,606) (5,333) (54,939) (69,132) (905) (70,037)
338,215 79,199 417,414 317,271 29,421 346,692 263,232 47,340 310,572
l.Tradingassets
Government securities 13,465 - 13,465 14,368 71,330 85,698 1,557 105,282 106,839
Equities 985 - 985 - 1,026 1,026 - 12,335 12,335
Derivative assets 16,693 114,970 131,663 48,669 12,831 61,500 25,733 51,373 77,106
31,143 114,970 146,113 63,037 85,187 148,224 27,290 168,990 196,280
Tradingliabilities
Derivative liabilities 9,426 131,651 141,077 26,341 58,623 84,964 3,177 45,894 49,071
NOTESTOTHEFINANCIALSTATEMENTSFORTHEYEARENDED30JUNE2011(CONT’D)39.SupplementaryinformationasrequiredbyBankOfMauritius(Cont’d)
SegmentA2011
Rs’000
SegmentB2011
Rs’000
Bank2011
Rs’000
Segment A2010
Rs’ 000
Segment B2010
Rs’ 000
Bank2010
Rs’ 000
Segment A2009
Rs’ 000
Segment B2009
Rs’ 000
Bank2009
Rs’ 000m.Loanstoandplacements
withbanksLoans to and placements with banks outside Mauritius - 943,359 943,359 - - - - 2,766,726 2,766,726
Remainingtermtomaturity
Up to 3 months - - - - - - - 2,086,144 2,086,144
Over 3 months and up to 6 months - 285,722 285,722 - - - - 39,175 39,175
Over 6 months and up to 12 months - 371,324 371,324 - - - - 641,407 641,407
Over 1 year and up to 2 years - 286,313 286,313 - - - - - -
- 943,359 943,359 - - - - 2,766,726 2,766,726
n.Loansandadvancestocustomers
Retail customers
Credit cards 358,563 - 358,563 303,554 - 303,554 271,394 - 271,394
Mortgages 9,419,961 - 9,419,961 7,349,260 - 7,349,260 6,450,892 - 6,450,892
Other retail loans 6,736,757 - 6,736,757 5,814,497 - 5,814,497 5,055,743 - 5,055,743
Corporate customers 21,845,280 1,737,520 23,582,800 16,827,505 2,084,982 18,912,487 18,284,473 2,420,047 20,704,520Governments 2,397 - 2,397 1,904 - 1,904 2,203 - 2,203
Entities outside Mauritius - 17,030,912 17,030,912 - 11,624,754 11,624,754 - 6,285,746 6,285,746
38,362,958 18,768,432 57,131,390 30,296,720 13,709,736 44,006,456 30,064,705 8,705,793 38,770,498
Less allowance for credit impairment (874,366) (204,686) (1,079,052) (769,002) (142,599) (911,601) (661,906) (46,268) (708,174)
37,488,592 18,563,746 56,052,338 29,527,718 13,567,137 43,094,855 29,402,799 8,659,525 38,062,324
Remainingtermtomaturity
Up to 3 months 5,957,954 8,243,309 14,201,263 3,762,451 4,976,808 8,739,259 5,035,188 2,090,363 7,125,551
Over 3 months and up to 6 months 2,231,421 4,960,073 7,191,494 1,402,722 520,664 1,923,386 997,224 1,071,265 2,068,489
Over 6 months and up to 12 months 2,449,939 634,394 3,084,333 1,287,570 1,448,339 2,735,909 1,727,834 814,826 2,542,660
Over 1 year and up to 5 years 8,623,255 3,370,331 11,993,586 6,430,527 4,478,352 10,908,879 6,704,908 2,952,726 9,657,634
Over 5 years 19,100,389 1,560,325 20,660,714 17,413,450 2,285,573 19,699,023 15,599,551 1,776,613 17,376,164
38,362,958 18,768,432 57,131,390 30,296,720 13,709,736 44,006,456 30,064,705 8,705,793 38,770,498
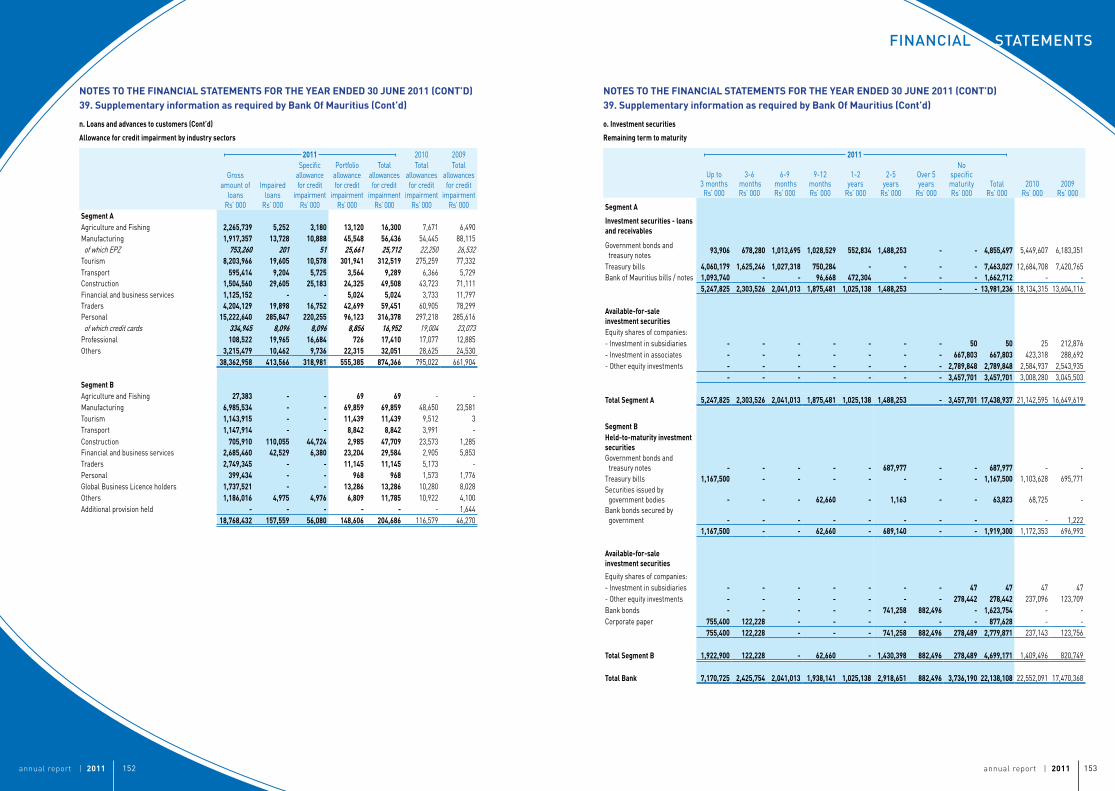
annual report | 2011 153annual report | 2011 152
STaTeMenTSFinancial
NOTESTOTHEFINANCIALSTATEMENTSFORTHEYEARENDED30JUNE2011(CONT’D)39.SupplementaryinformationasrequiredbyBankOfMauritius(Cont’d)
n.Loansandadvancestocustomers(Cont’d)
Allowanceforcreditimpairmentbyindustrysectors
2011 2010 2009
Grossamount of
loansRs’ 000
Impairedloans
Rs’ 000
Specificallowancefor credit
impairmentRs’ 000
Portfolio allowancefor credit
impairmentRs’ 000
Totalallowancesfor credit
impairmentRs’ 000
Totalallowancesfor credit
impairmentRs’ 000
Totalallowancesfor credit
impairmentRs’ 000
SegmentAAgriculture and Fishing 2,265,739 5,252 3,180 13,120 16,300 7,671 6,490Manufacturing 1,917,357 13,728 10,888 45,548 56,436 54,445 88,115 of which EPZ 753,260 201 51 25,661 25,712 22,250 26,532Tourism 8,203,966 19,605 10,578 301,941 312,519 275,259 77,332Transport 595,414 9,204 5,725 3,564 9,289 6,366 5,729Construction 1,504,560 29,605 25,183 24,325 49,508 43,723 71,111Financial and business services 1,125,152 - - 5,024 5,024 3,733 11,797Traders 4,204,129 19,898 16,752 42,699 59,451 60,905 78,299Personal 15,222,640 285,847 220,255 96,123 316,378 297,218 285,616 of which credit cards 334,945 8,096 8,096 8,856 16,952 19,004 23,073Professional 108,522 19,965 16,684 726 17,410 17,077 12,885Others 3,215,479 10,462 9,736 22,315 32,051 28,625 24,530
38,362,958 413,566 318,981 555,385 874,366 795,022 661,904
SegmentBAgriculture and Fishing 27,383 - - 69 69 - - Manufacturing 6,985,534 - - 69,859 69,859 48,650 23,581Tourism 1,143,915 - - 11,439 11,439 9,512 3Transport 1,147,914 - - 8,842 8,842 3,991 - Construction 705,910 110,055 44,724 2,985 47,709 23,573 1,285Financial and business services 2,685,460 42,529 6,380 23,204 29,584 2,905 5,853Traders 2,749,345 - - 11,145 11,145 5,173 - Personal 399,434 - - 968 968 1,573 1,776Global Business Licence holders 1,737,521 - - 13,286 13,286 10,280 8,028Others 1,186,016 4,975 4,976 6,809 11,785 10,922 4,100Additional provision held - - - - - - 1,644
18,768,432 157,559 56,080 148,606 204,686 116,579 46,270
NOTESTOTHEFINANCIALSTATEMENTSFORTHEYEARENDED30JUNE2011(CONT’D)39.SupplementaryinformationasrequiredbyBankOfMauritius(Cont’d)
o.Investmentsecurities
Remainingtermtomaturity
2011
Up to 3 monthsRs’ 000
3-6 monthsRs’ 000
6-9 monthsRs’ 000
9-12 monthsRs’ 000
1-2 years
Rs’ 000
2-5 years
Rs’ 000
Over 5 years
Rs’ 000
No specific maturityRs’ 000
TotalRs’ 000
2010 Rs’ 000
2009 Rs’ 000
SegmentA
Investmentsecurities-loansandreceivables
Government bonds and treasury notes 93,906 678,280 1,013,695 1,028,529 552,834 1,488,253 - - 4,855,497 5,449,607 6,183,351
Treasury bills 4,060,179 1,625,246 1,027,318 750,284 - - - - 7,463,027 12,684,708 7,420,765Bank of Mauritius bills / notes 1,093,740 - - 96,668 472,304 - - - 1,662,712 - -
5,247,825 2,303,526 2,041,013 1,875,481 1,025,138 1,488,253 - - 13,981,236 18,134,315 13,604,116
Available-for-saleinvestmentsecuritiesEquity shares of companies:- Investment in subsidiaries - - - - - - - 50 50 25 212,876- Investment in associates - - - - - - - 667,803 667,803 423,318 288,692- Other equity investments - - - - - - - 2,789,848 2,789,848 2,584,937 2,543,935
- - - - - - - 3,457,701 3,457,701 3,008,280 3,045,503
TotalSegmentA 5,247,825 2,303,526 2,041,013 1,875,481 1,025,138 1,488,253 - 3,457,701 17,438,937 21,142,595 16,649,619
SegmentBHeld-to-maturityinvestmentsecuritiesGovernment bonds and treasury notes - - - - - 687,977 - - 687,977 - - Treasury bills 1,167,500 - - - - - - - 1,167,500 1,103,628 695,771Securities issued by government bodies - - - 62,660 - 1,163 - - 63,823 68,725 - Bank bonds secured by government - - - - - - - - - - 1,222
1,167,500 - - 62,660 - 689,140 - - 1,919,300 1,172,353 696,993
Available-for-saleinvestmentsecurities
Equity shares of companies:- Investment in subsidiaries - - - - - - - 47 47 47 47- Other equity investments - - - - - - - 278,442 278,442 237,096 123,709Bank bonds - - - - - 741,258 882,496 - 1,623,754 - - Corporate paper 755,400 122,228 - - - - - - 877,628 - -
755,400 122,228 - - - 741,258 882,496 278,489 2,779,871 237,143 123,756
TotalSegmentB 1,922,900 122,228 - 62,660 - 1,430,398 882,496 278,489 4,699,171 1,409,496 820,749
TotalBank 7,170,725 2,425,754 2,041,013 1,938,141 1,025,138 2,918,651 882,496 3,736,190 22,138,108 22,552,091 17,470,368
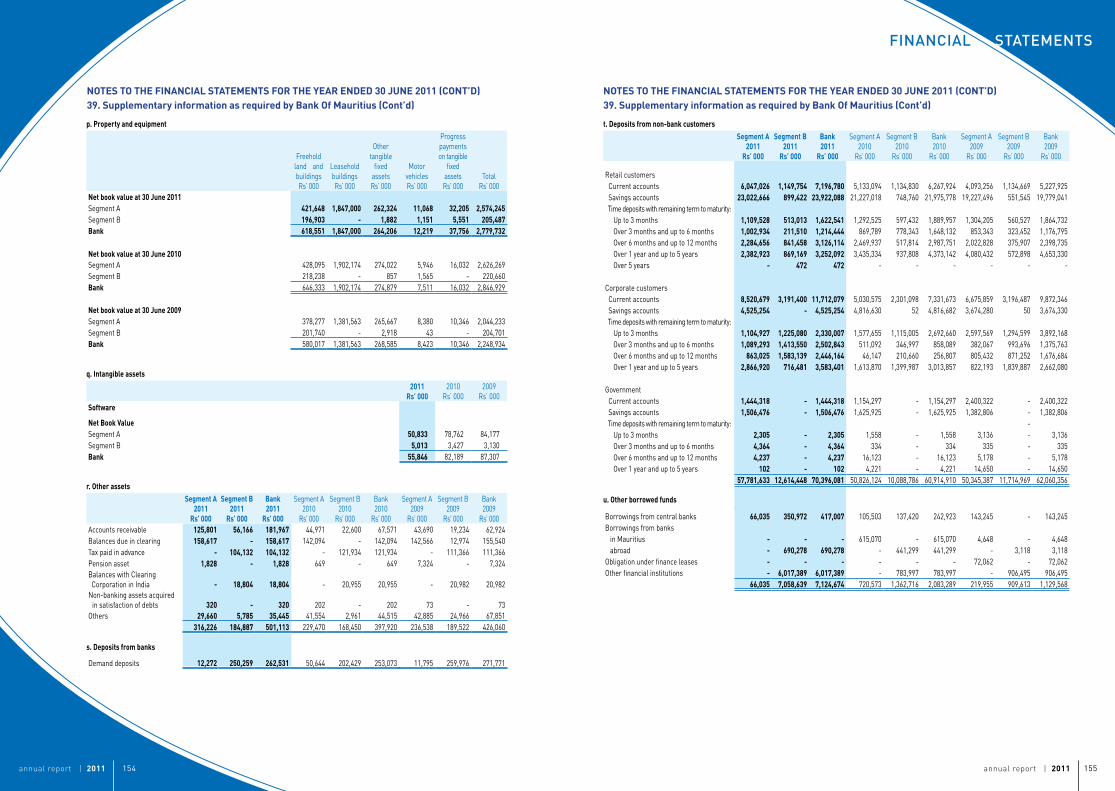
annual report | 2011 155annual report | 2011 154
STaTeMenTSFinancial
NOTESTOTHEFINANCIALSTATEMENTSFORTHEYEARENDED30JUNE2011(CONT’D)39.SupplementaryinformationasrequiredbyBankOfMauritius(Cont’d)
p.Propertyandequipment
Freehold land and buildingsRs’ 000
Leasehold buildingsRs’ 000
Other tangible
fixed assetsRs’ 000
Motor vehiclesRs’ 000
Progress payments on tangible
fixed assetsRs’ 000
TotalRs’ 000
Netbookvalueat30June2011Segment A 421,648 1,847,000 262,324 11,068 32,205 2,574,245Segment B 196,903 - 1,882 1,151 5,551 205,487Bank 618,551 1,847,000 264,206 12,219 37,756 2,779,732
Netbookvalueat30June2010Segment A 428,095 1,902,174 274,022 5,946 16,032 2,626,269Segment B 218,238 - 857 1,565 - 220,660Bank 646,333 1,902,174 274,879 7,511 16,032 2,846,929
Netbookvalueat30June2009Segment A 378,277 1,381,563 265,667 8,380 10,346 2,044,233Segment B 201,740 - 2,918 43 - 204,701Bank 580,017 1,381,563 268,585 8,423 10,346 2,248,934
q.Intangibleassets2011
Rs’0002010
Rs’ 0002009
Rs’ 000Software
NetBookValueSegment A 50,833 78,762 84,177Segment B 5,013 3,427 3,130Bank 55,846 82,189 87,307
r.OtherassetsSegmentA
2011Rs’000
SegmentB2011
Rs’000
Bank2011
Rs’000
Segment A2010
Rs’ 000
Segment B2010
Rs’ 000
Bank2010
Rs’ 000
Segment A2009
Rs’ 000
Segment B2009
Rs’ 000
Bank2009
Rs’ 000Accounts receivable 125,801 56,166 181,967 44,971 22,600 67,571 43,690 19,234 62,924Balances due in clearing 158,617 - 158,617 142,094 - 142,094 142,566 12,974 155,540Tax paid in advance - 104,132 104,132 - 121,934 121,934 - 111,366 111,366Pension asset 1,828 - 1,828 649 - 649 7,324 - 7,324Balances with Clearing Corporation in India - 18,804 18,804 - 20,955 20,955 - 20,982 20,982Non-banking assets acquired in satisfaction of debts 320 - 320 202 - 202 73 - 73Others 29,660 5,785 35,445 41,554 2,961 44,515 42,885 24,966 67,851
316,226 184,887 501,113 229,470 168,450 397,920 236,538 189,522 426,060
s.Depositsfrombanks
Demand deposits 12,272 250,259 262,531 50,644 202,429 253,073 11,795 259,976 271,771
NOTESTOTHEFINANCIALSTATEMENTSFORTHEYEARENDED30JUNE2011(CONT’D)39.SupplementaryinformationasrequiredbyBankOfMauritius(Cont’d)
t.Depositsfromnon-bankcustomersSegmentA
2011Rs’000
SegmentB2011
Rs’000
Bank2011
Rs’000
Segment A2010
Rs’ 000
Segment B2010
Rs’ 000
Bank2010
Rs’ 000
Segment A2009
Rs’ 000
Segment B2009
Rs’ 000
Bank2009
Rs’ 000
Retail customers Current accounts 6,047,026 1,149,754 7,196,780 5,133,094 1,134,830 6,267,924 4,093,256 1,134,669 5,227,925 Savings accounts 23,022,666 899,422 23,922,088 21,227,018 748,760 21,975,778 19,227,496 551,545 19,779,041 Time deposits with remaining term to maturity: Up to 3 months 1,109,528 513,013 1,622,541 1,292,525 597,432 1,889,957 1,304,205 560,527 1,864,732 Over 3 months and up to 6 months 1,002,934 211,510 1,214,444 869,789 778,343 1,648,132 853,343 323,452 1,176,795 Over 6 months and up to 12 months 2,284,656 841,458 3,126,114 2,469,937 517,814 2,987,751 2,022,828 375,907 2,398,735 Over 1 year and up to 5 years 2,382,923 869,169 3,252,092 3,435,334 937,808 4,373,142 4,080,432 572,898 4,653,330 Over 5 years - 472 472 - - - - - -
Corporate customers Current accounts 8,520,679 3,191,400 11,712,079 5,030,575 2,301,098 7,331,673 6,675,859 3,196,487 9,872,346 Savings accounts 4,525,254 - 4,525,254 4,816,630 52 4,816,682 3,674,280 50 3,674,330 Time deposits with remaining term to maturity: Up to 3 months 1,104,927 1,225,080 2,330,007 1,577,655 1,115,005 2,692,660 2,597,569 1,294,599 3,892,168 Over 3 months and up to 6 months 1,089,293 1,413,550 2,502,843 511,092 346,997 858,089 382,067 993,696 1,375,763 Over 6 months and up to 12 months 863,025 1,583,139 2,446,164 46,147 210,660 256,807 805,432 871,252 1,676,684 Over 1 year and up to 5 years 2,866,920 716,481 3,583,401 1,613,870 1,399,987 3,013,857 822,193 1,839,887 2,662,080
Government Current accounts 1,444,318 - 1,444,318 1,154,297 - 1,154,297 2,400,322 - 2,400,322 Savings accounts 1,506,476 - 1,506,476 1,625,925 - 1,625,925 1,382,806 - 1,382,806 Time deposits with remaining term to maturity: - Up to 3 months 2,305 - 2,305 1,558 - 1,558 3,136 - 3,136 Over 3 months and up to 6 months 4,364 - 4,364 334 - 334 335 - 335 Over 6 months and up to 12 months 4,237 - 4,237 16,123 - 16,123 5,178 - 5,178 Over 1 year and up to 5 years 102 - 102 4,221 - 4,221 14,650 - 14,650
57,781,633 12,614,448 70,396,081 50,826,124 10,088,786 60,914,910 50,345,387 11,714,969 62,060,356
u.Otherborrowedfunds
Borrowings from central banks 66,035 350,972 417,007 105,503 137,420 242,923 143,245 - 143,245Borrowings from banks in Mauritius - - - 615,070 - 615,070 4,648 - 4,648 abroad - 690,278 690,278 - 441,299 441,299 - 3,118 3,118Obligation under finance leases - - - - - - 72,062 - 72,062Other financial institutions - 6,017,389 6,017,389 - 783,997 783,997 - 906,495 906,495
66,035 7,058,639 7,124,674 720,573 1,362,716 2,083,289 219,955 909,613 1,129,568
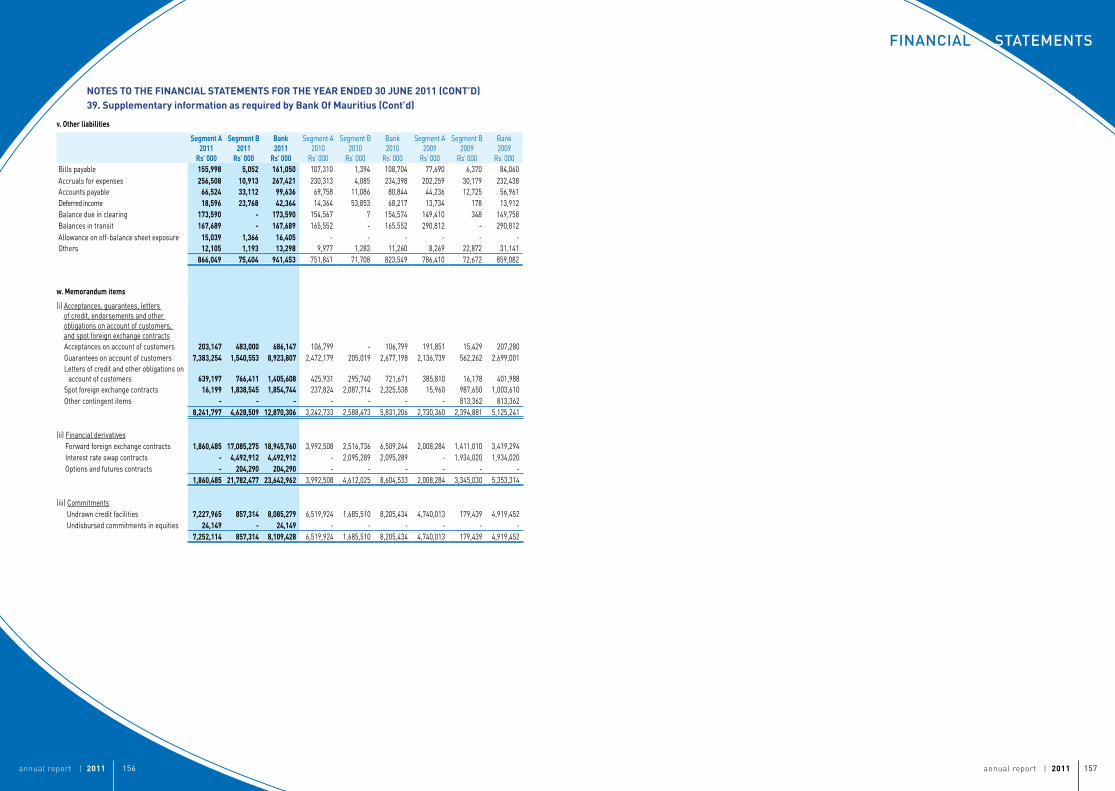
annual report | 2011 157annual report | 2011 156
STaTeMenTSFinancial
NOTESTOTHEFINANCIALSTATEMENTSFORTHEYEARENDED30JUNE2011(CONT’D)39.SupplementaryinformationasrequiredbyBankOfMauritius(Cont’d)
v.Otherliabilities
SegmentA2011
Rs’000
SegmentB2011
Rs’000
Bank2011
Rs’000
Segment A2010
Rs’ 000
Segment B2010
Rs’ 000
Bank2010
Rs’ 000
Segment A2009
Rs’ 000
Segment B2009
Rs’ 000
Bank2009
Rs’ 000Bills payable 155,998 5,052 161,050 107,310 1,394 108,704 77,690 6,370 84,060Accruals for expenses 256,508 10,913 267,421 230,313 4,085 234,398 202,259 30,179 232,438Accounts payable 66,524 33,112 99,636 69,758 11,086 80,844 44,236 12,725 56,961Deferred income 18,596 23,768 42,364 14,364 53,853 68,217 13,734 178 13,912Balance due in clearing 173,590 - 173,590 154,567 7 154,574 149,410 348 149,758Balances in transit 167,689 - 167,689 165,552 - 165,552 290,812 - 290,812Allowance on off-balance sheet exposure 15,039 1,366 16,405 - - - - - - Others 12,105 1,193 13,298 9,977 1,283 11,260 8,269 22,872 31,141
866,049 75,404 941,453 751,841 71,708 823,549 786,410 72,672 859,082
w.Memorandumitems
(i) Acceptances, guarantees, letters of credit, endorsements and other obligations on account of customers, and spot foreign exchange contractsAcceptances on account of customers 203,147 483,000 686,147 106,799 - 106,799 191,851 15,429 207,280Guarantees on account of customers 7,383,254 1,540,553 8,923,807 2,472,179 205,019 2,677,198 2,136,739 562,262 2,699,001Letters of credit and other obligations on account of customers 639,197 766,411 1,405,608 425,931 295,740 721,671 385,810 16,178 401,988Spot foreign exchange contracts 16,199 1,838,545 1,854,744 237,824 2,087,714 2,325,538 15,960 987,650 1,003,610Other contingent items - - - - - - - 813,362 813,362
8,241,797 4,628,509 12,870,306 3,242,733 2,588,473 5,831,206 2,730,360 2,394,881 5,125,241
(ii) Financial derivativesForward foreign exchange contracts 1,860,485 17,085,275 18,945,760 3,992,508 2,516,736 6,509,244 2,008,284 1,411,010 3,419,294Interest rate swap contracts - 4,492,912 4,492,912 - 2,095,289 2,095,289 - 1,934,020 1,934,020Options and futures contracts - 204,290 204,290 - - - - - -
1,860,485 21,782,477 23,642,962 3,992,508 4,612,025 8,604,533 2,008,284 3,345,030 5,353,314
(iii) CommitmentsUndrawn credit facilities 7,227,965 857,314 8,085,279 6,519,924 1,685,510 8,205,434 4,740,013 179,439 4,919,452Undisbursed commitments in equities 24,149 - 24,149 - - - - - -
7,252,114 857,314 8,109,428 6,519,924 1,685,510 8,205,434 4,740,013 179,439 4,919,452
SBMGroupAddresses
Corporate officeSBM Tower1, Queen Elizabeth II AvenuePort Louis, MauritiusTel: (230) 202 1111Fax: (230) 202 1234Swift: STCBMUMUHome Page: www.sbmgroup.muEmail: [email protected]
India101, Raheja CentreFree Press Journal MargNariman PointMumbai - 400 021, IndiaTel: (91) (22) 4302 8888Fax: (91) (22) 2284 2966Swift: STCBINBXEmail: [email protected]
SubsidiariesBanque SBM Madagascar SA 1, Rue Andrianary RatianarivoAntsahavola, 101 AntananarivoMadagascarTel: (261) 20 22 666 07Fax:(261) 20 22 666 08Swift: BSBMMGMGEmail: [email protected]
SBM Asset Management LimitedSBM Capital Management LimitedSBM Global Investments LtdSBM Investments LimitedSBM Holdings LtdSBM Tower1, Queen Elizabeth II AvenuePort Louis, MauritiusTel: (230) 202 1111Email: [email protected]
SBM Financials LtdSBM Tower1, Queen Elizabeth II AvenuePort Louis, MauritiusTel: (230) 202 1111Email: [email protected]
SBM Mauritius Asset Managers LtdSBM Tower1, Queen Elizabeth II AvenuePort Louis, MauritiusTel: (230) 202 1111Email: [email protected]
SBM Securities LimitedSBM Tower1, Queen Elizabeth II AvenuePort Louis, MauritiusTel: (230) 202 1111Home Page: www.sbmsecurities.comEmail: [email protected]
AssociateState Insurance Company of Mauritius LtdSICOM Building,Sir Celicourt Antelme Street,Port Louis, MauritiusTel: (230) 203 8400Email: [email protected]
Contactdetailsforshareholderinformation
Company SecretarySBM Tower1, Queen Elizabeth II AvenuePort Louis, MauritiusTel: (230) 202 1560Fax: (230) 211 8838Email: [email protected]

SBM Tower, 1 Queen elizabeth ii avenue, port louis, republic of Mauritius • Tel: (230) 202 1111 • Fax: (230) 202 1234Swift: STcBMUMU • email: [email protected] • website: www.sbmgroup.mu