Embed Size (px)
Citation preview
Home Office Research Study 251
Effects of improved street lighting on crime: a systematic review
David P. Farrington and Brandon C. Welsh
The views expressed in this report are those of the authors, not necessarily those of the Home Office (nor do they reflect Government policy).
Home Office Research, Development and Statistics DirectorateAugust 2002
Effects of improved street lighting on crime: a systematic review
Home Office Research Studies
The Home Office Research Studies are reports on research undertaken by or on behalf ofthe Home Office. They cover the range of subjects for which the Home Secretary hasresponsibility. Other publications produced by the Research, Development and StatisticsDirectorate include Findings, Statistical Bulletins and Statistical Papers.
The Research, Development and Statistics Directorate
RDS is part of the Home Office. The Home Office's purpose is to build a safe, just and tolerantsociety in which the rights and responsibilities of individuals, families and communities areproperly balanced and the protection and security of the public are maintained.
RDS is also part of National Statistics (NS). One of the aims of NS is to inform Parliament andthe citizen about the state of the nation and provide a window on the work and performanceof government, allowing the impact of government policies and actions to be assessed.
Therefore –
Research Development and Statistics Directorate exists to improve policy making, decisiontaking and practice in support of the Home Office purpose and aims, to provide the public andParliament with information necessary for informed debate and to publish information forfuture use.
First published 2002Application for reproduction should be made to the Communication Development Unit,Room 201, Home Office, 50 Queen Anne’s Gate, London SW1H 9AT.© Crown copyright 2002 ISBN 1 84082 881 1
ISSN 0072 6435
i
Foreword
This review summarises the findings of previous studies from both the USA and Britain on theeffectiveness of improved street lighting on crime. Rigorous criteria were set for the inclusionof studies. These criteria were:
that improvements in street lighting were the main intervention studied;that there was an outcome measure of crime;that crime levels before and after the intervention were measured; andthat the studies included a comparable control area.
A meta-analysis of the eligible studies found that improved street lighting led to significantreductions in crime and with an overall reduction in recorded crime of 20 per cent across allthe experimental areas.
The review assesses why street lighting has this impact on crime. The authors conclude thatlighting increases community pride and confidence and strengthens informal social controland that this explains the recorded impacts, rather than increased surveillance or deterrenteffects. The authors, however, suggest that these explanatory theories need to be testedmore explicitly in future research and that there need to be further assessments of theimpacts of different levels of illumination on crime.
The authors conclude that improvements in street lighting offer a cost-effective crimereduction measure and should be considered an important element in situational crimereduction programmes.
Carole F WillisHead of Policing and Reducing Crime Unit
Acknowledgements
We would like to thank the following individuals for assistance in obtaining copies ofevaluation reports and relevant data: Professor Norman Davidson (University of Hull),Professor Jason Ditton (University of Sheffield and Scottish Centre for Criminology), DeborahFriedman (University of Massachusetts Lowell), Professor David Griswold (Florida AtlanticUniversity), Dr. Patrick Langan (Bureau of Justice Statistics) and Dr. Kate A. Painter (HomeOffice). We would also like to thank Dr. John MacLeod (Home Office) for assistance withFigure 1. Thanks also go to Professor Ross Homel, Griffith University, Australia and DrAnthony Braga, Harvard University, USA, for acting as independent assessors for thisreport.
David P. FarringtonBrandon C. Welsh
David P. Farrington is Professor of Psychological Criminology in the Institute of Criminology,University of Cambridge. Brandon C. Welsh is an Assistant Professor in the Department ofCriminal Justice, University of Massachusetts Lowell.
ii
Effects of improved street lighting on crime: a systematic review
Contents
Foreword iAcknowledgements iiContents iiiList of tables ivList of figures ivSummary v
1 Background 1Research on street lighting and crime 1How might improved street lighting reduce crime? 2Causal links between street lighting and crime 3Determining what works to reduce crime 5Characteristics of systematic reviews 7Aims of this report 8
2 Methods 9Criteria for inclusion of evaluation studies 9Search strategies 11Programmes not meeting inclusion criteria 12
3 Results 19Key features of evaluations 19Results of American studies 20Results of British studies 29
4 Conclusions 39Summary of main findings 39Priorities for research 40Policy implications 41
Appendix 1: Literature reviews consulted 43Appendix 2: Evaluation reports that could not be obtained 44References 45
iii
List of tables
2.1 Street lighting evaluations not meeting inclusion criteria 133.1 American street lighting evaluations meeting inclusion criteria 213.2 Results of American street lighting evaluations 233.3 Meta-analysis of American street lighting evaluations 283.4 British street lighting evaluations meeting inclusion criteria 303.5 Results of British street lighting evaluations 313.6 Meta-analysis of British street lighting evaluations 34
List of figures
3.1 Street lighting evaluations 35
iv
Effects of improved street lighting on crime: a systematic review
Summary
The main aim of this report is to present the findings of a systematic review of the effects ofimproved street lighting on crime. Systematic reviews of the literature use rigorous methods forlocating, appraising and synthesising evidence from prior evaluation studies. They have explicitobjectives, extensive searches to locate possibly relevant studies, explicit criteria for inclusion orexclusion of studies, and a structured and detailed report including methods and results sections.
There are two main theories of why improved street lighting may cause a reduction in crime.The first suggests that improved lighting leads to increased surveillance of potentialoffenders (both by improving visibility and by increasing the number of people on the street)and hence to the deterrence of potential offenders. The second suggests that improvedlighting signals increased community investment in the area and that the area is improving,leading to increased community pride, community cohesiveness and informal social control.The first theory predicts decreases in crime especially during the hours of darkness, whilethe second theory predicts decreases in crime during both day-time and night-time.
The studies included
Studies were included in this review if improved lighting was the main intervention, if therewas an outcome measure of crime, if there was at least one experimental area and onecontrol area, if there were before and after measures of crime, and if the total number ofcrimes in each area before the intervention was at least 20.
Sixteen potentially relevant studies were obtained and screened but were excluded forvarious reasons, including the lack of a comparable control condition, the absence of anoutcome measurement of crime and too small numbers. Most of these studies found thatimproved street lighting was followed by a decrease in crime.
Findings: effects of lighting on crime
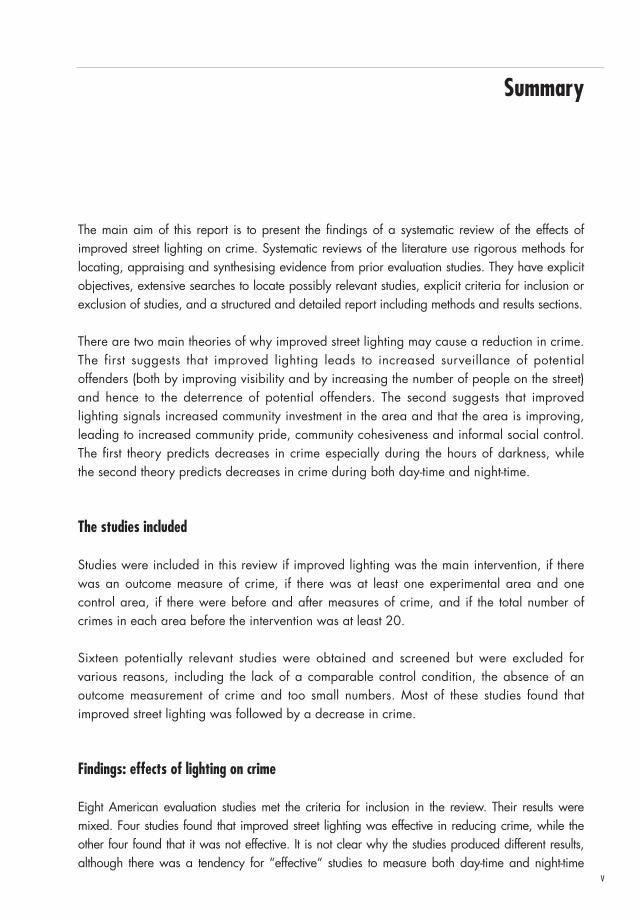
Eight American evaluation studies met the criteria for inclusion in the review. Their results weremixed. Four studies found that improved street lighting was effective in reducing crime, while theother four found that it was not effective. It is not clear why the studies produced different results,although there was a tendency for “effective“ studies to measure both day-time and night-time
v
crimes and for “ineffective“ studies to measure only night-time crimes. Seven of the eight evaluationswere rather old, dating from the 1970s. A meta-analysis found that the 8 studies, taken together,showed that improved street lighting led to a near-significant 7 per cent decrease in crime.
Five more recent British evaluation studies met the criteria for inclusion in the review. Their resultsshowed that improved lighting led to a significant 30 per cent decrease in crime. Furthermore,in two studies, the financial savings from reduced crimes greatly exceeded the financial costs ofthe improved street lighting. A meta-analysis found that the 13 studies, taken together, showedthat improved lighting led to reductions in crime. The overall reduction in crime after improvedlighting was 20 per cent in experimental areas compared with control areas.
Since these studies did not find that night-time crime decreased more than day-time crime, atheory of street lighting focussing on its role in increasing community pride and informalsocial control may be more plausible than a theory focussing on increased surveillance andincreased deterrence. The results did not contradict the theory that improved lighting wasmost effective in reducing crime in stable homogeneous communities.
The knowledge gaps
It is recommended that future research should be designed to test the main theories of the effectsof improved lighting more explicitly, and should measure crime using police records, victimsurveys, and self-reports of offending. Levels of illumination, as well as crime rates, should bemeasured before and after the intervention in experimental and control areas. Future researchshould ideally include experimental, adjacent and non-adjacent control areas, in order to testhypotheses about displacement and diffusion of benefits. Ideally, a long time series of crimesbefore and after improved lighting in experimental and control areas should be studied.Attempts should be made to investigate how the effects of improved lighting vary according tocharacteristics of areas and how far there are different effects on different kinds of crimes.
Conclusion
It is concluded that improved lighting should be included as one element of a situationalcrime reduction programme. It is an inclusive intervention benefiting the whole of aneighbourhood and leads to an increase in perceived public safety. Improved street lightingis associated with greater use of public space and neighbourhood streets by law abidingcitizens. Especially if well targeted to a high-crime area, improved street lighting can be afeasible, inexpensive and effective method of reducing crime.
vi
Effects of improved street lighting on crime: a systematic review
1. Background
Research on street lighting and crime
Contemporary interest in the effect of improved street lighting on crime began in NorthAmerica during the dramatic rise in crime which took place in the 1960s. Many towns andcities embarked upon major street lighting programmes as a means of reducing crime, andinitial results were encouraging (Wright et al., 1974).
The proliferation of projects across North America led to a detailed review of the effects ofstreet lighting on crime by Tien et al. (1979) as part of the National Evaluation Program ofLEAA (Law Enforcement Assistance Agency) funding. Their report describes how 103 streetlighting projects originally identified were eventually reduced to a final sample of only 15 thatwere considered by the review team to contain sufficiently rigorous evaluative information.
With regard to the impact of street lighting on crime, Tien et al. (1979) concluded that theresults were mixed and generally inconclusive. However, each project was considered to beseriously flawed because of such problems as: weak project designs; misuse or completeabsence of sound analytic techniques; inadequate measures of street lighting; poormeasures of crime (all were based on police records); and insufficient appreciation of theimpact of lighting on different types of crime.
Obviously, the Tien et al. (1979) review should have led to attempts to evaluate the effectsof improved street lighting using more adequate designs and alternative measures of crime,such as victim surveys, self-reports or systematic observation. It should also have stimulatedefforts to determine in what circumstances improved street lighting might lead to reductionsin crime (since the desired results were obtained in some studies). Unfortunately, it wasinterpreted as showing that street lighting had no effect on crime and effectively killedresearch on the topic in the United States.
Few crime prevention initiatives could have survived the rigorous examination by Tien et al.(1979) unscathed. As Painter (1996) p. 318) noted:
“Despite the fact that other National Evaluations conducted at the same time (e.g.Operation Identification, Crime Prevention Security Surveys, Citizen Patrols andCitizen Crime Reporting Projects) found evidence of programme impact to beinconsistent and inconclusive… all these strategies, with the exception of street
1
lighting, continued to be promoted on both sides of the Atlantic. The reasons forignoring the potential role of street lighting are difficult to determine“.
In the United Kingdom, very little research was carried out on street lighting and crime untilthe late 1980s (Fleming and Burrows, 1986). There was a resurgence of interest between1988 and 1990, when three small-scale street lighting projects were implemented andevaluated in dif ferent areas of London: in Edmonton, Tower Hamlets andHammersmith/Fulham (Painter, 1994). In each crime, disorder and fear of crime declinedand pedestrian street use increased dramatically after the lighting improvements.
In contrast to these generally positive results, a major Home Office-funded evaluation inWandsworth (Atkins et al., 1991) concluded that improved street lighting had no effect oncrime, and a Home Office review, published simultaneously, also asserted that “betterlighting by itself has very little effect on crime“ (Ramsay and Newton, 1991, p. 24).However, as further evidence accumulated, there were more signs that improved streetlighting could have an effect in reducing crime. In the most recent review by Pease (1999),he considered that “the capacity of street lighting to influence crime has now beensatisfactorily settled“ (p. 68). He also recommended that the debate should be moved fromthe sterile “does it work or doesn’t it?“ to the more productive “how can I flexibly andimaginatively incorporate lighting in crime reduction strategy and tactics?“ (p. 72).
How might improved street lighting reduce crime?
Explanations of the way street lighting improvements could prevent crime can be found in“situational“ approaches which focus on reducing opportunity and increasing perceived riskthrough modification of the physical environment (Clarke, 1995); and in perspectives whichstress the importance of strengthening informal social control and community cohesionthrough more effective street use (Jacobs, 1961; Angel, 1968) and investment inneighbourhood conditions (Taub et al., 1984; Taylor and Gottfredson, 1986).
The situational approach to crime prevention suggests that crime can be prevented byenvironmental measures which directly affect offenders’ perceptions of increased risks anddecreased rewards. This approach is also supported by theories which emphasise natural,informal surveillance as a key to crime prevention. For example, Jacobs (1961) drew attentionto the role of good visibility combined with natural surveillance as a deterrent to crime. Sheemphasised the association between levels of crime and public street use, suggesting that lesscrime would be committed in areas with an abundance of potential witnesses.
2
Effects of improved street lighting on crime: a systematic review
Other theoretical perspectives have emphasised the importance of investment to improveneighbourhood conditions as a means of strengthening community confidence, cohesionand social control (Wilson and Kelling, 1982; Skogan, 1990). As a highly visible sign ofpositive investment, improved street lighting might reduce crime if it physically improved theenvironment and signalled to residents that efforts were being made to invest in andimprove their neighbourhood. In turn, this might lead them to have a more positive image ofthe area and increased community pride, optimism and cohesion. It should be noted thatthis theoretical perspective predicts a reduction in both day-time and night-time crime.Consequently, attempts to measure the effects of improved lighting should not concentratepurely on night-time crime.
The relationship between visibility, social surveillance and criminal opportunities is aconsistently strong theme to emerge from the literature. A core assumption of bothopportunity and informal social control models of prevention is that criminal opportunitiesand risks are influenced by environmental conditions in interaction with resident andoffender characteristics. Street lighting is a tangible alteration to the built environment but itdoes not constitute a physical barrier to crime. However, it can act as a catalyst to stimulatecrime reduction through a change in the perceptions, attitudes and behaviour of residentsand potential offenders.
Causal links between street lighting and crime
It is helpful to list possible ways in which improved lighting might reduce crime (Painter andFarrington, 1999b; Pease, 1999). As mentioned, the two most popular theories focus on thedeterrent effects of increased surveillance and on the effects of increased community prideon informal social control. Sample hypotheses are as follows:
● Lighting may reduce crime by improving visibility. This deters potential offendersby increasing the risks that they will be recognised or interrupted in the course oftheir activities (Mayhew et al., 1979). The presence of police and other authorityfigures also becomes more visible.
● Lighting improvements may encourage increased street usage which intensifiesnatural surveillance. The change in routine activity patterns works to reduce crimebecause it increases the flow of potentially capable guardians (Cohen andFelson, 1979). From the potential offender’s perspective, the proximity of otherpedestrians acts as a deterrent since the risks of being recognised or interrupted
3
Background
when attacking personal or property targets are increased. From the potentialvictim’s perspective, perceived risks and fear of crime are reduced.
● Enhanced visibility and increased street usage may interact to heightenpossibilities for informal surveillance. Pedestrian density and flow and surveillancehave long been regarded as crucial for crime control since they can influencepotential offenders’ perceptions of the likely risks of being caught (Newman,1972; Bennett and Wright, 1984).
● The renovation of a highly noticeable component of the physical environmentcombined with changed social dynamics may act as a psychological deterrent.Potential offenders may judge that the image of the location is improving and thatsocial control, order, and surveillance have increased (Taylor and Gottfredson,1986). They may deduce that crime in the relit location is riskier than elsewhereand this can influence behaviour in two ways. First, potential offenders living inthe area will be deterred from committing offences or escalating their activities.Second, potential offenders from outside the area will be deterred from entering it(Wilson and Kelling, 1982). However, crimes may be displaced from the relitarea to other places.
● Lighting may improve community confidence. It provides a highly noticeable signthat local authorities are investing in the fabric of the area. This offsets anyprevious feelings of neglect and stimulates a general “feel good“ factor. It mayalso encourage informal social control and interventions by residents to preventcrime and disorder. Fear of crime may be reduced.
● Improved illumination may reduce fear of crime because it physically improves theenvironment and alters public perceptions of it. People sense that a well-litenvironment is less dangerous than one that is dark (Warr, 1990). The positiveimage of the night-time environment in the relit area is shared by residents andpedestrians. As actual and perceived risks of victimisation lessen, the areabecomes used by a wider cross- section of the community. The changed social mixand activity patterns within the locality reduce the risk and fear of crime.
It is also feasible that improved street lighting could, in certain circumstances, increaseopportunities for crime. It may bring greater numbers of potential victims and potentialoffenders into the same physical space. Increased visibility of potential victims may allowpotential offenders to make better judgements of their vulnerability and attractiveness (e.g. in
4
Effects of improved street lighting on crime: a systematic review
terms of valuables). Increased social activity outside the home may increase the number ofunoccupied homes available for burglary. Increased illumination may make it easier foroffenders to commit crimes and to escape.
The effects of improved street lighting are likely to vary in different conditions. In particular,they are likely to be greater if the existing lighting is poor and if the improvement in lightingis considerable. They may vary according to characteristics of the area or the residents, thedesign of the area, the design of the lighting, and the places that are illuminated. Forexample, lighting may only improve community confidence and informal social control inrelatively stable homogeneous communities, not in areas with a heterogeneous populationmix and high residential mobility. The effects of improved lighting may also interact withother environmental improvements such as CCTV cameras or better locks. Improved streetlighting may have different effects on different types of crimes (e.g. violence versus property)and different effects on day-time as opposed to night-time crime.
While more research is needed on the dose-response relationship between lighting andcrime and on effects in different boundary conditions, the main question addressed in thisreview is simply whether existing evidence suggests that improved street lighting does ordoes not lead to reductions in crime. Therefore, it is essential in each study to produce acomparable summary measure of effect size. The main measure of effect size used here isbased on changes in the number of crimes in a relit (experimental) area compared withchanges in the number of crimes in a comparable control area.
Determining what works to reduce crime
Deciding what works to reduce crime requires examination of the results of prior evaluationstudies whenever they are available. This is better than drawing conclusions about whatworks from personal experience, from anecdotal evidence, from widespread beliefs, or froma single study that was well-funded or heavily publicised. Given such advantages, it is nosurprise to find that criminologists have been reviewing what works for at least 50 years.Although the methods have varied, reviewers have followed the same general set of tasks:identify and gather relevant reports of evaluation studies, assess them, and come to asummary conclusion about what works.
From the 1970s, the traditional methods used in these reviews began to be seriouslycriticised. One criticism focussed on the general lack of explicitness of reviews: mostsuffered from a lack of detail about how the reviewer conducted the research. Information
5
Background
was often missing about why certain studies were included while others were excluded fromthe review. Sometimes this lack of detail was caused by space limitations imposed onreviewers by journal or book editors. The report of the review often did not describe whatliterature searches were carried out in order to try to locate relevant evaluation studies. Itwas often difficult for the serious reader to determine how the reviewers came to theirconclusions about what works. Too often, the reader was forced to accept and trust thereviewer’s expertise and was not given sufficient information to permit replication of thereviewer’s methods.
A second criticism focussed on the methods used. Most of the reviewers did not attempt tocontrol problems that could potentially bias their review toward one conclusion rather thananother. At its worst, a reviewer advocating a particular conclusion could selectively includeonly studies favouring that viewpoint in the review. For example, a reviewer in favour ofstreet lighting could exclude evaluations that found little effect of street lighting. Suchintentional distortion was fortunately rare in academic reviews (as opposed to reviews bypractitioners, policy makers or others with a vested interest).
More common than intentional distortion was the failure to deal with potential biases thatcould compromise the results of a review. For example, some reviewers examining whatworks relied on easy-to-obtain journal articles as the only source for reports of evaluations.One advantage of journal articles over other documents is that they have usually passed arigorous peer review process. However, research in other fields suggests that relying onjournal articles can bias the results towards concluding that interventions are more effectivethan they really are. This is because researchers are more likely to submit their articles tojournals when they find a positive effect of an intervention and to bury the manuscript intheir file drawer when they do not. Both authors and journal editors are biased againstarticles reporting a null effect, sometimes falsely assuming that such papers do notcontribute to knowledge.
Another criticism is that inexplicit and unsystematic review methods cannot cope with theincredible increase in research worldwide. For example, the number of journals that nowpublish information about crime is enormous compared to just a few years ago. Relying onjournals available in a library or on articles collected in office files will no longer ensurecoverage of all available studies. The internet now makes hundreds if not thousands ofevaluation reports potentially accessible to prospective reviewers. In the same way that itwould be difficult to make sense of a large, growing and scattered collection of policereports without orderly methods, it is also difficult to make sense of the burgeoning numberof evaluation studies without some systematic method for doing so.
6
Effects of improved street lighting on crime: a systematic review
Characteristics of systematic reviews
In response to these criticisms, researchers began to develop and refine scientific andorderly methods for conducting reviews, and the concept of a “systematic review“ arose.Individuals conducting systematic reviews use rigorous methods for locating, appraising andsynthesising evidence from prior evaluation studies. Systematic reviews contain methods andresults sections, and are reported with the same level of detail that characterises high qualityreports of original research. Other features of systematic reviews include (see Farringtonand Petrosino, 2000, 2001):
● Explicit objectives. The rationale for conducting the review is made clear.
● Explicit eligibility criteria. The reviewers specify in detail why they includedcer tain studies and rejected others. What was the minimum level ofmethodological quality for inclusion? Did they consider only a particular type ofevaluation design such as randomised experiments? Did the studies have toinclude a certain type of participant such as children or adults? What types ofinterventions were included? What kinds of outcome data had to be reported inthe studies? All criteria or rules used in selecting eligible studies should beexplicitly stated in the final report.
● The search for studies is designed to reduce potential bias. There are manypotential ways in which bias can compromise the results of a review. Thereviewers must explicitly state how they conducted their search of potential studiesto reduce such bias. How did they try to locate studies reported outside scientificjournals? How did they try to locate studies in foreign languages? Allbibliographic databases that were searched should be made explicit so thatpotential gaps in coverage can be identified.
● Each study is screened according to eligibility criteria with exclusions justified. Thesearches will undoubtedly locate many citations and abstracts to potentially relevantstudies. Each of the reports of these potentially relevant studies must be screened todetermine if it meets the eligibility criteria for the review. A full listing of all excludedstudies and the justifications for exclusion should be made available to readers.
● Assembly of the most complete data possible. The systematic reviewer will try toobtain all relevant evaluations meeting the eligibility criteria. In addition, all datarelevant to the objectives of the review should be carefully extracted from each
7
Background
eligible report and coded and computerised. Sometimes, original studydocuments lack important information. When possible, the systematic reviewerwill attempt to obtain this from the authors of the original report.
● Quantitative techniques are used, when appropriate and possible, in analysingresults. A meta-analysis involves the statistical or quantitative analysis of the resultsof prior research studies. Since it involves the statistical summary of data (andespecially of effect sizes), it requires a reasonable number of intervention studiesthat are sufficiently similar to be grouped together. A systematic review may ormay not include a meta-analysis. For example, a reviewer may only find a fewstudies meeting the eligibility criteria. Those studies may differ just enough in theway they were conducted (e.g. in interventions or participants) to make formalmeta-analysis inappropriate and potentially misleading.
● A structured and detailed report. The final report of a systematic review isstructured and detailed so that the reader can understand each phase of theresearch, the decisions that were made, and the conclusions that were reached.
Aims of this report
The main aim of this report is to present the findings of a systematic review of the availableresearch evidence on the effects of improved lighting on crime. This report is divided intofour main chapters. The second chapter, on methods, reports on the criteria for inclusion oflighting studies in this review and the methods used to search for, code and analyseevaluation reports of lighting studies. In addition, it summarises studies that were obtainedand screened but excluded from the review. The third chapter reports on the key features ofstudies that were included and the key results of each research project. The fourth and finalchapter summarises the main findings and identifies research priorities and policyrecommendations for the future.
8
Effects of improved street lighting on crime: a systematic review
9
2. Methods
This report presents a systematic review of the effects of improved street lighting on crimeand follows closely the methodology of this review technique. As noted above, systematicreviews use rigorous methods for locating, appraising, and synthesising evidence from priorevaluation studies, and are reported with the same level of detail that characterises highquality reports of original research. They have explicit objectives, explicit criteria forincluding or excluding studies, extensive searches for eligible evaluation studies from allover the world, careful extraction and coding of key features of studies, and a structuredand detailed report of the methods and conclusions of the review. All of this contributesgreatly to the ease of their replication by other researchers.
Criteria for inclusion of evaluation studies
In selecting programmes for inclusion in this review, the following criteria were used:
● Improved street lighting (or improved lighting) was the focus of the intervention.For programmes involving one or more other interventions, only thoseprogrammes in which improved lighting was the main intervention were included.In other cases, it would be very difficult to disentangle the effects of improvedlighting from the effects of another intervention. The determination of what wasthe main intervention was based on the author of the report identifying it as suchor, if the author did not do this, the importance the report gave to improvedlighting relative to the other interventions.
● There was an outcome measure of crime. The most relevant crime outcomes wereproperty and violent crimes.
● The evaluation design was of high quality methodologically, with the minimumdesign involving before and after measures in experimental and control areas(Farrington, 1997).
● There was at least one experimental area and one comparable control area. ● The total number of crimes in each area before the intervention was at least 20.
The main measure of effect size was based on changes in crime rates betweenthe before and after time periods. It was considered that a measure of changebased on an N below 20 was potentially misleading. Also, any study with lessthan 20 crimes before would have insufficient statistical power to detect changes
in crime. The criterion of 20 is probably too low, there was reluctance to excludestudies unless their numbers were clearly inadequate.
It might perhaps be argued that the “gold standard“ design should be the randomisedexperiment, which is the most convincing method of evaluating crime preventionprogrammes (Farrington, 1983). The key feature of randomised experiments is that theexperimental and control groups are equated before the experimental intervention on allpossible extraneous variables. Hence, any subsequent differences between them must beattributable to the intervention. The randomised experiment, however, is only the mostconvincing method of evaluation if a sufficiently large number of units is randomly assigned.As a rule of thumb, at least 50 units in each category are needed.
This number is relatively easy to achieve with individuals but very difficult to achieve withlarger units such as areas, as in improved street lighting programmes. Sherman andWeisburd (1995) were able to allocate 110 high crime places (about the size of a streetblock) at random either to receive increased police patrolling or not, but it is hard to see howthis approach could be used in practice with street lighting. For example, new cables wouldhave to be laid all over a city to improve the lighting of a few blocks chosen at random.
For larger units such as areas, the best and most feasible design usually involves before andafter measures in experimental and control conditions together with statistical control ofextraneous variables. This is the best way of dealing with the following threats to internalvalidity (Cook and Campbell, 1979; Painter and Farrington, 1997, p. 212):
● History: decreases in crime after improved lighting might be caused by otherchanges over time (e.g. decreased unemployment rates);
● Trends: decreases in crime after improved lighting might be attributable to acontinuation of pre-existing trends;
● Measurement: decreases in crime after improved lighting might be attributable tochanges in methods of measurement (e.g. police recording practices);
● Regression: decreases in crime after improved lighting might be attributable to afluctuation downwards following an unusually high crime rate period.
The statistical control of extraneous variables influencing crime rates can deal with selectioneffects due to prior differences between experimental and control areas.
10
Effects of improved street lighting on crime: a systematic review
In general, if crime decreases in an experimental area after an intervention, it is difficult tobe sure that the decrease was caused by the intervention without being able to comparecrime trends in the experimental area with crime trends in a comparable control area.
Search strategies
The following four search strategies were used to identify evaluations of improved lightingprogrammes meeting the criteria for inclusion in this review:
● searches of on-line databases (see below)● searches of reviews of the literature on the effects of improved lighting on crime
(for a list of reviews consulted, see Appendix 1)● searches of bibliographies of evaluation reports of improved lighting studies● contacts with leading researchers (see Acknowledgements).
Both published and unpublished reports were considered in these searches. Furthermore, thesearches were international in scope and were not limited to the English language. Thesesearches were completed in January 2001 and reflect material published or reported up tothe end of 2000.
The following eight databases were searched: ● Criminal Justice Abstracts● National Criminal Justice Reference Service (NCJRS) Abstracts● Sociological Abstracts● Social Science Abstracts (SocialSciAbs)● Educational Resources Information Clearinghouse (ERIC)● Government Publications Office Monthly Catalogue (GPO Monthly)● Psychology Information (PsychInfo) ● Public Affairs Information Service (PAIS) International.
These databases were selected on the basis of the most comprehensive coverage ofcriminological, criminal justice and social science literatures. They are also among the topdatabases recommended by the Crime and Justice Group of the Campbell Collaboration,and other systematic reviews of interventions in the field of crime and justice have used them(e.g. Petrosino et al., 2000).
11
Methods
The following terms were used to search the eight databases noted above: street lighting,lighting, illumination and natural surveillance. When applicable, “crime“ was then added toeach of these terms (e.g. street lighting and crime) to narrow the search parameters.
Only studies that might potentially be included in the review were sought. As alreadymentioned, the exhaustive review by Tien et al. (1979) identified 103 street lighting projectscarried out in the 1970s but only considered that 15 (listed on pp. 51-54) met theirminimum methodological standards. Attempts were made to obtain 11 of these 15evaluation reports. For the other four studies (conducted in Baltimore, Chicago,Richmond/Virginia and Washington DC), Tien et al. (1979) could not determine from thereport that there was any kind of experimental-control comparison. Hence, attempts werenot made to obtain and screen every possible study on lighting and crime conducted priorto Tien et al. (1979), only studies that conceivably might meet the criteria for inclusion.Attempts were made to obtain and screen every possible study conducted after the reviewby Tien et al. (1979).
These search strategies resulted in the collection of 13 evaluations of improved lightingprogrammes that met the criteria for inclusion in this review. A few of the identifiedevaluations, which may or may not have met the criteria for inclusion, could not beobtained. The (unpublished) reports of these programmes are listed in Appendix 2.
Programmes not meeting inclusion criteria
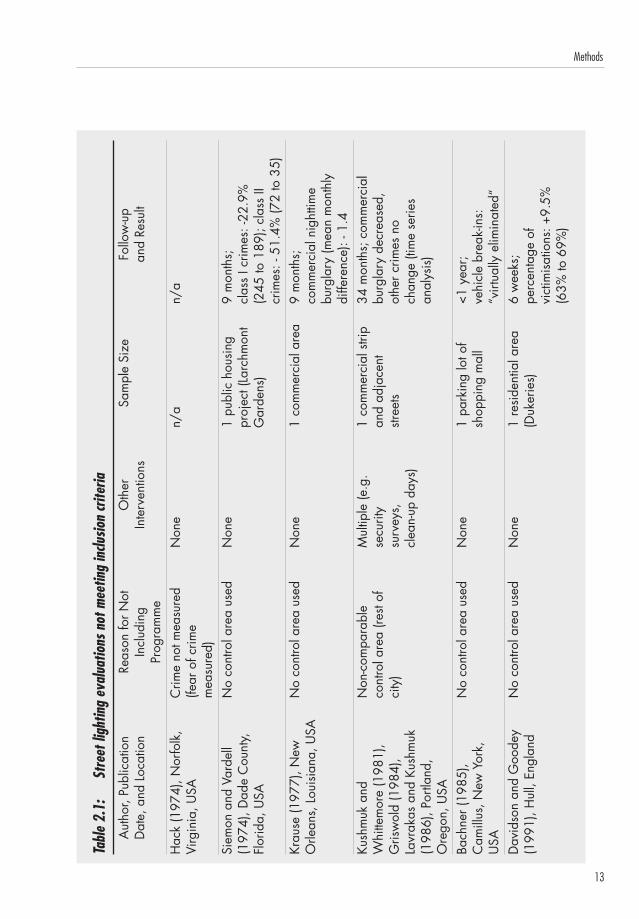
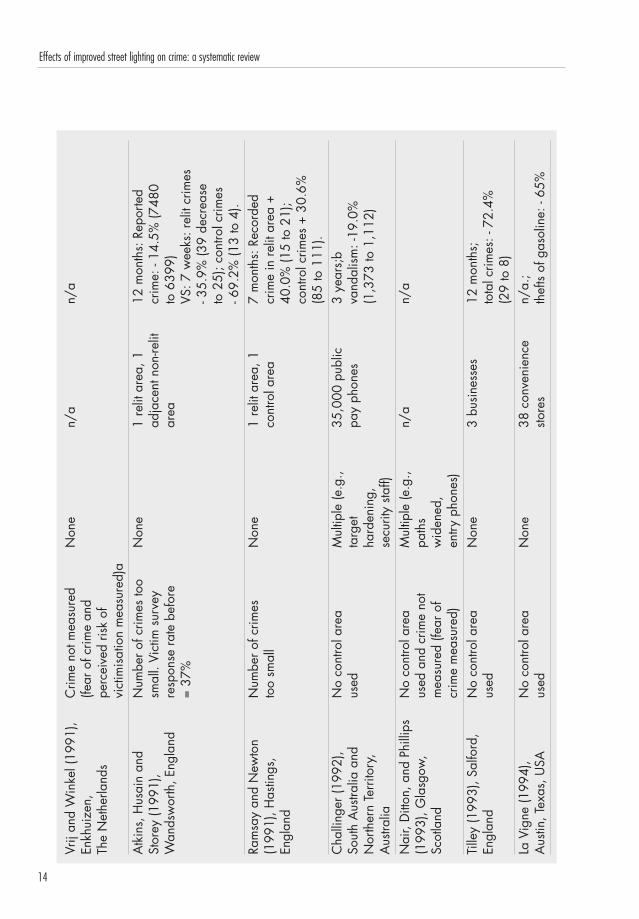
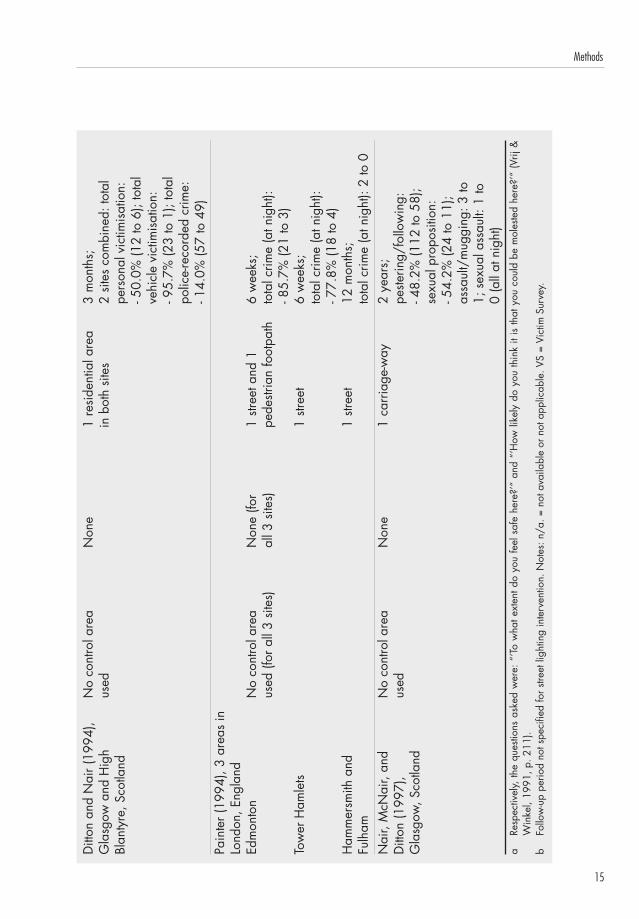
In the searches for evaluations of improved lighting programmes, several of those obtainedand screened did not meet the criteria for inclusion and thus have not been included in thepresent review. Altogether, 16 improved lighting programmes were excluded. Table 2.1 liststhese programmes and identifies the main reasons for their exclusion. There are two mainreasons for listing these studies. First, this conforms with the widespread practice insystematic reviews of identifying and summarising excluded studies. Second, it allowsreaders to judge for themselves the strength of the observed effects of lighting on crime inexcluded compared with included studies in light of the methodological differences betweenthe studies.
As shown in Table 2.1, 11 evaluations were excluded because they did not use acomparable control area in assessing the impact of the improved street lighting intervention,and two because the number of crimes was too small. Two evaluations were excludedbecause they did not include crime as an outcome measure, and one (Nair et al., 1993)
12
Effects of improved street lighting on crime: a systematic review
13
Methods
Tabl
e 2.
1:
Stre
et li
ghtin
g ev
alua
tions
not
mee
ting
inclu
sion
crite
ria
Aut
hor,
Publ
icat
ion
Reas
on fo
r Not
Oth
erSa
mpl
e Si
zeFo
llow
-up
Dat
e, a
nd L
ocat
ion
Incl
udin
g In
terv
entio
nsan
d Re
sult
Prog
ram
me
Hac
k (1
974)
, Nor
folk
,C
rime
not m
easu
red
Non
en/
an/
aVi
rgin
ia, U
SA(fe
ar o
f crim
e m
easu
red)
Siem
on a
nd V
arde
ll N
o co
ntro
l are
a us
edN
one
1 pu
blic
hou
sing
9 m
onth
s;(1
974)
, Dad
e C
ount
y,
proj
ect (
Larc
hmon
tcl
ass
I crim
es: -
22.9
%Fl
orid
a, U
SAG
arde
ns)
(245
to 1
89);
clas
s II
crim
es: -
51.
4% (7
2 to
35)
Krau
se (1
977)
, New
N
o co
ntro
l are
a us
edN
one
1 co
mm
erci
al a
rea
9 m
onth
s;O
rlean
s, L
ouis
iana
, USA
com
mer
cial
nig
httim
ebu
rgla
ry (m
ean
mon
thly
diffe
renc
e): -
1.4
Kush
muk
and
N
on-c
ompa
rabl
eM
ultip
le (e
.g.
1 co
mm
erci
al s
trip
34 m
onth
s; c
omm
erci
alW
hitte
mor
e (1
981)
, co
ntro
l are
a (re
st of
secu
rity
and
adja
cent
burg
lary
dec
reas
ed,
Gris
wol
d (1
984)
, ci
ty)
surv
eys,
stree
tsot
her c
rimes
no
Lavr
akas
and
Kus
hmuk
cl
ean-
up d
ays)
chan
ge (t
ime
serie
s(1
986)
, Por
tland
, an
alys
is)
Ore
gon,
USA
Bach
ner (
1985
), N
o co
ntro
l are
a us
edN
one
1 pa
rkin
g lo
t of
<1 y
ear;
Cam
illus
, New
Yor
k,
shop
ping
mal
lve
hicl
e br
eak-
ins:
U
SA“v
irtua
lly e
limin
ated
“D
avid
son
and
Goo
dey
No
cont
rol a
rea
used
Non
e1
resi
dent
ial a
rea
6 w
eeks
;(1
991)
, Hul
l, En
glan
d(D
uker
ies)
perc
enta
ge o
fvi
ctim
isat
ions
: +9.
5%(6
3% to
69%
)
14
Effects of improved street lighting on crime: a systematic reviewVr
ij an
d W
inke
l (19
91),
Crim
e no
t mea
sure
d N
one
n/a
n/a
Enkh
uize
n,
(fear
of c
rime
and
The
Net
herla
nds
perc
eive
d ris
k of
vi
ctim
isat
ion
mea
sure
d)a
Atk
ins,
Hus
ain
and
Num
ber o
f crim
es to
oN
one
1 re
lit a
rea,
112
mon
ths:
Rep
orte
dSt
orey
(199
1),
smal
l. Vi
ctim
sur
vey
adja
cent
non
-relit
cr
ime:
- 14
.5%
(748
0W
ands
wor
th, E
ngla
ndre
spon
se ra
te b
efor
e ar
eato
639
9)=
37%
VS: 7
wee
ks: r
elit
crim
es- 3
5.9%
(39
decr
ease
to
25)
; con
trol c
rimes
- 6
9.2%
(13
to 4
).Ra
msa
y an
d N
ewto
n N
umbe
r of c
rimes
Non
e1
relit
are
a, 1
7 m
onth
s: R
ecor
ded
(199
1), H
astin
gs,
too
smal
lco
ntro
l are
acr
ime
in re
lit a
rea
+En
glan
d40
.0%
(15
to 2
1);
cont
rol c
rimes
+ 3
0.6%
(85
to 1
11).
Cha
lling
er (1
992)
, N
o co
ntro
l are
aM
ultip
le (e
.g.,
35,0
00 p
ublic
3 ye
ars;
bSo
uth
Aus
tralia
and
us
edta
rget
pay
phon
esva
ndal
ism
: -19
.0%
Nor
ther
n Te
rrito
ry,
hard
enin
g,(1
,373
to 1
,112
)A
ustra
liase
curit
y sta
ff)N
air,
Ditt
on, a
nd P
hilli
psN
o co
ntro
l are
aM
ultip
le (e
.g.,
n/a
n/a
(199
3), G
lasg
ow,
used
and
crim
e no
tpa
ths
Scot
land
mea
sure
d (fe
ar o
f w
iden
ed,
crim
e m
easu
red)
entry
pho
nes)
Tille
y (1
993)
, Sal
ford
, N
o co
ntro
l are
aN
one
3 bu
sine
sses
12 m
onth
s;En
glan
dus
edto
tal c
rimes
: - 7
2.4%
(29
to 8
)La
Vig
ne (1
994)
, N
o co
ntro
l are
aN
one
38 c
onve
nien
cen/
a.;
Aus
tin, T
exas
, USA
used
store
sth
efts
of g
asol
ine:
- 65
%
15
Methods
Ditt
on a
nd N
air (
1994
),N
o co
ntro
l are
aN
one
1 re
side
ntia
l are
a3
mon
ths;
Gla
sgow
and
Hig
h us
edin
bot
h si
tes
2 si
tes
com
bine
d: to
tal
Blan
tyre
, Sco
tland
pers
onal
vic
timis
atio
n:- 5
0.0%
(12
to 6
); to
tal
vehi
cle
vict
imis
atio
n:
- 95.
7% (2
3 to
1);
tota
lpo
lice-
reco
rded
crim
e:
- 14.
0% (5
7 to
49)
Pain
ter (
1994
), 3
area
s in
Lo
ndon
, Eng
land
Edm
onto
nN
o co
ntro
l are
a N
one
(for
1 str
eet a
nd 1
6
wee
ks;
used
(for
all
3 si
tes)
all 3
site
s)pe
destr
ian
foot
path
tota
l crim
e (a
t nig
ht):
- 85.
7% (2
1 to
3)
Tow
er H
amle
ts1
stree
t6
wee
ks;
tota
l crim
e (a
t nig
ht):
- 77.
8% (1
8 to
4)
Ham
mer
smith
and
1
stree
t12
mon
ths;
Fulh
amto
tal c
rime
(at n
ight
): 2
to 0
Nai
r, M
cNai
r, an
d N
o co
ntro
l are
aN
one
1 ca
rria
ge-w
ay2
year
s;D
itton
(199
7),
used
peste
ring/
follo
win
g:
Gla
sgow
, Sco
tland
- 48.
2% (1
12 to
58)
;se
xual
pro
posi
tion:
- 5
4.2%
(24
to 1
1);
assa
ult/
mug
ging
: 3 to
1; s
exua
l ass
ault:
1 to
0 (a
ll at
nig
ht)
aRe
spec
tivel
y, th
e qu
estio
ns a
sked
wer
e: “
‘To
wha
t ext
ent d
o yo
u fe
el s
afe
here
?’“
and
“‘H
ow li
kely
do
you
thin
k it
is th
at y
ou c
ould
be
mol
este
d he
re?’
“ (V
rij &
Win
kel,
1991
, p. 2
11).
bFo
llow
-up
perio
d no
t spe
cifie
d fo
r stre
et li
ghtin
g in
terv
entio
n. N
otes
: n/a
. = n
ot a
vaila
ble
or n
ot a
pplic
able
. VS
= Vi
ctim
Sur
vey.
was excluded because it neither had a control area nor an outcome measure of crime.Three of these programmes also included other interventions, making it difficult todisentangle the effects of the improved lighting from the effects of the other interventions.
For example, Atkins et al. (1991) first carried out an analysis of reported crimes in a relitarea before and after the improved street lighting, and found that crime decreased by 14.5per cent after. This analysis was excluded because it did not study reported crimes in acontrol area. Then a victim survey was carried out in experimental and control areas beforeand after the improved lighting. Unfortunately, this was problematic because of the lowresponse rate (37% before) and the short time periods covered (only seven weeks beforeand after). This evaluation was excluded because of small numbers and inadequatestatistical power to detect effects; the number of crimes in the control area in the pretest wasonly 13. The Hastings evaluation by Ramsay and Newton (1991) was also excludedbecause the number of crimes in the relit area in the pretest was less than 20. Several of theother excluded programmes listed in Table 2.1 had short follow-up periods (less than oneyear) and were limited by small numbers of crimes.
The Portland (Oregon) evaluation of Kushmuk and Whittemore (1981), Griswold (1984)and Lavrakas and Kushmuk (1986) was methodologically sophisticated in many ways butwas problematic for two main reasons. First, the experimental area (a 3.5-mile longcommercial strip called the Union Avenue Corridor) was compared with the rest of the cityof Portland:
“An inherent weakness of the evaluation design used to study CPTED [CrimePrevention Through Environmental Design] was the lack of a “control group“ withwhich to compare findings on the UAC [Union Avenue Corridor]. The evaluatorswere keenly aware of the internal validity problems caused by the lack of a non-equivalent control site – most notably, the difficulty in separating out the effects ofhistorical events from program effects. In the early stages of this study, attempts weremade to identify a comparable control site in Portland, but this proved impossible. Itwas discovered that Union Avenue was unique as a commercial area, especially inregards to its combination of racial make-up and social/economic factors. Giventhese circumstances, the decision was made to use city-wide crime data as a control.By using a city-wide index of crime, the evaluation was able to determine if crimechanges observed on the UAC were unique to that area, and, therefore, attributableto CPTED activities“ (Kushmuk and Whittemore, 1981, p. 15).
16
Effects of improved street lighting on crime: a systematic review
Second, it was impossible to disentangle the effects of the improved street lighting from theeffects of other interventions that were implemented at the same time, in particular securitysurveys (where security advisors gave people recommendations about target hardeningtechniques) and community events such as “clean-up days“.
The reports did not provide raw data that would enable calculation of numbers of crimesbefore and after the intervention, but this information was kindly provided by ProfessorDavid Griswold. The most relevant comparison is between 1975 (the last full year beforethe intervention) and 1978 (the first full year after the intervention). Between these years,commercial burglary decreased by 59 per cent in the experimental area, compared with a26 per cent decrease in the remainder of the city, a significant difference (odds ratio =1.83, p<.0001; see later for a discussion of the odds ratio).
Between these years, residential burglary decreased by 40 per cent in the experimentalarea, compared with a 20 per cent decrease in the remainder of the city, a significantdifference (odds ratio = 1.34, p = .002). Commercial robbery decreased by 29 per cent inthe experimental area, compared with a 6 per cent decrease in the remainder of the city,but this effect was not significant because of small numbers (odds ratio = 1.33). Street crimedecreased by 6 per cent in the experimental area, compared with a 30 per cent increase inthe remainder of the city, a significant difference (odds ratio = 1.39, p<.0001). Therefore,the results of these analyses are more positive than the conclusions drawn by the researchersfrom the time series analyses. In total, between 1975 and 1978, all of these types of crimesdecreased by 28 per cent in the experimental area, compared with a 6 per cent decreasein the remainder of the city, a significant difference (odds ratio = 1.30, p<.0001).
Most of the excluded studies found that crimes decreased after improved street lighting in anexperimental area: Siemon and Vardell (1974), Krause (1977), Griswold (1984), Bachner(1985), Atkins et al. (1991), Challinger (1992), Tilley (1993), Ditton and Nair (1994), LaVigne (1994), Painter (1994, three studies) and Nair et al. (1997). In contrast, Davidsonand Goodey (1991) and Ramsay and Newton (1991) found that crimes increased afterimproved street lighting. Therefore on the basis of “head counting“, these studies show thatimproved lighting is followed by decreases in crime. However, it is unclear how many ofthese changes were statistically significant. The low level of internal validity of these studies(together with other methodological problems) means that too much weight cannot be givento the results.
17

18
Effects of improved street lighting on crime: a systematic review
19
3. Results
Key features of evaluations
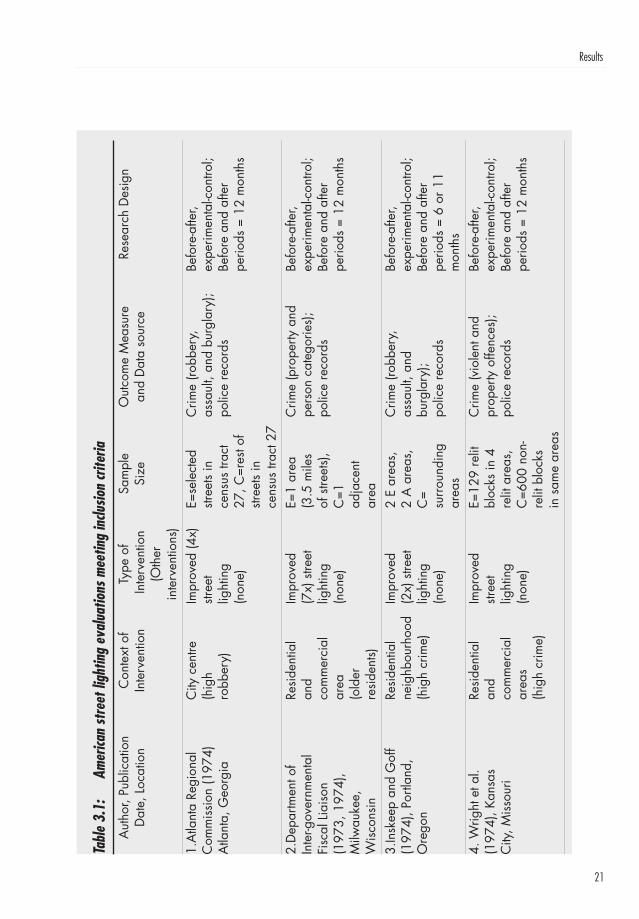
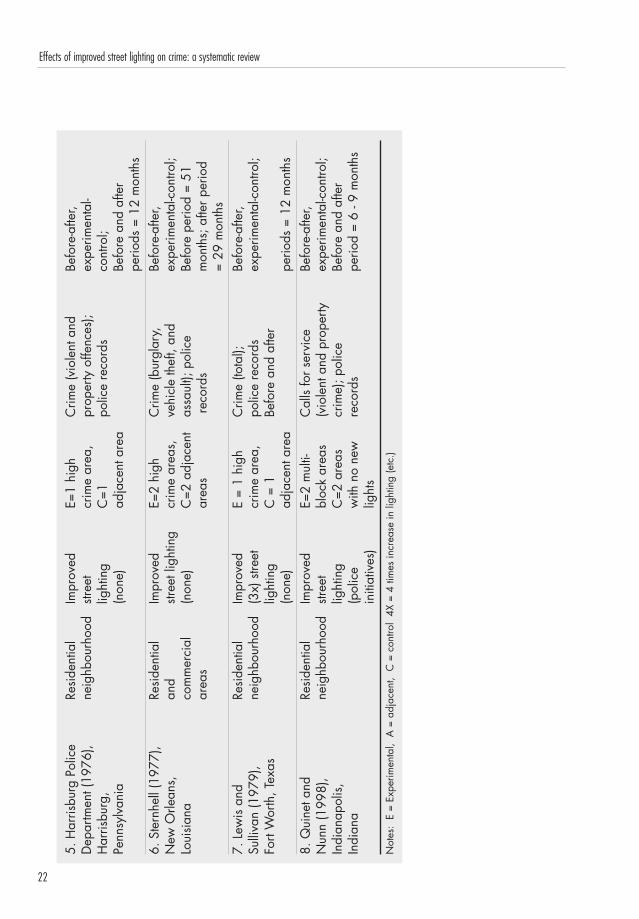
Tables 3.1 and 3.2 summarise key features of the eight American lighting evaluations thatwere included in the review, while Tables 3.4 and 3.5 summarise key features of five Britishlighting evaluations that were included. The programmes are listed in chronological order,according to the date of publication. Tables 3.1 and 3.4 list the following features:
● Author, publication date and location: The authors and dates of the most relevantevaluation reports are listed here, along with the location of the programme.
● Context of intervention: The physical setting in which the improved lightingintervention took place.
● Type of intervention and other interventions: The intervention is identified togetherwith the increase in lighting intensity (where known). Any other concurrentinterventions are noted.
● Sample size: The number and any special features of the experimental andcontrol areas are identified.
● Outcome measure and data source: As noted above, crime was the outcomemeasure of interest in this review. Here the specific crime types as well as thedata source of the outcome measure are identified.
● Research design: As noted above, the minimum research design for a programmeto be included in this review involves before and after measures in experimentaland comparable control areas. Information about non-comparable control areas(e.g. the remainder of the city) is not included. The lengths of the before and aftertime periods of the evaluation are also noted here.
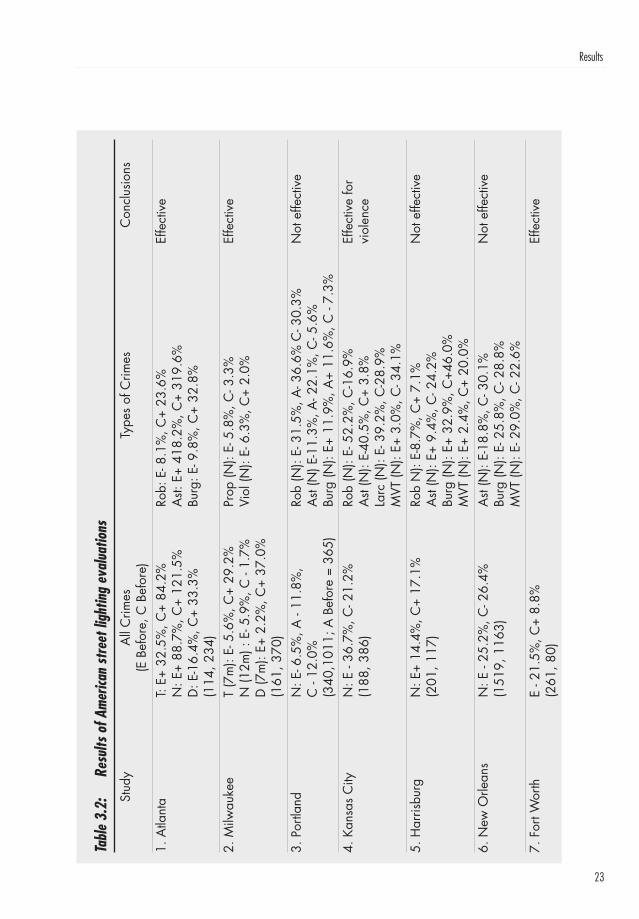
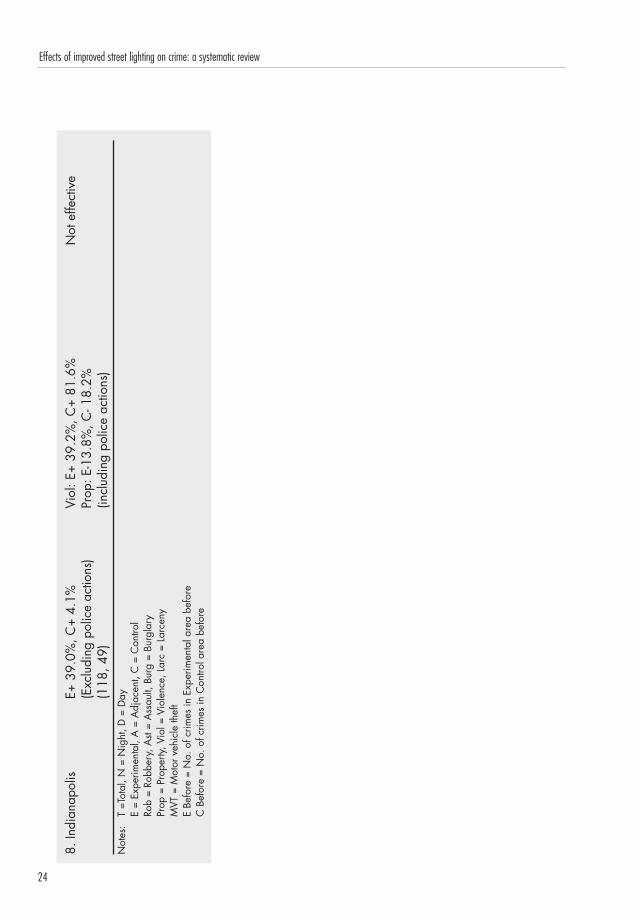
Tables 3.2 and 3.5 list the most important results. In summarising results, the focus was onthe most relevant crime outcomes for this review (i.e. property and violent crimes) and onbefore and after comparisons in experimental and control areas. Data were amalgamatedwhere possible and appropriate. For example, two experimental areas would be combined,
as would two control areas. As far as possible, the percentage change in crime after theimproved lighting compared with before was reported in Tables 3.2 and 3.5. The numbersof crimes in experimental and control areas in the pretest were also listed in light of therequirement that the minimum number of crimes before in each area should be 20. TheAmerican minimum was 49 (Indianapolis), while the British minimum was 43 (Dover).
Evaluations of improved lighting programmes differ on many different dimensions, and it isimpossible to include more than a few in summary tables. Two important issues that are notoften addressed adequately are displacement and diffusion of benefits. Displacement isoften defined as the unintended increase in crime following a crime reduction scheme; for adiscussion of “benign“ or desirable effects of displacement, see Barr and Pease (1990). Fivedifferent forms of displacement have been identified by Reppetto (1976): temporal (changein time), tactical (change in method), target (change in victim), territorial (change in place),and functional (change in type of crime). Diffusion of benefits is defined as the unintendeddecrease in crime following a crime reduction scheme, or the “complete reverse“ ofdisplacement (Clarke and Weisburd, 1994).
In order to investigate territorial displacement and diffusion of benefits, the minimum designinvolves one experimental area, one adjacent area, and one non-adjacent control area. Ifcrime decreased in the experimental area, increased in the adjacent area, and stayedconstant in the control area, this might be evidence of displacement. If crime decreased inthe experimental and adjacent areas and stayed constant or increased in the control area,this might be evidence of diffusion of benefits. Few studies in the tables included bothadjacent and non-adjacent but comparable control areas. More had an adjacent controlarea and the remainder of the city as another control area. Results obtained in theremainder of the city were not included in the tables because the remainder of the city wasnot comparable to the experimental area.
In many cases, the experimental area was chosen for relighting because it was a high crimearea. This raises the problem of “regression to the mean“; an area which is high at one timeis likely to decrease at a later time. In order to investigate this, longtime-series of crimesbefore and after the intervention in experimental and control areas are needed.
Results of American studies
20
Effects of improved street lighting on crime: a systematic review
21
Results
Tabl
e 3.
1:Am
erica
n st
reet
ligh
ting
eval
uatio
ns m
eetin
g in
clusio
n cr
iteria
Aut
hor,
Publ
icat
ion
Con
text
of
Type
of
Sam
ple
Out
com
e M
easu
reRe
sear
ch D
esig
nD
ate,
Loc
atio
nIn
terv
entio
nIn
terv
entio
nSi
zean
d D
ata
sour
ce(O
ther
in
terv
entio
ns)
1.A
tlant
a Re
gion
al
City
cen
treIm
prov
ed (4
x)E=
sele
cted
Crim
e (ro
bber
y,Be
fore
-afte
r,C
omm
issi
on (1
974)
(hig
hstr
eet
stree
ts in
assa
ult,
and
burg
lary
);ex
perim
enta
l-con
trol;
Atla
nta,
Geo
rgia
robb
ery)
light
ing
cens
us tr
act
polic
e re
cord
sBe
fore
and
afte
r(n
one)
27
, C=r
est o
f pe
riods
= 1
2 m
onth
sstr
eets
in
cens
us tr
act 2
72.
Dep
artm
ent o
f Re
side
ntia
lIm
prov
edE=
1 ar
eaC
rime
(pro
perty
and
Befo
re-a
fter,
Inte
r-gov
ernm
enta
l an
d(7
x) s
treet
(3
.5 m
iles
pers
on c
ateg
orie
s);
expe
rimen
tal-c
ontro
l;Fi
scal
Lia
ison
co
mm
erci
allig
htin
gof
stre
ets)
,po
lice
reco
rds
Befo
re a
nd a
fter
(197
3, 1
974)
, ar
ea(n
one)
C=1
perio
ds =
12
mon
ths
Milw
auke
e,
(old
er
adja
cent
Wis
cons
inre
side
nts)
area
3.In
skee
p an
d G
off
Resi
dent
ial
Impr
oved
2 E
area
s,C
rime
(robb
ery,
Befo
re-a
fter,
(197
4), P
ortla
nd,
neig
hbou
rhoo
d(2
x) s
treet
2 A
are
as,
assa
ult,
and
expe
rimen
tal-c
ontro
l;O
rego
n(h
igh
crim
e)lig
htin
g C
=bu
rgla
ry);
Befo
re a
nd a
fter
(non
e)su
rrou
ndin
g po
lice
reco
rds
perio
ds =
6 o
r 11
area
sm
onth
s4.
Wrig
ht e
t al.
Resi
dent
ial
Impr
oved
E=12
9 re
litC
rime
(vio
lent
and
Befo
re-a
fter,
(197
4), K
ansa
s an
dstr
eet
bloc
ks in
4pr
oper
ty o
ffenc
es);
expe
rimen
tal-c
ontro
l;C
ity, M
isso
uri
com
mer
cial
lig
htin
gre
lit a
reas
,po
lice
reco
rds
Befo
re a
nd a
fter
area
s (n
one)
C=6
00 n
on-
perio
ds =
12
mon
ths
(hig
h cr
ime)
relit
blo
cks
in s
ame
area
s
22
Effects of improved street lighting on crime: a systematic review5.
Har
risbu
rg P
olic
eRe
side
ntia
lIm
prov
edE=
1 hi
ghC
rime
(vio
lent
and
Befo
re-a
fter,
Dep
artm
ent (
1976
),ne
ighb
ourh
ood
stree
tcr
ime
area
,pr
oper
ty o
ffenc
es);
expe
rimen
tal-
Har
risbu
rg,
light
ing
C=1
polic
e re
cord
sco
ntro
l;Pe
nnsy
lvan
ia(n
one)
adja
cent
are
aBe
fore
and
afte
rpe
riods
= 1
2 m
onth
s6.
Ste
rnhe
ll (1
977)
,Re
side
ntia
lIm
prov
edE=
2 hi
ghC
rime
(bur
glar
y,Be
fore
-afte
r,N
ew O
rlean
s,
and
stree
t lig
htin
gcr
ime
area
s,ve
hicl
e th
eft,
and
expe
rimen
tal-c
ontro
l;Lo
uisi
ana
com
mer
cial
(non
e)C
=2 a
djac
ent
assa
ult);
pol
ice
Befo
re p
erio
d =
51ar
eas
area
s re
cord
sm
onth
s; a
fter p
erio
d=
29 m
onth
s7.
Lew
is a
nd
Resi
dent
ial
Impr
oved
E =
1 hi
ghC
rime
(tota
l);Be
fore
-afte
r,Su
lliva
n (1
979)
, ne
ighb
ourh
ood
(3x)
stre
etcr
ime
area
,po
lice
reco
rds
expe
rimen
tal-c
ontro
l;Fo
rt W
orth
, Tex
aslig
htin
gC
= 1
Befo
re a
nd a
fter
(non
e)ad
jace
nt a
rea
perio
ds =
12
mon
ths
8. Q
uine
t and
Re
side
ntia
lIm
prov
edE=
2 m
ulti-
Cal
ls fo
r ser
vice
Befo
re-a
fter,
Nun
n (1
998)
, ne
ighb
ourh
ood
stree
tbl
ock
area
s(v
iole
nt a
nd p
rope
rtyex
perim
enta
l-con
trol;
Indi
anap
olis
, lig
htin
gC
=2 a
reas
crim
e); p
olic
eBe
fore
and
afte
rIn
dian
a(p
olic
e w
ith n
o ne
wre
cord
spe
riod
= 6
- 9 m
onth
sin
itiat
ives
)lig
hts
Not
es:
E =
Expe
rimen
tal,
A =
adj
acen
t, C
= c
ontro
l 4X
= 4
tim
es in
crea
se in
ligh
ting
(etc
.)
23
Results
Tabl
e 3.
2:Re
sults
of A
mer
ican
stre
et li
ghtin
g ev
alua
tions
Stud
yA
ll C
rimes
Type
s of
Crim
esC
oncl
usio
ns(E
Bef
ore,
C B
efor
e)1.
Atla
nta
T: E
+ 32
.5%
, C+
84.2
%Ro
b: E
- 8.1
%, C
+ 23
.6%
Effe
ctiv
eN
: E+
88.7
%, C
+ 12
1.5%
Ast:
E+
418.
2%, C
+ 31
9.6%
D: E
-16.
4%, C
+ 33
.3%
Burg
: E- 9
.8%
, C+
32.8
%(1
14, 2
34)
2. M
ilwau
kee
T (7
m):
E- 5
.6%
, C+
29.2
%
Prop
(N):
E- 5
.8%
, C- 3
.3%
Effe
ctiv
eN
(12m
) : E
- 5.9
%, C
- 1.
7%Vi
ol (N
): E-
6.3
%, C
+ 2.
0%D
(7m
): E+
2.2
%, C
+ 37
.0%
(161
, 370
)3.
Por
tland
N
: E- 6
.5%
, A -
11.8
%,
Rob
(N):
E- 3
1.5%
, A- 3
6.6%
C- 3
0.3%
Not
effe
ctiv
eC
- 12
.0%
Ast
(N) E
-11.
3%, A
- 22.
1%, C
- 5.6
%(3
40,1
011;
A B
efor
e =
365)
Burg
(N):
E+ 1
1.9%
, A+
11.6
%, C
- 7.
3%4.
Kan
sas
City
N: E
- 36
.7%
, C- 2
1.2%
Rob
(N):
E- 5
2.2%
, C-1
6.9%
Effe
ctiv
e fo
r(1
88, 3
86)
Ast
(N):
E-40
.5%
, C+
3.8%
viol
ence
Larc
(N):
E- 3
9.2%
, C-2
8.9%
MVT
(N):
E+ 3
.0%
, C- 3
4.1%
5. H
arris
burg
N: E
+ 14
.4%
, C+
17.1
%Ro
b N
): E-
8.7%
, C+
7.1%
Not
effe
ctiv
e(2
01, 1
17)
Ast
(N):
E+ 9
.4%
, C- 2
4.2%
Burg
(N):
E+ 3
2.9%
, C+4
6.0%
MVT
(N):
E+ 2
.4%
, C+
20.0
%6.
New
Orle
ans
N: E
- 25
.2%
, C- 2
6.4%
Ast
(N):
E-18
.8%
, C- 3
0.1%
Not
effe
ctiv
e(1
519,
116
3)Bu
rg (N
): E-
25.
8%, C
- 28.
8%M
VT (N
): E-
29.
0%, C
- 22.
6%7.
For
t Wor
thE
- 21.
5%, C
+ 8.
8%Ef
fect
ive
(261
, 80)
24
Effects of improved street lighting on crime: a systematic review8.
Indi
anap
olis
E+ 3
9.0%
, C+
4.1%
Viol
: E+
39.2
%, C
+ 81
.6%
Not
effe
ctiv
e(E
xclu
ding
pol
ice
actio
ns)
Prop
: E-1
3.8%
, C- 1
8.2%
(118
, 49)
(incl
udin
g po
lice
actio
ns)
Not
es:
T =T
otal
, N =
Nig
ht, D
= D
ayE
= Ex
perim
enta
l, A
= A
djac
ent,
C =
Con
trol
Rob
= Ro
bber
y, A
st =
Ass
ault,
Bur
g =
Burg
lary
Prop
= P
rope
rty, V
iol =
Vio
lenc
e, L
arc
= La
rcen
yM
VT =
Mot
or v
ehic
le th
eft
E Be
fore
= N
o. o
f crim
es in
Exp
erim
enta
l are
a be
fore
C B
efor
e =
No.
of c
rimes
in C
ontro
l are
a be
fore
Tables 3.1 and 3.2 summarise key features of the eight American studies that were consideredto meet our minimum methodological standards. Only the last two studies (Fort Worth andIndianapolis) were published, but their methodological quality was not higher than that of thefirst six studies. Only the most relevant comparisons are shown in the tables. For example, theIndianapolis study included a second experimental area and a second control area, but callsfor service to the police were very low in these areas (e.g. only 10 in the experimental area inthe before time period), so they are not included in the tables. Also in this study, there weresome police initiatives (involving increased police presence) that generated calls for service.Where possible, the dates of these were excluded from the analysis.
In general, the experimental area was chosen for relighting because it had a high crimerate or was otherwise problematic. Only four of the eight evaluations specified the degreeof improvement in the lighting: by seven times in Milwaukee, four times in Atlanta, threetimes in Fort Worth, and two times in Portland. However, the description of the lighting inother cases (e.g. “high intensity street lighting“ in Harrisburg and New Orleans) suggeststhat there was a marked improvement in the degree of illumination. Only in Indianapoliswas the improved street lighting confounded with another concurrent intervention (asexplained above), and it was sometimes possible to disentangle this.
The control area was often adjacent to the experimental area. Hence, similar decreases incrime in experimental and control areas could reflect diffusion of benefits rather than noeffects of lighting. In most cases, the reports noted that the control area was similar to theexperimental area in socio-demographic factors or crime rates. However, none of theevaluations attempted to control for any prior non-comparability of experimental and controlareas. Only one evaluation (Portland) included an adjacent area and a comparable non-adjacent control area, but it found no effect of improved lighting.
The outcome measure of crime was always based on police records before and after theimproved street lighting. All evaluations except Fort Worth also provided comparable beforeand after data on types of crimes. The Indianapolis evaluation was based on calls forservice to the police, many of which did not clearly involve crimes (e.g. calls for“disturbance“). Only the Atlanta and Milwaukee studies provided total, night-time and day-time crimes. The Portland, Kansas City, Harrisburg and New Orleans studies measured onlynight-time crimes and the Fort Worth and Indianapolis studies reported only total crimes.
The before and after time periods were sometimes different for different comparisons. InMilwaukee, for example, night-time data were provided for 12 months before and after, butday-time and total data were provided only for seven months before and after. The New
25
Results
Orleans evaluation had different time periods before (51 months) and after (29 months) butreported average monthly crime rates. Similarly, the Indianapolis evaluation reportedaverage weekly calls for service.
Table 3.2 summarises the key results. In four evaluations the improved street lighting wasconsidered to be effective in reducing crime (Atlanta, Milwaukee, Fort Worth and – forviolence – Kansas City). In the other four evaluations, the improved street lighting wasconsidered to be ineffective (Portland, Harrisburg, New Orleans and Indianapolis).
Improved street lighting was most clearly effective in reducing crime in the Fort Worthevaluation. Crimes decreased by 21.5 per cent in the experimental area and increased by8.8 per cent in the control area (Lewis and Sullivan, 1979, p.75). Since crime in the wholecity stayed constant (a decrease of 1.1%), it might be argued that some crime had beendisplaced from the experimental to the adjacent control area. In the experimental area,property crimes decreased but violent crimes did not. Information about types of crime wasnot provided for the control area, and information was not provided about night-time asopposed to day-time crime.
Improved street lighting was followed by a decrease in robberies and burglaries in Atlanta,whereas the incidence of these crimes increased in the control area (Atlanta RegionalCommission, 1974, pp. 11-12). There was an increase in assaults in the experimental area, butthe numbers were relatively small (from 11 to 57). Overall, day-time crime decreased by 16.4per cent in the experimental area after the improved lighting, in comparison with an increase of33.3 per cent in the control area. Night-time crime increased considerably in both areas.
In Milwaukee, information about total crimes was only available for seven months beforeand after the improved lighting. Impressively, crimes decreased by 5.6 per cent in theexperimental area and increased by 29.2 per cent in the control area (Department ofIntergovernmental Fiscal Liaison, 1973, p. 6). Similar results were obtained for night-timecrimes (15.3% decrease in experimental area, 20.0% increase in control area). There wasalso a big effect on day-time crimes (2.2% increase in experimental area, 37.0% increasein control area). However, the effects were much less in a later report (Department ofIntergovernmental Fiscal Liaison, 1974, p. 3) covering 12 months before and after for night-time crimes only (5.9% decrease in experimental area, 1.7% decrease in control area).
In Kansas City, improved street lighting was effective in reducing night-time violent crimes(robbery and assault) but not night-time property crimes (larceny and motor vehicle theft).Violent crimes decreased by 51.9 per cent in the experimental area, compared with 7.2 per
26
Effects of improved street lighting on crime: a systematic review
cent in the control area (Wright et al., 1974, p. 49). However, property crimes decreasedmore in the control area (32.0%) than in the experimental area (22.6%). These results werestatistically significant for violent crimes but not for property crimes.
In Indianapolis, the results were difficult to interpret. When the dates of special policeinitiatives were excluded, crimes increased more in the experimental area than in the controlarea (Quinet and Nunn, 1998, pp. 759 and 763; their experimental areas A and C areincluded in this report’s analyses). However, the data on types of crimes, which did notexclude these dates, showed that violent crimes increased more in the control area (Quinetand Nunn, 1998, pp. 769 and 773). The data on types of crimes are more interestingbecause unlike total calls for service they clearly refer to crimes. However, they are severelylimited by small numbers.
In Portland, there was little evidence that improved street lighting had led to any reduction innight-time crime. The analysis of this project was complicated by the fact that one set ofexperimental, adjacent and control areas was followed up for 11 months before and after,while another set was followed up for six months before and after (Inskeep and Goff, 1974,p. 10). The figures are combined in Table 3.2. In general, changes in crime in theexperimental areas were similar to and not more desirable than changes in crime in theadjacent and control areas. Therefore, there was no evidence in favour of either a crime-reducing effect of improved lighting or a diffusion of benefits to adjacent areas.
Finally, in Harrisburg night-time crimes increased similarly in experimental and control areas(Harrisburg Police Department, 1976, Tables 1 and 2); and in New Orleans night-timecrimes decreased similarly in experimental and control areas (Sternhell, 1977, pp. 13-15).
Why was improved street lighting effective in reducing crime in some studies but not inothers? There was no clear tendency for some types of crime (e.g. violence) to decreasemore than others. One clear difference was that both day-time and night-time crimes weremeasured in the “effective“ evaluations (Atlanta, Milwaukee and Fort Worth), whereas onlynight-time crimes were measured in the “ineffective“ evaluations (Portland, Harrisburg andNew Orleans). However, both day-time and night-time crimes were measured in theIndianapolis evaluation. “Night-time“ was not defined in Portland or New Orleans; inHarrisburg, it was defined as the hours between 8.00 p.m. and 4.00 a.m., so this wouldexclude some crimes committed during the hours of darkness.
27
Results
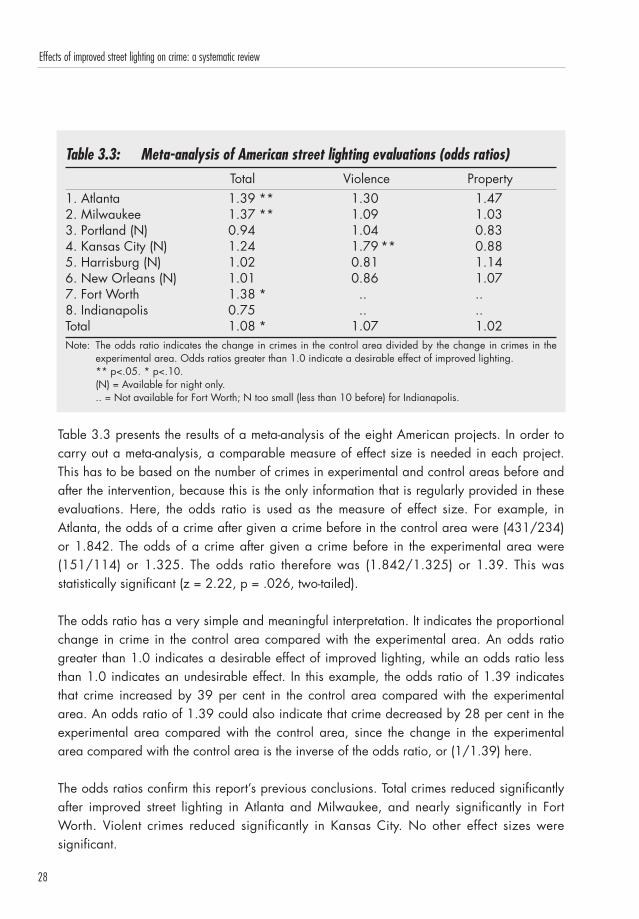
Table 3.3: Meta-analysis of American street lighting evaluations (odds ratios)Total Violence Property
1. Atlanta 1.39 ** 1.30 1.472. Milwaukee 1.37 ** 1.09 1.033. Portland (N) 0.94 1.04 0.834. Kansas City (N) 1.24 1.79 ** 0.885. Harrisburg (N) 1.02 0.81 1.146. New Orleans (N) 1.01 0.86 1.077. Fort Worth 1.38 * .. ..8. Indianapolis 0.75 .. ..Total 1.08 * 1.07 1.02Note: The odds ratio indicates the change in crimes in the control area divided by the change in crimes in the
experimental area. Odds ratios greater than 1.0 indicate a desirable effect of improved lighting.** p<.05. * p<.10.(N) = Available for night only... = Not available for Fort Worth; N too small (less than 10 before) for Indianapolis.
Table 3.3 presents the results of a meta-analysis of the eight American projects. In order tocarry out a meta-analysis, a comparable measure of effect size is needed in each project.This has to be based on the number of crimes in experimental and control areas before andafter the intervention, because this is the only information that is regularly provided in theseevaluations. Here, the odds ratio is used as the measure of effect size. For example, inAtlanta, the odds of a crime after given a crime before in the control area were (431/234)or 1.842. The odds of a crime after given a crime before in the experimental area were(151/114) or 1.325. The odds ratio therefore was (1.842/1.325) or 1.39. This wasstatistically significant (z = 2.22, p = .026, two-tailed).
The odds ratio has a very simple and meaningful interpretation. It indicates the proportionalchange in crime in the control area compared with the experimental area. An odds ratiogreater than 1.0 indicates a desirable effect of improved lighting, while an odds ratio lessthan 1.0 indicates an undesirable effect. In this example, the odds ratio of 1.39 indicatesthat crime increased by 39 per cent in the control area compared with the experimentalarea. An odds ratio of 1.39 could also indicate that crime decreased by 28 per cent in theexperimental area compared with the control area, since the change in the experimentalarea compared with the control area is the inverse of the odds ratio, or (1/1.39) here.
The odds ratios confirm this report’s previous conclusions. Total crimes reduced significantlyafter improved street lighting in Atlanta and Milwaukee, and nearly significantly in FortWorth. Violent crimes reduced significantly in Kansas City. No other effect sizes weresignificant.
28
Effects of improved street lighting on crime: a systematic review
Perhaps the most interesting and unexpected result occurred when the odds ratios from theeight studies were combined using the methods recommended by Lipsey and Wilson (2001, p.130). These require that each effect size has a known standard error, which is true for theodds ratio. (This was one reason for choosing to use the odds ratio.) The average effect size(weighted according to the standard error of each study) was an odds ratio of 1.08, but thiswas nearly significant (z = 1.85, p = .064). Thus, pooling the data from these eight studies,there was some evidence that improved street lighting led to a reduction in crime. Overall,crime increased by 8 per cent in control areas compared with experimental areas, orconversely crime decreased by 7 per cent in experimental areas compared with control areas.
The 8 effect sizes were significantly variable (Q = 14.81, 7 d.f., p = .039). This means thatthey were not randomly distributed around the average effect size. The key dimension onwhich they differed seemed to be whether they were based on data for both night and day(Atlanta, Milwaukee, Fort Worth and Indianapolis) or for night only (the other four studies).For the four night/day studies, the average effect size was an odds ratio of 1.28 (z = 3.05,p = .002), meaning that crime increased by 28 per cent in control areas compared withexperimental areas (Q = 6.02, 3 d.f., n.s., so no evidence of heterogeneity of these fourstudies). For the four night only studies, odds ratio = 1.02 (n.s.), indicating a negligibleeffect on crime, and Q = 2.81 (3 d.f., n.s.), again indicating homogeneity. Therefore, theeight American studies could be divided into two blocks of four, one block showing thatcrime reduced after improved street lighting and the other block showing that it did not.Surprisingly, evidence of a reduction in crime was only obtained when both day-time andnight-time crimes were measured, although this feature may be a proxy for some otherfeature of the different evaluation studies.
Unfortunately, all the American evaluations (except the Indianapolis one) are now ratherdated, since they were all carried out in the 1970s. More recent American evaluations ofthe effect of improved street lighting need to be conducted. The British evaluations, on theother hand were all published in the 1990s.
Results of British studies
29
Results
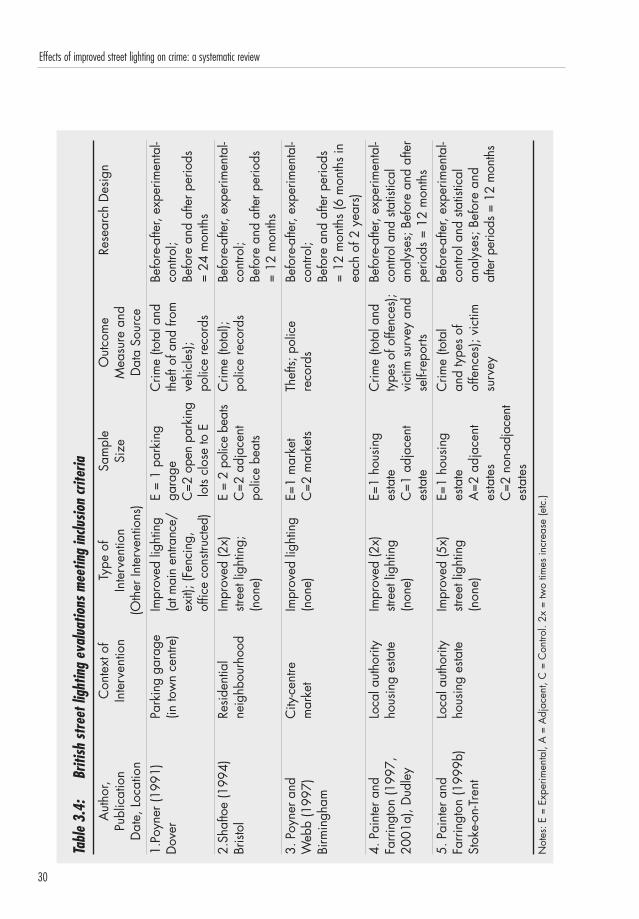
30
Effects of improved street lighting on crime: a systematic review
Tabl
e 3.
4:Br
itish
stre
et li
ghtin
g ev
alua
tions
mee
ting
inclu
sion
crite
riaA
utho
r, C
onte
xt o
fTy
pe o
fSa
mpl
eO
utco
me
Rese
arch
Des
ign
Publ
icat
ion
Inte
rven
tion
Inte
rven
tion
Size
Mea
sure
and
Dat
e, L
ocat
ion
(Oth
er In
terv
entio
ns)
Dat
a So
urce
1.Po
yner
(199
1)
Park
ing
gara
geIm
prov
ed li
ghtin
gE
= 1
park
ing
Crim
e (to
tal a
ndBe
fore
-afte
r, ex
perim
enta
l-D
over
(in to
wn
cent
re)
(at m
ain
entra
nce/
gara
geth
eft o
f and
from
cont
rol;
exit)
; (Fe
ncin
g,
C=2
ope
n pa
rkin
gve
hicl
es);
Befo
re a
nd a
fter p
erio
ds
offic
e co
nstru
cted
)lo
ts cl
ose
to E
polic
e re
cord
s=
24 m
onth
s2.
Shaf
toe
(199
4)
Resid
entia
lIm
prov
ed (2
x)E
= 2
polic
e be
ats
Crim
e (to
tal);
Be
fore
-afte
r, ex
perim
enta
l-Br
istol
neig
hbou
rhoo
dstr
eet l
ight
ing;
C=2
adj
acen
tpo
lice
reco
rds
cont
rol;
(non
e)po
lice
beat
sBe
fore
and
afte
r per
iods
=
12 m
onth
s3.
Poy
ner a
nd
City
-cen
treIm
prov
ed li
ghtin
gE=
1 m
arke
tTh
efts;
pol
ice
Befo
re-a
fter,
expe
rimen
tal-
Web
b (1
997)
mar
ket
(non
e)C
=2 m
arke
tsre
cord
sco
ntro
l;Bi
rmin
gham
Befo
re a
nd a
fter p
erio
ds
= 12
mon
ths
(6 m
onth
s in
each
of 2
yea
rs)
4. P
aint
er a
nd
Loca
l aut
horit
yIm
prov
ed (2
x)E=
1 ho
usin
gC
rime
(tota
l and
Befo
re-a
fter,
expe
rimen
tal-
Farr
ingt
on (1
997,
ho
usin
g es
tate
stree
t lig
htin
ges
tate
type
s of
offe
nces
);co
ntro
l and
sta
tistic
al
2001
a), D
udle
y(n
one)
C=1
adj
acen
tvi
ctim
sur
vey
and
anal
yses
; Bef
ore
and
afte
res
tate
self-
repo
rts
perio
ds =
12
mon
ths
5. P
aint
er a
ndLo
cal a
utho
rity
Impr
oved
(5x)
E=1
hous
ing
Crim
e (to
tal
Befo
re-a
fter,
expe
rimen
tal-
Farr
ingt
on (1
999b
)ho
usin
g es
tate
stree
t lig
htin
ges
tate
and
type
s of
co
ntro
l and
sta
tistic
al
Stok
e-on
-Tren
t(n
one)
A=2
adj
acen
tof
fenc
es);
vict
iman
alys
es; B
efor
e an
d es
tate
ssu
rvey
afte
r per
iods
= 1
2 m
onth
sC
=2 n
on-a
djac
ent
esta
tes
Not
es: E
= E
xper
imen
tal,
A =
Adj
acen
t, C
= C
ontro
l. 2x
= tw
o tim
es in
crea
se (e
tc.)
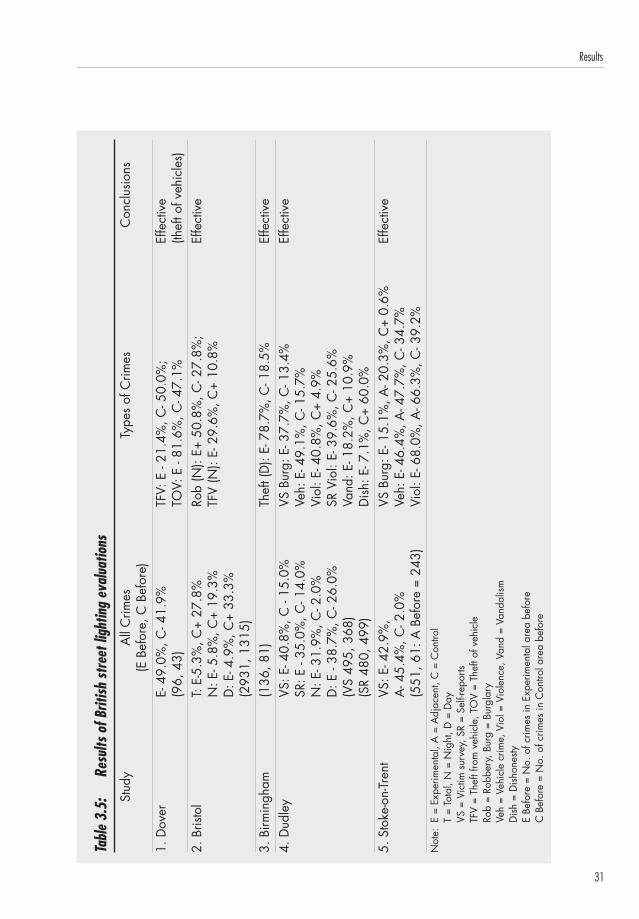
31
Results
Tabl
e 3.
5:Re
sults
of B
ritish
stre
et li
ghtin
g ev
alua
tions
Stud
yA
ll C
rimes
Type
s of
Crim
esC
oncl
usio
ns(E
Bef
ore,
C B
efor
e)1.
Dov
erE-
49.
0%, C
- 41.
9%TF
V: E
- 21
.4%
, C- 5
0.0%
;Ef
fect
ive
(96,
43)
TOV:
E -
81.6
%, C
- 47.
1%(th
eft o
f veh
icle
s)2.
Bris
tol
T: E
-5.3
%, C
+ 27
.8%
Rob
(N):
E+ 5
0.8%
, C- 2
7.8%
;Ef
fect
ive
N: E
- 5.8
%, C
+ 19
.3%
TFV
(N):
E- 2
9.6%
, C+
10.8
%D
: E- 4
.9%
, C+
33.3
%(2
931,
131
5)3.
Birm
ingh
am(1
36, 8
1)Th
eft (
D):
E- 7
8.7%
, C- 1
8.5%
Effe
ctiv
e4.
Dud
ley
VS: E
- 40.
8%, C
- 15
.0%
VS B
urg:
E- 3
7.7%
, C- 1
3.4%
Effe
ctiv
eSR
: E -
35.0
%, C
- 14.
0%Ve
h: E
- 49.
1%, C
- 15.
7%N
: E- 3
1.9%
, C- 2
.0%
Viol
: E- 4
0.8%
, C+
4.9%
D: E
- 38
.7%
, C- 2
6.0%
SR V
iol:
E- 3
9.6%
, C- 2
5.6%
(VS
495,
368
)Va
nd: E
- 18.
2%, C
+ 10
.9%
(SR
480,
499
)D
ish:
E- 7
.1%
, C+
60.0
%5.
Sto
ke-o
n-Tr
ent
VS: E
- 42.
9%,
VS B
urg:
E- 1
5.1%
, A- 2
0.3%
, C+
0.6%
Effe
ctiv
eA
- 45.
4%, C
- 2.0
%Ve
h: E
- 46.
4%, A
- 47.
7%, C
- 34.
7%(5
51, 6
1: A
Bef
ore
= 24
3)Vi
ol: E
- 68.
0%, A
- 66.
3%, C
- 39.
2%N
ote:
E =
Expe
rimen
tal,
A =
Adj
acen
t, C
= C
ontro
lT
= To
tal,
N =
Nig
ht, D
= D
ayVS
= V
ictim
sur
vey,
SR
= Se
lf-re
ports
TFV
= Th
eft f
rom
veh
icle
, TO
V =
Thef
t of v
ehic
le
Rob
= Ro
bber
y, B
urg
= Bu
rgla
ryVe
h =
Vehi
cle
crim
e, V
iol =
Vio
lenc
e, V
and
= Va
ndal
ism
Dis
h =
Dis
hone
styE
Befo
re =
No.
of c
rimes
in E
xper
imen
tal a
rea
befo
reC
Bef
ore
= N
o. o
f crim
es in
Con
trol a
rea
befo
re
Tables 3.4 and 3.5 summarise key features of the five British studies that were considered tomeet the minimum methodological standards. All were published. The improved lightinginterventions occurred in a variety of settings, including a parking garage and a market aswell as residential neighbourhoods. Three of the evaluations specified the degree ofimprovement in lighting: by five times in Stoke and by two times in Bristol (approximately)and Dudley. Control areas were usually located close to experimental areas.
The outcome measure of crime was based on police records for three studies and on victimsurveys in the other two cases (in Dudley and Stoke). Uniquely, the Dudley project alsoevaluated the impact of improved street lighting using self-reported delinquency surveys ofyoung people. This project also included self-reports of victimisation of young people andmeasures of fear of crime (Painter and Farrington, 2001a). Table 3.5 shows that improvedlighting was considered to be effective in reducing crime in four studies (Bristol,Birmingham, Dudley and Stoke).
In the fifth (Dover) study, the improved lighting was confounded with other improvements,including fencing to restrict access to the parking garage and the construction of an officenear the main entrance. On the basis of police records, Poyner (1991) concluded that theintervention had reduced thefts of vehicles but not thefts from vehicles. It was alsoconsidered that the crime prevention measures were successful because the reduced costs ofdamage and graffiti paid for the improvements within one year.
It was difficult to interpret the Bristol evaluation because the street lighting was graduallyimproved in different places over a period of 28 months. Information about crime was providedfor nine successive six-month periods overlapping this time period (Shaftoe, 1994, p. 75).Therefore, the first 12-month period before the improved lighting (January-December 1986) was compared with the last 12-month period after the improved lighting (July 1989-June 1990).Table 3.5 shows the results of this comparison. Total, night-time and day-time crime decreased inthe experimental area after the intervention and increased in the control area. Therefore,notwithstanding the contrary result for robbery (which was affected by small numbers in thecontrol area), it was concluded that improved street lighting was effective in reducing crime.
In the Birmingham study of city-centre markets, there were interventions in one of the controlmarkets that could have led to reductions in crime. Nevertheless, the reduction in thefts fromthe person in the experimental market after the improved lighting was far greater than in thecontrol markets. The experimental market was large and covered, and its lighting wasmarkedly improved. Poyner and Webb (1997, p. 89) concluded that “increased levels ofillumination appear to have deterred would-be thieves“.
32
Effects of improved street lighting on crime: a systematic review
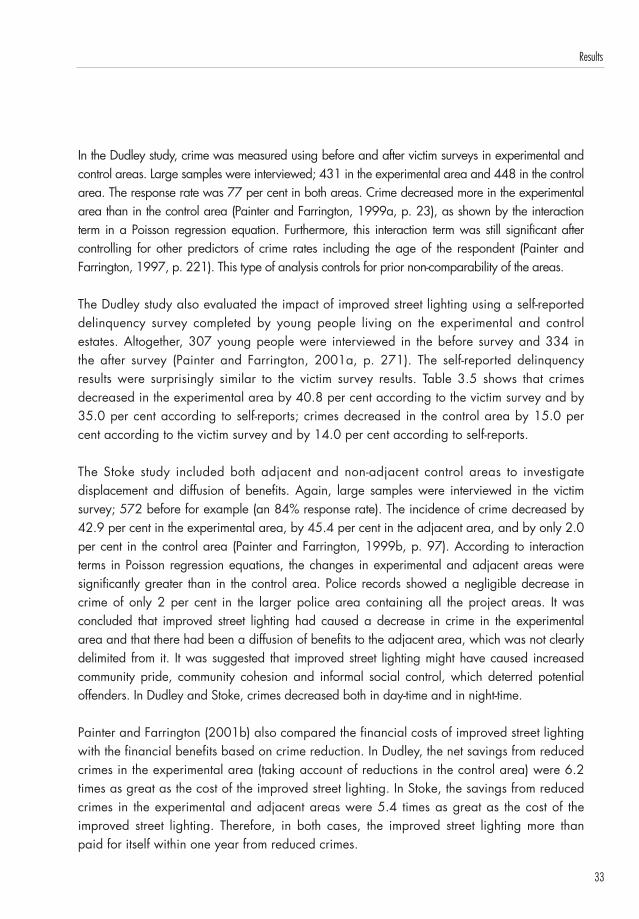
In the Dudley study, crime was measured using before and after victim surveys in experimental andcontrol areas. Large samples were interviewed; 431 in the experimental area and 448 in the controlarea. The response rate was 77 per cent in both areas. Crime decreased more in the experimentalarea than in the control area (Painter and Farrington, 1999a, p. 23), as shown by the interactionterm in a Poisson regression equation. Furthermore, this interaction term was still significant aftercontrolling for other predictors of crime rates including the age of the respondent (Painter andFarrington, 1997, p. 221). This type of analysis controls for prior non-comparability of the areas.
The Dudley study also evaluated the impact of improved street lighting using a self-reporteddelinquency survey completed by young people living on the experimental and controlestates. Altogether, 307 young people were interviewed in the before survey and 334 inthe after survey (Painter and Farrington, 2001a, p. 271). The self-reported delinquencyresults were surprisingly similar to the victim survey results. Table 3.5 shows that crimesdecreased in the experimental area by 40.8 per cent according to the victim survey and by35.0 per cent according to self-reports; crimes decreased in the control area by 15.0 percent according to the victim survey and by 14.0 per cent according to self-reports.
The Stoke study included both adjacent and non-adjacent control areas to investigatedisplacement and diffusion of benefits. Again, large samples were interviewed in the victimsurvey; 572 before for example (an 84% response rate). The incidence of crime decreased by42.9 per cent in the experimental area, by 45.4 per cent in the adjacent area, and by only 2.0per cent in the control area (Painter and Farrington, 1999b, p. 97). According to interactionterms in Poisson regression equations, the changes in experimental and adjacent areas weresignificantly greater than in the control area. Police records showed a negligible decrease incrime of only 2 per cent in the larger police area containing all the project areas. It wasconcluded that improved street lighting had caused a decrease in crime in the experimentalarea and that there had been a diffusion of benefits to the adjacent area, which was not clearlydelimited from it. It was suggested that improved street lighting might have caused increasedcommunity pride, community cohesion and informal social control, which deterred potentialoffenders. In Dudley and Stoke, crimes decreased both in day-time and in night-time.
Painter and Farrington (2001b) also compared the financial costs of improved street lightingwith the financial benefits based on crime reduction. In Dudley, the net savings from reducedcrimes in the experimental area (taking account of reductions in the control area) were 6.2times as great as the cost of the improved street lighting. In Stoke, the savings from reducedcrimes in the experimental and adjacent areas were 5.4 times as great as the cost of theimproved street lighting. Therefore, in both cases, the improved street lighting more thanpaid for itself within one year from reduced crimes.
33
Results
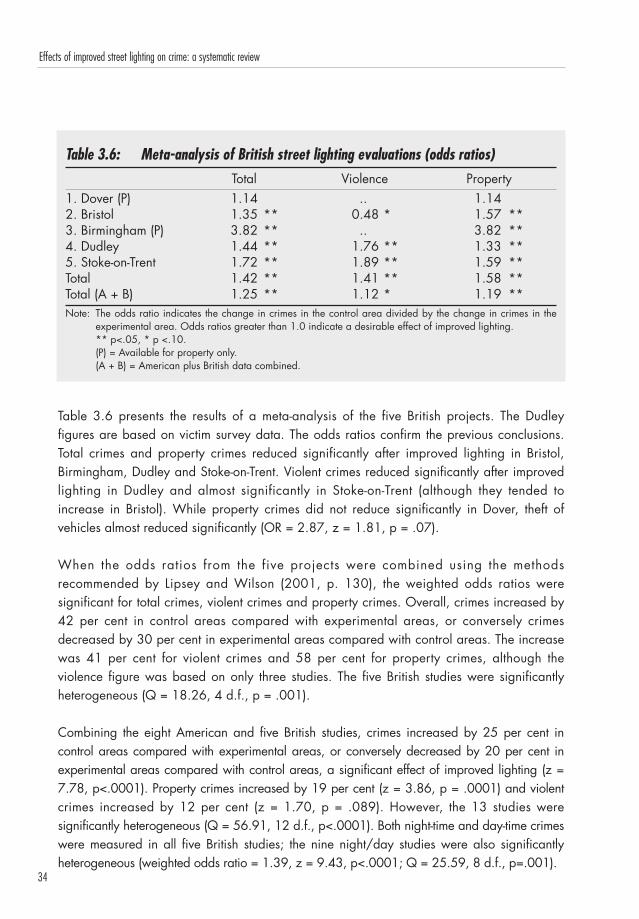
Table 3.6: Meta-analysis of British street lighting evaluations (odds ratios)Total Violence Property
1. Dover (P) 1.14 .. 1.142. Bristol 1.35 ** 0.48 * 1.57 **3. Birmingham (P) 3.82 ** .. 3.82 **4. Dudley 1.44 ** 1.76 ** 1.33 **5. Stoke-on-Trent 1.72 ** 1.89 ** 1.59 **Total 1.42 ** 1.41 ** 1.58 **Total (A + B) 1.25 ** 1.12 * 1.19 **Note: The odds ratio indicates the change in crimes in the control area divided by the change in crimes in the
experimental area. Odds ratios greater than 1.0 indicate a desirable effect of improved lighting.** p<.05, * p <.10.(P) = Available for property only.(A + B) = American plus British data combined.
Table 3.6 presents the results of a meta-analysis of the five British projects. The Dudleyfigures are based on victim survey data. The odds ratios confirm the previous conclusions.Total crimes and property crimes reduced significantly after improved lighting in Bristol,Birmingham, Dudley and Stoke-on-Trent. Violent crimes reduced significantly after improvedlighting in Dudley and almost significantly in Stoke-on-Trent (although they tended toincrease in Bristol). While property crimes did not reduce significantly in Dover, theft ofvehicles almost reduced significantly (OR = 2.87, z = 1.81, p = .07).
When the odds ratios from the five projects were combined using the methodsrecommended by Lipsey and Wilson (2001, p. 130), the weighted odds ratios weresignificant for total crimes, violent crimes and property crimes. Overall, crimes increased by42 per cent in control areas compared with experimental areas, or conversely crimesdecreased by 30 per cent in experimental areas compared with control areas. The increasewas 41 per cent for violent crimes and 58 per cent for property crimes, although theviolence figure was based on only three studies. The five British studies were significantlyheterogeneous (Q = 18.26, 4 d.f., p = .001).
Combining the eight American and five British studies, crimes increased by 25 per cent incontrol areas compared with experimental areas, or conversely decreased by 20 per cent inexperimental areas compared with control areas, a significant effect of improved lighting (z =7.78, p<.0001). Property crimes increased by 19 per cent (z = 3.86, p = .0001) and violentcrimes increased by 12 per cent (z = 1.70, p = .089). However, the 13 studies weresignificantly heterogeneous (Q = 56.91, 12 d.f., p<.0001). Both night-time and day-time crimeswere measured in all five British studies; the nine night/day studies were also significantlyheterogeneous (weighted odds ratio = 1.39, z = 9.43, p<.0001; Q = 25.59, 8 d.f., p=.001).
34
Effects of improved street lighting on crime: a systematic review
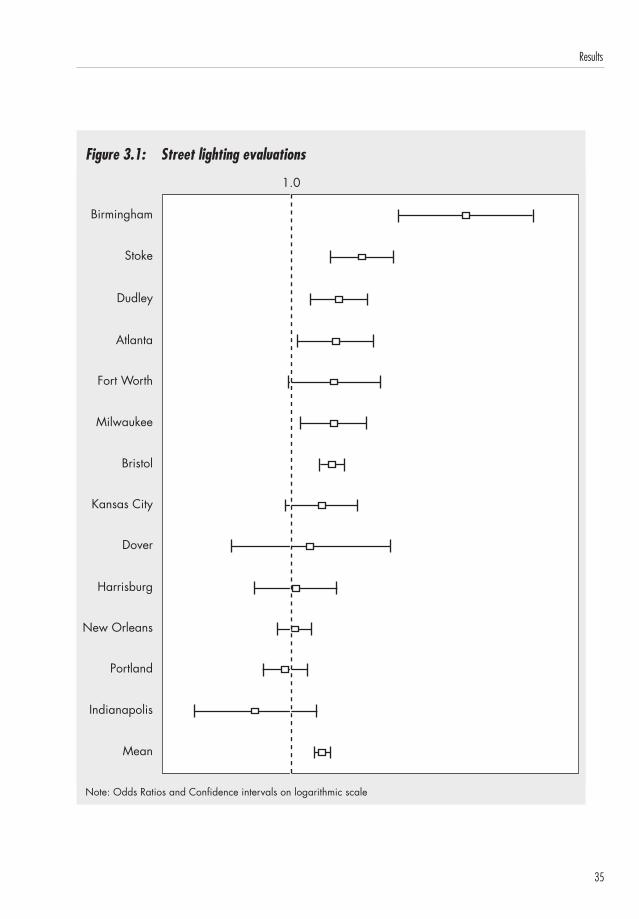
Figure 3.1: Street lighting evaluations
35
Results
Birmingham
Stoke
Dudley
Atlanta
Fort Worth
Milwaukee
Bristol
Kansas City
Dover
Harrisburg
New Orleans
Portland
Indianapolis
Mean
1.0
Note: Odds Ratios and Confidence intervals on logarithmic scale
Figure 3.1 summarises the results in all thirteen studies in a “Forest“ graph. This shows theodds ratio for total crime in each study plus its 95 per cent confidence interval. In order toshow the Birmingham study in full on the graph, logarithms of odds ratios are shown. The lineindicates an odds ratio of 1.0. The 13 studies are ordered according to the magnitudes oftheir odds ratios. It can immediately be seen that only two studies (Portland and Indianapolis)had odds ratios less than 1, meaning that improved lighting was followed by an increase incrime, and in neither case was this increase significant. Therefore, the hypothesis that morelighting causes more crime can be firmly rejected. Furthermore, the lower confidence limitwas markedly below 1 only for the last five studies, meaning that improved street lighting hada significant or near-significant effect in the desired direction in most studies. The overallweighted odds ratio of 1.25 (95% confidence interval 1.18 – 1.32) indicates the significantoverall increase of 25 per cent in the crime rate in control areas compared with experimentalareas in these 13 studies (a significant reduction of 20% in experimental areas).
In conclusion, these more recent British studies agree in showing that improved lightingreduces crime. They did not find that night-time crimes decreased more than day-timecrimes, suggesting that a “community pride“ theory may be more applicable than a“deterrence/surveillance“ theory.
It would be desirable to test whether the effectiveness of street lighting in reducing crime isrelated to certain features of the areas studied. For example, it was speculated that improvedlighting may only improve community pride in relatively stable homogeneous communities,not in areas with a heterogeneous population mix and high residential mobility.Unfortunately, insufficiently detailed information is given in the 13 studies to test thishypothesis adequately. In nevertheless attempting to test it, three studies had to be eliminated:Indianapolis because the areas were tiny (only 2-3 blocks), Dover because the “area“ was aparking garage, and Birmingham because the “area“ was a city-centre market.
Of the other 10 studies, Dudley and Stoke (both finding that lighting was effective) werebased on stable white working class areas. Harrisburg (lighting not effective) was based onan area in transition, with Whites moving out to the suburbs and an influx of ethnicminorities. Fort Worth (effective) was based on an homogeneous (98%) Black area. Portland(not effective), Kansas City (effective) and Bristol (effective) were based on areas with largeethnic minority populations. Atlanta (effective) and New Orleans (not effective) were basedon high crime areas which probably contained large ethnic minority populations, althoughthis was not stated explicitly. Milwaukee (effective) was based on a mixed residential andcommercial area adjacent to the central business district with a high percentage of olderresidents, so this may have been a stable area.
36
Effects of improved street lighting on crime: a systematic review
The lack of systematic information about residential mobility makes it difficult to draw clearconclusions about whether lighting is more effective in reducing crime in stablehomogeneous communities than in unstable heterogeneous communities. Nevertheless, noneof the 10 studies clearly contradicts this hypothesis, and four studies (Dudley, Stoke,Harrisburg and Fort Worth) are clearly concordant with it. The Bristol study was interestingin showing that crimes decreased most (27.4%) in an area undergoing gentrification, whichis again in agreement with the hypothesis that increased community pride results indecreased crime.
37
Results

38
Effects of improved street lighting on crime: a systematic review
39
4. Conclusions
Summary of main findings
The main aim of this report was to complete a systematic review of the effects of improvedstreet lighting on crime. Rigorous methods were used to locate evidence from evaluationstudies, and these methods were reported in detail. Explicit criteria were used to include orexclude studies in the review, and these criteria were also reported in detail. Sixteenpotentially relevant studies were screened but excluded for various reasons, including thelack of a comparable control condition, no outcome measurement of crime and too smallnumbers. Key features of these studies and their results were summarised in Table 2.1. Mostsuggested that improved street lighting was followed by a decrease in crime.
Eight American evaluation studies met the criteria for inclusion in the review. Key features ofthese studies and their results were summarised in Tables 3.1 and 3.2. Their results weremixed. Four studies found that improved street lighting was effective in reducing crime,while the other four found that it was not effective. A meta-analysis found that the eightstudies, taken together, showed that improved street lighting reduced crime by 7 per cent.Why the studies produced different results was not obvious, although there was a tendencyfor “effective“ studies to measure both day-time and night-time crimes and for “ineffective“studies to measure only night-time crimes. However, all except one of these Americanevaluations date from the 1970s.
Five more recent British evaluation studies met the criteria for inclusion in the review. Keyfeatures of these studies and their results were summarised in Tables 3.4 and 3.5. Theirresults showed that improved lighting led to decreases in crime. A meta-analysis found thatthese five studies showed that improved lighting reduced crime by 30 per cent. Theweighted effect size in all thirteen studies was substantial: a 20 per cent decrease inexperimental areas compared with control areas. Furthermore, in two studies, the financialsavings from reduced crimes greatly exceeded the financial costs of the improved lighting.Since these studies did not find that night-time crimes decreased more than day-time crimes,a theory of street lighting focussing on its role in increasing community pride and informalsocial control may be more plausible than a theory focussing on increased surveillance andincreased deterrence. The results did not contradict the theory that improved lighting wasmost effective in reducing crime in stable homogeneous communities.
Priorities for research
Future research should be designed to test the main theories of the effects of improved streetlighting (i.e. community pride versus surveillance/deterrence) more explicitly. Surveys ofyouth in the experimental and control areas could be carried out, to investigate theiroffending, their opinions of the area, their street use patterns, and factors that might inhibitthem from offending (e.g. informal social control by older residents, increased surveillanceafter dark). Household surveys of adults could also be carried out focussing on perceptionsof improvements in the community, community pride, informal social control of youngpeople, street use and surveillance after dark.
Ideally, future research should measure crime using police records, victim surveys, and self-reports of offending. It is possible that one effect of improved street lighting may be tofacilitate or encourage reporting of crimes to the police, for example if victims get a betterview of offenders. The surveys of potential victims and potential offenders are necessary fortesting key hypotheses about the effects of improved lighting.
Future research should ideally include several experimental areas and several comparableadjacent and control areas. Adjacent areas are needed to test hypotheses aboutdisplacement and diffusion of benefits. The comparability of experimental, adjacent andcontrol areas should be investigated. The use of several areas would make it more possibleto establish boundary conditions under which improved lighting had greater or lessereffects. The numbers of crimes recorded in each area in the pretest should be sufficient todetect changes reliably (as indicated by a statistical power analysis). Ideally, large numbersof potential victims and potential offenders should be surveyed.
Crimes should be measured before and after the intervention in experimental, adjacent andcontrol areas. Ideally, a long time series of crimes should be studied, to investigate pre-existing crime trends and also how far any effects of street lighting persist or wear off overtime. This would also help to determine how far a decrease in crime after a high rate mightreflect regression to the mean. Different types of crimes should be measured, and also crimescommitted during day-time and the hours of darkness. The improvement in lighting in differentareas should be carefully measured, including vertical and horizontal levels of illumination.Cost-benefit analyses of the impact of improved street lighting should be carried out.
Most importantly, systematic information should be collected and reported in eachevaluation project about such topics as the dates of the research and of the interventions,the design of the study, characteristics of areas, hypotheses to be tested, operational
40
Effects of improved street lighting on crime: a systematic review
definitions of variables, implementation issues, events occurring over time in all areas,lengths of before and after measurement periods, numbers of crimes, strength of effects andstatistical significance of results, and financial costs and benefits. It is important to specifycharacteristics of areas in order to investigate external validity, or what works with whom inwhat settings. Systematic reviews in the future would be easier to carry out if each projectfollowed a checklist of topics to be covered. This applies to all types of criminologicalevaluations.
Finally, in testing hypotheses, it would be useful to investigate the effects of street lighting inconjunction with other crime prevention interventions. To the extent that community pride isimportant, this could be enhanced by other environmental improvements. To the extent thatsurveillance is important, this could be enhanced by other interventions such as closed-circuit television cameras. For example, one experimental area could have both improvedstreet lighting and CCTV, a second could have only improved street lighting, and a thirdcould have only CCTV. This kind of planned evaluation of interactions of crime preventioninitiatives has rarely been attempted before.
Policy implications
The policy implications of research on improved street lighting have been well articulated byPease (1999). He pointed out that situational crime prevention involves the modification ofenvironments so that crimes involve more effort, more risk and lower rewards. The first stepin any crime reduction programme requires a careful analysis of situations and how theyaffect potential offenders and potential victims. The second step involves implementing crimereduction interventions. Whether improved street lighting is likely to be effective in reducingcrime would depend on characteristics of situations and on other concurrent situationalinterventions. Efforts to reduce crime should take account of the fact that crime tends to beconcentrated among certain people and in certain locations, rather than being evenlydistributed throughout a community.
The British studies included in this review show that improved street lighting can be effectivein reducing crime in some circumstances. Exactly what are the optimal circumstances is notclear at present, and this needs to be established by future evaluation research. However, itis clear that improved street lighting should be considered as a potential strategy in anycrime reduction programme in coordination with other intervention strategies. Depending onthe analysis of the crime problem, improved street lighting could often be implemented as afeasible, inexpensive and effective method of reducing crime.
41
Conclusions
Street lighting has some advantages over other situational measures which have beenassociated with the creeping privatisation of public space, the exclusion of sections of thepopulation and the move towards a “fortress“ society (Bottoms, 1990). Street lightingbenefits the whole neighbourhood rather than particular individuals or households. It is nota physical barrier to crime, it has no adverse civil liberties implications and it can increasepublic safety and effective use of neighbourhood streets at night. In short, improved streetlighting seems to have no negative effects and demonstrated benefits for law-abidingcitizens.
42
Effects of improved street lighting on crime: a systematic review
43
Appendix 1: Literature reviews consulted
The following eight literature reviews were consulted as part of the search strategies used toidentify evaluation reports on the effects of improved street lighting on crime.
Eck, J. E. (1997). Preventing crime at places. In L. W. Sherman, D. C. Gottfredson, D.L.MacKenzie, J. E. Eck, P. Reuter and S. D. Bushway, (eds.) Preventing Crime: What Works,What Doesn’t, What’s Promising (ch. 7). Washington, D.C.: National Institute of Justice,U.S. Department of Justice.
Eck, J. E. (2002). Preventing crime at places. In L. W. Sherman, D. P. Farrington, B. C.Welsh and D.L. MacKenzie (eds.) Evidence-Based Crime Prevention. (pp. 241-294).London: Routledge.
Fleming, R. and Burrows, J. (1986). The case for lighting as a means of preventing crime.Home Office Research Bulletin, 22, 14-17.
Painter, K. A. (1996). Street lighting, crime and fear of crime: A summary of research. In T.H. Bennett (ed.) Preventing Crime and Disorder: Targeting Strategies and Responsibilities(pp. 313-351). Cambridge: Institute of Criminology, University of Cambridge.
Pease, K. (1999). A review of street lighting evaluations: Crime reduction effects. In K. A.Painter and N. Tilley (eds.) Surveillance of Public Space: CCTV, Street Lighting and CrimePrevention (pp. 47-76). Monsey, N.Y.: Criminal Justice Press.
Poyner, B. (1993). What works in crime prevention: An overview of evaluations. In R.V.Clarke (ed.) Crime Prevention Studies, Vol. 1 (pp. 7-34). Monsey, N.Y.: Criminal JusticePress.
Ramsay, M. and Newton, R. (1991). The Effect of Better Street Lighting on Crime and Fear: AReview. (Crime Prevention Unit Paper 29.) London: Home Office.
Tien, J. M., O’Donnell, V. F., Barnett, A. and Mirchandani, P. B. (1979). Street LightingProjects: National Evaluation Program, Phase 1 Report. Washington, D.C.: National Instituteof Law Enforcement and Criminal Justice, U.S. Department of Justice.
44
Effects of improved street lighting on crime: a systematic review
Appendix 2: Evaluation reports that could not be obtained
The following four evaluation reports were identified by Tien et al. (1979), but copies couldnot be obtained. (James Tien and Arnold Barnett, as well as U.S. government sources werecontacted.)
Department of Public Works (1976). A Brief Update on ‘Miami Relights’. (July). Miami,Florida: Author.
Denver Anti-Crime Council (1977). Final Report: Street Lighting Project. (June). Unpublisheddraft. Denver, Colorado: Author.
Newark High Impact Evaluation Staff (1975). Street Lighting Project Interim EvaluationReport. (December). Newark, N.J.: Author.
Tucson Department of Human and Community Development (1971). First Action Year: August1, 1970-July 31, 1971. Project Evaluation Report. (October). Tucson, Arizona: Author.
It is not known if these reports would meet the inclusion criteria. According to Tien et al.(1979), the control area was the city for the Miami and Newark projects, so they wouldlikely be excluded. However, according to Tien et al. (1979), Denver had an adjacentcontrol area and Tucson had randomly selected experimental and control areas, so theymight be evaluation projects that should be included.
The following evaluation report was identified by Ramsay and Newton (1991), but couldnot be obtained. (Malcolm Ramsay was contacted.)
Vamplew, C. (1990). The Effect of Improved Street Lighting on Perceptions of Crime: ABefore-and-After Study. Cleveland County Council, Research and Intelligence Unit.
From the description given by Ramsay and Newton (1991), it is unclear whether theexperimental and control areas in this study are comparable.
45
References
Angel, S. (1968). Discouraging Crime Through City Planning. (Working Paper No. 5.)Berkeley, California: University of California.
Atkins, S., Husain, S. and Storey, A. (1991). The Influence of Street Lighting on Crime andFear of Crime (Crime Prevention Unit Paper 28). London: Home Office.
Atlanta Regional Commission (1974). Street Light Project: Final Evaluation Report. Atlanta,Georgia: Author.
Bachner, J. P. (1985). Effective security lighting. Journal of Security Administration, 9, 59-67.
Barr, R. and Pease, K. (1990). Crime placement, displacement and deflection. In M. Tonryand N. Morris (eds.) Crime and Justice, Vol. 12 (pp. 277-318). Chicago, Illinois: Universityof Chicago Press.
Bennett, T. H. and Wright, R. (1984). Burglars on Burglary. Farnborough, Hants: Gower.
Bottoms, A. E. (1990). Crime prevention facing the 1990s. Policing and Society, 1, 3-22.
Challinger, D. (1992). Less telephone vandalism: How did it happen? In R. V. Clarke (ed.)Situational Crime Prevention: Successful Case Studies (pp. 75-88). Albany, N.Y.: Harrowand Heston.
Clarke, R. V. (1995). Situational crime prevention. In M. Tonry and D. P. Farrington (eds.)Building a Safer Society: Strategic Approaches to Crime Prevention (pp. 91-150). Chicago,Illinois: University of Chicago Press.
Clarke, R. V. and Weisburd, D. (1994). Diffusion of crime control benefits: Observations onthe reverse of displacement. In R. V. Clarke (ed.) Crime Prevention Studies, Vol. 2 (pp. 165-183). Monsey, N.Y.: Criminal Justice Press.
Cohen, L. E. and Felson, M. (1979). Social change and crime rate trends: A routine activityapproach. American Sociological Review, 44, 588-608.
Cook, T. D. and Campbell, D. T. (1979). Quasi-Experimentation: Design and Analysis Issuesfor Field Settings. Chicago, Illinois: Rand McNally.
Davidson, N. and Goodey, J. (1991). Final Report of the Hull Street Lighting and CrimeProject. Hull: School of Geography and Earth Sciences, University of Hull.
Department of Intergovernmental Fiscal Liaison (1973). Preliminary Report – Milwaukee HighIntensity Street Lighting Project. Milwaukee, Wisconsin.: Author.
Department of Intergovernmental Fiscal Liaison (1974). Final Report – Milwaukee HighIntensity Street Lighting Project. Milwaukee, Wisconsin: Author.
Ditton, J. and Nair, G. (1994). Throwing light on crime: A study of the relationship betweenstreet lighting and crime prevention. Security Journal, 5, 125-132.
Farrington, D. P. (1983). Randomized experiments on crime and justice. In M.Tonry and N.Morris (eds.) Crime and Justice, Vol. 4 (pp. 257-308). Chicago, Illinois: University ofChicago Press.
Farrington, D. P. (1997). Evaluating a community crime prevention program. Evaluation, 3,157-173.
Farrington, D. P. and Petrosino, A. (2000). Systematic reviews of criminologicalinterventions: The Campbell Collaboration Crime and Justice Group. International Annals ofCriminology, 38, 49-66.
Farrington, D. P. and Petrosino, A. (2001). The Campbell Collaboration Crime and JusticeGroup. Annals of the American Academy of Political and Social Science, 578, 35-49.
Fleming, R. and Burrows, J. (1986). The case for lighting as a means of preventing crime.Home Office Research Bulletin, 22, 14-17.
Griswold, D. B. (1984). Crime prevention and commercial burglary: A time series analysis.Journal of Criminal Justice, 12, 493-501.
Hack, G. (1974). Improving City Streets for Use at Night: The Norfolk Experiment. Norfolk,Virginia: Norfolk Redevelopment and Housing Authority.
46
Effects of improved street lighting on crime: a systematic review
Harrisburg Police Department (1976). Final Evaluation Report of the “High Intensity StreetLighting Program“. Harrisburg, Pennsylvania: Planning and Research Section, Staff andTechnical Services Division, Harrisburg Police Department.
Inskeep, N. R. and Goff, C. (1974). A Preliminary Evaluation of the Portland Lighting Project.Salem, Oregon: Oregon Law Enforcement Council.
Jacobs, J. (1961). The Death and Life of Great American Cities. New York: Random House.
Krause, P. B. (1977). The impact of high intensity street lighting on night-time businessburglary. Human Factors, 19, 235-239.
Kushmuk, J. and Whittemore, S. L. (1981). A Re-evaluation of Crime Prevention throughEnvironmental Design Program in Portland, Oregon: Executive Summary. Washington, D.C.:National Institute of Justice, U.S. Department of Justice.
La Vigne, N. G. (1994). Gasoline drive-offs: Designing a less convenient environment. In R.V. Clarke (ed.) Crime Prevention Studies, Vol. 2 (pp. 91-114). Monsey, N.Y.: CriminalJustice Press.
Lavrakas, P. J. and Kushmuk, J. W. (1986). Evaluating crime prevention through environmentaldesign: The Portland commercial demonstration project. In D. P. Rosenbaum (ed.) CommunityCrime Prevention: Does It Work? (pp. 202-227). Beverly Hills, California: Sage.
Lewis, E. B. and Sullivan, T. T. (1979). Combating crime and citizen attitudes: A case study ofthe corresponding reality. Journal of Criminal Justice, 7, 71-79.
Lipsey, M. W. and Wilson, D. B. (2001). Practical Meta-Analysis. Thousand Oaks,California: Sage.
Mayhew, P., Clarke, R. V., Burrows, J. N., Hough, J. M. and Winchester, S. W. C. (1979). Crimein Public View. (Home Office Research Study 40.) London: Her Majesty’s Stationery Office.
Nair, G., Ditton, J. and Phillips, S. (1993). Environmental improvements and the fear of crime:The sad case of the ‘pond’ area in Glasgow. British Journal of Criminology, 33, 555-561.
Nair, G., McNair, D. G. and Ditton, J. (1997). Street lighting: Unexpected benefits to youngpedestrians from improvement. Lighting Research and Technology, 29, 143-149.
47
References
Newman, O. (1972). Defensible Space: Crime Prevention Through Urban Design. NewYork: Macmillan.
Painter, K. A. (1994). The impact of street lighting on crime, fear, and pedestrian street use.Security Journal, 5, 116-124.
Painter, K. A. (1996). Street lighting, crime and fear of crime: A summary of research. In T.H. Bennett (ed.) Preventing Crime and Disorder: Targeting Strategies and Responsibilities(pp. 313-351). Cambridge: Institute of Criminology, University of Cambridge.
Painter, K. A. and Farrington, D. P. (1997). The crime reducing effect of improved streetlighting: The Dudley project. In R. V. Clarke (ed.) Situational Crime Prevention: SuccessfulCase Studies, 2nd ed. (pp. 209-226). Guilderland, N.Y.: Harrow and Heston.
Painter, K. A. and Farrington, D. P. (1999a). Improved street lighting: Crime reducing effectsand cost-benefit analyses. Security Journal, 12, 17-32.
Painter, K. A. and Farrington, D. P. (1999b). Street lighting and crime: Diffusion of benefits in theStoke-on-Trent project. In K. A. Painter & N. Tilley (eds.) Surveillance of Public Space: CCTV,Street Lighting and Crime Prevention (pp. 77-122). Monsey, N.Y.: Criminal Justice Press.
Painter, K. A. and Farrington, D. P. (2001a). Evaluating situational crime prevention using ayoung people’s survey. British Journal of Criminology, 41, 266-284.
Painter, K. A. and Farrington, D. P. (2001b). The financial benefits of improved streetlighting, based on crime reduction. Lighting Research and Technology, 33, 3-12.
Pease, K. (1999). A review of street lighting evaluations: Crime reduction effects. In K. A.Painter and N. Tilley (eds.) Surveillance of Public Space: CCTV, Street Lighting and CrimePrevention (pp. 47-76). Monsey, N.Y.: Criminal Justice Press.
Petrosino, A., Turpin-Petrosino, C. and Finckenauer, J. O. (2000). Well-meaning programscan have harmful effects! Lessons from experiments of programs such as Scared Straight.Crime and Delinquency, 46, 354-379.
Poyner, B. (1991). Situational crime prevention in two parking facilities. Security Journal, 2,96-101.
48
Effects of improved street lighting on crime: a systematic review
Poyner, B. and Webb, B. (1997). Reducing theft from shopping bags in city centre markets.In R. V. Clarke (ed.) Situational Crime Prevention: Successful Case Studies, 2nd ed. (pp. 83-89). Guilderland, N.Y.: Harrow and Heston.
Quinet, K. D. and Nunn, S. (1998). Illuminating crime: The impact of street lighting on callsfor police service. Evaluation Review, 22, 751-779.
Ramsay, M. and Newton, R. (1991). The Effect of Better Street Lighting on Crime and Fear: AReview. (Crime Prevention Unit Paper 29.) London: Home Office.
Reppetto, T. A. (1976). Crime prevention and the displacement phenomenon. Crime andDelinquency, 22, 166-177.
Shaftoe, H. (1994). Easton/Ashley, Bristol: Lighting improvements. In S. Osborn (ed.)Housing Safe Communities: An Evaluation of Recent Initiatives (pp. 72-77). London: SafeNeighbourhoods Unit.
Sherman, L. W. and Weisburd, D. (1995). General deterrent effects of police patrol in crime“hot spots“: A randomized controlled trial. Justice Quarterly, 12, 625-648.
Siemon, J. M. and Vardell, L. (1974). A bright answer to the crime and energy question.Police Chief, June, 53-55.
Skogan, W. G. (1990). Disorder and Decline: Crime and the Spiral of Decay in AmericanNeighborhoods. New York: Free Press.
Sternhell, R. (1977). The Limits of Lighting: The New Orleans Experiment in CrimeReduction: Final Impact Evaluation Report. New Orleans, Louisiana: Mayor’s CriminalJustice Coordinating Council.
Taub, R. P., Taylor, D. G. and Dunham, J. D. (1984). Paths of Neighborhood Change: Raceand Crime in Urban America. Chicago, Illinois: University of Chicago Press.
Taylor, R. B. and Gottfredson, S. (1986). Environmental design, crime and prevention: Anexamination of community dynamics. In A. J. Reiss and M. Tonry (eds.) Communities andCrime (pp. 387-416). Chicago: University of Chicago Press.
49
References
Tien, J. M., O’Donnell, V. F., Barnett, A. and Mirchandani, P. B. (1979). Street LightingProjects: National Evaluation Program, Phase 1 Report. Washington, D.C.: National Instituteof Law Enforcement and Criminal Justice, U.S. Department of Justice.
Tilley, N. (1993). The Prevention of Crime against Small Businesses: The Safer CitiesExperience. (Crime Prevention Unit Paper 45.) London: Home Office.
Vrij, A. and Winkel, F. W. (1991). Characteristics of the built environment and fear of crime:A research note on interventions in unsafe locations. Deviant Behavior, 12, 203-215.
Warr, M. (1990). Dangerous situations: Social context and fear of victimization. SocialForces, 68, 891-907.
Wilson, J. Q. and Kelling, G. L. (1982). Broken windows. The Atlantic Monthly (March), 29-38.
Wright, R., Heilweil, M., Pelletier, P. and Dickinson, K. (1974). The Impact of Street Lightingon Crime. Ann Arbor, Michigan: University of Michigan.
50
Effects of improved street lighting on crime: a systematic review

51

52
Effects of improved street lighting on crime: a systematic review
RDS Publications
Requests for Publications
Copies of our publications and a list of those currently available may be obtained from:
Home OfficeResearch, Development and Statistics DirectorateCommunication Development UnitRoom 275, Home Office50 Queen Anne’s GateLondon SW1H 9ATTelephone: 020 7273 2084 (answerphone outside of office hours)Facsimile: 020 7222 0211E-mail: [email protected]
alternatively
why not visit the RDS web-site atInternet: http://www.homeoffice.gov.uk/rds/index.htm
where many of our publications are available to be read on screen or downloaded for printing.

Addendum to Effects of Improved Street Lighting on Crime: a systematic review (Home Office Research Study 251)
Since carrying out this meta-analysis, statistical advice from Dr Marchant (Leeds Metropolitan University) and from Dr Patricia Altham (Centre for Mathematical Sciences, Cambridge University) about the need to correct the estimate of the statistical variance calculated has been received. Corrections were needed to take account of: • positive dependence (i.e. the correlation) between the number of ‘before crimes’ and the
number of ‘after crimes’ experienced by victims; and • overdispersion (i.e. the ratio of the variance to the mean number of crimes experienced by
victims). New analyses of the data have subsequently been undertaken therefore. They show that the conclusions of HORS 251 are not substantially changed and that the effects of street lighting on crime are still statistically significant. Full technical details of the methodological improvements can be accessed on the website of the Campbell Collaboration (www.aic.gov.au/campbellcj) which holds the best scientific reviews of the effectiveness of interventions in criminal justice. A follow-up systematic review and meta-analysis of the effects of improved lighting on crime is being undertaken for the Campbell Collaboration.