Embed Size (px)
Citation preview

C A F R
For the Fiscal Year Ended June 30, 2017
www.TownofBluffton.sc.gov
Town of
BLUFFTON South Carolina
Photo courtesy of Palme o Bluff

Comprehensive Annual Financial Report for the
Town of Bluffton, South Carolina For the Year Ended June 30, 2017
Prepared by: Finance Department
Trisha Greathouse Director of Finance and Administration

Town of Bluffton, South Carolina Comprehensive Annual Financial Report
For the Year Ended June 30, 2017 Table of Contents
i
INTRODUCTORY SECTION
Page
Transmittal Letter A1 – A4
Principal Officials A5
Organizational Chart A6
GFOA Certificate of Achievement A7
FINANCIAL SECTION Independent Auditors’ Report B1 – B2
Management’s Discussion and Analysis C1 – C10
Basic Financial Statements
Government-Wide Financial Statements:
Statement of Net Position D1
Statement of Activities D2
Fund Financial Statements:
Balance Sheet – Governmental Funds D3
Reconciliation of Total Governmental Fund Balances to Net Position of Governmental Activities D4
Statement of Revenues, Expenditures, and Changes in Fund Balances – Governmental Funds D5
Reconciliation of the Statement of Revenues, Expenditures, and Changes in Fund Balances of D6
Governmental Funds to the Statement of Activities
Statement of Revenues, Expenditures, and Changes in Fund Balances – Budget and Actual –
General Fund D7
Statement of Revenues, Expenditures, and Changes in Fund Balances – Budget and Actual –
Stormwater Fund D8
Notes to the Financial Statements D9 – D32
Schedules of Required Supplementary Information
Pension Plan – Schedule of Town’s Proportionate Share of Net Pension Liability E1
Pension Plan – Schedule of Town’s Contributions E2
Individual and Combining Fund Statements and Schedules
Schedules of Revenues, Expenditures, and Changes in Fund Balances – Budget and Actual:
General Fund F1
Capital Improvements Program Fund F2
Debt Service Fund F3
Stormwater Fund F4
Combining Balance Sheet – Non-major Governmental Funds F5
Combining Statement of Revenues, Expenditures, and Changes in Fund Balances – Non-major
Governmental Funds F6

Town of Bluffton, South Carolina Comprehensive Annual Financial Report
For the Year Ended June 30, 2017 Table of Contents
ii
STATISTICAL SECTION (Unaudited) Statistical Section Table of Contents G1
Financial Trends
Schedule 1 – Net Position by Component, Last Ten Fiscal Years G2
Schedule 2 – Changes in Net Position, Last Ten Fiscal Years G3
Schedule 3 – Program Revenues by Function/Program, Last Ten Fiscal Years G4
Schedule 4 – Fund Balances, Governmental Funds, Last Ten Fiscal Years G5
Schedule 5 – Changes in Fund Balances, Governmental Funds, Last Ten Fiscal Years G6
Revenue Capacity
Schedule 6 – Tax Revenues by Source, Governmental Funds, Last Ten Fiscal Years G7
Schedule 7 – Assessed Value and Estimated Actual Value of Taxable Property, Last Ten G8
Fiscal Years
Schedule 8 – Direct and Overlapping Property Tax Rates, Last Ten Fiscal Years G9
Schedule 9 – Principal Property Tax Payers, Current Year and Nine Years Ago G10
Schedule 10 – Property Tax Levies and Collections, Last Ten Fiscal Years G11
Schedule 11 – Direct and Overlapping Sales Tax Rates, Last Ten Fiscal Years G12
Debt Capacity
Schedule 12 – Ratios of Outstanding Debt by Type, Last Ten Fiscal Years G13
Schedule 13 – Ratios of Net General Bonded Debt Outstanding, Last Ten Fiscal Years G14
Schedule 14 – Direct and Overlapping Governmental Activities Debt G15
Schedule 15 – Legal Debt Margin Information, Last Ten Fiscal Years G16
Schedule 16 – Pledged Revenue Coverage, Last Ten Fiscal Years G17
Demographic and Economic Information
Schedule 17 – Demographic and Economic Statistics, Last Ten Calendar Years G18
Schedule 18 – Principal Employers G19
Operating Information
Schedule 19 – Full-Time Equivalent (FTE) Town Governmental Employees G20
by Function/Program
Schedule 20 – Operating Indicators by Function/Program, Last Ten Fiscal Years G21
Schedule 21 – Capital Asset Statistics by Function/Program, Last Ten Fiscal Years G22
SUPPLEMENTAL SECTION Municipal Fines, Assessments and Surcharges H1
COMPLIANCE SECTION Report on Internal Control over Financial Reporting and on Compliance and Other Matters on an I1 Audit of Financial Statements Performed in Accordance with Government Auditing Standards

A1
Lisa Sulka Council MembersMayor Fred HamiltonLarry Toomer Harry Lutz Mayor Pro Tempore Dan Wood Marc Orlando Kim ChapmanTown Manager Town Clerk
December 22, 2017
To the Mayor and Members of Town Council, and the Citizens of the Town of Bluffton, South Carolina:
We are pleased to submit the Comprehensive Annual Financial Report (CAFR) of the Town of Bluffton, South Carolina (the “Town”) for fiscal year ended June 30, 2017.
State law requires that all general-purpose municipal governments publish a complete set of financial statements in conformity with generally accepted accounting principles (GAAP) and audited in accordance with generally accepted auditing standards by a firm of licensed certified public accountants. In addition to meeting this requirement, this report is more comprehensive than the minimum basicfinancial statement requirements. It consists of management’s representations concerning the finances of the Town and supports management’s commitment to full disclosure as reflected in the informative financial analyses provided herein.
Town management assumes full responsibility for the completeness and accuracy of the data provided in this report utilizing the Town’s established comprehensive framework of internal controls. These internal controls protect the Town’s assets from loss, theft, and misuse as well as provide reliable information for the preparation of this report. As the cost of internal controls should not outweigh their benefits, the Town’s controls have been designed to provide reasonable, rather than absolute, assurance that the financial statements are free of any material misstatements. As management, to the best of our knowledge and belief, this financial report is complete, accurate, and reliable in all material aspects. These Financial Statements have been prepared by the Finance Department in accordance with Generally Accepted Accounting Principles (GAAP) for local governments.
The Town’s Financial Statements have been audited by KRT, CPAs, P.C. Based upon their independent audit, an unmodified opinion was rendered for the Town’s Financial Statements for the fiscal year ended June 30, 2017. The Independent Auditors’ Report is presented as the first component of the financial section of this report.
GAAP require that management provide a narrative, introduction, overview, and analysis to accompany the basic financial statements in the form of Management’s Discussion and Analysis (MD&A). This letter of transmittal is designed to complement the MD&A and should be read in conjunction with it. The Town’s MD&A can be found immediately following the report of the independent auditors.
Town of Bluffton Profile
The Town of Bluffton, settled in 1825 and incorporated in 1852, is located in Beaufort County, a southern coastal county in South Carolina. The Town is located just 12 miles west of Hilton Head Island, SC and approximately 20 miles northeast of Savannah, Georgia. It is situated on a high bluff overlooking the May River, a pristine waterway that has strongly contributed to the Town's history and continued success.
The Town operates under the council-manager form of government. Policy-making and legislative authority are vested in a governing council (Council) consisting of a mayor and four (4) other members. Members of Council are elected for a term of four (4) years. Council is primarily responsible for setting policies, passing ordinances, adopting the budget, appointing committees, and hiring both the Town’s manager and attorney. The Town Manager carries out the policies and ordinances of the Council, oversees the day-to-day operations of the Town, and appoints the heads of the various departments.
A2
Mayor, Council, and Citizens Page Two December 22, 2017
The Town is empowered to levy a property tax on both real and personal property located within its boundaries. The Town also has the power by statute to extend its corporate limits by voluntary annexation as deemed appropriate by Council.
The original Town Boundary was approximately one square mile in area (640 acres). When the Town’s neighboring resort area of Hilton Head Island began to reach the “build out” stage of their development, Town of Bluffton officials began to recognize the enormous amount of growth that would soon face the Town. All of the land outside the Town’s original “one square mile” was in the jurisdiction of Beaufort County. Instead of ignoring the growth in the area, the Town began to voluntarily annex land in order to provide local control over future development.
The first large tract annexation took place on November 23, 1998 and included Palmetto Bluff (20,660 acres) and the Shults Tract (620 acres). Since then, Bluffton has approved 46 annexations increasing the Town’s boundary to approximately 54 square miles in area. In just a few years, Bluffton grew from a one square-mile-town to controlling the future development of more than 34,600 acres, a majority of which is located three or more miles from the heart of the Town.
According to the 2010 U.S. Census, Bluffton is one of the State’s fastest growing municipalities and the State’s 4th largest municipality in area. Additionally, the 2010 Census shows Bluffton has approximately 12,893 citizens compared to 1,275 in the 2000 Census. The estimated population today is 19,000 residents.
Local Economy
According to the U.S. Census Bureau, the 2010 median family income for the Town of Bluffton was $67,344 compared to $48,611 in the 2000 Census. The 2010 Census shows the Town of Bluffton’s per capita income at $29,008, exceeding the state average of $23,443.
For the year ending June 30, 2017, the building industry remains strong with 895 new single family housing permits issued and a moderate increase in revenues for Building Permits and Development Fees of 2% over the prior fiscal year. The town issued over 3,000 business licenses, with almost 1,400 of these businesses located within Town limits. Business License revenue increased over last year 1% to $2,030,598. Contractors represent approximately 8% of in-town businesses. Other predominate in-town businesses include Retail, Professional Services, Medical, Personal Services (beauty and spa services. pet services, event planners and suppliers, photographers, etc.), and Restaurants.
The Don Ryan Center for Innovation (DRCI) was a public-private partnership initiated by Clemson University, eviCore Healthcare, and the Town of Bluffton to establish the state’s first incubator in a non-metropolitan area of the state. Town Council authorized the merger of the DRCI Incubator and the Bluffton Public Development Corporation (PDC) in late FY 2017 into a single entity known as the Don Ryan Center for Innovation. This merger was approved by the State of South Carolina on July 31, 2017. The DRCI fosters and promotes economic development in six general areas: Business Incubation, Co-working offerings (The HUB), Education & Outreach, Business Attraction, Expansion & Retention, Workforce Development, and Business Startup/Concierge Services. In addition, the DRCI has partnerships with the Beaufort County School District and the Savannah College of Art and Design (SCAD) to promote and teach the foundations of entrepreneurship. The goal is to create a vibrant entrepreneurial business climate within the region. Currently there are nine companies in our incubator program. In total we have graduated 32 companies that have created more than 100 jobs.
Major Initiatives and Revitalization Efforts
The final phase of the May River Road Streetscape project is nearing the end of construction. The project includes 30 additional parking spaces, new 6’ wide sidewalks on the north and south sides of the roadway from Pin Oak Street to Whispering Pine and an extension of sidewalk on the north side of the street from Whispering Pine to Jennifer Court. Additional street lighting, landscaping, site furnishings and 550 feet of

A3
Mayor, Council, and Citizens Page Three December 22, 2017
living fences will improve the overall appeal of the downtown area and increase pedestrian safety. The total project cost is approximately $4.7 million.
This year the existing structure of the Garvin-Garvey house was rehabilitated and the structure was stabilized to preserve the history and accomplishments of the earliest known freedman-owned and built home on the May River. The home was built by freedman Cyrus Garvin in 1870. The house is located within Oyster Factory Park and tours of the newly renovated building can be scheduled through the Bluffton Historical Preservation Society and the Town of Bluffton Welcome Center. Renovation costs were subsidized by grants from SC Department of Parks, Recreation and Tourism Undiscovered SC Grant Program, SC Department of Archives and History Federal Historic Preservation Grants (Department of the Interior, National Park Service), SC State Appropriations, private donations, and additional matching funds from the Town provided from Hospitality and Local Accommodations Tax funds.
Budget Process
The Town’s budget serves as the foundation for financial planning and control. Annual strategic planning sessions provide the areas of focus for each department as they prepare their budgets. This year’s process encompassed a five year plan for capital projects.
The budget planning process begins in January of each year. Each department prepares a comprehensive list of goals and objectives highlighting the programs, projects and initiatives to be considered for the upcoming fiscal year. The departments submit their requests for general fund appropriation to the Town Manager in the spring of each year.
The Capital Improvements Program (CIP) is developed through input from the citizens and the Town’sPlanning Commission. Their input is used as the starting point for developing a proposed budget.
The Finance staff prepares and forwards revenue estimates for both the current and upcoming fiscal year. The expenditure proposals are compared to the revenue projections to serve as a mechanism for the Town Manager to make necessary adjustments in programs and priorities, if needed, to ensure a balanced budget and sufficient fund balance for the financial integrity of the Town.
The Town Manager presents this proposed budget to Council for review in May of each year. Council is required under state law to hold a public hearing and to adopt a final budget no later than June 30, the close of the Town’s fiscal year.
The appropriated budget is prepared by fund and department. Once adopted by Council, the budgetarycontrol is maintained by the Town Manager at the fund level. Council must approve by ordinance any amendment to the budget which causes a change in the total appropriation of any fund.
Long-term Financial Planning
As a part of the budget process, the Town began developing long-range financial plans in 2006. Additionally, the Town has held strategic planning sessions the last five years to develop and update strategic goals and objectives for Council and staff. Town staff prepares the budget forecasts based largely on the experience the Town has had in the prior years and growth based on developer projections that could reasonably be anticipated in the future. All revenues and expenditures in the general fund and capital projects fund are analyzed and forecasts developed for the upcoming budget year and five future years. This enables management to make proactive decisions for changes in service or tax and fee increases or decreases while providing a snapshot of revenue surpluses or shortfalls the Town could experience if no immediate actions were taken.

A4
Mayor, Council, and Citizens Page Four December 22, 2017
Long-term financial planning is a major tool in maintaining a sound financial position. It is critical that the Town maintain its bond ratings, Moody’s upgraded the town’s bond rating in October 2017 from Aa2 to Aa1 and Standard and Poor’s upgraded the town’s bond rating in June 2014 from AA- to AA+.
Awards and Acknowledgements
The Government Finance Officers Association of the United States and Canada (GFOA) awarded a Certificate of Achievement for Excellence in Financial Reporting to the Town of Bluffton for its comprehensive annual financial report for the fiscal year ended June 30, 2016. This was the ninth consecutive year that the Town has achieved this prestigious award. In order to be awarded a Certificate of Achievement, a government must publish an easily readable and efficiently organized comprehensive annual financial report. This report must satisfy both generally accepted accounting principles and applicable legal requirements.
A Certificate of Achievement is valid for a period of one year only. We believe that our current comprehensive annual financial report continues to meet Certificate of Achievement Program’s requirements, and we are submitting it to the GFOA to determine its eligibility for another certificate.
The preparation of this report could not be accomplished without the efficient and dedicated services of the entire Finance Department staff. Their contributions are truly appreciated. A special thank you to Donna Brownell, Accounting and Risk Manager for the vital role she played in the coordination and completion of this project.
Respectfully,
Trisha A. Greathouse Director of Finance & Administration
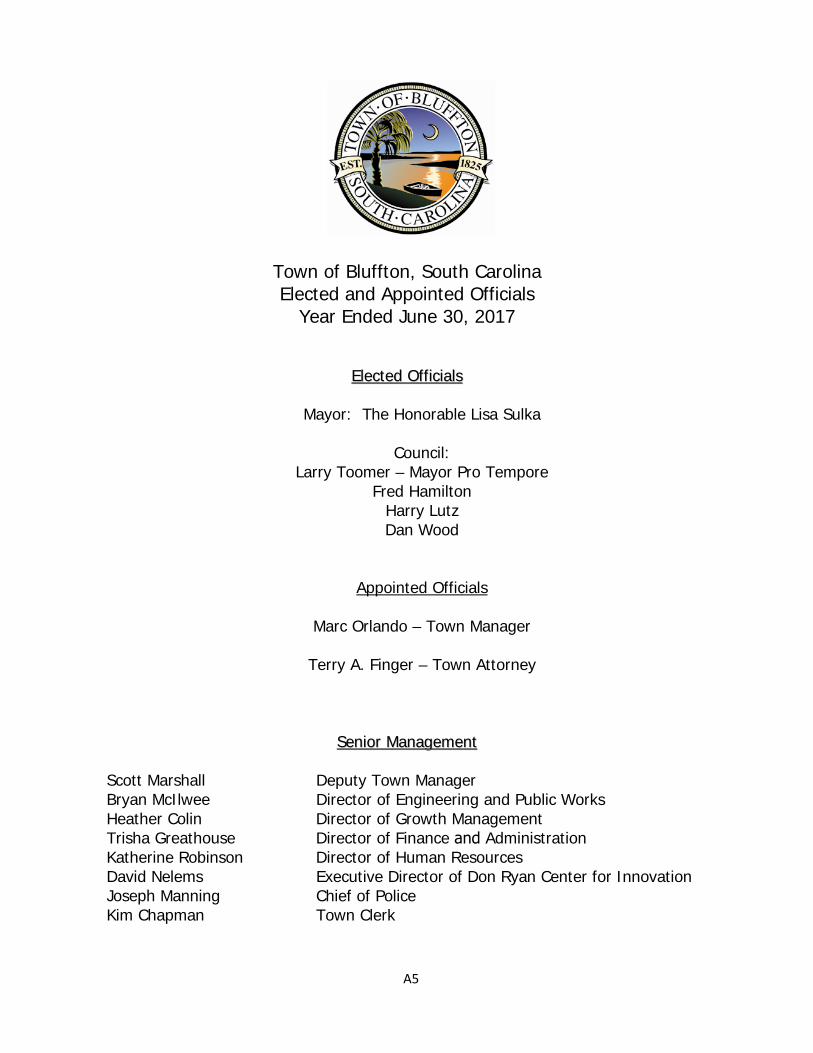
A5
Town of Bluffton, South Carolina Elected and Appointed Officials
Year Ended June 30, 2017
EElleecctteedd OOffffiicciiaallss
Mayor: The Honorable Lisa Sulka
Council: Larry Toomer – Mayor Pro Tempore
Fred Hamilton Harry Lutz Dan Wood
Appointed Officials
Marc Orlando – Town Manager
Terry A. Finger – Town Attorney
SSeenniioorr MMaannaaggeemmeenntt
Scott Marshall Bryan McIlwee Heather Colin Trisha Greathouse Katherine Robinson David Nelems Joseph Manning
Kim Chapman
Deputy Town Manager Director of Engineering and Public Works Director of Growth Management Director of Finance and Administration Director of Human Resources Executive Director of Don Ryan Center for Innovation Chief of Police Town Clerk

Voters/Citizens
Mayor & Council
Town Manager
Director of Engineering and
Public Works
Project Management
Public Works
Stormwater Management
Director of Growth
Management
Planning & Communtiy
Development
Building
Safety
Customer
Service
Director of Finance and Administration
Finance & Business License
Municipal Court
Chief of Police
Support Division
Investigations Division
Patrol
Division
Emergency Management
Director of Human Resources
Deputy Town Manager
Policy and Public
Information
Information Technology
Director of Don Ryan Center for
Innovation
EconomicDevelopment
Town Clerk
Municipal Judges
Town Attorney
Town of Bluffton Organizational Chart

A7

Tel 912-232-0475 Fax 912-232-0478
6600 Abercorn Street, Suite 200 | Savannah, GA 31405 | P.O. Box 16149 | Savannah, GA 31416 | krtcpa.com
B - 1
INDEPENDENT AUDITORS’ REPORT
To the Mayor and Members of the Town Council Town of Bluffton, South Carolina
Report on the Financial Statements We have audited the accompanying financial statements of the governmental activities, each major fund, the discretely presented component units and the aggregate remaining fund information of the Town of Bluffton, South Carolina (Town) as of and for the year ended June 30, 2017, and the related notes to the financial statements, which collectively comprise the Town’s basic financial statements as listed in the table of contents.
Management’s Responsibility for the Financial Statements Management is responsible for the preparation and fair presentation of these financial statements in accordance with accounting principles generally accepted in the United States of America; this includes the design, implementation, and maintenance of internal control relevant to the preparation and fair presentation of financial statements that are free from material misstatement, whether due to fraud or error.
Auditor’s Responsibility Our responsibility is to express opinions on these financial statements based on our audit. We conducted our audit in accordance with auditing standards generally accepted in the United States of America and the standards applicable to financial audits contained in Government Auditing Standards, issued by the Comptroller General of the United States. Those standards require that we plan and perform the audit to obtain reasonable assurance about whether the financial statements are free from material misstatement.
An audit involves performing procedures to obtain audit evidence about the amounts and disclosures in the financial statements. The procedures selected depend on the auditor’s judgment, including the assessment of the risks of material misstatement of the financial statements, whether due to fraud or error. In making those risk assessments, the auditor considers internal control relevant to the entity’s preparation and fair presentation of the financial statements in order to design audit procedures that are appropriate in the circumstances, but not for the purpose of expressing an opinion on the effectiveness of the entity’s internal control. Accordingly, we express no such opinion. An audit also includes evaluating the appropriateness of accounting policies used and the reasonableness of significant accounting estimates made by management, as well as evaluating the overall presentation of the financial statements.
We believe that the audit evidence we have obtained is sufficient and appropriate to provide a basis for our audit opinions.
Opinions In our opinion, the financial statements referred to above present fairly, in all material respects, the respective financial position of the governmental activities, each major fund, the discretely presented component units and the aggregate remaining fund information of the Town, as of June 30, 2017, and the respective changes in financial position and the budgetary comparison statements for the year then ended in accordance with accounting principles generally accepted in the United States of America.

B - 2
Other Matters Required Supplementary Information Accounting principles generally accepted in the United States of America require that the management’s discussion and analysis information on pages C1 – C10 and the required supplementary information other than management’s discussion and analysis beginning on page E1 are presented to supplement the basic financial statements. Such information, although not a part of the basic financial statements, is required by the Governmental Accounting Standards Board, who considers it to be an essential part of financial reporting for placing the basic financial statements in an appropriate operational, economic, or historical context. We have applied certain limited procedures to the required supplementary information in accordance with auditing standards generally accepted in the United States of America, which consisted of inquiries of management about the methods of preparing the information and comparing the information for consistency with management’s responses to our inquiries, the basic financial statements, and other knowledge we obtained during our audit of the basic financial statements. We do not express an opinion or provide any assurance on the information because the limited procedures do not provide us with sufficient evidence to express an opinion or provide any assurance.
Other Information Our audit was conducted for the purpose of forming opinions on the financial statements that collectively comprise the Town’s basic financial statements. The introductory section, individual and combining fund financial statements and schedules, statistical section and supplementary section, are presented for purposes of additional analysis and are not a required part of the basic financial statements.
The individual and combining fund financial statements and schedules and supplementary section are the responsibility of management and were derived from and relate directly to the underlying accounting and other records used to prepare the basic financial statements. Such information has been subjected to the auditing procedures applied in the audit of the basic financial statements and certain additional procedures, including comparing and reconciling such information directly to the underlying accounting and other records used to prepare the basic financial statements or to the basic financial statements themselves, and other additional procedures in accordance with auditing standards generally accepted in the United States of America. In our opinion, the individual and combining fund financial statements and schedules and supplementary section as listed in the table of contents are fairly stated in all material respects in relation to the basic financial statements as a whole.
The introductory and statistical sections have not been subjected to the auditing procedures applied in the audit of the basic financial statements and, accordingly, we do not express an opinion or provide any assurance on them.
Other Reporting Required by Government Auditing Standards In accordance with Government Auditing Standards, we have also issued our report dated December 22, 2017, on our consideration of the Town’s internal control over financial reporting and on our tests of its compliance with certain provisions of laws, regulations, contracts, and grant agreements and other matters. The purpose of that report is to describe the scope of our testing of internal control over financial reporting and compliance and the results of that testing, and not to provide an opinion on internal control over financial reporting or on compliance. That report is an integral part of an audit performed in accordance with Government Auditing Standards in considering the Town’s internal control over financial reporting and compliance.
KRT, CPAs P.C.
Savannah, Georgia December 22, 2017

Town of Bluffton Management’s Discussion and Analysis
June 30, 2017
C1
As management of the Town of Bluffton (the “Town”), we offer readers of the Town’s financial statements this narrative overview and analysis of the financial activities of the Town for the fiscal year ended June 30, 2017. We encourage readers to read the information presented here in conjunction with additional information we have furnished in our letter of transmittal, which can be found on pages A-1 through A-4 of this report.
Financial Highlights The assets of the Town exceeded its liabilities at the close of the fiscal year by $28,232,416 (net
position). Of this amount, $6,039,836 (unrestricted net position) may be used to meet the Town’s ongoing obligations to its citizens and vendors.
The Town’s total net position increased by $2,523,096 or 9.8% for Fiscal Year 2017.
As of the close of the current fiscal year, the Town’s governmental funds reported combined ending fund balances of $26,366,872, an increase of $1,197,191 in comparison with the prior year. Approximately 38% percent of this total amount, or $10,017,064, is available for spending at the government’s discretion (unassigned fund balance).
At the end of the current fiscal year, the unassigned fund balance for the General Fund was $10,017,064 or 65% percent of total General Fund expenditures for the fiscal year.
The Town’s total debt decreased by $1,033,759 (7%) during the current fiscal year. The Town had principal payments on outstanding debt of $1,358,759 and entered into a new lease agreement with Branch Banking and Trust Company (BB&T) for the purchase of four (4) 2017 Ford Police Interceptors, two (2) transit vans, two (2) tractors with movers, and one (1) trailer. The purchase price of the new vehicles and equipment was $325,000. In addition, the compensating absences liability increased by $84,458.
The Town of Bluffton’s bond rating at June 30, 2017 was Aa2 from Moody’s and an AA+ from Standard & Poor’s. Moody’s upgraded the Town to an Aa1 in October 2017. Both agencies stated the high ratings reflect the growth in the tax base and a healthy financial position supported by financial policies, professional management, and modest debt.
Overview of the Financial Statements
This discussion and analysis are intended to serve as an introduction to the Town’s basic financial statements. The Town’s basic financial statements consist of three components: 1) government-wide financial statements; 2) fund financial statements; and 3) notes to the financial statements. The basic financial statements present two different views of the Town through the use of government-wide statements and fund financial statements. In addition to the basic financial statements, this report contains other supplemental information that will enhance the reader’s understanding of the financial condition of the Town. Government-wide Financial Statements - The government-wide financial statements are designed to provide the reader with a broad overview of the Town’s finances, similar in format to the financial statements of a private-sector business. The government-wide statements provide short and long-term information about the town’s financial status as a whole.
The two government-wide statements report the Town’s net position and how they have changed. The net position is the difference between the Town’s total assets and total liabilities. Measuring net position is one way to gauge the Town’s financial condition.
The government-wide statements consist of governmental activities of the Town and its component units. The governmental activities include most of the Town’s basic services such as administrative, judicial, planning, public safety, public works, stormwater management and community development. Property taxes and charges for services finance most of these activities. Financial information for two non-major component units is reported separately from the primary government. The non-major component units are the Don Ryan Center for Innovation and The Bluffton Public Development Corporation.
The Government-wide Financial Statements can be found on pages D1 and D2 of this report.
Town of Bluffton Management’s Discussion and Analysis
June 30, 2017
C2
Fund Financial Statements - The fund financial statements provide a more detailed look at the Town’s most significant activities. A fund is a grouping of related accounts that is used to maintain control over resources that have been segregated for specific activities or objectives. The Town, like other state and local governments, uses fund accounting to ensure and demonstrate compliance with finance-related legal requirements, such as the General Statutes or the Town’s budget ordinance.
Governmental Funds – Governmental funds are used to account for essentially the same functions reported as governmental activities in the government-wide financial statements. These funds focus on how assets can readily be converted into cash flow in and out, and what monies are left at year- end that will be available for spending in the next year. Governmental funds are reported using an accounting method called modified accrual accounting, which provides a short-term spending focus. As a result, the governmental fund financial statements give the reader a detailed short-term view that helps determine if there are more or less financial resources available to finance the Town’s programs. The relationship between government activities (reported in the Statement of Net Position and the Statement of Activities) and governmental funds is described in a reconciliation that is part of the fund financial statements.
Information is presented separately in the Governmental Fund Balance Sheet and in the Governmental Fund Statement of Revenues, Expenditures, and Changes in Fund Balances for the General Fund, the Capital Improvements Program Fund, Debt Service Fund, Stormwater Fund and Hospitality Tax Fund all of which are considered to be major funds. Data from the other governmental funds are combined into a single, aggregated presentation. Individual fund data for each of these nonmajor governmental funds is provided in the form of combining statements elsewhere in this report.
The Town previously has adopted an annual budget for its General Fund, Capital Improvements Program Fund, Debt Service Fund and Stormwater Fund. The budget is a legally-adopted document that incorporates input from the citizens of the Town, the management of the Town, and the decisions of the Council about which services to provide and how to pay for them. It also authorizes the Town to obtain funds from identified sources to finance these current period activities. The budgetary statement provided for the General Fund and the schedules provided for the General Fund, Capital Improvements Program Fund, Debt Service Fund and Stormwater Fund demonstrates how well the Town complied with the budget ordinance and whether the Town succeeded in providing the services as planned when the budget was adopted. The budgetary comparison statement and schedules use the budgetary basis of accounting and are presented using the same format, language, and classifications as the Statement of Revenues, Expenditures and Changes in Fund Balances. The statement and schedules show four columns: 1) the original budget as adopted by the Council; 2) the final budget as amended by the Council; 3) the actual resources, charges to appropriations, and ending balances in the General Fund, Capital Improvements Program Fund, Debt Service Fund and Stormwater Fund; and 4) the difference or variance between the final budget and the actual resources and charges.
These basic fund financial statements and schedules can be found on pages D3 through D8 of this report.
Notes to the Financial Statements – The notes provide additional information that is essential to a full understanding of the data provided in the government-wide and fund financial statements. The Notes to the Financial Statements can be found on pages D9 through D32 of this report.
Other Supplemental information – In addition to the basic financial statements and accompanying notes, the report also presents certain supplementary information. The required supplementary information can be found on pages E1 and E2 of this report.
The combining statements referred to earlier in connection with nonmajor governmental funds are presented immediately following the required supplementary information related to pensions as other supplemental information. Community development grants for tourism are funded by State and Local Accommodations Taxes and are reviewed by the Town’s Accommodations Tax Advisory Committee.

Town of Bluffton Management’s Discussion and Analysis
June 30, 2017
C3
The committee’s recommendations are proposed to Town Council for final approval. Combining and individual fund statements and schedules can be found on pages F1 through F6 of this report.
Government-wide Financial Analysis The government-wide financial statements for the fiscal year ended June 30, 2017 are prepared using the financial statement-reporting model as mandated by the Governmental Accounting Standards Board (GASB).
Statement of Net PositionFigure 1
Governmental Activities2017 2016 % Change
Current and other assets 30,661,655$ 27,375,824$ 12%Capital assets, net 27,957,132 26,749,006 5%
Total assets 58,618,787 54,124,830 8%
3,795,063 1,828,200 108%Total assets and deferred outflows of resources 62,413,850$ 55,953,030$ 12%
Current and other liabilities 6,299,917$ 4,147,457$ 52%Long-term liability outstanding 13,205,695 14,224,896 (7%)Net pension liability 14,666,111 11,857,727 24%
Total liabilities 34,171,723 30,230,080 13%
9,711 13,630 (29%)Total liabilities and deferred inflows of resources 34,181,434 30,243,710 13%
Net position:Net investment in Capital Assets 13,698,001 11,494,116 19%Restricted 8,494,579 10,006,700 (15%)Unrestricted 6,039,836 4,208,504 44%
Total net position 28,232,416 25,709,320 10%
Total liabilities, deferred inflows of resources and net position 62,413,850$ 55,953,030$ 12%
Deferred outflows of resources related to pensions
Deferred inflows of resources related to pensions
As noted earlier, net position may serve over time as one useful indicator of a government’s financial condition. The assets of the Town exceeded liabilities by $28,232,416 as of June 30, 2017. The Town’s overall financial position improved and net position increased by $2,523,096 or 9.8% during Fiscal Year 2017.
The Town increased its current and other assets by $3,285,831 as a result of improved cash position and FY 2017 franchise fee receivables received in July 2017. The improved cash position is largely attributable to larger than expected revenues exceeding expenses. The 9.8% increase in the Town’s total net position is the result of a continued better than anticipated economic recovery for local businesses and residential development. The $2,152,460 net increase in current and other liabilities is related to the timing and management of outstanding payables to vendors and Beaufort County, the receipt of two separate $500,000 state appropriations in FY 2017 for capital project expenditures occurring in FY 18 and the increase in principal payments due in FY 2018 both for bonds and outstanding capital leases. The $1,091,201 net decrease in the Town’s long-term liabilities is related to the principal payments from the general obligation and revenue bonds due in Fiscal Year 2018 and the increases related to the new vehicle and equipment leases. The significant increase in the deferred outflows is due primarily to the change in Town’s proportionate share in the amount of $563,640 and $1,262,257 due to the difference between projected and actual earnings. GASBS 68 requires the collective deferred outflows and inflows arising from differences between projected and actual plan investment earnings in different measurement

Town of Bluffton Management’s Discussion and Analysis
June 30, 2017
C4
periods to be aggregated and included as a net collective deferred outflow or inflow. The Net Pension Liability increased primarily due to the overall increase in the plan’s pension liability calculation and the decrease in the plan’s net position. This resulted in an overall increase in the net pension liability for SCRS of 13% and for PORS of 14% when compared to the prior year. The Town’s restricted net position represents resources subject to external restrictions on how they may be used. The decrease from prior year is due to uses of these funds for tourism and capital improvement projects such as the May River Road Streetscape project and Land Acquisition for public parks and historic district parking. The remaining is a balance of $6,039,836 in unrestricted funds and may be used to meet the ongoing obligations to citizens and creditors.
The following table presents the Town’s changes in net position for the fiscal year ending June 30, 2017 and 2016.
Statement of Activities Figure 2
2017 2016 % ChangeRevenues:
Program revenues: Charges for services 10,428,372$ 9,918,443$ 5% Operating grants and contributions 691,119 480,525 44% Capital grants and contributions 2,579,042 2,614,001 (1%)General revenues: Property taxes 7,158,104 6,716,062 7% Accommodations taxes 963,688 586,612 64% Hospitality taxes 1,896,962 1,638,139 16% Interest 31,460 12,200 158% Unrestricted intergovernmental revenue 686,837 615,847 12% Miscellaneous 122,864 70,087 75% Gain (Loss ) on sale of assets - (171,500) (100%)
Total revenues 24,558,448 22,480,416 9%
Expenses:Administrative 4,858,208 4,210,681 15%Judicial 325,019 302,390 7%Planning 801,474 873,476 (8%)Building Safety 1,036,905 981,279 6%Police Department 6,720,715 5,691,428 18%Public Works 1,417,406 938,380 51%Stormwater Management 800,781 963,939 (17%)Project Management 1,170,935 921,486 27%Community Development 4,364,665 2,694,505 62%Interest on long-term debt 539,244 568,805 (5%) Total expenses 22,035,352 18,146,369 21%
Changes in Net Position 2,523,096 4,334,047 (42%)25,709,320 21,375,273 28,232,416$ 25,709,320$ 10%
Net position, July 1 Net position, June 30
Governmental Activities
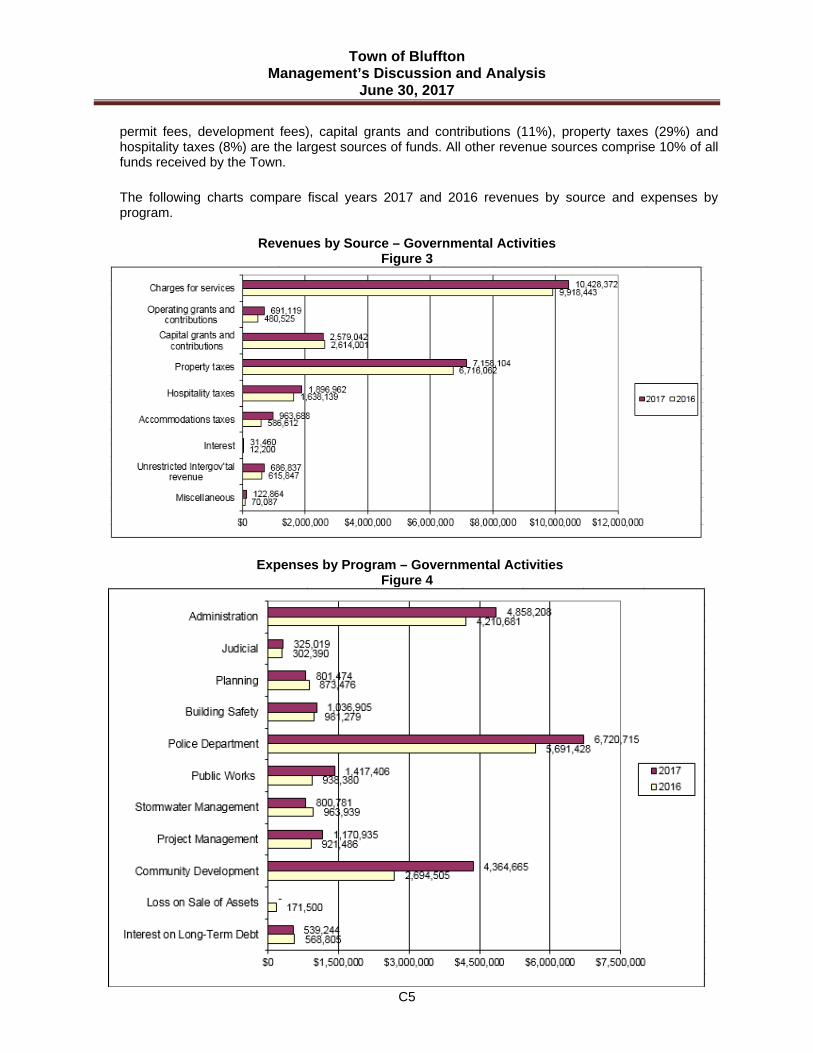
Governmental Activities - Governmental activities increased the Town’s net position by $2,523,096. This increase is attributable to better than expected revenue increases with the continued growth of Bluffton evident in the increase in property tax revenue in a year when the mill rate was lowered two mills, the town experienced 64% accommodation tax revenue growth with the expansion at Montage Palmetto Bluff and more tourists visiting our area as well as other related charges for service items. These factors combined with the Town’s efforts to control general fund spending resulted in a positive net position of over $2.5 million. Charges for services (42%) (e.g. business licenses, franchise fees,
Town of Bluffton Management’s Discussion and Analysis
June 30, 2017
C5
permit fees, development fees), capital grants and contributions (11%), property taxes (29%) and hospitality taxes (8%) are the largest sources of funds. All other revenue sources comprise 10% of all funds received by the Town.
The following charts compare fiscal years 2017 and 2016 revenues by source and expenses by program.
Revenues by Source – Governmental Activities
Figure 3
Expenses by Program – Governmental Activities Figure 4

Town of Bluffton Management’s Discussion and Analysis
June 30, 2017
C6
Major expenses for Fiscal Year 2017 were associated with the Police Department (30%), Administration (22%), Community Development (20%) and Public Works functions (6%). Administration expenses included costs for contracts to provide Town services, personnel costs and routine computer hardware and software costs. The Town incurred approximately $650,000 in emergency recovery costs related to Hurricane Matthew in FY 2017 across multiple departments including Police, Administration and Public Works. Community Development expenses increased due to major construction phase costs of infrastructure improvements to Buck Island-Simmonsville sewer projects and May River Road that will not be capitalized by the Town, but transferred to Beaufort Jasper Water and Sewer Authority and South Carolina Department of Transportation, respectively, upon their completion.
Transfers between the funds in Fiscal Year 2017 increased by $2,283,185 primarily due to the increase of transfers into the Capital Improvements Fund related to an increase in expenditures in 2017 from 2016. Transfers In occurred in the amount $3,570,340 to the Capital Improvements Program Fund from other funds and were used to fund portions of the Fund’s budgeted projects in Fiscal Year 2017. Transfers In to the General Fund remained consistent with prior year only increasing by $32,063. Major Transfers In to the General Fund for Fiscal Year 2017 were $500,000 from the Hospitality Tax Fund to support tourism projects and related support personnel.
Financial Analysis of the Town’s Funds
As noted earlier, the Town uses fund accounting to ensure and demonstrate compliance with finance-related legal requirements.
Governmental Funds - The focus of the Town’s governmental funds is to provide information on near-term inflows, outflows, and balances of usable resources. Such information is useful in assessing the Town’s financing requirements. Specifically, unassigned fund balance can be a useful measure of a government’s net resources available for spending at the end of the fiscal year.
At the end of the current fiscal year, the Town’s governmental funds reported combined ending fund balances of $26,366,872, an increase of $1,197,191 in comparison with the prior fiscal year. Approximately 38% of total fund balance, or $10,017,064, constitutes unassigned fund balance which is available for spending at the government’s discretion. The remainders of fund balance ($16,349,808) are designated to indicate that they are not available for new spending because they have already been designated as nonspendable ($253,037), restricted ($8,494,579), committed ($6,001,734) or assigned ($1,600,458). Significant amounts of restricted balances are due to external designations for debt service, tourism and related support programs as well as Stormwater Improvements Projects. Significant amounts of committed balances are due to Town Council’s designations for the Emergency Recovery Fund. Finally, amounts of assigned balances are due to the Town Manager and Directors designations for capital improvement purposes.
The General Fund is the chief operating fund of the Town. Total fund balance of the Town’s General Fund increased by $1,295,127 during Fiscal Year 2017. The majority of the increase was due to increased revenue as a factor of town growth, the positive economic recovery of local businesses and residential developers.
General Fund revenues (excluding transfers in and other financing sources) for Fiscal Year 2017 were $16,220,506, an increase of $1,324,605 or 8.9% from the previous year. Licenses and Permits totaled $8,387,262, an increase of $432,709 over the prior year. Franchise Fees and MASC Insurance Tax collections represent the largest increase for revenues within the Licenses and Permits category while the Business License and Permit Fee Revenue remains consistent for combined revenue of over $4 million. Property tax revenues for the General Fund totaled $5,170,871, an increase of $368,769 or 7.7% when compared to the prior year. This increase is the result of continued growth in the residential and commercial building markets adding additional taxpayers to the tax rolls.
General Fund expenditures totaled $15,489,889, a spending increase of $1,986,807 from the prior year or 14.7%. This increase can be attributed to the costs incurred with Hurricane Matthew, new

Town of Bluffton Management’s Discussion and Analysis
June 30, 2017
C7
equipment and vehicle costs, new employees hired within the Police and other functions, and town-wide contract services. At the end of the fiscal year, the unassigned fund balance of the General Fund was $10,017,064, while the total fund balance was $15,124,449. As a measure of the General Fund’s liquidity, it may be useful to compare both unassigned fund balance and total fund balance to total fund expenditures. Unassigned fund balance represents 65% of the total General Fund expenditures, while total fund balance represents 98% of that same amount.
The Capital Improvements Program (CIP) Fund’s fund balance decreased $239,683 during Fiscal Year 2017. The decrease is due to the use of prior year fund balance revenue sources to fund current year project expenditures, for instance Municipal Improvement Development fees and Alcohol Tax for infrastructure projects.
At the end of the fiscal year, the Debt Service Fund’s fund balance was $1,908,340 an increase of $250,559 from prior year attributable to the continued residential and commercial growth in the TIF District.
The Stormwater Utility Fund’s fund balance decreased $71,894 during Fiscal Year 2017. The 3% decrease is reflective of the use of these funds for the Watershed Management Division’s operating costs, three sewer projects and the drainage and stormwater work on the May River Streetscape project in FY 2017.
The Hospitality Tax Fund’s fund balance decreased $450,034 or 14% during Fiscal Year 2017. This decrease is due to budgeted tourism capital improvement projects spending in Fiscal Year 2017.
General Fund Budgetary Highlights During the fiscal year, the Town revised the budget on several occasions. Generally, budget amendments fall into one of four categories: 1) amendments made to adjust the estimates used to prepare the original budget ordinance once exact information is available; 2) amendments made to recognize new funding amounts from external sources, such as Federal and State grants; 3) amendments to provide budget appropriations for legal encumbrances; and 4) other increases or decreases in appropriations that become necessary throughout the year.
The General Fund Budget expenditure changes were $631,042 starting at $16,058,885 and ending at $16,689,927.
Actual revenues for the General Fund were $1,844,986 more than the original adopted budget and $1,722,766 more than the revised budget. Licenses and Permits exceeded budget by 11.6% or $873,457. Service Revenues exceeded budget by $249,029 or 27%, with Development Fees being the primary contributor. The Town saw a better than expected increase in residential building permits and their related fees as town growth continues it will continue to affect both of these revenue classes.
Actual expenditures for the General Fund were $1,200,038 below revised budget. The favorable variance was due to delays in hiring open positions and grant expenditure delays until 2018.
The General Fund continues to receive budgeted transfers from special revenue funds to support tourism projects and related support personnel. Net Transfers In (Out) decreased by $320,197 in Fiscal Year 2017 due to general fund transfers out in support of capital projects. Delays in these projects resulted in the delay in the majority of these budgeted transfers out expected within the FY 2017 budget and are now expected to occur in FY 2018 and 2019.
Capital Assets and Debt Administration Capital Assets - The Town’s investment in capital assets for its governmental activities as of June 30, 2017, totals $27,957,132 (net of accumulated depreciation). These assets include land, building and improvements, drainage, roads, sidewalks and trails, land improvements, machinery and equipment, and vehicles. The total increase in the Town’s investment in capital assets for the current

Town of Bluffton Management’s Discussion and Analysis
June 30, 2017
C8
fiscal year was 4.5% attributable to the land acquisition of the two separate parcels and vehicle and equipment purchases less accumulated depreciation expenses of $974,316.
Capital asset transactions during the year included the lease purchase of four (4) new 2017 Ford Police Interceptors, two (2) transit vans, service trucks, machinery and equipment for town-wide maintenance of assets, stormwater improvements at Pine Ridge, as well as the purchase of 68 Boundary Street and 111 Calhoun Street parcels for additional parking and open space in the Historic District.
Town of Bluffton’s Capital Assets Figure 5
Governmental Activities 2017 Land $ 15,321,677 Building and improvements 5,633,132 Drainage 375,685 Roads 2,255,505 Sidewalks and Trails 1,410,480 Land Improvements 956,109 Machinery and equipment 546,875 Vehicles 794,635 Construction in progress 663,034
Total $ 27,957,132
Additional information on the Town’s capital assets can be found in Note 5 to the financial statements.
Long-term Debt - At the end of the current fiscal year, the Town has total debt outstanding of $14,259,131. Of this amount, $5.650 million of General Obligation Debt is secured by the full faith and credit of the Town. Tax Increment Financing District bonded debt funded from incremental tax revenue represents $7,483,156. The Town entered into a new capital lease purchase in September of 2016 with Branch Bank and Trust (BB&T) for the purchase of four (4) 2017 Ford police interceptors, two (2) transit vans, two (2) tractors with mowers, and one (1) trailer in the amount of $325,000.
Town of Bluffton’s Outstanding Debt
Figure 6 Governmental Activities
2017 General Obligation Bonds $ 5,650,000 Refunded TIF Bonds 7,483,156 Capital Lease 1,125,975 Total $ 14,259,131
The Town’s debt decreased $1,033,759 during the current fiscal year excluding compensated absences. This was related to bond principal payments and capital lease payment schedules as well as the additions mentioned above. State statutes limit the amount of general obligation debt a governmental entity may issue, without a referendum, to 8% of its total assessed valuation of all taxable real estate and personal property within the Town limits. The current debt limitation for the Town is $13,507,717 of which $7,857,717 is remaining for additional general obligation issues. At June 30, 2017, only $5.650 million of the Town’s debt applies to this limitation.

Town of Bluffton Management’s Discussion and Analysis
June 30, 2017
C9
The Town maintained a bond rating of Aa2 from Moody’s Investor Service at June 30, 2017 and received an upgrade to AA+ from Standard and Poor’s Corporation in June 2014. Moody’s upgraded the Town to a Aa1 in October of 2017. Both agencies have stated the high ratings reflect the growth in the tax base in recent years and a healthy financial position supported by fiscal policies, professional management and modest debt.
Additional information on the Town of Bluffton’s long-term debt can be found in Note 7 to the financial statements.
Economic Factors and Next Year’s Budgets and Rates The following key economic indicators reflect the growth and prosperity of the Town:
Located in the heart of the Lowcounty, the Town tourism numbers are rising in Bluffton as in the neighboring communities of Hilton Head Island and Savannah, Georgia. Located on the banks of the pristine May River, Bluffton is home to the 20,660 acre Palmetto Bluff, an upscale award winning resort and residential development.
The number of residential building permits increased this year 5% over the prior fiscal year. New single family housing starts are estimated at $301 million for FY 2017. The number of Business Licenses issued grew by 10% to over 3000 in FY 2017 with nearly 1400 located in Town. These upswings are expected to continue into 2018.
The Town is entering the seventh year of a non-profit public/private economic development venture to operate a technology business incubator in the Town of Bluffton. The Don Ryan Center for Innovation (DRCI) was created as a storefront technology incubator within the Town’s Technology Park located at Buckwalter Place. Bluffton was the first of five such projects established in the state with Clemson University to commercialize technology and create new businesses. In 2019 the DRCI will move from its temporary location to a permanent home at Buckwalter Place within the new Southeastern Development Associates Commercial Project.
The unemployment rate for Beaufort County is 4.6% and below the State’s rate of 6.0% at June 30, 2017. Currently, no data is available specifically for the Town of Bluffton.
The Fiscal Year 2018 General Fund budget is balanced at $19,937,075, up 6.62% from Fiscal Year 2017’s original budget. This increase is attributable to the hiring of two new full-time employees, the addition of the USCB ambassador program and additions necessary for town growth to the contracted services for residential garbage service for citizens. The additional cost for personnel falls within the project management and public works divisions including the related equipment and training expenses for each.
The Fiscal Year 2018 Consolidated Municipal Budget was developed by our elected officials and town staff working together for the betterment of the community in delivering a balanced budget. The FY 2018 budget includes a reduction in our tax rate by two mills from 42.35 to 40.35. The General Fund will receive 37 mills and the Debt Service Fund will receive 3.35 mills.
The Capital Improvements Program Fund appropriation for Fiscal Year 2018 is $12,991,240. The majority of these expenditures are for road, infrastructure, and streetscape improvements (approximately $5 million), sewer improvements which support the improved water quality initiatives in the Buck Island/Simmonsville area and Jason-Able Street (approx. $2 million), Town Facility Improvements (approx. $3.8 million) and Park Development and Land Acquisition.
The Debt Service Fund provides for the payment of bond principal and interest payments totaling $1,474,356 for Fiscal Year 2018. This includes principal and interest payments for the Refunded TIF Bonds issued in 2014, as well as for General Obligation Bonds, Series 2010A. A transfer of $801,666 to the Capital Improvements Fund providing for Roadway improvements allowable within the Bond Ordinance is also planned.
The Stormwater Fund appropriation for Fiscal Year 2018 is $1,554,931. Operational expenditures total $930,481 and a transfer of $554,450 to the Capital Improvements Fund provides for sewer and watershed projects and a $70,000 transfer to the General Fund provides for the public works stormwater maintenance program and the stormwater management plan.

Town of Bluffton Management’s Discussion and Analysis
June 30, 2017
C10
Requests for Information
This report is designed to provide an overview of the Town’s finances. Questions concerning any of the information found in this report or requests for additional information should be directed to the Director of Finance & Administration, Town of Bluffton, 20 Bridge Street, (PO Box 386), Bluffton, South Carolina 29910.
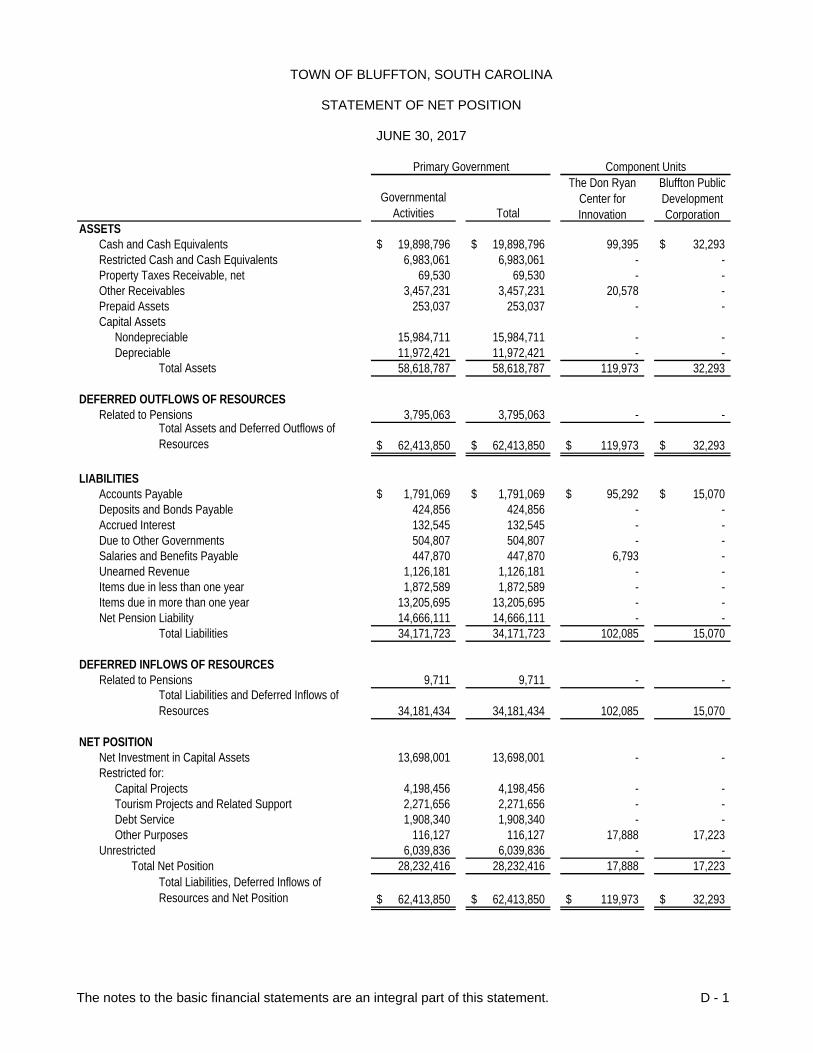
TOWN OF BLUFFTON, SOUTH CAROLINA
STATEMENT OF NET POSITION
JUNE 30, 2017
The notes to the basic financial statements are an integral part of this statement. D - 1
Governmental Activities Total
ASSETS Cash and Cash Equivalents 19,898,796$ 19,898,796$ 99,395 32,293$ Restricted Cash and Cash Equivalents 6,983,061 6,983,061 - - Property Taxes Receivable, net 69,530 69,530 - - Other Receivables 3,457,231 3,457,231 20,578 - Prepaid Assets 253,037 253,037 - - Capital Assets
Nondepreciable 15,984,711 15,984,711 - - Depreciable 11,972,421 11,972,421 - -
Total Assets 58,618,787 58,618,787 119,973 32,293
DEFERRED OUTFLOWS OF RESOURCESRelated to Pensions 3,795,063 3,795,063 - -
Total Assets and Deferred Outflows of Resources 62,413,850$ 62,413,850$ 119,973$ 32,293$
LIABILITIESAccounts Payable 1,791,069$ 1,791,069$ 95,292$ 15,070$ Deposits and Bonds Payable 424,856 424,856 - - Accrued Interest 132,545 132,545 - - Due to Other Governments 504,807 504,807 - - Salaries and Benefits Payable 447,870 447,870 6,793 - Unearned Revenue 1,126,181 1,126,181 - - Items due in less than one year 1,872,589 1,872,589 - - Items due in more than one year 13,205,695 13,205,695 - - Net Pension Liability 14,666,111 14,666,111 - -
Total Liabilities 34,171,723 34,171,723 102,085 15,070
DEFERRED INFLOWS OF RESOURCESRelated to Pensions 9,711 9,711 - -
Total Liabilities and Deferred Inflows of Resources 34,181,434 34,181,434 102,085 15,070
NET POSITIONNet Investment in Capital Assets 13,698,001 13,698,001 - - Restricted for:
Capital Projects 4,198,456 4,198,456 - - Tourism Projects and Related Support 2,271,656 2,271,656 - - Debt Service 1,908,340 1,908,340 - - Other Purposes 116,127 116,127 17,888 17,223
Unrestricted 6,039,836 6,039,836 - - Total Net Position 28,232,416 28,232,416 17,888 17,223
Total Liabilities, Deferred Inflows of Resources and Net Position 62,413,850$ 62,413,850$ 119,973$ 32,293$
The Don Ryan Center for Innovation
Bluffton Public Development Corporation
Primary Government Component Units

TOWN OF BLUFFTON, SOUTH CAROLINA
STATEMENT OF ACTIVITIES
FOR THE YEAR ENDED JUNE 30, 2017
The notes to the basic financial statements are an integral part of this statement. D - 2
ExpensesCharges for
Services
Operating Grants and
Contributions
Capital Grants and
ContributionsGovernmental
Activities Total
Don Ryan Center for Innovation
Bluffton Public Development Corporation
Primary GovernmentGovernmental Activities
General GovernmentAdministration 4,858,208$ 6,127,510$ 97,489$ -$ 1,366,791$ 1,366,791$ -$ -$ Judicial 325,019 320,564 - - (4,455) (4,455) - -
801,474 1,324,816 - - 523,342 523,342 - - Public Safety
Building Safety 1,036,905 2,063,472 - - 1,026,567 1,026,567 - - Police Department 6,720,715 70,910 593,630 - (6,056,175) (6,056,175) - -
Public Works 1,417,406 - - - (1,417,406) (1,417,406) - - Stormwater Management 800,781 - - 1,431,276 630,495 630,495 - - Project Management 1,170,935 - - 1,147,766 (23,169) (23,169) - - Community Development 4,364,665 521,100 - - (3,843,565) (3,843,565) - - Interest on long-term debt 539,244 - - - (539,244) (539,244) - -
Total governmental activities 22,035,352 10,428,372 691,119 2,579,042 (8,336,819) (8,336,819) - -
Total Primary Government 22,035,352$ 10,428,372$ 691,119$ 2,579,042$ (8,336,819) (8,336,819) - -
Component Units:Don Ryan Center for Innovation 321,288$ 20,196$ 281,354$ -$ (19,738) -
11,901 - 10,180 - - (1,721) Total Component Units 333,189$ 20,196$ 291,534$ -$ (19,738) (1,721)
General Revenues:Property Taxes 7,158,104 7,158,104 - - Accommodations Taxes 963,688 963,688 - - Hospitality Taxes 1,896,962 1,896,962 - - Interest Income 31,460 31,460 121 - Unrestricted Revenue 686,837 686,837 - - Miscellaneous 122,864 122,864 - - Total general revenues and capital contributions 10,859,915 10,859,915 121 - Change in Net Position 2,523,096 2,523,096 (19,617) (1,721)
Net Position - Beginning 25,709,320 25,709,320 37,505 18,944Net Position - Ending 28,232,416$ 28,232,416$ 17,888$ 17,223$
Bluffton Public Development Corporation
Primary GovernmentProgram Revenues
Function / Programs
Planning
Component UnitsNet (Expenses) Revenue and Changes in Net Position

TOWN OF BLUFFTON, SOUTH CAROLINA
BALANCE SHEET GOVERNMENTAL FUNDS
JUNE 30, 2017
The notes to the basic financial statements are an integral part of this statement. D - 3
General Fund
Capital Improvements Program Fund
Debt Service Fund
Stormwater Fund
Hospitality Tax Fund
Other Governmental
Funds
Total Governmental
FundsAssets
Cash and Cash Equivalents 14,075,429$ 2,835,097$ -$ -$ 2,502,749$ 485,521$ 19,898,796$ Restricted Cash and Cash Equivalents 624,615 1,746,597 1,910,189 2,611,266 - 90,394 6,983,061 Property taxes receivable, net 51,864 - 17,666 - - - 69,530 Other Receivables 2,321,597 121,826 34,363 33,183 532,146 414,116 3,457,231 Prepaid Assets 253,037 - - - - - 253,037 Due from other Funds 43,041 932,297 21,284 2,021 123,446 4,130 1,126,219
Total Assets 17,369,583$ 5,635,817$ 1,983,502$ 2,646,470$ 3,158,341$ 994,161$ 31,787,874$
LiabilitiesAccounts Payable 628,098$ 1,001,052$ -$ 29,442$ 10,694$ 140,956$ 1,810,242$ Deposits and Bonds Payable 405,683 - - - - - 405,683 Due to other Funds 267,954 19,116 75,162 371,099 289,222 103,666 1,126,219 Due to Other Governments 504,807 - - - - - 504,807 Salaries and Benefits Payable 437,342 - - 10,528 - - 447,870 Unearned Revenue 1,250 1,060,268 - 64,663 - - 1,126,181
Total Liabilities 2,245,134 2,080,436 75,162 475,732 299,916 244,622 5,421,002
Fund BalancesNonspendable 253,037 - - - - - 253,037 Restricted 624,615 1,954,923 1,908,340 1,730,738 1,526,424 749,539 8,494,579 Committed 4,229,733 - - 440,000 1,332,001 - 6,001,734 Assigned - 1,600,458 - - - - 1,600,458 Unassigned 10,017,064 - - - - - 10,017,064
Total Fund Balances 15,124,449 3,555,381 1,908,340 2,170,738 2,858,425 749,539 26,366,872
17,369,583$ 5,635,817$ 1,983,502$ 2,646,470$ 3,158,341$ 994,161$ 31,787,874$ Total Liabilities and Fund Balances
TOWN OF BLUFFTON, SOUTH CAROLINA
RECONCILIATION OF TOTAL GOVERNMENTAL FUND BALANCES TO NET POSITION OF GOVERNMENTAL ACTIVITIES
JUNE 30, 2017
The notes to the basic financial statements are an integral part of this statement. D - 4
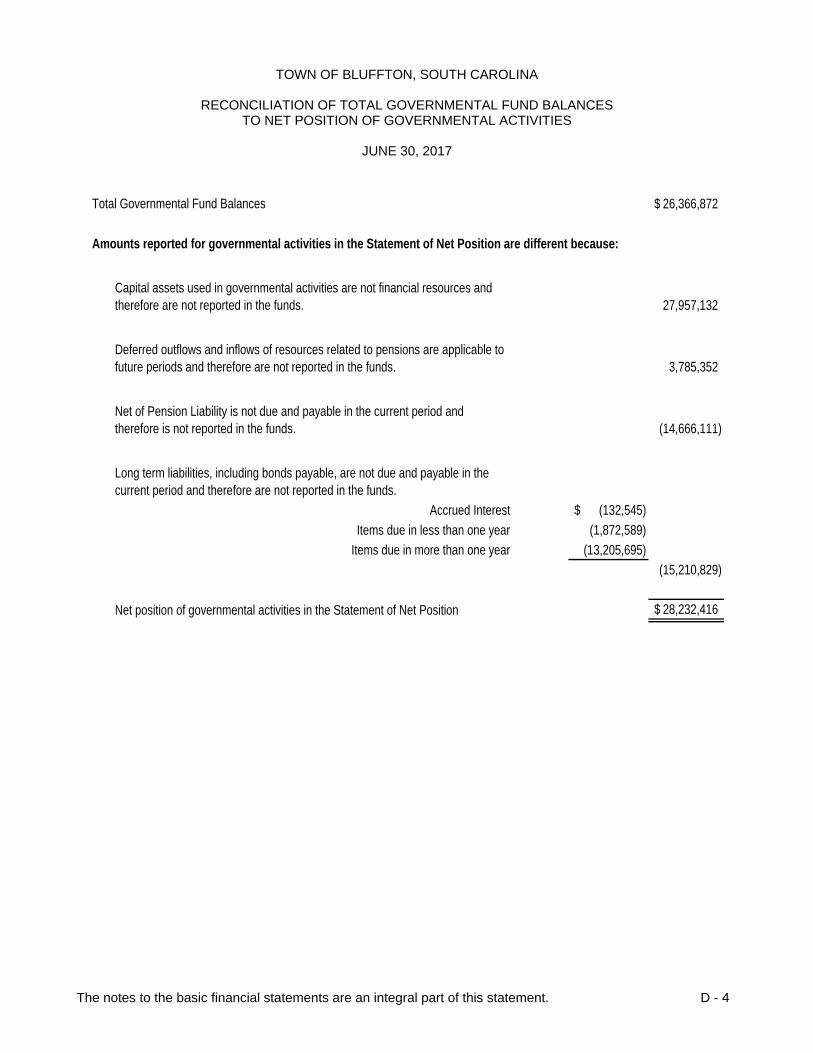
Total Governmental Fund Balances 26,366,872$
Amounts reported for governmental activities in the Statement of Net Position are different because:
27,957,132
3,785,352
(14,666,111)
Accrued Interest (132,545)$
Items due in less than one year (1,872,589)
Items due in more than one year (13,205,695)
(15,210,829)
Net position of governmental activities in the Statement of Net Position 28,232,416$
Capital assets used in governmental activities are not financial resources and therefore are not reported in the funds.
Long term liabilities, including bonds payable, are not due and payable in the current period and therefore are not reported in the funds.
Net of Pension Liability is not due and payable in the current period and therefore is not reported in the funds.
Deferred outflows and inflows of resources related to pensions are applicable to future periods and therefore are not reported in the funds.

TOWN OF BLUFFTON, SOUTH CAROLINA
STATEMENT OF REVENUES, EXPENDITURES AND CHANGES IN FUND BALANCES GOVERNMENTAL FUNDS
FOR THE YEAR ENDED JUNE 30, 2017
The notes to the basic financial statements are an integral part of this statement. D - 5
General Fund
Capital Improvements Program Fund
Debt Service Fund
Stormwater Fund
Hospitality Tax Fund
Other Governmental
Funds
Total Governmental
FundsREVENUES
Property Taxes 5,170,871$ -$ $1,987,233 -$ -$ -$ 7,158,104$ Hospitality and Accommodations Taxes - - - - 1,896,962 963,688 2,860,650 Licenses & Permits 8,387,262 521,067 188,919 - - - 9,097,248 Stormwater Utility Fees - - - 1,276,931 - - 1,276,931 Grants and Entitlements 274,605 1,071,010 - 145,545 - 6,697 1,497,857 Intergovernmental 692,467 175,306 102,898 - - - 970,671 Service Revenues 1,176,529 - - - - 22,950 1,199,479 Fees and Fines 320,564 - - - - - 320,564 Interest Income 21,748 7,473 721 - 1,331 187 31,460 Miscellaneous 176,460 10,000 - - - - 186,460
Total Revenues 16,220,506 1,784,856 2,279,771 1,422,476 1,898,293 993,522 24,599,424
EXPENDITURESCurrent
Legislative 147,754 - - - - - 147,754 Economic Development 207,858 - - - - - 207,858 Executive 805,686 - - - - - 805,686 Human Resources 285,411 - - - - - 285,411 Non-Departmental 1,442,473 - - - - - 1,442,473Finance 714,980 - - - - - 714,980 Municipal Court 253,192 - - - - - 253,192 Municipal Judges 52,188 - - - - - 52,188 Information Technology 1,001,627 - - - - - 1,001,627Facilities and Asset Management 1,302,326 - - - - - 1,302,326Stormwater Management - - - 724,005 - - 724,005 Project Management 762,967 - - - - - 762,967 Growth Management 305,618 - - - - - 305,618 Planning and Environmental Sustainability 726,953 - - - - 726,953 Building Safety 662,922 - - - - - 662,922 Police 6,028,589 - - - - 3,023 6,031,612 Community Development - - - - - 346,394 346,394
Debt ServicePrincipal 366,550 - 954,209 - - - 1,320,759Interest & Other Charges 21,889 - 518,085 - - - 539,974
Capital Outlay 400,906 6,183,533 - 96,749 - - 6,681,188Total Expenditures 15,489,889 6,183,533 1,472,294 820,754 - 349,417 24,315,887
Excess (Deficiency) of RevenuesOver Expenditures 730,617 (4,398,677) 807,477 601,722 1,898,293 644,105 283,537
OTHER FINANCING SOURCES (USES)Transfers In 591,770 3,570,340 - - - 19,395 4,181,505
Transfers Out (352,260) - (556,918) (673,616) (2,348,327) (250,384) (4,181,505)
Sale of Assets - 588,654 - - - - 588,654 Capital Leases 325,000 - - - - - 325,000
Total Other Financing Sources and Uses 564,510 4,158,994 (556,918) (673,616) (2,348,327) (230,989) 913,654 Net Change in Fund Balance 1,295,127 (239,683) 250,559 (71,894) (450,034) 413,116 1,197,191
Fund Balance - Beginning 13,829,322 3,795,064 1,657,781 2,242,632 3,308,459 336,423 25,169,681Fund Balance - Ending 15,124,449$ 3,555,381$ 1,908,340$ 2,170,738$ 2,858,425$ 749,539$ 26,366,872$

TOWN OF BLUFFTON, SOUTH CAROLINA
RECONCILIATION OF THE STATEMENT OF REVENUES, EXPENDITURES, AND CHANGES IN FUND BALANCES OF
GOVERNMENTAL FUNDS TO THE STATEMENT OF ACTIVITIES
FOR THE YEAR ENDED JUNE 30, 2017
The notes to the basic financial statements are an integral part of this statement. D - 6
Net change in fund balances - total governmental funds 1,197,191$
Amounts reported for governmental activities in the statement of activities are different because:
Capital Outlay Expenditures related to Capital Asset Additions 2,823,385 Less: Depreciation Expense (974,316)
1,849,069
(640,942)
(837,602)
1,033,759
(78,379)
2,523,096$ Change in net position of governmental activities
In the statement of activities, pension expense represents the change in net pension liability from the beginning of the year to the end of the year. In the governmental funds however, pension expense is measured by the amount of financial resources used (amount actually paid). This is the amount by which pension contributions paid in the current period exceeded the change in net pension liability.
Governmental funds report capital outlays as expenditures. However, in the statement of activities the cost of those assets is allocated over their estimated useful lives and reported as depreciation expense. This is the amount by which depreciation exceeded capital outlay in the current period.
The net effect of various miscellaneous transactions involving capital assets (i.e. sales, trade-ins, and donations) is to decrease net position.
The issuance of long-term debt (e.g. bonds, leases ) provides current financial resources to governmental funds, while the repayment of principal of long-term debt consumes the financial resources of governmental funds, neither transaction, however, has any effect on net position. This amount is the net effect of these differences in the treatment of long-term debt and related accounts.
Some expenses in the statement of activities do not require the use of current financial resources and therefore are not reported as expenditures in governmental funds.

TOWN OF BLUFFTON, SOUTH CAROLINA
STATEMENT OF REVENUES, EXPENDITURES, AND CHANGES IN FUND BALANCES BUDGET AND ACTUAL – GENERAL FUND
FOR THE YEAR ENDED JUNE 30, 2017
The notes to the basic financial statements are an integral part of this statement. D - 7
Variance with
Original Final Actual AmountsFinal Budget Over/ (Under)
REVENUESProperty Taxes 4,777,000$ 4,777,000$ 5,170,871$ 393,871$ Licenses & Permits 7,474,410 7,513,805 8,387,262 873,457 Intergovernmental 820,850 923,675 967,072 43,397 Service Revenues 927,500 927,500 1,176,529 249,029 Fees and Fines 301,260 281,260 320,564 39,304 Miscellaneous 74,500 74,500 198,208 123,708
Total Revenues 14,375,520 14,497,740 16,220,506 1,722,766
EXPENDITURESLegislative 162,055 162,055 147,754 (14,301) Economic Development 233,725 378,243 207,858 (170,385) Executive 953,790 839,761 805,686 (34,075) Human Resources 305,045 321,849 285,411 (36,438) Non-Departmental 1,422,795 1,442,795 1,442,473 (322) Finance 865,200 774,959 714,980 (59,979) Municipal Court 256,970 262,470 253,192 (9,278) Municipal Judges 56,085 60,385 52,188 (8,197) Information Technology 1,054,745 1,144,528 1,117,848 (26,680) Facilities and Asset Management 1,227,270 1,482,058 1,396,244 (85,814) Project Management 903,900 903,997 762,967 (141,030) Growth Management 351,950 321,933 305,618 (16,315) Planning and Environmental Sustainability 1,095,315 1,018,145 726,953 (291,192) Building Safety 707,825 755,928 685,215 (70,713) Police 6,109,555 6,468,161 6,197,063 (271,098) Debt Service Principal 334,432 334,432 366,550 32,118 Debt Service Interest 18,228 18,228 21,889 3,661
Total Expenditures 16,058,885 16,689,927 15,489,889 (1,200,038) Excess (Deficiency) of RevenuesOver Expenditures (1,683,365) (2,192,187) 730,617 2,922,804
OTHER FINANCING SOURCES (USES)Transfers In (Out) (1,957,385) (2,603,886) 239,510 2,843,396 Capital Leases 324,600 324,600 325,000 400
Total Other Financing Sources and Uses (1,632,785) (2,279,286) 564,510 2,843,796Net Change in Fund Balance (3,316,150) (4,471,473) 1,295,127 5,766,600
Fund Balance - Beginning 13,829,322 13,829,322 13,829,322 - Fund Balance - Ending 10,513,172$ 9,357,849$ 15,124,449$ 5,766,600$
Budgeted Amounts
TOWN OF BLUFFTON, SOUTH CAROLINA
STATEMENT OF REVENUES, EXPENSES AND CHANGES IN FUND BALANCES BUDGET AND ACTUAL – STORMWATER FUND
FOR THE YEAR ENDED JUNE 30, 2017
The notes to the basic financial statements are an integral part of this statement. D - 8
Original Final Actual Amounts
Variance with Final Budget Over/ (Under)
REVENUESLicenses & Permits 1,290,450$ 1,290,450$ 1,276,931$ (13,519)$ Intergovernmental - 28,464 145,545 117,081 Other Revenues 150 150 - (150)
Total Revenues 1,290,600 1,319,064 1,422,476 103,412
EXPENDITURESStormwater Management 750,695 850,656 820,754 (29,902)
Excess (Deficiency) of RevenuesOver Expenditures 539,905 468,408 601,722 133,314
OTHER FINANCING SOURCES (USES)Transfers In (Out) (2,150,800) (2,322,302) (673,616) 1,648,686
Net Change in Fund Balance (1,610,895) (1,853,894) (71,894) 1,782,000 Fund Balance - Beginning 2,242,632 2,242,632 2,242,632 - Fund Balance - Ending 631,737$ 388,738$ 2,170,738$ 1,782,000$
Budgeted Amounts

Town of Bluffton Notes to Financial Statements
June 30, 2017
D‐9
Note 1 – Summary of Significant Accounting Policies The basic financial statements of the Town have been prepared in conformity with accounting principles generally accepted in the United States of America, (“GAAP”), as applied to government units. The Governmental Accounting Standards Board (“GASB”) is the accepted standard-setting body for establishing governmental accounting and reporting principles. The more significant of the Town’s accounting policies are described in the paragraphs below. A. Reporting Entity The Town of Bluffton (the “Town”), a political subdivision of the State of South Carolina, was incorporated in 1852. The Town is a municipal corporation governed by an elected five member council. The Town operates under a Council-Manager form of government. The Town provides a range of services to its citizens including police protection, sanitation, public improvements, parks, recreation, cultural, economic development, planning, municipal court, permitting and general administration. As required by GAAP, the basic financial statements present the Town’s financial information with its component units. The primary criterion for determining inclusion or exclusion of a legally separate entity (component unit) is financial accountability which is presumed to exist if the Town both appoints a voting majority of the entity’s governing body, and either 1) the Town is able to impose its will on the entity or, 2) there is a potential for the entity to provide specific financial benefits to, or impose specific financial burdens on the Town. If either or both of the foregoing conditions are not met, the entity could still be considered a component unit if it is fiscally dependent on the Town. In order to be fiscally independent an entity must have the authority to do all of the following: (a) determine its budget without the Town having the authority to approve or modify the budget; (b) levy taxes or set rates or charges without approval by the Town; and (c) issue bonded debt without approval by the Town. Finally, an entity could be a component unit even if it met all the conditions for fiscal independence described above if excluding it would cause the Town’s basic financial statements to be misleading or incomplete. Blended component units, although legally separate entities, are in substance, part of the government’s operations and data from these units are combined with data of the primary government. Discretely presented component units, on the other hand are reported in separate column in the basic financial statements to emphasize they are legally separate from the Town. Based on the criteria above, the Town has two discretely presented component units as detailed below; the Town does not have any blended component units. Both discretely presented component units were deemed such because the Town appoints a voting majority of the component units’ governing boards and the Town can impose its will on the component units, however they are both legally separate. The Don Ryan Center for Innovation - The Bluffton Technology Incubator Corporation DBA The Don Ryan Center for Innovation (“DRCI”) was established in November of 2011 and was formed for charitable purposes including, but not limited to, the specific and primary purpose of providing small technology start up and development resulting in expanded employment, economic prosperity and business opportunities for businesses and residents of the Town of Bluffton. The Town shall have the right to vote on: the election and removal of directors of the seven members Board of Directors, the disposition of the corporation’s assets, and any election to dissolve the corporation. The DRCI shall submit an annual budget to the Town. The Town has hired and employs the Chief Executive Officer of the DRCI. The net position of the DRCI at June 30, 2017 was $17,888. Additional financial information can be obtained from the Don Ryan Center for Innovation at PO Box 2277, Bluffton, SC 29910. The Bluffton Public Development Corporation - The Bluffton Public Development Corporation (“BPDC”) was established in September of 2012 and was formed for charitable purposes including, but not limited to engaging in the economic development of the Town of Bluffton. The Town shall have the right to vote on: the election and removal of directors of the ten member Board of Directors, the disposition of the corporation’s assets, and any election to dissolve the corporation. The BPDC shall submit an annual budget to the Town. The Town’s Assistant Town Manager is the Executive Director of the BPDC. The net position of the BPDC at June 30, 2017 was $17,223. Additional financial information can be obtained from the Town of Bluffton, PO Box 386, Bluffton, SC 29910.

Town of Bluffton Notes to Financial Statements
June 30, 2017
D‐10
Note 1 – Summary of Significant Accounting Policies (continued)
B. Basis of Presentation – Basis of AccountingGovernment-wide Statements – The government-wide financial statements include the statement ofnet position and the statement of activities. These statements include the financial activities of theoverall government. Governmental activities generally are financed through taxes, intergovernmentalrevenues, and other non-exchange transactions. These statements report financial information aboutthe primary government (the Town) and its legally separate component units for which the primarygovernment is financially accountable. While activities of discretely presented component units arereported in the Town’s government-wide financial statements, separate columns are utilized so that theactivities of these component units can be viewed independently from those of the primary government.
The statement of activities presents a comparison between each function of the Town’s governmental activities. Direct expenses are those that are specifically associated with a program or function and, therefore, are clearly identifiable to a particular function. Indirect expense allocations that have been made in the funds have been reversed for the statement of activities. Program revenues include (a) fees and charges paid by the recipients of goods and services offered by the programs and (b) grants and contributions that are restricted to meeting the operational or capital requirements of a particular program. Revenues that are not classified as program revenues, including all taxes, are presented as general revenues.
Fund Financial Statements - The fund financial statements provide information about the Town’s funds. The emphasis of fund financial statements is on major governmental funds, each displayed in a separate column. All remaining governmental funds are aggregated and reported as non-major funds.
The Town reports the following major governmental funds:
General Fund - The General Fund is the primary operating fund of the Town. It is used to account for all financial resources except those to be accounted for in another fund.
Capital Improvements Program Fund – Capital Projects Fund - This fund accounts for and reports financial resources that are restricted, committed, or assigned to expenditure for capital outlays including the acquisition or construction of capital facilities and other capital assets.
Debt Service Fund - This fund is used for accumulating resources for the repayment of interest and principal on tax increment bonds and general obligation bonds.
Stormwater Fund - This fund is used to account for the stormwater utility fees collected by and distributed to the municipalities by the County for use in the Town’s Stormwater Management Program and related Capital Improvements Projects.
Hospitality Tax Fund - This fund is used to account for the local hospitality tax fees collected by the Town for use in Tourism related expenditures and related Capital Improvements Projects.
C. Measurement Focus, Basis of AccountingGovernment-wide Financial Statements - The government-wide financial statements are reportedusing the economic resources measurement focus and the accrual basis of accounting generallyincluding the reclassification or elimination of internal activity (between or within funds). Revenues arerecorded when earned and expenses are recorded at the time liabilities are incurred, regardless ofwhen the related cash flow takes place. Non-exchange transactions, in which the Town gives (orreceives) values without directly giving, receiving (or giving) equal value in exchange, include propertytaxes, grants, entitlements, and donations. On an accrual basis, revenue from property taxes isrecognized in the fiscal year for which the taxes are levied. Revenue from grants, entitlements, anddonations is recognized in the fiscal year in which eligibility requirements have been satisfied.
Town of Bluffton Notes to Financial Statements
June 30, 2017
D‐11
Note 1 – Summary of Significant Accounting Policies (continued)
Amounts reported as program revenues include 1) charges to customers or applicants for goods, services, or privileges provided, 2) operating grants and contributions and 3) capital grants and contributions, including special assessments. Internally dedicated resources are reported as general revenues rather than as program revenues. Likewise, general revenues include all taxes.
Government Fund Financial Statements - Governmental funds are reported using the current financial resources measurement focus and the modified accrual basis of accounting. Under this method, revenues are recognized when measurable and available. Available means collectible within the current period or soon enough thereafter to pay current liabilities. The Town considers revenues to be available if they are collected within 60 days of the end of the fiscal year. Expenditures are recorded when the related fund liability is incurred, except for principal and interest on general long-term debt, claims and judgments, and compensated absences, which are recognized as expenditure to the extent they have matured. General capital asset acquisitions under capital leases are reported as other financing sources.
The government considers property taxes as available if they are collected within 60 days after year-end. Generally, a 60-day availability period is used for revenue recognition for other governmental fund revenues. Those revenues susceptible to accrual are property taxes, state shared revenues, interest and garbage fees. Major revenues that are determined not to be susceptible to accrual because they are either not available soon enough to pay liabilities of the current period or are not objectively measurable include delinquent property taxes collected later than 60 days after year end, other fees and fines, licenses and permits.
D. Budgets and Budgetary AccountingTown Council at the department level determines the legal level of control. The Town Manager isauthorized by the budget ordinance to make transfers of any amounts within the General Fund;however, Town Council must approve any revisions that increase total expenditures of any fund.
Budgets, as reported in the financial statements, are as originally passed by ordinance and subsequently amended. A formalized budget for the Hospitality Tax Fund was not passed in 2017 and is not anticipated in future years. These funds are transferred to capital projects funds for tourism related capital improvement projects approved by Council. All annual budget appropriations lapse at fiscal year-end.
The Town follows a budget calendar in establishing the budgets for the next year ensuring the flowing criteria is met:
1. Prior to the second week in June, the Town Manager submits to the Town Council, a proposedoperating budget for the General Fund, Capital Improvements Program Fund, Debt Service Fund,and Stormwater Fund for the next fiscal year commencing the following July 1. The budgets for theaforementioned funds are prepared in accordance with GAAP. The budgets include estimatedexpenditures and estimated sources of revenue.
2. A public hearing is scheduled and conducted to obtain taxpayer comments.3. Prior to June 30, Town Council adopts the budget ordinance.
E. EncumbrancesEncumbrance accounting, under which purchase orders, contracts, and other commitments for theexpenditure of monies are recorded in order to reserve that portion of the applicable appropriation, isemployed as an extension of formal budgetary integration in the general fund and capital projects fund.Encumbrances are contractual amounts outstanding at year end and are reported under the GASB 54fund balance categories since they do not constitute expenditures or liabilities.

Town of Bluffton Notes to Financial Statements
June 30, 2017
D‐12
Note 1 – Summary of Significant Accounting Policies (continued)
F. Deposits and Investments For purposes of this report, the Town considers both restricted and unrestricted demand deposits, money market accounts and certificates of deposit with original maturities of three months or less from the date of purchase to be cash equivalents. The Town maintains cash and cash equivalents in two banks, which are members of the Federal Deposit Insurance Corporation (FDIC). Investments for the government are reported at fair value. G. Prepaid Items Certain payments to vendors reflect costs applicable to future accounting periods and are reported as prepaid items. The cost of prepaid items is accounted for using the consumption method.
H. Property Taxes Beaufort County assesses and collects property taxes and distributes an allocable portion to the Town of Bluffton. Real estate taxes for the current calendar year are levied during October and become delinquent the following January 15th. Taxes on licensed motor vehicles are levied during the month when the license registration is up for renewal. The lien date is March 15. I. Capital Assets Purchased or constructed capital assets are reported at cost or estimated historical cost. Minimum capitalization costs are $5,000 for all categories except roads, buildings and computer software which is $50,000. Donated capital assets are recorded at acquisition value. The cost of normal maintenance and repairs that do not add to the value of the asset or materially extend assets’ lives are not capitalized.
Capital Assets of the Town are depreciated on a straight-line basis over the following estimated useful lives:
Years Building and improvements 10 to 35Drainage 25Roads 20Land Improvements 10 to 20Sidewalks and Trails 20 to 30Machinery and equipment 5 to 15Vehicles 5
J. Long-term Obligations In the government-wide financial statements, long-term debt and other long-term obligations are reported as liabilities in the applicable governmental activities statement of net position. In the fund financial statements, governmental fund types recognize bond premiums and discounts, as well as bond issuance costs, during the current period. The face amount of debt issued is reported as other financing sources. Premiums received on debt issuances are reported as other financing sources while discounts on debt issuances are reported as other financing uses. Issuance costs, whether or not withheld from the actual debt proceeds received, are reported as debt service expenditures. K. Compensated Absences Full-time employees accrue Paid Time Off (PTO) in varying percentages to specified maximums depending on tenure with the Town. For the Town’s government-wide funds, an expense and a liability for compensated absences and the salary-related payments are recorded within those funds as the PTO is earned. The General Fund is used to liquidate the liability for compensated absences and the amount of the liability generally reported as a current liability is based on amounts paid out during the current fiscal year.
Town of Bluffton Notes to Financial Statements
June 30, 2017
D‐13
Note 1 – Summary of Significant Accounting Policies (continued) L. Allowance for Uncollectible Accounts All receivables are expected to be collected, so an allowance for uncollectible accounts was not considered necessary. M. Net Position/Fund Balances Net Position – Net position in the government–wide financial statements is classified as either net investment in capital assets, restricted, or unrestricted. Restricted net position represents constraints on resources that are externally imposed by creditors, grantors, contributors, or laws or regulations of other governments or imposed by law. Fund Balance – Fund balance is intended to serve as a measure of the financial resources available in a governmental fund. It is essential that governments maintain adequate levels of fund balance to mitigate current and future risks, ensure stable tax rates, maintain bond rating, and not jeopardize the continuation of necessary public services. This policy will ensure the Town maintains adequate fund balance reserves in the Town’s Governmental Funds to provide the capacity to: 1. Supply sufficient cash flow for daily financial needs, 2. Secure and maintain investment grade bond ratings, 3. Deliver adequate reserves to offset significant economic downturns or revenue shortfalls, and 4. Offer adequate reserves for unforeseen expenditures related to emergencies. Fund balance levels are also a crucial consideration to long-term financial planning. Fund Balance for the Town’s Funds will be comprised of the following categories: 1. Nonspendable - amounts that cannot be spent because they are either (a) not in spendable form or
(b) legally or contractually required to be maintained intact.
2. Restricted - amounts that are limited in how they can be spent due to external legal restrictions, such as externally imposed by creditors (debt covenants), grantors, contributors, laws, or regulations of other governments.
3. Committed - amounts used for a specific purpose pursuant to a council imposed ordinance and can only be modified or removed by the same formal council action. These can include amounts set aside based on self-imposed limitations established and set in place prior to fiscal year-end, but can be calculated after the fiscal year-end.
4. Assigned - amounts that are intended to be used for specific purpose, but are neither restricted nor
committed. Requires no formal action by year-end from Town Council and is delegated to the Town Manager and/or Director of Finance as per the adopted Fund Balance Financial Policy.
5. Unassigned - amounts that are not reported in any other classification. Only reported within the
General Fund; when the Town transfers resources from the general fund to another governmental fund, it is communicating that, at a minimum, it intends to use those resources for the purpose of the fund receiving them (minimally designated as Assigned). In other governmental funds, if expenditures incurred for specific purposes exceed the amounts restricted, committed, or assigned to those purposes, it may be necessary to report a negative unassigned fund balance.
The General Fund will be the only fund that has unassigned fund balance. All other funds’ fund balances will be designated at minimum as assigned by their original intent. The order of expenditure must be classified. The Town shall spend funds from restricted fund balance first, and then committed fund balance, assigned fund balance and lastly unassigned fund balance. Whenever multiple revenue sources are available, the Town will use resources in this order (as deemed by the agency granting funds or bond ordinances): bond proceeds, Federal funds, State funds, local county funds, and Town funds. The Town Manager may deviate from this order when it best meets the needs of the Town.

Town of Bluffton Notes to Financial Statements
June 30, 2017
D‐14
Note 1 – Summary of Significant Accounting Policies (continued)
N. Use of EstimatesThe preparation of financial statements in conformity with accounting principles generally accepted inthe United States of America requires management to make estimates and assumptions that affect thereported amounts of assets and liabilities and disclosure of contingent assets and liabilities at the dateof the financial statements and the reported amounts of revenues and expenses during the reportingperiod. Actual results could differ from those estimates.
Note 2 - Cash and Cash Equivalents
Deposits include cash and cash equivalents on deposit in the banks and non-negotiable certificates of deposit with original maturities less than 90 days and investments described below. A summary of the degree of risk associated with the Town’s deposits at June 30, 2017 follows. Custodial credit risk for deposits is the risk that in the event of failure, the Town’s deposits may not be recovered. The Town has not adopted policies regarding credit risk, custodial credit risk, interest rate risk or concentration of credit risk.
As of June 30, 2017, none of the Town’s primary government bank balances of $27,976,047 (book balance of $26,881,857) were exposed to custodial credit risk. Bank balances differ from the Town’s carrying amount due to cash on hand, deposits in transit and outstanding checks. Additionally, the Town has funds deposited in CDARS in the amount of $1,864,406. The deposits are held at multiple banks with no individual bank holding more than $250,000, including interest. As such, each deposit is fully collateralized by the FDIC.
June 30, 2017Amounts insured by FDIC coverage 3,780,434$ Amounts collateralized with securities held by the pledging financial institution in the Town's name 31,813,353 Excess Collateralization (7,617,740)
Total bank balances 27,976,047$
The Town had restricted cash in the amount of $6,983,061 at June 30, 2017. These amounts are legally restricted according to developer agreements and Town ordinances for capital projects.

Town of Bluffton Notes to Financial Statements
June 30, 2017
D‐15
Note 3 – Investments
The Town’s primary objectives, in priority order, of investment activities shall be safety, liquidity, and yield. In accordance with South Carolina Statute SC Code Ann. SECTION 6-5-10, Authorized investments by political subdivisions include:
1. Obligations of the United States and its agencies, the principal and interest of which is fullyguaranteed by the United States.
2. Obligations issued by the Federal Financing Bank, Federal Farm Credit Bank, the Bank ofCooperatives, the Federal Intermediate Credit Bank, the Federal Land Banks, the Federal HomeLoan Banks, the Federal Home Loan Mortgage Corporation, the Federal National MortgageAssociation, the Government National Mortgage Association, the Federal Housing Administration,and the Farmers Home Administration, if, at the time of investment, the obligor has a long-term,unenhanced, unsecured debt rating in one of the top two ratings categories, without regard to arefinement or gradation of rating category by numerical modifier or otherwise, issued by at least twonationally recognized credit rating organizations.
3. i) General obligations of the State of South Carolina or any of its political units; or ii) Revenueobligations of the State of South Carolina or its political units, if at the time of investment, the obligorhas a long-term, unenhanced, unsecured debt rating in one of the top two ratings categories,without regard to a refinement or gradation of rating category by numerical modifier or otherwise,issued by at least two nationally recognized credit rating organizations.
4. Savings and Loan Associations to the extent that the same are insured by an agency of the federalgovernment.
5. Certificates of deposit where the certificates are collaterally secured by securities of the typedescribed in (1) and (2) above held by a third party as escrow agent or custodian, of a market valuenot less than the amount of the certificates of deposit so secured, including interest; provided,however, such collateral shall not be required to the extent the same are insured by an agency ofthe federal government.
6. Repurchase agreements when collateralized by securities as set forth in this section.
7. No load open-end or closed-end management type investment companies or investment trustsregistered under the Investment Company Act of 1940, as amended, where the investment is madeby a bank or trust company or savings and loan association or other financial institution when actingas trustee or agent for a bond or other debt issue of that local government unit, political subdivision,or county treasurer if the particular portfolio of the investment company or investment trust in whichthe investment is made (i) is limited to obligations described in items (1), (2), (3), and (6) of thissubsection, and (ii) has among its objectives the attempt to maintain a constant net asset value ofone dollar a share and to that end, value its assets by the amortized cost method. The provisions ofthis chapter shall not impair the power of a municipality or county treasurer to hold funds in depositaccounts with banking institutions as otherwise authorized by law.

Town of Bluffton Notes to Financial Statements
June 30, 2017
D‐16
Note 4 – Receivables
At June 30, 2017, the Town’s receivable balances were as follows:
Capital Other General Improvements Debt Service Stormwater Hospitality Governmental
Fund Program Fund Fund Fund Tax Fund Funds TotalReceivables:
Administrative fees 88,000$ -$ -$ -$ -$ -$ 88,000$ Alcohol taxes - 20,550 - - - - 20,550 Contract police services 1,148 - - - - - 1,148Component Units 95,985 - - - - - 95,985 Due from other governments 164,806 - 34,363 - - - 199,169 Federal & state grants 139,025 88,576 - - - - 227,601 Fines and Fees 1,257 - - - - - 1,257Franchise fees 1,263,670 - - - - - 1,263,670 Hospitality taxes - - - - 532,146 - 532,146 Insurance 19,793 - - - - - 19,793 Licenses & permits 200,783 2,700 - - - - 203,483 Local accommodations taxes - - - - - 239,389 239,389 Local government fund 72,804 - - - - - 72,804 Other/miscellaneous 45,355 10,000 - - - - 55,355 Property taxes 51,864 - 17,666 - - - 69,530 School resources 228,971 - - - - - 228,971 State accommodations taxes - - - - - 174,727 174,727 Stormwater utility fees - - - 33,183 - - 33,183
Total Receivables 2,373,461$ 121,826$ 52,029$ 33,183$ 532,146$ 414,116$ 3,526,761$

Town of Bluffton Notes to Financial Statements
June 30, 2017
D‐17
Note 5 – Capital Assets
Capital asset activity for the governmental activities for the year ended June 30, 2017 was as follows:
Beginning Additions/ Disposals/ EndingBalances Completions Adjustments Balances
Governmental activities: Capital assets not being depreciated: Land 14,300,225$ 1,645,500$ (624,048)$ 15,321,677$ Construction in progress 198,380 568,304 (103,650) 663,034 Total capital assets not being depreciated 14,498,605 2,213,804 (727,698) 15,984,711 Capital assets being depreciated: Building and improvements 7,519,398 230,514 (14,579) 7,735,333 Drainage 683,071 - - 683,071 Roads 3,898,551 - - 3,898,551 Sidewalks and Trails 1,875,149 - - 1,875,149 Land Improvements 1,073,251 - - 1,073,251 Machinery and equipment 2,091,022 246,800 - 2,337,822 Vehicles 2,369,227 235,918 (137,037) 2,468,108 Total capital assets being depreciated 19,509,669 713,232 (151,616) 20,071,285 Less accumulated depreciation for: Building and improvements 1,868,585 236,115 (2,499) 2,102,201 Drainage 273,232 34,154 - 307,386 Roads 1,445,509 197,537 - 1,643,046 Sidewalks and Trails 388,825 75,844 - 464,669 Land Improvements 88,762 28,380 - 117,142 Machinery and equipment 1,682,213 108,734 - 1,790,947 Vehicles 1,512,142 293,552 (132,221) 1,673,473 Total accumulated depreciation 7,259,268 974,316 (134,720) 8,098,864 Total capital assets being depreciated, net 12,250,401 11,972,421 Governmental activity capital assets, net 26,749,006$ 27,957,132$
Depreciation was charged to functions/programs of the primary government as follows:
Depreciation by function:
Administration 28,732$ Public Works 74,307 Stormwater 36,100 Building Safety 6,425 Engineering 351,084 Information Technology 20,817 Municipal Court 663Planning 1,594 Police Department 267,438 Community Development 187,156
Total Depreciation Expense 974,316$
Town of Bluffton Notes to Financial Statements
June 30, 2017
D‐18
Note 6 – Employee Retirement Systems and Plans
Summary of Significant Accounting Policies Pensions. For purposes of measuring the net pension liability, deferred outflows of resources and deferred inflows of resources related to pensions, and pension expense, information about the fiduciary net position of the South Carolina Retirement Systems (SCRS), the Police Officers Retirement System (PORS) and additions to/deductions from SCRS’s & PORS’s fiduciary net positions have been determined on the same basis as they are reported by SCRS and PORS. For this purpose, benefit payments (including refunds of employee contributions) are recognized when due and payable in accordance with the benefit terms. Investments are reported at fair value.
General Information about the Pension Plan Plan administrator. The South Carolina Public Employee Benefit Authority (PEBA), which was created July 1, 2012, administers the various retirement systems and retirement programs managed by its Retirement Division. PEBA has an 11-member Board of Directors, appointed by the Governor and General Assembly leadership, which serves as co-trustee and co-fiduciary of the systems and the trust funds. By law, the Budget and Control Board, which consists of five elected officials, also reviews certain PEBA Board decisions regarding the funding of the SCRS and serves as a co-trustee of the SCRS in conducting that review.
For purposes of measuring the net pension liability, deferred outflows and inflows of resources related to pensions, and pension expense, information about the fiduciary net position of the Systems and additions to/deductions from the Systems fiduciary net position have been determined on the accrual basis of accounting as they are reported by the Systems in accordance with generally accepted accounting principles (GAAP). For this purpose, revenues are recognized when earned and expenses are recognized when incurred. Benefit and refund expenses are recognized when due and payable in accordance with the terms of the plan. Investments are reported at fair value.
The CAFR of the Pension Trust Funds is publicly available on PEBA’s Retirement Benefits’ website at www.peba.sc.gov, or a copy may be obtained by submitting a request to PEBA, PO Box 11960, Columbia, SC 29211-1960.
Plan descriptions. The South Carolina Retirement Systems (SCRS), a cost–sharing multiple-employer defined benefit pension plan, was established effective July 1, 1945, pursuant to the provisions of Section 9-1-20 of the South Carolina Code of Laws for the purpose of providing retirement allowances and other benefits for employees of the state, its public school Towns, and political subdivisions.
The South Carolina Police Officers Retirement System (PORS), a cost–sharing multiple-employer defined benefit pension plan, was established effective July 1, 1962, pursuant to the provisions of Section 9-11-20 of the South Carolina Code of Laws for the purpose of providing retirement allowances and other benefits for police officers and firemen of the state and its political subdivisions.
Employers’ proportionate shares were calculated on the basis of historical employer contributions. Although GASB 68 encourages the use of the employer’s projected long-term contribution effort to the retirement plan, allocating on the basis of historical employer contributions is considered acceptable. Employer contributions recognized by the Systems that are not representative of future contribution effort are excluded in the determination of employers’ proportionate shares.

Town of Bluffton Notes to Financial Statements
June 30, 2017
D‐19
Note 6 – Employee Retirement Systems and Plans (continued) Membership. Membership requirements are prescribed in Title 9 of the South Carolina Code of Laws. A brief summary of the requirements under each system are as follows. SCRS - Generally, all employees of covered employers are required to participate in and contribute to the system as a condition of employment. This plan covers general employees and teachers and individuals newly elected to the South Carolina General Assembly beginning with the November 2012 general election. An employee member of the system with an effective date of membership prior to July 1, 2012, is a Class Two member. An employee member of the system with an effective date of membership on or after July 1, 2012, is a Class Three member. PORS - To be eligible for PORS membership, an employee must be required by the terms of his employment, by election or appointment, to preserve public order, protect life and property, and detect crimes in the state; to prevent and control property destruction by fire; or to serve as a peace officer employed by the Department of Corrections, the Department of Juvenile Justice, or the Department of Mental Health. Probate judges and coroners may elect membership in PORS. Magistrates are required to participate in PORS for service as a magistrate. PORS members, other than magistrates and probate judges, must also earn at least $2,000 per year and devote at least 1,600 hours per year to this work, unless exempted by statute. An employee member of the system with an effective date of membership prior to July 1, 2012, is a Class Two member. An employee member of the system with an effective date of membership on or after July 1, 2012, is a Class Three member. Benefits provided. Benefit terms are prescribed in Title 9 of the South Carolina Code of Laws. PEBA does not have the authority to establish or amend benefit terms without a legislative change in the code of laws. Key elements of the benefit calculation include the benefit multiplier, years of service, and average final compensation. A brief summary of the benefit terms for each system are as follows.
SCRS - A Class Two member who has separated from service with at least five or more years of earned service is eligible for a monthly pension at age 65 or with 28 years credited service regardless of age. A member may elect early retirement with reduced pension benefits payable at age 55 with 25 years of service credit. A Class Three member who has separated from service with at least eight or more years of earned service is eligible for a monthly pension upon satisfying the Rule of 90 requirement that the total of the member’s age and the member’s creditable service equals at least 90 years. Both Class Two and Class Three members are eligible to receive a reduced deferred annuity at age 60 if they satisfy the five or eight-year earned service requirement, respectively. An incidental death benefit is also available to beneficiaries of active and retired members of employers who participate in the death benefit program.
The annual retirement allowance of eligible retirees or their surviving annuitants is increased by the lesser of one percent or five hundred dollars every July 1. Only those annuitants in receipt of a benefit on July 1 of the preceding year are eligible to receive the increase. Members who retire under the early retirement provisions at age 55 with 25 years of service are not eligible for the benefit adjustment until the second July 1 after reaching age 60 or the second July 1 after the date they would have had 28 years of service credit had they not retired.
PORS - A Class Two member who has separated from service with at least five or more years of earned service is eligible for a monthly pension at age 55 or with 25 years of service regardless of age. A Class Three member who has separated from service with at least eight or more years of earned service is eligible for a monthly pension at age 55 or with 27 years of service regardless of age. Both Class Two and Class Three members are eligible to receive a deferred annuity at age 55 with five or eight years of earned service, respectively. An incidental death benefit is also available to beneficiaries of active and retired members of employers who participate in the death benefit program. Accidental death benefits are also provided upon the death of an active member working for a covered employer whose death was a natural and proximate result of an injury incurred while in the performance of duty.

Town of Bluffton Notes to Financial Statements
June 30, 2017
D‐20
Note 6 – Employee Retirement Systems and Plans (continued)
The retirement allowance of eligible retirees or their surviving annuitants is increased by the lesser of one percent or five hundred dollars every July 1. Only those annuitants in receipt of a benefit on July 1 of the preceding year are eligible to receive the increase.
Contributions. Contributions are prescribed in Title 9 of the South Carolina Code of Laws. The PEBA Board may increase the SCRS and PORS employer and employee contribution rates on the basis of the actuarial valuations, but any such increase may not result in a differential between the employee and employer contribution rate that exceeds 2.9 percent of earnable compensation for SCRS and 5 percent for PORS. An increase in the contribution rates adopted by the board may not provide for an increase of more than one-half of one percent in any one year. If the scheduled employee and employer contributions provided in statute or the rates last adopted by the board are insufficient to maintain a thirty year amortization schedule of the unfunded liabilities of the plans, the board shall increase the contribution rates in equal percentage amounts for the employer and employee as necessary to maintain the thirty-year amortization period; and, this increase is not limited to one half of one percent per year.
Required employee contribution rates for the following fiscal years are as follows:
2017 2016SCRS Employee Class Two 8.66% 8.16% of earnable compensation
Employee Class Three 8.66% 8.16% of earnable compensation
PORS Employee Class Two 9.24% 8.74% of earnable compensationEmployee Class Three 9.24% 8.74% of earnable compensation
Required employer contributions for the following fiscal years are as follows:
2017 2016SCRS Employer Class Two 11.41% 10.91% of earnable compensation
Employer Class Three 11.41% 10.91% of earnable compensationEmployer Incidental Death Benefit 0.15% 0.15% of earnable compensation
PORS Employer Class Two 13.84% 13.34% of earnable compensationEmployer Class Three 13.84% 13.34% of earnable compensationEmployer Incidental Death Benefit 0.20% 0.20% of earnable compensationEmployer Acidental Death Program 0.20% 0.20% of earnable compensation
Pension Liabilities, Pension Expense, and Deferred Outflows of Resources and Deferred Inflows of Resources Related to Pensions At June 30, 2017, the Town reported a total liability of $14,666,111 for its proportionate share of the net pension liabilities for both plans in aggregate. The net pension liabilities were measured as of June 30, 2016, and the total pension liabilities used to calculate the net pension liabilities were determined by actuarial valuations as of July 1, 2015. The Town’s proportion of the net pension liabilities were calculated on the basis of employer contributions actually remitted to the plan for the fiscal year ended June 30, 2016. At June 30, 2016, the Town’s proportion was 0.041865 percent for SCRS and 0.22566 percent for PORS.

Town of Bluffton Notes to Financial Statements
June 30, 2017
D‐21
Note 6 – Employee Retirement Systems and Plans (continued)
For the year ended June 30, 2016, the Town recognized pension expense of $2,097,791, which includes $942,768 for SCRS and $1,155,023 for PORS. At June 30, 2017, the Town reported deferred outflows of resources and deferred inflows of resources related to pensions from the following sources:
Deferred Deferred Deferred Deferred Deferred DeferredOutflows of Inflows of Outflows of Inflows of Outflows of Inflows ofResources Resources Resources Resources Resources Resources
Difference between expected and actual experience 92,697$ 9,711$ 84,930$ 177,627$ 9,711$
Net difference between projected and actualinvestment earnings 752,334 - 649,031 - 1,401,365 -
Change in proportion 427,584 - 803,861 - 1,231,445 -
Town contributions subsequent to the measurement date 506,952 - 477,674 - 984,626 -
Total 1,779,567$ 9,711$ 2,015,496$ -$ 3,795,063$ 9,711$
SCRS PORS Total
$984,626 reported as deferred outflows of resources related to pensions resulting from Town contributions subsequent to the measurement date will be recognized as a reduction of the net pension liability in the year ended June 30, 2018. Other amounts reported as deferred outflows of resources and deferred inflows of resources related to pensions will be recognized in pension expense as follows:
SCRS PORS TotalMeasurement period ending June 30,
2018 (371,489)$ (414,432)$ (785,921)$
2019 (330,064) (411,171) (741,235)
2020 (384,403) (465,131) (849,534)
2021 (176,949) (247,088) (424,037) Thereafter
Net Balance of deferred outflows/(inflows) of resources (1,262,905)$ (1,537,822)$ (2,800,727)$
Actuarial assumptions and methods. Actuarial valuations involve estimates of the reported amounts and assumptions about the probability of occurrence of events far into the future. Examples include assumptions about future employment, mortality, and future salary increases. Amounts determined during the valuation process are subject to continual revision as actual results are compared with past expectations and new estimates are made about the future. South Carolina state statute requires that an actuarial experience study be completed at least once in each five-year period. The last experience study was performed on data through June 30, 2015.

Town of Bluffton Notes to Financial Statements
June 30, 2017
D‐22
Note 6 – Employee Retirement Systems and Plans (continued)
The most recent annual actuarial valuation reports adopted by the PEBA Board and Budget and Control Board are as of July 1, 2015. The net pension liability of each defined benefit pension plan was therefore determined by the consulting actuary, Gabriel, Roeder, Smith and Company (GRS), based on the July 1, 2015 actuarial valuations, using membership data as of July 1, 2015, projected forward to the end of the fiscal year, and financial information of the pension trust funds as of June 30, 2016, using generally accepted actuarial principles. Information included in the following schedules is based on the certification provided by GRS. The following provides a summary of the actuarial assumptions and methods used in the July 1, 2015, valuations for SCRS and PORS.
SCRS PORSActuarial cost method Entry age normal Entry age normal
Actuarial assumptions:Investment rate of return 7.50% 7.50%
Projected salary increases 3.5% to 12.5% 4.0% to 10.0%(varies with service) (varies with service)
Includes inflation at 2.75% 2.75%
Benefits adjustments lesser of 1% or $500 lesser of 1% or $500
Mortality rates were based on the RP-2000 Mortality Table with adjustments for mortality improvements based on Scale AA. Those rates are as follows:
Job Class Males Females
General Employees RP-2000 Males multiplied by 100% RP-2000 Females multiplied by 90%
Public Safety Employees RP-2000 Males (with Blue Collar adjustment) multiplied by 115%
RP-2000 Females (with Blue Collar adjustment) multiplied by 115%
Long-term expected rate of return. The long-term expected rate of return on pension plan investments, as used in the July 1, 2015, actuarial valuations, was based upon the 30 year capital market outlook at the end of the fourth quarter 2015. The long-term expected rate of returns represent assumptions developed using an arithmetic building block approach, reflecting observable inflation and interest rate information available in the fixed income markets as well as Consensus Economics forecasts. Long-term assumptions for other asset classes are based on historical results, current market characteristics, and professional judgment.
The expected returns, along with the expected inflation rate, form the basis for the target asset allocation as adopted beginning January 1, 2016. The long-term expected rate of return is produced by weighting the expected future real rates of return by the target allocation percentage and by adding expected inflation and is summarized in the table below. For actuarial purposes, the 7.50 percent assumed annual investment rate of return set in statute and used in the calculation of the total pension liability includes a 4.75 percent real rate of return and a 2.75 percent inflation component.

Town of Bluffton Notes to Financial Statements
June 30, 2017
D‐23
Note 6 – Employee Retirement Systems and Plans (continued)
The target allocation and best estimates of arithmetic real rates of return for each major asset class are summarized in the following table:
Long TermTarget Expected ExpectedAsset Arithmetic Real Portfolio Real
Asset Class Allocation Rate of Return Rate of Return
Global equityGlobal public equity 34.0% 6.52% 2.22%Private equity 9.0% 9.30% 0.84%
Real AssetsReal estate 5.0% 4.32% 0.22%commodities 3.0% 4.53% 0.13%
OpportunisticGTAA/Risk Parity 10.0% 3.90% 0.39%HF (Low Beta) 10.0% 3.87% 0.39%
Diversified CreditMixed credit 5.0% 3.52% 0.17%Emerging markets debt 5.0% 4.91% 0.25%Private debt 7.0% 4.47% 0.31%
Conservative fixed incomeCore fixed income 10.0% 1.72% 0.17%Cash and short duration (net) 2.0% 0.71% 0.01%
Total expected real return 100.0% 5.10%
Inflation for actuarial purposes 2.75%Total expected nominal return 7.85%
Discount rate. The discount rate used to measure the total pension liability was 7.50 percent. The projection of cash flows used to determine the discount rate assumed that contributions from participating employers in SCRS and PORS will be made based on the actuarially determined rates based on provisions in the South Carolina State Code of Laws. Based on those assumptions, the fiduciary net position was projected to be available to make all projected future benefit payments of current plan members. Therefore, the long-term expected rate of return on pension plan investments was applied to all periods of projected benefit payments to determine the total pension liability.
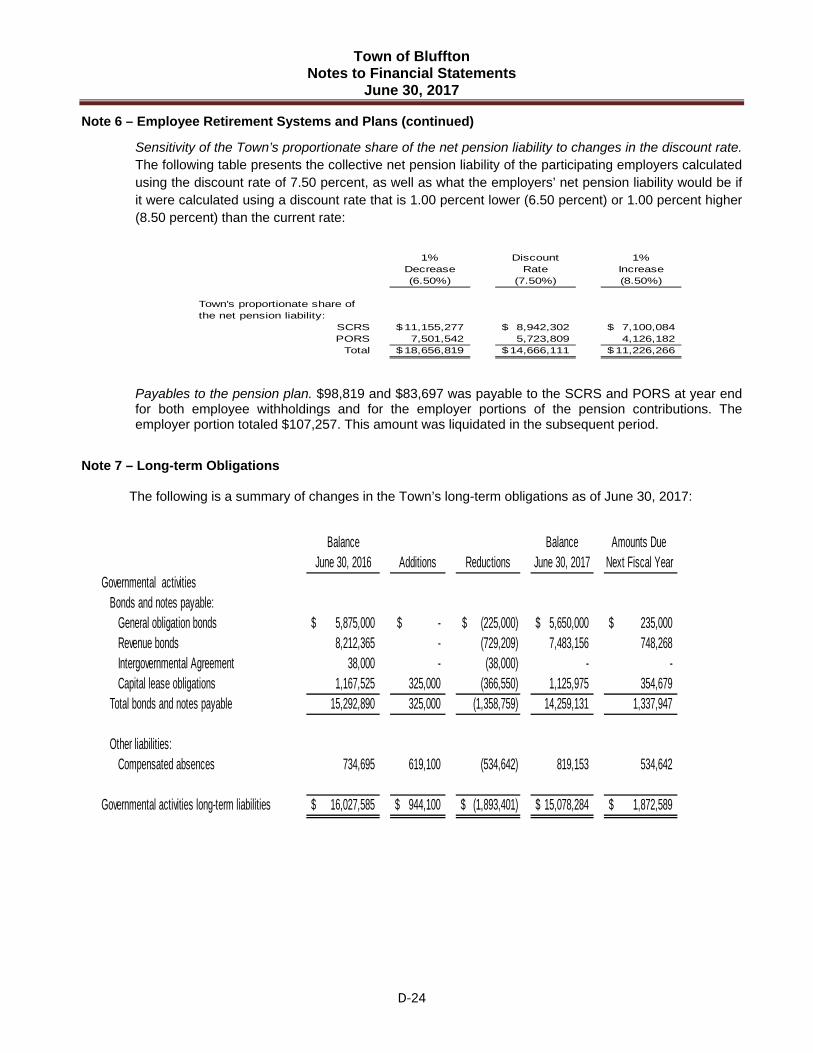
Town of Bluffton Notes to Financial Statements
June 30, 2017
D‐24
Note 6 – Employee Retirement Systems and Plans (continued)
Sensitivity of the Town’s proportionate share of the net pension liability to changes in the discount rate. The following table presents the collective net pension liability of the participating employers calculated using the discount rate of 7.50 percent, as well as what the employers’ net pension liability would be if it were calculated using a discount rate that is 1.00 percent lower (6.50 percent) or 1.00 percent higher (8.50 percent) than the current rate:
1% Discount 1%Decrease Rate Increase(6.50%) (7.50%) (8.50%)
Town's proportionate share ofthe net pension liability:
SCRS 11,155,277$ 8,942,302$ 7,100,084$ PORS 7,501,542 5,723,809 4,126,182
Total 18,656,819$ 14,666,111$ 11,226,266$
Payables to the pension plan. $98,819 and $83,697 was payable to the SCRS and PORS at year end for both employee withholdings and for the employer portions of the pension contributions. The employer portion totaled $107,257. This amount was liquidated in the subsequent period.
Note 7 – Long-term Obligations
The following is a summary of changes in the Town’s long-term obligations as of June 30, 2017:
Balance Balance Amounts DueJune 30, 2016 Additions Reductions June 30, 2017 Next Fiscal Year
Governmental activities Bonds and notes payable: General obligation bonds 5,875,000$ -$ (225,000)$ 5,650,000$ 235,000$ Revenue bonds 8,212,365 - (729,209) 7,483,156 748,268
Intergovernmental Agreement 38,000 - (38,000) - - Capital lease obligations 1,167,525 325,000 (366,550) 1,125,975 354,679 Total bonds and notes payable 15,292,890 325,000 (1,358,759) 14,259,131 1,337,947
Other liabilities: Compensated absences 734,695 619,100 (534,642) 819,153 534,642
Governmental activities long-term liabilities 16,027,585$ 944,100$ (1,893,401)$ 15,078,284$ 1,872,589$

Town of Bluffton Notes to Financial Statements
June 30, 2017
D‐25
Note 7 – Long-term Obligations (continued)
General Obligation Bonds On July 8, 2010, the Town issued General Obligation Bonds, Series 2010A Taxable Build America Bonds in the amount of $6,500,000 for the purpose of a) designing, constructing and equipping a law enforcement center and all costs associated therewith; b) paying cost of issuance of the bonds; and c) such other capital projects as Town Council may determine. The general obligation bonds were issued as taxable direct pay Build America Bonds (BABs) at a net interest rate of 3.57% for a term of 25 years. The principal and interest on the bonds is payable from tax revenues received by the Town. The Town incurred a premium of $379 on the bond issue.
This bond issue resulted in a tax levy of 2.3 mills to the Debt Service Fund in fiscal year 2011 for the initial interest payments on the bonds. Additionally, the Town receives a 32.5% Federal Interest Rebate from the IRS on the interest payments which totaled $102,898 in FY 2017.
A schedule of the amounts due follows:
$6,500,000 General Obligation Bonds dated July 8, 2010
Governmental ActivitiesFiscal Year Interest
Ending June 30, Rate Interest Principal Total2018 3.800% 307,625$ 235,000$ 542,625$ 2019 4.200% 298,695 240,000 538,695 2020 4.400% 288,615 245,000 533,615 2021 4.700% 277,835 255,000 532,835 2022 4.700% 265,850 265,000 530,850 2023 5.000% 253,395 270,000 523,395 2024 5.000% 239,895 280,000 519,895 2025 5.300% 225,895 290,000 515,895 2026 5.300% 210,525 300,000 510,525 2027 5.750% 194,625 310,000 504,625 2028 5.750% 176,800 320,000 496,800 2029 6.000% 158,400 335,000 493,400 2030 6.000% 138,300 350,000 488,300 2031 6.000% 117,300 360,000 477,300 2032 6.000% 95,700 375,000 470,700 2033 6.000% 73,200 390,000 463,200 2034 6.000% 49,800 405,000 454,800 2035 6.000% 25,500 425,000 450,500
3,397,955$ 5,650,000$ 9,047,955$

Town of Bluffton Notes to Financial Statements
June 30, 2017
D‐26
Note 7 – Long-term Obligations (continued)
Tax Increment Revenue Refunding Bonds On December 1, 2014, the Town issued $8,923,000 of tax increment financing bonds bearing interest at 2.58% for a current refunding of the $9,920,000 of outstanding principal of tax increment financing bonds issued by the Town in 2010. The principal and interest on these bonds are paid via the pledged revenue of up to fifty percent of the incremental increase in property taxes due to the economic development in the town’s TIF district and a pledge of the MID fees. The full faith, credit and taxing powers of the Town are not pledged for the payment of the TIF Bonds nor the interest on these bonds. The principal and interest on the bonds is payable from tax revenues received by the Town with respect to the Redevelopment Project Area. The refunding was undertaken to reduce total future debt service payments. The transaction resulted in an economic gain of $254,853 and a reduction of $736,548 in future debt service payments.
A schedule of the amounts due follows:
$8,923,000 Tax Increment Revenue Refunding Bonds dated December 1, 2014
Fiscal Year InterestEnding June 30, Rate Interest Principal Total
2018 2.580% 183,413$ 748,268$ 931,681$ 2019 2.580% 163,855 767,826 931,681 2020 2.580% 143,786 787,895 931,681 2021 2.580% 123,193 808,488 931,681 2022 2.580% 102,061 829,620 931,681 2023 2.580% 80,377 851,304 931,681 2024 2.580% 58,127 873,554 931,681 2025 2.580% 35,295 896,386 931,681 2026 2.580% 11,866 919,815 931,681
901,973$ 7,483,156$ 8,385,129$
Capital Leases On March 27, 2014 the Town entered into a lease agreement with Branch Banking and Trust Company for the purchase of seven (7) 2014 Ford Utility Police Interceptor vehicles, the removable outfitting equipment and one (1) Rhino boom mower. The purchase price of the new vehicles and associated equipment was $291,000. The lease bears an interest rate of 1.21% and is payable in annual installments of principal and interest of $74,964 through March of 2018. The lease is being paid annually through the general fund. A schedule of the amount due for this lease follows:
Governmental ActivitiesFiscal Year Interest
Ending June 30 Rate Interest Principal Total2018 1.210% 896$ 74,068$ 74,964$
896$ 74,068$ 74,964$
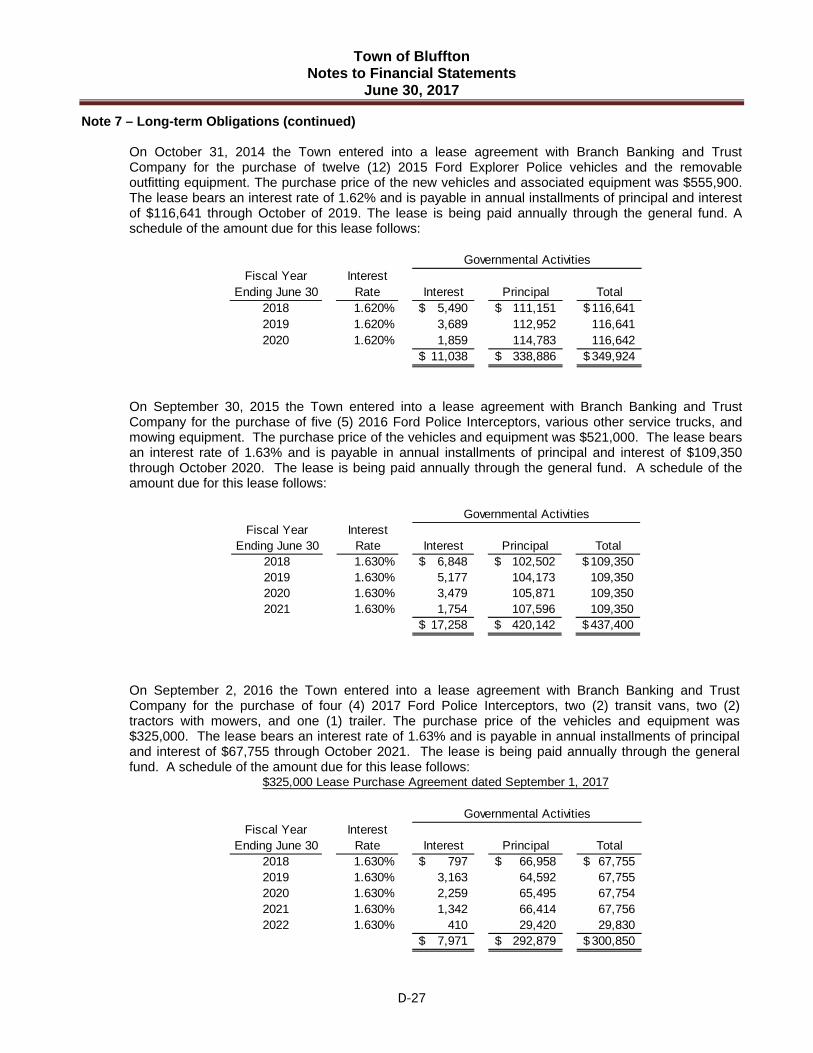
Town of Bluffton Notes to Financial Statements
June 30, 2017
D‐27
Note 7 – Long-term Obligations (continued)
On October 31, 2014 the Town entered into a lease agreement with Branch Banking and Trust Company for the purchase of twelve (12) 2015 Ford Explorer Police vehicles and the removable outfitting equipment. The purchase price of the new vehicles and associated equipment was $555,900. The lease bears an interest rate of 1.62% and is payable in annual installments of principal and interest of $116,641 through October of 2019. The lease is being paid annually through the general fund. A schedule of the amount due for this lease follows:
Governmental ActivitiesFiscal Year Interest
Ending June 30 Rate Interest Principal Total2018 1.620% 5,490$ 111,151$ 116,641$ 2019 1.620% 3,689 112,952 116,641 2020 1.620% 1,859 114,783 116,642
11,038$ 338,886$ 349,924$
On September 30, 2015 the Town entered into a lease agreement with Branch Banking and Trust Company for the purchase of five (5) 2016 Ford Police Interceptors, various other service trucks, and mowing equipment. The purchase price of the vehicles and equipment was $521,000. The lease bears an interest rate of 1.63% and is payable in annual installments of principal and interest of $109,350 through October 2020. The lease is being paid annually through the general fund. A schedule of the amount due for this lease follows:
Governmental ActivitiesFiscal Year Interest
Ending June 30 Rate Interest Principal Total2018 1.630% 6,848$ 102,502$ 109,350$ 2019 1.630% 5,177 104,173 109,350 2020 1.630% 3,479 105,871 109,350 2021 1.630% 1,754 107,596 109,350
17,258$ 420,142$ 437,400$
On September 2, 2016 the Town entered into a lease agreement with Branch Banking and Trust Company for the purchase of four (4) 2017 Ford Police Interceptors, two (2) transit vans, two (2) tractors with mowers, and one (1) trailer. The purchase price of the vehicles and equipment was $325,000. The lease bears an interest rate of 1.63% and is payable in annual installments of principal and interest of $67,755 through October 2021. The lease is being paid annually through the general fund. A schedule of the amount due for this lease follows:
$325,000 Lease Purchase Agreement dated September 1, 2017
Governmental ActivitiesFiscal Year Interest
Ending June 30 Rate Interest Principal Total2018 1.630% 797$ 66,958$ 67,755$ 2019 1.630% 3,163 64,592 67,755 2020 1.630% 2,259 65,495 67,754 2021 1.630% 1,342 66,414 67,756 2022 1.630% 410 29,420 29,830
7,971$ 292,879$ 300,850$
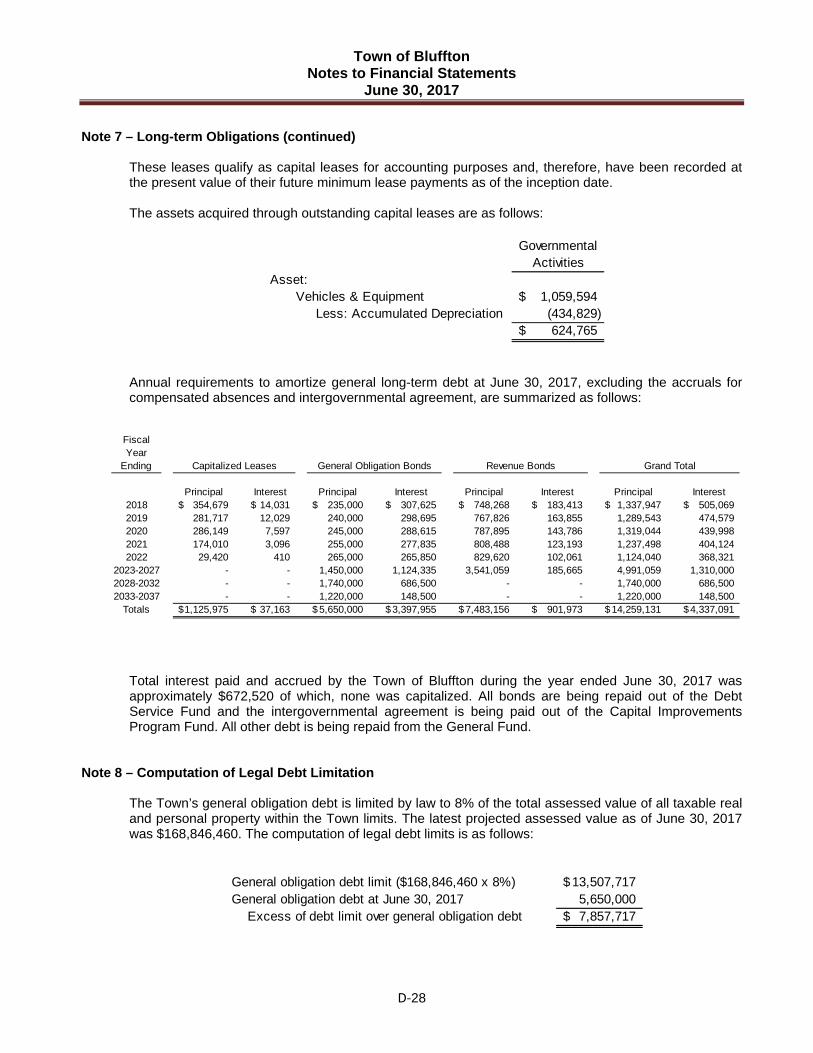
Town of Bluffton Notes to Financial Statements
June 30, 2017
D‐28
Note 7 – Long-term Obligations (continued)
These leases qualify as capital leases for accounting purposes and, therefore, have been recorded at the present value of their future minimum lease payments as of the inception date.
The assets acquired through outstanding capital leases are as follows:
Governmental Activities
Asset:Vehicles & Equipment 1,059,594$ Less: Accumulated Depreciation (434,829)
624,765$
Annual requirements to amortize general long-term debt at June 30, 2017, excluding the accruals for compensated absences and intergovernmental agreement, are summarized as follows:
Fiscal Year
Ending Capitalized Leases General Obligation Bonds Revenue Bonds Grand Total
Principal Interest Principal Interest Principal Interest Principal Interest2018 354,679$ 14,031$ 235,000$ 307,625$ 748,268$ 183,413$ 1,337,947$ 505,069$ 2019 281,717 12,029 240,000 298,695 767,826 163,855 1,289,543 474,579 2020 286,149 7,597 245,000 288,615 787,895 143,786 1,319,044 439,998 2021 174,010 3,096 255,000 277,835 808,488 123,193 1,237,498 404,124 2022 29,420 410 265,000 265,850 829,620 102,061 1,124,040 368,321
2023-2027 - - 1,450,000 1,124,335 3,541,059 185,665 4,991,059 1,310,000 2028-2032 - - 1,740,000 686,500 - - 1,740,000 686,500 2033-2037 - - 1,220,000 148,500 - - 1,220,000 148,500
Totals 1,125,975$ 37,163$ 5,650,000$ 3,397,955$ 7,483,156$ 901,973$ 14,259,131$ 4,337,091$
Total interest paid and accrued by the Town of Bluffton during the year ended June 30, 2017 was approximately $672,520 of which, none was capitalized. All bonds are being repaid out of the Debt Service Fund and the intergovernmental agreement is being paid out of the Capital Improvements Program Fund. All other debt is being repaid from the General Fund.
Note 8 – Computation of Legal Debt Limitation
The Town’s general obligation debt is limited by law to 8% of the total assessed value of all taxable real and personal property within the Town limits. The latest projected assessed value as of June 30, 2017 was $168,846,460. The computation of legal debt limits is as follows:
General obligation debt limit ($168,846,460 x 8%) 13,507,717$ General obligation debt at June 30, 2017 5,650,000 Excess of debt limit over general obligation debt 7,857,717$

Town of Bluffton Notes to Financial Statements
June 30, 2017
D‐29
Note 9 – Fund Balances
As prescribed by GASB Statement No.54, governmental funds report fund balance in classifications based primarily on the extent which the Town is bound to constraints on the specific purposes for which amounts in the funds can be spent. As of June 30, 2017, fund balances for all the major and non-major funds were distributed as follows:
General Fund
Capital Improvements Program Fund
Debt Service
Fund Stormwater
Fund Hospitality Tax Fund
Non-Major Governmental
Funds
Total Governmental
Funds Fund Balances:Nonspendable: Prepaid Assets 253,037$ -$ -$ -$ -$ -$ 253,037$
Restricted for:Drug Enforcement (SC Code of Laws 44-53-530 (g)) - - - - - 23,090 23,090 Victims Services (SC Code of Laws 14-1-208E) 32,095 - - - - - 32,095Stormwater Improvement (SW Fee Ordinance) - - - 1,730,738 - - 1,730,738 TIF Debt Service (Bond & Budget Ordinance) - - 1,550,434 - - - 1,550,434 GO Bond Debt Service (Bond & Budget Ordinance) - - 357,906 - - - 357,906 Municipal Improvement District Funds (Development Agreement) 461,578 775,958 - - - - 1,237,536 Boat Ramp Repair (Development Agreement) - - - - - 45,996 45,996 Buckwalter Park (Development Agreement) - 670,187 - - - - 670,187 Linear Park (Development Agreement) - 179,805 - - - - 179,805 Kent Estates Leisure Trail (Development Agreement) 28,000 42,000 - - - - 70,000 Village of Verdier Leisure Trail (Development Agreement) 42,000 28,000 - - - - 70,000 Tree Fund (unified code) 60,942 - - - - - 60,942Economic Development (MCIP Agreement & Tax Credits - 194,194 - - - - 194,194 Tourism Projects and Related Support (SC Code 6-1-530 & 730) - 64,779 - - 1,526,424 680,453 2,271,656
Committed to:Emergency Recovery Fund (Budget Ordinance) 2,804,833 - - - - - 2,804,833 Equipment & Vehicle Replacement Reserve (Budget Ordinance) 632,940 - - - - - 632,940 Contract Encumbrances (May River Road) 349,490 - - 440,000 1,332,001 - 2,121,491 Contract Encumbrances (Town Hall Redevelopment) 442,470 - - - - - 442,470
Assigned to:Other Capital Improvement Purposes - 1,600,458 - - - - 1,600,458
Unassigned: 10,017,064 - - - - - 10,017,064
Total Fund Balances 15,124,449$ 3,555,381$ 1,908,340$ 2,170,738$ 2,858,425$ 749,539$ 26,366,872$
Ordinance No. 2016-06 “Fiscal Year 2017 Budget” establishes the following designated reserve funds:
Emergency Recovery Fund – shall be funded at an amount equal to or greater than fifteen (15) percent of the current fiscal year General Fund expenditure budget amount. For Fiscal Year 2017, this amount was established as $2,804,833. The fund amount is established by Council Ordinance every year with the adoption of each year’s General Fund budget. The fund was created to provide emergency funds for a natural disaster (i.e. hurricane) or other state of emergency.
Vehicle and Equipment Replacement Reserve Fund – This reserve shall be funded at an amount equal to 105% of the designated assets’ prior completed fiscal year’s depreciation cost from uncommitted Fund Balance. This funding will occur in years in which there is a positive net change in the prior year’s fund balance. In addition, any insurance proceeds from totaled vehicles and proceeds from the sale of vehicles and equipment will be designated as reserved for future vehicle or equipment purchases. Debt Service requirements (lease principal and interest payments) are charged to Department Cost Centers and reduce the Vehicle and Equipment Replacement Reserve each year. For Fiscal Year 2017, this amount is established at $632,940.

Town of Bluffton Notes to Financial Statements
June 30, 2017
D‐30
Note 10 – Net Investment in Capital Assets A significant portion of the net position reported in the government-wide statement of net position is attributable to the Town’s investment in capital assets. The amount is calculated as follows:
Capital Assets 36,055,996$ Less: Accumulated Depreciation (8,098,864)
27,957,132 Less: Outstanding Principal of Capital-Related Borrowings General obligation bonds (5,650,000) Revenue bonds (7,483,156) Capital lease obligations (1,125,975)
(14,259,131)
Net Investment in Capital Assets 13,698,001$
Note 11 – Interfund Balances and Activity
Due From/To Other Funds Amounts due from/to funds resulted from temporary borrowings related to capital expenditures, budget transfers and bond payments. The composition of interfund balances as of June 30, 2017, is shown in the following schedule. These balances occur during the ordinary course of activities and are expected to be settled during the next year.
Due FromCapital Non Major
Due To General Improvements Debt Service Stormwater Hospitality GovernmentalFund Program Fund Fund Fund Tax Fund Funds Total
General Fund -$ 19,081$ -$ 12,645$ 405$ 10,910$ 43,041$ Capital Improvements Program Fund 144,529 - 75,162 358,454 288,817 65,335 932,297 Debt Service Fund 21,284 - - - - - 21,284 Stormwater Fund 2,021 - - - - - 2,021 Hospitality Tax Fund 99,970 35 - - - 23,441 123,446 Non Major Governmental Funds 150 - - - - 3,980 4,130 Total 267,954$ 19,116$ 75,162$ 371,099$ 289,222$ 103,666$ 1,126,219$
Note 12 – Transfers To/From Other Funds The Town uses transfers to move revenues from the fund that by statue or budget requires to collect them to the fund that statute or budget requires to expend them or to transfer bond proceeds from the fund that by statute or budget requires to receive them to other funds authorized to expend them. Transfers in (out) for the year ended June 30, 2017, are summarized as follows:
Transfers Out
Non MajorTransfers In General Debt Service Stormwater Hospitality Tax Governmental
Fund Fund Fund Fund Fund TotalGeneral Fund -$ -$ 50,000$ 500,000$ 41,770$ 591,770$ Capital Improvements Program Fund 332,865 556,918 623,616 1,848,327 208,614 3,570,340 Non Major Governmental Fund 19,395 - - - - 19,395 Totals 352,260$ 556,918$ 673,616$ 2,348,327$ 250,384$ 4,181,505$

Town of Bluffton Notes to Financial Statements
June 30, 2017
D‐31
Note 13 – State Accommodations Tax Fund
State Accommodations Tax Fund is a special revenue fund to record State Accommodations Tax receipts and grants approved by Town Council payable out of appropriations. In accordance with state law, the first $25,000 and five percent (5%) thereafter is transferred to the General Fund and thirty percent (30%) is distributed to the Hilton Head Island-Bluffton Chamber of Commerce’s Visitor and Convention Bureau. Transfers to the General Fund for the year ended June 30, 2017 totaled $41,770 and the distributions to the Visitor and Convention Bureau totaled $100,622. The remaining amounts (65%) are restricted to tourism-related projects approved by Town Council.
The Bluffton Historical Preservation Society received grant appropriations of $90,000 and expenditures of $90,000 for the year ending June 30, 2017. In addition, the Beaufort County Black Chamber of Commerce received grant appropriations of $3,980 and remains encumbered at June 30, 2017.
The unpaid balances for approved grants are reflected as an encumbrance of fund balance in the Special Revenue Fund. Fund balance at June 30, 2017, was $219,574.
Note 14 – Local Accommodations Tax Fund
Local Accommodations Tax Fund is a special revenue fund to record Local Accommodations Tax receipts and grants approved by Town Council payable out of appropriations. Eight percent (8%) of Local Accommodations Taxes is required by Town Ordinance to be transferred to the Hilton Head Island-Bluffton Chamber of Commerce. For the period ending June 30, 2017, this amount totaled $48,262. The remaining amounts are allocated to tourism-related projects approved by Town Council.
Grant appropriations and expenditures for the year ending June 30, 2017, were as follows:
Grant Recipient Appropriations Expenditures Lapsed EncumbrancesOld Town Bluffton Merchants Society 48,000$ 48,000$ -$ -$ Greater Bluffton Chamber of Commerce-Boiled Peanut Festival 11,900 - - 11,900 Historic Bluffton Arts & Seafood Festival 25,000 20,958 - 4,042The Farmers Market of Bluffton 24,050 7,362 - 16,688Beaufort County PALS - Dixie Junior Boys & Dixie World Series 50,570 - - 50,570Hilton Head Bluffton Chamber of Commerce 24,000 - - 24,000Greater Bluffton Chamber of Commerce-Taste of Bluffton 17,750 17,031 - 719 Prior Year Grant Appropriations - 10,169 - - Total 201,270$ 103,520$ -$ 107,919$
The fund balance of the Special Revenue Fund is restricted for tourism-related projects under SC Code except for the allowable 1% committed to Emergency Recovery by Town Council. Fund balance at June 30, 2017, was $460,879 of which $107,919 was encumbered by unpaid balances of approved grants.
Note 15 – Operating Leases
The Town entered into a lease with Beaufort County School District for the Town Hall facilities in December of 2000 and amended February 2015 for $108 extended to December 2099.
The Town entered into a lease with Government Capital Corporation in September 2014 for a records management system.

Town of Bluffton Notes to Financial Statements
June 30, 2017
D‐32
In addition, the Town has several five-year lease agreements for copiers designated to the various departments. For the year ended June 30, 2017, base payments under these leases totaled $93,063. Future minimum lease payments are as follows:
Year ending LeaseJune 30, Amounts
2018 92,638$ 2019 81,370 2020 12,532 2021 8,864
195,404$
Note 16 – Risk Management
The Town is exposed to various risks of losses related to torts; theft of, damage to, and destruction of assets; errors and omissions; injuries to employees; and natural disasters. The Town carries insurance coverage through the State of South Carolina for general liability and auto liability coverage of $1,000,000 per occurrence, property coverage up to the total insurance values of the property policy, workers’ compensation coverage up to statutory limits, and employee health coverage with no lifetime limit. The pools are reinsured through commercial companies for single occurrence claims against general liability, auto liability and property in excess of $60,000 and $300,000 up to statutory limits for workers’ compensation. The pools are reinsured for annual employee health claims in excess of $150,000. The property liability pool has an aggregate limit for the total property losses in a single year, with the reinsurance limit based upon a percentage of the total insurance values.
There have been no significant reductions in insurance coverage in the prior year, and settled claims have not exceeded coverage in any of the past three fiscal years.
Note 17 – Other Post-Employment Benefits
The Town does not provide any post-employment benefits to its employees at this time. Therefore, the Town has no liability at fiscal year-end under GASB 45.
Note 18 – Commitments and Contingencies
The Town is subject to various claims and contingencies related to compliance with regulations associated with various grants and other matters arising out of the normal course of business. Management of the Town believes that the ultimate liability, if any, from such claims or contingencies are covered by the Town’s insurance policies and are not likely to have a material adverse effect on the Town’s operating results, financial condition or liquidity.
Arbitrage State and local bonds issued after 1984 are subject to arbitrage restrictions as enacted by the Federal Government. To retain a bond’s tax exempt status, local governments must comply with the regulations as adopted by the government to expend all of the bond proceeds within designated periods. The Town believes it is in compliance with all arbitrage rules as of June 30, 2017.
Note 19 – Subsequent Events
Bluffton Town Council unanimously approved award of a $4,333,039 contract to JE Dunn Construction Company at its October 10, 2017 meeting to renovate Town Hall, located at 20 Bridge Street. The project includes renovating the existing structure which currently houses Town Hall offices, the Charles E. Ulmer Auditorium and Calhoun Station. It will also add 4,582 square feet to the original building. When finished, total construction will be 28,876 square feet.

Town of Bluffton Schedules of Required Supplementary Information
Pension Plan – Schedule of Town’s Proportionate Share of Net Pension Liability June 30, 2017
E-1
Measurement Date 2017 2016 2015 2017 2016 2015
Town's proportion of the net pensionliability (asset) 0.041865% 0.040187% 0.038147% 0.225660% 0.170920% 0.170920%
Town's proportionate share of the netpension liability (asset) 8,942,302$ 7,621,658$ 6,567,649$ 5,723,809$ 3,272,235$ 3,272,235$
Town's covered-employee payroll 4,054,074$ 3,768,002$ 3,462,291$ 2,407,795$ 2,055,787$ 2,055,787$
Town's proportionate share of the netpension liability (asset) as a percentageof its covered-employee payroll 220.58% 202.27% 189.69% 237.72% 159.17% 159.17%
Plan fiduciary net position as a percentageof the total pension liability 52.91% 56.99% 59.90% 60.44% 64.57% 67.55%
N/A - Information not applicable
* - The amounts presented for each fiscal year were determined as of 6/30 of the previous year.
Note: Information for the previous seven (7) years is not readily available.
SCRS PORS

Town of Bluffton Schedules of Required Supplementary Information Pension Plan – Schedule of Town’s Contributions
June 30, 2017
E-2
Fiscal Year Contributions 2017 2016 2015 2017 2016 2015
Contractually required contribtuion 506,952$ 448,381$ 410,713$ 477,674$ 395,280$ 322,885$
Contributions in relation to the contractually required contribution (506,952) (448,381) (410,713) (477,674) (395,280) (322,885)
Contribution deficiency (excess) -$ -$ -$ -$ -$ -$
Town's covered-employee payroll 4,385,398$ 4,054,074$ 3,768,002$ 3,354,450$ 2,407,795$ 2,055,787$
Contributions as a percentage of covered-employee payroll 11.56% 11.06% 10.90% 14.24% 16.42% 15.71%
Note: Information for the previous seven (7) years is not readily available.
SCRS PORS

TOWN OF BLUFFTON, SOUTH CAROLINA
SCHEDULE OF REVENUES, EXPENDITURES, AND CHANGES IN FUND BALANCES BUDGET AND ACTUAL – GENERAL FUND
FOR THE YEAR ENDED JUNE 30, 2017
F-1
Original Final Actual Amounts
Variance with Final Budget Over/ (Under)
REVENUESProperty Taxes 4,777,000$ 4,777,000$ 5,170,871$ 393,871$ Licenses & Permits
Franchise Fees 2,022,000 2,061,395 2,268,677 Business Licenses 1,875,000 1,875,000 2,030,598 MASC Telecommunications 109,140 109,140 74,932 MASC Insurance Tax Collection 1,590,000 1,590,000 1,753,303 Building Permits 1,769,270 1,769,270 2,063,472 Administrative Fees 44,000 44,000 88,000 Application Fees 65,000 65,000 108,280
Total Licenses & Permits 7,474,410 7,513,805 8,387,262 873,457 Intergovernmental
State Shared RevenuesLocal Government Fund 278,145 278,145 295,270 Federal Grants 132,310 235,135 237,033State Grants - - 37,572
Total State Shared Revenues 410,455 513,280 569,875 56,595 Other Local Governments
School Resource Officers 344,350 344,350 343,609 School Crossing Guards 66,045 66,045 53,588
Total Other Local Governments 410,395 410,395 397,197 (13,198) Total Intergovernmental 820,850 923,675 967,072 43,397
Service RevenuesContract Police Services 50,000 50,000 70,910 Impact Fee Collection Fee 51,500 51,500 62,619 Development Fees 826,000 826,000 1,043,000
Total Sales and Service 927,500 927,500 1,176,529 249,029 Fines & Fees
Municipal Court 245,000 245,000 278,397 Victims Assistance 36,260 36,260 42,167 Forfeitures 20,000 - -
Total Fees and Fines 301,260 281,260 320,564 39,304 Miscellaneous Revenues
Donations - - 12,620 Miscellaneous 30,000 30,000 122,115 Rental Income 38,000 38,000 41,725 Interest Income 6,500 6,500 21,748
Total Miscellaneous 74,500 74,500 198,208 123,708 Total Revenues 14,375,520 14,497,740 16,220,506 1,722,766
EXPENDITURESLegislative 162,055 162,055 147,754 (14,301) Economic Development 233,725 378,243 207,858 (170,385) Executive 953,790 839,761 805,686 (34,075) Human Resources 305,045 321,849 285,411 (36,438) Non-Departmental 1,422,795 1,442,795 1,442,473 (322) Finance 865,200 774,959 714,980 (59,979) Municipal Court 256,970 262,470 253,192 (9,278) Municipal Judges 56,085 60,385 52,188 (8,197) Information Technology 1,054,745 1,144,528 1,117,848 (26,680) Facilities and Asset Management 1,227,270 1,482,058 1,396,244 (85,814) Project Management 903,900 903,997 762,967 (141,030) Growth Management Administration 351,950 321,933 305,618 (16,315) Planning and Environmental Sustainability 1,095,315 1,018,145 726,953 (291,192) Building Safety 707,825 755,928 685,215 (70,713) Police 6,109,555 6,468,161 6,197,063 (271,098) Debt Service Principal 334,432 334,432 366,550 32,118 Debt Service Interest 18,228 18,228 21,889 3,661
Total Expenditures 16,058,885 16,689,927 15,489,889 (1,200,038) Excess (Deficiency) of RevenuesOver Expenditures (1,683,365) (2,192,187) 730,617 2,922,804
OTHER FINANCING SOURCES (USES)Capital Leases 324,600 324,600 325,000 400 Transfers In (Out) (1,957,385) (2,603,886) 239,510 2,843,396
Total Other Financing Sources and Uses (1,632,785) (2,279,286) 564,510 2,843,796 Net Change in Fund Balance (3,316,150) (4,471,473) 1,295,127 5,766,600
Fund Balance - Beginning 13,829,322 13,829,322 13,829,322 - Fund Balance - Ending 10,513,172$ 9,357,849$ 15,124,449$ 5,766,600$
Budgeted Amounts

TOWN OF BLUFFTON, SOUTH CAROLINA
SCHEDULE OF REVENUES, EXPENDITURES, AND CHANGES IN FUND BALANCES BUDGET AND ACTUAL – CAPITAL IMPROVEMENT PROGRAM FUND
FOR THE YEAR ENDED JUNE 30, 2017
F-2
Original Final Actual Amounts
Variance with Final Budget Over/ (Under)
REVENUESFederal/State Revenue
Federal Grants 471,600$ 1,063,965$ 494,561$ (569,404)$ State Grants - 167,000 576,449 409,449
Total Federal/State Revenue 471,600 1,230,965 1,071,010 (159,955) Other Revenues
Intergovernmental Revenue 2,219,950 1,962,000 175,306 (1,786,694) Interest Income - - 7,473 7,473 Donations 138,000 138,000 10,000 (128,000) Development Fees 22,000 22,000 521,067 499,067
Total Other Revenues 2,379,950 2,122,000 713,846 (1,408,154) Total Revenues 2,851,550 3,352,965 1,784,856 (1,568,109)
EXPENDITURESCapital Outlay
Buck Island Sewer - Phase III - 300,000 105,432 (194,568) Buck Island Sewer - Phase IV 685,800 834,643 671,082 (163,561) Buck Island Sewer - Phase V 970,000 1,050,201 14,910 (1,035,291) BIS - Neighborhood Sidewalks 75,000 81,756 20,914 (60,842) Calhoun Street & Adjacent Area Study 30,000 65,864 21,278 (44,586) Don Ryan Center for Innovation Uplift 140,000 140,000 9,732 (130,268) Dr Mellichamp Drive Streetscape 582,400 582,400 146,556 (435,844) Goethe Shultz Road Pathways 370,000 566,619 52,911 (513,708) Goethe Shultz Improvements - Phase II 75,000 75,000 23,290 (51,710) Hampton Parkway Striping 62,000 55,244 32,769 (22,475) Jason-Able Sewer 874,000 907,468 114,777 (792,691) Land Acquisition 1,000,000 2,045,549 2,017,040 (28,509) May River Preserve 10,000 241,350 9,554 (231,796) May River Road/Bruin Road Streetscape - Phase II & III 2,178,300 4,486,548 1,551,467 (2,935,081) Multiple County Commerce Park 1,900,000 1,900,000 625,992 (1,274,008) Old Town Lighting & Streetsigns 200,000 200,000 65,237 (134,763) Oyster Factory Park 202,000 304,669 277,779 (26,890) Oyster Factory Park Improvements 10,000 10,000 8,453 (1,547) Police Department Camera System Install 74,000 86,000 82,162 (3,838) Town Hall Redevelopment 2,500,000 2,976,640 199,374 (2,777,266) Town Facility Maintenance 22,000 24,423 24,179 (244) Sewer Connection Program 200,000 200,000 33,572 (166,428) Wetlands Restoration 100,000 111,034 75,073 (35,961)
Total Expenditures 12,260,500 17,245,408 6,183,533 (11,061,875) Excess (Deficiency) of RevenuesOver Expenditures (9,408,950) (13,892,443) (4,398,677) 9,493,766
OTHER FINANCING SOURCES (USES)Transfers In (Out) 8,640,565 13,207,790 3,570,340 (9,637,450) Sale of Assets - - 588,654 588,654
Total Other Financing Sources and Uses 8,640,565 13,207,790 4,158,994 (9,048,796) Net Change in Fund Balance (768,385) (684,653) (239,683) 444,970
Fund Balance - Beginning 3,795,064 3,795,064 3,795,064 - Fund Balance - Ending 3,026,679$ 3,110,411$ 3,555,381$ 444,970$
Budgeted Amounts
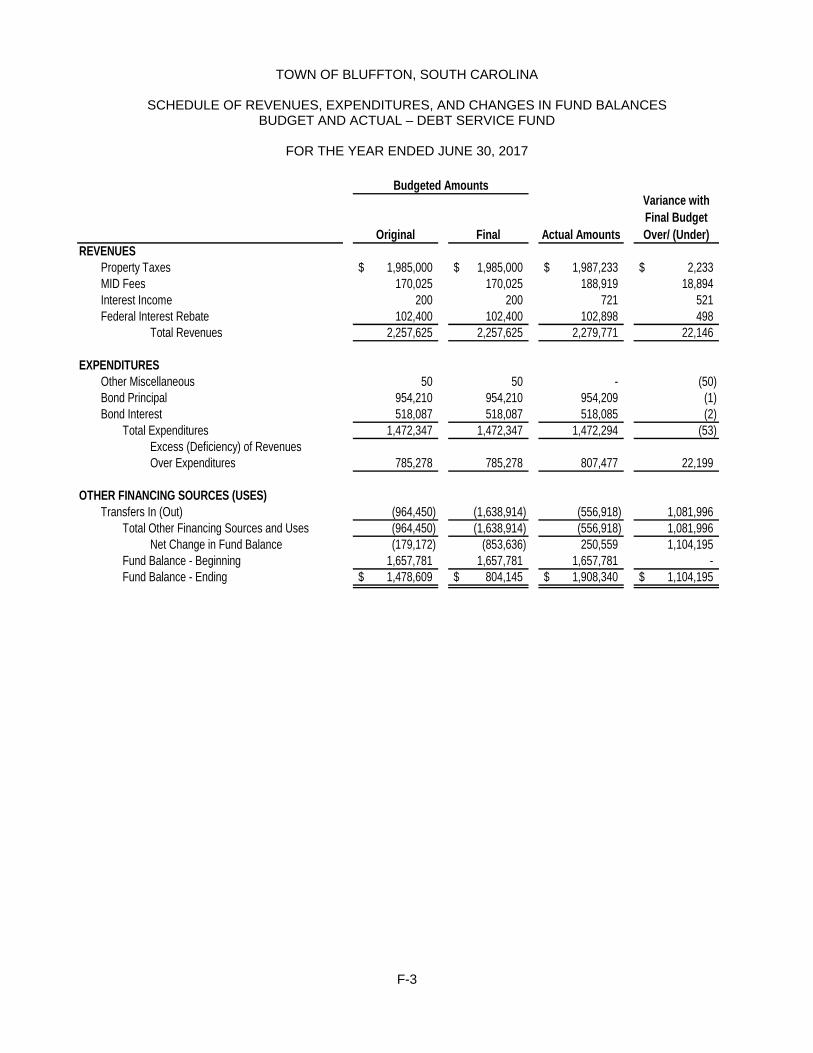
TOWN OF BLUFFTON, SOUTH CAROLINA
SCHEDULE OF REVENUES, EXPENDITURES, AND CHANGES IN FUND BALANCES BUDGET AND ACTUAL – DEBT SERVICE FUND
FOR THE YEAR ENDED JUNE 30, 2017
F-3
Original Final Actual Amounts
Variance with Final Budget Over/ (Under)
REVENUESProperty Taxes 1,985,000$ 1,985,000$ 1,987,233$ 2,233$ MID Fees 170,025 170,025 188,919 18,894 Interest Income 200 200 721 521 Federal Interest Rebate 102,400 102,400 102,898 498
Total Revenues 2,257,625 2,257,625 2,279,771 22,146
EXPENDITURESOther Miscellaneous 50 50 - (50) Bond Principal 954,210 954,210 954,209 (1) Bond Interest 518,087 518,087 518,085 (2)
Total Expenditures 1,472,347 1,472,347 1,472,294 (53) Excess (Deficiency) of RevenuesOver Expenditures 785,278 785,278 807,477 22,199
OTHER FINANCING SOURCES (USES)Transfers In (Out) (964,450) (1,638,914) (556,918) 1,081,996
Total Other Financing Sources and Uses (964,450) (1,638,914) (556,918) 1,081,996 Net Change in Fund Balance (179,172) (853,636) 250,559 1,104,195
Fund Balance - Beginning 1,657,781 1,657,781 1,657,781 - Fund Balance - Ending 1,478,609$ 804,145$ 1,908,340$ 1,104,195$
Budgeted Amounts

TOWN OF BLUFFTON, SOUTH CAROLINA
SCHEDULE OF REVENUES, EXPENDITURES, AND CHANGES IN FUND BALANCES BUDGET AND ACTUAL – STORMWATER FUND
FOR THE YEAR ENDED JUNE 30, 2017
F-4
Original Final Actual Amounts
Variance with Final Budget Over/ (Under)
REVENUESLicenses & Permits
Stormwater Fees 1,290,450$ 1,290,450$ 1,276,931$ (13,519)$ Federal/State Revenue
Federal Grants - 28,464 10,208 (18,256) State Grants - - 135,337 135,337
Total Federal/State Revenue - 28,464 145,545 117,081 Other Revenues
Interest Income 150 150 - (150) Total Revenues 1,290,600 1,319,064 1,422,476 103,412
EXPENDITURESPersonnel
Stormwater 464,515 464,515 451,797 (12,718) Operating Costs
Stormwater 286,180 286,180 272,208 (13,972) Capital Outlay
319 Grant - Phase II - 99,961 96,749 (3,212) Total Expenditures 750,695 850,656 820,754 (29,902)
Excess (Deficiency) of RevenuesOver Expenditures 539,905 468,408 601,722 133,314
OTHER FINANCING SOURCES (USES)Transfers In (Out) (2,150,800) (2,322,302) (673,616) 1,648,686
Total Other Financing Sources and Uses (2,150,800) (2,322,302) (673,616) 1,648,686 Net Change in Fund Balance (1,610,895) (1,853,894) (71,894) 1,782,000
Fund Balance - Beginning 2,242,632 2,242,632 2,242,632 - Fund Balance - Ending 631,737$ 388,738$ 2,170,738$ 1,782,000$
Budgeted Amounts

TOWN OF BLUFFTON, SOUTH CAROLINA
COMBINING BALANCE SHEET NONMAJOR GOVERNMENTAL FUNDS
JUNE 30, 2017
F-5
Boat Ramp Fund
State Accommodations
Tax Fund
Local Accommodations
Tax Fund
Seized and Forfeited Assets
Total Nonmajor
Special Revenue
FundsASSETSCash and Cash Equivalents -$ 109,981$ 375,540$ -$ 485,521$
Restricted Cash and Cash Equivalents 45,996 - - 44,398 90,394
Other Receivables - 174,727 239,389 - 414,116
Due from other Funds 150 - 3,980 - 4,130
Total Assets 46,146$ 284,708$ 618,909$ 44,398$ 994,161$
LIABILITIES AND FUND BALANCESAccounts Payable 150$ 52,418$ 69,215$ 19,173$ 140,956$
Due to other Funds - 12,716 88,815 2,135 103,666
Total Liabilities 150 65,134 158,030 21,308 244,622
Fund Balances:Nonspendable - - - - -
Restricted 45,996 219,574 460,879 23,090 749,539
Committed - - - - -
Assigned - - - - -
Unassigned - - - - -
Total Fund Balances 45,996 219,574 460,879 23,090 749,539
Total Liabilities and Fund Balances 46,146$ 284,708$ 618,909$ 44,398$ 994,161$

TOWN OF BLUFFTON, SOUTH CAROLINA
COMBINING OF REVENUES, EXPENDITURES, AND CHANGES IN FUND BALANCES NONMAJOR GOVERNMENTAL FUNDS
FOR THE YEAR ENDED JUNE 30, 2017
F-6
Boat Ramp Fund
State Accommodations
Tax Fund
Local Accommodations
Tax Fund
Seized and Forfeited Assets
Total Nonmajor
Special Revenue
FundsREVENUES
Accommodations Taxes -$ 360,408$ 603,280$ -$ 963,688$
Development Fees 22,950 - - - 22,950
Interest Income 27 31 108 21 187
Confiscated Reveues - - - 6,697 6,697
Total Revenues 22,977 360,439 603,388 6,718 993,522
EXPENDITURES
Current
Administrative - - - 3,023 3,023
Community Development - 194,602 151,792 - 346,394
Total Expenditures - 194,602 151,792 3,023 349,417
Excess (Deficiency) of Revenues
Over Expenditures 22,977 165,837 451,596 3,695 644,105
OTHER FINANCING SOURCES (USES)
Transfers In - - - 19,395 19,395
Transfers Out - (41,770) (208,614) - (250,384)
Total Other Financing Sources
and Uses - (41,770) (208,614) 19,395 (230,989)
Net Change in Fund Balance 22,977 124,067 242,982 23,090 413,116
Fund Balance - Beginning 23,019 95,507 217,897 - 336,423
Fund Balance - Ending 45,996$ 219,574$ 460,879$ 23,090$ 749,539$

Statistical Section(unaudited)
This part of the Town of Bluffton's comprehensive financial report represents detailedinformation as a context for understanding what the information in the financial statements,note disclosures, and required supplementary information says about the Town's overall financial health.
Contents Page
Financial Trends G2-G6 These schedules contain trend information to help the reader understand how the Town's financial performance and well being have changed over time.
Revenue Capacity G7-G12 These schedules contain information to help the reader assess the factors affecting the Town's ability to generate its property and sales taxes.
Debt Capacity G13-G17 These schedules present information to help the reader assess the affordability of the Town's current levels of outstanding debt and the Town's abilities to issue additional debt in the future.
Demographic and Economic Information G18-G19 These schedules offer demographic and economic indicators to help the reader understand the environment within which the Town's financial activities take place.
Operating Information G20-G22 These schedules contain information about the Town's operations and resources to help the reader understand how the Town's financial information relates to the services the Town provides and the activities it performs.
Sources: Unless otherwise noted, the information in these schedules is derived from the Annual Financial
Statements audit reports for the relevant year.
G1

Schedule 1Town of Bluffton, SCNet Position by Component, Last Ten Fiscal Years(accrual basis of accounting)
2008 2009 2010 2011 2012 2013 2014 2015 2016 2017Governmental activities
Net investment in capital assets 12,047,567$ 12,518,793$ 9,807,190$ 8,600,498$ 8,456,941$ 9,552,186$ 10,745,284$ 11,556,509$ 11,494,116$ 13,698,001$ Restricted 4,531,438 2,492,544 214,401 5,152,452 5,474,434 6,629,087 7,566,263 8,501,810 10,006,700 8,494,579 Unrestricted 4,313,844 5,653,065 7,654,350 4,609,087 5,203,005 6,543,899 8,328,146 1,316,954 4,208,504 6,039,836
Total governmental activities net position 20,892,849$ 20,664,402$ 17,675,941$ 18,362,037$ 19,134,380$ 22,725,172$ 26,639,693$ 21,375,273$ 25,709,320$ 28,232,416$
G2

Schedule 2Town of Bluffton, SCChanges in Net Position, Last Ten Fiscal Years(accrual basis of accounting)
2008 2009 2010 2011 2012 2013 2014 2015 2016 2017ExpensesGovernmental activities:
General Government:Administration 2,715,940$ 3,171,895$ 2,807,552$ 2,624,831$ 2,741,335$ 2,953,686$ 3,177,857$ 3,675,493$ 4,210,681$ 4,858,208$ Judicial 451,086 278,295 307,603 307,168 312,215 300,056 261,663 278,425 302,390 325,019 Planning 841,091 1,011,981 1,556,322 1,212,826 997,773 896,613 797,378 744,605 873,476 801,474
Public Safety:Building Safety 375,157 740,370 985,977 806,099 666,711 685,841 832,699 962,685 981,279 1,036,905 Police 3,106,849 3,506,817 3,383,148 3,423,620 3,680,878 3,752,007 4,007,350 4,801,530 5,691,428 6,720,715
Public Works 452,851 546,691 779,592 820,750 912,322 912,800 945,375 1,034,327 938,380 1,417,406 Environmental Protection/Stormwater Management 816,075 918,052 - - 628,636 638,438 644,128 652,579 963,939 800,781 Engineering/Project Management 477,419 686,276 662,107 808,562 665,071 612,469 487,943 876,330 921,486 1,170,935 Community Development 856,205 1,287,273 1,258,689 3,820,154 2,787,424 1,500,055 1,070,319 1,027,545 2,694,505 4,364,665 Interest on Long-Term Debt 642,512 558,983 523,777 756,571 705,764 1,005,006 664,378 684,047 568,805 539,244
Total governmental activities expenses 10,735,185$ 12,706,633$ 12,264,767$ 14,580,581$ 14,098,129$ 13,256,971$ 12,889,090$ 14,737,566$ 18,146,369$ 22,035,352$
Program Revenues (see Schedule 3)Governmental activities:
Charges for services:General Government
Administration 3,156,457$ 3,306,249$ 3,177,906$ 3,276,217$ 3,601,641$ 4,120,809$ 5,016,969$ 5,465,905$ 5,764,361$ 6,127,510$ Judicial 218,263 246,837 256,973 227,290 196,065 190,993 164,583 277,388 278,360 320,564 Planning 817,380 583,987 1,256,292 450,158 382,225 557,075 630,359 898,669 1,055,317 1,324,816
Public SafetyBuilding Safety - 199,312 424,196 532,291 576,706 979,777 1,090,532 1,608,131 2,118,220 2,063,472 Police 86,153 89,156 65,008 75,353 55,985 56,638 54,610 65,820 59,585 70,910
Environmental Protection/Stormwater Management 393,835 956,318 - - - - - - Community Development 322,274 151,897 159,275 165,000 156,750 242,225 - 343,800 642,600 521,100
Operating grants and contributions 114,983 146,419 403,468 467,776 410,086 267,960 236,472 317,366 480,525 691,119 Capital grants and contributions 96,295 150,600 183,252 2,849,085 2,172,461 2,552,546 1,565,210 1,322,203 2,614,001 2,579,042
Total governmental activities program revenues 5,205,640$ 5,830,775$ 5,926,370$ 8,043,170$ 7,551,919$ 8,968,023$ 8,758,735$ 10,299,282$ 13,012,969$ 13,698,533$
Net (Expense)RevenueTotal governmental activities net expense (5,529,545)$ (6,875,858)$ (6,338,397)$ (6,537,411)$ (6,546,210)$ (4,288,948)$ (4,130,355)$ (4,438,284)$ (5,133,400)$ (8,336,819)$
General Revenues and Other Changes in Net PositionGovernmental activities:
TaxesProperty taxes 3,811,999$ 4,706,019$ 5,245,883$ 5,152,002$ 5,233,427$ 5,573,318$ 5,580,452$ 6,089,064$ 6,716,062$ 7,158,104$ Other taxes 1,245,040 1,115,603 1,118,513 1,324,608 1,514,316 1,720,504 1,849,205 2,015,182 2,224,751 2,860,650
Intergovernmental Revenue 277,104 407,173 170,274 233,896 284,065 330,780 617,942 634,044 615,847 686,837 Investment earnings 651,325 311,680 181,283 108,796 35,283 10,070 9,576 12,963 12,200 31,460 Capital contributions - - - - - - - - Gain/(Loss) on Sale of Capital Assets 912,810 - - - - - - - (171,500) - Miscellaneous 489,892 106,936 118,199 404,205 251,462 245,068 91,201 176,981 70,087 122,864
Total governmental activities 7,388,170$ 6,647,411$ 6,834,152$ 7,223,507$ 7,318,553$ 7,879,740$ 8,148,376$ 8,928,234$ 9,467,447$ 10,859,915$
Change in Net PositionGovernmental activities 1,858,625$ (228,447)$ 495,755$ 686,096$ 772,343$ 3,590,792$ 4,018,021$ 4,489,950$ 4,334,047$ 2,523,096$
G3

Schedule 3Town of Bluffton, SCProgram Revenues by Function/Program, Last Ten Fiscal Years(accrual basis of accounting)
2008 2009 2010 2011 2012 2013 2014 2015 2016 2017
Function/ProgramGovernmental activities:
General GovernmentAdministration 3,156,457$ 3,306,249$ 3,177,906$ 3,276,217$ 3,601,641$ 4,120,809$ 5,016,969$ 5,465,905$ 5,764,361$ 6,127,510$ Municipal Court 218,263 246,837 256,973 227,290 196,065 190,993 164,583 277,388 278,360 320,564 Planning 817,380 583,987 1,256,292 450,158 382,225 557,075 630,359 898,669 1,055,317 1,324,816
Public SafetyBuilding Safety - 199,312 424,196 532,291 576,706 979,777 1,090,532 1,608,131 2,118,220 2,063,472 Police 86,153 89,156 65,008 75,353 55,985 56,638 54,610 65,820 59,585 70,910
Environmental Protection/Stormwater Management 393,835 956,318 - - - - - - - - Community Development 322,274 151,897 159,275 165,000 156,750 242,225 - 343,800 642,600 521,100 Operating grants and contributions 114,983 146,419 403,468 467,776 410,086 267,960 236,472 317,366 480,525 691,119 Capital grants and contributions 96,295 150,600 183,252 2,849,085 2,172,461 2,552,546 1,565,210 1,322,203 2,614,001 2,579,042
Total governmental activities 5,205,640$ 5,830,775$ 5,926,370$ 8,043,170$ 7,551,919$ 8,968,023$ 8,758,735$ 10,299,282$ 13,012,969$ 13,698,533$
G4

Schedule 4Town of Bluffton, SCFund Balances, Governmental FundsLast Ten Fiscal Years(modified accrual basis of accounting)
2008 2009 2010 2011 2012 2013 2014 2015 2016 2017
Pre-GASB 54 1
General FundReserved 530,164$ 253,102$ 630,934$ Unreserved 4,506,377 3,718,570 3,419,594
Total General Fund 5,036,541$ 3,971,672$ 4,050,528$
All Other Governmental FundsReserved 9,677,482$ 8,275,859$ 4,748,173$ Unreserved, reported in:
Special revenue funds 987,572 158,210 202,191 Total all other governmental funds 10,665,054$ 8,434,069$ 4,950,364$
Post-GASB 54 1
General FundNonspendable 148,094$ 174,744$ 168,714$ 167,490$ 184,569$ 177,876$ 245,442$ 253,037$ Restricted 436,555 540,516 688,579 895,290 759,661 824,985 860,630 624,615 Committed 1,567,690 1,567,691 1,833,770 1,939,386 1,990,521 2,333,802 2,673,900 4,229,733 Assigned 194,379 132,992 - - - - - - Unassigned 1,703,810 2,333,024 2,520,528 3,968,242 5,917,866 8,019,133 10,049,350 10,017,064
Total General Fund 4,050,528$ 4,748,967$ 5,211,591$ 6,970,408$ 8,852,617$ 11,355,796$ 13,829,322$ 15,124,449$
All Other Governmental FundsRestricted 4,492,059$ 4,437,192$ 4,668,755$ 5,566,307$ 6,622,033$ 7,676,824$ 9,146,070$ 7,869,964$ Committed 9,999 780,050 237,594 315,565 135,730 22,200 261,202 1,772,001 Assigned 448,306 833,838 381,712 865,782 1,004,002 1,494,675 1,933,087 1,600,458
Total all other governmental funds 4,950,364$ 6,051,080$ 5,288,061$ 6,747,654$ 7,761,765$ 9,193,699$ 11,340,359$ 11,242,423$
1 The Town implemented GASB 54, Fund Balance Reporting and Governmental Fund Type Definitions, in FY 2011. FY 2010 has been recalculated for comparison purposes.
Notes: Significant increase in fund balance in Fiscal Year 2006 due to bond proceeds.
G5

Schedule 5Town of Bluffton, SCChanges in Fund Balances, Governmental FundsLast Ten Fiscal Years(modified accrual basis of accounting)
2008 2009 2010 2011 2012 2013 2014 2015 2016 2017RevenuesTaxes (see Schedule 6) 5,057,039$ 5,821,622$ 6,364,396$ 6,476,610$ 6,747,743$ 7,293,822$ 7,429,657$ 8,104,246$ 8,940,813$ 10,018,754$
Licenses and permits 4,242,728 5,012,441 4,787,752 5,125,588 5,477,203 6,521,506 7,570,195 8,796,439 9,982,960 10,374,179
Fees and Fines 218,263 246,837 256,973 227,290 196,065 190,993 164,583 279,641 297,783 320,564
Charges for services 622,648 395,121 294,925 330,695 335,540 513,105 598,890 857,264 1,042,973 1,199,479
Intergovernmental 277,104 407,173 170,274 483,896 284,065 675,842 843,547 711,079 904,097 970,671
Grants and entitlements 114,983 155,879 586,720 1,413,877 1,543,111 1,514,043 179,462 283,803 1,397,633 1,497,857
Investment earnings 626,817 282,147 154,621 83,373 35,283 10,070 9,576 13,466 12,702 31,460
Other revenues 574,376 227,433 218,199 497,904 251,463 172,818 111,201 181,578 72,955 186,460 Total revenues 11,733,958$ 12,548,653$ 12,833,860$ 14,639,233$ 14,870,473$ 16,892,199$ 16,907,111$ 19,227,516$ 22,651,916$ 24,599,424$
ExpendituresLegislative 95,581$ 136,996$ 142,930$ 126,729$ 82,606$ 95,321$ 103,148$ 126,291$ 154,466$ 147,754$
Executive 784,241 995,011 464,927 317,952 328,699 379,349 425,677 729,375 911,914 805,686
Economic Development - - - - 54,309 164,527 191,686 248,943 178,005 207,858
Human Resources - - - 184,193 187,384 185,885 234,151 234,489 286,519 285,411
Non-Departmental 1,393,442 1,151,854 1,003,794 774,025 842,452 831,061 895,425 971,594 1,086,435 1,442,473
Finance 358,048 410,066 568,429 588,792 592,727 628,670 609,957 614,757 711,162 714,980
Municipal Court 424,501 229,093 254,623 257,753 268,860 251,726 223,621 228,639 238,894 253,192
Municipal Judges 31,025 44,228 49,456 47,437 41,316 47,026 37,373 45,809 52,811 52,188
Information Technology - 382,810 397,046 446,551 494,425 535,309 557,241 602,567 729,118 1,001,627
Public Works 378,345 447,916 685,502 753,620 796,449 834,542 845,448 938,131 839,274 1,302,326
Environmental Protection/Stormwater Management 807,623 908,517 111,079 - 574,097 629,281 624,318 619,579 634,437 724,005
Engineering/Project Management 411,951 618,370 599,358 745,533 618,710 567,703 490,314 510,368 540,200 762,967
Growth Management - - 398,903 322,261 380,789 391,703 449,054 336,652 360,106 305,618
Planning and Community Development 830,649 1,000,233 1,046,341 879,713 609,598 497,474 361,910 396,287 839,624 726,953
Building Safety 340,488 710,054 970,950 792,362 649,635 676,502 815,999 943,115 578,904 662,922
Police 2,765,268 3,116,134 3,065,401 3,086,150 3,343,082 3,488,330 3,723,356 4,532,209 5,271,030 6,031,612
Community Development 428,247 359,476 199,836 328,621 376,272 428,422 391,361 385,019 333,752 346,394
Capital Outlay 5,308,586 3,347,144 4,190,769 7,325,822 2,972,393 2,251,728 1,964,449 1,278,887 3,154,082 6,681,188
Debt Service
Interest 580,995 565,371 532,966 659,431 706,611 686,850 667,612 662,643 564,365 539,974
Principal 294,393 1,629,764 1,556,399 908,743 1,418,461 690,858 960,609 1,112,874 1,361,064 1,320,759
Cost of Issuance - - - 174,239 - - - -Total expenditures 15,233,383$ 16,053,037$ 16,238,709$ 18,719,927$ 15,338,875$ 14,262,267$ 14,572,709$ 15,518,228$ 18,826,162$ 24,315,887$
Excess of revenues
over (under) expenditures (3,499,425) (3,504,384) (3,404,849) (4,080,694) (468,402) 2,629,932 2,334,402 3,709,288 3,825,754 283,537
Other FinancingSources (Uses)Issuance of Bonds -$ -$ -$ 18,370,000$ -$ -$ - 8,923,000$ -$ -$
Underwriter's Premium (Discount) - - - (3,121) - - - (23,075) - -
Current Refund of Existing Debt - - - (12,875,000) - - - (9,230,000) - -
Sale of Capital Assets 120,000 - - 387,970 - 388,479 74,420 273,432 588,654
Capital Leases 193,220 208,531 - - 168,000 200,000 591,000 555,900 521,000 325,000
Transfers In 4,744,520 3,666,517 3,876,944 2,936,493 1,844,092 924,997 1,295,929 1,195,262 1,898,320 4,097,065
Transfers Out (4,744,520) (3,666,517) (3,876,944) (2,936,493) (1,844,092) (924,997) (1,295,929) (1,195,262) (1,898,320) (4,097,065) Total other financing sources (uses) 313,220$ 208,531$ -$ 5,879,849$ 168,000$ 588,479$ 665,420$ 225,825$ 794,432$ 913,654$
Net change in fund balances (3,186,205)$ (3,295,853)$ (3,404,849)$ 1,799,155$ (300,402)$ 3,218,411$ 2,999,822$ 3,935,113$ 4,620,186$ 1,197,191$
Debt service as a
percentage of non-
capital expenditures 7.9% 16.4% 15.9% 11.8% 14.5% 10.8% 12.6% 11.9% 10.6% 8.7%
G6
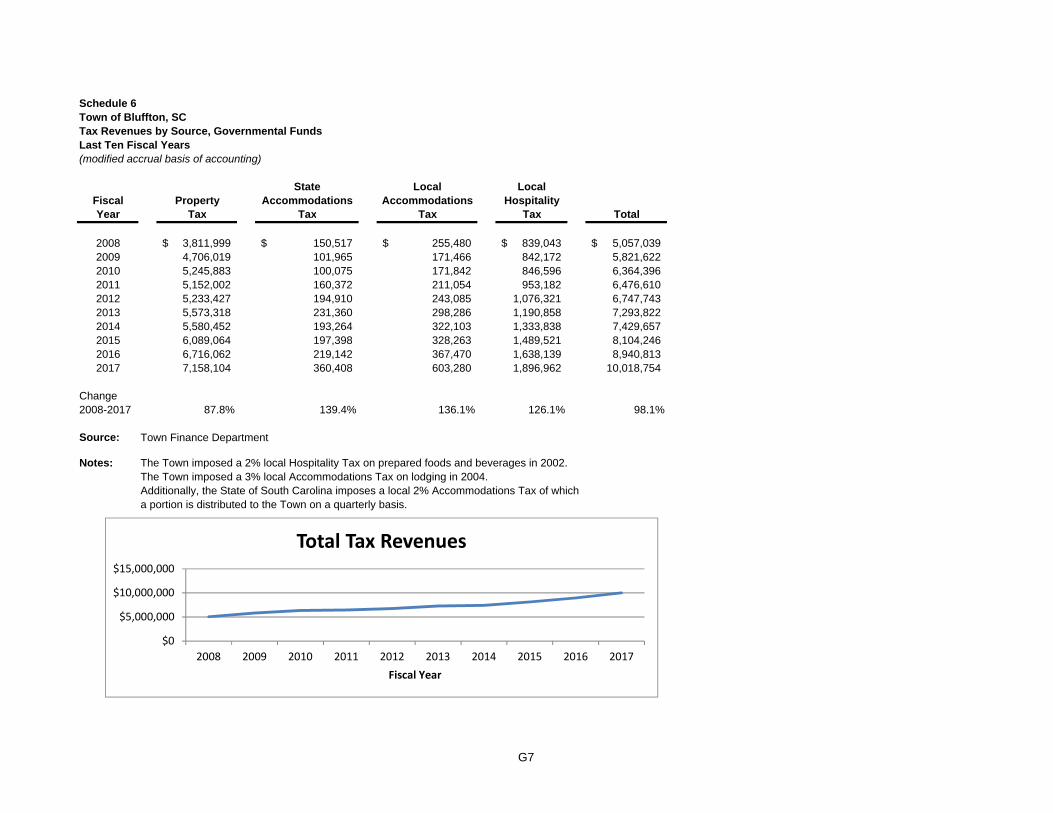
Schedule 6Town of Bluffton, SCTax Revenues by Source, Governmental FundsLast Ten Fiscal Years(modified accrual basis of accounting)
State Local LocalFiscal Property Accommodations Accommodations HospitalityYear Tax Tax Tax Tax Total
2008 3,811,999$ 150,517$ 255,480$ 839,043$ 5,057,039$ 2009 4,706,019 101,965 171,466 842,172 5,821,622 2010 5,245,883 100,075 171,842 846,596 6,364,396 2011 5,152,002 160,372 211,054 953,182 6,476,610 2012 5,233,427 194,910 243,085 1,076,321 6,747,743 2013 5,573,318 231,360 298,286 1,190,858 7,293,822 2014 5,580,452 193,264 322,103 1,333,838 7,429,657 2015 6,089,064 197,398 328,263 1,489,521 8,104,246 2016 6,716,062 219,142 367,470 1,638,139 8,940,813 2017 7,158,104 360,408 603,280 1,896,962 10,018,754
Change2008-2017 87.8% 139.4% 136.1% 126.1% 98.1%
Source: Town Finance Department
Notes: The Town imposed a 2% local Hospitality Tax on prepared foods and beverages in 2002.The Town imposed a 3% local Accommodations Tax on lodging in 2004. Additionally, the State of South Carolina imposes a local 2% Accommodations Tax of whicha portion is distributed to the Town on a quarterly basis.
$0
$5,000,000
$10,000,000
$15,000,000
2008 2009 2010 2011 2012 2013 2014 2015 2016 2017
Fiscal Year
Total Tax Revenues
G7

Schedule 7Town of Bluffton, SCAssessed Value and Estimated Actual Value of Taxable PropertyLast Ten Fiscal Years
TaxableAssessed
Total Value as aReal & Personal Property Motor Vehicles Total Taxable Direct Percentage of
Fiscal Tax Assessed Estimated Assessed Estimated Assessed Estimated Tax Estimated ActualYear Year Value Actual Value Value Actual Value Value Actual Value Rate Taxable Value
2008 2007 91,606,794 1,760,140,210 4,545,857 75,764,283 96,152,651 1,835,904,493 40.00 5.24%2009 2008 117,639,926 2,240,638,874 4,988,255 83,137,583 122,628,181 2,323,776,458 40.00 5.28%2010 2009 131,730,227 2,476,463,407 5,293,319 88,221,983 137,023,546 2,564,685,390 38.00 5.34%2011 2010 130,372,943 2,464,735,850 6,093,820 101,563,667 136,466,763 2,566,299,517 38.00 5.32%2012 2011 130,578,732 2,489,307,650 6,372,315 106,205,250 136,951,047 2,595,512,900 38.00 5.28%2013 2012 149,190,533 2,822,563,022 9,196,340 153,272,333 158,386,873 2,975,835,355 38.00 5.32%2014 2013 130,020,720 2,452,999,629 10,538,720 175,645,333 140,559,440 2,628,644,962 44.35 5.35%2015 2014 136,945,050 2,590,016,419 9,549,500 159,158,333 146,494,550 2,749,174,752 44.35 5.33%2016 2015 140,889,336 2,654,799,615 14,139,420 235,657,000 155,028,756 2,890,456,615 44.35 5.36%2017 2016 154,685,800 2,919,919,981 14,160,660 236,011,000 168,846,460 3,155,930,981 42.35 5.35%
Source: Beaufort County Assessor's Office.
Note: Property in Beaufort County is reassessed once every five years on average. The last reassessment was tax year 2009. Currently, the county assesses property at 6%and 4% of actual value for real property, 10.5% for personal property, and 6% for motor vehicles. Estimated actual taxable value is calculated by dividing taxable assessed value by those percentages. Tax rates are per $1,000 of assessed value.
$0
$20,000,000
$40,000,000
$60,000,000
$80,000,000
$100,000,000
$120,000,000
$140,000,000
$160,000,000
$180,000,000
2008 2009 2010 2011 2012 2013 2014 2015 2016 2017
Fiscal Year
Total Assessed Values
$0
$500,000,000
$1,000,000,000
$1,500,000,000
$2,000,000,000
$2,500,000,000
$3,000,000,000
$3,500,000,000
2008 2009 2010 2011 2012 2013 2014 2015 2016 2017
Fiscal Year
Total Estimated Actual Values
G8

Schedule 8Town of Bluffton, SCDirect and Overlapping Property Tax RatesLast Ten Fiscal Years(rate per thousand of assessed value)
Town Direct Rates Overlapping Rates
Total County County County Bluffton Bluffton TotalFiscal Tax General Debt Direct County County Land Schools Schools Fire District Fire District Overlapping TotalYear Year Fund Service Rate Operations Debt Purchase Operations Debt Operations Debt Rate Rate
2008 2007 40.00 - 40.00 38.90 5.80 2.70 104.70 22.60 21.10 0.90 196.70 236.70 2009 2008 40.00 - 40.00 45.50 4.00 2.40 102.60 28.00 22.30 0.40 205.20 245.20
* 2010 2009 38.00 - 38.00 40.21 3.64 2.13 90.26 24.43 19.67 0.37 180.71 218.71 2011 2010 35.70 2.30 38.00 40.21 4.57 2.76 90.26 26.33 19.67 0.38 184.18 222.18 2012 2011 35.70 2.30 38.00 40.21 4.57 2.76 90.26 28.00 19.67 0.38 185.85 223.85 2013 2012 35.70 2.30 38.00 40.21 4.44 3.87 92.26 28.00 20.49 - 189.27 227.27
** 2014 2013 40.00 4.35 44.35 46.48 5.48 4.34 97.45 31.71 24.02 - 209.48 253.83 2015 2014 40.00 4.35 44.35 46.48 5.48 4.90 103.50 31.71 24.02 - 216.09 260.44 2016 2015 40.00 4.35 44.35 48.77 5.48 4.90 103.50 31.71 24.02 1.22 219.60 263.95 2017 2016 39.00 3.35 42.35 50.89 5.48 4.90 111.50 31.71 24.64 1.10 230.22 272.57
Source: Beaufort County Auditor's Office and Town Finance Department
* Represents Reassessment and millage rollback** Represents Reassessment and millage rollforward
Notes: The Town's basic property tax rate may be increased only by a majority vote of Town Council after sufficient public notice has been provided to the citizens. State legislature limits themillage rate increase for general operating purposes to the region's average CPI for the January through December period of the prior year plus estimated population growth.
Overlapping rates are those of local and county governments that apply to property owners within the Town of Bluffton in addition to those impacted directly by the Town itself. Not all overlappingrates apply to all of the Beaufort County School District property owners. Beginning with Tax Year 2006, a 1% statewide sales tax was used to pay the operating expenses that would otherwisehave been paid by owner occupied residents as a part of their millage rate. Prior to Tax Year 2006, the owner occupied and non-owner occupied rates were the same. Whereas currently, theBeaufort County School District rates apply only to non-owner occupied properties.
34.00
36.00
38.00
40.00
42.00
44.00
46.00
2008 2009 2010 2011 2012 2013 2014 2015 2016 2017
Mills
Fiscal Year
Town of Bluffton Millage Rates
0.00
50.00
100.00
150.00
200.00
250.00
2008 2009 2010 2011 2012 2013 2014 2015 2016 2017
Mills
Fiscal Year
Overlapping Millage Rates Beaufort County and Bluffton Fire District
G9

Schedule 9Town of Bluffton, SCPrincipal Property Tax PayersCurrent Year and Nine Years Ago
Fiscal Year 2017 Fiscal Year 2008Tax Year 2016 Tax Year 2007
Percentage Percentageof Total Town of Total Town
Total Taxable Total TaxableAssessed Assessed Assessed Assessed
Taxpayer Value Rank1 Value Value Rank1 Value
South Carolina Electric & Gas 4,957,100$ 1 2.94% 2,170,910$ 2 2.26%Palmetto Electric Cooperative 1,855,060 2 1.10% 1,531,172 3 1.59%Garrison Bluffton LLC 1,306,610 3 0.77%Bluffton Telephone Company Inc 1,183,890 4 0.70%Palmetto Bluff Lodge LLC 1,013,670 5 0.60%May River Forest 845,350 6 0.50% 2,652,416 1 2.76%Crowne Old Carolina LLC A Delaware LLC 826,350 7 0.49%Bre Mariner Belfair Town Village LLC 768,330 8 0.46% 908,326 4 0.94%Real Sub LLC 726,160 9 0.43%CareCore Properties LLC 1,262,180 10 0.75%Hampton Lake LLC 969,750 5 1.01%Sea Turtle Entertainment 889,602 6 0.93%Village Park Communities 694,878 7 0.72%William Wrigley, Jr. 694,620 8 0.72%JPR Properties 458,274 9 0.48%Rose Canyon Bluffton LLC 478,878 10 0.50%
Total 14,744,700$ 8.73% 11,448,826$ 11.91%
Source: Beaufort County Assessor's Office
1Note: The rankings are based on total taxes paid and not the total assessed value.
G10

Schedule 10Town of Bluffton, SCProperty Tax Levies and CollectionsLast Ten Fiscal Years
Fiscal Taxes Collected within the CollectionsYear Levied Fiscal Year of the Levy In Total Collections to Date
Ended Tax for the Percentage Subsequent PercentageJune 30, Year Fiscal Year Amount of Levy Years Amount of Levy
2008 2007 3,846,106 3,703,569 96.29% 72,109 3,775,678 98.17%2009 2008 4,905,127 4,555,641 92.88% 287,529 4,843,170 98.74%2010 2009 5,176,582 4,875,274 94.18% 172,822 5,048,096 97.52%2011 2010 5,100,085 4,899,168 96.06% 153,203 5,052,371 99.06%2012 2011 5,293,555 4,976,802 94.02% 207,463 5,184,266 97.94%2013 2012 5,426,594 5,275,406 97.21% 122,449 5,397,855 99.47%2014 2013 5,610,943 5,364,595 95.61% 7,279 5,364,595 95.61%2015 2014 5,989,057 5,978,582 99.83% 32,515 5,978,582 99.83%2016 2015 6,876,467 6,550,702 95.26% n/a 6,550,702 95.26%2017 2016 7,141,565 7,025,202 98.37% n/a 7,025,202 98.37%
Source: Beaufort County Treasurer's Office and Finance Department.
Note: Penalties associated with delinquent collections are not included in this schedule. For some fiscal years , information for collections in subsequent years is not always available at time of printing. Therefore, delinquent collections may be shown in the year collected and may result in collection percentages slightly (immaterial) higher.
G11

Schedule 11Town of Bluffton, SCDirect and Overlapping Sales Tax RatesLast Ten Fiscal Years
TownFiscal Direct Beaufort SouthYear Rate County Carolina
2008 0% 1% 6%2009 0% 1% 6%2010 0% 1% 6%2011 0% 1% 6%2012 0% 1% 6%2013 0% 0% 6%2014 0% 0% 6%2015 0% 0% 6%2016 0% 0% 6%2017 0% 0% 6%
Sources: Beaufort County and Town Finance Department
G12

Schedule 12Town of Bluffton, SCRatios of Outstanding Debt by TypeLast Ten Fiscal Years
General Retirement Other Intergovernmental PercentageFiscal Obligation Revenue Notes Notes Agreement Capital Operating of Personal PerYear Bonds Bonds Payable Payable Payments Leases Payable Total Incomea Capitaa
2008 60,000 14,000,000 70,756 - 2,970,000 449,079 - 17,549,835 0.00% 1,423 2009 40,000 13,450,000 60,612 - 2,230,000 313,945 - 16,094,557 0.00% 1,286 2010 20,000 12,875,000 49,859 - 1,490,000 137,346 - 14,572,205 0.00% 1,130 2011 6,500,000 11,870,000 38,463 - 750,000 - - 19,158,463 0.01% 1,505 2012 6,500,000 11,240,000 - - - 168,000 - 17,908,000 0.01% 1,385 2013 6,500,000 10,590,000 - - - 327,142 - 17,417,142 0.00% 1,280 2014 6,300,000 9,920,000 - - 300,000 527,533 - 17,047,533 0.00% 1,122 2015 6,090,000 8,923,000 - - 200,000 919,944 219,146 16,352,090 0.00% 978 2016 5,875,000 8,212,365 - - 38,000 1,167,525 - 15,292,890 0.00% 809 2017 5,650,000 7,483,156 - - - 1,125,974 - 14,259,130 n/a n/a
Note: Details regarding the Town's outstanding debt can be found in the notes to the financial statements.
aSee Schedule 17 for personal income and population data. These ratios are calculated using personal income for the prior calendar year.n/a-Data not available at time of printing.
G13

Schedule 13Town of Bluffton, SCRatios of General Bonded Debt OutstandingLast Ten Fiscal Years
Percentage ofGeneral Actual Taxable
Fiscal Obligation Total Valuea of PerYear Bonds Gross Property Capitab
2008 60,000$ 60,000$ 0.00% 6$ 2009 40,000 40,000 0.00% 32010 20,000 20,000 0.00% 22011 6,500,000 6,500,000 0.25% 5042012 6,500,000 6,500,000 0.25% 5102013 6,500,000 6,500,000 0.22% 5032014 6,300,000 6,300,000 0.24% 4632015 6,090,000 6,090,000 0.22% 4012016 5,875,000 5,875,000 0.20% 3512017 5,650,000 5,650,000 0.18% 299
Note: Details regarding the Town's outstanding debt can be found in the notes to the financial statements.
aSee Schedule 7 for property value data.bSee Schedule 17 for personal income and population data.
G14

Schedule 14Town of Bluffton, SCDirect and Overlapping Governmental Activities DebtAs of June 30, 2017
EstimatedShare of
Estimated Direct andDebt Percentage Overlapping
Government Unit Outstanding Applicable Debt
Debt repaid with property taxesBeaufort County School District 309,770,621$ 9.8% 23,542,567$ Beaufort County General Obligation Debt 283,501,455 9.8% 21,546,111 Bluffton Fire District 7,682,420 39.4% 2,304,726
Subtotal, overlapping debt 47,393,404
Town direct debt 15,292,890
Total direct and overlapping debt 62,686,294$
Sources: Beaufort County and Town Finance Department the Beaufort County Assessor's Office.
Note: Overlapping governments are those that coincide, at least in part, with the geographic boundaries of the Town. This schedule estimates the portion of the outstanding debt of those overlapping governments that is borne by the residents andbusinesses of the Town of Bluffton. This process recognizes that, when considering the Town's ability to issue and repay long-term debt, the entire debt burden borne by the residents and businesses should be taken into account. However, this does notimply that every taxpayer is a resident---and, therefore, responsible for repaying the debt---of each overlapping government. The assessed values used to estimate applicable percentages as provided by the Beaufort County Assessor's Office.
G15

Schedule 15Town of Bluffton, SCLegal Debt Margin InformationLast Ten Fiscal Years
Assessed value 168,846,460$ Debt Limit (8% of assessed value) 13,507,717 Debt applicable to limit (5,875,000) Legal Debt Margin (without a Referendum) 7,632,717$
2008 2009 2010 2011 2012 2013 2014 2015 2016 2017
Debt limit 7,692,212$ 9,810,254$ 10,961,884$ 10,917,341$ 10,956,084$ 12,670,950$ 11,244,755$ 11,719,564$ 12,404,000$ 13,507,717$
Total net debt applicable to limit 60,000 40,000 20,000 6,500,000 6,500,000 6,500,000 6,300,000 6,090,000 5,875,000 5,650,000
Legal debt margin 7,632,212 9,770,254 10,941,884 4,417,341 4,456,084 6,170,950 4,944,755 5,629,564 6,529,000 7,857,717
Total net debt applicable to the limit as a percentage of debt limit 0.78% 0.41% 0.18% 59.54% 59.33% 51.30% 56.03% 51.96% 47.36% 41.83%
Note: Article Ten (X), Section Fourteen (14), of the South Carolina Constitution of 1895 as amended provides that a City or Town shall incur General Obligation Debt over the eight percent (8%)limit only when approved by a majority vote of the qualified electors of the political subdivisions voting in a referendum authorized by law. There shall be no conditions or restrictions limiting theincurring of such indebtedness except:
a. Those restrictions and limitations imposed in the authorization to incur such indebtedness;b. The provisions of Article Ten (X), Section Fourteen (14); andc. Such general obligation debt shall be issued within five (5) years of the date of such referendum and shall mature within forty (40) years from the time such indebtedness shall be incurred.
G16
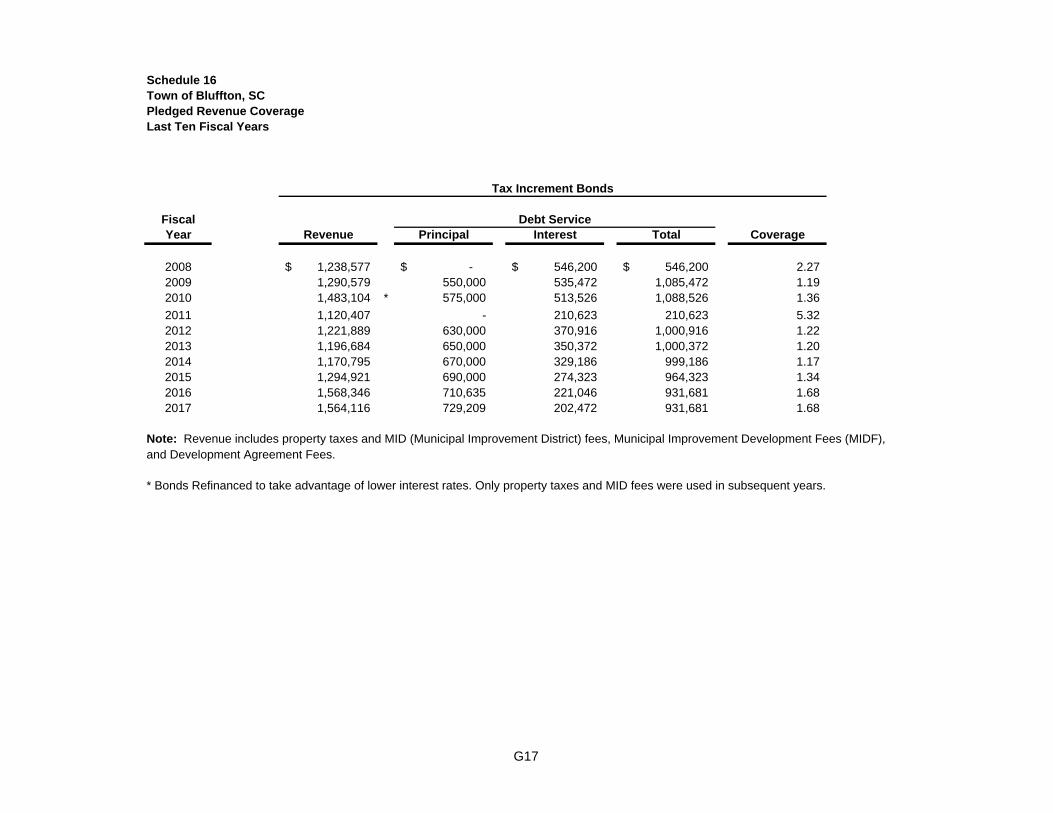
Schedule 16Town of Bluffton, SCPledged Revenue CoverageLast Ten Fiscal Years
FiscalYear Revenue Principal Interest Total Coverage
2008 1,238,577$ -$ 546,200$ 546,200$ 2.27 2009 1,290,579 550,000 535,472 1,085,472 1.19 2010 1,483,104 * 575,000 513,526 1,088,526 1.36
2011 1,120,407 - 210,623 210,623 5.32 2012 1,221,889 630,000 370,916 1,000,916 1.22 2013 1,196,684 650,000 350,372 1,000,372 1.20 2014 1,170,795 670,000 329,186 999,186 1.17 2015 1,294,921 690,000 274,323 964,323 1.34 2016 1,568,346 710,635 221,046 931,681 1.68 2017 1,564,116 729,209 202,472 931,681 1.68
Note: Revenue includes property taxes and MID (Municipal Improvement District) fees, Municipal Improvement Development Fees (MIDF),and Development Agreement Fees.
* Bonds Refinanced to take advantage of lower interest rates. Only property taxes and MID fees were used in subsequent years.
Tax Increment Bonds
Debt Service
G17

Schedule 17
Town of Bluffton, SC
Demographic and Economic Statistics
Last Ten Calendar Years
Per Town of BeaufortCapita Bluffton County Annual
Calendar Personal Personal School School UnemploymentYear Population Income Income Enrollment Enrollment Rate*
2007 9,576 435,669,696 45,496 * 4,423 19,221 4.3%2008 12,333 559,585,209 45,373 4,625 19,067 5.3%2009 12,519 535,600,377 42,783 5,256 19,525 8.7%2010 12,893 374,000,144 29,008 ** 5,345 19,626 8.7%2011 12,734 346,963,298 27,247 4,913 19,953 8.7%2012 12,932 373,773,596 28,903 5,245 20,852 7.6%2013 13,606 354,218,604 26,034 5,912 20,285 6.4%2014 15,199 391,009,474 25,726 6,262 20,622 5.7%2015 16,728 469,906,248 28,091 6,642 21,120 5.5%2016 18,897 n/a n/a 7,149 21,439 4.6%
*Town of Bluffton data not available due to low population; Beaufort County data provided alternatively.**Town of Bluffton data beginning in 2010.n/a-Data not available at time of printing.
Sources: Population for 2005 and 2010 provided by U.S. Census Bureau; Population for remaining years are estimates only asprovided by the Census Bureau's Population Division; Personal Income provided by U.S. Census Bureau, American Fact Finder;Unemployment rate provided by U.S. Department of Labor, Bureau of Labor and Statistics.
738
1,275
4,885
12,893
1990 U.S. Census
2000 U.S. Census
2005 Special Census
2010 U.S. Census
G18

Schedule 18Town of Bluffton, SCPrincipal EmployersCurrent Year and Nine Years Ago
2017 2008# of % of Total Town # of % of Total Town
Employer Employees Rank Employment Employees Rank EmploymentBeaufort County School District- Bluffton only 771 1 n/a 452 1 n/aInn at Palmetto Bluff & Palmetto Bluff Clubs 583 2 n/a 208 3 n/aEviCore National, LLC 448 3 n/aPublix 265 4 n/a 140 4 n/aResort Services Inc. 200 5 n/aNHC Healthcare/Bluffton 195 6 n/aHargray 165 7 n/a 300 2 n/aKroger 140 8 n/a 100 5 n/aBluffton Township Fire Department 132 9 n/aTown of Bluffton 132 10 n/a 88 6 n/aJim N Nick's Barbeque Restaurant 70 7 n/aD.R. Horton, Inc 64 8 n/aCentex Homes 61 9 n/aBluffton Post Office 60 10 n/aCareCore National, LLC 60 10 n/aFraser Construction Company, LLC 60 10 n/a
Source: Beaufort Regional Chamber of Commerce and Town's Finance Department
Notes: n/a = not available
G19
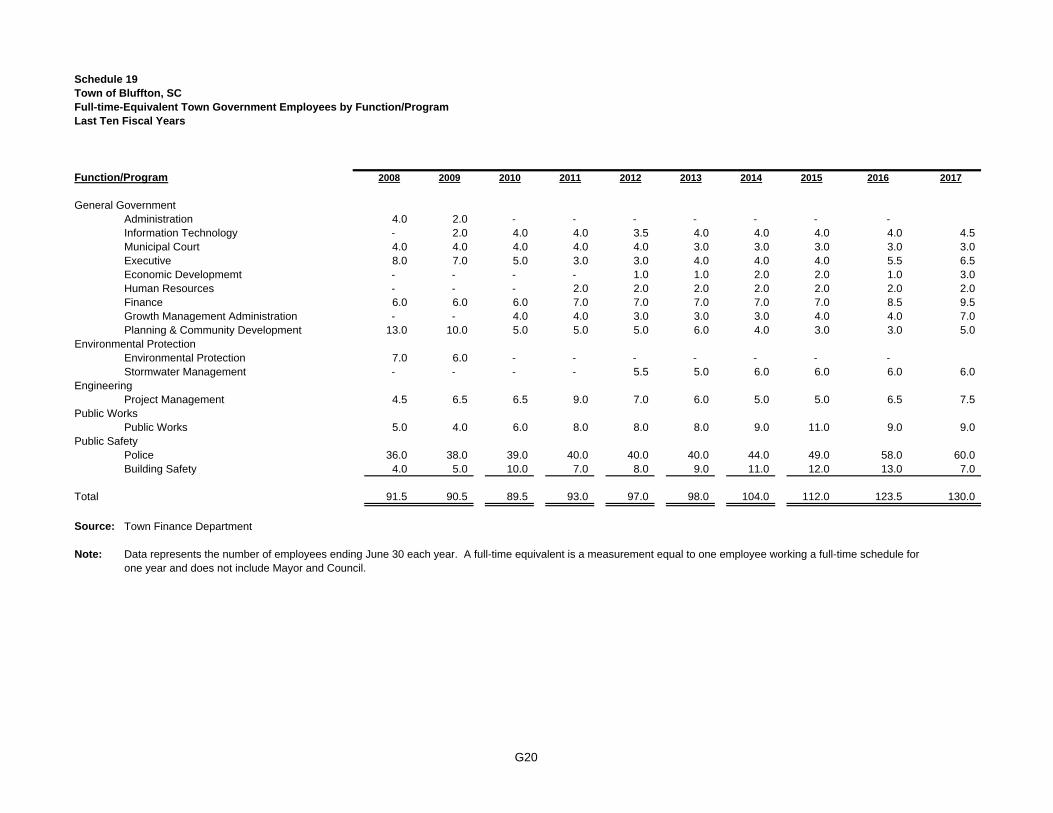
Schedule 19Town of Bluffton, SCFull-time-Equivalent Town Government Employees by Function/ProgramLast Ten Fiscal Years
Function/Program 2008 2009 2010 2011 2012 2013 2014 2015 2016 2017
General GovernmentAdministration 4.0 2.0 - - - - - - - Information Technology - 2.0 4.0 4.0 3.5 4.0 4.0 4.0 4.0 4.5 Municipal Court 4.0 4.0 4.0 4.0 4.0 3.0 3.0 3.0 3.0 3.0 Executive 8.0 7.0 5.0 3.0 3.0 4.0 4.0 4.0 5.5 6.5 Economic Developmemt - - - - 1.0 1.0 2.0 2.0 1.0 3.0 Human Resources - - - 2.0 2.0 2.0 2.0 2.0 2.0 2.0 Finance 6.0 6.0 6.0 7.0 7.0 7.0 7.0 7.0 8.5 9.5 Growth Management Administration - - 4.0 4.0 3.0 3.0 3.0 4.0 4.0 7.0 Planning & Community Development 13.0 10.0 5.0 5.0 5.0 6.0 4.0 3.0 3.0 5.0
Environmental ProtectionEnvironmental Protection 7.0 6.0 - - - - - - - Stormwater Management - - - - 5.5 5.0 6.0 6.0 6.0 6.0
EngineeringProject Management 4.5 6.5 6.5 9.0 7.0 6.0 5.0 5.0 6.5 7.5
Public WorksPublic Works 5.0 4.0 6.0 8.0 8.0 8.0 9.0 11.0 9.0 9.0
Public SafetyPolice 36.0 38.0 39.0 40.0 40.0 40.0 44.0 49.0 58.0 60.0 Building Safety 4.0 5.0 10.0 7.0 8.0 9.0 11.0 12.0 13.0 7.0
Total 91.5 90.5 89.5 93.0 97.0 98.0 104.0 112.0 123.5 130.0
Source: Town Finance Department
Note: Data represents the number of employees ending June 30 each year. A full-time equivalent is a measurement equal to one employee working a full-time schedule forone year and does not include Mayor and Council.
G20

Schedule 20Town of Bluffton, SCOperating Indicators by Function/ProgramLast Ten Fiscal Years
Function/Program 2008 2009 2010 2011 2012 2013 2014 2015 2016 2017
General GovernmentBusiness licenses issued 2,207 2,208 2,280 1,961 2,245 2,422 2,549 2,476 2,297 2,793 Hospitality Tax remitters 81 81 89 100 108 110 112 133 113 135 Accommodations Tax remitters 4 5 4 4 10 10 14 23 33 28 Court case counts 5,251 8,302 8,242 6,514 6,466 5,170 3,867 7,009 6,301 7,324 Jury trial counts - 6 5 5 4 6 3 11 14 64 Planning and Community Development applications issued 294 260 183 254 296 346 422 362 340 299
Environmental Protection/Stormwater ManagementCertificates of compliance 46 30 17 8 7 16 6 n/a 57 120 Notices to comply 176 151 117 15 49 602 1,171 n/a 300 363 Stop work orders 1 - - - - - - - - 8 Citations 30 13 - - - - - - 1 13 Outreach/Education (# of people) 834 996 1,250 1,366 1,508 4,687 2,324 5,000 5,500 * 5,500 *Sediment & Erosion Control Inspections - - - - - 1,964 - 2,159 1,331 1,849
Public SafetyPolice calls for service 18,477 23,543 34,000 35,864 32,102 30,034 38,366 41,061 45,000 46,350 Domestic calls 428 657 915 558 674 655 750 515 475 489 Traffic collisions 820 693 1,011 1,012 960 1,107 634 871 1,080 1,112 Citations 8,064 10,886 11,724 9,828 11,094 8,466 7,063 8,628 6,200 6,368 Arrests 1,083 1,216 1,510 1,231 1,023 947 880 1,069 735 757 Reports 2,859 2,978 3,976 3,656 2,910 2,693 3,656 3,216 3,200 3,296 Building permit counts 699 682 657 695 803 1,005 1,456 1,532 1,723 1,846 Development permits Issued 39 21 17 11 28 34 13 27 43 52 Construction site inspections n/a n/a 5,415 5,722 6,402 11,787 20,872 24,398 19,002 16,009
Public Projects & Facilities# of capital improvement projects to manage 20 18 16 21 24 24 13 16 21 25 # of parks to maintain 6 6 6 7 7 7 7 7 7 8 # of pathways to maintain 11 12 12 13 14 15 19 19 23 23
*1,997 in person programs; assumes increased numbers due to stormwater PSAs (County Channel & Town Hall) and Kiosk at library
Source: Town departments
Note: n/a = not available
G21

Schedule 21Town of Bluffton, SCCapital Asset Statistics by Function/ProgramLast Ten Fiscal Years
Function/Program 2008 2009 2010 2011 2012 2013 2014 2015 2016 2017
General GovernmentTown-owned parcels 26 27 27 28 27 28 30 30 30 32 Town-owned property acreage 544 551 551 571 564 571 577 577 574 577 Town vehicles 1 2 3 2 2 3 3 4 4 7
Environmental Protection/Stormwater ManagementTown vehicles 3 3 - - 3 5 3 3 3 3
EngineeringTown vehicles 4 5 4 4 2 1 2 2 2 4
Public WorksTown vehicles 5 7 7 7 7 7 6 6 8 9 Utility vehicles - - - 1 1 1 1 1 - - Dump Truck - - - - 1 1 1 1 - 1 Tractor - - - - 1 1 1 1 2 2
Public SafetyLaw Enforcementer Center - - - 1 1 1 1 1 1 1 Police vehicles 38 42 42 41 47 47 47 50 61 61 Police mobility vehicles - - 2 2 2 2 3 3 3 3 Police Boat - Marine Patrol 1 1 1 1 1 1 1 1 1 1 Town vehicles (Building Safety) 1 3 4 3 3 5 6 7 7 6
Public Projects & FacilitiesStreets (miles) 3.70 3.95 3.95 4.25 3.81 3.81 3.81 3.81 3.03 3.06Pathways (miles) 3.01 3.01 6.25 6.25 11.86 11.86 11.86 11.86 11.86 11.95Parks (count) 6 6 6 7 7 7 7 7 7 8
Source: Finance Department and Public Works Department
G22

TOWN OF BLUFFTON, SOUTH CAROLINA
FINES AND ASSESSMENTS
FOR THE YEAR ENDED JUNE 30, 2017
H‐1
Fines and Fees Collected 293,357$ Assessments Collected 273,321 Surcharges Collected 98,643 Assessments Collected for Victim Services 33,975 Surcharges Collected for Victim Services 8,191
Total fines, assessments and surcharges collected 707,487$
Fines and Fees retained by the Town 278,272$ Assessments retained by the Town - Surcharges retained by the Town - Assessments for Victim Services retained by the Town 33,975 Surcharges for Victim Services retained by the Town 8,191
Total fines, assessments and surcharges retained by the Town 320,438$
Fines and Fees remitted to State Treasurer 15,085$ Assessments remitted to State Treasurer 273,321 Surcharges remitted to State Treasurer 98,643
Total fines, assessments and surcharges remitted to State Treasurer 387,049$
Note: This schedule is required by SC 14-1-208E and is an annual reconciliationof amounts collected and remitted to State Treasurer on the State Treasurer'smonthly remittance form.

Tel 912-232-0475 Fax 912-232-0478
6600 Abercorn Street, Suite 200 | Savannah, GA 31405 | P.O. Box 16149 | Savannah, GA 31416 | krtcpa.com
I-1
INDEPENDENT AUDITORS’ REPORT ON INTERNAL CONTROL OVER FINANCIAL REPORTING AND ON COMPLIANCE AND OTHER MATTERS BASED ON AN AUDIT OF FINANCIAL STATEMENTS PERFORMED IN
ACCORDANCE WITH GOVERNMENT AUDITING STANDARDS
To the Mayor and Members of the Town Council Town of Bluffton, South Carolina
We have audited, in accordance with the auditing standards generally accepted in the United States of America and the standards applicable to financial audits contained in Government Auditing Standards issued by the Comptroller General of the United States, the financial statements of the governmental activities, each major fund, the discretely presented component units and the aggregate remaining fund information of the Town of Bluffton, South Carolina (Town), as of and for the year ended June 30, 2017, and the related notes to the financial statements, which collectively comprise the Town’s basic financial statements, and have issued our report thereon dated December 22, 2017.
Internal Control Over Financial Reporting
In planning and performing our audit of the financial statements, we considered the Town’s internal control over financial reporting (internal control) to determine the audit procedures that are appropriate in the circumstances for the purpose of expressing our opinions on the financial statements, but not for the purpose of expressing an opinion on the effectiveness of the Town’s internal control. Accordingly, we do not express an opinion on the effectiveness of the Town’s internal control.
A deficiency in internal control exists when the design or operation of a control does not allow management or employees, in the normal course of performing their assigned functions, to prevent, or detect and correct, misstatements on a timely basis. A material weakness is a deficiency, or a combination of deficiencies, in internal control, such that there is a reasonable possibility that a material misstatement of the entity’s financial statements will not be prevented, or detected and corrected on a timely basis. A significant deficiency is a deficiency, or a combination of deficiencies, in internal control that is less severe than a material weakness, yet important enough to merit attention by those charged with governance.
Our consideration of internal control was for the limited purpose described in the first paragraph of this section and was not designed to identify all deficiencies in internal control that might be material weaknesses or, significant deficiencies. Given these limitations, during our audit, we did not identify any deficiencies in internal control that might be material weaknesses. However, material weaknesses may exist that have not been identified.
Compliance and Other Matters
As part of obtaining reasonable assurance about whether the Town’s financial statements are free from material misstatement, we performed tests of its compliance with certain provisions of laws, regulations, contracts, and grant agreements, noncompliance with which could have a direct and material effect on the determination of financial statement amounts. However, providing an opinion on compliance with those provisions was not an objective of our audit, and accordingly, we do not express such an opinion. The results of our tests disclosed no instances of noncompliance or other matters that are required to be reported under Government Auditing Standards.
Purpose of this Report
The purpose of this report is solely to describe the scope of our testing of internal control and compliance and the results of that testing, and not to provide an opinion on the effectiveness of the entity’s internal control or on compliance. This report is an integral part of an audit performed in accordance with Government Auditing Standards in considering the entity’s internal control and compliance. Accordingly, this communication is not suitable for any other purpose.
KRT, CPAs P.C.
Savannah, Georgia December 22, 2017