Embed Size (px)
Citation preview

Holt McDougal Algebra 1
Comparing Functions Comparing Functions
Holt Algebra 1
Warm UpWarm Up
Lesson PresentationLesson Presentation
Lesson QuizLesson Quiz
Holt McDougal Algebra 1
Holt McDougal Algebra 1
Comparing Functions
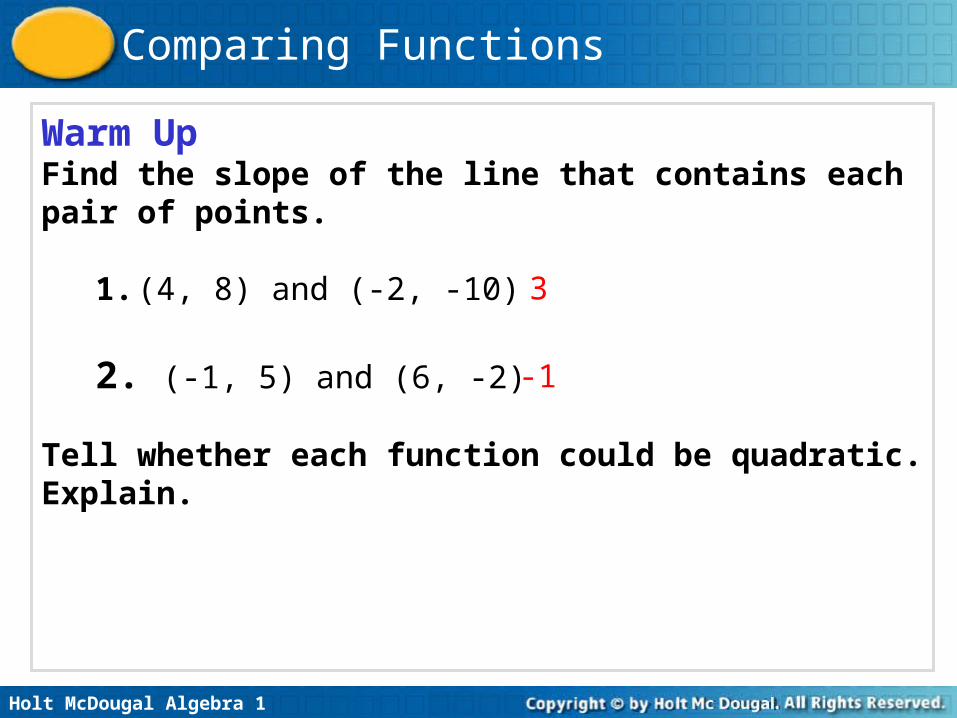
Warm UpFind the slope of the line that contains each pair of points.
1. (4, 8) and (-2, -10)
2. (-1, 5) and (6, -2)
Tell whether each function could be quadratic. Explain.
3
-1
Holt McDougal Algebra 1
Comparing Functions
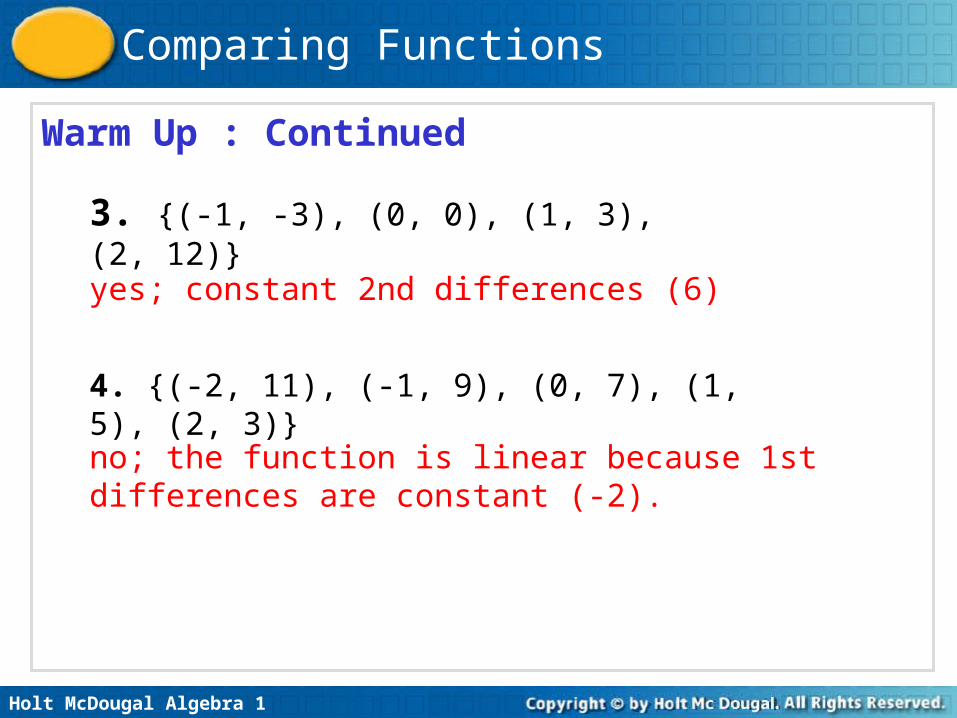
Warm Up : Continued
no; the function is linear because 1st differences are constant (-2).
4. {(-2, 11), (-1, 9), (0, 7), (1, 5), (2, 3)}
3. {(-1, -3), (0, 0), (1, 3), (2, 12)}
yes; constant 2nd differences (6)
Holt McDougal Algebra 1
Comparing Functions
Compare functions in different representations. Estimate and compare rates of change.
Objectives
Holt McDougal Algebra 1
Comparing Functions
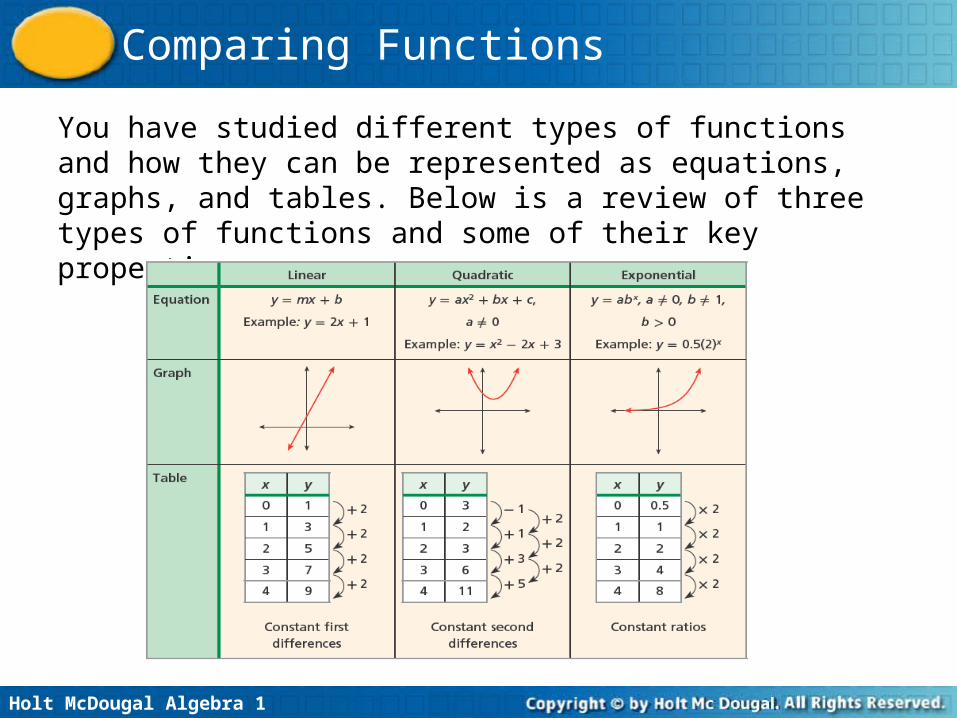
You have studied different types of functions and how they can be represented as equations, graphs, and tables. Below is a review of three types of functions and some of their key properties.
Holt McDougal Algebra 1
Comparing Functions
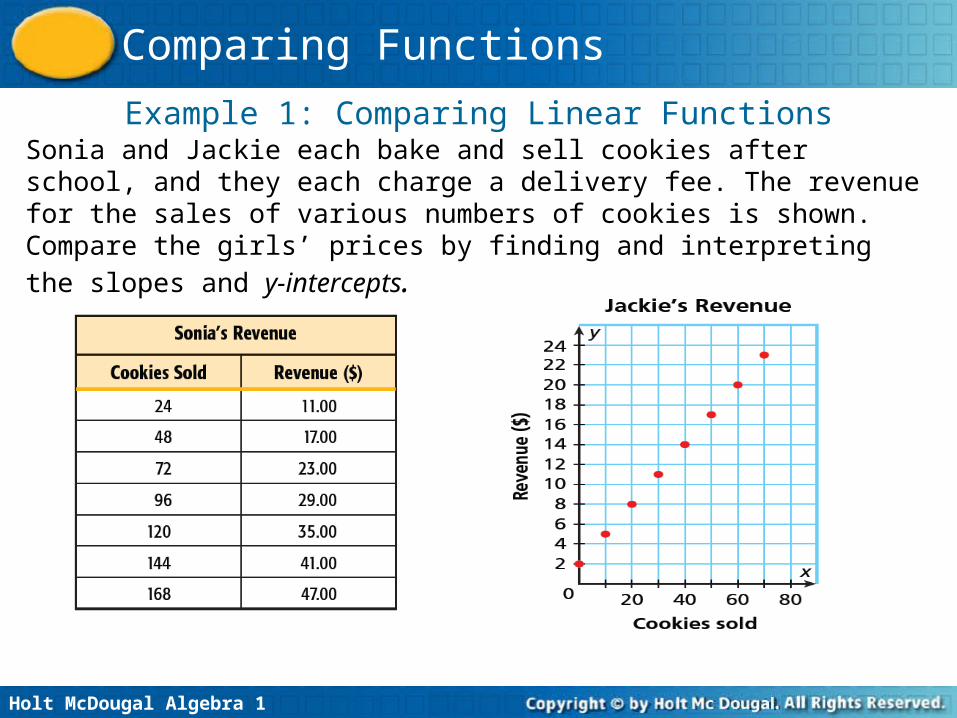
Example 1: Comparing Linear FunctionsSonia and Jackie each bake and sell cookies after school, and they each charge a delivery fee. The revenue for the sales of various numbers of cookies is shown. Compare the girls’ prices by finding and interpreting the slopes and y-intercepts.
Holt McDougal Algebra 1
Comparing Functions
Example 1: Continued
The slope of Sonia’s revenue is 0.25 and the slope of Jackie’s revenue is 0.30. This means that Jackie charges more per cookie ($0.30) than Sonia does ($0.25). Jackie’s delivery fee ($2.00) is less than Sonia’s delivery fee ($5.00).
Holt McDougal Algebra 1
Comparing Functions
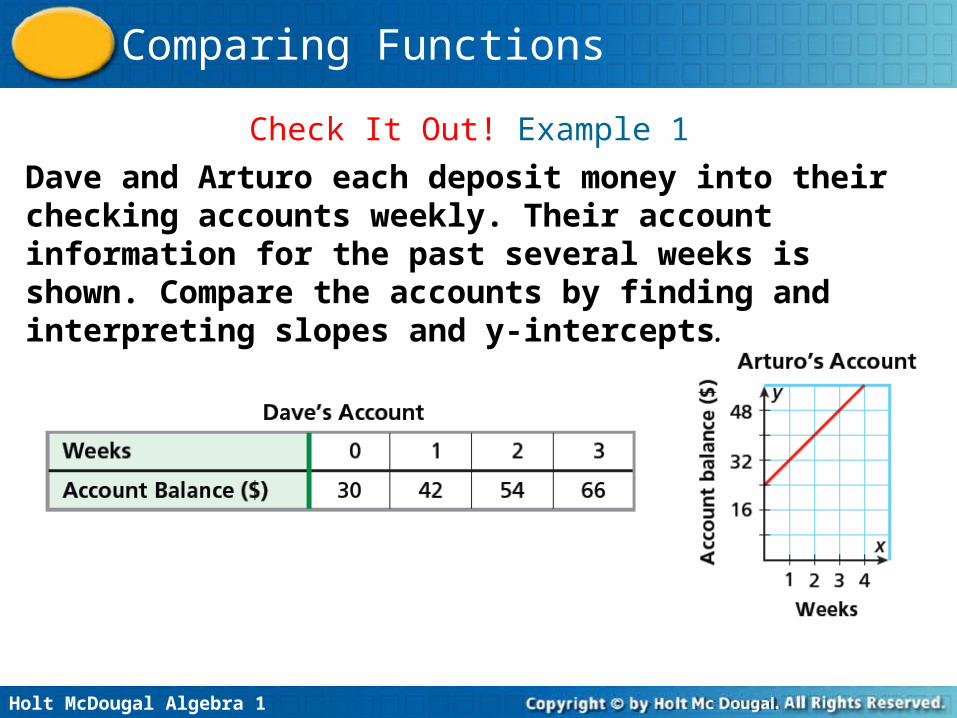
Check It Out! Example 1
Dave and Arturo each deposit money into their checking accounts weekly. Their account information for the past several weeks is shown. Compare the accounts by finding and interpreting slopes and y-intercepts.
Holt McDougal Algebra 1
Comparing Functions
Check It Out! Example 1 Continued
The slope of Dave’s account balance is $12/week and the slope of Arturo’s account balance is $8/week. So Dave is saving at a higher rate than Arturo. Looking at the y-intercepts, Dave started with more money ($30) than Arturo ($24).
Holt McDougal Algebra 1
Comparing Functions
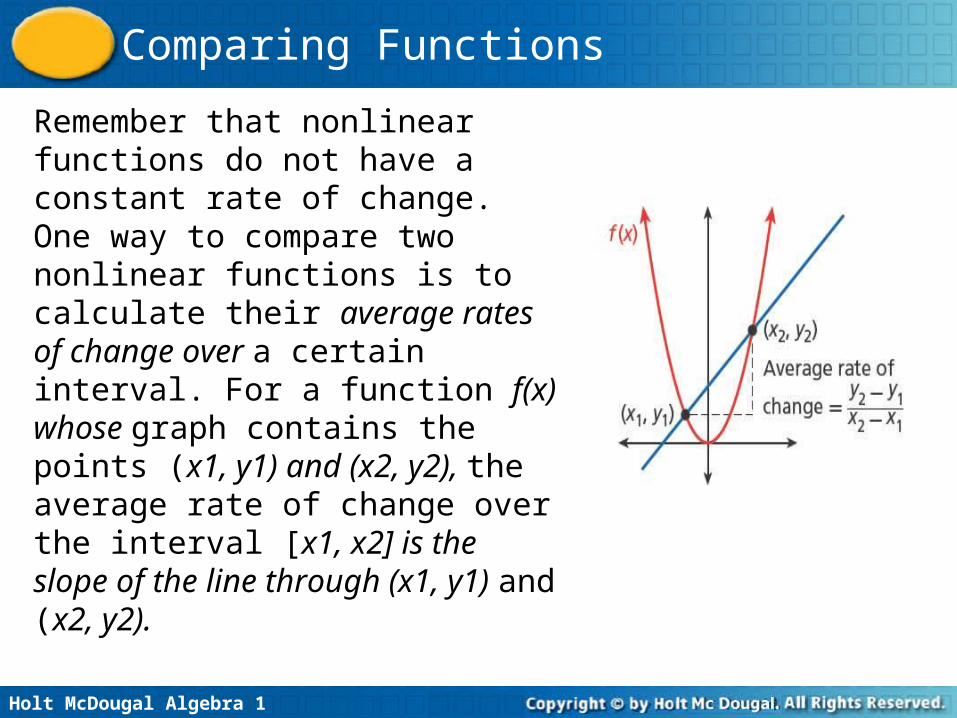
Remember that nonlinear functions do not have a constant rate of change. One way to compare two nonlinear functions is to calculate their average rates of change over a certain interval. For a function f(x) whose graph contains the points (x1, y1) and (x2, y2), the average rate of change over the interval [x1, x2] is the slope of the line through (x1, y1) and (x2, y2).
Holt McDougal Algebra 1
Comparing Functions
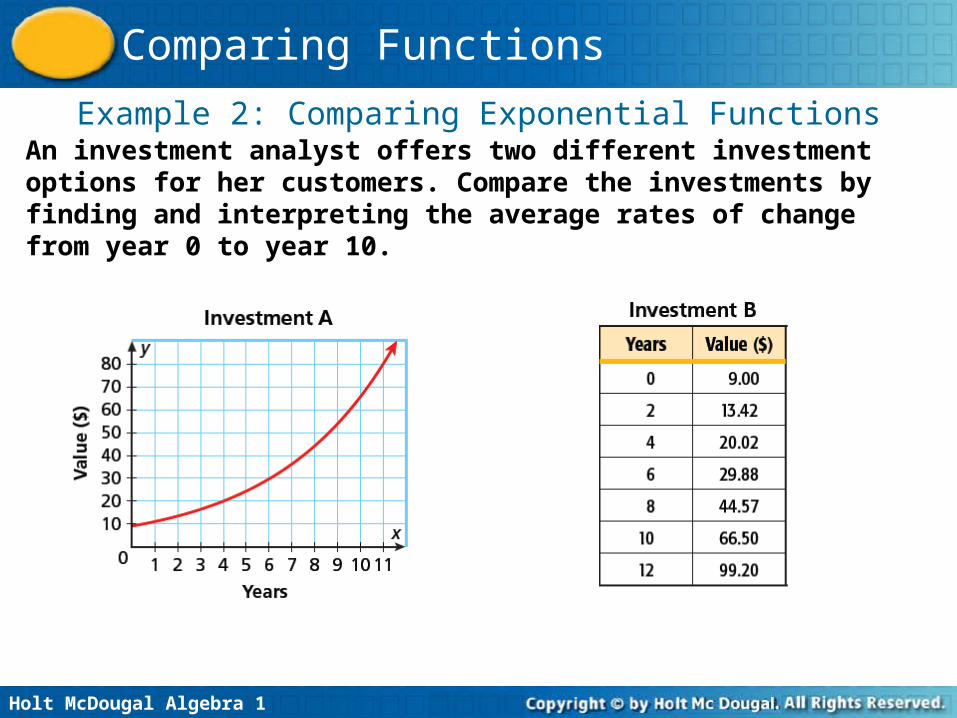
Example 2: Comparing Exponential FunctionsAn investment analyst offers two different investment options for her customers. Compare the investments by finding and interpreting the average rates of change from year 0 to year 10.
Holt McDougal Algebra 1
Comparing Functions
Example 2: Continued
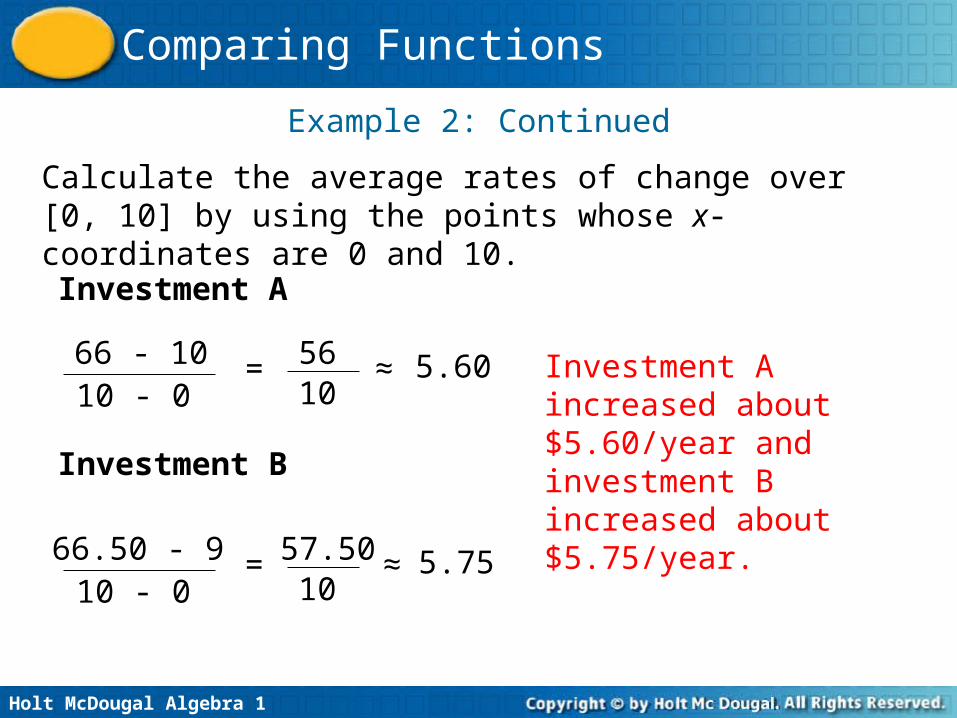
Investment A increased about $5.60/year and investment B increased about $5.75/year.
Calculate the average rates of change over [0, 10] by using the points whose x-coordinates are 0 and 10.
Investment A
66 - 1010 - 0
= 5610
≈ 5.60
Investment B
66.50 - 910 - 0
= 57.5010
≈ 5.75
Holt McDougal Algebra 1
Comparing Functions
Check It Out! Example 2
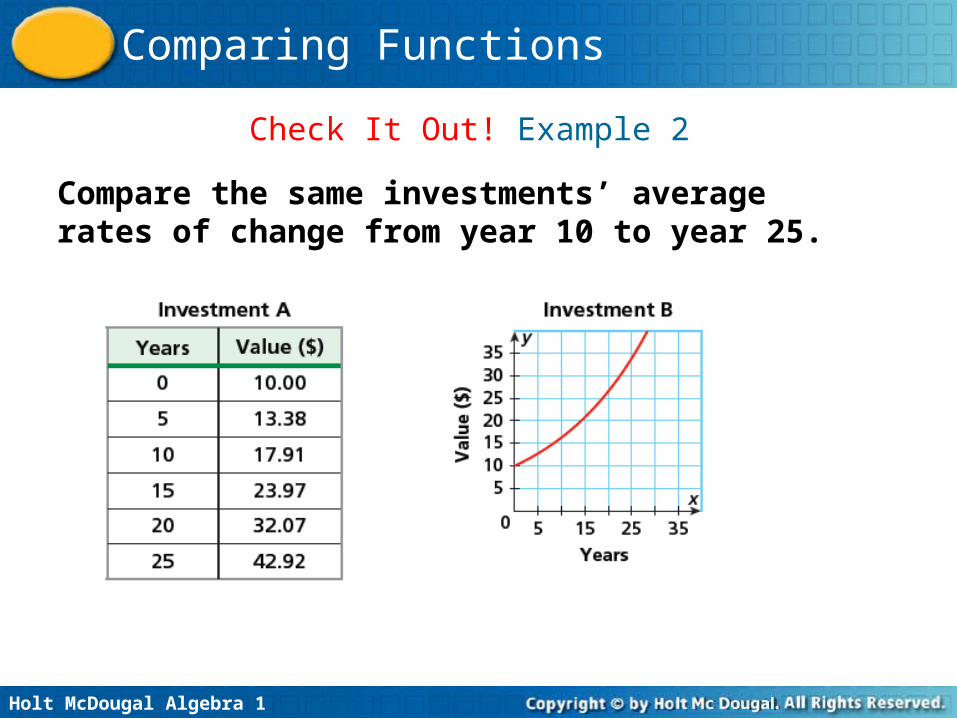
Compare the same investments’ average rates of change from year 10 to year 25.
Holt McDougal Algebra 1
Comparing Functions
Check It Out! Example 2 Continued
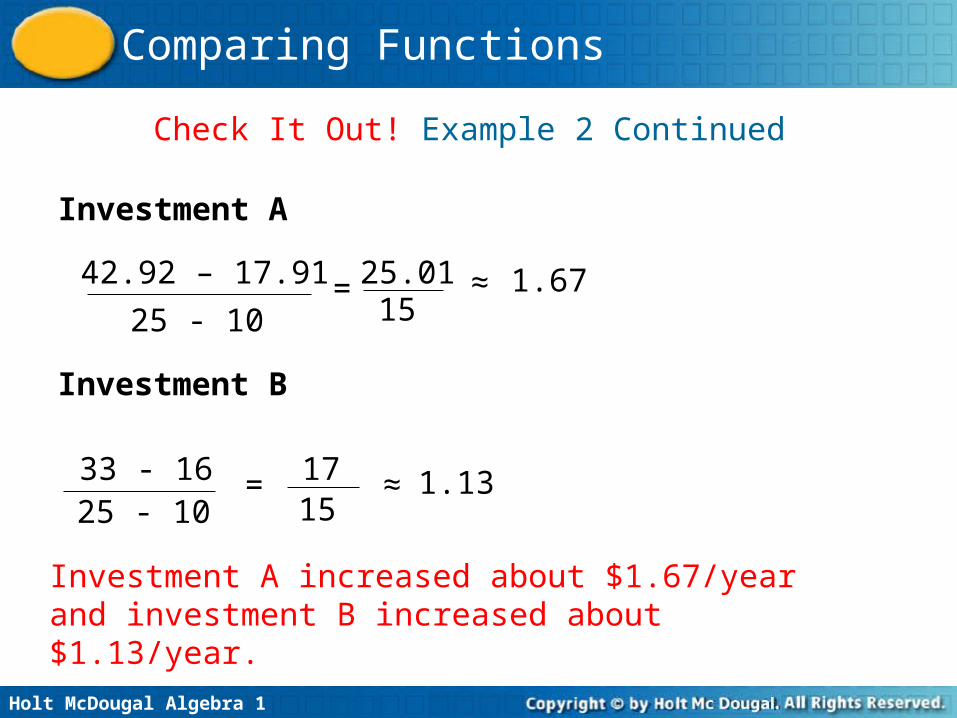
Investment A increased about $1.67/year and investment B increased about $1.13/year.
Investment A
Investment B
33 - 1625 - 10
= 1715
≈ 1.13
42.92 – 17.91
25 - 10= ≈ 1.6725.01
15
Holt McDougal Algebra 1
Comparing Functions
The minimum or maximum of a quadratic function is the y-value of the vertex.
Remember!
Holt McDougal Algebra 1
Comparing Functions
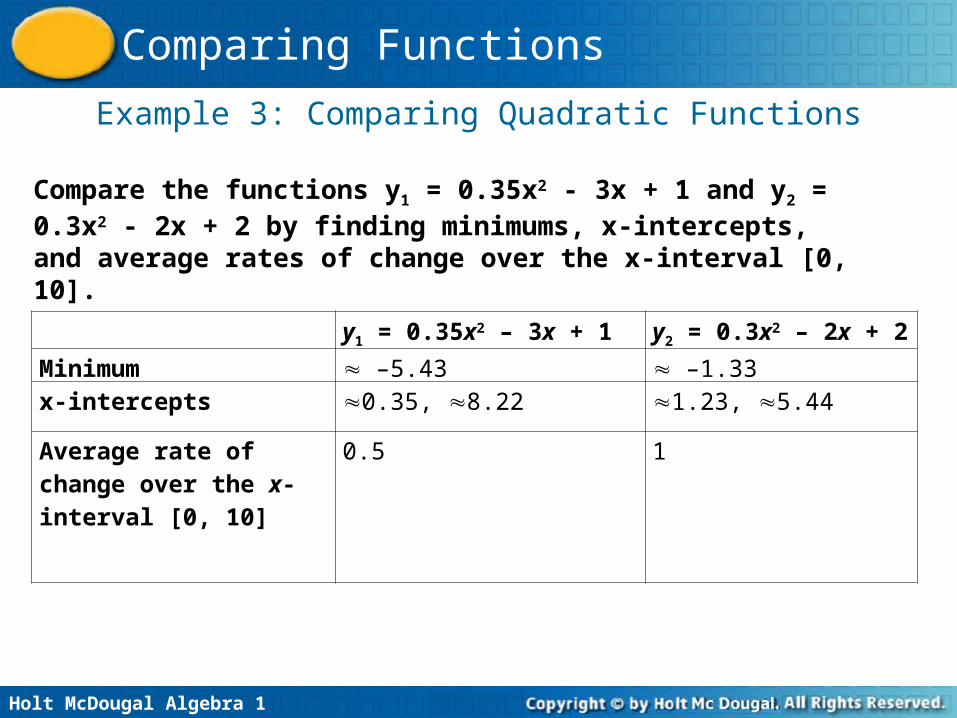
Example 3: Comparing Quadratic Functions
Compare the functions y1 = 0.35x2 - 3x + 1 and y2 = 0.3x2 - 2x + 2 by finding minimums, x-intercepts, and average rates of change over the x-interval [0, 10].
y1 = 0.35x2 – 3x + 1 y2 = 0.3x2 – 2x + 2
Minimum –5.43 –1.33x-intercepts 0.35, 8.22 1.23, 5.44
Average rate of change over the x-interval [0, 10]
0.5 1
Holt McDougal Algebra 1
Comparing Functions
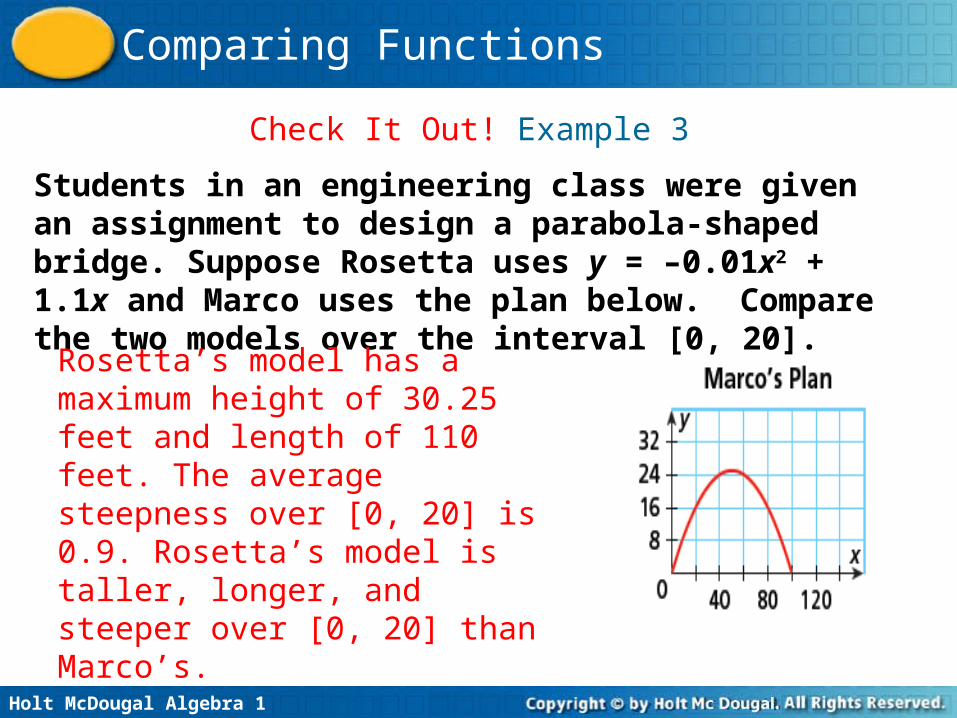
Students in an engineering class were given an assignment to design a parabola-shaped bridge. Suppose Rosetta uses y = –0.01x2 + 1.1x and Marco uses the plan below. Compare the two models over the interval [0, 20].
Check It Out! Example 3
Rosetta’s model has a maximum height of 30.25 feet and length of 110 feet. The average steepness over [0, 20] is 0.9. Rosetta’s model is taller, longer, and steeper over [0, 20] than Marco’s.
Holt McDougal Algebra 1
Comparing Functions
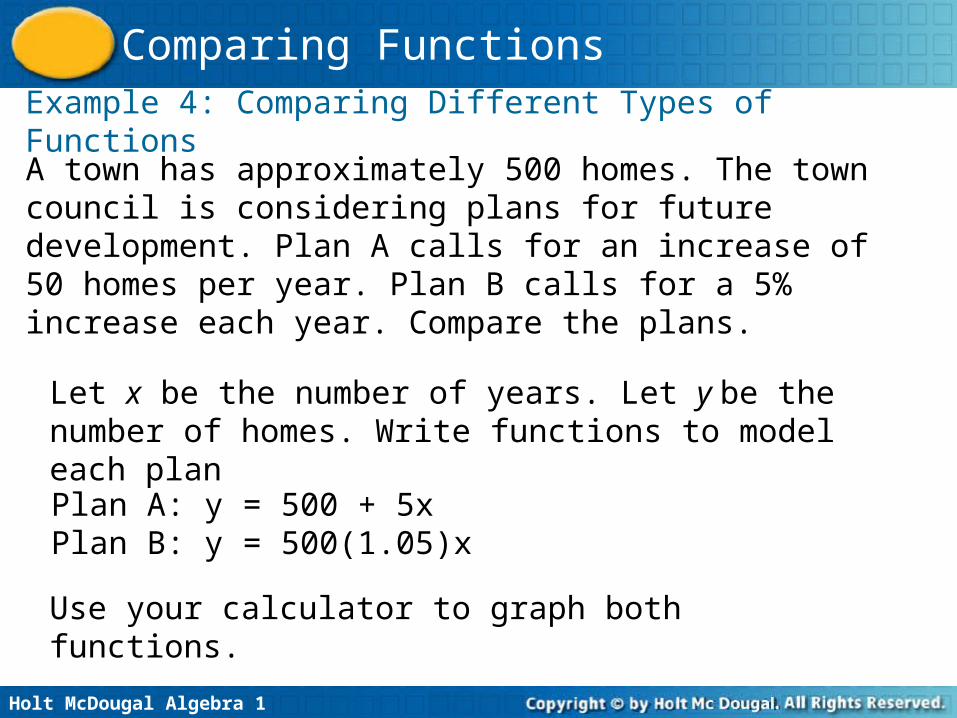
Example 4: Comparing Different Types of Functions
A town has approximately 500 homes. The town council is considering plans for future development. Plan A calls for an increase of 50 homes per year. Plan B calls for a 5% increase each year. Compare the plans.
Let x be the number of years. Let y be the number of homes. Write functions to model each plan
Plan A: y = 500 + 5xPlan B: y = 500(1.05)x
Use your calculator to graph both functions.
Holt McDougal Algebra 1
Comparing Functions
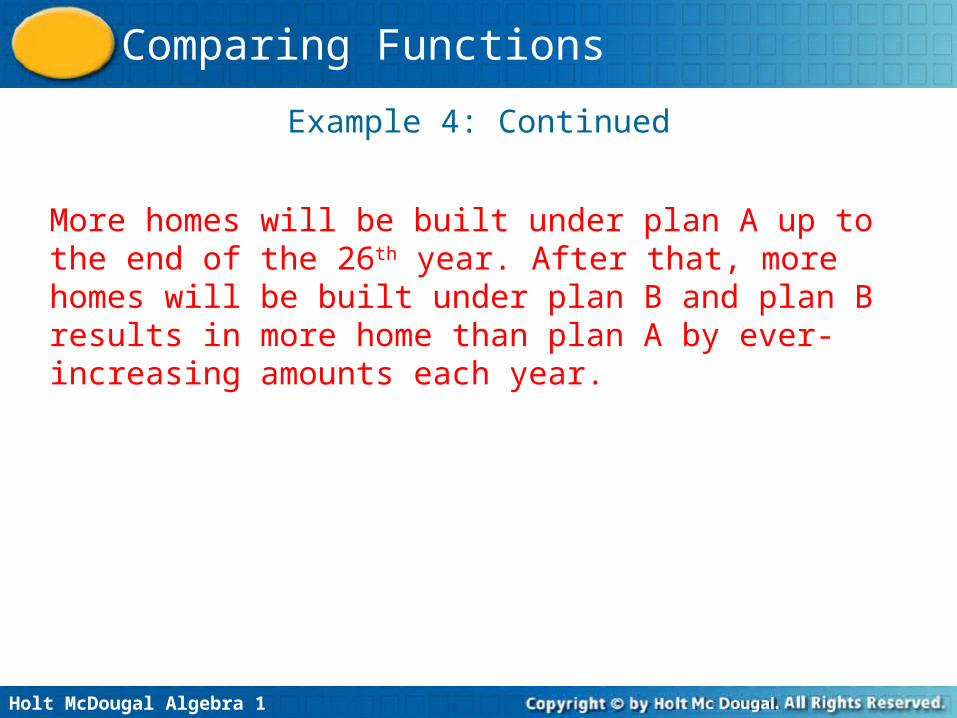
Example 4: Continued
More homes will be built under plan A up to the end of the 26th year. After that, more homes will be built under plan B and plan B results in more home than plan A by ever-increasing amounts each year.
Holt McDougal Algebra 1
Comparing Functions
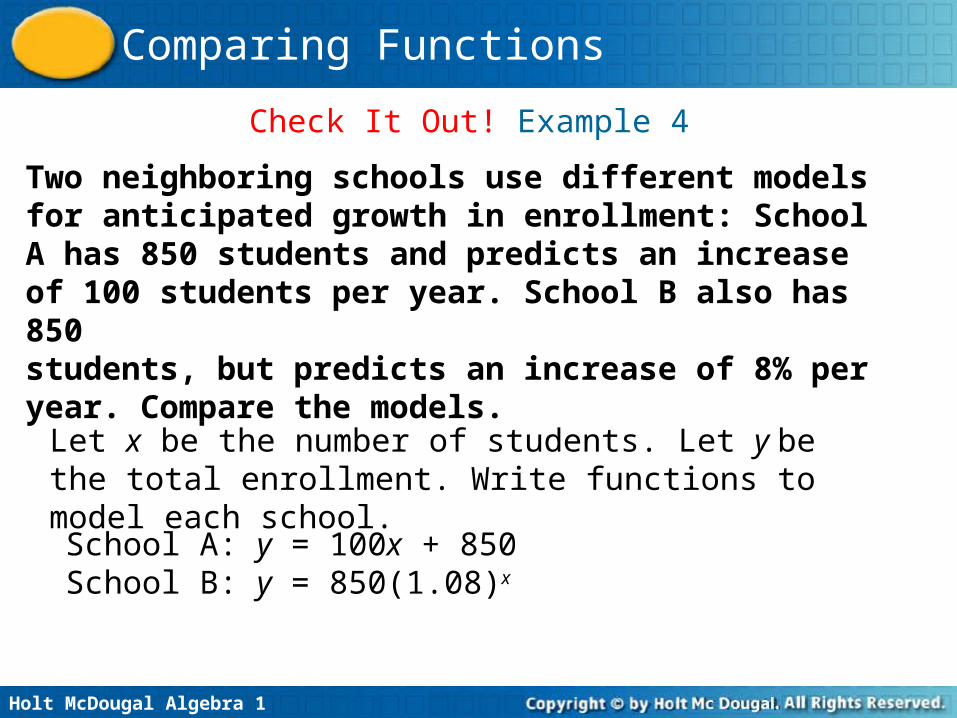
Two neighboring schools use different models for anticipated growth in enrollment: School A has 850 students and predicts an increase of 100 students per year. School B also has 850students, but predicts an increase of 8% per year. Compare the models.
Check It Out! Example 4
Let x be the number of students. Let y be the total enrollment. Write functions to model each school.
School A: y = 100x + 850School B: y = 850(1.08)x
Holt McDougal Algebra 1
Comparing Functions
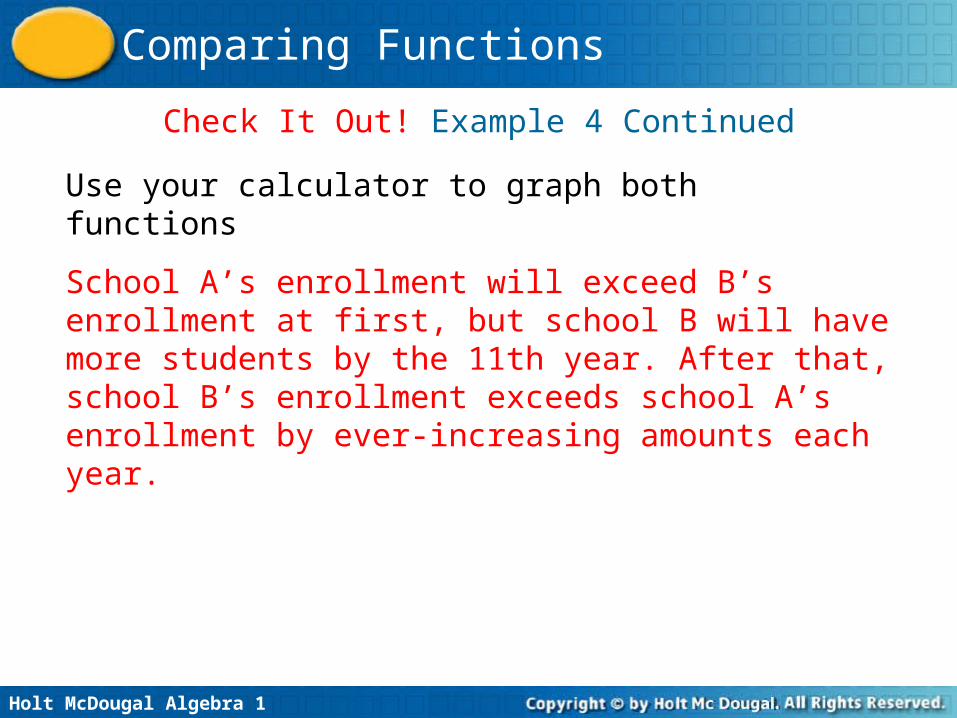
Check It Out! Example 4 Continued
School A’s enrollment will exceed B’s enrollment at first, but school B will have more students by the 11th year. After that, school B’s enrollment exceeds school A’s enrollment by ever-increasing amounts each year.
Use your calculator to graph both functions
Holt McDougal Algebra 1
Comparing Functions
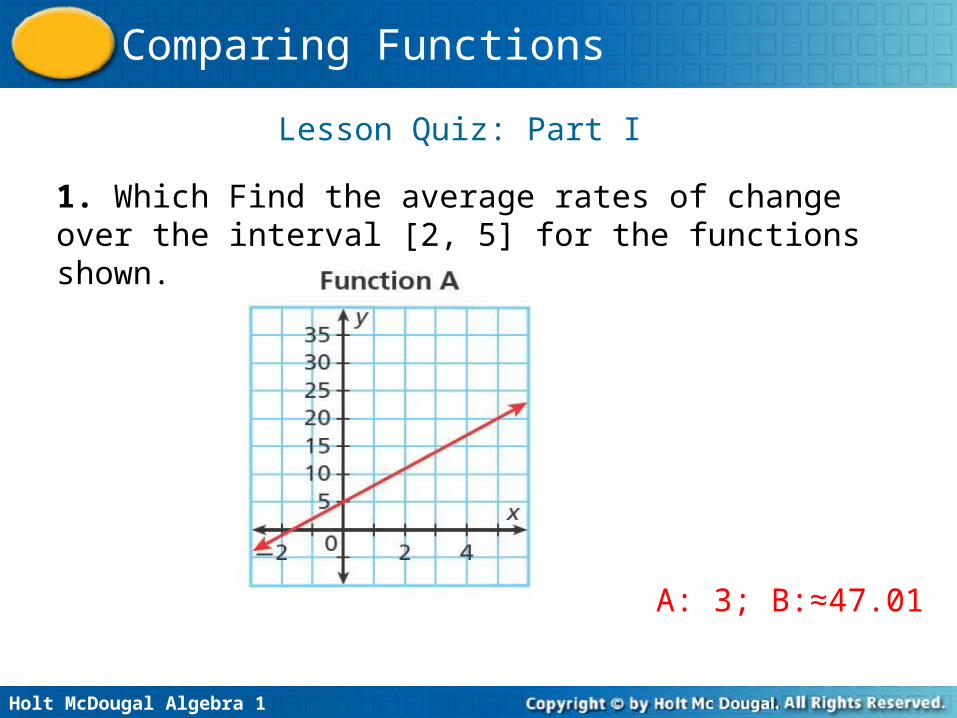
Lesson Quiz: Part I
1. Which Find the average rates of change over the interval [2, 5] for the functions shown.
A: 3; B:≈47.01
Holt McDougal Algebra 1
Comparing Functions
Lesson Quiz: Part II
2. Compare y = x2 and y = -x2 by finding minimums/maximums, x-intercepts, and average rates of change over the interval [0, 2].
Both have x-int. 0, which is also the max. of y = x2 and the min. of y = x2. The avg. rate of chg. for y = x2 is 2, which is the opp. of the avg. rate of chg. for y = x2.

Holt McDougal Algebra 1
Comparing Functions
Lesson Quiz: Part III
3. A car manufacturer has 40 cars in stock. The manufacturer is considering two proposals. Proposal A recommends increasing the inventory by 12 cars per year. Proposal B recommends an 8% increase each year. Compare the proposals.
Under proposal A, more cars will be manufactured for the first 29 yrs. After the 29th yr, more cars will be manufactured under proposal B