Embed Size (px)
Citation preview
Holt McDougal Algebra 1
10-3 Data Distributions
Create and interpret box-and-whisker plots.
Objectives
Holt McDougal Algebra 1
10-3 Data Distributions
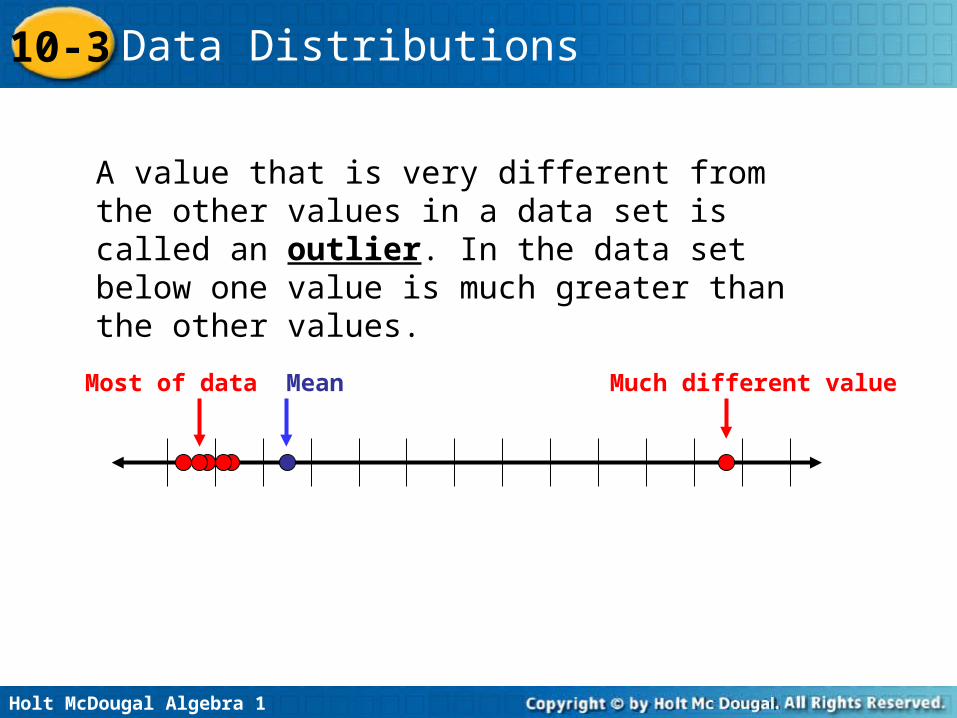
A value that is very different from the other values in a data set is called an outlier. In the data set below one value is much greater than the other values.
Most of data Mean Much different value
Holt McDougal Algebra 1
10-3 Data Distributions
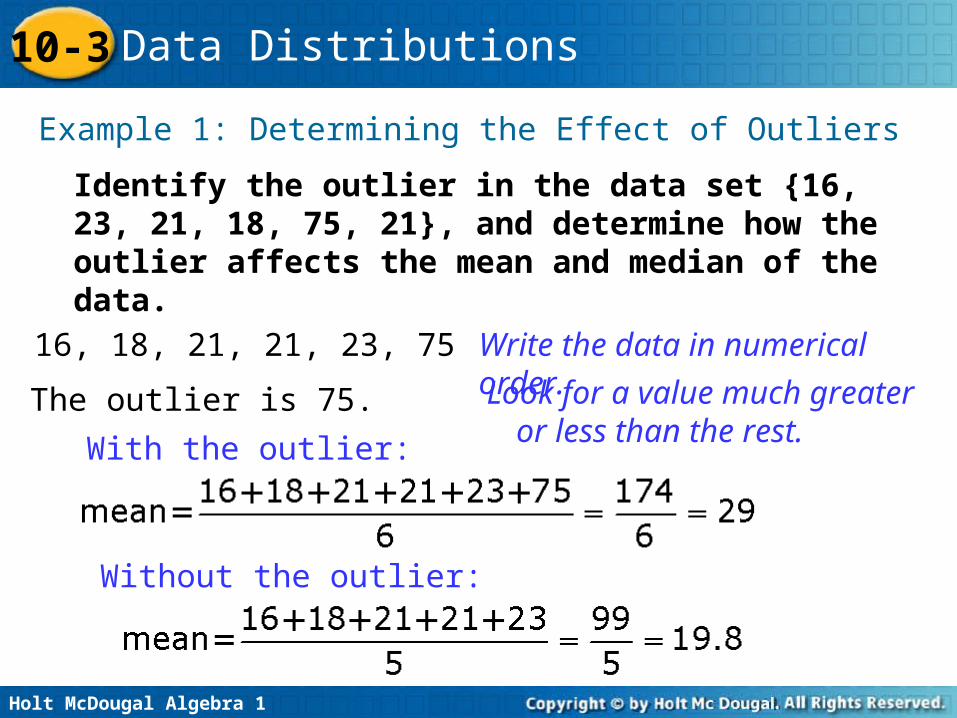
Identify the outlier in the data set {16, 23, 21, 18, 75, 21}, and determine how the outlier affects the mean and median of the data.
Example 1: Determining the Effect of Outliers
Write the data in numerical order.16, 18, 21, 21, 23, 75
Look for a value much greater or less than the rest.
The outlier is 75.
With the outlier:
Without the outlier:
Holt McDougal Algebra 1
10-3 Data Distributions
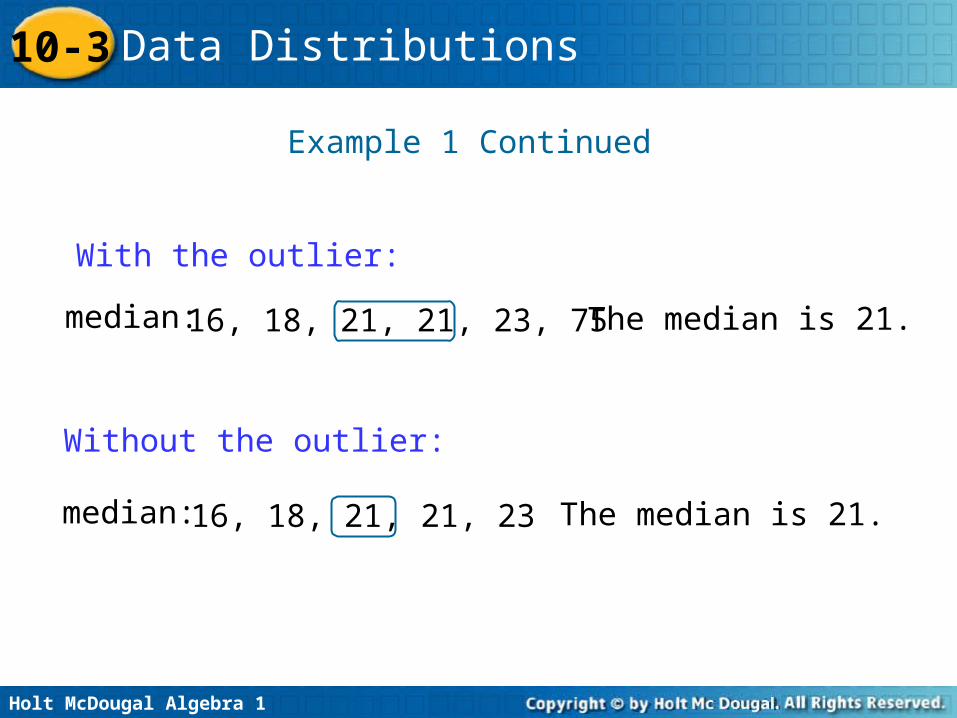
Without the outlier:
16, 18, 21, 21, 23median: The median is 21.
Example 1 Continued
With the outlier:
16, 18, 21, 21, 23, 75median: The median is 21.
Holt McDougal Algebra 1
10-3 Data Distributions
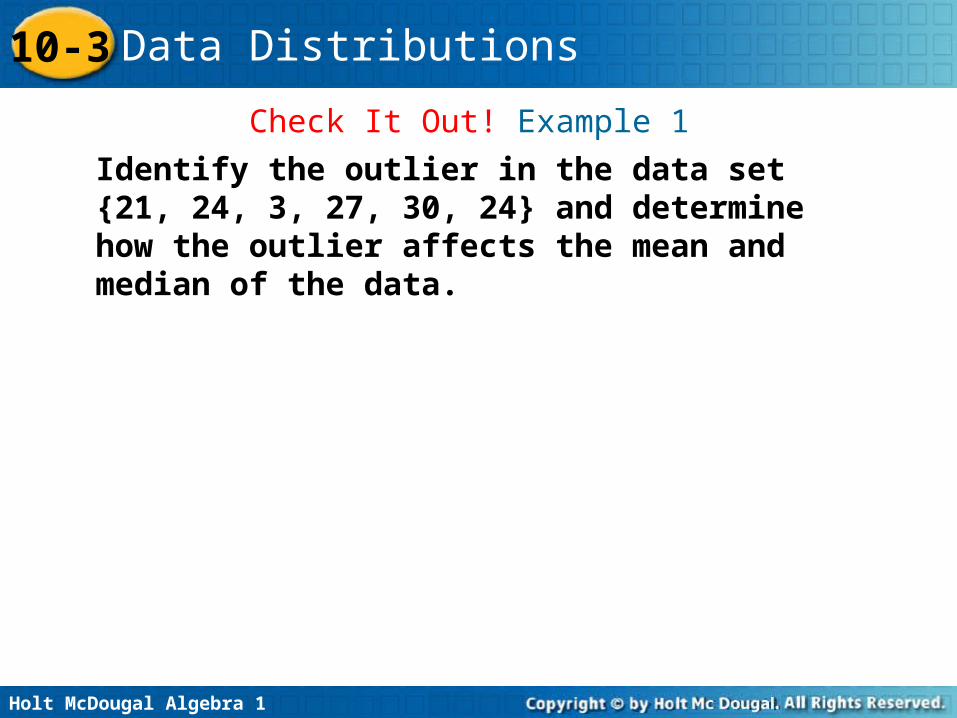
Check It Out! Example 1
Identify the outlier in the data set {21, 24, 3, 27, 30, 24} and determine how the outlier affects the mean and median of the data.
Holt McDougal Algebra 1
10-3 Data Distributions
As you can see in Example 1, an outlier can strongly affect the mean of a data set, having little or no impact on the median. Therefore, the mean may not be the best measure to describe a data set that contains an outlier. In such cases, the median may better describe the center of the data set.
Holt McDougal Algebra 1
10-3 Data Distributions
Measures of central tendency describe how data cluster around one value. Another way to describe a data set is by its spread—how the data values are spread out from the center.
Quartiles divide a data set into four equal parts. Each quartile contains one-fourth of the values in the set. The first quartile is the median of the lower half of the data set. The second quartile is the median of the data set, and the third quartile is the median of the upper half of the data set.
Holt McDougal Algebra 1
10-3 Data Distributions
Reading Math
The first quartile is sometimes called the lower quartile, and the third quartile is sometimes called the upper quartile.
Holt McDougal Algebra 1
10-3 Data Distributions
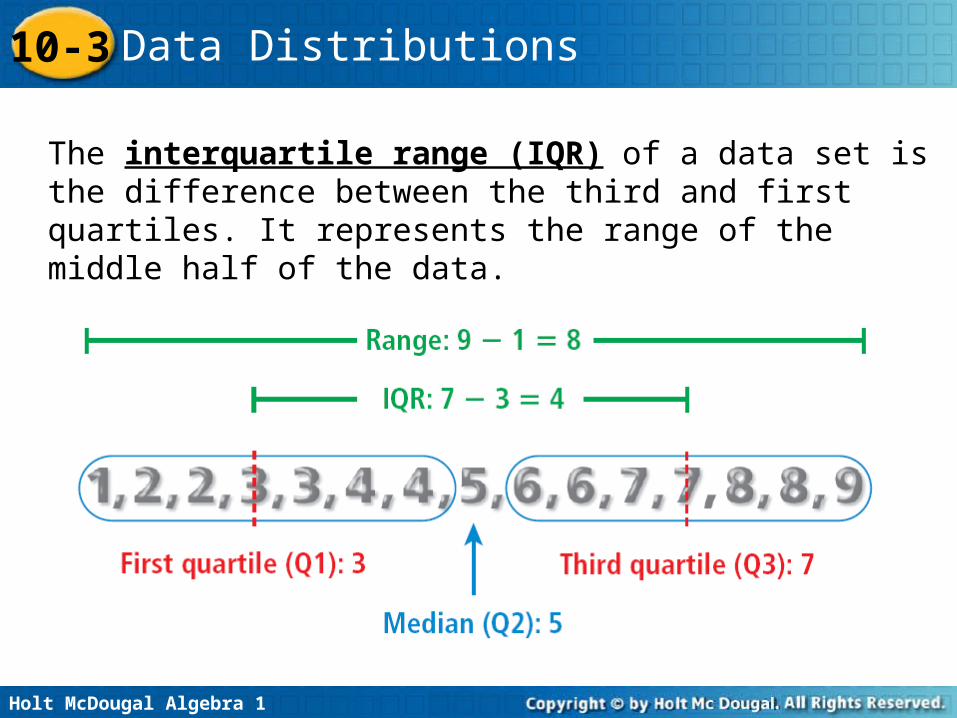
The interquartile range (IQR) of a data set is the difference between the third and first quartiles. It represents the range of the middle half of the data.
Holt McDougal Algebra 1
10-3 Data Distributions
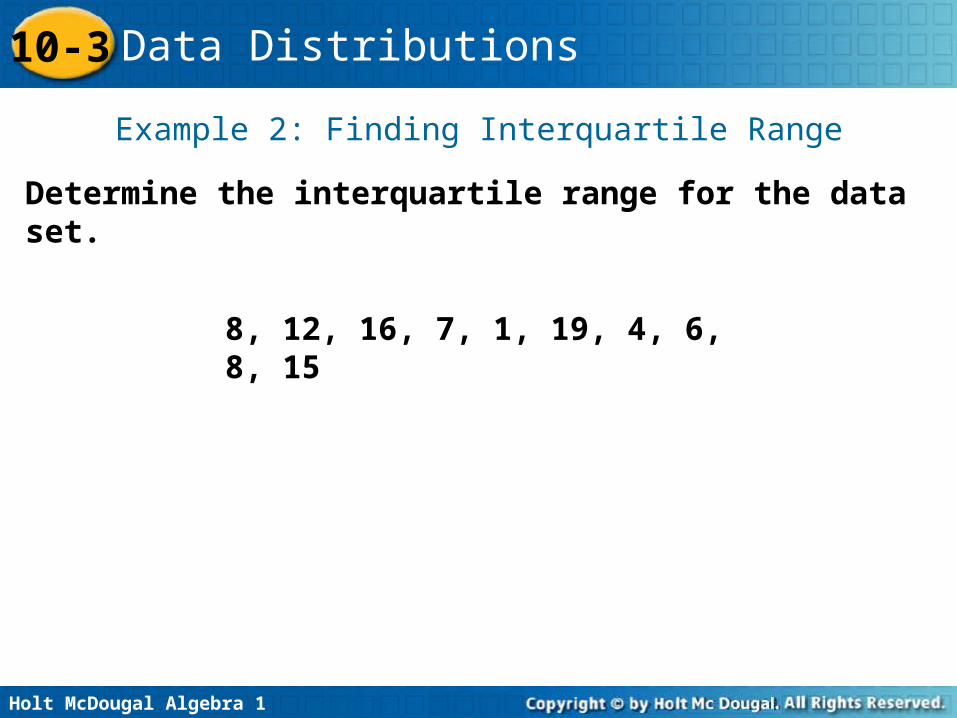
Example 2: Finding Interquartile Range
Determine the interquartile range for the data set.
8, 12, 16, 7, 1, 19, 4, 6, 8, 15
Holt McDougal Algebra 1
10-3 Data Distributions
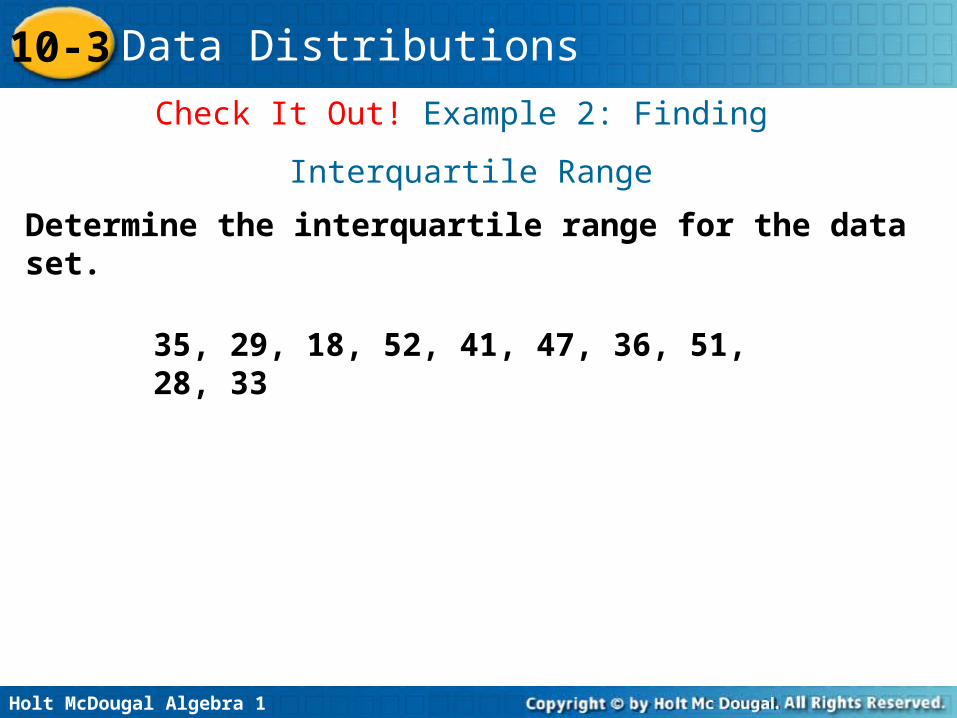
Check It Out! Example 2: Finding
Interquartile Range
Determine the interquartile range for the data set.
35, 29, 18, 52, 41, 47, 36, 51, 28, 33
Holt McDougal Algebra 1
10-3 Data Distributions
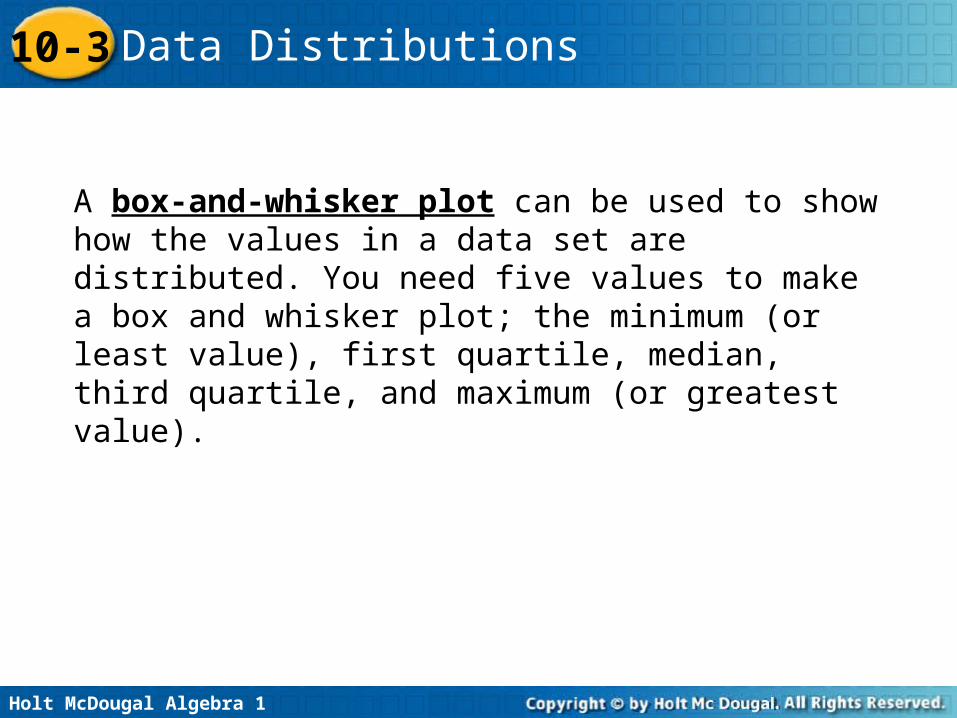
A box-and-whisker plot can be used to show how the values in a data set are distributed. You need five values to make a box and whisker plot; the minimum (or least value), first quartile, median, third quartile, and maximum (or greatest value).
Holt McDougal Algebra 1
10-3 Data Distributions
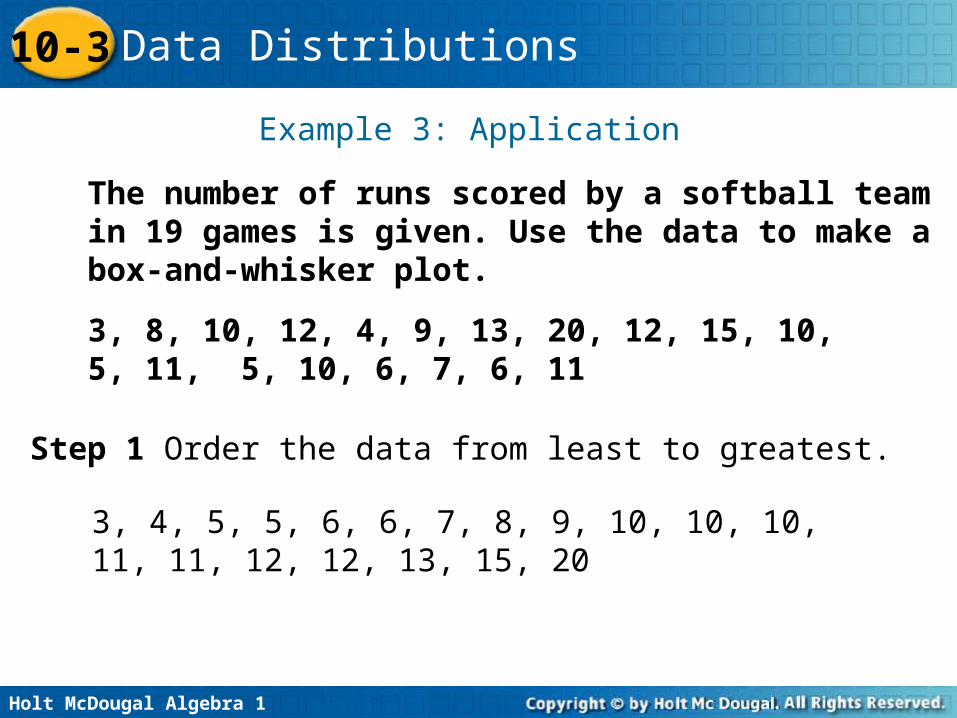
Example 3: Application
The number of runs scored by a softball team in 19 games is given. Use the data to make a box-and-whisker plot.
3, 8, 10, 12, 4, 9, 13, 20, 12, 15, 10, 5, 11, 5, 10, 6, 7, 6, 11
Step 1 Order the data from least to greatest.
3, 4, 5, 5, 6, 6, 7, 8, 9, 10, 10, 10, 11, 11, 12, 12, 13, 15, 20
Holt McDougal Algebra 1
10-3 Data Distributions
Example 3 Continued
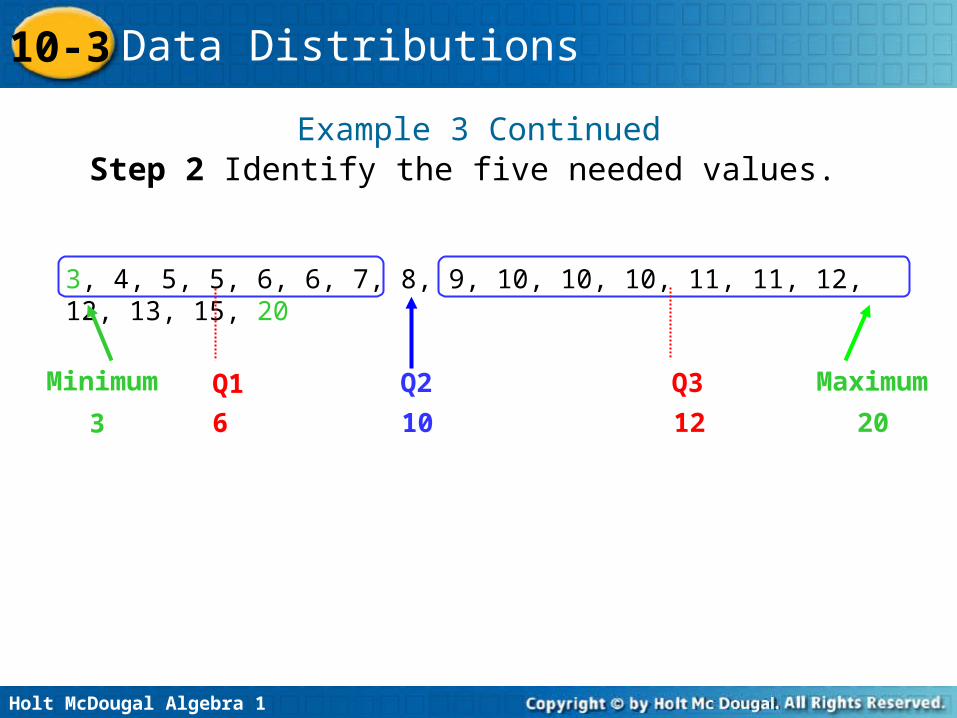
3, 4, 5, 5, 6, 6, 7, 8, 9, 10, 10, 10, 11, 11, 12, 12, 13, 15, 20
Q1
6
Q3
12
Q2
10
Minimum
3
Maximum
20
Step 2 Identify the five needed values.
Holt McDougal Algebra 1
10-3 Data Distributions
Example 3 Continued
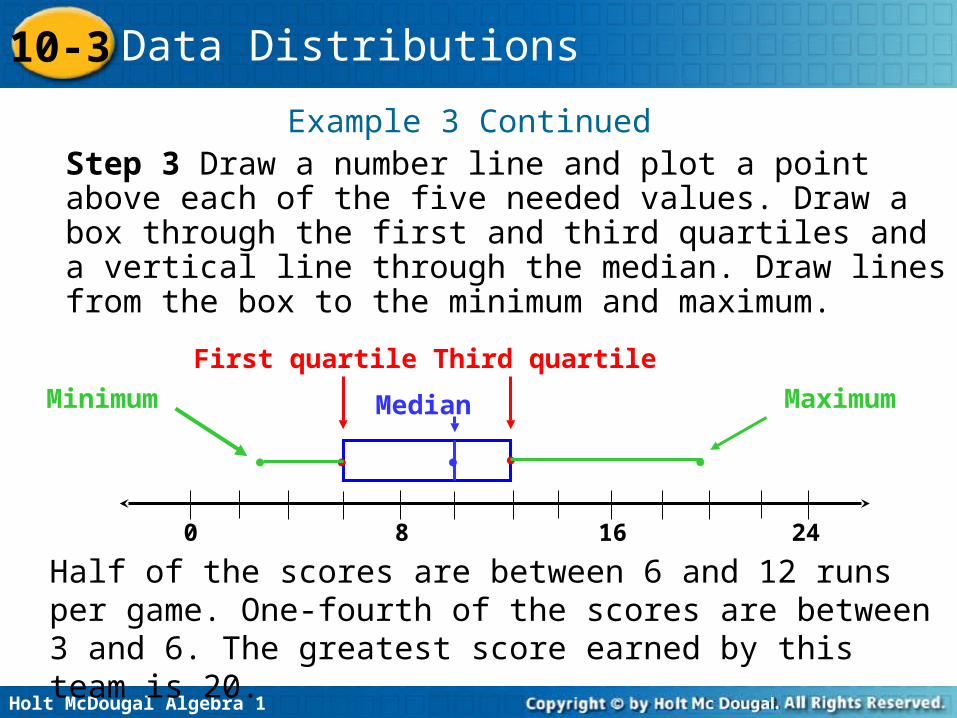
Half of the scores are between 6 and 12 runs per game. One-fourth of the scores are between 3 and 6. The greatest score earned by this team is 20.
0 8 16 24
Median
First quartile Third quartile
Minimum Maximum
Step 3 Draw a number line and plot a point above each of the five needed values. Draw a box through the first and third quartiles and a vertical line through the median. Draw lines from the box to the minimum and maximum.
Holt McDougal Algebra 1
10-3 Data Distributions
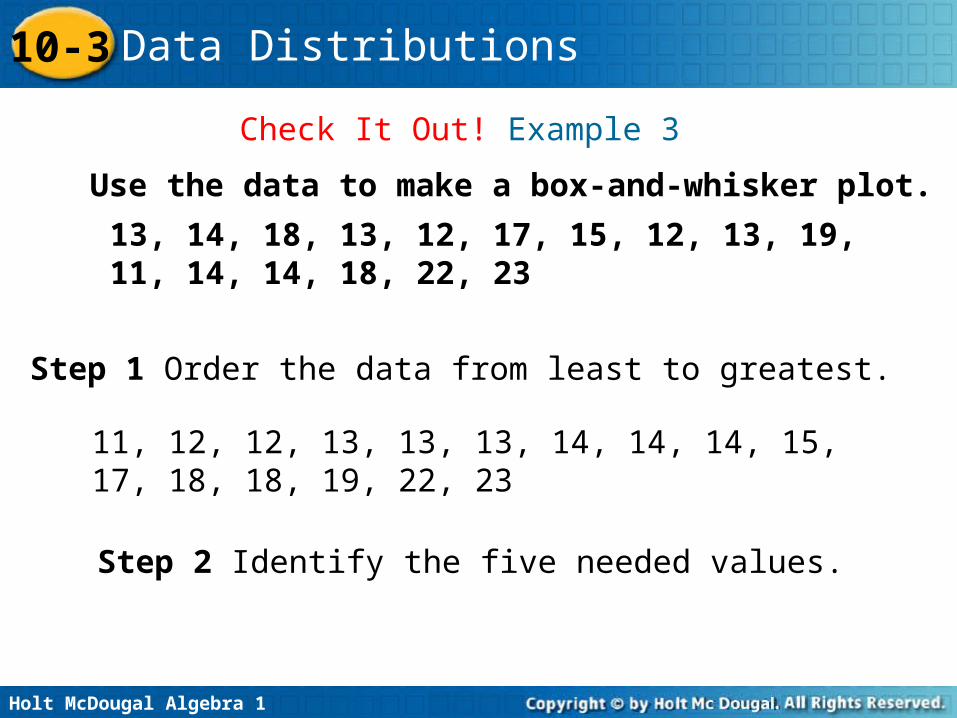
Use the data to make a box-and-whisker plot.
13, 14, 18, 13, 12, 17, 15, 12, 13, 19, 11, 14, 14, 18, 22, 23
Check It Out! Example 3
Step 1 Order the data from least to greatest.
11, 12, 12, 13, 13, 13, 14, 14, 14, 15, 17, 18, 18, 19, 22, 23
Step 2 Identify the five needed values.
Holt McDougal Algebra 1
10-3 Data Distributions
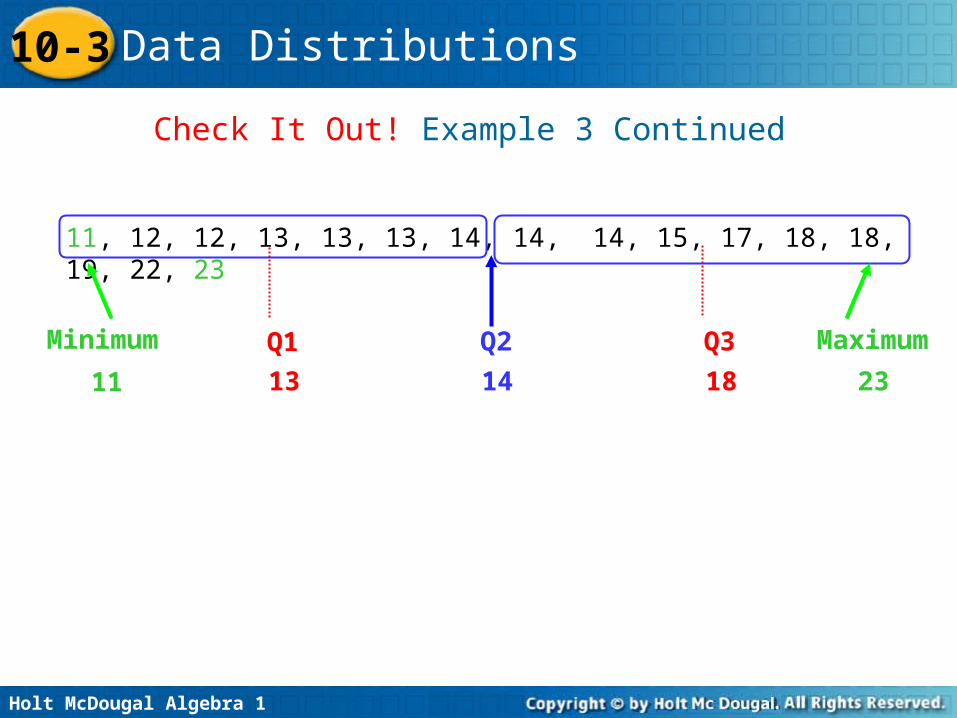
11, 12, 12, 13, 13, 13, 14, 14, 14, 15, 17, 18, 18, 19, 22, 23
Q1
13
Q3
18
Q2
14
Minimum
11
Maximum
23
Check It Out! Example 3 Continued
Holt McDougal Algebra 1
10-3 Data Distributions
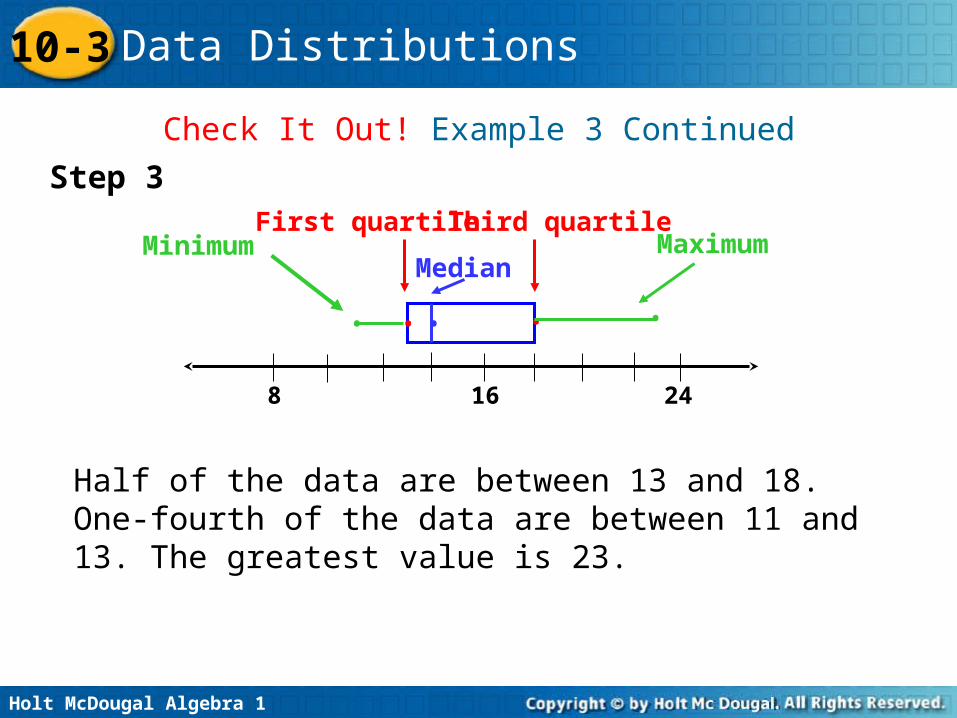
Half of the data are between 13 and 18. One-fourth of the data are between 11 and 13. The greatest value is 23.
Check It Out! Example 3 Continued
8 16 24
Median
First quartile Third quartile
• ••• •
Minimum Maximum
Step 3
Holt McDougal Algebra 1
10-3 Data Distributions
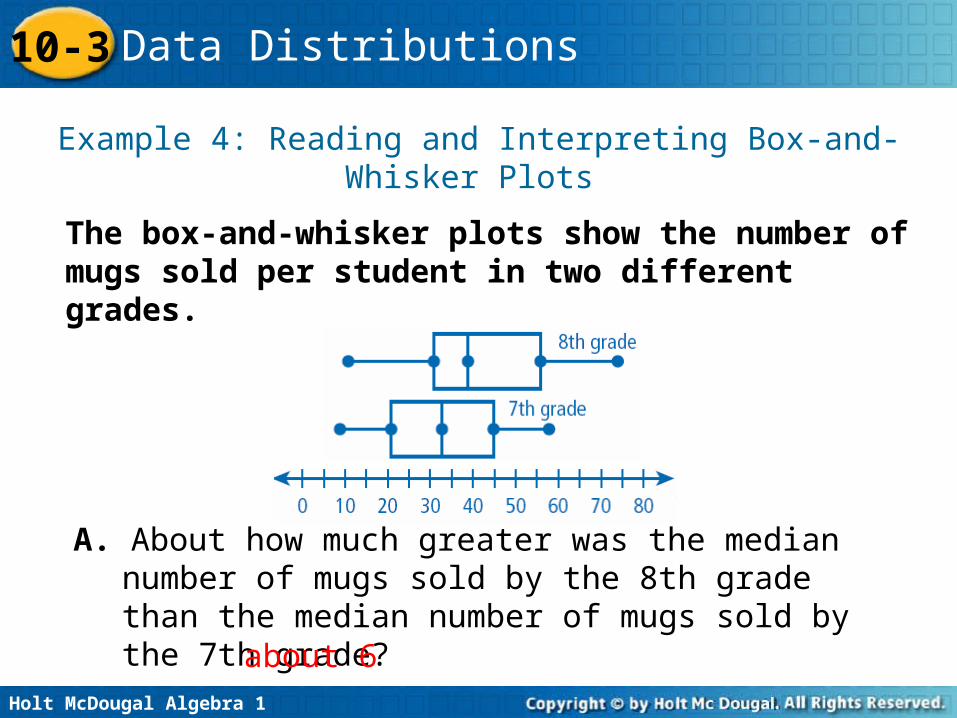
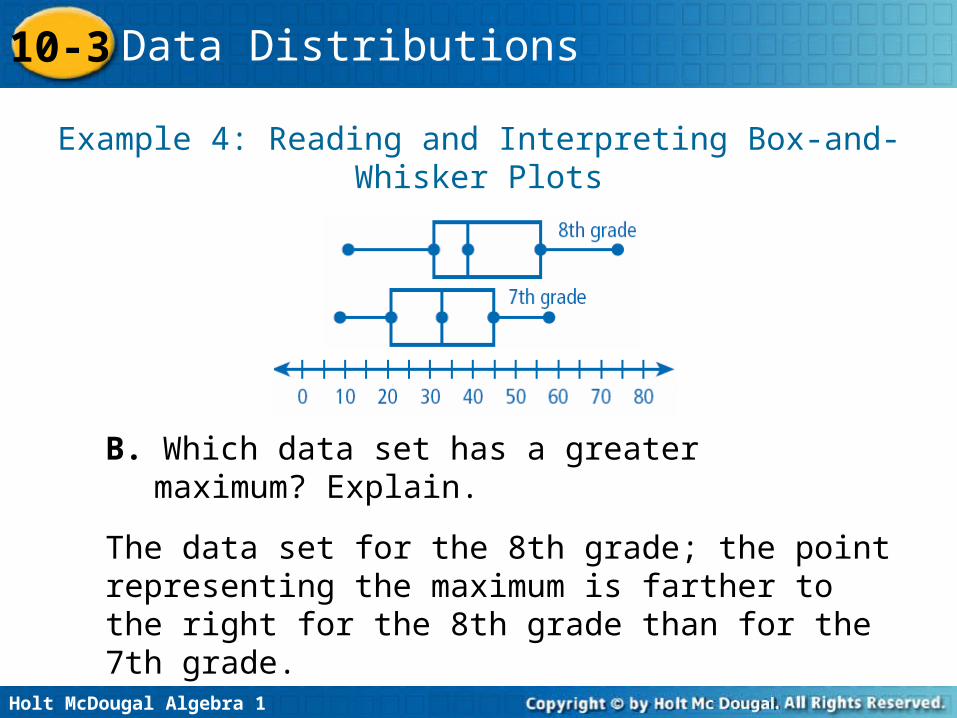
The box-and-whisker plots show the number of mugs sold per student in two different grades.
Example 4: Reading and Interpreting Box-and-Whisker Plots
A. About how much greater was the median number of mugs sold by the 8th grade than the median number of mugs sold by the 7th grade? about 6
Holt McDougal Algebra 1
10-3 Data Distributions
Example 4: Reading and Interpreting Box-and-Whisker Plots
B. Which data set has a greater maximum? Explain.
The data set for the 8th grade; the point representing the maximum is farther to the right for the 8th grade than for the 7th grade.

Holt McDougal Algebra 1
10-3 Data Distributions
Example 4: Reading and Interpreting Box-and-Whisker Plots
C. Approximate the interquartile range for each data set.
7th grade: 45 – 20 = 258th grade: 55 – 30 = 25
Holt McDougal Algebra 1
10-3 Data Distributions
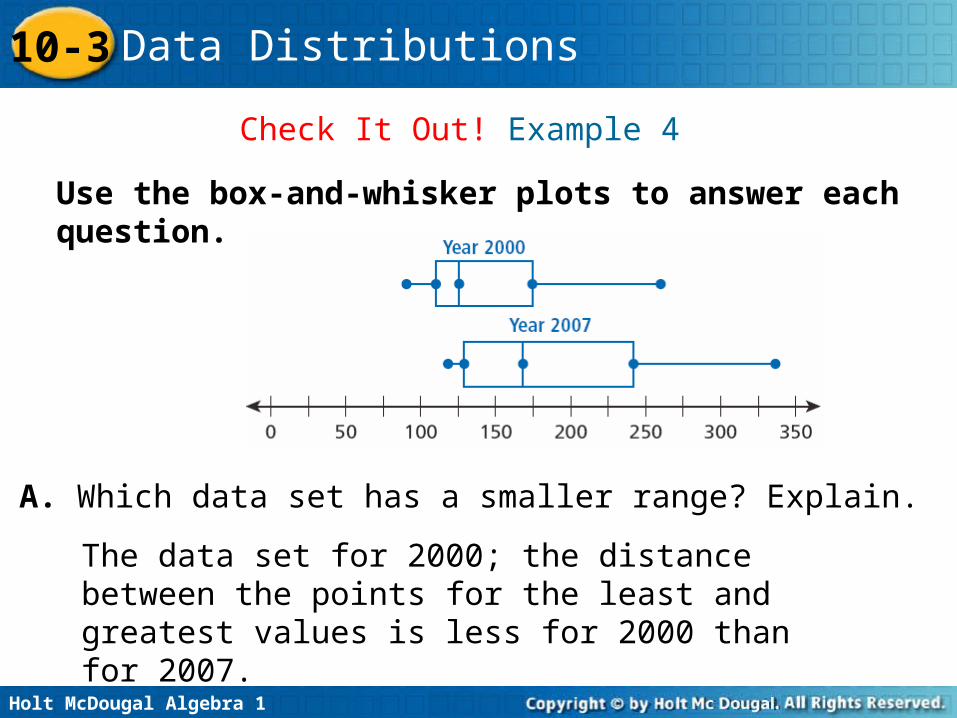
Check It Out! Example 4
Use the box-and-whisker plots to answer each question.
A. Which data set has a smaller range? Explain.
The data set for 2000; the distance between the points for the least and greatest values is less for 2000 than for 2007.
Holt McDougal Algebra 1
10-3 Data Distributions
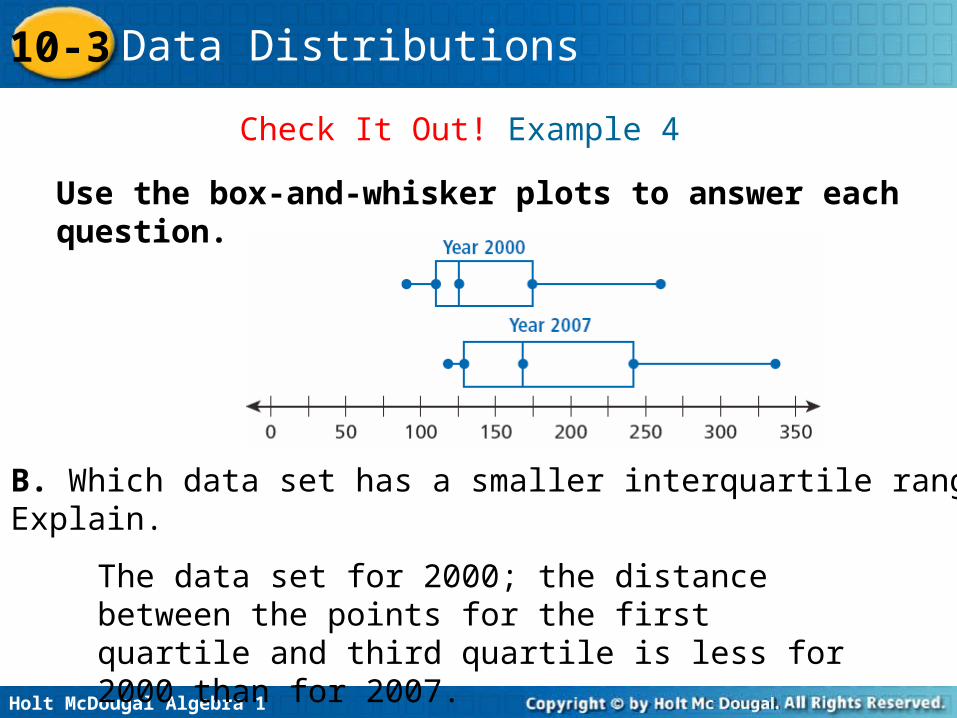
Check It Out! Example 4
Use the box-and-whisker plots to answer each question.
B. Which data set has a smaller interquartile range? Explain.
The data set for 2000; the distance between the points for the first quartile and third quartile is less for 2000 than for 2007.
Holt McDougal Algebra 1
10-3 Data Distributions
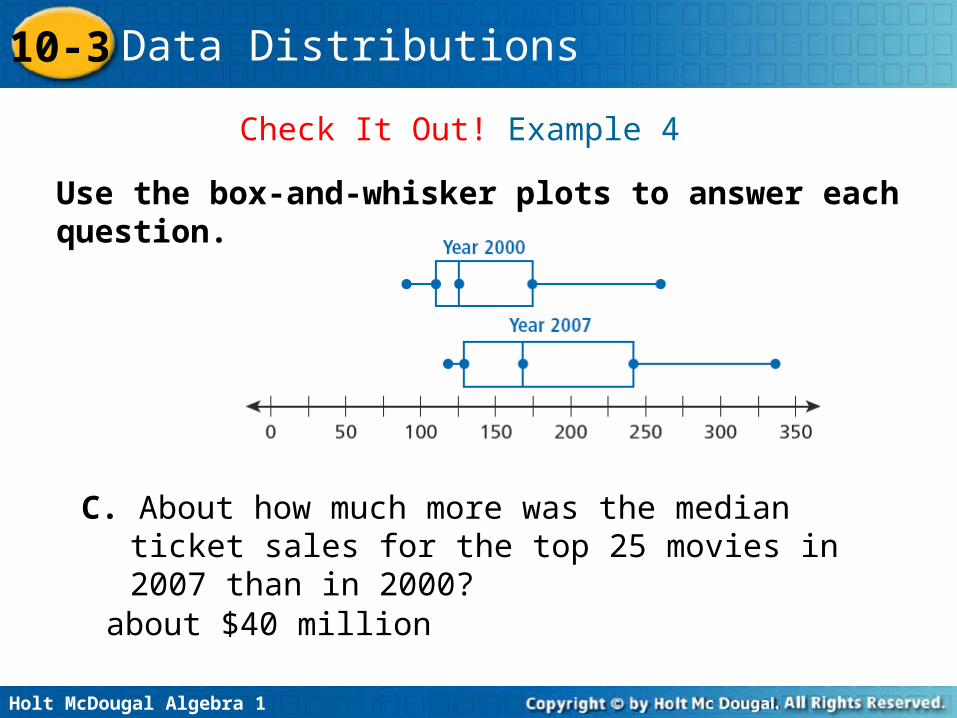
Check It Out! Example 4
Use the box-and-whisker plots to answer each question.
C. About how much more was the median ticket sales for the top 25 movies in 2007 than in 2000?about $40 million