Embed Size (px)
Citation preview
Ryu et al. BMC Genomics (2016) 17:158 DOI 10.1186/s12864-016-2501-0
RESEARCH ARTICLE Open Access
Hologenome analysis of two marinesponges with different microbiomes
Taewoo Ryu1,2,12*, Loqmane Seridi1,2, Lucas Moitinho-Silva3, Matthew Oates4, Yi Jin Liew2,5, Charalampos Mavromatis1,2,Xiaolei Wang6,7, Annika Haywood2, Feras F. Lafi2,8, Marija Kupresanin1,2, Rachid Sougrat9, Majed A. Alzahrani6,7,Emily Giles2, Yanal Ghosheh1,2, Celia Schunter1,2, Sebastian Baumgarten2,5, Michael L. Berumen2,5, Xin Gao6,7,Manuel Aranda2,5, Sylvain Foret10, Julian Gough4, Christian R. Voolstra2,5, Ute Hentschel11 and Timothy Ravasi1,2*Abstract
Background: Sponges (Porifera) harbor distinct microbial consortia within their mesohyl interior. We herein analysedthe hologenomes of Stylissa carteri and Xestospongia testudinaria, which notably differ in their microbiome content.
Results: Our analysis revealed that S. carteri has an expanded repertoire of immunological domains, specificallyScavenger Receptor Cysteine-Rich (SRCR)-like domains, compared to X. testudinaria. On the microbial side,metatranscriptome analyses revealed an overrepresentation of potential symbiosis-related domains in X. testudinaria.
Conclusions: Our findings provide genomic insights into the molecular mechanisms underlying host-symbiontcoevolution and may serve as a roadmap for future hologenome analyses.
Keywords: Sponge, Stylissa carteri, Xestospongia testudinaria, Innate immune system, Host, Microbial symbionts,Hologenome
BackgroundMicrobial symbionts are being increasingly recognised asdeeply integral components of multicellular organismsthat affect core host functions such as development, im-munity, nutrition, and reproduction [1]. The holobiont(synonym with “metaorganism”, and defined as the hostorganism and its collective microbial community) [2] isthus considered a biological unit of natural selection(the “hologenome theory”) [3]. However, the molecularmechanisms (e.g., immune system evasion and toler-ance) that have resulted in these symbiotic partnershipsare poorly understood.Sponges (Porifera) represent one of the oldest, still ex-
tant animal phyla. Fossil evidence dating back 580 millionyears ago shows their existence in the Precambrian longbefore the radiation of all other animal phyla [4]. Spongesare globally distributed in all aquatic habitats from warm
* Correspondence: [email protected]; [email protected] Environmental Epigenetic Program (KEEP), King Abdullah Universityof Science and Technology, Thuwal 23955-6900, Kingdom of Saudi Arabia2Division of Biological and Environmental Sciences & Engineering, KingAbdullah University of Science and Technology, Thuwal 23955-6900,Kingdom of Saudi ArabiaFull list of author information is available at the end of the article
© 2016 Ryu et al. Open Access This article isInternational License (http://creativecommonsreproduction in any medium, provided you gthe Creative Commons license, and indicate if(http://creativecommons.org/publicdomain/ze
tropical reefs to the cold deep sea and are even present infreshwater lakes and streams. As sessile filter feeders, theypump many thousands liters of water per day through theaquiferous canal system that is embedded within thesponge body and are constantly exposed to a plethora ofmicroorganisms from the environment [5]. Many speciesare colonised by dense and diverse microbial consortiathat are contained extracellularly within the mesohylmatrix (“high microbial abundance” (HMA)), while otherspecies are nearly devoid of microorganisms (“low micro-bial abundance” (LMA)) [6–8].To investigate factors involved in sponge-microbe inter-
actions, we herein sequenced and analysed hologenomedata including genome, transcriptome, and metatranscrip-tome of S. carteri (an LMA sponge and hereafter referredto as “SC”) and X. testudinaria (an HMA sponge andhereafter referred to as “XT”) (Fig. 1, Additional file 1 andAdditional file 2). These two sponges were collected fromthe same habitat, which ensured systematic comparisonby minimizing environmental effect such as differentplanktons and temperature. SC is the first species in theorder Halichondrida to have its genome sequenced whileXT (order Haplosclerida) is the first HMA sponge to have
distributed under the terms of the Creative Commons Attribution 4.0.org/licenses/by/4.0/), which permits unrestricted use, distribution, andive appropriate credit to the original author(s) and the source, provide a link tochanges were made. The Creative Commons Public Domain Dedication waiverro/1.0/) applies to the data made available in this article, unless otherwise stated.
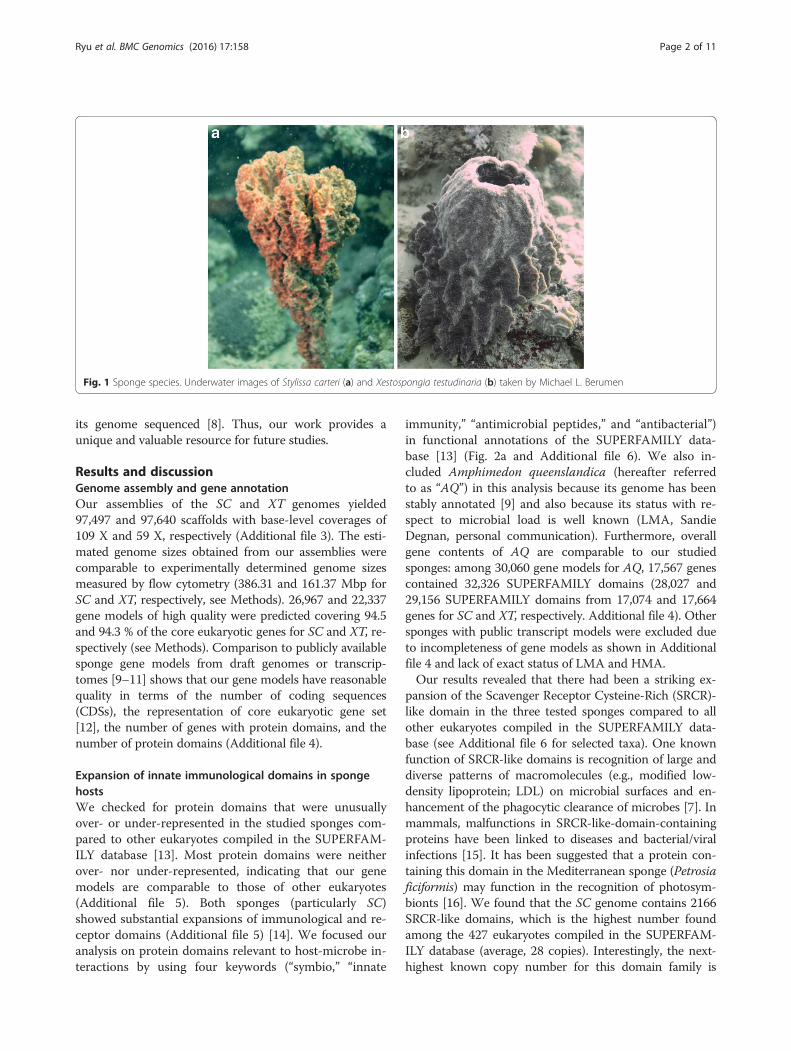
Fig. 1 Sponge species. Underwater images of Stylissa carteri (a) and Xestospongia testudinaria (b) taken by Michael L. Berumen
Ryu et al. BMC Genomics (2016) 17:158 Page 2 of 11
its genome sequenced [8]. Thus, our work provides aunique and valuable resource for future studies.
Results and discussionGenome assembly and gene annotationOur assemblies of the SC and XT genomes yielded97,497 and 97,640 scaffolds with base-level coverages of109 X and 59 X, respectively (Additional file 3). The esti-mated genome sizes obtained from our assemblies werecomparable to experimentally determined genome sizesmeasured by flow cytometry (386.31 and 161.37 Mbp forSC and XT, respectively, see Methods). 26,967 and 22,337gene models of high quality were predicted covering 94.5and 94.3 % of the core eukaryotic genes for SC and XT, re-spectively (see Methods). Comparison to publicly availablesponge gene models from draft genomes or transcrip-tomes [9–11] shows that our gene models have reasonablequality in terms of the number of coding sequences(CDSs), the representation of core eukaryotic gene set[12], the number of genes with protein domains, and thenumber of protein domains (Additional file 4).
Expansion of innate immunological domains in spongehostsWe checked for protein domains that were unusuallyover- or under-represented in the studied sponges com-pared to other eukaryotes compiled in the SUPERFAM-ILY database [13]. Most protein domains were neitherover- nor under-represented, indicating that our genemodels are comparable to those of other eukaryotes(Additional file 5). Both sponges (particularly SC)showed substantial expansions of immunological and re-ceptor domains (Additional file 5) [14]. We focused ouranalysis on protein domains relevant to host-microbe in-teractions by using four keywords (“symbio,” “innate
immunity,” “antimicrobial peptides,” and “antibacterial”)in functional annotations of the SUPERFAMILY data-base [13] (Fig. 2a and Additional file 6). We also in-cluded Amphimedon queenslandica (hereafter referredto as “AQ”) in this analysis because its genome has beenstably annotated [9] and also because its status with re-spect to microbial load is well known (LMA, SandieDegnan, personal communication). Furthermore, overallgene contents of AQ are comparable to our studiedsponges: among 30,060 gene models for AQ, 17,567 genescontained 32,326 SUPERFAMILY domains (28,027 and29,156 SUPERFAMILY domains from 17,074 and 17,664genes for SC and XT, respectively. Additional file 4). Othersponges with public transcript models were excluded dueto incompleteness of gene models as shown in Additionalfile 4 and lack of exact status of LMA and HMA.Our results revealed that there had been a striking ex-
pansion of the Scavenger Receptor Cysteine-Rich (SRCR)-like domain in the three tested sponges compared to allother eukaryotes compiled in the SUPERFAMILY data-base (see Additional file 6 for selected taxa). One knownfunction of SRCR-like domains is recognition of large anddiverse patterns of macromolecules (e.g., modified low-density lipoprotein; LDL) on microbial surfaces and en-hancement of the phagocytic clearance of microbes [7]. Inmammals, malfunctions in SRCR-like-domain-containingproteins have been linked to diseases and bacterial/viralinfections [15]. It has been suggested that a protein con-taining this domain in the Mediterranean sponge (Petrosiaficiformis) may function in the recognition of photosym-bionts [16]. We found that the SC genome contains 2166SRCR-like domains, which is the highest number foundamong the 427 eukaryotes compiled in the SUPERFAM-ILY database (average, 28 copies). Interestingly, the next-highest known copy number for this domain family is
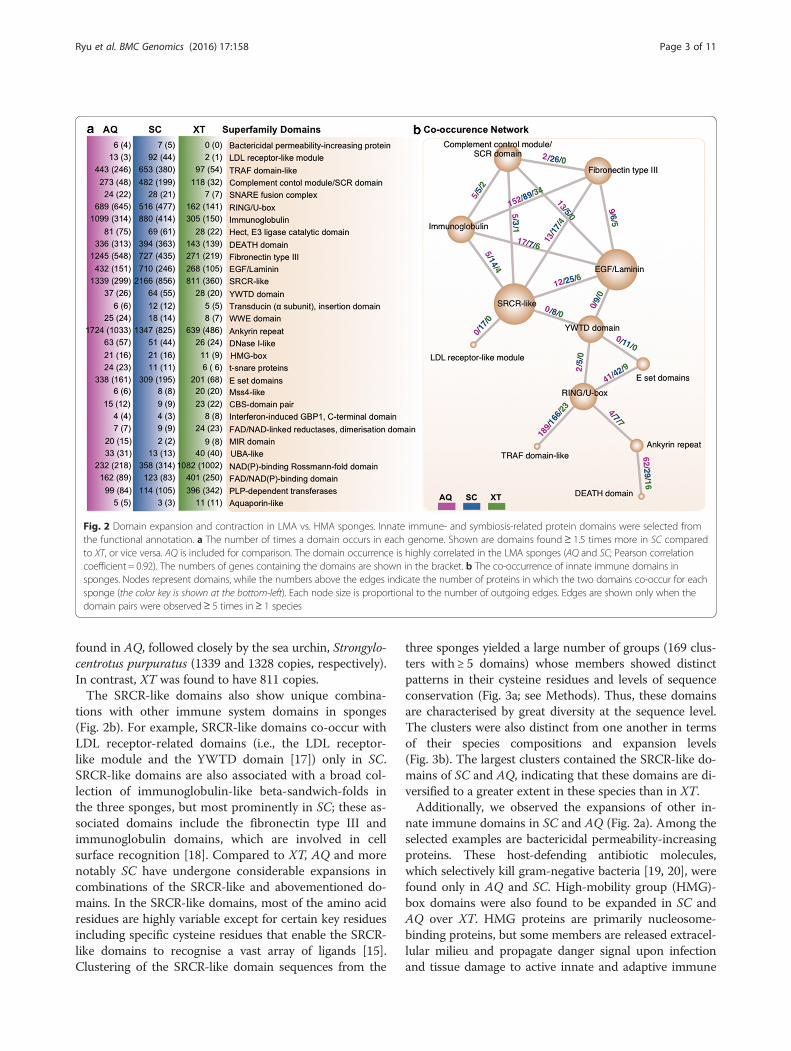
Fig. 2 Domain expansion and contraction in LMA vs. HMA sponges. Innate immune- and symbiosis-related protein domains were selected fromthe functional annotation. a The number of times a domain occurs in each genome. Shown are domains found≥ 1.5 times more in SC comparedto XT, or vice versa. AQ is included for comparison. The domain occurrence is highly correlated in the LMA sponges (AQ and SC; Pearson correlationcoefficient = 0.92). The numbers of genes containing the domains are shown in the bracket. b The co-occurrence of innate immune domains insponges. Nodes represent domains, while the numbers above the edges indicate the number of proteins in which the two domains co-occur for eachsponge (the color key is shown at the bottom-left). Each node size is proportional to the number of outgoing edges. Edges are shown only when thedomain pairs were observed≥ 5 times in≥ 1 species
Ryu et al. BMC Genomics (2016) 17:158 Page 3 of 11
found in AQ, followed closely by the sea urchin, Strongylo-centrotus purpuratus (1339 and 1328 copies, respectively).In contrast, XT was found to have 811 copies.The SRCR-like domains also show unique combina-
tions with other immune system domains in sponges(Fig. 2b). For example, SRCR-like domains co-occur withLDL receptor-related domains (i.e., the LDL receptor-like module and the YWTD domain [17]) only in SC.SRCR-like domains are also associated with a broad col-lection of immunoglobulin-like beta-sandwich-folds inthe three sponges, but most prominently in SC; these as-sociated domains include the fibronectin type III andimmunoglobulin domains, which are involved in cellsurface recognition [18]. Compared to XT, AQ and morenotably SC have undergone considerable expansions incombinations of the SRCR-like and abovementioned do-mains. In the SRCR-like domains, most of the amino acidresidues are highly variable except for certain key residuesincluding specific cysteine residues that enable the SRCR-like domains to recognise a vast array of ligands [15].Clustering of the SRCR-like domain sequences from the
three sponges yielded a large number of groups (169 clus-ters with ≥ 5 domains) whose members showed distinctpatterns in their cysteine residues and levels of sequenceconservation (Fig. 3a; see Methods). Thus, these domainsare characterised by great diversity at the sequence level.The clusters were also distinct from one another in termsof their species compositions and expansion levels(Fig. 3b). The largest clusters contained the SRCR-like do-mains of SC and AQ, indicating that these domains are di-versified to a greater extent in these species than in XT.Additionally, we observed the expansions of other in-
nate immune domains in SC and AQ (Fig. 2a). Among theselected examples are bactericidal permeability-increasingproteins. These host-defending antibiotic molecules,which selectively kill gram-negative bacteria [19, 20], werefound only in AQ and SC. High-mobility group (HMG)-box domains were also found to be expanded in SC andAQ over XT. HMG proteins are primarily nucleosome-binding proteins, but some members are released extracel-lular milieu and propagate danger signal upon infectionand tissue damage to active innate and adaptive immune
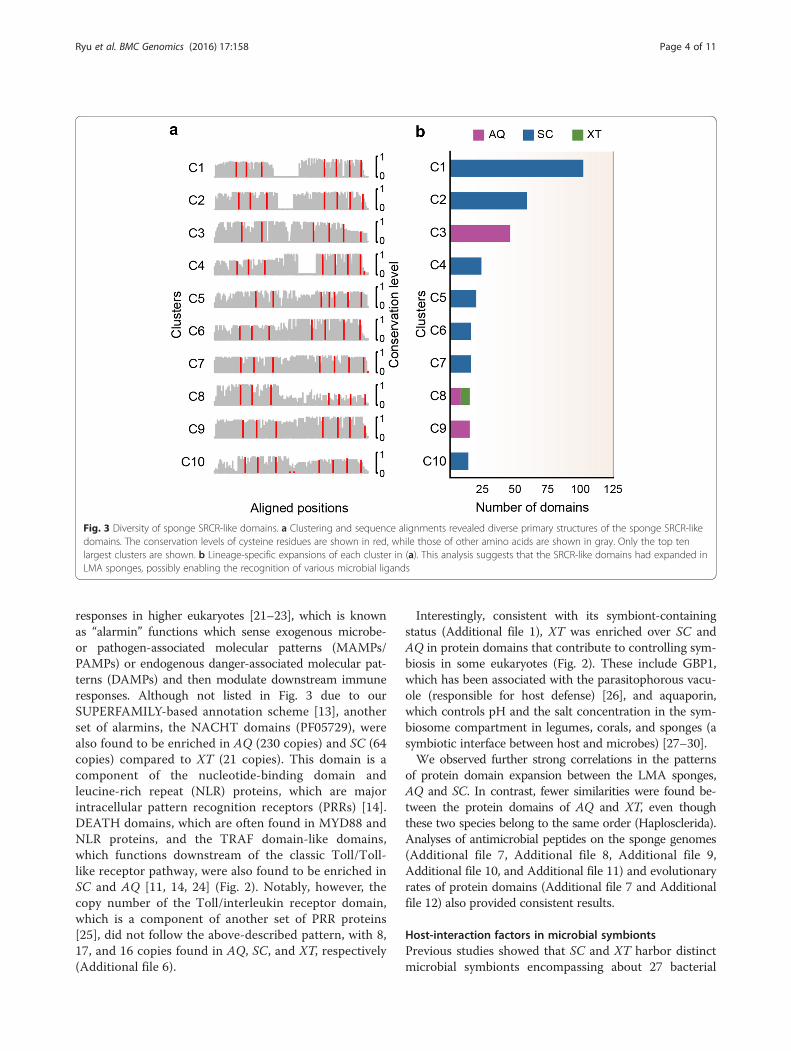
Fig. 3 Diversity of sponge SRCR-like domains. a Clustering and sequence alignments revealed diverse primary structures of the sponge SRCR-likedomains. The conservation levels of cysteine residues are shown in red, while those of other amino acids are shown in gray. Only the top tenlargest clusters are shown. b Lineage-specific expansions of each cluster in (a). This analysis suggests that the SRCR-like domains had expanded inLMA sponges, possibly enabling the recognition of various microbial ligands
Ryu et al. BMC Genomics (2016) 17:158 Page 4 of 11
responses in higher eukaryotes [21–23], which is knownas “alarmin” functions which sense exogenous microbe-or pathogen-associated molecular patterns (MAMPs/PAMPs) or endogenous danger-associated molecular pat-terns (DAMPs) and then modulate downstream immuneresponses. Although not listed in Fig. 3 due to ourSUPERFAMILY-based annotation scheme [13], anotherset of alarmins, the NACHT domains (PF05729), werealso found to be enriched in AQ (230 copies) and SC (64copies) compared to XT (21 copies). This domain is acomponent of the nucleotide-binding domain andleucine-rich repeat (NLR) proteins, which are majorintracellular pattern recognition receptors (PRRs) [14].DEATH domains, which are often found in MYD88 andNLR proteins, and the TRAF domain-like domains,which functions downstream of the classic Toll/Toll-like receptor pathway, were also found to be enriched inSC and AQ [11, 14, 24] (Fig. 2). Notably, however, thecopy number of the Toll/interleukin receptor domain,which is a component of another set of PRR proteins[25], did not follow the above-described pattern, with 8,17, and 16 copies found in AQ, SC, and XT, respectively(Additional file 6).
Interestingly, consistent with its symbiont-containingstatus (Additional file 1), XT was enriched over SC andAQ in protein domains that contribute to controlling sym-biosis in some eukaryotes (Fig. 2). These include GBP1,which has been associated with the parasitophorous vacu-ole (responsible for host defense) [26], and aquaporin,which controls pH and the salt concentration in the sym-biosome compartment in legumes, corals, and sponges (asymbiotic interface between host and microbes) [27–30].We observed further strong correlations in the patterns
of protein domain expansion between the LMA sponges,AQ and SC. In contrast, fewer similarities were found be-tween the protein domains of AQ and XT, even thoughthese two species belong to the same order (Haplosclerida).Analyses of antimicrobial peptides on the sponge genomes(Additional file 7, Additional file 8, Additional file 9,Additional file 10, and Additional file 11) and evolutionaryrates of protein domains (Additional file 7 and Additionalfile 12) also provided consistent results.
Host-interaction factors in microbial symbiontsPrevious studies showed that SC and XT harbor distinctmicrobial symbionts encompassing about 27 bacterial
Ryu et al. BMC Genomics (2016) 17:158 Page 5 of 11
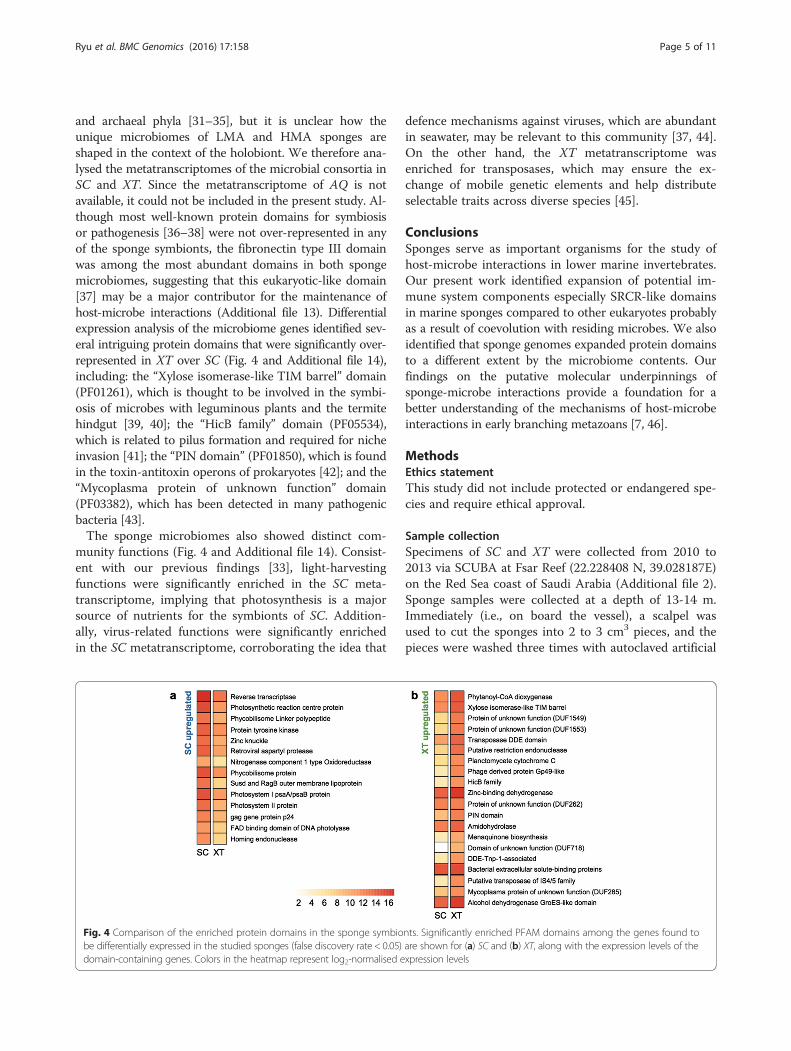
and archaeal phyla [31–35], but it is unclear how theunique microbiomes of LMA and HMA sponges areshaped in the context of the holobiont. We therefore ana-lysed the metatranscriptomes of the microbial consortia inSC and XT. Since the metatranscriptome of AQ is notavailable, it could not be included in the present study. Al-though most well-known protein domains for symbiosisor pathogenesis [36–38] were not over-represented in anyof the sponge symbionts, the fibronectin type III domainwas among the most abundant domains in both spongemicrobiomes, suggesting that this eukaryotic-like domain[37] may be a major contributor for the maintenance ofhost-microbe interactions (Additional file 13). Differentialexpression analysis of the microbiome genes identified sev-eral intriguing protein domains that were significantly over-represented in XT over SC (Fig. 4 and Additional file 14),including: the “Xylose isomerase-like TIM barrel” domain(PF01261), which is thought to be involved in the symbi-osis of microbes with leguminous plants and the termitehindgut [39, 40]; the “HicB family” domain (PF05534),which is related to pilus formation and required for nicheinvasion [41]; the “PIN domain” (PF01850), which is foundin the toxin-antitoxin operons of prokaryotes [42]; and the“Mycoplasma protein of unknown function” domain(PF03382), which has been detected in many pathogenicbacteria [43].The sponge microbiomes also showed distinct com-
munity functions (Fig. 4 and Additional file 14). Consist-ent with our previous findings [33], light-harvestingfunctions were significantly enriched in the SC meta-transcriptome, implying that photosynthesis is a majorsource of nutrients for the symbionts of SC. Addition-ally, virus-related functions were significantly enrichedin the SC metatranscriptome, corroborating the idea that
Fig. 4 Comparison of the enriched protein domains in the sponge symbiobe differentially expressed in the studied sponges (false discovery rate < 0.05)domain-containing genes. Colors in the heatmap represent log2-normalised e
defence mechanisms against viruses, which are abundantin seawater, may be relevant to this community [37, 44].On the other hand, the XT metatranscriptome wasenriched for transposases, which may ensure the ex-change of mobile genetic elements and help distributeselectable traits across diverse species [45].
ConclusionsSponges serve as important organisms for the study ofhost-microbe interactions in lower marine invertebrates.Our present work identified expansion of potential im-mune system components especially SRCR-like domainsin marine sponges compared to other eukaryotes probablyas a result of coevolution with residing microbes. We alsoidentified that sponge genomes expanded protein domainsto a different extent by the microbiome contents. Ourfindings on the putative molecular underpinnings ofsponge-microbe interactions provide a foundation for abetter understanding of the mechanisms of host-microbeinteractions in early branching metazoans [7, 46].
MethodsEthics statementThis study did not include protected or endangered spe-cies and require ethical approval.
Sample collectionSpecimens of SC and XT were collected from 2010 to2013 via SCUBA at Fsar Reef (22.228408 N, 39.028187E)on the Red Sea coast of Saudi Arabia (Additional file 2).Sponge samples were collected at a depth of 13-14 m.Immediately (i.e., on board the vessel), a scalpel wasused to cut the sponges into 2 to 3 cm3 pieces, and thepieces were washed three times with autoclaved artificial
nts. Significantly enriched PFAM domains among the genes found toare shown for (a) SC and (b) XT, along with the expression levels of thexpression levels
Ryu et al. BMC Genomics (2016) 17:158 Page 6 of 11
seawater (ASW). Thereafter, the samples were either fro-zen in dry ice for DNA extraction, or incubated over-night at 4 °C in RNAlater (Ambion, USA) and stored at− 80 °C for RNA extraction. These cooled samples weretransported to the laboratory for experiments.
Transmission electron microscopyThe 3 mm3 pieces of sponge were fixed with 2.5 % glu-taraldehyde in seawater for ≥ 48 h, treated with reducedosmium (1:1 mixture of 2 % aqueous potassium ferro-cyanide) for 1 h as described previously [47], graduallydehydrated using an ethanol series (70, 80, 90, 95, and100 %), and embedded in Epoxy resin. Thereafter, 80 to120 nm-thick sections were collected on copper gridsand contrasted with lead citrate. Imaging was performedusing a Tecnai transmission electron microscope operat-ing at 120 kV (FEI, USA). Images were recorded on a2 K × 4 K CCD camera (Gatan Inc., USA).
DNA extractionSponge tissues were ground under liquid nitrogen, andgenomic DNA was extracted from 20 to 30 mg groundtissue using an All-PrepDNA kit (Qiagen, Germany).The extracted DNA was eluted with 100 μl of water, andits quality and quantity were measured using a Nano-Drop 8000 spectrophotometer (Thermo Scientific, USA).To test the level of bacterial DNA in the extractedDNA, PCR was performed using the Qiagen PCR MasterMix solution (Qiagen, Germany) and two primer pairs(Bac27F, 5’-AGAGTTTGATCMTGGCTCAG-3’ andBac1492R, CGGTTACCTTGTTACGACTT; and COX1-D2, AATACTGCTTTTTTTGATCCT GCCGG and COX1-R1 TGTTGRGGGAAAAARGTTAAATT). The cyc-ling conditions consisted of 15 min at 95 °C, followed by30 cycles of 95 °C for 30 s, 56 °C for 90 s and 72 °C for90 s, and a final extension of 10 min at 72 °C. The sampleswere resolved by 1 % agarose gel electrophoresis. TheDNA integrity was checked, and samples that showed abrighter band for bacterial DNA compared to sponge gen-omic DNA were excluded from further analysis.We additionally performed whole-genome amplifica-
tion of isolated sponge cells from SC and XT (Additionalfile 2). The sponges were cut into 0.5 cm3 pieces, rinsedthree times with cold calcium-magnesium-free (CMF)-ASW (0.55 M NaCl, 12 mM KCl, 6.3 mM Na2S04,5 mM Tris–HCl, 5 mM EDTA) at a 1:10 ratio of spon-ge:CMF-ASW, and agitated at 100 rpm overnight infresh CMF-ASW. All liquid and the remaining spongepieces were passed through a 70 μm Nitex filter (FisherScientific, UK), and each sample was centrifuged (700 gfor 5 min at 4 °C). The pellet was washed with 10 ml ofASW, centrifuged, and suspended in 2 ml ASW. One mlof sample was gently layered atop a 30:50:70 % Percollgradient in a 15 ml Falcon tube (VWR International,
USA), and the sample-loaded gradient was centrifugedat 400 x g for 15 min at 4 °C. Each gradient layer was in-dividually pipetted to a separate 2 ml tube and subjectedto microscopic analysis. The layers representing 30:50and 50:70 % Percoll were found to contain the mostsponge cells and the fewest bacterial cells. These layerswere washed with 5 ml ASW (300 x g for 5 min)and suspended in 200 μl 1xPBS. Micromanipulators(Narishige, Japan) were used to collect 15–30 sponge cells,which were dispensed to 3 μl sterile 1x PBS and subjectedto whole-genome DNA amplification using an REPLI-gMidi kit (Qiagen, Germany). Briefly, 3.5 μl of Buffer D2(83 mM DTT, 917 mM Reconstituted Buffer DLB) and3 μl of cells in 1 x PBS were vortexed, briefly centrifuged,and incubated for 10 min on ice. Stop solution (3.5 μl)was added, and the sample was vortexed and then brieflycentrifuged to yield denatured DNA. A master mix wasmade by combining 1 x SYBR Green, nuclease free H20,REPLI-g Midi Reaction Buffer and REPLI-g Midi DNApolymerase (as per the instructions), and 50 μl of thismaster mix was added to 10 μl of the denatured DNA.The samples were incubated on a Real-Time PCR 7900(Applied Biosystems, USA) at 30 °C for 16 h followed by3 min at 65 °C (to inactivate the polymerase). Each samplewas then analysed for bacterial contamination (as de-scribed above) and then stored at − 20 °C until use.
Extraction of mRNATotal RNA was extracted as described by Moitinho-Silvaet al. [33], and sponge mRNA was isolated from the totalRNA (100 μg) using a Poly(A) Purist MAG kit (Ambion,USA) with two rounds of poly(A) purification. The iso-lated sponge mRNA was linearly amplified using a Mes-sageAmp II-Bacteria kit (Ambion, USA) as described,except that we omitted the polyadenylation of the tem-plate RNA (which is required only for prokaryotic RNA).RNA integrity was analysed using an Experion System(Bio-Rad, USA), and the isolated sponge mRNA wasstored at − 80 °C until use.
Microbiome RNA extractionThe metatranscriptome of each sponge was extracted asdescribed by Moitinho-Silva et al. [33].
Estimation of sponge genome sizeFresh sponge tissues were rinsed three times in filtered(0.22-μm, 142-mm Express Plus filters; Millipore, USA)seawater, fixed in 95 % ethanol and stored at − 20 °C.Small pieces of ethanol-preserved sponge (0.5–1 cm3)were subjected to two different nuclear suspension ap-proaches, both involving the standard protocol of theCyStain® PI absolute T kit (Partec GmbH, Germany). Forthe first (tissue-grinder-based) approach, a piece ofsponge was placed in a cryotube, incubated for 15 min
Ryu et al. BMC Genomics (2016) 17:158 Page 7 of 11
in extraction buffer, and mashed with a tissue grinder for1 min. The sample was filtered through a 40 μm nylonmesh filter, 250 μl of sample was combined with 1.25 ml(5 volumes) of staining solution (staining buffer + pro-pidium iodide + RNase), and the mixture was incubatedin the dark for 60 min. As a control, chicken erythro-cytes (Gallus gallus domesticus, 2C = 2.45 pg) wereincluded in the same tube and analysed in parallel withthe sponge sample. For the second (bead-beating-based) approach, the sample was placed in a cryotube,incubated in extraction buffer (Partec GmbH, Germany)for 15 min, and homogenised with an MP FastPrep 24machine (MP Biomedicals, USA) for 10–20 s (4.0 M/s, 2ceramic beads). All samples were analysed using a BDCanto II flow cytometer (BD Biosciences, USA) with a488 nm laser (to excite the PI) and a 585/42 band-passemission filter.Both methods yielded very similar genome sizes. For
SC, the first and second protocols yielded haploid gen-ome sizes of 0.395 pg (386.31 Mbp) and 0.39 pg (381.42Mbp), respectively. For XT, both protocols yielded hap-loid genome sizes of 0.165 pg (161.37 Mbp).
High-throughput sequencingGenomic DNA and RNA libraries were prepared usingthe TruSeq kit (Illumina, USA). For mate-pair librarypreparation, a Nextera kit (Illumina, USA) was used forfragmentation, size selection, and circularisation, and thena TruSeq kit was used for end repair and adapter ligation.HiSeq2000 technology (Illumina, USA) was used forpaired-end and mate-pair sequencing; 454 and Ion protonsequencing were conducted using standard protocols(Additional file 2). All sequencing was performed in theKAUST Bioscience Core Lab (Saudi Arabia).
De novo assembly of sponge genomes andtranscriptomesThe low-quality ends of short Illumina reads (spanningfrom the first base with Q-score < 20 up to the 3’ end)and sequencing adapters were trimmed. Long reads ob-tained from 454, Ion PGM, and Ion proton sequencingwere split at each low-quality base (Q-score < 20), suchthat all bases in each split sequence had Q-scores ≥ 20.The preprocessed genomic reads obtained using the
different platforms were assembled with Velvet v1.2.09[48], using k-mers from 55 to 75 with steps of 10. TheVelvet assembly with k = 65 was selected, as it producedthe longest scaffold N50. Transcriptomes were assem-bled with ABySS v.1.3.4 [49] and Trans-ABySS v.1.4.4[50], using k-mers from 45 to 75 with steps of 10; theseprograms were chosen because benchmark tests [51, 52]showed that it yielded a higher accuracy than other de novoassemblers. Genomic scaffolds were further assembledusing the transcriptomes, by the L_RNA_SCAFFOLDER
[53]. After discarding short scaffolds (<800 bp) based onthe genome annotation guideline [54], our analysis yielded97,497 and 97,640 scaffolds for SC and XT, respectively.The statistics for our genomic and transcriptomic assem-blies are summarised in Additional file 3. To obtain thebase-level and mean coverages for each scaffold, we alignedthe reads to the relevant scaffolds, and analysed them usingBWA [55], SAMtools [56], BEDTools [57], and custom Javascripts. The mean base-level coverages of the SC and XTgenomes were 109 X and 59 X, respectively. The host gen-ome sizes for SC and XT, which were roughly estimatedusing scaffolds with GC % < 50, were 407.44 and 173.78Mbp, respectively.
Gene annotationMAKER2 was used to annotate the gene models [58].Assembled transcriptome contigs were used as themRNA evidence, while proteins from the Amphimedonqueenslandica (AQ), CEGMA, and UniProtKB/Swiss-Prot databases were used as protein homology evidence[12, 59]. Augustus (trained with the gene model fromAQ) and SNAP were used as ab initio gene predictorsinside the MAKER2 pipeline [60, 61]. Gene models withan Annotation Edit Distance (AED) score ≤ 0.75 fromMAKER2 were selected.To increase the authenticity of each predicted gene
model, we tagged them as eukaryotic (E), prokaryotic (P),or unknown (X). A gene was tagged as “E” if the proteinproduct had a hit to any eukaryotic gene (e-value < 10−4)in the NCBI non-redundant (nr) database, as assessedusing Blastp [62]. A gene was tagged as “P” if it had a sig-nificant hit (e-value < 10−4) to prokaryotic genes withoutany eukaryotic gene hit. A gene was tagged as “X” if itlacked any significant hit. The statistics and properties ofthe genes identified with each tag are summarized inAdditional file 3 and Additional file 15, respectively. Weused only “E” genes for our downstream analysis (26,967and 22,337 genes for SC and XT, respectively), becausethey were considered to represent bona fide host genes.The completeness of each assembly was measured
using CEGMA v2.4 [12], which revealed that 73 and81 % of 458 Core Eukaryotic Genes (CEGs) were com-pletely or partially present in the genomes of SC and XT,respectively. However, as reported in Smith et al. [63],these numbers can differ depending on the utilisedsearch algorithm. Accordingly, we also used Blastp tosearch 458 CEGs against the sponge gene models, set-ting the e-value threshold to 10−4. This analysis indicatedthat 433 (94.5 %) and 432 (94.3 %) CEGs had homologsin SC and XT, respectively.The quality of predicted gene models was assessed by
comparing to those of publicly available Porifera dataset(Additional file 4). Gene models from the draft genomeswere used for AQ [9], SC, and XT. Transcriptome
Ryu et al. BMC Genomics (2016) 17:158 Page 8 of 11
assemblies of eight sponges (Aphrocallistes vastus, Chon-drilla nucula, Corticium candelabrum, Ircinia fasciculata,Petrosia ficiformis, Pseudospongosorites suberitoides, Spon-gilla lacustris, and Sycon coactum) were retrieved fromRiesgo et al. [11]. Transcript models for other sponges(Ephydatia muelleri, Leucosolenia complicata, Oscarellacarmela, Oscarella sp, Sycon ciliatum) were retrieved fromCompagen [10]. The CDSs of sponges except for AQ, SC,and XT were obtained by applying TransDecoder [64] andcd-hit-est [65] with default setting. Blastp [62] were per-formed for sponge CDSs against 458 CEGMA core geneset [12] with the threshold 10−4. SUPERFAMILY domainswere annotated using Interproscan v5. RC7 [66].
Functional annotation of genesWe annotated SUPERFAMILY and PFAM domainsusing InterProScan v5. RC7 [66]. The gene ontology(GO) terms were assigned to proteins harboring SUPER-FAMILY and PFAM domains using dcGO [67] andInterProScan, respectively. Blast searches of the pre-dicted sponge proteins were performed against the NCBInr database, and homologs were identified with an e-value threshold of 10−4. The GO terms of the identifiedhomologs were retrieved from the NCBI database andtransferred to sponge genes using a custom Python script.Whole-genome over/under-representations of GO termswere ranked using Z-scores calculated from a backgrounddistribution generated for each annotated GO term(composed of dcGO results from 382 species found inthe SUPERFAMILY library as of June 1, 2014). Due to re-dundancy among the SUPERFAMILY and PFAM domainsand the more comprehensive functional annotation of theformer by dcGO, we used the SUPERFAMILY domainsfor our analysis of the sponge domain repertoire.
Analysis of SRCR-like domainsThe peptide sequences of the SRCR-like domains fromAQ, SC, and XT were queried against each other usingBlastp [62]. A threshold of ≥ 90 % positive-scoringmatches between two domains was used to identify hom-ology. The Markov Cluster (MCL) Algorithm [68] wasused to cluster the SRCR-like domains, with the Blastp bitscore applied as a similarity metric. The SRCR-like do-main sequences from each cluster were aligned usingMAFFT v7.123b [69], with the extension penalty param-eter and maximum iterations set to 0.123 and 3, respect-ively. We computed the amino acid frequency at eachaligned position using a custom Python script.
Microbial community analysisFor Illumina reads, the low-quality ends (from the firstbase with Q-score < 20, which correspond to an errorprobability of 0.01, to the 3’ end) and sequencing adapterswere trimmed using custom Java scripts.
The preprocessed metatranscriptome reads were furtherprocessed to remove any rRNA fragments, using riboPickerv0.4.3 [70] with thresholds of 90 % alignment coverage and90 % alignment identity. Blastx [62] was then used to alignthe reads against the nr database to obtain the best-hit se-quence for each aligned read. To create each reference se-quence, we measured the similarities between extractedsequences using Blastp, and clustered them into homologygroups using MCL [68] with the inflation parameter set to3.6 and the other parameters set at their default values.To quantify the expression level of each homology
group per sample per sponge, we summed the numbersof reads whose best hits were assigned to each homologygroup, then further quantile-normalised the read countsacross samples using the preprocessCore package in R[71]. The differentially expressed homology groups be-tween two sponges were obtained using GFOLD v1.1.2[72], with an expected false discovery rate (FDR) ≤ 0.05.Representative sequences of each homology group were
annotated with respect to PFAM [73] domains using Inter-ProScan v5. RC7 [66]. The GO terms for each domain werealso obtained [74]. The statistical significance of each do-main and the GO term enrichments observed among thedifferentially expressed homology groups were assessedbased on the cumulative hypergeometric distributions andFDRs (≤0.05), which were calculated with a custom Rscript. Fourteen and 20 PFAM domains were found to bestatistically significant in the SC and XT metatranscriptomedatasets, respectively (Fig. 4). SUPERFAMILY [13] domainswere annotated in the same way (Additional file 14).
Availability of supporting dataThe generated sequencing datasets for SC and XT are pub-licly available under NCBI BioProject IDs PRJNA254402and PRJNA254412, respectively. The genome assem-blies, transcripts, and coding sequences for both spongesare available at http://sc.reefgenomics.org and http://xt.reefgenomics.org.
Additional files
Additional file 1: Transmission electron microscope (TEM) images ofstudied sponges. (a–d) TEM images of Stylissa carteri (SC). A number ofthe SC cells are packed with vesicle-like inclusions. Microbes are notobserved in the mesohyl. Spongin (spincy lines), which gives structure tothe sponge tissues, and choanocytes are observed. (e–j) TEM images ofXestospongia testudinaria (XT). Archaeocytes are seen to be engulfingbacteria for digestion. Unique sponge symbionts, such as cyanobacteriawith thylakoid membranes, are frequently observed. Spirochaetes are alsoobserved (arrow in j). Abbreviations: ECM, extracellular matrix; HSC, hostsponge cell; ST, storage cell; n, nucleus; b, bacterium; ub, undigestedbacterium; db, digested bacterium; and f, flagella. (PDF 7354 kb)
Additional file 2: Sources and statistics of sequences used for thehologenome analysis. (XLSX 19 kb)
Additional file 3: Detailed statistics of our sponge genomes andtranscriptomes. (PDF 263 kb)
Ryu et al. BMC Genomics (2016) 17:158 Page 9 of 11
Additional file 4: Comparison of gene annotation quality amongsponge dataset. Transcript models of 16 sponge species are compared toaddress the quality of gene annotation. (PDF 60 kb)
Additional file 5: Over- or under-represented Superfamily domains inSC and XT. Superfamily domains that are unusually enriched in SC and XT.Domains with |deviation| > 0.5 are shown. (PDF 64 kb)
Additional file 6: Superfamily domains related to innate immunity andsymbiosis. Sixteen species were compared; their NCBI taxonomic IDs aregiven in brackets. (XLSX 72 kb)
Additional file 7: Supplementary information describing relationshipbetween Xestospongia testudinaria and Xestospongia muta, antimicrobialpeptides, and evolutionary rates of innate immune domains in analyzedsponge genomes. (PDF 790 kb)
Additional file 8: Statistics of compiled AMPs for broad taxonomicgroup. (PDF 34 kb)
Additional file 9: Taxonomic origins of the AMPs that were successfullyaligned to the sponge genomes. (PDF 47 kb)
Additional file 10: Antimicrobial peptides encoded in the spongegenomes. (PDF 78 kb)
Additional file 11: The number of AMPs with different biologicalactivities on the sponge genomes. (PDF 56 kb)
Additional file 12: Evolutionary rates of selected domains. (a) Boxplotrepresenting the distribution of the mean Ka/Ks for each protein domainbetween sponge pairs. (b) The mean Ka/Ks of each protein domain isshown. This analysis was restricted to the protein domains given in Fig. 2that passed our quality control step (see Methods). (PDF 194 kb)
Additional file 13: Expression levels of protein domains in themetatranscriptome dataset. PFAM and SUPERFAMILY domains are rankedby their expression levels, which were quantile-normalised and thensummed. (XLSX 462 kb)
Additional file 14: SUPERFAMILY domains enriched among the genesfound to be differentially expressed in each sponge metatranscriptome.(PDF 50 kb)
Additional file 15: Properties of gene models. Gene models weretagged based on the presence of eukaryotic or prokaryotic sequences, asassessed by comparison to the NCBI nr database (see Methods). Theproperties of the gene models were analysed based on the numbers ofexons and the transcriptional expression levels. (PDF 481 kb)
AbbreviationsAED: Annotation edit distance; AQ: Amphimedon queenslandica;ASW: Artificial seawater; CEGs: Core eukaryotic genes; CMF: Calcium-magnesium-free; DAMPs: Endogenous danger-associated molecular patterns;GO: Gene ontology; HMA: High microbial abundance; HMG: High-mobilitygroup; LDL: Low-density lipoprotein; LMA: Low microbial abundance;MAMPs: Microbe-associated molecular patterns; NLR: Leucine-rich repeat;PAMPs: Pathogen-associated molecular patterns; SC: Stylissa carteri;SRCR: Scavenger receptor cysteine-rich; XT: Xestospongia testudinaria.
Competing interestsThe authors declare that they have no competing interest.
Authors’ contributionsTR1 (Taewoo Ryu) and TR2 (Timothy Ravasi) conceived the overall study. UHand MLB identified the Red Sea sponges. TR1, RS, LMS, and UH performed theTEM analysis. MK, SB, CRV, and MA performed the genome-size analysis. LMS,AH, FFL, EG, and CS purified the DNA and RNA. TR1, LMS, LS, HM, and UHanalysed the microbial components. TR1, SF, and LS performed the sequenceassembly. TR1 annotated the gene models. TR1 and MO annotated the genefunctions. YJL and MA constructed the website. TR1, MO, and JG performed thedomain enrichment analysis. TR1, LS, YG, and MAA performed the evolutionaryanalysis. TR1, XW, and XG performed the antimicrobial peptide analysis. HMcontributed to preparing the figures. TR1 integrated the results and wrote themanuscript. TR2, UH, CRV, and LMS contributed to the data interpretation ofdata and writing of the manuscript. TR2 supervised the project. All authorsread and approved the final manuscript.
AcknowledgementsThis work was supported by the King Abdullah University of Science andTechnology. LMS was supported by a grant of the German ExcellenceInitiative to the Graduate School of Life Sciences, University of Wuerzburg.We thank the KAUST Core Lab for performing the sequencing and assistingwith the genome-size analysis. We acknowledge Till Rothig (KAUST) forcontributing to the sponge sample collection, Christine Gernert (University ofWurzburg) for assisting with the TEM analysis, and Sebastian Fraune (Universityof Kiel) for reading the manuscript critically. We also thank several anonymousreviewers for constructive comments.
Author details1KAUST Environmental Epigenetic Program (KEEP), King Abdullah Universityof Science and Technology, Thuwal 23955-6900, Kingdom of Saudi Arabia.2Division of Biological and Environmental Sciences & Engineering, KingAbdullah University of Science and Technology, Thuwal 23955-6900,Kingdom of Saudi Arabia. 3School of Biotechnology and BiomolecularSciences & Centre for Marine Bio-Innovation, University of New South WalesSydney, Sydney, Australia. 4Department of Computer Science, University ofBristol, 24 Tyndall Ave, Bristol, UK. 5Red Sea Research Center, King AbdullahUniversity of Science and Technology, Thuwal 23955-6900, Kingdom of SaudiArabia. 6Computer, Electrical and Mathematical Sciences and EngineeringDivision, King Abdullah University of Science and Technology, Thuwal23955-6900, Kingdom of Saudi Arabia. 7Computational Bioscience ResearchCenter, King Abdullah University of Science and Technology, Thuwal23955-6900, Kingdom of Saudi Arabia. 8Center for Desert Agriculture, KingAbdullah University of Science and Technology, Thuwal 23955-6900,Kingdom of Saudi Arabia. 9Imaging and characterization Lab, King AbdullahUniversity of Science and Technology, Thuwal 23955-6900, Kingdom of SaudiArabia. 10Division of Evolution, Ecology and Genetics, Research School ofBiology, The Australian National University, Canberra ACT 2601, Australia.11GEOMAR Helmholtz Centre for Ocean Research, RD3 Marine Microbiologyand Christian-Albrechts University of Kiel, Düsternbrooker Weg 20, D-24105Kiel, Germany. 12Present address: APEC Climate Center, Busan 48058, SouthKorea.
Received: 27 September 2015 Accepted: 18 February 2016
References1. McFall-Ngai M, Hadfield MG, Bosch TC, Carey HV, Domazet-Loso T, Douglas
AE, Dubilier N, Eberl G, Fukami T, Gilbert SF, et al. Animals in a bacterialworld, a new imperative for the life sciences. Proc Natl Acad Sci U S A.2013;110(9):3229–36.
2. Bosch TC, McFall-Ngai MJ. Metaorganisms as the new frontier. Zoology(Jena). 2011;114(4):185–90.
3. Zilber-Rosenberg I, Rosenberg E. Role of microorganisms in the evolution ofanimals and plants: the hologenome theory of evolution. FEMS MicrobiolRev. 2008;32(5):723–35.
4. Li CW, Chen JY, Hua TE. Precambrian sponges with cellular structures.Science. 1998;279(5352):879–82.
5. Bergquist PR. Sponges. Berkeley: University of California Press; 1978.6. Taylor MW, Radax R, Steger D, Wagner M. Sponge-associated
microorganisms: evolution, ecology, and biotechnological potential.Microbiol Mol Biol Rev. 2007;71(2):295–347.
7. Hentschel U, Piel J, Degnan SM, Taylor MW. Genomic insights into themarine sponge microbiome. Nat Rev Microbiol. 2012;10(9):641–54.
8. Gloeckner V, Wehrl M, Moitinho-Silva L, Gernert C, Schupp P, Pawlik JR,Lindquist NL, Erpenbeck D, Worheide G, Hentschel U. The HMA-LMAdichotomy revisited: an electron microscopical survey of 56 sponge species.Biol Bull. 2014;227(1):78–88.
9. Srivastava M, Simakov O, Chapman J, Fahey B, Gauthier MEA, Mitros T,Richards GS, Conaco C, Dacre M, Hellsten U, et al. The Amphimedonqueenslandica genome and the evolution of animal complexity. Nature.2010;466(7307):720–6.
10. Hemmrich G, Bosch TC. Compagen, a comparative genomics platform forearly branching metazoan animals, reveals early origins of genes regulatingstem-cell differentiation. BioEssays. 2008;30(10):1010–8.
11. Riesgo A, Farrar N, Windsor PJ, Giribet G, Leys SP. The analysis of eighttranscriptomes from all poriferan classes reveals surprising geneticcomplexity in sponges. Mol Biol Evol. 2014;31(5):1102–20.
Ryu et al. BMC Genomics (2016) 17:158 Page 10 of 11
12. Parra G, Bradnam K, Korf I. CEGMA: a pipeline to accurately annotate coregenes in eukaryotic genomes. Bioinformatics. 2007;23(9):1061–7.
13. Gough J, Karplus K, Hughey R, Chothia C. Assignment of homology togenome sequences using a library of hidden Markov models that representall proteins of known structure. J Mol Biol. 2001;313(4):903–19.
14. Yuen B, Bayes JM, Degnan SM. The characterization of sponge NLRsprovides insight into the origin and evolution of this innate immune genefamily in animals. Mol Biol Evol. 2014;31(1):106–20.
15. Martinez VG, Moestrup SK, Holmskov U, Mollenhauer J, Lozano F. Theconserved scavenger receptor cysteine-rich superfamily in therapy anddiagnosis. Pharmacol Rev. 2011;63(4):967–1000.
16. Steindler L, Schuster S, Ilan M, Avni A, Cerrano C, Beer S. Differential geneexpression in a marine sponge in relation to its symbiotic state. Mar Biotechnol.2007;9(5):543–9.
17. Springer TA. An extracellular beta-propeller module predicted inlipoprotein and scavenger receptors, tyrosine kinases, epidermal growthfactor precursor, and extracellular matrix components. J Mol Biol.1998;283(4):837–62.
18. Maness PF, Schachner M. Neural recognition molecules of theimmunoglobulin superfamily: signaling transducers of axon guidance andneuronal migration. Nat Neurosci. 2007;10(1):19–26.
19. Levy O, Martin S, Eichenwald E, Ganz T, Valore E, Carroll SF, Lee K,Goldmann D, Thorne GM. Impaired innate immunity in the newborn:newborn neutrophils are deficient in bactericidal/permeability-increasingprotein. Pediatrics. 1999;104(6):1327–33.
20. Nupponen I, Turunen R, Nevalainen T, Peuravuori H, Pohjavuori M, Repo H,Andersson S. Extracellular release of bactericidal/permeability-increasingprotein in newborn infants. Pediatr Res. 2002;51(6):670–4.
21. Bianchi ME. DAMPs, PAMPs and alarmins: all we need to know aboutdanger. J Leukoc Biol. 2007;81(1):1–5.
22. Pisetsky DS, Erlandsson-Harris H, Andersson U. High-mobility group boxprotein 1 (HMGB1): an alarmin mediating the pathogenesis of rheumaticdisease. Arthritis Res Ther. 2008;10(3):209.
23. Yang D, Tewary P, de la Rosa G, Wei F, Oppenheim JJ. The alarmin functions ofhigh-mobility group proteins. Biochim Biophys Acta. 2010;1799(1–2):157–63.
24. Miller DJ, Hemmrich G, Ball EE, Hayward DC, Khalturin K, Funayama N, AgataK, Bosch TCG. The innate immune repertoire in Cnidaria - ancestralcomplexity and stochastic gene loss. Genome Biol. 2007;8(4):R59.
25. Wiens M, Korzhev M, Krasko A, Thakur NL, Perovic-Ottstadt S, Breter HJ,Ushijima H, Diehl-Seifert B, Muller IM, Muller WE. Innate immune defense ofthe sponge Suberites domuncula against bacteria involves a MyD88-dependent signaling pathway. Induction of a perforin-like molecule. J BiolChem. 2005;280(30):27949–59.
26. Degrandi D, Konermann C, Beuter-Gunia C, Kresse A, Wurthner J, Kurig S, BeerS, Pfeffer K. Extensive characterization of IFN-induced GTPases mGBP1 tomGBP10 involved in host defense. J Immunol. 2007;179(11):7729–40.
27. Rivers RL, Dean RM, Chandy G, Hall JE, Roberts DM, Zeidel ML. Functionalanalysis of nodulin 26, an aquaporin in soybean root nodule symbiosomes.J Biol Chem. 1997;272(26):16256–61.
28. Kaldenhoff R, Fischer M. Aquaporins in plants. Acta Physiol (Oxf). 2006;187(1–2):169–76.
29. Muller WE, Belikov SI, Kaluzhnaya OV, Chernogor L, Krasko A, Schroder HC.Symbiotic interaction between dinoflagellates and the demospongeLubomirskia baicalensis: aquaporin-mediated glycerol transport. Prog MolSubcell Biol. 2009;47:145–70.
30. Lehnert EM, Mouchka ME, Burriesci MS, Gallo ND, Schwarz JA, Pringle JR.Extensive differences in gene expression between symbiotic andaposymbiotic cnidarians. G3 (Bethesda). 2014;4(2):277–95.
31. Moitinho-Silva L, Bayer K, Cannistraci CV, Giles EC, Ryu T, Seridi L, Ravasi T,Hentschel U. Specificity and transcriptional activity of microbiota associatedwith low and high microbial abundance sponges from the Red Sea. Mol Ecol.2014;23(6):1348–63.
32. Lee OO, Wang Y, Yang J, Lafi FF, Al-Suwailem A, Qian PY. Pyrosequencingreveals highly diverse and species-specific microbial communities insponges from the Red Sea. Isme J. 2011;5(4):650–64.
33. Moitinho-Silva L, Seridi L, Ryu T, Voolstra CR, Ravasi T, Hentschel U.Revealing microbial functional activities in the Red Sea sponge Stylissacarteri by metatranscriptomics. Environ Microbiol. 2014;16(12):3683–98.
34. Schmitt S, Tsai P, Bell J, Fromont J, Ilan M, Lindquist N, Perez T, Rodrigo A, SchuppPJ, Vacelet J, et al. Assessing the complex sponge microbiota: core, variable andspecies-specific bacterial communities in marine sponges. Isme J. 2012;6(3):564–76.
35. Webster NS, Taylor MW, Behnam F, Lucker S, Rattei T, Whalan S, Horn M, WagnerM. Deep sequencing reveals exceptional diversity and modes of transmission forbacterial sponge symbionts. Environ Microbiol. 2010;12(8):2070–82.
36. Toft C, Andersson SG. Evolutionary microbial genomics: insights intobacterial host adaptation. Nat Rev Genet. 2010;11(7):465–75.
37. Fan L, Reynolds D, Liu M, Stark M, Kjelleberg S, Webster NS, Thomas T.Functional equivalence and evolutionary convergence in complexcommunities of microbial sponge symbionts. Proc Natl Acad Sci U S A.2012;109(27):E1878–1887.
38. Bright M, Bulgheresi S. A complex journey: transmission of microbialsymbionts. Nat Rev Microbiol. 2010;8(3):218–30.
39. Omrane S, Ferrarini A, D’Apuzzo E, Rogato A, Delledonne M, Chiurazzi M.Symbiotic competence in Lotus japonicus is affected by plant nitrogenstatus: transcriptomic identification of genes affected by a new signallingpathway. New Phytol. 2009;183(2):380–94.
40. Isanapong J, Sealy Hambright W, Willis AG, Boonmee A, Callister SJ, BurnumKE, Pasa-Tolic L, Nicora CD, Wertz JT, Schmidt TM, et al. Development of anecophysiological model for Diplosphaera colotermitum TAV2, a termitehindgut Verrucomicrobium. Isme J. 2013;7(9):1803–13.
41. Mhlanga-Mutangadura T, Morlin G, Smith AL, Eisenstark A, Golomb M.Evolution of the major pilus gene cluster of Haemophilus influenzae.J Bacteriol. 1998;180(17):4693–703.
42. Arcus VL, Rainey PB, Turner SJ. The PIN-domain toxin-antitoxin array inmycobacteria. Trends Microbiol. 2005;13(8):360–5.
43. Hunter S, Jones P, Mitchell A, Apweiler R, Attwood TK, Bateman A, BernardT, Binns D, Bork P, Burge S, et al. InterPro in 2011: new developments in thefamily and domain prediction database. Nucleic Acids Res. 2012;40(Database issue):D306–312.
44. Thomas T, Rusch D, DeMaere MZ, Yung PY, Lewis M, Halpern A, HeidelbergKB, Egan S, Steinberg PD, Kjelleberg S. Functional genomic signatures ofsponge bacteria reveal unique and shared features of symbiosis. Isme J.2010;4(12):1557–67.
45. Hooper SD, Mavromatis K, Kyrpides NC. Microbial co-habitation and lateralgene transfer: what transposases can tell us. Genome Biol. 2009;10(4):R45.
46. Sachs JL, Essenberg CJ, Turcotte MM. New paradigms for the evolution ofbeneficial infections. Trends Ecol Evol. 2011;26(4):202–9.
47. Karnovsky M. Use of ferrocyanide-reduced osmium tetroxide in electronmicroscopy, Proceedings of the 11th Annual Meeting American Society forCell Biology New Orleans, Louisiana. 1971.
48. Zerbino DR, Birney E. Velvet: algorithms for de novo short read assemblyusing de Bruijn graphs. Genome Res. 2008;18(5):821–9.
49. Simpson JT, Wong K, Jackman SD, Schein JE, Jones SJ, Birol I. ABySS: a parallelassembler for short read sequence data. Genome Res. 2009;19(6):1117–23.
50. Robertson G, Schein J, Chiu R, Corbett R, Field M, Jackman SD, Mungall K,Lee S, Okada HM, Qian JQ, et al. De novo assembly and analysis of RNA-seqdata. Nat Methods. 2010;7(11):909–12.
51. Zhao QY, Wang Y, Kong YM, Luo D, Li X, Hao P. Optimizing de novotranscriptome assembly from short-read RNA-Seq data: a comparative study.BMC bioinformatics. 2011;12(14):S2.
52. Yang Y, Smith SA. Optimizing de novo assembly of short-read RNA-seq datafor phylogenomics. BMC Genomics. 2013;14:328.
53. Xue W, Li JT, Zhu YP, Hou GY, Kong XF, Kuang YY, Sun XW. L_RNA_scaffolder:scaffolding genomes with transcripts. BMC Genomics. 2013;14:604.
54. Yandell M, Ence D. A beginner’s guide to eukaryotic genome annotation.Nat Rev Genet. 2012;13(5):329–42.
55. Li H, Durbin R. Fast and accurate short read alignment with Burrows-Wheeler transform. Bioinformatics. 2009;25(14):1754–60.
56. Li H, Handsaker B, Wysoker A, Fennell T, Ruan J, Homer N, Marth G, AbecasisG, Durbin R. The Sequence Alignment/Map format and SAMtools.Bioinformatics. 2009;25(16):2078–9.
57. Quinlan AR, Hall IM. BEDTools: a flexible suite of utilities for comparinggenomic features. Bioinformatics. 2010;26(6):841–2.
58. Holt C, Yandell M. MAKER2: an annotation pipeline and genome-databasemanagement tool for second-generation genome projects. BMCbioinformatics. 2011;12:491.
59. Boutet E, Lieberherr D, Tognolli M, Schneider M, Bairoch A. UniProtKB/Swiss-Prot.Methods Mol Biol. 2007;406:89–112.
60. Stanke M, Morgenstern B. AUGUSTUS: a web server for gene predictionin eukaryotes that allows user-defined constraints. Nucleic Acids Res.2005;33(Web Server issue):W465–467.
61. Korf I. Gene finding in novel genomes. BMC bioinformatics. 2004;5:59.

Ryu et al. BMC Genomics (2016) 17:158 Page 11 of 11
62. Altschul SF, Gish W, Miller W, Myers EW, Lipman DJ. Basic local alignmentsearch tool. J Mol Biol. 1990;215(3):403–10.
63. Smith JJ, Kuraku S, Holt C, Sauka-Spengler T, Jiang N, Campbell MS, YandellMD, Manousaki T, Meyer A, Bloom OE, et al. Sequencing of the sea lamprey(Petromyzon marinus) genome provides insights into vertebrate evolution.Nat Genet. 2013;45(4):415–21. 421e411-412.
64. Grabherr MG, Haas BJ, Yassour M, Levin JZ, Thompson DA, Amit I, Adiconis X,Fan L, Raychowdhury R, Zeng Q, et al. Full-length transcriptome assembly fromRNA-Seq data without a reference genome. Nat Biotechnol. 2011;29(7):644–52.
65. Fu L, Niu B, Zhu Z, Wu S, Li W. CD-HIT: accelerated for clustering the next-generation sequencing data. Bioinformatics. 2012;28(23):3150–2.
66. Jones P, Binns D, Chang HY, Fraser M, Li W, McAnulla C, McWilliam H,Maslen J, Mitchell A, Nuka G, et al. InterProScan 5: genome-scale proteinfunction classification. Bioinformatics. 2014;30(9):1236–40.
67. Fang H, Gough J. DcGO: database of domain-centric ontologies onfunctions, phenotypes, diseases and more. Nucleic Acids Res. 2013;41(Database issue):D536–544.
68. Enright AJ, Van Dongen S, Ouzounis CA. An efficient algorithm for large-scale detection of protein families. Nucleic Acids Res. 2002;30(7):1575–84.
69. Katoh K, Standley DM. MAFFT multiple sequence alignment softwareversion 7: improvements in performance and usability. Mol Biol Evol.2013;30(4):772–80.
70. Schmieder R, Lim YW, Edwards R. Identification and removal of ribosomalRNA sequences from metatranscriptomes. Bioinformatics. 2012;28(3):433–5.
71. Bolstad BM, Irizarry RA, Astrand M, Speed TP. A comparison of normalizationmethods for high density oligonucleotide array data based on variance andbias. Bioinformatics. 2003;19(2):185–93.
72. Feng J, Meyer CA, Wang Q, Liu JS, Shirley Liu X, Zhang Y. GFOLD: ageneralized fold change for ranking differentially expressed genes fromRNA-seq data. Bioinformatics. 2012;28(21):2782–8.
73. Finn RD, Mistry J, Tate J, Coggill P, Heger A, Pollington JE, Gavin OL,Gunasekaran P, Ceric G, Forslund K, et al. The Pfam protein familiesdatabase. Nucleic Acids Res. 2010;38(Database issue):D211–222.
74. Ashburner M, Ball CA, Blake JA, Botstein D, Butler H, Cherry JM, Davis AP,Dolinski K, Dwight SS, Eppig JT, et al. Gene ontology: tool for the unificationof biology. The Gene Ontology Consortium. Nat Genet. 2000;25(1):25–9.
• We accept pre-submission inquiries
• Our selector tool helps you to find the most relevant journal
• We provide round the clock customer support
• Convenient online submission
• Thorough peer review
• Inclusion in PubMed and all major indexing services
• Maximum visibility for your research
Submit your manuscript atwww.biomedcentral.com/submit
Submit your next manuscript to BioMed Central and we will help you at every step: