Embed Size (px)
Citation preview
Holly Drive Leadership Academy2018 Charter Renewal Achievement Analysis
October 22, 2018
Holly Drive’s Achievement Analysis
● Holly Drive’s Performance Summary
● Holly Drive’s Demographic Context
● Holly Drive’s 2015-2018 SBAC ME Growth Comparisons
● Holly Drive’s SBAC ME Growth
● Holly Drive’s District School ME Comparisons
● Strategies to Address Math and Suspension Challenges
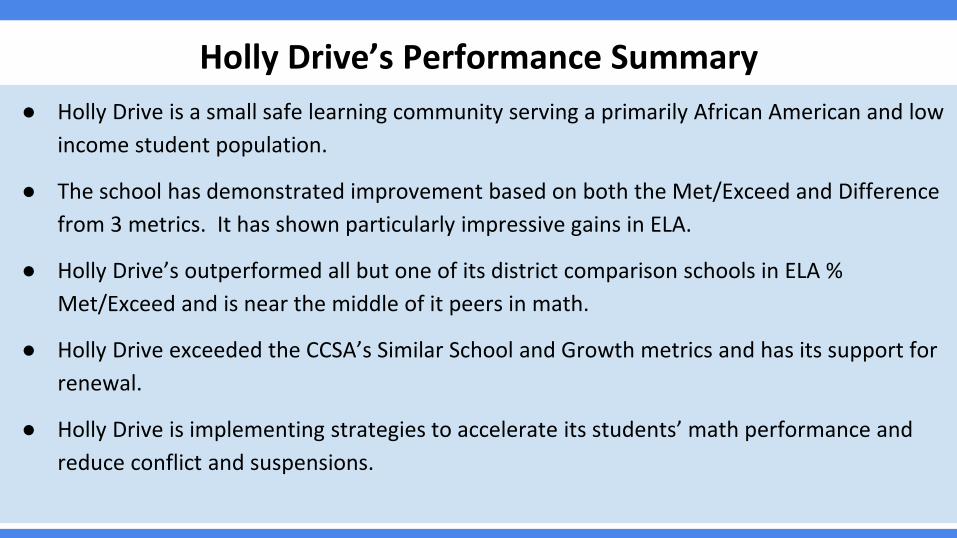
Holly Drive’s Performance Summary
● Holly Drive is a small safe learning community serving a primarily African American and low
income student population.
● The school has demonstrated improvement based on both the Met/Exceed and Difference
from 3 metrics. It has shown particularly impressive gains in ELA.
● Holly Drive’s outperformed all but one of its district comparison schools in ELA %
Met/Exceed and is near the middle of it peers in math.
● Holly Drive exceeded the CCSA’s Similar School and Growth metrics and has its support for
renewal.
● Holly Drive is implementing strategies to accelerate its students’ math performance and
reduce conflict and suspensions.
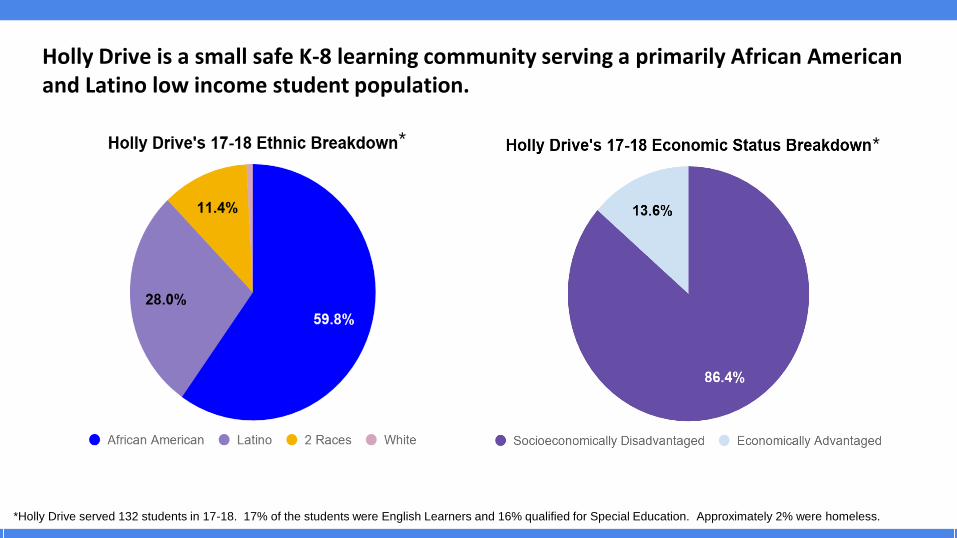
Holly Drive is a small safe K-8 learning community serving a primarily African American and Latino low income student population.
*Holly Drive served 132 students in 17-18. 17% of the students were English Learners and 16% qualified for Special Education. Approximately 2% were homeless.
**
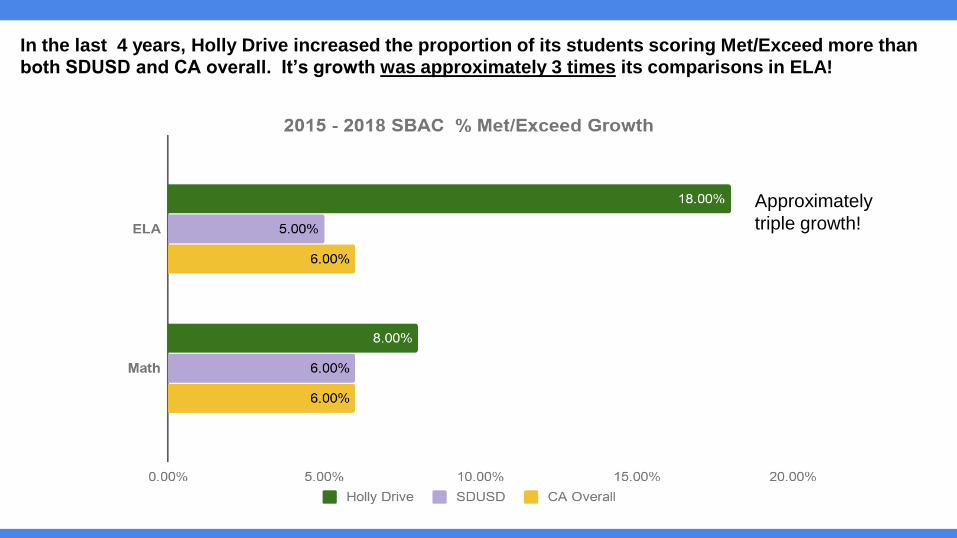
In the last 4 years, Holly Drive increased the proportion of its students scoring Met/Exceed more than both SDUSD and CA overall. It’s growth was approximately 3 times its comparisons in ELA!
Approximately
triple growth!
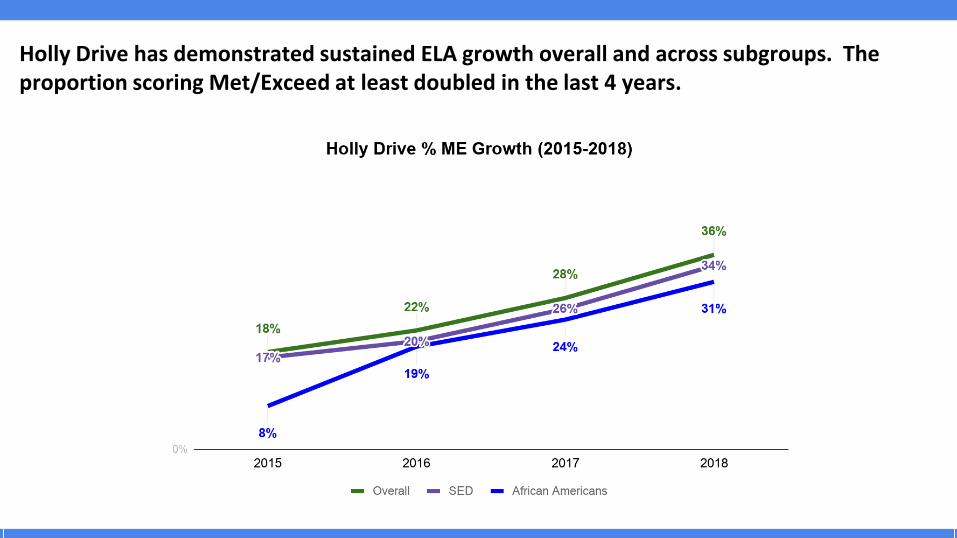
Holly Drive has demonstrated sustained ELA growth overall and across subgroups. The proportion scoring Met/Exceed at least doubled in the last 4 years.
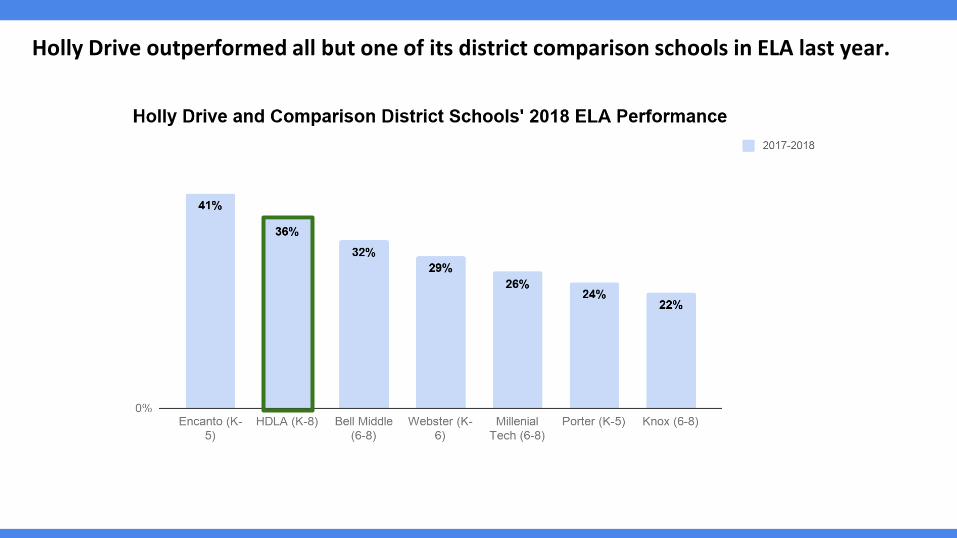
Holly Drive outperformed all but one of its district comparison schools in ELA last year.
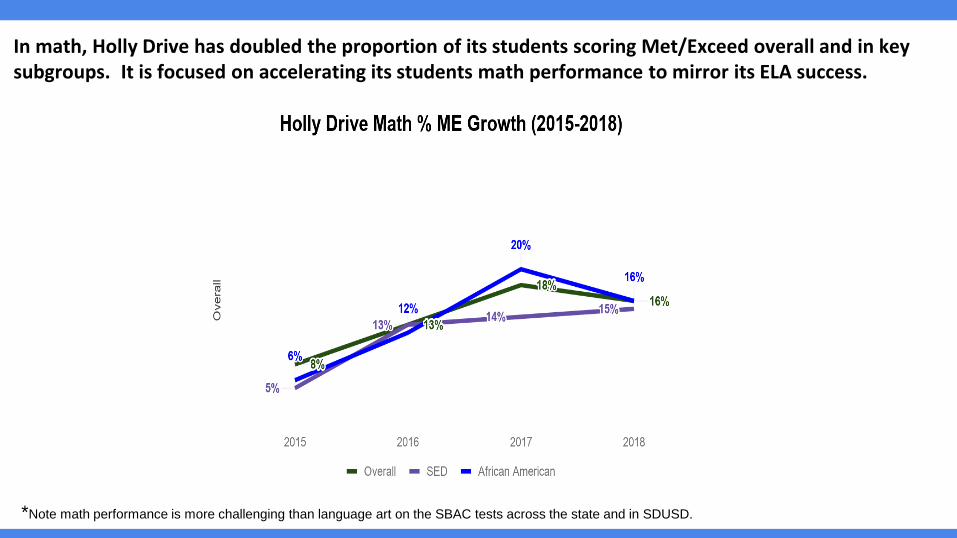
In math, Holly Drive has doubled the proportion of its students scoring Met/Exceed overall and in key subgroups. It is focused on accelerating its students math performance to mirror its ELA success.
*Note math performance is more challenging than language art on the SBAC tests across the state and in SDUSD.
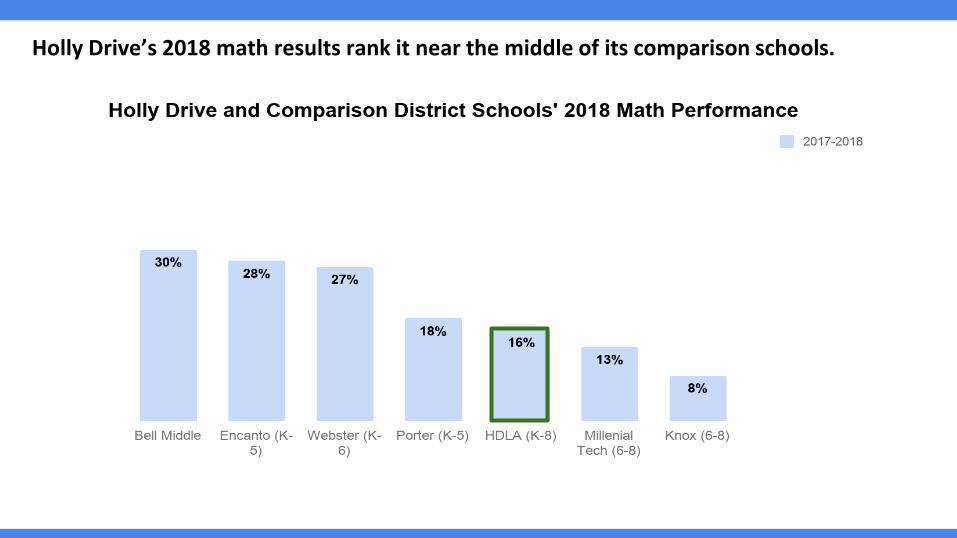
Holly Drive’s 2018 math results rank it near the middle of its comparison schools.
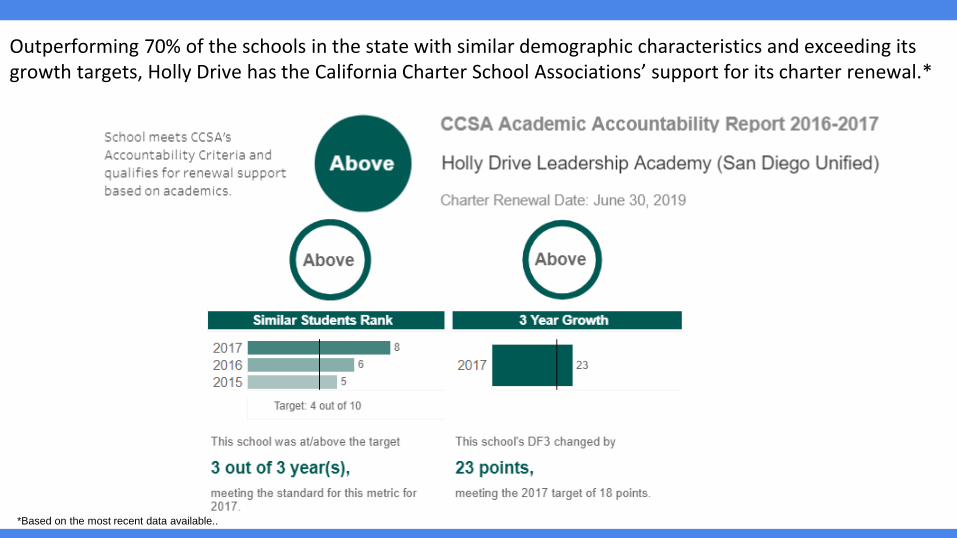
Outperforming 70% of the schools in the state with similar demographic characteristics and exceeding its growth targets, Holly Drive has the California Charter School Associations’ support for its charter renewal.*
*Based on the most recent data available..
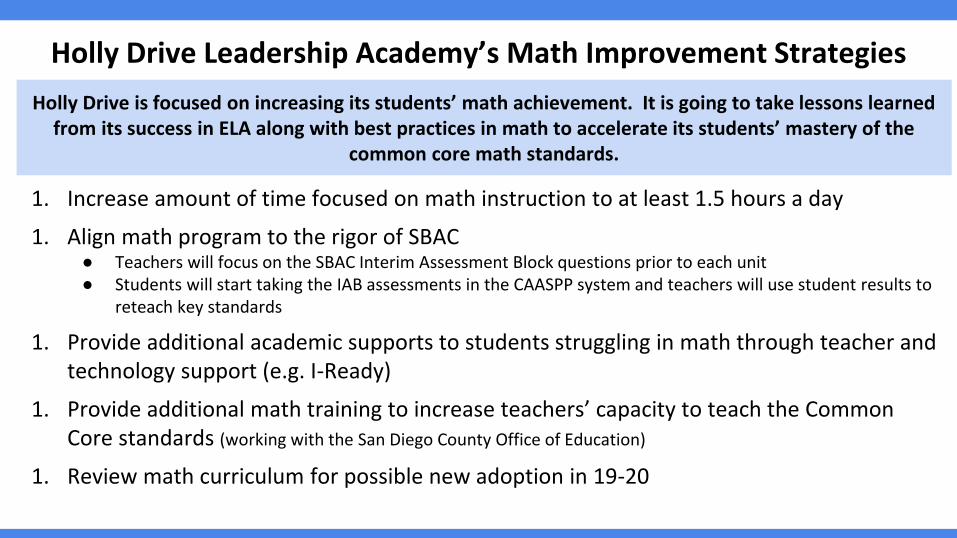
Holly Drive Leadership Academy’s Math Improvement Strategies
1. Increase amount of time focused on math instruction to at least 1.5 hours a day
1. Align math program to the rigor of SBAC● Teachers will focus on the SBAC Interim Assessment Block questions prior to each unit● Students will start taking the IAB assessments in the CAASPP system and teachers will use student results to
reteach key standards
1. Provide additional academic supports to students struggling in math through teacher and technology support (e.g. I-Ready)
1. Provide additional math training to increase teachers’ capacity to teach the Common Core standards (working with the San Diego County Office of Education)
1. Review math curriculum for possible new adoption in 19-20
Holly Drive is focused on increasing its students’ math achievement. It is going to take lessons learned from its success in ELA along with best practices in math to accelerate its students’ mastery of the
common core math standards.
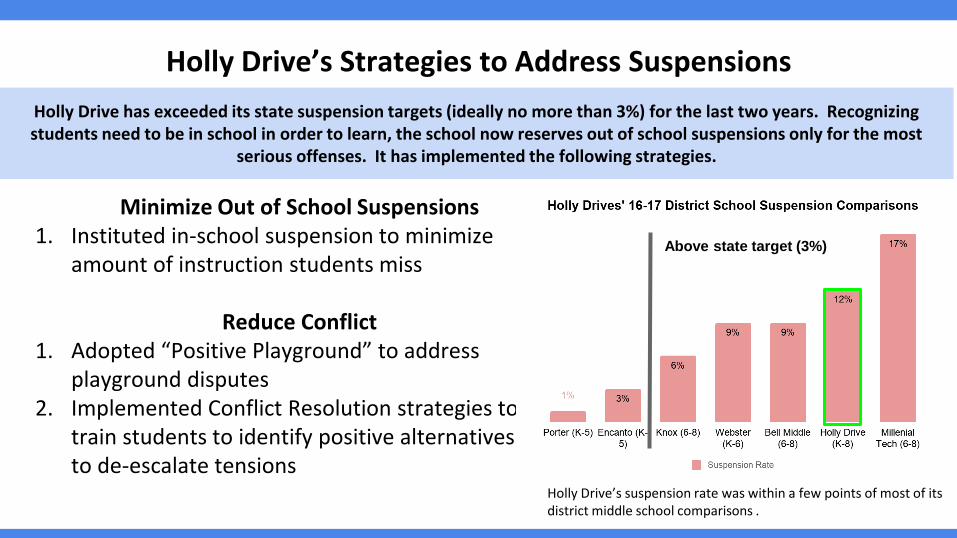
Holly Drive’s Strategies to Address Suspensions
Minimize Out of School Suspensions1. Instituted in-school suspension to minimize
amount of instruction students miss
Reduce Conflict1. Adopted “Positive Playground” to address
playground disputes2. Implemented Conflict Resolution strategies to
train students to identify positive alternatives to de-escalate tensions
Holly Drive has exceeded its state suspension targets (ideally no more than 3%) for the last two years. Recognizing students need to be in school in order to learn, the school now reserves out of school suspensions only for the most
serious offenses. It has implemented the following strategies.
Holly Drive’s suspension rate was within a few points of most of its district middle school comparisons .
Above state target (3%)
Appendix
● Difference from 3 Definition
● Difference from 3 2015 - 2018 growth
● Holly Drive State Accountability Performance
● Difference from 3 District Comparisons Overall and for SED
and African American Subgroups
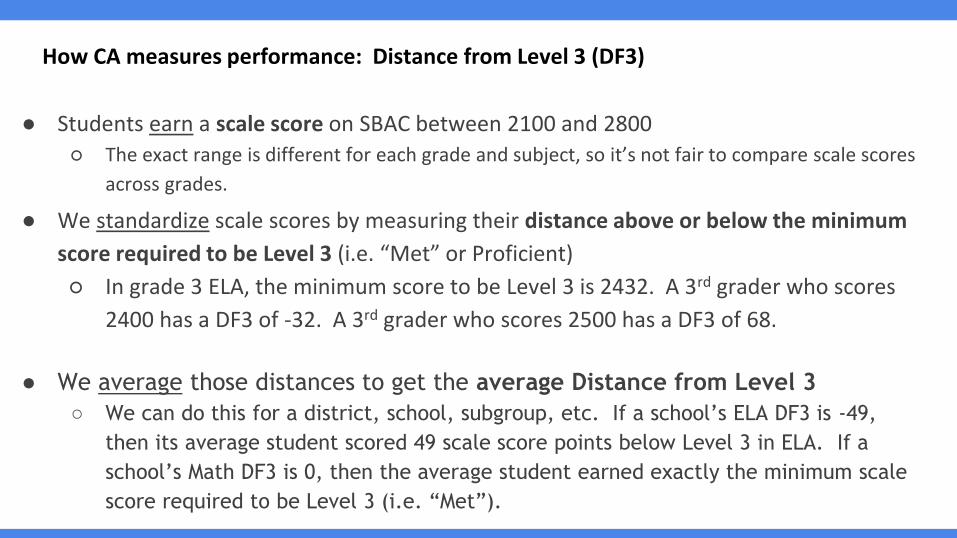
How CA measures performance: Distance from Level 3 (DF3)
● Students earn a scale score on SBAC between 2100 and 2800
○ The exact range is different for each grade and subject, so it’s not fair to compare scale scores
across grades.
● We standardize scale scores by measuring their distance above or below the minimum
score required to be Level 3 (i.e. “Met” or Proficient)
○ In grade 3 ELA, the minimum score to be Level 3 is 2432. A 3rd grader who scores
2400 has a DF3 of -32. A 3rd grader who scores 2500 has a DF3 of 68.
● We average those distances to get the average Distance from Level 3
○ We can do this for a district, school, subgroup, etc. If a school’s ELA DF3 is -49,
then its average student scored 49 scale score points below Level 3 in ELA. If a
school’s Math DF3 is 0, then the average student earned exactly the minimum scale
score required to be Level 3 (i.e. “Met”).
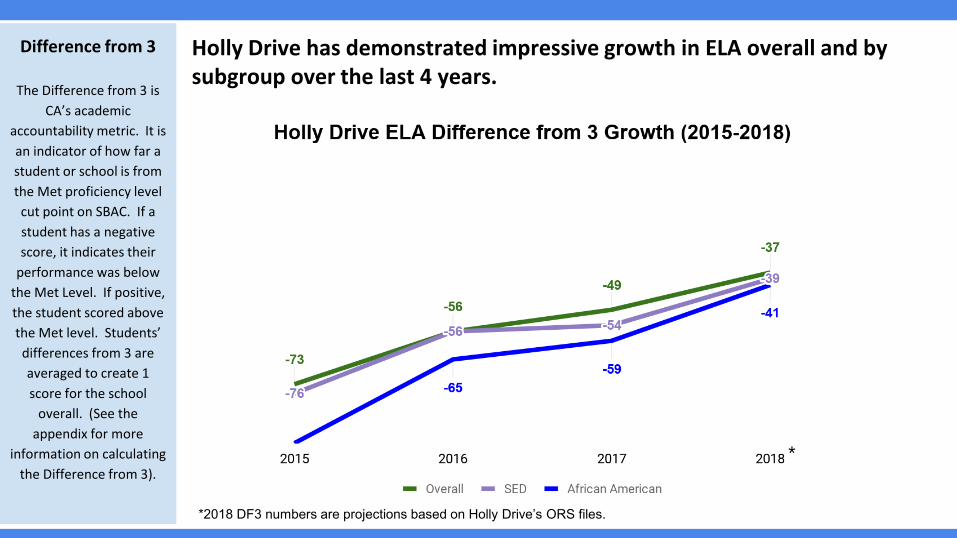
Holly Drive has demonstrated impressive growth in ELA overall and by subgroup over the last 4 years.
Difference from 3
The Difference from 3 is
CA’s academic
accountability metric. It is
an indicator of how far a
student or school is from
the Met proficiency level
cut point on SBAC. If a
student has a negative
score, it indicates their
performance was below
the Met Level. If positive,
the student scored above
the Met level. Students’
differences from 3 are
averaged to create 1
score for the school
overall. (See the
appendix for more
information on calculating
the Difference from 3).
*2018 DF3 numbers are projections based on Holly Drive’s ORS files.
*
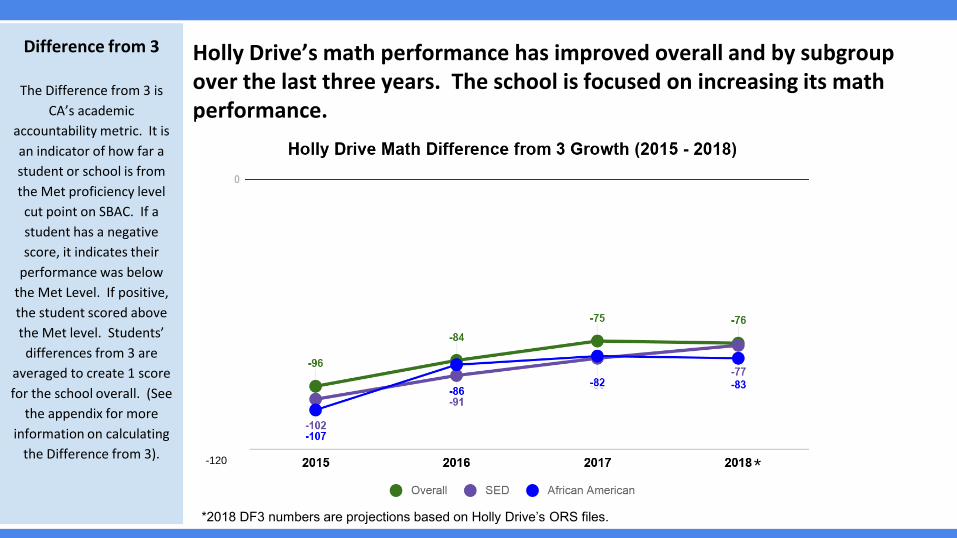
Holly Drive’s math performance has improved overall and by subgroup over the last three years. The school is focused on increasing its math performance.
Difference from 3
The Difference from 3 is
CA’s academic
accountability metric. It is
an indicator of how far a
student or school is from
the Met proficiency level
cut point on SBAC. If a
student has a negative
score, it indicates their
performance was below
the Met Level. If positive,
the student scored above
the Met level. Students’
differences from 3 are
averaged to create 1 score
for the school overall. (See
the appendix for more
information on calculating
the Difference from 3). -120
*2018 DF3 numbers are projections based on Holly Drive’s ORS files.
*
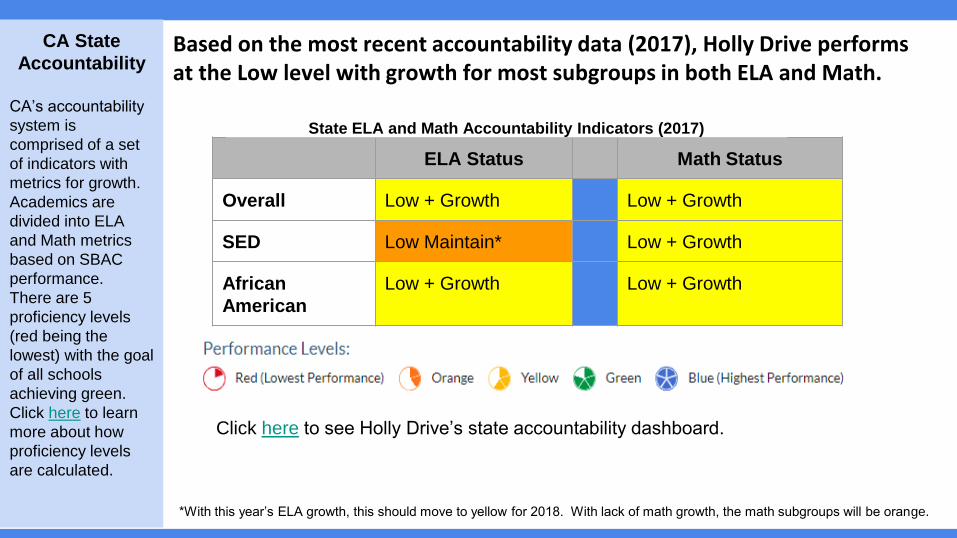
Based on the most recent accountability data (2017), Holly Drive performs at the Low level with growth for most subgroups in both ELA and Math.
ELA Status Math Status
Overall Low + Growth Low + Growth
SED Low Maintain* Low + Growth
African
American
Low + Growth Low + Growth
*With this year’s ELA growth, this should move to yellow for 2018. With lack of math growth, the math subgroups will be orange.
Click here to see Holly Drive’s state accountability dashboard.
CA State
Accountability
CA’s accountability
system is
comprised of a set
of indicators with
metrics for growth.
Academics are
divided into ELA
and Math metrics
based on SBAC
performance.
There are 5
proficiency levels
(red being the
lowest) with the goal
of all schools
achieving green.
Click here to learn
more about how
proficiency levels
are calculated.
State ELA and Math Accountability Indicators (2017)
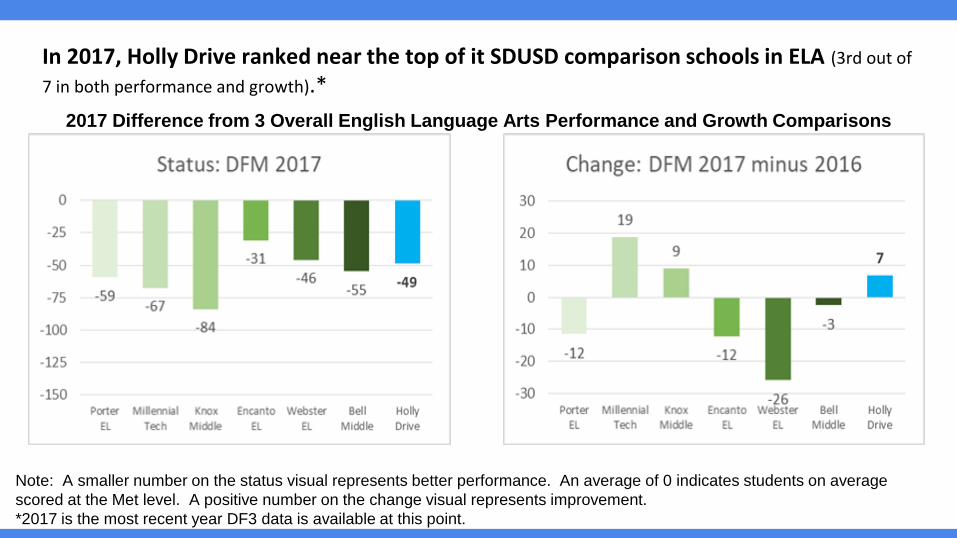
In 2017, Holly Drive ranked near the top of it SDUSD comparison schools in ELA (3rd out of
7 in both performance and growth).*
Note: A smaller number on the status visual represents better performance. An average of 0 indicates students on average
scored at the Met level. A positive number on the change visual represents improvement.
*2017 is the most recent year DF3 data is available at this point.
2017 Difference from 3 Overall English Language Arts Performance and Growth Comparisons
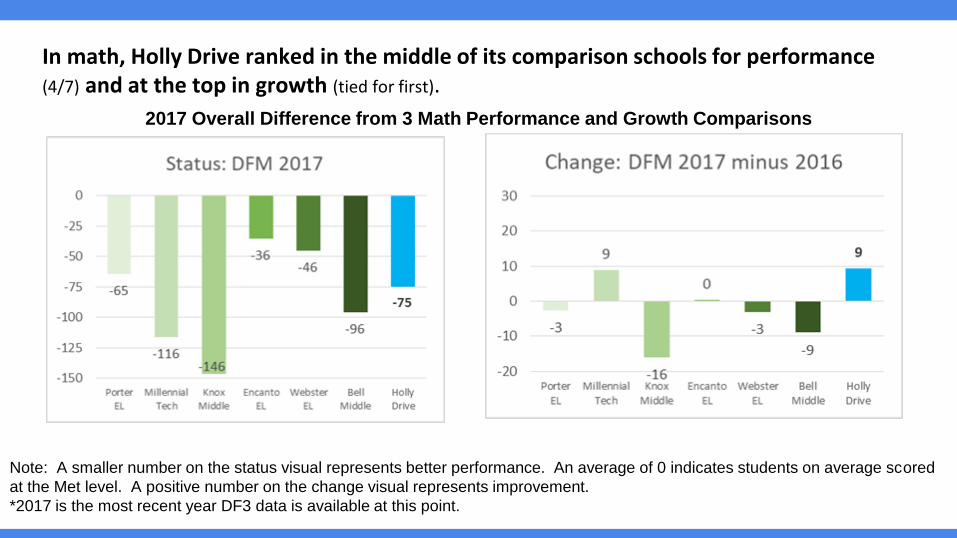
In math, Holly Drive ranked in the middle of its comparison schools for performance(4/7) and at the top in growth (tied for first).
Note: A smaller number on the status visual represents better performance. An average of 0 indicates students on average scored
at the Met level. A positive number on the change visual represents improvement.
*2017 is the most recent year DF3 data is available at this point.
2017 Overall Difference from 3 Math Performance and Growth Comparisons
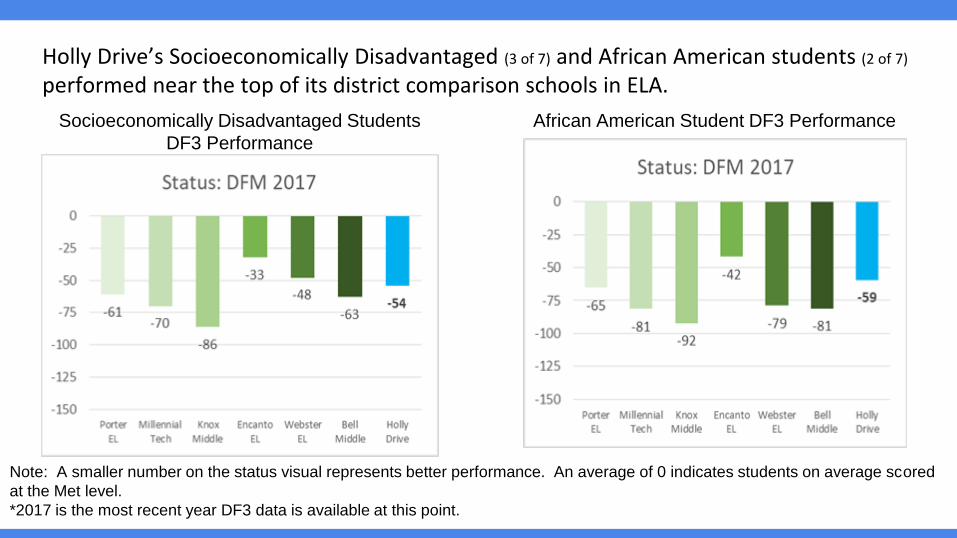
Holly Drive’s Socioeconomically Disadvantaged (3 of 7) and African American students (2 of 7)
performed near the top of its district comparison schools in ELA.
Socioeconomically Disadvantaged Students
DF3 Performance
African American Student DF3 Performance
Note: A smaller number on the status visual represents better performance. An average of 0 indicates students on average scored
at the Met level.
*2017 is the most recent year DF3 data is available at this point.
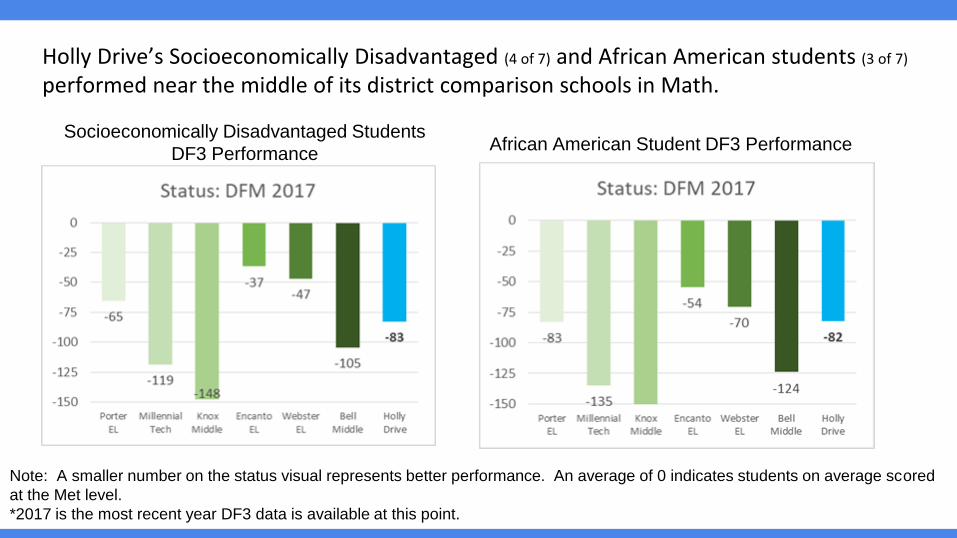
Holly Drive’s Socioeconomically Disadvantaged (4 of 7) and African American students (3 of 7)
performed near the middle of its district comparison schools in Math.
Socioeconomically Disadvantaged Students
DF3 PerformanceAfrican American Student DF3 Performance
Note: A smaller number on the status visual represents better performance. An average of 0 indicates students on average scored
at the Met level.
*2017 is the most recent year DF3 data is available at this point.