Embed Size (px)
Citation preview
672 OPTICS LETTERS / Vol. 33, No. 7 / April 1, 2008
Hollow-core waveguide characterization byoptically induced particle transport
Philip Measor,1,* Sergei Kühn,1 Evan J. Lunt,2 Brian S. Phillips,2 Aaron R. Hawkins,2 andHolger Schmidt1
1School of Engineering, University of California Santa Cruz, 1156 High Street, Santa Cruz, California 95064, USA2Department of Electrical and Computer Engineering, Brigham Young University, 459 Clyde Building,
Provo, Utah 84602, USA*Corresponding author: [email protected]
Received January 3, 2008; revised February 14, 2008; accepted February 15, 2008;posted February 22, 2008 (Doc. ID 91076); published March 26, 2008
We introduce a method for optical characterization of hollow-core optical waveguides. Radiation pressureexerted by the waveguide modes on dielectric microspheres is used to analyze salient properties such aspropagation loss and waveguide mode profiles. These quantities were measured for quasi-single-mode andmultimode propagation in on-chip liquid-filled hollow-core antiresonant reflecting optical waveguides. Ex-cellent agreement with analytical and numerical models is found, demonstrating that optically induced par-ticle transport provides a simple, inexpensive, and nondestructive alternative to other characterizationmethods. © 2008 Optical Society of America
OCIS codes: 130.3120, 230.7390, 350.4855.
Hollow-core waveguides have become increasinglyimportant in many applications [1–4]. Optofluidicwaveguides [5] are of particular interest as theypromise device miniaturization, optical componentintegration, and low fabrication costs. As for allwaveguides, the propagation loss and the mode pro-file play critically important roles in their operation.Many techniques have been used to characterize theloss or mode profile of a waveguide, and among thesethe cutback [6] and optical time-domain reflectom-etry methods [7] have been used to characterizehollow-core loss [8]. These methods are either de-structive or require sophisticated setups and rela-tively long sample lengths (greater than a few milli-meters) due to cleaving or detector bandwidth limits.Most optofluidic devices will rely on hollow–solidwaveguide interfaces to confine the sample liquidswhile providing optical access. In this case, direct ac-cess to the hollow-core mode is limited. Thus, ashollow-core waveguide devices continue to decreasein size and increase in component complexity, it be-comes necessary to characterize these devices withmore accurate and accessible means. Optically in-duced motion of particles in hollow-core waveguidesprovides a solution. Radiation pressure has beenused extensively for over three decades for trappingand manipulation of particles and atoms [9] with ap-plications such as optical tweezers [10] and opticaltransport of particles through hollow-corewaveguides [11,12]. In this work, we introduce andexperimentally demonstrate a simple, inexpensive,and nondestructive method for characterization ofliquid- and hollow-core waveguides, both stand-aloneand integrated within miniaturized device struc-tures. Optically induced motion of dielectric particlesis used to measure waveguide properties such aspropagation loss and mode profiles using integratedliquid-filled hollow-core antiresonant reflecting opti-cal waveguides (ARROWs).
The forces involved in optically induced particle
motion through a hollow-core waveguide are the scat-0146-9592/08/070672-3/$15.00 ©
tering Fs, drag FStokes, and gradient Fg forces. The op-tical forces arise from the photon momentum transferas the beam in the waveguide interacts with the par-ticles. The scattering force, in the direction of lightpropagation z, in a waveguide with loss coefficient�WG can be expressed as [9]
Fs�z� = Qn
cP0 exp�− �WGz�, �1�
with Q a dimensionless factor describing the effi-ciency of photon momentum transfer, medium refrac-tive index n, vacuum speed of light c, and initial in-cident power P0. Additional axial gradient andpressure-induced forces can be neglected for typicalexperimental conditions. For steady-state particlemotion in a liquid-core waveguide, the Stokes–Navierviscous drag force in the z direction must be balancedby the axial scattering force or,
FStokes�z� = − 6���rdz
dt= − Fs�z�, �2�
where r is the particle radius and �� is an average dy-namic viscosity that takes into account the increaseof the viscosity near the waveguide walls using Fax-en’s law [13]. The equation of motion in Eq. (2) can besolved with Eq. (1) for the particle trajectory to give
z�t� =1
�WGln�v0�WGt + exp��WGz0��, �3�
where v0=QP0n / �6���rc� and z0 are the initial par-ticle velocity and axial position, respectively, whenoptically induced transport begins. Thus, z�t� can beused to extract �WG and v0 by Eq. (3).
Another important parameter of waveguide opera-tion is the lateral intensity distribution I�x�, whichresults from the excitation and interference of differ-ent guided modes. The particle tends to move toward
intensity maxima owing to the gradient force Fg, pro-2008 Optical Society of America
April 1, 2008 / Vol. 33, No. 7 / OPTICS LETTERS 673
viding a mode profile probe. The potential associatedwith this force governs the motion of the diffusingparticle. Using Boltzmann statistics at thermal equi-librium, the probability density p�x� of the particle lo-cation, within potential U�x�, is related to the lateralgradient force by [14]
U�x� = − kT ln p�x� = −�
c�I�x� = −� Fg�x�dx, �4�
with Boltzmann constant k, absolute temperature T,permittivity �, effective particle polarizability �, andincident light intensity I. Therefore, the particle dis-tribution p�x� is explicitly related to the mode profileI�x� by Eq. (4).
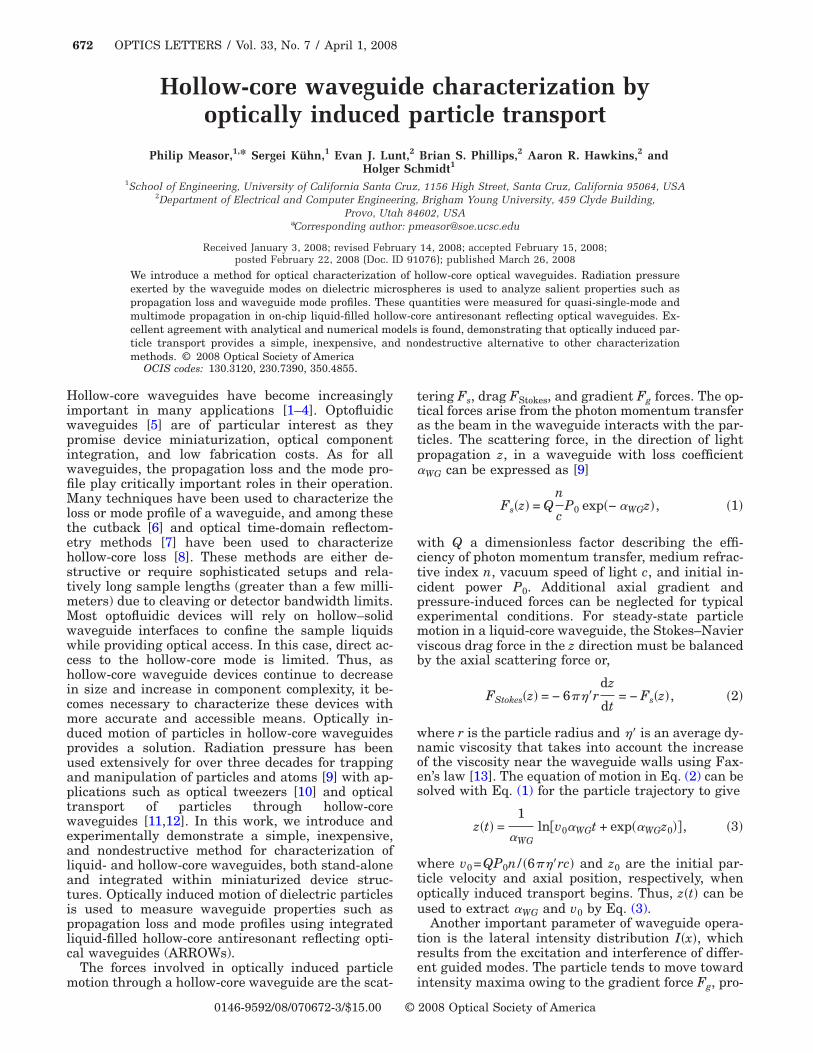
To demonstrate this characterization method, �WGand I�x� are determined for liquid-filled hollow-coreARROW waveguides. Hollow-core ARROWs consistof high-index dielectric layers, whose thicknesses arechosen to satisfy optical guidance [5] in an enclosedlow-index hollow core (Fig. 1 inset). Samples are con-structed using standard silicon microfabricationtechniques of plasma-enhanced chemical vapor depo-sition and a sacrificial core process [15]. Thewaveguides characterized here consisted of liquid-core ARROWs connected with solid-core ARROWs(Fig. 1) to form optofluidic devices for single particleanalysis [5]. Two types of liquid-core ARROWs weretested. Type S (quasi-single-mode) had liquid-core di-mensions of 5 �m high by 12 �m wide and solid-corewaveguide dimensions of 5 �m high by 22 �m wide—defined by a 5 �m high pedestal by adding a pre-etchfabrication step [15]. Type M (multimode) had thesame dimensions but with different solid-core ribwaveguide dimensions of 3 �m high by 6 �m wide—defined with 1 �m etch depths. Reservoirs of 10 �Lwere attached to the chip surface (Fig. 1) and filledwith a solution of ultrapure water �n=1.33�, Triton X[16], and 1 �m diameter polystyrene spheres (n=1.59 index, Duke Scientific) with a concentration of0.4 particles/nL, corresponding to less than one par-ticle in the waveguide volume. Frequency doubledNd:YAG laser light �532 nm� was coupled into asingle-mode fiber and aligned to the input solid coreof the ARROW device. Particle motion was observedthrough a microscope setup from above (0.45 NA50� objective) with a 540 nm long-pass filter and im-
Fig. 1. (Color online) Hollow-core waveguide device and
ARROW cross section along dotted line (inset).aged onto a charge-coupled device camera. Images ofthe particle trajectory were recorded with a temporalresolution of 50 ms and a localization accuracy of lessthan 200 nm. The images were calibrated, and theparticle trajectory was determined through a particlefinding algorithm. The entire coupling setup wasmounted on a translation stage and moved in the im-age plane for particle tracking. Prior to laser light ir-radiation, a single particle was introduced into theoptical volume of the waveguide using pressure in-duced flow. The pressure was then balanced untilthere was negligible drift. After particle passage, thewaveguide was inspected to ensure only one particlewas involved.
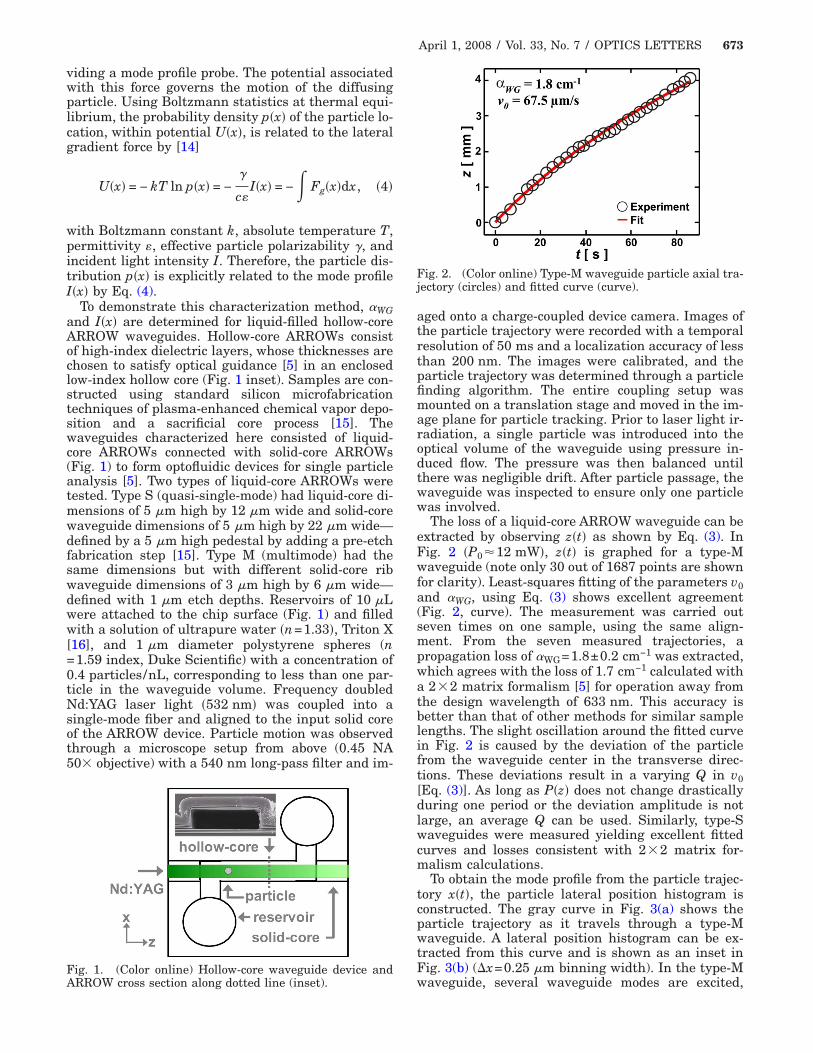
The loss of a liquid-core ARROW waveguide can beextracted by observing z�t� as shown by Eq. (3). InFig. 2 �P0�12 mW�, z�t� is graphed for a type-Mwaveguide (note only 30 out of 1687 points are shownfor clarity). Least-squares fitting of the parameters v0and �WG, using Eq. (3) shows excellent agreement(Fig. 2, curve). The measurement was carried outseven times on one sample, using the same align-ment. From the seven measured trajectories, apropagation loss of �WG=1.8±0.2 cm−1 was extracted,which agrees with the loss of 1.7 cm−1 calculated witha 2�2 matrix formalism [5] for operation away fromthe design wavelength of 633 nm. This accuracy isbetter than that of other methods for similar samplelengths. The slight oscillation around the fitted curvein Fig. 2 is caused by the deviation of the particlefrom the waveguide center in the transverse direc-tions. These deviations result in a varying Q in v0[Eq. (3)]. As long as P�z� does not change drasticallyduring one period or the deviation amplitude is notlarge, an average Q can be used. Similarly, type-Swaveguides were measured yielding excellent fittedcurves and losses consistent with 2�2 matrix for-malism calculations.
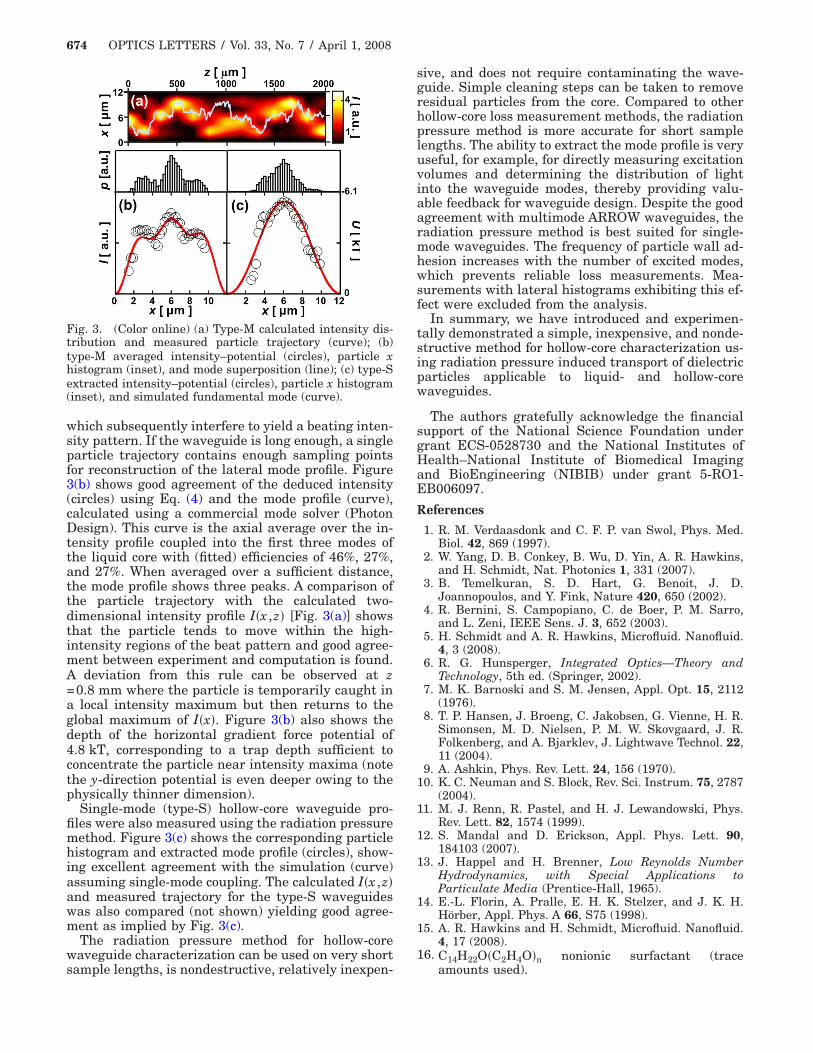
To obtain the mode profile from the particle trajec-tory x�t�, the particle lateral position histogram isconstructed. The gray curve in Fig. 3(a) shows theparticle trajectory as it travels through a type-Mwaveguide. A lateral position histogram can be ex-tracted from this curve and is shown as an inset inFig. 3(b) (�x=0.25 �m binning width). In the type-M
Fig. 2. (Color online) Type-M waveguide particle axial tra-jectory (circles) and fitted curve (curve).
waveguide, several waveguide modes are excited,
674 OPTICS LETTERS / Vol. 33, No. 7 / April 1, 2008
which subsequently interfere to yield a beating inten-sity pattern. If the waveguide is long enough, a singleparticle trajectory contains enough sampling pointsfor reconstruction of the lateral mode profile. Figure3(b) shows good agreement of the deduced intensity(circles) using Eq. (4) and the mode profile (curve),calculated using a commercial mode solver (PhotonDesign). This curve is the axial average over the in-tensity profile coupled into the first three modes ofthe liquid core with (fitted) efficiencies of 46%, 27%,and 27%. When averaged over a sufficient distance,the mode profile shows three peaks. A comparison ofthe particle trajectory with the calculated two-dimensional intensity profile I�x ,z� [Fig. 3(a)] showsthat the particle tends to move within the high-intensity regions of the beat pattern and good agree-ment between experiment and computation is found.A deviation from this rule can be observed at z=0.8 mm where the particle is temporarily caught ina local intensity maximum but then returns to theglobal maximum of I�x�. Figure 3(b) also shows thedepth of the horizontal gradient force potential of4.8 kT, corresponding to a trap depth sufficient toconcentrate the particle near intensity maxima (notethe y-direction potential is even deeper owing to thephysically thinner dimension).
Single-mode (type-S) hollow-core waveguide pro-files were also measured using the radiation pressuremethod. Figure 3(c) shows the corresponding particlehistogram and extracted mode profile (circles), show-ing excellent agreement with the simulation (curve)assuming single-mode coupling. The calculated I�x ,z�and measured trajectory for the type-S waveguideswas also compared (not shown) yielding good agree-ment as implied by Fig. 3(c).
The radiation pressure method for hollow-corewaveguide characterization can be used on very short
Fig. 3. (Color online) (a) Type-M calculated intensity dis-tribution and measured particle trajectory (curve); (b)type-M averaged intensity–potential (circles), particle xhistogram (inset), and mode superposition (line); (c) type-Sextracted intensity–potential (circles), particle x histogram(inset), and simulated fundamental mode (curve).
sample lengths, is nondestructive, relatively inexpen-
sive, and does not require contaminating the wave-guide. Simple cleaning steps can be taken to removeresidual particles from the core. Compared to otherhollow-core loss measurement methods, the radiationpressure method is more accurate for short samplelengths. The ability to extract the mode profile is veryuseful, for example, for directly measuring excitationvolumes and determining the distribution of lightinto the waveguide modes, thereby providing valu-able feedback for waveguide design. Despite the goodagreement with multimode ARROW waveguides, theradiation pressure method is best suited for single-mode waveguides. The frequency of particle wall ad-hesion increases with the number of excited modes,which prevents reliable loss measurements. Mea-surements with lateral histograms exhibiting this ef-fect were excluded from the analysis.
In summary, we have introduced and experimen-tally demonstrated a simple, inexpensive, and nonde-structive method for hollow-core characterization us-ing radiation pressure induced transport of dielectricparticles applicable to liquid- and hollow-corewaveguides.
The authors gratefully acknowledge the financialsupport of the National Science Foundation undergrant ECS-0528730 and the National Institutes ofHealth–National Institute of Biomedical Imagingand BioEngineering (NIBIB) under grant 5-RO1-EB006097.
References
1. R. M. Verdaasdonk and C. F. P. van Swol, Phys. Med.Biol. 42, 869 (1997).
2. W. Yang, D. B. Conkey, B. Wu, D. Yin, A. R. Hawkins,and H. Schmidt, Nat. Photonics 1, 331 (2007).
3. B. Temelkuran, S. D. Hart, G. Benoit, J. D.Joannopoulos, and Y. Fink, Nature 420, 650 (2002).
4. R. Bernini, S. Campopiano, C. de Boer, P. M. Sarro,and L. Zeni, IEEE Sens. J. 3, 652 (2003).
5. H. Schmidt and A. R. Hawkins, Microfluid. Nanofluid.4, 3 (2008).
6. R. G. Hunsperger, Integrated Optics—Theory andTechnology, 5th ed. (Springer, 2002).
7. M. K. Barnoski and S. M. Jensen, Appl. Opt. 15, 2112(1976).
8. T. P. Hansen, J. Broeng, C. Jakobsen, G. Vienne, H. R.Simonsen, M. D. Nielsen, P. M. W. Skovgaard, J. R.Folkenberg, and A. Bjarklev, J. Lightwave Technol. 22,11 (2004).
9. A. Ashkin, Phys. Rev. Lett. 24, 156 (1970).10. K. C. Neuman and S. Block, Rev. Sci. Instrum. 75, 2787
(2004).11. M. J. Renn, R. Pastel, and H. J. Lewandowski, Phys.
Rev. Lett. 82, 1574 (1999).12. S. Mandal and D. Erickson, Appl. Phys. Lett. 90,
184103 (2007).13. J. Happel and H. Brenner, Low Reynolds Number
Hydrodynamics, with Special Applications toParticulate Media (Prentice-Hall, 1965).
14. E.-L. Florin, A. Pralle, E. H. K. Stelzer, and J. K. H.Hörber, Appl. Phys. A 66, S75 (1998).
15. A. R. Hawkins and H. Schmidt, Microfluid. Nanofluid.4, 17 (2008).
16. C14H22O�C2H4O�n nonionic surfactant (trace
amounts used).