Embed Size (px)
Citation preview

United States Department of Agriculture National Agricultural Statistics Service Statistical Bulletin Number 1020
Hogs and Pigs Final Estimates 2003-2007 March 2009


Hogs and Pigs Final Estimates 2003-2007 Agricultural Statistics Board March 2009 1 NASS, USDA
Contents Page Summary ................................................................................................................................................2 Quarterly U.S. Inventory by Class and Weight Group, 2003-2007 .......................................................3 Quarterly U.S. Sows Farrowed, Pig Crop, and Pigs per Litter, 2003-2007 ...........................................4 Hogs and Pigs: Inventory by State and U.S., 2003-2007 December 1................................................................................................................................5 March 1....................................................................................................................................12 June 1 .......................................................................................................................................16 September 1 .............................................................................................................................20 Farrowings: Number of Sows, Pigs per Litter, Pig Crop by State and U.S., 2003-2007 December-February .................................................................................................................24 March-May ..............................................................................................................................26 June-August .............................................................................................................................28 September-November ..............................................................................................................30 Annual Farrowings by State and U.S., 2003-2007...............................................................................32 Information Contacts............................................................................................................................35 Statistical Bulletin Publication Schedule and other ASB Services ......................................................36
Hogs and Pigs Final Estimates 2003-2007 Agricultural Statistics Board March 2009 2 NASS, USDA
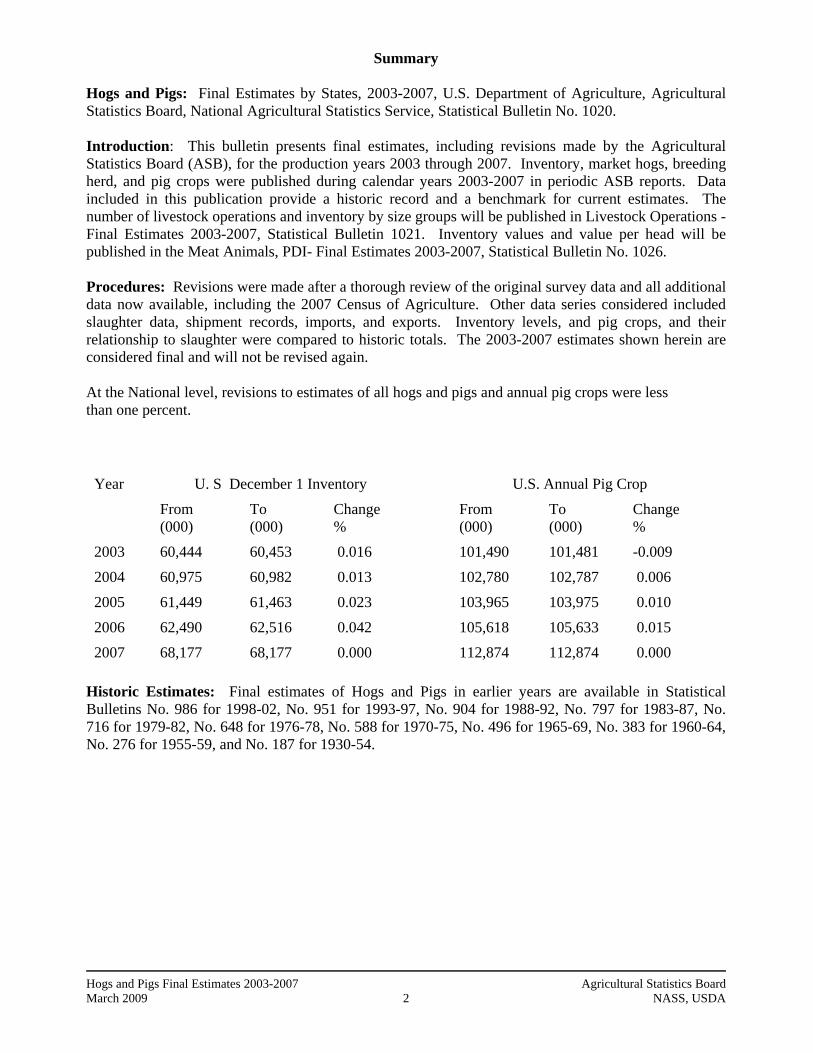
Summary Hogs and Pigs: Final Estimates by States, 2003-2007, U.S. Department of Agriculture, Agricultural Statistics Board, National Agricultural Statistics Service, Statistical Bulletin No. 1020. Introduction: This bulletin presents final estimates, including revisions made by the Agricultural Statistics Board (ASB), for the production years 2003 through 2007. Inventory, market hogs, breeding herd, and pig crops were published during calendar years 2003-2007 in periodic ASB reports. Data included in this publication provide a historic record and a benchmark for current estimates. The number of livestock operations and inventory by size groups will be published in Livestock Operations - Final Estimates 2003-2007, Statistical Bulletin 1021. Inventory values and value per head will be published in the Meat Animals, PDI- Final Estimates 2003-2007, Statistical Bulletin No. 1026. Procedures: Revisions were made after a thorough review of the original survey data and all additional data now available, including the 2007 Census of Agriculture. Other data series considered included slaughter data, shipment records, imports, and exports. Inventory levels, and pig crops, and their relationship to slaughter were compared to historic totals. The 2003-2007 estimates shown herein are considered final and will not be revised again. At the National level, revisions to estimates of all hogs and pigs and annual pig crops were less than one percent.
U. S December 1 Inventory U.S. Annual Pig Crop Year From
(000) To (000)
Change %
From (000)
To (000)
Change %
2003 60,444 60,453 0.016 101,490 101,481 -0.009
2004 60,975 60,982 0.013 102,780 102,787 0.006
2005 61,449 61,463 0.023 103,965 103,975 0.010
2006 62,490 62,516 0.042 105,618 105,633 0.015
2007 68,177 68,177 0.000 112,874 112,874 0.000 Historic Estimates: Final estimates of Hogs and Pigs in earlier years are available in Statistical Bulletins No. 986 for 1998-02, No. 951 for 1993-97, No. 904 for 1988-92, No. 797 for 1983-87, No. 716 for 1979-82, No. 648 for 1976-78, No. 588 for 1970-75, No. 496 for 1965-69, No. 383 for 1960-64, No. 276 for 1955-59, and No. 187 for 1930-54.

Hogs and Pigs Final Estimates 2003-2007 Agricultural Statistics Board March 2009 3 NASS, USDA
Hogs and Pigs: Inventory Number by Class, Weight Group, and Quarter, United States, 2003-2007 1
Item 2003 2004 2005 2006 2007
1,000 Head 1,000 Head 1,000 Head 1,000 Head 1,000 Head
March 1 Inventory All Hogs and Pigs Kept for Breeding Market Market Hogs and Pigs by Weight Groups Under 60 Pounds 60-119 Pounds 120-179 Pounds 180 Pounds and Over June 1 Inventory All Hogs and Pigs Kept for Breeding Market Market Hogs and Pigs by Weight Groups Under 60 Pounds 60-119 Pounds 120-179 Pounds 180 Pounds and Over September 1 Inventory All Hogs and Pigs Kept for Breeding Market Market Hogs and Pigs by Weight Groups Under 60 Pounds 60-119 Pounds 120-179 Pounds 180 Pounds and Over December 1 Inventory All Hogs and Pigs Kept for Breeding Market Market Hogs and Pigs by Weight Groups Under 60 Pounds 60-119 Pounds 120-179 Pounds 180 Pounds and Over
58,193
6,037 52,156
19,086 12,639 10,915
9,516
59,609 6,036
53,573
20,432 12,952 10,827
9,362
61,019 5,948
55,071
20,438 13,739 11,384
9,510
60,453 6,019
54,434
19,778 13,238 11,108 10,311
59,529 5,971
53,558
19,823 12,954 11,204 9,578
60,707 5,947
54,760
20,292 13,500 11,255 9,714
61,525 5,972
55,553
20,727 13,612 11,234 9,981
60,982 5,980
55,002
19,979 13,438 11,185 10,401
59,711 5,952
53,759
19,669 13,087 11,360 9,644
60,744 5,988
54,756
20,425 13,376 11,143 9,813
61,858 5,993
55,865
20,760 13,874 11,403 9,829
61,463 6,031
55,432
20,053 13,523 11,291 10,566
60,340
6,045 54,295
19,986 13,005 11,432 9,873
61,701 6,080
55,621
20,806 13,691 11,483 9,642
62,928 6,099
56,829
20,706 14,230 11,683 10,211
62,516 6,116
56,399
20,460 13,927 11,274 10,738
61,896 6,149
55,746
20,379 13,355 11,678 10,334
63,947 6,169
57,777
21,748 14,320 11,789 9,920
67,275 6,208
61,066
22,648 15,261 12,530 10,627
68,177 6,233
61,944
22,545 15,173 12,658 11,569
1 May not add due to rounding.

Hogs and Pigs Final Estimates 2003-2007 Agricultural Statistics Board March 2009 4 NASS, USDA
Farrowings: Number of Sows, Pig Crop, and Pigs per Litter, United States, 2003-2007 1
Item 2003 2004 2005 2006 2007
1,000 Head 1,000 Head 1,000 Head 1,000 Head 1,000 Head
Sows Farrowing Dec-Feb 2 Mar-May Dec-May 2 Jun-Aug Sep-Nov Jun-Nov Pig Crop Dec-Feb 2 Mar-May Dec-May 2 Jun-Aug Sep-Nov Jun-Nov
2,768 2,885 5,654
2,917 2,854 5,771
24,393 25,630 50,024
25,974 25,484 51,458
2,836 2,870 5,706
2,905 2,887 5,791
25,109 25,639 50,747
26,165 25,874 52,039
2,834 2,881 5,715
2,917 2,900 5,817
25,348 25,991 51,340
26,446 26,190 52,636
2,840 2,929 5,769
2,912 2,949 5,861
25,660 26,599 52,259
26,519 26,855 53,374
2,905 3,030 5,935
3,133 3,180 6,312
26,395 27,870 54,266
29,095 29,513 58,608
Number Number Number Number Number
Pigs per Litter Dec-Feb 2 Mar-May Dec-May 2 Jun-Aug Sep-Nov Jun-Nov
8.81 8.88 8.85
8.90 8.93 8.92
8.85 8.93 8.89
9.01 8.96 8.99
8.94 9.02 8.98
9.06 9.03 9.05
9.03 9.08 9.06
9.11 9.11 9.11
9.09 9.20 9.14
9.29 9.28 9.28
1 May not add due to rounding. 2 December preceding year.
Hogs and Pigs Final Estimates 2003-2007 Agricultural Statistics Board March 2009 5 NASS, USDA
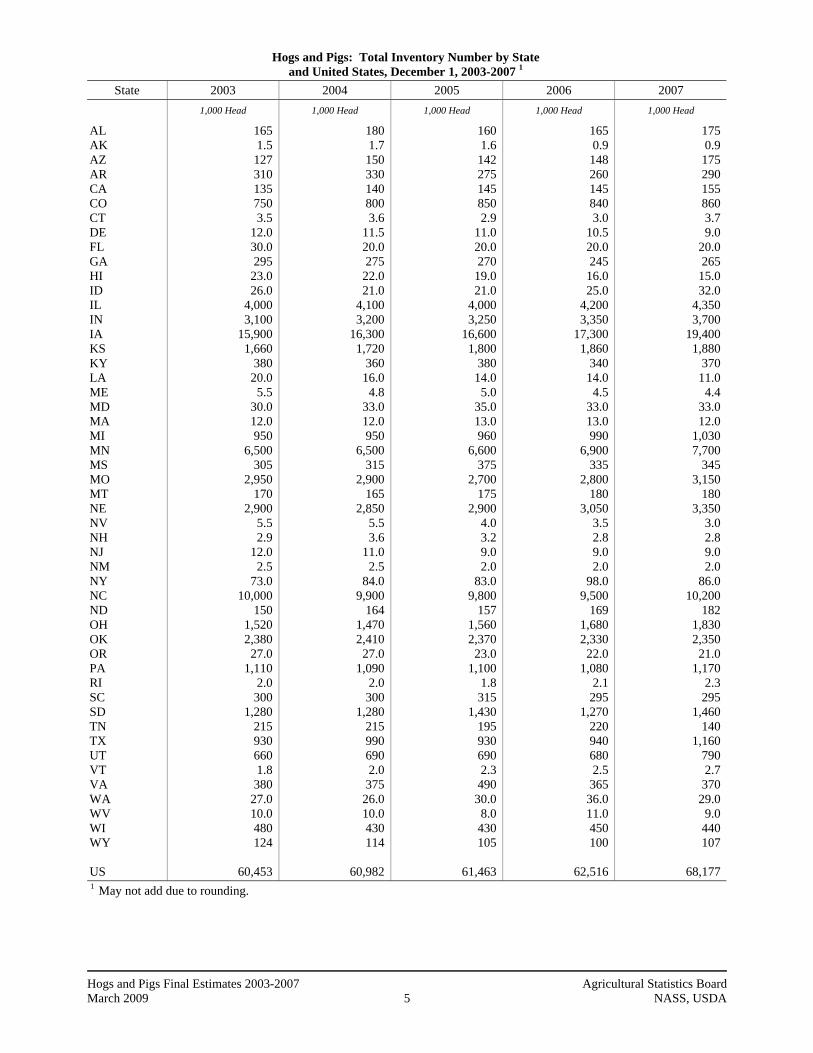
Hogs and Pigs: Total Inventory Number by State and United States, December 1, 2003-2007 1
State 2003 2004 2005 2006 2007
1,000 Head 1,000 Head 1,000 Head 1,000 Head 1,000 Head
AL AK AZ AR CA CO CT DE FL GA HI ID IL IN IA KS KY LA ME MD MA MI MN MS MO MT NE NV NH NJ NM NY NC ND OH OK OR PA RI SC SD TN TX UT VT VA WA WV WI WY US
165 1.5 127 310 135 750 3.5
12.0 30.0 295
23.0 26.0
4,000 3,100
15,900 1,660
380 20.0
5.5 30.0 12.0 950
6,500 305
2,950 170
2,900 5.5 2.9
12.0 2.5
73.0 10,000
150 1,520 2,380
27.0 1,110
2.0 300
1,280 215 930 660 1.8 380
27.0 10.0 480 124
60,453
180 1.7 150 330 140 800 3.6
11.5 20.0 275
22.0 21.0
4,100 3,200
16,300 1,720
360 16.0 4.8
33.0 12.0 950
6,500 315
2,900 165
2,850 5.5 3.6
11.0 2.5
84.0 9,900
164 1,470 2,410 27.0
1,090 2.0 300
1,280 215 990 690 2.0 375
26.0 10.0 430 114
60,982
160 1.6 142 275 145 850 2.9
11.0 20.0 270
19.0 21.0
4,000 3,250
16,600 1,800
380 14.0 5.0
35.0 13.0 960
6,600 375
2,700 175
2,900 4.0 3.2 9.0 2.0
83.0 9,800
157 1,560 2,370 23.0
1,100 1.8 315
1,430 195 930 690 2.3 490
30.0 8.0 430 105
61,463
165 0.9 148 260 145 840 3.0
10.5 20.0 245
16.0 25.0
4,200 3,350
17,300 1,860
340 14.0 4.5
33.0 13.0 990
6,900 335
2,800 180
3,050 3.5 2.8 9.0 2.0
98.0 9,500
169 1,680 2,330 22.0
1,080 2.1 295
1,270 220 940 680 2.5 365
36.0 11.0 450 100
62,516
175 0.9 175 290 155 860 3.7 9.0
20.0 265
15.0 32.0
4,350 3,700
19,400 1,880
370 11.0 4.4
33.0 12.0
1,030 7,700
345 3,150
180 3,350
3.0 2.8 9.0 2.0
86.0 10,200
182 1,830 2,350 21.0
1,170 2.3 295
1,460 140
1,160 790 2.7 370
29.0 9.0 440 107
68,177
1 May not add due to rounding.

Hogs and Pigs Final Estimates 2003-2007 Agricultural Statistics Board March 2009 6 NASS, USDA
Hogs and Pigs: Breeding Inventory Number by State and United States, December 1, 2003-2007 1
State 2003 2004 2005 2006 2007
1,000 Head 1,000 Head 1,000 Head 1,000 Head 1,000 Head
AL AK AZ AR CA CO CT DE FL GA HI ID IL IN IA KS KY LA ME MD MA MI MN MS MO MT NE NV NH NJ NM NY NC ND OH OK OR PA RI SC SD TN TX UT VT VA WA WV WI WY US
15 0.4 16 85 20
135 0.7 3.0 5.0 48
5.0 4.0 410 300
1,050 170
40 3.0 1.3 5.0 1.8 105 600
28 340
18 365 1.0 0.8 1.0 0.4 9.0
1,020 30
160 390 6.0 120 0.5 30
140 25
105 91
0.4 35
4.0 2.0 55 19
6,019
18 0.3 16 85 20
140 0.9 3.0 4.0 42
5.2 3.0 420 280
1,060 165 40
2.0 1.3 5.0 1.5 105 590 35
340 17
355 1.0 0.9 1.0 0.3
12.0 1,020
29 155 400 5.0 110 0.5 30
140 23
100 92
0.4 30
4.0 2.0 50 20
5,980
17 0.3 15 85 20
145 0.7 3.5 4.0 43
5.0 4.0 430 300
1,060 170 40
2.0 1.2 5.0 2.0 100 580 39
345 18
350 0.5 0.5 1.0 0.2
10.0 1,010
31 165 400 4.0 100 0.5 30
165 20
100 92
0.4 35
5.0 2.0 55 19
6,031
19 0.3 16 85 20
155 0.7 2.5 4.0 38
4.1 5.0 470 320
1,060 180 35
2.0 1.1 6.0 1.5 110 580 35
360 18
365 0.4 0.5 1.0 0.2
12.0 1,010
33 165 390 4.0 105 0.6 30
140 22 90
103 0.5 30
4.0 2.0 55 25
6,116
18 0.3 17 85 20
160 0.9 2.5 5.0 40
3.6 6.0 480 320
1,080 180 40
1.5 0.9 5.0 1.5 100 600 35
375 18
365 0.4 0.6 1.0 0.2
11.0 1,020
37 160 400 4.0 105 0.6 29
165 18
105 100 0.6 30
4.0 2.0 50 29
6,233
1 May not add due to rounding.

Hogs and Pigs Final Estimates 2003-2007 Agricultural Statistics Board March 2009 7 NASS, USDA
Hogs and Pigs: Market Inventory Number by State and United States, December 1, 2003-2007 1
State 2003 2004 2005 2006 2007
1,000 Head 1,000 Head 1,000 Head 1,000 Head 1,000 Head
AL AK AZ AR CA CO CT DE FL GA HI ID IL IN IA KS KY LA ME MD MA MI MN MS MO MT NE NV NH NJ NM NY NC ND OH OK OR PA RI SC SD TN TX UT VT VA WA WV WI WY US
150 1.1 111 225 115 615 2.8 9.0
25.0 247
18.0 22.0
3,590 2,800
14,850 1,490
340 17.0
4.2 25.0 10.2 845
5,900 277
2,610 152
2,535 4.5 2.1
11.0 2.1
64.0 8,980
120 1,360 1,990
21.0 990 1.5 270
1,140 190 825 569 1.4 345
23.0 8.0 425 105
54,434
162 1.4 134 245 120 660 2.7 8.5
16.0 233
16.8 18.0
3,680 2,920
15,240 1,555
320 14.0 3.5
28.0 10.5 845
5,910 280
2,560 148
2,495 4.5 2.7
10.0 2.2
72.0 8,880
135 1,315 2,010 22.0 980 1.5 270
1,140 192 890 598 1.6 345
22.0 8.0 380 94
55,002
143 1.3 127 190 125 705 2.2 7.5
16.0 227
14.0 17.0
3,570 2,950
15,540 1,630
340 12.0 3.8
30.0 11.0 860
6,020 336
2,355 157
2,550 3.5 2.7 8.0 1.8
73.0 8,790
126 1,395 1,970 19.0
1,000 1.3 285
1,265 175 830 598 1.9 455
25.0 6.0 375 86
55,432
146 0.6 132 175 125 685 2.3 8.0
16.0 207
11.9 20.0
3,730 3,030
16,240 1,680
305 12.0 3.4
27.0 11.5 880
6,320 300
2,440 162
2,685 3.1 2.3 8.0 1.8
86.0 8,490
136 1,515 1,940 18.0 975 1.5 265
1,130 198 850 577 2.0 335
32.0 9.0 395 75
56,399
157 0.6 158 205 135 700 2.8 6.5
15.0 225
11.4 26.0
3,870 3,380
18,320 1,700
330 9.5 3.5
28.0 10.5 930
7,100 310
2,775 162
2,985 2.6 2.2 8.0 1.8
75.0 9,180
145 1,670 1,950 17.0
1,065 1.7 266
1,295 122
1,055 690 2.1 340
25.0 7.0 390 78
61,944
1 May not add due to rounding.

Hogs and Pigs Final Estimates 2003-2007 Agricultural Statistics Board March 2009 8 NASS, USDA
Hogs and Pigs: Market Inventory, Under 60 Pounds by State and United States, December 1, 2003-2007 1
State 2003 2004 2005 2006 2007
1,000 Head 1,000 Head 1,000 Head 1,000 Head 1,000 Head
AL AK AZ AR CA CO CT DE FL GA HI ID IL IN IA KS KY LA ME MD MA MI MN MS MO MT NE NV NH NJ NM NY NC ND OH OK OR PA RI SC SD TN TX UT VT VA WA WV WI WY US
65 0.5 32
120 35
340 1.3 4.0
13.0 114 8.0 7.0
1,280 990
4,510 510 110 6.0 2.3 8.0 3.3 300
2,210 34
1,280 50
960 1.3 0.6 1.0 1.0
24.0 3,550
50 540 920 8.0 350 0.6 65
385 77
245 245 0.6 105 8.0 3.0 165
39
19,778
69 1.0 47
130 32
355 1.4 4.0 8.0 98
7.6 5.0
1,410 1,010 4,580
460 110 5.0 2.0
10.0 4.0 330
2,250 67
1,200 48
970 1.3 0.9 1.0 0.5
26.0 3,520
48 540 970 7.0 280 0.4 65
395 72
300 250 0.6 115 7.0 2.0 135 28
19,979
60 0.4 46
135 40
390 1.1 3.5 8.0 97
6.0 6.0
1,300 1,060 4,610
570 105 4.0 2.1
12.0 5.0 315
2,320 83
1,105 50
990 0.9 1.0 1.0 0.5
24.0 3,450
50 550 920 6.0 310 0.4 60
435 60
270 260 0.9 140 9.0 2.0 150 28
20,053
62 0.2 49
125 40
380 1.0 4.0 7.0 96
5.5 9.0
1,260 1,120 4,910
570 100 4.0 1.5
10.0 4.2 295
2,420 125
1,130 53
1,010 0.7 0.8 1.0 0.5
23.0 3,390
58 585 900 5.5 300 0.5 60
415 73
280 273 0.7 110 8.0 2.0 155 27
20,460
65 0.2 62
150 40
360 1.2 3.0 7.0 94
5.8 12.0
1,420 1,260 5,810
580 105 3.0 1.7 9.0 3.8 315
2,750 111
1,300 55
1,140 0.7 0.6 1.5 0.5
17.0 3,430
75 650 910 5.0 345 0.7 50
465 40
315 275 0.9 100 6.0 1.0 150 42
22,545
1 Weight groups may not add to Market Hogs and Pigs due to rounding.

Hogs and Pigs Final Estimates 2003-2007 Agricultural Statistics Board March 2009 9 NASS, USDA
Hogs and Pigs: Market Inventory, 60-119 Pounds by State and United States, December 1, 2003-2007 1
State 2003 2004 2005 2006 2007
1,000 Head 1,000 Head 1,000 Head 1,000 Head 1,000 Head
AL AK AZ AR CA CO CT DE FL GA HI ID IL IN IA KS KY LA ME MD MA MI MN MS MO MT NE NV NH NJ NM NY NC ND OH OK OR PA RI SC SD TN TX UT VT VA WA WV WI WY US
30 0.3 27 30 25 70
0.7 2.0 7.0 56
5.0 6.0 860 670
4,130 285
90 5.0 1.0 5.0 2.8 210
1,420 81
530 37
655 1.2 0.7 2.0 0.3
15.0 2,180
30 330 310 6.0 235 0.4 70
250 43
195 123 0.2 80
6.0 1.0 95 23
13,238
32 0.2 29 40 32
100 0.6 2.0 3.0 55
4.4 5.0 830 750
4,140 330 80
4.0 0.8 5.0 3.1 200
1,430 76
530 37
650 1.2 0.8 2.0 0.6
18.0 2,150
33 310 330 7.0 275 0.4 70
285 45
200 131 0.4 90
6.0 1.0 90 22
13,438
30 0.6 27 20 35 95
0.6 1.5 4.0 51
3.9 5.0 860 740
4,180 315 90
3.0 0.8 3.0 2.6 205
1,460 85
480 40
675 1.0 0.4 2.0 0.5
16.0 2,130
30 330 300 5.0 280 0.4 80
310 45
195 146 0.4 125 7.0 1.0 85 20
13,523
29 0.2 28 15 40 80
0.6 1.0 4.0 46
3.0 5.0 960 760
4,470 320 85
3.0 1.0 6.0 3.4 225
1,550 69
490 40
720 0.9 0.4 2.0 0.5
22.0 1,970
36 375 320 5.0 300 0.4 80
260 40
205 129 0.4 95
9.0 2.0 100 20
13,927
32 0.2 32 20 37 90
0.6 1.0 5.0 51
2.7 6.0 980 850
4,880 365 80
3.0 0.8 7.0 3.0 235
1,730 77
570 40
805 0.7 0.4 2.0 0.5
20.0 2,220
27 405 300 4.5 300 0.3 81
285 23
230 148 0.4 100 7.0 2.0 100 13
15,173
1 Weight groups may not add to Market Hogs and Pigs due to rounding.

Hogs and Pigs Final Estimates 2003-2007 Agricultural Statistics Board March 2009 10 NASS, USDA
Hogs and Pigs: Market Inventory, 120-179 Pounds by State and United States, December 1, 2003-2007 1
State 2003 2004 2005 2006 2007
1,000 Head 1,000 Head 1,000 Head 1,000 Head 1,000 Head
AL AK AZ AR CA CO CT DE FL GA HI ID IL IN IA KS KY LA ME MD MA MI MN MS MO MT NE NV NH NJ NM NY NC ND OH OK OR PA RI SC SD TN TX UT VT VA WA WV WI WY US
27 0.2 26 30 28 70
0.5 1.5 3.0 42
3.0 5.0 770 580
3,200 280
75 3.0 0.5 6.0 2.4 175
1,250 81
460 35
490 1.0 0.5 3.0 0.3
13.0 1,750
21 280 310 3.0 195 0.2 60
285 36
200 123 0.2 70
5.0 1.0 85 22
11,108
30 0.1 29 35 26 75
0.4 1.5 3.0 43
3.2 5.0 770 600
3,340 340 70
2.0 0.4 6.0 1.8 160
1,250 70
480 33
470 1.0 0.5 2.0 0.6
13.0 1,700
27 270 230 4.0 225 0.2 60
250 38
205 131 0.2 75
5.0 1.0 80 22
11,185
27 0.2 27 15 25 85
0.3 1.5 2.0 40
2.4 3.0 740 560
3,520 315 75
2.0 0.4 7.0 1.7 175
1,200 83
450 34
480 0.9 0.6 2.0 0.5
17.0 1,720
23 295 240 4.0 215 0.3 70
280 35
180 136 0.2 100 5.0 1.0 75 19
11,291
26 0.1 27 15 20 85
0.3 2.0 4.0 35
2.0 3.0 800 580
3,540 310 60
2.0 0.4 7.0 2.4 170
1,250 53
475 35
530 0.8 0.2 2.0 0.5
21.0 1,680
22 300 240 4.0 185 0.4 65
220 40
185 115 0.3 65
9.0 2.0 70 13
11,274
30 0.1 32 15 30 90
0.4 1.5 2.0 41
1.8 5.0 800 680
4,060 295 70
2.0 0.5 8.0 2.2 200
1,450 61
485 36
590 0.6 0.4 2.0 0.5
20.0 1,890
24 360 220 4.0 220 0.4 70
295 23
230 142 0.3 75
6.0 2.0 70 14
12,658
1 Weight groups may not add to Market Hogs and Pigs due to rounding.

Hogs and Pigs Final Estimates 2003-2007 Agricultural Statistics Board March 2009 11 NASS, USDA
Hogs and Pigs: Market Inventory, 180 Pounds and Over by State and United States, December 1, 2003-2007 1
State 2003 2004 2005 2006 2007
1,000 Head 1,000 Head 1,000 Head 1,000 Head 1,000 Head
AL AK AZ AR CA CO CT DE FL GA HI ID IL IN IA KS KY LA ME MD MA MI MN MS MO MT NE NV NH NJ NM NY NC ND OH OK OR PA RI SC SD TN TX UT VT VA WA WV WI WY US
28 0.1 26 45 27
135 0.3 1.5 2.0 35
2.0 4.0 680 560
3,010 415
65 3.0 0.4 6.0 1.7 160
1,020 81
340 30
430 1.0 0.3 5.0 0.5
12.0 1,500
19 210 450 4.0 210 0.3 75
220 34
185 78
0.4 90
4.0 3.0 80 21
10,311
31 0.1 29 40 30
130 0.3 1.0 2.0 37
1.6 3.0 670 560
3,180 425 60
3.0 0.3 7.0 1.6 155 980 67
350 30
405 1.0 0.5 5.0 0.5
15.0 1,510
27 195 480 4.0 200 0.5 75
210 37
185 86
0.4 65
4.0 4.0 75 22
10,401
26 0.1 27 20 25
135 0.2 1.0 2.0 39
1.7 3.0 670 590
3,230 430 70
3.0 0.5 8.0 1.7 165
1,040 85
320 33
405 0.7 0.7 3.0 0.3
16.0 1,490
23 220 510 4.0 195 0.2 75
240 35
185 56
0.4 90
4.0 2.0 65 19
10,566
29 0.1 28 20 25
140 0.4 1.0 1.0 30
1.4 3.0 710 570
3,320 480 60
3.0 0.5 4.0 1.5 190
1,100 53
345 34
425 0.7 0.9 3.0 0.3
20.0 1,450
20 255 480 3.5 190 0.2 60
235 45
180 60
0.6 65
6.0 3.0 70 15
10,738
30 0.1 32 20 28
160 0.6 1.0 1.0 39
1.1 3.0 670 590
3,570 460 75
1.5 0.5 4.0 1.5 180
1,170 61
420 31
450 0.6 0.8 2.5 0.3
18.0 1,640
19 255 520 3.5 200 0.3 65
250 36
280 125 0.5 65
6.0 2.0 70 9
11,569 1 Weight groups may not add to Market Hogs and Pigs due to rounding.

Hogs and Pigs Final Estimates 2003-2007 Agricultural Statistics Board March 2009 12 NASS, USDA
Hogs and Pigs: Total Inventory Number by State and United States, March 1, 2003-2007 1
State 2003 2004 2005 2006 2007
1,000 Head 1,000 Head 1,000 Head 1,000 Head 1,000 Head
AR CO IL IN IA KS MI MN MO NE NC OH OK PA SD TX WI Oth Sts 2 US
275 720
3,950 3,100
15,000 1,480
870 6,100 2,950 2,900 9,600 1,440 2,370 1,070 1,300
890 500
3,678
58,193
315 720
3,850 3,150
15,500 1,730
930 6,500 2,900 2,850 9,900 1,500 2,350 1,030 1,250
920 450
3,684
59,529
330 810
4,000 3,050
16,100 1,690
920 6,300 2,850 2,750 9,700 1,500 2,390 1,100 1,300
910 430
3,581
59,711
275 830
4,150 3,100
16,400 1,740
960 6,400 2,700 2,950 9,500 1,540 2,330 1,110 1,380
930 430
3,615
60,340
280 830
4,100 3,250
16,900 1,860
980 6,900 2,850 3,100 9,400 1,700 2,350 1,110 1,280
970 440
3,596
61,896
1 May not add due to rounding. 2 Individual State estimates not available for the 33 Other States.
Hogs and Pigs: Breeding Inventory Number by State and United States, March 1, 2003-2007 1
State 2003 2004 2005 2006 2007
1,000 Head 1,000 Head 1,000 Head 1,000 Head 1,000 Head
AR CO IL IN IA KS MI MN MO NE NC OH OK PA SD TX WI Oth Sts 2 US
75 130 420 320
1,060 170 100 590 360 380
1,010 160 350 125 145 105
60
477
6,037
85 140 410 300
1,030 180 100 590 330 360
1,020 160 380 120 145 105 50
466
5,971
85 140 430 280
1,070 165 100 580 325 355
1,010 160 400 100 145 95 50
462
5,952
85 150 420 300
1,090 175 100 570 345 355
1,020 160 400 100 155 100 50
470
6,045
85 150 490 310
1,070 175 110 590 360 360
1,030 160 400 100 135 95 55
474
6,149
1 May not add due to rounding. 2 Individual State estimates not available for the 33 Other States.

Hogs and Pigs Final Estimates 2003-2007 Agricultural Statistics Board March 2009 13 NASS, USDA
Hogs and Pigs: Market Inventory Number by State and United States, March 1, 2003-2007 1
State 2003 2004 2005 2006 2007
1,000 Head 1,000 Head 1,000 Head 1,000 Head 1,000 Head
AR CO IL IN IA KS MI MN MO NE NC OH OK PA SD TX WI Oth Sts 2 US
200 590
3,530 2,780
13,940 1,310
770 5,510 2,590 2,520 8,590 1,280 2,020
945 1,155
785 440
3,201
52,156
230 580
3,440 2,850
14,470 1,550
830 5,910 2,570 2,490 8,880 1,340 1,970
910 1,105
815 400
3,218
53,558
245 670
3,570 2,770
15,030 1,525
820 5,720 2,525 2,395 8,690 1,340 1,990 1,000 1,155
815 380
3,119
53,759
190 680
3,730 2,800
15,310 1,565
860 5,830 2,355 2,595 8,480 1,380 1,930 1,010 1,225
830 380
3,145
54,295
195 680
3,610 2,940
15,830 1,685
870 6,310 2,490 2,740 8,370 1,540 1,950 1,010 1,145
875 385
3,121
55,746
1 May not add due to rounding. 2 Individual State estimates not available for the 33 Other States.

Hogs and Pigs Final Estimates 2003-2007 Agricultural Statistics Board March 2009 14 NASS, USDA
Hogs and Pigs: Market Inventory, Under 60 Pounds by State and United States, March 1, 2003-2007 1
State 2003 2004 2005 2006 2007
1,000 Head 1,000 Head 1,000 Head 1,000 Head 1,000 Head
AR CO IL IN IA KS MI MN MO NE NC OH OK PA SD TX WI Oth Sts 2 US
130 305
1,270 1,040 4,290
430 270
2,110 1,230 1,000 3,350
525 880 340 380 220 165
1,151
19,086
135 315
1,260 1,060 4,510
530 300
2,260 1,270
980 3,500
555 930 300 385 265 155
1,113
19,823
145 365
1,360 1,030 4,330
540 325
2,230 1,195
970 3,410
550 950 290 405 295 145
1,134
19,669
140 360
1,310 1,030 4,690
530 315
2,280 1,085 1,010 3,400
570 900 370 445 265 145
1,141
19,986
140 380
1,310 1,070 4,650
575 300
2,400 1,165 1,050 3,430
605 930 300 415 315 155
1,189
20,379
1 Weight groups may not add to Market Hogs and Pigs due to rounding. 2 Individual State estimates not available for the 33 Other States.
Hogs and Pigs: Market Inventory, 60-119 Pounds by State and United States, March 1, 2003-2007 1
State 2003 2004 2005 2006 2007
1,000 Head 1,000 Head 1,000 Head 1,000 Head 1,000 Head
AR CO IL IN IA KS MI MN MO NE NC OH OK PA SD TX WI Oth Sts 2 US
20 85
860 660
3,810 250 190
1,330 570 640
1,990 305 340 245 295 210 100
739
12,639
30 75
820 660
4,000 285 205
1,410 510 640
2,180 305 300 240 245 185 95
769
12,954
35 115 840 660
4,230 255 190
1,400 520 600
2,030 310 320 295 280 190 90
727
13,087
20 90
870 700
4,140 285 200
1,340 490 670
1,940 315 340 270 280 190 95
770
13,005
20 105 890 730
4,210 310 210
1,540 485 730
1,850 375 300 295 260 205 90
750
13,355
1 Weight groups may not add to Market Hogs and Pigs due to rounding. 2 Individual State estimates not available for the 33 Other States.
Hogs and Pigs Final Estimates 2003-2007 Agricultural Statistics Board March 2009 15 NASS, USDA
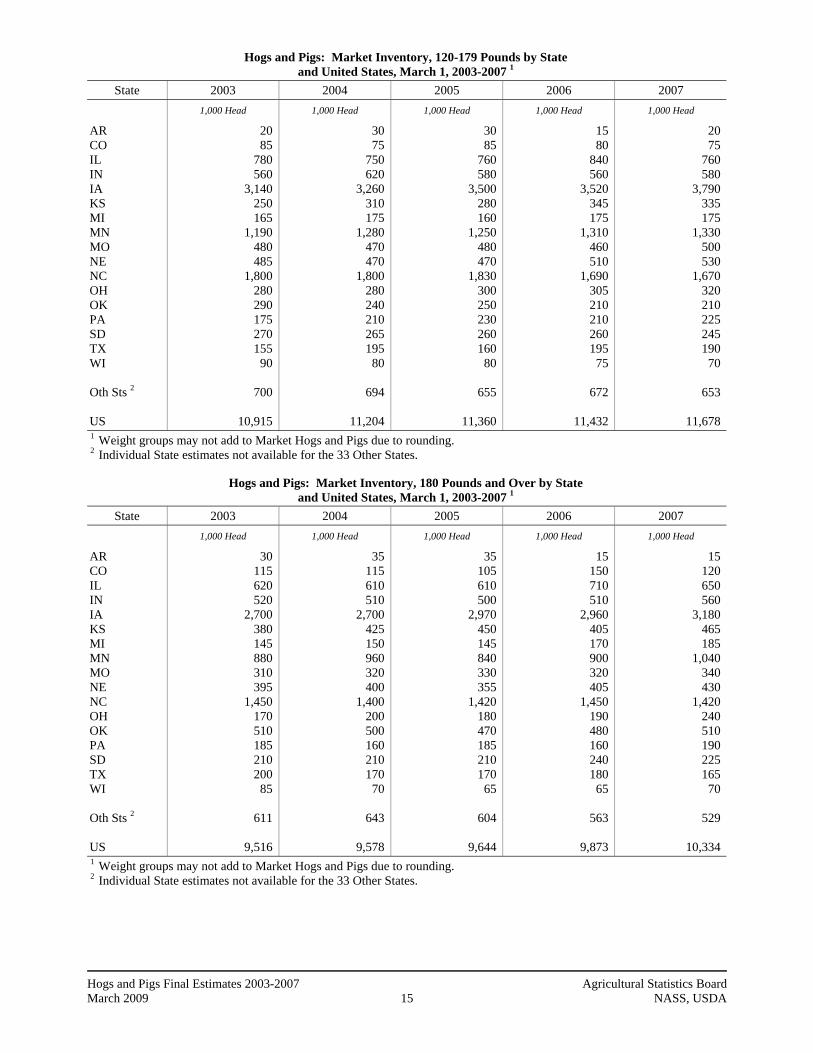
Hogs and Pigs: Market Inventory, 120-179 Pounds by State and United States, March 1, 2003-2007 1
State 2003 2004 2005 2006 2007
1,000 Head 1,000 Head 1,000 Head 1,000 Head 1,000 Head
AR CO IL IN IA KS MI MN MO NE NC OH OK PA SD TX WI Oth Sts 2 US
20 85
780 560
3,140 250 165
1,190 480 485
1,800 280 290 175 270 155
90
700
10,915
30 75
750 620
3,260 310 175
1,280 470 470
1,800 280 240 210 265 195 80
694
11,204
30 85
760 580
3,500 280 160
1,250 480 470
1,830 300 250 230 260 160 80
655
11,360
15 80
840 560
3,520 345 175
1,310 460 510
1,690 305 210 210 260 195 75
672
11,432
20 75
760 580
3,790 335 175
1,330 500 530
1,670 320 210 225 245 190 70
653
11,678
1 Weight groups may not add to Market Hogs and Pigs due to rounding. 2 Individual State estimates not available for the 33 Other States.
Hogs and Pigs: Market Inventory, 180 Pounds and Over by State and United States, March 1, 2003-2007 1
State 2003 2004 2005 2006 2007
1,000 Head 1,000 Head 1,000 Head 1,000 Head 1,000 Head
AR CO IL IN IA KS MI MN MO NE NC OH OK PA SD TX WI Oth Sts 2 US
30 115 620 520
2,700 380 145 880 310 395
1,450 170 510 185 210 200
85
611
9,516
35 115 610 510
2,700 425 150 960 320 400
1,400 200 500 160 210 170 70
643
9,578
35 105 610 500
2,970 450 145 840 330 355
1,420 180 470 185 210 170 65
604
9,644
15 150 710 510
2,960 405 170 900 320 405
1,450 190 480 160 240 180 65
563
9,873
15 120 650 560
3,180 465 185
1,040 340 430
1,420 240 510 190 225 165 70
529
10,334
1 Weight groups may not add to Market Hogs and Pigs due to rounding. 2 Individual State estimates not available for the 33 Other States.

Hogs and Pigs Final Estimates 2003-2007 Agricultural Statistics Board March 2009 16 NASS, USDA
Hogs and Pigs: Total Inventory Number by State and United States, June 1, 2003-2007 1
State 2003 2004 2005 2006 2007
1,000 Head 1,000 Head 1,000 Head 1,000 Head 1,000 Head
AR CO IL IN IA KS MI MN MO NE NC OH OK PA SD TX WI Oth Sts 2 US
270 730
4,050 3,050
15,800 1,520
930 6,300 2,900 2,950 9,800 1,460 2,300 1,060 1,330
910 480
3,769
59,609
335 750
3,950 3,150
16,100 1,740
910 6,600 2,950 2,850
10,200 1,470 2,450 1,010 1,230
890 440
3,682
60,707
290 780
4,100 3,150
16,200 1,700
910 6,600 2,850 2,800 9,900 1,580 2,390 1,070 1,340
930 430
3,724
60,744
280 840
4,200 3,200
16,700 1,850
980 6,800 2,700 3,000 9,600 1,610 2,370 1,100 1,360
960 430
3,721
61,701
290 840
4,000 3,350
18,200 1,900 1,020 7,000 3,050 3,150 9,700 1,660 2,320 1,120 1,290 1,000
410
3,647
63,947 1 May not add due to rounding. 2 Individual State estimates not available for the 33 Other States.
Hogs and Pigs: Breeding Inventory Number by State and United States, June 1, 2003-2007 1
State 2003 2004 2005 2006 2007
1,000 Head 1,000 Head 1,000 Head 1,000 Head 1,000 Head
AR CO IL IN IA KS MI MN MO NE NC OH OK PA SD TX WI Oth Sts 2 US
75 125 420 310
1,060 175 100 600 340 380
1,020 160 370 120 145 110
60
466
6,036
85 140 420 290
1,050 175 95
590 320 355
1,010 155 380 110 140 110 50
472
5,947
85 140 430 290
1,060 165 100 590 335 355
1,020 160 400 95
145 100 50
468
5,988
85 150 440 310
1,070 170 100 580 350 360
1,020 165 400 95
160 105 55
465
6,080
85 150 480 300
1,060 175 110 600 375 365
1,020 165 400 100 145 105 50
484
6,169
1 May not add due to rounding. 2 Individual State estimates not available for the 33 Other States.

Hogs and Pigs Final Estimates 2003-2007 Agricultural Statistics Board March 2009 17 NASS, USDA
Hogs and Pigs: Market Inventory Number by State and United States, June 1, 2003-2007 1
State 2003 2004 2005 2006 2007
1,000 Head 1,000 Head 1,000 Head 1,000 Head 1,000 Head
AR CO IL IN IA KS MI MN MO NE NC OH OK PA SD TX WI Oth Sts 2 US
195 605
3,630 2,740
14,740 1,345
830 5,700 2,560 2,570 8,780 1,300 1,930
940 1,185
800 420
3,303
53,573
250 610
3,530 2,860
15,050 1,565
815 6,010 2,630 2,495 9,190 1,315 2,070
900 1,090
780 390
3,210
54,760
205 640
3,670 2,860
15,140 1,535
810 6,010 2,515 2,445 8,880 1,420 1,990
975 1,195
830 380
3,256
54,756
195 690
3,760 2,890
15,630 1,680
880 6,220 2,350 2,640 8,580 1,445 1,970 1,005 1,200
855 375
3,256
55,621
205 690
3,520 3,050
17,140 1,725
910 6,400 2,675 2,785 8,680 1,495 1,920 1,020 1,145
895 360
3,162
57,777
1 May not add due to rounding. 2 Individual State estimates not available for the 33 Other States.
Hogs and Pigs Final Estimates 2003-2007 Agricultural Statistics Board March 2009 18 NASS, USDA
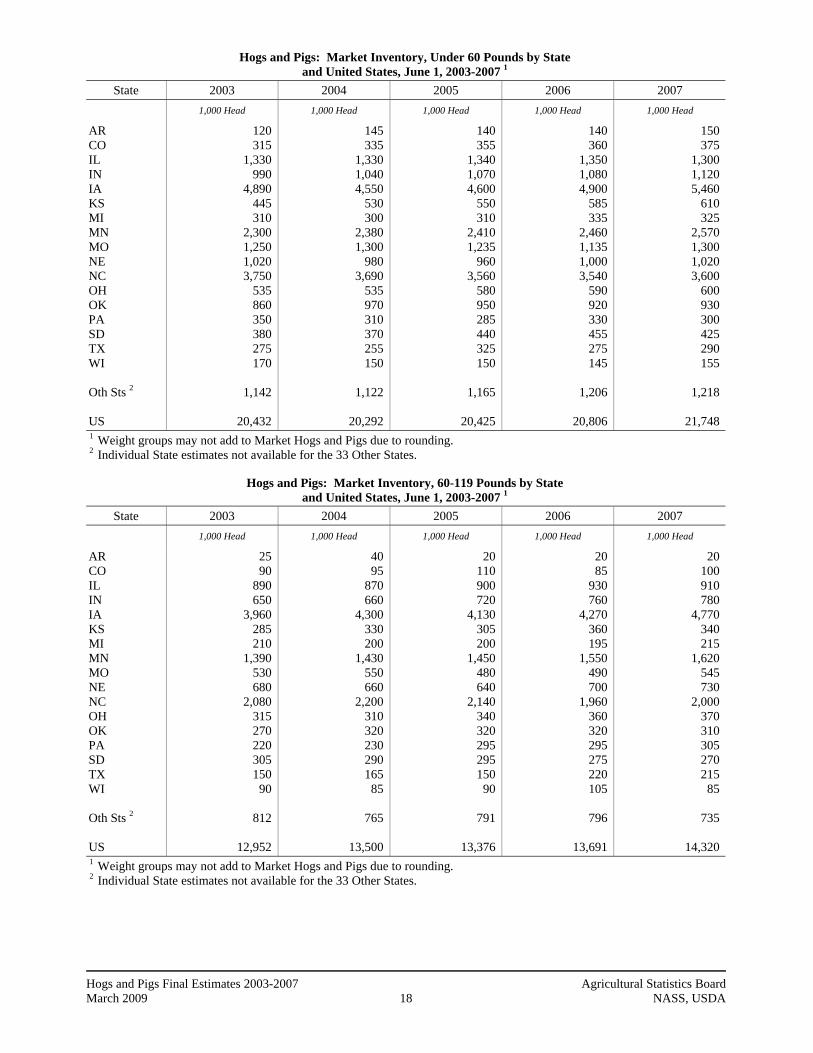
Hogs and Pigs: Market Inventory, Under 60 Pounds by State and United States, June 1, 2003-2007 1
State 2003 2004 2005 2006 2007
1,000 Head 1,000 Head 1,000 Head 1,000 Head 1,000 Head
AR CO IL IN IA KS MI MN MO NE NC OH OK PA SD TX WI Oth Sts 2 US
120 315
1,330 990
4,890 445 310
2,300 1,250 1,020 3,750
535 860 350 380 275 170
1,142
20,432
145 335
1,330 1,040 4,550
530 300
2,380 1,300
980 3,690
535 970 310 370 255 150
1,122
20,292
140 355
1,340 1,070 4,600
550 310
2,410 1,235
960 3,560
580 950 285 440 325 150
1,165
20,425
140 360
1,350 1,080 4,900
585 335
2,460 1,135 1,000 3,540
590 920 330 455 275 145
1,206
20,806
150 375
1,300 1,120 5,460
610 325
2,570 1,300 1,020 3,600
600 930 300 425 290 155
1,218
21,748
1 Weight groups may not add to Market Hogs and Pigs due to rounding. 2 Individual State estimates not available for the 33 Other States.
Hogs and Pigs: Market Inventory, 60-119 Pounds by State and United States, June 1, 2003-2007 1
State 2003 2004 2005 2006 2007
1,000 Head 1,000 Head 1,000 Head 1,000 Head 1,000 Head
AR CO IL IN IA KS MI MN MO NE NC OH OK PA SD TX WI Oth Sts 2 US
25 90
890 650
3,960 285 210
1,390 530 680
2,080 315 270 220 305 150
90
812
12,952
40 95
870 660
4,300 330 200
1,430 550 660
2,200 310 320 230 290 165 85
765
13,500
20 110 900 720
4,130 305 200
1,450 480 640
2,140 340 320 295 295 150 90
791
13,376
20 85
930 760
4,270 360 195
1,550 490 700
1,960 360 320 295 275 220 105
796
13,691
20 100 910 780
4,770 340 215
1,620 545 730
2,000 370 310 305 270 215 85
735
14,320
1 Weight groups may not add to Market Hogs and Pigs due to rounding. 2 Individual State estimates not available for the 33 Other States.

Hogs and Pigs Final Estimates 2003-2007 Agricultural Statistics Board March 2009 19 NASS, USDA
Hogs and Pigs: Market Inventory, 120-179 Pounds by State and United States, June 1, 2003-2007 1
State 2003 2004 2005 2006 2007
1,000 Head 1,000 Head 1,000 Head 1,000 Head 1,000 Head
AR CO IL IN IA KS MI MN MO NE NC OH OK PA SD TX WI Oth Sts 2 US
25 85
780 570
3,190 255 165
1,180 470 495
1,650 275 280 190 280 135
85
717
10,827
30 80
750 600
3,350 275 170
1,260 480 465
1,800 290 300 190 255 185 80
695
11,255
20 60
770 550
3,500 280 155
1,220 450 490
1,720 300 230 225 250 160 70
693
11,143
15 95
840 550
3,560 310 175
1,320 420 555
1,690 310 260 215 240 195 70
663
11,483
15 85
750 590
3,860 335 190
1,300 505 590
1,670 310 220 225 240 200 65
639
11,789
1 Weight groups may not add to Market Hogs and Pigs due to rounding. 2 Individual State estimates not available for the 33 Other States.
Hogs and Pigs: Market Inventory, 180 Pounds and Over by State and United States, June 1, 2003-2007 1
State 2003 2004 2005 2006 2007
1,000 Head 1,000 Head 1,000 Head 1,000 Head 1,000 Head
AR CO IL IN IA KS MI MN MO NE NC OH OK PA SD TX WI Oth Sts 2 US
25 115 630 530
2,700 360 145 830 310 375
1,300 175 520 180 220 240
75
632
9,362
35 100 580 560
2,850 430 145 940 300 390
1,500 180 480 170 175 175 75
629
9,714
25 115 660 520
2,910 400 145 930 350 355
1,460 200 490 170 210 195 70
608
9,813
20 150 640 500
2,900 425 175 890 305 385
1,390 185 470 165 230 165 55
592
9,642
20 130 560 560
3,050 440 180 910 325 445
1,410 215 460 190 210 190 55
570
9,920
1 Weight groups may not add to Market Hogs and Pigs due to rounding. 2 Individual State estimates not available for the 33 Other States.
Hogs and Pigs Final Estimates 2003-2007 Agricultural Statistics Board March 2009 20 NASS, USDA
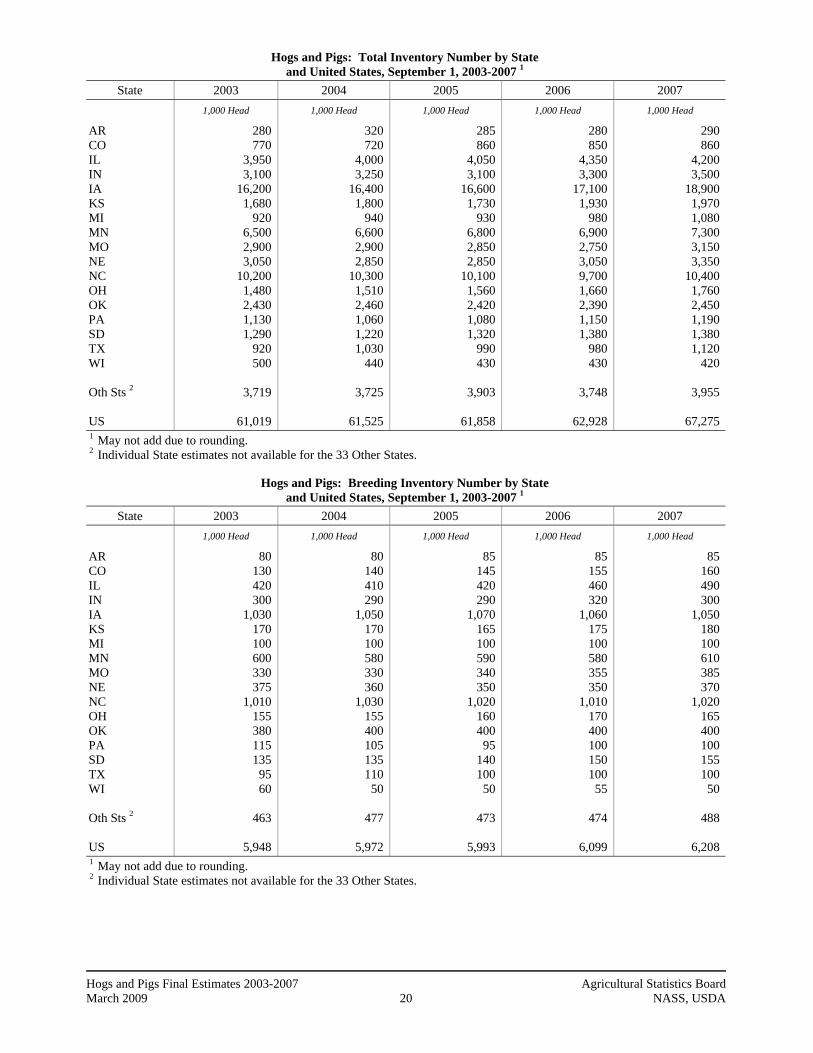
Hogs and Pigs: Total Inventory Number by State and United States, September 1, 2003-2007 1
State 2003 2004 2005 2006 2007
1,000 Head 1,000 Head 1,000 Head 1,000 Head 1,000 Head
AR CO IL IN IA KS MI MN MO NE NC OH OK PA SD TX WI Oth Sts 2 US
280 770
3,950 3,100
16,200 1,680
920 6,500 2,900 3,050
10,200 1,480 2,430 1,130 1,290
920 500
3,719
61,019
320 720
4,000 3,250
16,400 1,800
940 6,600 2,900 2,850
10,300 1,510 2,460 1,060 1,220 1,030
440
3,725
61,525
285 860
4,050 3,100
16,600 1,730
930 6,800 2,850 2,850
10,100 1,560 2,420 1,080 1,320
990 430
3,903
61,858
280 850
4,350 3,300
17,100 1,930
980 6,900 2,750 3,050 9,700 1,660 2,390 1,150 1,380
980 430
3,748
62,928
290 860
4,200 3,500
18,900 1,970 1,080 7,300 3,150 3,350
10,400 1,760 2,450 1,190 1,380 1,120
420
3,955
67,275 1 May not add due to rounding. 2 Individual State estimates not available for the 33 Other States.
Hogs and Pigs: Breeding Inventory Number by State and United States, September 1, 2003-2007 1
State 2003 2004 2005 2006 2007
1,000 Head 1,000 Head 1,000 Head 1,000 Head 1,000 Head
AR CO IL IN IA KS MI MN MO NE NC OH OK PA SD TX WI Oth Sts 2 US
80 130 420 300
1,030 170 100 600 330 375
1,010 155 380 115 135
95 60
463
5,948
80 140 410 290
1,050 170 100 580 330 360
1,030 155 400 105 135 110 50
477
5,972
85 145 420 290
1,070 165 100 590 340 350
1,020 160 400 95
140 100 50
473
5,993
85 155 460 320
1,060 175 100 580 355 350
1,010 170 400 100 150 100 55
474
6,099
85 160 490 300
1,050 180 100 610 385 370
1,020 165 400 100 155 100 50
488
6,208
1 May not add due to rounding. 2 Individual State estimates not available for the 33 Other States.

Hogs and Pigs Final Estimates 2003-2007 Agricultural Statistics Board March 2009 21 NASS, USDA
Hogs and Pigs: Market Inventory Number by State and United States, September 1, 2003-2007 1
State 2003 2004 2005 2006 2007
1,000 Head 1,000 Head 1,000 Head 1,000 Head 1,000 Head
AR CO IL IN IA KS MI MN MO NE NC OH OK PA SD TX WI Oth Sts 2 US
200 640
3,530 2,800
15,170 1,510
820 5,900 2,570 2,675 9,190 1,325 2,050 1,015 1,155
825 440
3,256
55,071
240 580
3,590 2,960
15,350 1,630
840 6,020 2,570 2,490 9,270 1,355 2,060
955 1,085
920 390
3,248
55,553
200 715
3,630 2,810
15,530 1,565
830 6,210 2,510 2,500 9,080 1,400 2,020
985 1,180
890 380
3,430
55,865
195 695
3,890 2,980
16,040 1,755
880 6,320 2,395 2,700 8,690 1,490 1,990 1,050 1,230
880 375
3,274
56,829
205 700
3,710 3,200
17,850 1,790
980 6,690 2,765 2,980 9,380 1,595 2,050 1,090 1,225 1,020
370
3,466
61,066 1 May not add due to rounding. 2 Individual State estimates not available for the 33 Other States.

Hogs and Pigs Final Estimates 2003-2007 Agricultural Statistics Board March 2009 22 NASS, USDA
Hogs and Pigs: Market Inventory, Under 60 Pounds by State and United States, September 1, 2003-2007 1
State 2003 2004 2005 2006 2007
1,000 Head 1,000 Head 1,000 Head 1,000 Head 1,000 Head
AR CO IL IN IA KS MI MN MO NE NC OH OK PA SD TX WI Oth Sts 2 US
110 335
1,310 1,060 4,800
500 300
2,300 1,220 1,060 3,660
545 935 365 380 290 175
1,093
20,438
140 320
1,380 1,080 4,740
550 320
2,430 1,270
970 3,670
575 980 290 395 340 150
1,127
20,727
145 400
1,380 1,050 4,780
535 320
2,450 1,180
990 3,650
580 920 300 425 290 150
1,215
20,760
140 380
1,350 1,080 4,800
590 300
2,440 1,115 1,000 3,530
600 940 330 455 310 145
1,201
20,706
150 365
1,400 1,120 5,790
550 335
2,680 1,300 1,150 3,700
630 950 350 425 355 150
1,248
22,648
1 Weight groups may not add to Market Hogs and Pigs due to rounding. 2 Individual State estimates not available for the 33 Other States.
Hogs and Pigs: Market Inventory, 60-119 Pounds by State and United States, September 1, 2003-2007 1
State 2003 2004 2005 2006 2007
1,000 Head 1,000 Head 1,000 Head 1,000 Head 1,000 Head
AR CO IL IN IA KS MI MN MO NE NC OH OK PA SD TX WI Oth Sts 2 US
35 95
870 690
4,130 350 210
1,510 550 700
2,330 345 300 240 310 160 100
814
13,739
35 85
840 710
4,210 340 200
1,440 500 660
2,350 330 360 245 270 185 90
762
13,612
20 110 890 720
4,410 355 195
1,510 520 670
2,130 335 290 270 295 210 90
854
13,874
20 90
980 770
4,540 395 220
1,610 480 710
2,040 380 320 300 285 200 90
800
14,230
20 120 910 840
4,920 380 230
1,710 545 810
2,310 385 340 310 290 215 105
821
15,261
1 Weight groups may not add to Market Hogs and Pigs due to rounding. 2 Individual State estimates not available for the 33 Other States.
Hogs and Pigs Final Estimates 2003-2007 Agricultural Statistics Board March 2009 23 NASS, USDA
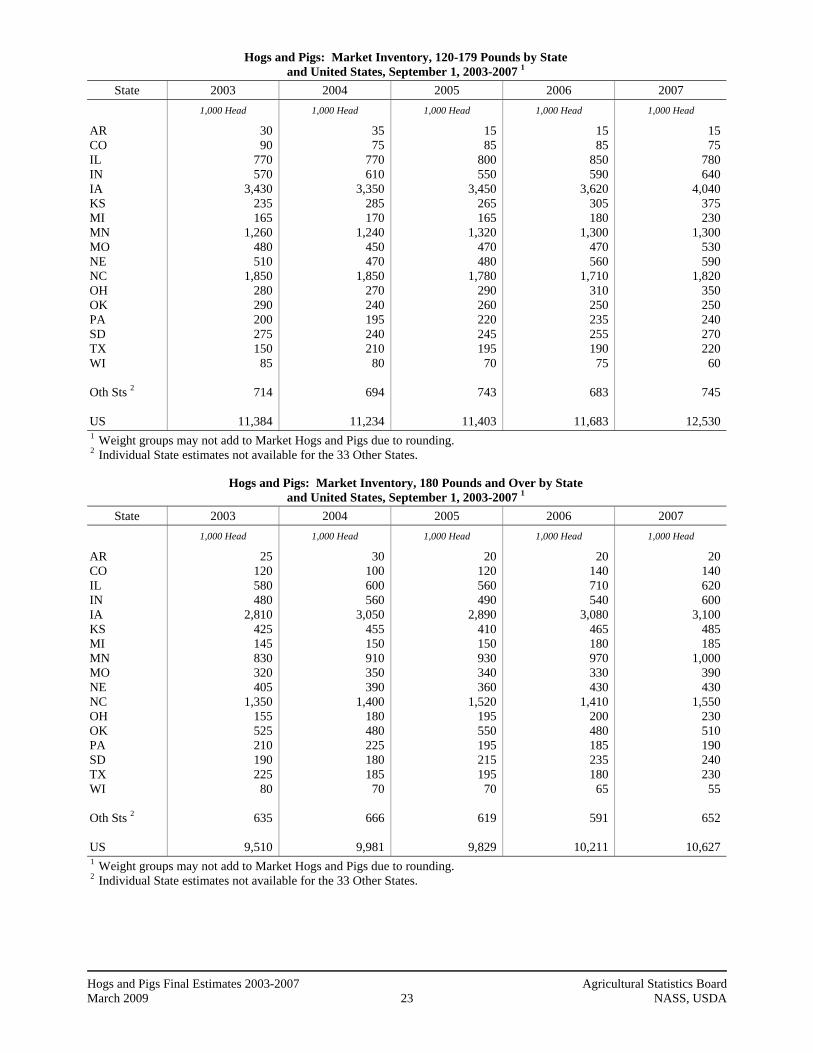
Hogs and Pigs: Market Inventory, 120-179 Pounds by State and United States, September 1, 2003-2007 1
State 2003 2004 2005 2006 2007
1,000 Head 1,000 Head 1,000 Head 1,000 Head 1,000 Head
AR CO IL IN IA KS MI MN MO NE NC OH OK PA SD TX WI Oth Sts 2 US
30 90
770 570
3,430 235 165
1,260 480 510
1,850 280 290 200 275 150
85
714
11,384
35 75
770 610
3,350 285 170
1,240 450 470
1,850 270 240 195 240 210 80
694
11,234
15 85
800 550
3,450 265 165
1,320 470 480
1,780 290 260 220 245 195 70
743
11,403
15 85
850 590
3,620 305 180
1,300 470 560
1,710 310 250 235 255 190 75
683
11,683
15 75
780 640
4,040 375 230
1,300 530 590
1,820 350 250 240 270 220 60
745
12,530
1 Weight groups may not add to Market Hogs and Pigs due to rounding. 2 Individual State estimates not available for the 33 Other States.
Hogs and Pigs: Market Inventory, 180 Pounds and Over by State and United States, September 1, 2003-2007 1
State 2003 2004 2005 2006 2007
1,000 Head 1,000 Head 1,000 Head 1,000 Head 1,000 Head
AR CO IL IN IA KS MI MN MO NE NC OH OK PA SD TX WI Oth Sts 2 US
25 120 580 480
2,810 425 145 830 320 405
1,350 155 525 210 190 225
80
635
9,510
30 100 600 560
3,050 455 150 910 350 390
1,400 180 480 225 180 185 70
666
9,981
20 120 560 490
2,890 410 150 930 340 360
1,520 195 550 195 215 195 70
619
9,829
20 140 710 540
3,080 465 180 970 330 430
1,410 200 480 185 235 180 65
591
10,211
20 140 620 600
3,100 485 185
1,000 390 430
1,550 230 510 190 240 230 55
652
10,627
1 Weight groups may not add to Market Hogs and Pigs due to rounding. 2 Individual State estimates not available for the 33 Other States.

Hogs and Pigs Final Estimates 2003-2007 Agricultural Statistics Board March 2009 24 NASS, USDA
Farrowings: Number of Sows by State and United States, Dec-Feb 2003-2007 1 December 2 - February State
2003 2004 2005 2006 2007
1,000 Head 1,000 Head 1,000 Head 1,000 Head 1,000 Head
AR CO IL IN IA KS MI MN MO NE NC OH OK PA SD TX WI Oth Sts 3 US
41 75
200 150 410
76 43
265 170 180 530
73 170
49 64 43 29
200
2,768
38 73
205 145 410 84 46
285 170 175 550 74
185 53 70 46 24
203
2,836
43 75
210 130 440 80 44
275 170 175 540 77
190 47 72 43 24
199
2,834
41 81
195 130 455 84 48
270 165 175 540 77
185 47 77 42 26
202
2,840
39 83
220 140 450 88 49
275 180 175 540 84
190 44 67 45 27
209
2,905
1 May not add due to rounding. 2 December preceding year. 3 Individual State estimates not available for the 33 Other States.
Farrowings: Pigs per Litter by State and United States, Dec-Feb 2003-2007 December 1 - February State
2003 2004 2005 2006 2007
Number Number Number Number Number
AR CO IL IN IA KS MI MN MO NE NC OH OK PA SD TX WI Oth Sts 2 US
9.70 8.35 8.85 8.85 8.50 8.50 8.80 8.80 8.85 8.75 9.00 8.90 8.80 9.30 9.05 8.75 8.60
8.86
8.81
9.60 8.30 8.85 8.85 8.70 8.70 8.90 9.05 9.00 8.90 8.95 8.80 8.60 8.50 9.20 8.40 8.80
8.92
8.85
9.55 8.55 8.90 8.80 8.90 8.70 9.00 9.10 9.05 9.05 8.85 9.00 8.80 9.50 9.40 9.20 8.75
8.91
8.94
9.50 8.80 9.00 8.90 9.00 8.85 9.30 9.10 9.00 9.15 9.10 9.10 8.70 9.90 9.40 8.60 8.55
9.00
9.03
9.45 8.80 9.05 8.80 9.00 8.90 8.75 9.25 9.05 9.20 9.10 9.15 9.20 9.00 9.50 8.90 8.95
9.18
9.09
1 December preceding year. 2 Individual State estimates not available for the 33 Other States.
Hogs and Pigs Final Estimates 2003-2007 Agricultural Statistics Board March 2009 25 NASS, USDA
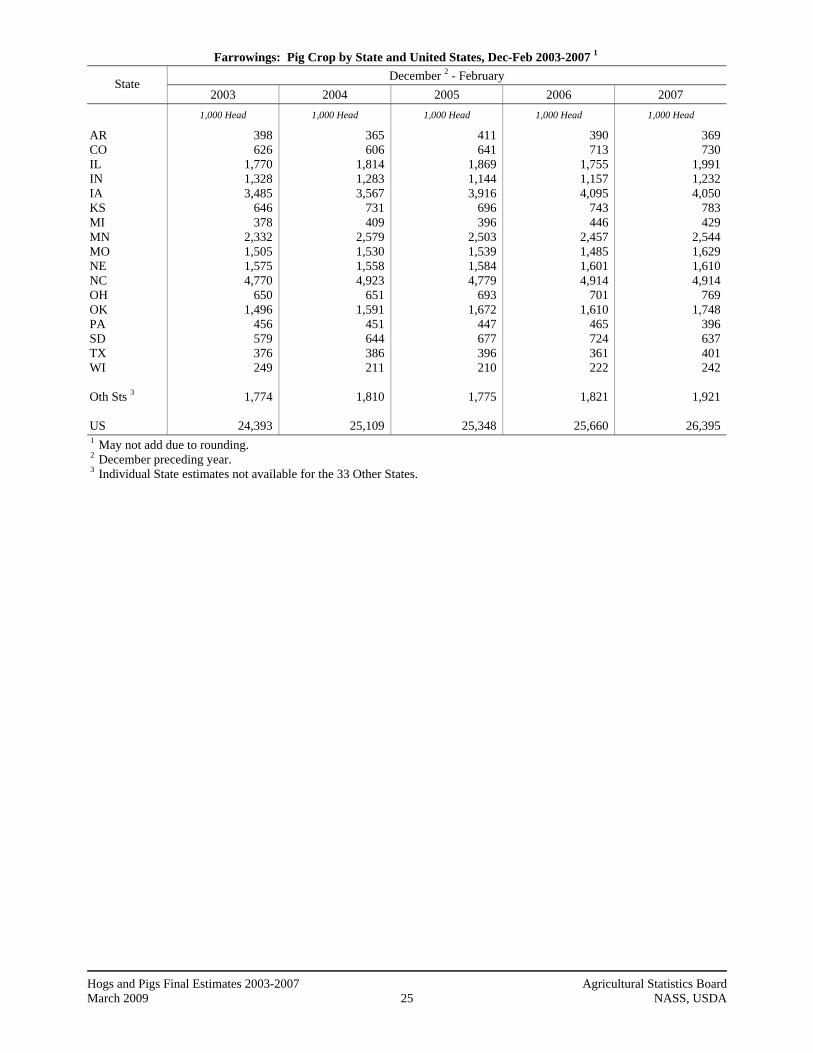
Farrowings: Pig Crop by State and United States, Dec-Feb 2003-2007 1 December 2 - February State
2003 2004 2005 2006 2007
1,000 Head 1,000 Head 1,000 Head 1,000 Head 1,000 Head
AR CO IL IN IA KS MI MN MO NE NC OH OK PA SD TX WI Oth Sts 3 US
398 626
1,770 1,328 3,485
646 378
2,332 1,505 1,575 4,770
650 1,496
456 579 376 249
1,774
24,393
365 606
1,814 1,283 3,567
731 409
2,579 1,530 1,558 4,923
651 1,591
451 644 386 211
1,810
25,109
411 641
1,869 1,144 3,916
696 396
2,503 1,539 1,584 4,779
693 1,672
447 677 396 210
1,775
25,348
390 713
1,755 1,157 4,095
743 446
2,457 1,485 1,601 4,914
701 1,610
465 724 361 222
1,821
25,660
369 730
1,991 1,232 4,050
783 429
2,544 1,629 1,610 4,914
769 1,748
396 637 401 242
1,921
26,395
1 May not add due to rounding. 2 December preceding year. 3 Individual State estimates not available for the 33 Other States.
Hogs and Pigs Final Estimates 2003-2007 Agricultural Statistics Board March 2009 26 NASS, USDA
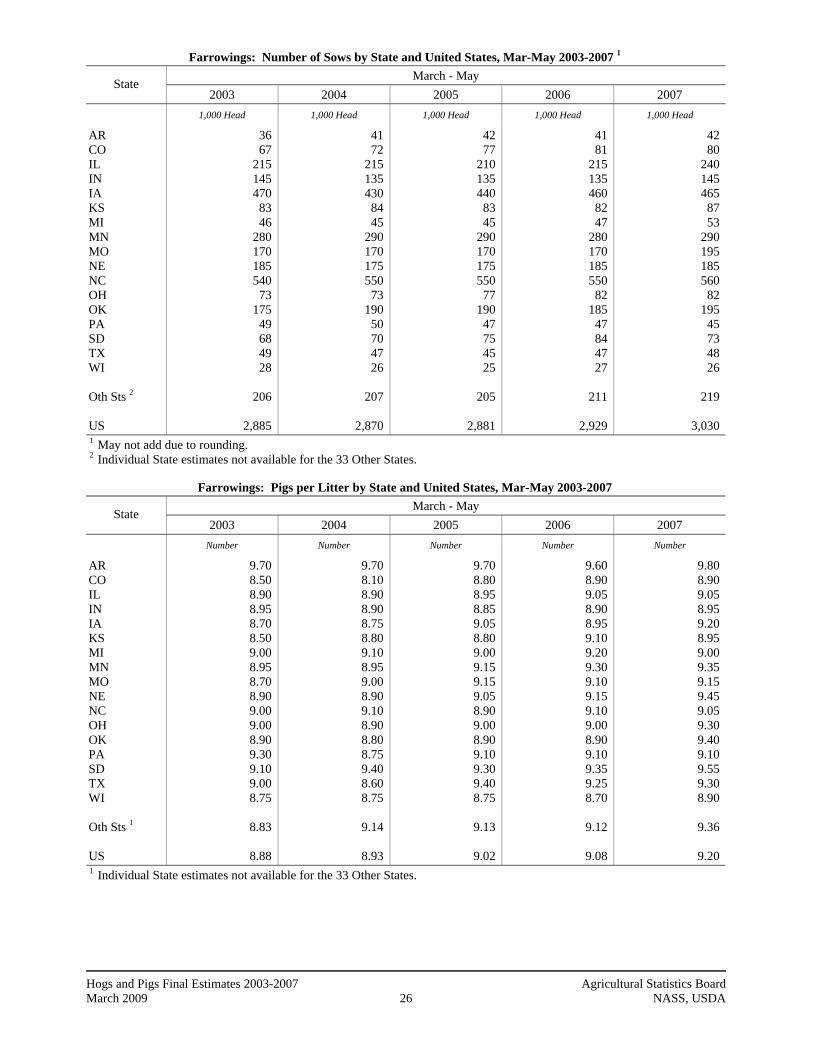
Farrowings: Number of Sows by State and United States, Mar-May 2003-2007 1 March - May State
2003 2004 2005 2006 2007
1,000 Head 1,000 Head 1,000 Head 1,000 Head 1,000 Head
AR CO IL IN IA KS MI MN MO NE NC OH OK PA SD TX WI Oth Sts 2 US
36 67
215 145 470
83 46
280 170 185 540
73 175
49 68 49 28
206
2,885
41 72
215 135 430 84 45
290 170 175 550 73
190 50 70 47 26
207
2,870
42 77
210 135 440 83 45
290 170 175 550 77
190 47 75 45 25
205
2,881
41 81
215 135 460 82 47
280 170 185 550 82
185 47 84 47 27
211
2,929
42 80
240 145 465 87 53
290 195 185 560 82
195 45 73 48 26
219
3,030
1 May not add due to rounding. 2 Individual State estimates not available for the 33 Other States.
Farrowings: Pigs per Litter by State and United States, Mar-May 2003-2007 March - May State
2003 2004 2005 2006 2007
Number Number Number Number Number
AR CO IL IN IA KS MI MN MO NE NC OH OK PA SD TX WI Oth Sts 1 US
9.70 8.50 8.90 8.95 8.70 8.50 9.00 8.95 8.70 8.90 9.00 9.00 8.90 9.30 9.10 9.00 8.75
8.83
8.88
9.70 8.10 8.90 8.90 8.75 8.80 9.10 8.95 9.00 8.90 9.10 8.90 8.80 8.75 9.40 8.60 8.75
9.14
8.93
9.70 8.80 8.95 8.85 9.05 8.80 9.00 9.15 9.15 9.05 8.90 9.00 8.90 9.10 9.30 9.40 8.75
9.13
9.02
9.60 8.90 9.05 8.90 8.95 9.10 9.20 9.30 9.10 9.15 9.10 9.00 8.90 9.10 9.35 9.25 8.70
9.12
9.08
9.80 8.90 9.05 8.95 9.20 8.95 9.00 9.35 9.15 9.45 9.05 9.30 9.40 9.10 9.55 9.30 8.90
9.36
9.20
1 Individual State estimates not available for the 33 Other States.

Hogs and Pigs Final Estimates 2003-2007 Agricultural Statistics Board March 2009 27 NASS, USDA
Farrowings: Pig Crop by State and United States, Mar-May 2003-2007 1 March - May State
2003 2004 2005 2006 2007
1,000 Head 1,000 Head 1,000 Head 1,000 Head 1,000 Head
AR CO IL IN IA KS MI MN MO NE NC OH OK PA SD TX WI Oth Sts 2 US
349 570
1,914 1,298 4,089
706 414
2,506 1,479 1,647 4,860
657 1,558
456 619 441 245
1,822
25,630
398 583
1,914 1,202 3,763
739 410
2,596 1,530 1,558 5,005
650 1,672
438 658 404 228
1,891
25,639
407 678
1,880 1,195 3,982
730 405
2,654 1,556 1,584 4,895
693 1,691
428 698 423 219
1,873
25,991
394 721
1,946 1,202 4,117
746 432
2,604 1,547 1,693 5,005
738 1,647
428 785 435 235
1,924
26,599
412 712
2,172 1,298 4,278
779 477
2,712 1,784 1,748 5,068
763 1,833
410 697 446 231
2,050
27,870
1 May not add due to rounding. 2 Individual State estimates not available for the 33 Other States.

Hogs and Pigs Final Estimates 2003-2007 Agricultural Statistics Board March 2009 28 NASS, USDA
Farrowings: Number of Sows by State and United States, Jun-Aug 2003-2007 1 June - August State
2003 2004 2005 2006 2007
1,000 Head 1,000 Head 1,000 Head 1,000 Head 1,000 Head
AR CO IL IN IA KS MI MN MO NE NC OH OK PA SD TX WI Oth Sts 2 US
37 70
215 150 460
80 47
275 170 185 560
76 185
51 70 49 29
208
2,917
43 70
210 140 440 87 48
285 170 175 560 75
195 46 68 56 24
213
2,905
44 81
205 140 460 83 48
280 170 175 560 78
200 47 71 45 25
205
2,917
40 82
210 140 450 85 48
280 170 170 560 84
190 45 77 48 26
207
2,912
46 83
245 150 480 90 55
295 195 200 580 86
195 48 83 58 26
218
3,133
1 May not add due to rounding. 2 Individual State estimates not available for the 33 Other States.
Farrowings: Pigs per Litter by State and United States, Jun-Aug 2003-2007 June - August State
2003 2004 2005 2006 2007
Number Number Number Number Number
AR CO IL IN IA KS MI MN MO NE NC OH OK PA SD TX WI Oth Sts 1 US
9.60 8.70 8.85 8.95 8.70 8.75 9.00 8.90 9.00 8.80 9.00 8.90 9.00 9.40 9.30 8.70 8.60
8.89
8.90
9.40 8.40 8.90 9.00 8.90 8.80 9.20 9.05 9.00 8.90 9.15 8.90 9.00 9.20 9.30 9.05 8.85
9.08
9.01
9.60 8.80 8.90 8.90 9.00 8.80 9.25 9.30 9.05 9.05 9.10 9.10 8.90 9.40 9.40 9.10 8.70
9.13
9.06
9.70 9.00 9.05 8.95 9.05 8.75 9.15 9.25 9.05 9.15 9.10 9.15 9.00 8.80 9.40 9.60 8.80
9.24
9.11
9.70 9.15 9.15 9.10 9.30 9.00 9.20 9.50 9.30 9.50 9.10 9.40 9.35 9.60 9.60 9.05 8.90
9.49
9.29
1 Individual State estimates not available for the 33 Other States.

Hogs and Pigs Final Estimates 2003-2007 Agricultural Statistics Board March 2009 29 NASS, USDA
Farrowings: Pig Crop by State and United States, Jun-Aug 2003-2007 1 June - August State
2003 2004 2005 2006 2007
1,000 Head 1,000 Head 1,000 Head 1,000 Head 1,000 Head
AR CO IL IN IA KS MI MN MO NE NC OH OK PA SD TX WI Oth Sts 2 US
355 609
1,903 1,343 4,002
700 423
2,448 1,530 1,628 5,040
676 1,665
479 651 426 249
1,847
25,974
404 588
1,869 1,260 3,916
766 442
2,579 1,530 1,558 5,124
668 1,755
423 632 507 212
1,932
26,165
422 713
1,825 1,246 4,140
730 444
2,604 1,539 1,584 5,096
710 1,780
442 667 410 218
1,876
26,446
388 738
1,901 1,253 4,073
744 439
2,590 1,539 1,556 5,096
769 1,710
396 724 461 229
1,913
26,519
446 759
2,242 1,365 4,464
810 506
2,803 1,814 1,900 5,278
808 1,823
461 797 525 231
2,063
29,095
1 May not add due to rounding. 2 Individual State estimates not available for the 33 Other States.

Hogs and Pigs Final Estimates 2003-2007 Agricultural Statistics Board March 2009 30 NASS, USDA
Farrowings: Number of Sows by State and United States, Sep-Nov 2003-2007 1 September - November State
2003 2004 2005 2006 2007
1,000 Head 1,000 Head 1,000 Head 1,000 Head 1,000 Head
AR CO IL IN IA KS MI MN MO NE NC OH OK PA SD TX WI Oth Sts 2 US
35 70
205 145 440
81 51
280 175 185 540
74 185
51 70 33 26
208
2,854
42 73
210 135 460 82 46
285 170 170 550 77
190 49 71 46 25
206
2,887
42 81
200 135 455 84 47
280 175 175 550 81
190 47 81 44 27
206
2,900
38 84
220 140 480 87 50
280 175 180 550 83
185 43 71 45 29
209
2,949
44 83
245 155 540 89 53
295 195 195 570 86
190 51 90 58 26
215
3,180
1 May not add due to rounding. 2 Individual State estimates not available for the 33 Other States.
Farrowings: Pigs per Litter by State and United States, Sep-Nov 2003-2007 September - November State
2003 2004 2005 2006 2007
Number Number Number Number Number
AR CO IL IN IA KS MI MN MO NE NC OH OK PA SD TX WI Oth Sts 1 US
9.50 8.40 8.85 8.85 8.80 8.75 8.80 9.00 9.10 9.00 9.10 8.80 8.70 9.50 9.10 8.20 8.70
8.94
8.93
9.50 8.45 8.85 8.85 8.90 8.80 9.20 9.10 8.95 9.00 9.00 9.00 8.90 9.50 9.20 8.95 8.80
8.91
8.96
9.70 8.80 8.85 9.00 9.00 8.70 9.20 9.25 9.00 9.05 9.00 9.10 8.90 9.80 9.30 8.90 8.65
9.04
9.03
9.75 8.80 9.10 8.90 9.05 8.85 8.95 9.30 9.00 9.25 9.15 9.20 9.00 9.00 9.45 8.95 8.90
9.13
9.11
9.80 9.05 9.25 9.00 9.30 9.15 9.45 9.30 9.30 9.55 9.20 9.45 9.20 9.10 9.55 9.35 8.90
9.37
9.28
1 Individual State estimates not available for the 33 Other States.

Hogs and Pigs Final Estimates 2003-2007 Agricultural Statistics Board March 2009 31 NASS, USDA
Farrowings: Pig Crop by State and United States, Sep-Nov 2003-2007 1 September - November State
2003 2004 2005 2006 2007
1,000 Head 1,000 Head 1,000 Head 1,000 Head 1,000 Head
AR CO IL IN IA KS MI MN MO NE NC OH OK PA SD TX WI Oth Sts 2 US
333 588
1,814 1,283 3,872
709 449
2,520 1,593 1,665 4,914
651 1,610
485 637 271 226
1,864
25,484
399 617
1,859 1,195 4,094
722 423
2,594 1,522 1,530 4,950
693 1,691
466 653 412 220
1,834
25,874
407 713
1,770 1,215 4,095
731 432
2,590 1,575 1,584 4,950
737 1,691
461 753 392 234
1,860
26,190
371 739
2,002 1,246 4,344
770 448
2,604 1,575 1,665 5,033
764 1,665
387 671 403 258
1,910
26,855
431 751
2,266 1,395 5,022
814 501
2,744 1,814 1,862 5,244
813 1,748
464 860 542 231
2,011
29,513
1 May not add due to rounding. 2 Individual State estimates not available for the 33 Other States.

Hogs and Pigs Final Estimates 2003-2007 Agricultural Statistics Board March 2009 32 NASS, USDA
Annual Farrowings: Number of Sows, by State and United States, December-November 2003-2007 1 2
State 2003 2004 2005 2006 2007
1,000 Head 1,000 Head 1,000 Head 1,000 Head 1,000 Head
AL AK AZ AR CA CO CT DE FL GA HI ID IL IN IA KS KY LA ME MD MA MI MN MS MO MT NE NV NH NJ NM NY NC ND OH OK OR PA RI SC SD TN TX UT VT VA WA WV WI WY US
25.0 0.32 30.0 149
34.0 282
0.70 6.00
10.00 96.0 4.30 5.90 835 590
1,780 320
75.0 4.60 1.80 8.00 2.30 187
1,100 60.0 685
37.0 735
0.68 0.80 0.80 0.40
14.00 2,170
45.0 296 715
6.40 200
0.50 53.0 272
51.0 174
136.0 0.50 61.0 4.50 2.50 112
45.0
11,425
29.0 0.38 32.0 164
39.0 288
0.80 6.00 8.00 91.0 4.30 3.80 840 555
1,740 337
85.0 4.20 1.40 8.00 1.90 185
1,145 61.5 680
32.5 695
0.76 0.80 1.10 0.40
16.80 2,210 46.0 299 760
6.40 198
0.50 52.0 279
43.0 195
142.0 0.50 59.0 4.80 2.30 99.0 43.0
11,497
32.0 0.32 30.0 171
32.0 314
0.60 6.00 8.00 84.0 4.00 3.90 825 540
1,795 330
78.0 3.60 1.60
10.00 2.50 184
1,125 70.0 685
33.0 700
0.66 0.70 0.40 0.40
14.60 2,200 48.0 313 770
5.80 188
0.50 54.0 299
40.0 177
139.0 0.50 59.0 6.40 2.10 101
44.0
11,533
32.0 0.26 31.0 160
33.0 328
0.60 6.00 8.00 83.0 3.40 5.60 840 545
1,845 338
75.0 3.70 1.30 8.00 1.60 193
1,110 74.5 680
34.0 710
0.62 0.60 0.90 0.40
15.60 2,200 54.5 326 745
5.70 182
0.60 55.0 309
37.0 182
144.0 0.60 62.0 5.60 2.20 108
43.5
11,631
33.0 0.25 32.0 171
33.0 329
0.70 6.00 8.00 75.0 3.20 8.00 950 590
1,935 354
75.0 3.00 1.30 8.00 1.60 210
1,155 75.5 765
33.5 755
0.58 0.60 1.00 0.40
18.00 2,250 62.0 338 770
5.40 188
0.60 52.0 313
43.0 209
160.0 0.70 59.0 5.20 1.90 105
53.0
12,247 1 May not add due to rounding. 2 December preceding year.

Hogs and Pigs Final Estimates 2003-2007 Agricultural Statistics Board March 2009 33 NASS, USDA
Annual Farrowings: Pigs Per Litter by State and United States, December-November 2003-2007 1
State 2003 2004 2005 2006 2007
Number Number Number Number Number
AL AK AZ AR CA CO CT DE FL GA HI ID IL IN IA KS KY LA ME MD MA MI MN MS MO MT NE NV NH NJ NM NY NC ND OH OK OR PA RI SC SD TN TX UT VT VA WA WV WI WY US
8.80 9.28 8.33 9.63 9.44 8.49 8.10 8.67 7.00 8.81 7.21 8.31 8.86 8.90 8.68 8.63 8.59 7.39 7.00 8.00 7.90 8.90 8.91 8.60 8.92 9.14 8.86 7.66 6.50 7.00 7.50 9.14 9.02 9.16 8.90 8.85 8.44 9.38 7.00 9.00 9.14 8.41 8.70 9.35 7.50 9.38 8.44 7.40 8.65 9.02
8.88
8.83 8.39 9.34 9.55 9.03 8.31 7.60 9.17 7.50 8.75 7.21 8.95 8.88 8.90 8.82 8.78 8.96 7.14 7.10 8.00 7.80 9.10 9.04 8.78 8.99 9.57 8.93 7.83 6.60 7.00 7.50 9.88 9.05 9.50 8.90 8.83 7.50 8.98 7.50 9.46 9.27 8.28 8.76 9.30 7.70 9.42 8.75 7.91 8.80 8.79
8.94
8.91 9.41 9.20 9.63 9.56 8.74 8.10 9.33 7.25 8.81 7.00 8.72 8.90 8.89 8.99 8.75 8.92 7.50 7.30 8.40 8.08 9.11 9.20 8.86 9.06 9.67 9.05 7.45 8.00 7.00 8.50 8.90 8.96 9.48 9.05 8.88 6.72 9.46 8.50 9.30 9.35 8.58 9.16 9.53 7.70 9.22 8.44 7.00 8.72 8.73
9.02
8.66 9.19 9.00 9.64
10.00 8.88 7.60 9.33 7.00 8.90 7.35 8.93 9.05 8.91 9.01 8.88 9.08 7.03 6.40 8.00 8.30 9.15 9.24 9.33 9.04 9.56 9.18 7.45 7.00 6.33 8.50 9.55 9.11 9.60 9.12 8.90 8.25 9.21 8.00 9.24 9.40 8.89 9.12 9.48 7.70 8.84 8.57 7.00 8.74 8.67
9.08
8.73 9.20 9.47 9.70
10.15 8.97 7.80 9.33 7.00 8.91 7.50 8.88 9.13 8.97 9.21 9.00 9.35 6.97 6.80 7.75 7.50 9.11 9.35 9.46 9.20
10.06 9.43 7.29 7.50 7.00 8.00 9.78 9.11 9.85 9.33 9.29 8.15 9.21 7.90 9.10 9.56 9.07 9.16 9.78 7.40 9.31 8.08 7.58 8.90 9.21
9.22
1 December preceding year.

Hogs and Pigs Final Estimates 2003-2007 Agricultural Statistics Board March 2009 34 NASS, USDA
Annual Farrowings: Pig Crop by State and United States, December-November 2003-2007 1 2
State 2003 2004 2005 2006 2007
1,000 Head 1,000 Head 1,000 Head 1,000 Head 1,000 Head
AL AK AZ AR CA CO CT DE FL GA HI ID IL IN IA KS KY LA ME MD MA MI MN MS MO MT NE NV NH NJ NM NY NC ND OH OK OR PA RI SC SD TN TX UT VT VA WA WV WI WY US
220.0 2.97
250.0 1,435 321.0 2,393
5.67 52.00 70.00 846.0 31.00 49.00 7,401 5,252
15,448 2,761 644.0 34.00 12.60 64.00 18.17 1,664 9,806 516.0 6,107 338.0 6,515
5.21 5.20 5.60 3.00
128.00 19,584
412.0 2,634 6,329 54.00 1,876
3.50 477.0 2,486 429.0 1,514
1,272.0 3.75
572.0 38.00 18.50
969 406.0
101,481
256.0 3.19
299.0 1,566 352.0 2,394 6.08
55.00 60.00 796.0 31.00 34.00 7,456 4,940
15,340 2,958 762.0 30.00 9.94
64.00 14.82 1,684
10,348 540.0 6,112 311.0 6,204 5.95 5.28 7.70 3.00
166.00 20,002 437.0 2,662 6,709 48.00 1,778 3.75
492.0 2,587 356.0 1,709
1,320.0 3.85
556.0 42.00 18.20
871 378.0
102,787
285.0 3.01
276.0 1,647 306.0 2,745 4.86
56.00 58.00 740.0 28.00 34.00 7,344 4,800
16,133 2,887 696.0 27.00 11.68 84.00 20.20 1,677
10,351 620.0 6,209 319.0 6,336 4.92 5.60 2.80 3.40
130.00 19,720 455.0 2,833 6,834 39.00 1,778 4.25
502.0 2,795 343.0 1,621
1,325.0 3.85
544.0 54.00 14.70
881 384.0
103,975
277.0 2.39
279.0 1,543 330.0 2,911 4.56
56.00 56.00 739.0 25.00 50.00 7,604 4,858
16,629 3,003 681.0 26.00
8.32 64.00 13.28 1,765
10,255 695.0 6,146 325.0 6,515 4.62 4.20 5.70 3.40
149.00 20,048 523.0 2,972 6,632 47.00 1,676 4.80
508.0 2,904 329.0 1,660
1,365.0 4.62
548.0 48.00 15.40
944 377.0
105,633
288.0 2.30
303.0 1,658 335.0 2,952 5.46
56.00 56.00 668.0 24.00 71.00 8,671 5,290
17,814 3,186 701.0 20.90 8.84
62.00 12.00 1,913
10,803 714.0 7,041 337.0 7,120 4.23 4.50 7.00 3.20
176.00 20,504 611.0 3,153 7,152 44.00 1,731 4.74
473.0 2,991 390.0 1,914
1,565.0 5.18
549.0 42.00 14.40
935 488.0
112,874
1 May not add due to rounding. 2 December preceding year.

Hogs and Pigs Final Estimates 2003-2007 Agricultural Statistics Board March 2009 35 NASS, USDA
Information Contacts Listed below are the commodity specialists in the Livestock Branch of the National Agricultural Statistics Service to contact for additional information. Dan Kerestes, Chief, Livestock Branch ........................................................................ (202) 720-3570 Livestock Section Scott Hollis, Head, Livestock Section ........................................................................... (202) 690-2424 Jim Collom - Dairy Products ............................................................................ (202) 690-3236 Joe Gaynor - Dairy Products Prices .................................................................. (202) 690-2168 Jason Hardegree - Cattle, Cattle on Feed .......................................................... (202) 720-3040 Sherry Bertramsen - Livestock Slaughter ......................................................... (515) 284-4340 Everett Olbert - Sheep and Goats ..................................................................... (202) 720-4751 Mike Miller - Milk Production and Milk Cows ................................................ (202) 720-3278 Nick Streff - Hogs and Pigs .............................................................................. (202) 720-3106
Hogs and Pigs Final Estimates 2003-2007 Agricultural Statistics Board March 2009 36 NASS, USDA
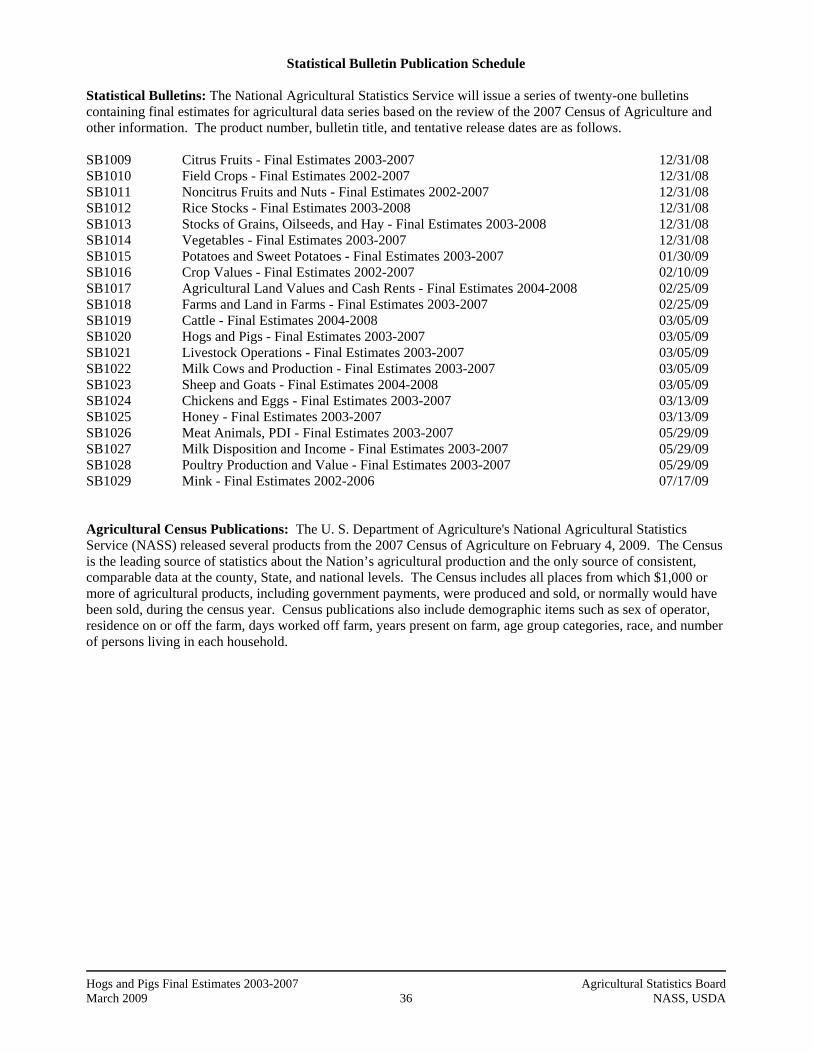
Statistical Bulletin Publication Schedule
Statistical Bulletins: The National Agricultural Statistics Service will issue a series of twenty-one bulletins containing final estimates for agricultural data series based on the review of the 2007 Census of Agriculture and other information. The product number, bulletin title, and tentative release dates are as follows. SB1009 Citrus Fruits - Final Estimates 2003-2007 12/31/08 SB1010 Field Crops - Final Estimates 2002-2007 12/31/08 SB1011 Noncitrus Fruits and Nuts - Final Estimates 2002-2007 12/31/08 SB1012 Rice Stocks - Final Estimates 2003-2008 12/31/08 SB1013 Stocks of Grains, Oilseeds, and Hay - Final Estimates 2003-2008 12/31/08 SB1014 Vegetables - Final Estimates 2003-2007 12/31/08 SB1015 Potatoes and Sweet Potatoes - Final Estimates 2003-2007 01/30/09 SB1016 Crop Values - Final Estimates 2002-2007 02/10/09 SB1017 Agricultural Land Values and Cash Rents - Final Estimates 2004-2008 02/25/09 SB1018 Farms and Land in Farms - Final Estimates 2003-2007 02/25/09 SB1019 Cattle - Final Estimates 2004-2008 03/05/09 SB1020 Hogs and Pigs - Final Estimates 2003-2007 03/05/09 SB1021 Livestock Operations - Final Estimates 2003-2007 03/05/09 SB1022 Milk Cows and Production - Final Estimates 2003-2007 03/05/09 SB1023 Sheep and Goats - Final Estimates 2004-2008 03/05/09 SB1024 Chickens and Eggs - Final Estimates 2003-2007 03/13/09 SB1025 Honey - Final Estimates 2003-2007 03/13/09 SB1026 Meat Animals, PDI - Final Estimates 2003-2007 05/29/09 SB1027 Milk Disposition and Income - Final Estimates 2003-2007 05/29/09 SB1028 Poultry Production and Value - Final Estimates 2003-2007 05/29/09 SB1029 Mink - Final Estimates 2002-2006 07/17/09 Agricultural Census Publications: The U. S. Department of Agriculture's National Agricultural Statistics Service (NASS) released several products from the 2007 Census of Agriculture on February 4, 2009. The Census is the leading source of statistics about the Nation’s agricultural production and the only source of consistent, comparable data at the county, State, and national levels. The Census includes all places from which $1,000 or more of agricultural products, including government payments, were produced and sold, or normally would have been sold, during the census year. Census publications also include demographic items such as sex of operator, residence on or off the farm, days worked off farm, years present on farm, age group categories, race, and number of persons living in each household.

ACCESS TO REPORTS!! For your convenience, there are several ways to obtain NASS reports, data products, and services:
INTERNET ACCESS All NASS reports are available free of charge on the worldwide Internet. For access, connect to the Internet and go to the NASS Home Page at: www.nass.usda.gov.
E-MAIL SUBSCRIPTION All NASS reports are available by subscription free of charge direct to your e-mail address. Starting with the NASS Home Page at www.nass.usda.gov, under the right navigation, Receive reports by Email, click on National or State. Follow the instructions on the screen.
- - - - - - - - - - - - - - - - - - - - - - - - - - - - - - - - -
PRINTED REPORTS OR DATA PRODUCTS
CALL OUR TOLL-FREE ORDER DESK: 800-999-6779 (U.S. and Canada) Other areas, please call 703-605-6220 FAX: 703-605-6900
(Visa, MasterCard, check, or money order acceptable for payment.)
- - - - - - - - - - - - - - - - - - - - - - - - - - - - - - - - - -
ASSISTANCE For assistance with general agricultural statistics or further information about NASS or its products or services, contact the Agricultural Statistics Hotline at 800-727-9540, 7:30 a.m. to 4:00 p.m. ET, or e-mail: [email protected]. The U.S. Department of Agriculture (USDA) prohibits discrimination in all its programs and activities on the basis of race, color, national origin, age, disability, and where applicable, sex, marital status, familial status, parental status, religion, sexual orientation, genetic information, political beliefs, reprisal, or because all or a part of an individual’s income is derived from any public assistance program. (Not all prohibited bases apply to all programs.) Persons with disabilities who require alternative means for communication of program information (Braille, large print, audiotape, etc.) should contact USDA’s TARGET Center at (202) 720-2600 (voice and TDD). To file a complaint of discrimination, write to USDA, Director, Office of Civil Rights, 1400 Independence Avenue, S.W., Washington, D.C. 20250-9410, or call (800) 795-3272 (voice) or (202) 720-6382 (TDD). USDA is an equal opportunity provider and employer.