Embed Size (px)
Citation preview
HM Sultan Qaboos Bin Said, Sultan of Oman

Oman Fisheries Co. S.A.O.G
Twentysixth Annual Report2014 - 2015
INDEX Page
Board Members i
Chairman’s Report ii-iii
Report of the Shareholders of Factual Findings iv
Report on Corporate Governance v-xi
Management Discussion and Analysis Report xii-xvii
Report of the auditors 1-2
Consolidated statement of financial position 3
Consolidated statement of profit or loss and other comprehensive income 4
Consolidated statement of changes in equity 5
Consolidated statement of cash flows 6
Notes to the consolidated financial statements 7-32
Oman Fisheries Co. S.A.O.G
i
Saleh bin Nasser bin Juma Al AraimiDeputy Chairman
Sheikh Mohammed bin Hamad bin Ali Al Masrouri Chairman
Qais bin Mahmood bin Abdalla Al KhonjiDirector
Abdul Ameer bin Said bin MohammedDirector
Musalam Amer Al AmmriDirector
Dr. Khalid Mansoor Sabil Al Zadjali Director
Oman Fisheries Co. S.A.O.G
Sheikh Salah bin Hilal bin Naser Al MawaliDirector
Mal Allah Ali Yousuf Al ZadjaliDirector
BOARD MEMBERS
ii
CHAIRMAN REPORTDear Shareholders,
On behalf of the Board of Directors, I present the Company’s audited consolidated results for the Financial year ended 31st March 2015.
Turnover and summary of results:
The audited results of the Financial year ended 31st March 2015 represent the consolidation of Oman Fisheries co. SAOG, Oman Fisheries Co. FZE and Al Ameen Stores and Refrigeration LLC.
Your company has achieved the consolidated turnover of RO 23.89 Million in 2014-15 compared to the previous year turnover of RO 19.00 Million (26% increase for the same period). However there had been following hindrances;
1- Due to the decision from Ministry of Agriculture and Fisheries to ban some species for export, the stock increased for frozen species at the end of the period, without having any chance to sell in the local market. The Co. is however trying its level best to market these species in the local market.
2- The increase in operation expenses related to depreciation and staff costs and increase in the capacity by operating two new plants in Salalah and Shouqra and incremental Salary cost consequent to increment in SIS contribution.
3- The Co. is restricting purchase of cuttlefish in large quantities to ensure strict compliance to quality norms maintained with our customers.
As a result of the abovementioned challenges, the Co. incurred loss of RO 1.753,714 Million as compared to the loss of RO 711,021 K of previous year.
Human Resources Development and Omanisation:
The company is committed to train and employ more Omani nationals in all departments. Young Omanis are being recruited in jobs compatible to their experience and know-how within the company’s recruitment policy and nature of jobs in fisheries. One of the prime objectives of the new projects being initiated by the company is to provide employment opportunities indirectly for a number of Omani nationals in the fisheries sector.
Contribution to Food Security
As a part of supporting to Government’s initiative of food security and making available fish across the Sultanate of Oman, we had taken number of steps. In order to keep the fish prices under control during off season and Ramadan, we have reserved stock of 2,000 Mt. for the local consumption. We had made strategic plan to cover all the regions of the Sultanate.
Future outlook
The fish season is full swing. The stock built-up started in September14, will improvise the sales and profitability of the company in the coming periods.
iii
Company has planned to go ahead with pilot project on seaweeds farming on Government allocated area in sea. The company has initiated viability studies with government for identification of appropriate land. We are in process of technical, financial feasibility studies.
The Board of Directors is currently reviewing three years strategy for the company’s future
Plan to come out of the current losses.
The Board of Directors made decision to appoint a specialist company to analyze the present situation of the company and also to scrutinize the previous approved five year plan with current situation. The company to analise and evaluate the current 3 year strategic plan to provide us the areas for improvement in next 5 years.
Corporate Social Responsibility
On the Social front, the company had sponsored and supported many social events, local communities on their various initiatives. Your Company has been supporting to fishermen as interest free loan towards procurements of boats, engines and fishing equipments etc. This is being adjusted against the fish supplied by them. The company has supplied ice and bait to our fishermen.
Internal control systems:
The system of internal control of the Company is in line with the size of its operations, business activities and in conformity with the requirement of the Capital Market Authority. The Company had established in-house internal audit department who is directly reporting to the Board of Directors in addition to this Company had appointed PWC as internal auditor. The Internal Audit Committee formed by the Board of Directors reviews effectiveness of internal controls and interacts on regular basis with internal auditor to review their reports. Government of Sultanate of Oman is holding 24% stake in Company. Company is committed to follow laws and regulations set up through its Articles of Association and Capital Market Authority.
Acknowledgement
On behalf of the Board of Directors and Management of the Company, I wish to acknowledge and expressed my sincere gratitude to His Majesty Sultan Qaboos Bin Said and his Government for establishing good working environment in the fisheries sector and for taking good steps for food security in the Country. Further, on behalf of all of us I am sincerely thankful to the Ministry of Agricultural and Fisheries and all Government agencies for their continuous support to Oman Fisheries Co. SAOG.
Further, we are extending our thanks to, suppliers, banks, customers the employees of the Company for their continuous efforts and we are wishing them all the success for the coming financial year.
Mohammed Bin Hamad Al Masrouri Abdul Amir Bin Said Bin Mohammed
Chairman Chairman-Internal Audit Committee
v
REPORT ON CORPORATE GOVERNANCE
The Company has implemented the Code of Corporate Governance during the financial year issued by the Capital Market Authorities.
1. Company Philosophy on Code of Corporate Governance
The Company has always believed in fair business and corporate practices while dealing with Shareholders, employees, Customers, Creditors and Others. The Company is prompt in discharging its statutory obligations and duties. The Company is maintaining policies, procedures and systems for the purposes to ensure the fair and timely release of information about the Company.
The Board of Directors (“the Board”) has had adequate representation of the qualified, Non-executive and Independent Directors. The Board has constituted various Committees of directors from time to time for the matters which require special attention. The Board has adequately empowered the Executive Management on all day-to-day matters, subject to the overall authority vested in the Board. The Directors attending the Board and Committee meetings and actively participate in their proceedings. The Company lays strong emphasis on audit and internal controls, having regard to the nature of the company’s business and has introduced suitable checks and balances to ensure sound integrity of the operations. The Company also lays a very high emphasis on total compliance with the various laws and regulations of the Country.
2. Board of Directors
As per the Article 19 of Articles of Association of the Company the strength of the Board is eight Directors, and all of them are Non executive and Independent among them 6 Directors are elected by shareholders during the AGM and 2 directors are appointed by resolution from the Cabinet.
The primary functions of the Company’s Board of directors in general include amongst others the following:
• To approve business and financial policies to meet the objectives of the Company and enhance shareholders value.
• Review and approve the Company’s annual budget / plans and monitoring corporate performance against the budget.
• Approve and implement the disclosure policy in compliance with regulatory requirements.
• Ensure compliance with regulatory requirements, policies, procedures and laws.
• Nominating members of subcommittees and defining their roles, responsibilities and authorities.
• Evaluate and appoint senior management executives.
• Review effectiveness of systems and procedure of internal controls.
• Constantly monitor and oversee the Corporation’s financial position, adherence to reporting standards and policy of public disclosure of material information.
To facilitate proper governance, the Company’s management places before the Board, at least, the minimum information as required by Article 4 of the Code of Corporate Governance.
The current Board of directors as on 31st March 2015 consists of 8 members, six of them were elected on 19th June 2012 and other two were appointed by the Cabinet. The details of them is as follows:
vi
REPORT ON CORPORATE GOVERNANCE
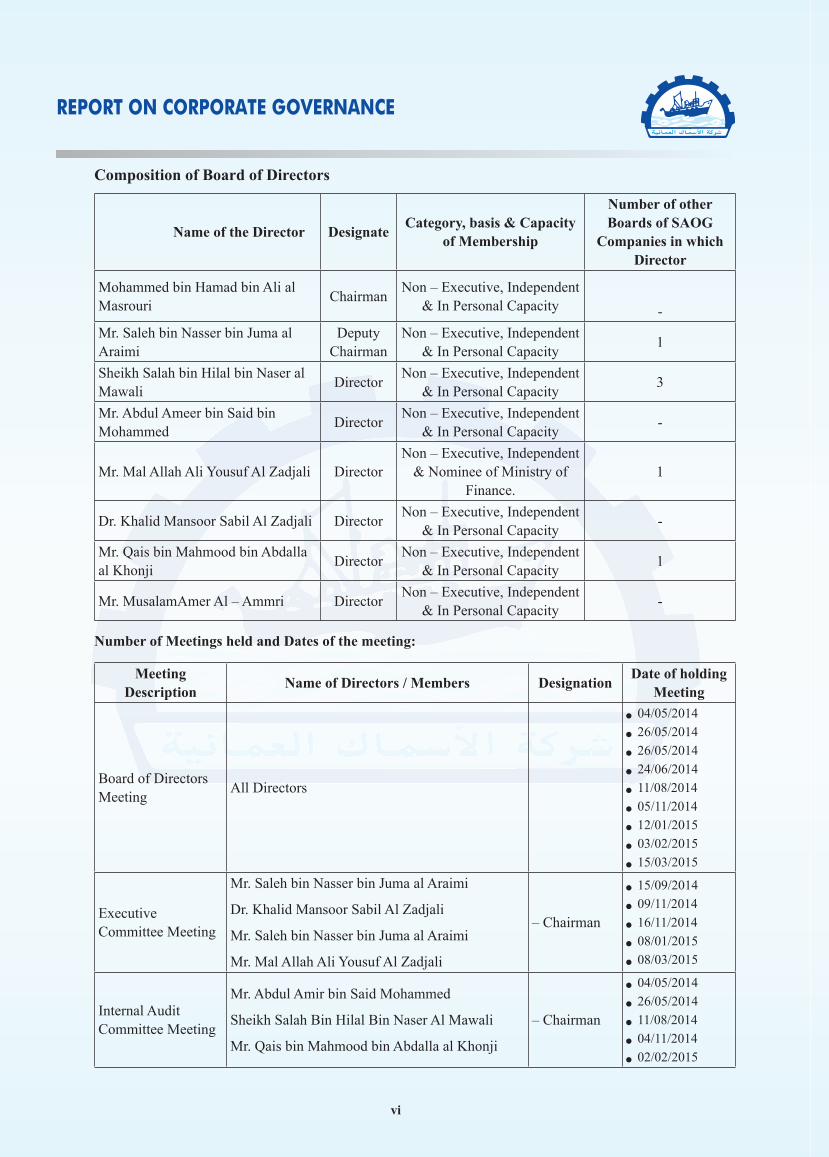
Composition of Board of Directors
Name of the Director DesignateCategory, basis & Capacity
of Membership
Number of other Boards of SAOG
Companies in which Director
Mohammed bin Hamad bin Ali al Masrouri
ChairmanNon – Executive, Independent
& In Personal Capacity -
Mr. Saleh bin Nasser bin Juma al Araimi
Deputy Chairman
Non – Executive, Independent & In Personal Capacity
1
Sheikh Salah bin Hilal bin Naser al Mawali
DirectorNon – Executive, Independent
& In Personal Capacity3
Mr. Abdul Ameer bin Said bin Mohammed
DirectorNon – Executive, Independent
& In Personal Capacity-
Mr. Mal Allah Ali Yousuf Al Zadjali DirectorNon – Executive, Independent
& Nominee of Ministry of Finance.
1
Dr. Khalid Mansoor Sabil Al Zadjali DirectorNon – Executive, Independent
& In Personal Capacity-
Mr. Qais bin Mahmood bin Abdalla al Khonji
DirectorNon – Executive, Independent
& In Personal Capacity1
Mr. MusalamAmer Al – Ammri DirectorNon – Executive, Independent
& In Personal Capacity-
Number of Meetings held and Dates of the meeting:
Meeting Description
Name of Directors / Members DesignationDate of holding
Meeting
Board of Directors Meeting
All Directors
04/05/2014 26/05/2014 26/05/2014 24/06/2014 11/08/2014 05/11/2014 12/01/2015 03/02/2015 15/03/2015
Executive Committee Meeting
Mr. Saleh bin Nasser bin Juma al Araimi
Dr. Khalid Mansoor Sabil Al Zadjali
Mr. Saleh bin Nasser bin Juma al Araimi
Mr. Mal Allah Ali Yousuf Al Zadjali
– Chairman
15/09/2014 09/11/2014 16/11/2014 08/01/2015 08/03/2015
Internal Audit Committee Meeting
Mr. Abdul Amir bin Said Mohammed
Sheikh Salah Bin Hilal Bin Naser Al Mawali
Mr. Qais bin Mahmood bin Abdalla al Khonji
– Chairman
04/05/2014 26/05/2014 11/08/2014 04/11/2014 02/02/2015
vii
REPORT ON CORPORATE GOVERNANCE
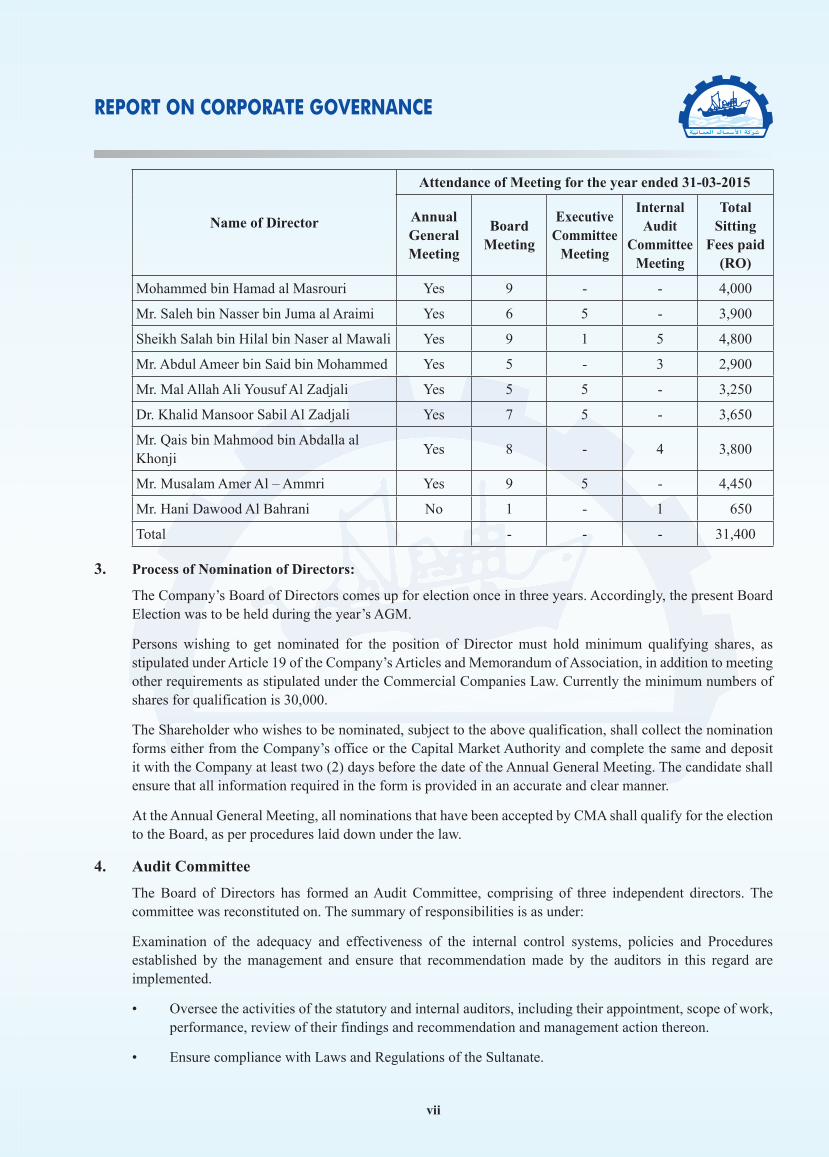
Name of Director
Attendance of Meeting for the year ended 31-03-2015
Annual General Meeting
Board Meeting
Executive Committee
Meeting
Internal Audit
Committee Meeting
Total Sitting
Fees paid (RO)
Mohammed bin Hamad al Masrouri Yes 9 - - 4,000
Mr. Saleh bin Nasser bin Juma al Araimi Yes 6 5 - 3,900
Sheikh Salah bin Hilal bin Naser al Mawali Yes 9 1 5 4,800
Mr. Abdul Ameer bin Said bin Mohammed Yes 5 - 3 2,900
Mr. Mal Allah Ali Yousuf Al Zadjali Yes 5 5 - 3,250
Dr. Khalid Mansoor Sabil Al Zadjali Yes 7 5 - 3,650
Mr. Qais bin Mahmood bin Abdalla al Khonji
Yes 8 - 4 3,800
Mr. Musalam Amer Al – Ammri Yes 9 5 - 4,450
Mr. Hani Dawood Al Bahrani No 1 - 1 650
Total - - - 31,400
3. Process of Nomination of Directors:
The Company’s Board of Directors comes up for election once in three years. Accordingly, the present Board Election was to be held during the year’s AGM.
Persons wishing to get nominated for the position of Director must hold minimum qualifying shares, as stipulated under Article 19 of the Company’s Articles and Memorandum of Association, in addition to meeting other requirements as stipulated under the Commercial Companies Law. Currently the minimum numbers of shares for qualification is 30,000.
The Shareholder who wishes to be nominated, subject to the above qualification, shall collect the nomination forms either from the Company’s office or the Capital Market Authority and complete the same and deposit it with the Company at least two (2) days before the date of the Annual General Meeting. The candidate shall ensure that all information required in the form is provided in an accurate and clear manner.
At the Annual General Meeting, all nominations that have been accepted by CMA shall qualify for the election to the Board, as per procedures laid down under the law.
4. Audit Committee
The Board of Directors has formed an Audit Committee, comprising of three independent directors. The committee was reconstituted on. The summary of responsibilities is as under:
Examination of the adequacy and effectiveness of the internal control systems, policies and Procedures established by the management and ensure that recommendation made by the auditors in this regard are implemented.
• Oversee the activities of the statutory and internal auditors, including their appointment, scope of work, performance, review of their findings and recommendation and management action thereon.
• Ensure compliance with Laws and Regulations of the Sultanate.
viii
REPORT ON CORPORATE GOVERNANCE
• Report to the Board regarding committee activities and recommendations and keep the Board aware of matters affecting the business affairs and financial condition of the Company.
• Authorize the implementation of the Board’s strategy.
• Oversee the implementation of the Board’s strategy.
• Considering the name of the auditor in the context of their independence, fees and terms of engagement and recommending their name to the board for putting before the AGM for appointment.
• Review the audit plan and results of the audit and whether auditors have full access to all relevant documents.
• Checking the financial fraud particularly fictitious and fraudulent portion of the financial statements.
• Review the quarterly and yearly financial statements before issues, review of qualifications in the draft financial statements and discussion of accounting principles. In particular, change in accounting policies, principles and accounting estimates in comparison to previous year, any adoption of new accounting policy, any departure from International Accounting Standards (IAS) and non-compliance with disclosure requirements prescribed by the CMA.
• Serving as a channel of communication between external auditors and the board and also internal auditors and the board.
• Reviewing risk management policies and looking into the reasons of defaults in payment obligations of the company.
• Reviewing the specific transactions with related parties for making suitable recommendations to the board and setting rules for entering the small values transactions with related parties without obtaining the prior approval of audit committee and the board.
5. Executive Committee
The Board Executive Committee, which comprises of 4 directors, is chaired by the Dy. Chairman to the Board of Directors and meets as and when required. The objective of the Executive Committee is to discharge responsibilities on behalf of the board in deciding on specific and any other matters. The Executive Committee also reviews and recommends to the Board of Directors the annual budget of the Company.
6. Remuneration Matters
• Sitting Fees of RO 31,400 was paid to the directors during the year. During this year Board of directors had proposed remuneration of RO 18,600 (P.Y. 25,650).
• The top six senior executives of the Company have received a total amount of R.O. 131,896/- The above includes salary, benefits, bonuses, gratuity, etc.
• There are no incentives payable to the above based on performance criteria.
• Consolidated audit fees payable for the financial year 2014-15 is RO. 11,525/-
7. Details of Non-Compliance by the Company.
There were no penalties or strictures imposed on the Company by MSM/CMA or any statutory authority for the last 3 years. There are no areas in which company is not compliant with the code of Corporate Governance.
ix
REPORT ON CORPORATE GOVERNANCE
8. Means of Communication with the Shareholders
a) Quarterly results are published in Arabic and English local newspaper and the Shareholders are notified that the detailed accounts will be sent to any Shareholder who requests the same.
b) Annual Reports containing the audited financial statements together with the Chairman’s Report, Related Party Transactions and invitation to attend the AGM are sent by registered Post to all shareholders.
c) Management Discussion and Analysis Report is a part of this Annual report.
d) The company has its own website and the information relating to the Company products and facilities are posted on the website for all interested parties. The company’s website is www.omanfisheries.com
9. Market Data
a) The following table depicts the high, and low of company’s share traded during the financial year ended 31st March 2015with month end general index.
MONTH HIGH LOW MSM Index
Apr-14 0.097 0.097 6,727
May-14 0.086 0.084 6,857
Jun-14 0.093 0.088 7,008
Jul-14 0.093 0.092 7,200
Aug-14 0.090 0.090 7,367
Sep-14 0.086 0.085 7,484
Oct-14 0.075 0.073 6,975
Nov-14 0.070 0.065 6,506
Dec-14 0.071 0.065 6,343
Jan-15 0.069 0.069 6,558
Feb-15 0.070 0.070 6,559
Mar-15 0.059 0.057 6,238
b) Distribution of Shareholding No Change
The share capital comprises of 125,000,000 fully paid ordinary shares of R.O. 0.100 each.
Major shareholders as of 31/03/2015
Shareholders Number No. Of Shares held Shareholding %
Government of Sultanate of Oman 1 30,000,000 24.00 %
Others – Public 15,686 95,000,000 76.00%
10. Review of Internal Control Systems and their adequacy
The company has been constantly monitoring and upgrading its internal control procedures and systems. The company has appointed an in house internal audit team as well as an external firm of auditors for the review of internal controls .Further, the Audit Committee is involved in the review process and has reviewed the internal controls and procedures adopted by the company and found them to be effective.
x
REPORT ON CORPORATE GOVERNANCE
11. Internal Audit Department
Company having in-house Internal Audit Department headed by CA. Shazad Chandio who is a Chartered Accountant from the Institute of Chartered Accountants of Pakistan. His Previous Experience includes 3 years of working with an audit firm and 2 years of working as a auditor in a Bank in Pakistan.
Further, Company had appointed PwC audit firm to assist her for carrying out Internal Audit function. PwC is a global network of firms operating in 158 countries with 169,000 people committed to providing quality in assurance, tax and advisory services.
PwC is the fastest growing professional services firm in the Middle East region and has offices in Bahrain, Egypt, Iraq, Jordan, Kuwait, Lebanon, Libya, Oman, the Palestinian territories, Qatar, Saudi Arabia and the United Arab Emirates, employing around 2,500 people.
PwC has been established in Oman for over 40 years and the Firm comprises four partners, including one Omani national, and over 140 professionals and support staff. Expert assurance, tax and advisory professionals are able to combine specialist internationally acquired consulting and technical skills with relevant local experience.
You can find more information about PwC at: www.pwc.com/middle-east.
12. External or Statutory Auditors and their Professional Profile
Deloitte
Deloitte refers to one or more of Deloitte Touche Tohmatsu Limited, a UK private company limited by guarantee, and its network of member firms, each of which is a legally separate and independent entity. Please see www.deloitte.com/about for a detailed description of the legal structure of Deloitte Touche Tohmatsu Limited and its member firms.
Deloitte provides audit, tax, consulting, and financial advisory services to public and private clients spanning multiple industries. With a globally connected network of member firms in more than 150 countries, Deloitte brings world-class capabilities and high-quality service to clients, delivering the insights they need to address their most complex business challenges. Deloitte has in the region of 200,000 professionals, all committed to becoming the standard of excellence.
Deloitte’s professionals are unified by a collaborative culture that fosters integrity, outstanding value to markets and clients, commitment to each other, and strength from cultural diversity. They enjoy an environment of continuous learning, challenging experiences, and enriching career opportunities. Deloitte’s professionals are dedicated to strengthening corporate responsibility, building public trust, and making a positive impact in their communities.
About Deloitte &Touche (M.E.):
Deloitte &Touche (M.E.) is a member firm of Deloitte Touche Tohmatsu Limited (DTTL) and is the first Arab professional services firm established in the Middle East region with uninterrupted presence for over 87 years. Deloitte is among the region’s leading professional services firms, providing audit, tax, consulting, and financial advisory services through 26 offices in 15 countries with over 2,500 partners, directors and staff. Deloitte has been annually classified as a Tier 1 Tax advisor in the GCC region since 2010 by the International Tax Review World Tax Rankings.
xi
REPORT ON CORPORATE GOVERNANCE
13. Legal consultant
M/s Suliman Al Busaidi is a noted local legal consultant who employs qualified professional lawyers and was appointed as our retainer legal consultants for pursuing the company’s legal matters.
14. Acknowledgment
The Board of Directors acknowledges confirmation of:
• Its responsibility for the preparation of the financial statements in accordance with the applicable standards and rules.
• Review of the efficiency and adequacy of internal control systems of the Company and that it compliance with internal rules and regulations
• There are no material matters effects the continuation of the Company and its ability to continue its operation during the next financial year.
For OMAN FISHERIES CO SAOG For OMAN FISHERIES CO SAOG
AUTHORISED SIGNATORY AUTHORISED SIGNATORY
xii
MANAGEMENT DISCUSSION AND ANALYSIS REPORTFor the year ended 31st March 2015
Introduction
The Management of the Oman Fisheries Co. SAOG (OFC) is pleased to present Discussion and Analysis report for the Financial Year 2014-15. Readers are encouraged to consider the information presented here in conjunction with information contained in the financial statements that follow this section.
Oman Fisheries Co. SAOG was formed by royal Decree no. 87/79 issued by His Majesty Sultan Qaboos bin Said by which Oman National Fisheries was merged with Oman Fisheries Co. Oman Fisheries Co. SAOG started its operation from 2nd April 1989. The paid up capital of the Oman Fisheries Co. SAOG is RO 12,500,000 consisting of 125,000,000 shares of RO 0.100 each. Company has family of more than 15,000 shareholders and Government of Oman is holding 24% stake.
Business Plan, Vision and Mission of the Company:
The company is in the process of implementing the approved 5 Year Business Growth Plan (2010-11 to 2014-15). Various communications methods were used by the Executive Management to communicate Vision, Mission and Goals and Objectives of Business Plan cascading down to all the levels of the employees in the organization. While in the first year the emphasis was on ‘Procurement’; in the subsequent year importance for ‘Quality’ was taken up as initiative and is befitting for this year considering the turn of events. We have started establishing and implementing Performance Management Framework towards effective monitoring process.
Internal Control System and their adequacy
OFC realise the importance of having in place an adequate system of internal control and the company has appointed a full time Chartered Accountant for conducting Internal Audit. In addition to this a reputed firm of Chartered Accountants has been appointed who is coordinating with the internal auditor of the company to conduct internal audit services and provide independent reports on internal control systems followed for managing the operations. Internal Auditor has no major observations with relation to internal control system, misconduct or non compliance on the part of the company.
Business Highlights and Overview of Financial Performance:
After three successful years of incremental operating profit, this is consecutively third time company is facing challenge in terms of ending up in an operational loss in year 2014 – 2015. During the financial year, OFC had achieved record sales in quantity, but the tight competition in the export market forced us to focus on some low value species under contract basis. The tight competition in the export market being an obstacle to increasing the sales price as against an increase in total procurement cost and increased operational expenses is one of the major reasons for ending in an operating loss of RO 1.8 million this year. OFC has launched three years strategic plan( 2015-16 to 2017-18) aiming to focus on its core strengths i.e. Marketing, and quality while de regulating other activities in order to reduce cost and improve the bottomline.The importance of quality in the processes and of the products has been emphasized as one of the primary goals under the business plan efforts which should be bearing fruit in the years ahead. In order to continue achieve target Operating Profit in the subsequent years we continue to concentrate on better product mix and high margin species through the implementation of the new strategic plan for the next three years, focused on quality and marketing. Through the new strategic plan OFC is intending to lease out the operations of the processing plants to get rid of the operational expenses and thereby focusing on the marketing to its core.
xiii
MANAGEMENT DISCUSSION AND ANALYSIS REPORTFor the year ended 31st March 2015
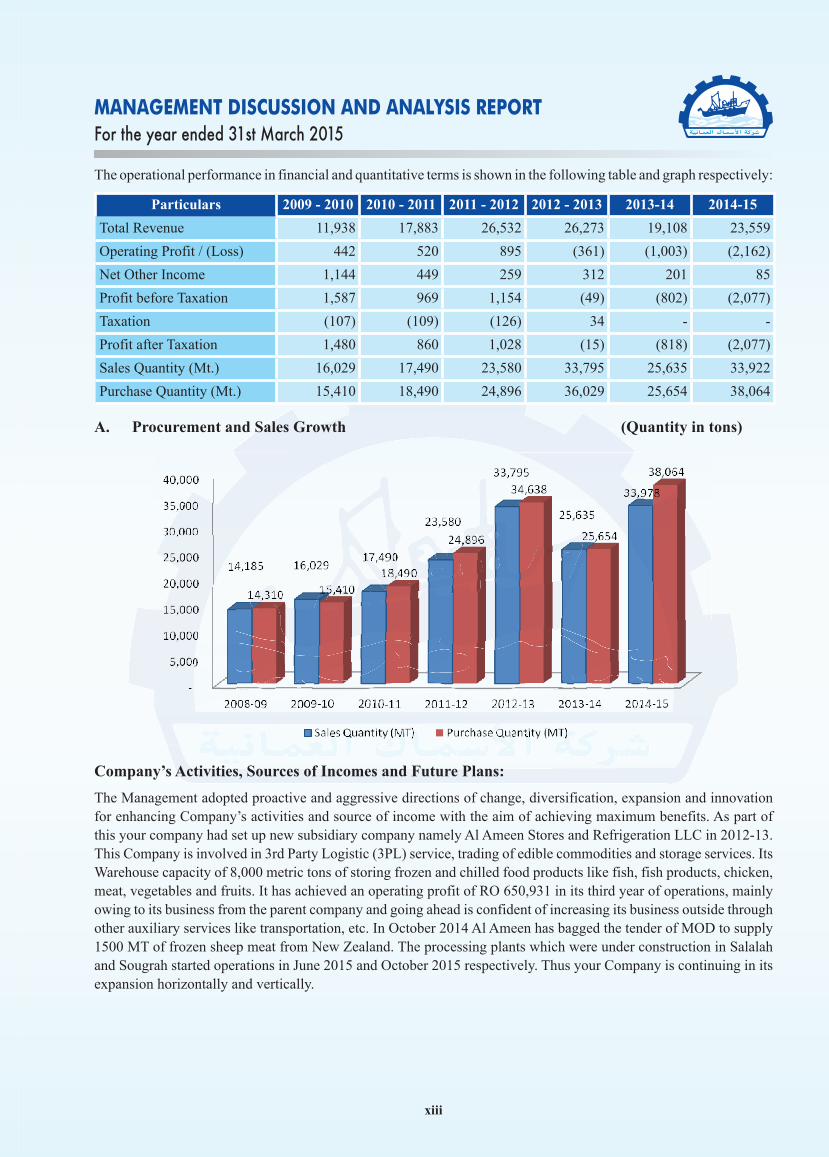
The operational performance in financial and quantitative terms is shown in the following table and graph respectively:
Particulars 2009 - 2010 2010 - 2011 2011 - 2012 2012 - 2013 2013-14 2014-15
Total Revenue 11,938 17,883 26,532 26,273 19,108 23,559
Operating Profit / (Loss) 442 520 895 (361) (1,003) (2,162)
Net Other Income 1,144 449 259 312 201 85
Profit before Taxation 1,587 969 1,154 (49) (802) (2,077)
Taxation (107) (109) (126) 34 - -
Profit after Taxation 1,480 860 1,028 (15) (818) (2,077)
Sales Quantity (Mt.) 16,029 17,490 23,580 33,795 25,635 33,922
Purchase Quantity (Mt.) 15,410 18,490 24,896 36,029 25,654 38,064
A. Procurement and Sales Growth (Quantity in tons)
Company’s Activities, Sources of Incomes and Future Plans:
The Management adopted proactive and aggressive directions of change, diversification, expansion and innovation for enhancing Company’s activities and source of income with the aim of achieving maximum benefits. As part of this your company had set up new subsidiary company namely Al Ameen Stores and Refrigeration LLC in 2012-13. This Company is involved in 3rd Party Logistic (3PL) service, trading of edible commodities and storage services. Its Warehouse capacity of 8,000 metric tons of storing frozen and chilled food products like fish, fish products, chicken, meat, vegetables and fruits. It has achieved an operating profit of RO 650,931 in its third year of operations, mainly owing to its business from the parent company and going ahead is confident of increasing its business outside through other auxiliary services like transportation, etc. In October 2014 Al Ameen has bagged the tender of MOD to supply 1500 MT of frozen sheep meat from New Zealand. The processing plants which were under construction in Salalah and Sougrah started operations in June 2015 and October 2015 respectively. Thus your Company is continuing in its expansion horizontally and vertically.
xiv
MANAGEMENT DISCUSSION AND ANALYSIS REPORTFor the year ended 31st March 2015
The core activities of the company are grouped into:
I. Fishing
II. Fish Procurement from Local fishermen
III. Value Added Products
IV. Sale of Fish and Fish Products
V. Storage and Logistics.
The brief outline of current operations of above activities and the new initiatives taken by the Executive Management in order to translate the approach of change, diversification and innovations is given below:
1. Fishing:
As per the concession agreement signed with the Government, the Company has been allotted fishing Quota of 20,000 Mt of bottom fishing and 30,000 Mt of large pelagic. However the company during the past periods could not exploit such quotas in the optimal use for one or another reason. With effect from June 2011, trawling has been banned in Oman.
To overcome from the above, the company had earlier submitted its five-year plan to Ministry of Fisheries to own and operate a fleet of fishing vessels and coastal fisheries, which will enable, God willing, the exploitation of quota granted to the company to catch both demersal and pelagic fish. The Ministry has already approved first two phases of coastal fishing boats of 24 licenses. Your Company currently operates 13 boats in the Oman water. The coastal fishing will help us in securing raw material for our factory and make fish available for local consumption.
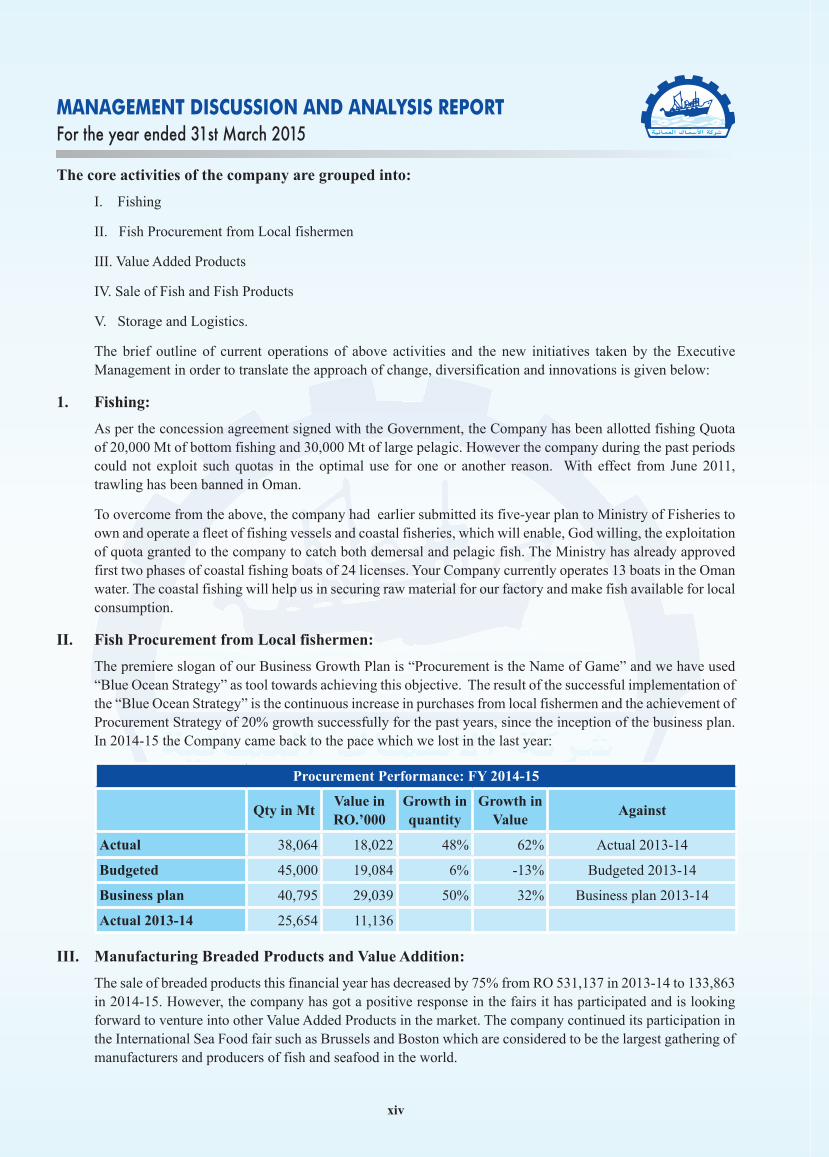
II. Fish Procurement from Local fishermen:
The premiere slogan of our Business Growth Plan is “Procurement is the Name of Game” and we have used “Blue Ocean Strategy” as tool towards achieving this objective. The result of the successful implementation of the “Blue Ocean Strategy” is the continuous increase in purchases from local fishermen and the achievement of Procurement Strategy of 20% growth successfully for the past years, since the inception of the business plan. In 2014-15 the Company came back to the pace which we lost in the last year:
Procurement Performance: FY 2014-15
Qty in MtValue in RO.’000
Growth in quantity
Growth in Value
Against
Actual 38,064 18,022 48% 62% Actual 2013-14
Budgeted 45,000 19,084 6% -13% Budgeted 2013-14
Business plan 40,795 29,039 50% 32% Business plan 2013-14
Actual 2013-14 25,654 11,136
III. Manufacturing Breaded Products and Value Addition:
The sale of breaded products this financial year has decreased by 75% from RO 531,137 in 2013-14 to 133,863 in 2014-15. However, the company has got a positive response in the fairs it has participated and is looking forward to venture into other Value Added Products in the market. The company continued its participation in the International Sea Food fair such as Brussels and Boston which are considered to be the largest gathering of manufacturers and producers of fish and seafood in the world.
xv
MANAGEMENT DISCUSSION AND ANALYSIS REPORTFor the year ended 31st March 2015
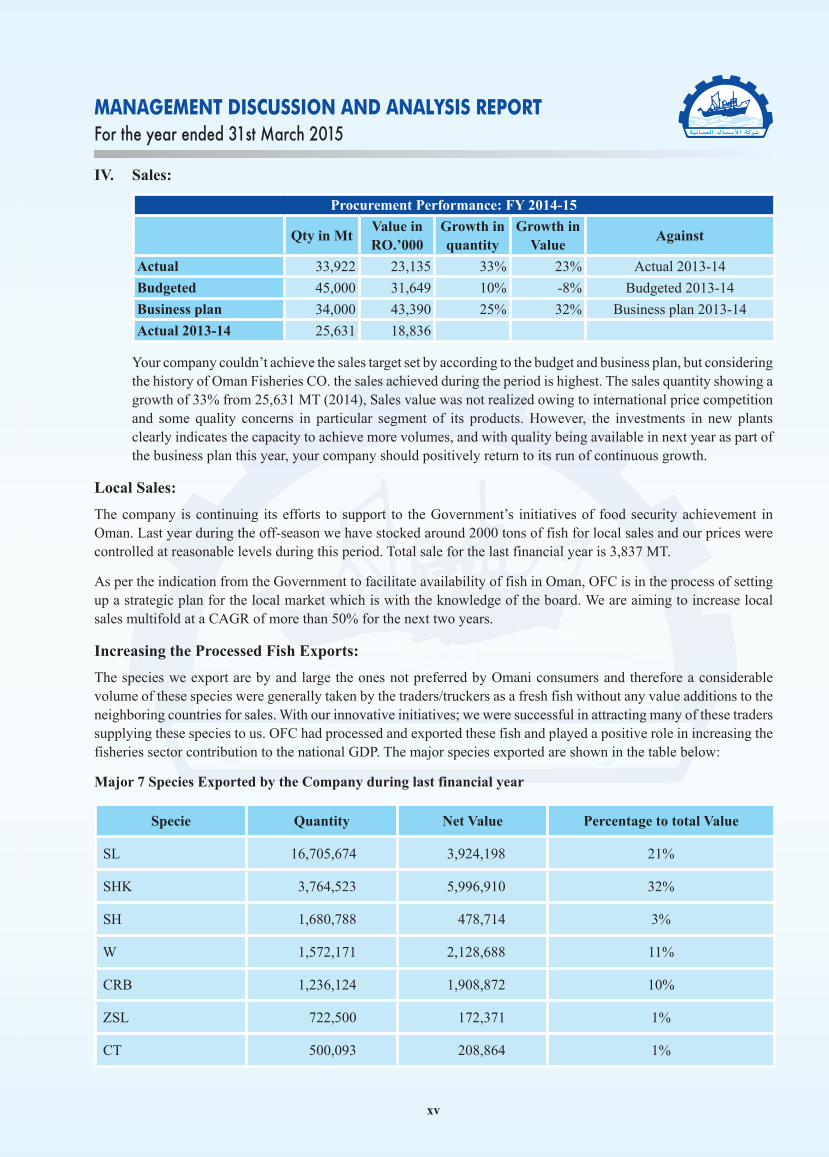
IV. Sales:
Procurement Performance: FY 2014-15
Qty in MtValue in RO.’000
Growth in quantity
Growth in Value
Against
Actual 33,922 23,135 33% 23% Actual 2013-14
Budgeted 45,000 31,649 10% -8% Budgeted 2013-14
Business plan 34,000 43,390 25% 32% Business plan 2013-14
Actual 2013-14 25,631 18,836
Your company couldn’t achieve the sales target set by according to the budget and business plan, but considering the history of Oman Fisheries CO. the sales achieved during the period is highest. The sales quantity showing a growth of 33% from 25,631 MT (2014), Sales value was not realized owing to international price competition and some quality concerns in particular segment of its products. However, the investments in new plants clearly indicates the capacity to achieve more volumes, and with quality being available in next year as part of the business plan this year, your company should positively return to its run of continuous growth.
Local Sales:
The company is continuing its efforts to support to the Government’s initiatives of food security achievement in Oman. Last year during the off-season we have stocked around 2000 tons of fish for local sales and our prices were controlled at reasonable levels during this period. Total sale for the last financial year is 3,837 MT.
As per the indication from the Government to facilitate availability of fish in Oman, OFC is in the process of setting up a strategic plan for the local market which is with the knowledge of the board. We are aiming to increase local sales multifold at a CAGR of more than 50% for the next two years.
Increasing the Processed Fish Exports:
The species we export are by and large the ones not preferred by Omani consumers and therefore a considerable volume of these species were generally taken by the traders/truckers as a fresh fish without any value additions to the neighboring countries for sales. With our innovative initiatives; we were successful in attracting many of these traders supplying these species to us. OFC had processed and exported these fish and played a positive role in increasing the fisheries sector contribution to the national GDP. The major species exported are shown in the table below:
Major 7 Species Exported by the Company during last financial year
Specie Quantity Net Value Percentage to total Value
SL 16,705,674 3,924,198 21%
SHK 3,764,523 5,996,910 32%
SH 1,680,788 478,714 3%
W 1,572,171 2,128,688 11%
CRB 1,236,124 1,908,872 10%
ZSL 722,500 172,371 1%
CT 500,093 208,864 1%
xvi
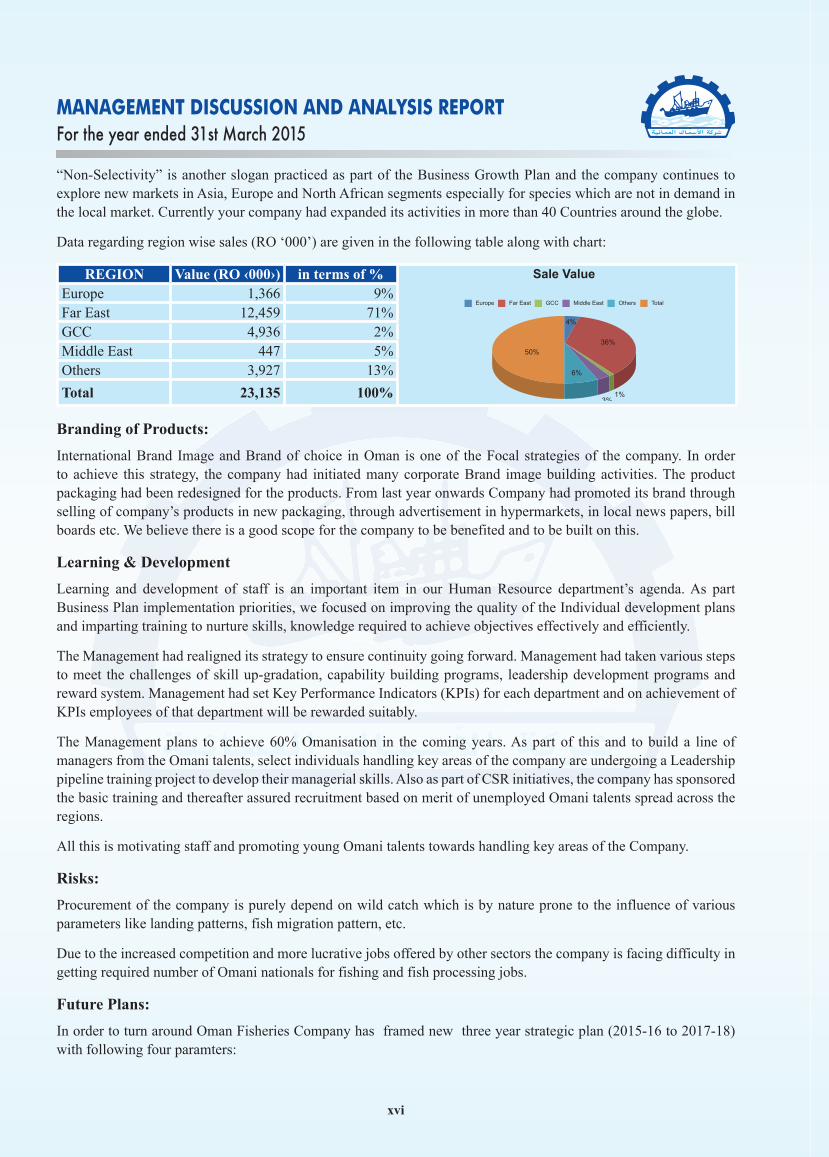
“Non-Selectivity” is another slogan practiced as part of the Business Growth Plan and the company continues to explore new markets in Asia, Europe and North African segments especially for species which are not in demand in the local market. Currently your company had expanded its activities in more than 40 Countries around the globe.
Data regarding region wise sales (RO ‘000’) are given in the following table along with chart:
REGION Value (RO ‹000›) in terms of %
Europe Far East GCC Middle East Others Total
Sale Value
50%
4%
36%
6%
3%1%
Europe 1,366 9%Far East 12,459 71%GCC 4,936 2%Middle East 447 5%Others 3,927 13%
Total 23,135 100%
Branding of Products:
International Brand Image and Brand of choice in Oman is one of the Focal strategies of the company. In order to achieve this strategy, the company had initiated many corporate Brand image building activities. The product packaging had been redesigned for the products. From last year onwards Company had promoted its brand through selling of company’s products in new packaging, through advertisement in hypermarkets, in local news papers, bill boards etc. We believe there is a good scope for the company to be benefited and to be built on this.
Learning & Development
Learning and development of staff is an important item in our Human Resource department’s agenda. As part Business Plan implementation priorities, we focused on improving the quality of the Individual development plans and imparting training to nurture skills, knowledge required to achieve objectives effectively and efficiently.
The Management had realigned its strategy to ensure continuity going forward. Management had taken various steps to meet the challenges of skill up-gradation, capability building programs, leadership development programs and reward system. Management had set Key Performance Indicators (KPIs) for each department and on achievement of KPIs employees of that department will be rewarded suitably.
The Management plans to achieve 60% Omanisation in the coming years. As part of this and to build a line of managers from the Omani talents, select individuals handling key areas of the company are undergoing a Leadership pipeline training project to develop their managerial skills. Also as part of CSR initiatives, the company has sponsored the basic training and thereafter assured recruitment based on merit of unemployed Omani talents spread across the regions.
All this is motivating staff and promoting young Omani talents towards handling key areas of the Company.
Risks:
Procurement of the company is purely depend on wild catch which is by nature prone to the influence of various parameters like landing patterns, fish migration pattern, etc.
Due to the increased competition and more lucrative jobs offered by other sectors the company is facing difficulty in getting required number of Omani nationals for fishing and fish processing jobs.
Future Plans:
In order to turn around Oman Fisheries Company has framed new three year strategic plan (2015-16 to 2017-18) with following four paramters:
MANAGEMENT DISCUSSION AND ANALYSIS REPORTFor the year ended 31st March 2015
xvii
• Sustainable profitability
• Controlling costs
• Breakeven point identification
• Targeting business growth.
The Five Year Strategic Plan for the period 2010-2015 focused on higher processing and diversification. OFC strengthened procurement and diversified by investing in new projects. In the New strategic business plan, 2015/2018, Company plans to focus solely on Procurement, Marketing and quality control, while lease out processing.
Along with that as a part of new strategic plan Oman Fisheries Company is taking the initiative to aid Oman Government’s activities aimed at supporting and promoting the SMEs. Through the concept of “Outsourcing” Oman Fisheries Company is aiming to mould the young Entrepreneurs of Oman with the skills to lead from the front to herald the economic growth of our country.
Other future projects in the pipeline are:
1. New Fish processing plants in Dahar, Barkha and along the coastal regions of the country.
2. Aquaculture farming in Government allotted land. The company has initiated feasibility studies for the same along with firm having expertise in the field.
3. Business Plan to activate the role of OFC local sales and be able to contribute towards Food Security initiatives of the nation and aiming to achieve the following key objectives:
• Making Freshfish available to consumers especially in the cities with high populations.
• Maintaining superior and consistent Quality with Better price
• Introduction of new fish shops across the country
• Creating job opportunities for the nationals
• Promoting corporate image Building the Brand of OFC’s taQa as the “Brand of Choice in Oman”.
Acknowledgement
On behalf of the Management, I thank the Chairman and board of Directors for their continued guidance and direction in managing the Company as a successful organization.
Our sincere appreciation and thanks to the officials in the Ministry of Agricultural and Fisheries Wealth, The Ministry of Finance, Oman Chamber of Commerce and Industry and all other Governmental bodies who supported us to achieve the what we had achieved.
Our heart felt thanks and appreciation to all our valued customers and suppliers for whole heartedly supporting the company and extending their co-operation.
Said Rashid Al Rawahi
General Manager
MANAGEMENT DISCUSSION AND ANALYSIS REPORTFor the year ended 31st March 2015
3
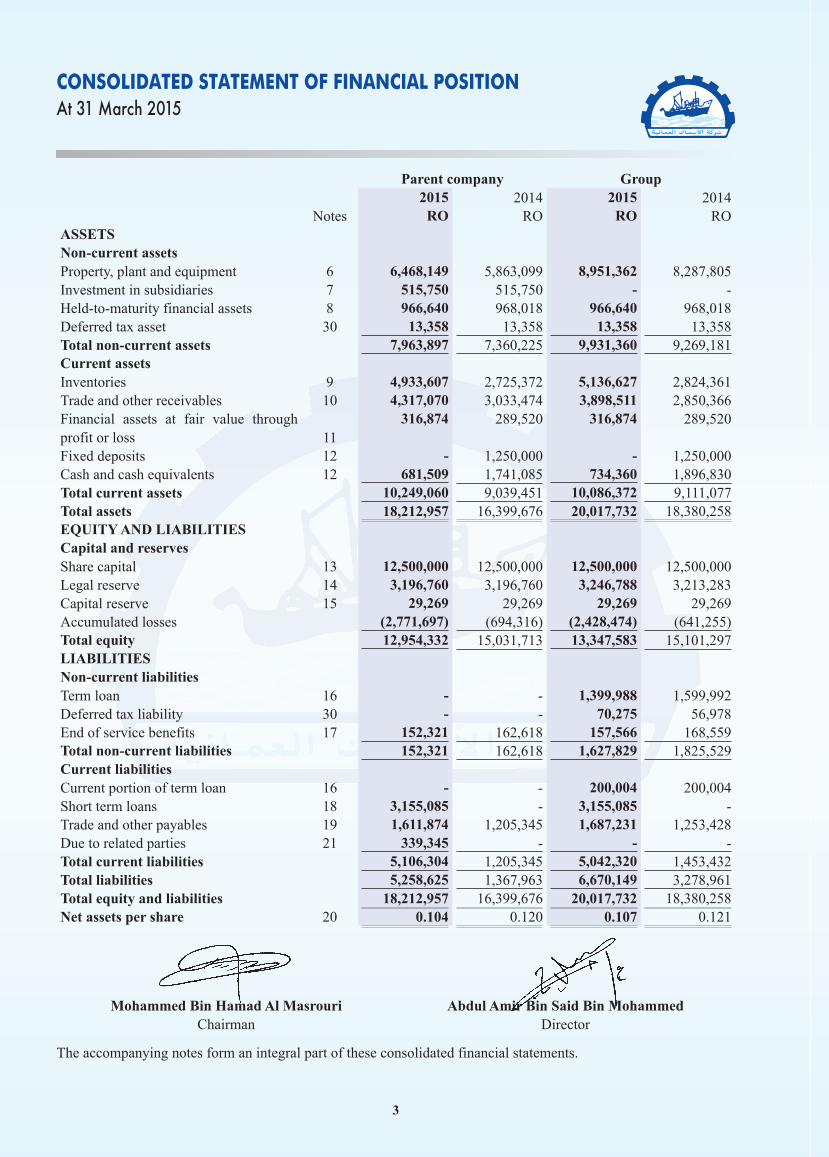
CONSOLIDATED STATEMENT OF FINANCIAL POSITIONAt 31 March 2015
Parent company Group2015 2014 2015 2014
Notes RO RO RO ROASSETSNon-current assetsProperty, plant and equipment 6 6,468,149 5,863,099 8,951,362 8,287,805Investment in subsidiaries 7 515,750 515,750 - -Held-to-maturity financial assets 8 966,640 968,018 966,640 968,018Deferred tax asset 30 13,358 13,358 13,358 13,358Total non-current assets 7,963,897 7,360,225 9,931,360 9,269,181Current assetsInventories 9 4,933,607 2,725,372 5,136,627 2,824,361Trade and other receivables 10 4,317,070 3,033,474 3,898,511 2,850,366Financial assets at fair value through profit or loss 11
316,874 289,520 316,874 289,520
Fixed deposits 12 - 1,250,000 - 1,250,000Cash and cash equivalents 12 681,509 1,741,085 734,360 1,896,830Total current assets 10,249,060 9,039,451 10,086,372 9,111,077Total assets 18,212,957 16,399,676 20,017,732 18,380,258EQUITY AND LIABILITIESCapital and reserves Share capital 13 12,500,000 12,500,000 12,500,000 12,500,000Legal reserve 14 3,196,760 3,196,760 3,246,788 3,213,283Capital reserve 15 29,269 29,269 29,269 29,269Accumulated losses (2,771,697) (694,316) (2,428,474) (641,255)Total equity 12,954,332 15,031,713 13,347,583 15,101,297LIABILITIESNon-current liabilitiesTerm loan 16 - - 1,399,988 1,599,992Deferred tax liability 30 - - 70,275 56,978End of service benefits 17 152,321 162,618 157,566 168,559Total non-current liabilities 152,321 162,618 1,627,829 1,825,529Current liabilitiesCurrent portion of term loan 16 - - 200,004 200,004Short term loans 18 3,155,085 - 3,155,085 -Trade and other payables 19 1,611,874 1,205,345 1,687,231 1,253,428Due to related parties 21 339,345 - - -Total current liabilities 5,106,304 1,205,345 5,042,320 1,453,432Total liabilities 5,258,625 1,367,963 6,670,149 3,278,961Total equity and liabilities 18,212,957 16,399,676 20,017,732 18,380,258Net assets per share 20 0.104 0.120 0.107 0.121
Mohammed Bin Hamad Al MasrouriChairman
Abdul Amir Bin Said Bin MohammedDirector
The accompanying notes form an integral part of these consolidated financial statements.
4
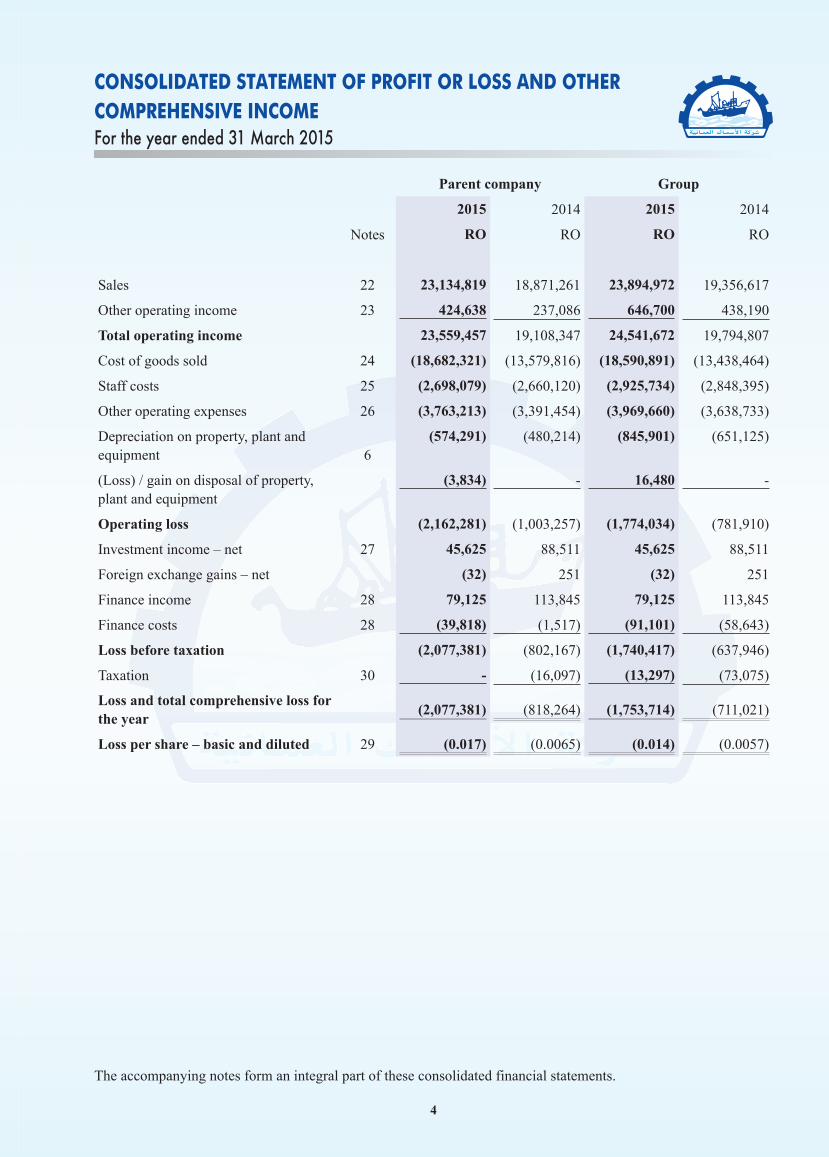
CONSOLIDATED STATEMENT OF PROFIT OR LOSS AND OTHER COMPREHENSIVE INCOMEFor the year ended 31 March 2015
Parent company Group
2015 2014 2015 2014
Notes RO RO RO RO
Sales 22 23,134,819 18,871,261 23,894,972 19,356,617
Other operating income 23 424,638 237,086 646,700 438,190
Total operating income 23,559,457 19,108,347 24,541,672 19,794,807
Cost of goods sold 24 (18,682,321) (13,579,816) (18,590,891) (13,438,464)
Staff costs 25 (2,698,079) (2,660,120) (2,925,734) (2,848,395)
Other operating expenses 26 (3,763,213) (3,391,454) (3,969,660) (3,638,733)
Depreciation on property, plant and equipment 6
(574,291) (480,214) (845,901) (651,125)
(Loss) / gain on disposal of property, plant and equipment
(3,834) - 16,480 -
Operating loss (2,162,281) (1,003,257) (1,774,034) (781,910)
Investment income – net 27 45,625 88,511 45,625 88,511
Foreign exchange gains – net (32) 251 (32) 251
Finance income 28 79,125 113,845 79,125 113,845
Finance costs 28 (39,818) (1,517) (91,101) (58,643)
Loss before taxation (2,077,381) (802,167) (1,740,417) (637,946)
Taxation 30 - (16,097) (13,297) (73,075)
Loss and total comprehensive loss for the year
(2,077,381) (818,264) (1,753,714) (711,021)
Loss per share – basic and diluted 29 (0.017) (0.0065) (0.014) (0.0057)
The accompanying notes form an integral part of these consolidated financial statements.
5
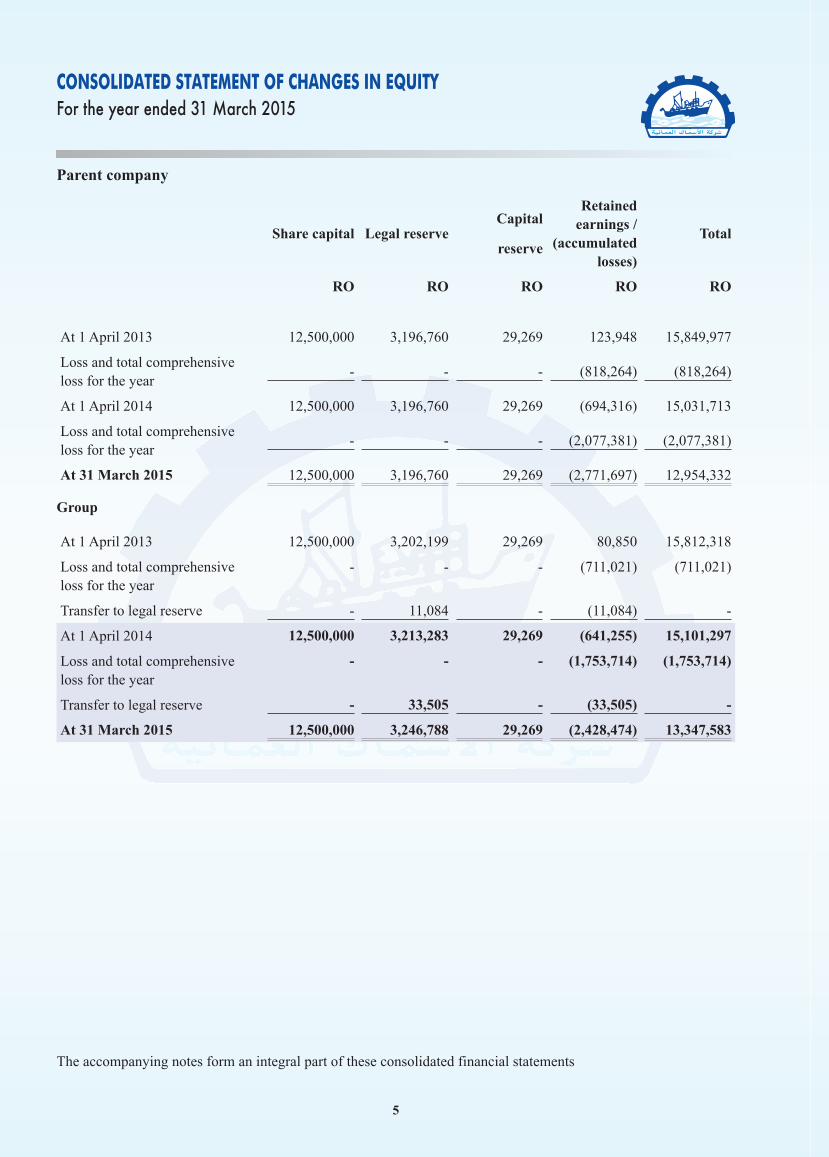
CONSOLIDATED STATEMENT OF CHANGES IN EQUITYFor the year ended 31 March 2015
Parent company
Share capital Legal reserveCapital
reserve
Retained earnings /
(accumulated losses)
Total
RO RO RO RO RO
At 1 April 2013 12,500,000 3,196,760 29,269 123,948 15,849,977
Loss and total comprehensive loss for the year
- - - (818,264) (818,264)
At 1 April 2014 12,500,000 3,196,760 29,269 (694,316) 15,031,713
Loss and total comprehensive loss for the year
- - - (2,077,381) (2,077,381)
At 31 March 2015 12,500,000 3,196,760 29,269 (2,771,697) 12,954,332
Group
At 1 April 2013 12,500,000 3,202,199 29,269 80,850 15,812,318
Loss and total comprehensive loss for the year
- - - (711,021) (711,021)
Transfer to legal reserve - 11,084 - (11,084) -
At 1 April 2014 12,500,000 3,213,283 29,269 (641,255) 15,101,297
Loss and total comprehensive loss for the year
- - - (1,753,714) (1,753,714)
Transfer to legal reserve - 33,505 - (33,505) -
At 31 March 2015 12,500,000 3,246,788 29,269 (2,428,474) 13,347,583
The accompanying notes form an integral part of these consolidated financial statements
6
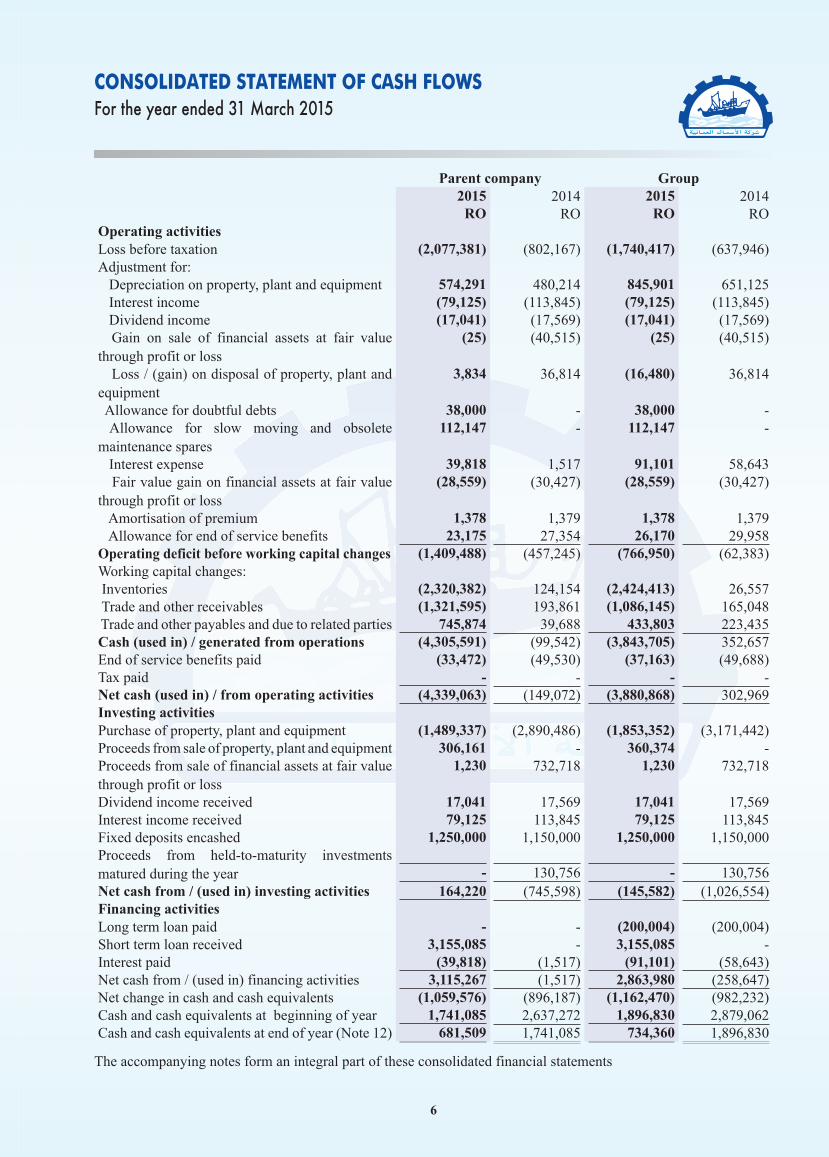
CONSOLIDATED STATEMENT OF CASH FLOWSFor the year ended 31 March 2015
Parent company Group2015 2014 2015 2014
RO RO RO ROOperating activitiesLoss before taxation (2,077,381) (802,167) (1,740,417) (637,946)Adjustment for: Depreciation on property, plant and equipment 574,291 480,214 845,901 651,125 Interest income (79,125) (113,845) (79,125) (113,845) Dividend income (17,041) (17,569) (17,041) (17,569) Gain on sale of financial assets at fair value through profit or loss
(25) (40,515) (25) (40,515)
Loss / (gain) on disposal of property, plant and equipment
3,834 36,814 (16,480) 36,814
Allowance for doubtful debts 38,000 - 38,000 - Allowance for slow moving and obsolete maintenance spares
112,147 - 112,147 -
Interest expense 39,818 1,517 91,101 58,643 Fair value gain on financial assets at fair value through profit or loss
(28,559) (30,427) (28,559) (30,427)
Amortisation of premium 1,378 1,379 1,378 1,379 Allowance for end of service benefits 23,175 27,354 26,170 29,958Operating deficit before working capital changes (1,409,488) (457,245) (766,950) (62,383)Working capital changes: Inventories (2,320,382) 124,154 (2,424,413) 26,557 Trade and other receivables (1,321,595) 193,861 (1,086,145) 165,048 Trade and other payables and due to related parties 745,874 39,688 433,803 223,435Cash (used in) / generated from operations (4,305,591) (99,542) (3,843,705) 352,657End of service benefits paid (33,472) (49,530) (37,163) (49,688)Tax paid - - - -Net cash (used in) / from operating activities (4,339,063) (149,072) (3,880,868) 302,969Investing activitiesPurchase of property, plant and equipment (1,489,337) (2,890,486) (1,853,352) (3,171,442)Proceeds from sale of property, plant and equipment 306,161 - 360,374 -Proceeds from sale of financial assets at fair value through profit or loss
1,230 732,718 1,230 732,718
Dividend income received 17,041 17,569 17,041 17,569Interest income received 79,125 113,845 79,125 113,845Fixed deposits encashed 1,250,000 1,150,000 1,250,000 1,150,000Proceeds from held-to-maturity investments matured during the year - 130,756 - 130,756Net cash from / (used in) investing activities 164,220 (745,598) (145,582) (1,026,554)Financing activitiesLong term loan paid - - (200,004) (200,004)Short term loan received 3,155,085 - 3,155,085 -Interest paid (39,818) (1,517) (91,101) (58,643)Net cash from / (used in) financing activities 3,115,267 (1,517) 2,863,980 (258,647)Net change in cash and cash equivalents (1,059,576) (896,187) (1,162,470) (982,232)Cash and cash equivalents at beginning of year 1,741,085 2,637,272 1,896,830 2,879,062Cash and cash equivalents at end of year (Note 12) 681,509 1,741,085 734,360 1,896,830
The accompanying notes form an integral part of these consolidated financial statements
7
NOTES TO THE CONSOLIDATED FINANCIAL STATEMENTSFor the year ended 31 March 2015
1. General
Oman Fisheries Co. SAOG (‘the Company’ or ‘the Parent company’) is an Omani Joint Stock Company registered under the Commercial Companies Law of Oman. The principal activities of the Company are the procurement, processing and sale of fresh, frozen and coated fish, fishing and the sale of fishing rights.
On 27 August 2005, the Company incorporated a subsidiary in UAE, Oman Fisheries Co. FZE with an initial registered share capital of RO 15,750. Oman Fisheries Co. FZE registered in United Arab Emirates as a free zone company, is a wholly owned subsidiary of the Company. The subsidiary company started its operations on 1 February 2006 and is engaged in the business of distribution of the products of the Parent company.
On 19 September 2011, the Company incorporated a subsidiary in Oman, Al Ameen Stores and Refrigeration LLC, with an initial registered share capital of RO 500,000. The Parent company holds 99% of the share capital of the subsidiary and through a director, Mr. Saleh bin Nasser bin Juma al Araimi, holds the remaining 1%. Thus, effectively Al Ameen Stores and Refrigeration LLC is a wholly owned subsidiary of the Parent company. The subsidiary is registered under the Commercial Companies Law of the Sultanate of Oman and is mainly involved in the business of storage and wholesale of fish, meat, chicken, vegetables, and fruits.
2. Basis of preparation
The Parent company’s and the Group’s financial statements have been prepared on the historical cost basis except for financial assets at fair value through profit or loss that have been measured at fair value and held-to-maturity financial assets that are measured to amortized cost.
Statement of compliance
These Parent company’s and the Group’s financial statements have been prepared in accordance with International Financial Reporting Standards (“IFRS”) as promulgated by the International Accounting Standards Board (IASB) and the interpretations issued by the International Financial Reporting Interpretations Committee (IFRIC) of the IASB. The Parent company’s and the Group’s financial statements comply with the relevant disclosure requirements of the Commercial Companies Law of 1974, as amended and the provisions for disclosure included in the Executive Regulations of the Capital Market Law.
Basis of consolidation
The consolidated financial statements incorporate the financial statements of the Parent company and entities controlled by the Parent company. Control is achieved where the Parent company has power to govern the financial and operating policies of an entity so as to obtain benefits from its activities.
Subsidiaries are all entities (including special purpose entities) over which the Group exercises control. Control is achieved when the Parent company:
• has power over the investee;
• is exposed, or has rights, to variable returns from its involvement with the investee; and
• has the ability to use its power to affect the investee’s returns.
The Company reassesses whether or not it controls an investee if facts and circumstances indicate that there are changes to one or more of the three elements of control listed above.
When the Company has less than a majority of the voting rights of an investee, it has power over the investee when the voting rights are sufficient to give it the practical ability to direct the relevant activities of the investee unilaterally.
8
NOTES TO THE CONSOLIDATED FINANCIAL STATEMENTSFor the year ended 31 March 2015
2. Basis of preparation (continued)
Consolidation of a subsidiary begins when the Parent company obtains control over the subsidiary and ceases when the Parent company loses control of the subsidiary. Specifically, income and expenses of a subsidiary acquired or disposed of during the year are included in the consolidated profit or loss from the date the Parent company gains control until the date when the Parent company ceases to control the subsidiary.
Profit or loss and each component of other comprehensive income are attributed to the owners of the Parent company and to the non-controlling interests. Total comprehensive income of subsidiary is attributed to the owners of the Parent company and to the non-controlling interests even if this results in the non-controlling interests having a deficit balance.
All intragroup assets and liabilities, equity, income, expenses and cash flows relating to transactions between members of the Group are eliminated in full on consolidation.
The purchase method of accounting is used to account for the acquisition of subsidiaries by the Group. The cost of an acquisition is measured at the fair value of the assets given, equity instruments issued and liabilities incurred or assumed at the date of exchange, plus costs directly attributable to the acquisition. Identifiable assets acquired and liabilities and contingent liabilities assumed in a business combination are measured initially at their fair values at the acquisition date, irrespective of the extent of any minority interest. The excess of the cost of acquisition over the fair value of the Group’s share of the identifiable net assets acquired is recorded as goodwill.
In accordance with the transitional provisions of IFRS 10 Consolidated Financial Statements (2011), for first time application, the Directors reassessed the control conclusion for its subsidiary at 1 April 2013 and concluded that there is no change in control over subsidiary as per the new control model described in IFRS 10.
A change in the ownership interest of a subsidiary, without a change of control, is accounted for as an equity transaction.
Losses are attributed to the non-controlling interest even if that results in a deficit balance.
If the Group loses control over a subsidiary, it:
• Derecognises the assets (including goodwill) and liabilities of the subsidiary
• Derecognises the carrying amount of any non-controlling interests
• Derecognises the cumulative translation differences, recorded in equity
• Recognises the fair value of the consideration received
• Recognises the fair value of any investment retained
• Recognises any surplus or deficit in profit or loss
• Reclassifies the parent’s share of components previously recognised in other comprehensive income to profit or loss
The consolidated financial statements incorporate the following subsidiary companies in which the Group has a controlling interest:
Company nameCountry of
incorporationYear end
Percentage held
Principal activities
2015 2014
Oman Fisheries Co. FZE UAE 31 March 100% 100%Procurement and sale of fish
and fish productsAl Ameen Stores and Refrigeration LLC
Sultanate of Oman
31 March 100% 100%Storing of fish, meat, chicken,
vegetables and fruits.
9
NOTES TO THE CONSOLIDATED FINANCIAL STATEMENTSFor the year ended 31 March 2015
3. Adoption of new and revised International Financial Reporting Standards (IFRS)
For the year ended 31 March 2015, the Group has adopted all the new and revised standards and interpretations issued by the International Accounting Standards Board (IASB) and the International Financial Reporting Interpretations Committee (IFRIC) of the IASB that are relevant to its operations and effective for the period beginning on 1 April 2014.
3.1 Standards and Interpretations adopted with no effect on the financial statements
The following new and revised Standards and Interpretations have been adopted in these consolidated financial statements. Their adoption has not had any significant impact on the amounts reported in these consolidated financial statements but may affect the accounting for future transactions or arrangements.
Amendments to IFRS 10, IFRS 12 and IAS 27: Investment Entities
The amendments to IFRS 10 define an investment entity and require a reporting entity that meets the definition of an investment entity not to consolidate its subsidiaries but instead to measure its subsidiaries at fair value through profit or loss in its consolidated and separate financial statements. Consequential amendments have been made to IFRS 12 and IAS 27 to introduce new disclosure requirements for investment entities.
Amendments to IAS 32: Offsetting Financial Assets and Financial Liabilities
The amendments to IAS 32 clarify the requirements relating to the offset of financial assets and financial liabilities. Specifically, the amendments clarify the meaning of ‘currently has a legally enforceable right of set-off’ and ‘simultaneous realisation and settlement’.
Amendments to IAS 36: Recoverable Amount Disclosures for Non-Financial Assets
The amendment to IAS 36 remove the requirement to disclose the recoverable amount of a cash-generating unit (CGU) to which goodwill or other intangible assets with indefinite useful lives had been allocated when there has been no impairment or reversal of impairment of the related CGU. Furthermore, the amendments introduce additional disclosure requirements applicable to when the recoverable amount of an asset or a CGU is measured at fair value less cost of disposal.
Amendments to IAS 39: Novation of Derivatives and Continuation of Hedge Accounting
The amendments to IAS 39 provide relief from the requirement to discontinue hedge accounting when a derivative designated as a hedging instrument is novated under certain circumstances. The amendments also clarify that any change to the fair value of the derivative designated as hedging instrument arising from the novation should be included in the assessment and measurement of hedge effectiveness.
IFRIC 21: Levies IFRIC 21 addresses the issue as to when to recognise a liability to pay a levy imposed by a government. The Interpretation provides guidance on how different levy arrangements should be accounted for, in particular, it clarifies neither economic compulsion nor the going concern basis financial statements preparation implies that an entity has a present obligation to pay a levy that will be triggered by operating in a future period.
10
NOTES TO THE CONSOLIDATED FINANCIAL STATEMENTSFor the year ended 31 March 2015
3. Adoption of new and revised International Financial Reporting Standards (IFRS) (continued)
3.2 Standards and Interpretations in issue not yet effective
At the date of authorisation of these consolidated financial statements, the following new and revised Standards and Interpretations were in issue but not yet effective:
Effective for annual periods beginning
on or after
New IFRS and relevant amendments
IFRS 9: Financial Instruments 1 January 2018
IFRS 15: Revenue from Contracts with Customers 1 January 2017
Amendment to IFRS 11: Accounting for Acquisition of Interest in Joint Operations
1 January 2016
Amendment to IAS 16 and IAS 38: Clarification of Acceptable Methods of Depreciation and Amortisation
1 January 2016
Amendment to IAS 16 and IAS 41: Agriculture – Bearer Plants. 1 January 2016
Amendment to IAS 19: Employee Benefit Plans – Employee Contributions 1 July 2014
Amendments to IAS 27: Permits use of equity method for investments in subsidiaries, associates and joint ventures when an entity prepares its separate financial statements.
1 January 2016
Amendments to IFRS 10 and IAS 28: Specifies the accounting treatment for gain or loss on sale or contribution of assets between investor and joint ventures based on whether or not the sale or contribution results in a business.
1 January 2016
Annual Improvements to IFRSs 2010 – 2012 cycle 1 July 2014
Annual Improvements to IFRSs 2011 – 2013 cycle 1 July 2014
Annual Improvements to IFRSs 2012 – 2014 cycle 1 January 2016
The directors anticipate that the adoption of these Standards and Interpretations in future periods will have no material impact on the consolidated financial statements of the Company’s in the period of initial application. The adoption of these standards and interpretations has not resulted in changes to the Company’s accounting policies and has not affected the amounts reported for the current or prior periods except for IFRS 9: Financial Instruments. IFRS 9 introduces new requirements for the classification and measurement of financial instruments. The management is currently assessing this standard which may have an impact on the consolidated financial statements of the Company as described above.
4. Summary of significant accounting policies
Property, plant and equipment
Property, plant and equipment are stated at cost less accumulated depreciation. The cost of property, plant and equipment is their purchase price together with any incidental expenses that are directly attributable to the acquisition of the item. Subsequent costs are included in the asset’s carrying amount or recognised as a separate asset, as appropriate, only when it is probable that future economic benefits associated with the item will flow to the Group and the cost of the item can be measured reliably. All other repairs and maintenance are charged to the profit or loss during the financial year in which they are incurred.
11
NOTES TO THE CONSOLIDATED FINANCIAL STATEMENTSFor the year ended 31 March 2015
4. Summary of significant accounting policies (continued)
The cost of property, plant and equipment is written down to residual value in equal installments over the estimated useful lives of the assets. The estimated useful lives are:
Years
Buildings and cabins 10 - 25
Plant and equipment 3 - 10
Boats and trawlers 5 - 15
Motor vehicles 3 - 5
Furniture, fixtures and office equipment 3 - 10
Capital work-in-progress is not depreciated until it is transferred into one of the above categories at the time when it is ready for use.
The assets’ residual values and useful lives are reviewed, and adjusted if appropriate, at each reporting date. Where the carrying amount of an asset is greater than its estimated recoverable amount it is written down immediately to its recoverable amount.
Gains and losses on disposals of property, plant and equipment are determined by reference to their carrying amounts, and are taken into account in determining operating profit.
Investments in subsidiaries
A subsidiary is a company in which the Parent company owns more than one half of the voting power or exercises control. In the Parent company’s separate financial statements, the investment in the subsidiary is carried at cost less impairment.
Financial assets
The Group classifies its financial assets in the following categories: at fair value through profit or loss, held-to-maturity and loans and receivables. The classification depends on the purpose for which the financial assets were acquired. Management determines the classification of its financial assets at initial recognition.
Financial assets at fair value through profit or loss
A financial asset is classified in this category if acquired principally for the purpose of selling in the short term or if so designated by management.
Financial assets carried at fair value through profit or loss are initially recognised at fair value and transaction costs are expensed in the profit or loss. Financial assets at fair value through profit or loss are subsequently carried at fair value.
The fair values of quoted investments are based on current market bid prices. Gains or losses arising from changes in the fair value are presented in the profit or loss in the period in which they arise.
Investments are derecognised when the rights to receive cash flows from the investments have expired or have been transferred and the Group has transferred subsequently all risks and rewards of ownership.
All purchases and sales of investments are recognised on the trade date, which is the date that the Group commits to purchase or sell the asset.
12
NOTES TO THE CONSOLIDATED FINANCIAL STATEMENTSFor the year ended 31 March 2015
4. Summary of significant accounting policies (continued)
Held-to-maturity investments
Held-to-maturity investments are non-derivative financial assets with fixed or determinable payments and fixed maturities that the Group’s management has the positive intent and ability to hold to maturity.
Held-to-maturity investments are initially recognised at cost and subsequently re-measured at amortised cost using the effective interest rate method less any allowance for impairment.
Interest receivable from held-to-maturity is accounted for on the accruals basis.
Loans and receivables
Loans and receivables are non-derivative financial assets with fixed or determinable payments that are not quoted in an active market. They are included in current assets, except for maturities greater than 12 months after the reporting date. These are classified as non-current assets. The Group’s loans and receivables comprise fixed deposits, due from related parties and trade and other receivables in the statement of financial position.
Trade and other receivables
Trade and other receivables are initially recognised at their fair value and subsequently stated at amortised cost using effective interest rate method, less allowance for impairment. A allowance for impairment of trade receivables is established when there is objective evidence that the Group will not be able to collect all amounts due according to the original terms of receivables. The amount of the allowance is the difference between the asset’s carrying amount and the present value of estimated future cash flows, discounted at the effective interest rate. The amount of any allowance is recognised in the profit or loss within ‘other operating expenses’. Subsequent recoveries of amounts previously written off are credited against ‘other operating expenses’ in the profit or loss.
Cash and cash equivalents
For the purpose of statement of cash flows, the Group considers all bank balances, including short term deposits with a maturity of three months or less from the date of placement, to be cash equivalents.
Inventories
Inventories are valued at the lower of cost and net realisable value. Cost is determined on the weighted average cost method. The cost of inventories comprises of direct cost of materials and related expenses. Net realisable value is the price at which inventories can be sold in the normal course of business after allowing for the costs of realisation. An allowance is made where necessary for obsolete, slow moving and defective items.
End of service benefits and leave allowance
End of service benefits are accrued in accordance with the terms of employment of the Group’s employees at the reporting date, having regard to the requirements of the Oman Labour Law 2003 as amended and UAE Labour Law. Employee entitlements to annual leave and leave passage are recognised when they accrue to employees and an accrual is made for the estimated liability as a result of services rendered by employees up to the reporting date.
Contributions to a defined contribution retirement plan and occupational hazard insurance for Omani employees in accordance with the Omani Social Insurances Law of 1991 are recognised as an expense in the profit or loss as incurred.
13
NOTES TO THE CONSOLIDATED FINANCIAL STATEMENTSFor the year ended 31 March 2015
4. Summary of significant accounting policies (continued)
Trade and other payables
Trade payables are recognised initially at fair value and subsequently measured at amortised cost using the effective interest rate method.
Liabilities are recognised for amounts to be paid for goods and services received, whether or not billed to the Group.
Borrowings
Borrowings are recognised initially at fair value, net of transaction costs incurred. Borrowings are subsequently stated at amortised cost; any difference between the proceeds (net of transaction costs) and the redemption value is recognised in profit or loss over the period of the borrowings using the effective interest method.
Provisions
A provision is recognised when the Group has a legal or constructive obligation as a result of a past event, and it is probable that an outflow of economic benefits will be required to settle the obligation. If the effect is material, provisions are determined by discounting the expected future cash flows at a pre-tax rate that reflects current market assessments of the time value of money and, where appropriate, the risks specific to the liability.
Revenue recognition
Revenue from the sale of goods is stated at the fair value of the consideration received or receivable, net of returns and allowances, trade discounts and volume rebates. Revenue is recognised when the significant risks and rewards of ownership have been transferred to the buyer, recovery of the consideration is probable, the associated costs and possible return of goods can be estimated reliably, and there is no continuing management involvement with the goods.
Sales represent the invoiced value of fish supplied by the Group during the year. Sale of fishing rights is recognised on an accrual basis.
Foreign currency translation
Items included in the financial statements of each of the Group’s entities are measured using the currency of the primary economic environment in which the entity operates (‘the functional currency’). The consolidated financial statements are presented in ‘Rial Omani’, which is the Parent company’s functional and the Group’s presentation currency.
Foreign currency transactions are translated into the functional currency using the exchange rates prevailing at the dates of the transactions or valuation where items are re-measured. Foreign exchange gains and losses resulting from the settlement of such transactions and from the translation at year-end exchange rates of monetary assets and liabilities denominated in foreign currencies are recognised in the profit or loss.
The accounting records of the subsidiary, Oman Fisheries Co. FZE are maintained in UAE Dirhams (AED). The Rial Omani amounts included in the consolidated financial statements have been translated at an exchange rate of 0.105 Omani Rial to each AED for the profit or loss and the statement of financial position items, as the AED to RO exchange rate has effectively remained fixed during the year, both currencies being pegged to the US Dollar.
Finance costs and income
Finance cost comprises of interest payable on loans and finance income comprises of interest income from deposits and held-to-maturity financial assets. Finance income and cost are accounted on accrual basis using the effective interest rate method.
14
NOTES TO THE CONSOLIDATED FINANCIAL STATEMENTSFor the year ended 31 March 2015
4. Summary of significant accounting policies (continued)
Operating leases
Leases in which a significant portion of the risks and rewards of ownership are retained by the lessor are classified as operating leases. Payments made under operating leases are included in ‘other operating expense’ in the profit or loss on a straight-line basis over the period of the lease.
Earnings per share
The Group presents basic earnings per share (EPS) data for its ordinary shares. Basic EPS is calculated by dividing the profit or loss attributable to ordinary shareholders of the Parent company / Group by the weighted average number of ordinary shares outstanding during the period.
Directors’ remuneration
The Directors’ remuneration is governed as set out by the Commercial Companies Law and the rules prescribed by the Capital Market Authority. The Annual General Meeting shall approve the remuneration and the sitting fees for the Board of Directors and its sub-committees provided that such fees shall not exceed a minimum of 5% of the annual net profit after deduction of the legal reserve and the optional reserve as distribution of dividends to the shareholders. Such fees shall not exceed RO 200,000 in one year. The sitting fees for each Director shall not exceed RO 10,000 in one year.
Dividend distribution
Dividend distribution to the Company’s shareholders is recognised as a liability in the Company’s financial statements in the period in which the dividends are approved by the Company’s shareholders.
Taxation
Current tax is recognised in the profit or loss as the expected tax payable on the taxable income for the year, using tax rates enacted or substantially enacted at the reporting date, and any adjustment to tax payable in respect of previous years.
Deferred income tax is provided, using the liability method, for all temporary differences arising between the tax bases of assets and liabilities and their carrying values for financial reporting purposes. Currently enacted tax rates are used to determine deferred tax. Deferred income tax assets and liabilities are offset as there is a legally enforceable right to offset these in Oman.
The principal temporary differences arise from depreciation on property, plant and equipment, allowance for doubtful debts and allowance for slow moving inventories.
A deferred tax asset is recognised only to the extent that it is probable that future taxable profits will be available against which the asset can be utilised and is subsequently reduced to the extent that it is no longer probable that the related tax benefit will be realised.
Segment reporting
Operating segments are reported in a manner consistent with the internal reporting provided to the chief operating decision-maker. The chief operating decision maker, who is responsible for allocating resources and assessing performance of the operating segments, make strategic decisions and has been identified as the
Board of Directors.
15
NOTES TO THE CONSOLIDATED FINANCIAL STATEMENTSFor the year ended 31 March 2015
5. Critical accounting estimates and judgements
The preparation of the financial statements, as per IFRS, requires management to make estimates and assumptions that affect the reported amount of assets and liabilities at the reporting date and the resultant provisions and changes in fair value for the year. Such estimates are necessarily based on assumptions about several factors involving varying, and possibly significant, degrees of judgment and uncertainty and actual results may differ from management’s estimates resulting in future changes in estimated assets and liabilities.
Key sources of estimation uncertainty
The following are the key assumptions concerning the future, and other key sources of estimation uncertainty at the reporting date, that have a significant risk of causing a material adjustment to the carrying amounts of assets and liabilities within the next financial year.
Useful lives of property, plant and equipment
Depreciation is charged so as to write off the cost of assets over their estimated useful lives. The calculation of useful lives is based on management’s assessment of various factors such as the operating cycles, the maintenance programs, and normal wear and tear using its best estimates.
Allowance for doubtful debts
Allowance for doubtful debts is based on management’s assessment of various factors such as the Group’s past experience of collecting receivables from the customers and the age of debts.
Allowance for slow moving inventories
Allowance for slow moving inventories is based on management’s assessment of various factors such as the usability, maintenance programs, and normal wear and tear using best estimates.
6. Property, plant and equipment
Parent company Land, buildings
and cabins
Plant and equipment
Boats and trawlers
Motor vehicles
Furniture, fixture
and office equipment
Capital work-in-progress
Total
RO RO RO RO RO RO RO
Cost
At 1 April 2013 1,951,521 2,531,892 951,395 487,029 335,680 1,021,461 7,278,978
Additions 130,839 72,816 75,068 340,746 50,667 2,220,350 2,890,486
Transfers 49,000 42,466 131,718 - 93,167 (316,351) -
Disposals - - (40,901) (41,528) - - (82,429)
At 1 April 2014 2,131,360 2,647,174 1,117,280 786,247 479,514 2,925,460 10,087,035
Additions 633,657 487,667 7,680 179,635 41,148 139,550 1,489,337
Transfers 1,094,992 816,834 107,382 - - (2,019,208) -
Disposals - - (56,556) (339,146) - - (395,702)
At 31 March 2015 3,860,009 3,951,675 1,175,786 626,736 520,662 1,045,802 11,180,670
16
NOTES TO THE CONSOLIDATED FINANCIAL STATEMENTSFor the year ended 31 March 2015
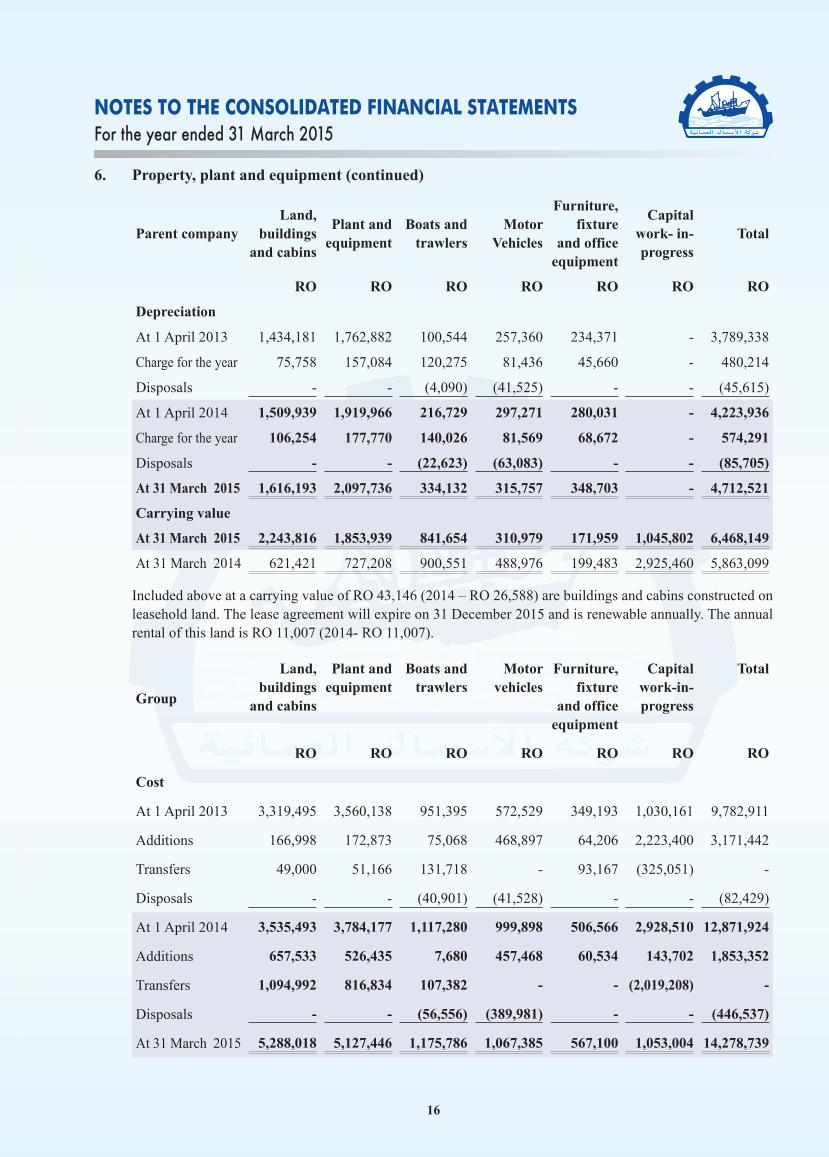
6. Property, plant and equipment (continued)
Parent companyLand,
buildings and cabins
Plant and equipment
Boats and trawlers
Motor Vehicles
Furniture, fixture
and office equipment
Capital work- in-progress
Total
RO RO RO RO RO RO RO
Depreciation
At 1 April 2013 1,434,181 1,762,882 100,544 257,360 234,371 - 3,789,338
Charge for the year 75,758 157,084 120,275 81,436 45,660 - 480,214
Disposals - - (4,090) (41,525) - - (45,615)
At 1 April 2014 1,509,939 1,919,966 216,729 297,271 280,031 - 4,223,936
Charge for the year 106,254 177,770 140,026 81,569 68,672 - 574,291
Disposals - - (22,623) (63,083) - - (85,705)
At 31 March 2015 1,616,193 2,097,736 334,132 315,757 348,703 - 4,712,521
Carrying value
At 31 March 2015 2,243,816 1,853,939 841,654 310,979 171,959 1,045,802 6,468,149
At 31 March 2014 621,421 727,208 900,551 488,976 199,483 2,925,460 5,863,099
Included above at a carrying value of RO 43,146 (2014 – RO 26,588) are buildings and cabins constructed on leasehold land. The lease agreement will expire on 31 December 2015 and is renewable annually. The annual rental of this land is RO 11,007 (2014- RO 11,007).
Group
Land, buildings
and cabins
Plant and equipment
Boats and trawlers
Motor vehicles
Furniture, fixture
and office equipment
Capital work-in-progress
Total
RO RO RO RO RO RO RO
Cost
At 1 April 2013 3,319,495 3,560,138 951,395 572,529 349,193 1,030,161 9,782,911
Additions 166,998 172,873 75,068 468,897 64,206 2,223,400 3,171,442
Transfers 49,000 51,166 131,718 - 93,167 (325,051) -
Disposals - - (40,901) (41,528) - - (82,429)
At 1 April 2014 3,535,493 3,784,177 1,117,280 999,898 506,566 2,928,510 12,871,924
Additions 657,533 526,435 7,680 457,468 60,534 143,702 1,853,352
Transfers 1,094,992 816,834 107,382 - - (2,019,208) -
Disposals - - (56,556) (389,981) - - (446,537)
At 31 March 2015 5,288,018 5,127,446 1,175,786 1,067,385 567,100 1,053,004 14,278,739
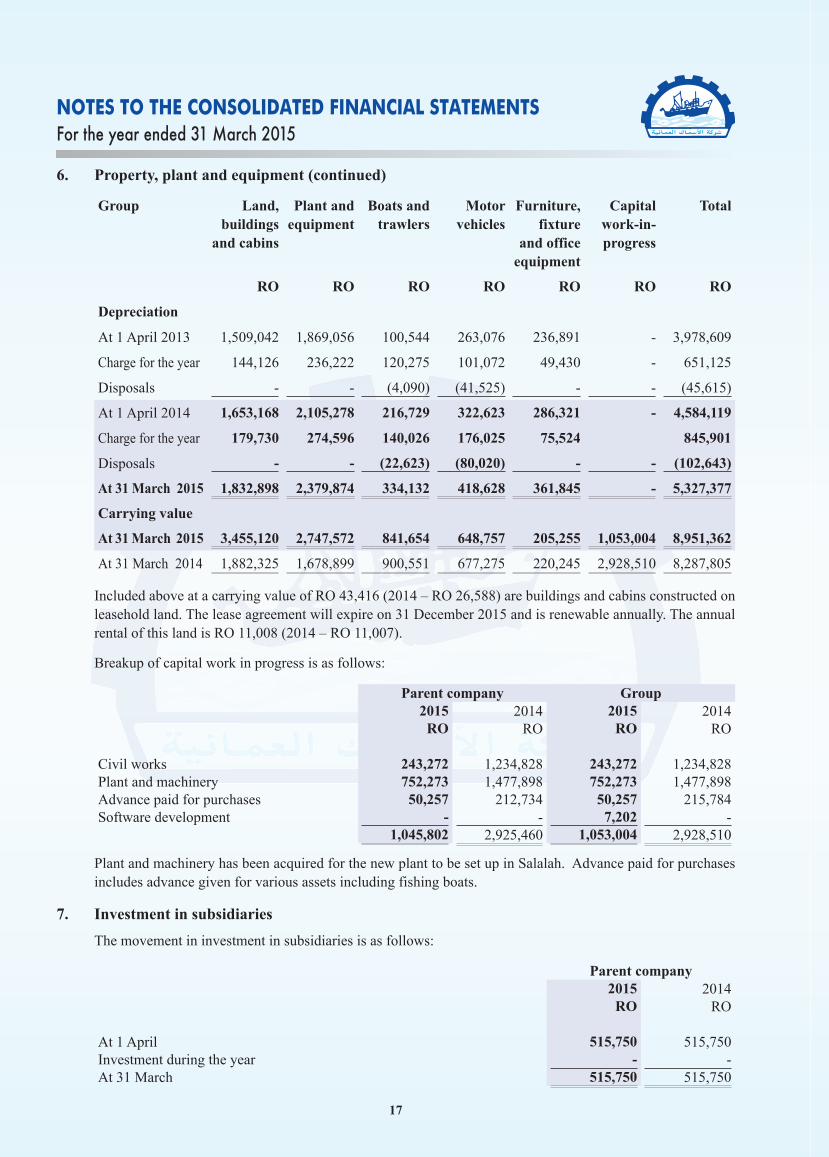
17
NOTES TO THE CONSOLIDATED FINANCIAL STATEMENTSFor the year ended 31 March 2015
6. Property, plant and equipment (continued)
Group Land, buildings
and cabins
Plant and equipment
Boats and trawlers
Motor vehicles
Furniture, fixture
and office equipment
Capital work-in-progress
Total
RO RO RO RO RO RO RO
Depreciation
At 1 April 2013 1,509,042 1,869,056 100,544 263,076 236,891 - 3,978,609
Charge for the year 144,126 236,222 120,275 101,072 49,430 - 651,125
Disposals - - (4,090) (41,525) - - (45,615)
At 1 April 2014 1,653,168 2,105,278 216,729 322,623 286,321 - 4,584,119
Charge for the year 179,730 274,596 140,026 176,025 75,524 845,901
Disposals - - (22,623) (80,020) - - (102,643)
At 31 March 2015 1,832,898 2,379,874 334,132 418,628 361,845 - 5,327,377
Carrying value
At 31 March 2015 3,455,120 2,747,572 841,654 648,757 205,255 1,053,004 8,951,362
At 31 March 2014 1,882,325 1,678,899 900,551 677,275 220,245 2,928,510 8,287,805
Included above at a carrying value of RO 43,416 (2014 – RO 26,588) are buildings and cabins constructed on leasehold land. The lease agreement will expire on 31 December 2015 and is renewable annually. The annual rental of this land is RO 11,008 (2014 – RO 11,007).
Breakup of capital work in progress is as follows:
Parent company Group 2015 2014 2015 2014
RO RO RO RO
Civil works 243,272 1,234,828 243,272 1,234,828Plant and machinery 752,273 1,477,898 752,273 1,477,898Advance paid for purchases 50,257 212,734 50,257 215,784Software development - - 7,202 -
1,045,802 2,925,460 1,053,004 2,928,510
Plant and machinery has been acquired for the new plant to be set up in Salalah. Advance paid for purchases includes advance given for various assets including fishing boats.
7. Investment in subsidiaries
The movement in investment in subsidiaries is as follows:
Parent company2015 2014RO RO
At 1 April 515,750 515,750Investment during the year - -At 31 March 515,750 515,750
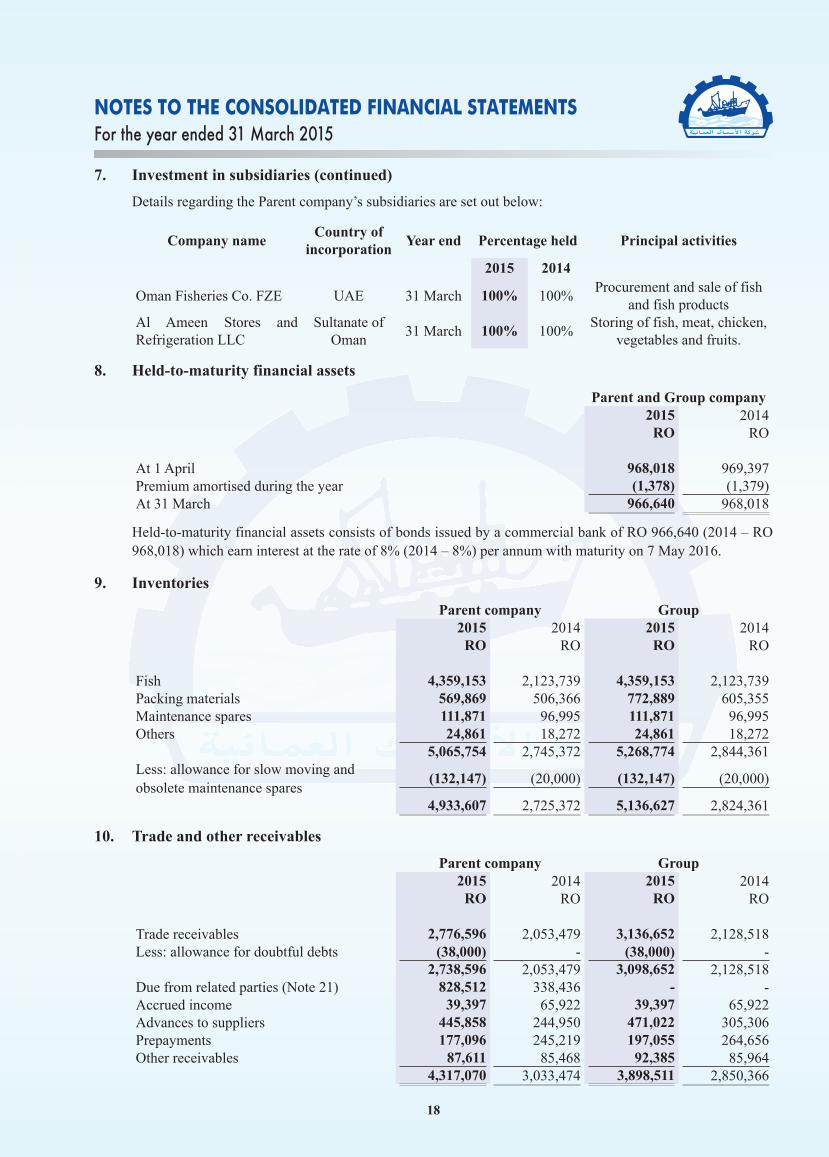
18
NOTES TO THE CONSOLIDATED FINANCIAL STATEMENTSFor the year ended 31 March 2015
7. Investment in subsidiaries (continued)
Details regarding the Parent company’s subsidiaries are set out below:
Company nameCountry of
incorporationYear end Percentage held Principal activities
2015 2014
Oman Fisheries Co. FZE UAE 31 March 100% 100%Procurement and sale of fish
and fish productsAl Ameen Stores and Refrigeration LLC
Sultanate of Oman
31 March 100% 100%Storing of fish, meat, chicken,
vegetables and fruits.
8. Held-to-maturity financial assets
Parent and Group company 2015 2014
RO RO
At 1 April 968,018 969,397Premium amortised during the year (1,378) (1,379)At 31 March 966,640 968,018
Held-to-maturity financial assets consists of bonds issued by a commercial bank of RO 966,640 (2014 – RO 968,018) which earn interest at the rate of 8% (2014 – 8%) per annum with maturity on 7 May 2016.
9. Inventories
Parent company Group 2015 2014 2015 2014
RO RO RO RO
Fish 4,359,153 2,123,739 4,359,153 2,123,739Packing materials 569,869 506,366 772,889 605,355Maintenance spares 111,871 96,995 111,871 96,995Others 24,861 18,272 24,861 18,272
5,065,754 2,745,372 5,268,774 2,844,361Less: allowance for slow moving and obsolete maintenance spares
(132,147) (20,000) (132,147) (20,000)
4,933,607 2,725,372 5,136,627 2,824,361
10. Trade and other receivables
Parent company Group 2015 2014 2015 2014
RO RO RO RO
Trade receivables 2,776,596 2,053,479 3,136,652 2,128,518Less: allowance for doubtful debts (38,000) - (38,000) -
2,738,596 2,053,479 3,098,652 2,128,518Due from related parties (Note 21) 828,512 338,436 - -Accrued income 39,397 65,922 39,397 65,922Advances to suppliers 445,858 244,950 471,022 305,306Prepayments 177,096 245,219 197,055 264,656Other receivables 87,611 85,468 92,385 85,964
4,317,070 3,033,474 3,898,511 2,850,366
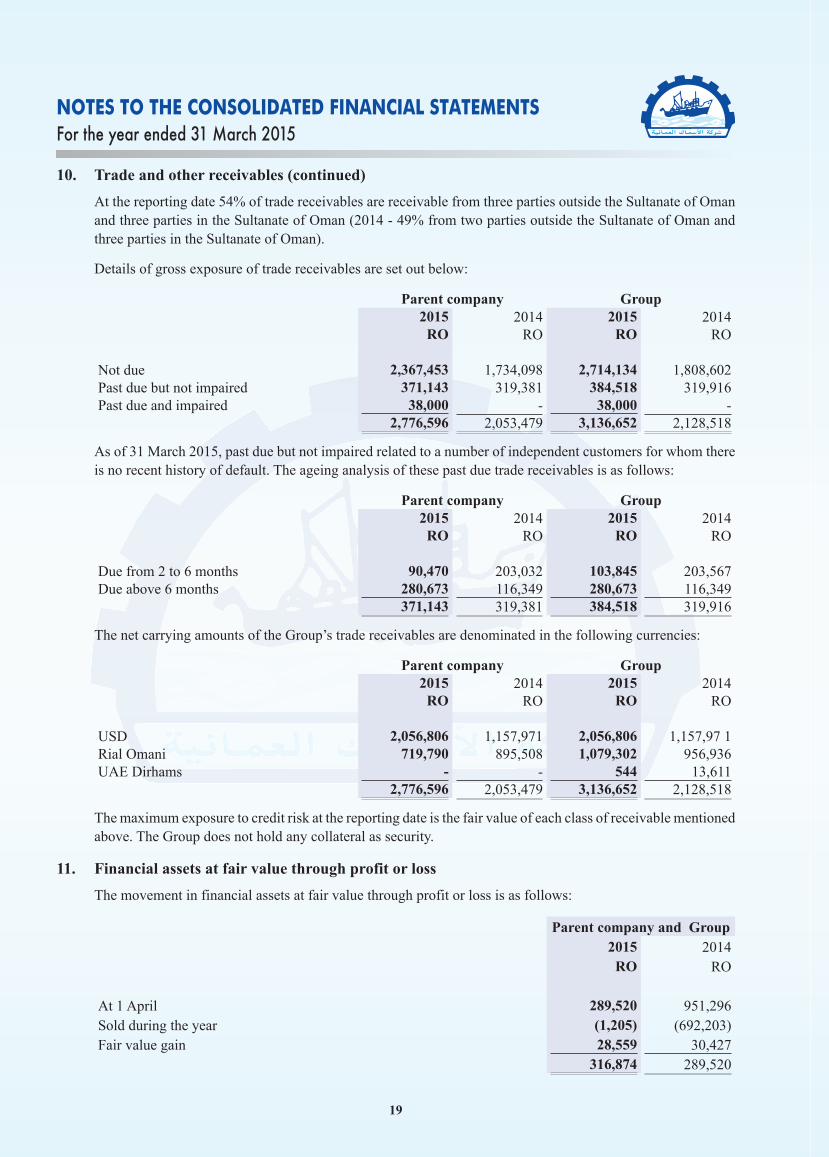
19
NOTES TO THE CONSOLIDATED FINANCIAL STATEMENTSFor the year ended 31 March 2015
10. Trade and other receivables (continued)
At the reporting date 54% of trade receivables are receivable from three parties outside the Sultanate of Oman and three parties in the Sultanate of Oman (2014 - 49% from two parties outside the Sultanate of Oman and three parties in the Sultanate of Oman).
Details of gross exposure of trade receivables are set out below:
Parent company Group 2015 2014 2015 2014
RO RO RO RO
Not due 2,367,453 1,734,098 2,714,134 1,808,602Past due but not impaired 371,143 319,381 384,518 319,916Past due and impaired 38,000 - 38,000 -
2,776,596 2,053,479 3,136,652 2,128,518
As of 31 March 2015, past due but not impaired related to a number of independent customers for whom there is no recent history of default. The ageing analysis of these past due trade receivables is as follows:
Parent company Group 2015 2014 2015 2014
RO RO RO RO
Due from 2 to 6 months 90,470 203,032 103,845 203,567Due above 6 months 280,673 116,349 280,673 116,349
371,143 319,381 384,518 319,916
The net carrying amounts of the Group’s trade receivables are denominated in the following currencies:
Parent company Group 2015 2014 2015 2014
RO RO RO RO
USD 2,056,806 1,157,971 2,056,806 1,157,97 1Rial Omani 719,790 895,508 1,079,302 956,936UAE Dirhams - - 544 13,611
2,776,596 2,053,479 3,136,652 2,128,518
The maximum exposure to credit risk at the reporting date is the fair value of each class of receivable mentioned above. The Group does not hold any collateral as security.
11. Financial assets at fair value through profit or loss
The movement in financial assets at fair value through profit or loss is as follows:
Parent company and Group 2015 2014
RO RO
At 1 April 289,520 951,296Sold during the year (1,205) (692,203)Fair value gain 28,559 30,427
316,874 289,520
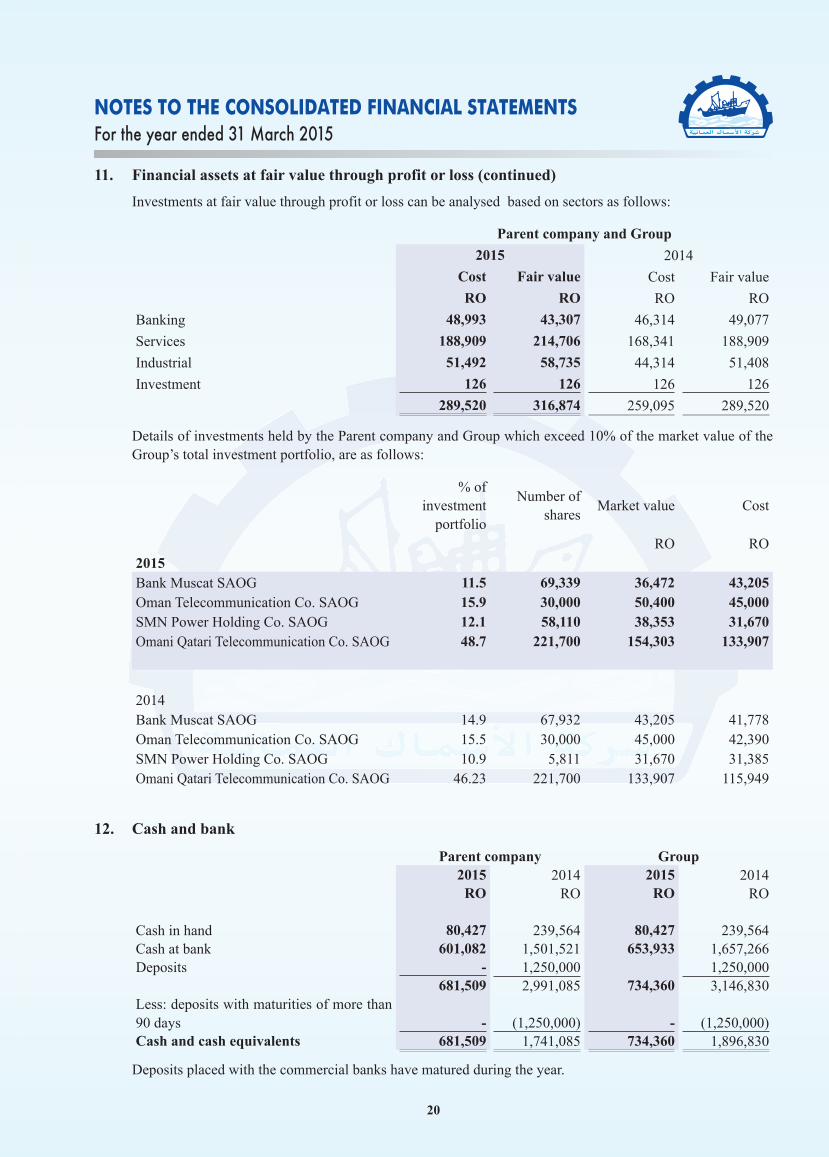
20
NOTES TO THE CONSOLIDATED FINANCIAL STATEMENTSFor the year ended 31 March 2015
11. Financial assets at fair value through profit or loss (continued)
Investments at fair value through profit or loss can be analysed based on sectors as follows:
Parent company and Group
2015 2014
Cost Fair value Cost Fair value
RO RO RO RO
Banking 48,993 43,307 46,314 49,077
Services 188,909 214,706 168,341 188,909
Industrial 51,492 58,735 44,314 51,408
Investment 126 126 126 126
289,520 316,874 259,095 289,520
Details of investments held by the Parent company and Group which exceed 10% of the market value of the Group’s total investment portfolio, are as follows:
% of investment
portfolio
Number of shares
Market value Cost
RO RO2015Bank Muscat SAOG 11.5 69,339 36,472 43,205Oman Telecommunication Co. SAOG 15.9 30,000 50,400 45,000SMN Power Holding Co. SAOG 12.1 58,110 38,353 31,670Omani Qatari Telecommunication Co. SAOG 48.7 221,700 154,303 133,907
2014Bank Muscat SAOG 14.9 67,932 43,205 41,778Oman Telecommunication Co. SAOG 15.5 30,000 45,000 42,390SMN Power Holding Co. SAOG 10.9 5,811 31,670 31,385Omani Qatari Telecommunication Co. SAOG 46.23 221,700 133,907 115,949
12. Cash and bank
Parent company Group 2015 2014 2015 2014
RO RO RO RO
Cash in hand 80,427 239,564 80,427 239,564Cash at bank 601,082 1,501,521 653,933 1,657,266Deposits - 1,250,000 1,250,000
681,509 2,991,085 734,360 3,146,830Less: deposits with maturities of more than 90 days - (1,250,000) - (1,250,000)Cash and cash equivalents 681,509 1,741,085 734,360 1,896,830
Deposits placed with the commercial banks have matured during the year.
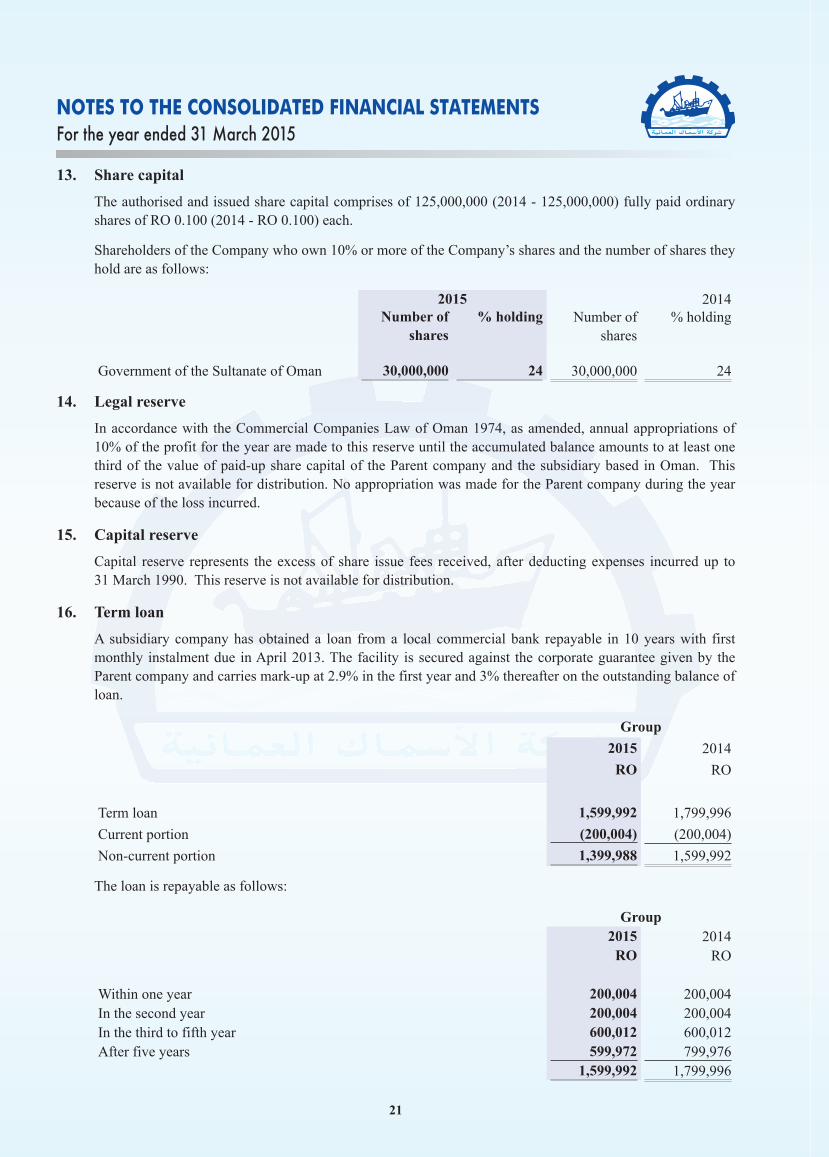
21
NOTES TO THE CONSOLIDATED FINANCIAL STATEMENTSFor the year ended 31 March 2015
13. Share capital
The authorised and issued share capital comprises of 125,000,000 (2014 - 125,000,000) fully paid ordinary shares of RO 0.100 (2014 - RO 0.100) each.
Shareholders of the Company who own 10% or more of the Company’s shares and the number of shares they hold are as follows:
2015 2014Number of
shares% holding Number of
shares% holding
Government of the Sultanate of Oman 30,000,000 24 30,000,000 24
14. Legal reserve
In accordance with the Commercial Companies Law of Oman 1974, as amended, annual appropriations of 10% of the profit for the year are made to this reserve until the accumulated balance amounts to at least one third of the value of paid-up share capital of the Parent company and the subsidiary based in Oman. This reserve is not available for distribution. No appropriation was made for the Parent company during the year because of the loss incurred.
15. Capital reserve
Capital reserve represents the excess of share issue fees received, after deducting expenses incurred up to 31 March 1990. This reserve is not available for distribution.
16. Term loan
A subsidiary company has obtained a loan from a local commercial bank repayable in 10 years with first monthly instalment due in April 2013. The facility is secured against the corporate guarantee given by the Parent company and carries mark-up at 2.9% in the first year and 3% thereafter on the outstanding balance of loan.
Group
2015 2014
RO RO
Term loan 1,599,992 1,799,996
Current portion (200,004) (200,004)
Non-current portion 1,399,988 1,599,992
The loan is repayable as follows:
Group2015 2014
RO RO
Within one year 200,004 200,004In the second year 200,004 200,004In the third to fifth year 600,012 600,012After five years 599,972 799,976
1,599,992 1,799,996
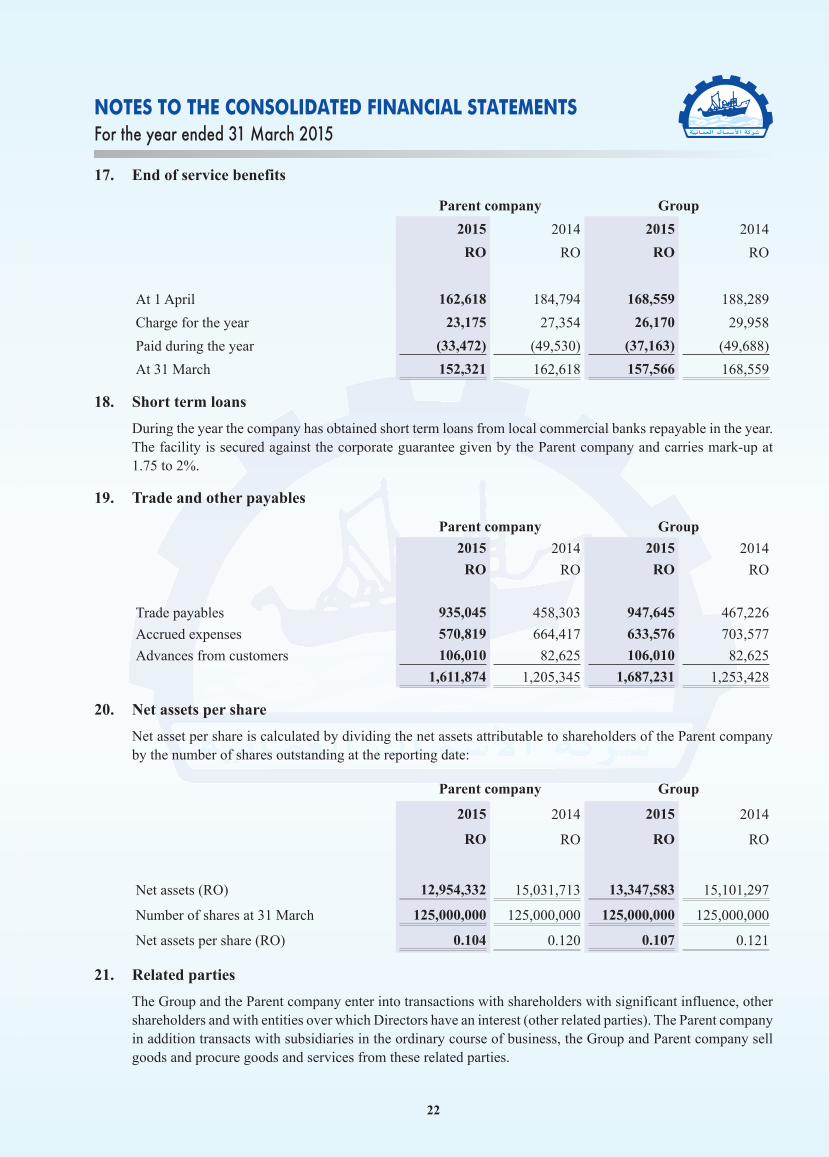
22
NOTES TO THE CONSOLIDATED FINANCIAL STATEMENTSFor the year ended 31 March 2015
17. End of service benefits
Parent company Group
2015 2014 2015 2014
RO RO RO RO
At 1 April 162,618 184,794 168,559 188,289
Charge for the year 23,175 27,354 26,170 29,958
Paid during the year (33,472) (49,530) (37,163) (49,688)
At 31 March 152,321 162,618 157,566 168,559
18. Short term loans
During the year the company has obtained short term loans from local commercial banks repayable in the year. The facility is secured against the corporate guarantee given by the Parent company and carries mark-up at 1.75 to 2%.
19. Trade and other payables
Parent company Group
2015 2014 2015 2014
RO RO RO RO
Trade payables 935,045 458,303 947,645 467,226
Accrued expenses 570,819 664,417 633,576 703,577
Advances from customers 106,010 82,625 106,010 82,625
1,611,874 1,205,345 1,687,231 1,253,428
20. Net assets per share
Net asset per share is calculated by dividing the net assets attributable to shareholders of the Parent company by the number of shares outstanding at the reporting date:
Parent company Group
2015 2014 2015 2014
RO RO RO RO
Net assets (RO) 12,954,332 15,031,713 13,347,583 15,101,297
Number of shares at 31 March 125,000,000 125,000,000 125,000,000 125,000,000
Net assets per share (RO) 0.104 0.120 0.107 0.121
21. Related parties
The Group and the Parent company enter into transactions with shareholders with significant influence, other shareholders and with entities over which Directors have an interest (other related parties). The Parent company in addition transacts with subsidiaries in the ordinary course of business, the Group and Parent company sell goods and procure goods and services from these related parties.
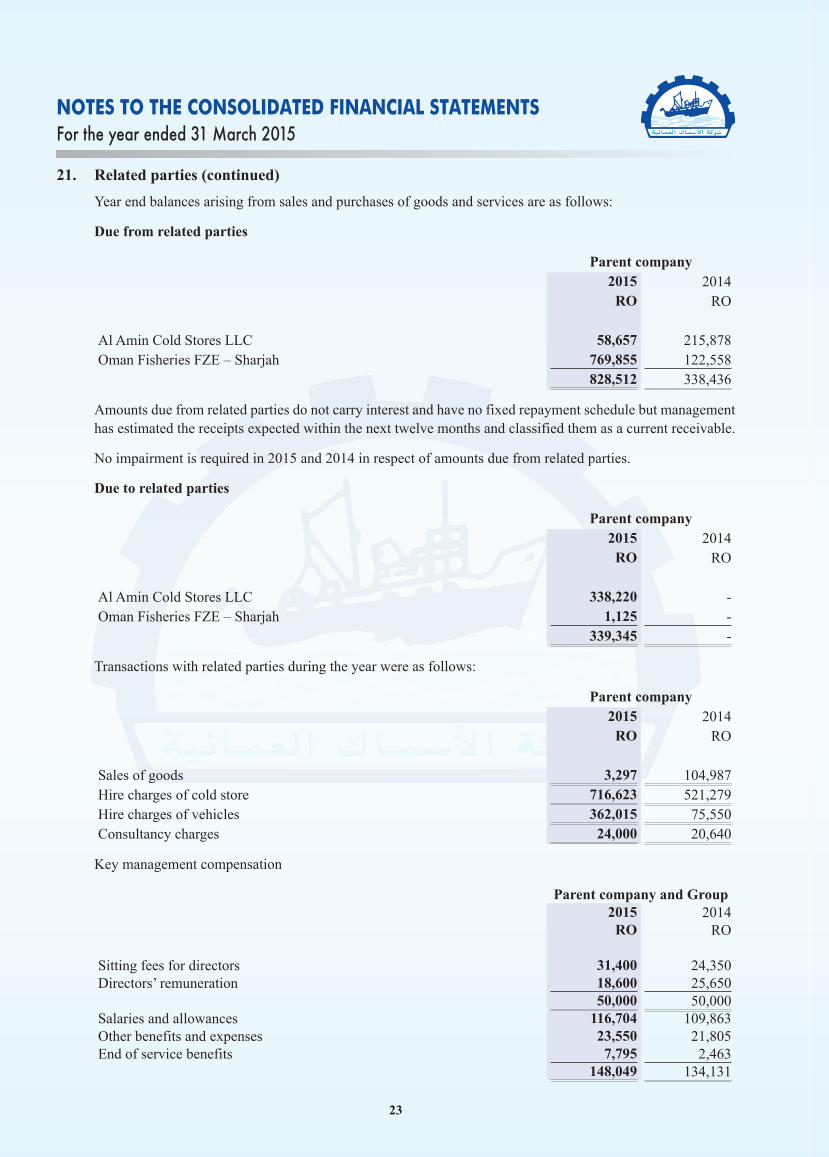
23
NOTES TO THE CONSOLIDATED FINANCIAL STATEMENTSFor the year ended 31 March 2015
21. Related parties (continued)
Year end balances arising from sales and purchases of goods and services are as follows:
Due from related parties
Parent company 2015 2014
RO RO
Al Amin Cold Stores LLC 58,657 215,878Oman Fisheries FZE – Sharjah 769,855 122,558
828,512 338,436
Amounts due from related parties do not carry interest and have no fixed repayment schedule but management has estimated the receipts expected within the next twelve months and classified them as a current receivable.
No impairment is required in 2015 and 2014 in respect of amounts due from related parties.
Due to related parties
Parent company 2015 2014
RO RO
Al Amin Cold Stores LLC 338,220 -Oman Fisheries FZE – Sharjah 1,125 -
339,345 -
Transactions with related parties during the year were as follows:
Parent company 2015 2014
RO RO
Sales of goods 3,297 104,987Hire charges of cold store 716,623 521,279Hire charges of vehicles 362,015 75,550Consultancy charges 24,000 20,640
Key management compensation
Parent company and Group 2015 2014
RO RO
Sitting fees for directors 31,400 24,350Directors’ remuneration 18,600 25,650
50,000 50,000Salaries and allowances 116,704 109,863Other benefits and expenses 23,550 21,805End of service benefits 7,795 2,463
148,049 134,131
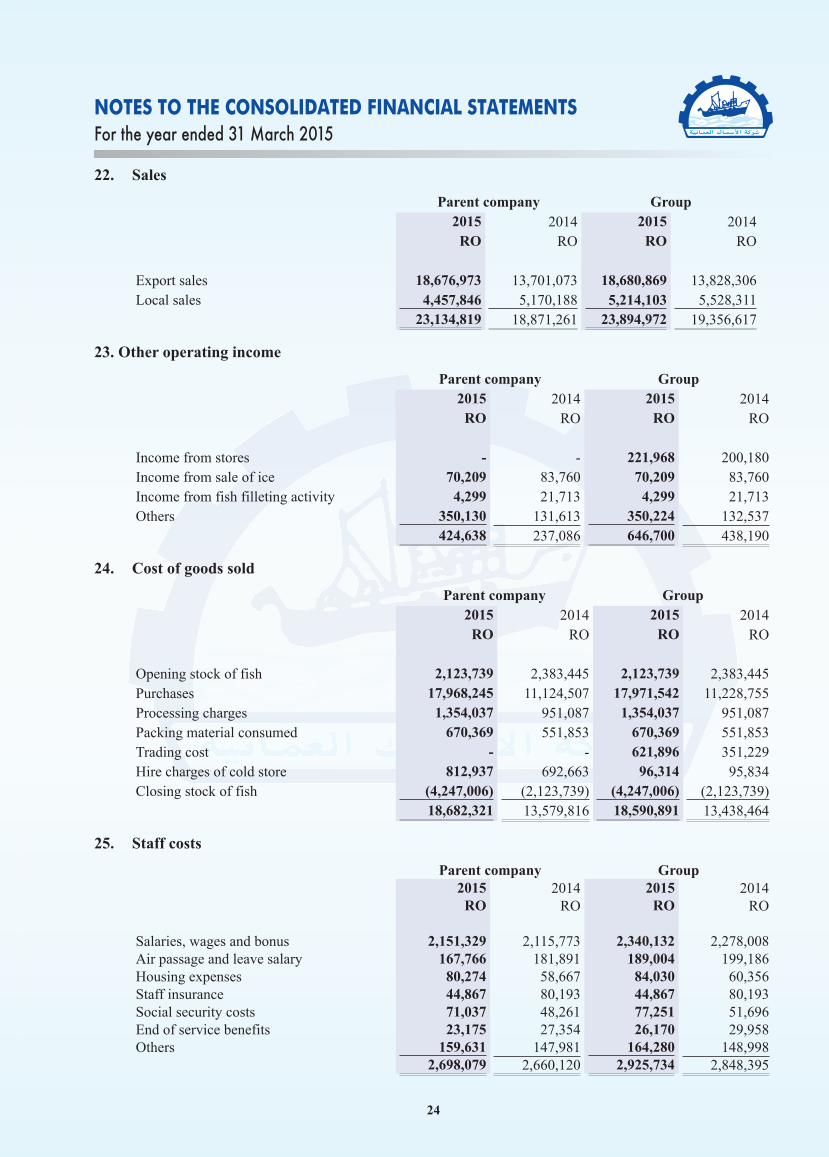
24
NOTES TO THE CONSOLIDATED FINANCIAL STATEMENTSFor the year ended 31 March 2015
22. Sales
Parent company Group 2015 2014 2015 2014
RO RO RO RO
Export sales 18,676,973 13,701,073 18,680,869 13,828,306Local sales 4,457,846 5,170,188 5,214,103 5,528,311
23,134,819 18,871,261 23,894,972 19,356,617
23. Other operating income
Parent company Group 2015 2014 2015 2014
RO RO RO RO
Income from stores - - 221,968 200,180Income from sale of ice 70,209 83,760 70,209 83,760Income from fish filleting activity 4,299 21,713 4,299 21,713Others 350,130 131,613 350,224 132,537
424,638 237,086 646,700 438,190
24. Cost of goods sold
Parent company Group 2015 2014 2015 2014
RO RO RO RO
Opening stock of fish 2,123,739 2,383,445 2,123,739 2,383,445Purchases 17,968,245 11,124,507 17,971,542 11,228,755Processing charges 1,354,037 951,087 1,354,037 951,087Packing material consumed 670,369 551,853 670,369 551,853Trading cost - - 621,896 351,229Hire charges of cold store 812,937 692,663 96,314 95,834Closing stock of fish (4,247,006) (2,123,739) (4,247,006) (2,123,739)
18,682,321 13,579,816 18,590,891 13,438,464
25. Staff costs
Parent company Group 2015 2014 2015 2014
RO RO RO RO
Salaries, wages and bonus 2,151,329 2,115,773 2,340,132 2,278,008Air passage and leave salary 167,766 181,891 189,004 199,186Housing expenses 80,274 58,667 84,030 60,356Staff insurance 44,867 80,193 44,867 80,193Social security costs 71,037 48,261 77,251 51,696End of service benefits 23,175 27,354 26,170 29,958Others 159,631 147,981 164,280 148,998
2,698,079 2,660,120 2,925,734 2,848,395
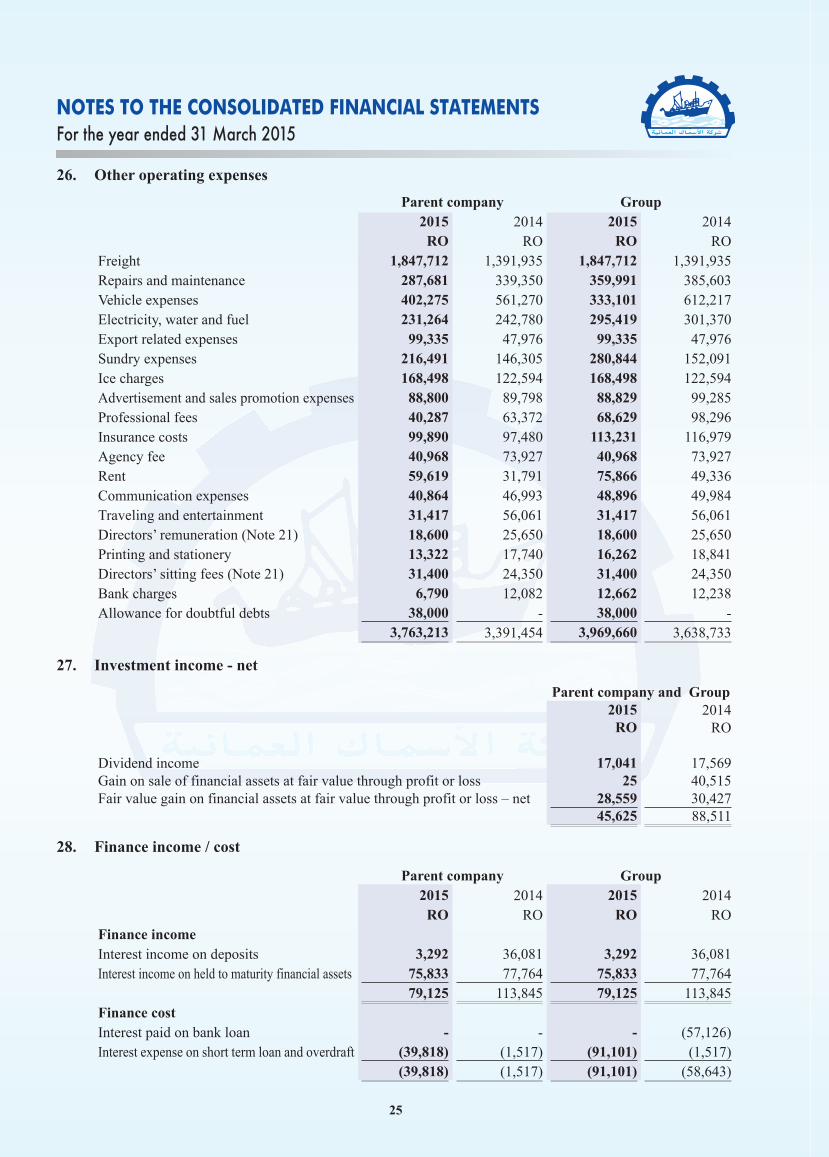
25
NOTES TO THE CONSOLIDATED FINANCIAL STATEMENTSFor the year ended 31 March 2015
26. Other operating expenses
Parent company Group2015 2014 2015 2014
RO RO RO ROFreight 1,847,712 1,391,935 1,847,712 1,391,935Repairs and maintenance 287,681 339,350 359,991 385,603Vehicle expenses 402,275 561,270 333,101 612,217Electricity, water and fuel 231,264 242,780 295,419 301,370Export related expenses 99,335 47,976 99,335 47,976Sundry expenses 216,491 146,305 280,844 152,091Ice charges 168,498 122,594 168,498 122,594Advertisement and sales promotion expenses 88,800 89,798 88,829 99,285Professional fees 40,287 63,372 68,629 98,296Insurance costs 99,890 97,480 113,231 116,979Agency fee 40,968 73,927 40,968 73,927Rent 59,619 31,791 75,866 49,336Communication expenses 40,864 46,993 48,896 49,984Traveling and entertainment 31,417 56,061 31,417 56,061Directors’ remuneration (Note 21) 18,600 25,650 18,600 25,650Printing and stationery 13,322 17,740 16,262 18,841Directors’ sitting fees (Note 21) 31,400 24,350 31,400 24,350Bank charges 6,790 12,082 12,662 12,238Allowance for doubtful debts 38,000 - 38,000 -
3,763,213 3,391,454 3,969,660 3,638,733
27. Investment income - net
Parent company and Group2015 2014RO RO
Dividend income 17,041 17,569Gain on sale of financial assets at fair value through profit or loss 25 40,515Fair value gain on financial assets at fair value through profit or loss – net 28,559 30,427
45,625 88,511
28. Finance income / cost
Parent company Group2015 2014 2015 2014 RO RO RO RO
Finance incomeInterest income on deposits 3,292 36,081 3,292 36,081Interest income on held to maturity financial assets 75,833 77,764 75,833 77,764
79,125 113,845 79,125 113,845Finance costInterest paid on bank loan - - - (57,126)Interest expense on short term loan and overdraft (39,818) (1,517) (91,101) (1,517)
(39,818) (1,517) (91,101) (58,643)
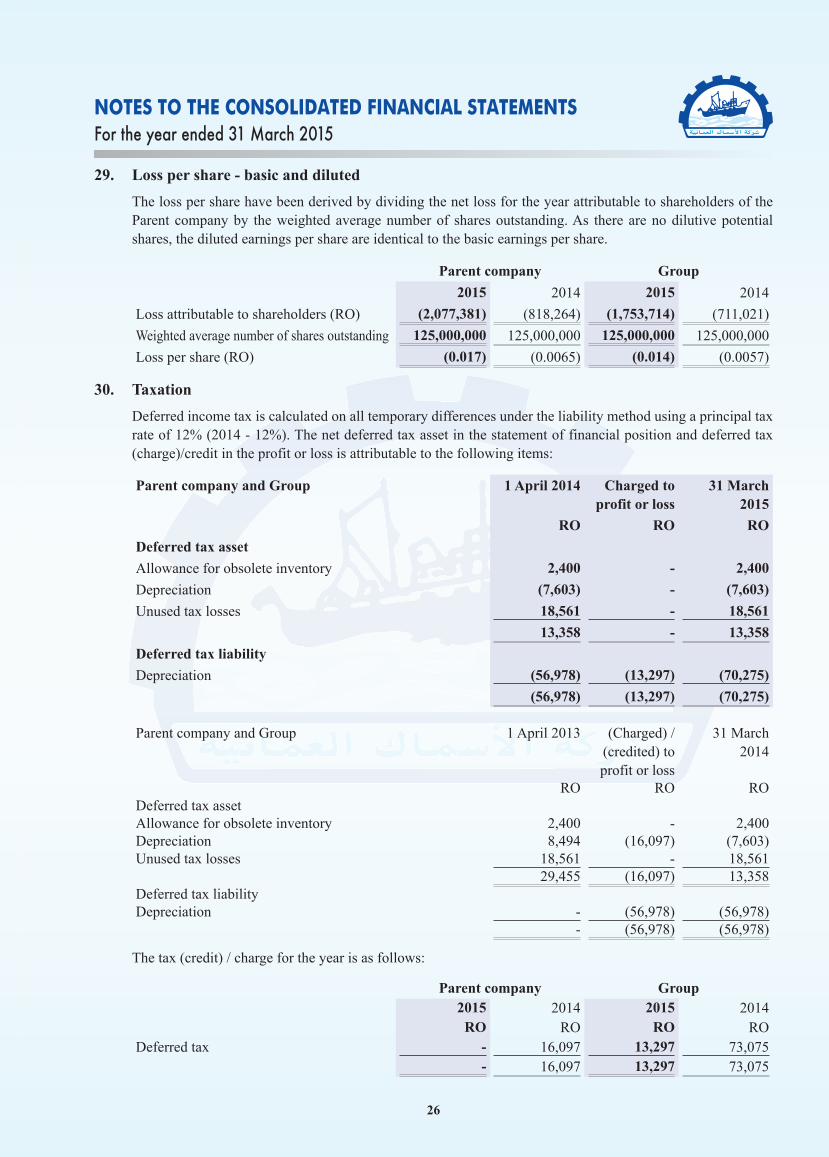
26
NOTES TO THE CONSOLIDATED FINANCIAL STATEMENTSFor the year ended 31 March 2015
29. Loss per share - basic and diluted
The loss per share have been derived by dividing the net loss for the year attributable to shareholders of the Parent company by the weighted average number of shares outstanding. As there are no dilutive potential shares, the diluted earnings per share are identical to the basic earnings per share.
Parent company Group
2015 2014 2015 2014
Loss attributable to shareholders (RO) (2,077,381) (818,264) (1,753,714) (711,021)
Weighted average number of shares outstanding 125,000,000 125,000,000 125,000,000 125,000,000
Loss per share (RO) (0.017) (0.0065) (0.014) (0.0057)
30. Taxation
Deferred income tax is calculated on all temporary differences under the liability method using a principal tax rate of 12% (2014 - 12%). The net deferred tax asset in the statement of financial position and deferred tax (charge)/credit in the profit or loss is attributable to the following items:
Parent company and Group 1 April 2014 Charged to profit or loss
31 March 2015
RO RO RO
Deferred tax asset
Allowance for obsolete inventory 2,400 - 2,400
Depreciation (7,603) - (7,603)
Unused tax losses 18,561 - 18,561
13,358 - 13,358
Deferred tax liability
Depreciation (56,978) (13,297) (70,275)
(56,978) (13,297) (70,275)
Parent company and Group 1 April 2013 (Charged) / (credited) to profit or loss
31 March 2014
RO RO RODeferred tax assetAllowance for obsolete inventory 2,400 - 2,400Depreciation 8,494 (16,097) (7,603)Unused tax losses 18,561 - 18,561
29,455 (16,097) 13,358Deferred tax liabilityDepreciation - (56,978) (56,978)
- (56,978) (56,978)
The tax (credit) / charge for the year is as follows:
Parent company Group2015 2014 2015 2014
RO RO RO RODeferred tax - 16,097 13,297 73,075
- 16,097 13,297 73,075
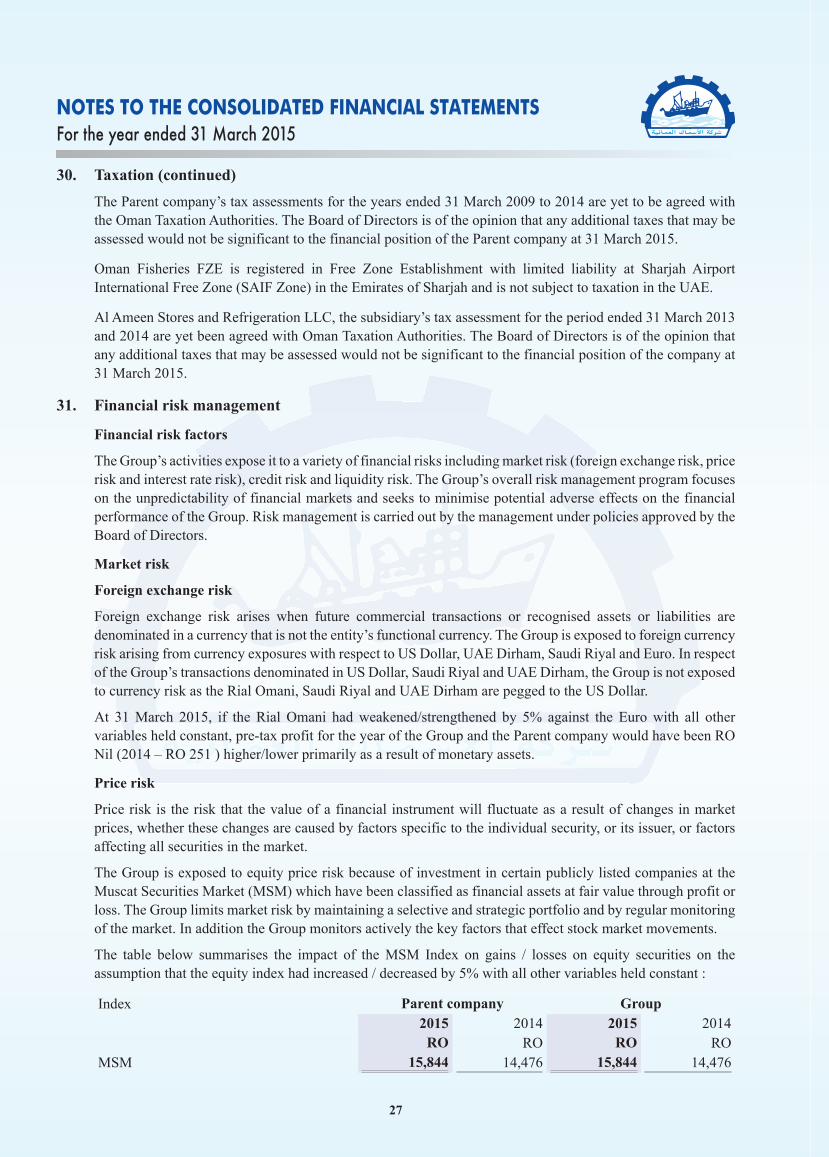
27
NOTES TO THE CONSOLIDATED FINANCIAL STATEMENTSFor the year ended 31 March 2015
30. Taxation (continued)
The Parent company’s tax assessments for the years ended 31 March 2009 to 2014 are yet to be agreed with the Oman Taxation Authorities. The Board of Directors is of the opinion that any additional taxes that may be assessed would not be significant to the financial position of the Parent company at 31 March 2015.
Oman Fisheries FZE is registered in Free Zone Establishment with limited liability at Sharjah Airport International Free Zone (SAIF Zone) in the Emirates of Sharjah and is not subject to taxation in the UAE.
Al Ameen Stores and Refrigeration LLC, the subsidiary’s tax assessment for the period ended 31 March 2013 and 2014 are yet been agreed with Oman Taxation Authorities. The Board of Directors is of the opinion that any additional taxes that may be assessed would not be significant to the financial position of the company at 31 March 2015.
31. Financial risk management
Financial risk factors
The Group’s activities expose it to a variety of financial risks including market risk (foreign exchange risk, price risk and interest rate risk), credit risk and liquidity risk. The Group’s overall risk management program focuses on the unpredictability of financial markets and seeks to minimise potential adverse effects on the financial performance of the Group. Risk management is carried out by the management under policies approved by the Board of Directors.
Market risk
Foreign exchange risk
Foreign exchange risk arises when future commercial transactions or recognised assets or liabilities are denominated in a currency that is not the entity’s functional currency. The Group is exposed to foreign currency risk arising from currency exposures with respect to US Dollar, UAE Dirham, Saudi Riyal and Euro. In respect of the Group’s transactions denominated in US Dollar, Saudi Riyal and UAE Dirham, the Group is not exposed to currency risk as the Rial Omani, Saudi Riyal and UAE Dirham are pegged to the US Dollar.
At 31 March 2015, if the Rial Omani had weakened/strengthened by 5% against the Euro with all other variables held constant, pre-tax profit for the year of the Group and the Parent company would have been RO Nil (2014 – RO 251 ) higher/lower primarily as a result of monetary assets.
Price risk
Price risk is the risk that the value of a financial instrument will fluctuate as a result of changes in market prices, whether these changes are caused by factors specific to the individual security, or its issuer, or factors affecting all securities in the market.
The Group is exposed to equity price risk because of investment in certain publicly listed companies at the Muscat Securities Market (MSM) which have been classified as financial assets at fair value through profit or loss. The Group limits market risk by maintaining a selective and strategic portfolio and by regular monitoring of the market. In addition the Group monitors actively the key factors that effect stock market movements.
The table below summarises the impact of the MSM Index on gains / losses on equity securities on the assumption that the equity index had increased / decreased by 5% with all other variables held constant :
Index Parent company Group2015 2014 2015 2014
RO RO RO ROMSM 15,844 14,476 15,844 14,476
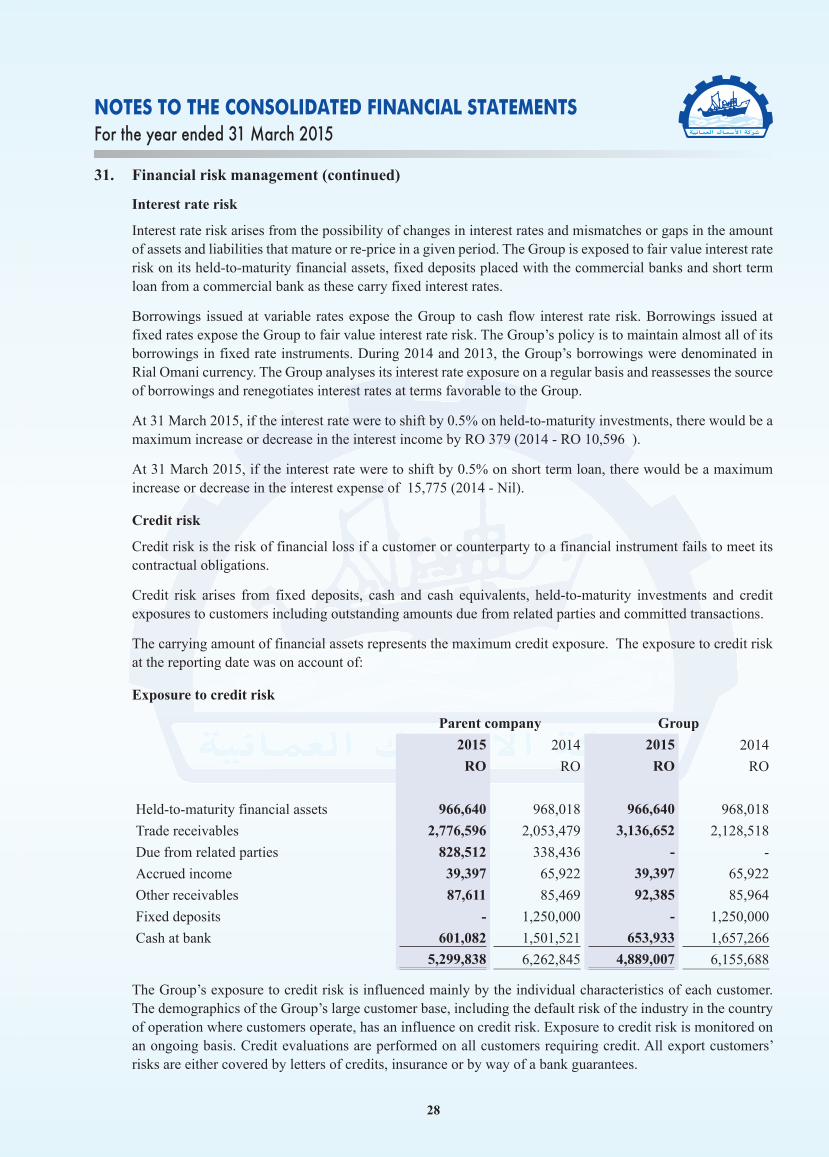
28
NOTES TO THE CONSOLIDATED FINANCIAL STATEMENTSFor the year ended 31 March 2015
31. Financial risk management (continued)
Interest rate risk
Interest rate risk arises from the possibility of changes in interest rates and mismatches or gaps in the amount of assets and liabilities that mature or re-price in a given period. The Group is exposed to fair value interest rate risk on its held-to-maturity financial assets, fixed deposits placed with the commercial banks and short term loan from a commercial bank as these carry fixed interest rates.
Borrowings issued at variable rates expose the Group to cash flow interest rate risk. Borrowings issued at fixed rates expose the Group to fair value interest rate risk. The Group’s policy is to maintain almost all of its borrowings in fixed rate instruments. During 2014 and 2013, the Group’s borrowings were denominated in Rial Omani currency. The Group analyses its interest rate exposure on a regular basis and reassesses the source of borrowings and renegotiates interest rates at terms favorable to the Group.
At 31 March 2015, if the interest rate were to shift by 0.5% on held-to-maturity investments, there would be a maximum increase or decrease in the interest income by RO 379 (2014 - RO 10,596 ).
At 31 March 2015, if the interest rate were to shift by 0.5% on short term loan, there would be a maximum increase or decrease in the interest expense of 15,775 (2014 - Nil).
Credit risk
Credit risk is the risk of financial loss if a customer or counterparty to a financial instrument fails to meet its contractual obligations.
Credit risk arises from fixed deposits, cash and cash equivalents, held-to-maturity investments and credit exposures to customers including outstanding amounts due from related parties and committed transactions.
The carrying amount of financial assets represents the maximum credit exposure. The exposure to credit risk at the reporting date was on account of:
Exposure to credit risk
Parent company Group
2015 2014 2015 2014
RO RO RO RO
Held-to-maturity financial assets 966,640 968,018 966,640 968,018
Trade receivables 2,776,596 2,053,479 3,136,652 2,128,518
Due from related parties 828,512 338,436 - -
Accrued income 39,397 65,922 39,397 65,922
Other receivables 87,611 85,469 92,385 85,964
Fixed deposits - 1,250,000 - 1,250,000
Cash at bank 601,082 1,501,521 653,933 1,657,266
5,299,838 6,262,845 4,889,007 6,155,688
The Group’s exposure to credit risk is influenced mainly by the individual characteristics of each customer. The demographics of the Group’s large customer base, including the default risk of the industry in the country of operation where customers operate, has an influence on credit risk. Exposure to credit risk is monitored on an ongoing basis. Credit evaluations are performed on all customers requiring credit. All export customers’ risks are either covered by letters of credits, insurance or by way of a bank guarantees.
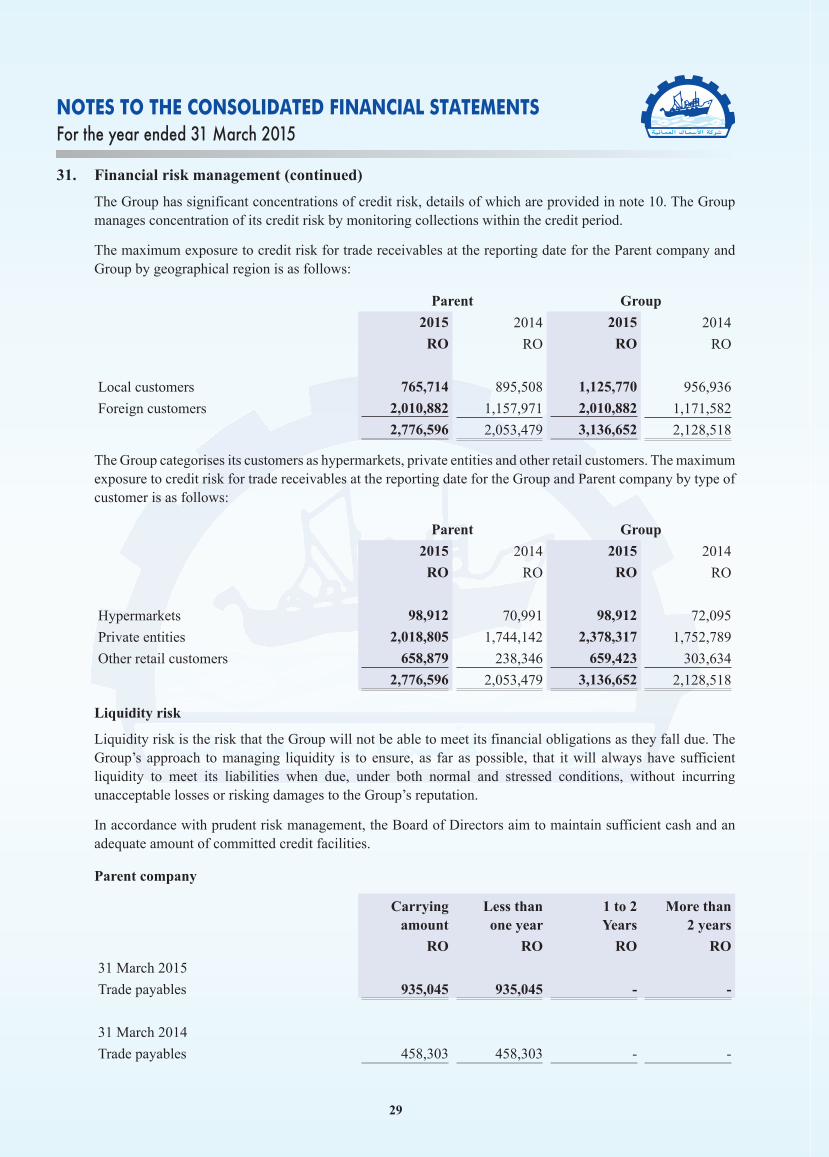
29
NOTES TO THE CONSOLIDATED FINANCIAL STATEMENTSFor the year ended 31 March 2015
31. Financial risk management (continued)
The Group has significant concentrations of credit risk, details of which are provided in note 10. The Group manages concentration of its credit risk by monitoring collections within the credit period.
The maximum exposure to credit risk for trade receivables at the reporting date for the Parent company and Group by geographical region is as follows:
Parent Group
2015 2014 2015 2014
RO RO RO RO
Local customers 765,714 895,508 1,125,770 956,936
Foreign customers 2,010,882 1,157,971 2,010,882 1,171,582
2,776,596 2,053,479 3,136,652 2,128,518
The Group categorises its customers as hypermarkets, private entities and other retail customers. The maximum exposure to credit risk for trade receivables at the reporting date for the Group and Parent company by type of customer is as follows:
Parent Group
2015 2014 2015 2014
RO RO RO RO
Hypermarkets 98,912 70,991 98,912 72,095
Private entities 2,018,805 1,744,142 2,378,317 1,752,789
Other retail customers 658,879 238,346 659,423 303,634
2,776,596 2,053,479 3,136,652 2,128,518
Liquidity risk
Liquidity risk is the risk that the Group will not be able to meet its financial obligations as they fall due. The Group’s approach to managing liquidity is to ensure, as far as possible, that it will always have sufficient liquidity to meet its liabilities when due, under both normal and stressed conditions, without incurring unacceptable losses or risking damages to the Group’s reputation.
In accordance with prudent risk management, the Board of Directors aim to maintain sufficient cash and an adequate amount of committed credit facilities.
Parent company
Carrying amount
Less than one year
1 to 2 Years
More than 2 years
RO RO RO RO
31 March 2015
Trade payables 935,045 935,045 - -
31 March 2014
Trade payables 458,303 458,303 - -
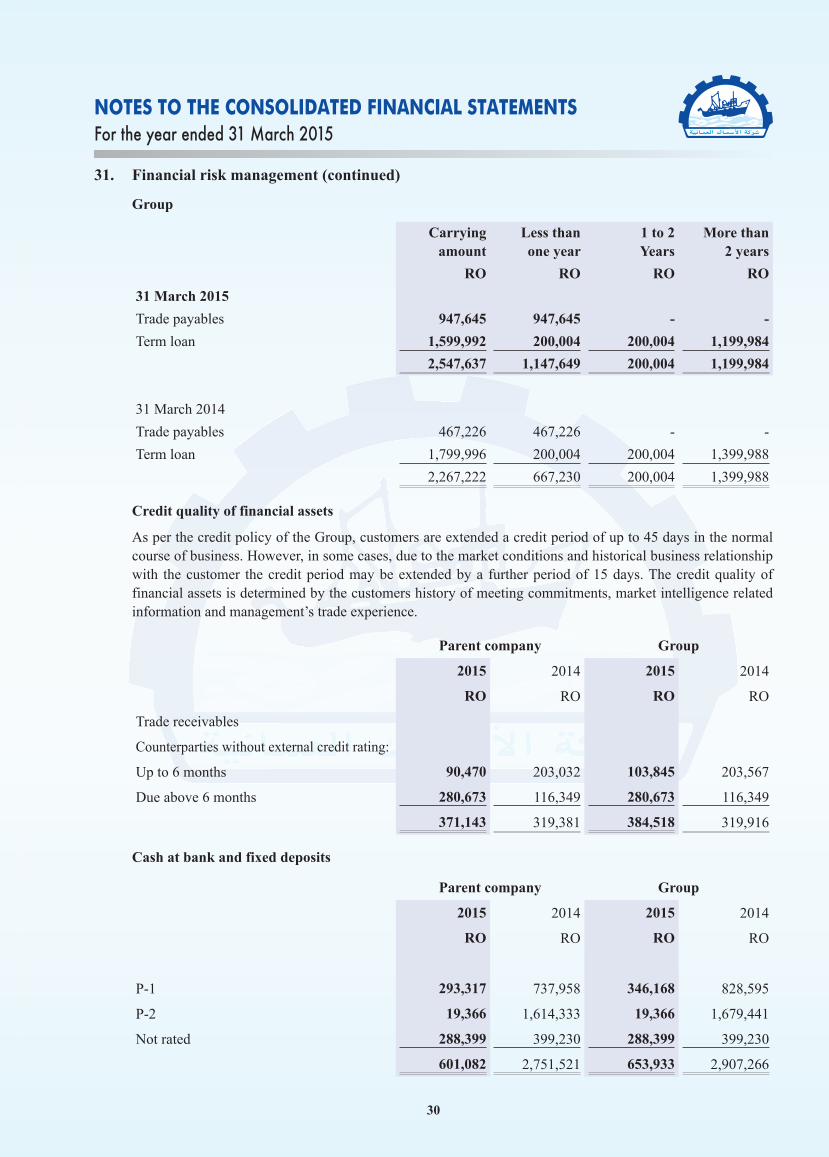
30
NOTES TO THE CONSOLIDATED FINANCIAL STATEMENTSFor the year ended 31 March 2015
31. Financial risk management (continued)
Group
Carrying amount
Less than one year
1 to 2 Years
More than 2 years
RO RO RO RO
31 March 2015
Trade payables 947,645 947,645 - -
Term loan 1,599,992 200,004 200,004 1,199,984
2,547,637 1,147,649 200,004 1,199,984
31 March 2014
Trade payables 467,226 467,226 - -
Term loan 1,799,996 200,004 200,004 1,399,988
2,267,222 667,230 200,004 1,399,988
Credit quality of financial assets
As per the credit policy of the Group, customers are extended a credit period of up to 45 days in the normal course of business. However, in some cases, due to the market conditions and historical business relationship with the customer the credit period may be extended by a further period of 15 days. The credit quality of financial assets is determined by the customers history of meeting commitments, market intelligence related information and management’s trade experience.
Parent company Group
2015 2014 2015 2014
RO RO RO RO
Trade receivables
Counterparties without external credit rating:
Up to 6 months 90,470 203,032 103,845 203,567
Due above 6 months 280,673 116,349 280,673 116,349
371,143 319,381 384,518 319,916
Cash at bank and fixed deposits
Parent company Group
2015 2014 2015 2014
RO RO RO RO
P-1 293,317 737,958 346,168 828,595
P-2 19,366 1,614,333 19,366 1,679,441
Not rated 288,399 399,230 288,399 399,230
601,082 2,751,521 653,933 2,907,266
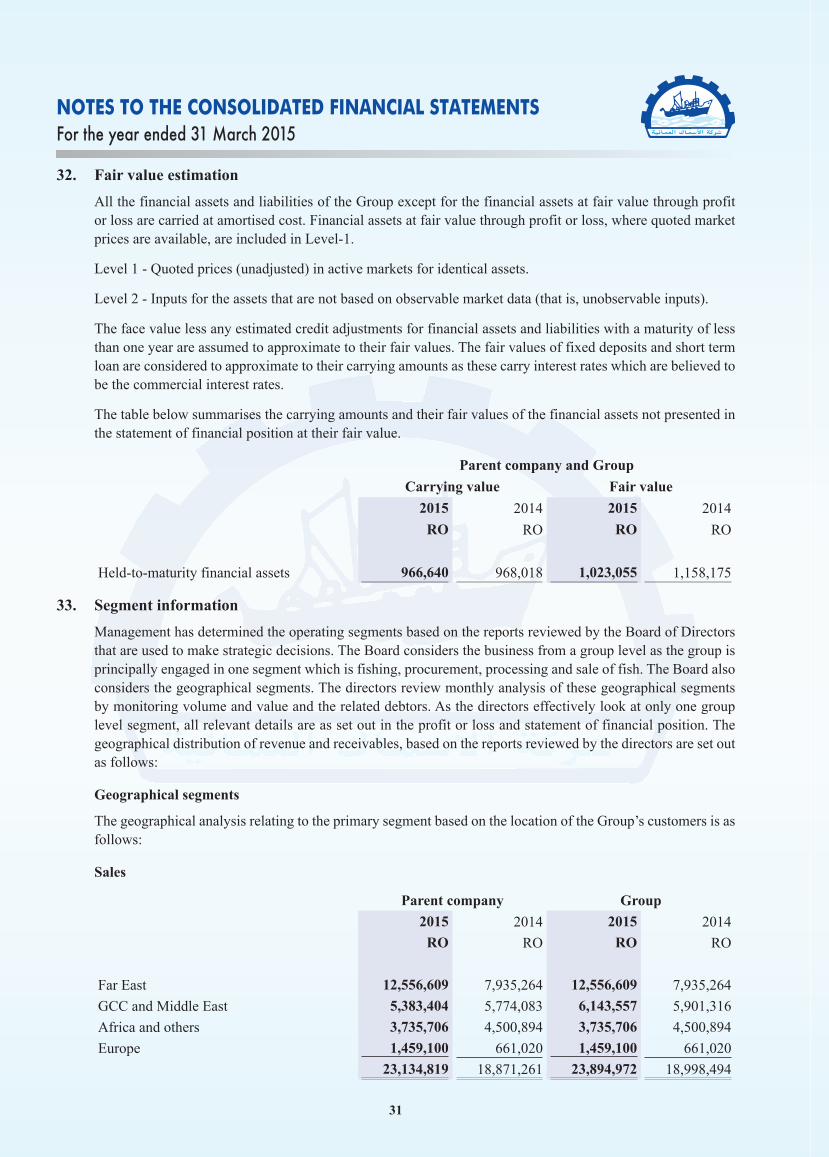
31
NOTES TO THE CONSOLIDATED FINANCIAL STATEMENTSFor the year ended 31 March 2015
32. Fair value estimation
All the financial assets and liabilities of the Group except for the financial assets at fair value through profit or loss are carried at amortised cost. Financial assets at fair value through profit or loss, where quoted market prices are available, are included in Level-1.
Level 1 - Quoted prices (unadjusted) in active markets for identical assets.
Level 2 - Inputs for the assets that are not based on observable market data (that is, unobservable inputs).
The face value less any estimated credit adjustments for financial assets and liabilities with a maturity of less than one year are assumed to approximate to their fair values. The fair values of fixed deposits and short term loan are considered to approximate to their carrying amounts as these carry interest rates which are believed to be the commercial interest rates.
The table below summarises the carrying amounts and their fair values of the financial assets not presented in the statement of financial position at their fair value.
Parent company and Group
Carrying value Fair value
2015 2014 2015 2014
RO RO RO RO
Held-to-maturity financial assets 966,640 968,018 1,023,055 1,158,175
33. Segment information
Management has determined the operating segments based on the reports reviewed by the Board of Directors that are used to make strategic decisions. The Board considers the business from a group level as the group is principally engaged in one segment which is fishing, procurement, processing and sale of fish. The Board also considers the geographical segments. The directors review monthly analysis of these geographical segments by monitoring volume and value and the related debtors. As the directors effectively look at only one group level segment, all relevant details are as set out in the profit or loss and statement of financial position. The geographical distribution of revenue and receivables, based on the reports reviewed by the directors are set out as follows:
Geographical segments
The geographical analysis relating to the primary segment based on the location of the Group’s customers is as follows:
Sales
Parent company Group
2015 2014 2015 2014
RO RO RO RO
Far East 12,556,609 7,935,264 12,556,609 7,935,264
GCC and Middle East 5,383,404 5,774,083 6,143,557 5,901,316
Africa and others 3,735,706 4,500,894 3,735,706 4,500,894
Europe 1,459,100 661,020 1,459,100 661,020
23,134,819 18,871,261 23,894,972 18,998,494
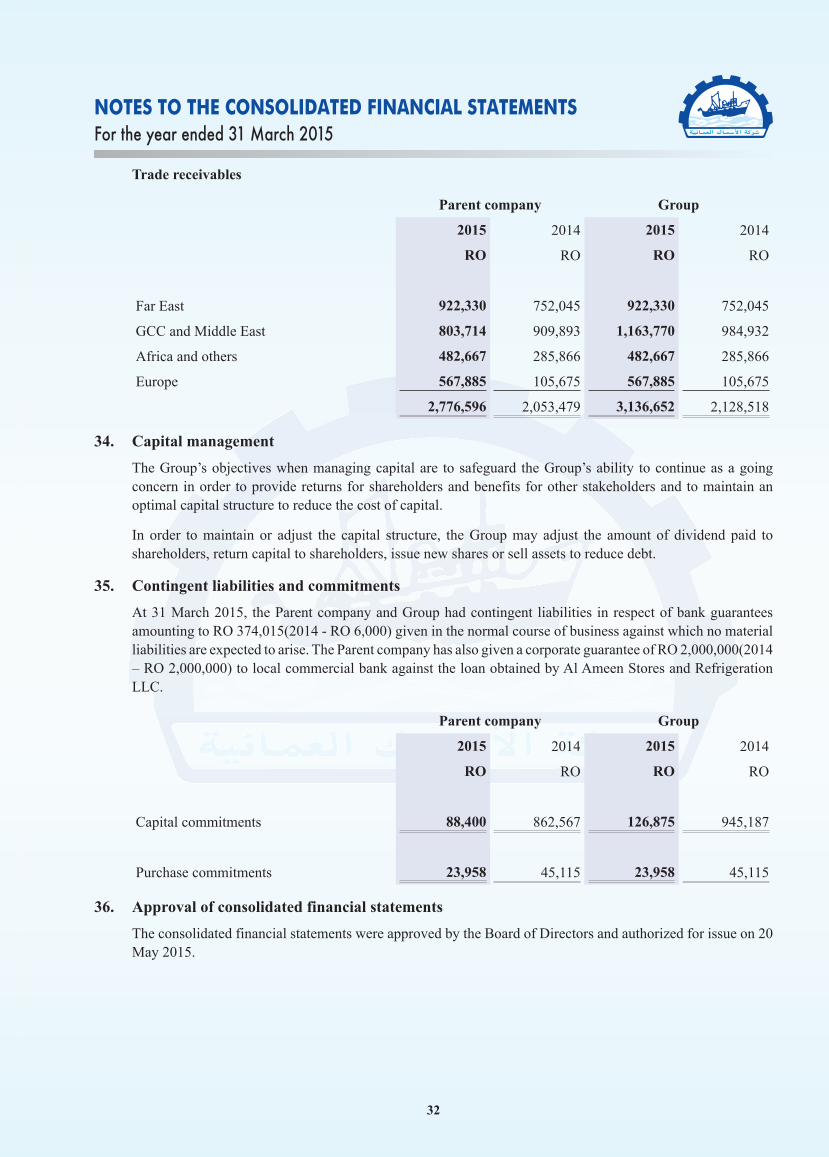
32
NOTES TO THE CONSOLIDATED FINANCIAL STATEMENTSFor the year ended 31 March 2015
Trade receivables
Parent company Group
2015 2014 2015 2014
RO RO RO RO
Far East 922,330 752,045 922,330 752,045
GCC and Middle East 803,714 909,893 1,163,770 984,932
Africa and others 482,667 285,866 482,667 285,866
Europe 567,885 105,675 567,885 105,675
2,776,596 2,053,479 3,136,652 2,128,518
34. Capital management
The Group’s objectives when managing capital are to safeguard the Group’s ability to continue as a going concern in order to provide returns for shareholders and benefits for other stakeholders and to maintain an optimal capital structure to reduce the cost of capital.
In order to maintain or adjust the capital structure, the Group may adjust the amount of dividend paid to shareholders, return capital to shareholders, issue new shares or sell assets to reduce debt.
35. Contingent liabilities and commitments
At 31 March 2015, the Parent company and Group had contingent liabilities in respect of bank guarantees amounting to RO 374,015(2014 - RO 6,000) given in the normal course of business against which no material liabilities are expected to arise. The Parent company has also given a corporate guarantee of RO 2,000,000(2014 – RO 2,000,000) to local commercial bank against the loan obtained by Al Ameen Stores and Refrigeration LLC.
Parent company Group
2015 2014 2015 2014
RO RO RO RO
Capital commitments 88,400 862,567 126,875 945,187
Purchase commitments 23,958 45,115 23,958 45,115
36. Approval of consolidated financial statements
The consolidated financial statements were approved by the Board of Directors and authorized for issue on 20 May 2015.


![Sheikh Zayed Bin Sultan[1]](https://img.pdfslide.us/doc/110x75/577d29661a28ab4e1ea6ac97/sheikh-zayed-bin-sultan1.jpg)