Embed Size (px)
DESCRIPTION
http://foothillsri.ca/sites/default/files/null/HLP_1999_03_Prsnttn_NDWkshpCoarseScaleDisturbancePatterns.pdf
Citation preview
Coarse-Scale Disturbance Patterns
on FMF Landscapes
• Types of disturbances
• Frequency of disturbances
• Seral-stage representation
• Non-forested lands
• Natural disturbance integration
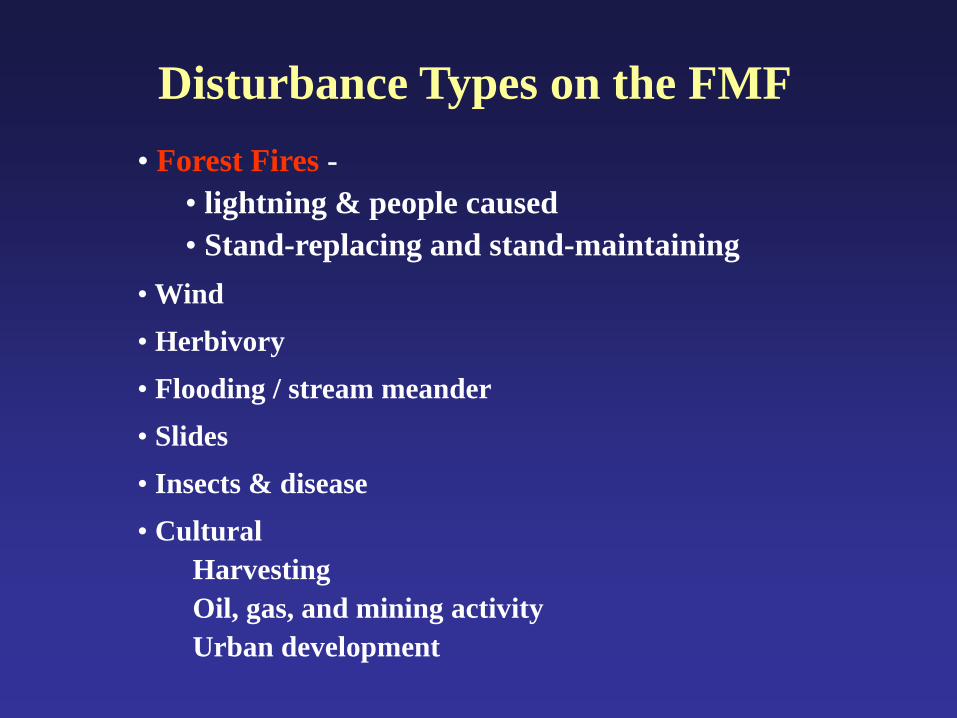
Disturbance Types on the FMF
• Forest Fires -
• lightning & people caused
• Stand-replacing and stand-maintaining
• Wind
• Herbivory
• Flooding / stream meander
• Slides
• Insects & disease
• Cultural
Harvesting
Oil, gas, and mining activity
Urban development
Based on experience and
knowledge to date, the majority of
the forest on the FMF is even-
aged.
… meaning that we can use stand age
data to represent coarse-scale
disturbance activity patterns.
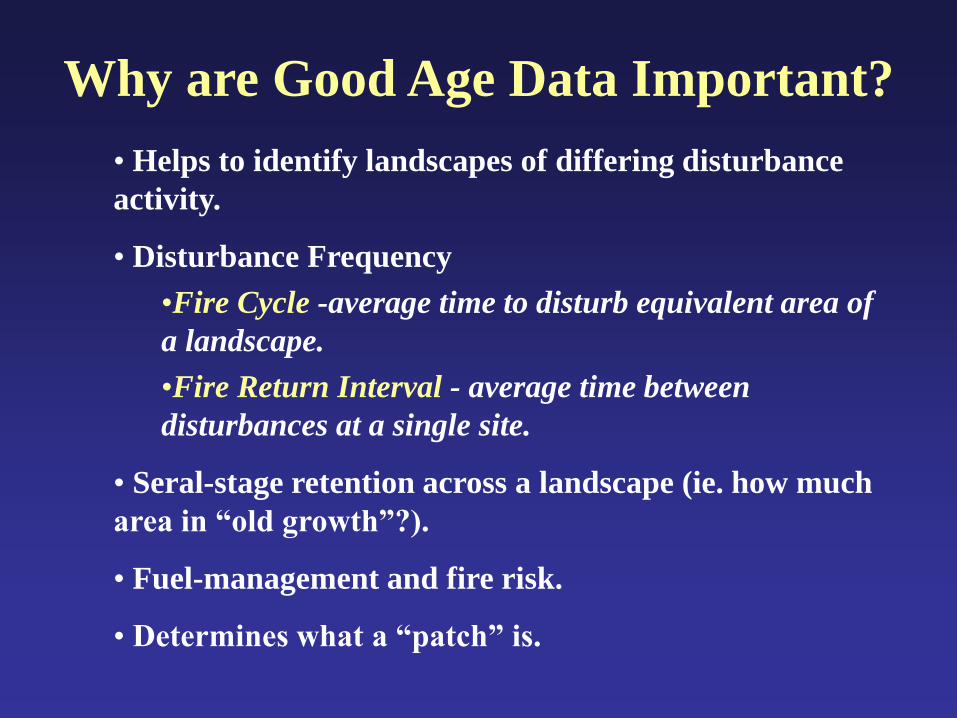
Why are Good Age Data Important?
• Helps to identify landscapes of differing disturbance
activity.
• Disturbance Frequency
•Fire Cycle -average time to disturb equivalent area of
a landscape.
•Fire Return Interval - average time between
disturbances at a single site.
• Seral-stage retention across a landscape (ie. how much
area in “old growth”?).
• Fuel-management and fire risk.
• Determines what a “patch” is.
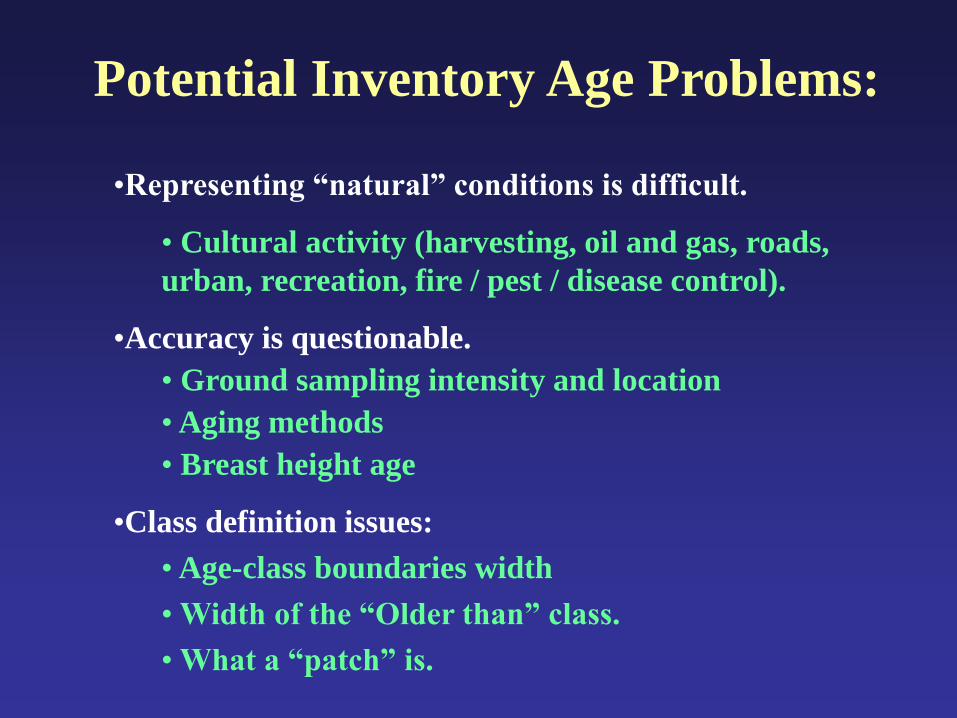
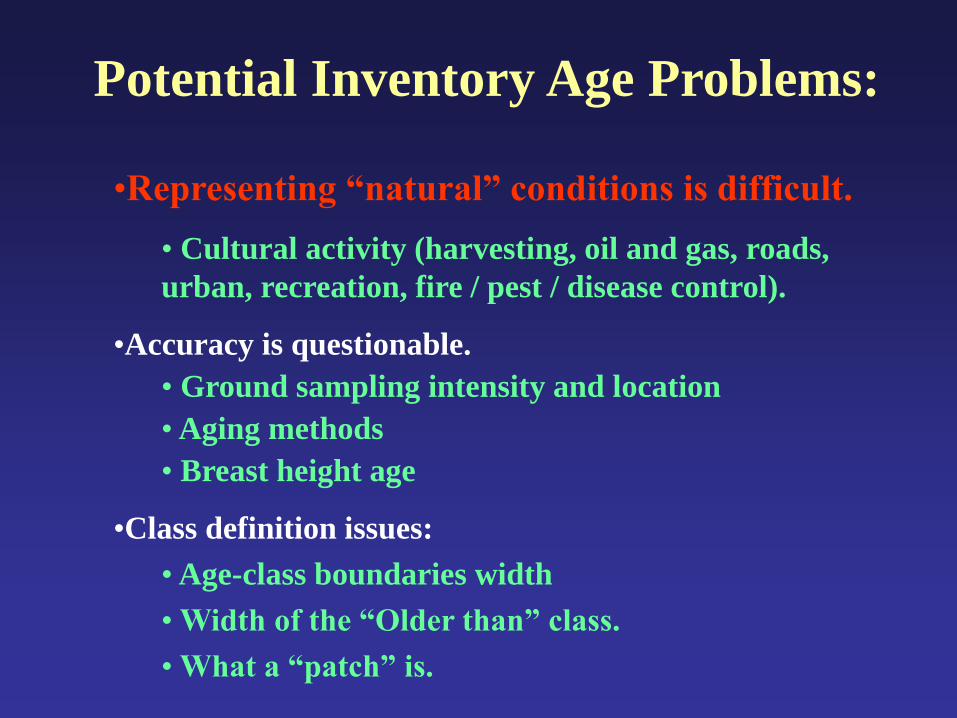
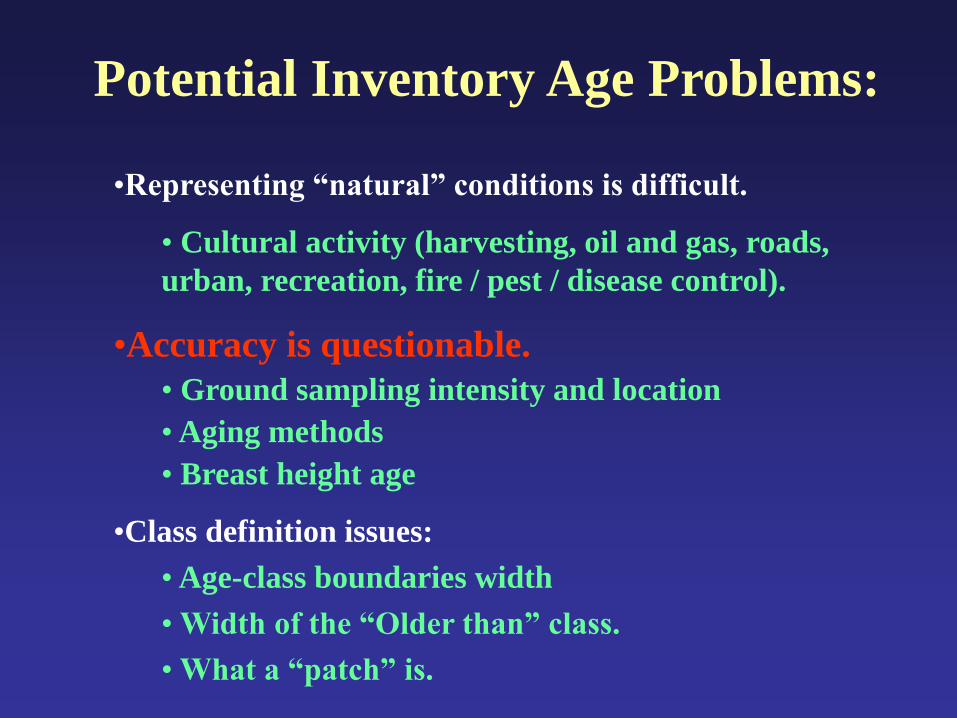
Potential Inventory Age Problems:
•Representing “natural” conditions is difficult.
• Cultural activity (harvesting, oil and gas, roads,
urban, recreation, fire / pest / disease control).
•Accuracy is questionable.
• Ground sampling intensity and location
• Aging methods
• Breast height age
•Class definition issues:
• Age-class boundaries width
• Width of the “Older than” class.
• What a “patch” is.
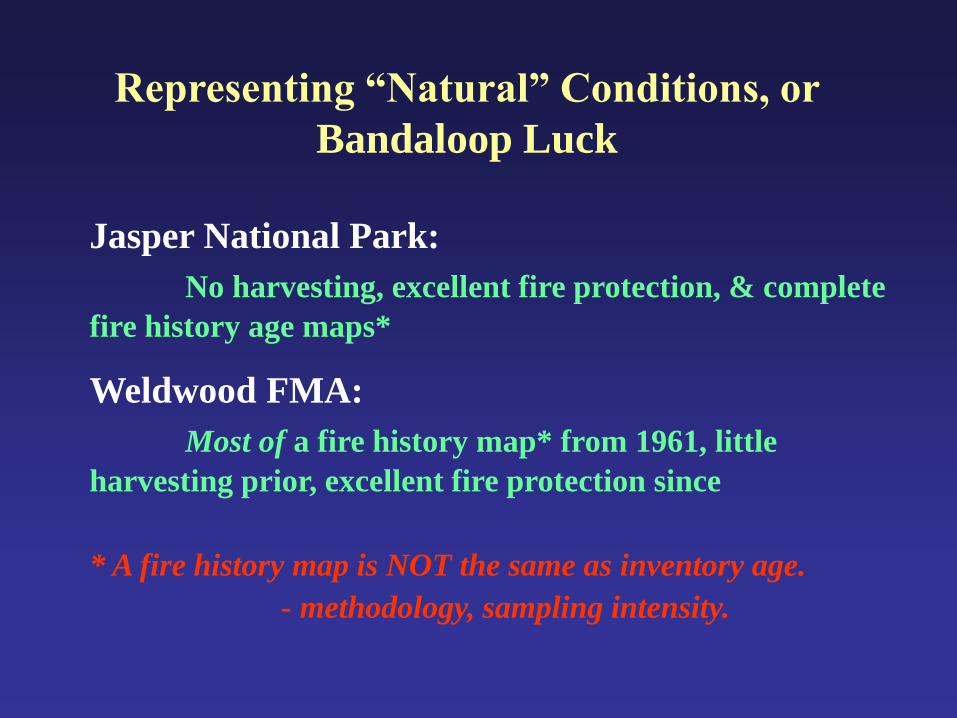
Representing “Natural” Conditions, or
Bandaloop Luck
Jasper National Park:
No harvesting, excellent fire protection, & complete
fire history age maps*
Weldwood FMA:
Most of a fire history map* from 1961, little
harvesting prior, excellent fire protection since
* A fire history map is NOT the same as inventory age.
- methodology, sampling intensity.
Potential Inventory Age Problems:
•Representing “natural” conditions is difficult.
• Cultural activity (harvesting, oil and gas, roads,
urban, recreation, fire / pest / disease control).
•Accuracy is questionable.
• Ground sampling intensity and location
• Aging methods
• Breast height age
•Class definition issues:
• Age-class boundaries width
• Width of the “Older than” class.
• What a “patch” is.
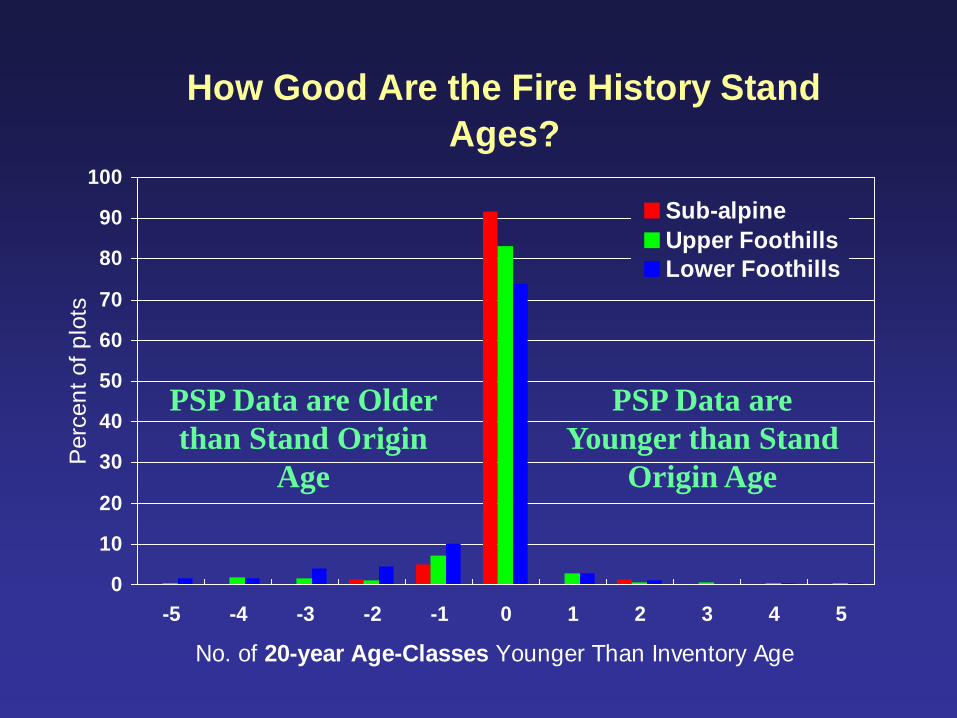
How Good Are the Fire History Stand
Ages?
0
10
20
30
40
50
60
70
80
90
100
-5 -4 -3 -2 -1 0 1 2 3 4 5
No. of 20-year Age-Classes Younger Than Inventory Age
Perc
en
t of
plo
ts
Sub-alpine
Upper Foothills
Lower Foothills
PSP Data are Older
than Stand Origin
Age
PSP Data are
Younger than Stand
Origin Age
Potential Inventory Age Problems:
•Representing “natural” conditions is difficult.
• Cultural activity (harvesting, oil and gas, roads,
urban, recreation, fire / pest / disease control).
•Accuracy is questionable.
• Ground sampling intensity and location
• Aging methods
• Breast height age
•Class definition issues:
• Age-class boundaries width
• Width of the “Older than” class.
• What a “patch” is.
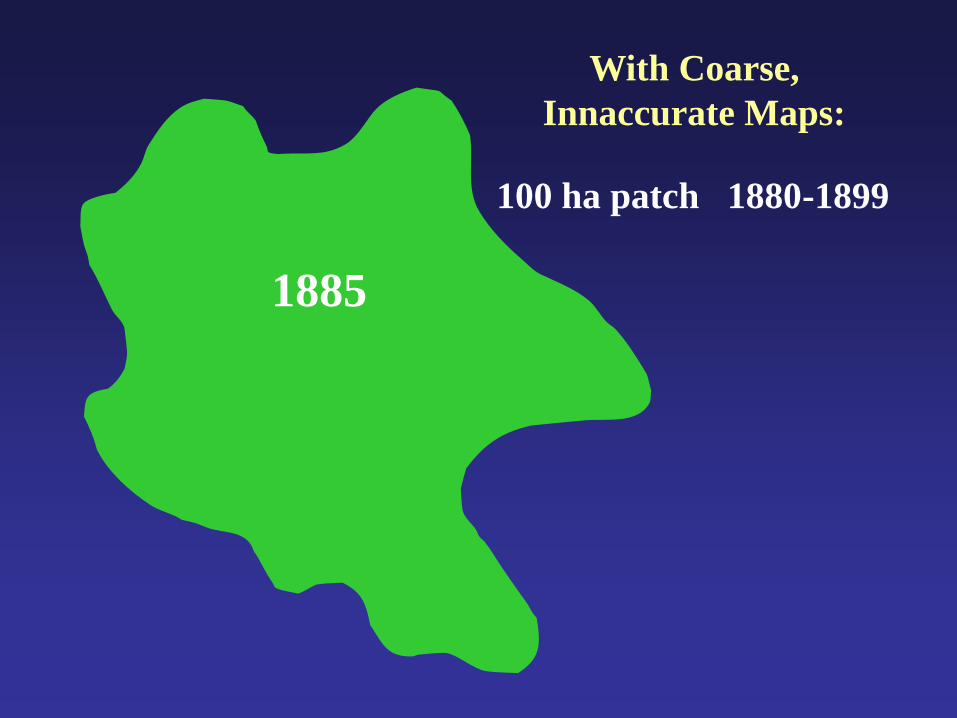
1885
100 ha patch 1880-1899
With Coarse,
Innaccurate Maps:
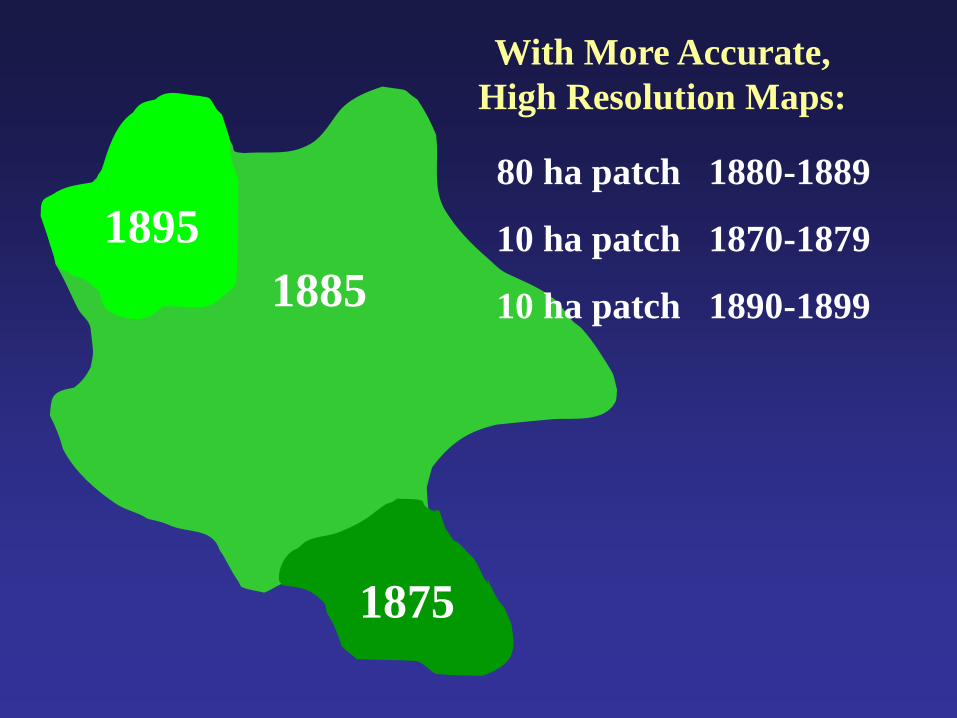
1885
1895
1875
80 ha patch 1880-1889
10 ha patch 1870-1879
10 ha patch 1890-1899
With More Accurate,
High Resolution Maps:
How Do We Want to Define a Patch?
Tradeoff between effort and accuracy.
Do we need to know the exact year of
origin of every patch of every age?
Probably not.
A 10-20 year class allows for several
years worth of disturbance activity.
Ecologically, they are probably similar
10-20 years later. Much easier to define
and map.
PATCH = The contiguous, gross area
of same-aged (within 20 years) forest. (includes islands & non-forested areas).
0
5
10
15
20
25
30
35
40
45
1970 1930 1890 1850 1810
Year of origin
Perc
en
t A
rea
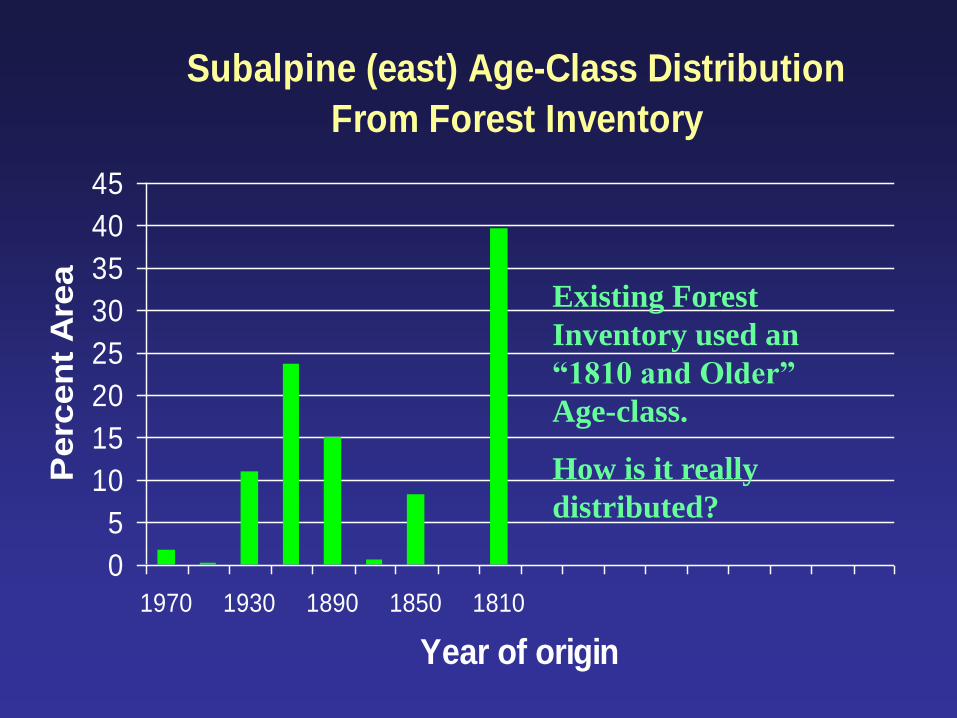
Subalpine (east) Age-Class Distribution
From Forest Inventory
Existing Forest
Inventory used an
“1810 and Older”
Age-class.
How is it really
distributed?
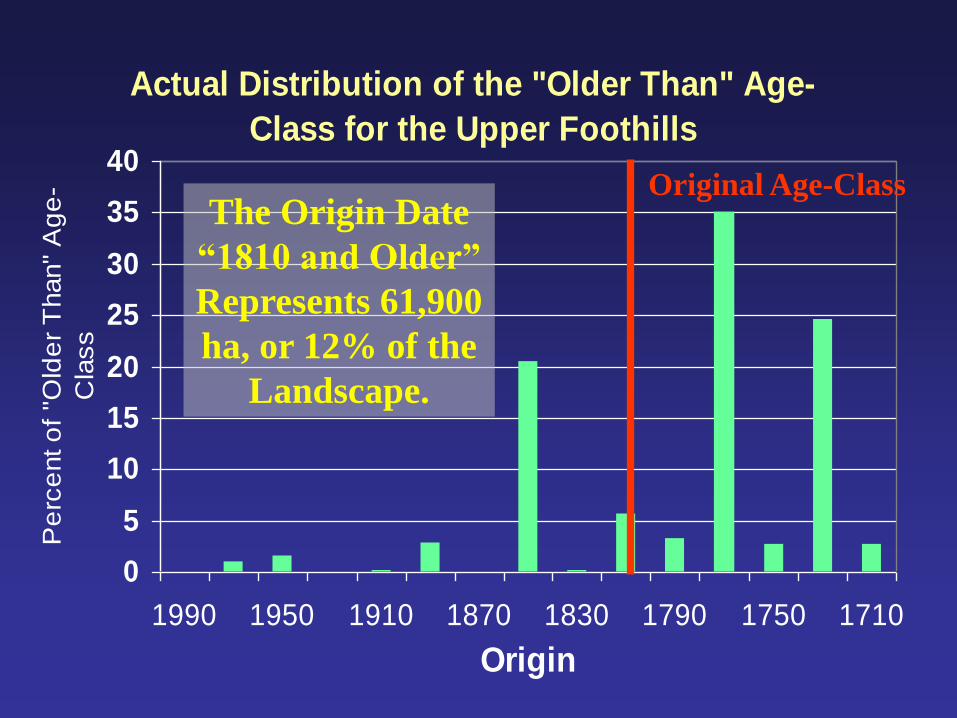
Actual Distribution of the "Older Than" Age-
Class for the Upper Foothills
0
5
10
15
20
25
30
35
40
1990 1950 1910 1870 1830 1790 1750 1710
Origin
Pe
rce
nt o
f "O
lde
r T
han"
Ag
e-
Cla
ss
The Origin Date
“1810 and Older”
Represents 61,900
ha, or 12% of the
Landscape.
Original Age-Class
0
5
10
15
20
25
30
35
40
45
1970 1930 1890 1850 1810 1770 1730 1690 1650
Year of origin
Perc
en
t A
rea
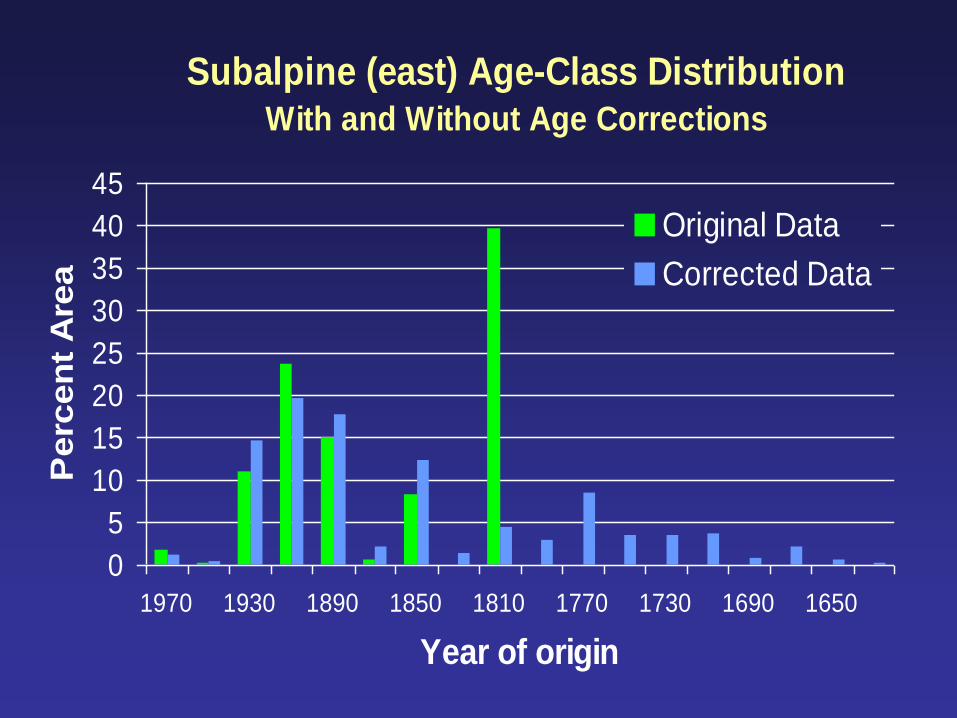
Original Data
Corrected Data
Subalpine (east) Age-Class DistributionWith and Without Age Corrections
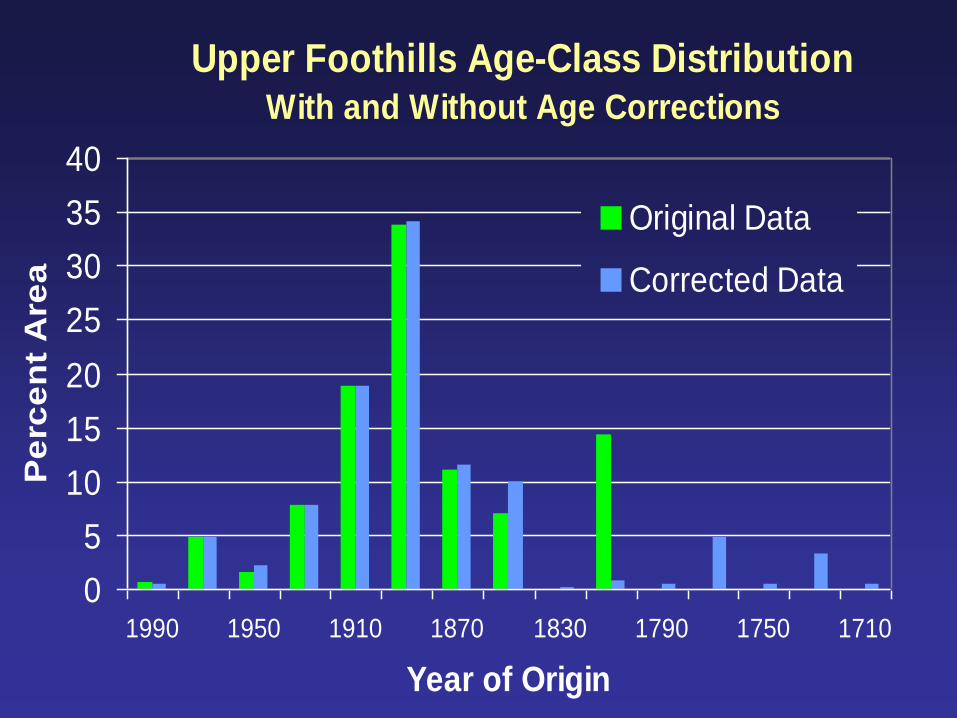
Upper Foothills Age-Class DistributionWith and Without Age Corrections
0
5
10
15
20
25
30
35
40
1990 1950 1910 1870 1830 1790 1750 1710
Year of Origin
Pe
rce
nt
Are
a
Original Data
Corrected Data
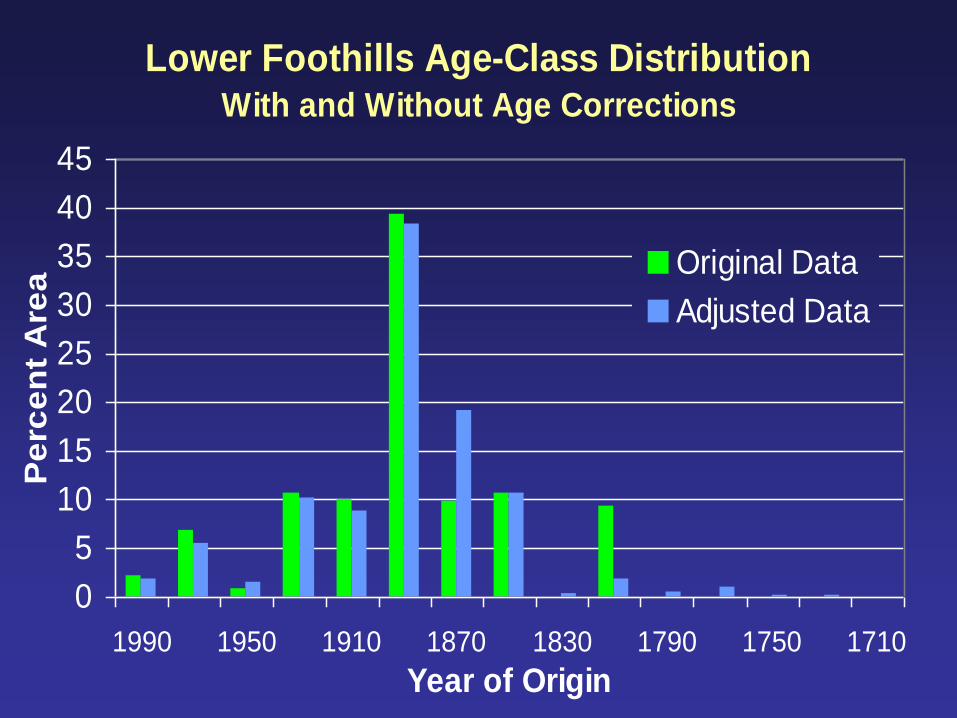
Lower Foothills Age-Class DistributionWith and Without Age Corrections
0
5
10
15
20
25
30
35
40
45
1990 1950 1910 1870 1830 1790 1750 1710
Year of Origin
Pe
rce
nt
Are
a
Original Data
Adjusted Data
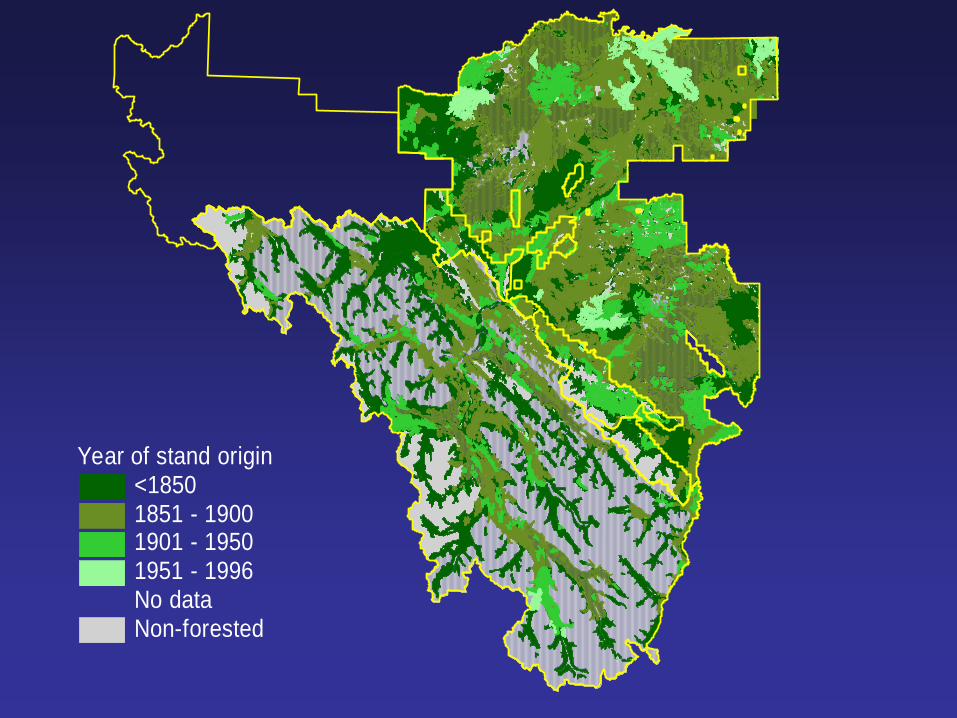
Non-forested
Year of stand origin<18501851 - 19001901 - 19501951 - 1996No data
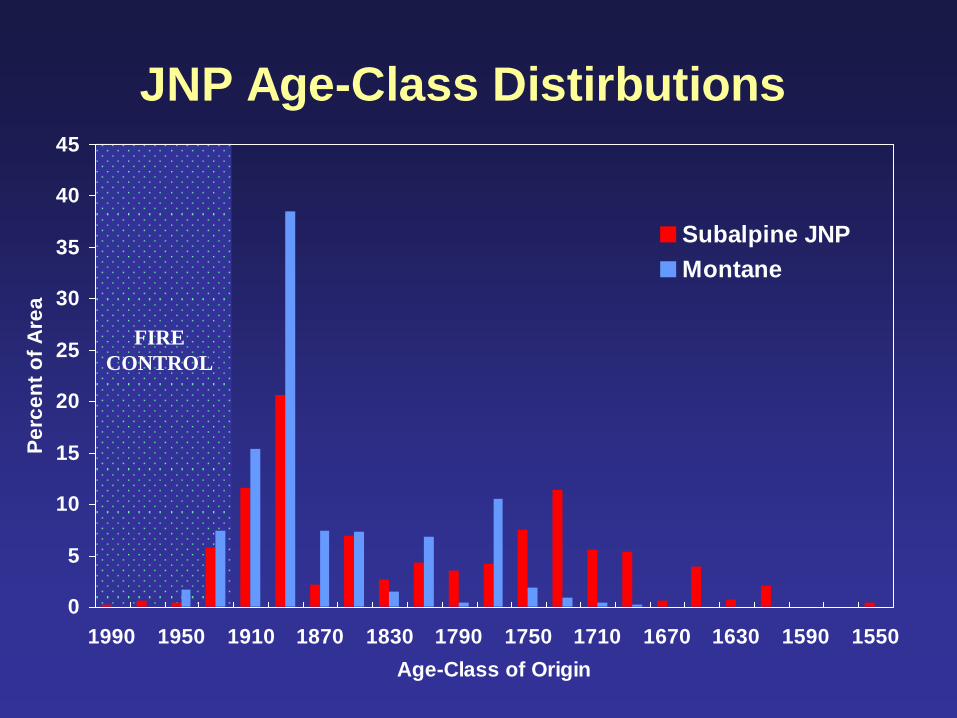
JNP Age-Class Distirbutions
0
5
10
15
20
25
30
35
40
45
1990 1950 1910 1870 1830 1790 1750 1710 1670 1630 1590 1550
Age-Class of Origin
Pe
rce
nt
of
Are
a
Subalpine JNP
Montane
FIRE
CONTROL
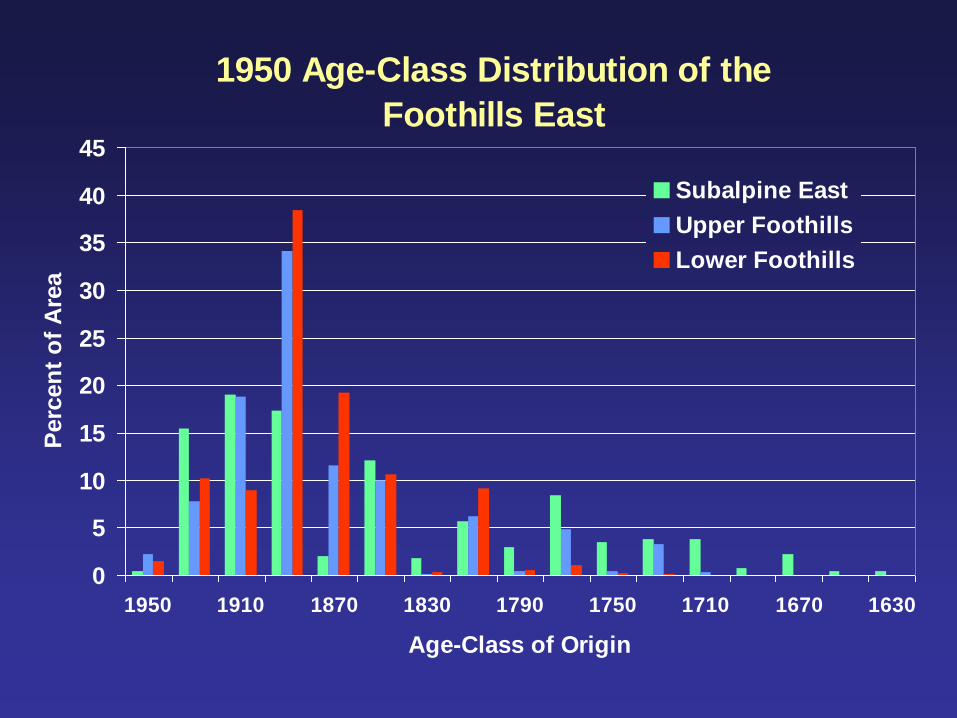
1950 Age-Class Distribution of the
Foothills East
0
5
10
15
20
25
30
35
40
45
1950 1910 1870 1830 1790 1750 1710 1670 1630
Age-Class of Origin
Perc
en
t o
f A
rea
Subalpine East
Upper Foothills
Lower Foothills
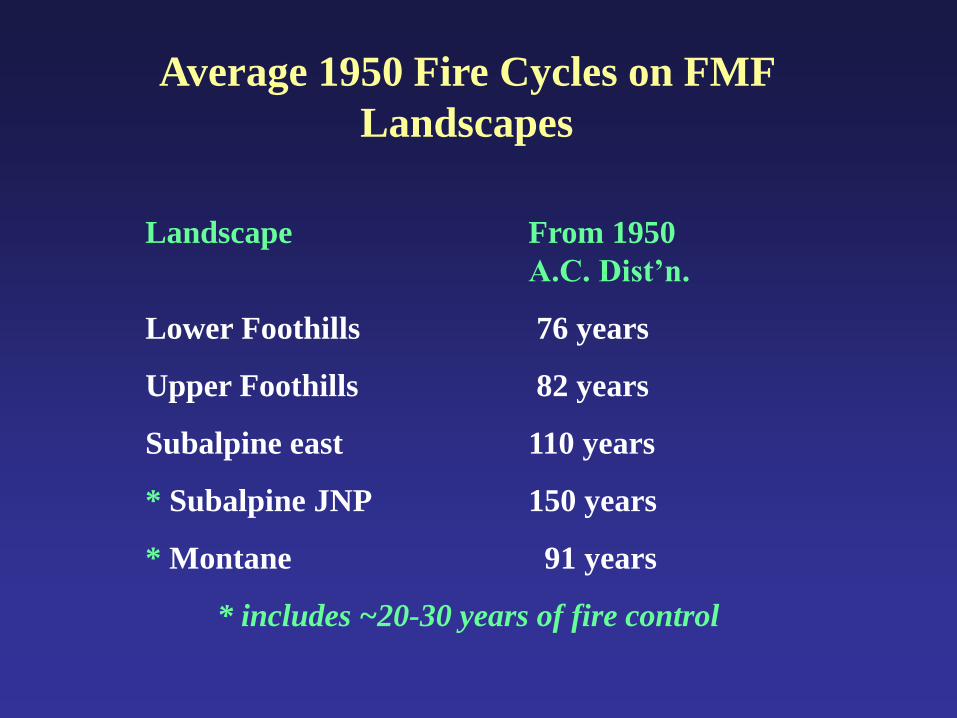
Average 1950 Fire Cycles on FMF
Landscapes
Landscape From 1950
A.C. Dist’n.
Lower Foothills 76 years
Upper Foothills 82 years
Subalpine east 110 years
* Subalpine JNP 150 years
* Montane 91 years
* includes ~20-30 years of fire control
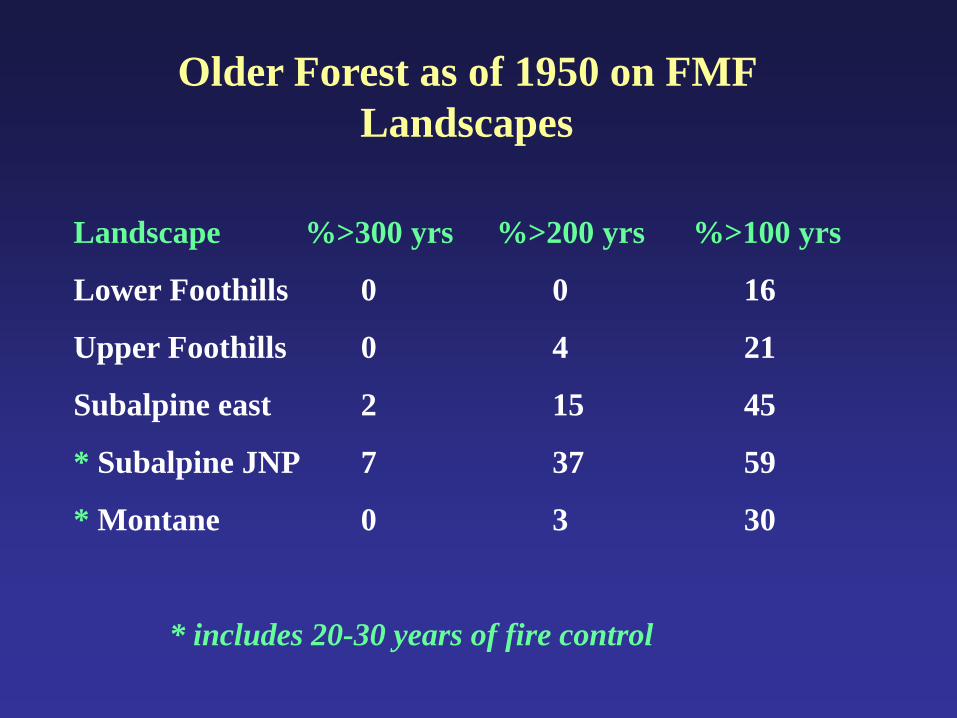
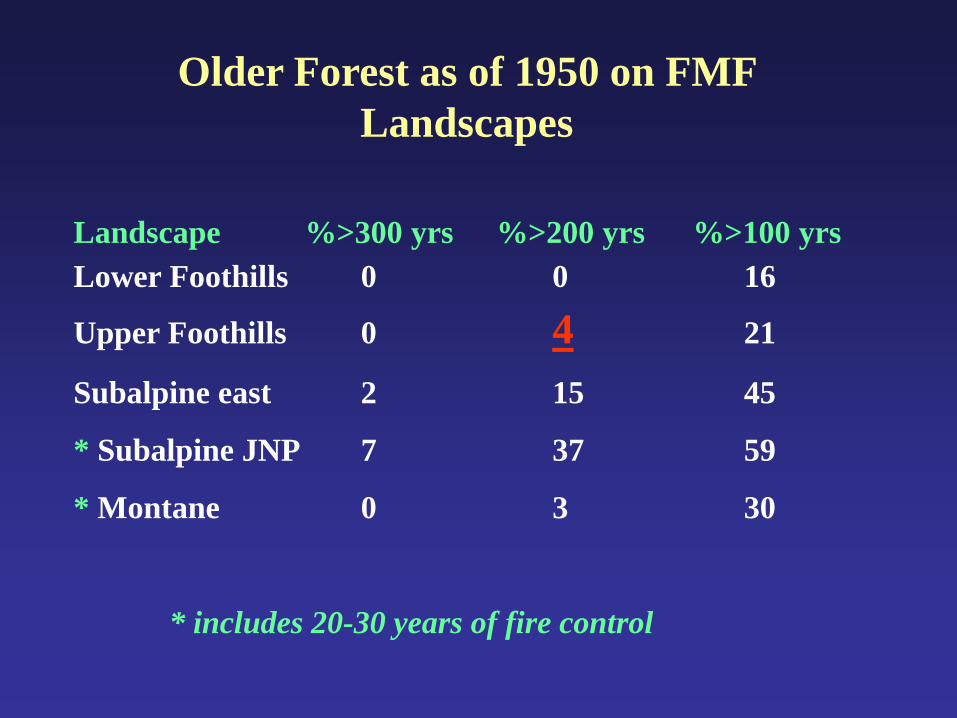
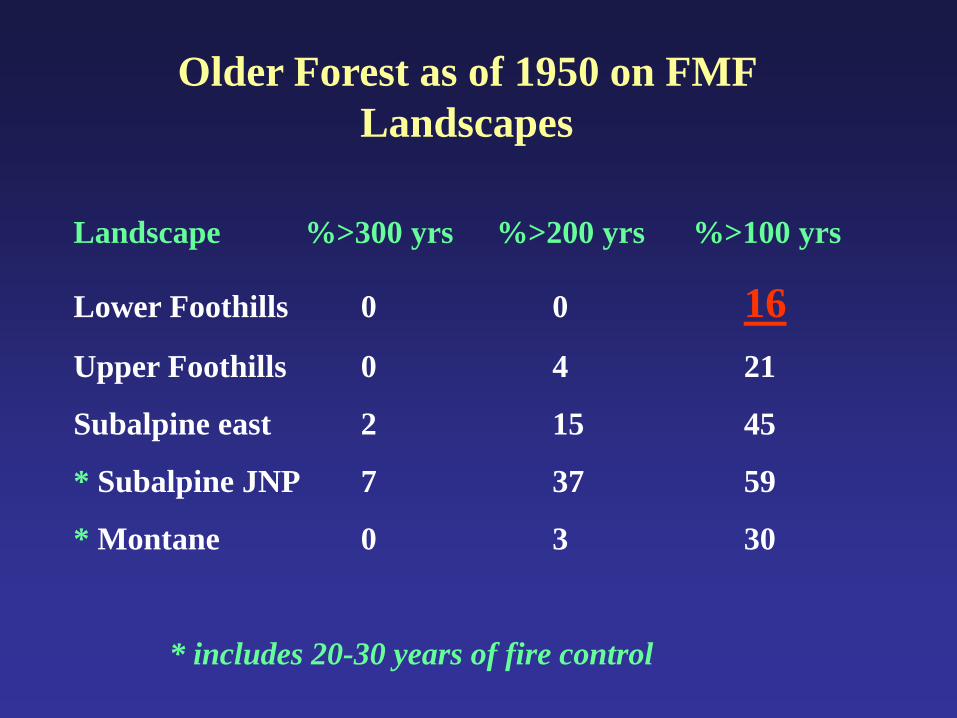
Older Forest as of 1950 on FMF
Landscapes
Landscape %>300 yrs %>200 yrs %>100 yrs
Lower Foothills 0 0 16
Upper Foothills 0 4 21
Subalpine east 2 15 45
* Subalpine JNP 7 37 59
* Montane 0 3 30
* includes 20-30 years of fire control
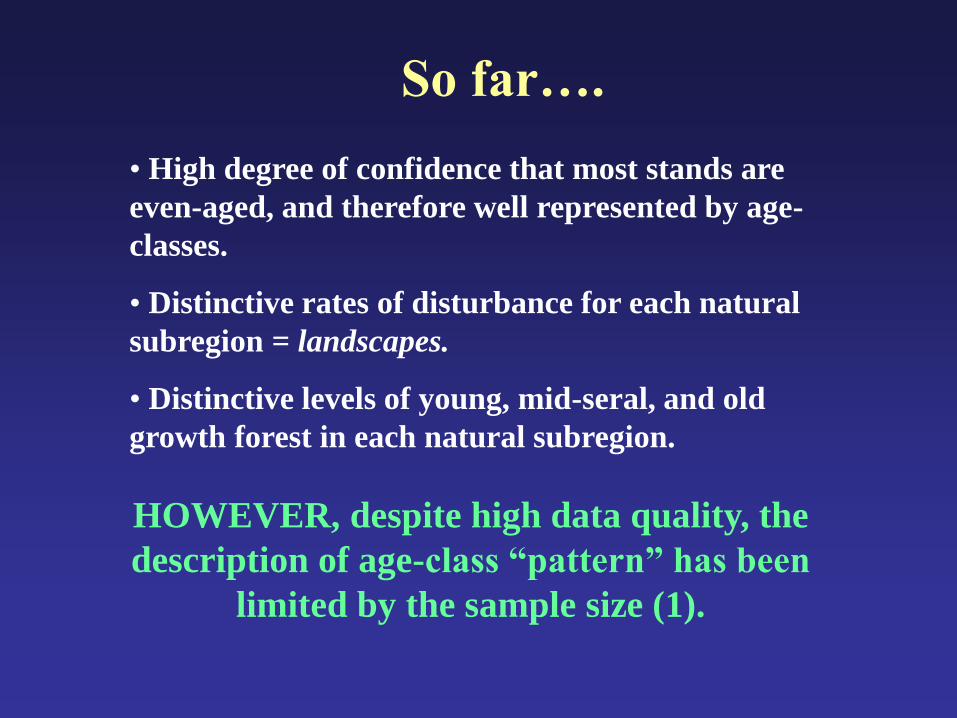
HOWEVER, despite high data quality, the
description of age-class “pattern” has been
limited by the sample size (1).
So far….
• High degree of confidence that most stands are
even-aged, and therefore well represented by age-
classes.
• Distinctive rates of disturbance for each natural
subregion = landscapes.
• Distinctive levels of young, mid-seral, and old
growth forest in each natural subregion.
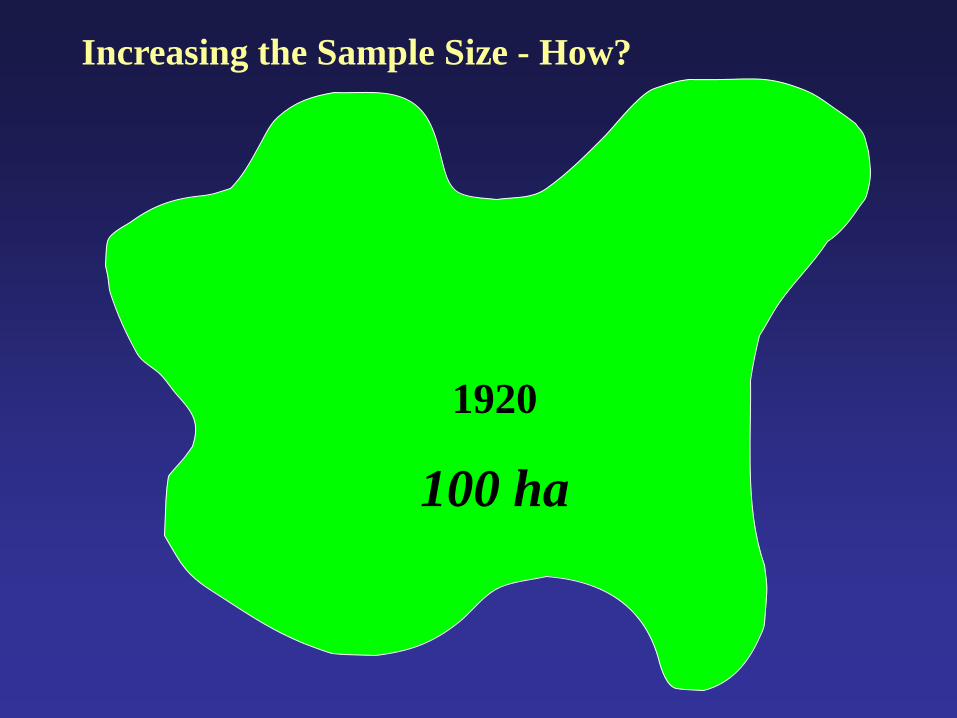
1920
100 ha
Increasing the Sample Size - How?
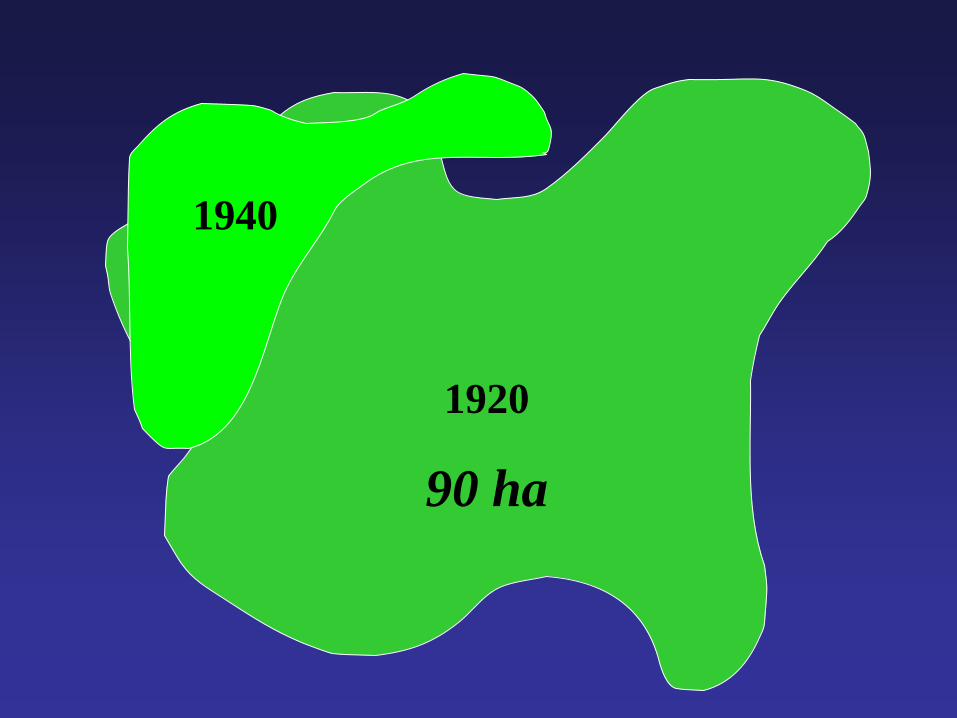
1920
90 ha
1940
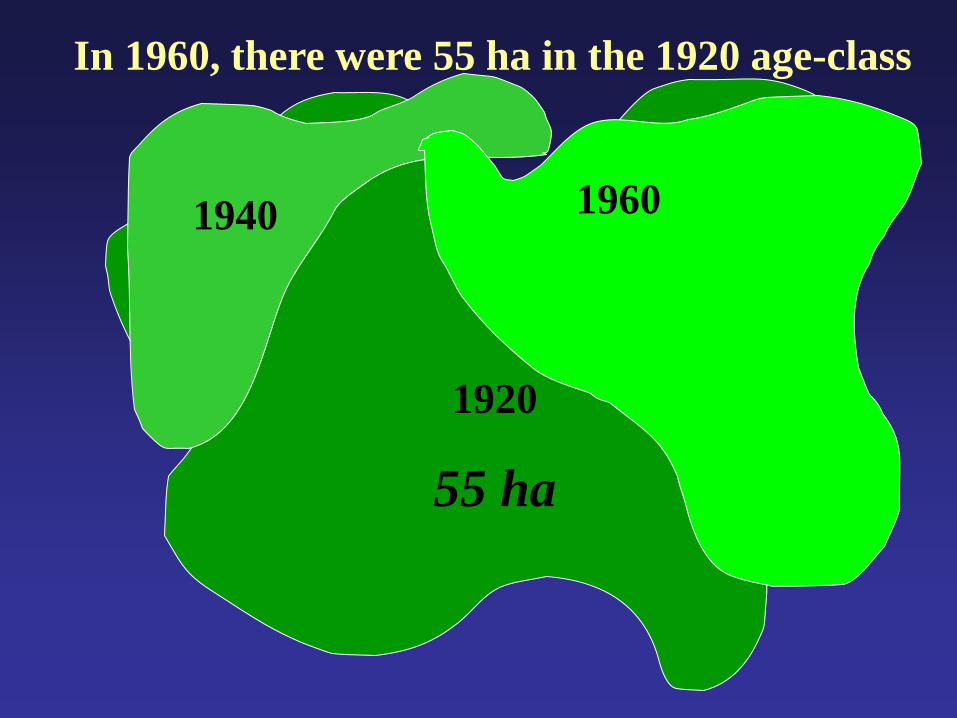
1920
55 ha
1940 1960
In 1960, there were 55 ha in the 1920 age-class
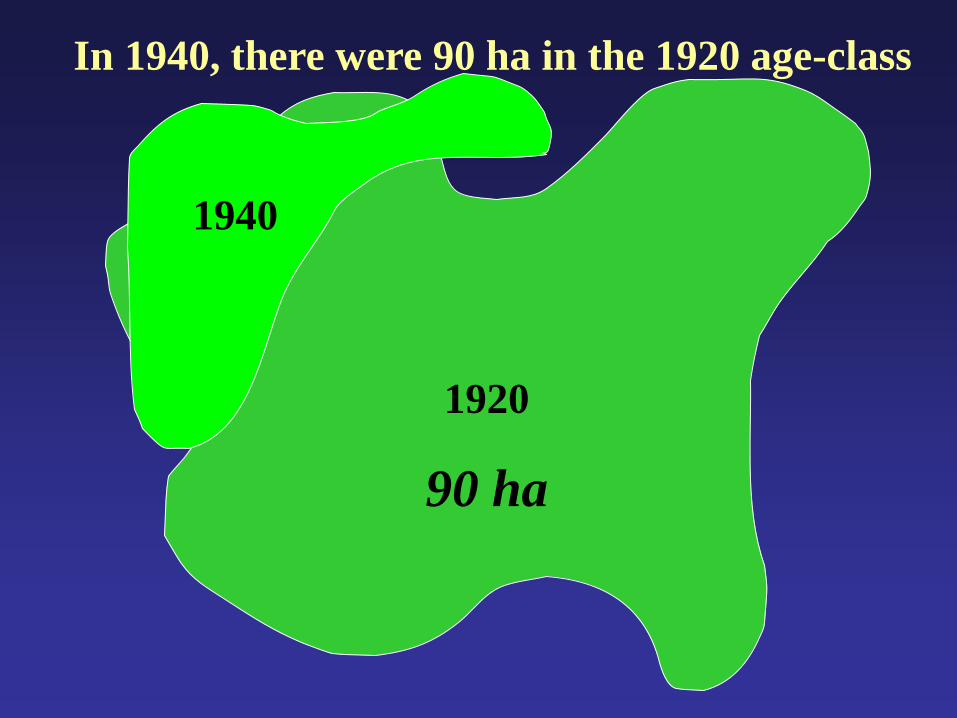
1920
90 ha
1940
In 1940, there were 90 ha in the 1920 age-class
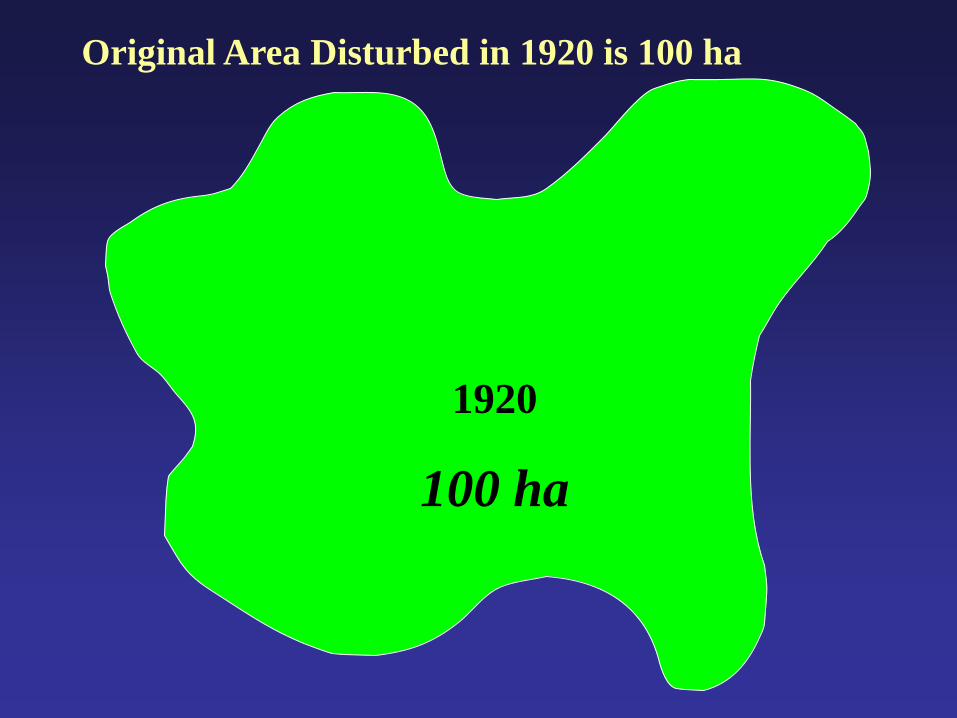
1920
100 ha
Original Area Disturbed in 1920 is 100 ha
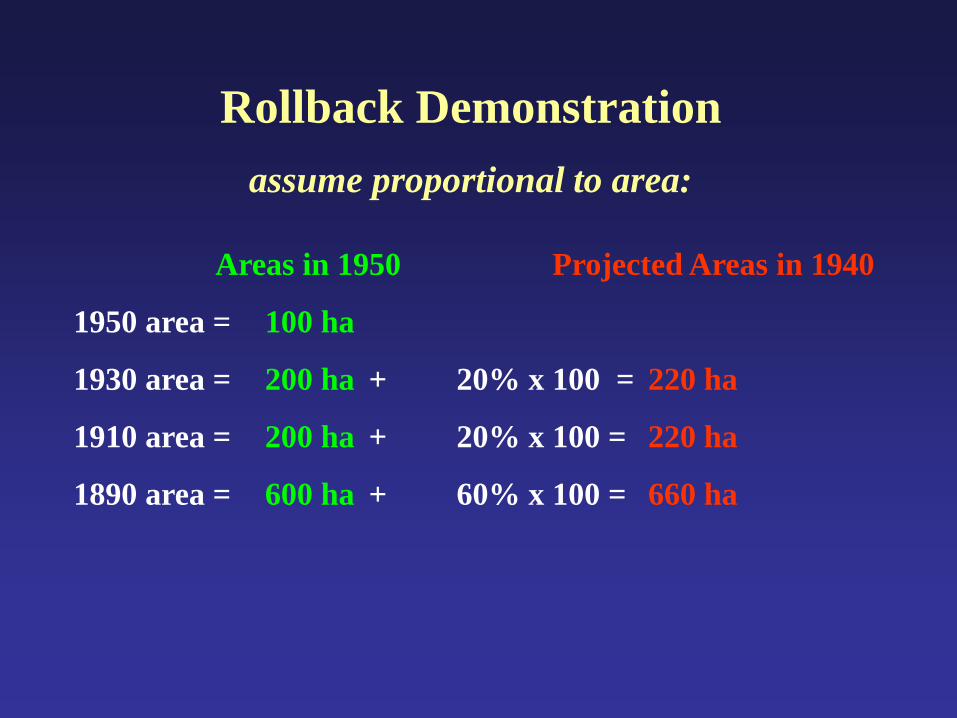
Areas in 1950 Projected Areas in 1940
1950 area = 100 ha
1930 area = 200 ha + 20% x 100 = 220 ha
1910 area = 200 ha + 20% x 100 = 220 ha
1890 area = 600 ha + 60% x 100 = 660 ha
Rollback Demonstration
assume proportional to area:
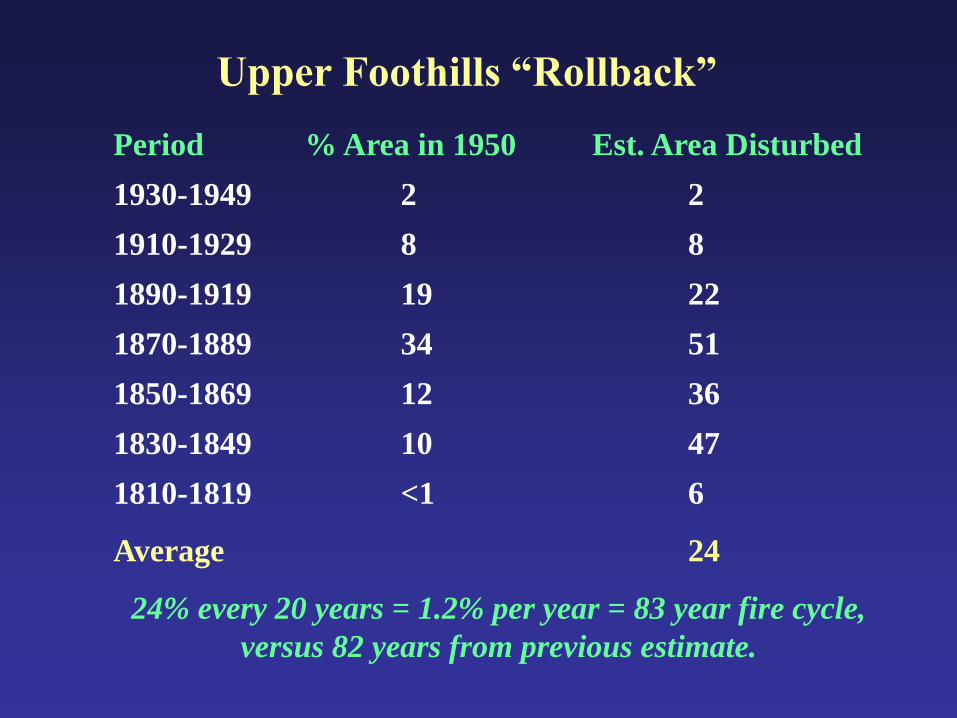
Upper Foothills “Rollback”
Period % Area in 1950 Est. Area Disturbed
1930-1949 2 2
1910-1929 8 8
1890-1919 19 22
1870-1889 34 51
1850-1869 12 36
1830-1849 10 47
1810-1819 <1 6
Average 24
24% every 20 years = 1.2% per year = 83 year fire cycle,
versus 82 years from previous estimate.
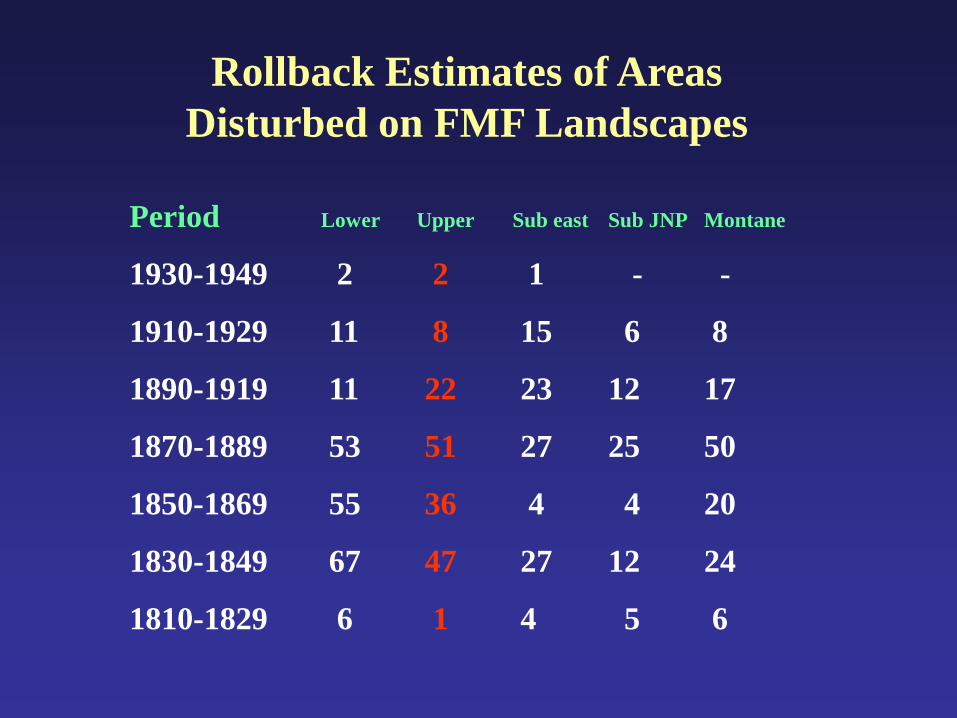
Rollback Estimates of Areas
Disturbed on FMF Landscapes
Period Lower Upper Sub east Sub JNP Montane
1930-1949 2 2 1 - -
1910-1929 11 8 15 6 8
1890-1919 11 22 23 12 17
1870-1889 53 51 27 25 50
1850-1869 55 36 4 4 20
1830-1849 67 47 27 12 24
1810-1829 6 1 4 5 6
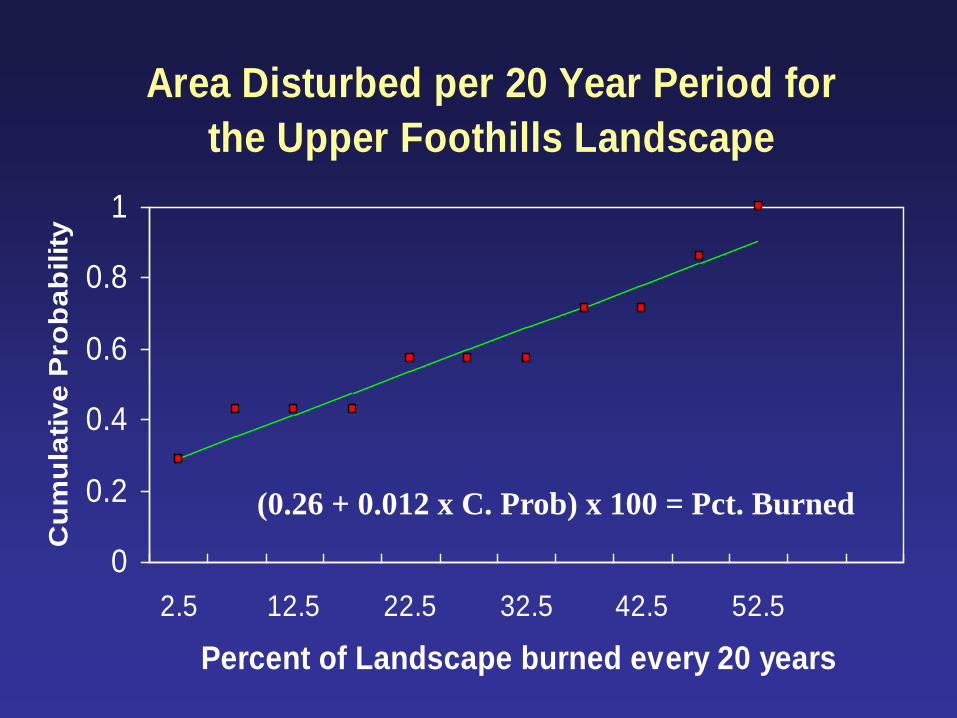
Area Disturbed per 20 Year Period for
the Upper Foothills Landscape
0
0.2
0.4
0.6
0.8
1
2.5 12.5 22.5 32.5 42.5 52.5
Percent of Landscape burned every 20 years
Cu
mu
lati
ve
Pro
ba
bilit
y
(0.26 + 0.012 x C. Prob) x 100 = Pct. Burned
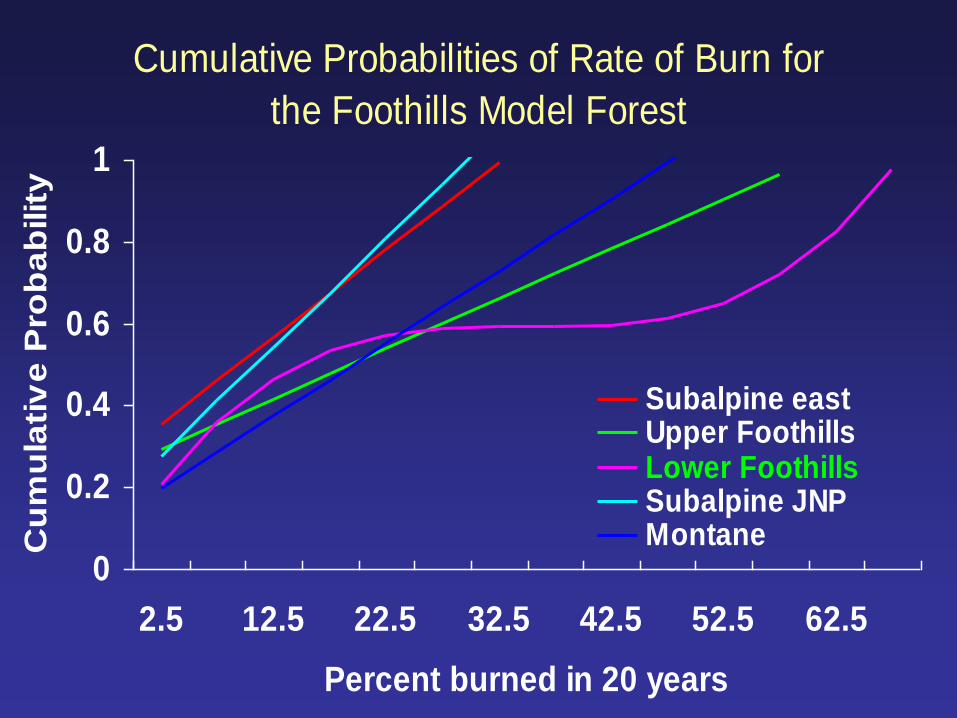
Cumulative Probabilities of Rate of Burn for
the Foothills Model Forest
0
0.2
0.4
0.6
0.8
1
2.5 12.5 22.5 32.5 42.5 52.5 62.5
Percent burned in 20 years
Cu
mu
lati
ve
Pro
ba
bilit
y
Subalpine eastUpper FoothillsLower FoothillsSubalpine JNPMontane
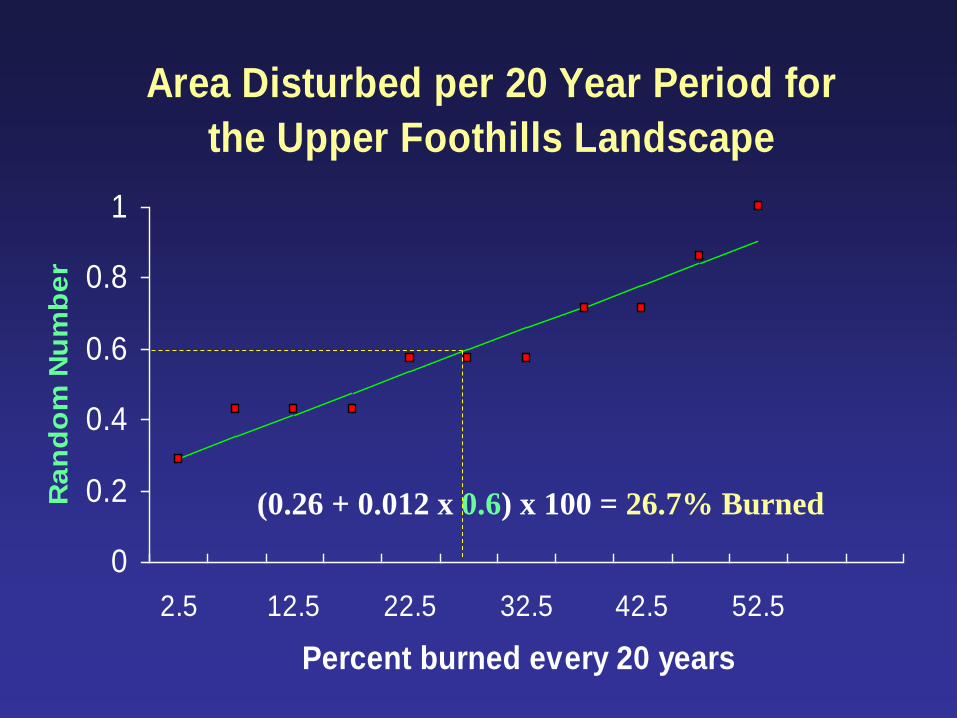
Area Disturbed per 20 Year Period for
the Upper Foothills Landscape
0
0.2
0.4
0.6
0.8
1
2.5 12.5 22.5 32.5 42.5 52.5
Percent burned every 20 years
Ra
nd
om
Nu
mb
er
(0.26 + 0.012 x 0.6) x 100 = 26.7% Burned
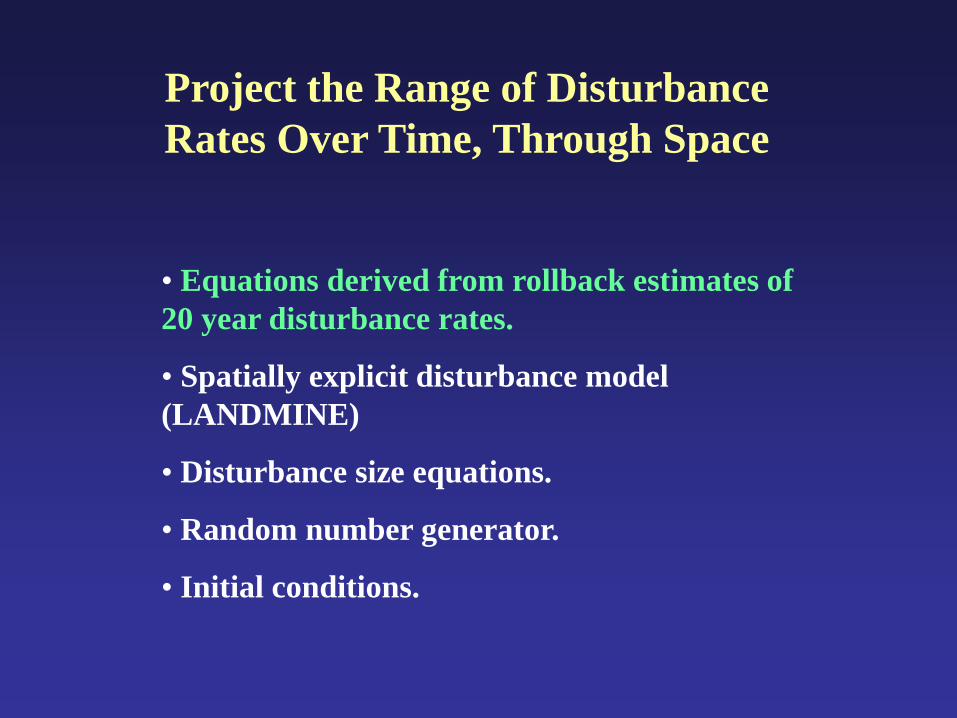
Project the Range of Disturbance
Rates Over Time, Through Space
• Equations derived from rollback estimates of
20 year disturbance rates.
• Spatially explicit disturbance model
(LANDMINE)
• Disturbance size equations.
• Random number generator.
• Initial conditions.
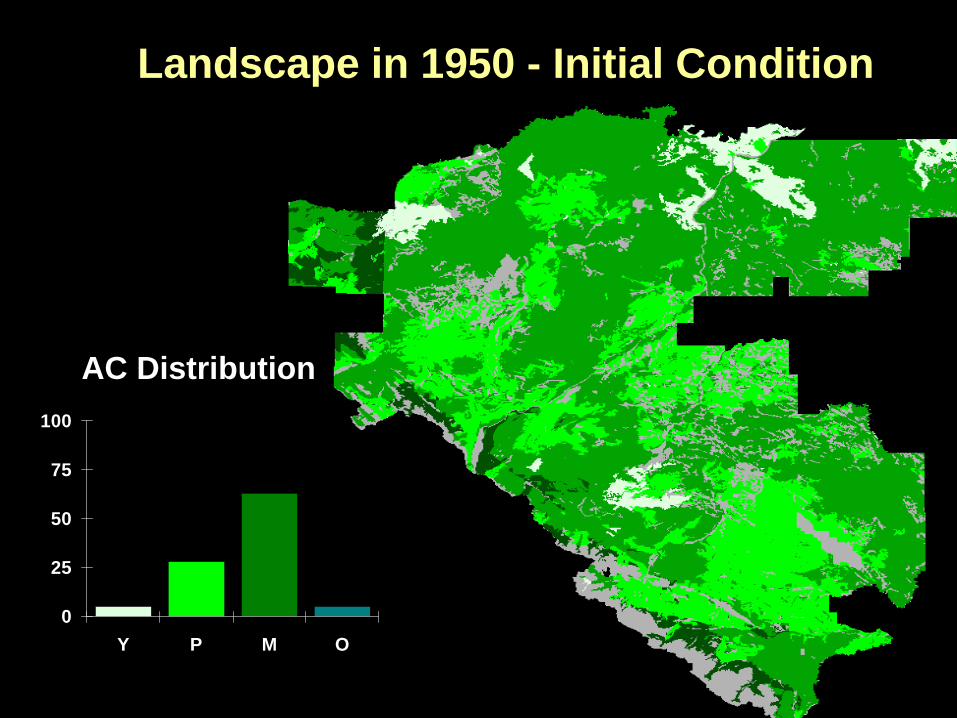
0
25
50
75
100
Y P M O
AC Distribution
Landscape in 1950 - Initial Condition
AC Dist’n
0
25
50
75
100
Y P M O
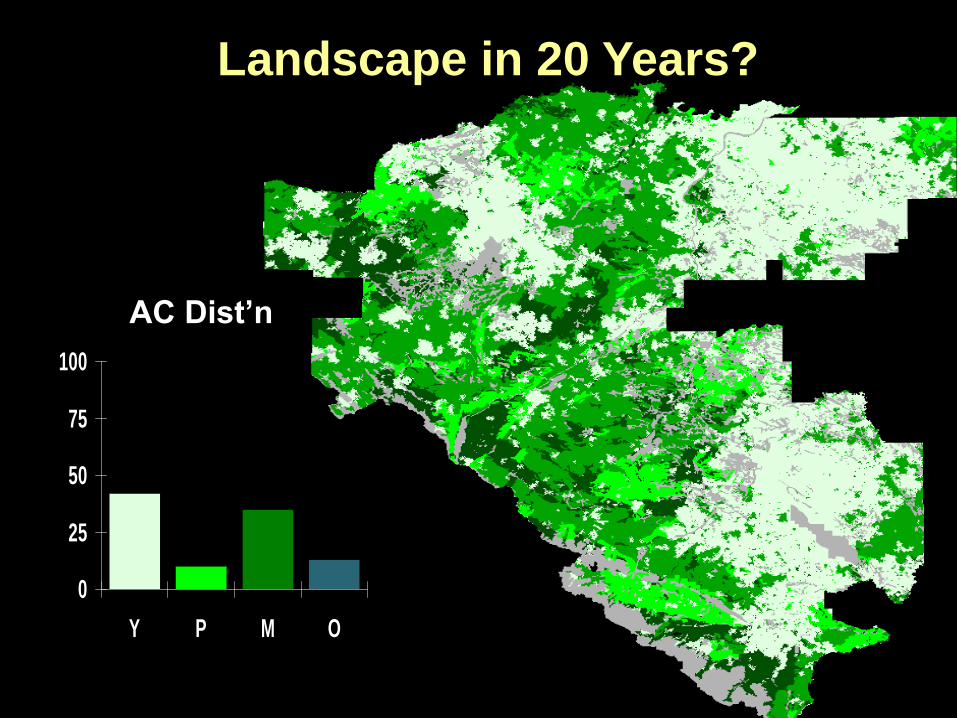
Landscape in 20 Years?
0
25
50
75
100
Y P M O
AC Dist’n
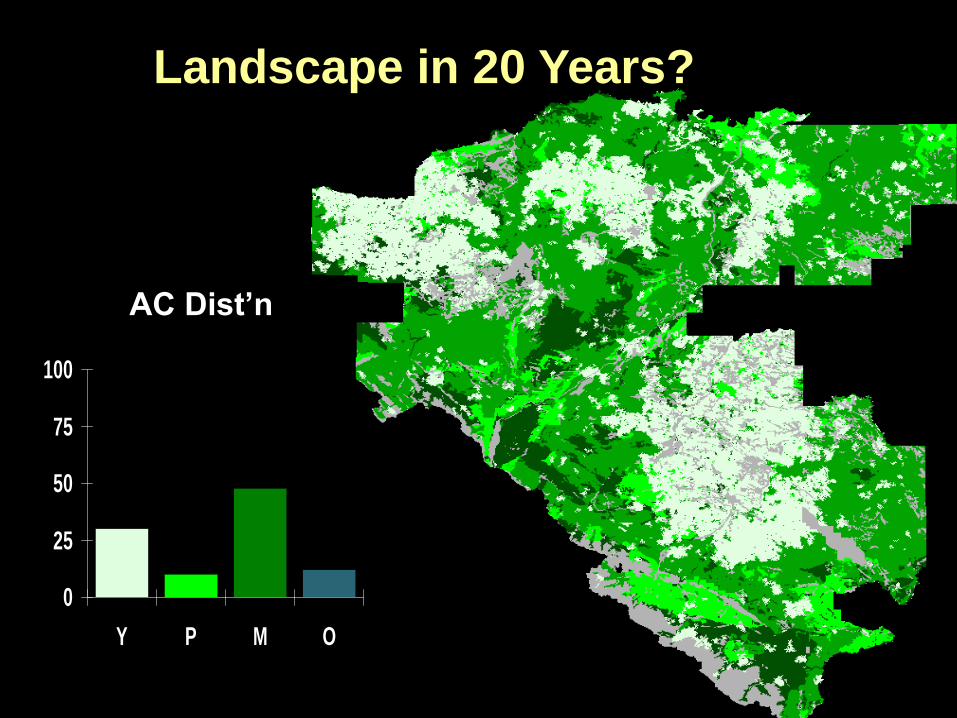
Landscape in 20 Years?
0
25
50
75
100
Y P M O
AC Dist’n
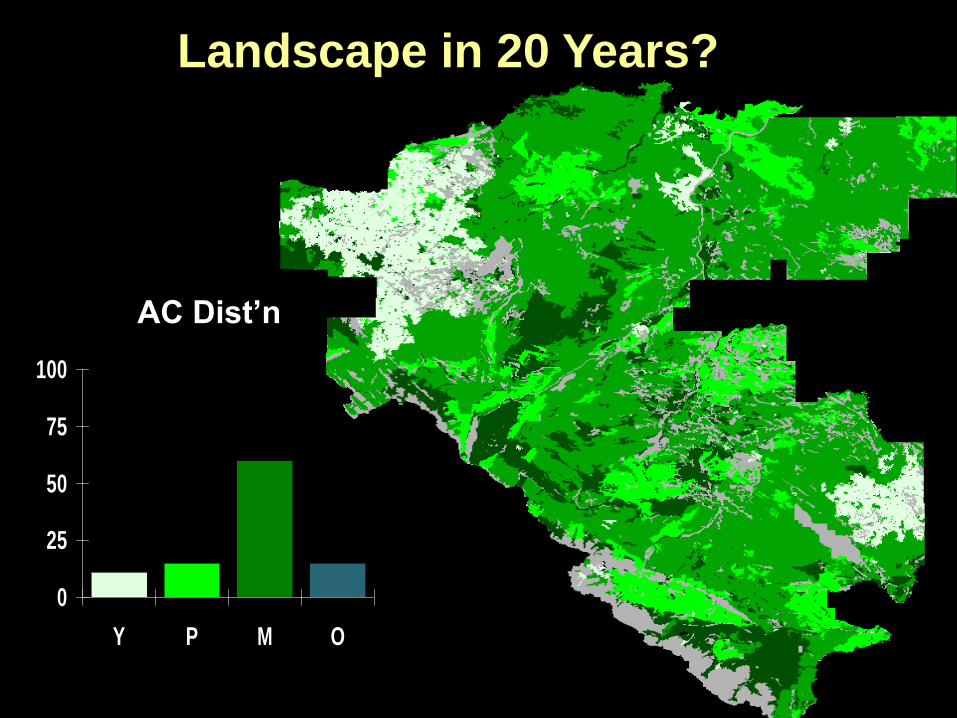
Landscape in 20 Years?
0
25
50
75
100
Y P M O
AC Dist’n
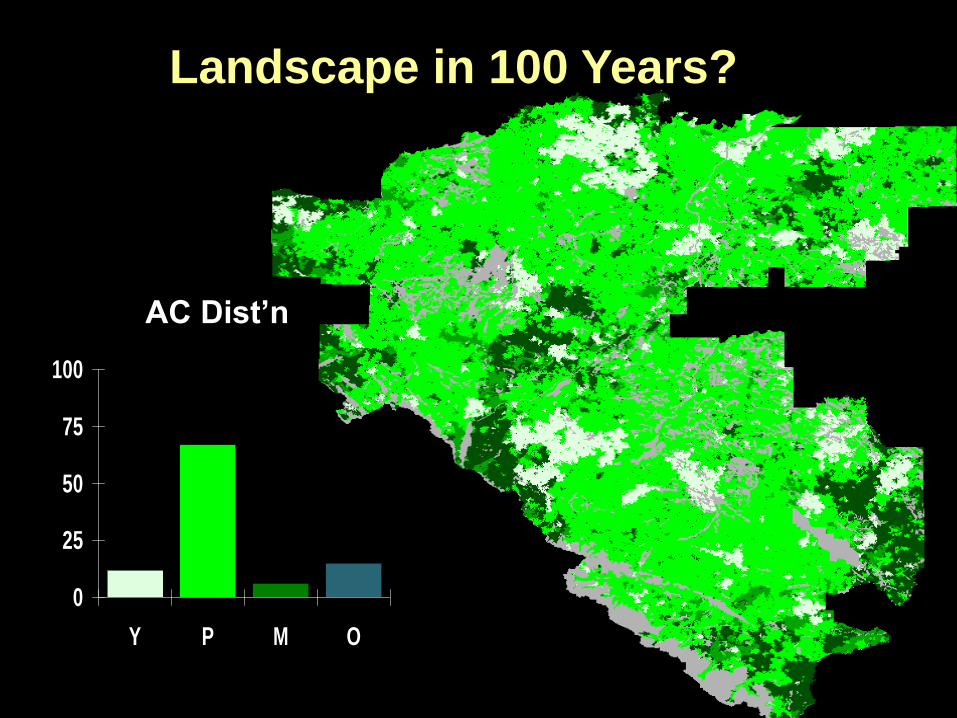
Landscape in 100 Years?
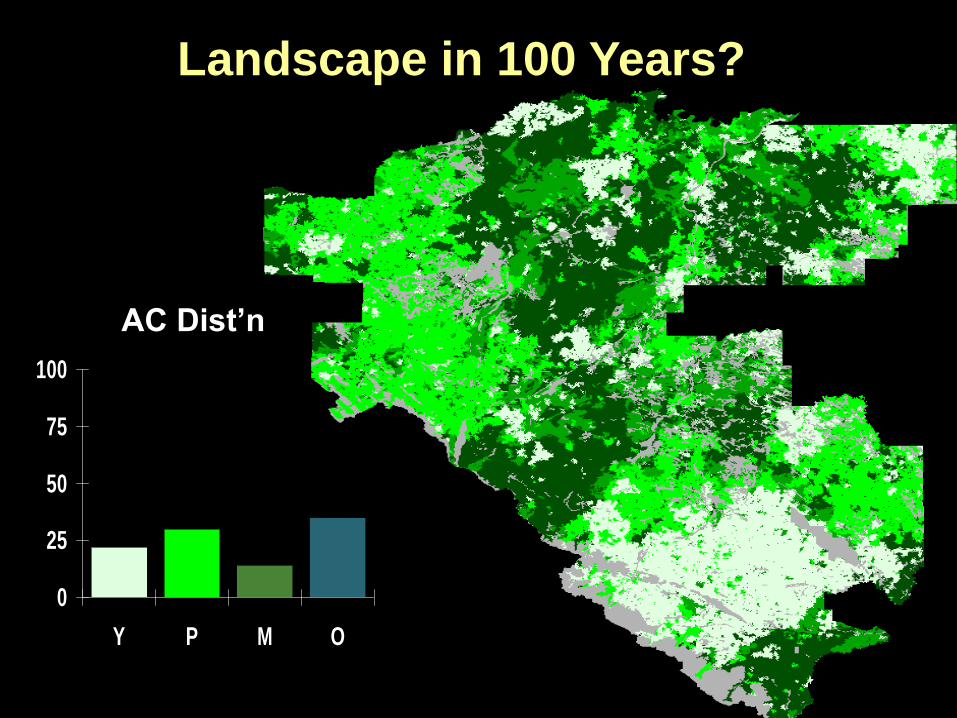
0
25
50
75
100
Y P M O
AC Dist’n
Landscape in 100 Years?
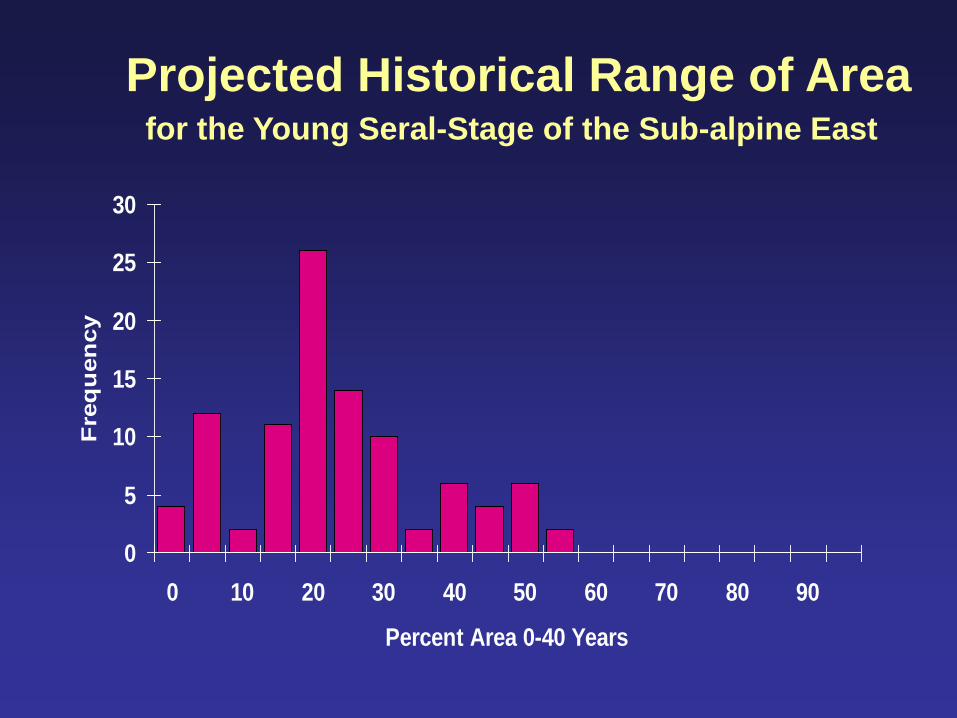
0
5
10
15
20
25
30
0 10 20 30 40 50 60 70 80 90
Percent Area 0-40 Years
Fre
qu
en
cy
Projected Historical Range of Area for the Young Seral-Stage of the Sub-alpine East
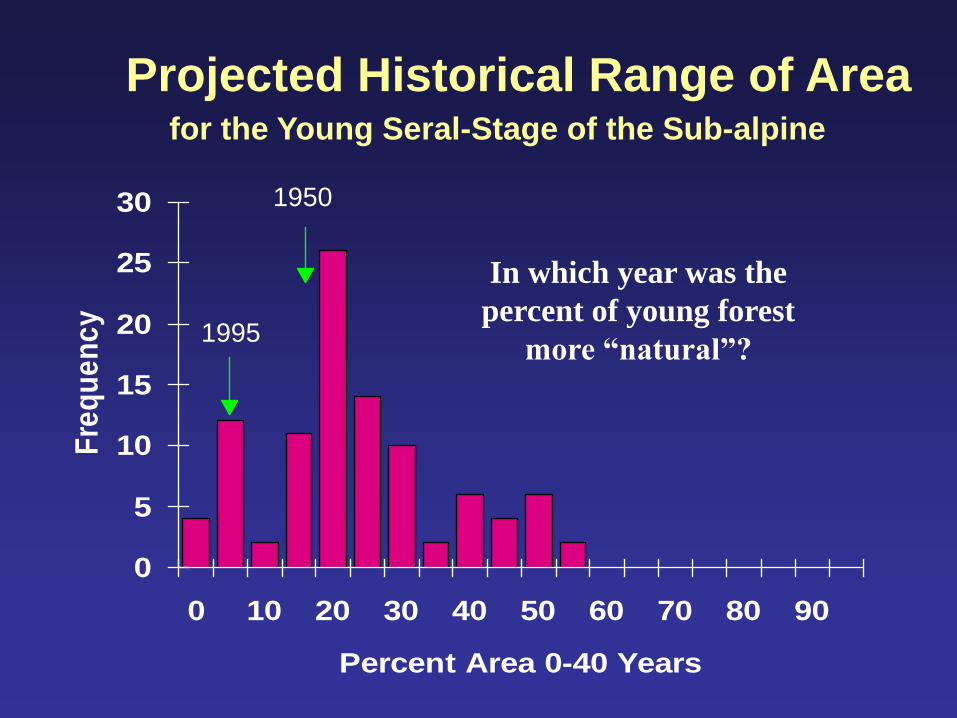
0
5
10
15
20
25
30
0 10 20 30 40 50 60 70 80 90
Percent Area 0-40 Years
Fre
qu
en
cy
1995
1950
Projected Historical Range of Area for the Young Seral-Stage of the Sub-alpine
In which year was the
percent of young forest
more “natural”?
0
5
10
15
20
25
30
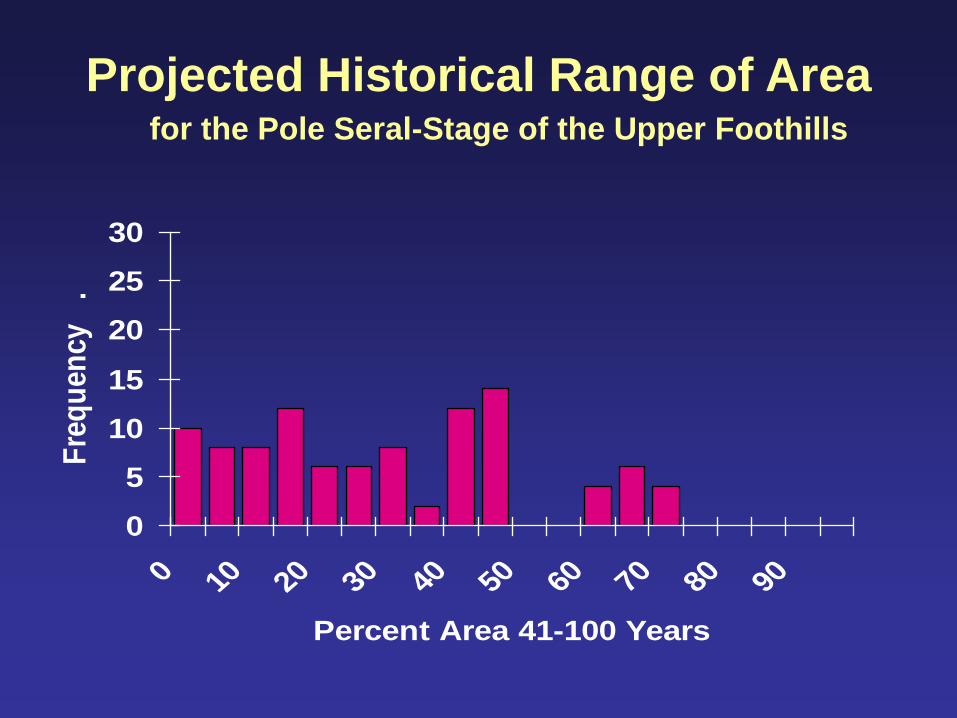
0 10 20 30 40 50 60 70 80 90
Percent Area 41-100 Years
Fre
qu
en
cy
.Projected Historical Range of Area
for the Pole Seral-Stage of the Upper Foothills
0
5
10
15
20
25
30
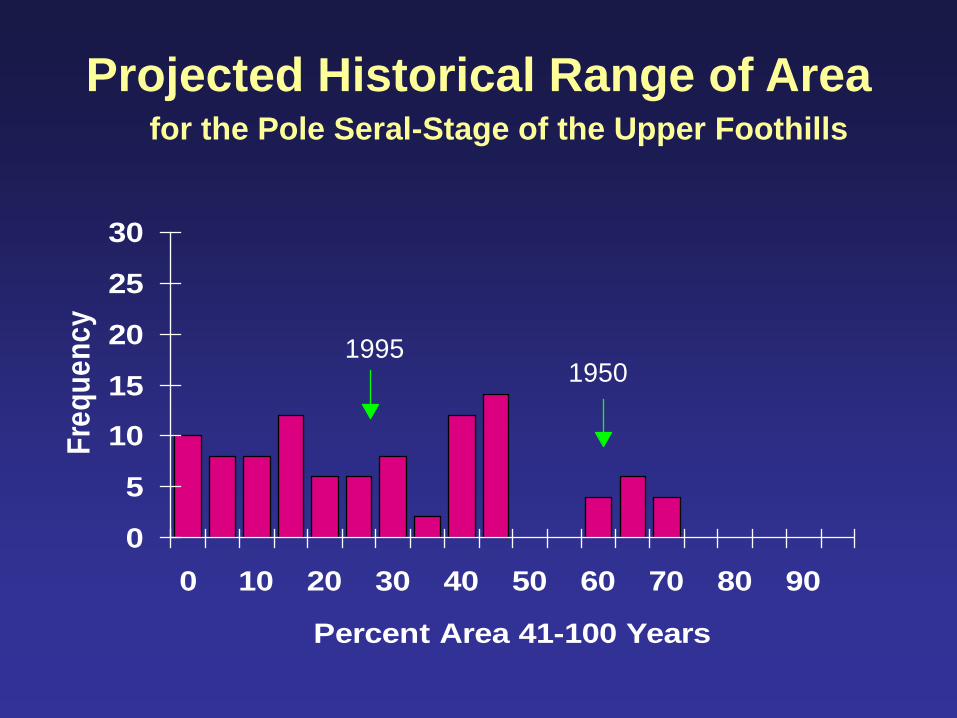
0 10 20 30 40 50 60 70 80 90
Percent Area 41-100 Years
Fre
qu
en
cy
1995 1950
Projected Historical Range of Area for the Pole Seral-Stage of the Upper Foothills
0
5
10
15
20
25
30
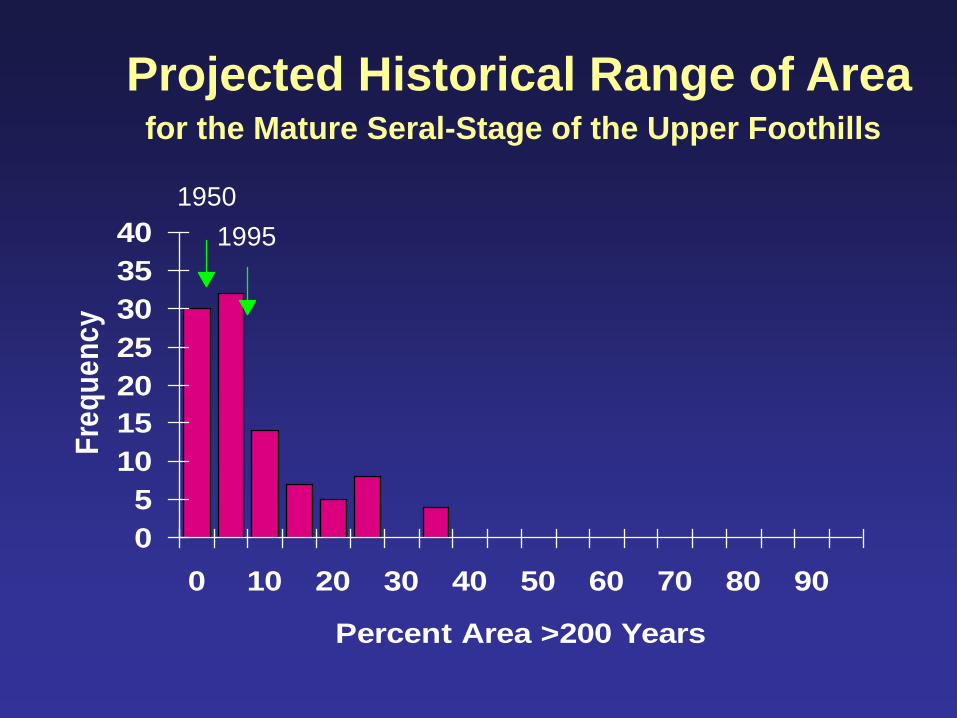
35
40
0 10 20 30 40 50 60 70 80 90
Percent Area >200 Years
Fre
qu
en
cy
1995
1950
Projected Historical Range of Area for the Mature Seral-Stage of the Upper Foothills
Older Forest as of 1950 on FMF
Landscapes
Landscape %>300 yrs %>200 yrs %>100 yrs
Lower Foothills 0 0 16
Upper Foothills 0 4 21
Subalpine east 2 15 45
* Subalpine JNP 7 37 59
* Montane 0 3 30
* includes 20-30 years of fire control

0
5
10
15
20
25
30
35
40
0 10 20 30 40 50 60 70 80 90
Percent Area >200 Years
Fre
qu
en
cy
1995
1950
Projected Historical Range of Area for the Mature Seral-Stage of the Upper Foothills
Older Forest as of 1950 on FMF
Landscapes
Landscape %>300 yrs %>200 yrs %>100 yrs
Lower Foothills 0 0 16
Upper Foothills 0 4 21
Subalpine east 2 15 45
* Subalpine JNP 7 37 59
* Montane 0 3 30
* includes 20-30 years of fire control
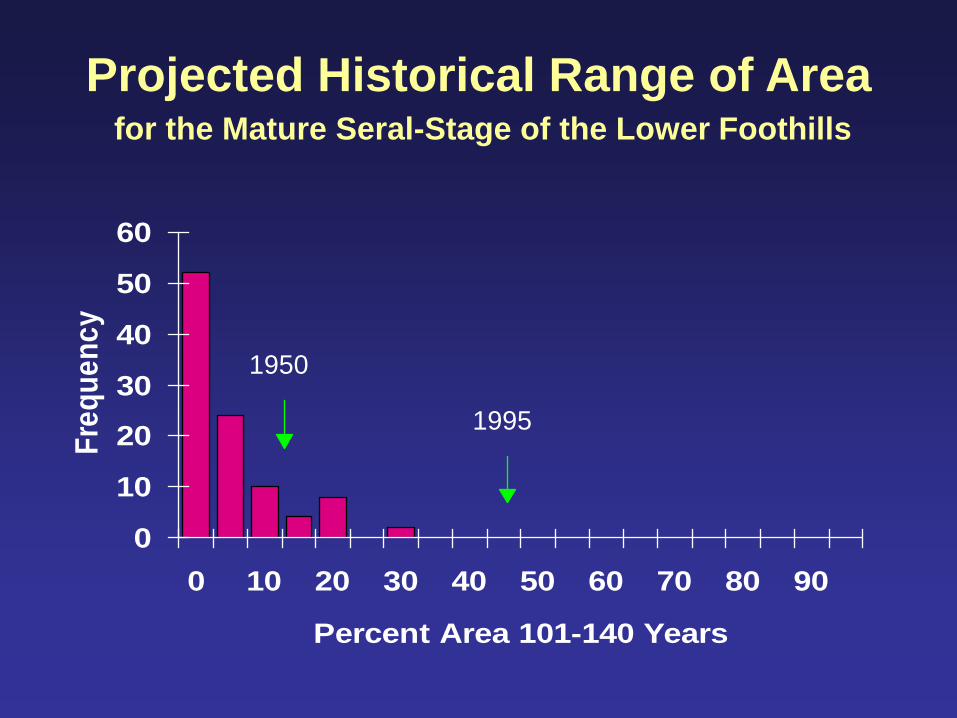
0
10
20
30
40
50
60
0 10 20 30 40 50 60 70 80 90
Percent Area 101-140 Years
Fre
qu
en
cy
1995
1950
Projected Historical Range of Area for the Mature Seral-Stage of the Lower Foothills
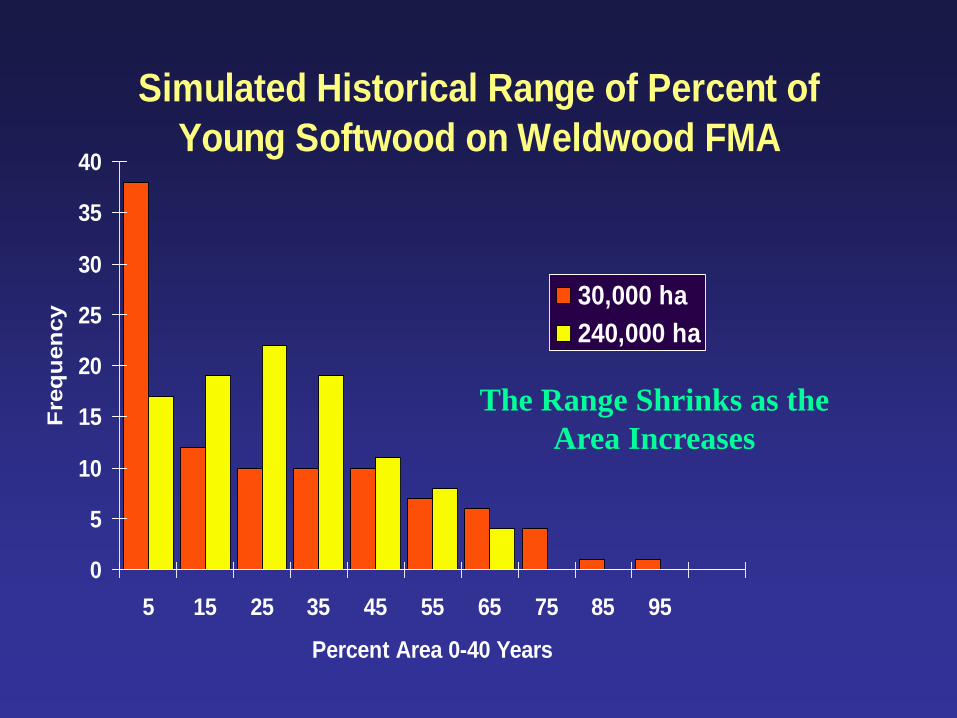
Simulated Historical Range of Percent of
Young Softwood on Weldwood FMA
0
5
10
15
20
25
30
35
40
5 15 25 35 45 55 65 75 85 95
Percent Area 0-40 Years
Fre
qu
en
cy
30,000 ha
240,000 ha
The Range Shrinks as the
Area Increases
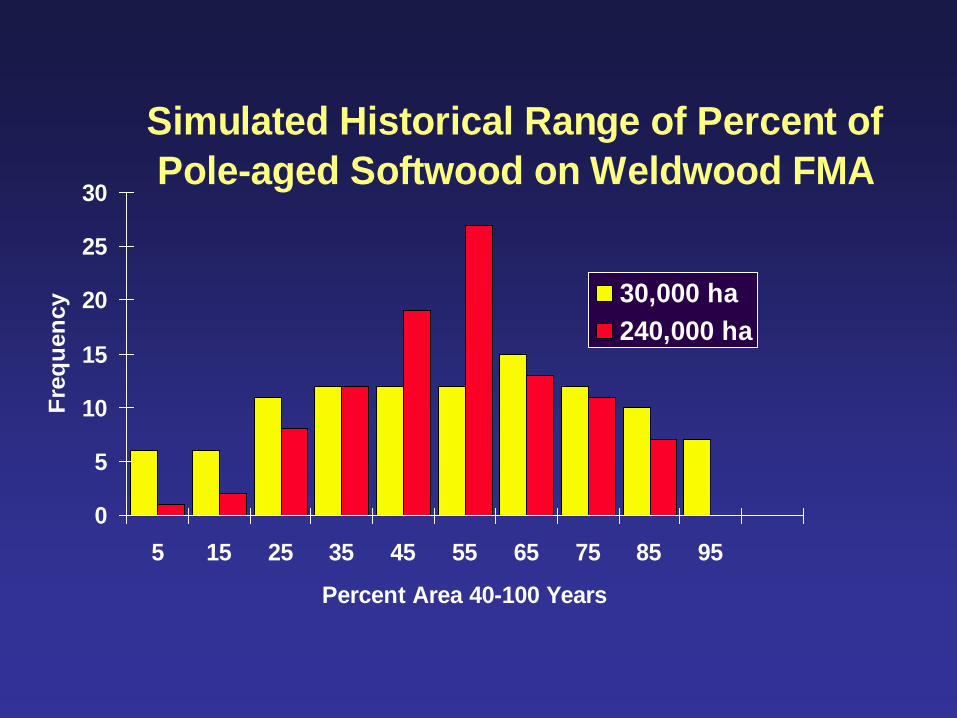
Simulated Historical Range of Percent of
Pole-aged Softwood on Weldwood FMA
0
5
10
15
20
25
30
5 15 25 35 45 55 65 75 85 95
Percent Area 40-100 Years
Fre
qu
en
cy 30,000 ha
240,000 ha
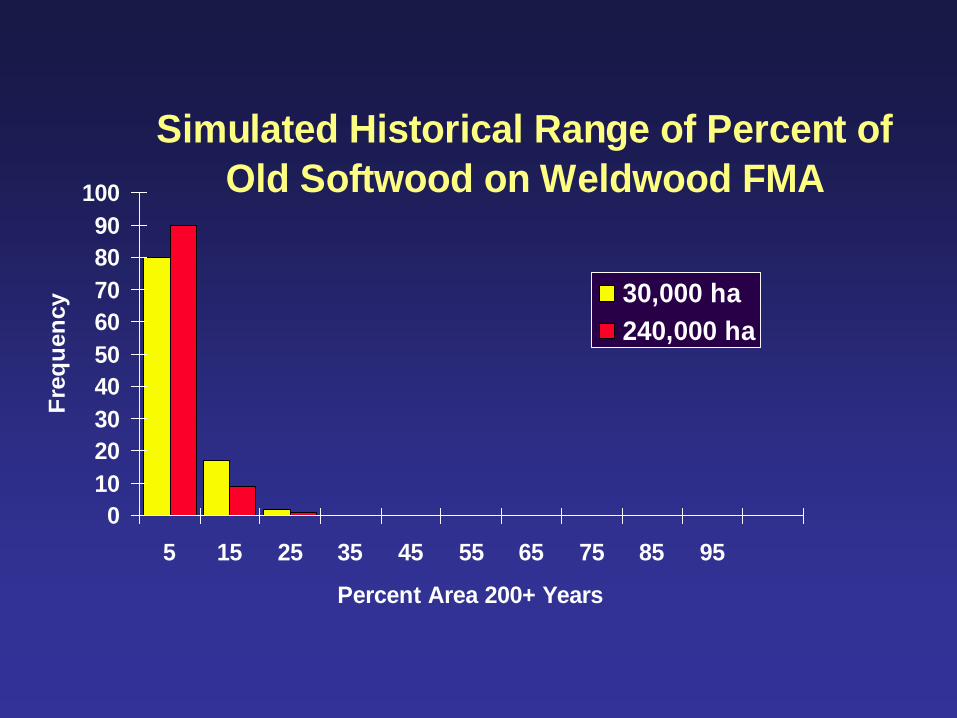
Simulated Historical Range of Percent of
Old Softwood on Weldwood FMA
0
10
20
30
40
50
60
70
80
90
100
5 15 25 35 45 55 65 75 85 95
Percent Area 200+ Years
Fre
qu
en
cy 30,000 ha
240,000 ha
0
10
20
30
40
50
60
70
80
90
100
0 0.6 1.2 1.8 2.4 3
Millions of Hectares
Per
cen
t A
rea
1
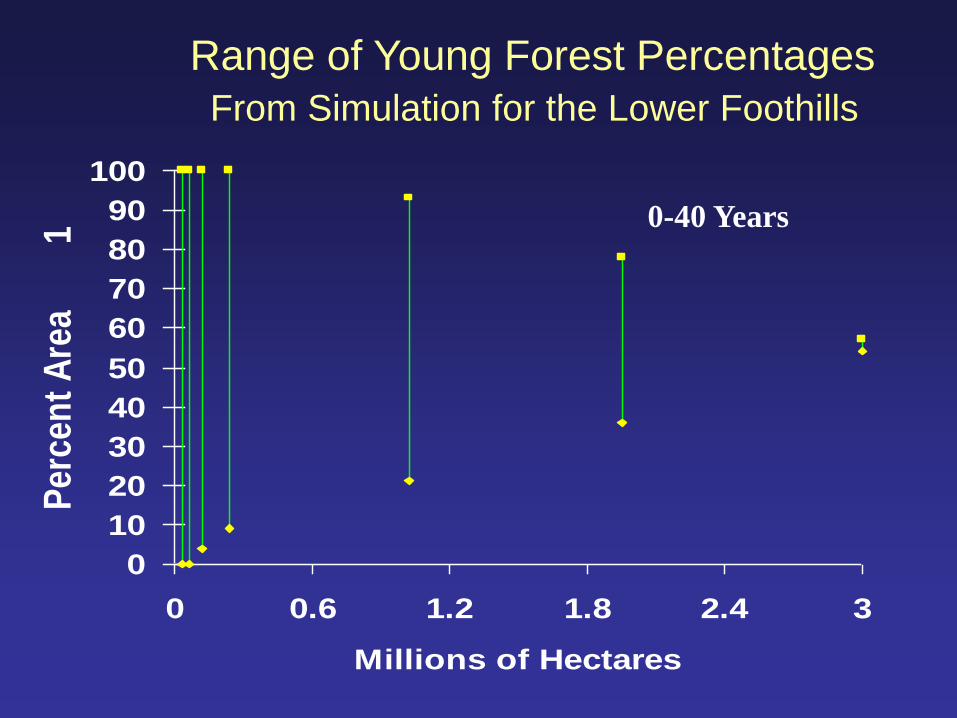
Range of Young Forest Percentages
From Simulation for the Lower Foothills
0-40 Years
0
20
40
60
80
100
0 0.6 1.2 1.8 2.4 3
Millions of Hectares
Perc
en
t A
rea
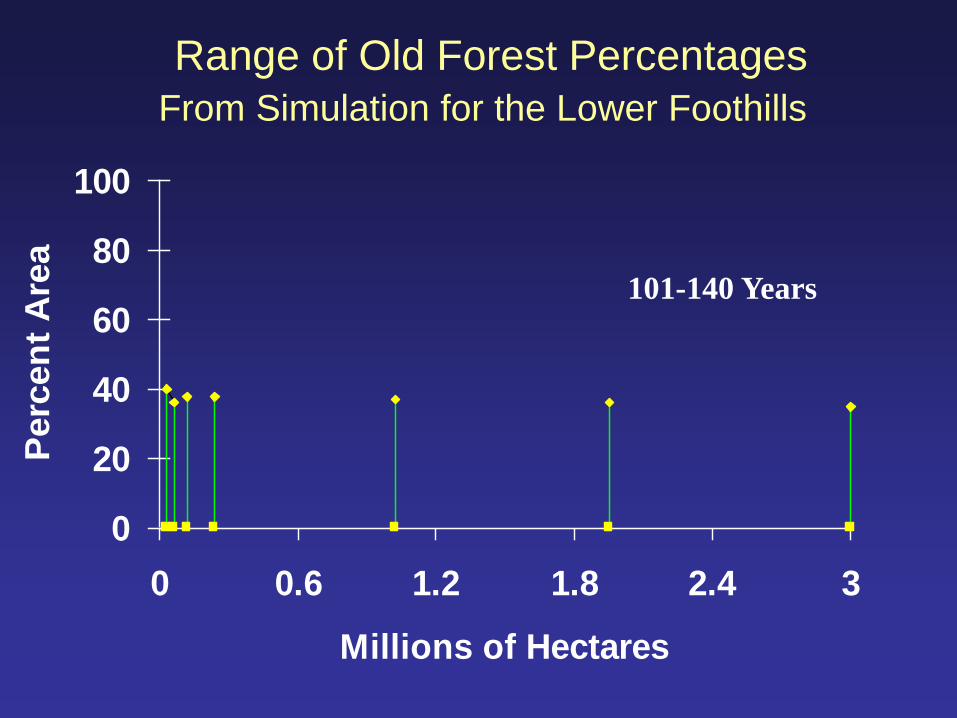
Range of Old Forest Percentages
From Simulation for the Lower Foothills
101-140 Years
In theory, a very large land area may
“stabilize” all age-class variation.
In practice, an “equilibrium point”
does not exist (where there is no
variation), but smaller areas do exhibit
higher age-class variability than larger
ones.
Age-Class Variability Patterns
This means that smaller areas (<100,000 ha)
experienced regular, extended periods of
extreme age-class variation, and probably
had no “old growth” to speak of for many
years, even decades.
Corollary of this is that “old growth”, like
any other age-class, tends to cluster over
very large areas.
Age-Class Variability Patterns
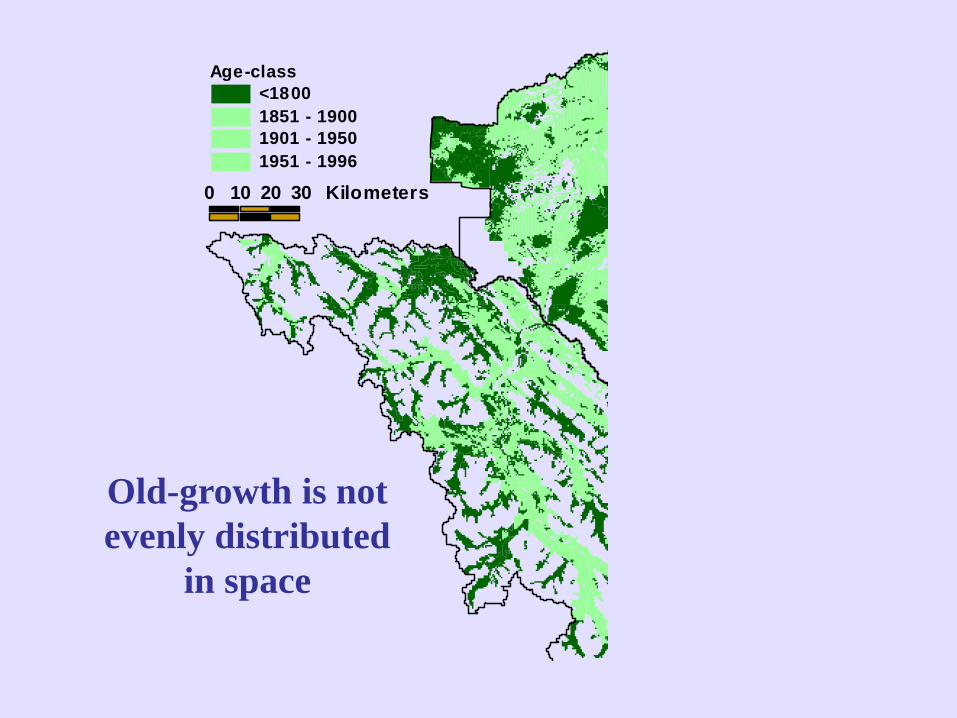
0 10 20 30 Kilometers
Age-class
<1800
1851 - 1900
1901 - 1950
1951 - 1996
Old-growth is not
evenly distributed
in space
• Age-class distributions have temporal patterns,
the range and shape of which may be unique to
natural subregions.
Is the Lower Foothills range of disturbance
indicative of spring vs. summer fire events?
• The range of temporal variability is generally
quite wide, ranging from between 1 and 2
percent of the land area disturbed to over 50%
for a given 20 year period.
• Areas of the same age-class cluster over large
areas.
Age-Class Summary
What Else at Coarse Scales?
• Fire threat
• Climate change
• Interaction of fire with other natural
disturbances
• Non-forested areas
• Fire and salvaging
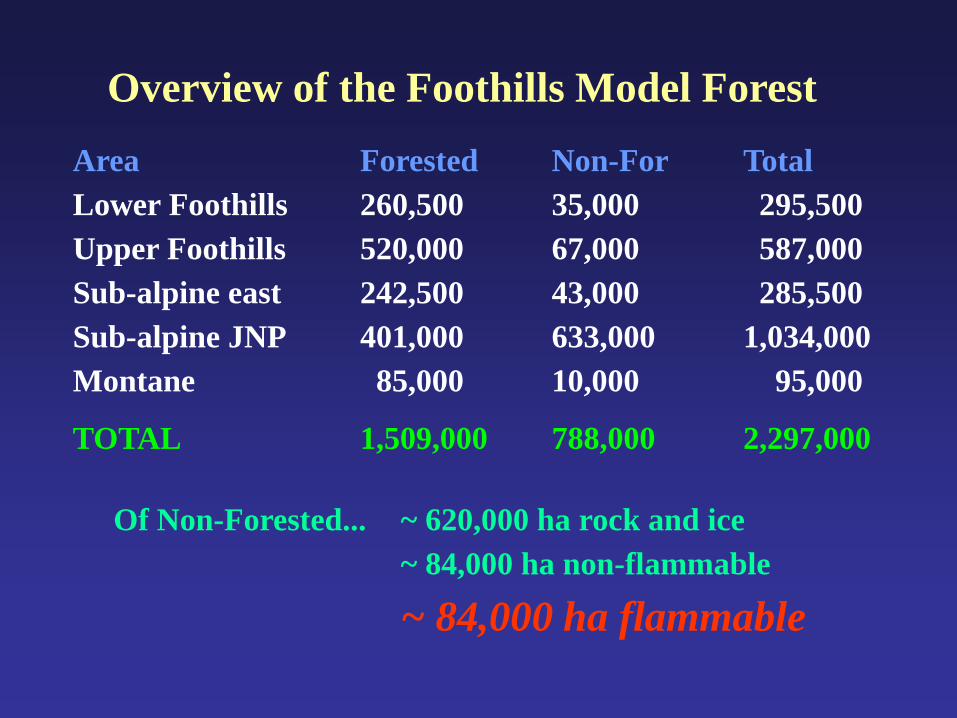
Overview of the Foothills Model Forest
Area Forested Non-For Total
Lower Foothills 260,500 35,000 295,500
Upper Foothills 520,000 67,000 587,000
Sub-alpine east 242,500 43,000 285,500
Sub-alpine JNP 401,000 633,000 1,034,000
Montane 85,000 10,000 95,000
TOTAL 1,509,000 788,000 2,297,000
Of Non-Forested... ~ 620,000 ha rock and ice
~ 84,000 ha non-flammable
~ 84,000 ha flammable
Non-Forested Areas: How Much Do
We Know?
• Build up of duff, peat?
• Potential for growing trees - soil temperature,
germination sites?
• Biodiversity implications? Who uses them?
Carbon storage?
Natural Disturbances Will Happen
… so we might as well take advantage.
• Integration of temporal age-class variability.
• Create ecological benefits of natural disturbance
that cultural disturbances cannot create (given
that salvage policies allow for it).
• Disturbance of non-forested areas.
• Stand-level structure, leaving biomass on
site, nutrient release, compaction.
• Fewer wood flow surprises?????
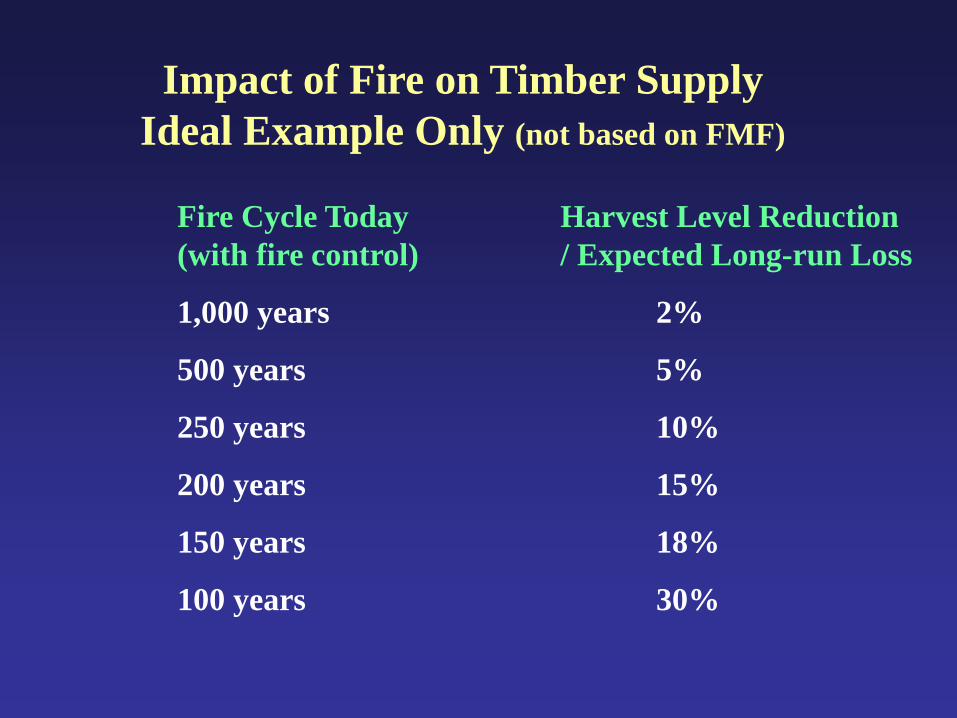
Impact of Fire on Timber Supply
Ideal Example Only (not based on FMF)
Fire Cycle Today Harvest Level Reduction
(with fire control) / Expected Long-run Loss
1,000 years 2%
500 years 5%
250 years 10%
200 years 15%
150 years 18%
100 years 30%

•Non-forested areas are part of the landscape and
much of it evolved with fire. We do not know the
full impacts of removing fire on these areas.
• Natural disturbance will happen, and there are
some positive aspects that a salvage policy can take
advantage of.
• Disturbance of non-forested areas.
• De-stabilizing age-class pattern over time.
• Fine-scale patterns that cultural disturbance
activities cannot match.
Disturbance Design Issues at
Coarse Scales
Disturbance Design Issues at
Coarse Scales
• In this case, ecological subregions are good
means of differentiating areas with distinctive fire
cycles.
• Age-class distributions vary over space. Same-
aged areas tend to cluster.
• Age-class distributions vary tremendously over
time. Where there are “nodes” of old-growth
today, there were likely none 100 years ago.