Embed Size (px)
Citation preview
1
HKCP ALUMNI BULLETIN
Issue-XII Feb- 2014
From the Editors Desk:
Dear Alumni,
I am pleased to present the 12th issue of alumni bulletin. A cultural week and Orane 2014 was celebrated
from 23rd
Jan to 28th Jan. It was full of activities as sports day; many competitions were organized as
indoor –outdoor games, mehendi, tattoo making, face painting, rangoli, dumb charades and mono acting.
Our students participated in inter college competitions like Rx sports, RX cultural and RX tech-fest. On
nation level students has participated in Manthan- 2013.
In Success secret series the present issue carries an article “SOFTWARES IN
PHARMACEUTICAL RESEARCH”
As ever we always work towards giving you more and more of news about college, do send us
your views and suggestions.
With best wishes
SheelaYadav
2
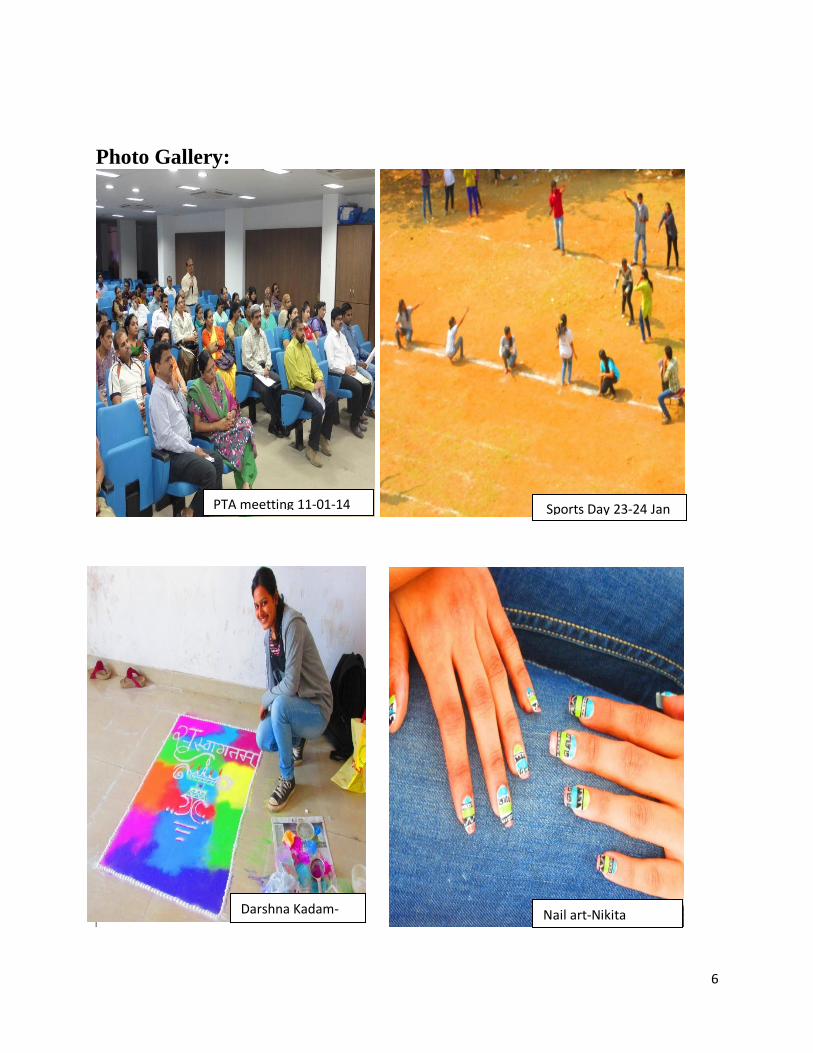
Campus News:
A PTA meeting was held on 11th
Jan 2014.
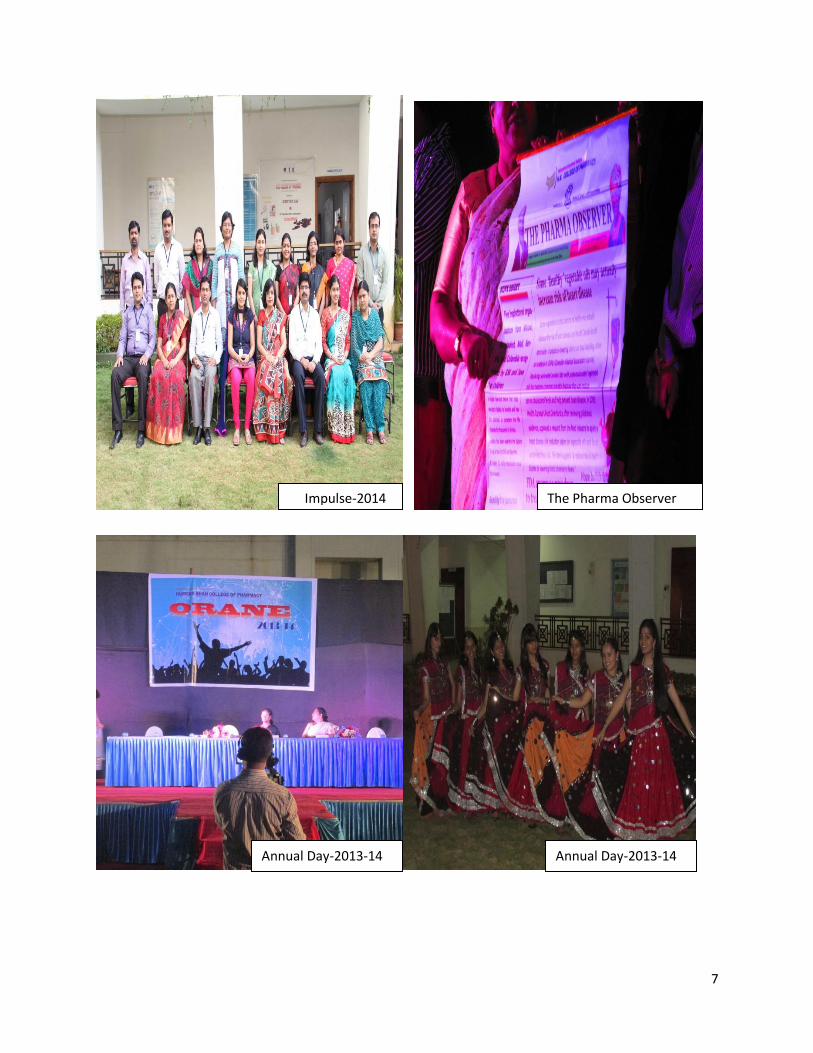
A photo session for Impulse was organized on 13th Jan.
The cultural week was organized under the guidance of principal madam.
A sport day was organized on 23rd
and 24th
Jan. Students were participated in various out
doors and in doors games.
On 25th Jan students were participated in nail art, mehandi, face painting, tattoo making,
rangoli ect.
On 26th
Jan, The Republic day was celebrated.
On 28th
Jan “Orane” annual day was celebrated. The students were awarded with trophy
and certificates for their achievements.
For Academic Year 2012-2013; Tarjani form 1st year M.Pharm, Gaurave from final year,
Mitchell lobo from 3rd
year, Anamika Pandey from 2nd
yr, Prabhuta Makwana fron 1st yr;
got 1st prize.
Under the guidance of Dr. Anubha Khale and Sunita Ogale madam; in manthan two groups
from our college were participated and their ppt selected on 34th and 35
th position.
For RX sports; Maulik and Nihkil from 2nd
yr got 2nd
prize for Bowling, Vivek from 2nd
yr
for NFS got 2nd
prize, Yasin from 4th
yr got 2nd
prize for Fifa, for carom doubles (girls)
Rohini and Varsha from 3rd
yr got 3rd
prize ect.
RX cultural; 1st prize for spelling buzz Rahul from 2
nd ye, 2
nd prize for personality Zaid
from 4th
yr, 3rd
prize for Hogathon John from 2nd
yr, 3rd
prize for poetry writing Salma
shaikh from 4th
yr.
RX Tech-fest; From 4th yr Zaid and Akshay got 1
st prize for poster presentation, 3
rd for
oral presentation.
Pharma observer and Impulse-14 was released on 28th
Jan.
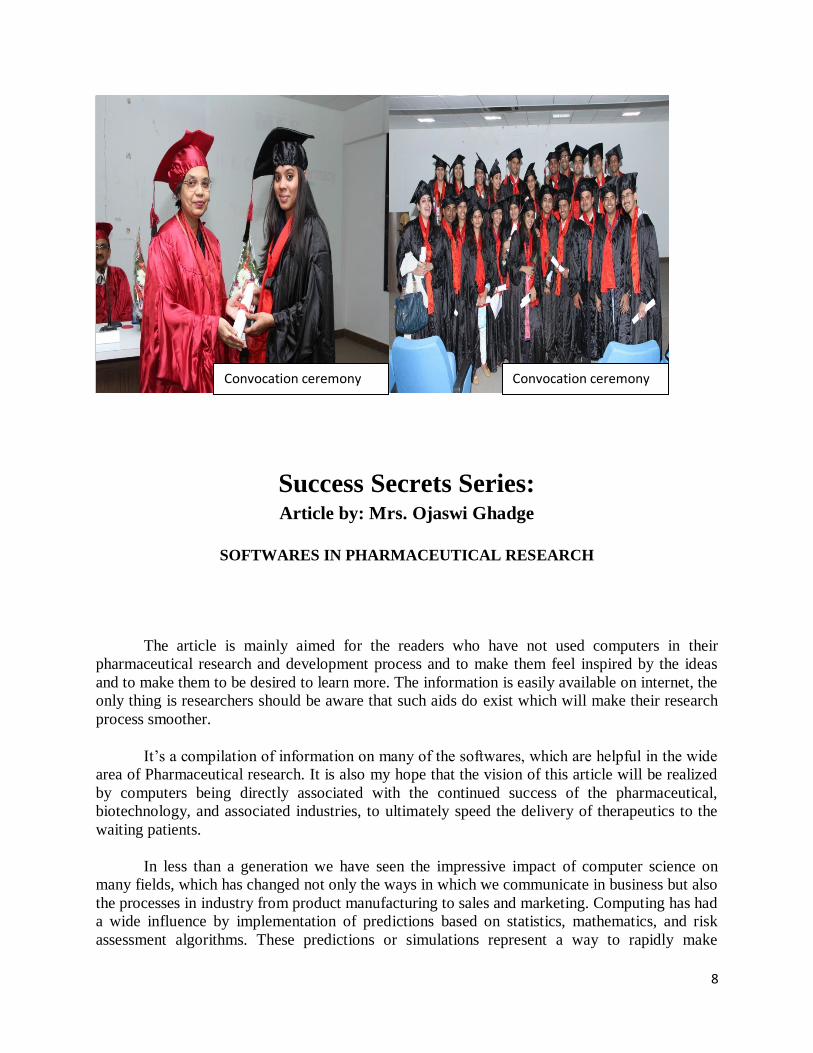
Convocation ceremony was held on 18th
Feb.
3
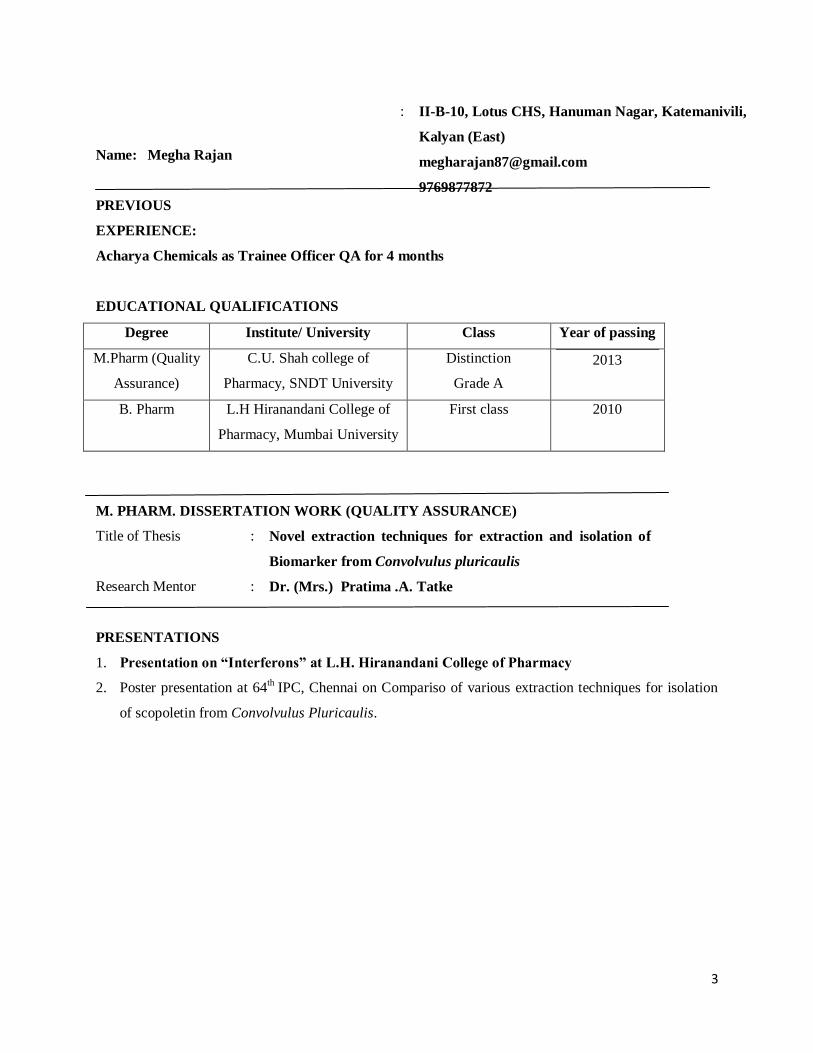
Name: Megha Rajan
PREVIOUS
EXPERIENCE:
Acharya Chemicals as Trainee Officer QA for 4 months
EDUCATIONAL QUALIFICATIONS
Degree Institute/ University Class Year of passing
M.Pharm (Quality
Assurance)
C.U. Shah college of
Pharmacy, SNDT University
Distinction
Grade A
2013
B. Pharm L.H Hiranandani College of
Pharmacy, Mumbai University
First class 2010
M. PHARM. DISSERTATION WORK (QUALITY ASSURANCE)
Title of Thesis : Novel extraction techniques for extraction and isolation of
Biomarker from Convolvulus pluricaulis
Research Mentor : Dr. (Mrs.) Pratima .A. Tatke
PRESENTATIONS
1. Presentation on “Interferons” at L.H. Hiranandani College of Pharmacy
2. Poster presentation at 64th
IPC, Chennai on Compariso of various extraction techniques for isolation
of scopoletin from Convolvulus Pluricaulis.
: II-B-10, Lotus CHS, Hanuman Nagar, Katemanivili,
Kalyan (East)
9769877872
4
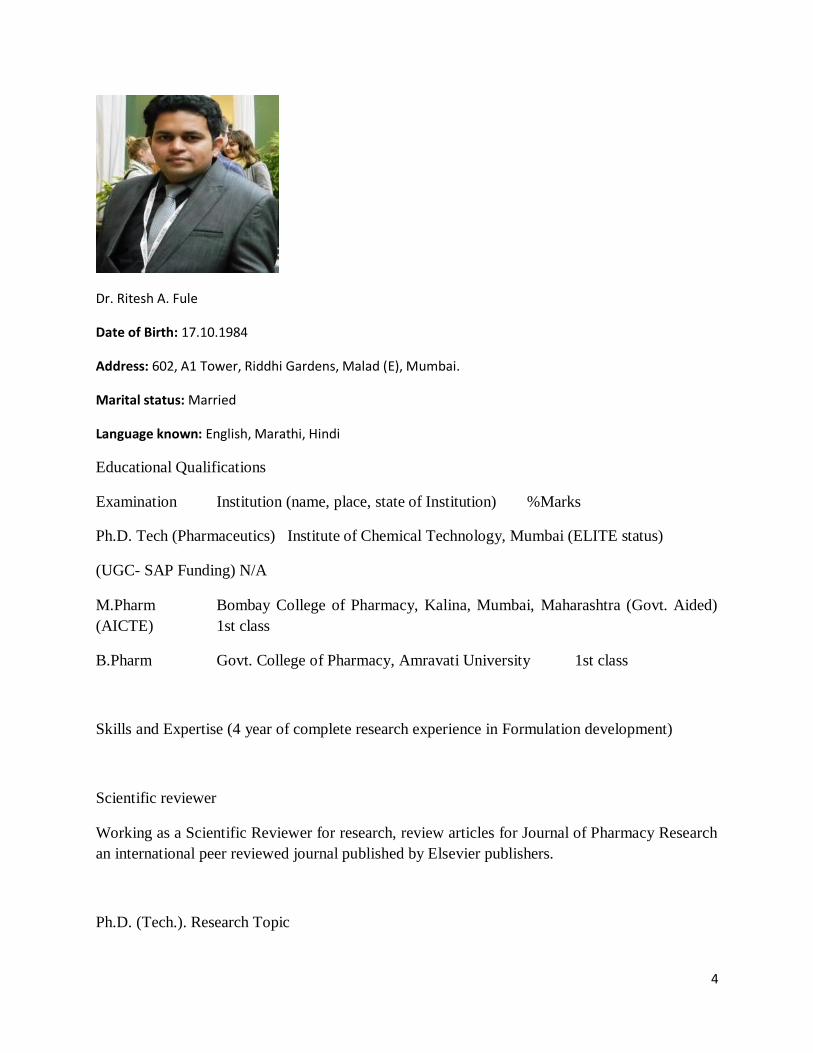
Dr. Ritesh A. Fule
Date of Birth: 17.10.1984
Address: 602, A1 Tower, Riddhi Gardens, Malad (E), Mumbai.
Marital status: Married
Language known: English, Marathi, Hindi
Educational Qualifications
Examination Institution (name, place, state of Institution) %Marks
Ph.D. Tech (Pharmaceutics) Institute of Chemical Technology, Mumbai (ELITE status)
(UGC- SAP Funding) N/A
M.Pharm Bombay College of Pharmacy, Kalina, Mumbai, Maharashtra (Govt. Aided)
(AICTE) 1st class
B.Pharm Govt. College of Pharmacy, Amravati University 1st class
Skills and Expertise (4 year of complete research experience in Formulation development)
Scientific reviewer
Working as a Scientific Reviewer for research, review articles for Journal of Pharmacy Research
an international peer reviewed journal published by Elsevier publishers.
Ph.D. (Tech.). Research Topic
5
“Innovative drug delivery systems for Antimalarials in Fixed dose form”
Research Supervisor: Prof. Purnima D. Amin
Place of research work: Institute of Chemical Technology
List of Publications in Peer-Reviewed Journals (published / accepted / under review) -15
Patents
1. Indian Patent with complete specification (1674/MUM/2013) filled entitled “Pharmaceutical
Dosage Form Comprising Antimalarial Ingredients In A Solid Dispersion Using Hot Melt
Extrusion Technology” (Ritesh A. Fule, Tarique S. Meer, Purnima D. Amin)
2. Indian patent entitled “Preparation and use of oligosaccharide imprinted mesoporous silica”
got published with patent application number 2056/MUM/2011 in 19/7/2011; Meer Tariq Ali,
Patole Rahul K, Fule Ritesh Amol, Amin Purnima Dhanraj.
3. Indian patent entitled “Once a daily oral sustained release gastroretentive formulation of
lafutidine” got published with patent application number 3203/MUM/2011; Khan Furqan,
Dhamecha Dinesh, Ghadlinge Shyam, Fule Ritesh Amol.
Presentations (oral / poster) in Conferences / Workshops / Seminars
Posters presented-5
Awards and honors
1. Awarded 1st Prize for poster presentation entitled “Engineering novel pfLDH inhibitors for
falciparum species” in Medicinal chemistry at the 61st Indian Pharmaceutical Congress held at
Ahmedabad from December 12th to 13th, 2009.
2. Awarded Gold medal for the poster presentation entitled “Design and synthesis of novel
inhibitors of pfLDH for plasmodium falciparum” at DIA conference in Mumbai, 2009.
6
Photo Gallery:
PTA meetting 11-01-14 Sports Day 23-24 Jan
Darshna Kadam- 1st prize Darshna Kadam-
1st prize Nail art-Nikita
Karedia
7
Impulse-2014 The Pharma Observer
released on
Annual Day-2013-14 Annual Day-2013-14
8
Success Secrets Series: Article by: Mrs. Ojaswi Ghadge
SOFTWARES IN PHARMACEUTICAL RESEARCH
The article is mainly aimed for the readers who have not used computers in their
pharmaceutical research and development process and to make them feel inspired by the ideas
and to make them to be desired to learn more. The information is easily available on internet, the
only thing is researchers should be aware that such aids do exist which will make their research
process smoother.
It’s a compilation of information on many of the softwares, which are helpful in the wide
area of Pharmaceutical research. It is also my hope that the vision of this article will be realized
by computers being directly associated with the continued success of the pharmaceutical,
biotechnology, and associated industries, to ultimately speed the delivery of therapeutics to the
waiting patients.
In less than a generation we have seen the impressive impact of computer science on
many fields, which has changed not only the ways in which we communicate in business but also
the processes in industry from product manufacturing to sales and marketing. Computing has had
a wide influence by implementation of predictions based on statistics, mathematics, and risk
assessment algorithms. These predictions or simulations represent a way to rapidly make
Convocation ceremony Convocation ceremony
9
decisions, prototype, innovate, and, importantly, learn quickly from failure. The computer is
really just a facilitator using software and a user interface to lower the threshold of entry for
individuals to benefit from complex fields such as mathematics, statistics, physics, biology,
chemistry, and engineering. Without necessarily having to be an expert in these fields the user
can take advantage of the software for the desired goal whether in the simulation of a process or
for visualization and interpretation of results from analytical hardware.
Within the pharmaceutical industry we have progressed from the point where computers
in the laboratory were rarely present or used beyond spread-sheet calculations. Now computers
are ubiquitous in pharmaceutical research and development laboratories, and nearly everyone has
at least one used in some way to aid in his or her role. It should come as no surprise that the
development of hardware and software over the last 30 years has expanded the scope of
computer use to virtually all stages of pharmaceutical research and development (data analysis,
data capture, monitoring and decision making, Computers as Data Analysis and Data
Management Tools in Preclinical Development, Statistical Modeling in Pharmaceutical Research
and Development, Chemoinformatics Techniques for Processing ChemicalStructure Databases,
Electronic Laboratory Notebooks, Protein Crystallograph, Computer Algorithms for Selecting
Molecule Libraries for Synthesis, Computer Methods for Predicting Drug Metabolism
orAnalyzing Adverse Drug Events).
There are many excellent books, papers published that are focused on in-depth
discussions of computer-aided drug design, bioinformatics, or other related individual topics.
General Programming Tools
Accelrys provides high-quality scientific information products and services to the fine-chemical,
pharmaceutical, agrochemical, biotechnology and academic research community.
Accord for Microsoft Access is a chemical database, relational, multi-user and fast.
Accord for Microsoft Excel, Synopsys' bestselling chemical spreadsheet, is used by
thousands of chemists world-wide to transform raw chemical data into meaningful
information.
With the Accord VBX, developers can rapidly integrate Accord's chemical capabilities
into their own Visual Basic applications.
With the Accord Software Development Kit (SDK), developers can integrate Accords'
chemical capabilities into their own applications, such as Notes, Access, Word, Foxpro,
Paradox or Omnis 7.
Accelrys also produces five corporate reaction databases, Solid-Phase Synthesis,
Methods in Organic Synthesis, Biocatalysis, Protecting Groups and Bioster.
ChemBuddy (http://www.chembuddy.com) offers a variety of Chemical calculators for labs and
education. We offer three chemical calculators, easy to use Windows applications that balance
chemical equations, do stoichiometric calculations, convert concentrations and calculate pH.
10
Calculators help you easily prepare lab reports, solve textbook questions, check results of your
homework, prepare solutions, calculate titration results or prepare quizzes and tests for students.
EBAS (Equation Balancing and Stoichiometry calculator) balances reaction equations, calculates
stoichiometric masses and number of moles of reagents and finds limiting reagents. All you have
to do is to enter substance formulas and their known amounts. Program has a built in
concentration and ideal gas calculators to further speed up calculations. EBAS exports balanced
reactions as TXT, RTF, HTML, LaTeX and UBBC code making it easy to incorporate equations
into papers, on line lectures and lab reports.
CASC (Concentration and Solution Calculator) calculates concentrations and converts between
molar, molal, percent w/w and w/v concentrations and molar fractions. These conversions
require knowledge of solution density and CASC uses built in database of density tables of over
300 compounds for the highest possible accuracy. You may use it to prepare printable solution
recipes and to calculate concentrations of solutions regardless of the way they were prepared by
mixing other solutions or by dissolving solids.
BATE (Base Acid Titration and Equilibrium calculator) calculates pH of any solution containing
strong or weak acid and/or base with up to four dissociation steps. Built in database contains
dissociation constants for many popular acids and bases. Program also calculates acid base
titration curves and allows calculation of ionic strength and activity coefficients if necessary.
You may compose solutions in several easy ways for example entering concentrations, entering
mass of substance and volume of solvent or entering volumes of acid and base solutions mixed.
All programs have easy and intuitive user interface and they were designed for the flexibility and
versatility. All possible calculations are done automatically whenever you enter any information
which not only speeds up finding answer but also helps twiddling with parameters and solving
what-if scenarios. Results of calculations can be always saved and printed for further reference.
All built in databases can be modified and extended by user.
IMSL Libraries IMSL supplies two libraries of subroutines for graphics, Mathematics and
Statistics. IMSL/IDL is an array oriented interactive command language complete with graphics
and a robust set of mathematical, statistical, image processing and signal processing functions
which allow visual exploration of numerical data. Exponent Graphics is a library of graphical
subroutines that alleviates the task of coding low-level graphics primatives. The IMSL Libraries
is an extensive set of 900 Fortran subroutines for applications in general applied mathematics,
special functions and for analyzing and presenting statistical data. Libraries are also available for
C programming needs. All of the IMSL software runs on a wide variety of platforms.
SolMis (Solubility/Miscibility) is a program available from Tarko Laszlo, Center of Organic
Chemistry (CCO) - Bucharest, Romanian Academy. The program solves five
solubility/miscibility problems:
what are the best solvents to dissolve a given compound
what is miscibility of two given compound
what are the best solvents to separate two compounds by extraction / precipitation
11
what is the best solvent to dissolve a given compound in the presence of a given poor
solvent
what is the solubleness of a given compound within a given good solvent / poor solvent
mixture
By an improvement routine the program may "learn" how to solve problems that involve
whimsical chemical groups. The SolMis software (a small archive of an installation kit) will be
sent only by E-mail.
Spectra Heap is a software product and a spectral lines database for atomic emission analysis
created on the basis of the spectral tables issued earlier as separate publications.
Technical Data Analysis and Graphing
Axum Technical data analysis and graphing program for Windows which provides over 80 2D
and 3D graphs. Panel plots based on TRELLIS graphics are also supported.
ChemSpread is an SGI-based statistical/spreadsheet program for use in analysing and
correlating structural, electronic, and biological data of chemical compounds. Its primary uses
are in the fields of drug design and agrochemicals.
CrossGraphs is a new software tool that helps you visualize, understand, and report complex,
multidimensional data in analysis databases and data warehouses.
Uniquely architected to present data in arrays of graphs that reveal important trends and
relationships, CrossGraphs is the industry's only data visualization product that can automatically
divide data into subsets and iteratively create many graphs, one graph per subset, on one or many
pages without programming. This unique combination of cross-tabulation and statistical graphics
lets you scan graphs along rows, columns, and diagonals to discover relationships in higher-
dimensional data and compare patterns across many subsets of the data. CrossGraphs supports
over a dozen built-in types of graphs.
CrossGraphs runs on industry-leading platforms including, personal computers with Windows
3.1, Windows for Workgroups 3.11, Windows95, and Windows NT; Sun workstations with
SunOS or Solaris; and Hewlett-Packard workstations with HP-UX. The system interfaces to a
variety of data sources including dBase, Oracle, text data files, SAS datasets, and ODBC-
compliant sources. A Customization Option lets programmers extend CrossGraphs with new
graph types and user interfaces designed specifically for their company's unique needs. This
option also supports integration with other software, via Windows OLE automation.
Application areas include High Throughput Compound Screening (HTS) and Combinatorial
Chemistry.
DataMontage is a Java class library that enables you to display information-dense collections of
timelines, time-series graphs, and time-stamped notes within Java applets or applications. You
can stack graphs and timelines vertically or arrange them in rows and columns to see patterns
12
spanning multiple variables. Flexible control over the color, shape, and size of graph and
timeline symbols lets you encode multiple attributes and highlight significant data points.
Design-Ease software for design of experiments (DOE) helps experimenters make breakthrough
discoveries. Wizards make it easy to set up two-level factorial, general factorial, fractional
factorial and Plackett-Burman designs. The program also provides simple one-way designs. A
point and shoot interface with progressive toolbar icons leads the user to statistically valid
predictive equations. Graphics simplify the analysis at every step.
Design-Expert software for design of experiments (DOE) includes all of the features of Design-
Ease plus powerful DOEs for process optimization including three-level factorials, central
composite, Box-Behnken and d-optimal designs. The program also offers mixture experiments
including simplex, extreme vertices and d-optimal designs; combined mixture/process designs
plus screening for up to 24 components. Rotatable 3D response surface maps (RSM) lead
experimenters to the peak of performance. Design-Expert then uses sophisticated multiple
response optimization routines to find the "sweet spot" that meets all specifications. Design-
Expert is one of Stat-Ease's design of experiments (DOE) software packages available.
EasyFit is a distribution fitting software designed to facilitate probability data analysis and best
model selection. It allows to easily and quickly selecting the probability distribution which best
fits to your data. EasyFit supports over 30 probability distributions, goodness of fit tests, and
high-quality graphs. A 30-day free trial is available for download at
http://mathwave.com/downloads.html. EasyFit is available from MathWave Technologies.
ECHIP: Software for Design of experiments (DOE). ECHIP software produces 3D diagrams
and 2D contour plots. You can view 2D and 3D plots simultaneously. This gives you a more
complete understanding of how the plotted control variables affect your response variable. You
can rotate a 3D plot to identify any peaks or valleys that might otherwise be obscured. The
combination of contour and 3D plots for each response variable which makes it easier to find
optimum and robust settings to get the maximum output, And achieve it consistently.
The software handles the analysis, computing all coefficient values, and checking the lack-of-fit
statistic to assess how good your model is. This is where lesser DOE packages fall down. They
make you do the analysis separately, expecting you to know what analysis is best for your
experiment and how to perform it. If the analysis indicates that you need another experiment,
ECHIP lets you augment existing designs. The application gives you a new set of experimental
runs to perform, combining the data from the original experiment with the results of the new
experimental runs for the analysis.
Version 6.4.1 Release - This CD contains multiple versions of ECHIP so that you can install
under Windows 95/98/NT and above (Using ECHIP 6.3.2) and Macintosh 7/8 (ECHIP 6.2.1 for
Macintosh)
Version 7.2 Pre-Release - This newest version of ECHIP is now shipping. Windows 95/98/NT
and above and Macintosh 7/8.
13
Fortner Visualization Suite is a collection of three tools which can be used to analyze and
manipulate sophisticated plots, images, and 3D renderings of data. The components are Plot - a
plotting tool that is optimized for huge datasets, Transform - for analysis of matrix and image
data, and Slicer - a volumetric visualization tool.
LeoAnalyst is an application for most common statistical analysis of data with intuitive friendly
user interface. Distribution, approximation, signal revealing, 3D presentation function of two
arguments, near neighbor method. Platform - all windows OC beginning Win95.
LeoCalculator is an application for performing calculation of mathematical expressions that
could include not only basic operations but also functions and brackets.
http://www.leokrut.com/LeoCalculator.zip
Platform - all windows OC beginning Win95. http://www.leokrut.com
Mathcad is a live worksheet-based program which performs numerical and symbolic
calculations, graphs, annotates, etc. The program is available for Windows and MacOS.
Mathematica is a technical computing system that seamlessly integrates a numeric and symbolic
computational engine, graphics system, programming language, documentation system, and
advanced connectivity to other applications."
MINITAB is a general statistical analysis package for Macintosh, Windows and PC platforms.
The program provides:
basic statistics
regression analysis
multivariate analysis
nonparametrics
experiment design
exploratory data analysis
time series
statistical process control
spreadsheet-like data editor
presentation quality graphics
MultiSimplex is new Windows-based chemometric software for experimental design and
optimization. The optimization is based on practical trials that are performed step-by-step. The
computation algorithms in the software are the simplex methods and fuzzy set membership
functions.
MultiSimplex can simultaneously handle up to 15 control variables and up to 15 response
variables with different, and conflicting, optimization objectives. Algorithms, objectives, etc. can
be changed "on the fly", On-line help and manual, Extensive database and graphical display of
results. It is designed for Microsoft Windows NT and Windows 95. Also it is Microsoft Office
14
97 Compatible. It requires Microsoft Excel. Supported platforms: 486 or Pentium PC's and
Windows 3.1/3.11, Windows 95 or Windows NT 3.51/4.0.
Origin is a technical graphics and data analysis program for Windows 3.1 and Windows 95.
Functions available include full analysis (regression, FFT, baseline and peak analysis), nonlinear
curve fitting, presentation, etc.
Pestode is comprised of two freeware programs to estimate parameters in ODEs by
quasilinearization. A library of ODE models is used in one program. Users can submit their own
models to be added. An option to use a "stiff" integration method is available. Eleven examples
illustrate use of PESTODE. A second program for estimation of rate constants in networks of
first order Rxns with three examples is included.
PractiCalc - A brand new CALCULATOR for your PC. More powerful than your usual
calculator - more user-friendly than a spreadsheet. PractiCalc provides both conventional and
unique calculator operation and facilities. PractiCalc processes your calculations, equations and
expressions giving the result as you type. PractiCalc's extensive built-in functions and user-
defined formula combine to allow flexible and extendible mathematical expressions. Practicalc
offers a comprehensive range of conversion operators and a special conversion screen.
PractiCalc is the prime choice for anyone who uses a computer - from professional scientists,
engineers to financial information processors including computer scientists, educators, students
and the layperson. PractiCalc runs in all Windows environments, 95 thru XP.
PrestoPlot (Version 1.16) is a freely available, windows-based 2D plotting tool. Among the
many improvements and bug fixes are:
Vector plots.
Plot arbitrary 1D functions (including cartesian, polar and parametric plots).
Perform interactive non-linear curve fitting of 1D data sets with an arbitrary number of fit
parameters.
Move and resize graphs using the mouse.
Zoom and scroll graphs using the wheel mouse and middle mouse button.
PlotData is a software package consisting of a plotter with data analysis capability. Data can be
plotted on the screen, viewed, edited, analyzed, differentiated, integrated, calculated and
reproduced graphically. Many sets of data can be overlapped to solve systems of equations
graphically. The three versions of PlotD11A.ZIP are available.
ProWorks is the provider of top quality data visualization solutions. Since 1986 ProWorks has
been the affordable, timesaving graphics choice for developers, financial institutions, business
and scientific applications. Our award-winning Flipper series is used by developers and software
professionals in major industries throughout the world. Continually expanded and updated, the
Flipper components provide a cost-efficient solution for adding virtually any type of scientific or
business charts to Windows applications and web pages. Flipper is backed by on-going, high
quality technical support. Supported OS include WinNT 3.x, WinNT 4.x, Win XP, Windows
2000.
15
Qmol is a program for viewing molecular structures and animating molecular trajectories.
Originally based on the molview demo program by Mark Kilgard (from his book, Programming
OpenGL for the X Window System) and inspired by the Xmol program. Qmol is similar to
programs like VMD , MolMol , weblab, Swiss-Pdb Viewer, MolScript, RasMol, gOpenMol and
ICM, but opts for a fast, easy to use user interface with a set of features focused on the display of
proteins and small molecules. It supports the following (on the Windows platform - features
under *uix are unfortunately rather limited):
Display wire frame, stick figure, ball and stick, point, space-filling, solid and flat ribbon,
trace and tube molecular structures from a PDB file.
Display of multiple molecular models (as used in NMR).
Animate molecular trajectories stored in a DCD (i.e. CHARMm/Xplor binary trajectory)
file in either big- or little-endian formats.
Kabsch rotate all structures in a trajectory against the initial structure.
Interactively measure bond lengths, bond angles and torsion angles.
Dynamically adjust user selected torsion angles.
Display atom labels.
Display coordinate axis.
Dynamic modification of the color scheme (including color-by-element, color-by-atom-
number, color-by-residue-number, color-by-temperature and color-by-occupancy).
Dynamic lighting.
Adjust atomic radii (including radii-by-temperature and radii-by-occupancy).
Print to any Windows supported printer and copy images to the Windows clip board.
Generate AVI movies from a molecular trajectory.
Assign secondary structure via the STRIDE program.
Stereo view.
Directly query the Protein Data Bank and display the resulting structure.
Detect and display hydrogen bonds (using the energetic criterion of Kabsch and Sander).
Use the wheel mouse to zoom in and out.
NEW: User defined clipping plane with rendered sphere/plane intersections.
16
NEW: Paste temperature and occupancy PDB fields from the windows clipboard.
SciPredict is a free program with optional models (after a 10 day trial period) that can be
purchased at $150 each. The program models are based on the training of a Bayesian
Regularized Neural Network. Preditions can be made individually by inputting SMILES strings
or by processing files of SMILES strings or SD files. SciMetrics offers chemical prediction
models for Vapor Pressure, Henry's Law, LogP, Water Solubility as well as the toxicity of
chemicals to Tetrahymena Pyriformis and Fathead Minnow.
The Sigma Suite of programs provide data analysis, equation development and graphing. The
programs include:
SigmaPlot: A library of 2D and 3D graph types, mathematical transforms and summary
statistics. Automatically fits and plots polynomial regressions up to 10th order and 95%
or 99% confidence and prediction levels.
SigmaStat, TableCurve, PeakFit: Advanced data fitting and analysis programs. Can be
used to separate and fit up to 100 overlapping, difficult to resolve peaks on spectroscopy,
chromatography and electrophoresis data.
SigmaScan, SigmaScan Pro and SigmaGel: Image measurement and analysis software
for digital images.
SigmaXL is a leading provider of user-friendly Excel add-in tools for statistical and graphical
analysis. Our flagship product, SigmaXL, was designed from the ground up to be cost-effective,
powerful, and easy to use. Features include:
Measurement Systems Analysis with confidence intervals
Multiple Linear Regression that accepts both continuous and categorical predictors
Capability Combination Report
Weibull Analysis
Control Chart Tools
o Add Data to existing control chart
o Split limits by historical group
o Scroll through chart data
o Easy to read summary of test violations
Stat-Ease: Design-Expert software is an experimental design program available from
http://www.statease.com/
STATISTICA: Complete Windows and Macintosh based data analysis and graphing
programs with thousands of on-screen customizable, presentation-quality graphs fully
integrated with all procedures.
StatView is a statistical analysis package which runs on both Macintosh and Windows
platforms. Statview provides a variety of statistical analyses and the ability to create high
quality presentation graphics. Links between data and results are interactive so that
changes to the data are immediately reflected in the models.
SYSTAT is a dynamic data explorer for Windows. Features for data management,
interactive, exploratory data analysis, comprehensive statistics, and high quality graphics.
17
SymbMath is a computer algebra system that can perform exact numeric, symbolic and graphic
computation.
Visual Math for Java: is a Java applet to serve as graphic calculator, equation solver, plotter of
functions, derivatives and integrals.
Spartan: Spartan is a powerful tool for computer aided drug design. The easy-to-use interface
delivers a new suite of molecular modelling features as well as quantum calculation tools for
chemists working in drug discovery. Pharmaceutical scientists can perform conformational
analysis and can quantify 3D molecular similarity based on structure, chemical function, and
pharmacophore models. Many of the leading Pharmaceutical companies are already using Wave
function software to fast-track development of new drugs.
Key Benefits of Spartan
Ease of Use
Spartan offers construction, manipulation, and analysis (both computational and statistical) from
a single, user friendly interface. The end result is that Spartan is easier to master, without
compromising the limitations of its functionality. This maximizes the return on investment for
pharma research companies.
Seamless Databases Access
Spartan integrates access to the leading molecular and spectroscopy databases seamlessly from
within the graphical interface.
Efficient Molecular Modelling
Spartan includes easy to use 3D builders for Organic, Inorganic, Peptides, and Nucleotides --it
offers a new substituent builder for generating virtual libraries, and one can use ChemDraw
(directly from within Spartan) to build in 2D and seamlessly convert the 2D molecule to 3D
within Spartan.
Conformer Library Generation
A new capability has been added to provide generation of libraries of diverse conformers. This is
based on a systematic search of conformation space using MMFF molecular mechanics,
followed by a procedure to eliminate conformers that occupy "similar space". Conformer
libraries are intended for use in similarity analysis. Conformer libraries corresponding to
common drugs (5,000 entries) and to the Maybridge compendium, "Compounds for Drug
Discovery Chemistry" (70,000 entries) are provided via the Spartan Molecular Database (SMD).
18
Similarity Analysis
A new capability has been developed for assessing and quantifying the similarity of one or more
"templates" (either molecules or pharmacophores), to one or more "libraries" (including libraries
of diverse conformers). Similarity between molecules may either be based on structure or on
CFD's, whereas similarity between molecules and pharmacophores is based solely on CFD's. A
scoring function based on rms deviations between selected atomic centers or between CFDs
(automatically adjusted to account for unfavorable intramolecular interactions) has also been
provided.
Reference:
1. http://www.computational-chemistry.co.uk/pharmaceutical-research-software.html
2. http://www.pharmaresearch.in/?page=17e62166fc8586dfa4d1bc0e1742c08b
3. Computer applications in Pharmaceutical Research and Development, Sean Ekins, A
JOHN WILEY & SONS, INC., PUBLICATION
---------------------------------------------------------------------------------------------------------------------