Embed Size (px)
Citation preview

HIV Surveillance by Race/Ethnicity
National Center for HIV/AIDS, Viral Hepatitis, STD & TB Prevention
Division of HIV/AIDS Prevention
Diagnoses of HIV Infection among Adults and Adolescents, by Race/Ethnicity, 2008–2012
United States and 6 Dependent Areas
Note. Data include persons with a diagnosis of HIV infection regardless of stage of disease at diagnosis. All displayed data have been statistically adjusted to account for reporting delays, but not for incomplete reporting.
a Hispanics/Latinos can be of any race.
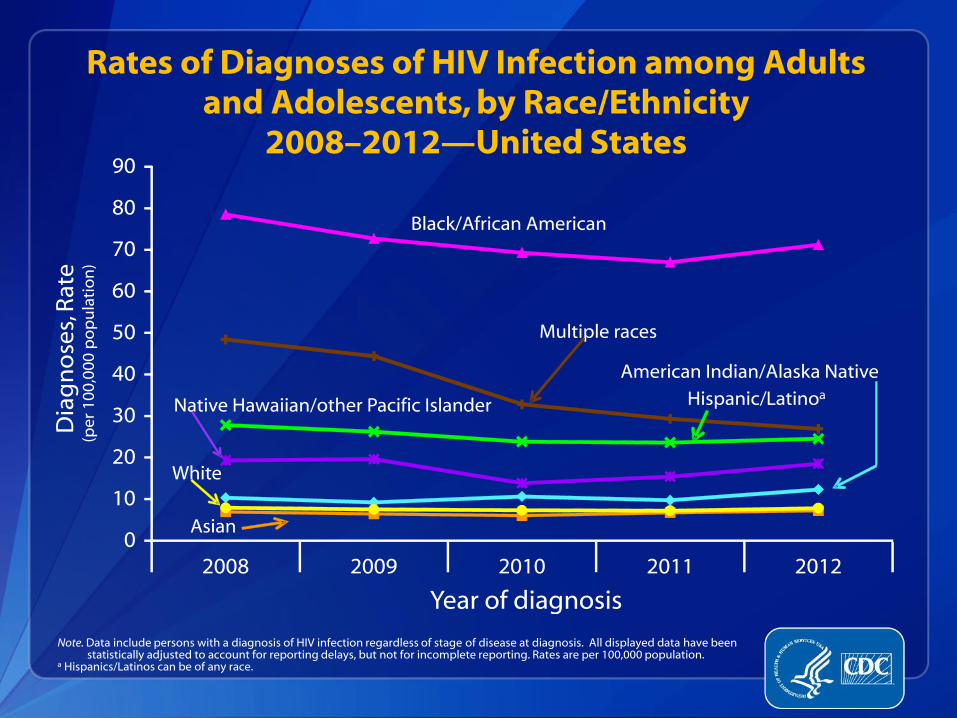
Rates of Diagnoses of HIV Infection among Adults and Adolescents, by Race/Ethnicity
2008–2012—United States
Note. Data include persons with a diagnosis of HIV infection regardless of stage of disease at diagnosis. All displayed data have been statistically adjusted to account for reporting delays, but not for incomplete reporting. Rates are per 100,000 population.
a Hispanics/Latinos can be of any race.
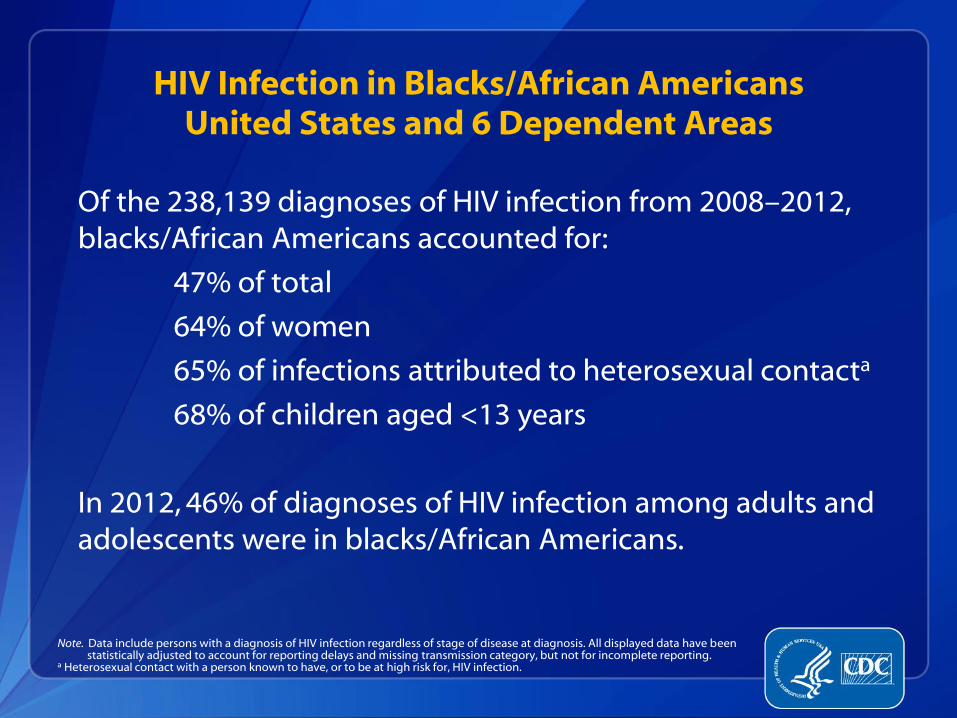
HIV Infection in Blacks/African Americans United States and 6 Dependent Areas
Of the 238,139 diagnoses of HIV infection from 2008–2012, blacks/African Americans accounted for:
47% of total
64% of women
65% of infections attributed to heterosexual contacta
68% of children aged <13 years
In 2012, 46% of diagnoses of HIV infection among adults and adolescents were in blacks/African Americans.
Note. Data include persons with a diagnosis of HIV infection regardless of stage of disease at diagnosis. All displayed data have been statistically adjusted to account for reporting delays and missing transmission category, but not for incomplete reporting.
a Heterosexual contact with a person known to have, or to be at high risk for, HIV infection.
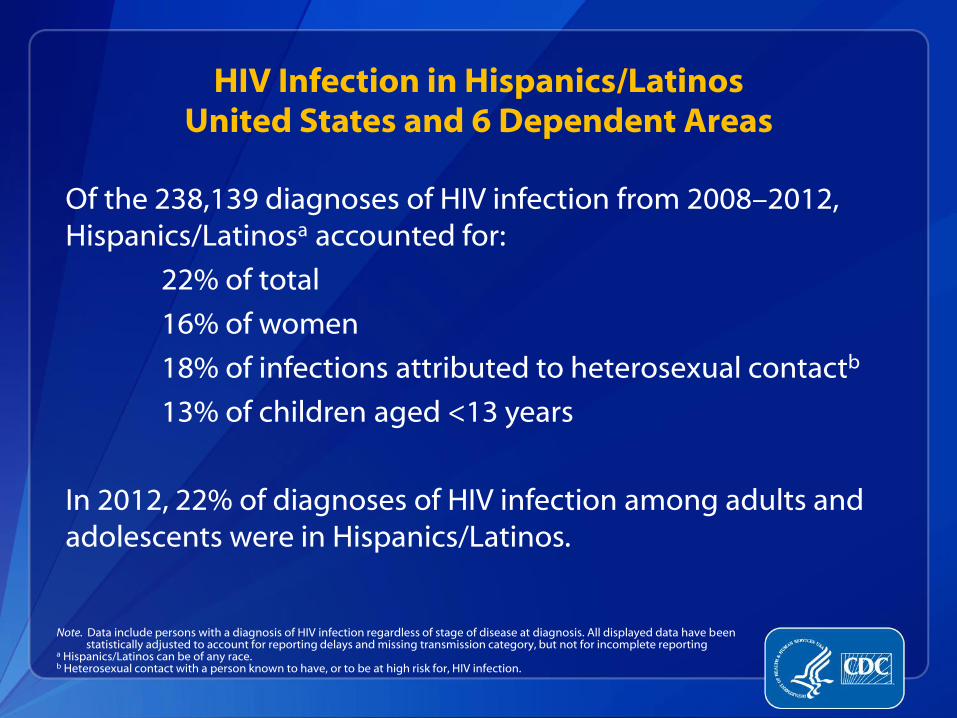
HIV Infection in Hispanics/Latinos United States and 6 Dependent Areas
Of the 238,139 diagnoses of HIV infection from 2008–2012, Hispanics/Latinosa accounted for:
22% of total
16% of women
18% of infections attributed to heterosexual contactb
13% of children aged <13 years
In 2012, 22% of diagnoses of HIV infection among adults and adolescents were in Hispanics/Latinos.
Note. Data include persons with a diagnosis of HIV infection regardless of stage of disease at diagnosis. All displayed data have been statistically adjusted to account for reporting delays and missing transmission category, but not for incomplete reporting
a Hispanics/Latinos can be of any race. b Heterosexual contact with a person known to have, or to be at high risk for, HIV infection.
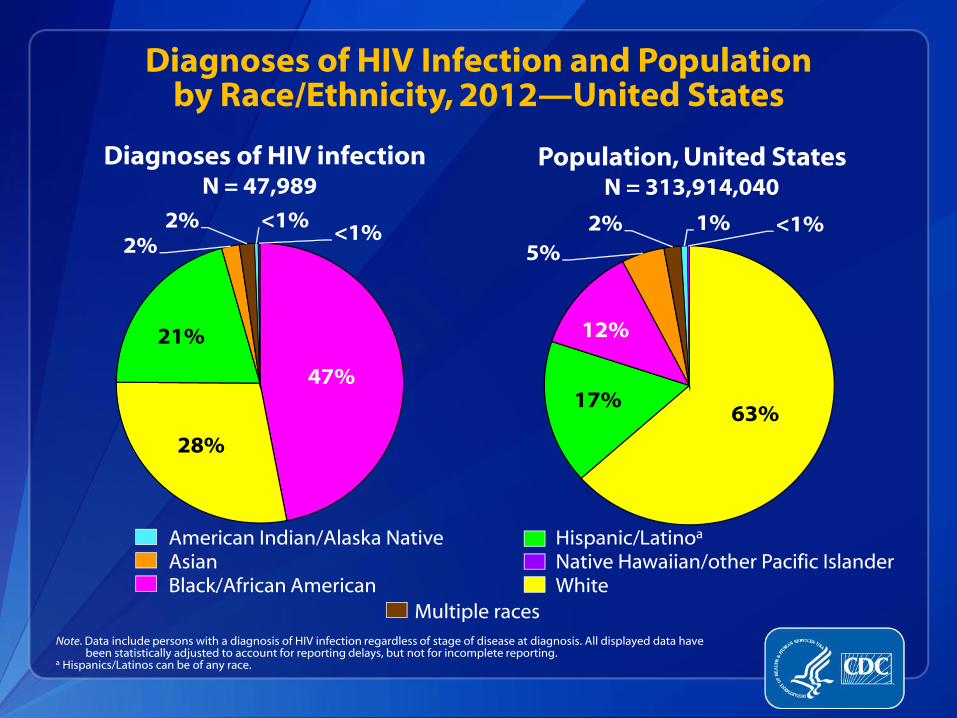
Diagnoses of HIV Infection and Population by Race/Ethnicity, 2012—United States
Note. Data include persons with a diagnosis of HIV infection regardless of stage of disease at diagnosis. All displayed data have been statistically adjusted to account for reporting delays, but not for incomplete reporting.
a Hispanics/Latinos can be of any race.
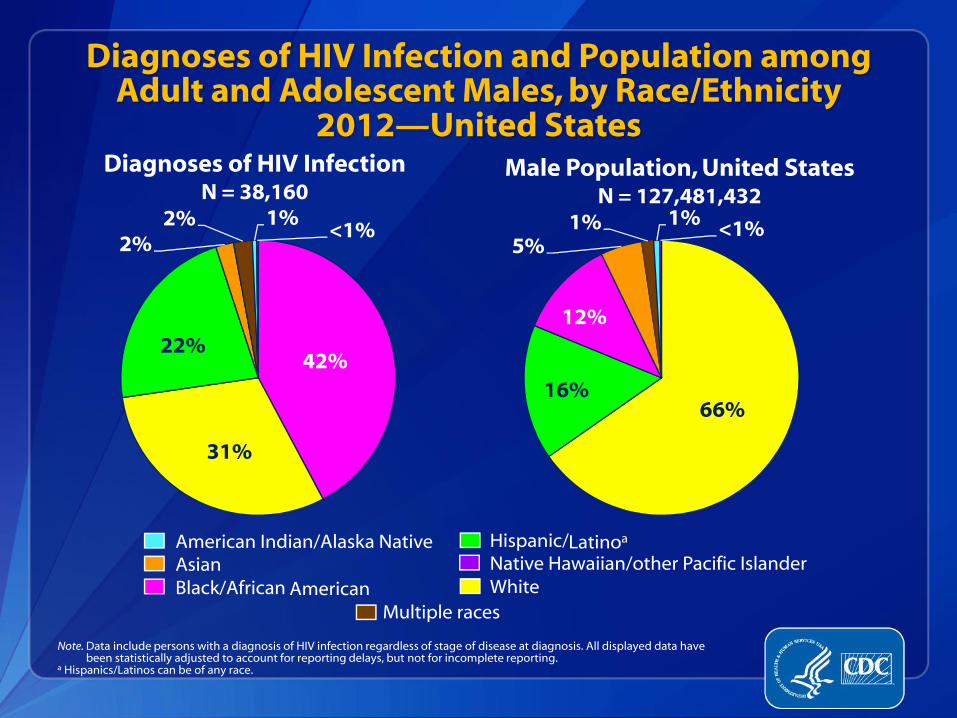
Diagnoses of HIV Infection and Population among Adult and Adolescent Males, by Race/Ethnicity
2012—United States
Note. Data include persons with a diagnosis of HIV infection regardless of stage of disease at diagnosis. All displayed data have been statistically adjusted to account for reporting delays, but not for incomplete reporting.
a Hispanics/Latinos can be of any race.

Diagnoses of HIV Infection and Population among Adult and Adolescent Females, by Race/Ethnicity
2012—United States
Note. Data include persons with a diagnosis of HIV infection regardless of stage of disease at diagnosis. All displayed data have been statistically adjusted to account for reporting delays, but not for incomplete reporting.
a Hispanics/Latinos can be of any race.

Diagnoses of HIV Infection among Adult and Adolescent Blacks/African Americans, by Sex and Transmission Category
2012—United States and 6 Dependent Areas
Note. Data include persons with a diagnosis of HIV infection regardless of stage of disease at diagnosis. All displayed data have been statistically adjusted to account for reporting delays and missing transmission category, but not for incomplete reporting.
a Heterosexual contact with a person known to have, or to be at high risk for, HIV infection. b Includes hemophilia, blood transfusion, perinatal exposure, and risk factor not reported or not identified.
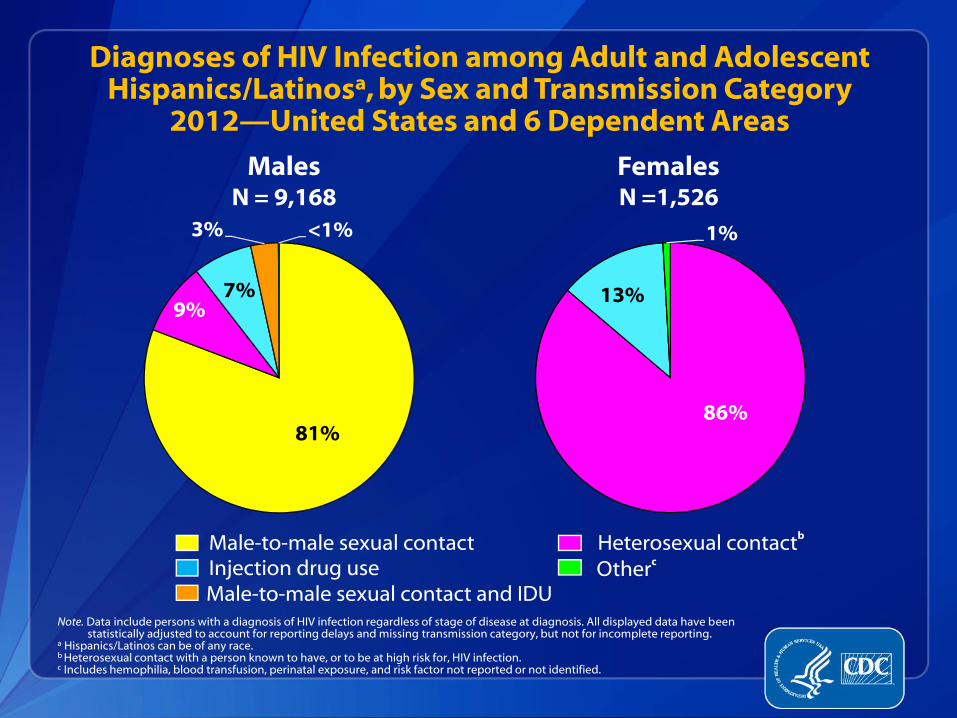
Diagnoses of HIV Infection among Adult and Adolescent Hispanics/Latinosa, by Sex and Transmission Category
2012—United States and 6 Dependent Areas
Note. Data include persons with a diagnosis of HIV infection regardless of stage of disease at diagnosis. All displayed data have been statistically adjusted to account for reporting delays and missing transmission category, but not for incomplete reporting.
a Hispanics/Latinos can be of any race. b Heterosexual contact with a person known to have, or to be at high risk for, HIV infection. c Includes hemophilia, blood transfusion, perinatal exposure, and risk factor not reported or not identified.

Diagnoses of HIV Infection among Adult and Adolescent Whites, by Sex and Transmission Category
2012—United States and 6 Dependent Areas
Note. Data include persons with a diagnosis of HIV infection regardless of stage of disease at diagnosis. All displayed data have been statistically adjusted to account for reporting delays and missing transmission category, but not for incomplete reporting.
a Heterosexual contact with a person known to have, or to be at high risk for, HIV infection. b Includes hemophilia, blood transfusion, perinatal exposure, and risk factor not reported or not identified.

Diagnoses of HIV Infection among Adult and Adolescent Hispanics/Latinosa, by Sex and Place of Birth 2012—United States and 6 Dependent Areas
Note. Data include persons with a diagnosis of HIV infection regardless of stage of disease at diagnosis. All displayed data have been statistically adjusted to account for reporting delays, but not for incomplete reporting.
a Hispanics/Latinos can be of any race.
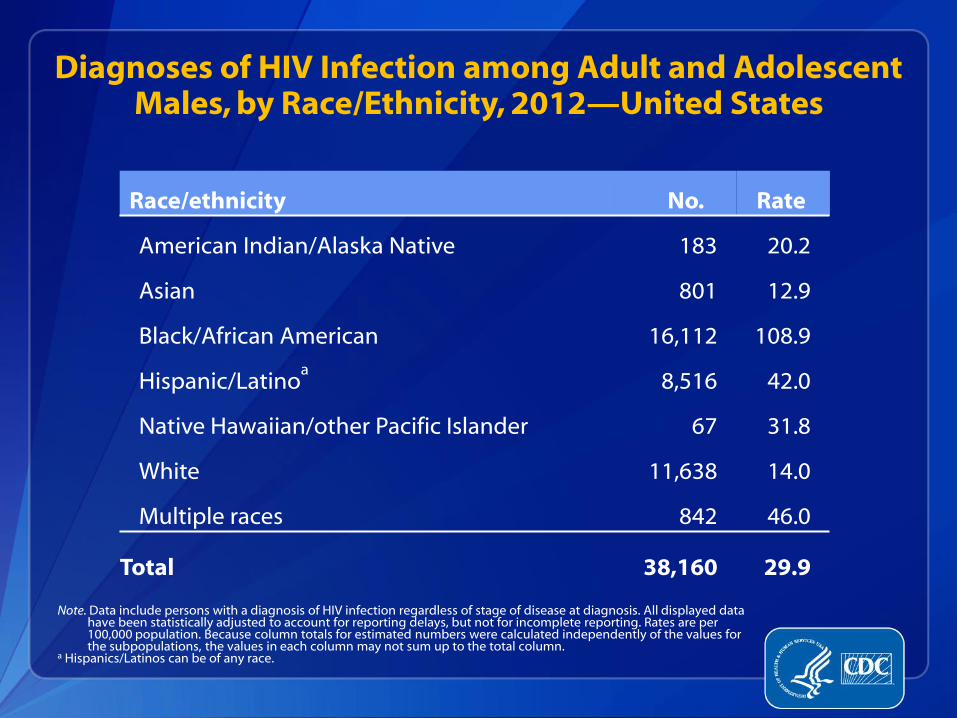
Diagnoses of HIV Infection among Adult and Adolescent Males, by Race/Ethnicity, 2012—United States
Race/ethnicity No. Rate
American Indian/Alaska Native 183 20.2
Asian 801 12.9
Black/African American 16,112 108.9
Hispanic/Latinoa 8,516 42.0
Native Hawaiian/other Pacific Islander 67 31.8
White 11,638 14.0
Multiple races 842 46.0
Total 38,160 29.9
Note. Data include persons with a diagnosis of HIV infection regardless of stage of disease at diagnosis. All displayed data have been statistically adjusted to account for reporting delays, but not for incomplete reporting. Rates are per 100,000 population. Because column totals for estimated numbers were calculated independently of the values for the subpopulations, the values in each column may not sum up to the total column.
a Hispanics/Latinos can be of any race.
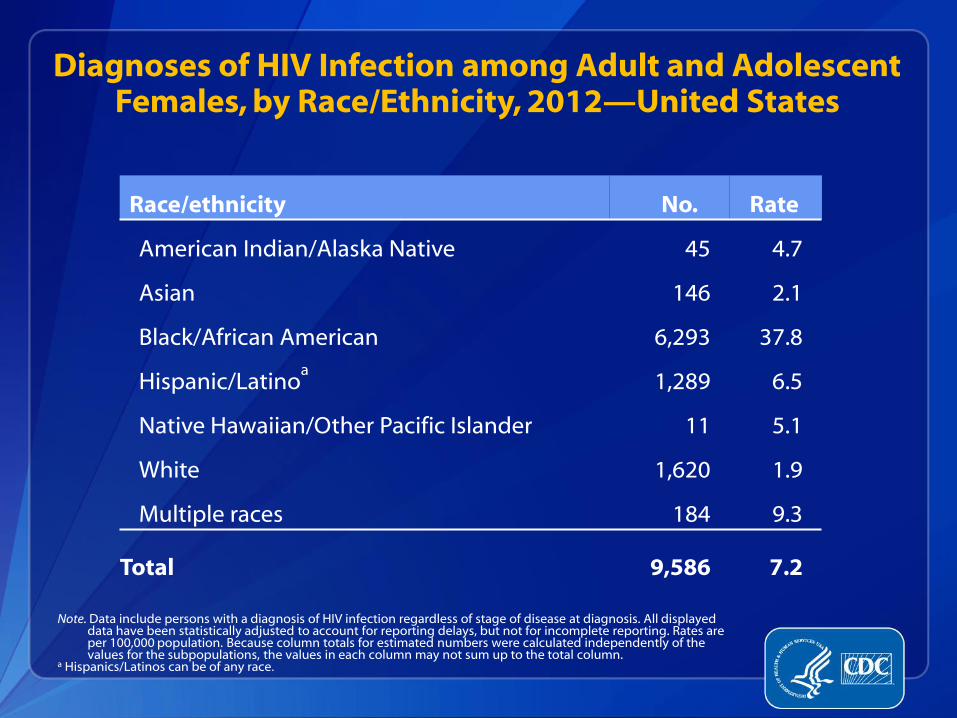
Diagnoses of HIV Infection among Adult and Adolescent Females, by Race/Ethnicity, 2012—United States
Race/ethnicity No. Rate
American Indian/Alaska Native 45 4.7
Asian 146 2.1
Black/African American 6,293 37.8
Hispanic/Latinoa 1,289 6.5
Native Hawaiian/Other Pacific Islander 11 5.1
White 1,620 1.9
Multiple races 184 9.3
Total 9,586 7.2
Note. Data include persons with a diagnosis of HIV infection regardless of stage of disease at diagnosis. All displayed data have been statistically adjusted to account for reporting delays, but not for incomplete reporting. Rates are per 100,000 population. Because column totals for estimated numbers were calculated independently of the values for the subpopulations, the values in each column may not sum up to the total column.
a Hispanics/Latinos can be of any race.

Diagnoses of HIV Infection among Adults and Adolescents, by Region and Race/Ethnicity
2012—United States
Note. All displayed data have been statistically adjusted to account for reporting delays, but not for incomplete reporting. Rates are per 100,000 population.
a Hispanics/Latinos can be of any race.

Rates of Diagnoses of HIV Infection among Adult and Adolescent Blacks/African Americans, 2012—United States
N = 22,405 Total Rate = 71.2
Note. Data include persons with a diagnosis of HIV infection regardless of stage of disease at diagnosis. All displayed data have been statistically adjusted to account for reporting delays, but not for incomplete reporting.

Rates of Diagnoses of HIV Infection among Adult and Adolescent Hispanics/Latinosa, 2012—United States
N = 9,805 Total Rate = 24.5
Note. Data include persons with a diagnosis of HIV infection regardless of stage of disease at diagnosis. All displayed data have been statistically adjusted to account for reporting delays, but not for incomplete reporting.
a Hispanics/Latinos can be of any race.

Rates of Diagnoses of HIV Infection among Adult and Adolescent Whites, 2012—United States
N = 13,258 Total Rate = 7.8
Note. Data include persons with a diagnosis of HIV infection regardless of stage of disease at diagnosis. All displayed data have been statistically adjusted to account for reporting delays, but not for incomplete reporting.
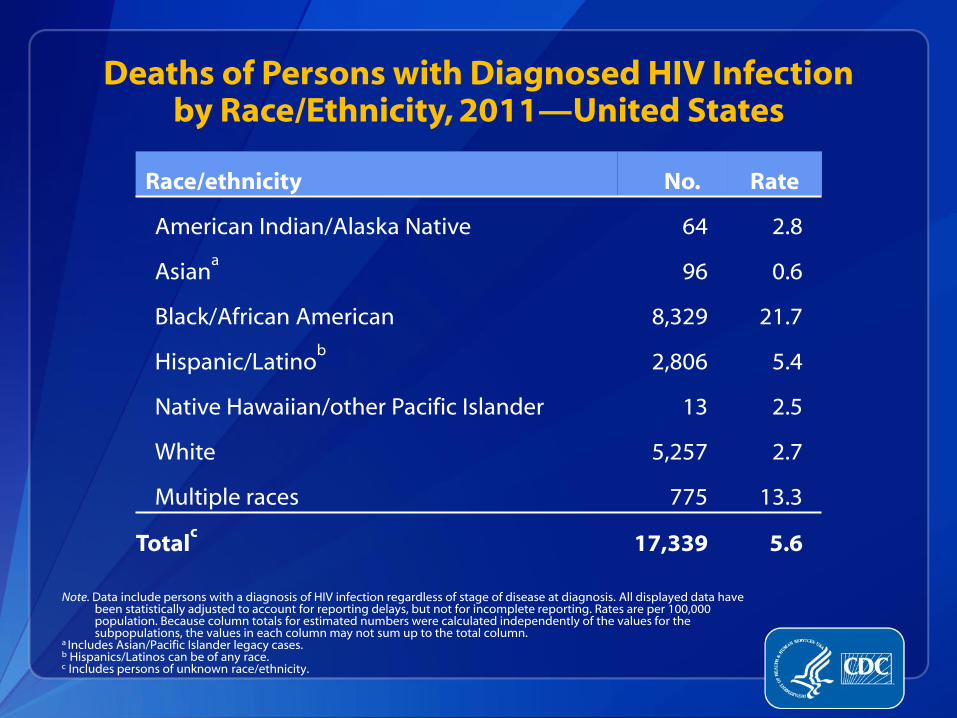
Deaths of Persons with Diagnosed HIV Infection by Race/Ethnicity, 2011—United States
Race/ethnicity No. Rate
American Indian/Alaska Native 64 2.8
Asiana
96 0.6
Black/African American 8,329 21.7
Hispanic/Latinob 2,806 5.4
Native Hawaiian/other Pacific Islander 13 2.5
White 5,257 2.7
Multiple races 775 13.3
Totalc
17,339 5.6
Note. Data include persons with a diagnosis of HIV infection regardless of stage of disease at diagnosis. All displayed data have been statistically adjusted to account for reporting delays, but not for incomplete reporting. Rates are per 100,000 population. Because column totals for estimated numbers were calculated independently of the values for the subpopulations, the values in each column may not sum up to the total column.
a Includes Asian/Pacific Islander legacy cases. b Hispanics/Latinos can be of any race. c Includes persons of unknown race/ethnicity.
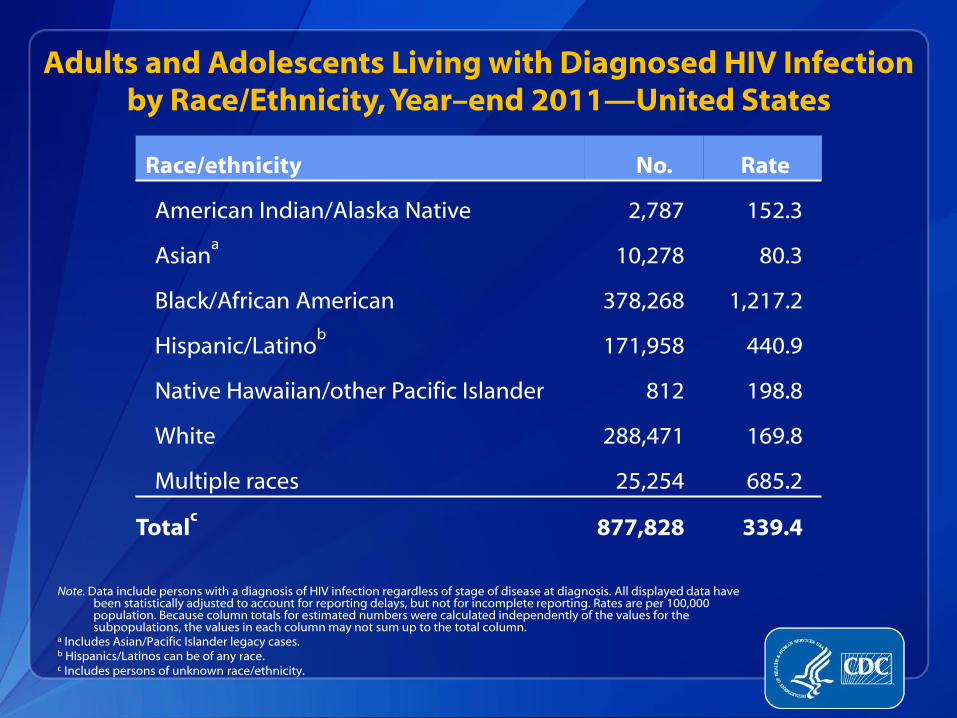
Adults and Adolescents Living with Diagnosed HIV Infection by Race/Ethnicity, Year–end 2011—United States
Race/ethnicity No. Rate
American Indian/Alaska Native 2,787 152.3
Asiana
10,278 80.3
Black/African American 378,268 1,217.2
Hispanic/Latinob 171,958 440.9
Native Hawaiian/other Pacific Islander 812 198.8
White 288,471 169.8
Multiple races 25,254 685.2
Totalc
877,828 339.4
Note. Data include persons with a diagnosis of HIV infection regardless of stage of disease at diagnosis. All displayed data have been statistically adjusted to account for reporting delays, but not for incomplete reporting. Rates are per 100,000 population. Because column totals for estimated numbers were calculated independently of the values for the subpopulations, the values in each column may not sum up to the total column.
a Includes Asian/Pacific Islander legacy cases. b Hispanics/Latinos can be of any race. c Includes persons of unknown race/ethnicity.
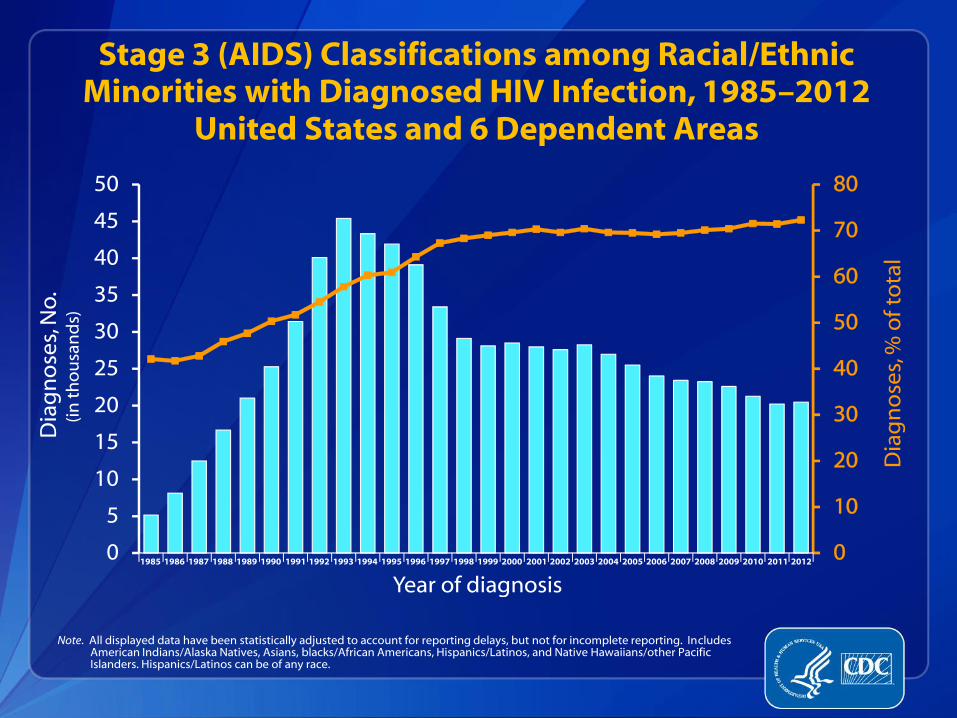
Stage 3 (AIDS) Classifications among Racial/Ethnic Minorities with Diagnosed HIV Infection, 1985–2012
United States and 6 Dependent Areas
Note. All displayed data have been statistically adjusted to account for reporting delays, but not for incomplete reporting. Includes American Indians/Alaska Natives, Asians, blacks/African Americans, Hispanics/Latinos, and Native Hawaiians/other Pacific Islanders. Hispanics/Latinos can be of any race.

Stage 3 (AIDS) Classifications among Adults and Adolescents with Diagnosed HIV Infection, by Race/Ethnicity, 1985–2012
United States and 6 Dependent Areas
Note. All displayed data have been statistically adjusted to account for reporting delays, but not for incomplete reporting. a Hispanics/Latinos can be of any race. b Includes Asian/Pacific Islander legacy cases.
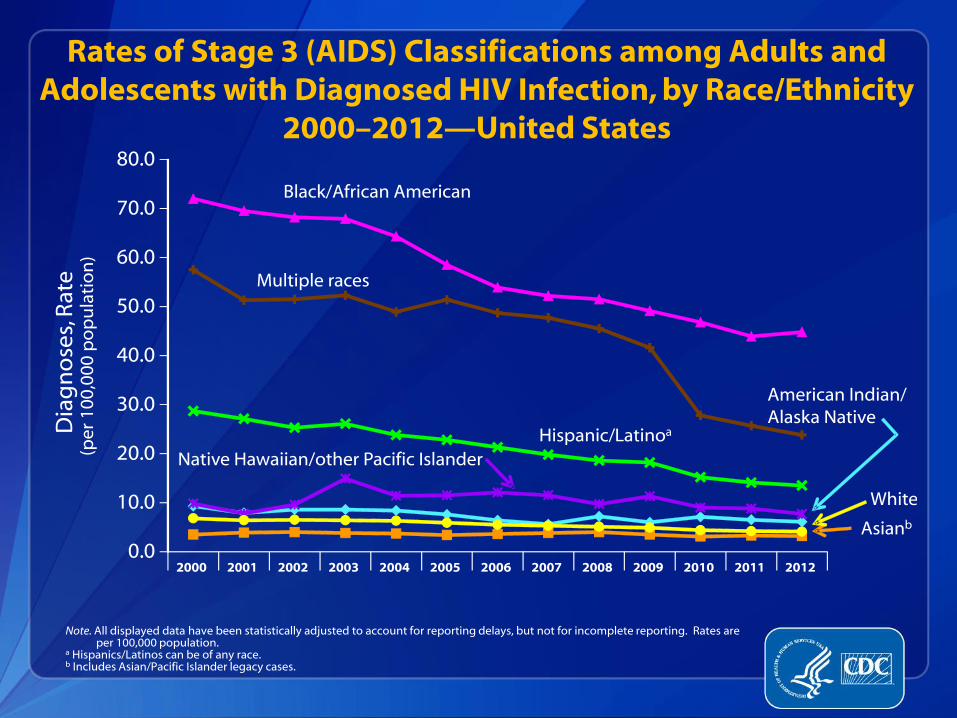
Rates of Stage 3 (AIDS) Classifications among Adults and Adolescents with Diagnosed HIV Infection, by Race/Ethnicity
2000–2012—United States
Note. All displayed data have been statistically adjusted to account for reporting delays, but not for incomplete reporting. Rates are per 100,000 population.
a Hispanics/Latinos can be of any race. b Includes Asian/Pacific Islander legacy cases.
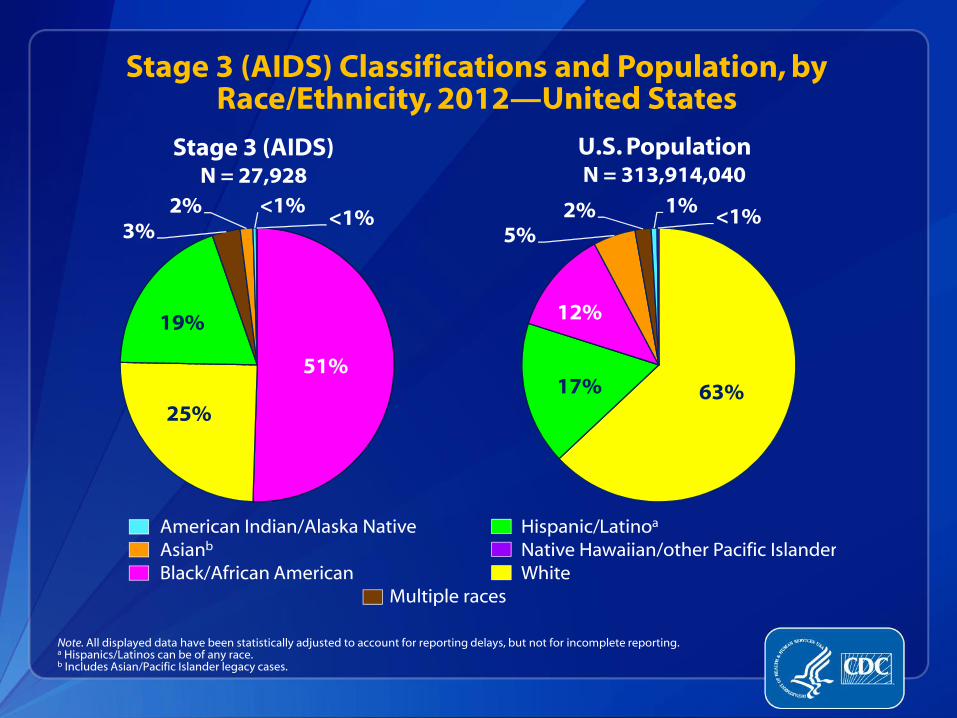
Stage 3 (AIDS) Classifications and Population, by Race/Ethnicity, 2012—United States
Note. All displayed data have been statistically adjusted to account for reporting delays, but not for incomplete reporting. a Hispanics/Latinos can be of any race. b Includes Asian/Pacific Islander legacy cases.
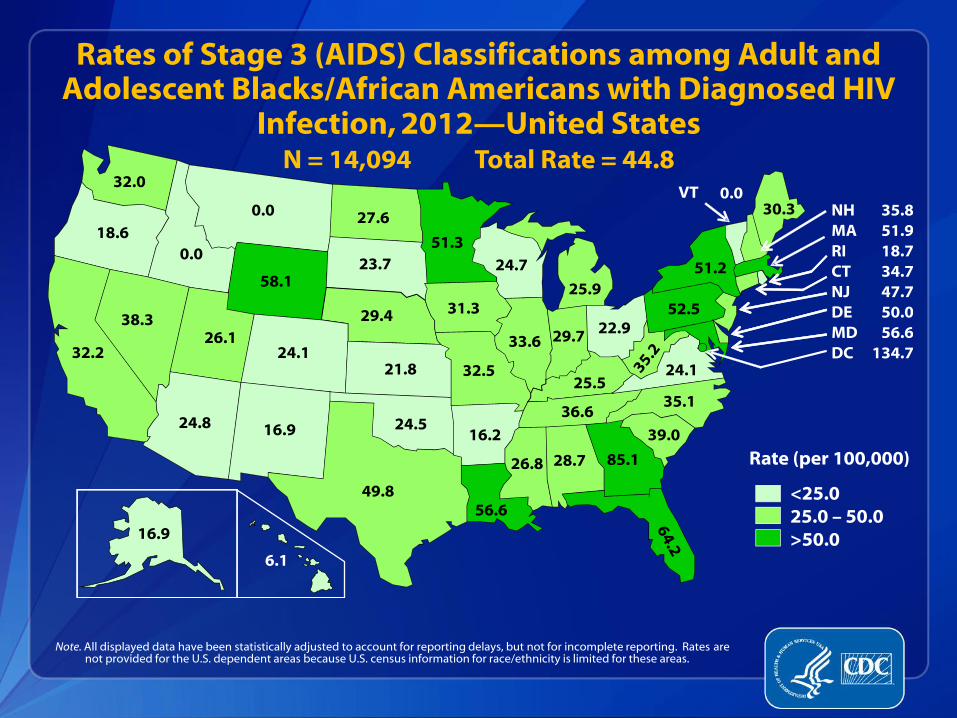
Rates of Stage 3 (AIDS) Classifications among Adult and Adolescent Blacks/African Americans with Diagnosed HIV
Infection, 2012—United States N = 14,094 Total Rate = 44.8
Note. All displayed data have been statistically adjusted to account for reporting delays, but not for incomplete reporting. Rates are not provided for the U.S. dependent areas because U.S. census information for race/ethnicity is limited for these areas.
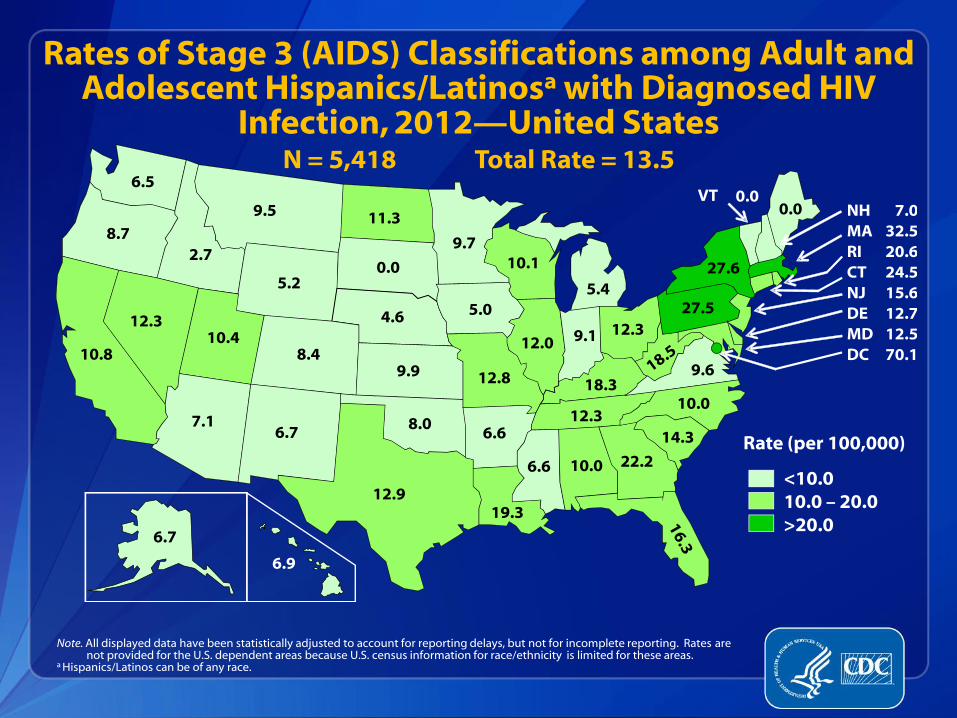
Rates of Stage 3 (AIDS) Classifications among Adult and Adolescent Hispanics/Latinosa with Diagnosed HIV
Infection, 2012—United States N = 5,418 Total Rate = 13.5
Note. All displayed data have been statistically adjusted to account for reporting delays, but not for incomplete reporting. Rates are not provided for the U.S. dependent areas because U.S. census information for race/ethnicity is limited for these areas.
a Hispanics/Latinos can be of any race.
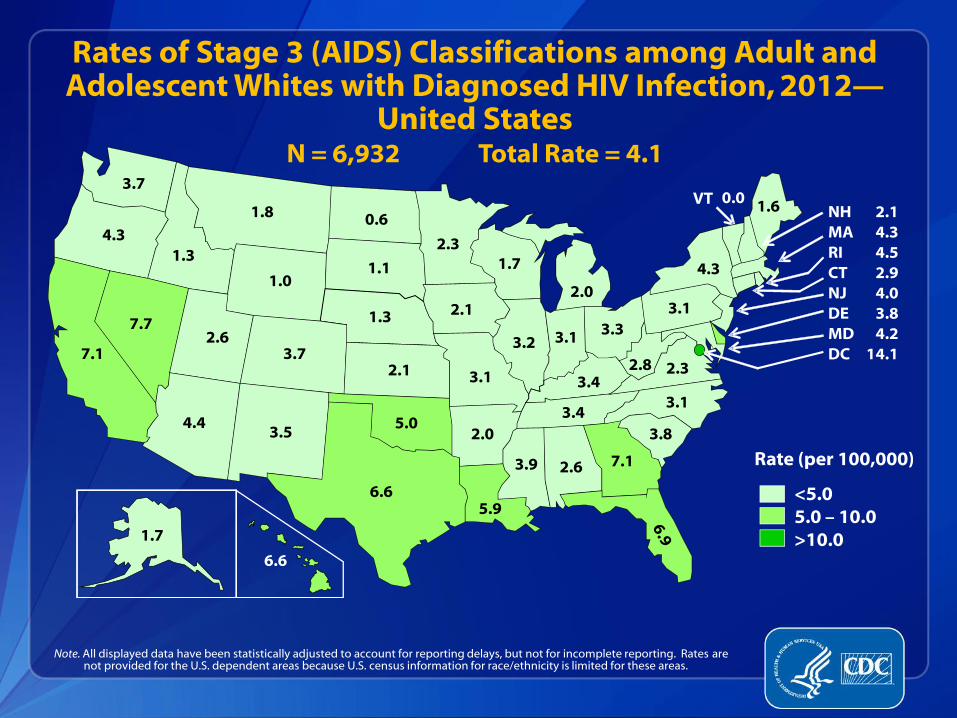
Rates of Stage 3 (AIDS) Classifications among Adult and Adolescent Whites with Diagnosed HIV Infection, 2012—
United States N = 6,932 Total Rate = 4.1
Note. All displayed data have been statistically adjusted to account for reporting delays, but not for incomplete reporting. Rates are not provided for the U.S. dependent areas because U.S. census information for race/ethnicity is limited for these areas.
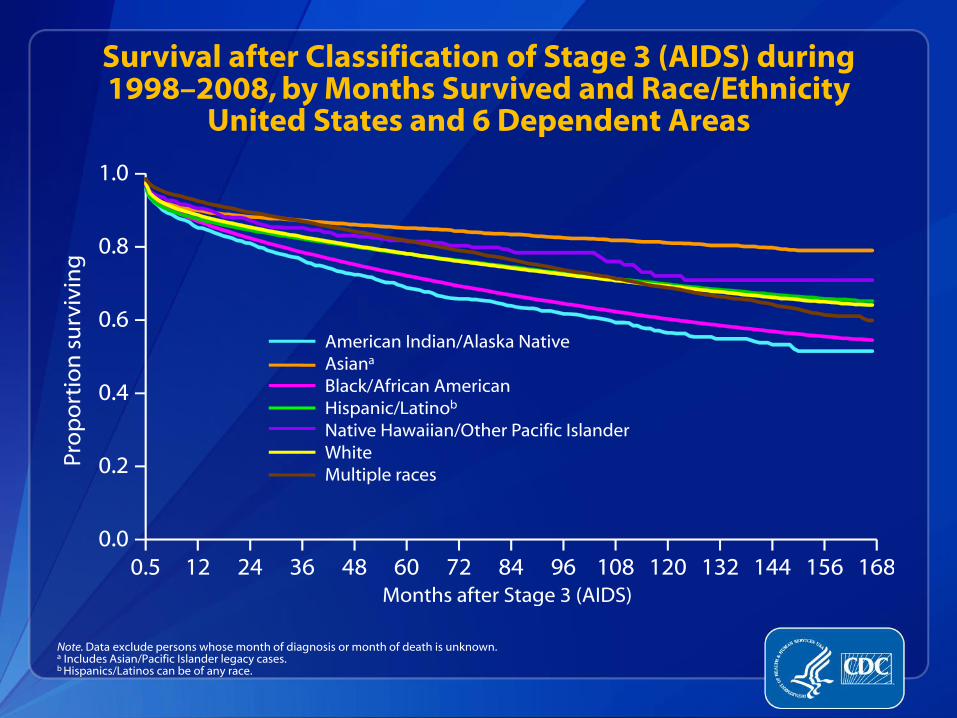
Survival after Classification of Stage 3 (AIDS) during 1998–2008, by Months Survived and Race/Ethnicity
United States and 6 Dependent Areas
Note. Data exclude persons whose month of diagnosis or month of death is unknown. a Includes Asian/Pacific Islander legacy cases. b Hispanics/Latinos can be of any race.
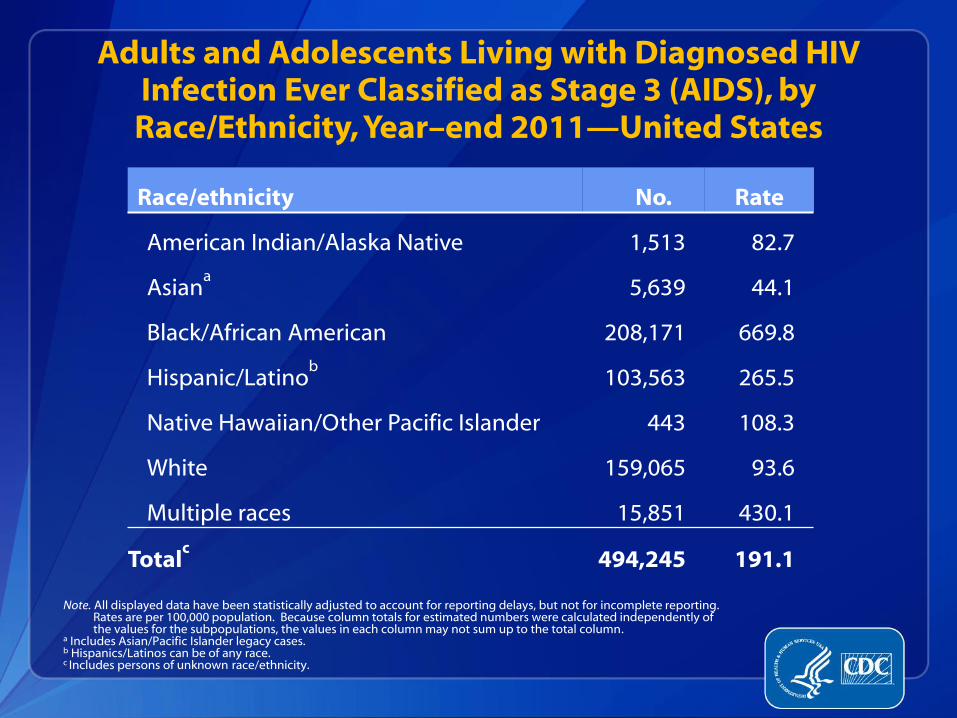
Adults and Adolescents Living with Diagnosed HIV Infection Ever Classified as Stage 3 (AIDS), by Race/Ethnicity, Year–end 2011—United States
Race/ethnicity No. Rate
American Indian/Alaska Native 1,513 82.7
Asiana
5,639 44.1
Black/African American 208,171 669.8
Hispanic/Latinob 103,563 265.5
Native Hawaiian/Other Pacific Islander 443 108.3
White 159,065 93.6
Multiple races 15,851 430.1
Totalc
494,245 191.1
Note. All displayed data have been statistically adjusted to account for reporting delays, but not for incomplete reporting. Rates are per 100,000 population. Because column totals for estimated numbers were calculated independently of the values for the subpopulations, the values in each column may not sum up to the total column.
a Includes Asian/Pacific Islander legacy cases. b Hispanics/Latinos can be of any race. c Includes persons of unknown race/ethnicity.