Embed Size (px)
Citation preview

Hitachi Command Suite
Tuning ManagerApplication Reports Reference
MK-95HC113-18
Document Organization
Product Version
Getting Help
Contents
© 2014, 2015, Hitachi, Ltd. All rights reserved.
No part of this publication may be reproduced or transmitted in any form or by any means,electronic or mechanical, including photocopying and recording, or stored in a database or retrievalsystem for any purpose without the express written permission of Hitachi, Ltd.
Hitachi, Ltd., reserves the right to make changes to this document at any time without notice andassumes no responsibility for its use. This document contains the most current information availableat the time of publication. When new or revised information becomes available, this entiredocument will be updated and distributed to all registered users.
Some of the features described in this document might not be currently available. Refer to the mostrecent product announcement for information about feature and product availability, or contactHitachi Data Systems Corporation at https://portal.hds.com.
Notice: Hitachi, Ltd., products and services can be ordered only under the terms and conditions ofthe applicable Hitachi Data Systems Corporation agreements. The use of Hitachi, Ltd., products isgoverned by the terms of your agreements with Hitachi Data Systems Corporation.
Hitachi is a registered trademark of Hitachi, Ltd., in the United States and other countries. HitachiData Systems is a registered trademark and service mark of Hitachi, Ltd., in the United States andother countries.
Archivas, Essential NAS Platform, HiCommand, Hi-Track, ShadowImage, Tagmaserve, Tagmasoft,Tagmasolve, Tagmastore, TrueCopy, Universal Star Network, and Universal Storage Platform areregistered trademarks of Hitachi Data Systems.
AIX, AS/400, DB2, Domino, DS6000, DS8000, Enterprise Storage Server, ESCON, FICON,FlashCopy, IBM, Lotus, MVS, OS/390, RS/6000, S/390, System z9, System z10, Tivoli, VM/ESA,z/OS, z9, z10, zSeries, z/VM, and z/VSE are registered trademarks or trademarks of InternationalBusiness Machines Corporation.
All other trademarks, service marks, and company names in this document or web site areproperties of their respective owners.
Microsoft product screen shots are reprinted with permission from Microsoft Corporation.
Notice on Export Controls. The technical data and technology inherent in this Document may besubject to U.S. export control laws, including the U.S. Export Administration Act and its associatedregulations, and may be subject to export or import regulations in other countries. Reader agrees tocomply strictly with all such regulations and acknowledges that Reader has the responsibility toobtain licenses to export, re-export, or import the Document and any Compliant Products.
iiHitachi Tuning Manager Application Reports Reference
Contents
Preface.................................................................................................xiiiIntended audience...................................................................................................xivProduct version....................................................................................................... xivRelease notes..........................................................................................................xivDocument organization............................................................................................ xivRelated documents.................................................................................................. xivDocument conventions............................................................................................. xvConventions for storage capacity values.................................................................... xviAccessing product documentation............................................................................ xviiGetting help........................................................................................................... xviiComments..............................................................................................................xvii
1 Working with the Solution Set................................................................1-1Overview of the Solution Set....................................................................................1-2Format of Alarm Explanations.................................................................................. 1-2Agent for Oracle Alarms.......................................................................................... 1-3
Buffer Cache Usage.......................................................................................... 1-3Buffer Cache Waits........................................................................................... 1-4Dict. Cache Usage............................................................................................ 1-5Disk Sorts........................................................................................................ 1-6Free List Waits................................................................................................. 1-6Full Table Scans............................................................................................... 1-7Library Cache Usage......................................................................................... 1-8Redo Log Contention........................................................................................ 1-9Server Status................................................................................................... 1-9Tablespace Usage...........................................................................................1-10
Agent for Microsoft SQL Server Alarms................................................................... 1-11Blocked Sessions............................................................................................ 1-12Cache Usage.................................................................................................. 1-13CPU Usage..................................................................................................... 1-13Database Space..............................................................................................1-14Log Space Usage............................................................................................ 1-15Network Error.................................................................................................1-16Server Status..................................................................................................1-16
Agent for Microsoft Exchange Server Alarm.............................................................1-17Log Threads Waiting....................................................................................... 1-17
iiiHitachi Tuning Manager Application Reports Reference

Agent for DB2 Alarms............................................................................................1-18Cat Cache Hit Rate..........................................................................................1-19DB2 Status.....................................................................................................1-19Pkg Cache Hit Rate......................................................................................... 1-20Sort Memory Usage........................................................................................ 1-21Sort Overflow Rate..........................................................................................1-22Workspace Hit Rate........................................................................................ 1-22
Agent for Enterprise Applications Alarms.................................................................1-23Buffer - CUA...................................................................................................1-25Buffer - FieldDescri......................................................................................... 1-25Buffer - GenericKey.........................................................................................1-26Buffer - InitialReco..........................................................................................1-27Buffer - Program.............................................................................................1-28Buffer - Screen............................................................................................... 1-28Buffer - ShortNameTA.....................................................................................1-29Buffer - SingleRecor........................................................................................1-30Buffer - TableDefini.........................................................................................1-31Dialog ResponseTime......................................................................................1-31Extended Memory...........................................................................................1-32Heap Memory.................................................................................................1-33Paging Area....................................................................................................1-34Roll Area........................................................................................................ 1-34SystemWideQueue..........................................................................................1-35ServerSpecificQueue....................................................................................... 1-36Utilization % (alarm for monitoring the average usage of background workprocesses)......................................................................................................1-37QueueLength %............................................................................................. 1-37Utilization % (alarm for monitoring the average usage of dialog processes)........ 1-38
Format of Report Explanations............................................................................... 1-39Organization of Report Folders...............................................................................1-40
Agent for Oracle............................................................................................. 1-41Agent for Microsoft SQL Server........................................................................ 1-42Agent for Microsoft Exchange Server................................................................1-43Agent for DB2.................................................................................................1-43Agent for Enterprise Applications..................................................................... 1-44
Agent for Oracle Reports....................................................................................... 1-44Blocking Locks(8.0).........................................................................................1-48Cache Usage(8.0)........................................................................................... 1-49Cache Usage Status(Multi-Agent)(8.0)..............................................................1-50Cache Usage Trend(Multi-Agent)(8.0).............................................................. 1-50Database Activity Status (8.0)..........................................................................1-51Database Activity Status Detail (8.0)................................................................ 1-51Database Activity Status(Multi-Agent)(8.0)....................................................... 1-52Database Activity Trend(Multi-Agent)(8.0)........................................................ 1-53Database Space Overview (8.0)....................................................................... 1-53Database Space Summary(Multi-Agent)(8.0).....................................................1-54Database Space Trend(Multi-Agent)(8.0)..........................................................1-55Datafile I/O Activity Detail (8.0)....................................................................... 1-55Datafile I/O Status Detail (Reads) (8.0)............................................................ 1-56Datafile I/O Status Detail (Writes) (8.0)............................................................1-57Datafile I/O Status Summary (8.0)................................................................... 1-57Datafile I/O Trend Detail (Reads) (8.0).............................................................1-58
ivHitachi Tuning Manager Application Reports Reference
Datafile I/O Trend Detail (Writes) (8.0)............................................................ 1-59Datafile I/O Trend Summary (8.0)....................................................................1-60Disk Sorts - Top 10 Sessions (8.0)....................................................................1-60Error Log(8.0)................................................................................................ 1-61Full Table Scans(8.0)...................................................................................... 1-62I/O Activity - Top 10 Datafiles (8.0)................................................................. 1-62Lock Usage - Top 10 Sessions (8.0)................................................................. 1-63Locked Objects (8.0).......................................................................................1-64Longest Transactions - Top 10 Sessions (8.0)................................................... 1-65Memory Usage - Top 10 Sessions (8.0)............................................................ 1-66Open Cursors (4.0)......................................................................................... 1-67Physical I/O - Top 10 Sessions (8.0).................................................................1-67Redo Log Buffer Contention(8.0)......................................................................1-68Server Configuration Status (4.0).....................................................................1-69Session Detail (8.0).........................................................................................1-69Session Statistics Detail (4.0)...........................................................................1-70SGA Status(8.0)..............................................................................................1-71SGA Status Summary(8.0)...............................................................................1-72SQL Text (4.0)................................................................................................1-72System Overview (8.0) (Real-Time Rpt on the Overall Status of Instance).......... 1-73System Overview (8.0) (Real-Time Rpt on the General Status of Instance)......... 1-75Tablespace Status (4.0)...................................................................................1-77Tablespace Status Detail (4.0)......................................................................... 1-77
Agent for Microsoft SQL Server Reports.................................................................. 1-78Blocked Sessions............................................................................................ 1-81Blocking Locks................................................................................................1-82Cache Usage.................................................................................................. 1-83Cache Usage Trend (Multi-Agent).................................................................... 1-84Cache Usage Trend (Multi-Agent).................................................................... 1-84CPU Usage - Top 10 Sessions.......................................................................... 1-85Database Detail.............................................................................................. 1-86Database Space Usage....................................................................................1-87Database Space Usage Detail.......................................................................... 1-88Database Summary.........................................................................................1-89Errorlog Detail................................................................................................ 1-90Errorlog Overview...........................................................................................1-91Lock Detail..................................................................................................... 1-91Lock Overview................................................................................................1-93Lock Overview by Lock Type............................................................................1-94Lock Usage - Top 10 Sessions..........................................................................1-94Log I/O Activity.............................................................................................. 1-95Log I/O Activity 2............................................................................................1-96Log Space Usage - Top 10 Databases...............................................................1-96Memory Usage - Top 10 Sessions.....................................................................1-97Network Activity............................................................................................. 1-97Network Activity Trend....................................................................................1-98Network Activity Trend....................................................................................1-98Pending I/O....................................................................................................1-99Physical I/O - Top 10 Sessions.........................................................................1-99Physical Write Activity................................................................................... 1-100Physical Write Activity 2.................................................................................1-100Server Configuration Status........................................................................... 1-101
vHitachi Tuning Manager Application Reports Reference
Server CPU Trend......................................................................................... 1-101Server CPU Trend......................................................................................... 1-102Server Space Trend (Multi-Agent).................................................................. 1-102Server Space Trend (Multi-Agent).................................................................. 1-103Server Space Usage...................................................................................... 1-103Session Detail............................................................................................... 1-104Sessions.......................................................................................................1-105System Overview.......................................................................................... 1-106
Agent for Microsoft Exchange Server Reports........................................................ 1-108Database Cache Trend.................................................................................. 1-110Database Log Trend......................................................................................1-111Epoxy Trend.................................................................................................1-112Information Store Trend................................................................................1-113Information Store Trend - 2013..................................................................... 1-113Mailbox Messages Trend (Hourly Historical Report)..........................................1-114Mailbox Messages Trend - 2013 (Hourly Historical Report)............................... 1-115Mailbox Messages Trend (Daily Historical Report)............................................1-115Mailbox Messages Trend - 2013 (Daily Historical Report)................................. 1-116Mailbox Message Queue Trend.......................................................................1-116Process Detail...............................................................................................1-117Users Trend..................................................................................................1-118Users Trend - 2013....................................................................................... 1-119
Agent for DB2 Reports.........................................................................................1-119Basic Information on Database...................................................................... 1-120Basic Information on Database Manager.........................................................1-121Bufferpool I/O Status.................................................................................... 1-123Bufferpool I/O Trend.....................................................................................1-124Bufferpool Stat on Database.......................................................................... 1-125Cache Hit Rate..............................................................................................1-127Cache Hit Rate Status....................................................................................1-127Cache Hit Rate Trend.................................................................................... 1-128Cache on Database....................................................................................... 1-128Sort Status on Database................................................................................1-129SQL Statement on Database.......................................................................... 1-130
Agent for Enterprise Applications Reports..............................................................1-131Dialog ResponseTime.................................................................................... 1-136Dialog ResponseTime Status..........................................................................1-137Dialog ResponseTime Trend (hourly historical report)...................................... 1-138Dialog ResponseTime Trend (daily historical report)........................................ 1-139Dialog ResponseTime Trend (Multi-Agent)...................................................... 1-140Dialog Utilization %.......................................................................................1-141Process Detail...............................................................................................1-142Process Overview Status................................................................................1-143SAP Buffer Detail (CUA).................................................................................1-144SAP Buffer Detail (FieldDescription)................................................................1-145SAP Buffer Detail (GenericKey).......................................................................1-145SAP Buffer Detail (InitialRecords)................................................................... 1-146SAP Buffer Detail (Program)...........................................................................1-147SAP Buffer Detail (Screen)............................................................................. 1-148SAP Buffer Detail (ShortNameTAB).................................................................1-148SAP Buffer Detail (SingleRecord).................................................................... 1-149SAP Buffer Detail (TableDefinition)................................................................. 1-150
viHitachi Tuning Manager Application Reports Reference
SAP Buffer Hitratio........................................................................................ 1-150SAP Buffer Hitratio Status..............................................................................1-152SAP Buffer Hitratio Trend (hourly historical report).......................................... 1-153SAP Buffer Hitratio Trend (daily historical report)............................................ 1-155SAP Memory Detail........................................................................................1-156SAP Memory Used.........................................................................................1-157SAP Memory Used Status...............................................................................1-157SAP Memory Used Trend (hourly historical report)...........................................1-158SAP Memory Used Trend (daily historical report)............................................. 1-159UsersLoggedIn Trend (hourly historical report)................................................1-160UsersLoggedIn Trend (daily historical report)..................................................1-160UsersLoggedIn Trend (Multi-Agent)................................................................1-161Background Processing SystemWideQueue..................................................... 1-162Background Service ServerSpecificQueue........................................................1-162Background Service Utilization %................................................................... 1-163
2 Working with Records........................................................................... 2-1Data Model Version.................................................................................................2-2Format of Record Explanations................................................................................ 2-2List of Common Key Fields.......................................................................................2-5Field Values............................................................................................................2-6
Summarization Rules........................................................................................ 2-6List of Data Types.............................................................................................2-9Delta..............................................................................................................2-10Restriction (in Agent for DB2).......................................................................... 2-14Data Source................................................................................................... 2-14
Agent for Oracle....................................................................................2-14Agent for Microsoft SQL Server...............................................................2-15Agent for Microsoft Exchange Server.......................................................2-15Agent for DB2....................................................................................... 2-15
Fields Added When Data Is Stored in a Store Database............................................2-16Fields Added for All Records............................................................................ 2-16Fields Output When Data in a Store Database Is Exported................................. 2-17
Notes on Collecting Records...................................................................................2-18Agent for Oracle............................................................................................. 2-18
When Oracle 10g® Is Monitored.............................................................2-18When Monitoring Databases that Have Many Data Segments....................2-18Notes on Specific Records...................................................................... 2-20Permissions Required for Collecting Performance Data............................. 2-21Record Creation Result When Data Cannot Be Obtained...........................2-23
Agent for Microsoft SQL Server........................................................................ 2-23When Records Are Not Created.............................................................. 2-23When the Correct Value Is Not Displayed in the Field...............................2-23Records that Cannot Be Created During Execution of a Failover in a MirroringConfiguration........................................................................................ 2-24Record Creation Results When the Monitored Microsoft SQL Server Is Offline............................................................................................................2-25Record Creation Results When a Session to the Monitored Microsoft SQLServer Has Been Disconnected............................................................... 2-25Notes on the Lock Detail (PD_LD) Record................................................2-25Record Creation Results When Data Cannot Be Obtained......................... 2-26
Agent for Microsoft Exchange Server................................................................2-27
viiHitachi Tuning Manager Application Reports Reference
Precaution Before Collecting Performance Information............................. 2-27Application Event Log When a Record Is Not Created Successfully............ 2-27Note on Multi-Instance Records..............................................................2-28Notes on Changes to a Mounted Microsoft Exchange Server Store............ 2-28Action to Take When Performance Data Cannot Be Collected (Restoration ofPerformance Object)..............................................................................2-29Record Creation Result When Data Cannot Be Obtained...........................2-29What to do if KAVL12007-W is output when monitoring Microsoft ExchangeServer 2013.......................................................................................... 2-29
Agent for DB2.................................................................................................2-30Record Creation Result When Data Cannot Be Obtained...........................2-30
Agent for Enterprise Applications..................................................................... 2-30Record Creation Result When Data Cannot Be Acquired........................... 2-30Notes on records of the PI record type....................................................2-31
Agent for Oracle Records.......................................................................................2-31Activity Summary (PD_PDAS).......................................................................... 2-36ASM Disk (PD_PDDK)......................................................................................2-41ASM Disk Group Interval (PI_PIDG)..................................................................2-47Backup Async IO (PD_PDBA)........................................................................... 2-51Backup Sync IO (PD_PDBS).............................................................................2-56Block Contention Interval (PI_PIBC).................................................................2-60Block Contention Statistics (PD_PDBC)............................................................. 2-62Buffer Pool (PD_PDBP)....................................................................................2-63Cache Summary (PD_PDCS)............................................................................ 2-66Cache Summary Interval (PI_PICS)..................................................................2-71Circuit (PD_PDCI)........................................................................................... 2-76Collection Instance 2 (PD_PCI)........................................................................ 2-80Collection Tablespace 2 (PD_PCTS)..................................................................2-81Control File (PD_PDCF)................................................................................... 2-84Current Sessions Stat Summary (PD_PDS3)...................................................... 2-85Data Dictionary Cache (PD_PDDD)...................................................................2-94Data Dictionary Cache Interval (PI_PIDD).........................................................2-97Data File (PD_PDDF)..................................................................................... 2-100Data File Interval (PI_PIDF)...........................................................................2-107Database (PD_PDDB).................................................................................... 2-118Database Interval (PI_PIDB)..........................................................................2-130Database Object Cache (PD_PDDO)............................................................... 2-143Dispatcher (PD_PDDS).................................................................................. 2-147Dispatcher Interval (PI_PIDS)........................................................................ 2-150Errorlog Detail (PD_PDEL)............................................................................. 2-154GCS Stat Summary (PD_PDGC)......................................................................2-156GCS Stat Summary Interval (PI_PIGC)............................................................2-160Instance (PD_PDI)........................................................................................ 2-163Instance Availability (PD_PDIA)......................................................................2-166Latch (PD_PDLA).......................................................................................... 2-169Latch Interval (PI_PILA)................................................................................ 2-173Library Cache (PD_PDLC).............................................................................. 2-177Library Cache Interval (PI_PILC).................................................................... 2-180Lock (PD_PDLO)........................................................................................... 2-183Lock Activity Interval (PI_PIPL)......................................................................2-187Lock Interval (PI_PILO).................................................................................2-190Lock Waiters (PD_PDLW)...............................................................................2-193
viiiHitachi Tuning Manager Application Reports Reference

Minimum Data File Interval 2 (PI_PMDF)........................................................ 2-196Minimum Database Interval 2 (PI_PMDB)....................................................... 2-199Minimum Tablespace Interval 2 (PI_PMTS)..................................................... 2-201Multi-Threaded Server (PD_PDMT).................................................................2-204Multi-Threaded Server Interval (PI_PIMT).......................................................2-210Open Cursor (PD_PDOC)............................................................................... 2-217Options Installed (PD_PDO)...........................................................................2-219Parallel Query Server (PD_PDPQ)................................................................... 2-220Parallel Query Server Interval (PI_PIPQ).........................................................2-224Parallel Query Statistics (PD_PDPS)................................................................2-228Parameter Values (PD_PDP).......................................................................... 2-229Process Detail (PD_PDOP)............................................................................. 2-230Queue Statistics (PD_PDQU)..........................................................................2-232Resource Limit (PD_PDRL).............................................................................2-234Rollback Segment (PD_PDRS)........................................................................2-237Rollback Segment Interval (PI_PIRS)..............................................................2-240Segment Detail (PD_PDSM)........................................................................... 2-243Server Status (PD_STAT)...............................................................................2-252Session Detail (PD_PDS)................................................................................2-253Session Event (PD_PDEV)..............................................................................2-261Session Event Interval (PI_PIEV)....................................................................2-264Session I/O Interval (PI_PIIO)....................................................................... 2-267Session Stat Summary Interval (PI_PIS2)....................................................... 2-270Session Statistics (PD_PDSS)......................................................................... 2-279Session Statistics Summary (PD_PDS2)...........................................................2-281Session Wait (PD_PDWA).............................................................................. 2-290SGA Components (PD_PDSG).........................................................................2-294Shared Cursor Cache (PD_PDC)..................................................................... 2-296Shared Server (PD_PDSH)............................................................................. 2-301Shared Server Interval (PI_PISH)...................................................................2-304Sort Segment (PD_PDSR).............................................................................. 2-307Sort Segment Interval (PI_PISR)....................................................................2-310SQL Text (PD_PDSQ).................................................................................... 2-313SQL Text - Performance Based (PD_PDES)..................................................... 2-315SQL*Net Listener (PD_PDNL).........................................................................2-318SQL*Net Listeners (PD_PDLS)........................................................................2-321System Event (PD_PDSE).............................................................................. 2-323System Event Interval (PI_PISE).................................................................... 2-325System Stat Interval (PI_PIST)...................................................................... 2-327System Stat Summary (PD)........................................................................... 2-329System Stat Summary Interval (PI)................................................................ 2-340System Statistics (PD_PDST)..........................................................................2-352Table Access (PD_PDTA)............................................................................... 2-354Tablespace (PD_PDTS)..................................................................................2-356Tablespace Fragmentation (PD_PDTF)............................................................2-368Tablespace Interval (PI_PITS)........................................................................2-376Transaction (PD_PDTR).................................................................................2-382Transaction Interval (PI_PITR).......................................................................2-386Transaction Lock (PD_PDTL)..........................................................................2-390Version (PD_PDV)......................................................................................... 2-392Reserved Records......................................................................................... 2-393
Agent for Microsoft SQL Server Records................................................................2-393
ixHitachi Tuning Manager Application Reports Reference
Config Detail (PD_CD)................................................................................... 2-395Database Detail (PD_DD).............................................................................. 2-397Database Interval (PI_DI)..............................................................................2-400Database Replication Detail (PD_RD)..............................................................2-403Database Space Detail (PD_DS)..................................................................... 2-405Errorlog Error Detail (PD_EE).........................................................................2-411Errorlog Summary Detail (PD_ES).................................................................. 2-413Global Server Summary (PI).......................................................................... 2-414Global Server Summary 2 (PI_PI2).................................................................2-417Instance Availability (PD_IA)..........................................................................2-420Job History Detail (PD_JH).............................................................................2-422Licensing Detail (PD_LIC).............................................................................. 2-423Lock Detail (PD_LD)...................................................................................... 2-425Procedure Cache Detail (PD_PCAC)................................................................ 2-427Process Detail (PD_PDET)..............................................................................2-430Replication Published Database Overview (PI_RPDB).......................................2-432Replication Summary Detail (PD_RS)..............................................................2-434Server Detail (PD).........................................................................................2-436Server Locks Detail (PD_LOCK)...................................................................... 2-442Server Overview (PI_SERV)........................................................................... 2-445Server Overview 2 (PI_SRV2).........................................................................2-448Server Space Detail (PD_SS)..........................................................................2-451Server Space Interval (PI_SI)........................................................................ 2-457SQL Text (PD_SQL).......................................................................................2-462Transaction Log Overview (PI_TLOG)............................................................. 2-464User-Defined Counter Overview (PI_UCTR).....................................................2-465User Process Detail (PD_USER)......................................................................2-467Reserved Records......................................................................................... 2-469
Agent for Microsoft Exchange Server Records........................................................2-469Database (PI_DB)......................................................................................... 2-470Epoxy (PI_EPOX).......................................................................................... 2-473Managed Store Information (PI_MSI)............................................................. 2-474MSExchangeIS (PI)....................................................................................... 2-477MSExchangeIS Mailbox (PI_ISM)....................................................................2-479MSExchangeIS Public (PI_ISP).......................................................................2-481Process (PD).................................................................................................2-483
Agent for DB2 Records........................................................................................ 2-487Basic Information on Application (PD_DBIA)................................................... 2-488Basic Information on Database (PD_DBID)..................................................... 2-491Basic Information on Database Manager (PD_PD)........................................... 2-496Basic Information on Database Manager Interval (PI_PI)................................. 2-502Bufferpool Stat on Database (PD_DBPD).........................................................2-507Bufferpool Stat on Database Interval (PI_DBPI).............................................. 2-518Cache on Application (PD_DCAA)................................................................... 2-528Cache on Database (PD_DCAD)..................................................................... 2-531Cache on Database Interval (PI_DCAI)........................................................... 2-534DB2 Configuration (PD_DCFE)........................................................................2-538Lock Information on Application (PD_DLIA).................................................... 2-542Lock Information on Database (PD_DLID)...................................................... 2-546Sort Status on Database (PD_DSOD)..............................................................2-548SQL Statement on Application (PD_DSQA)...................................................... 2-552SQL Statement on Database (PD_DSQD)........................................................ 2-558
xHitachi Tuning Manager Application Reports Reference

Tablespace Information on DB (PD_DTID)......................................................2-563Agent for Enterprise Applications Records............................................................. 2-579
Background Processing (PI_BTCP)..................................................................2-580Background Service (PI_BTC)........................................................................ 2-581CCMS Alert Monitor Command (PD_ALMX)......................................................2-583Dialog Service (PI_DIA).................................................................................2-585Enqueue Service (PI_ENQ)............................................................................ 2-590SAP Buffer Summary (PI_BUFF)..................................................................... 2-591SAP Instance Summary (PD_SRV).................................................................. 2-600SAP Memory Summary (PI_MEM)...................................................................2-602Spool Service (PI_SPO)................................................................................. 2-607System Log Monitor Command (PD_SLMX)..................................................... 2-610Update1 Service (PI_UPD1)........................................................................... 2-612Update2 Service (PI_UPD2)........................................................................... 2-614User defined Monitor (Perf.) (PI_UMP)............................................................2-616Work Process Summary (PD)......................................................................... 2-618WorkLoad Summary Interval (PI)...................................................................2-621
Acronyms and Abbreviations
xiHitachi Tuning Manager Application Reports Reference

xiiHitachi Tuning Manager Application Reports Reference

Preface
This document describes how to use the Hitachi Tuning Manager.
This preface includes the following information:
□ Intended audience
□ Product version
□ Release notes
□ Document organization
□ Related documents
□ Document conventions
□ Conventions for storage capacity values
□ Accessing product documentation
□ Getting help
□ Comments
Preface xiiiHitachi Tuning Manager Application Reports Reference
Intended audienceThis document is intended for system/account administrators who have abasic knowledge of both Storage Area Networks (SANs) and NetworkAttached Storage (NAS) and who are responsible for:
• Store database management• Backup and disk management• Cluster system set up and maintenance• Data collection (system configuration detail records, log information, and
workgroup information)
Product versionThis document revision applies to Tuning Manager v8.1.2 or later.
Release notesRead the release notes before installing and using this product. They maycontain requirements or restrictions that are not fully described in thisdocument or updates or corrections to this document.
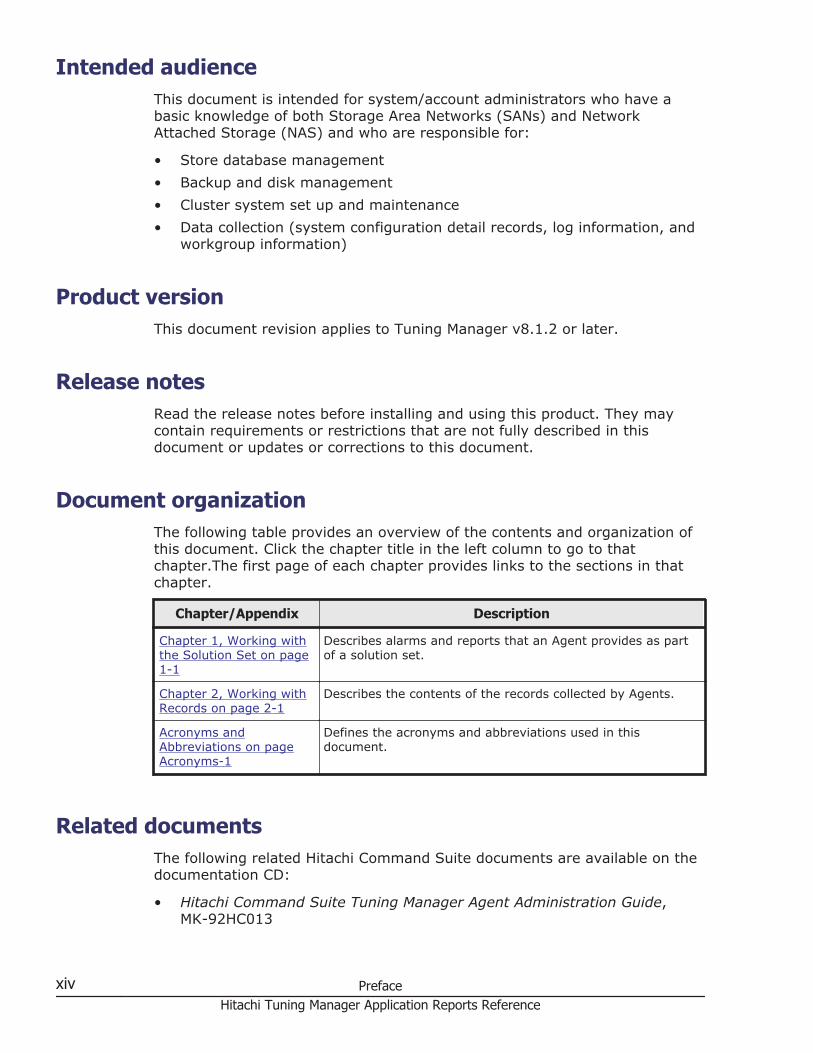
Document organizationThe following table provides an overview of the contents and organization ofthis document. Click the chapter title in the left column to go to thatchapter.The first page of each chapter provides links to the sections in thatchapter.
Chapter/Appendix Description
Chapter 1, Working withthe Solution Set on page1-1
Describes alarms and reports that an Agent provides as partof a solution set.
Chapter 2, Working withRecords on page 2-1
Describes the contents of the records collected by Agents.
Acronyms andAbbreviations on pageAcronyms-1
Defines the acronyms and abbreviations used in thisdocument.
Related documentsThe following related Hitachi Command Suite documents are available on thedocumentation CD:
• Hitachi Command Suite Tuning Manager Agent Administration Guide,MK-92HC013
xiv PrefaceHitachi Tuning Manager Application Reports Reference
• Hitachi Command Suite Tuning Manager Server Administration Guide,MK-92HC021
• Hitachi Command Suite Tuning Manager User Guide, MK-92HC022• Hitachi Command Suite Tuning Manager API Reference Guide,
MK-92HC218• Hitachi Command Suite Tuning Manager Hardware Reports Reference,
MK-95HC111• Hitachi Command Suite Tuning Manager Operating System Reports
Reference, MK-95HC112• Hitachi Command Suite Tuning Manager Messages, MK-95HC114• Hitachi Command Suite Tuning Manager CLI Reference Guide,
MK-96HC119• Hitachi Command Suite Tuning Manager Installation Guide, MK-96HC141
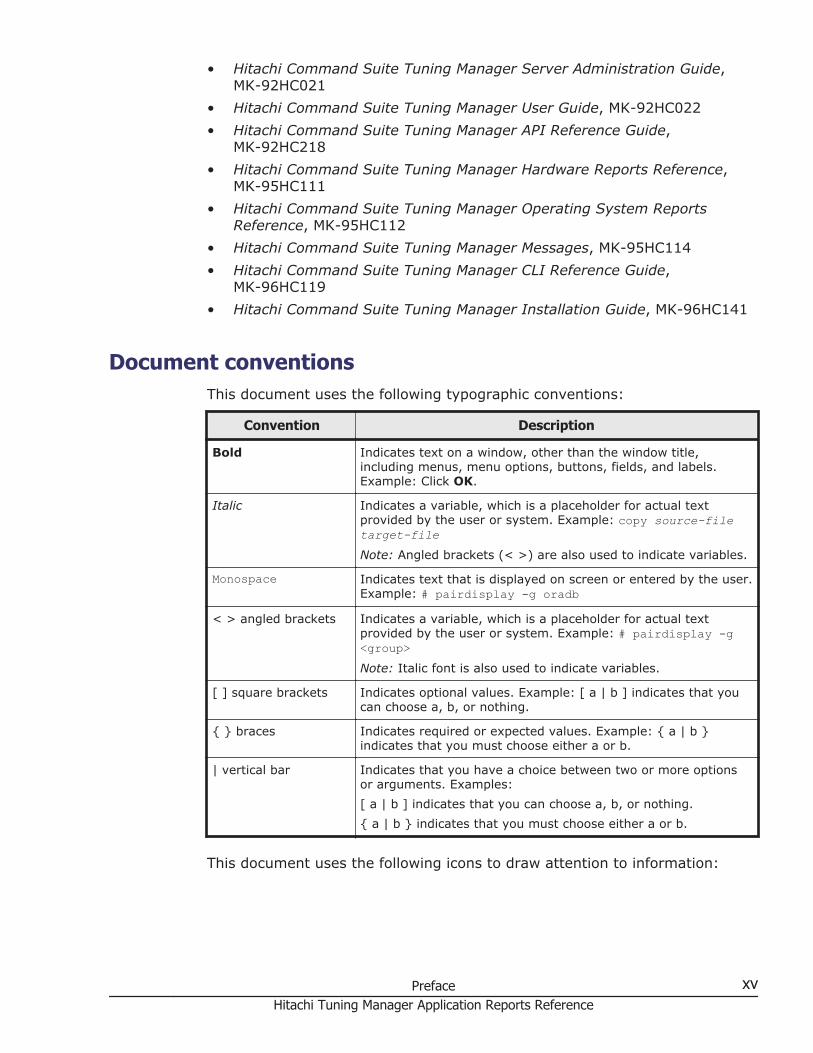
Document conventionsThis document uses the following typographic conventions:
Convention Description
Bold Indicates text on a window, other than the window title,including menus, menu options, buttons, fields, and labels.Example: Click OK.
Italic Indicates a variable, which is a placeholder for actual textprovided by the user or system. Example: copy source-filetarget-file
Note: Angled brackets (< >) are also used to indicate variables.
Monospace Indicates text that is displayed on screen or entered by the user.Example: # pairdisplay -g oradb
< > angled brackets Indicates a variable, which is a placeholder for actual textprovided by the user or system. Example: # pairdisplay -g<group>Note: Italic font is also used to indicate variables.
[ ] square brackets Indicates optional values. Example: [ a | b ] indicates that youcan choose a, b, or nothing.
{ } braces Indicates required or expected values. Example: { a | b }indicates that you must choose either a or b.
| vertical bar Indicates that you have a choice between two or more optionsor arguments. Examples:[ a | b ] indicates that you can choose a, b, or nothing.{ a | b } indicates that you must choose either a or b.
This document uses the following icons to draw attention to information:
Preface xvHitachi Tuning Manager Application Reports Reference
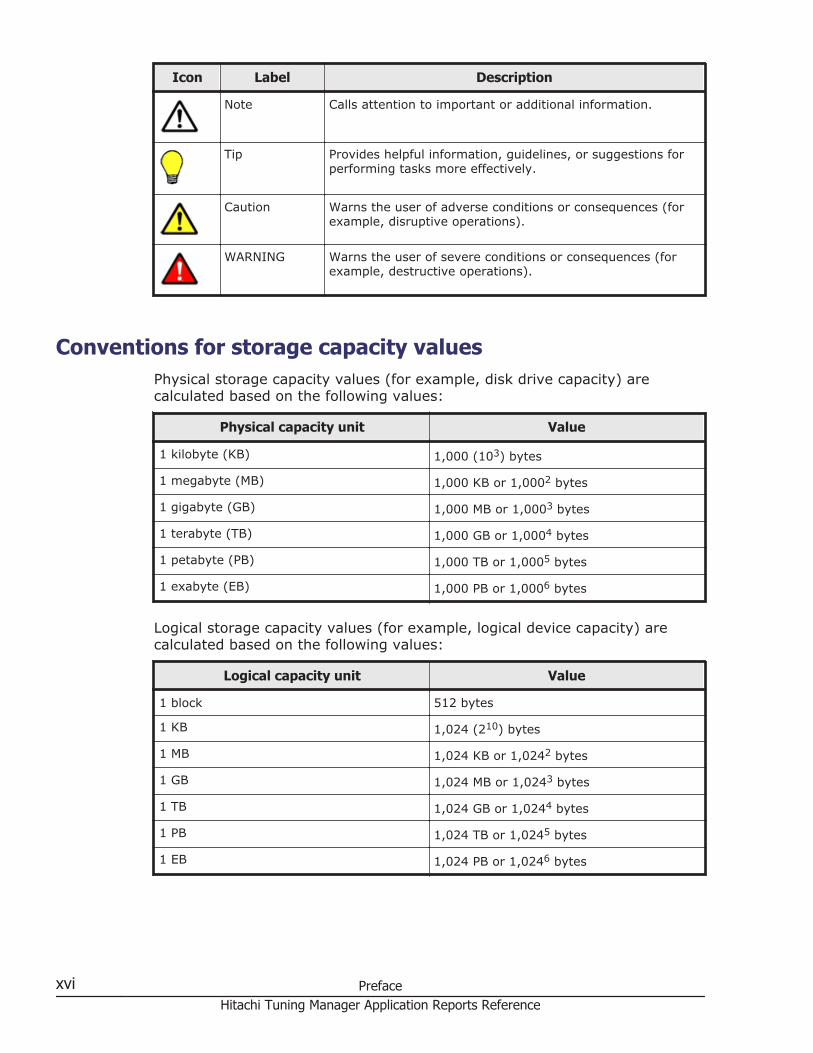
Icon Label Description
Note Calls attention to important or additional information.
Tip Provides helpful information, guidelines, or suggestions forperforming tasks more effectively.
Caution Warns the user of adverse conditions or consequences (forexample, disruptive operations).
WARNING Warns the user of severe conditions or consequences (forexample, destructive operations).
Conventions for storage capacity valuesPhysical storage capacity values (for example, disk drive capacity) arecalculated based on the following values:
Physical capacity unit Value
1 kilobyte (KB) 1,000 (103) bytes
1 megabyte (MB) 1,000 KB or 1,0002 bytes
1 gigabyte (GB) 1,000 MB or 1,0003 bytes
1 terabyte (TB) 1,000 GB or 1,0004 bytes
1 petabyte (PB) 1,000 TB or 1,0005 bytes
1 exabyte (EB) 1,000 PB or 1,0006 bytes
Logical storage capacity values (for example, logical device capacity) arecalculated based on the following values:
Logical capacity unit Value
1 block 512 bytes
1 KB 1,024 (210) bytes
1 MB 1,024 KB or 1,0242 bytes
1 GB 1,024 MB or 1,0243 bytes
1 TB 1,024 GB or 1,0244 bytes
1 PB 1,024 TB or 1,0245 bytes
1 EB 1,024 PB or 1,0246 bytes
xvi PrefaceHitachi Tuning Manager Application Reports Reference
Accessing product documentationThe Tuning Manager user documentation is available on the Hitachi DataSystems Portal: https://portal.hds.com. Check this site for the mostcurrent documentation, including important updates that may have beenmade after the release of the product.
Getting helpHitachi Data Systems Support Portal is the destination for technical support ofyour current or previously-sold storage systems, midrange and enterpriseservers, and combined solution offerings. The Hitachi Data Systems customersupport staff is available 24 hours a day, seven days a week. If you needtechnical support, log on to the Hitachi Data Systems Support Portal forcontact information: https://portal.hds.com.
Hitachi Data Systems Community is a new global online community for HDScustomers, partners, independent software vendors, employees, andprospects. It is an open discussion among these groups about the HDSportfolio of products and services. It is the destination to get answers,discover insights, and make connections. The HDS Community complementsour existing Support Portal and support services by providing an area whereyou can get answers to non-critical issues and questions. Join theconversation today! Go to community.hds.com, register, and completeyour profile.
CommentsPlease send us your comments on this document: [email protected] the document title and number, including the revision level (forexample, -07), and refer to specific sections and paragraphs wheneverpossible. All comments become the property of Hitachi Data SystemsCorporation.
Thank you!
Preface xviiHitachi Tuning Manager Application Reports Reference

xviii PrefaceHitachi Tuning Manager Application Reports Reference
1Working with the Solution Set
This chapter describes alarms and reports that an Agent provides as part of asolution set. A solution set makes it easy for the user to set alarms andreports.
□ Overview of the Solution Set
□ Format of Alarm Explanations
□ Agent for Oracle Alarms
□ Agent for Microsoft SQL Server Alarms
□ Agent for Microsoft Exchange Server Alarm
□ Agent for DB2 Alarms
□ Agent for Enterprise Applications Alarms
□ Format of Report Explanations
□ Organization of Report Folders
□ Agent for Oracle Reports
□ Agent for Microsoft SQL Server Reports
□ Agent for Microsoft Exchange Server Reports
□ Agent for DB2 Reports
□ Agent for Enterprise Applications Reports
Working with the Solution Set 1-1Hitachi Tuning Manager Application Reports Reference
Overview of the Solution SetThe Tuning Manager series programs enable you to define alarms and reportsby the following methods:
• Use the default alarms and reports provided by an Agent.• Customize the default alarms and reports provided by an Agent.• Define new alarms and reports.
The alarms and reports provided by an Agent constitute a solution set.Because all required information is already defined for alarms and reports inthe solution set, you can use them as they are or customize them asappropriate for your environment. Therefore, you can monitor the operatingstatus of a desired program without having to define new alarms and reports.
For details about how to use reports, see the Tuning Manager User Guide. Fordetails about how to use alarms, see the Tuning Manager AgentAdministration Guide.
Format of Alarm ExplanationsThis section describes the format that is used to explain alarms. This manuallists the alarms in alphabetical order.
Overview
Provides an overview of what can be monitored by the alarm.
Main Settings
Provides a table that lists and describes the main settings for the alarm. Thealarm settings in the table correspond to the settings in the Propertieswindow that appears when you click an alarm icon on the Alarms window ofPerformance Reporter, and then click the Properties method. For detailsabout each alarm setting, see the Properties window for the particular alarmin Performance Reporter.
Two hyphens (--) in the Setting column indicate that the setting is alwaysdisabled.
If the same value is set as the conditional expression for both the abnormaland warning conditions, only abnormal error alarms are issued.
Related Reports
Indicates the reports in the solution set that are associated with this alarm.You can view reports by clicking the report icons in the Display AlarmStatuses method, which is accessible by clicking the Agents icon in theAgents window of Performance Reporter.
1-2 Working with the Solution SetHitachi Tuning Manager Application Reports Reference

Agent for Oracle AlarmsThe alarms defined in the Agent for Oracle solution set are grouped togetherin an alarm table called PFM Oracle Template Alarms 10.50. "10.50"represents the version of the alarm table. This alarm table is stored in theOracle folder that is displayed in the Alarms window of PerformanceReporter. Table 1-1 Agent for Oracle Alarms on page 1-3 lists anddescribes the alarms defined in this solution set:
Table 1-1 Agent for Oracle Alarms
Name of Alarm What Is Monitored
Buffer Cache Usage Buffer cache usage
Buffer Cache Waits Contention among database data and contention amongrollback blocks
Dict. Cache Usage Shared pool
Disk Sorts Percentage of sort operations that are executed on thedisk, when memory and disk I/O operations are used
Free List Waits Contention among database data for free lists
Full Table Scans Percentage of table lookups that do not use an index
Library Cache Usage Library cache
Redo Log Contention Frequency at which the Oracle server has to wait to write tothe log
Server Status Availability of the Oracle instance
Tablespace Usage Free tablespace
Note: If Agent for Oracle has not been connected to the Oracle instance to bemonitored, Agent for Oracle will not detect alarms other than the ServerStatus alarm.
Buffer Cache Usage
Overview
The Buffer Cache Usage alarm monitors the buffer cache usage rate.
Main Settings
Table 1-2 Main Settings for the Buffer Cache Usage Alarm
Alarm Properties in PerformanceReporter Setting
Item Detailed Item
Main Report alarm whenthe following
Selected
Working with the Solution Set 1-3Hitachi Tuning Manager Application Reports Reference
Alarm Properties in PerformanceReporter Setting
Item Detailed Item
damping condition isreached
Interval(s) 3
Occurrence(s)during
2
Actions SNMP Abnormal, Warning, Normal
ConditionalExpressions
Record System Stat Summary Interval (PI)
Field Cache Hit %
Abnormal condition Cache Hit % < 85
Warning condition Cache Hit % < 95
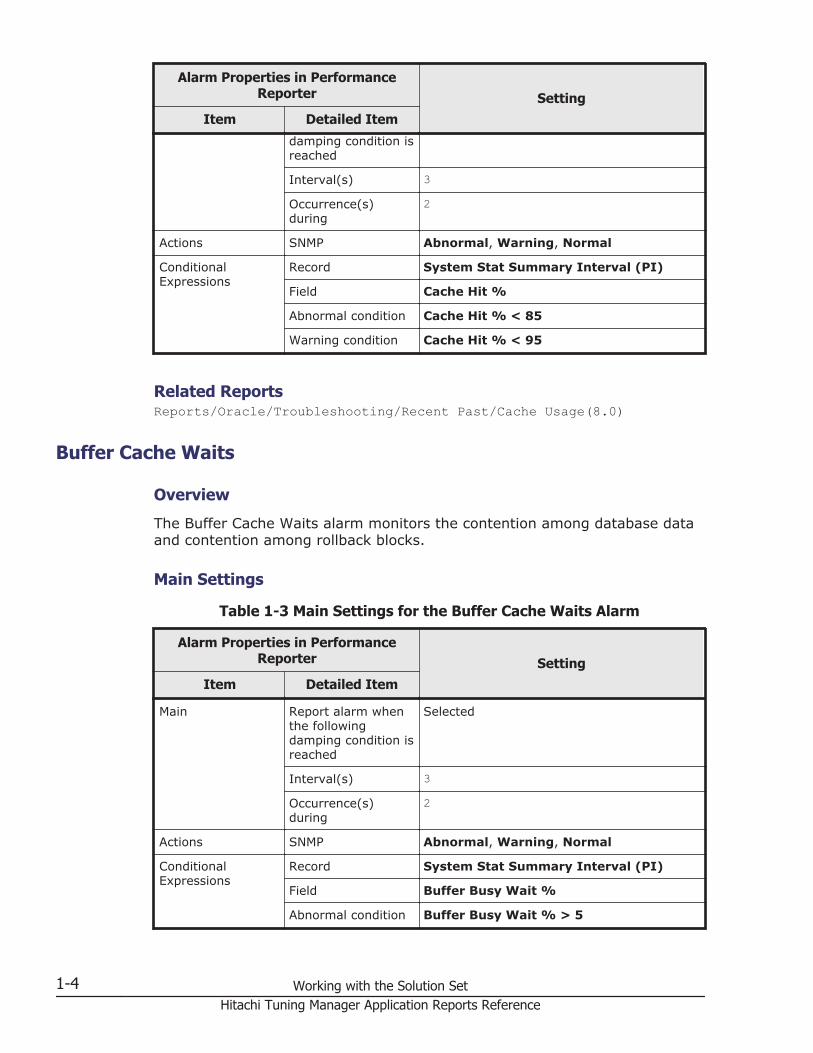
Related ReportsReports/Oracle/Troubleshooting/Recent Past/Cache Usage(8.0)
Buffer Cache Waits
Overview
The Buffer Cache Waits alarm monitors the contention among database dataand contention among rollback blocks.
Main Settings
Table 1-3 Main Settings for the Buffer Cache Waits Alarm
Alarm Properties in PerformanceReporter Setting
Item Detailed Item
Main Report alarm whenthe followingdamping condition isreached
Selected
Interval(s) 3
Occurrence(s)during
2
Actions SNMP Abnormal, Warning, Normal
ConditionalExpressions
Record System Stat Summary Interval (PI)
Field Buffer Busy Wait %
Abnormal condition Buffer Busy Wait % > 5
1-4 Working with the Solution SetHitachi Tuning Manager Application Reports Reference

Alarm Properties in PerformanceReporter Setting
Item Detailed Item
Warning condition Buffer Busy Wait % > 3
Related ReportsReports/Oracle/Troubleshooting/Recent Past/Cache Usage(8.0)
Dict. Cache Usage
Overview
The Dict. Cache Usage alarm monitors shared pools.
Main Settings
Table 1-4 Main Settings for the Dict. Cache Usage Alarm
Alarm Properties in PerformanceReporter Setting
Item Detailed Item
Main Report alarm whenthe followingdamping condition isreached
Selected
Interval(s) 3
Occurrence(s)during
2
Actions SNMP Abnormal, Warning, Normal
ConditionalExpressions
Record System Stat Summary Interval (PI)
Field Dict Cache Get Miss %
Abnormal condition Dict Cache Get Miss % > 15
Warning condition Dict Cache Get Miss % > 10
Related ReportsReports/Oracle/Troubleshooting/Recent Past/Cache Usage(8.0)
Working with the Solution Set 1-5Hitachi Tuning Manager Application Reports Reference
Disk Sorts
Overview
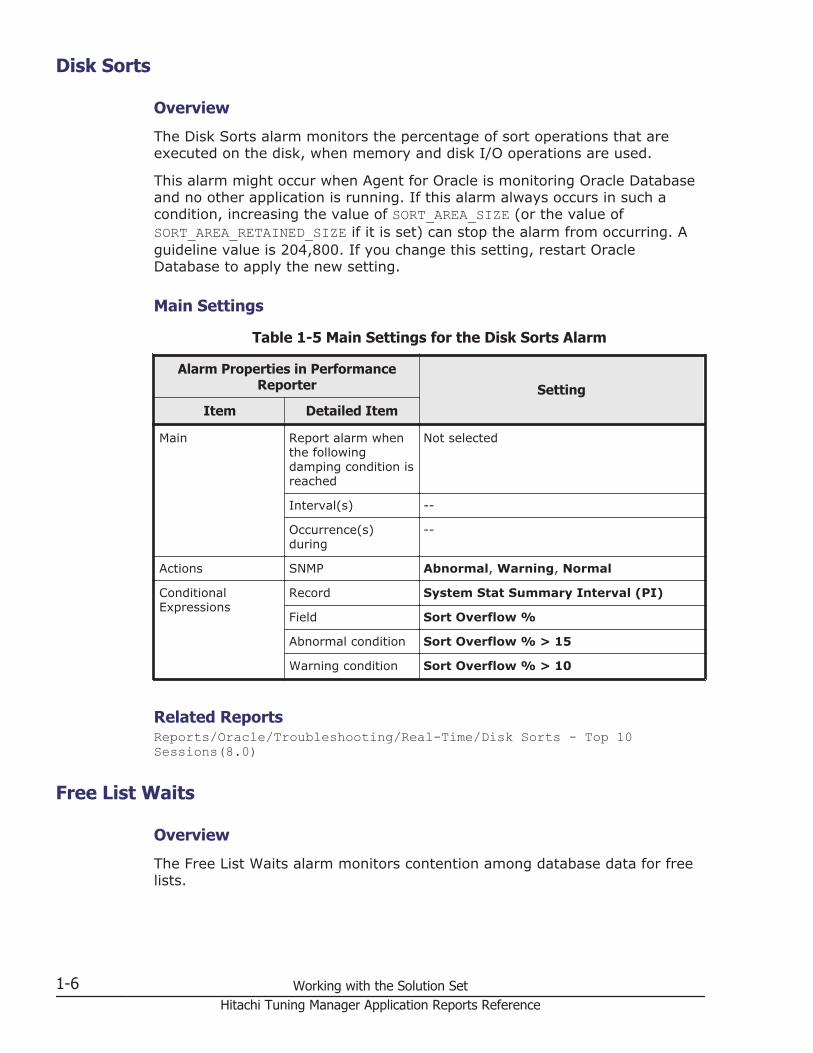
The Disk Sorts alarm monitors the percentage of sort operations that areexecuted on the disk, when memory and disk I/O operations are used.
This alarm might occur when Agent for Oracle is monitoring Oracle Databaseand no other application is running. If this alarm always occurs in such acondition, increasing the value of SORT_AREA_SIZE (or the value ofSORT_AREA_RETAINED_SIZE if it is set) can stop the alarm from occurring. Aguideline value is 204,800. If you change this setting, restart OracleDatabase to apply the new setting.
Main Settings
Table 1-5 Main Settings for the Disk Sorts Alarm
Alarm Properties in PerformanceReporter Setting
Item Detailed Item
Main Report alarm whenthe followingdamping condition isreached
Not selected
Interval(s) --
Occurrence(s)during
--
Actions SNMP Abnormal, Warning, Normal
ConditionalExpressions
Record System Stat Summary Interval (PI)
Field Sort Overflow %
Abnormal condition Sort Overflow % > 15
Warning condition Sort Overflow % > 10
Related ReportsReports/Oracle/Troubleshooting/Real-Time/Disk Sorts - Top 10 Sessions(8.0)
Free List Waits
Overview
The Free List Waits alarm monitors contention among database data for freelists.
1-6 Working with the Solution SetHitachi Tuning Manager Application Reports Reference
Main Settings
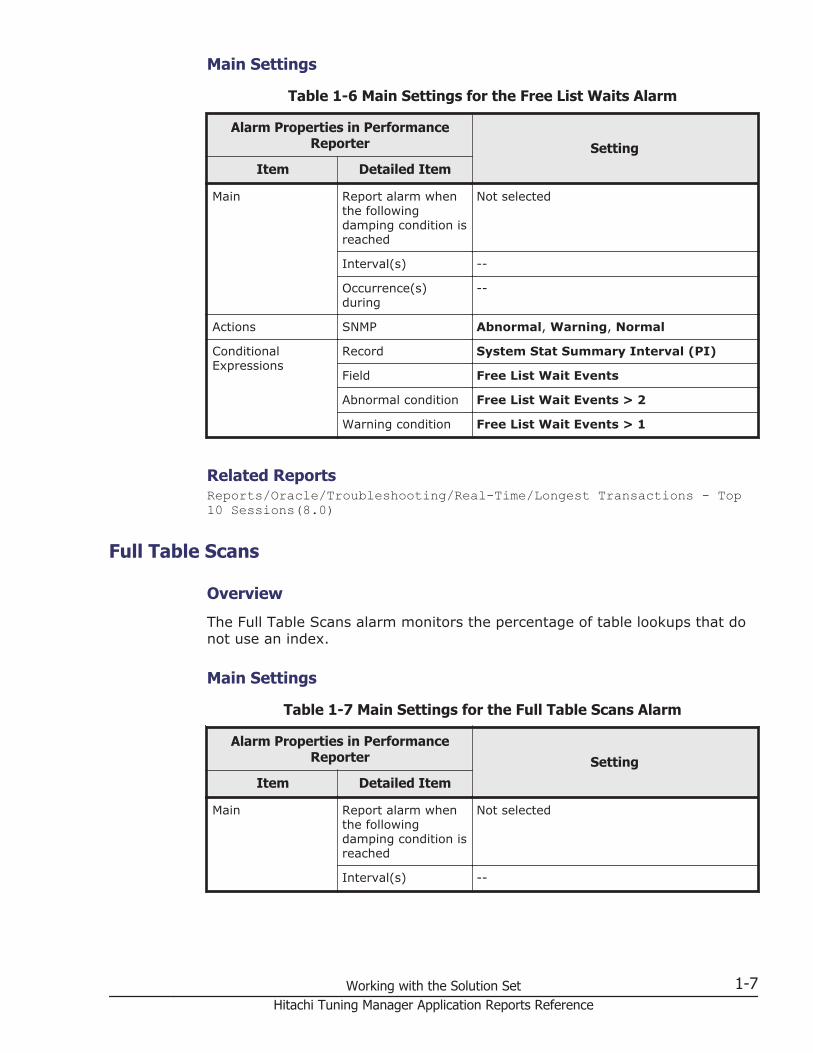
Table 1-6 Main Settings for the Free List Waits Alarm
Alarm Properties in PerformanceReporter Setting
Item Detailed Item
Main Report alarm whenthe followingdamping condition isreached
Not selected
Interval(s) --
Occurrence(s)during
--
Actions SNMP Abnormal, Warning, Normal
ConditionalExpressions
Record System Stat Summary Interval (PI)
Field Free List Wait Events
Abnormal condition Free List Wait Events > 2
Warning condition Free List Wait Events > 1
Related ReportsReports/Oracle/Troubleshooting/Real-Time/Longest Transactions - Top 10 Sessions(8.0)
Full Table Scans
Overview
The Full Table Scans alarm monitors the percentage of table lookups that donot use an index.
Main Settings
Table 1-7 Main Settings for the Full Table Scans Alarm
Alarm Properties in PerformanceReporter Setting
Item Detailed Item
Main Report alarm whenthe followingdamping condition isreached
Not selected
Interval(s) --
Working with the Solution Set 1-7Hitachi Tuning Manager Application Reports Reference

Alarm Properties in PerformanceReporter Setting
Item Detailed Item
Occurrence(s)during
--
Actions SNMP Abnormal, Warning, Normal
ConditionalExpressions
Record System Stat Summary Interval (PI)
Field Non-Index Lookups %
Abnormal condition Non-Index Lookups % > 10
Warning condition Non-Index Lookups % > 5
Related ReportsReports/Oracle/Troubleshooting/Recent Past/Full Table Scans(8.0)
Library Cache Usage
Overview
The Library Cache Usage alarm monitors the library cache.
Main Settings
Table 1-8 Main Settings for the Library Cache Usage Alarm
Alarm Properties in PerformanceReporter Setting
Item Detailed Item
Main Report alarm whenthe followingdamping condition isreached
Selected
Interval(s) 3
Occurrence(s)during
2
Actions SNMP Abnormal, Warning, Normal
ConditionalExpressions
Record System Stat Summary Interval (PI)
Field Lib Cache Miss %
Abnormal condition Lib Cache Miss % > 2
Warning condition Lib Cache Miss % > 1
1-8 Working with the Solution SetHitachi Tuning Manager Application Reports Reference
Related ReportsReports/Oracle/Troubleshooting/Recent Past/Cache Usage(8.0)
Redo Log Contention
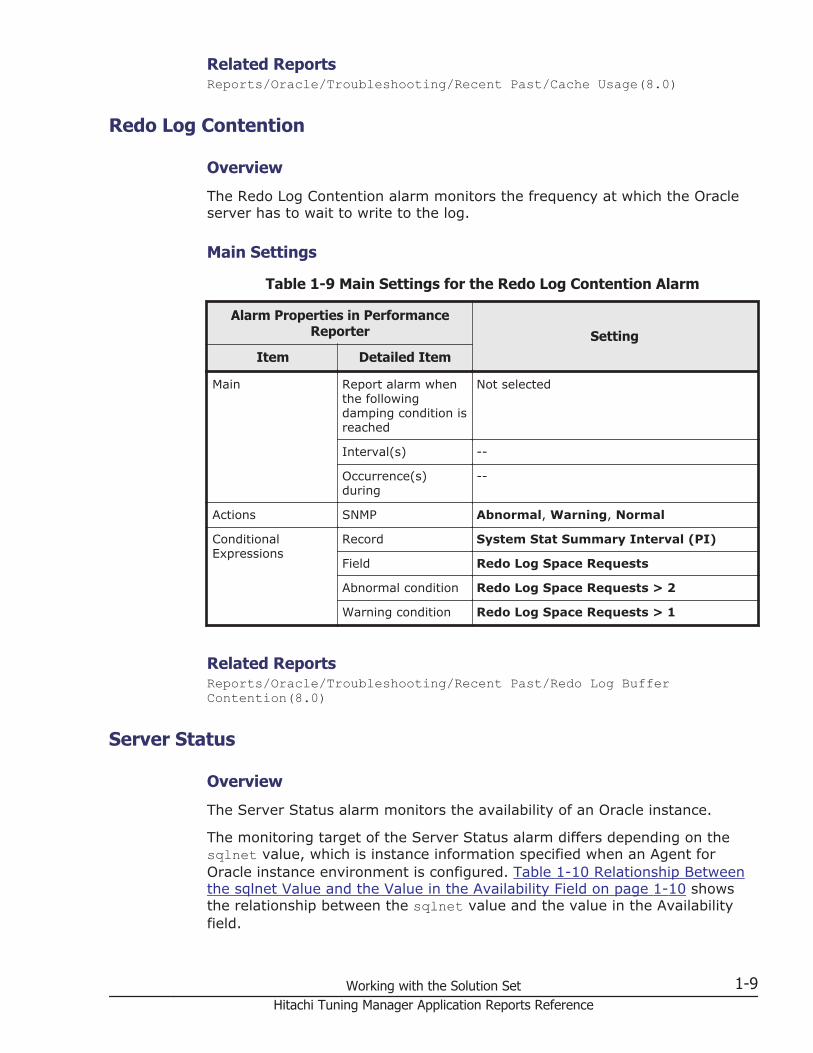
Overview
The Redo Log Contention alarm monitors the frequency at which the Oracleserver has to wait to write to the log.
Main Settings
Table 1-9 Main Settings for the Redo Log Contention Alarm
Alarm Properties in PerformanceReporter Setting
Item Detailed Item
Main Report alarm whenthe followingdamping condition isreached
Not selected
Interval(s) --
Occurrence(s)during
--
Actions SNMP Abnormal, Warning, Normal
ConditionalExpressions
Record System Stat Summary Interval (PI)
Field Redo Log Space Requests
Abnormal condition Redo Log Space Requests > 2
Warning condition Redo Log Space Requests > 1
Related ReportsReports/Oracle/Troubleshooting/Recent Past/Redo Log Buffer Contention(8.0)
Server Status
Overview
The Server Status alarm monitors the availability of an Oracle instance.
The monitoring target of the Server Status alarm differs depending on thesqlnet value, which is instance information specified when an Agent forOracle instance environment is configured. Table 1-10 Relationship Betweenthe sqlnet Value and the Value in the Availability Field on page 1-10 showsthe relationship between the sqlnet value and the value in the Availabilityfield.
Working with the Solution Set 1-9Hitachi Tuning Manager Application Reports Reference
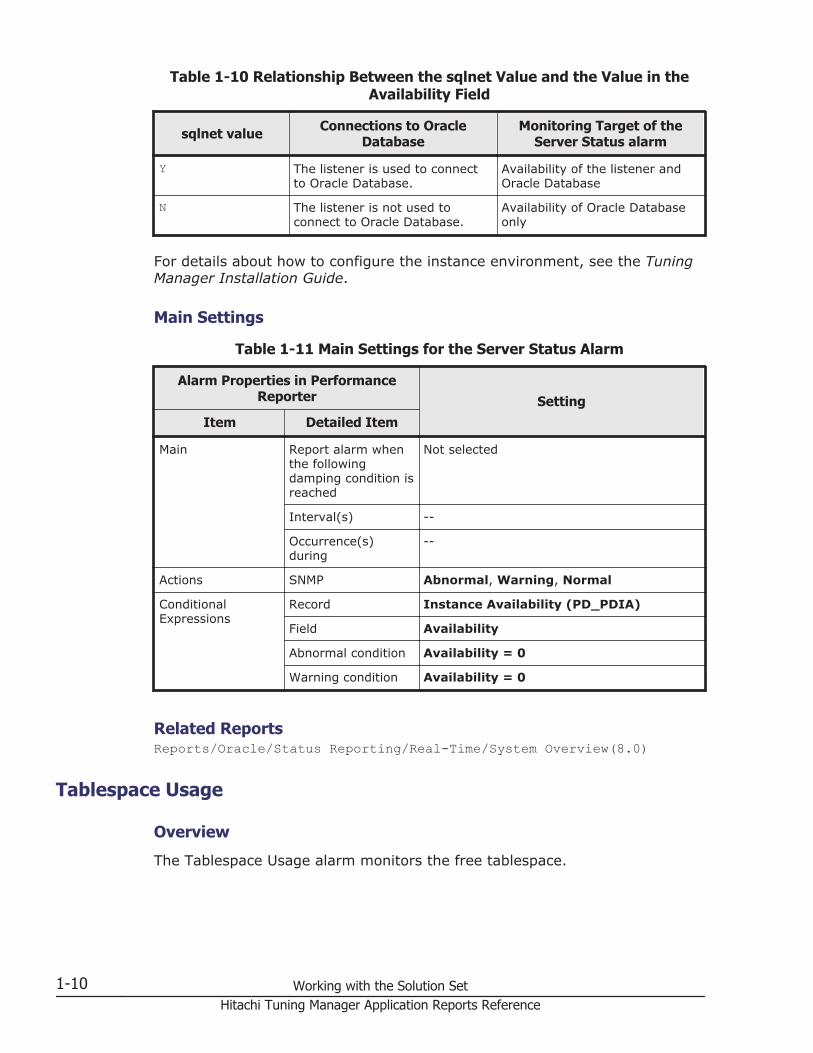
Table 1-10 Relationship Between the sqlnet Value and the Value in theAvailability Field
sqlnet value Connections to OracleDatabase
Monitoring Target of theServer Status alarm
Y The listener is used to connectto Oracle Database.
Availability of the listener andOracle Database
N The listener is not used toconnect to Oracle Database.
Availability of Oracle Databaseonly
For details about how to configure the instance environment, see the TuningManager Installation Guide.
Main Settings
Table 1-11 Main Settings for the Server Status Alarm
Alarm Properties in PerformanceReporter Setting
Item Detailed Item
Main Report alarm whenthe followingdamping condition isreached
Not selected
Interval(s) --
Occurrence(s)during
--
Actions SNMP Abnormal, Warning, Normal
ConditionalExpressions
Record Instance Availability (PD_PDIA)
Field Availability
Abnormal condition Availability = 0
Warning condition Availability = 0
Related ReportsReports/Oracle/Status Reporting/Real-Time/System Overview(8.0)
Tablespace Usage
Overview
The Tablespace Usage alarm monitors the free tablespace.
1-10 Working with the Solution SetHitachi Tuning Manager Application Reports Reference

Main Settings
Table 1-12 Main Settings for the Tablespace Usage Alarm
Alarm Properties in PerformanceReporter Setting
Item Detailed Item
Main Report alarm whenthe followingdamping condition isreached
Not selected
Interval(s) --
Occurrence(s)during
--
Actions SNMP Abnormal, Warning, Normal
ConditionalExpressions
Record Tablespace (PD_PDTS)
Field Free %
Abnormal condition Free % < 10
Warning condition Free % < 20
Related ReportsReports/Oracle/Status Reporting/Real-Time/Tablespace Status(4.0)
Agent for Microsoft SQL Server AlarmsThe alarms defined in the Agent for Microsoft SQL Server solution set aregrouped together in an alarm table called PFM SQL Template Alarms09.00. 09.00 represents the version of the alarm table. This alarm table isstored in the SQL folder that is displayed on the Alarms window ofPerformance Reporter. Table 1-13 Agent for Microsoft SQL Server Alarms onpage 1-11 lists and describes the alarms that are defined in this solutionset:
Table 1-13 Agent for Microsoft SQL Server Alarms
Name of Alarm What Is Monitored
Blocked Sessions Number of sessions that are waiting due to a sessionrunning on Microsoft SQL Server being locked
Cache Usage Percentage of requests that were found in the data cache(instead of being read from the disk)
CPU Usage The ten sessions that consume the most CPU cycles
Database Space Space usage status in each database on Microsoft SQLServer
Log Space Usage The ten databases that consume the most log space
Working with the Solution Set 1-11Hitachi Tuning Manager Application Reports Reference
Name of Alarm What Is Monitored
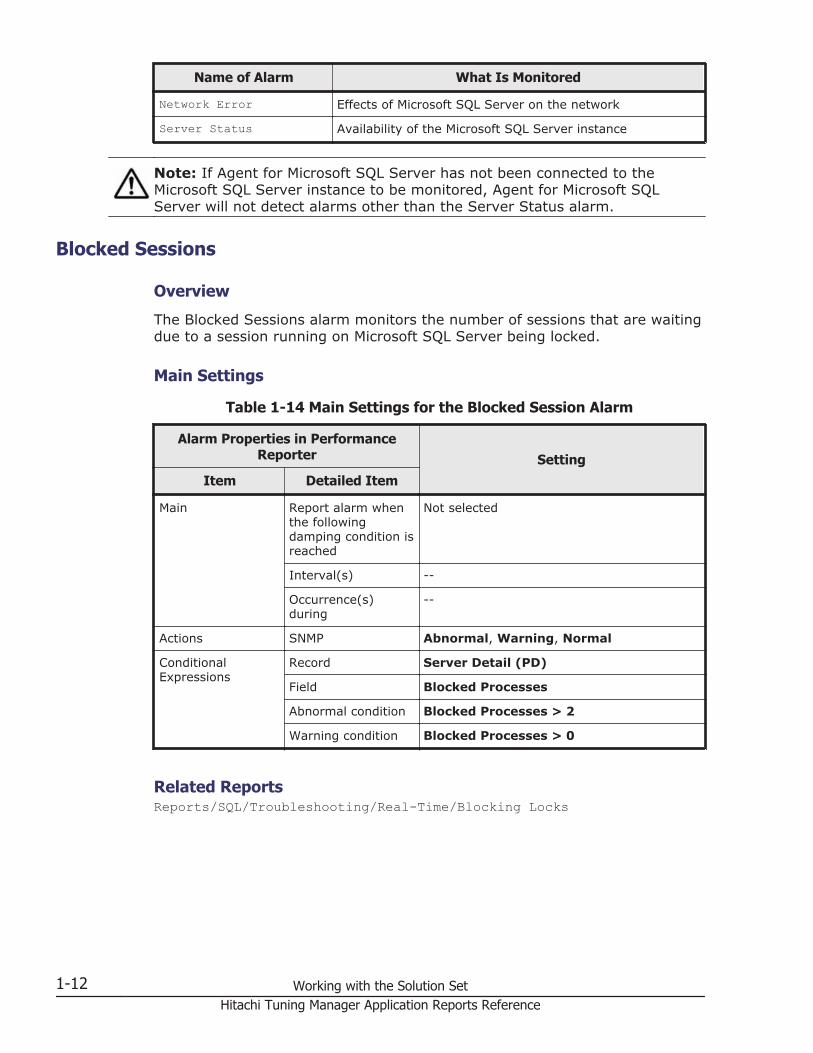
Network Error Effects of Microsoft SQL Server on the network
Server Status Availability of the Microsoft SQL Server instance
Note: If Agent for Microsoft SQL Server has not been connected to theMicrosoft SQL Server instance to be monitored, Agent for Microsoft SQLServer will not detect alarms other than the Server Status alarm.
Blocked Sessions
Overview
The Blocked Sessions alarm monitors the number of sessions that are waitingdue to a session running on Microsoft SQL Server being locked.
Main Settings
Table 1-14 Main Settings for the Blocked Session Alarm
Alarm Properties in PerformanceReporter Setting
Item Detailed Item
Main Report alarm whenthe followingdamping condition isreached
Not selected
Interval(s) --
Occurrence(s)during
--
Actions SNMP Abnormal, Warning, Normal
ConditionalExpressions
Record Server Detail (PD)
Field Blocked Processes
Abnormal condition Blocked Processes > 2
Warning condition Blocked Processes > 0
Related ReportsReports/SQL/Troubleshooting/Real-Time/Blocking Locks
1-12 Working with the Solution SetHitachi Tuning Manager Application Reports Reference

Cache Usage
Overview
The Cache Usage alarm monitors the percentage of requests that were foundin the data cache (instead of being read from the disk).
Main Settings
Table 1-15 Main Settings for the Cache Usage Alarm
Alarm Properties in PerformanceReporter Setting
Item Detailed Item
Main Report alarm whenthe followingdamping condition isreached
Selected
Interval(s) 3
Occurrence(s)during
2
Actions SNMP Abnormal, Warning, Normal
ConditionalExpressions
Record Server Overview (PI_SERV)
Field Cache Hit %
Abnormal condition Cache Hit % < 85
Warning condition Cache Hit % < 95
Related ReportsReports/SQL/Troubleshooting/Recent Past/Cache Usage
CPU Usage
Overview
The CPU Usage alarm monitors ten sessions that consume the most CPUcycles.
Working with the Solution Set 1-13Hitachi Tuning Manager Application Reports Reference
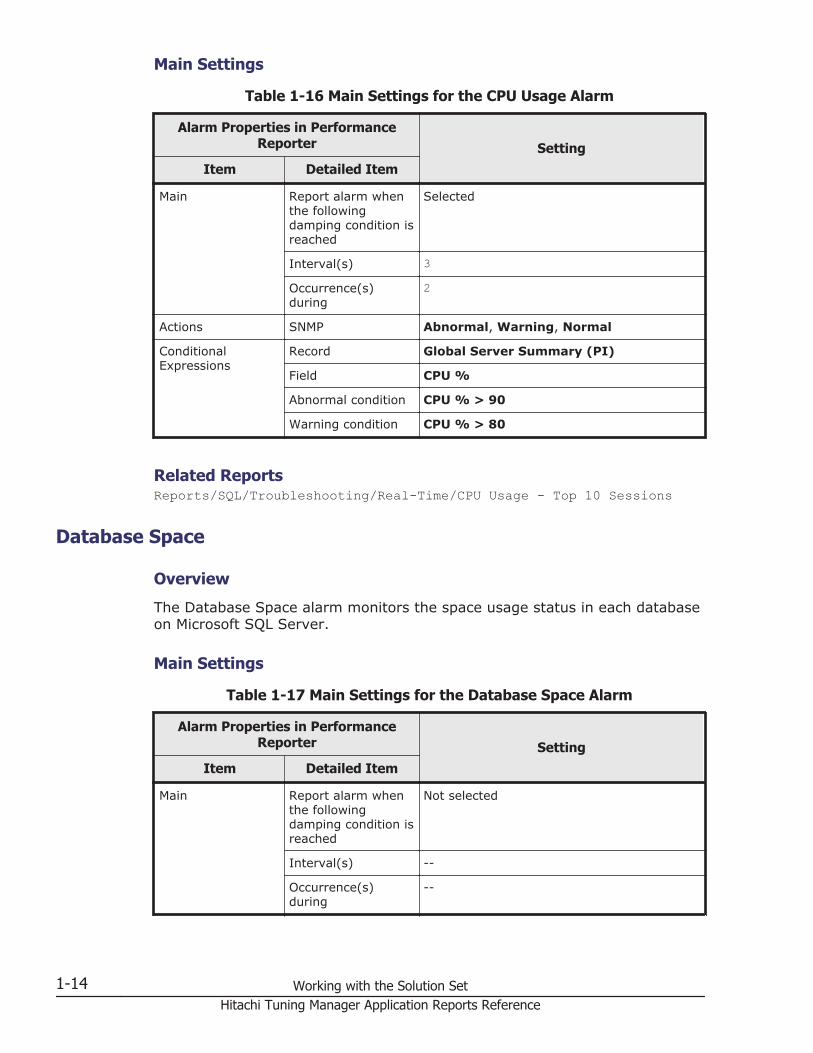
Main Settings
Table 1-16 Main Settings for the CPU Usage Alarm
Alarm Properties in PerformanceReporter Setting
Item Detailed Item
Main Report alarm whenthe followingdamping condition isreached
Selected
Interval(s) 3
Occurrence(s)during
2
Actions SNMP Abnormal, Warning, Normal
ConditionalExpressions
Record Global Server Summary (PI)
Field CPU %
Abnormal condition CPU % > 90
Warning condition CPU % > 80
Related ReportsReports/SQL/Troubleshooting/Real-Time/CPU Usage - Top 10 Sessions
Database Space
Overview
The Database Space alarm monitors the space usage status in each databaseon Microsoft SQL Server.
Main Settings
Table 1-17 Main Settings for the Database Space Alarm
Alarm Properties in PerformanceReporter Setting
Item Detailed Item
Main Report alarm whenthe followingdamping condition isreached
Not selected
Interval(s) --
Occurrence(s)during
--
1-14 Working with the Solution SetHitachi Tuning Manager Application Reports Reference
Alarm Properties in PerformanceReporter Setting
Item Detailed Item
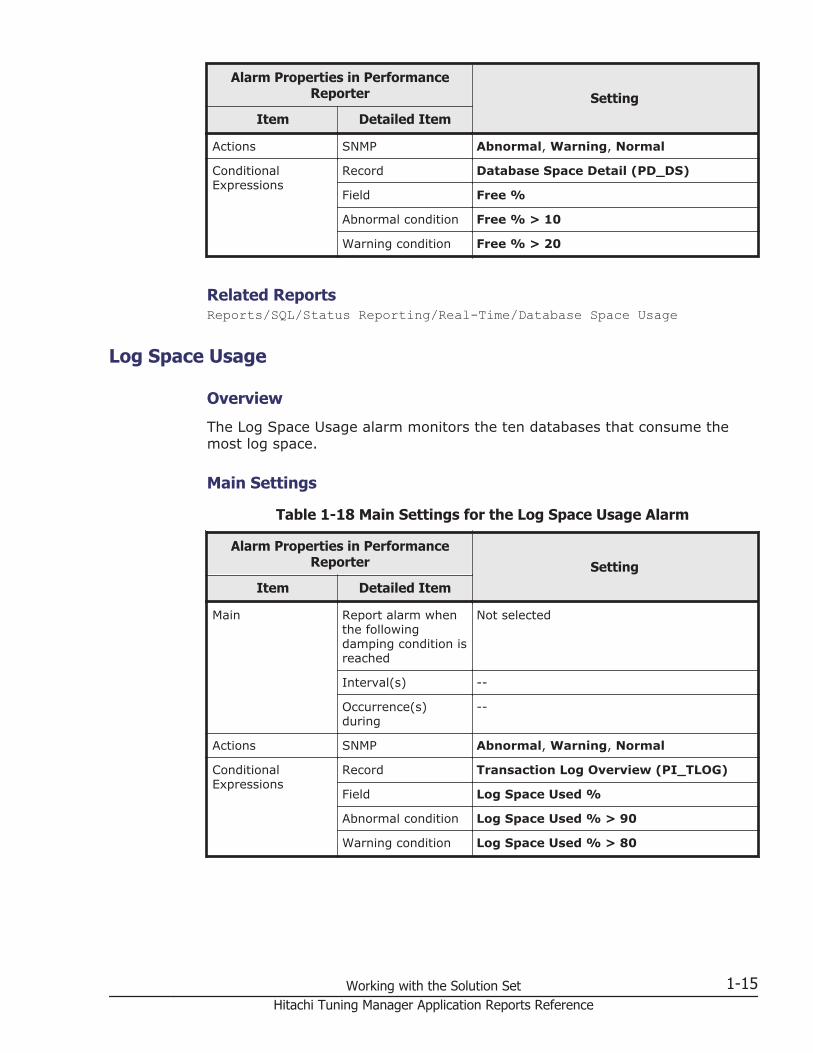
Actions SNMP Abnormal, Warning, Normal
ConditionalExpressions
Record Database Space Detail (PD_DS)
Field Free %
Abnormal condition Free % > 10
Warning condition Free % > 20
Related ReportsReports/SQL/Status Reporting/Real-Time/Database Space Usage
Log Space Usage
Overview
The Log Space Usage alarm monitors the ten databases that consume themost log space.
Main Settings
Table 1-18 Main Settings for the Log Space Usage Alarm
Alarm Properties in PerformanceReporter Setting
Item Detailed Item
Main Report alarm whenthe followingdamping condition isreached
Not selected
Interval(s) --
Occurrence(s)during
--
Actions SNMP Abnormal, Warning, Normal
ConditionalExpressions
Record Transaction Log Overview (PI_TLOG)
Field Log Space Used %
Abnormal condition Log Space Used % > 90
Warning condition Log Space Used % > 80
Working with the Solution Set 1-15Hitachi Tuning Manager Application Reports Reference
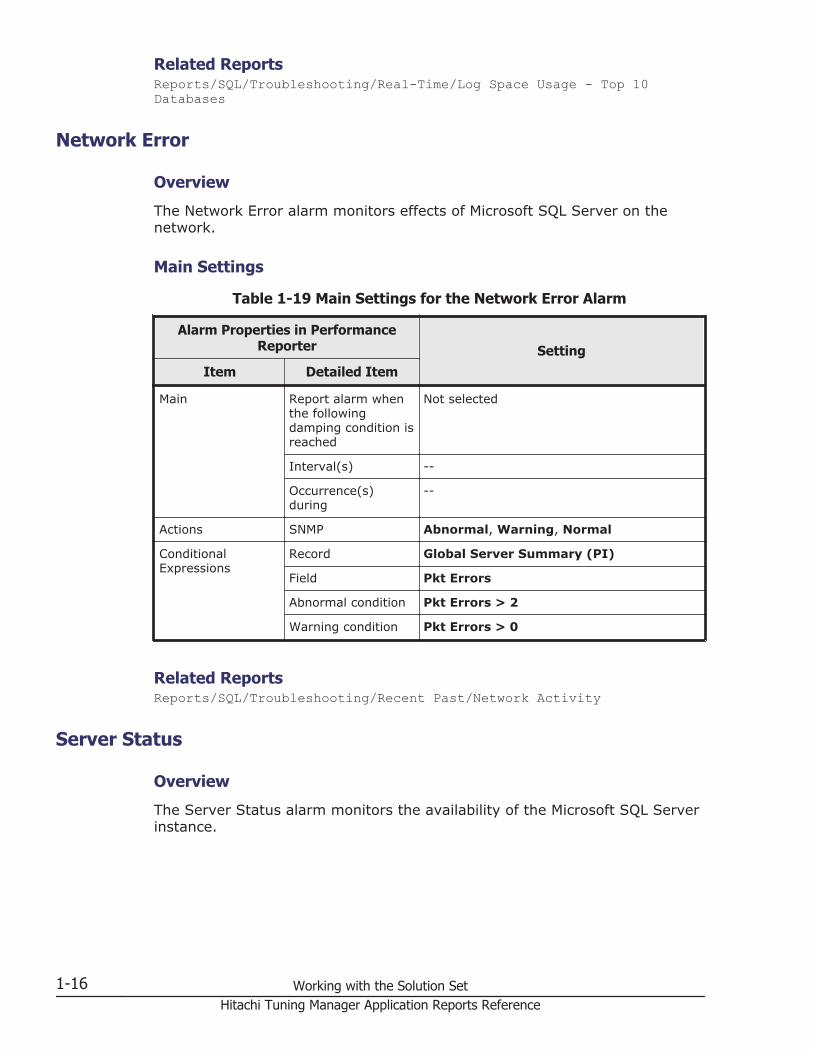
Related ReportsReports/SQL/Troubleshooting/Real-Time/Log Space Usage - Top 10 Databases
Network Error
Overview
The Network Error alarm monitors effects of Microsoft SQL Server on thenetwork.
Main Settings
Table 1-19 Main Settings for the Network Error Alarm
Alarm Properties in PerformanceReporter Setting
Item Detailed Item
Main Report alarm whenthe followingdamping condition isreached
Not selected
Interval(s) --
Occurrence(s)during
--
Actions SNMP Abnormal, Warning, Normal
ConditionalExpressions
Record Global Server Summary (PI)
Field Pkt Errors
Abnormal condition Pkt Errors > 2
Warning condition Pkt Errors > 0
Related ReportsReports/SQL/Troubleshooting/Recent Past/Network Activity
Server Status
Overview
The Server Status alarm monitors the availability of the Microsoft SQL Serverinstance.
1-16 Working with the Solution SetHitachi Tuning Manager Application Reports Reference
Main Settings
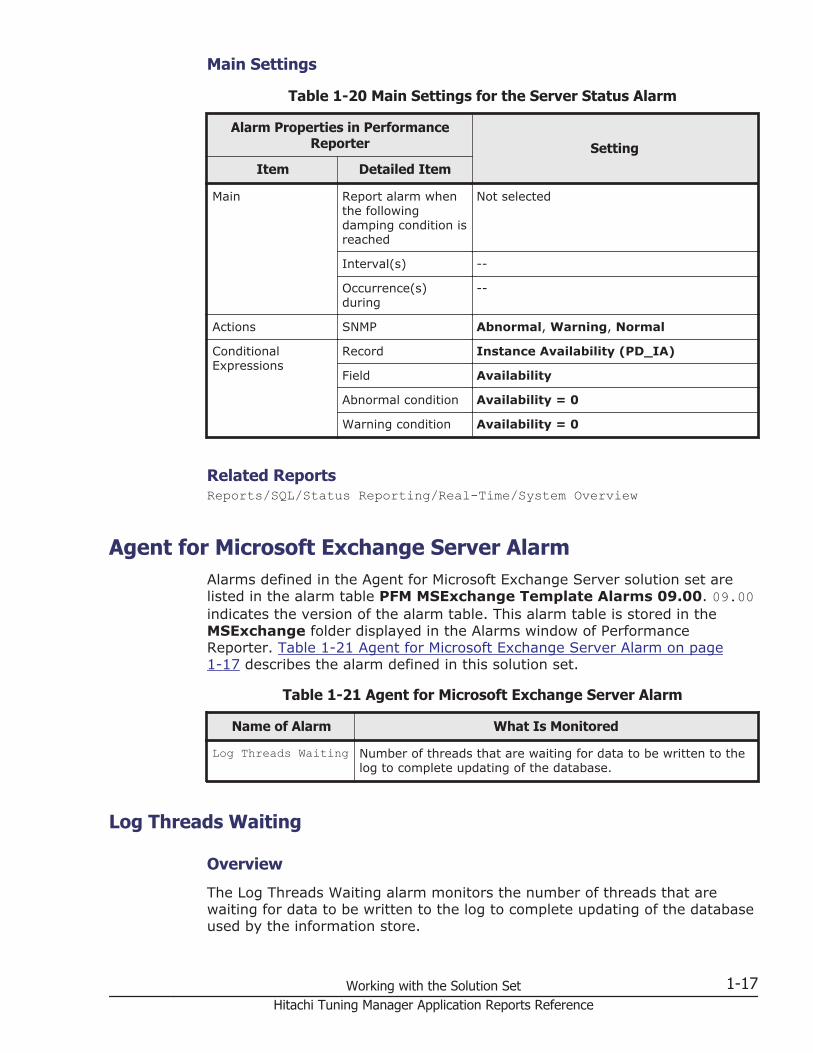
Table 1-20 Main Settings for the Server Status Alarm
Alarm Properties in PerformanceReporter Setting
Item Detailed Item
Main Report alarm whenthe followingdamping condition isreached
Not selected
Interval(s) --
Occurrence(s)during
--
Actions SNMP Abnormal, Warning, Normal
ConditionalExpressions
Record Instance Availability (PD_IA)
Field Availability
Abnormal condition Availability = 0
Warning condition Availability = 0
Related ReportsReports/SQL/Status Reporting/Real-Time/System Overview
Agent for Microsoft Exchange Server AlarmAlarms defined in the Agent for Microsoft Exchange Server solution set arelisted in the alarm table PFM MSExchange Template Alarms 09.00. 09.00indicates the version of the alarm table. This alarm table is stored in theMSExchange folder displayed in the Alarms window of PerformanceReporter. Table 1-21 Agent for Microsoft Exchange Server Alarm on page1-17 describes the alarm defined in this solution set.
Table 1-21 Agent for Microsoft Exchange Server Alarm
Name of Alarm What Is Monitored
Log Threads Waiting Number of threads that are waiting for data to be written to thelog to complete updating of the database.
Log Threads Waiting
Overview
The Log Threads Waiting alarm monitors the number of threads that arewaiting for data to be written to the log to complete updating of the databaseused by the information store.
Working with the Solution Set 1-17Hitachi Tuning Manager Application Reports Reference
Main Settings
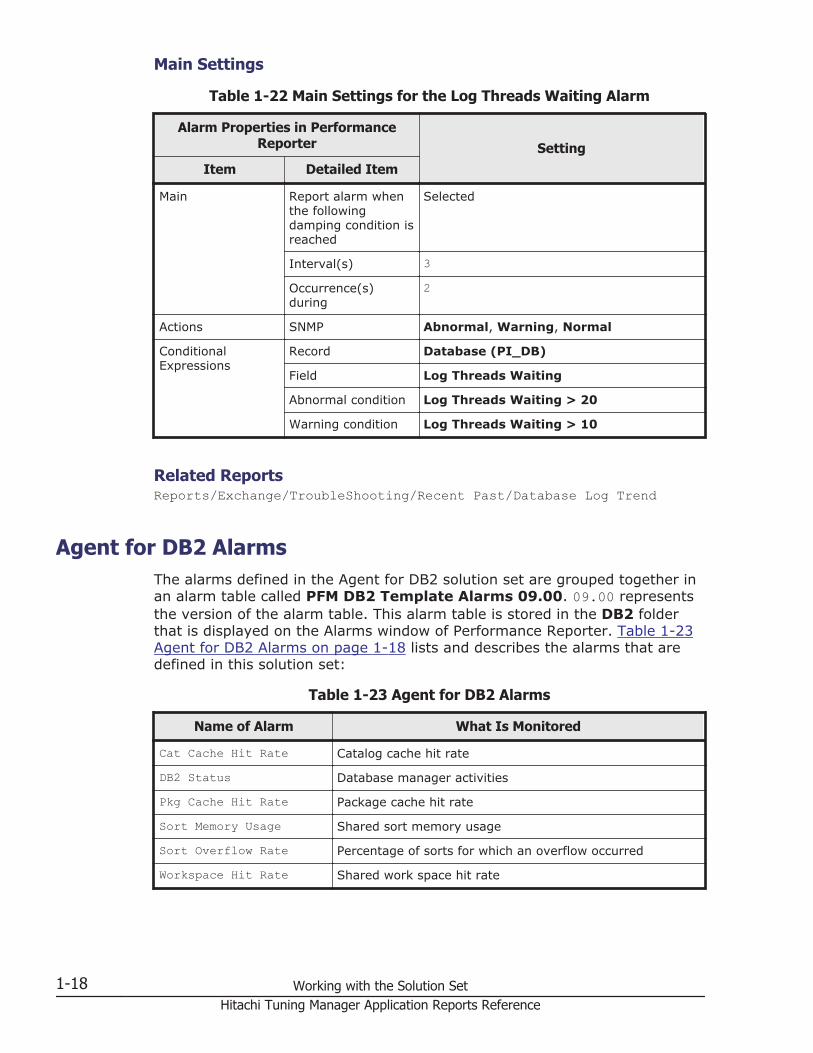
Table 1-22 Main Settings for the Log Threads Waiting Alarm
Alarm Properties in PerformanceReporter Setting
Item Detailed Item
Main Report alarm whenthe followingdamping condition isreached
Selected
Interval(s) 3
Occurrence(s)during
2
Actions SNMP Abnormal, Warning, Normal
ConditionalExpressions
Record Database (PI_DB)
Field Log Threads Waiting
Abnormal condition Log Threads Waiting > 20
Warning condition Log Threads Waiting > 10
Related ReportsReports/Exchange/TroubleShooting/Recent Past/Database Log Trend
Agent for DB2 AlarmsThe alarms defined in the Agent for DB2 solution set are grouped together inan alarm table called PFM DB2 Template Alarms 09.00. 09.00 representsthe version of the alarm table. This alarm table is stored in the DB2 folderthat is displayed on the Alarms window of Performance Reporter. Table 1-23Agent for DB2 Alarms on page 1-18 lists and describes the alarms that aredefined in this solution set:
Table 1-23 Agent for DB2 Alarms
Name of Alarm What Is Monitored
Cat Cache Hit Rate Catalog cache hit rate
DB2 Status Database manager activities
Pkg Cache Hit Rate Package cache hit rate
Sort Memory Usage Shared sort memory usage
Sort Overflow Rate Percentage of sorts for which an overflow occurred
Workspace Hit Rate Shared work space hit rate
1-18 Working with the Solution SetHitachi Tuning Manager Application Reports Reference

Cat Cache Hit Rate
Overview
The Cat Cache Hit Rate alarm monitors the catalog cache hit rate.
Main Settings
Table 1-24 Main Settings for the Cat Cache Hit Rate Alarm
Alarm Properties in PerformanceReporter Setting
Item Detailed Item
Main Report alarm whenthe followingdamping condition isreached
Selected
Interval(s) 3
Occurrence(s)during
2
Actions SNMP Abnormal, Warning, Normal
ConditionalExpressions
Record Cache on Database Interval (PI_DCAI)
Field Catcache Hit Rate
Abnormal condition Catcache Hit Rate < 70AND Catcache Hit Rate <> 0
Warning condition Catcache Hit Rate < 80AND Catcache Hit Rate <> 0
Related ReportsReports/DB2/Troubleshooting/Recent Past/Cache Hit Rate
DB2 Status
Overview
The DB2 Status alarm monitors the database manager to determine whetherit is running normally.
Working with the Solution Set 1-19Hitachi Tuning Manager Application Reports Reference
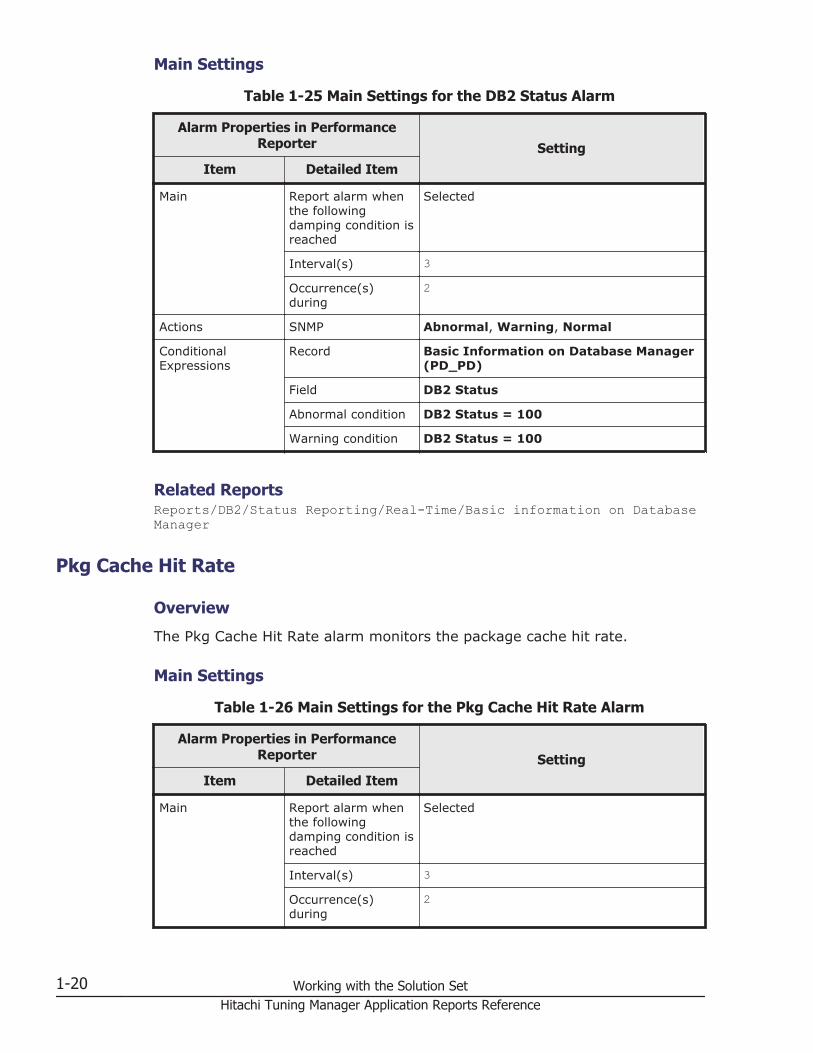
Main Settings
Table 1-25 Main Settings for the DB2 Status Alarm
Alarm Properties in PerformanceReporter Setting
Item Detailed Item
Main Report alarm whenthe followingdamping condition isreached
Selected
Interval(s) 3
Occurrence(s)during
2
Actions SNMP Abnormal, Warning, Normal
ConditionalExpressions
Record Basic Information on Database Manager(PD_PD)
Field DB2 Status
Abnormal condition DB2 Status = 100
Warning condition DB2 Status = 100
Related ReportsReports/DB2/Status Reporting/Real-Time/Basic information on Database Manager
Pkg Cache Hit Rate
Overview
The Pkg Cache Hit Rate alarm monitors the package cache hit rate.
Main Settings
Table 1-26 Main Settings for the Pkg Cache Hit Rate Alarm
Alarm Properties in PerformanceReporter Setting
Item Detailed Item
Main Report alarm whenthe followingdamping condition isreached
Selected
Interval(s) 3
Occurrence(s)during
2
1-20 Working with the Solution SetHitachi Tuning Manager Application Reports Reference
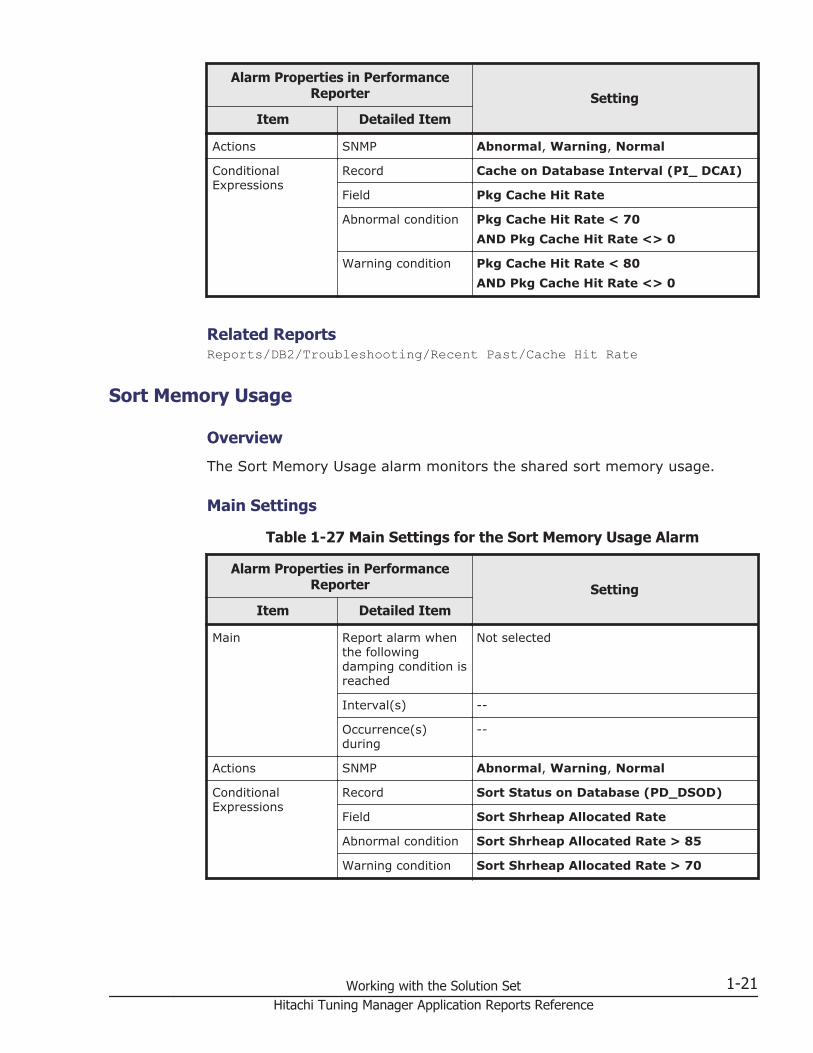
Alarm Properties in PerformanceReporter Setting
Item Detailed Item
Actions SNMP Abnormal, Warning, Normal
ConditionalExpressions
Record Cache on Database Interval (PI_ DCAI)
Field Pkg Cache Hit Rate
Abnormal condition Pkg Cache Hit Rate < 70AND Pkg Cache Hit Rate <> 0
Warning condition Pkg Cache Hit Rate < 80AND Pkg Cache Hit Rate <> 0
Related ReportsReports/DB2/Troubleshooting/Recent Past/Cache Hit Rate
Sort Memory Usage
Overview
The Sort Memory Usage alarm monitors the shared sort memory usage.
Main Settings
Table 1-27 Main Settings for the Sort Memory Usage Alarm
Alarm Properties in PerformanceReporter Setting
Item Detailed Item
Main Report alarm whenthe followingdamping condition isreached
Not selected
Interval(s) --
Occurrence(s)during
--
Actions SNMP Abnormal, Warning, Normal
ConditionalExpressions
Record Sort Status on Database (PD_DSOD)
Field Sort Shrheap Allocated Rate
Abnormal condition Sort Shrheap Allocated Rate > 85
Warning condition Sort Shrheap Allocated Rate > 70
Working with the Solution Set 1-21Hitachi Tuning Manager Application Reports Reference
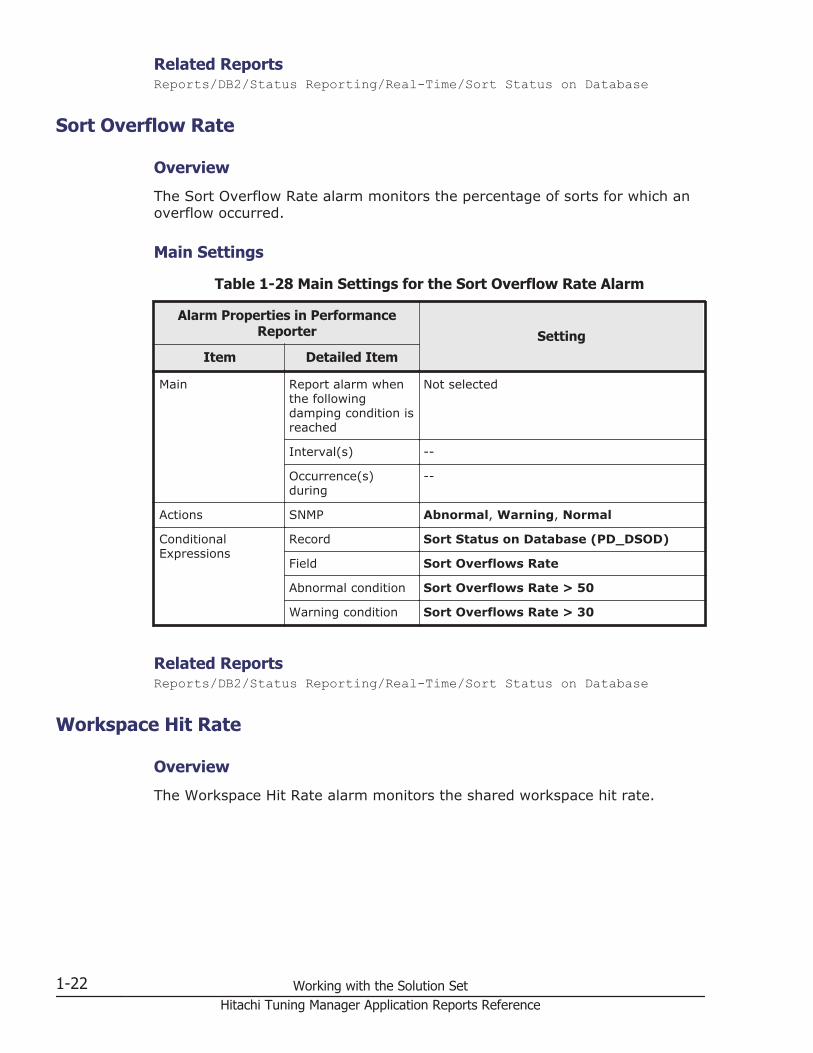
Related ReportsReports/DB2/Status Reporting/Real-Time/Sort Status on Database
Sort Overflow Rate
Overview
The Sort Overflow Rate alarm monitors the percentage of sorts for which anoverflow occurred.
Main Settings
Table 1-28 Main Settings for the Sort Overflow Rate Alarm
Alarm Properties in PerformanceReporter Setting
Item Detailed Item
Main Report alarm whenthe followingdamping condition isreached
Not selected
Interval(s) --
Occurrence(s)during
--
Actions SNMP Abnormal, Warning, Normal
ConditionalExpressions
Record Sort Status on Database (PD_DSOD)
Field Sort Overflows Rate
Abnormal condition Sort Overflows Rate > 50
Warning condition Sort Overflows Rate > 30
Related ReportsReports/DB2/Status Reporting/Real-Time/Sort Status on Database
Workspace Hit Rate
Overview
The Workspace Hit Rate alarm monitors the shared workspace hit rate.
1-22 Working with the Solution SetHitachi Tuning Manager Application Reports Reference
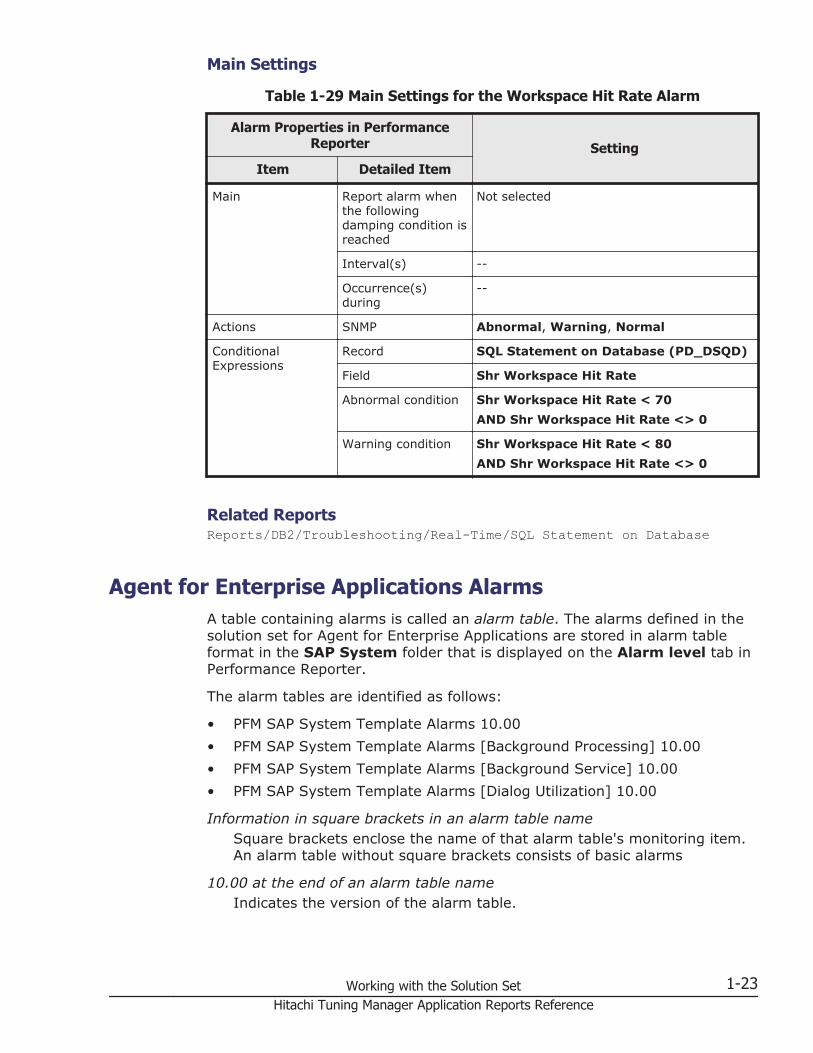
Main Settings
Table 1-29 Main Settings for the Workspace Hit Rate Alarm
Alarm Properties in PerformanceReporter Setting
Item Detailed Item
Main Report alarm whenthe followingdamping condition isreached
Not selected
Interval(s) --
Occurrence(s)during
--
Actions SNMP Abnormal, Warning, Normal
ConditionalExpressions
Record SQL Statement on Database (PD_DSQD)
Field Shr Workspace Hit Rate
Abnormal condition Shr Workspace Hit Rate < 70AND Shr Workspace Hit Rate <> 0
Warning condition Shr Workspace Hit Rate < 80AND Shr Workspace Hit Rate <> 0
Related ReportsReports/DB2/Troubleshooting/Real-Time/SQL Statement on Database
Agent for Enterprise Applications AlarmsA table containing alarms is called an alarm table. The alarms defined in thesolution set for Agent for Enterprise Applications are stored in alarm tableformat in the SAP System folder that is displayed on the Alarm level tab inPerformance Reporter.
The alarm tables are identified as follows:
• PFM SAP System Template Alarms 10.00• PFM SAP System Template Alarms [Background Processing] 10.00• PFM SAP System Template Alarms [Background Service] 10.00• PFM SAP System Template Alarms [Dialog Utilization] 10.00
Information in square brackets in an alarm table nameSquare brackets enclose the name of that alarm table's monitoring item.An alarm table without square brackets consists of basic alarms
10.00 at the end of an alarm table nameIndicates the version of the alarm table.
Working with the Solution Set 1-23Hitachi Tuning Manager Application Reports Reference
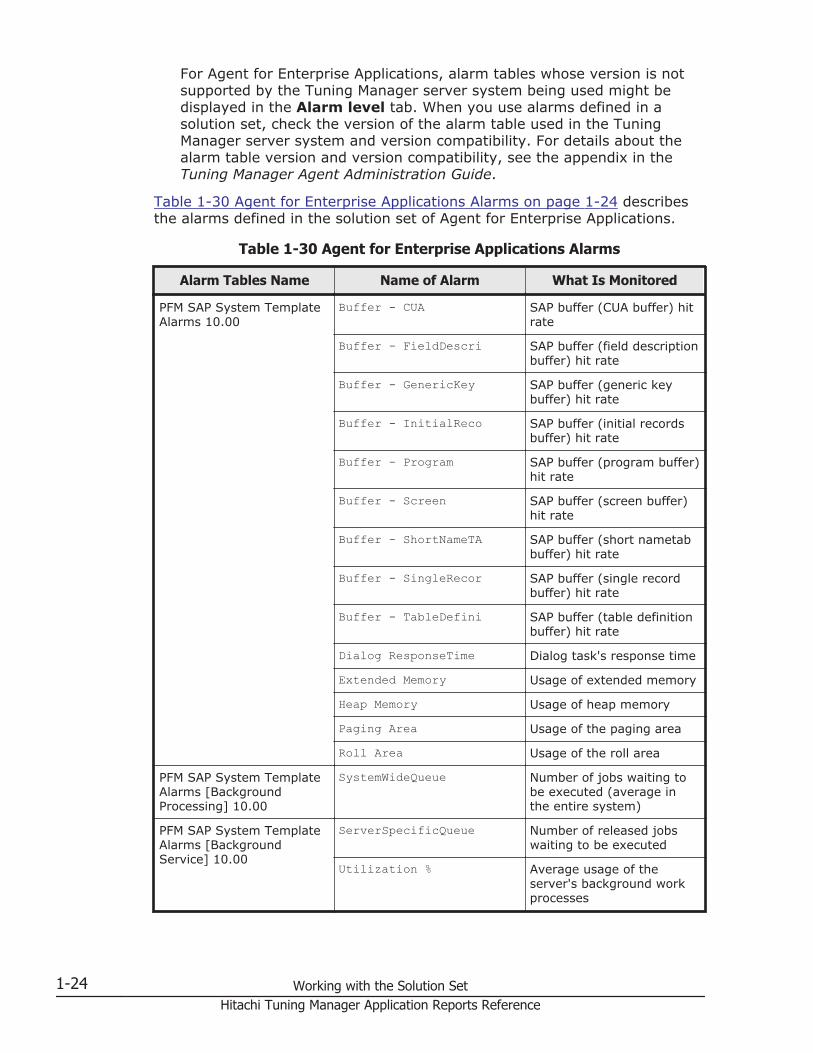
For Agent for Enterprise Applications, alarm tables whose version is notsupported by the Tuning Manager server system being used might bedisplayed in the Alarm level tab. When you use alarms defined in asolution set, check the version of the alarm table used in the TuningManager server system and version compatibility. For details about thealarm table version and version compatibility, see the appendix in theTuning Manager Agent Administration Guide.
Table 1-30 Agent for Enterprise Applications Alarms on page 1-24 describesthe alarms defined in the solution set of Agent for Enterprise Applications.
Table 1-30 Agent for Enterprise Applications Alarms
Alarm Tables Name Name of Alarm What Is Monitored
PFM SAP System TemplateAlarms 10.00
Buffer - CUA SAP buffer (CUA buffer) hitrate
Buffer - FieldDescri SAP buffer (field descriptionbuffer) hit rate
Buffer - GenericKey SAP buffer (generic keybuffer) hit rate
Buffer - InitialReco SAP buffer (initial recordsbuffer) hit rate
Buffer - Program SAP buffer (program buffer)hit rate
Buffer - Screen SAP buffer (screen buffer)hit rate
Buffer - ShortNameTA SAP buffer (short nametabbuffer) hit rate
Buffer - SingleRecor SAP buffer (single recordbuffer) hit rate
Buffer - TableDefini SAP buffer (table definitionbuffer) hit rate
Dialog ResponseTime Dialog task's response time
Extended Memory Usage of extended memory
Heap Memory Usage of heap memory
Paging Area Usage of the paging area
Roll Area Usage of the roll area
PFM SAP System TemplateAlarms [BackgroundProcessing] 10.00
SystemWideQueue Number of jobs waiting tobe executed (average inthe entire system)
PFM SAP System TemplateAlarms [BackgroundService] 10.00
ServerSpecificQueue Number of released jobswaiting to be executed
Utilization % Average usage of theserver's background workprocesses
1-24 Working with the Solution SetHitachi Tuning Manager Application Reports Reference
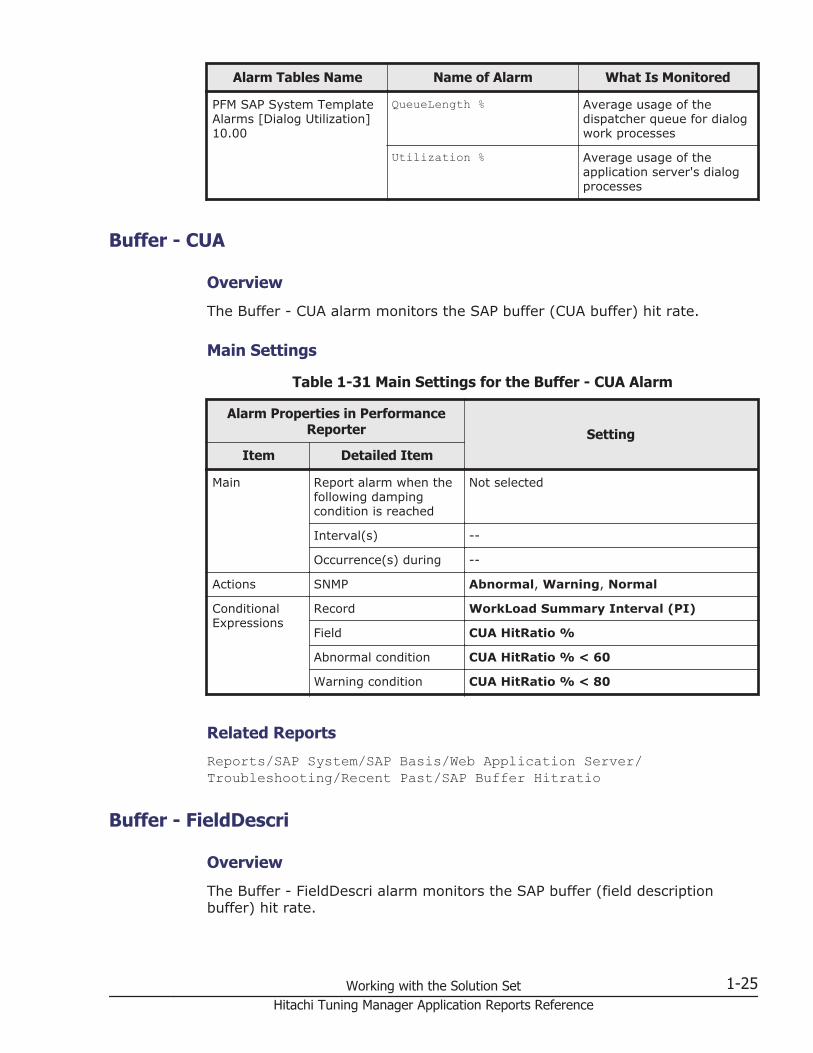
Alarm Tables Name Name of Alarm What Is Monitored
PFM SAP System TemplateAlarms [Dialog Utilization]10.00
QueueLength % Average usage of thedispatcher queue for dialogwork processes
Utilization % Average usage of theapplication server's dialogprocesses
Buffer - CUA
Overview
The Buffer - CUA alarm monitors the SAP buffer (CUA buffer) hit rate.
Main Settings
Table 1-31 Main Settings for the Buffer - CUA Alarm
Alarm Properties in PerformanceReporter Setting
Item Detailed Item
Main Report alarm when thefollowing dampingcondition is reached
Not selected
Interval(s) --
Occurrence(s) during --
Actions SNMP Abnormal, Warning, Normal
ConditionalExpressions
Record WorkLoad Summary Interval (PI)
Field CUA HitRatio %
Abnormal condition CUA HitRatio % < 60
Warning condition CUA HitRatio % < 80
Related Reports
Reports/SAP System/SAP Basis/Web Application Server/Troubleshooting/Recent Past/SAP Buffer Hitratio
Buffer - FieldDescri
Overview
The Buffer - FieldDescri alarm monitors the SAP buffer (field descriptionbuffer) hit rate.
Working with the Solution Set 1-25Hitachi Tuning Manager Application Reports Reference

Main Settings
Table 1-32 Main Settings for the Buffer - FieldDescri Alarm
Alarm Properties in PerformanceReporter Setting
Item Detailed Item
Main Report alarm when thefollowing dampingcondition is reached
Not selected
Interval(s) --
Occurrence(s) during --
Actions SNMP Abnormal, Warning, Normal
ConditionalExpressions
Record WorkLoad Summary Interval (PI)
Field FieldDescription HitRatio %
Abnormal condition FieldDescription HitRatio % < 60
Warning condition FieldDescription HitRatio % < 80
Related Reports
Reports/SAP System/SAP Basis/Web Application Server/Troubleshooting/Recent Past/SAP Buffer Hitratio
Buffer - GenericKey
Overview
The Buffer - GenericKey alarm monitors the SAP buffer (generic key buffer)hit rate.
Main Settings
Table 1-33 Main Settings for the Buffer - GenericKey Alarm
Alarm Properties in PerformanceReporter Setting
Item Detailed Item
Main Report alarm when thefollowing dampingcondition is reached
Not selected
Interval(s) --
Occurrence(s) during --
Actions SNMP Abnormal, Warning, Normal
1-26 Working with the Solution SetHitachi Tuning Manager Application Reports Reference
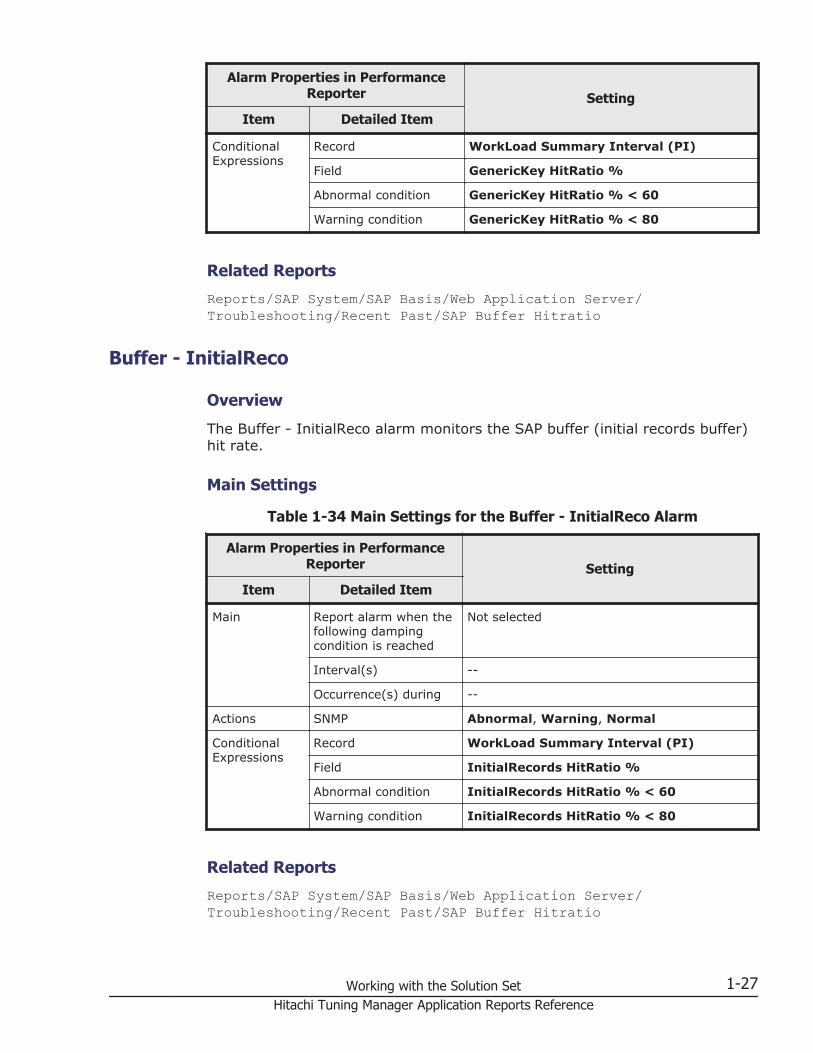
Alarm Properties in PerformanceReporter Setting
Item Detailed Item
ConditionalExpressions
Record WorkLoad Summary Interval (PI)
Field GenericKey HitRatio %
Abnormal condition GenericKey HitRatio % < 60
Warning condition GenericKey HitRatio % < 80
Related Reports
Reports/SAP System/SAP Basis/Web Application Server/Troubleshooting/Recent Past/SAP Buffer Hitratio
Buffer - InitialReco
Overview
The Buffer - InitialReco alarm monitors the SAP buffer (initial records buffer)hit rate.
Main Settings
Table 1-34 Main Settings for the Buffer - InitialReco Alarm
Alarm Properties in PerformanceReporter Setting
Item Detailed Item
Main Report alarm when thefollowing dampingcondition is reached
Not selected
Interval(s) --
Occurrence(s) during --
Actions SNMP Abnormal, Warning, Normal
ConditionalExpressions
Record WorkLoad Summary Interval (PI)
Field InitialRecords HitRatio %
Abnormal condition InitialRecords HitRatio % < 60
Warning condition InitialRecords HitRatio % < 80
Related Reports
Reports/SAP System/SAP Basis/Web Application Server/Troubleshooting/Recent Past/SAP Buffer Hitratio
Working with the Solution Set 1-27Hitachi Tuning Manager Application Reports Reference

Buffer - Program
Overview
The Buffer - Program alarm monitors the SAP buffer (program buffer) hitrate.
Main Settings
Table 1-35 Main Settings for the Buffer - Program Alarm
Alarm Properties in PerformanceReporter Setting
Item Detailed Item
Main Report alarm when thefollowing dampingcondition is reached
Not selected
Interval(s) --
Occurrence(s) during --
Actions SNMP Abnormal, Warning, Normal
ConditionalExpressions
Record WorkLoad Summary Interval (PI)
Field Program HitRatio %
Abnormal condition Program HitRatio % < 60
Warning condition Program HitRatio % < 80
Related Reports
Reports/SAP System/SAP Basis/Web Application Server/Troubleshooting/Recent Past/SAP Buffer Hitratio
Buffer - Screen
Overview
The Buffer - Screen alarm monitors the SAP buffer (screen buffer) hit rate.
1-28 Working with the Solution SetHitachi Tuning Manager Application Reports Reference

Main Settings
Table 1-36 Main Settings for the Buffer - Screen Alarm
Alarm Properties in PerformanceReporter Setting
Item Detailed Item
Main Report alarm when thefollowing dampingcondition is reached
Not selected
Interval(s) --
Occurrence(s) during --
Actions SNMP Abnormal, Warning, Normal
ConditionalExpressions
Record WorkLoad Summary Interval (PI)
Field Screen HitRatio %
Abnormal condition Screen HitRatio % < 60
Warning condition Screen HitRatio % < 80
Related Reports
Reports/SAP System/SAP Basis/Web Application Server/Troubleshooting/Recent Past/SAP Buffer Hitratio
Buffer - ShortNameTA
Overview
The Buffer - ShortNameTA alarm monitors the SAP buffer (short nametabbuffer) hit rate.
Main Settings
Table 1-37 Main Settings for the Buffer - ShortNameTA Alarm
Alarm Properties in PerformanceReporter Setting
Item Detailed Item
Main Report alarm when thefollowing dampingcondition is reached
Not selected
Interval(s) --
Occurrence(s) during --
Actions SNMP Abnormal, Warning, Normal
Working with the Solution Set 1-29Hitachi Tuning Manager Application Reports Reference

Alarm Properties in PerformanceReporter Setting
Item Detailed Item
ConditionalExpressions
Record WorkLoad Summary Interval (PI)
Field ShortNameTAB HitRatio %
Abnormal condition ShortNameTAB HitRatio % < 60
Warning condition ShortNameTAB HitRatio % < 80
Related Reports
Reports/SAP System/SAP Basis/Web Application Server/Troubleshooting/Recent Past/SAP Buffer Hitratio
Buffer - SingleRecor
Overview
The Buffer - SingleRecor alarm monitors the SAP buffer (single record buffer)hit rate.
Main Settings
Table 1-38 Main Settings for the Buffer - SingleRecor Alarm
Alarm Properties in PerformanceReporter Setting
Item Detailed Item
Main Report alarm when thefollowing dampingcondition is reached
Not selected
Interval(s) --
Occurrence(s) during --
Actions SNMP Abnormal, Warning, Normal
ConditionalExpressions
Record WorkLoad Summary Interval (PI)
Field SingleRecord HitRatio %
Abnormal condition SingleRecord HitRatio % < 60
Warning condition SingleRecord HitRatio % < 80
Related Reports
Reports/SAP System/SAP Basis/Web Application Server/Troubleshooting/Recent Past/SAP Buffer Hitratio
1-30 Working with the Solution SetHitachi Tuning Manager Application Reports Reference

Buffer - TableDefini
Overview
The Buffer - TableDefini alarm monitors the SAP buffer (table definitionbuffer) hit rate.
Main Settings
Table 1-39 Main Settings for the Buffer - TableDefini Alarm
Alarm Properties in PerformanceReporter Setting
Item Detailed Item
Main Report alarm when thefollowing dampingcondition is reached
Not selected
Interval(s) --
Occurrence(s) during --
Actions SNMP Abnormal, Warning, Normal
ConditionalExpressions
Record WorkLoad Summary Interval (PI)
Field TableDefinition HitRatio %
Abnormal condition TableDefinition HitRatio % < 60
Warning condition TableDefinition HitRatio % < 80
Related Reports
Reports/SAP System/SAP Basis/Web Application Server/Troubleshooting/Recent Past/SAP Buffer Hitratio
Dialog ResponseTime
Overview
The Dialog ResponseTime alarm monitors the dialog task's response time.
Working with the Solution Set 1-31Hitachi Tuning Manager Application Reports Reference
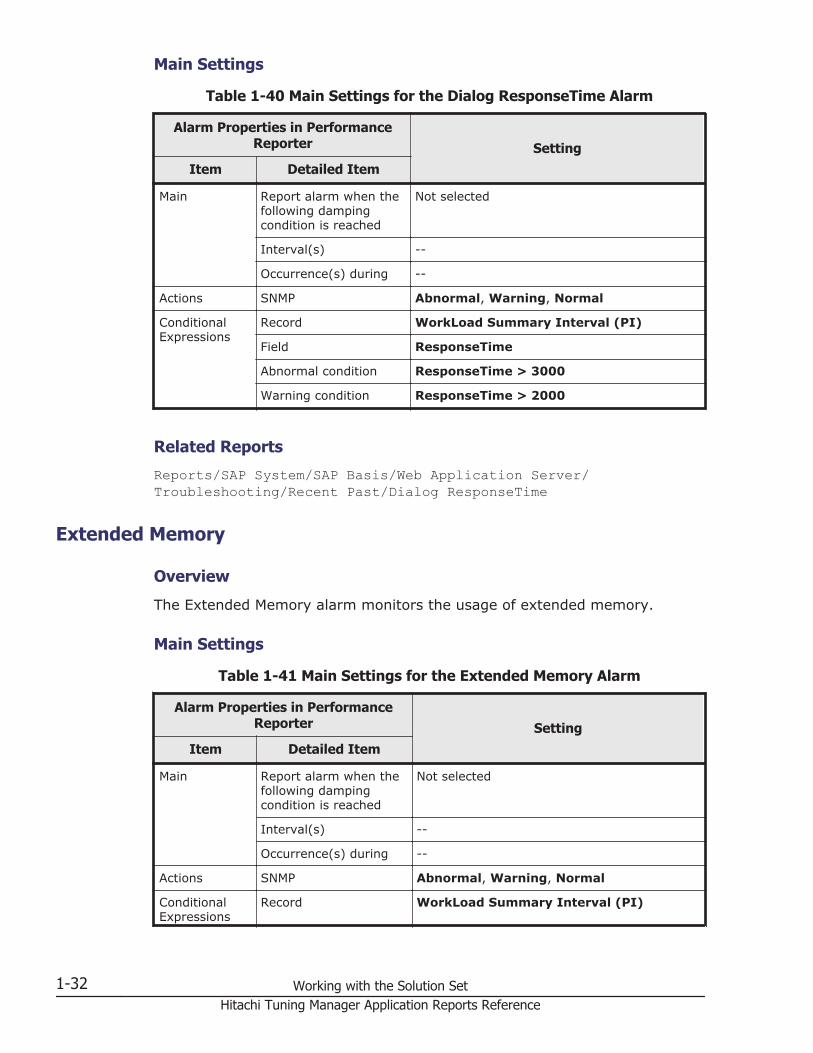
Main Settings
Table 1-40 Main Settings for the Dialog ResponseTime Alarm
Alarm Properties in PerformanceReporter Setting
Item Detailed Item
Main Report alarm when thefollowing dampingcondition is reached
Not selected
Interval(s) --
Occurrence(s) during --
Actions SNMP Abnormal, Warning, Normal
ConditionalExpressions
Record WorkLoad Summary Interval (PI)
Field ResponseTime
Abnormal condition ResponseTime > 3000
Warning condition ResponseTime > 2000
Related Reports
Reports/SAP System/SAP Basis/Web Application Server/Troubleshooting/Recent Past/Dialog ResponseTime
Extended Memory
Overview
The Extended Memory alarm monitors the usage of extended memory.
Main Settings
Table 1-41 Main Settings for the Extended Memory Alarm
Alarm Properties in PerformanceReporter Setting
Item Detailed Item
Main Report alarm when thefollowing dampingcondition is reached
Not selected
Interval(s) --
Occurrence(s) during --
Actions SNMP Abnormal, Warning, Normal
ConditionalExpressions
Record WorkLoad Summary Interval (PI)
1-32 Working with the Solution SetHitachi Tuning Manager Application Reports Reference

Alarm Properties in PerformanceReporter Setting
Item Detailed Item
Field EsAct %
Abnormal condition EsAct % > 95
Warning condition EsAct % > 80
Related Reports
Reports/SAP System/SAP Basis/Web Application Server/Troubleshooting/Recent Past/SAP Memory Used
Heap Memory
Overview
The Heap Memory alarm monitors the usage of heap memory.
Main Settings
Table 1-42 Main Settings for the Heap Memory Alarm
Alarm Properties in PerformanceReporter Setting
Item Detailed Item
Main Report alarm when thefollowing dampingcondition is reached
Not selected
Interval(s) --
Occurrence(s) during --
Actions SNMP Abnormal, Warning, Normal
ConditionalExpressions
Record WorkLoad Summary Interval (PI)
Field HeapAct %
Abnormal condition HeapAct % > 95
Warning condition HeapAct % > 80
Related Reports
Reports/SAP System/SAP Basis/Web Application Server/Troubleshooting/Recent Past/SAP Memory Used
Working with the Solution Set 1-33Hitachi Tuning Manager Application Reports Reference

Paging Area
Overview
The Paging Area alarm monitors the usage of paging area.
Main Settings
Table 1-43 Main Settings for the Paging Area Alarm
Alarm Properties in PerformanceReporter Setting
Item Detailed Item
Main Report alarm when thefollowing dampingcondition is reached
Not selected
Interval(s) --
Occurrence(s) during --
Actions SNMP Abnormal, Warning, Normal
ConditionalExpressions
Record WorkLoad Summary Interval (PI)
Field R3PagingUsed %
Abnormal condition R3PagingUsed % > 95
Warning condition R3PagingUsed % > 80
Related Reports
Reports/SAP System/SAP Basis/Web Application Server/Troubleshooting/Recent Past/SAP Memory Used
Roll Area
Overview
The Roll Area alarm monitors the usage of roll area.
1-34 Working with the Solution SetHitachi Tuning Manager Application Reports Reference

Main Settings
Table 1-44 Main Settings for the Roll Area Alarm
Alarm Properties in PerformanceReporter Setting
Item Detailed Item
Main Report alarm when thefollowing dampingcondition is reached
Not selected
Interval(s) --
Occurrence(s) during --
Actions SNMP Abnormal, Warning, Normal
ConditionalExpressions
Record WorkLoad Summary Interval (PI)
Field R3RollUsed %
Abnormal condition R3RollUsed % > 95
Warning condition R3RollUsed % > 80
Related Reports
Reports/SAP System/SAP Basis/Web Application Server/Troubleshooting/Recent Past/SAP Memory Used
SystemWideQueue
Overview
The SystemWideQueue alarm monitors the number of jobs waiting to beexecuted (average in the entire system).
Main Settings
Table 1-45 Main Settings for the SystemWideQueue Alarm
Alarm Properties in PerformanceReporter Setting
Item Detailed Item
Main Report alarm when thefollowing dampingcondition is reached
Not selected
Interval(s) --
Occurrence(s) during --
Actions SNMP Abnormal, Warning, Normal
Working with the Solution Set 1-35Hitachi Tuning Manager Application Reports Reference
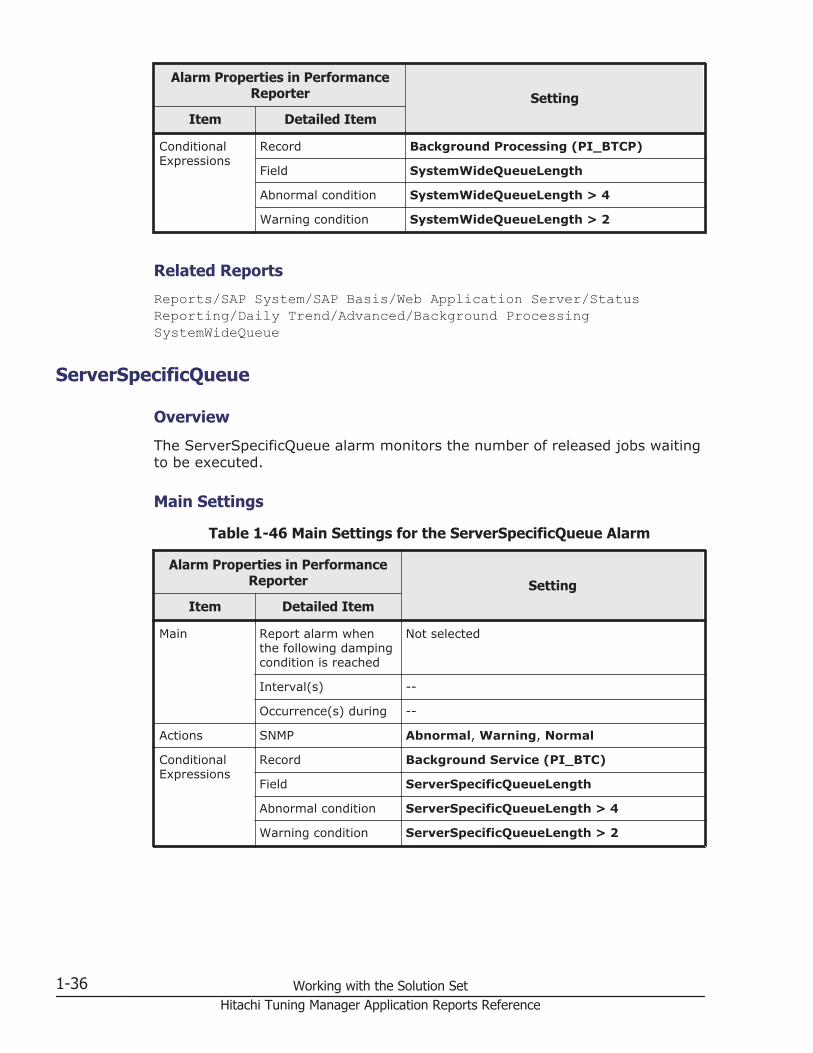
Alarm Properties in PerformanceReporter Setting
Item Detailed Item
ConditionalExpressions
Record Background Processing (PI_BTCP)
Field SystemWideQueueLength
Abnormal condition SystemWideQueueLength > 4
Warning condition SystemWideQueueLength > 2
Related Reports
Reports/SAP System/SAP Basis/Web Application Server/StatusReporting/Daily Trend/Advanced/Background ProcessingSystemWideQueue
ServerSpecificQueue
Overview
The ServerSpecificQueue alarm monitors the number of released jobs waitingto be executed.
Main Settings
Table 1-46 Main Settings for the ServerSpecificQueue Alarm
Alarm Properties in PerformanceReporter Setting
Item Detailed Item
Main Report alarm whenthe following dampingcondition is reached
Not selected
Interval(s) --
Occurrence(s) during --
Actions SNMP Abnormal, Warning, Normal
ConditionalExpressions
Record Background Service (PI_BTC)
Field ServerSpecificQueueLength
Abnormal condition ServerSpecificQueueLength > 4
Warning condition ServerSpecificQueueLength > 2
1-36 Working with the Solution SetHitachi Tuning Manager Application Reports Reference
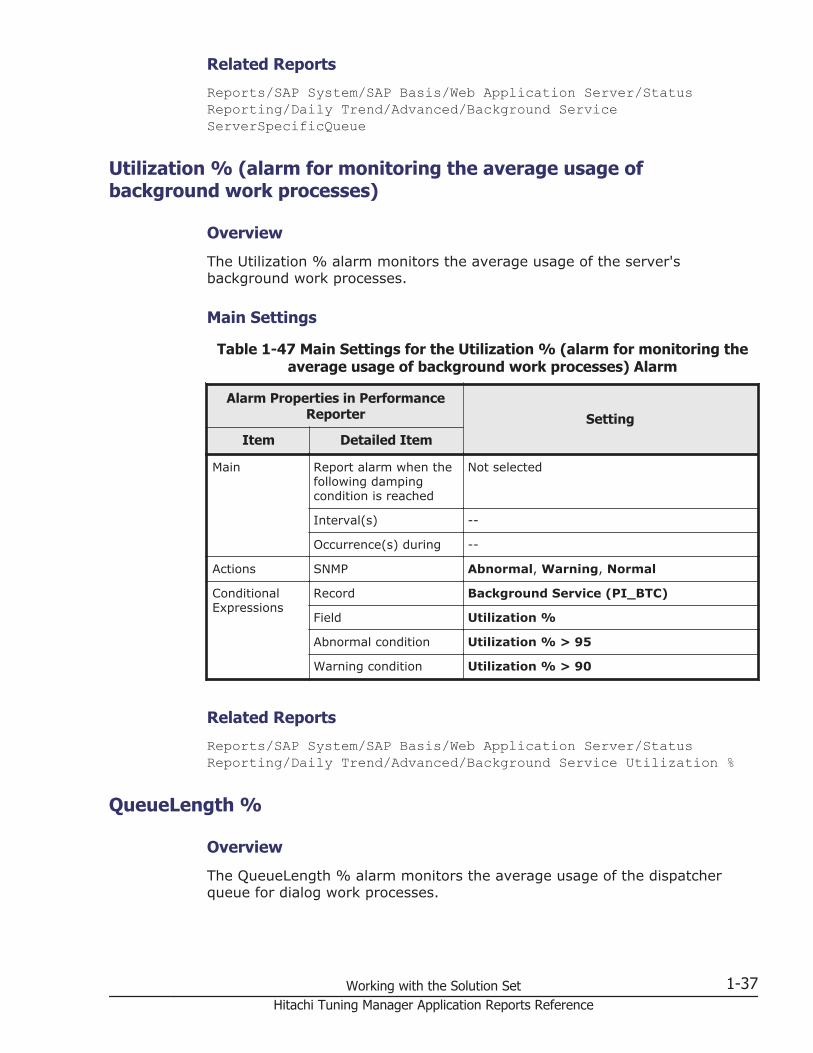
Related Reports
Reports/SAP System/SAP Basis/Web Application Server/StatusReporting/Daily Trend/Advanced/Background ServiceServerSpecificQueue
Utilization % (alarm for monitoring the average usage ofbackground work processes)
Overview
The Utilization % alarm monitors the average usage of the server'sbackground work processes.
Main Settings
Table 1-47 Main Settings for the Utilization % (alarm for monitoring theaverage usage of background work processes) Alarm
Alarm Properties in PerformanceReporter Setting
Item Detailed Item
Main Report alarm when thefollowing dampingcondition is reached
Not selected
Interval(s) --
Occurrence(s) during --
Actions SNMP Abnormal, Warning, Normal
ConditionalExpressions
Record Background Service (PI_BTC)
Field Utilization %
Abnormal condition Utilization % > 95
Warning condition Utilization % > 90
Related Reports
Reports/SAP System/SAP Basis/Web Application Server/StatusReporting/Daily Trend/Advanced/Background Service Utilization %
QueueLength %
Overview
The QueueLength % alarm monitors the average usage of the dispatcherqueue for dialog work processes.
Working with the Solution Set 1-37Hitachi Tuning Manager Application Reports Reference
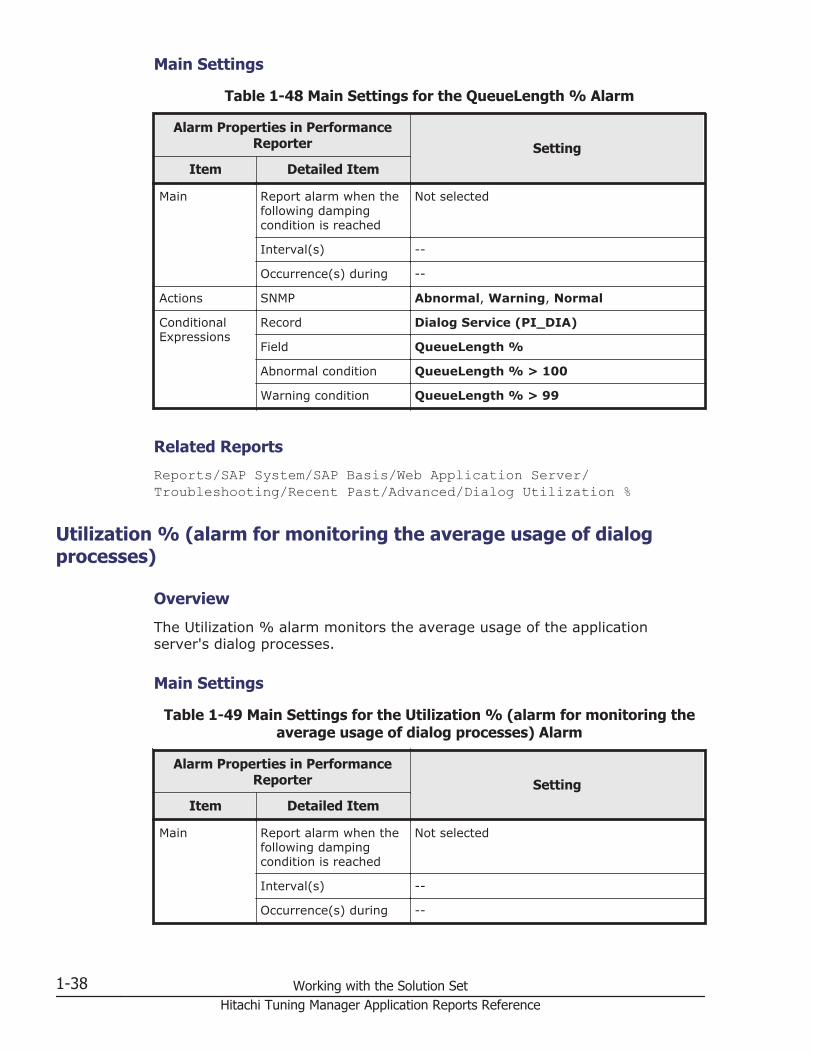
Main Settings
Table 1-48 Main Settings for the QueueLength % Alarm
Alarm Properties in PerformanceReporter Setting
Item Detailed Item
Main Report alarm when thefollowing dampingcondition is reached
Not selected
Interval(s) --
Occurrence(s) during --
Actions SNMP Abnormal, Warning, Normal
ConditionalExpressions
Record Dialog Service (PI_DIA)
Field QueueLength %
Abnormal condition QueueLength % > 100
Warning condition QueueLength % > 99
Related Reports
Reports/SAP System/SAP Basis/Web Application Server/Troubleshooting/Recent Past/Advanced/Dialog Utilization %
Utilization % (alarm for monitoring the average usage of dialogprocesses)
Overview
The Utilization % alarm monitors the average usage of the applicationserver's dialog processes.
Main Settings
Table 1-49 Main Settings for the Utilization % (alarm for monitoring theaverage usage of dialog processes) Alarm
Alarm Properties in PerformanceReporter Setting
Item Detailed Item
Main Report alarm when thefollowing dampingcondition is reached
Not selected
Interval(s) --
Occurrence(s) during --
1-38 Working with the Solution SetHitachi Tuning Manager Application Reports Reference

Alarm Properties in PerformanceReporter Setting
Item Detailed Item
Actions SNMP Abnormal, Warning, Normal
ConditionalExpressions
Record Dialog Service (PI_DIA)
Field Utilization %
Abnormal condition Utilization % > 100
Warning condition Utilization % > 99
Related Reports
Reports/SAP System/SAP Basis/Web Application Server/Troubleshooting/Recent Past/Advanced/Dialog Utilization %
Format of Report ExplanationsThis section describes the format that is used to explain reports. The manuallists the reports in alphabetical order.
Report Name
Indicates the report name of a solution set. If a number (such as (6.0)) isadded to the end of a report name, this number indicates the version numberof the data model being used by the report. This means that only the Agentswhose data model version is equal to or later than this number can use thereport. For details about the data model version, see Data Model Version onpage 2-2.
Reports with names that include (Multi-Agent) display information aboutmultiple instances.
Reports with names that do not include (Multi-Agent) display informationabout a single instance.
Overview
Provides an overview of the information that can be displayed in the report.
Storage Location
Indicates the storage location of the report.
Record
Indicates the record that contains the performance data used in the report.To display a historical report, you must specify information in advance inorder to collect the record indicated in this column. Before displaying a
Working with the Solution Set 1-39Hitachi Tuning Manager Application Reports Reference
report, display the Agent properties in the Agents window of PerformanceReporter, and make sure that Log is set to Yes for this record. For a real-time report, you do not need to set it.
Note: The maximum number of records that can be displayed in a report isset in advance. For details about how to change the maximum number ofrecords that can be displayed, see the chapter that describes how to createuser-defined reports in the Tuning Manager User Guide.
Fields
Describes the fields used in the report.
Drilldown Reports (Report Level)
Lists other reports in the solution set that are related to this report. Fordetails about how to display a drilldown report, see the chapter that describeshow to create user-defined reports in the Tuning Manager User Guide. Note:Some reports and Agents do not have any drilldown reports.
Drilldown Reports (Field Level)
Describes reports in the solution set that are associated with fields used inthis report. For details about how to display a drilldown report, see thechapter that describes how to create user-defined reports in the TuningManager User Guide. Note: Some reports and Agents do not have anydrilldown reports.
Organization of Report FoldersListed below is a description of each folder:
• Monthly Trend folderThis folder contains reports that display daily information for the pastmonth. Use the reports in this folder to check monthly trends in thesystem.
• Status Reporting folderThis folder contains a report displaying information compiled for each day.Use this folder to check the overall status of the system. In addition, real-time reports as well as historical reports can be displayed.
¢ Daily Trend folderThe report containing hourly information over the past 24 hours isstored in this folder. Use the reports in this folder to check the dailystatus of the system.
¢ Real-Time folderThis folder contains real-time reports for checking the current statusof the system.
• Troubleshooting folder
1-40 Working with the Solution SetHitachi Tuning Manager Application Reports Reference

This folder contains reports showing useful information for resolvingproblems. In the event of a system problem, use the reports in this folderto check the cause of the problem.
¢ Real-Time folderThis folder contains real-time reports for checking the current statusof the monitored system.
¢ Recent Past folderThis folder contains historical reports showing the cumulative dataevery minute in the last hour.
Also, some of the folders might contain the following subordinate folders,depending on the folders above each:
• Advanced folderThis folder contains reports that use records for which Log is set to No bydefault. To display any of these reports, you must use PerformanceReporter to change the record setting so that Log is set to Yes.
• Drilldown Only folderThis folder contains reports that are displayed as drilldown reports (fieldlevel). Use it to display detailed information about the fields contained inthe applicable report.
The following are examples of the organization of report folders for eachAgent. Angle brackets (< >) enclose folder names.
Agent for Oracle<Oracle> +-- <Monthly Trend> | +-- Cache Usage Trend(Multi-Agent)(8.0) | +-- Database Activity Trend(Multi-Agent)(8.0) | +-- <Advanced> | +-- Database Space Trend(Multi-Agent)(8.0) | +-- Datafile I/O Trend Summary(8.0) | +-- SGA Status Summary(8.0) | +-- <Drilldown Only> | +-- Datafile I/O Trend Detail(Reads)(8.0) | +-- Datafile I/O Trend Detail(Writes)(8.0) +-- <Status Reporting> | +-- <Daily Trend> | | +-- Cache Usage Status(Multi-Agent)(8.0) | | +-- Database Activity Status(Multi-Agent)(8.0) | | +-- <Advanced> | | +-- Database Space Summary(Multi-Agent)(8.0) | | +-- Datafile I/O Status Summary(8.0) | | +-- <Drilldown Only> | | +-- Datafile I/O Status Detail(Reads)(8.0) | | +-- Datafile I/O Status Detail(Writes)(8.0) | +-- <Real-Time> | +-- Database Activity Status(8.0) | +-- Database Space Overview(8.0) | +-- Server Configuration Status(4.0) | +-- SGA Status(8.0) | +-- System Overview(8.0)
Working with the Solution Set 1-41Hitachi Tuning Manager Application Reports Reference
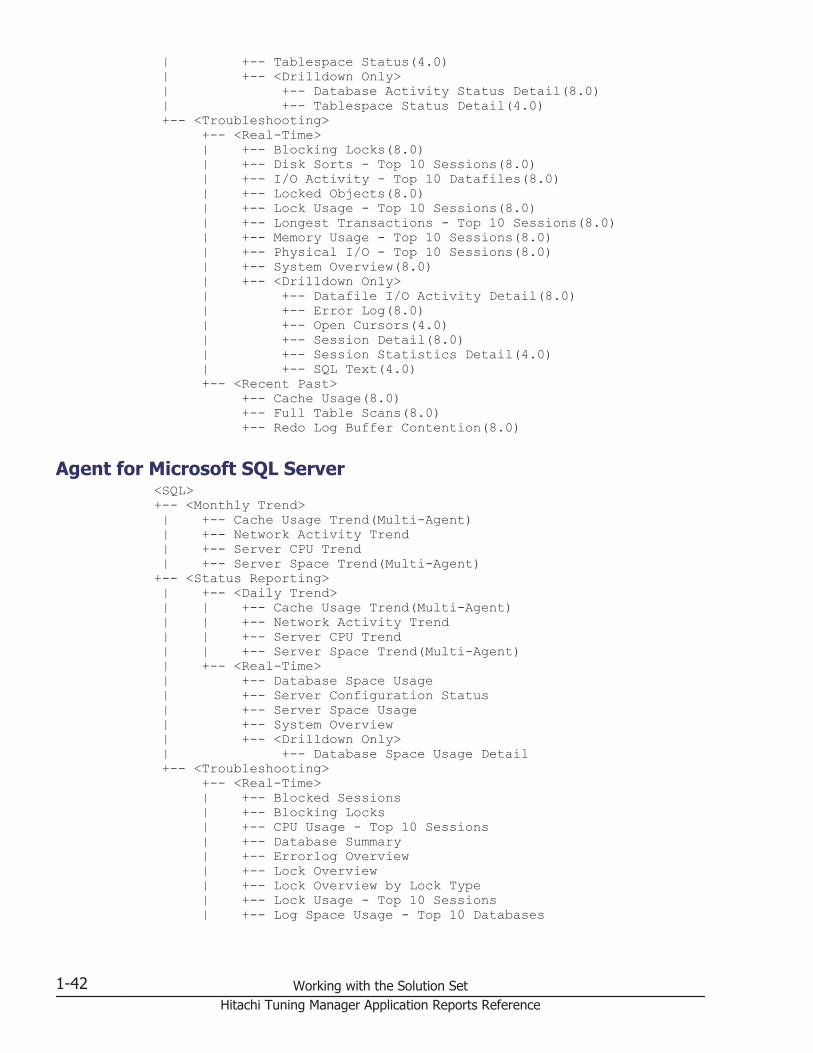
| +-- Tablespace Status(4.0) | +-- <Drilldown Only> | +-- Database Activity Status Detail(8.0) | +-- Tablespace Status Detail(4.0) +-- <Troubleshooting> +-- <Real-Time> | +-- Blocking Locks(8.0) | +-- Disk Sorts - Top 10 Sessions(8.0) | +-- I/O Activity - Top 10 Datafiles(8.0) | +-- Locked Objects(8.0) | +-- Lock Usage - Top 10 Sessions(8.0) | +-- Longest Transactions - Top 10 Sessions(8.0) | +-- Memory Usage - Top 10 Sessions(8.0) | +-- Physical I/O - Top 10 Sessions(8.0) | +-- System Overview(8.0) | +-- <Drilldown Only> | +-- Datafile I/O Activity Detail(8.0) | +-- Error Log(8.0) | +-- Open Cursors(4.0) | +-- Session Detail(8.0) | +-- Session Statistics Detail(4.0) | +-- SQL Text(4.0) +-- <Recent Past> +-- Cache Usage(8.0) +-- Full Table Scans(8.0) +-- Redo Log Buffer Contention(8.0)
Agent for Microsoft SQL Server<SQL>+-- <Monthly Trend> | +-- Cache Usage Trend(Multi-Agent) | +-- Network Activity Trend | +-- Server CPU Trend | +-- Server Space Trend(Multi-Agent)+-- <Status Reporting> | +-- <Daily Trend> | | +-- Cache Usage Trend(Multi-Agent) | | +-- Network Activity Trend | | +-- Server CPU Trend | | +-- Server Space Trend(Multi-Agent) | +-- <Real-Time> | +-- Database Space Usage | +-- Server Configuration Status | +-- Server Space Usage | +-- System Overview | +-- <Drilldown Only> | +-- Database Space Usage Detail +-- <Troubleshooting> +-- <Real-Time> | +-- Blocked Sessions | +-- Blocking Locks | +-- CPU Usage - Top 10 Sessions | +-- Database Summary | +-- Errorlog Overview | +-- Lock Overview | +-- Lock Overview by Lock Type | +-- Lock Usage - Top 10 Sessions | +-- Log Space Usage - Top 10 Databases
1-42 Working with the Solution SetHitachi Tuning Manager Application Reports Reference
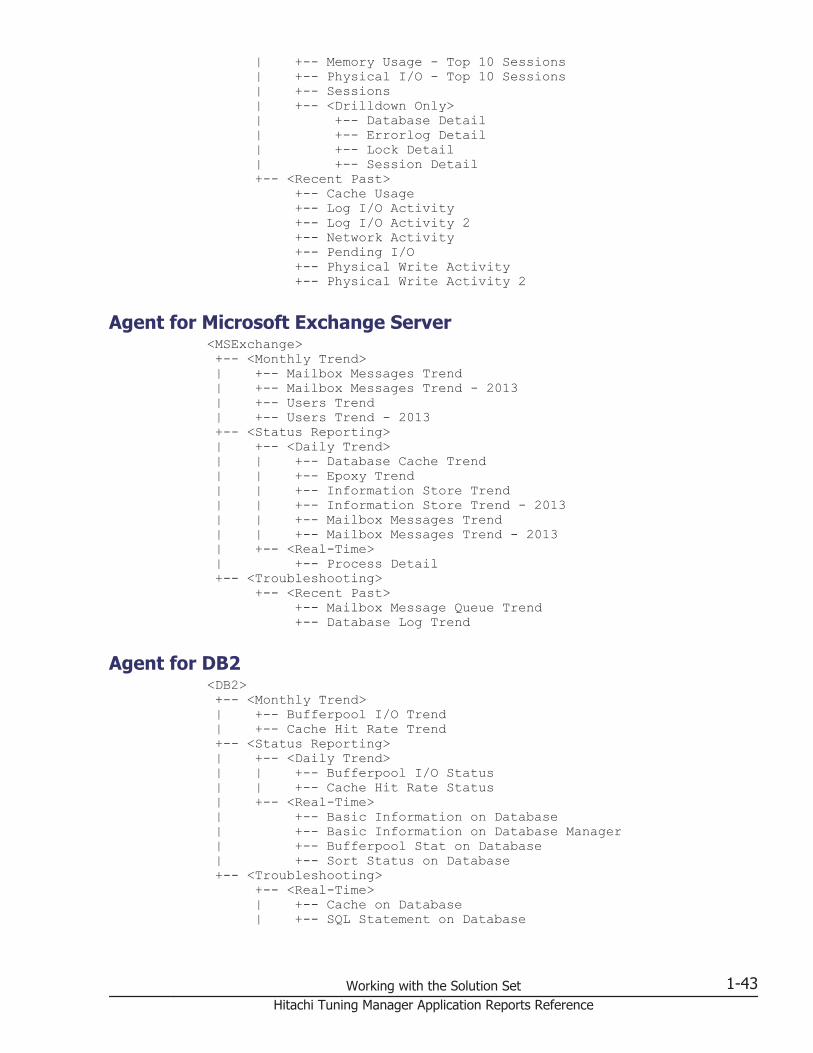
| +-- Memory Usage - Top 10 Sessions | +-- Physical I/O - Top 10 Sessions | +-- Sessions | +-- <Drilldown Only> | +-- Database Detail | +-- Errorlog Detail | +-- Lock Detail | +-- Session Detail +-- <Recent Past> +-- Cache Usage +-- Log I/O Activity +-- Log I/O Activity 2 +-- Network Activity +-- Pending I/O +-- Physical Write Activity +-- Physical Write Activity 2
Agent for Microsoft Exchange Server<MSExchange> +-- <Monthly Trend> | +-- Mailbox Messages Trend | +-- Mailbox Messages Trend - 2013 | +-- Users Trend | +-- Users Trend - 2013 +-- <Status Reporting> | +-- <Daily Trend> | | +-- Database Cache Trend | | +-- Epoxy Trend | | +-- Information Store Trend | | +-- Information Store Trend - 2013 | | +-- Mailbox Messages Trend | | +-- Mailbox Messages Trend - 2013 | +-- <Real-Time> | +-- Process Detail +-- <Troubleshooting> +-- <Recent Past> +-- Mailbox Message Queue Trend +-- Database Log Trend
Agent for DB2<DB2> +-- <Monthly Trend> | +-- Bufferpool I/O Trend | +-- Cache Hit Rate Trend +-- <Status Reporting> | +-- <Daily Trend> | | +-- Bufferpool I/O Status | | +-- Cache Hit Rate Status | +-- <Real-Time> | +-- Basic Information on Database | +-- Basic Information on Database Manager | +-- Bufferpool Stat on Database | +-- Sort Status on Database +-- <Troubleshooting> +-- <Real-Time> | +-- Cache on Database | +-- SQL Statement on Database
Working with the Solution Set 1-43Hitachi Tuning Manager Application Reports Reference
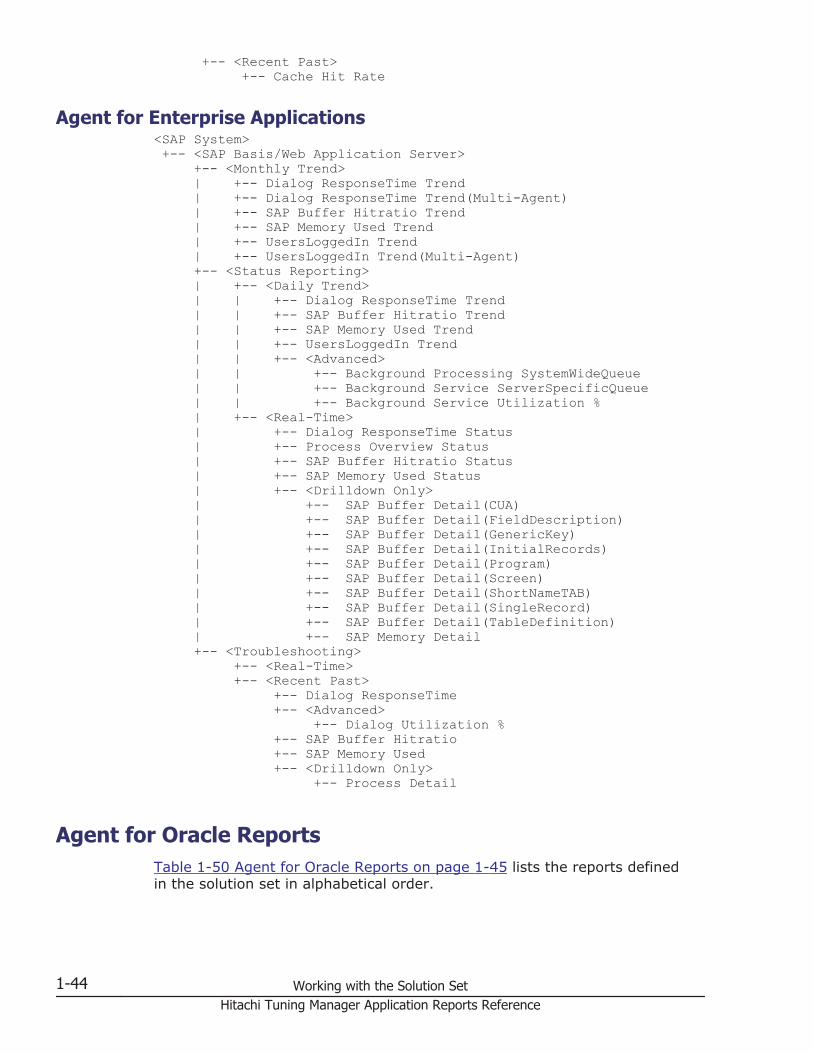
+-- <Recent Past> +-- Cache Hit Rate
Agent for Enterprise Applications<SAP System> +-- <SAP Basis/Web Application Server> +-- <Monthly Trend> | +-- Dialog ResponseTime Trend | +-- Dialog ResponseTime Trend(Multi-Agent) | +-- SAP Buffer Hitratio Trend | +-- SAP Memory Used Trend | +-- UsersLoggedIn Trend | +-- UsersLoggedIn Trend(Multi-Agent) +-- <Status Reporting> | +-- <Daily Trend> | | +-- Dialog ResponseTime Trend | | +-- SAP Buffer Hitratio Trend | | +-- SAP Memory Used Trend | | +-- UsersLoggedIn Trend | | +-- <Advanced> | | +-- Background Processing SystemWideQueue | | +-- Background Service ServerSpecificQueue | | +-- Background Service Utilization % | +-- <Real-Time> | +-- Dialog ResponseTime Status | +-- Process Overview Status | +-- SAP Buffer Hitratio Status | +-- SAP Memory Used Status | +-- <Drilldown Only> | +-- SAP Buffer Detail(CUA) | +-- SAP Buffer Detail(FieldDescription) | +-- SAP Buffer Detail(GenericKey) | +-- SAP Buffer Detail(InitialRecords) | +-- SAP Buffer Detail(Program) | +-- SAP Buffer Detail(Screen) | +-- SAP Buffer Detail(ShortNameTAB) | +-- SAP Buffer Detail(SingleRecord) | +-- SAP Buffer Detail(TableDefinition) | +-- SAP Memory Detail +-- <Troubleshooting> +-- <Real-Time> +-- <Recent Past> +-- Dialog ResponseTime +-- <Advanced> +-- Dialog Utilization % +-- SAP Buffer Hitratio +-- SAP Memory Used +-- <Drilldown Only> +-- Process Detail
Agent for Oracle ReportsTable 1-50 Agent for Oracle Reports on page 1-45 lists the reports definedin the solution set in alphabetical order.
1-44 Working with the Solution SetHitachi Tuning Manager Application Reports Reference

Table 1-50 Agent for Oracle Reports
Report Name DisplayedInformation Storage Location
BlockingLocks(8.0)
Session that includesa lock that placesanother session inwait status
Reports/Oracle/Troubleshooting/Real-Time/
Cache Usage(8.0) Buffer cache usagefor each minute overthe past hour
Reports/Oracle/Troubleshooting/RecentPast/
Cache UsageStatus(Multi-Agent)(8.0)
Summary of thebuffer cache usagefor multiple agentsfor each hour overthe past 24 hours
Reports/Oracle/Status Reporting/DailyTrend/
Cache UsageTrend(Multi-Agent)(8.0)
Summary of thebuffer cache usagefor multiple agentsfor each day overthe past month
Reports/Oracle/Monthly Trend/
Database ActivityStatus(8.0)
Status of databaseactivity
Reports/Oracle/Status Reporting/Real-Time/
Database ActivityStatusDetail(8.0)
Details about statusof database activity
Reports/Oracle/Status Reporting/Real-Time/Drilldown Only/
Database ActivityStatus(Multi-Agent)(8.0)
I/O statistics ondatabase instancesfor multiple agentsfor each hour overthe past 24 hours
Reports/Oracle/Status Reporting/DailyTrend/
Database ActivityTrend(Multi-Agent)(8.0)
Summary of I/Oprocessing formultiple agents foreach day over thepast month
Reports/Oracle/Monthly Trend/
Database SpaceOverview(8.0)
Performance dataand generaldatabase informationon tablespaces anddata files
Reports/Oracle/Status Reporting/Real-Time/
Database SpaceSummary(Multi-Agent)(8.0)
Summary of spaceusage for multipleagents at theinstance level foreach hour over thepast 24 hours
Reports/Oracle/Status Reporting/DailyTrend/Advanced/
Database SpaceTrend(Multi-Agent)(8.0)
Summary of spaceusage for instancesof multiple agents
Reports/Oracle/Monthly Trend/Advanced/
Working with the Solution Set 1-45Hitachi Tuning Manager Application Reports Reference
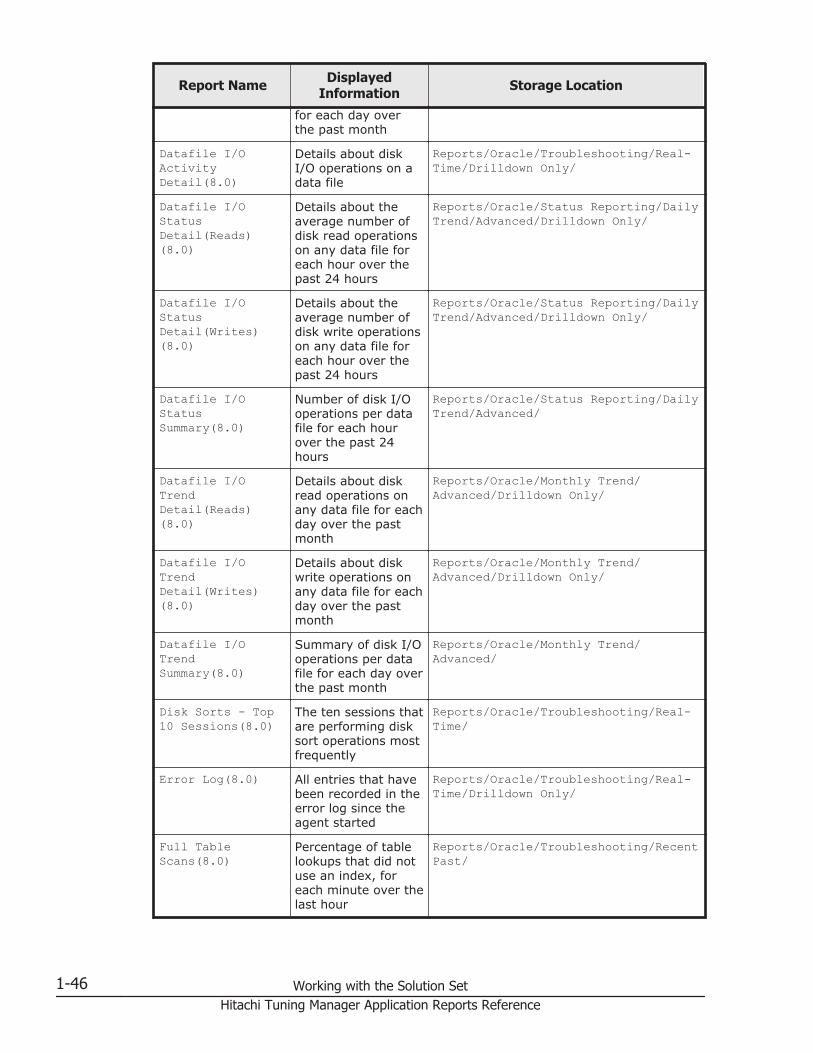
Report Name DisplayedInformation Storage Location
for each day overthe past month
Datafile I/OActivityDetail(8.0)
Details about diskI/O operations on adata file
Reports/Oracle/Troubleshooting/Real-Time/Drilldown Only/
Datafile I/OStatusDetail(Reads)(8.0)
Details about theaverage number ofdisk read operationson any data file foreach hour over thepast 24 hours
Reports/Oracle/Status Reporting/DailyTrend/Advanced/Drilldown Only/
Datafile I/OStatusDetail(Writes)(8.0)
Details about theaverage number ofdisk write operationson any data file foreach hour over thepast 24 hours
Reports/Oracle/Status Reporting/DailyTrend/Advanced/Drilldown Only/
Datafile I/OStatusSummary(8.0)
Number of disk I/Ooperations per datafile for each hourover the past 24hours
Reports/Oracle/Status Reporting/DailyTrend/Advanced/
Datafile I/OTrendDetail(Reads)(8.0)
Details about diskread operations onany data file for eachday over the pastmonth
Reports/Oracle/Monthly Trend/Advanced/Drilldown Only/
Datafile I/OTrendDetail(Writes)(8.0)
Details about diskwrite operations onany data file for eachday over the pastmonth
Reports/Oracle/Monthly Trend/Advanced/Drilldown Only/
Datafile I/OTrendSummary(8.0)
Summary of disk I/Ooperations per datafile for each day overthe past month
Reports/Oracle/Monthly Trend/Advanced/
Disk Sorts - Top10 Sessions(8.0)
The ten sessions thatare performing disksort operations mostfrequently
Reports/Oracle/Troubleshooting/Real-Time/
Error Log(8.0) All entries that havebeen recorded in theerror log since theagent started
Reports/Oracle/Troubleshooting/Real-Time/Drilldown Only/
Full TableScans(8.0)
Percentage of tablelookups that did notuse an index, foreach minute over thelast hour
Reports/Oracle/Troubleshooting/RecentPast/
1-46 Working with the Solution SetHitachi Tuning Manager Application Reports Reference
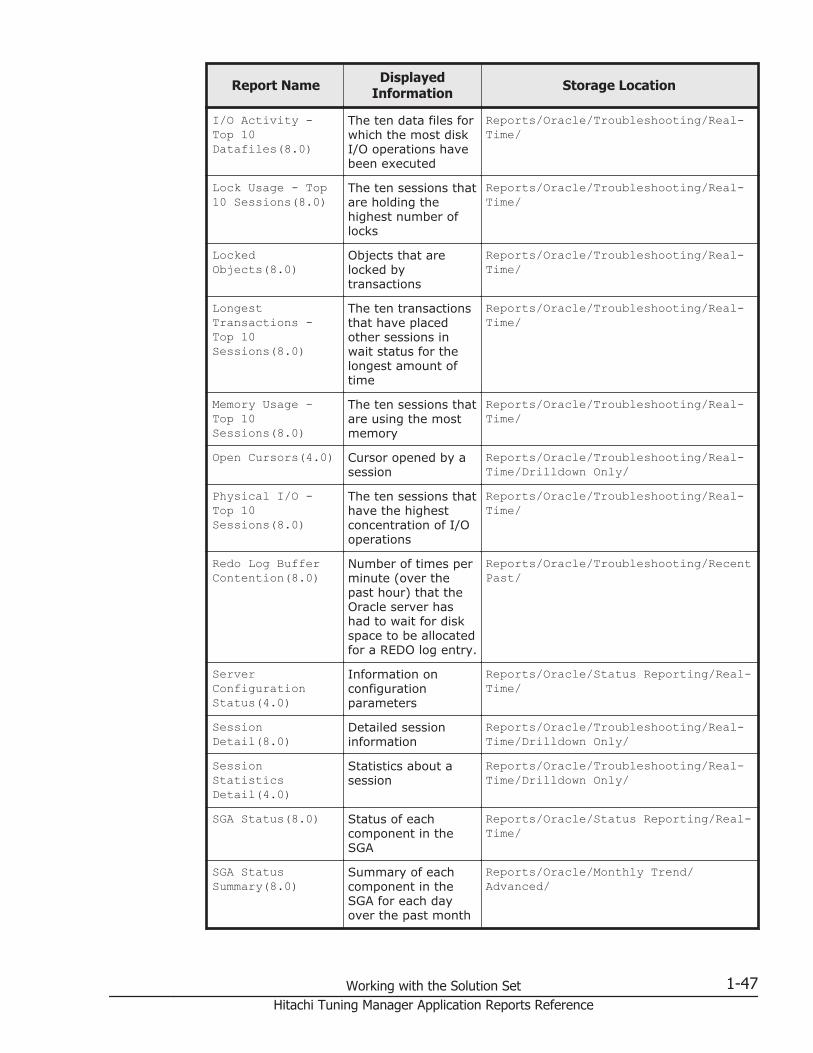
Report Name DisplayedInformation Storage Location
I/O Activity -Top 10Datafiles(8.0)
The ten data files forwhich the most diskI/O operations havebeen executed
Reports/Oracle/Troubleshooting/Real-Time/
Lock Usage - Top10 Sessions(8.0)
The ten sessions thatare holding thehighest number oflocks
Reports/Oracle/Troubleshooting/Real-Time/
LockedObjects(8.0)
Objects that arelocked bytransactions
Reports/Oracle/Troubleshooting/Real-Time/
LongestTransactions -Top 10Sessions(8.0)
The ten transactionsthat have placedother sessions inwait status for thelongest amount oftime
Reports/Oracle/Troubleshooting/Real-Time/
Memory Usage -Top 10Sessions(8.0)
The ten sessions thatare using the mostmemory
Reports/Oracle/Troubleshooting/Real-Time/
Open Cursors(4.0) Cursor opened by asession
Reports/Oracle/Troubleshooting/Real-Time/Drilldown Only/
Physical I/O -Top 10Sessions(8.0)
The ten sessions thathave the highestconcentration of I/Ooperations
Reports/Oracle/Troubleshooting/Real-Time/
Redo Log BufferContention(8.0)
Number of times perminute (over thepast hour) that theOracle server hashad to wait for diskspace to be allocatedfor a REDO log entry.
Reports/Oracle/Troubleshooting/RecentPast/
ServerConfigurationStatus(4.0)
Information onconfigurationparameters
Reports/Oracle/Status Reporting/Real-Time/
SessionDetail(8.0)
Detailed sessioninformation
Reports/Oracle/Troubleshooting/Real-Time/Drilldown Only/
SessionStatisticsDetail(4.0)
Statistics about asession
Reports/Oracle/Troubleshooting/Real-Time/Drilldown Only/
SGA Status(8.0) Status of eachcomponent in theSGA
Reports/Oracle/Status Reporting/Real-Time/
SGA StatusSummary(8.0)
Summary of eachcomponent in theSGA for each dayover the past month
Reports/Oracle/Monthly Trend/Advanced/
Working with the Solution Set 1-47Hitachi Tuning Manager Application Reports Reference

Report Name DisplayedInformation Storage Location
SQL Text(4.0) Performance data forthe SQL Text andExplain Plan fields
Reports/Oracle/Troubleshooting/Real-Time/Drilldown Only/
SystemOverview(8.0)(Real-Time Rpt onthe Overall Status ofInstance)
Main performancedata indicating theoverall status of aninstance
Reports/Oracle/Status Reporting/Real-Time/
SystemOverview(8.0)(Real-Time Rpt onthe General Statusof Instance)
Performance dataindicating thegeneral status of aninstance
Reports/Oracle/Troubleshooting/Real-Time/
TablespaceStatus(4.0)
Status of alltablespaces in thedatabase
Reports/Oracle/Status Reporting/Real-Time/
Tablespace StatusDetail(4.0)
Details about aspecified tablespace
Reports/Oracle/Status Reporting/Real-Time/Drilldown Only/
Blocking Locks(8.0)
Overview
The Blocking Locks(8.0) report displays real-time information about a sessionthat includes a lock that places another session in wait status. If you cannotdisplay this report, create Oracle's static dictionary view DBA_WAITERS. Youcan create DBA_WAITERS by executing the CATBLOCK.SQL script that isprovided by Oracle.
Agent for Oracle does not display this report if the Oracle Database does nothave enough performance data to display the report.
Storage LocationReports/Oracle/Troubleshooting/Real-Time/
Record
Lock Waiters (PD_PDLW)
Fields
Field Name Description
Holding Session Session identifier that has the lock. To display the LockedObjects(8.0) report, choose this field.
1-48 Working with the Solution SetHitachi Tuning Manager Application Reports Reference

Field Name Description
Holding User Name of the user that has the lock
Mode Held Lock mode held during data collection
Mode Requested Lock mode requested during data collection
Waiting Session Session identifier waiting for lock release. To display theSession Detail(8.0) report, choose this field.
Waiting User Name of the user waiting for the lock to be released
Drilldown Report (Report Level)
Report Name Description
Longest Transactions -Top 10 Sessions(8.0)
Displays the ten transactions that have placed othersessions in wait status for the longest amount of time.
Drilldown Report (Field Level)
Report Name Description
Locked Objects(8.0) Displays the objects that are locked by thesession. To display this report, choose theHolding Session field.
Session Detail(8.0) Displays detailed information about thesession. To display this report, choose theWaiting Session field.
Cache Usage(8.0)
Overview
The Cache Usage(8.0) report displays the buffer cache usage for each minuteover the past hour.
Storage LocationReports/Oracle/Troubleshooting/Recent Past/
Record
System Stat Summary Interval (PI)
Fields
Field Name Description
Cache Hit % Buffer cache usage
Working with the Solution Set 1-49Hitachi Tuning Manager Application Reports Reference
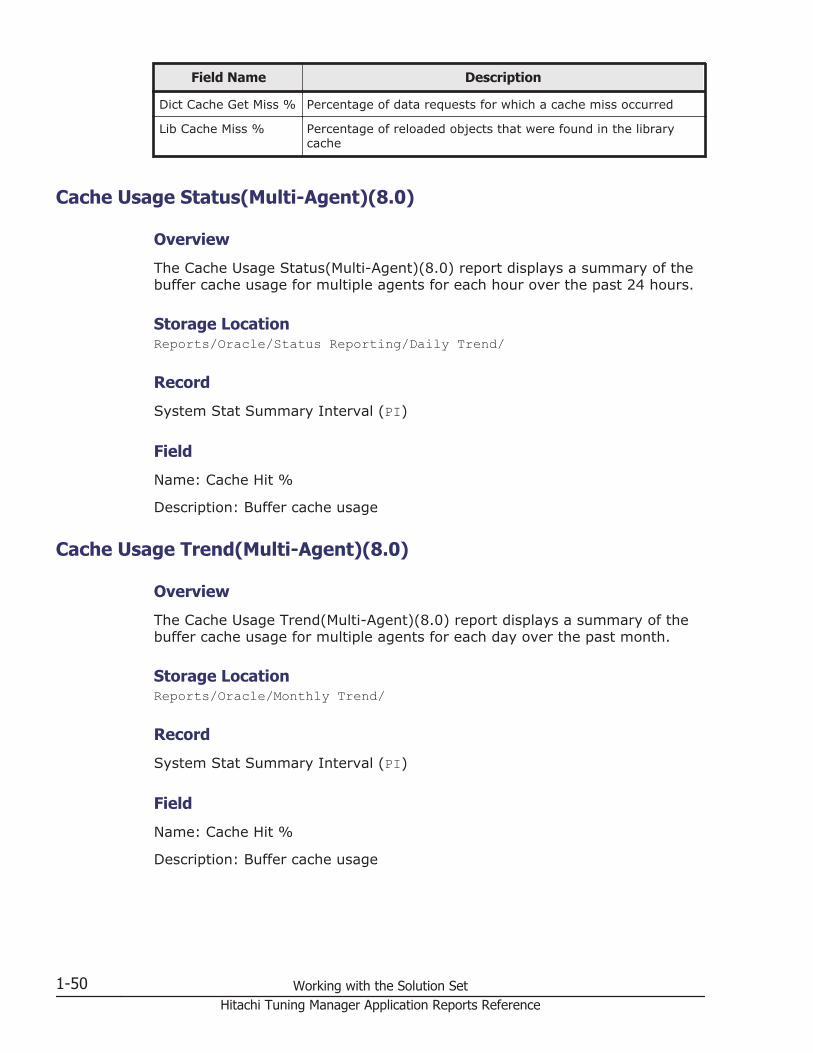
Field Name Description
Dict Cache Get Miss % Percentage of data requests for which a cache miss occurred
Lib Cache Miss % Percentage of reloaded objects that were found in the librarycache
Cache Usage Status(Multi-Agent)(8.0)
Overview
The Cache Usage Status(Multi-Agent)(8.0) report displays a summary of thebuffer cache usage for multiple agents for each hour over the past 24 hours.
Storage LocationReports/Oracle/Status Reporting/Daily Trend/
Record
System Stat Summary Interval (PI)
Field
Name: Cache Hit %
Description: Buffer cache usage
Cache Usage Trend(Multi-Agent)(8.0)
Overview
The Cache Usage Trend(Multi-Agent)(8.0) report displays a summary of thebuffer cache usage for multiple agents for each day over the past month.
Storage LocationReports/Oracle/Monthly Trend/
Record
System Stat Summary Interval (PI)
Field
Name: Cache Hit %
Description: Buffer cache usage
1-50 Working with the Solution SetHitachi Tuning Manager Application Reports Reference
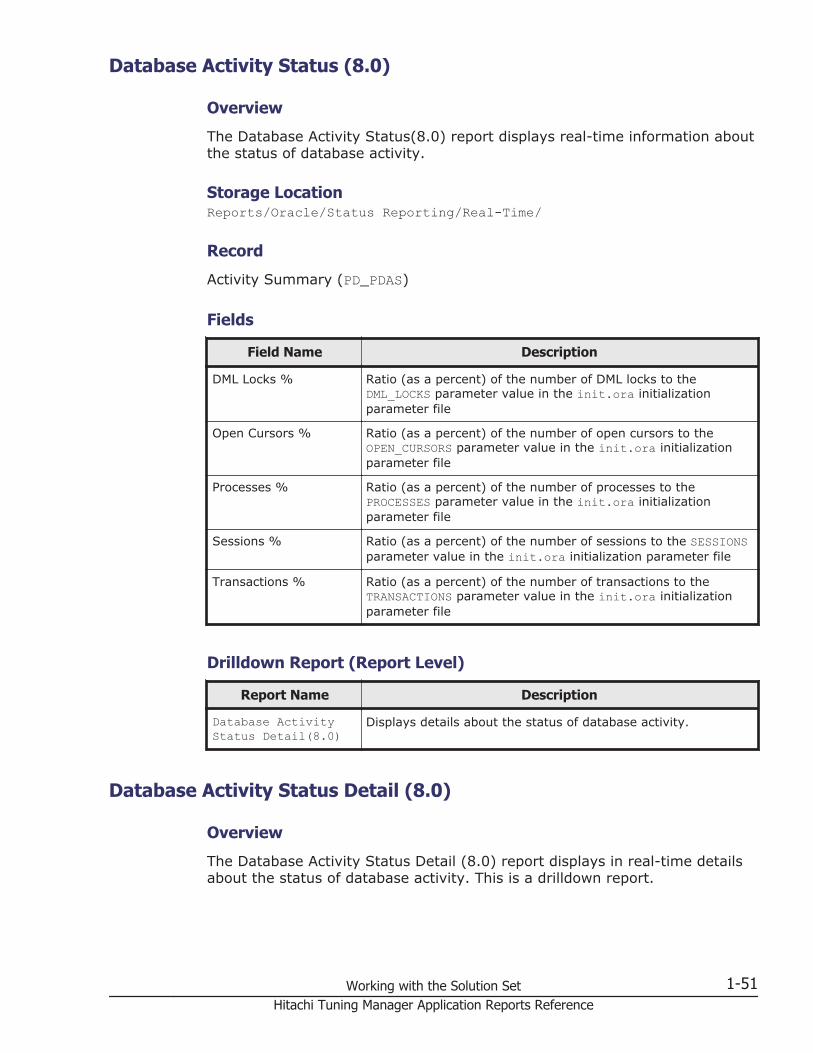
Database Activity Status (8.0)
Overview
The Database Activity Status(8.0) report displays real-time information aboutthe status of database activity.
Storage LocationReports/Oracle/Status Reporting/Real-Time/
Record
Activity Summary (PD_PDAS)
Fields
Field Name Description
DML Locks % Ratio (as a percent) of the number of DML locks to theDML_LOCKS parameter value in the init.ora initializationparameter file
Open Cursors % Ratio (as a percent) of the number of open cursors to theOPEN_CURSORS parameter value in the init.ora initializationparameter file
Processes % Ratio (as a percent) of the number of processes to thePROCESSES parameter value in the init.ora initializationparameter file
Sessions % Ratio (as a percent) of the number of sessions to the SESSIONSparameter value in the init.ora initialization parameter file
Transactions % Ratio (as a percent) of the number of transactions to theTRANSACTIONS parameter value in the init.ora initializationparameter file
Drilldown Report (Report Level)
Report Name Description
Database ActivityStatus Detail(8.0)
Displays details about the status of database activity.
Database Activity Status Detail (8.0)
Overview
The Database Activity Status Detail (8.0) report displays in real-time detailsabout the status of database activity. This is a drilldown report.
Working with the Solution Set 1-51Hitachi Tuning Manager Application Reports Reference
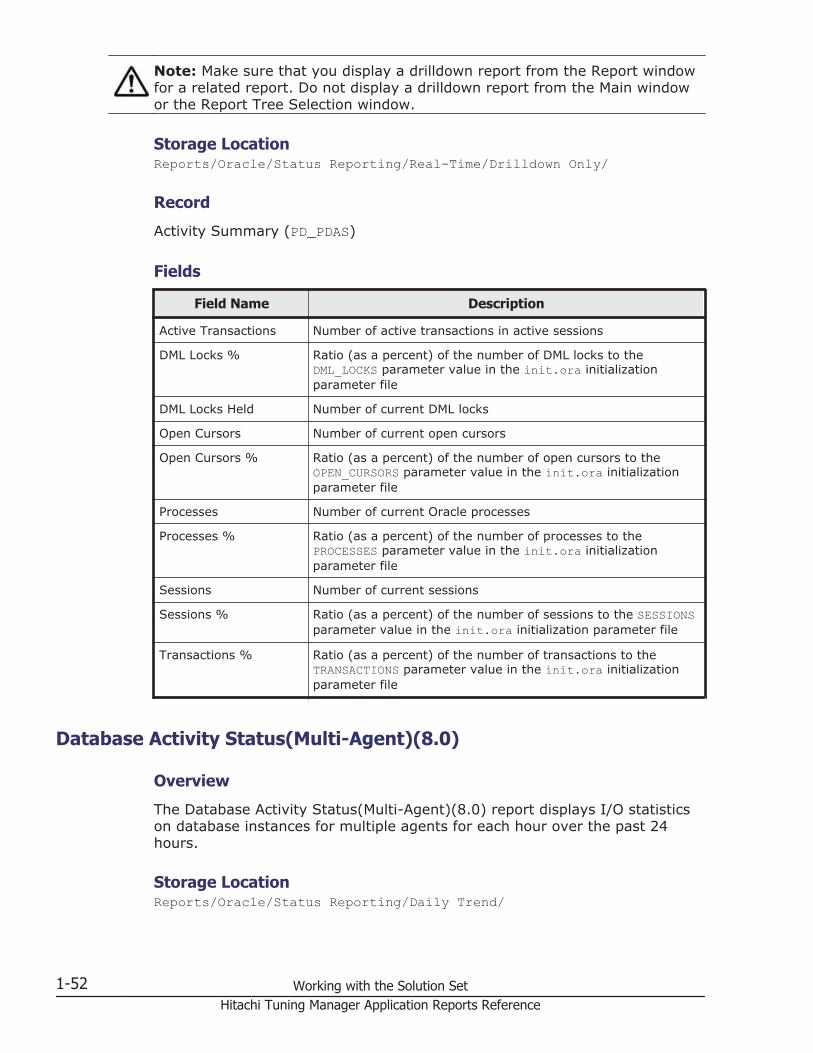
Note: Make sure that you display a drilldown report from the Report windowfor a related report. Do not display a drilldown report from the Main windowor the Report Tree Selection window.
Storage LocationReports/Oracle/Status Reporting/Real-Time/Drilldown Only/
Record
Activity Summary (PD_PDAS)
Fields
Field Name Description
Active Transactions Number of active transactions in active sessions
DML Locks % Ratio (as a percent) of the number of DML locks to theDML_LOCKS parameter value in the init.ora initializationparameter file
DML Locks Held Number of current DML locks
Open Cursors Number of current open cursors
Open Cursors % Ratio (as a percent) of the number of open cursors to theOPEN_CURSORS parameter value in the init.ora initializationparameter file
Processes Number of current Oracle processes
Processes % Ratio (as a percent) of the number of processes to thePROCESSES parameter value in the init.ora initializationparameter file
Sessions Number of current sessions
Sessions % Ratio (as a percent) of the number of sessions to the SESSIONSparameter value in the init.ora initialization parameter file
Transactions % Ratio (as a percent) of the number of transactions to theTRANSACTIONS parameter value in the init.ora initializationparameter file
Database Activity Status(Multi-Agent)(8.0)
Overview
The Database Activity Status(Multi-Agent)(8.0) report displays I/O statisticson database instances for multiple agents for each hour over the past 24hours.
Storage LocationReports/Oracle/Status Reporting/Daily Trend/
1-52 Working with the Solution SetHitachi Tuning Manager Application Reports Reference

Record
System Stat Summary Interval (PI)
Field
Name: I/O Ops/sec
Description: Number of I/O operations per second
Database Activity Trend(Multi-Agent)(8.0)
Overview
The Database Activity Trend(Multi-Agent)(8.0) report displays a summary ofI/O processing for multiple agents for each day over the past month.
Storage LocationReports/Oracle/Monthly Trend/
Record
System Stat Summary Interval (PI)
Field
Name: I/O Ops/sec
Description: Number of I/O operations per second
Database Space Overview (8.0)
Overview
The Database Space Overview (8.0) report displays in real-time performancedata and general database information on tablespaces and data files.
Storage LocationReports/Oracle/Status Reporting/Real-Time/
Record
Database (PD_PDDB)
Fields
Field Name Description
Datafiles Number of data files used by tablespaces
Working with the Solution Set 1-53Hitachi Tuning Manager Application Reports Reference
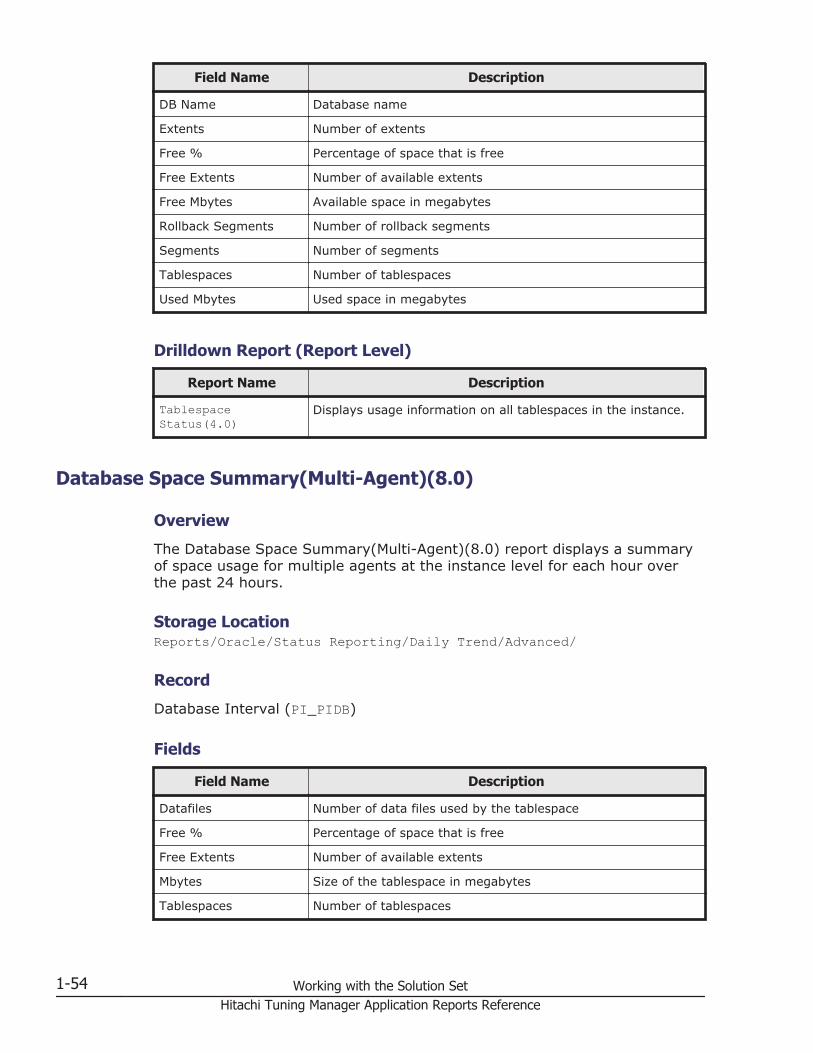
Field Name Description
DB Name Database name
Extents Number of extents
Free % Percentage of space that is free
Free Extents Number of available extents
Free Mbytes Available space in megabytes
Rollback Segments Number of rollback segments
Segments Number of segments
Tablespaces Number of tablespaces
Used Mbytes Used space in megabytes
Drilldown Report (Report Level)
Report Name Description
TablespaceStatus(4.0)
Displays usage information on all tablespaces in the instance.
Database Space Summary(Multi-Agent)(8.0)
Overview
The Database Space Summary(Multi-Agent)(8.0) report displays a summaryof space usage for multiple agents at the instance level for each hour overthe past 24 hours.
Storage LocationReports/Oracle/Status Reporting/Daily Trend/Advanced/
Record
Database Interval (PI_PIDB)
Fields
Field Name Description
Datafiles Number of data files used by the tablespace
Free % Percentage of space that is free
Free Extents Number of available extents
Mbytes Size of the tablespace in megabytes
Tablespaces Number of tablespaces
1-54 Working with the Solution SetHitachi Tuning Manager Application Reports Reference
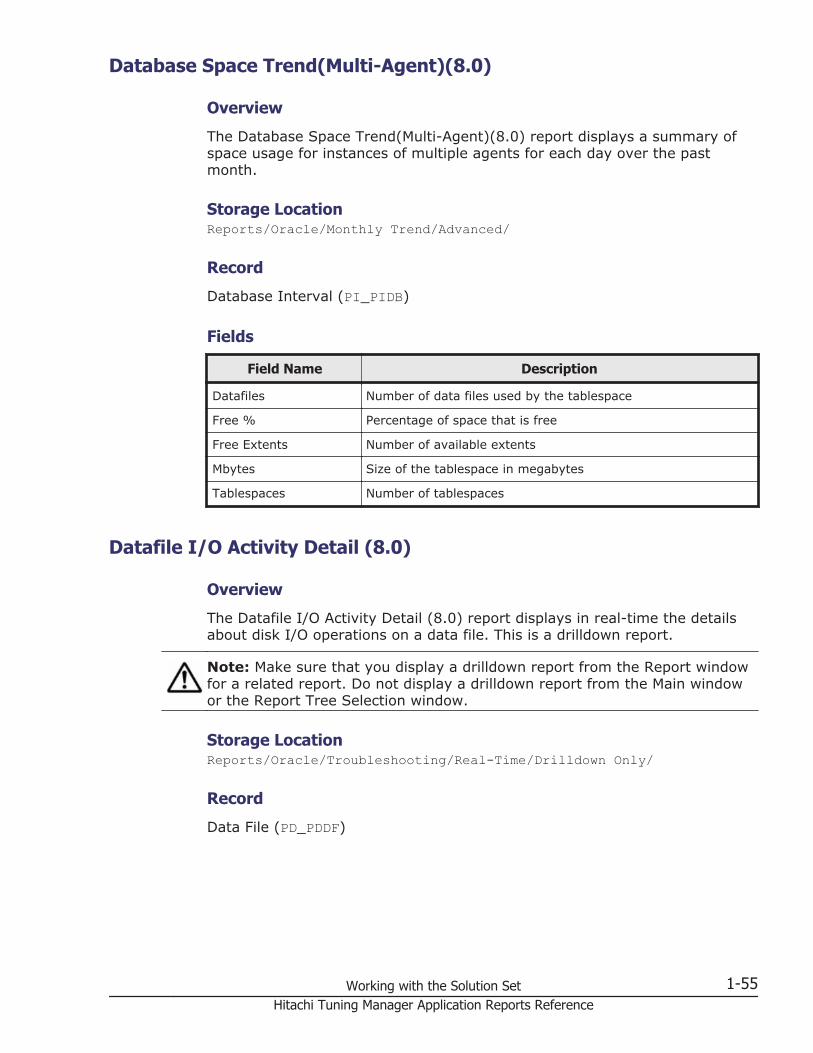
Database Space Trend(Multi-Agent)(8.0)
Overview
The Database Space Trend(Multi-Agent)(8.0) report displays a summary ofspace usage for instances of multiple agents for each day over the pastmonth.
Storage LocationReports/Oracle/Monthly Trend/Advanced/
Record
Database Interval (PI_PIDB)
Fields
Field Name Description
Datafiles Number of data files used by the tablespace
Free % Percentage of space that is free
Free Extents Number of available extents
Mbytes Size of the tablespace in megabytes
Tablespaces Number of tablespaces
Datafile I/O Activity Detail (8.0)
Overview
The Datafile I/O Activity Detail (8.0) report displays in real-time the detailsabout disk I/O operations on a data file. This is a drilldown report.
Note: Make sure that you display a drilldown report from the Report windowfor a related report. Do not display a drilldown report from the Main windowor the Report Tree Selection window.
Storage LocationReports/Oracle/Troubleshooting/Real-Time/Drilldown Only/
Record
Data File (PD_PDDF)
Working with the Solution Set 1-55Hitachi Tuning Manager Application Reports Reference

Fields
Field Name Description
File # File number
File Name File name
Physical Blocks Read Number of physical block read operations
Physical Blocks Written Number of physical block write operations
Physical Reads Number of physical read operations
Physical Writes Number of physical write operations
Tablespace Name Tablespace name
Datafile I/O Status Detail (Reads) (8.0)
Overview
The Datafile I/O Status Detail(Reads)(8.0) report displays details aboutaverage number of disk read operations on any data file for each hour overthe past 24 hours. This is a drilldown report.
Note: Make sure that you display a drilldown report from the Report windowfor a related report. Do not display a drilldown report from the Main windowor the Report Tree Selection window.
Storage LocationReports/Oracle/Status Reporting/Daily Trend/Advanced/Drilldown Only/
Record
Data File Interval (PI_PIDF)
Fields
Field Name Description
File # File number
File Name File name
Physical Blocks Read Number of physical block read operations
Physical Blocks Written Number of physical block write operations
Physical Reads Number of completed physical read operations
Physical Writes Number of completed physical write operations
Tablespace Name Tablespace name
1-56 Working with the Solution SetHitachi Tuning Manager Application Reports Reference

Datafile I/O Status Detail (Writes) (8.0)
Overview
The Datafile I/O Status Detail(Writes)(8.0) report displays details aboutaverage number of disk write operations on any data file for each hour overthe past 24 hours. This is a drilldown report.
Note: Make sure that you display a drilldown report from the Report windowfor a related report. Do not display a drilldown report from the Main windowor the Report Tree Selection window.
Storage LocationReports/Oracle/Status Reporting/Daily Trend/Advanced/Drilldown Only/
Record
Data File Interval (PI_PIDF)
Fields
Field Name Description
File # File number
File Name File name
Physical Blocks Read Number of physical block read operations
Physical Blocks Written Number of physical block write operations
Physical Reads Number of completed physical read operations
Physical Writes Number of completed physical write operations
Tablespace Name Tablespace name
Datafile I/O Status Summary (8.0)
Overview
The Datafile I/O Status Summary(8.0) report displays a summary of disk I/Ooperations per data file for each hour over the past 24 hours.
Storage LocationReports/Oracle/Status Reporting/Daily Trend/Advanced/
Record
Data File Interval (PI_PIDF)
Working with the Solution Set 1-57Hitachi Tuning Manager Application Reports Reference
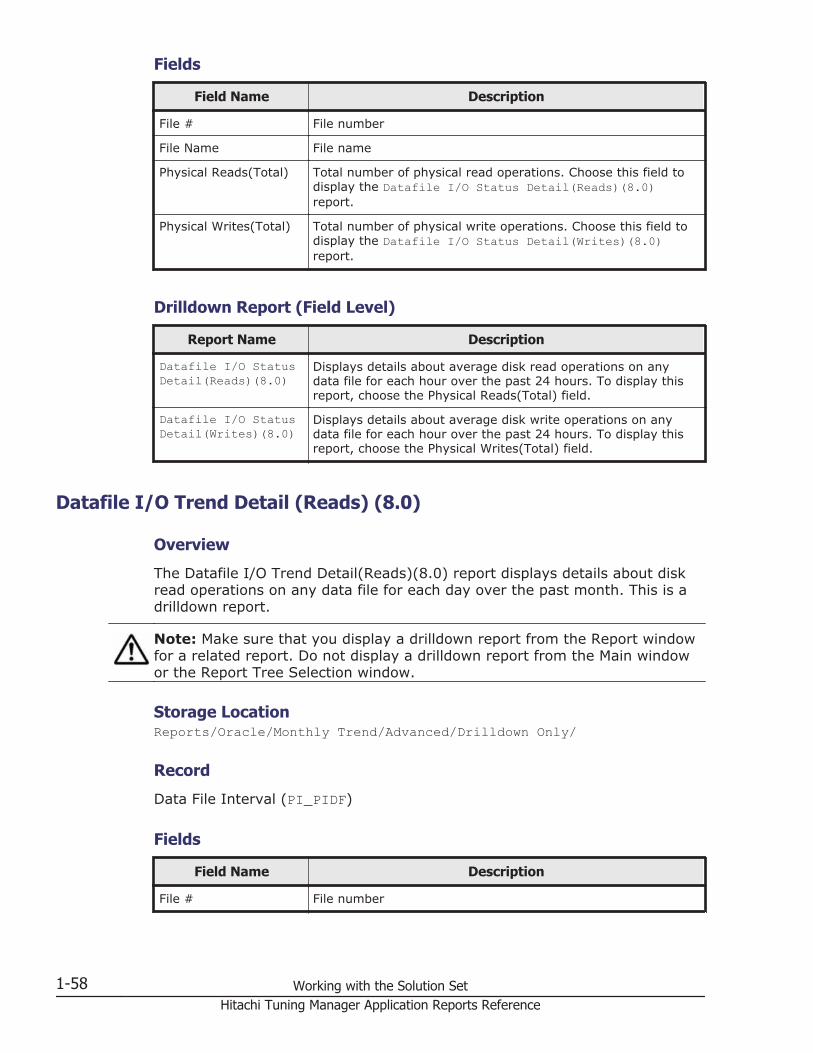
Fields
Field Name Description
File # File number
File Name File name
Physical Reads(Total) Total number of physical read operations. Choose this field todisplay the Datafile I/O Status Detail(Reads)(8.0)report.
Physical Writes(Total) Total number of physical write operations. Choose this field todisplay the Datafile I/O Status Detail(Writes)(8.0)report.
Drilldown Report (Field Level)
Report Name Description
Datafile I/O StatusDetail(Reads)(8.0)
Displays details about average disk read operations on anydata file for each hour over the past 24 hours. To display thisreport, choose the Physical Reads(Total) field.
Datafile I/O StatusDetail(Writes)(8.0)
Displays details about average disk write operations on anydata file for each hour over the past 24 hours. To display thisreport, choose the Physical Writes(Total) field.
Datafile I/O Trend Detail (Reads) (8.0)
Overview
The Datafile I/O Trend Detail(Reads)(8.0) report displays details about diskread operations on any data file for each day over the past month. This is adrilldown report.
Note: Make sure that you display a drilldown report from the Report windowfor a related report. Do not display a drilldown report from the Main windowor the Report Tree Selection window.
Storage LocationReports/Oracle/Monthly Trend/Advanced/Drilldown Only/
Record
Data File Interval (PI_PIDF)
Fields
Field Name Description
File # File number
1-58 Working with the Solution SetHitachi Tuning Manager Application Reports Reference
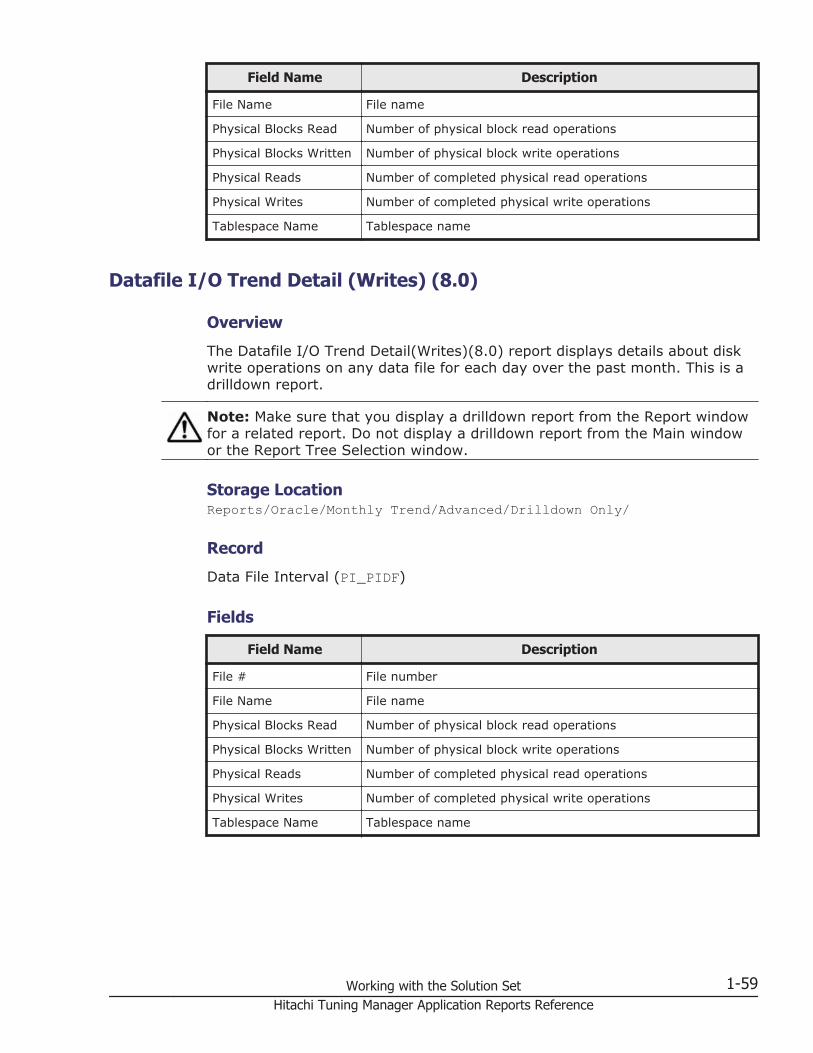
Field Name Description
File Name File name
Physical Blocks Read Number of physical block read operations
Physical Blocks Written Number of physical block write operations
Physical Reads Number of completed physical read operations
Physical Writes Number of completed physical write operations
Tablespace Name Tablespace name
Datafile I/O Trend Detail (Writes) (8.0)
Overview
The Datafile I/O Trend Detail(Writes)(8.0) report displays details about diskwrite operations on any data file for each day over the past month. This is adrilldown report.
Note: Make sure that you display a drilldown report from the Report windowfor a related report. Do not display a drilldown report from the Main windowor the Report Tree Selection window.
Storage LocationReports/Oracle/Monthly Trend/Advanced/Drilldown Only/
Record
Data File Interval (PI_PIDF)
Fields
Field Name Description
File # File number
File Name File name
Physical Blocks Read Number of physical block read operations
Physical Blocks Written Number of physical block write operations
Physical Reads Number of completed physical read operations
Physical Writes Number of completed physical write operations
Tablespace Name Tablespace name
Working with the Solution Set 1-59Hitachi Tuning Manager Application Reports Reference
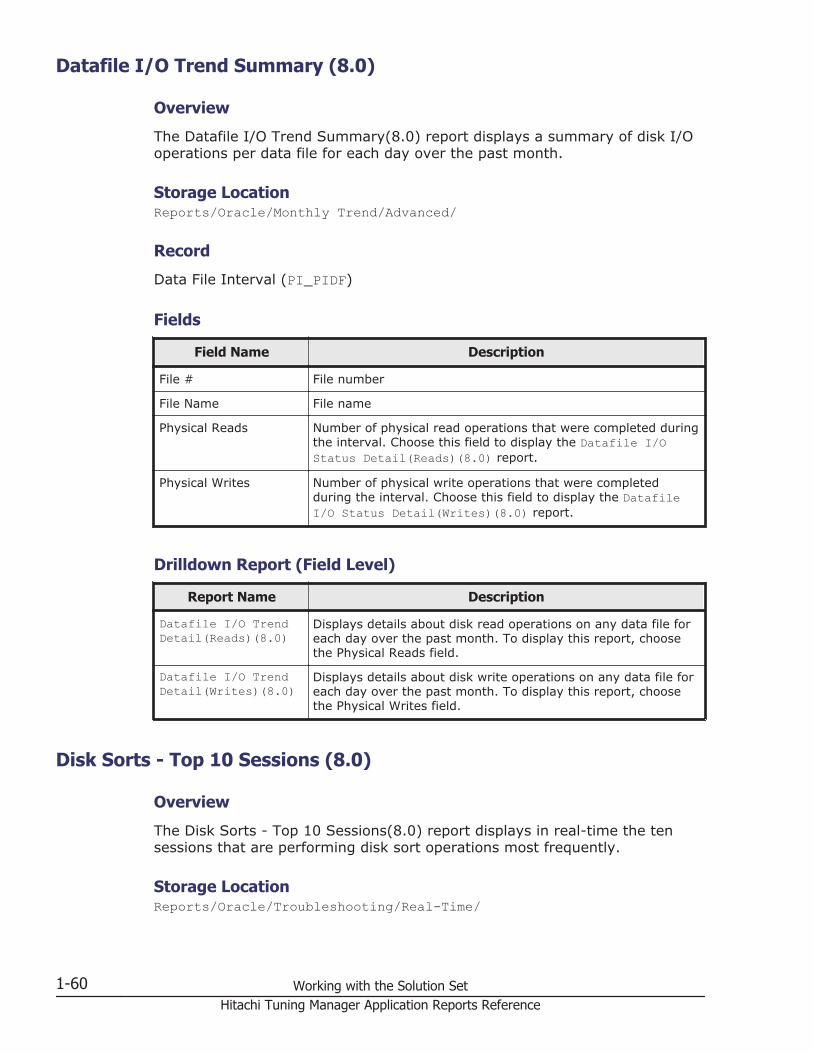
Datafile I/O Trend Summary (8.0)
Overview
The Datafile I/O Trend Summary(8.0) report displays a summary of disk I/Ooperations per data file for each day over the past month.
Storage LocationReports/Oracle/Monthly Trend/Advanced/
Record
Data File Interval (PI_PIDF)
Fields
Field Name Description
File # File number
File Name File name
Physical Reads Number of physical read operations that were completed duringthe interval. Choose this field to display the Datafile I/OStatus Detail(Reads)(8.0) report.
Physical Writes Number of physical write operations that were completedduring the interval. Choose this field to display the DatafileI/O Status Detail(Writes)(8.0) report.
Drilldown Report (Field Level)
Report Name Description
Datafile I/O TrendDetail(Reads)(8.0)
Displays details about disk read operations on any data file foreach day over the past month. To display this report, choosethe Physical Reads field.
Datafile I/O TrendDetail(Writes)(8.0)
Displays details about disk write operations on any data file foreach day over the past month. To display this report, choosethe Physical Writes field.
Disk Sorts - Top 10 Sessions (8.0)
Overview
The Disk Sorts - Top 10 Sessions(8.0) report displays in real-time the tensessions that are performing disk sort operations most frequently.
Storage LocationReports/Oracle/Troubleshooting/Real-Time/
1-60 Working with the Solution SetHitachi Tuning Manager Application Reports Reference

Record
Session Statistics Summary (PD_PDS2)
Fields
Field Name Description
SID Session identifier
Sort Overflow % Percentage of sorts that used temporary segments. To displaythe Session Detail(8.0) report, choose this field.
User Oracle user name
Drilldown Report (Field Level)
Report Name Description
Session Detail(8.0) Displays detailed information about a session. To display thisreport, choose the Sort Overflow % field.
Error Log(8.0)
Overview
The Error Log(8.0) report displays in real-time all entries that have beenrecorded in the error log since the agent started. This is a drilldown report.
Agent for Oracle does not display this report if the Oracle Database does nothave enough performance data to display the report.
Note: Make sure that you display a drilldown report from the Report windowfor a related report. Do not display a drilldown report from the Main windowor the Report Tree Selection window.
Storage LocationReports/Oracle/Troubleshooting/Real-Time/Drilldown Only/
Record
Errorlog Detail (PD_PDEL)
Fields
Field Name Description
Error # Error number
Error File Name of the file in which the error occurred
Error Time Time the error occurred
Working with the Solution Set 1-61Hitachi Tuning Manager Application Reports Reference

Field Name Description
Message Error message
Full Table Scans(8.0)
Overview
The Full Table Scans(8.0) report displays the percentage of table lookupsusing no index for each minute over the past hour.
Storage LocationReports/Oracle/Troubleshooting/Recent Past/
Record
System Stat Summary Interval (PI)
Field
Field Name Description
Non-Index Lookups % Percentage of full table scans for which no caching is performed
Drilldown Report (Field Level)
Report Name Description
Cache Usage(8.0) Displays the buffer cache usage. To display this report, choosethe Non Index Lookups % field.
I/O Activity - Top 10 Datafiles (8.0)
Overview
The I/O Activity - Top 10 Datafiles(8.0) report displays in real-time the tendata files for which the most disk I/O operations have been executed.
Storage LocationReports/Oracle/Troubleshooting/Real-Time/
Record
Data File (PD_PDDF)
1-62 Working with the Solution SetHitachi Tuning Manager Application Reports Reference

Fields
Field Name Description
File # File number
File Name File name
Physical Reads Number of physical read operations. To display the DatafileI/O Activity Detail(8.0) report, choose this field.
Physical Writes Number of physical write operations. To display the DatafileI/O Activity Detail(8.0) report, choose this field.
Drilldown Reports (Report Level)
Report Name Description
Datafile I/OActivity Detail(8.0)
Displays the details about I/O operations for all data files. Todisplay this report, choose the Physical Read or Physical Writesfield.
Physical I/O - Top10 Sessions(8.0)
Displays the ten sessions in which the most I/O operationsoccurred.
Drilldown Report (Field Level)
Report Name Description
Datafile I/OActivity Detail(8.0)
Displays details about disk I/O operations for a specified datafile. To display this report, choose the Physical Reads orPhysical Writes field.
Lock Usage - Top 10 Sessions (8.0)
Overview
The Lock Usage - Top 10 Sessions (8.0) report displays in real-time the tensessions that are holding the highest number of locks.
Storage LocationReports/Oracle/Troubleshooting/Real-Time/
Record
Session Detail (PD_PDS)
Working with the Solution Set 1-63Hitachi Tuning Manager Application Reports Reference
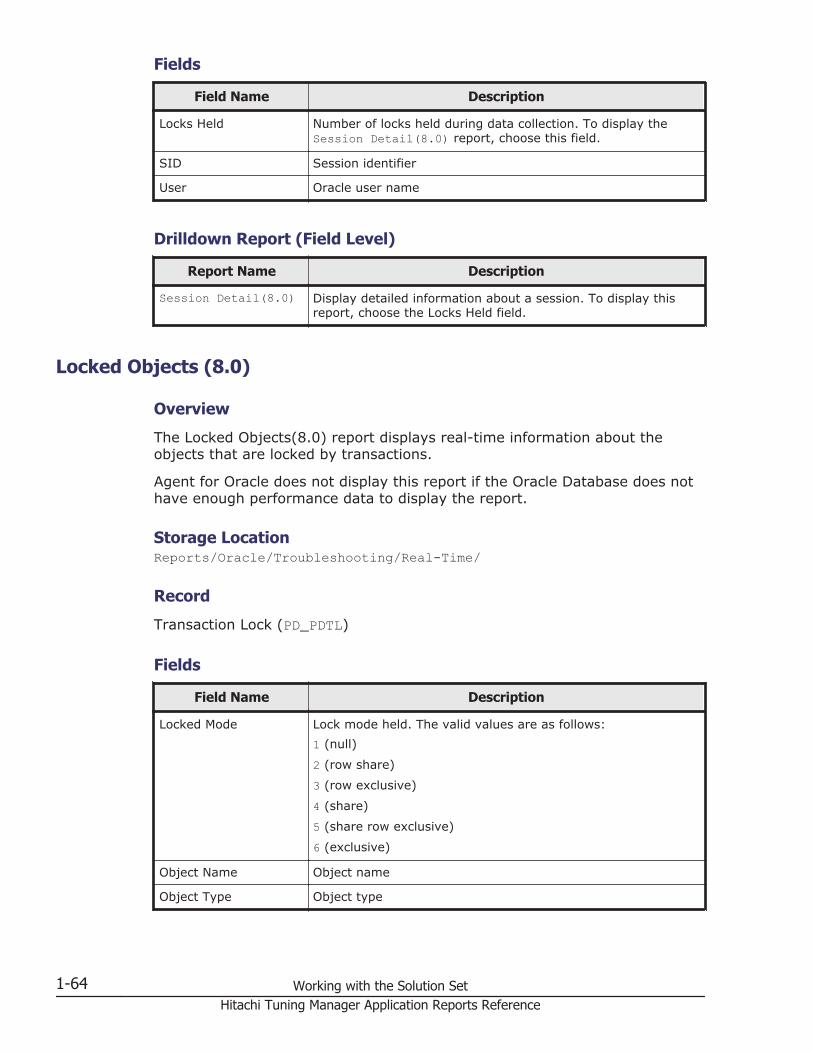
Fields
Field Name Description
Locks Held Number of locks held during data collection. To display theSession Detail(8.0) report, choose this field.
SID Session identifier
User Oracle user name
Drilldown Report (Field Level)
Report Name Description
Session Detail(8.0) Display detailed information about a session. To display thisreport, choose the Locks Held field.
Locked Objects (8.0)
Overview
The Locked Objects(8.0) report displays real-time information about theobjects that are locked by transactions.
Agent for Oracle does not display this report if the Oracle Database does nothave enough performance data to display the report.
Storage LocationReports/Oracle/Troubleshooting/Real-Time/
Record
Transaction Lock (PD_PDTL)
Fields
Field Name Description
Locked Mode Lock mode held. The valid values are as follows:1 (null)
2 (row share)
3 (row exclusive)
4 (share)
5 (share row exclusive)
6 (exclusive)
Object Name Object name
Object Type Object type
1-64 Working with the Solution SetHitachi Tuning Manager Application Reports Reference

Field Name Description
Owner Object owner
SID Session identifier. To display the Session Detail(8.0) report,choose this field.
User Oracle user name
Drilldown Report (Field Level)
Report Name Description
Session Detail(8.0) Displays detailed information about a session. To display thisreport, choose the SID field.
Longest Transactions - Top 10 Sessions (8.0)
Overview
The Longest Transactions - Top 10 Sessions(8.0) report displays in real-timethe ten transactions that have placed other sessions in wait status for thelongest amount of time.
Agent for Oracle does not display this report if the Oracle Database does nothave enough performance data to display the report.
Storage LocationReports/Oracle/Troubleshooting/Real-Time/
Record
Transaction (PD_PDTR)
Fields
Field Name Description
Cache Hit % Ratio (as a percent) of logical I/O operations to physical I/Ooperations.
Locks Number of locks being held by the transaction. To display theBlocking Locks(8.0) report, choose this field.
Logical I/O Logical I/O operations
Physical I/O Physical I/O operations
SID Session identifier. To display the Open Cursors(4.0) report,choose this field.
Tran Secs Number of seconds since the transaction started
User Oracle user name
Working with the Solution Set 1-65Hitachi Tuning Manager Application Reports Reference
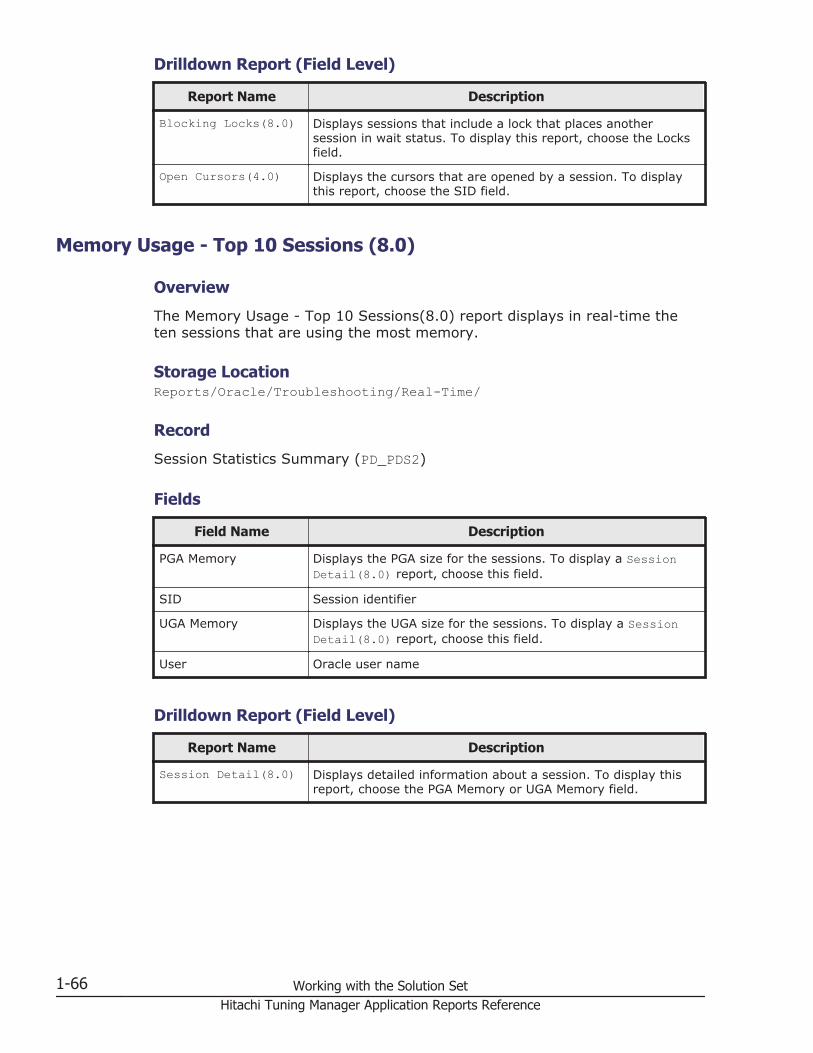
Drilldown Report (Field Level)
Report Name Description
Blocking Locks(8.0) Displays sessions that include a lock that places anothersession in wait status. To display this report, choose the Locksfield.
Open Cursors(4.0) Displays the cursors that are opened by a session. To displaythis report, choose the SID field.
Memory Usage - Top 10 Sessions (8.0)
Overview
The Memory Usage - Top 10 Sessions(8.0) report displays in real-time theten sessions that are using the most memory.
Storage LocationReports/Oracle/Troubleshooting/Real-Time/
Record
Session Statistics Summary (PD_PDS2)
Fields
Field Name Description
PGA Memory Displays the PGA size for the sessions. To display a SessionDetail(8.0) report, choose this field.
SID Session identifier
UGA Memory Displays the UGA size for the sessions. To display a SessionDetail(8.0) report, choose this field.
User Oracle user name
Drilldown Report (Field Level)
Report Name Description
Session Detail(8.0) Displays detailed information about a session. To display thisreport, choose the PGA Memory or UGA Memory field.
1-66 Working with the Solution SetHitachi Tuning Manager Application Reports Reference

Open Cursors (4.0)
Overview
The Open Cursors(4.0) report displays in real-time a cursor opened by asession. This is a drilldown report.
Note: Make sure that you display a drilldown report from the Report windowfor a related report. Do not display a drilldown report from the Main windowor the Report Tree Selection window.
Storage LocationReports/Oracle/Troubleshooting/Real-Time/Drilldown Only/
Record
Open Cursor (PD_PDOC)
Fields
Field Name Description
Addrhash Character string that identifies the SQL statement beingexecuted
Program Name of the program being executed
SID Session identifier
SQL Text First 60 characters of the SQL statement that was analyzed bythe open cursor. To display the SQL Text(4.0) report, choosethis field.
User Oracle user name
Drilldown Report (Report Level)
Report Name Description
SQL Text(4.0) Displays the performance data for the SQL Text and ExplainPlan fields. To display this field, choose the SQL Text field.
Physical I/O - Top 10 Sessions (8.0)
Overview
The Physical I/O - Top 10 Sessions(8.0) report displays in real-time the tensessions that have the highest concentration of I/O operations.
Storage LocationReports/Oracle/Troubleshooting/Real-Time/
Working with the Solution Set 1-67Hitachi Tuning Manager Application Reports Reference
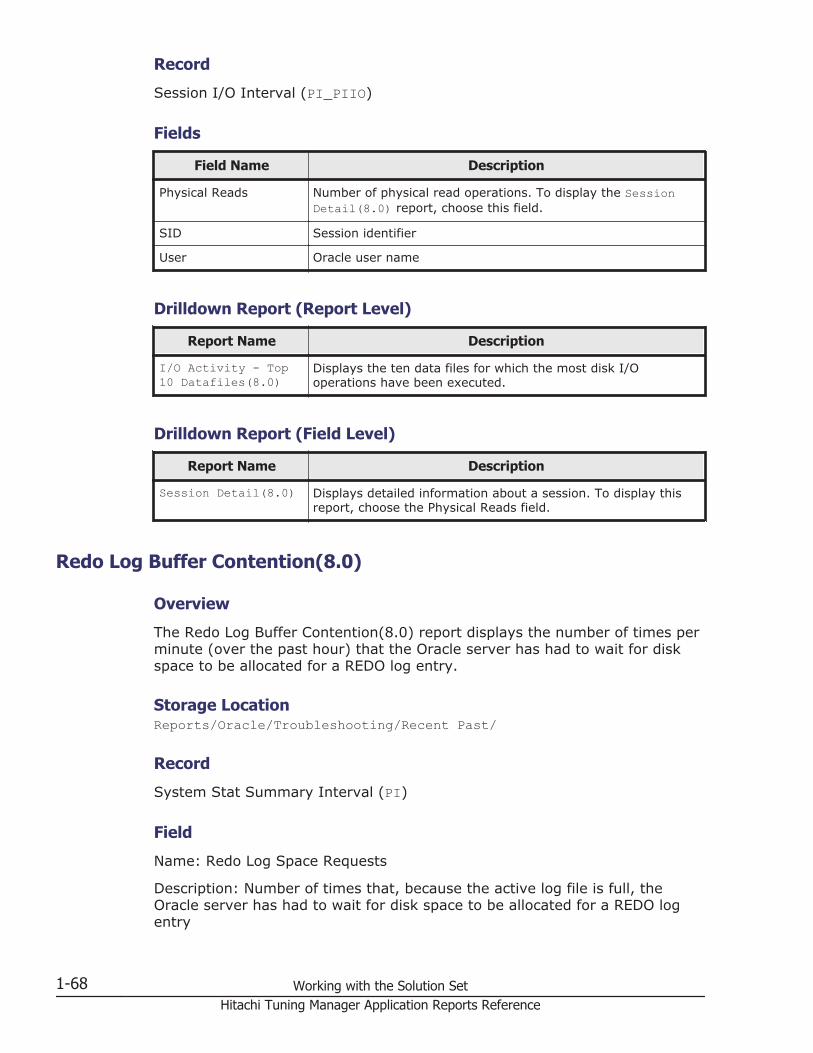
Record
Session I/O Interval (PI_PIIO)
Fields
Field Name Description
Physical Reads Number of physical read operations. To display the SessionDetail(8.0) report, choose this field.
SID Session identifier
User Oracle user name
Drilldown Report (Report Level)
Report Name Description
I/O Activity - Top10 Datafiles(8.0)
Displays the ten data files for which the most disk I/Ooperations have been executed.
Drilldown Report (Field Level)
Report Name Description
Session Detail(8.0) Displays detailed information about a session. To display thisreport, choose the Physical Reads field.
Redo Log Buffer Contention(8.0)
Overview
The Redo Log Buffer Contention(8.0) report displays the number of times perminute (over the past hour) that the Oracle server has had to wait for diskspace to be allocated for a REDO log entry.
Storage LocationReports/Oracle/Troubleshooting/Recent Past/
Record
System Stat Summary Interval (PI)
Field
Name: Redo Log Space Requests
Description: Number of times that, because the active log file is full, theOracle server has had to wait for disk space to be allocated for a REDO logentry
1-68 Working with the Solution SetHitachi Tuning Manager Application Reports Reference

Server Configuration Status (4.0)
Overview
The Server Configuration Status(4.0) report displays real-time information onconfiguration parameters.
Storage LocationReports/Oracle/Status Reporting/Real-Time/
Record
Parameter Values (PD_PDP)
Fields
Field Name Description
Is Default Default value. The valid values are TRUE and FALSE.
Parameter Name Parameter name. There are two parameters:• Parameter with capacity restriction that has no effect on
performance• Parameter with no capacity restriction that has an effect on
performance
Value Parameter value
Session Detail (8.0)
Overview
The Session Detail(8.0) report displays in real-time detailed informationabout a session. This is a drilldown report.
Note: Make sure that you display a drilldown report from the Report windowfor a related report. Do not display a drilldown report from the Main windowor the Report Tree Selection window.
Storage LocationReports/Oracle/Troubleshooting/Real-Time/Drilldown Only/
Record
Session Detail (PD_PDS)
Working with the Solution Set 1-69Hitachi Tuning Manager Application Reports Reference

Fields
Field Name Description
Addrhash Character string that identifies the SQL statement beingexecuted
Blocking Locks Number of locks that are blocking other locks
Command Command being executed. To display the SQL Text(4.0)report, choose this field.
Locks Held Number of locks held during data collection
Open Cursors Number of open cursors. To display the Open Cursors(4.0)report, choose this field.
Program Name of the program being executed
Session Events Number of wait events for a session
Session Waits Number of resources and events the session is waiting for
Sessions Blocked Number of sessions that have been placed in wait status by thissession
SID Session identifier. To display the Session StatisticsDetail(4.0) report, choose this field.
Table Accesses Number of table accesses
Transactions Number of active transactions
User Oracle user name
Drilldown Report (Field Level)
Report Name Description
Open Cursors(4.0) Displays detailed information about the open cursors in thesession. To display this report, choose the Open Cursors field.
Session StatisticsDetail(4.0)
Displays detailed statistics about a session. To display thisreport, choose the SID field.
SQL Text(4.0) Displays the performance data for the SQL Text and ExplainPlan fields. To display this report, choose the Command field.
Session Statistics Detail (4.0)
Overview
The Session Statistics Detail(4.0) report displays in real-time statistics abouta session. This is a drilldown report.
Note: Make sure that you display a drilldown report from the Report windowfor a related report. Do not display a drilldown report from the Main windowor the Report Tree Selection window.
1-70 Working with the Solution SetHitachi Tuning Manager Application Reports Reference

Storage LocationReports/Oracle/Troubleshooting/Real-Time/Drilldown Only/
Record
Session Statistics Summary (PD_PDS2)
Fields
Field Name Description
Blocking Locks Number of locks in a session that are blocking other locks
Cache Hit % Buffer cache usage
Disk Sorts Number of disk sort operations
Lock Requests Number of lock requests
Lock Waits Number of times lock request was placed in wait status
Memory Sorts Number of sort operations in memory
PGA Memory Session's PGA size
Physical Reads Number of real read operations on a database block from disk
Program Program name
SID Session identifier
Sort Overflow % Percentage of sorts that used temporary segments
UGA Memory Session's UGA size
User Oracle user name
SGA Status(8.0)
Overview
The SGA Status (8.0) report displays in real-time the status of a componentin the SGA.
Storage LocationReports/Oracle/Status Reporting/Real-Time/
Record
SGA Components (PD_PDSG)
Fields
Field Name Description
Bytes Amount of memory in bytes
Working with the Solution Set 1-71Hitachi Tuning Manager Application Reports Reference
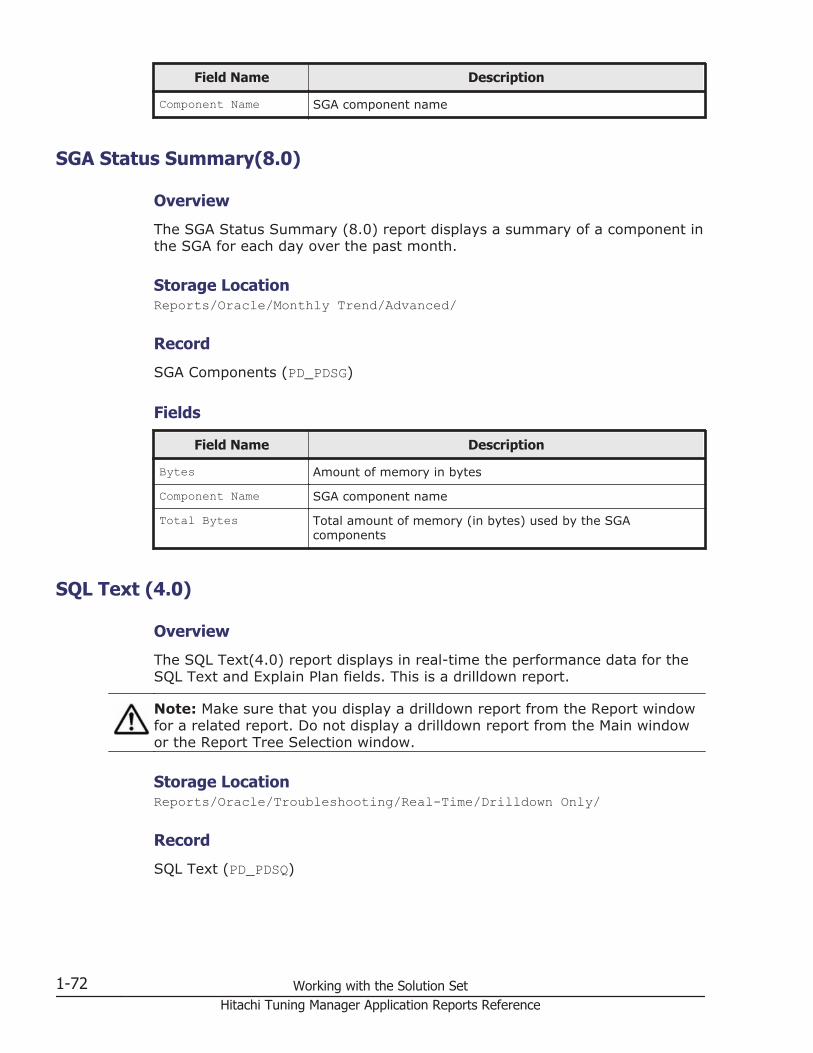
Field Name Description
Component Name SGA component name
SGA Status Summary(8.0)
Overview
The SGA Status Summary (8.0) report displays a summary of a component inthe SGA for each day over the past month.
Storage LocationReports/Oracle/Monthly Trend/Advanced/
Record
SGA Components (PD_PDSG)
Fields
Field Name Description
Bytes Amount of memory in bytes
Component Name SGA component name
Total Bytes Total amount of memory (in bytes) used by the SGAcomponents
SQL Text (4.0)
Overview
The SQL Text(4.0) report displays in real-time the performance data for theSQL Text and Explain Plan fields. This is a drilldown report.
Note: Make sure that you display a drilldown report from the Report windowfor a related report. Do not display a drilldown report from the Main windowor the Report Tree Selection window.
Storage LocationReports/Oracle/Troubleshooting/Real-Time/Drilldown Only/
Record
SQL Text (PD_PDSQ)
1-72 Working with the Solution SetHitachi Tuning Manager Application Reports Reference
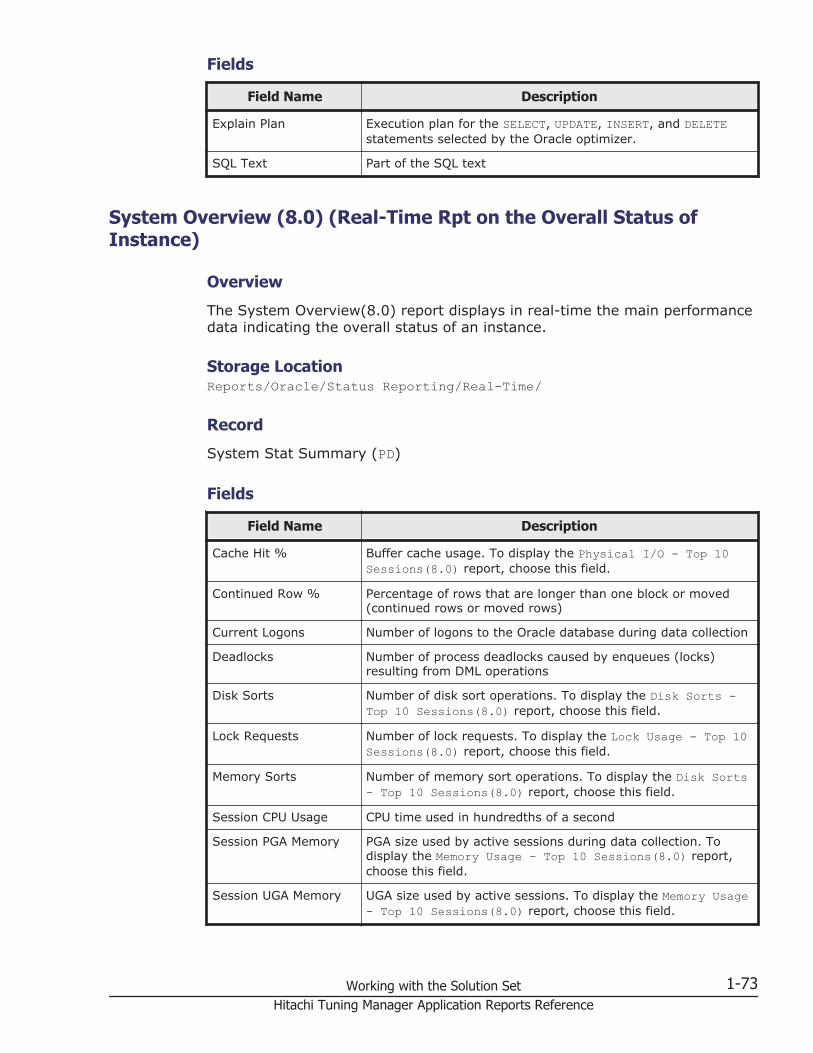
Fields
Field Name Description
Explain Plan Execution plan for the SELECT, UPDATE, INSERT, and DELETEstatements selected by the Oracle optimizer.
SQL Text Part of the SQL text
System Overview (8.0) (Real-Time Rpt on the Overall Status ofInstance)
Overview
The System Overview(8.0) report displays in real-time the main performancedata indicating the overall status of an instance.
Storage LocationReports/Oracle/Status Reporting/Real-Time/
Record
System Stat Summary (PD)
Fields
Field Name Description
Cache Hit % Buffer cache usage. To display the Physical I/O - Top 10Sessions(8.0) report, choose this field.
Continued Row % Percentage of rows that are longer than one block or moved(continued rows or moved rows)
Current Logons Number of logons to the Oracle database during data collection
Deadlocks Number of process deadlocks caused by enqueues (locks)resulting from DML operations
Disk Sorts Number of disk sort operations. To display the Disk Sorts -Top 10 Sessions(8.0) report, choose this field.
Lock Requests Number of lock requests. To display the Lock Usage - Top 10Sessions(8.0) report, choose this field.
Memory Sorts Number of memory sort operations. To display the Disk Sorts- Top 10 Sessions(8.0) report, choose this field.
Session CPU Usage CPU time used in hundredths of a second
Session PGA Memory PGA size used by active sessions during data collection. Todisplay the Memory Usage - Top 10 Sessions(8.0) report,choose this field.
Session UGA Memory UGA size used by active sessions. To display the Memory Usage- Top 10 Sessions(8.0) report, choose this field.
Working with the Solution Set 1-73Hitachi Tuning Manager Application Reports Reference

Field Name Description
Sort Overflow % Percentage of sorts that used temporary segments. To displaythe Disk Sorts - Top 10 Sessions(8.0) report, choose thisfield.
Total SQL Executions Number of SQL statement executions
User Calls Number of requests from application to database that havebeen processed
User Commits Number of transactions. To display the Longest Transactions- Top 10 Sessions(8.0) report, choose this field.
User Rollbacks Number of rollbacks
Drilldown Reports (Report Level)
Report Name Description
Database ActivityStatus(8.0)
Displays instance activity status.
Database SpaceOverview(8.0)
Displays usage information about tablespaces and data files forthe instance.
Error Log(8.0) Displays the error messages that have been issued since theagent started.
Server ConfigurationStatus(4.0)
Displays all configuration parameter information for the server.
TablespaceStatus(4.0)
Displays all tablespace information.
Drilldown Report (Field Level)
Report Name Description
Disk Sorts - Top 10Sessions(8.0)
Displays the ten sessions that are performing disk sortoperations most frequently. To display this report, choose thefollowing fields:• Disk Sorts• Memory Sorts• Sort Overflow %
Lock Usage - Top 10Sessions(8.0)
Displays the ten sessions that are holding the highest numberof locks. To display this report, choose the Lock Requests field.
Longest Transactions- Top 10Sessions(8.0)
Displays the ten transactions that have placed other sessions inwait status for the longest amount of time. To display thisreport, choose the User Commits field.
Memory Usage - Top10 Sessions(8.0)
Displays the ten sessions that are using the most memory. Todisplay this report, choose the Session PGA Memory or SessionUGA Memory field.
1-74 Working with the Solution SetHitachi Tuning Manager Application Reports Reference

Report Name Description
Physical I/O - Top10 Sessions(8.0)
Displays the ten sessions that have the highest concentrationof I/O operations. To display this report, choose the Cache Hit% field.
System Overview (8.0) (Real-Time Rpt on the General Status ofInstance)
Overview
The System Overview(8.0) report displays in real-time the main performancedata indicating the general status of an instance.
Storage LocationReports/Oracle/Troubleshooting/Real-Time/
Record
System Stat Summary (PD)
Fields
Field Name Description
Cache Hit % Buffer cache usage. To display the Physical I/O - Top 10Sessions(8.0) report, choose this field.
Continued Row % Percentage of rows that are longer than one block or moved(continued rows or moved rows)
Current Logons Number of logons to the Oracle database during data collection
Deadlocks Number of process deadlocks caused by enqueues (locks)resulting from DML operations
Disk Sorts Number of disk sort operations. To display the Disk Sorts -Top 10 Sessions(8.0) report, choose this field.
Lock Requests Number of lock requests. To display the Lock Usage - Top 10Sessions(8.0) report, choose this field.
Memory Sorts Number of memory sort operations. To display the Disk Sorts- Top 10 Sessions(8.0) report, choose this field.
Session CPU Usage CPU time used in hundredths of a second
Session PGA Memory PGA size used by active sessions during data collection. Todisplay the Memory Usage - Top 10 Sessions(8.0) report,choose this field.
Session UGA Memory UGA size used by active sessions. To display the Memory Usage- Top 10 Sessions(8.0) report, choose this field.
Working with the Solution Set 1-75Hitachi Tuning Manager Application Reports Reference

Field Name Description
Sort Overflow % Percentage of sorts that used temporary segments. To displaythe Disk Sorts - Top 10 Sessions(8.0) report, choose thisfield.
Total SQL Executions Total number of SQL statement executions
User Calls Number of requests from application to database that havebeen processed
User Commits Number of transactions. To display the Longest Transactions- Top 10 Sessions(8.0) report, choose this field.
User Rollbacks Number of rollbacks
Drilldown Reports (Report Level)
Report Name Description
Database ActivityStatus(8.0)
Displays the instance activity status.
Database SpaceOverview(8.0)
Displays usage information about tablespaces and data files forthe instance.
Error Log(8.0) Displays the error messages that have been issued since theagent started.
Server ConfigurationStatus(4.0)
Displays all configuration parameter information for the server.
TablespaceStatus(4.0)
Displays all tablespace information.
Drilldown Report (Field Level)
Report Name Description
Disk Sorts - Top 10Sessions(8.0)
Displays the ten sessions that are performing disk sortoperations most frequently. To display this report, choose thefollowing fields:• Disk Sorts• Memory Sorts• Sort Overflow %
Lock Usage - Top 10Sessions(8.0)
Displays the ten sessions that are holding the highest numberof locks. To display this report, choose the Lock Requests field.
Longest Transactions- Top 10Sessions(8.0)
Displays the ten transactions that have placed other sessions inwait status for the longest amount of time. To display thisreport, choose the User Commits field.
Memory Usage - Top10 Sessions(8.0)
Displays the ten sessions that are using the most memory. Todisplay this report, choose the Session PGA Memory or SessionUGA Memory field.
1-76 Working with the Solution SetHitachi Tuning Manager Application Reports Reference
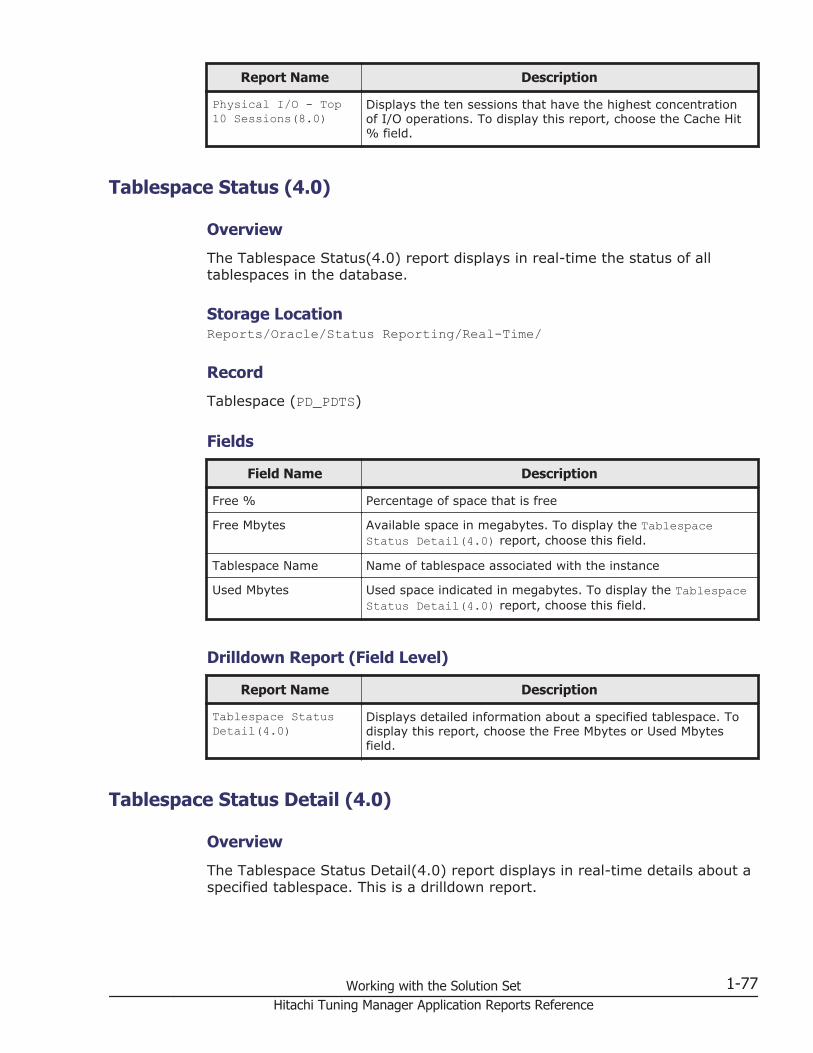
Report Name Description
Physical I/O - Top10 Sessions(8.0)
Displays the ten sessions that have the highest concentrationof I/O operations. To display this report, choose the Cache Hit% field.
Tablespace Status (4.0)
Overview
The Tablespace Status(4.0) report displays in real-time the status of alltablespaces in the database.
Storage LocationReports/Oracle/Status Reporting/Real-Time/
Record
Tablespace (PD_PDTS)
Fields
Field Name Description
Free % Percentage of space that is free
Free Mbytes Available space in megabytes. To display the TablespaceStatus Detail(4.0) report, choose this field.
Tablespace Name Name of tablespace associated with the instance
Used Mbytes Used space indicated in megabytes. To display the TablespaceStatus Detail(4.0) report, choose this field.
Drilldown Report (Field Level)
Report Name Description
Tablespace StatusDetail(4.0)
Displays detailed information about a specified tablespace. Todisplay this report, choose the Free Mbytes or Used Mbytesfield.
Tablespace Status Detail (4.0)
Overview
The Tablespace Status Detail(4.0) report displays in real-time details about aspecified tablespace. This is a drilldown report.
Working with the Solution Set 1-77Hitachi Tuning Manager Application Reports Reference
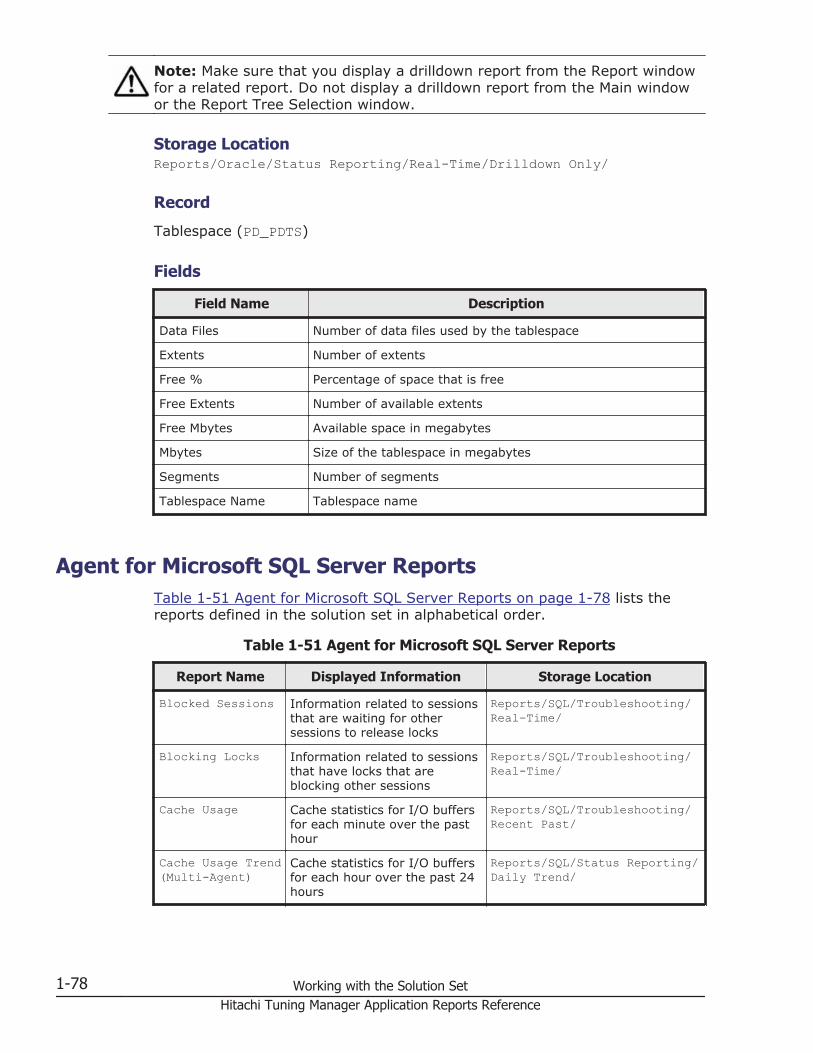
Note: Make sure that you display a drilldown report from the Report windowfor a related report. Do not display a drilldown report from the Main windowor the Report Tree Selection window.
Storage LocationReports/Oracle/Status Reporting/Real-Time/Drilldown Only/
Record
Tablespace (PD_PDTS)
Fields
Field Name Description
Data Files Number of data files used by the tablespace
Extents Number of extents
Free % Percentage of space that is free
Free Extents Number of available extents
Free Mbytes Available space in megabytes
Mbytes Size of the tablespace in megabytes
Segments Number of segments
Tablespace Name Tablespace name
Agent for Microsoft SQL Server ReportsTable 1-51 Agent for Microsoft SQL Server Reports on page 1-78 lists thereports defined in the solution set in alphabetical order.
Table 1-51 Agent for Microsoft SQL Server Reports
Report Name Displayed Information Storage Location
Blocked Sessions Information related to sessionsthat are waiting for othersessions to release locks
Reports/SQL/Troubleshooting/Real-Time/
Blocking Locks Information related to sessionsthat have locks that areblocking other sessions
Reports/SQL/Troubleshooting/Real-Time/
Cache Usage Cache statistics for I/O buffersfor each minute over the pasthour
Reports/SQL/Troubleshooting/Recent Past/
Cache Usage Trend(Multi-Agent)
Cache statistics for I/O buffersfor each hour over the past 24hours
Reports/SQL/Status Reporting/Daily Trend/
1-78 Working with the Solution SetHitachi Tuning Manager Application Reports Reference
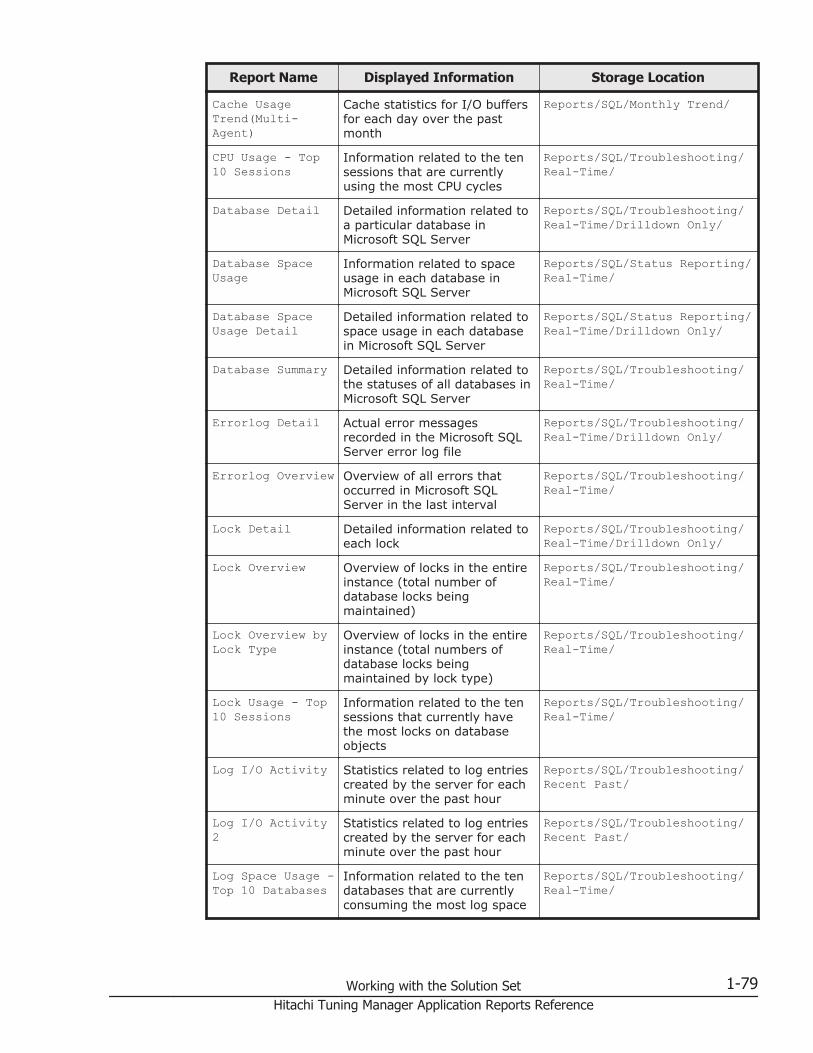
Report Name Displayed Information Storage Location
Cache UsageTrend(Multi-Agent)
Cache statistics for I/O buffersfor each day over the pastmonth
Reports/SQL/Monthly Trend/
CPU Usage - Top10 Sessions
Information related to the tensessions that are currentlyusing the most CPU cycles
Reports/SQL/Troubleshooting/Real-Time/
Database Detail Detailed information related toa particular database inMicrosoft SQL Server
Reports/SQL/Troubleshooting/Real-Time/Drilldown Only/
Database SpaceUsage
Information related to spaceusage in each database inMicrosoft SQL Server
Reports/SQL/Status Reporting/Real-Time/
Database SpaceUsage Detail
Detailed information related tospace usage in each databasein Microsoft SQL Server
Reports/SQL/Status Reporting/Real-Time/Drilldown Only/
Database Summary Detailed information related tothe statuses of all databases inMicrosoft SQL Server
Reports/SQL/Troubleshooting/Real-Time/
Errorlog Detail Actual error messagesrecorded in the Microsoft SQLServer error log file
Reports/SQL/Troubleshooting/Real-Time/Drilldown Only/
Errorlog Overview Overview of all errors thatoccurred in Microsoft SQLServer in the last interval
Reports/SQL/Troubleshooting/Real-Time/
Lock Detail Detailed information related toeach lock
Reports/SQL/Troubleshooting/Real-Time/Drilldown Only/
Lock Overview Overview of locks in the entireinstance (total number ofdatabase locks beingmaintained)
Reports/SQL/Troubleshooting/Real-Time/
Lock Overview byLock Type
Overview of locks in the entireinstance (total numbers ofdatabase locks beingmaintained by lock type)
Reports/SQL/Troubleshooting/Real-Time/
Lock Usage - Top10 Sessions
Information related to the tensessions that currently havethe most locks on databaseobjects
Reports/SQL/Troubleshooting/Real-Time/
Log I/O Activity Statistics related to log entriescreated by the server for eachminute over the past hour
Reports/SQL/Troubleshooting/Recent Past/
Log I/O Activity2
Statistics related to log entriescreated by the server for eachminute over the past hour
Reports/SQL/Troubleshooting/Recent Past/
Log Space Usage -Top 10 Databases
Information related to the tendatabases that are currentlyconsuming the most log space
Reports/SQL/Troubleshooting/Real-Time/
Working with the Solution Set 1-79Hitachi Tuning Manager Application Reports Reference
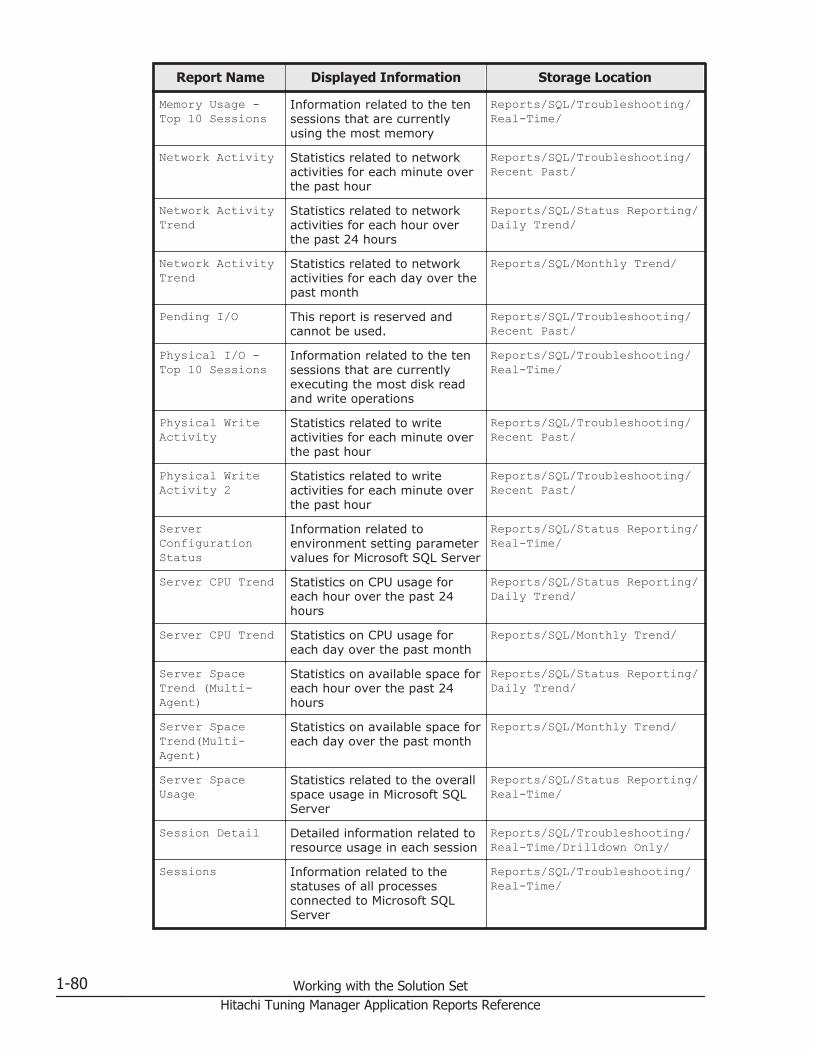
Report Name Displayed Information Storage Location
Memory Usage -Top 10 Sessions
Information related to the tensessions that are currentlyusing the most memory
Reports/SQL/Troubleshooting/Real-Time/
Network Activity Statistics related to networkactivities for each minute overthe past hour
Reports/SQL/Troubleshooting/Recent Past/
Network ActivityTrend
Statistics related to networkactivities for each hour overthe past 24 hours
Reports/SQL/Status Reporting/Daily Trend/
Network ActivityTrend
Statistics related to networkactivities for each day over thepast month
Reports/SQL/Monthly Trend/
Pending I/O This report is reserved andcannot be used.
Reports/SQL/Troubleshooting/Recent Past/
Physical I/O -Top 10 Sessions
Information related to the tensessions that are currentlyexecuting the most disk readand write operations
Reports/SQL/Troubleshooting/Real-Time/
Physical WriteActivity
Statistics related to writeactivities for each minute overthe past hour
Reports/SQL/Troubleshooting/Recent Past/
Physical WriteActivity 2
Statistics related to writeactivities for each minute overthe past hour
Reports/SQL/Troubleshooting/Recent Past/
ServerConfigurationStatus
Information related toenvironment setting parametervalues for Microsoft SQL Server
Reports/SQL/Status Reporting/Real-Time/
Server CPU Trend Statistics on CPU usage foreach hour over the past 24hours
Reports/SQL/Status Reporting/Daily Trend/
Server CPU Trend Statistics on CPU usage foreach day over the past month
Reports/SQL/Monthly Trend/
Server SpaceTrend (Multi-Agent)
Statistics on available space foreach hour over the past 24hours
Reports/SQL/Status Reporting/Daily Trend/
Server SpaceTrend(Multi-Agent)
Statistics on available space foreach day over the past month
Reports/SQL/Monthly Trend/
Server SpaceUsage
Statistics related to the overallspace usage in Microsoft SQLServer
Reports/SQL/Status Reporting/Real-Time/
Session Detail Detailed information related toresource usage in each session
Reports/SQL/Troubleshooting/Real-Time/Drilldown Only/
Sessions Information related to thestatuses of all processesconnected to Microsoft SQLServer
Reports/SQL/Troubleshooting/Real-Time/
1-80 Working with the Solution SetHitachi Tuning Manager Application Reports Reference
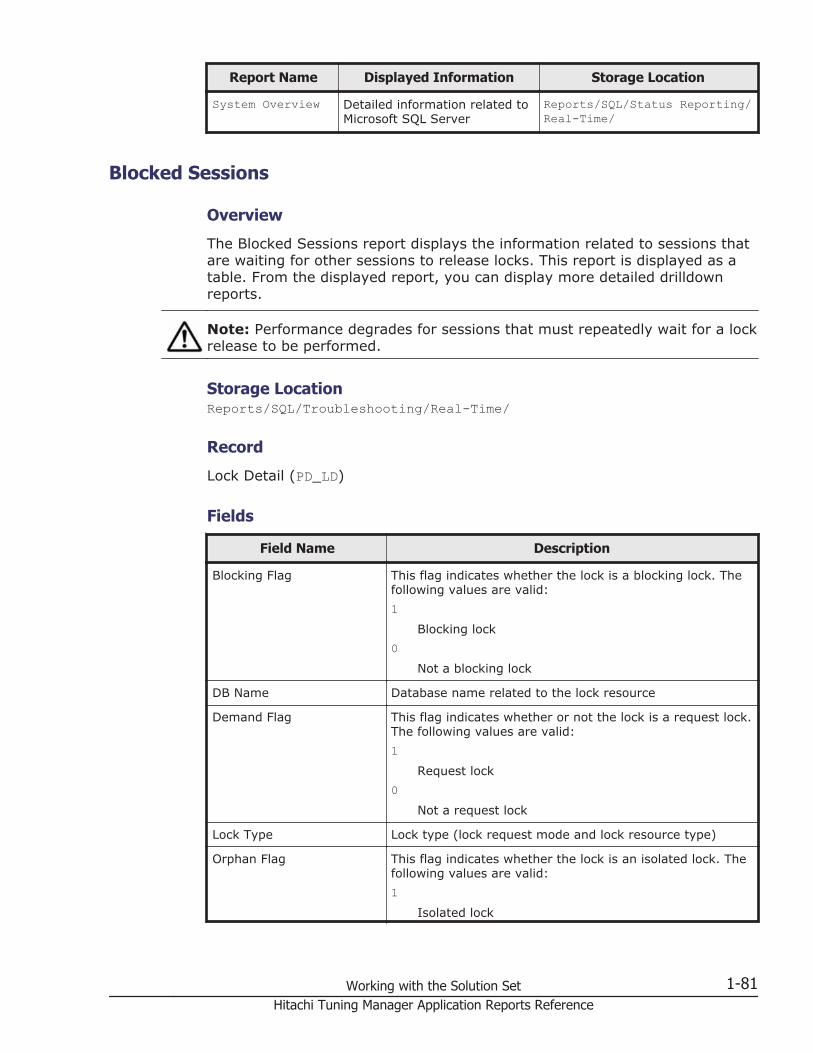
Report Name Displayed Information Storage Location
System Overview Detailed information related toMicrosoft SQL Server
Reports/SQL/Status Reporting/Real-Time/
Blocked Sessions
Overview
The Blocked Sessions report displays the information related to sessions thatare waiting for other sessions to release locks. This report is displayed as atable. From the displayed report, you can display more detailed drilldownreports.
Note: Performance degrades for sessions that must repeatedly wait for a lockrelease to be performed.
Storage LocationReports/SQL/Troubleshooting/Real-Time/
Record
Lock Detail (PD_LD)
Fields
Field Name Description
Blocking Flag This flag indicates whether the lock is a blocking lock. Thefollowing values are valid:1
Blocking lock0
Not a blocking lock
DB Name Database name related to the lock resource
Demand Flag This flag indicates whether or not the lock is a request lock.The following values are valid:1
Request lock0
Not a request lock
Lock Type Lock type (lock request mode and lock resource type)
Orphan Flag This flag indicates whether the lock is an isolated lock. Thefollowing values are valid:1
Isolated lock
Working with the Solution Set 1-81Hitachi Tuning Manager Application Reports Reference

Field Name Description0
Not an isolated lock
Program Name of the application program that is requesting the lock
SPID Process ID that is requesting the lock
Table Table name if the lock resource is a table or row
User Logon name of the user who issued the command
Drilldown Report (Field Level)
Report Name Description
Lock Detail Displays detailed information related to each lock. Todisplay this report, click the Lock Type field.
Session Detail Displays detailed information related to the status ofresource usage for each session. To display this report,click the SPID field.
Blocking Locks
Overview
The Blocking Locks report displays information related to sessions that havelocks that are blocking other sessions. The report is displayed as a table.From the displayed report, you can display more detailed drilldown reports.
Storage LocationReports/SQL/Troubleshooting/Real-Time/
Record
Lock Detail (PD_LD)
Fields
Field Name Description
Blocking Flag This flag indicates whether the lock is a blocking lock. Thefollowing values are valid:1
Blocking lock0
Not a blocking lock
DB Name Database name related to the lock resource
1-82 Working with the Solution SetHitachi Tuning Manager Application Reports Reference
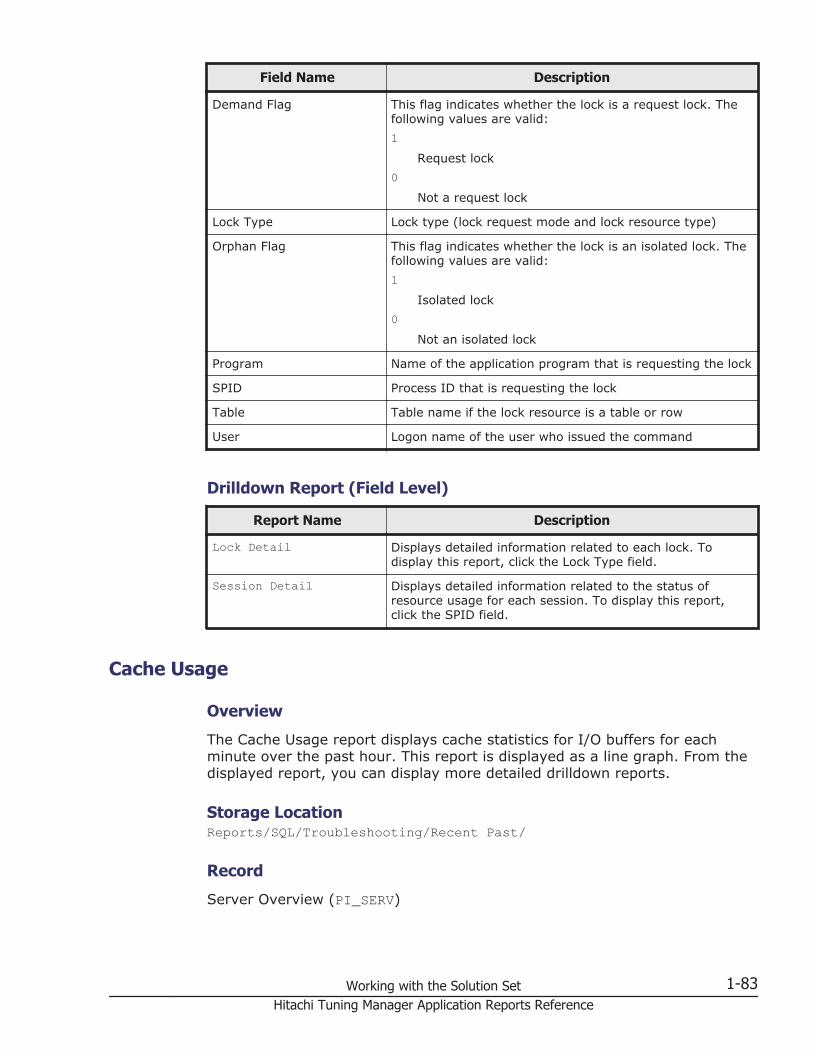
Field Name Description
Demand Flag This flag indicates whether the lock is a request lock. Thefollowing values are valid:1
Request lock0
Not a request lock
Lock Type Lock type (lock request mode and lock resource type)
Orphan Flag This flag indicates whether the lock is an isolated lock. Thefollowing values are valid:1
Isolated lock0
Not an isolated lock
Program Name of the application program that is requesting the lock
SPID Process ID that is requesting the lock
Table Table name if the lock resource is a table or row
User Logon name of the user who issued the command
Drilldown Report (Field Level)
Report Name Description
Lock Detail Displays detailed information related to each lock. Todisplay this report, click the Lock Type field.
Session Detail Displays detailed information related to the status ofresource usage for each session. To display this report,click the SPID field.
Cache Usage
Overview
The Cache Usage report displays cache statistics for I/O buffers for eachminute over the past hour. This report is displayed as a line graph. From thedisplayed report, you can display more detailed drilldown reports.
Storage LocationReports/SQL/Troubleshooting/Recent Past/
Record
Server Overview (PI_SERV)
Working with the Solution Set 1-83Hitachi Tuning Manager Application Reports Reference
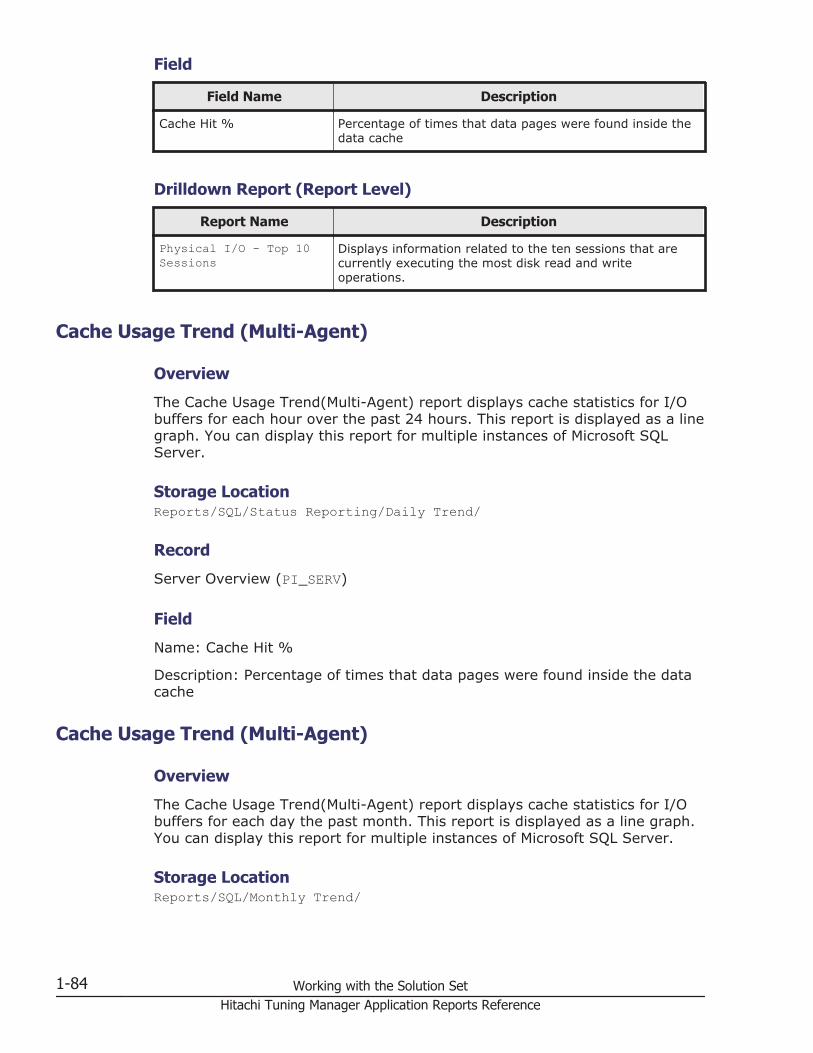
Field
Field Name Description
Cache Hit % Percentage of times that data pages were found inside thedata cache
Drilldown Report (Report Level)
Report Name Description
Physical I/O - Top 10Sessions
Displays information related to the ten sessions that arecurrently executing the most disk read and writeoperations.
Cache Usage Trend (Multi-Agent)
Overview
The Cache Usage Trend(Multi-Agent) report displays cache statistics for I/Obuffers for each hour over the past 24 hours. This report is displayed as a linegraph. You can display this report for multiple instances of Microsoft SQLServer.
Storage LocationReports/SQL/Status Reporting/Daily Trend/
Record
Server Overview (PI_SERV)
Field
Name: Cache Hit %
Description: Percentage of times that data pages were found inside the datacache
Cache Usage Trend (Multi-Agent)
Overview
The Cache Usage Trend(Multi-Agent) report displays cache statistics for I/Obuffers for each day the past month. This report is displayed as a line graph.You can display this report for multiple instances of Microsoft SQL Server.
Storage LocationReports/SQL/Monthly Trend/
1-84 Working with the Solution SetHitachi Tuning Manager Application Reports Reference

Record
Server Overview (PI_SERV)
Field
Name: Cache Hit %
Description: Percentage of times that data pages were found inside the datacache
CPU Usage - Top 10 Sessions
Overview
The CPU Usage - Top 10 Sessions report displays information related to theten sessions that are currently using the most CPU cycles. This report isdisplayed as a bar graph. From the displayed report, you can display moredetailed drilldown reports.
Storage LocationReports/SQL/Troubleshooting/Real-Time/
Record
Process Detail (PD_PDET)
Fields
Field Name Description
Command Name of the command being executed
CPU % CPU time used by the process as a percentage of the CPUtime used by all database processes
Physical I/O Total number of times the process performed disk read andwrite operations
Program Application program name
SPID Process ID
User Logon name of the user who issued the command
Drilldown Report (Field Level)
Report Name Description
Session Detail Displays detailed information related to resource usage foreach session. To display this report, click the CPU % field.
Working with the Solution Set 1-85Hitachi Tuning Manager Application Reports Reference
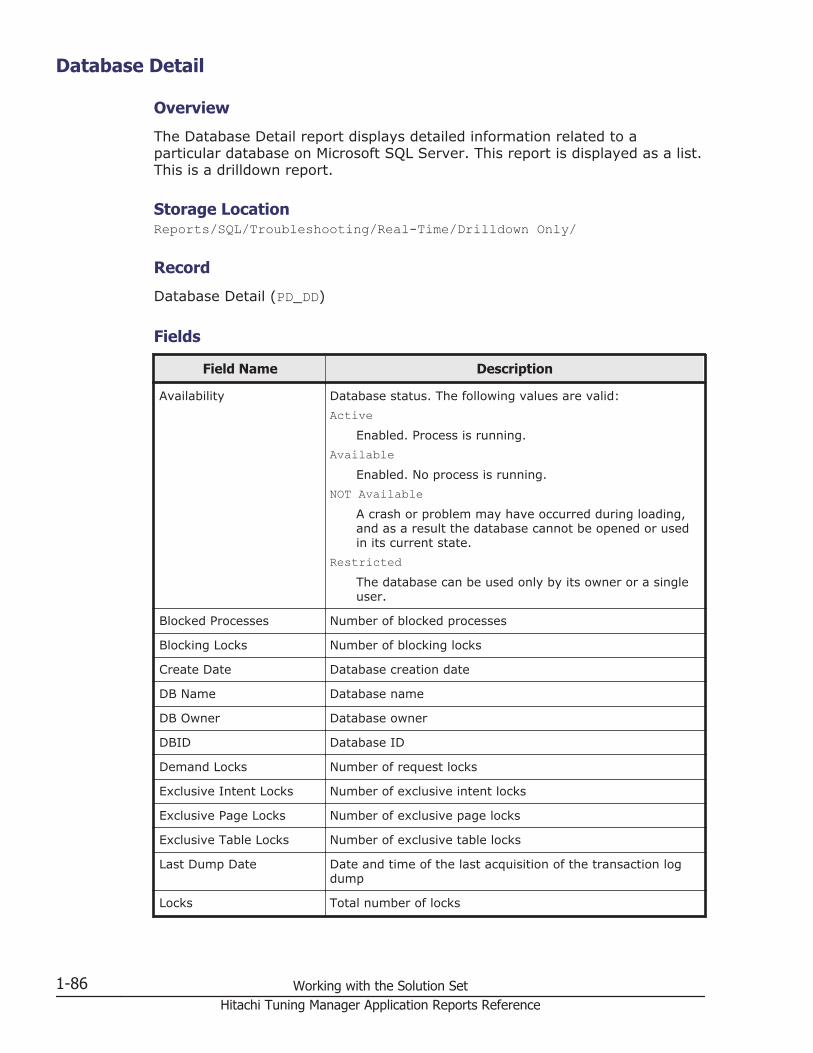
Database Detail
Overview
The Database Detail report displays detailed information related to aparticular database on Microsoft SQL Server. This report is displayed as a list.This is a drilldown report.
Storage LocationReports/SQL/Troubleshooting/Real-Time/Drilldown Only/
Record
Database Detail (PD_DD)
Fields
Field Name Description
Availability Database status. The following values are valid:Active
Enabled. Process is running.Available
Enabled. No process is running.NOT Available
A crash or problem may have occurred during loading,and as a result the database cannot be opened or usedin its current state.
RestrictedThe database can be used only by its owner or a singleuser.
Blocked Processes Number of blocked processes
Blocking Locks Number of blocking locks
Create Date Database creation date
DB Name Database name
DB Owner Database owner
DBID Database ID
Demand Locks Number of request locks
Exclusive Intent Locks Number of exclusive intent locks
Exclusive Page Locks Number of exclusive page locks
Exclusive Table Locks Number of exclusive table locks
Last Dump Date Date and time of the last acquisition of the transaction logdump
Locks Total number of locks
1-86 Working with the Solution SetHitachi Tuning Manager Application Reports Reference
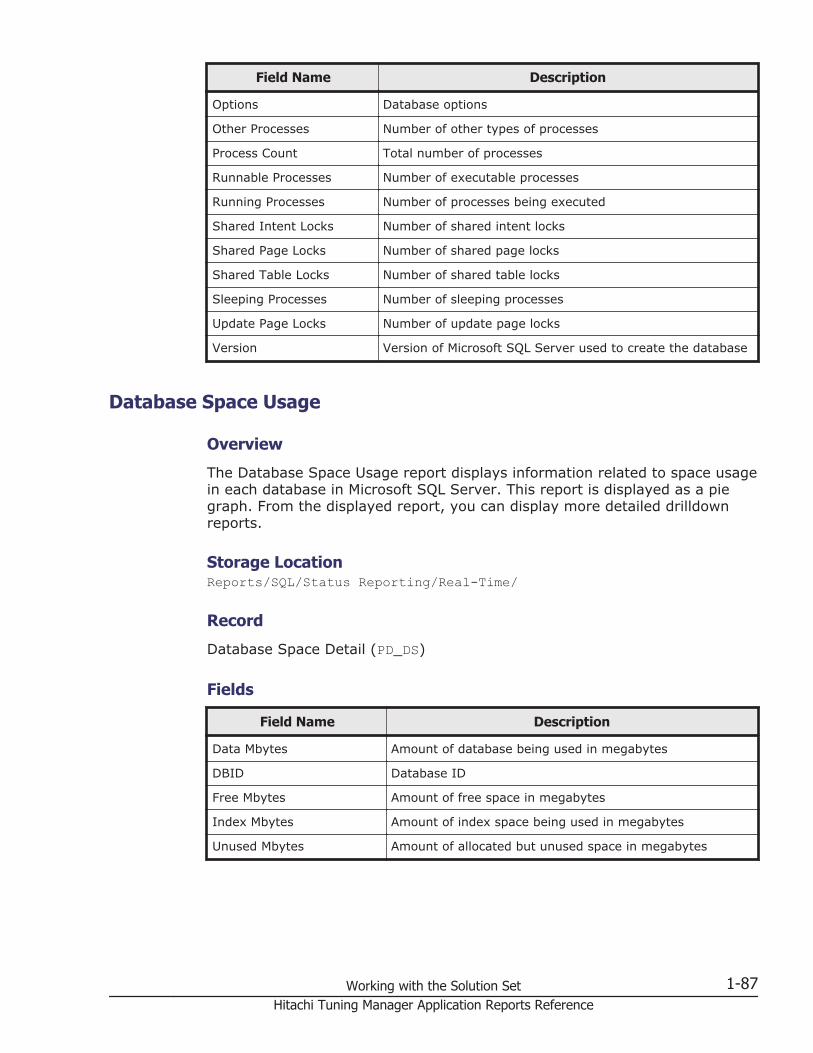
Field Name Description
Options Database options
Other Processes Number of other types of processes
Process Count Total number of processes
Runnable Processes Number of executable processes
Running Processes Number of processes being executed
Shared Intent Locks Number of shared intent locks
Shared Page Locks Number of shared page locks
Shared Table Locks Number of shared table locks
Sleeping Processes Number of sleeping processes
Update Page Locks Number of update page locks
Version Version of Microsoft SQL Server used to create the database
Database Space Usage
Overview
The Database Space Usage report displays information related to space usagein each database in Microsoft SQL Server. This report is displayed as a piegraph. From the displayed report, you can display more detailed drilldownreports.
Storage LocationReports/SQL/Status Reporting/Real-Time/
Record
Database Space Detail (PD_DS)
Fields
Field Name Description
Data Mbytes Amount of database being used in megabytes
DBID Database ID
Free Mbytes Amount of free space in megabytes
Index Mbytes Amount of index space being used in megabytes
Unused Mbytes Amount of allocated but unused space in megabytes
Working with the Solution Set 1-87Hitachi Tuning Manager Application Reports Reference

Drilldown Report (Report Level)
Report Name Description
Database Space UsageDetail
Displays detailed information related to space usage ineach database.
Drilldown Report (Field Level)
Report Name Description
Database Space UsageDetail
Displays detailed information related to space usage ineach database. To display this report, click the followingfields:• Data Mbytes• Free Mbytes• Index Mbytes• Unused Mbytes
Database Space Usage Detail
Overview
The Database Space Usage Detail report displays detailed information relatedto space usage in each database on Microsoft SQL Server. This report isdisplayed as a list. This is a drilldown report.
Storage LocationReports/SQL/Status Reporting/Real-Time/Drilldown Only/
Record
Database Space Detail (PD_DS)
Fields
Field Name Description
Data Mbytes Amount of database being used in megabytes
DB Name Database name
DB Size Database size in megabytes
DBID Database ID
Free Mbytes Amount of unallocated space in megabytes
Index Mbytes Amount of index space being used in megabytes
Log Mbytes Amount of log space being used in megabytes
Rsvd Mbytes Amount of allocated space in megabytes
1-88 Working with the Solution SetHitachi Tuning Manager Application Reports Reference

Field Name Description
Unused Mbytes Amount of allocated but unused space in megabytes
Database Summary
Overview
The Database Summary report displays detailed information related to thestatuses of all databases in Microsoft SQL Server. This report is displayed as atable. From the displayed report, you can display more detailed drilldownreports.
Storage LocationReports/SQL/Troubleshooting/Real-Time/
Record
Database Detail (PD_DD)
Fields
Field Name Description
Availability Database status. The following values are valid:Active
Enabled. Process is running.Available
Enabled. No process is running.NOT Available
A crash or problem may have occurred during loading,and as a result the database cannot be opened or usedin its current state.
RestrictedDatabase can be used only by its owner or a singleuser.
Blocked Processes Number of blocked processes
Blocking Locks Number of blocking locks
Create Date Database creation date
DB Name Database name
DB Owner Database owner
DBID Database ID
Last Dump Date Date and time of the last acquisition of the transaction logdump
Locks Total number of locks
Working with the Solution Set 1-89Hitachi Tuning Manager Application Reports Reference
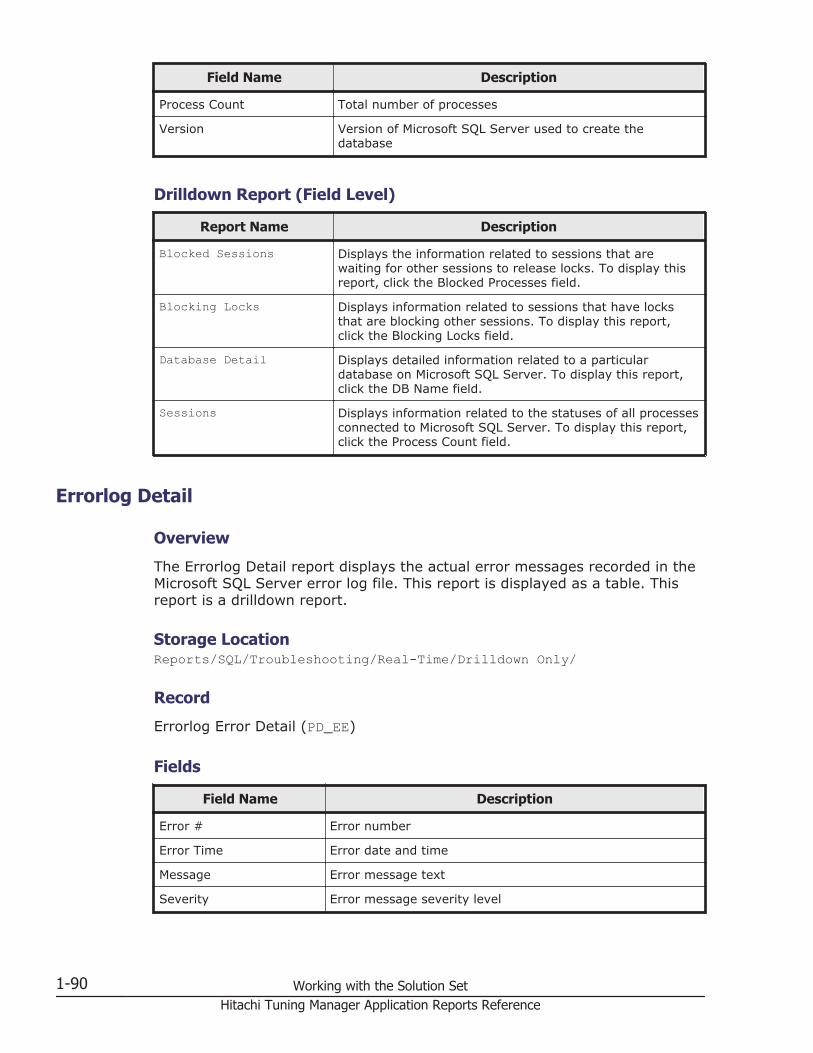
Field Name Description
Process Count Total number of processes
Version Version of Microsoft SQL Server used to create thedatabase
Drilldown Report (Field Level)
Report Name Description
Blocked Sessions Displays the information related to sessions that arewaiting for other sessions to release locks. To display thisreport, click the Blocked Processes field.
Blocking Locks Displays information related to sessions that have locksthat are blocking other sessions. To display this report,click the Blocking Locks field.
Database Detail Displays detailed information related to a particulardatabase on Microsoft SQL Server. To display this report,click the DB Name field.
Sessions Displays information related to the statuses of all processesconnected to Microsoft SQL Server. To display this report,click the Process Count field.
Errorlog Detail
Overview
The Errorlog Detail report displays the actual error messages recorded in theMicrosoft SQL Server error log file. This report is displayed as a table. Thisreport is a drilldown report.
Storage LocationReports/SQL/Troubleshooting/Real-Time/Drilldown Only/
Record
Errorlog Error Detail (PD_EE)
Fields
Field Name Description
Error # Error number
Error Time Error date and time
Message Error message text
Severity Error message severity level
1-90 Working with the Solution SetHitachi Tuning Manager Application Reports Reference
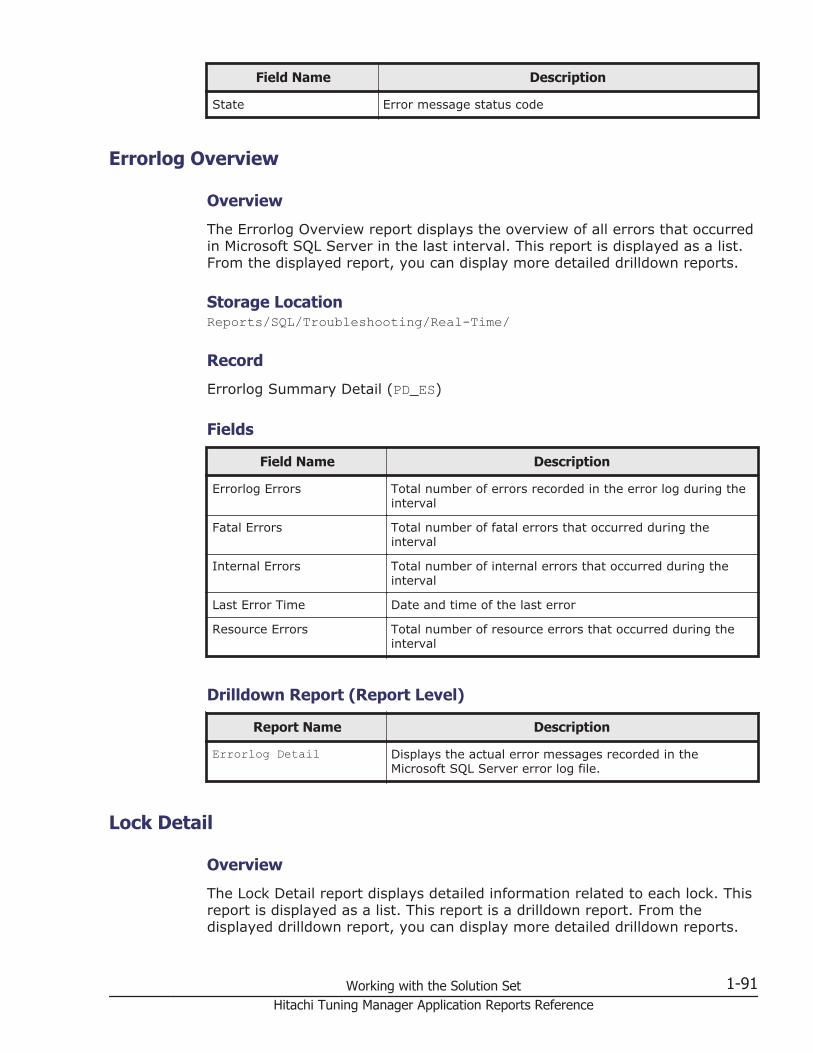
Field Name Description
State Error message status code
Errorlog Overview
Overview
The Errorlog Overview report displays the overview of all errors that occurredin Microsoft SQL Server in the last interval. This report is displayed as a list.From the displayed report, you can display more detailed drilldown reports.
Storage LocationReports/SQL/Troubleshooting/Real-Time/
Record
Errorlog Summary Detail (PD_ES)
Fields
Field Name Description
Errorlog Errors Total number of errors recorded in the error log during theinterval
Fatal Errors Total number of fatal errors that occurred during theinterval
Internal Errors Total number of internal errors that occurred during theinterval
Last Error Time Date and time of the last error
Resource Errors Total number of resource errors that occurred during theinterval
Drilldown Report (Report Level)
Report Name Description
Errorlog Detail Displays the actual error messages recorded in theMicrosoft SQL Server error log file.
Lock Detail
Overview
The Lock Detail report displays detailed information related to each lock. Thisreport is displayed as a list. This report is a drilldown report. From thedisplayed drilldown report, you can display more detailed drilldown reports.
Working with the Solution Set 1-91Hitachi Tuning Manager Application Reports Reference
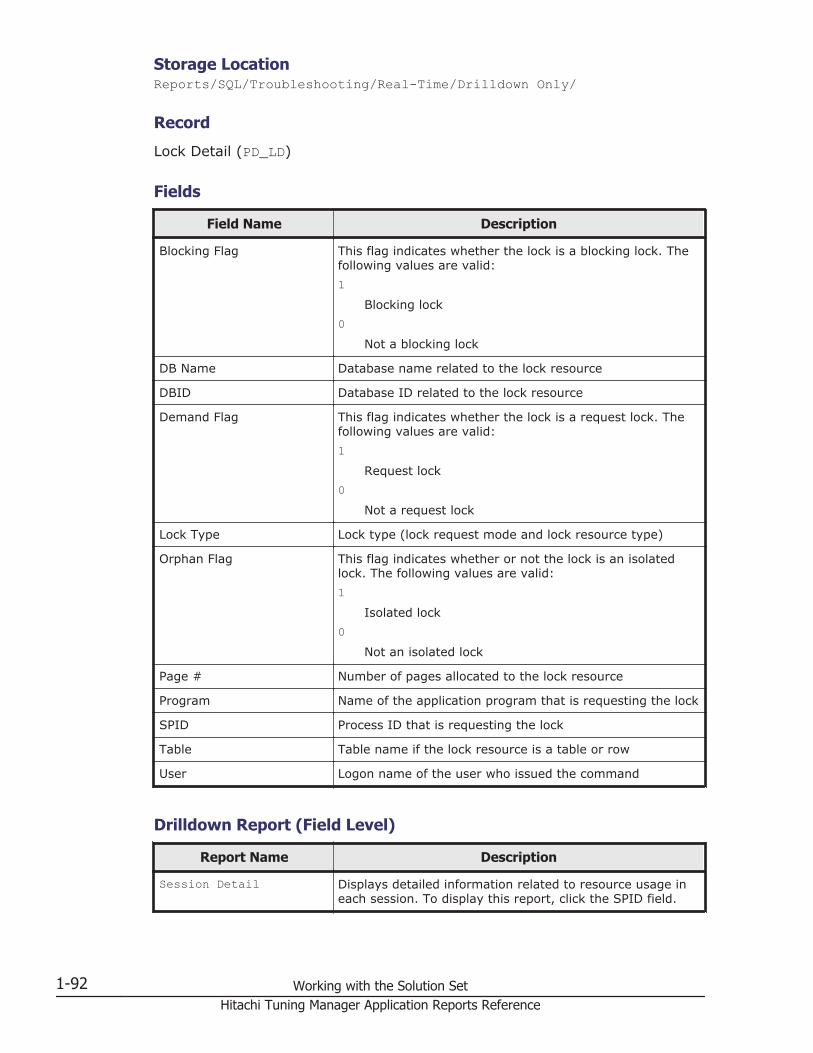
Storage LocationReports/SQL/Troubleshooting/Real-Time/Drilldown Only/
Record
Lock Detail (PD_LD)
Fields
Field Name Description
Blocking Flag This flag indicates whether the lock is a blocking lock. Thefollowing values are valid:1
Blocking lock0
Not a blocking lock
DB Name Database name related to the lock resource
DBID Database ID related to the lock resource
Demand Flag This flag indicates whether the lock is a request lock. Thefollowing values are valid:1
Request lock0
Not a request lock
Lock Type Lock type (lock request mode and lock resource type)
Orphan Flag This flag indicates whether or not the lock is an isolatedlock. The following values are valid:1
Isolated lock0
Not an isolated lock
Page # Number of pages allocated to the lock resource
Program Name of the application program that is requesting the lock
SPID Process ID that is requesting the lock
Table Table name if the lock resource is a table or row
User Logon name of the user who issued the command
Drilldown Report (Field Level)
Report Name Description
Session Detail Displays detailed information related to resource usage ineach session. To display this report, click the SPID field.
1-92 Working with the Solution SetHitachi Tuning Manager Application Reports Reference

Lock Overview
Overview
The Lock Overview report displays the overview of locks in the entire instanceas the total number of database locks being maintained. This report isdisplayed as a list. From the displayed report, you can display more detaileddrilldown reports.
Storage LocationReports/SQL/Troubleshooting/Real-Time/
Record
Server Locks Detail (PD_LOCK)
Fields
Field Name Description
Total Blocking Locks Number of locks that are blocking other processes
Total Exclusive Locks Total number of exclusive locks
Total Extent Locks Total number of extent locks
Total Intent Locks Total number of intent locks
Total Locks Total number of locks being used by Microsoft SQL Server
Total Page Locks Total number of page locks
Total Shared Locks Total number of shared locks
Total Table Locks Total number of table locks
Users Blocked Number of users who are blocked by other users
Drilldown Report (Report Level)
Report Name Description
Lock Overview by LockType
Displays the overview of locks in the entire instance as thetotal numbers of database locks being maintained by locktype.
Drilldown Report (Field Level)
Report Name Description
Blocked Sessions Displays the information related to sessions that arewaiting for other sessions to release locks. To display thisreport, click the Users Blocked field.
Working with the Solution Set 1-93Hitachi Tuning Manager Application Reports Reference

Report Name Description
Blocking Locks Displays information related to sessions that have locksthat are blocking other sessions. To display this report,click the Total Blocking Locks field.
Lock Overview by Lock Type
Overview
The Lock Overview by Lock Type report displays the overview of locks in theentire instance as the total number of database locks being maintained bylock type. This report is displayed as a list.
Storage LocationReports/SQL/Troubleshooting/Real-Time/
Record
Server Locks Detail (PD_LOCK)
Fields
Field Name Description
Exclusive Extent Locks Number of exclusive extent locks
Exclusive Intent Locks Number of exclusive intent locks
Exclusive Page Locks Number of exclusive page locks
Exclusive Table Locks Number of exclusive table locks
Shared Intent Locks Number of shared intent locks
Shared Page Locks Number of shared page locks
Shared Table Locks Number of shared table locks
Update Extent Locks Number of update extent locks
Update Page Locks Number of update page locks
Lock Usage - Top 10 Sessions
Overview
The Lock Usage - Top 10 Sessions report displays information related to theten sessions that currently have the most locks on database objects. Thisreport is displayed as a bar graph. From the displayed report, you can displaymore detailed drilldown reports.
1-94 Working with the Solution SetHitachi Tuning Manager Application Reports Reference

Storage LocationReports/SQL/Troubleshooting/Real-Time/
Record
Process Detail (PD_PDET)
Fields
Field Name Description
Blocked Processes Number of processes blocked by the process
DB Name Name of the database being used by the process at thetime of record acquisition
Locks Number of locks being requested by the process at thetime of record acquisition
Program Application program name
SPID Process ID
User Logon name of the user who issued the command
Drilldown Report (Field Level)
Report Name Description
Session Detail Displays detailed information related to resource usage ineach session. To display this report, click the Locks field.
Log I/O Activity
Overview
The Log I/O Activity report displays statistics related to log entries by serverfor each minute over the past hour. This report is displayed as a line graph.
Storage LocationReports/SQL/Troubleshooting/Recent Past/
Record
Server Overview (PI_SERV)
Field
Name: Log Writes/sec
Description: Total number of log pages physically written onto a disk
Working with the Solution Set 1-95Hitachi Tuning Manager Application Reports Reference
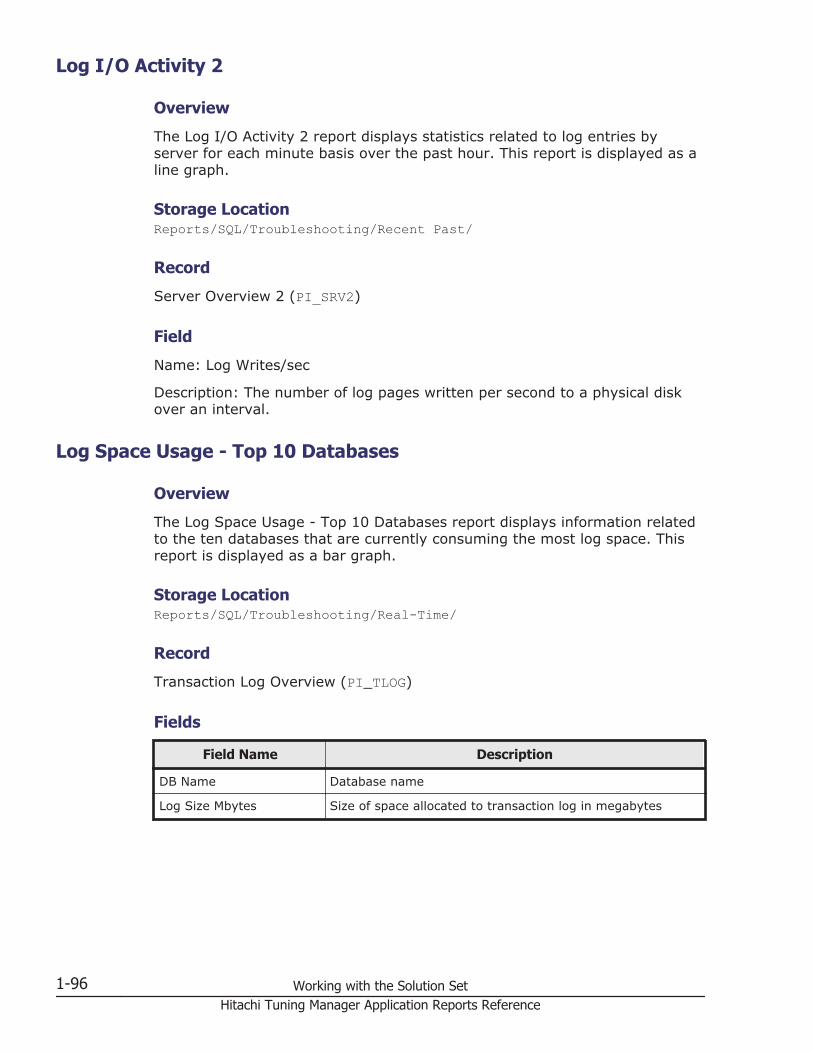
Log I/O Activity 2
Overview
The Log I/O Activity 2 report displays statistics related to log entries byserver for each minute basis over the past hour. This report is displayed as aline graph.
Storage LocationReports/SQL/Troubleshooting/Recent Past/
Record
Server Overview 2 (PI_SRV2)
Field
Name: Log Writes/sec
Description: The number of log pages written per second to a physical diskover an interval.
Log Space Usage - Top 10 Databases
Overview
The Log Space Usage - Top 10 Databases report displays information relatedto the ten databases that are currently consuming the most log space. Thisreport is displayed as a bar graph.
Storage LocationReports/SQL/Troubleshooting/Real-Time/
Record
Transaction Log Overview (PI_TLOG)
Fields
Field Name Description
DB Name Database name
Log Size Mbytes Size of space allocated to transaction log in megabytes
1-96 Working with the Solution SetHitachi Tuning Manager Application Reports Reference

Memory Usage - Top 10 Sessions
Overview
The Memory Usage - Top 10 Sessions report displays information related tothe ten sessions that are currently using the most memory. This report isdisplayed as a bar graph. From the displayed report, you can display moredetailed drilldown reports.
Storage LocationReports/SQL/Troubleshooting/Real-Time/
Record
Process Detail (PD_PDET)
Fields
Field Name Description
Mem Usage Number of procedure cache pages allocated to the process(1 page equals 8 kilobytes)
Program Application program name
Drilldown Report (Field Level)
Report Name Description
Session Detail Displays detailed information related to resource usage ineach session. To display this report, click the Mem Usagefield.
Network Activity
Overview
The Network Activity report displays statistics related to network activities foreach minute over the past hour. This report is displayed as a line graph.
Storage LocationReports/SQL/Troubleshooting/Recent Past/
Record
Global Server Summary (PI)
Working with the Solution Set 1-97Hitachi Tuning Manager Application Reports Reference

Fields
Field Name Description
Pkt Errors Number of packet errors
Pkts Rcvd Number of packets received
Pkts Sent Number of packets sent
Network Activity Trend
Overview
The Network Activity Trend report displays statistics related to networkactivities for each hour over the past 24 hours. This report is displayed as aline graph.
Storage LocationReports/SQL/Status Reporting/Daily Trend/
Record
Global Server Summary (PI)
Fields
Field Name Description
Pkt Errors Number of packet errors
Pkts Rcvd Number of packets received
Pkts Sent Number of packets sent
Network Activity Trend
Overview
The Network Activity Trend report displays statistics related to networkactivities for each day over the past month. This report is displayed as a linegraph.
Storage LocationReports/SQL/Monthly Trend/
Record
Global Server Summary (PI)
1-98 Working with the Solution SetHitachi Tuning Manager Application Reports Reference
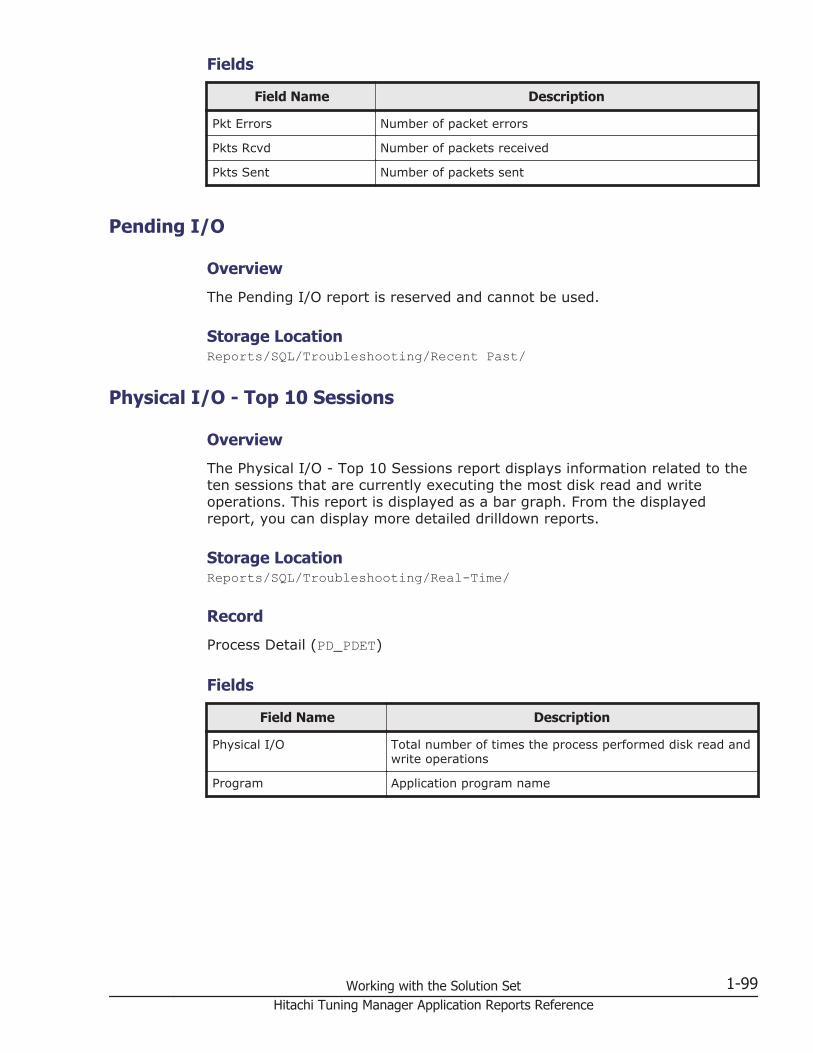
Fields
Field Name Description
Pkt Errors Number of packet errors
Pkts Rcvd Number of packets received
Pkts Sent Number of packets sent
Pending I/O
Overview
The Pending I/O report is reserved and cannot be used.
Storage LocationReports/SQL/Troubleshooting/Recent Past/
Physical I/O - Top 10 Sessions
Overview
The Physical I/O - Top 10 Sessions report displays information related to theten sessions that are currently executing the most disk read and writeoperations. This report is displayed as a bar graph. From the displayedreport, you can display more detailed drilldown reports.
Storage LocationReports/SQL/Troubleshooting/Real-Time/
Record
Process Detail (PD_PDET)
Fields
Field Name Description
Physical I/O Total number of times the process performed disk read andwrite operations
Program Application program name
Working with the Solution Set 1-99Hitachi Tuning Manager Application Reports Reference

Drilldown Report (Field Level)
Report Name Description
Session Detail Displays detailed information related to resource usage foreach session. To display this report, click the Physical I/Ofield.
Physical Write Activity
Overview
The Physical Write Activity report displays statistics related to write activitiesfor each minute over the past hour. This report is displayed as a line graph.
You can use this report to view the statistics on physical and delayed writing.
Storage LocationReports/SQL/Troubleshooting/Recent Past/
Record
Server Overview (PI_SERV)
Fields
Field Name Description
Lazy Writes/sec Total number of pages flushed by Lazy Writer to a disk (1page equals 8 kilobytes)
Page Writes/sec Total number of physical page write operations
Physical Write Activity 2
Overview
The Physical Write Activity 2 report displays statistics related to writeactivities for each minute over the past hour. This report is displayed as a linegraph.
You can use this report to view the statistics on physical and delayed writing.
Storage LocationReports/SQL/Troubleshooting/Recent Past/
Record
Server Overview 2 (PI_SRV2)
1-100 Working with the Solution SetHitachi Tuning Manager Application Reports Reference

Fields
Field Name Description
Lazy Writes/sec Number of pages (where a page is 8 KB) flushed per secondto a disk by Lazy Writer over an interval
Page Writes/sec Number of times physical page writes were performed persecond over an interval
Server Configuration Status
Overview
The Server Configuration Status report displays information related toenvironment setting parameter values for Microsoft SQL Server. This report isdisplayed as a table.
Storage LocationReports/SQL/Status Reporting/Real-Time/
Record
Config Detail (PD_CD)
Fields
Field Name Description
Config Value Environment setting option value
Current Run Value Environment setting option value (execution value duringdata collection)
Max Value Maximum value of environment setting option
Min Value Minimum value of environment setting option
Name Name of environment setting option
Server CPU Trend
Overview
The Server CPU Trend report displays statistics on CPU usage for each hourover the past 24 hours. This report is displayed as a line graph.
Storage LocationReports/SQL/Status Reporting/Daily Trend/
Working with the Solution Set 1-101Hitachi Tuning Manager Application Reports Reference

Record
Global Server Summary (PI)
Fields
Field Name Description
CPU % Percentage of time that the CPU is busy
I/O % Percentage of CPU time spent for I/O
Idle % Percentage of time that the CPU is idle
Server CPU Trend
Overview
The Server CPU Trend report displays statistics on CPU usage for each dayover the past month.This report is displayed as a line graph.
Storage LocationReports/SQL/Monthly Trend/
Record
Global Server Summary (PI)
Fields
Field Name Description
CPU % Percentage of time that the CPU is busy
I/O % Percentage of CPU time spent for I/O
Idle % Percentage of time that the CPU is idle
Server Space Trend (Multi-Agent)
Overview
The Server Space Trend(Multi-Agent) report displays statistics on availablespace for each hour over the past 24 hours. This report is displayed as a linegraph. You can display this report for multiple instances of Microsoft SQLServer.
Storage LocationReports/SQL/Status Reporting/Daily Trend/
1-102 Working with the Solution SetHitachi Tuning Manager Application Reports Reference

Record
Server Space Interval (PI_SI)
Field
Name: Free %
Description: Percentage of free space to the size of the entire database
Server Space Trend (Multi-Agent)
Overview
The Server Space Trend(Multi-Agent) report displays statistics on availablespace for each day over the past month. This report is displayed as a linegraph. You can display this report for multiple instances of Microsoft SQLServer.
Storage LocationReports/SQL/Monthly Trend/
Record
Server Space Interval (PI_SI)
Field
Name: Free %
Description: Ratio (as a percent) of free space to the size of the entiredatabase
Server Space Usage
Overview
The Server Space Usage report displays statistics related to the overall spaceusage in Microsoft SQL Server. This report is displayed as a pie graph and alist. From the displayed report, you can display more detailed drilldownreports.
Storage LocationReports/SQL/Status Reporting/Real-Time/
Record
Server Space Detail (PD_SS)
Working with the Solution Set 1-103Hitachi Tuning Manager Application Reports Reference
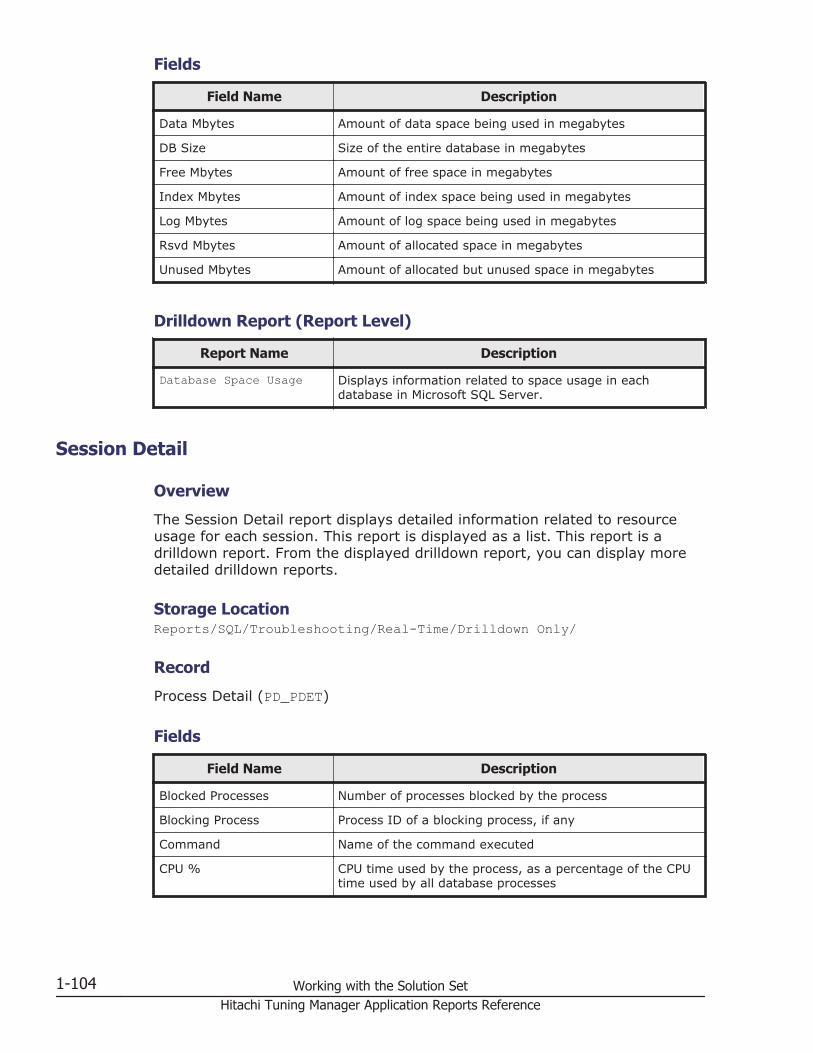
Fields
Field Name Description
Data Mbytes Amount of data space being used in megabytes
DB Size Size of the entire database in megabytes
Free Mbytes Amount of free space in megabytes
Index Mbytes Amount of index space being used in megabytes
Log Mbytes Amount of log space being used in megabytes
Rsvd Mbytes Amount of allocated space in megabytes
Unused Mbytes Amount of allocated but unused space in megabytes
Drilldown Report (Report Level)
Report Name Description
Database Space Usage Displays information related to space usage in eachdatabase in Microsoft SQL Server.
Session Detail
Overview
The Session Detail report displays detailed information related to resourceusage for each session. This report is displayed as a list. This report is adrilldown report. From the displayed drilldown report, you can display moredetailed drilldown reports.
Storage LocationReports/SQL/Troubleshooting/Real-Time/Drilldown Only/
Record
Process Detail (PD_PDET)
Fields
Field Name Description
Blocked Processes Number of processes blocked by the process
Blocking Process Process ID of a blocking process, if any
Command Name of the command executed
CPU % CPU time used by the process, as a percentage of the CPUtime used by all database processes
1-104 Working with the Solution SetHitachi Tuning Manager Application Reports Reference
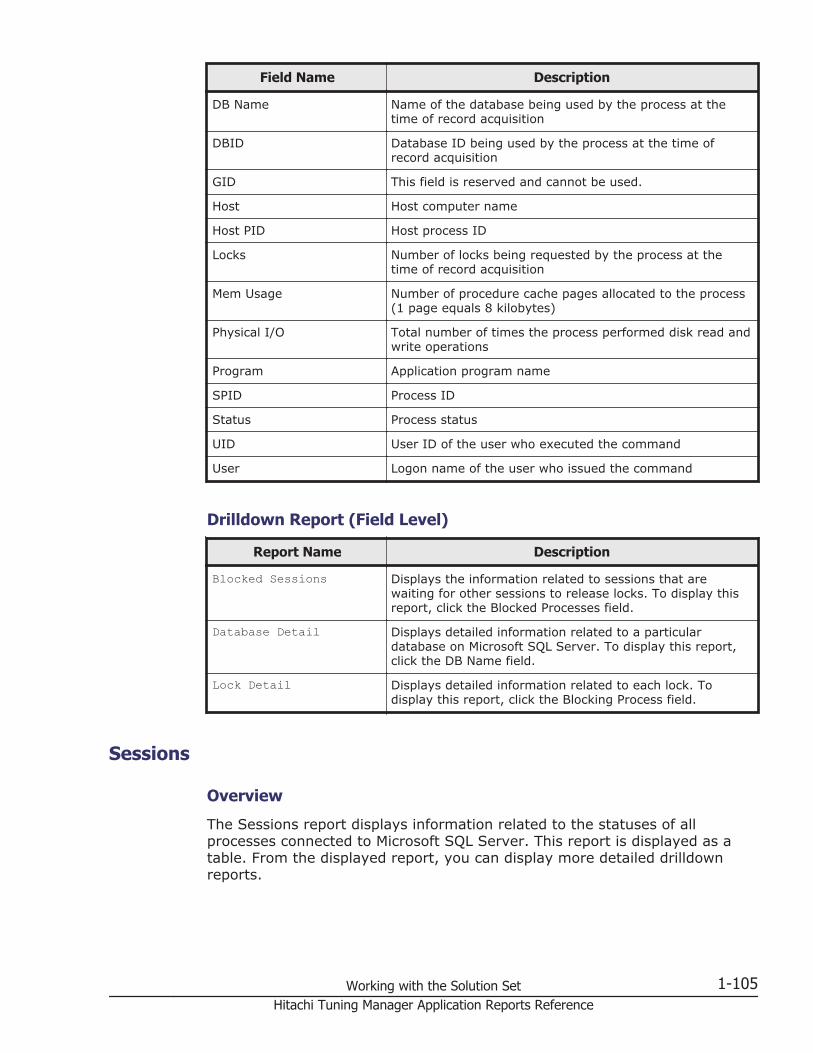
Field Name Description
DB Name Name of the database being used by the process at thetime of record acquisition
DBID Database ID being used by the process at the time ofrecord acquisition
GID This field is reserved and cannot be used.
Host Host computer name
Host PID Host process ID
Locks Number of locks being requested by the process at thetime of record acquisition
Mem Usage Number of procedure cache pages allocated to the process(1 page equals 8 kilobytes)
Physical I/O Total number of times the process performed disk read andwrite operations
Program Application program name
SPID Process ID
Status Process status
UID User ID of the user who executed the command
User Logon name of the user who issued the command
Drilldown Report (Field Level)
Report Name Description
Blocked Sessions Displays the information related to sessions that arewaiting for other sessions to release locks. To display thisreport, click the Blocked Processes field.
Database Detail Displays detailed information related to a particulardatabase on Microsoft SQL Server. To display this report,click the DB Name field.
Lock Detail Displays detailed information related to each lock. Todisplay this report, click the Blocking Process field.
Sessions
Overview
The Sessions report displays information related to the statuses of allprocesses connected to Microsoft SQL Server. This report is displayed as atable. From the displayed report, you can display more detailed drilldownreports.
Working with the Solution Set 1-105Hitachi Tuning Manager Application Reports Reference

Storage LocationReports/SQL/Troubleshooting/Real-Time/
Record
Process Detail (PD_PDET)
Fields
Field Name Description
Blocked Processes Number of processes blocked by the process
Blocking Process Process ID of a blocking process, if any
DB Name Name of the database being used by the process at thetime of record acquisition
DBID Database ID being used by the process at the time ofrecord acquisition
Mem Usage Number of procedure cache pages allocated to the process(1 page equals 8 kilobytes)
Program Application program name
SPID Process ID
User Logon name of the user who issued the command
Drilldown Report (Field Level)
Report Name Description
Database Detail Displays detailed information related to a particulardatabase on Microsoft SQL Server. To display this report,click the DB Name field.
Session Detail Displays detailed information related to resource usage foreach session. To display this report, click one of thefollowing fields:• Blocking Process• SPID
System Overview
Overview
The System Overview report displays detailed information related to MicrosoftSQL Server. This report is displayed as a list and a line graph. From thedisplayed report, you can display more detailed drilldown reports.
Storage LocationReports/SQL/Status Reporting/Real-Time/
1-106 Working with the Solution SetHitachi Tuning Manager Application Reports Reference
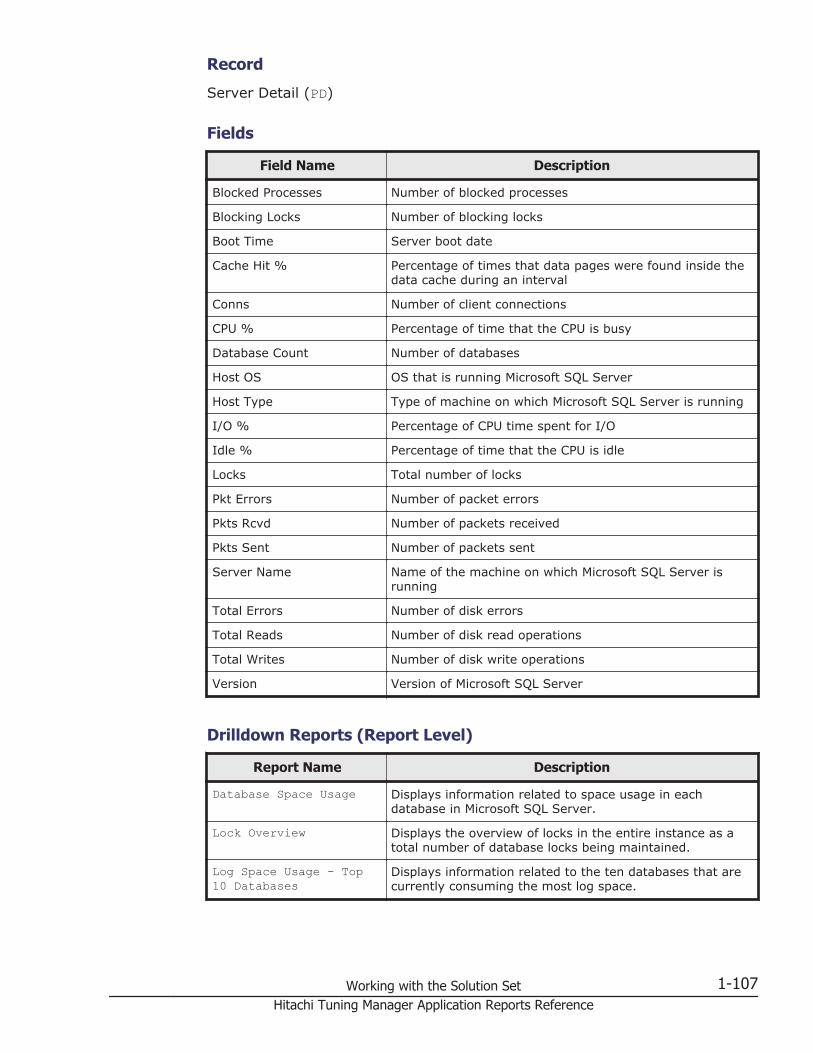
Record
Server Detail (PD)
Fields
Field Name Description
Blocked Processes Number of blocked processes
Blocking Locks Number of blocking locks
Boot Time Server boot date
Cache Hit % Percentage of times that data pages were found inside thedata cache during an interval
Conns Number of client connections
CPU % Percentage of time that the CPU is busy
Database Count Number of databases
Host OS OS that is running Microsoft SQL Server
Host Type Type of machine on which Microsoft SQL Server is running
I/O % Percentage of CPU time spent for I/O
Idle % Percentage of time that the CPU is idle
Locks Total number of locks
Pkt Errors Number of packet errors
Pkts Rcvd Number of packets received
Pkts Sent Number of packets sent
Server Name Name of the machine on which Microsoft SQL Server isrunning
Total Errors Number of disk errors
Total Reads Number of disk read operations
Total Writes Number of disk write operations
Version Version of Microsoft SQL Server
Drilldown Reports (Report Level)
Report Name Description
Database Space Usage Displays information related to space usage in eachdatabase in Microsoft SQL Server.
Lock Overview Displays the overview of locks in the entire instance as atotal number of database locks being maintained.
Log Space Usage - Top10 Databases
Displays information related to the ten databases that arecurrently consuming the most log space.
Working with the Solution Set 1-107Hitachi Tuning Manager Application Reports Reference
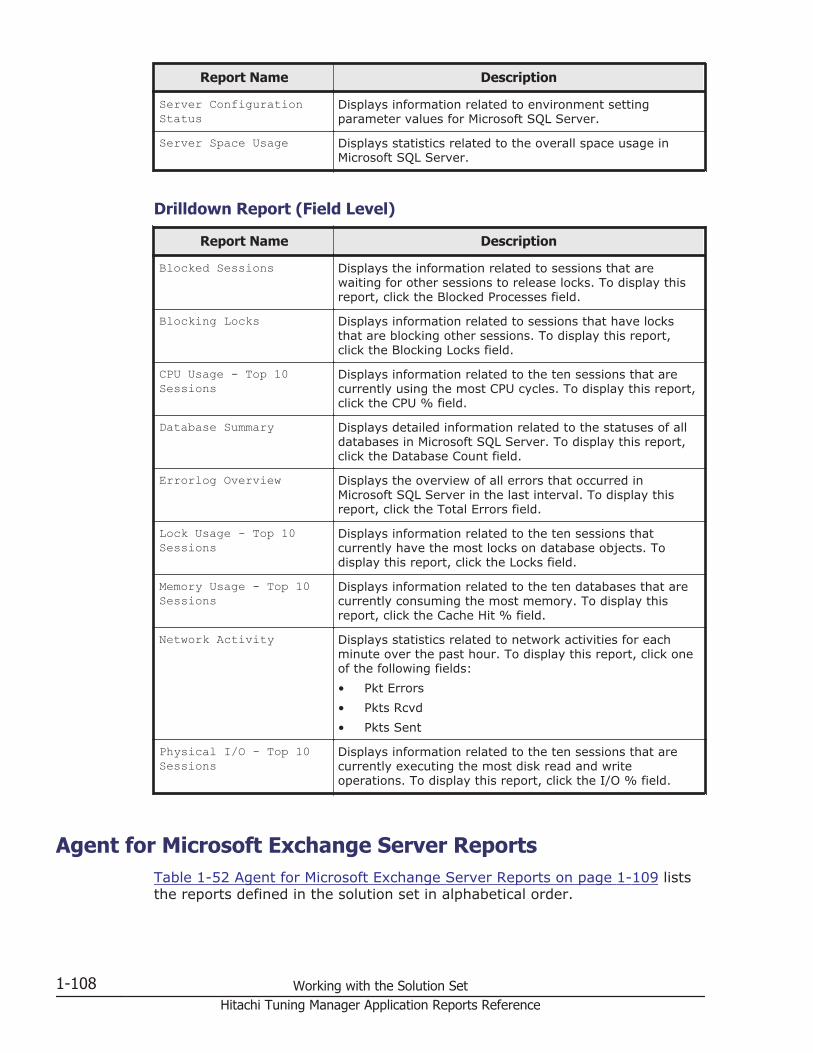
Report Name Description
Server ConfigurationStatus
Displays information related to environment settingparameter values for Microsoft SQL Server.
Server Space Usage Displays statistics related to the overall space usage inMicrosoft SQL Server.
Drilldown Report (Field Level)
Report Name Description
Blocked Sessions Displays the information related to sessions that arewaiting for other sessions to release locks. To display thisreport, click the Blocked Processes field.
Blocking Locks Displays information related to sessions that have locksthat are blocking other sessions. To display this report,click the Blocking Locks field.
CPU Usage - Top 10Sessions
Displays information related to the ten sessions that arecurrently using the most CPU cycles. To display this report,click the CPU % field.
Database Summary Displays detailed information related to the statuses of alldatabases in Microsoft SQL Server. To display this report,click the Database Count field.
Errorlog Overview Displays the overview of all errors that occurred inMicrosoft SQL Server in the last interval. To display thisreport, click the Total Errors field.
Lock Usage - Top 10Sessions
Displays information related to the ten sessions thatcurrently have the most locks on database objects. Todisplay this report, click the Locks field.
Memory Usage - Top 10Sessions
Displays information related to the ten databases that arecurrently consuming the most memory. To display thisreport, click the Cache Hit % field.
Network Activity Displays statistics related to network activities for eachminute over the past hour. To display this report, click oneof the following fields:• Pkt Errors• Pkts Rcvd• Pkts Sent
Physical I/O - Top 10Sessions
Displays information related to the ten sessions that arecurrently executing the most disk read and writeoperations. To display this report, click the I/O % field.
Agent for Microsoft Exchange Server ReportsTable 1-52 Agent for Microsoft Exchange Server Reports on page 1-109 liststhe reports defined in the solution set in alphabetical order.
1-108 Working with the Solution SetHitachi Tuning Manager Application Reports Reference

Table 1-52 Agent for Microsoft Exchange Server Reports
Report Name Displayed Information Storage Location
Version ofMicrosoftExchange
ServerBeing
Monitored
Database CacheTrend
Information about thedatabase cache for eachhour over the past 24hours
Reports/MSExchange/Status Reporting/DailyTrend/
All versions
Database LogTrend
Information about thedatabase log for eachminute over the past hour
Reports/MSExchange/Troubleshooting/RecentPast/
All versions
Epoxy Trend Information about theshared memory queuesystem (Epoxy) for eachhour over the past 24hours.This report is only forMicrosoft Exchange Server2003. Other versions ofMicrosoft Exchange Serverare not supported.
Reports/MSExchange/Status Reporting/DailyTrend/
MicrosoftExchangeServer2003
InformationStore Trend
Information about theinformation store for eachhour over the past 24hours
Reports/MSExchange/Status Reporting/DailyTrend/
MicrosoftExchangeServer2010 orearlier
InformationStore Trend -2013
Information about theManaged Store for eachhour over the past 24hours
Reports/MSExchange/Status Reporting/DailyTrend/
MicrosoftExchangeServer2013
MailboxMessages Trend(hourly historicalreport)
Information about themessages in the mailboxstore for each hour overthe past 24 hours
Reports/MSExchange/Status Reporting/DailyTrend/
MicrosoftExchangeServer2010 orearlier
MailboxMessages Trend- 2013 (hourlyhistoricalreport)
Information about themessages in the mailboxstore for each hour overthe past 24 hours
Reports/MSExchange/Status Reporting/DailyTrend/
MicrosoftExchangeServer2013
MailboxMessages Trend(daily historicalreport)
Information about themessages in the mailboxstore for each day overthe past month
Reports/MSExchange/Monthly Trend/
MicrosoftExchangeServer2010 orearlier
MailboxMessages Trend- 2013 (daily
Information about themessages in the mailbox
Reports/MSExchange/Monthly Trend/
MicrosoftExchange
Working with the Solution Set 1-109Hitachi Tuning Manager Application Reports Reference
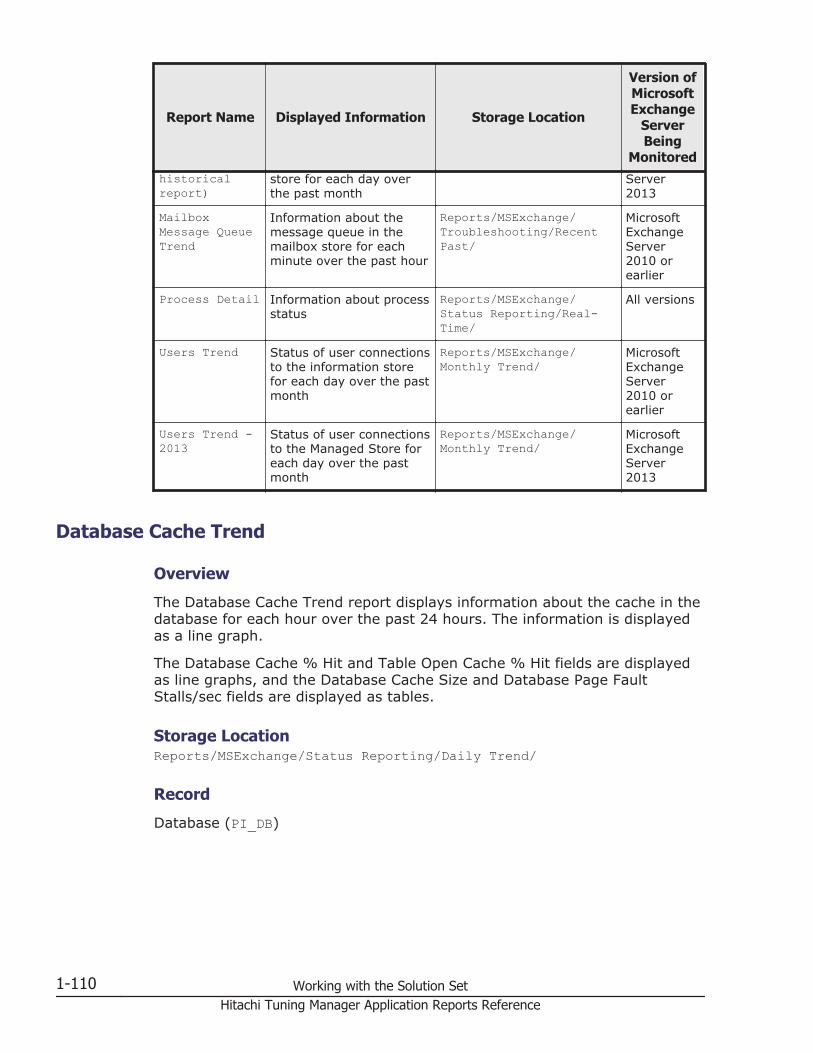
Report Name Displayed Information Storage Location
Version ofMicrosoftExchange
ServerBeing
Monitoredhistoricalreport)
store for each day overthe past month
Server2013
MailboxMessage QueueTrend
Information about themessage queue in themailbox store for eachminute over the past hour
Reports/MSExchange/Troubleshooting/RecentPast/
MicrosoftExchangeServer2010 orearlier
Process Detail Information about processstatus
Reports/MSExchange/Status Reporting/Real-Time/
All versions
Users Trend Status of user connectionsto the information storefor each day over the pastmonth
Reports/MSExchange/Monthly Trend/
MicrosoftExchangeServer2010 orearlier
Users Trend -2013
Status of user connectionsto the Managed Store foreach day over the pastmonth
Reports/MSExchange/Monthly Trend/
MicrosoftExchangeServer2013
Database Cache Trend
Overview
The Database Cache Trend report displays information about the cache in thedatabase for each hour over the past 24 hours. The information is displayedas a line graph.
The Database Cache % Hit and Table Open Cache % Hit fields are displayedas line graphs, and the Database Cache Size and Database Page FaultStalls/sec fields are displayed as tables.
Storage LocationReports/MSExchange/Status Reporting/Daily Trend/
Record
Database (PI_DB)
1-110 Working with the Solution SetHitachi Tuning Manager Application Reports Reference

Fields
Field Name Description
Database Cache % Hit Database Cache % Hit is the percentage of database filepage requests that were fulfilled by the database cachewithout causing a file operation. If this percentage is toolow, the database cache size may be too small.
Database Cache Size Database Cache Size is the amount of system memoryused by the database cache manager to hold commonlyused information from the database file(s) to prevent fileoperations. If the database cache size seems to be toosmall for optimal performance and there is very littleavailable memory on the system (see Memory/AvailableBytes), adding more memory to the system may increaseperformance. If there is a lot of available memory on thesystem and the database cache size is not growing beyonda certain point, the database cache size may be capped atan artificially low limit. Increasing this limit may increaseperformance.
Database Page FaultStalls/sec
Database Page Fault Stalls/sec is the rate of page faultsthat cannot be serviced because there are no pagesavailable for allocation from the database cache. If thiscounter is non-zero most of the time, the clean thresholdmay be too low.
Table Open Cache % Hit Table Open Cache % Hit is the percentage of databasetables opened using cached schema information. If thispercentage is too low, the table cache size may be toosmall.
Database Log Trend
Overview
The Database Log Trend report displays information about the database logfor each minute over the past hour. The information is displayed as a table.
Storage LocationReports/MSExchange/Troubleshooting/Recent Past/
Record
Database (PI_DB)
Fields
Field Name Description
Log Record Stalls/sec Log Record Stalls/sec is the number of log records thatcannot be added to the log buffers per second becausethey are full. If this counter is non-zero most of the time,the log buffer size may be a bottleneck.
Working with the Solution Set 1-111Hitachi Tuning Manager Application Reports Reference
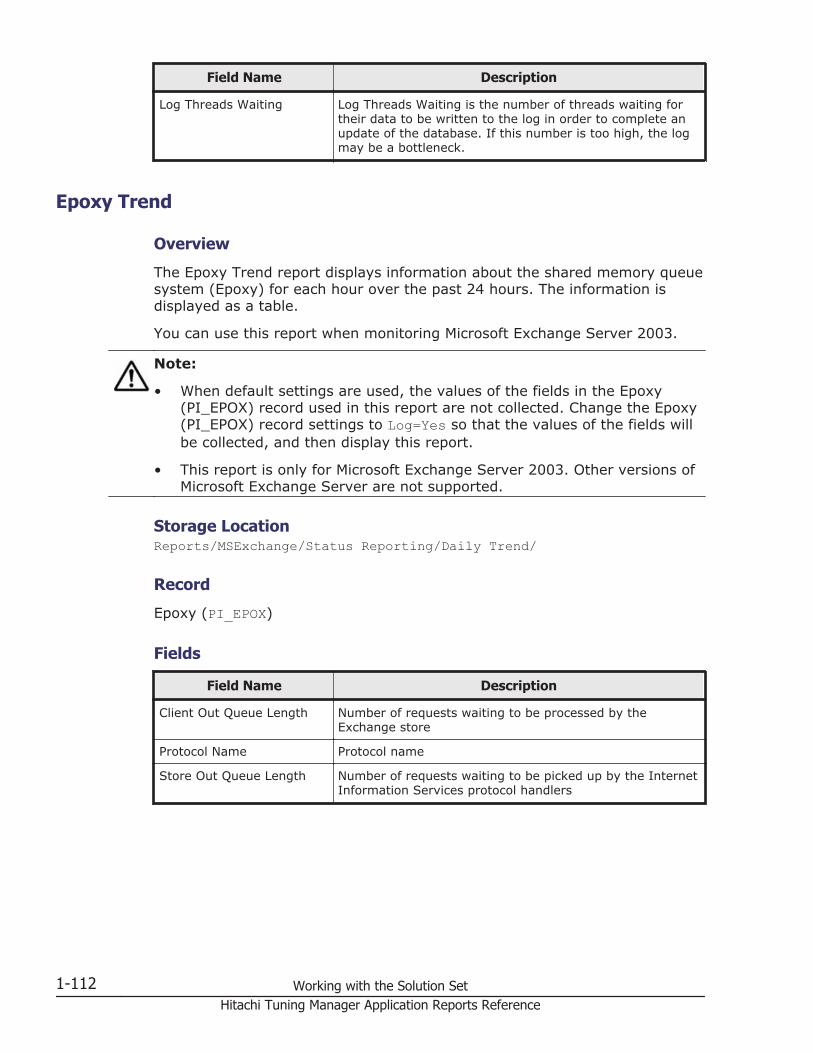
Field Name Description
Log Threads Waiting Log Threads Waiting is the number of threads waiting fortheir data to be written to the log in order to complete anupdate of the database. If this number is too high, the logmay be a bottleneck.
Epoxy Trend
Overview
The Epoxy Trend report displays information about the shared memory queuesystem (Epoxy) for each hour over the past 24 hours. The information isdisplayed as a table.
You can use this report when monitoring Microsoft Exchange Server 2003.
Note:
• When default settings are used, the values of the fields in the Epoxy(PI_EPOX) record used in this report are not collected. Change the Epoxy(PI_EPOX) record settings to Log=Yes so that the values of the fields willbe collected, and then display this report.
• This report is only for Microsoft Exchange Server 2003. Other versions ofMicrosoft Exchange Server are not supported.
Storage LocationReports/MSExchange/Status Reporting/Daily Trend/
Record
Epoxy (PI_EPOX)
Fields
Field Name Description
Client Out Queue Length Number of requests waiting to be processed by theExchange store
Protocol Name Protocol name
Store Out Queue Length Number of requests waiting to be picked up by the InternetInformation Services protocol handlers
1-112 Working with the Solution SetHitachi Tuning Manager Application Reports Reference
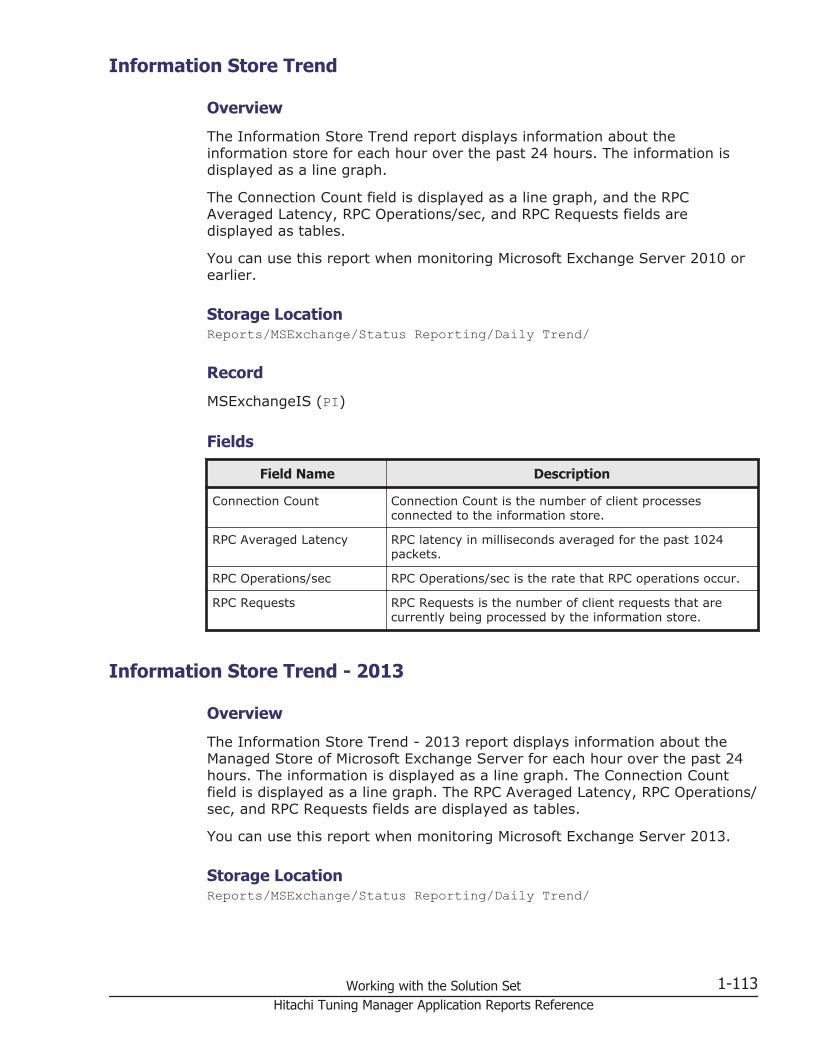
Information Store Trend
Overview
The Information Store Trend report displays information about theinformation store for each hour over the past 24 hours. The information isdisplayed as a line graph.
The Connection Count field is displayed as a line graph, and the RPCAveraged Latency, RPC Operations/sec, and RPC Requests fields aredisplayed as tables.
You can use this report when monitoring Microsoft Exchange Server 2010 orearlier.
Storage LocationReports/MSExchange/Status Reporting/Daily Trend/
Record
MSExchangeIS (PI)
Fields
Field Name Description
Connection Count Connection Count is the number of client processesconnected to the information store.
RPC Averaged Latency RPC latency in milliseconds averaged for the past 1024packets.
RPC Operations/sec RPC Operations/sec is the rate that RPC operations occur.
RPC Requests RPC Requests is the number of client requests that arecurrently being processed by the information store.
Information Store Trend - 2013
Overview
The Information Store Trend - 2013 report displays information about theManaged Store of Microsoft Exchange Server for each hour over the past 24hours. The information is displayed as a line graph. The Connection Countfield is displayed as a line graph. The RPC Averaged Latency, RPC Operations/sec, and RPC Requests fields are displayed as tables.
You can use this report when monitoring Microsoft Exchange Server 2013.
Storage LocationReports/MSExchange/Status Reporting/Daily Trend/
Working with the Solution Set 1-113Hitachi Tuning Manager Application Reports Reference

Record
Managed Store Information (PI_MSI)
Fields
Field Name Description
Connection Count Connection Count is the number of client processes thatare connected to the Managed Store.
RPC Averaged Latency This is the RPC latency (averaged over the past 1024packets, and expressed in milliseconds).
RPC Operations/sec RPC Operations/sec is the rate at which RPC operationsoccur.
RPC Requests RPC Requests is the number of client requests that arecurrently being processed by the Managed Store.
Mailbox Messages Trend (Hourly Historical Report)
Overview
The Mailbox Messages Trend report displays information about the messagesin the mailbox store for each hour over the past 24 hours. The information isdisplayed as a table.
You can use this report when monitoring Microsoft Exchange Server 2010 orearlier.
Storage LocationReports/MSExchange/Status Reporting/Daily Trend/
Record
MSExchangeIS Mailbox (PI_ISM)
Fields
Field Name Description
Message RecipientsDelivered/min
Message Recipients Delivered/min is the rate thatrecipients receive messages.
Messages Submitted/min Messages Submitted/min is the rate that messages aresubmitted by clients.
1-114 Working with the Solution SetHitachi Tuning Manager Application Reports Reference
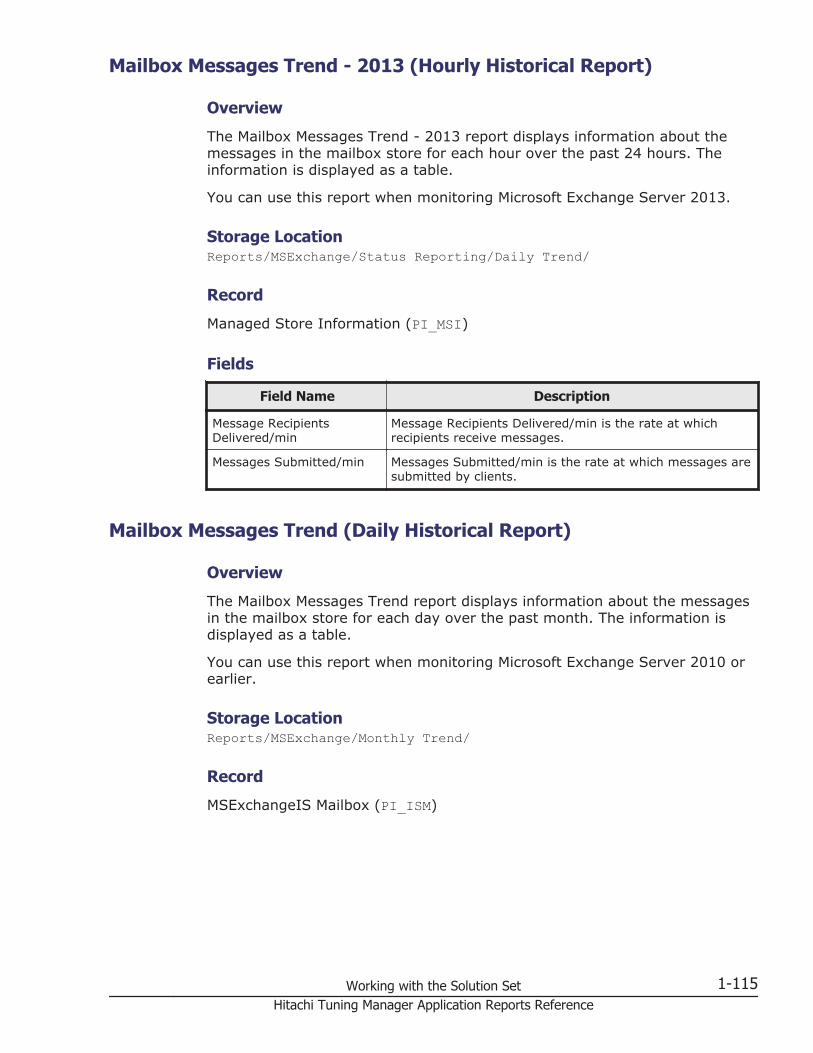
Mailbox Messages Trend - 2013 (Hourly Historical Report)
Overview
The Mailbox Messages Trend - 2013 report displays information about themessages in the mailbox store for each hour over the past 24 hours. Theinformation is displayed as a table.
You can use this report when monitoring Microsoft Exchange Server 2013.
Storage LocationReports/MSExchange/Status Reporting/Daily Trend/
Record
Managed Store Information (PI_MSI)
Fields
Field Name Description
Message RecipientsDelivered/min
Message Recipients Delivered/min is the rate at whichrecipients receive messages.
Messages Submitted/min Messages Submitted/min is the rate at which messages aresubmitted by clients.
Mailbox Messages Trend (Daily Historical Report)
Overview
The Mailbox Messages Trend report displays information about the messagesin the mailbox store for each day over the past month. The information isdisplayed as a table.
You can use this report when monitoring Microsoft Exchange Server 2010 orearlier.
Storage LocationReports/MSExchange/Monthly Trend/
Record
MSExchangeIS Mailbox (PI_ISM)
Working with the Solution Set 1-115Hitachi Tuning Manager Application Reports Reference

Fields
Field Name Description
Message RecipientsDelivered/min
Message Recipients Delivered/min is the rate thatrecipients receive messages.
Messages Submitted/min Messages Submitted/min is the rate that messages aresubmitted by clients.
Mailbox Messages Trend - 2013 (Daily Historical Report)
Overview
The Mailbox Messages Trend - 2013 report displays information about themessages in the mailbox store for each day over the past month. Theinformation is displayed as a table.
You can use this report when monitoring Microsoft Exchange Server 2013.
Storage LocationReports/MSExchange/Monthly Trend/
Record
Managed Store Information (PI_MSI)
Fields
Field Name Description
Message RecipientsDelivered/min
Message Recipients Delivered/min is the rate at whichrecipients receive messages.
Messages Submitted/min Messages Submitted/min is the rate at which messages aresubmitted by clients.
Mailbox Message Queue Trend
Overview
The Mailbox Message Queue Trend report displays information about themessage queue in the mailbox store for each minute over the past hour. Theinformation is displayed as a table.
You can use this report when monitoring Microsoft Exchange Server 2010 orearlier.
Storage LocationReports/MSExchange/Troubleshooting/Recent Past/
1-116 Working with the Solution SetHitachi Tuning Manager Application Reports Reference

Record
MSExchangeIS Mailbox (PI_ISM)
Fields
Field Name Description
Average Delivery Time Average Delivery Time is the average time in millisecondsbetween the submission of a message to the mailbox storeand the delivery to all local recipients (recipients on thesame server) for the last 10 messages.
Send Queue Size Send Queue Size is the number of messages in the mailboxstore's send queue.
Process Detail
Overview
The Process Detail report displays a real-time table that lists informationabout Microsoft Exchange Server processes. For Microsoft Exchange Server2007 or Microsoft Exchange Server 2010, the relevant processes arestore.exe and mad.exe. For Microsoft Exchange Server 2013, the relevantprocesses are Microsoft.Exchange.Store.Service.exe andMicrosoft.Exchange.Store.Worker.exe. There are as manyMicrosoft.Exchange.Store.Worker processes as there are mailboxdatabases.
Storage LocationReports/MSExchange/Status Reporting/Real-Time/
Record
Process (PD)
Fields
Field Name Description
% Processor Time % Processor Time is the percentage of elapsed time thatall of process threads used the processor to executioninstructions. An instruction is the basic unit of executionin a computer, a thread is the object that executesinstructions, and a process is the object created when aprogram is run. Code executed to handle some hardwareinterrupts and trap conditions are included in this count.
Elapsed Time The total elapsed time, in seconds, that this process hasbeen running.
Page Faults/sec Page Faults/sec is the rate at which page faults by thethreads executing in this process are occurring. A page
Working with the Solution Set 1-117Hitachi Tuning Manager Application Reports Reference

Field Name Description
fault occurs when a thread refers to a virtual memorypage that is not in its working set in main memory. Thismay not cause the page to be fetched from disk if it ison the standby list and hence already in main memory,or if it is in use by another process with whom the pageis shared.
Page File Bytes Page File Bytes is the current amount of virtual memory,in Kbytes, that this process has reserved for use in thepaging file(s). Paging files are used to store pages ofmemory used by the process that are not contained inother files. Paging files are shared by all processes, andthe lack of space in paging files can prevent otherprocesses from allocating memory. If there is no pagingfile, this counter reflects the current amount of virtualmemory that the process has reserved for use inphysical memory.
Process Name Process Name of Microsoft Exchange Server (See Note).
Virtual Bytes Virtual Bytes is the current size, in Kbytes, of the virtualaddress space the process is using. Use of virtualaddress space does not necessarily imply correspondinguse of either disk or main memory pages. Virtual spaceis finite, and the process can limit its ability to loadlibraries.
Working Set Working Set is the current size, in Kbytes, of theWorking Set of this process. The Working Set is the setof memory pages touched recently by the threads in theprocess. If free memory in the computer is above athreshold, pages are left in the Working Set of a processeven if they are not in use. When free memory fallsbelow a threshold, pages are trimmed from WorkingSets. If they are needed they will then be soft-faultedback into the Working Set before leaving main memory.
Note: For Microsoft Exchange Server 2013, multipleMicrosoft.Exchange.Store.Worker processes might exist. These aredisplayed in the format Microsoft.Exchange.Store.Worker (process-ID).
Users Trend
Overview
The Users Trend report displays the status of user connections to theinformation store for each day over the past month. The information isdisplayed as a line graph.
You can use this report when monitoring Microsoft Exchange Server 2010 orearlier.
Storage LocationReports/MSExchange/Monthly Trend/
1-118 Working with the Solution SetHitachi Tuning Manager Application Reports Reference
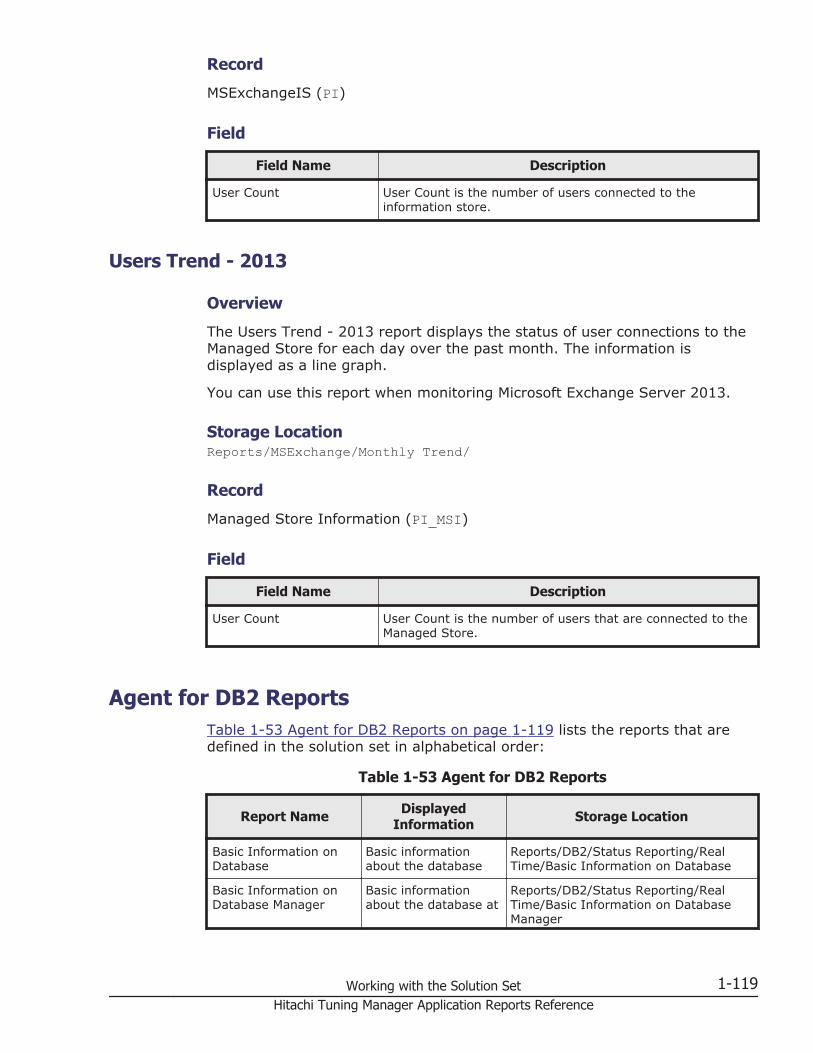
Record
MSExchangeIS (PI)
Field
Field Name Description
User Count User Count is the number of users connected to theinformation store.
Users Trend - 2013
Overview
The Users Trend - 2013 report displays the status of user connections to theManaged Store for each day over the past month. The information isdisplayed as a line graph.
You can use this report when monitoring Microsoft Exchange Server 2013.
Storage LocationReports/MSExchange/Monthly Trend/
Record
Managed Store Information (PI_MSI)
Field
Field Name Description
User Count User Count is the number of users that are connected to theManaged Store.
Agent for DB2 ReportsTable 1-53 Agent for DB2 Reports on page 1-119 lists the reports that aredefined in the solution set in alphabetical order:
Table 1-53 Agent for DB2 Reports
Report Name DisplayedInformation Storage Location
Basic Information onDatabase
Basic informationabout the database
Reports/DB2/Status Reporting/RealTime/Basic Information on Database
Basic Information onDatabase Manager
Basic informationabout the database at
Reports/DB2/Status Reporting/RealTime/Basic Information on DatabaseManager
Working with the Solution Set 1-119Hitachi Tuning Manager Application Reports Reference
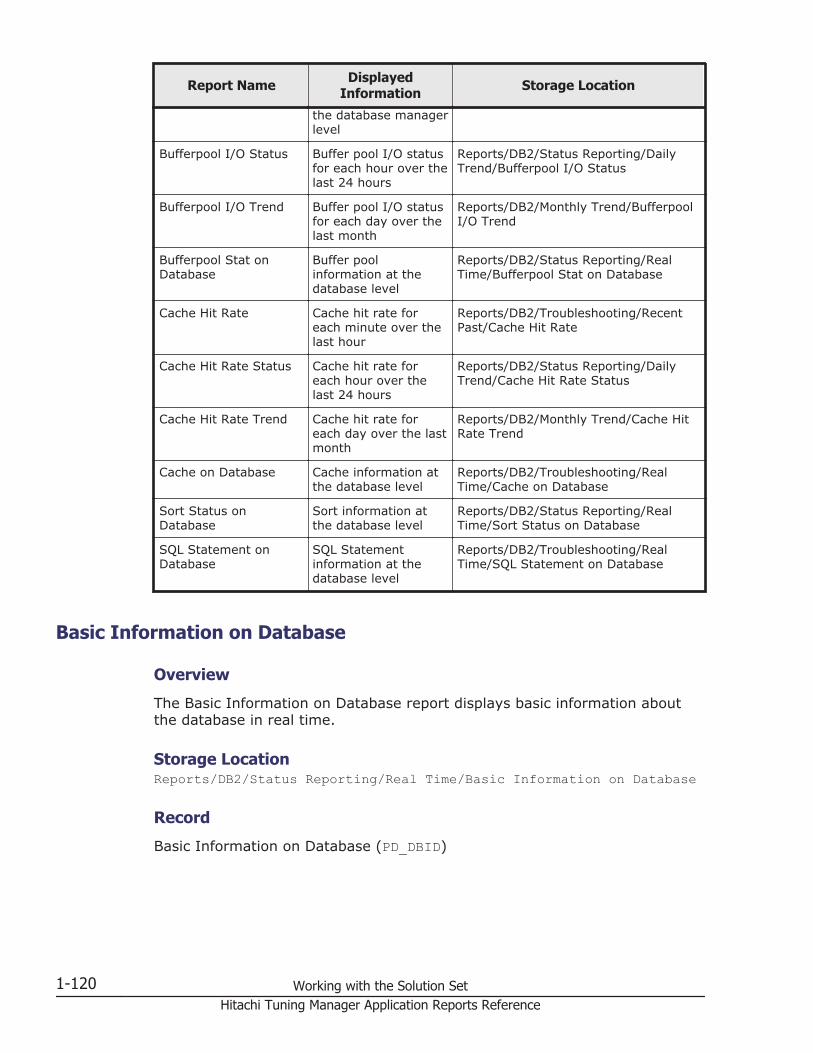
Report Name DisplayedInformation Storage Location
the database managerlevel
Bufferpool I/O Status Buffer pool I/O statusfor each hour over thelast 24 hours
Reports/DB2/Status Reporting/DailyTrend/Bufferpool I/O Status
Bufferpool I/O Trend Buffer pool I/O statusfor each day over thelast month
Reports/DB2/Monthly Trend/BufferpoolI/O Trend
Bufferpool Stat onDatabase
Buffer poolinformation at thedatabase level
Reports/DB2/Status Reporting/RealTime/Bufferpool Stat on Database
Cache Hit Rate Cache hit rate foreach minute over thelast hour
Reports/DB2/Troubleshooting/RecentPast/Cache Hit Rate
Cache Hit Rate Status Cache hit rate foreach hour over thelast 24 hours
Reports/DB2/Status Reporting/DailyTrend/Cache Hit Rate Status
Cache Hit Rate Trend Cache hit rate foreach day over the lastmonth
Reports/DB2/Monthly Trend/Cache HitRate Trend
Cache on Database Cache information atthe database level
Reports/DB2/Troubleshooting/RealTime/Cache on Database
Sort Status onDatabase
Sort information atthe database level
Reports/DB2/Status Reporting/RealTime/Sort Status on Database
SQL Statement onDatabase
SQL Statementinformation at thedatabase level
Reports/DB2/Troubleshooting/RealTime/SQL Statement on Database
Basic Information on Database
Overview
The Basic Information on Database report displays basic information aboutthe database in real time.
Storage LocationReports/DB2/Status Reporting/Real Time/Basic Information on Database
Record
Basic Information on Database (PD_DBID)
1-120 Working with the Solution SetHitachi Tuning Manager Application Reports Reference

Fields
Field Name Description
Agents Top The maximum number of agents for applications.
Appl Section Inserts The number of SQL sections inserted by an application from itsSQL work area.
Appl Section Lookups The number of SQL sections referenced by an application fromits SQL work area.
Appls Cur Cons The number of applications that are currently connected to thedatabase.
Appls In DB2 The number of applications that are connected to the database,and for which the database manager is processing requests.
Coord Agents Top The maximum number of coordinator agents that can runconcurrently.
DB Heap Top Memory usage
DB Name The real name of the database for which information iscollected or to which the application is connected.
DB Status The current status of the database. The valid values are:• 0 (SQLM_DB_ACTIVE: The database is active.)
• 1 (SQLM_DB_QUIESCE_PEND: The database is in thequiescent pending state.)
• 2 (SQLM_DB_QUIESCED: The database is in the quiescentstate.)
• 3 (SQLM_DB_ROLLFWD: A roll forward is in progress on thedatabase.)
Hash Join Overflows The number of times that hash join data exceeded the availablesort heap space.
Hash Join OverflowsRate
Ratio of hash_join_overflows andhash_join_small_overflows.
Hash Join SmallOverflows
The number of times that hash join data exceeded the availablesort heap space by less than 10%.
Num Assoc Agents The number of subagents for all applications.
Total Hash Joins The total number of hash joins executed.
Total Hash Loops The total number of times that a single partition of a hash joinwas larger than the available sort heap space.
Basic Information on Database Manager
Overview
The Basic Information on Database Manager report displays basic informationabout the database at the database manager level, in real time.
Working with the Solution Set 1-121Hitachi Tuning Manager Application Reports Reference
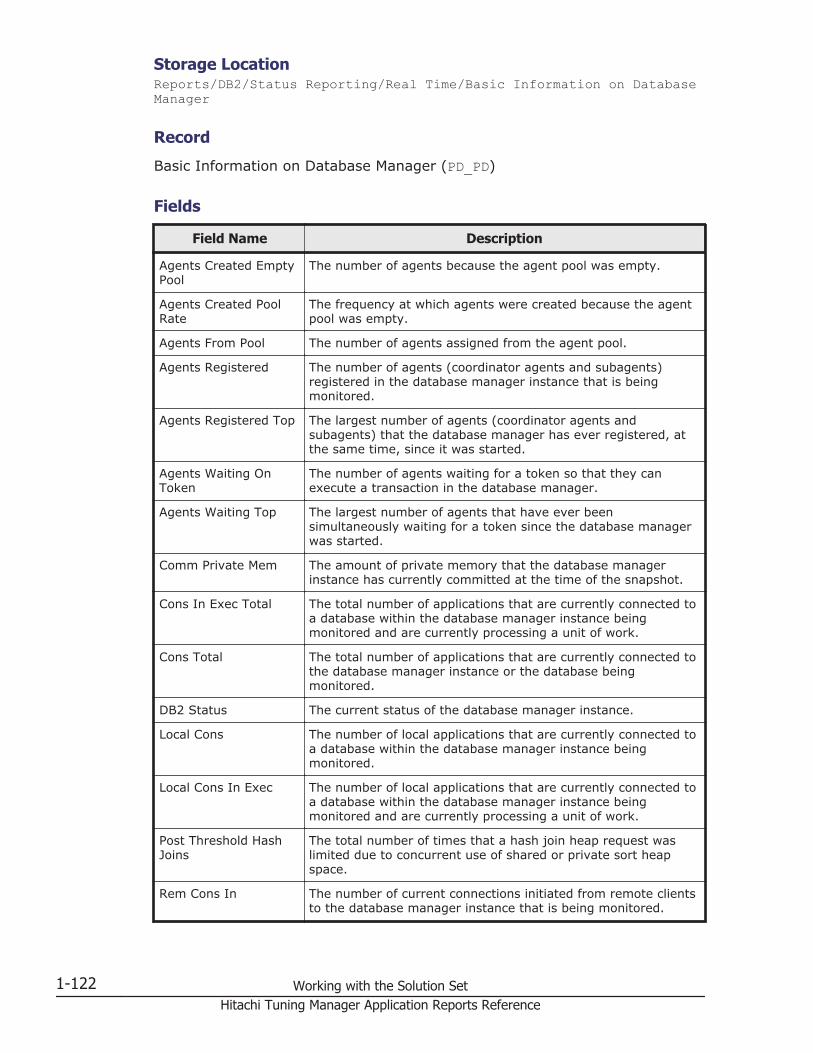
Storage LocationReports/DB2/Status Reporting/Real Time/Basic Information on Database Manager
Record
Basic Information on Database Manager (PD_PD)
Fields
Field Name Description
Agents Created EmptyPool
The number of agents because the agent pool was empty.
Agents Created PoolRate
The frequency at which agents were created because the agentpool was empty.
Agents From Pool The number of agents assigned from the agent pool.
Agents Registered The number of agents (coordinator agents and subagents)registered in the database manager instance that is beingmonitored.
Agents Registered Top The largest number of agents (coordinator agents andsubagents) that the database manager has ever registered, atthe same time, since it was started.
Agents Waiting OnToken
The number of agents waiting for a token so that they canexecute a transaction in the database manager.
Agents Waiting Top The largest number of agents that have ever beensimultaneously waiting for a token since the database managerwas started.
Comm Private Mem The amount of private memory that the database managerinstance has currently committed at the time of the snapshot.
Cons In Exec Total The total number of applications that are currently connected toa database within the database manager instance beingmonitored and are currently processing a unit of work.
Cons Total The total number of applications that are currently connected tothe database manager instance or the database beingmonitored.
DB2 Status The current status of the database manager instance.
Local Cons The number of local applications that are currently connected toa database within the database manager instance beingmonitored.
Local Cons In Exec The number of local applications that are currently connected toa database within the database manager instance beingmonitored and are currently processing a unit of work.
Post Threshold HashJoins
The total number of times that a hash join heap request waslimited due to concurrent use of shared or private sort heapspace.
Rem Cons In The number of current connections initiated from remote clientsto the database manager instance that is being monitored.
1-122 Working with the Solution SetHitachi Tuning Manager Application Reports Reference

Field Name Description
Rem Cons In Exec The number of remote applications that are currently connectedto a database in the monitored database manager instance andare currently processing a unit of work.
Sort Heap Allocated The total number of allocated pages of sort heap space allocatedfor all sorts at the level chosen, at the time the snapshot wastaken.
Bufferpool I/O Status
Overview
The Bufferpool I/O Status report displays a summary of the buffer pool I/Ostatus for each hour over the last 24 hours.
Storage LocationReports/DB2/Status Reporting/Daily Trend/Bufferpool I/O Status
Record
Bufferpool Stat on Database Interval (PI_DBPI)
Fields
Field Name Description
Pool Async Data ReadsRate
The ratio of the number of data pages read asynchronouslyinto the buffer pool by a prefetcher to the number of readrequests that required I/O to get data pages into the bufferpool.
Pool Async Data WritesRate
The ratio of the number of times that a buffer pool data pagewas physically written to a disk by either an asynchronouspage cleaner or a prefetcher to the number of times a bufferpool data page was physically written to the disk.
Pool Async Index ReadsRate
The ratio of the number of index pages read asynchronouslyinto the buffer pool by a prefetcher to the number of physicalread requests to get index pages into the buffer pool.
Pool Async Index WritesRate
The ratio of the number of times a buffer pool index page wasphysically written to a disk by either an asynchronous pagecleaner or a prefetcher to the number of times a buffer poolindex page was physically written to a disk.
Pool Data L Reads The number of logical read requests for data pages that havegone through the buffer pool.
Pool Data P Reads The number of read requests that required I/O to get datapages into the buffer pool.
Pool Data Writes The number of times a buffer pool data page was physicallywritten to a disk.
Working with the Solution Set 1-123Hitachi Tuning Manager Application Reports Reference
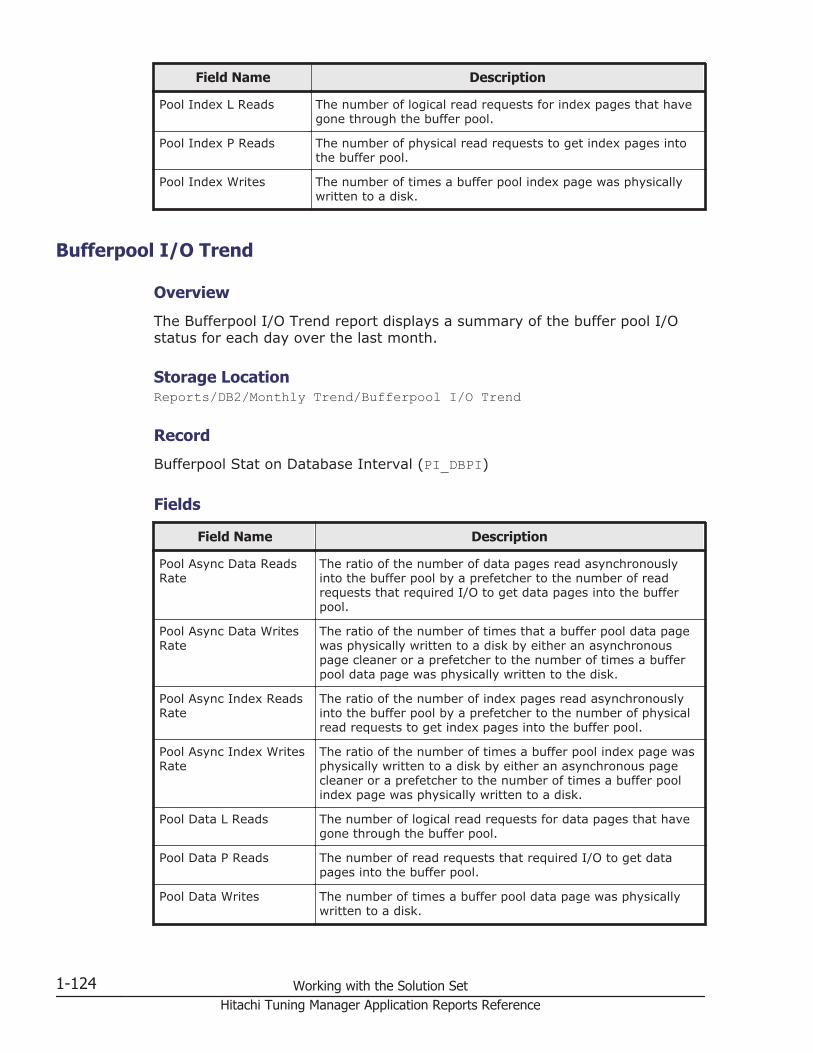
Field Name Description
Pool Index L Reads The number of logical read requests for index pages that havegone through the buffer pool.
Pool Index P Reads The number of physical read requests to get index pages intothe buffer pool.
Pool Index Writes The number of times a buffer pool index page was physicallywritten to a disk.
Bufferpool I/O Trend
Overview
The Bufferpool I/O Trend report displays a summary of the buffer pool I/Ostatus for each day over the last month.
Storage LocationReports/DB2/Monthly Trend/Bufferpool I/O Trend
Record
Bufferpool Stat on Database Interval (PI_DBPI)
Fields
Field Name Description
Pool Async Data ReadsRate
The ratio of the number of data pages read asynchronouslyinto the buffer pool by a prefetcher to the number of readrequests that required I/O to get data pages into the bufferpool.
Pool Async Data WritesRate
The ratio of the number of times that a buffer pool data pagewas physically written to a disk by either an asynchronouspage cleaner or a prefetcher to the number of times a bufferpool data page was physically written to the disk.
Pool Async Index ReadsRate
The ratio of the number of index pages read asynchronouslyinto the buffer pool by a prefetcher to the number of physicalread requests to get index pages into the buffer pool.
Pool Async Index WritesRate
The ratio of the number of times a buffer pool index page wasphysically written to a disk by either an asynchronous pagecleaner or a prefetcher to the number of times a buffer poolindex page was physically written to a disk.
Pool Data L Reads The number of logical read requests for data pages that havegone through the buffer pool.
Pool Data P Reads The number of read requests that required I/O to get datapages into the buffer pool.
Pool Data Writes The number of times a buffer pool data page was physicallywritten to a disk.
1-124 Working with the Solution SetHitachi Tuning Manager Application Reports Reference

Field Name Description
Pool Index L Reads The number of logical read requests for index pages that havegone through the buffer pool.
Pool Index P Reads The number of physical read requests to get index pages intothe buffer pool.
Pool Index Writes The number of times a buffer pool index page was physicallywritten to a disk.
Bufferpool Stat on Database
Overview
The Bufferpool Stat on Database report displays information on the bufferpool at the database level, in real time.
Storage LocationReports/DB2/Status Reporting/Real Time/Bufferpool Stat on Database
Record
Bufferpool Stat on Database (PD_DBPD)
Fields
Field Name Description
Pool Async Data Reads The number of pages read asynchronously into the buffer pool.
Pool Async Data ReadsRate
The ratio of the number of data pages read asynchronously intothe buffer pool by a prefetcher to the number of read requeststhat required I/O to get data pages into the buffer pool.
Pool Async Data Writes The number of times a buffer pool data page was physicallywritten to a disk by either an asynchronous page cleaner or aprefetcher.
Pool Async Data WritesRate
The ratio of the number of times that a buffer pool data pagewas physically written to a disk by either an asynchronous pagecleaner or a prefetcher to the number of times a buffer pooldata page was physically written to the disk.
Pool Async Index Reads The number of index pages asynchronously read into the bufferpool by a prefetcher.
Pool Async Index ReadsRate
The ratio of the number of index pages read asynchronouslyinto the buffer pool by a prefetcher to the number of physicalread requests to get index pages into the buffer pool.
Pool Async IndexWrites
The number of times a buffer pool index page was written to adisk by either an asynchronous page cleaner or a prefetcher.
Working with the Solution Set 1-125Hitachi Tuning Manager Application Reports Reference

Field Name Description
Pool Async IndexWrites Rate
The ratio of the number of times a buffer pool index page wasphysically written to a disk by either an asynchronous pagecleaner or a prefetcher to the number of times a buffer poolindex page was physically written to a disk.
Pool Async Read Time The total elapsed time spent reading by database managerprefetchers.
Pool Async Read TimeAvg
The average of the total elapsed time spent reading bydatabase manager prefetchers.
Pool Async Total Reads The total number of data and index pages read asynchronouslyinto the buffer pool by prefetchers.
Pool Async Total Writes The number of times a buffer pool data page or index page wasphysically written to a disk by an asynchronous page cleaner ora prefetcher.
Pool Async Write Time The total elapsed time spent by database manager pagecleaners writing data or index pages from the buffer pool to adisk.
Pool Async Write TimeAvg
The average of the total elapsed time spent by databasemanager page cleaners writing data or index pages from thebuffer pool to a disk.
Pool Data Hit Rate Rate of data page hits.
Pool Data L Reads The number of logical read requests for data pages that havegone through the buffer pool.
Pool Data P Reads The number of read requests that required I/O to get datapages into the buffer pool.
Pool Data Writes The number of times a buffer pool data page was physicallywritten to a disk.
Pool Drty PG Steal Clns The number of times a page cleaner was invoked because asynchronous write was needed during the victim bufferreplacement for the database.
Pool Drty PG Steal ClnsRate
The ratio of the number of times a page cleaner was invokedbecause a synchronous write was needed during the victimbuffer replacement for the database to the total number ofpage cleaner invocations.
Pool Drty PG Thrsh Clns The number of times a page cleaner was invoked because abuffer pool had reached the dirty page threshold criterion forthe database.
Pool Index Hit Rate Rate of index page hits.
Pool Index L Reads The number of logical read requests for index pages that havegone through the buffer pool.
Pool Index P Reads The number of physical read requests to get index pages intothe buffer pool.
Pool Index Writes The number of times a buffer pool index page was physicallywritten to a disk.
1-126 Working with the Solution SetHitachi Tuning Manager Application Reports Reference

Field Name Description
Pool Lsn Gap Clns The number of times a page cleaner was invoked because theused logging space had reached a predefined criterion for thedatabase.
Pool Read Time The total amount of time spent processing read requests thatcaused data or index pages to be physically read from a disk orthe buffer pool.
Pool Read Time Avg The average of the total amount of time spent processing readrequests that caused data or index pages to be physically readfrom a disk or the buffer pool.
Pool Total Hit Rate Total hit rate for the buffer pool.
Pool Total Writes The total number of physical writes of buffer pool data pagesand buffer pool index pages to a disk.
Pool Write Time The total amount of time spent writing data or index pagesphysically from the buffer pool to a disk.
Pool Write Time Avg The average of the total amount of time spent writing data orindex pages physically from the buffer pool to a disk.
Cache Hit Rate
Overview
The Cache Hit Rate report displays a summary of the cache hit rate for eachminute over the last hour.
Storage LocationReports/DB2/Troubleshooting/Recent Past/Cache Hit Rate
Record
Cache on Database Interval (PI_DCAI)
Fields
Field Name Description
Catcache Hit Rate Rate of catalog cache hits.
Pkg Cache Hit Rate Rate of package cache hits.
Cache Hit Rate Status
Overview
The Cache Hit Rate Status report displays a summary of the cache hit rate foreach hour over the last 24 hours.
Working with the Solution Set 1-127Hitachi Tuning Manager Application Reports Reference
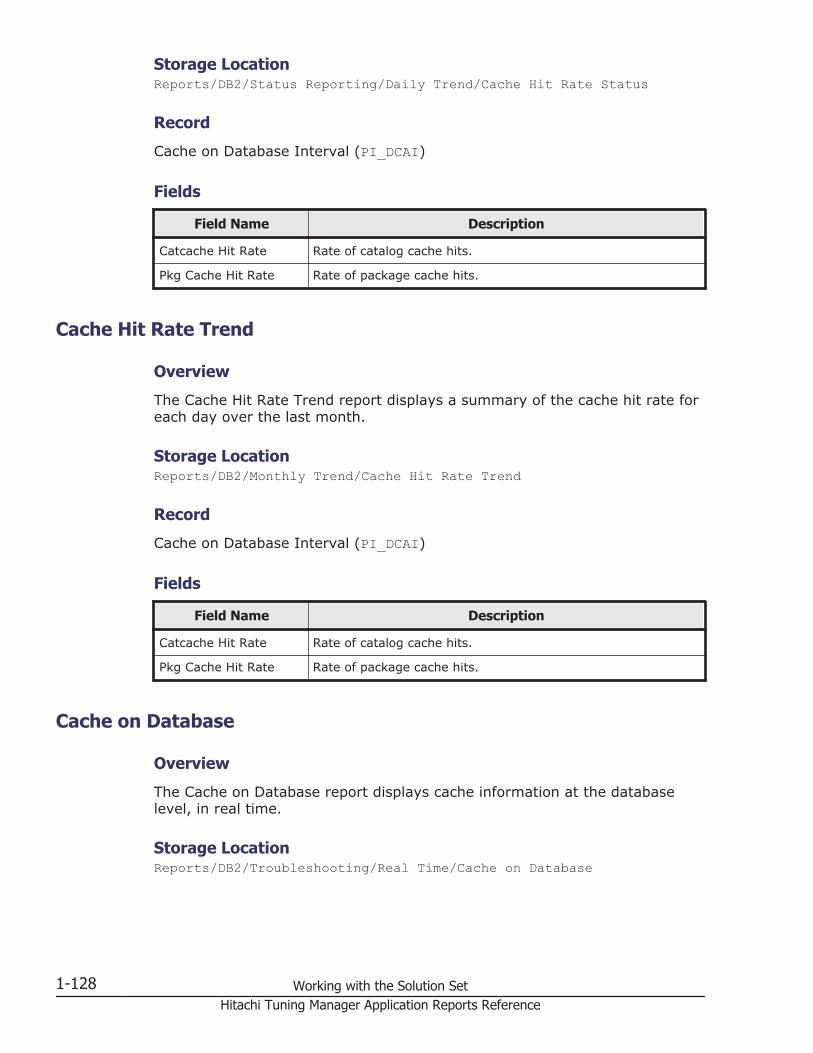
Storage LocationReports/DB2/Status Reporting/Daily Trend/Cache Hit Rate Status
Record
Cache on Database Interval (PI_DCAI)
Fields
Field Name Description
Catcache Hit Rate Rate of catalog cache hits.
Pkg Cache Hit Rate Rate of package cache hits.
Cache Hit Rate Trend
Overview
The Cache Hit Rate Trend report displays a summary of the cache hit rate foreach day over the last month.
Storage LocationReports/DB2/Monthly Trend/Cache Hit Rate Trend
Record
Cache on Database Interval (PI_DCAI)
Fields
Field Name Description
Catcache Hit Rate Rate of catalog cache hits.
Pkg Cache Hit Rate Rate of package cache hits.
Cache on Database
Overview
The Cache on Database report displays cache information at the databaselevel, in real time.
Storage LocationReports/DB2/Troubleshooting/Real Time/Cache on Database
1-128 Working with the Solution SetHitachi Tuning Manager Application Reports Reference
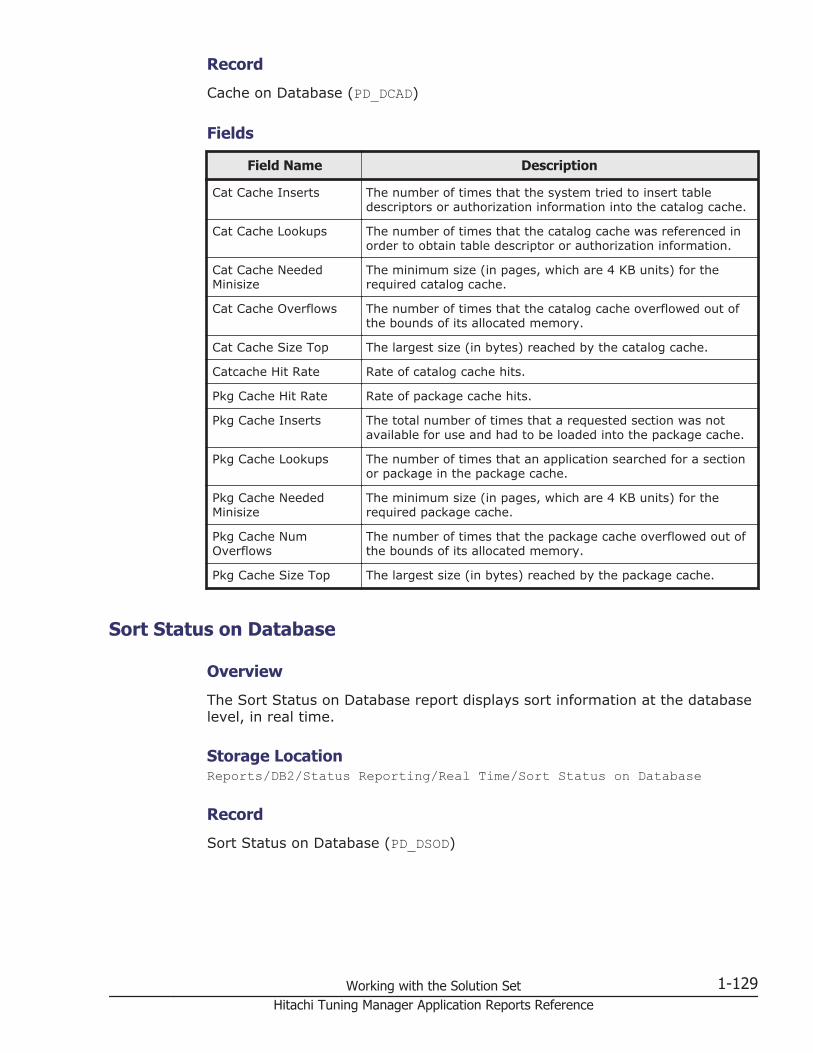
Record
Cache on Database (PD_DCAD)
Fields
Field Name Description
Cat Cache Inserts The number of times that the system tried to insert tabledescriptors or authorization information into the catalog cache.
Cat Cache Lookups The number of times that the catalog cache was referenced inorder to obtain table descriptor or authorization information.
Cat Cache NeededMinisize
The minimum size (in pages, which are 4 KB units) for therequired catalog cache.
Cat Cache Overflows The number of times that the catalog cache overflowed out ofthe bounds of its allocated memory.
Cat Cache Size Top The largest size (in bytes) reached by the catalog cache.
Catcache Hit Rate Rate of catalog cache hits.
Pkg Cache Hit Rate Rate of package cache hits.
Pkg Cache Inserts The total number of times that a requested section was notavailable for use and had to be loaded into the package cache.
Pkg Cache Lookups The number of times that an application searched for a sectionor package in the package cache.
Pkg Cache NeededMinisize
The minimum size (in pages, which are 4 KB units) for therequired package cache.
Pkg Cache NumOverflows
The number of times that the package cache overflowed out ofthe bounds of its allocated memory.
Pkg Cache Size Top The largest size (in bytes) reached by the package cache.
Sort Status on Database
Overview
The Sort Status on Database report displays sort information at the databaselevel, in real time.
Storage LocationReports/DB2/Status Reporting/Real Time/Sort Status on Database
Record
Sort Status on Database (PD_DSOD)
Working with the Solution Set 1-129Hitachi Tuning Manager Application Reports Reference

Fields
Field Name Description
Active Sorts The number of sorts in the database that currently have a sortheap allocated.
Sheapthres Sort heap threshold.
Sheapthres Shr Sort heap threshold for shared sorts.
Sort Heap Allocated The total number of pages of sort heap space allocated for allsorts at the level chosen, at the time the snapshot was taken.
Sort Heap AllocatedAvg
The average of the number of pages of sort heap spaceallocated for all sorts at the level chosen, at the time thesnapshot was taken.
Sort Overflows Total number of sorts that might need temporary memory diskspace, as a result of using up the sort heap.
Sort Overflows Rate Percentage of sorts that might need temporary memory diskspace, as a result of using up the sort heap.
Sort Shrheap Allocated Sort shared heap currently allocated.
Sort Shrheap AllocatedRate
Shared sort memory usage of the database.
Sort Shrheap Top Maximum watermark for the sort shared heap.
Total Sort Time The total elapsed time for all sorts that have been executed (inmilliseconds).
Total Sort Time Avg The average of the total elapsed time for all sorts that havebeen executed (in milliseconds).
Total Sorts The total number of sorts that have been executed.
SQL Statement on Database
Overview
The SQL Statement on Database report displays SQL statement informationat the database level, in real time.
Storage LocationReports/DB2/Troubleshooting/Real Time/SQL Statement on Database
Record
SQL Statement on Database (PD_DSQD)
1-130 Working with the Solution SetHitachi Tuning Manager Application Reports Reference
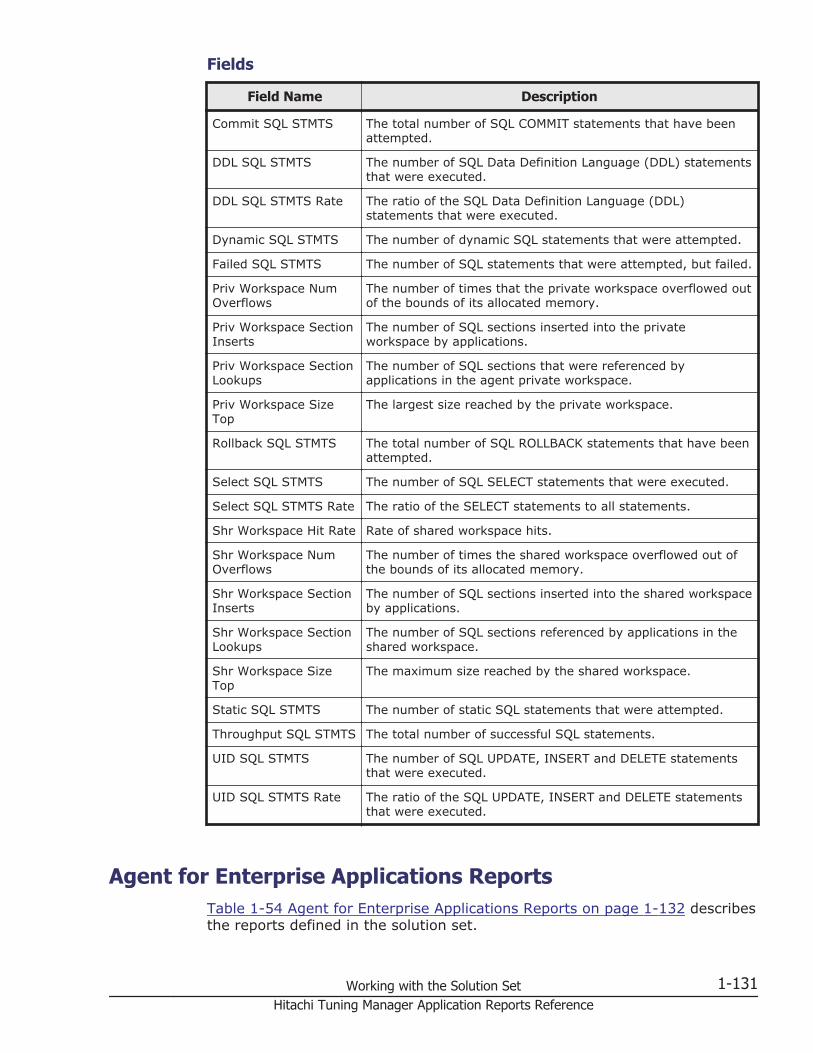
Fields
Field Name Description
Commit SQL STMTS The total number of SQL COMMIT statements that have beenattempted.
DDL SQL STMTS The number of SQL Data Definition Language (DDL) statementsthat were executed.
DDL SQL STMTS Rate The ratio of the SQL Data Definition Language (DDL)statements that were executed.
Dynamic SQL STMTS The number of dynamic SQL statements that were attempted.
Failed SQL STMTS The number of SQL statements that were attempted, but failed.
Priv Workspace NumOverflows
The number of times that the private workspace overflowed outof the bounds of its allocated memory.
Priv Workspace SectionInserts
The number of SQL sections inserted into the privateworkspace by applications.
Priv Workspace SectionLookups
The number of SQL sections that were referenced byapplications in the agent private workspace.
Priv Workspace SizeTop
The largest size reached by the private workspace.
Rollback SQL STMTS The total number of SQL ROLLBACK statements that have beenattempted.
Select SQL STMTS The number of SQL SELECT statements that were executed.
Select SQL STMTS Rate The ratio of the SELECT statements to all statements.
Shr Workspace Hit Rate Rate of shared workspace hits.
Shr Workspace NumOverflows
The number of times the shared workspace overflowed out ofthe bounds of its allocated memory.
Shr Workspace SectionInserts
The number of SQL sections inserted into the shared workspaceby applications.
Shr Workspace SectionLookups
The number of SQL sections referenced by applications in theshared workspace.
Shr Workspace SizeTop
The maximum size reached by the shared workspace.
Static SQL STMTS The number of static SQL statements that were attempted.
Throughput SQL STMTS The total number of successful SQL statements.
UID SQL STMTS The number of SQL UPDATE, INSERT and DELETE statementsthat were executed.
UID SQL STMTS Rate The ratio of the SQL UPDATE, INSERT and DELETE statementsthat were executed.
Agent for Enterprise Applications ReportsTable 1-54 Agent for Enterprise Applications Reports on page 1-132 describesthe reports defined in the solution set.
Working with the Solution Set 1-131Hitachi Tuning Manager Application Reports Reference

Table 1-54 Agent for Enterprise Applications Reports
Category Report Name DisplayedInformation Storage Location
Responsetime
Dialog ResponseTime Analysis report in theevent of a problem withthe dialog task'sresponse times overthe past hour
Reports/SAPSystem/SAPBasis/WebApplicationServer/Troubleshooting/Recent Past/
Dialog ResponseTimeStatus
Overview of the dialogtask's response times
Reports/SAPSystem/SAPBasis/WebApplicationServer/StatusReporting/Real-Time/
Dialog ResponseTimeTrend (hourly historicalreport)
Trends in the dialogtask's response timesover the past 24 hours(hourly)
Reports/SAPSystem/SAPBasis/WebApplicationServer/StatusReporting/DailyTrend/
Dialog ResponseTimeTrend (daily historicalreport)
Trends in the dialogtask's response timesover the past month(daily)
Reports/SAPSystem/SAPBasis/WebApplicationServer/MonthlyTrend/
Dialog ResponseTimeTrend (Multi-Agent)
Trends in the dialogtask's response timesover the past month(comparison amongapplication servers)
Reports/SAPSystem/SAPBasis/WebApplicationServer/MonthlyTrend/
Workprocess
Background ServiceUtilization %
Trends in the averageusage of the server'sbackground processesover the past 24 hours(hourly)
Reports/SAPSystem/SAPBasis/WebApplicationServer/StatusReporting/DailyTrend/Advanced/
Dialog Utilization % Analysis report in theevent of a problem withdialog work processesover the past hour(minute-by-minute)
Reports/SAPSystem/SAPBasis/WebApplicationServer/Troubleshooting/Recent Past/Advanced/
1-132 Working with the Solution SetHitachi Tuning Manager Application Reports Reference

Category Report Name DisplayedInformation Storage Location
Process Detail Work process activitystatus over the pasthour
Reports/SAPSystem/SAPBasis/WebApplicationServer/Troubleshooting/Recent Past/Drilldown Only/
Process Overview Status Work process activitystatus
Reports/SAPSystem/SAPBasis/WebApplicationServer/StatusReporting/Real-Time/
SAP buffer SAP Buffer Detail (CUA) Details of the SAPbuffer (CUA buffer)(drilldown report)
Reports/SAPSystem/SAPBasis/WebApplicationServer/StatusReporting/Real-Time/DrilldownOnly/
SAP Buffer Detail(FieldDescription)
Details of the SAPbuffer (field descriptionbuffer) (drilldownreport)
Reports/SAPSystem/SAPBasis/WebApplicationServer/StatusReporting/Real-Time/DrilldownOnly/
SAP Buffer Detail(GenericKey)
Details of the SAPbuffer (generic keybuffer) (drilldownreport)
Reports/SAPSystem/SAPBasis/WebApplicationServer/StatusReporting/Real-Time/DrilldownOnly/
SAP Buffer Detail(InitialRecords)
Details of the SAPbuffer (initial recordsbuffer) (drilldownreport)
Reports/SAPSystem/SAPBasis/WebApplicationServer/StatusReporting/Real-Time/DrilldownOnly/
SAP Buffer Detail(Program)
Details of the SAPbuffer (program buffer)(drilldown report)
Reports/SAPSystem/SAPBasis/WebApplicationServer/Status
Working with the Solution Set 1-133Hitachi Tuning Manager Application Reports Reference

Category Report Name DisplayedInformation Storage Location
Reporting/Real-Time/DrilldownOnly/
SAP Buffer Detail(Screen)
Details of the SAPbuffer (screen buffer)(drilldown report)
Reports/SAPSystem/SAPBasis/WebApplicationServer/StatusReporting/Real-Time/DrilldownOnly/
SAP Buffer Detail(ShortNameTAB)
Details of the SAPbuffer (short nametabbuffer) (drilldownreport)
Reports/SAPSystem/SAPBasis/WebApplicationServer/StatusReporting/Real-Time/DrilldownOnly/
SAP Buffer Detail(SingleRecord)
Details of the SAPbuffer (single recordbuffer) (drilldownreport)
Reports/SAPSystem/SAPBasis/WebApplicationServer/StatusReporting/Real-Time/DrilldownOnly/
SAP Buffer Detail(TableDefinition)
Details of the SAPbuffer (table definitionbuffer) (drilldownreport)
Reports/SAPSystem/SAPBasis/WebApplicationServer/StatusReporting/Real-Time/DrilldownOnly/
SAP Buffer Hitratio Analysis report in theevent of a problem withthe SAP buffer hit rateover the past hour
Reports/SAPSystem/SAPBasis/WebApplicationServer/Troubleshooting/Recent Past/
SAP Buffer HitratioStatus
Overview of the SAPbuffer hit rate
Reports/SAPSystem/SAPBasis/WebApplicationServer/StatusReporting/Real-Time/
1-134 Working with the Solution SetHitachi Tuning Manager Application Reports Reference
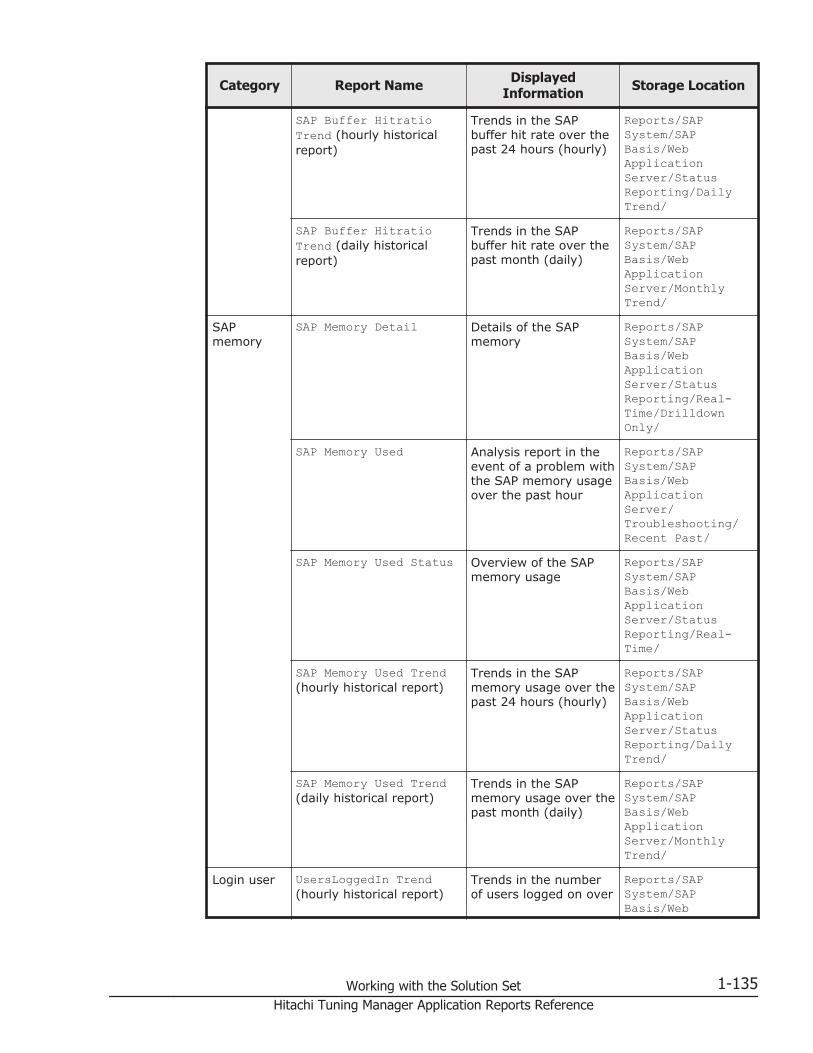
Category Report Name DisplayedInformation Storage Location
SAP Buffer HitratioTrend (hourly historicalreport)
Trends in the SAPbuffer hit rate over thepast 24 hours (hourly)
Reports/SAPSystem/SAPBasis/WebApplicationServer/StatusReporting/DailyTrend/
SAP Buffer HitratioTrend (daily historicalreport)
Trends in the SAPbuffer hit rate over thepast month (daily)
Reports/SAPSystem/SAPBasis/WebApplicationServer/MonthlyTrend/
SAPmemory
SAP Memory Detail Details of the SAPmemory
Reports/SAPSystem/SAPBasis/WebApplicationServer/StatusReporting/Real-Time/DrilldownOnly/
SAP Memory Used Analysis report in theevent of a problem withthe SAP memory usageover the past hour
Reports/SAPSystem/SAPBasis/WebApplicationServer/Troubleshooting/Recent Past/
SAP Memory Used Status Overview of the SAPmemory usage
Reports/SAPSystem/SAPBasis/WebApplicationServer/StatusReporting/Real-Time/
SAP Memory Used Trend(hourly historical report)
Trends in the SAPmemory usage over thepast 24 hours (hourly)
Reports/SAPSystem/SAPBasis/WebApplicationServer/StatusReporting/DailyTrend/
SAP Memory Used Trend(daily historical report)
Trends in the SAPmemory usage over thepast month (daily)
Reports/SAPSystem/SAPBasis/WebApplicationServer/MonthlyTrend/
Login user UsersLoggedIn Trend(hourly historical report)
Trends in the numberof users logged on over
Reports/SAPSystem/SAPBasis/Web
Working with the Solution Set 1-135Hitachi Tuning Manager Application Reports Reference
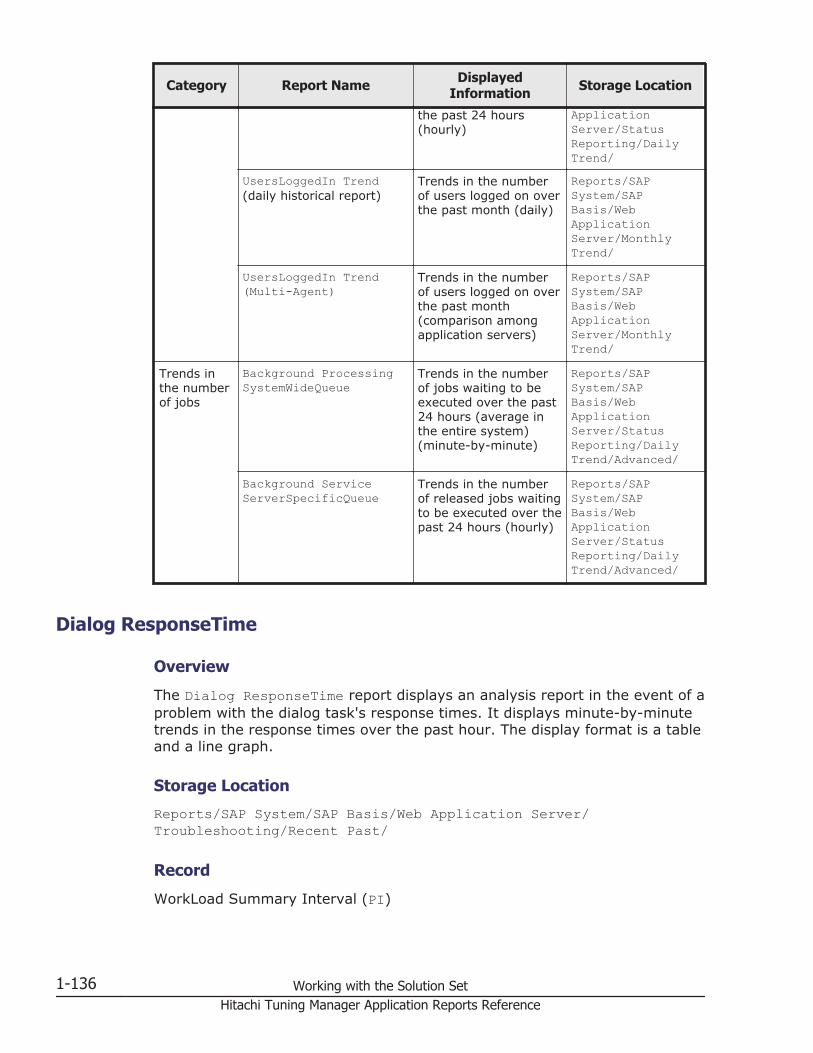
Category Report Name DisplayedInformation Storage Location
the past 24 hours(hourly)
ApplicationServer/StatusReporting/DailyTrend/
UsersLoggedIn Trend(daily historical report)
Trends in the numberof users logged on overthe past month (daily)
Reports/SAPSystem/SAPBasis/WebApplicationServer/MonthlyTrend/
UsersLoggedIn Trend(Multi-Agent)
Trends in the numberof users logged on overthe past month(comparison amongapplication servers)
Reports/SAPSystem/SAPBasis/WebApplicationServer/MonthlyTrend/
Trends inthe numberof jobs
Background ProcessingSystemWideQueue
Trends in the numberof jobs waiting to beexecuted over the past24 hours (average inthe entire system)(minute-by-minute)
Reports/SAPSystem/SAPBasis/WebApplicationServer/StatusReporting/DailyTrend/Advanced/
Background ServiceServerSpecificQueue
Trends in the numberof released jobs waitingto be executed over thepast 24 hours (hourly)
Reports/SAPSystem/SAPBasis/WebApplicationServer/StatusReporting/DailyTrend/Advanced/
Dialog ResponseTime
Overview
The Dialog ResponseTime report displays an analysis report in the event of aproblem with the dialog task's response times. It displays minute-by-minutetrends in the response times over the past hour. The display format is a tableand a line graph.
Storage Location
Reports/SAP System/SAP Basis/Web Application Server/Troubleshooting/Recent Past/
Record
WorkLoad Summary Interval (PI)
1-136 Working with the Solution SetHitachi Tuning Manager Application Reports Reference
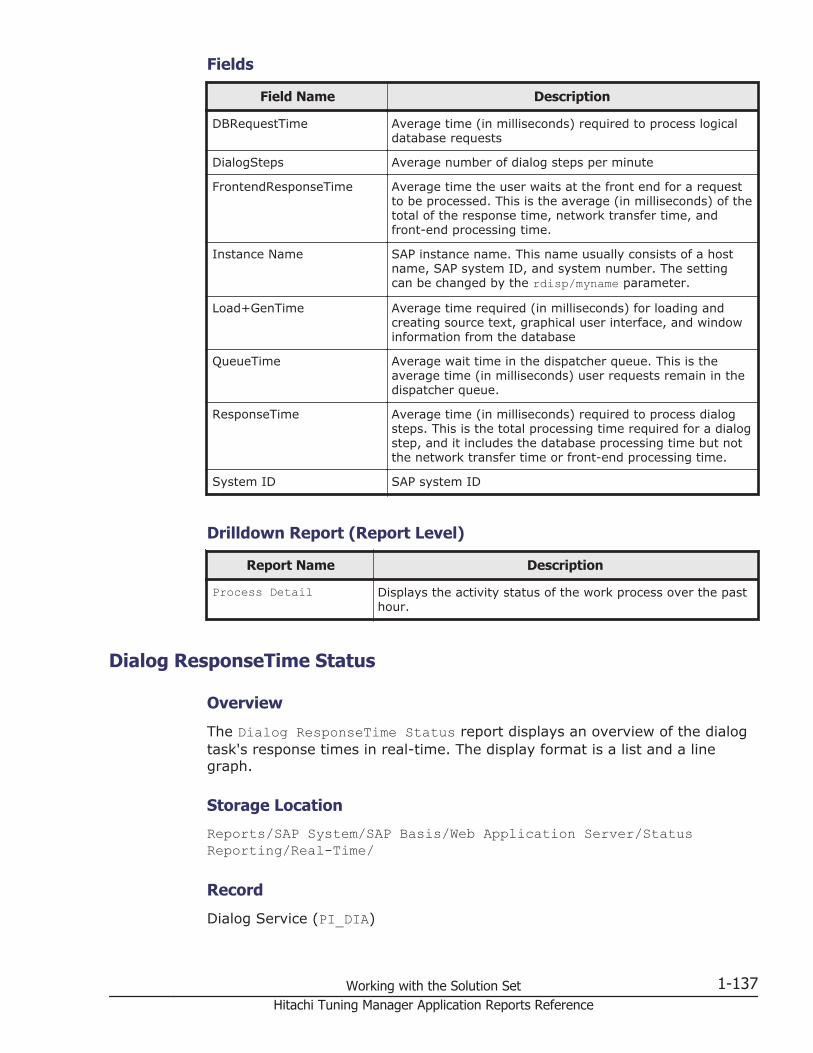
Fields
Field Name Description
DBRequestTime Average time (in milliseconds) required to process logicaldatabase requests
DialogSteps Average number of dialog steps per minute
FrontendResponseTime Average time the user waits at the front end for a requestto be processed. This is the average (in milliseconds) of thetotal of the response time, network transfer time, andfront-end processing time.
Instance Name SAP instance name. This name usually consists of a hostname, SAP system ID, and system number. The settingcan be changed by the rdisp/myname parameter.
Load+GenTime Average time required (in milliseconds) for loading andcreating source text, graphical user interface, and windowinformation from the database
QueueTime Average wait time in the dispatcher queue. This is theaverage time (in milliseconds) user requests remain in thedispatcher queue.
ResponseTime Average time (in milliseconds) required to process dialogsteps. This is the total processing time required for a dialogstep, and it includes the database processing time but notthe network transfer time or front-end processing time.
System ID SAP system ID
Drilldown Report (Report Level)
Report Name Description
Process Detail Displays the activity status of the work process over the pasthour.
Dialog ResponseTime Status
Overview
The Dialog ResponseTime Status report displays an overview of the dialogtask's response times in real-time. The display format is a list and a linegraph.
Storage Location
Reports/SAP System/SAP Basis/Web Application Server/StatusReporting/Real-Time/
Record
Dialog Service (PI_DIA)
Working with the Solution Set 1-137Hitachi Tuning Manager Application Reports Reference
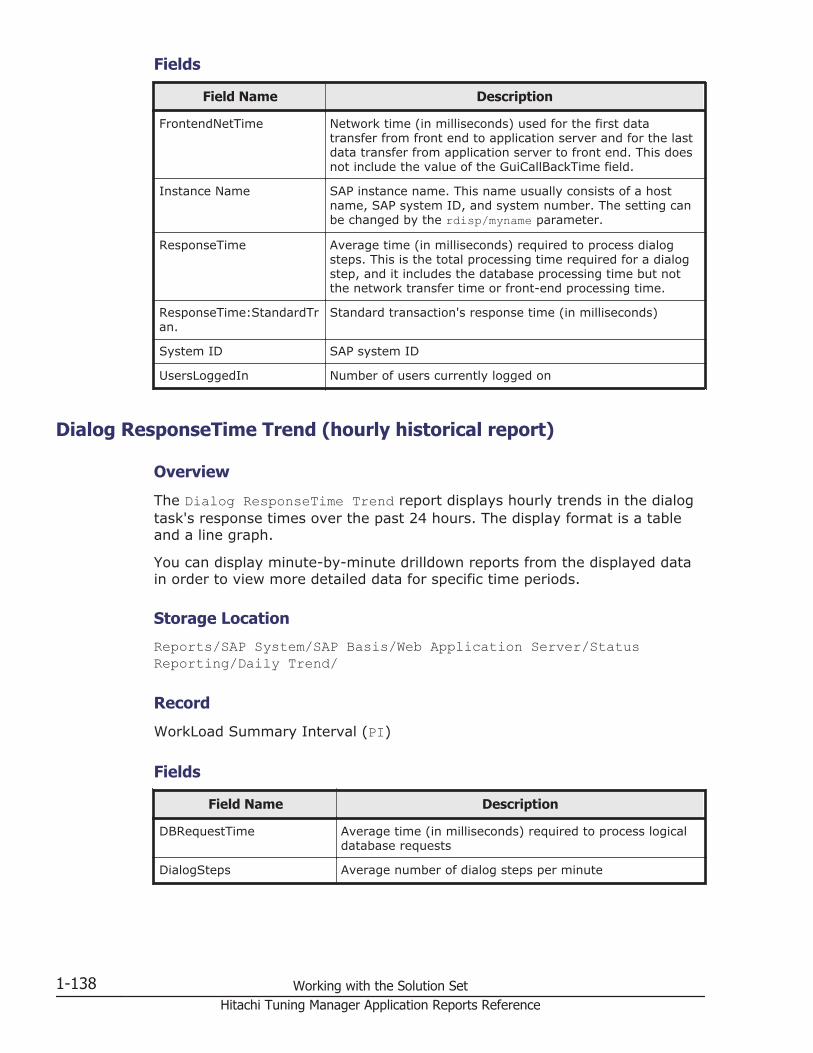
Fields
Field Name Description
FrontendNetTime Network time (in milliseconds) used for the first datatransfer from front end to application server and for the lastdata transfer from application server to front end. This doesnot include the value of the GuiCallBackTime field.
Instance Name SAP instance name. This name usually consists of a hostname, SAP system ID, and system number. The setting canbe changed by the rdisp/myname parameter.
ResponseTime Average time (in milliseconds) required to process dialogsteps. This is the total processing time required for a dialogstep, and it includes the database processing time but notthe network transfer time or front-end processing time.
ResponseTime:StandardTran.
Standard transaction's response time (in milliseconds)
System ID SAP system ID
UsersLoggedIn Number of users currently logged on
Dialog ResponseTime Trend (hourly historical report)
Overview
The Dialog ResponseTime Trend report displays hourly trends in the dialogtask's response times over the past 24 hours. The display format is a tableand a line graph.
You can display minute-by-minute drilldown reports from the displayed datain order to view more detailed data for specific time periods.
Storage Location
Reports/SAP System/SAP Basis/Web Application Server/StatusReporting/Daily Trend/
Record
WorkLoad Summary Interval (PI)
Fields
Field Name Description
DBRequestTime Average time (in milliseconds) required to process logicaldatabase requests
DialogSteps Average number of dialog steps per minute
1-138 Working with the Solution SetHitachi Tuning Manager Application Reports Reference
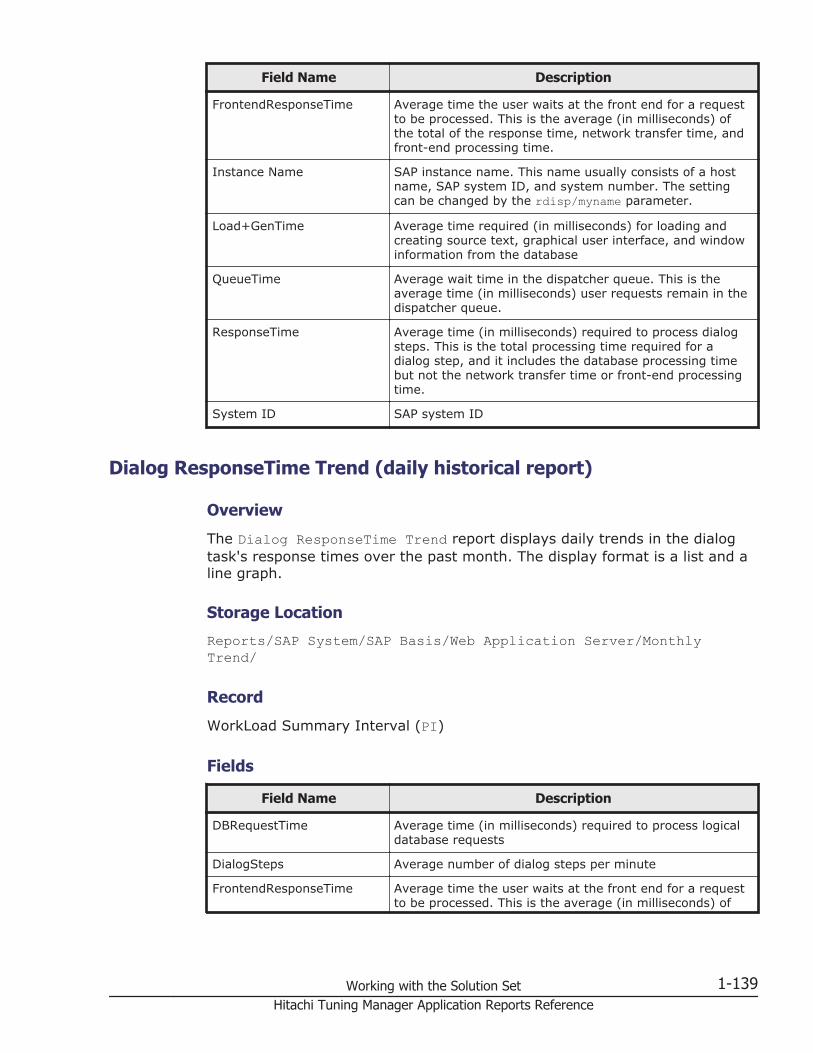
Field Name Description
FrontendResponseTime Average time the user waits at the front end for a requestto be processed. This is the average (in milliseconds) ofthe total of the response time, network transfer time, andfront-end processing time.
Instance Name SAP instance name. This name usually consists of a hostname, SAP system ID, and system number. The settingcan be changed by the rdisp/myname parameter.
Load+GenTime Average time required (in milliseconds) for loading andcreating source text, graphical user interface, and windowinformation from the database
QueueTime Average wait time in the dispatcher queue. This is theaverage time (in milliseconds) user requests remain in thedispatcher queue.
ResponseTime Average time (in milliseconds) required to process dialogsteps. This is the total processing time required for adialog step, and it includes the database processing timebut not the network transfer time or front-end processingtime.
System ID SAP system ID
Dialog ResponseTime Trend (daily historical report)
Overview
The Dialog ResponseTime Trend report displays daily trends in the dialogtask's response times over the past month. The display format is a list and aline graph.
Storage Location
Reports/SAP System/SAP Basis/Web Application Server/MonthlyTrend/
Record
WorkLoad Summary Interval (PI)
Fields
Field Name Description
DBRequestTime Average time (in milliseconds) required to process logicaldatabase requests
DialogSteps Average number of dialog steps per minute
FrontendResponseTime Average time the user waits at the front end for a requestto be processed. This is the average (in milliseconds) of
Working with the Solution Set 1-139Hitachi Tuning Manager Application Reports Reference

Field Name Description
the total of the response time, network transfer time, andfront-end processing time.
Instance Name SAP instance name. This name usually consists of a hostname, SAP system ID, and system number. The settingcan be changed by the rdisp/myname parameter.
Load+GenTime Average time required (in milliseconds) for loading andcreating source text, graphical user interface, and windowinformation from the database
QueueTime Average wait time in the dispatcher queue. This is theaverage time (in milliseconds) user requests remain in thedispatcher queue.
ResponseTime Average time (in milliseconds) required to process dialogsteps. This is the total processing time required for adialog step, and it includes the database processing timebut not the network transfer time or front-end processingtime.
System ID SAP system ID
Dialog ResponseTime Trend (Multi-Agent)
Overview
The Dialog ResponseTime Trend (Multi-Agent) report compares trends amongapplication servers in the dialog task's response times over the past month.The display format is a list and a line graph.
Storage Location
Reports/SAP System/SAP Basis/Web Application Server/MonthlyTrend/
Record
WorkLoad Summary Interval (PI)
Fields
Field Name Description
DBRequestTime Average time (in milliseconds) required to process logicaldatabase requests
DialogSteps Average number of dialog steps per minute
FrontendResponseTime Average time the user waits at the front end for a requestto be processed. This is the average (in milliseconds) of thetotal of the response time, network transfer time, andfront-end processing time.
1-140 Working with the Solution SetHitachi Tuning Manager Application Reports Reference

Field Name Description
Agent Instance Instance name of Agent
Load+GenTime Average time required (in milliseconds) for loading andcreating source text, graphical user interface, and windowinformation from the database
QueueTime Average wait time in the dispatcher queue. This is theaverage time (in milliseconds) user requests remain in thedispatcher queue.
ResponseTime Average time (in milliseconds) required to process dialogsteps. This is the total processing time required for a dialogstep, and it includes the database processing time but notthe network transfer time or front-end processing time.
System ID SAP system ID
Dialog Utilization %
Overview
The Dialog Utilization % report displays an analysis report in the event ofa problem with dialog work processes. It displays minute-by-minute trends inthe dialog work processes over the past hour.
Storage Location
Reports/SAP System/SAP Basis/Web Application Server/Troubleshooting/Recent Past/Advanced/
Record
Dialog Service (PI_DIA)
Fields
Field Name Description
Instance Name SAP instance name. This name usually consists of a hostname, SAP system ID, and system number. The setting canbe changed by the rdisp/myname parameter.
QueueLength % Average usage of the dispatcher queue for dialog workprocesses
Utilization % Average usage of the application server's dialog processes
System ID SAP system ID
Working with the Solution Set 1-141Hitachi Tuning Manager Application Reports Reference

Process Detail
Overview
The Process Detail report displays the activity status of a work processover the past hour. The display format is a list. This is a drilldown report.
Storage Location
Reports/SAP System/SAP Basis/Web Application Server/Troubleshooting/Recent Past/Drilldown Only/
Record
Work Process Summary (PD)
Fields
Field Name Description
Action Applicable activity name of the work process
Bname User name of the request that is currently being processedby the work process
CPU Reserved field; cannot be used
Dumps Number of times the work process terminated abnormally
ElTime Duration of the work process (in seconds)
Instance Name SAP instance name. This name usually consists of a hostname, SAP system ID, and system number. The setting canbe changed by the rdisp/myname parameter.
ManDt Client name of the request that is currently being processedby the work process
No Work process number
Pid ID of the work process in the host system
Report Name of the report the work process is executing
Restart Y (re-execute) or N (do not re-execute), indicating whetherthe work process will be re-executed automatically in theevent of abnormal termination.
Sem Semaphore number where the work process is in wait status
Status Current status of the work process (example: Waiting orRunning)
System ID SAP system ID
Table Name of the last database table accessed by the workprocess
Typ Type of work process (such as DIA, UPD, UP2, ENQ, BGD, orSPO).
1-142 Working with the Solution SetHitachi Tuning Manager Application Reports Reference
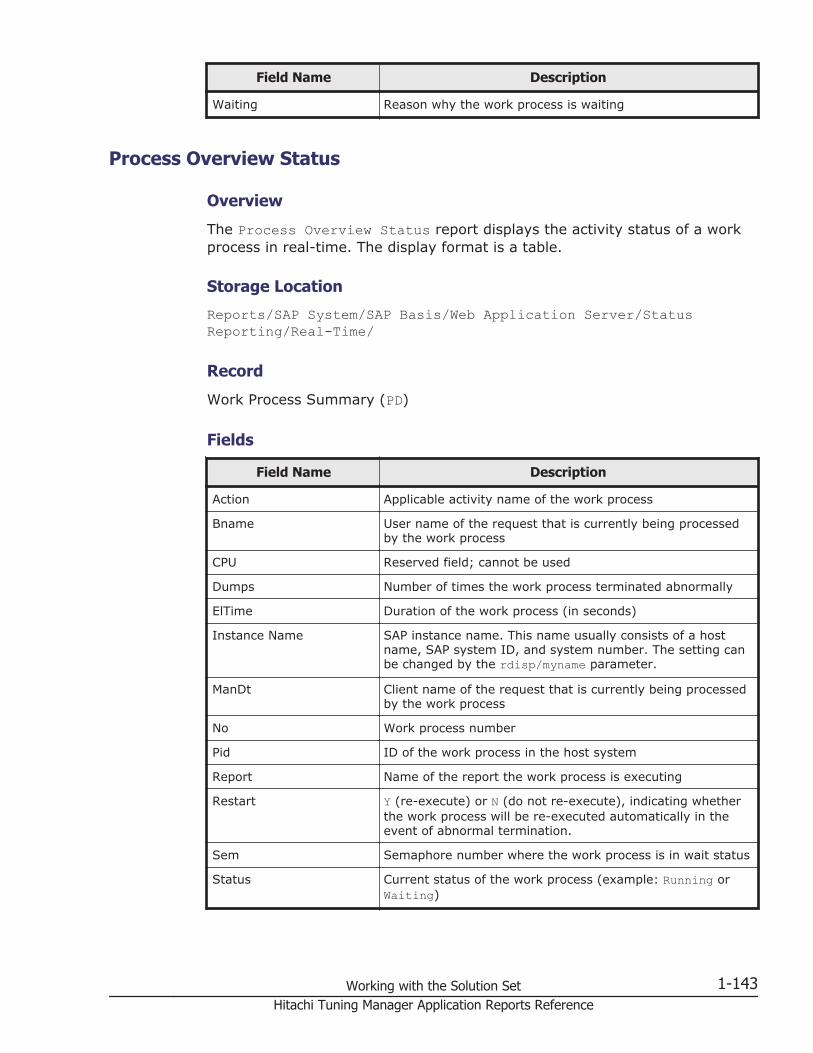
Field Name Description
Waiting Reason why the work process is waiting
Process Overview Status
Overview
The Process Overview Status report displays the activity status of a workprocess in real-time. The display format is a table.
Storage Location
Reports/SAP System/SAP Basis/Web Application Server/StatusReporting/Real-Time/
Record
Work Process Summary (PD)
Fields
Field Name Description
Action Applicable activity name of the work process
Bname User name of the request that is currently being processedby the work process
CPU Reserved field; cannot be used
Dumps Number of times the work process terminated abnormally
ElTime Duration of the work process (in seconds)
Instance Name SAP instance name. This name usually consists of a hostname, SAP system ID, and system number. The setting canbe changed by the rdisp/myname parameter.
ManDt Client name of the request that is currently being processedby the work process
No Work process number
Pid ID of the work process in the host system
Report Name of the report the work process is executing
Restart Y (re-execute) or N (do not re-execute), indicating whetherthe work process will be re-executed automatically in theevent of abnormal termination.
Sem Semaphore number where the work process is in wait status
Status Current status of the work process (example: Running orWaiting)
Working with the Solution Set 1-143Hitachi Tuning Manager Application Reports Reference
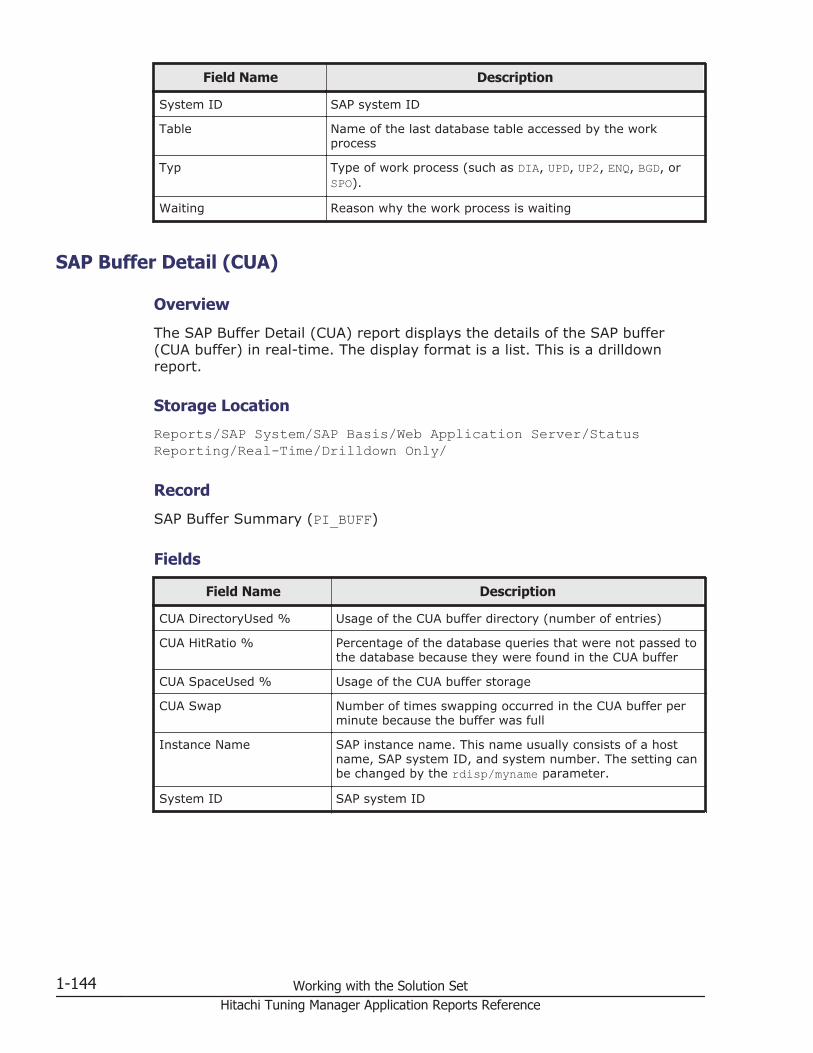
Field Name Description
System ID SAP system ID
Table Name of the last database table accessed by the workprocess
Typ Type of work process (such as DIA, UPD, UP2, ENQ, BGD, orSPO).
Waiting Reason why the work process is waiting
SAP Buffer Detail (CUA)
Overview
The SAP Buffer Detail (CUA) report displays the details of the SAP buffer(CUA buffer) in real-time. The display format is a list. This is a drilldownreport.
Storage Location
Reports/SAP System/SAP Basis/Web Application Server/StatusReporting/Real-Time/Drilldown Only/
Record
SAP Buffer Summary (PI_BUFF)
Fields
Field Name Description
CUA DirectoryUsed % Usage of the CUA buffer directory (number of entries)
CUA HitRatio % Percentage of the database queries that were not passed tothe database because they were found in the CUA buffer
CUA SpaceUsed % Usage of the CUA buffer storage
CUA Swap Number of times swapping occurred in the CUA buffer perminute because the buffer was full
Instance Name SAP instance name. This name usually consists of a hostname, SAP system ID, and system number. The setting canbe changed by the rdisp/myname parameter.
System ID SAP system ID
1-144 Working with the Solution SetHitachi Tuning Manager Application Reports Reference
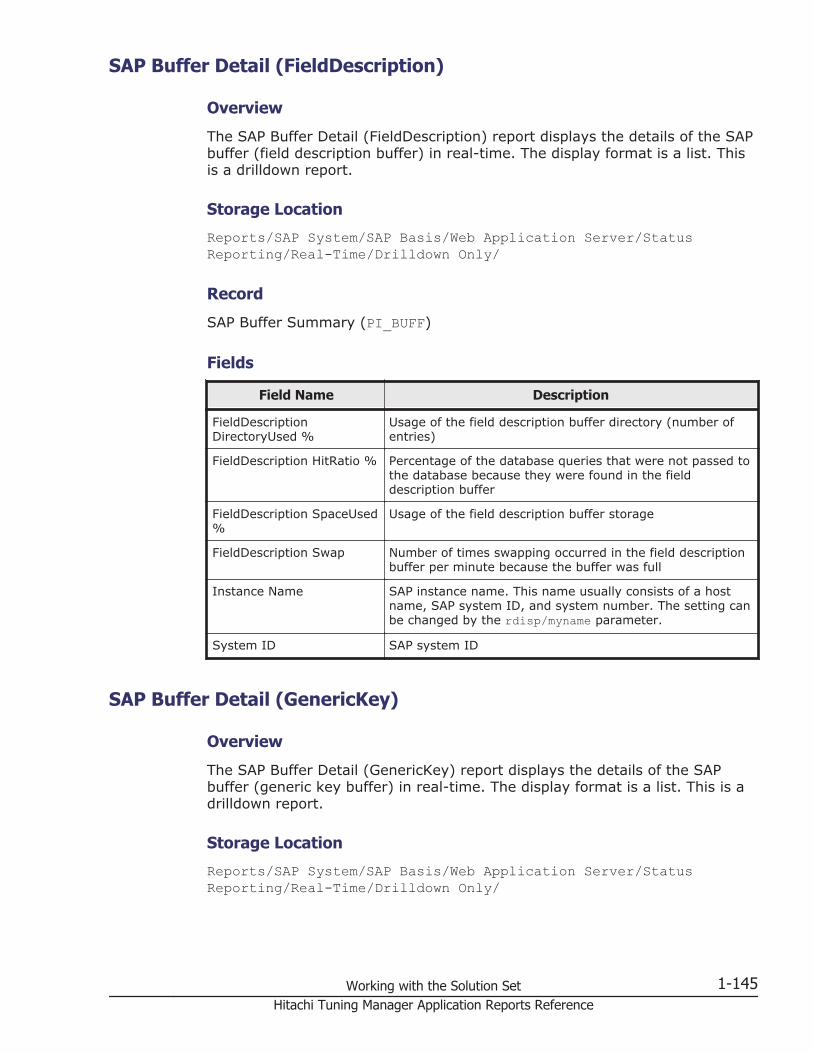
SAP Buffer Detail (FieldDescription)
Overview
The SAP Buffer Detail (FieldDescription) report displays the details of the SAPbuffer (field description buffer) in real-time. The display format is a list. Thisis a drilldown report.
Storage Location
Reports/SAP System/SAP Basis/Web Application Server/StatusReporting/Real-Time/Drilldown Only/
Record
SAP Buffer Summary (PI_BUFF)
Fields
Field Name Description
FieldDescriptionDirectoryUsed %
Usage of the field description buffer directory (number ofentries)
FieldDescription HitRatio % Percentage of the database queries that were not passed tothe database because they were found in the fielddescription buffer
FieldDescription SpaceUsed%
Usage of the field description buffer storage
FieldDescription Swap Number of times swapping occurred in the field descriptionbuffer per minute because the buffer was full
Instance Name SAP instance name. This name usually consists of a hostname, SAP system ID, and system number. The setting canbe changed by the rdisp/myname parameter.
System ID SAP system ID
SAP Buffer Detail (GenericKey)
Overview
The SAP Buffer Detail (GenericKey) report displays the details of the SAPbuffer (generic key buffer) in real-time. The display format is a list. This is adrilldown report.
Storage Location
Reports/SAP System/SAP Basis/Web Application Server/StatusReporting/Real-Time/Drilldown Only/
Working with the Solution Set 1-145Hitachi Tuning Manager Application Reports Reference
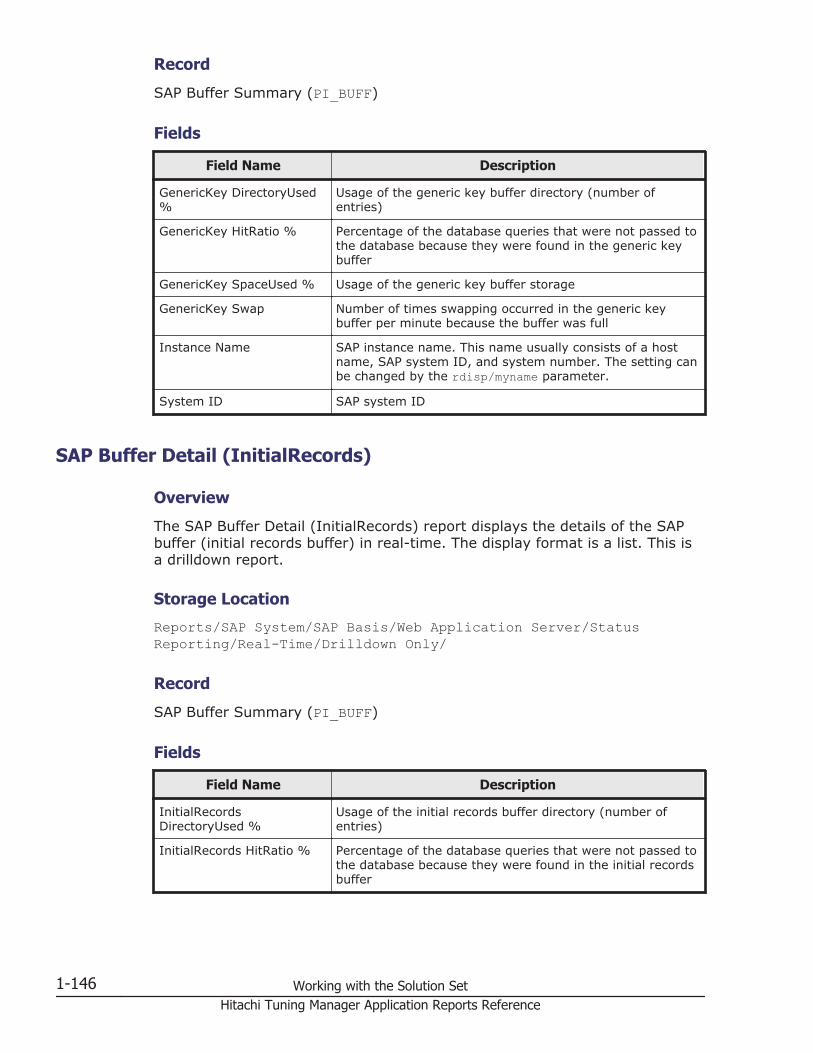
Record
SAP Buffer Summary (PI_BUFF)
Fields
Field Name Description
GenericKey DirectoryUsed%
Usage of the generic key buffer directory (number ofentries)
GenericKey HitRatio % Percentage of the database queries that were not passed tothe database because they were found in the generic keybuffer
GenericKey SpaceUsed % Usage of the generic key buffer storage
GenericKey Swap Number of times swapping occurred in the generic keybuffer per minute because the buffer was full
Instance Name SAP instance name. This name usually consists of a hostname, SAP system ID, and system number. The setting canbe changed by the rdisp/myname parameter.
System ID SAP system ID
SAP Buffer Detail (InitialRecords)
Overview
The SAP Buffer Detail (InitialRecords) report displays the details of the SAPbuffer (initial records buffer) in real-time. The display format is a list. This isa drilldown report.
Storage Location
Reports/SAP System/SAP Basis/Web Application Server/StatusReporting/Real-Time/Drilldown Only/
Record
SAP Buffer Summary (PI_BUFF)
Fields
Field Name Description
InitialRecordsDirectoryUsed %
Usage of the initial records buffer directory (number ofentries)
InitialRecords HitRatio % Percentage of the database queries that were not passed tothe database because they were found in the initial recordsbuffer
1-146 Working with the Solution SetHitachi Tuning Manager Application Reports Reference

Field Name Description
InitialRecords SpaceUsed%
Usage of the initial records buffer storage
InitialRecords Swap Number of times swapping occurred in the initial recordsbuffer per minute because the buffer was full
Instance Name SAP instance name. This name usually consists of a hostname, SAP system ID, and system number. The setting canbe changed by the rdisp/myname parameter.
System ID SAP system ID
SAP Buffer Detail (Program)
Overview
The SAP Buffer Detail (Program) report displays the details of the SAP buffer(program buffer) in real-time. The display format is a list. This is a drilldownreport.
Storage Location
Reports/SAP System/SAP Basis/Web Application Server/StatusReporting/Real-Time/Drilldown Only/
Record
SAP Buffer Summary (PI_BUFF)
Fields
Field Name Description
Instance Name SAP instance name. This name usually consists of a hostname, SAP system ID, and system number. The setting canbe changed by the rdisp/myname parameter.
Program DirectoryUsed % Usage of the program buffer directory (number of entries)
Program HitRatio % Percentage of the database queries that were not passed tothe database because they were found in the programbuffer
Program SpaceUsed % Usage of the program buffer storage
Program Swap Number of times swapping occurred in the program bufferper minute because the buffer was full
System ID SAP system ID
Working with the Solution Set 1-147Hitachi Tuning Manager Application Reports Reference

SAP Buffer Detail (Screen)
Overview
The SAP Buffer Detail (Screen) report displays the details of the SAP buffer(screen buffer) in real-time. The display format is a list. This is a drilldownreport.
Storage Location
Reports/SAP System/SAP Basis/Web Application Server/StatusReporting/Real-Time/Drilldown Only/
Record
SAP Buffer Summary (PI_BUFF)
Fields
Field Name Description
Instance Name SAP instance name. This name usually consists of a hostname, SAP system ID, and system number. The setting canbe changed by the rdisp/myname parameter.
Screen DirectoryUsed % Usage of the screen buffer directory (number of entries)
Screen HitRatio % Percentage of the database queries that were not passed tothe database because they were found in the screen buffer
Screen SpaceUsed % Usage of the screen buffer storage
Screen Swap Number of times swapping occurred in the screen bufferper minute because the buffer was full
System ID SAP system ID
SAP Buffer Detail (ShortNameTAB)
Overview
The SAP Buffer Detail (ShortNameTAB) report displays the details of the SAPbuffer (short nametab buffer) in real-time. The display format is a list. This isa drilldown report.
Storage Location
Reports/SAP System/SAP Basis/Web Application Server/StatusReporting/Real-Time/Drilldown Only/
Record
SAP Buffer Summary (PI_BUFF)
1-148 Working with the Solution SetHitachi Tuning Manager Application Reports Reference

Fields
Field Name Description
Instance Name SAP instance name. This name usually consists of a hostname, SAP system ID, and system number. The setting canbe changed by the rdisp/myname parameter.
ShortNameTABDirectoryUsed %
Usage of the short nametab buffer directory (number ofentries)
ShortNameTAB HitRatio % Percentage of the database queries that were not passed tothe database because they were found in the shortnametab buffer
ShortNameTAB SpaceUsed%
Usage of the short nametab buffer storage
ShortNameTAB Swap Number of times swapping occurred in the short nametabbuffer per minute because the buffer was full
System ID SAP system ID
SAP Buffer Detail (SingleRecord)
Overview
The SAP Buffer Detail (SingleRecord) report displays the details of the SAPbuffer (single record buffer) in real-time. The display format is a list. This is adrilldown report.
Storage Location
Reports/SAP System/SAP Basis/Web Application Server/StatusReporting/Real-Time/Drilldown Only/
Record
SAP Buffer Summary (PI_BUFF)
Fields
Field Name Description
Instance Name SAP instance name. This name usually consists of a hostname, SAP system ID, and system number. The setting canbe changed by the rdisp/myname parameter.
SingleRecord DirectoryUsed%
Usage of the single record buffer directory (number ofentries)
SingleRecord HitRatio % Ratio (percentage) of the database queries that were notpassed to the database because the data was found in thesingle record buffer
SingleRecord SpaceUsed % Usage of the single record buffer storage
Working with the Solution Set 1-149Hitachi Tuning Manager Application Reports Reference
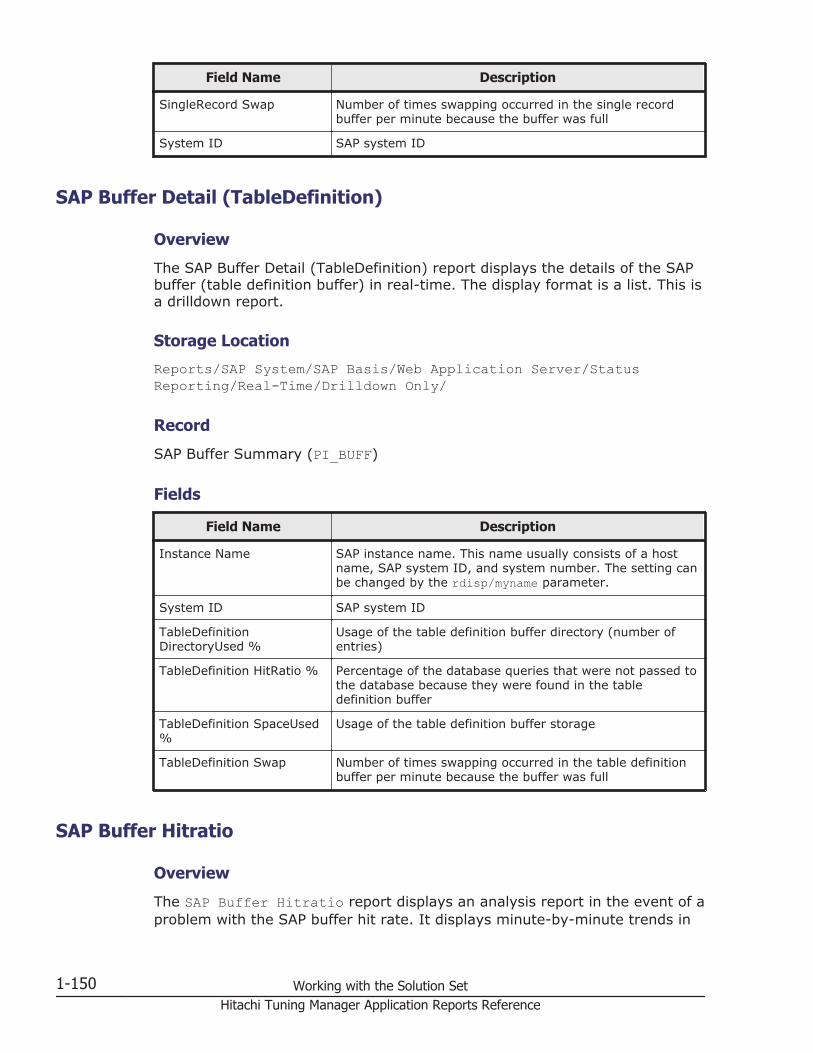
Field Name Description
SingleRecord Swap Number of times swapping occurred in the single recordbuffer per minute because the buffer was full
System ID SAP system ID
SAP Buffer Detail (TableDefinition)
Overview
The SAP Buffer Detail (TableDefinition) report displays the details of the SAPbuffer (table definition buffer) in real-time. The display format is a list. This isa drilldown report.
Storage Location
Reports/SAP System/SAP Basis/Web Application Server/StatusReporting/Real-Time/Drilldown Only/
Record
SAP Buffer Summary (PI_BUFF)
Fields
Field Name Description
Instance Name SAP instance name. This name usually consists of a hostname, SAP system ID, and system number. The setting canbe changed by the rdisp/myname parameter.
System ID SAP system ID
TableDefinitionDirectoryUsed %
Usage of the table definition buffer directory (number ofentries)
TableDefinition HitRatio % Percentage of the database queries that were not passed tothe database because they were found in the tabledefinition buffer
TableDefinition SpaceUsed%
Usage of the table definition buffer storage
TableDefinition Swap Number of times swapping occurred in the table definitionbuffer per minute because the buffer was full
SAP Buffer Hitratio
Overview
The SAP Buffer Hitratio report displays an analysis report in the event of aproblem with the SAP buffer hit rate. It displays minute-by-minute trends in
1-150 Working with the Solution SetHitachi Tuning Manager Application Reports Reference

the SAP buffer hit rate over the past hour. The display format is a table and aline graph.
Storage Location
Reports/SAP System/SAP Basis/Web Application Server/Troubleshooting/Recent Past/
Record
WorkLoad Summary Interval (PI)
Fields
Field Name Description
CUA HitRatio % Percentage of the database queries that were not passed tothe database because they were found in the CUA buffer
FieldDescription HitRatio % Percentage of the database queries that were not passed tothe database because they were found in the fielddescription buffer
GenericKey HitRatio % Percentage of the database queries that were not passed tothe database because they were found in the generic keybuffer
InitialRecords HitRatio % Percentage of the database queries that were not passed tothe database because they were found in the initial recordsbuffer
Instance Name SAP instance name. This name usually consists of a hostname, SAP system ID, and system number. The setting canbe changed by the rdisp/myname parameter.
Program HitRatio % Percentage of the database queries that were not passed tothe database because they were found in the programbuffer
Screen HitRatio % Percentage of the database queries that were not passed tothe database because they were found in the screen buffer
ShortNameTAB HitRatio % Percentage of the database queries that were not passed tothe database because they were found in the shortnametab buffer
SingleRecord HitRatio % Percentage of the database queries that were not passed tothe database because they were found in the single recordbuffer
System ID SAP system ID
TableDefinition HitRatio % Percentage of the database queries that were not passed tothe database because they were found in the tabledefinition buffer
Working with the Solution Set 1-151Hitachi Tuning Manager Application Reports Reference

Drilldown Report (Report Level)
Report Name Description
Process Detail Displays the activity status of the work process over thepast hour.
SAP Buffer Hitratio Status
Overview
The SAP Buffer Hitratio Status report displays an overview of the SAPbuffer hit rate in real-time. The display format is a list and a line graph.
Storage Location
Reports/SAP System/SAP Basis/Web Application Server/StatusReporting/Real-Time/
Record
SAP Buffer Summary (PI_BUFF)
Fields
Field Name Description
CUA HitRatio % Percentage of the database queries that were not passed tothe database because they were found in the CUA buffer
FieldDescription HitRatio % Percentage of the database queries that were not passed tothe database because they were found in the fielddescription buffer
GenericKey HitRatio % Percentage of the database queries that were not passed tothe database because they were found in the generic keybuffer
InitialRecords HitRatio % Percentage of the database queries that were not passed tothe database because they were found in the initial recordsbuffer
Instance Name SAP instance name. This name usually consists of a hostname, SAP system ID, and system number. The setting canbe changed by the rdisp/myname parameter.
Program HitRatio % Percentage of the database queries that were not passed tothe database because they were found in the programbuffer
Screen HitRatio % Percentage of the database queries that were not passed tothe database because they were found in the screen buffer
ShortNameTAB HitRatio % Percentage of the database queries that were not passed tothe database because they were found in the shortnametab buffer
1-152 Working with the Solution SetHitachi Tuning Manager Application Reports Reference
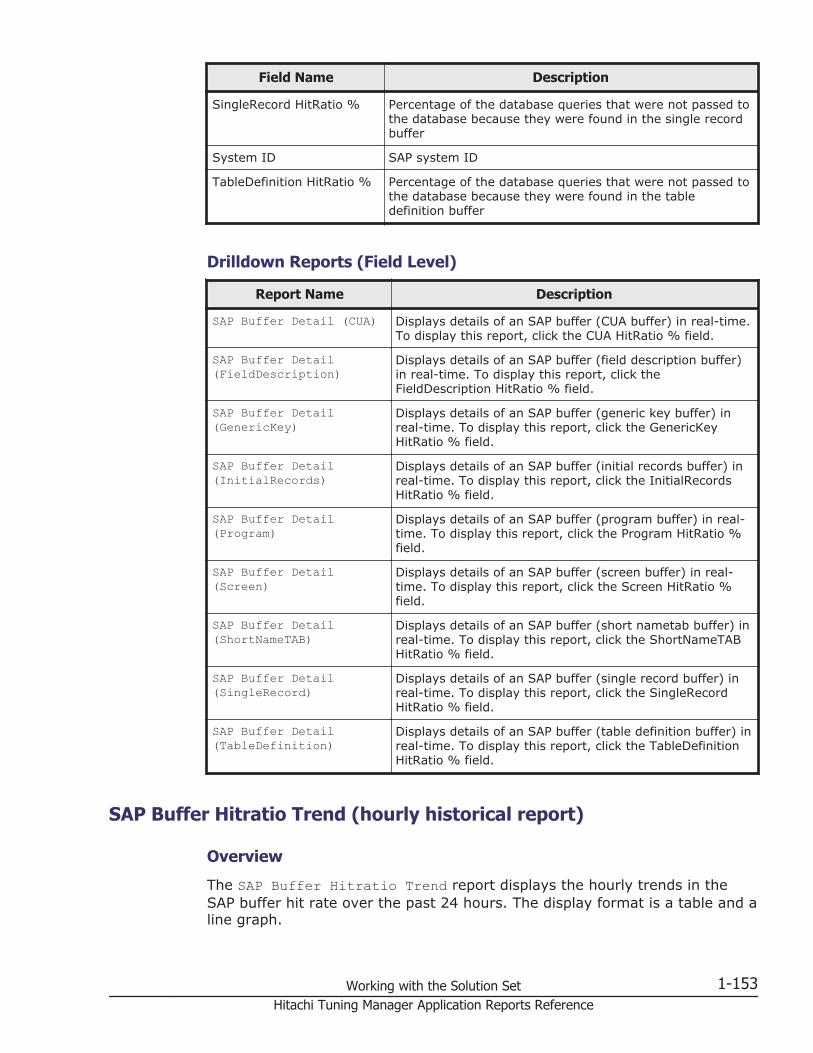
Field Name Description
SingleRecord HitRatio % Percentage of the database queries that were not passed tothe database because they were found in the single recordbuffer
System ID SAP system ID
TableDefinition HitRatio % Percentage of the database queries that were not passed tothe database because they were found in the tabledefinition buffer
Drilldown Reports (Field Level)
Report Name Description
SAP Buffer Detail (CUA) Displays details of an SAP buffer (CUA buffer) in real-time.To display this report, click the CUA HitRatio % field.
SAP Buffer Detail(FieldDescription)
Displays details of an SAP buffer (field description buffer)in real-time. To display this report, click theFieldDescription HitRatio % field.
SAP Buffer Detail(GenericKey)
Displays details of an SAP buffer (generic key buffer) inreal-time. To display this report, click the GenericKeyHitRatio % field.
SAP Buffer Detail(InitialRecords)
Displays details of an SAP buffer (initial records buffer) inreal-time. To display this report, click the InitialRecordsHitRatio % field.
SAP Buffer Detail(Program)
Displays details of an SAP buffer (program buffer) in real-time. To display this report, click the Program HitRatio %field.
SAP Buffer Detail(Screen)
Displays details of an SAP buffer (screen buffer) in real-time. To display this report, click the Screen HitRatio %field.
SAP Buffer Detail(ShortNameTAB)
Displays details of an SAP buffer (short nametab buffer) inreal-time. To display this report, click the ShortNameTABHitRatio % field.
SAP Buffer Detail(SingleRecord)
Displays details of an SAP buffer (single record buffer) inreal-time. To display this report, click the SingleRecordHitRatio % field.
SAP Buffer Detail(TableDefinition)
Displays details of an SAP buffer (table definition buffer) inreal-time. To display this report, click the TableDefinitionHitRatio % field.
SAP Buffer Hitratio Trend (hourly historical report)
Overview
The SAP Buffer Hitratio Trend report displays the hourly trends in theSAP buffer hit rate over the past 24 hours. The display format is a table and aline graph.
Working with the Solution Set 1-153Hitachi Tuning Manager Application Reports Reference

You can display minute-by-minute drilldown reports from the displayed datain order to view more detailed data for specific time periods.
Storage Location
Reports/SAP System/SAP Basis/Web Application Server/StatusReporting/Daily Trend/
Record
WorkLoad Summary Interval (PI)
Fields
Field Name Description
CUA HitRatio % Percentage of the database queries that were not passed tothe database because they were found in the CUA buffer
FieldDescription HitRatio % Percentage of the database queries that were not passed tothe database because they were found in the fielddescription buffer
GenericKey HitRatio % Percentage of the database queries that were not passed tothe database because they were found in the generic keybuffer
InitialRecords HitRatio % Percentage of the database queries that were not passed tothe database because they were found in the initial recordsbuffer
Instance Name SAP instance name. This name usually consists of a hostname, SAP system ID, and system number. The setting canbe changed by the rdisp/myname parameter.
Program HitRatio % Percentage of the database queries that were not passed tothe database because they were found in the programbuffer
Screen HitRatio % Percentage of the database queries that were not passed tothe database because they were found in the screen buffer
ShortNameTAB HitRatio % Percentage of the database queries that were not passed tothe database because they were found in the shortnametab buffer
SingleRecord HitRatio % Percentage of the database queries that were not passed tothe database because they were found in the single recordbuffer
System ID SAP system ID
TableDefinition HitRatio % Percentage of the database queries that were not passed tothe database because they were found in the tabledefinition buffer
1-154 Working with the Solution SetHitachi Tuning Manager Application Reports Reference

SAP Buffer Hitratio Trend (daily historical report)
Overview
The SAP Buffer Hitratio Trend report displays the daily trends in the SAPbuffer hit rate over the past month. The display format is a list and a linegraph.
Storage Location
Reports/SAP System/SAP Basis/Web Application Server/MonthlyTrend/
Record
WorkLoad Summary Interval (PI)
Fields
Field Name Description
CUA HitRatio % Percentage of the database queries that were not passed tothe database because they were found in the CUA buffer
FieldDescription HitRatio % Percentage of the database queries that were not passed tothe database because they were found in the fielddescription buffer
GenericKey HitRatio % Percentage of the database queries that were not passed tothe database because they were found in the generic keybuffer
InitialRecords HitRatio % Percentage of the database queries that were not passed tothe database because they were found in the initial recordsbuffer
Instance Name SAP instance name. This name usually consists of a hostname, SAP system ID, and system number. The setting canbe changed by the rdisp/myname parameter.
Program HitRatio % Percentage of the database queries that were not passed tothe database because they were found in the programbuffer
Screen HitRatio % Percentage of the database queries that were not passed tothe database because they were found in the screen buffer
ShortNameTAB HitRatio % Percentage of the database queries that were not passed tothe database because they were found in the shortnametab buffer
SingleRecord HitRatio % Percentage of the database queries that were not passed tothe database because they were found in the single recordbuffer
System ID SAP system ID
Working with the Solution Set 1-155Hitachi Tuning Manager Application Reports Reference

Field Name Description
TableDefinition HitRatio % Percentage of the database queries that were not passed tothe database because they were found in the tabledefinition buffer
SAP Memory Detail
Overview
The SAP Memory Detail report displays the details of the SAP memory inreal-time. The display format is a list. This is a drilldown report.
Storage Location
Reports/SAP System/SAP Basis/Web Application Server/StatusReporting/Real-Time/Drilldown Only/
Record
SAP Memory Summary (PI_MEM)
Fields
Field Name Description
EmSlotsAct % Current usage of the expansion memory slots
EmSlotsTotal Total number of expansion memory slots
EsAct % Current expansion memory usage
EsAttached % Usage of the attached expansion memory
EsTotal Size (in megabytes) of the expansion memory
HeapAct % Current heap area usage
HeapTotal Total size (in megabytes) of the heap area
Instance Name SAP instance name. This name usually consists of a hostname, SAP system ID, and system number. The setting canbe changed by the rdisp/myname parameter.
PrivWpNo Number of work processes that were placed in the PRIVmode
R3PagingUsed % Paging area usage
R3RollUsed % Roll area usage
System ID SAP system ID
WpDiaRestart Number of dialog work processes with restart=Yesspecified
WpNonDiaRestart Number of dialog work processes with restart=No specified
1-156 Working with the Solution SetHitachi Tuning Manager Application Reports Reference
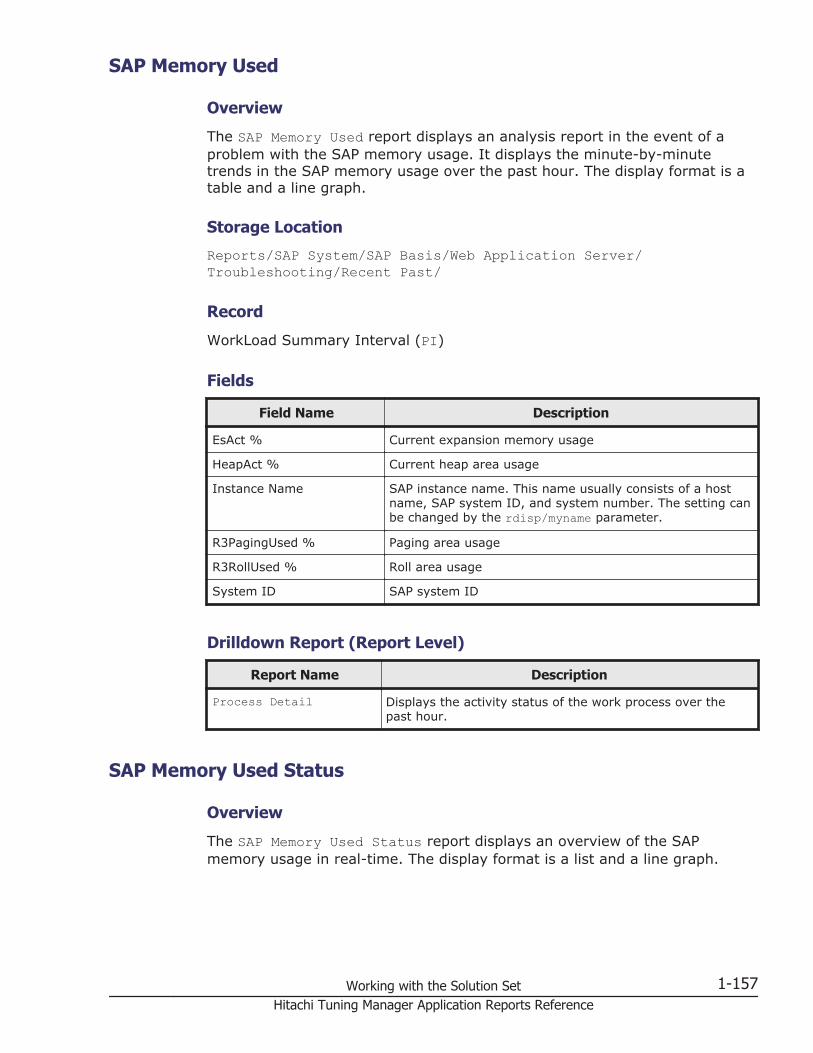
SAP Memory Used
Overview
The SAP Memory Used report displays an analysis report in the event of aproblem with the SAP memory usage. It displays the minute-by-minutetrends in the SAP memory usage over the past hour. The display format is atable and a line graph.
Storage Location
Reports/SAP System/SAP Basis/Web Application Server/Troubleshooting/Recent Past/
Record
WorkLoad Summary Interval (PI)
Fields
Field Name Description
EsAct % Current expansion memory usage
HeapAct % Current heap area usage
Instance Name SAP instance name. This name usually consists of a hostname, SAP system ID, and system number. The setting canbe changed by the rdisp/myname parameter.
R3PagingUsed % Paging area usage
R3RollUsed % Roll area usage
System ID SAP system ID
Drilldown Report (Report Level)
Report Name Description
Process Detail Displays the activity status of the work process over thepast hour.
SAP Memory Used Status
Overview
The SAP Memory Used Status report displays an overview of the SAPmemory usage in real-time. The display format is a list and a line graph.
Working with the Solution Set 1-157Hitachi Tuning Manager Application Reports Reference

Storage Location
Reports/SAP System/SAP Basis/Web Application Server/StatusReporting/Real-Time/
Record
SAP Memory Summary (PI_MEM)
Fields
Field Name Description
EsAct % Current expansion memory usage
HeapAct % Current heap area usage
Instance Name SAP instance name. This name usually consists of a hostname, SAP system ID, and system number. The setting canbe changed by the rdisp/myname parameter.
R3PagingUsed % Paging area usage
R3RollUsed % Roll area usage
System ID SAP system ID
Drilldown Report (Field Level)
Report Name Description
SAP Memory Detail Displays details of the SAP memory in real-time. To displaythis report, click the EsAct %, HeapAct %, R3PagingUsed %,or R3RollUsed % field.
SAP Memory Used Trend (hourly historical report)
Overview
The SAP Memory Used Trend report displays hourly trends in the SAPmemory usage over the past 24 hours. The display format is a table and aline graph. You can display minute-by-minute drilldown reports from thedisplayed data in order to view more detailed data in specific time periods.
Storage Location
Reports/SAP System/SAP Basis/Web Application Server/StatusReporting/Daily Trend/
Record
WorkLoad Summary Interval (PI)
1-158 Working with the Solution SetHitachi Tuning Manager Application Reports Reference
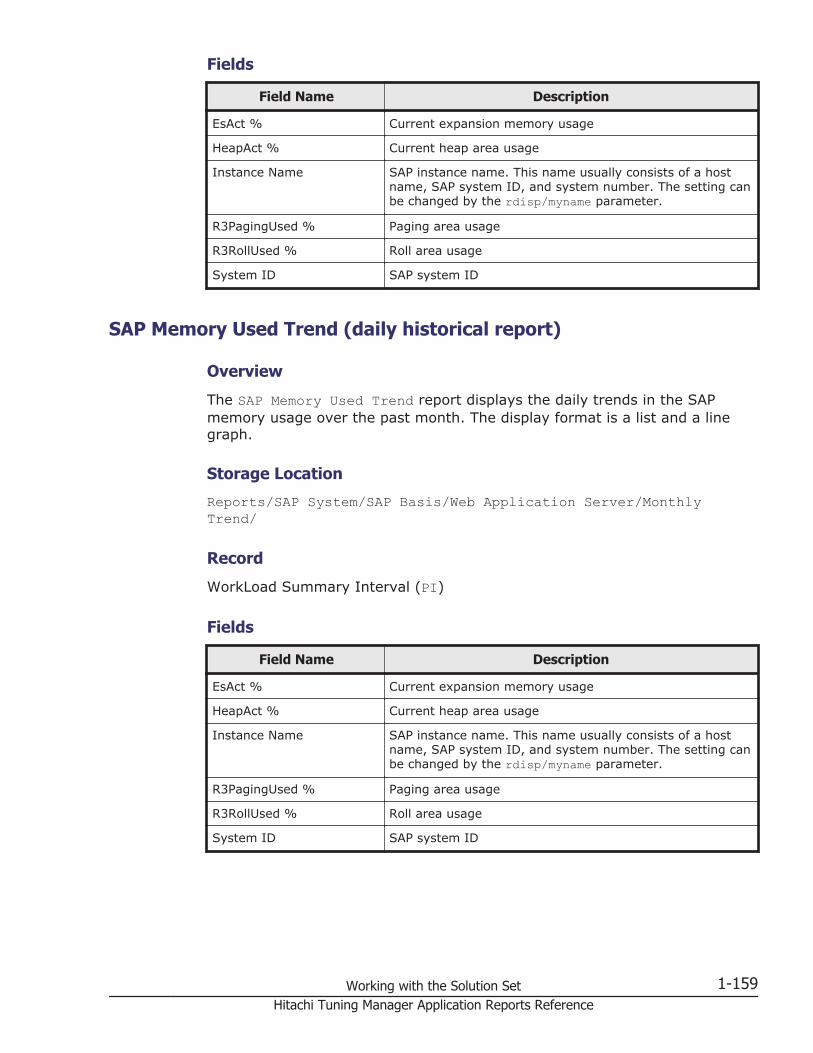
Fields
Field Name Description
EsAct % Current expansion memory usage
HeapAct % Current heap area usage
Instance Name SAP instance name. This name usually consists of a hostname, SAP system ID, and system number. The setting canbe changed by the rdisp/myname parameter.
R3PagingUsed % Paging area usage
R3RollUsed % Roll area usage
System ID SAP system ID
SAP Memory Used Trend (daily historical report)
Overview
The SAP Memory Used Trend report displays the daily trends in the SAPmemory usage over the past month. The display format is a list and a linegraph.
Storage Location
Reports/SAP System/SAP Basis/Web Application Server/MonthlyTrend/
Record
WorkLoad Summary Interval (PI)
Fields
Field Name Description
EsAct % Current expansion memory usage
HeapAct % Current heap area usage
Instance Name SAP instance name. This name usually consists of a hostname, SAP system ID, and system number. The setting canbe changed by the rdisp/myname parameter.
R3PagingUsed % Paging area usage
R3RollUsed % Roll area usage
System ID SAP system ID
Working with the Solution Set 1-159Hitachi Tuning Manager Application Reports Reference
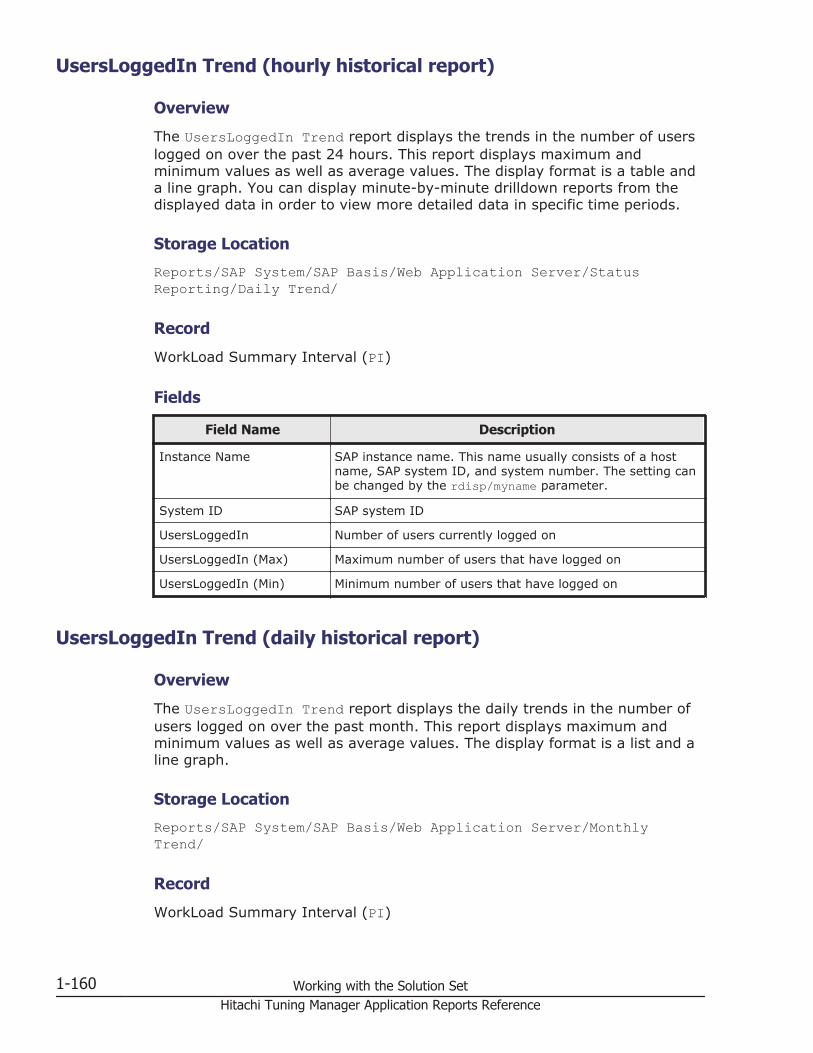
UsersLoggedIn Trend (hourly historical report)
Overview
The UsersLoggedIn Trend report displays the trends in the number of userslogged on over the past 24 hours. This report displays maximum andminimum values as well as average values. The display format is a table anda line graph. You can display minute-by-minute drilldown reports from thedisplayed data in order to view more detailed data in specific time periods.
Storage Location
Reports/SAP System/SAP Basis/Web Application Server/StatusReporting/Daily Trend/
Record
WorkLoad Summary Interval (PI)
Fields
Field Name Description
Instance Name SAP instance name. This name usually consists of a hostname, SAP system ID, and system number. The setting canbe changed by the rdisp/myname parameter.
System ID SAP system ID
UsersLoggedIn Number of users currently logged on
UsersLoggedIn (Max) Maximum number of users that have logged on
UsersLoggedIn (Min) Minimum number of users that have logged on
UsersLoggedIn Trend (daily historical report)
Overview
The UsersLoggedIn Trend report displays the daily trends in the number ofusers logged on over the past month. This report displays maximum andminimum values as well as average values. The display format is a list and aline graph.
Storage Location
Reports/SAP System/SAP Basis/Web Application Server/MonthlyTrend/
Record
WorkLoad Summary Interval (PI)
1-160 Working with the Solution SetHitachi Tuning Manager Application Reports Reference

Fields
Field Name Description
Instance Name SAP instance name. This name usually consists of a hostname, SAP system ID, and system number. The setting canbe changed by the rdisp/myname parameter.
System ID SAP system ID
UsersLoggedIn Number of users currently logged on
UsersLoggedIn (Max) Maximum number of users that have logged on
UsersLoggedIn (Min) Minimum number of users that have logged on
UsersLoggedIn Trend (Multi-Agent)
Overview
The UsersLoggedIn Trend (Multi-Agent) report compares among applicationservers the trends in the number of users logged on over the past month.The display format is a list and a line graph.
Storage Location
Reports/SAP System/SAP Basis/Web Application Server/MonthlyTrend/
Record
WorkLoad Summary Interval (PI)
Fields
Field Name Description
Instance Name SAP instance name. This name usually consists of a hostname, SAP system ID, and system number. The setting canbe changed by the rdisp/myname parameter.
System ID SAP system ID
UsersLoggedIn Number of users currently logged on
UsersLoggedIn (Max) Maximum number of users that have logged on
UsersLoggedIn (Min) Minimum number of users that have logged on
Working with the Solution Set 1-161Hitachi Tuning Manager Application Reports Reference

Background Processing SystemWideQueue
Overview
The Background Processing SystemWideQueue report displays hourly trendsin the number of jobs waiting to be executed over the past 24 hours (averagein the entire system).
Storage Location
Reports/SAP System/SAP Basis/Web Application Server/StatusReporting/Daily Trend/Advanced/
Record
Background Processing (PI_BTCP)
Fields
Field Name Description
Instance Name SAP instance name. This name usually consists of a hostname, SAP system ID, and system number. The settingcan be changed by the rdisp/myname parameter.
SystemWideQueueLength Number of jobs waiting to be executed (average in theentire system)
System ID SAP system ID
Background Service ServerSpecificQueue
Overview
The Background Service ServerSpecificQueue report displays hourlytrends in the number of released jobs waiting to be executed over the past 24hours.
Storage Location
Reports/SAP System/SAP Basis/Web Application Server/StatusReporting/Daily Trend/Advanced/
Record
Background Service (PI_BTC)
1-162 Working with the Solution SetHitachi Tuning Manager Application Reports Reference
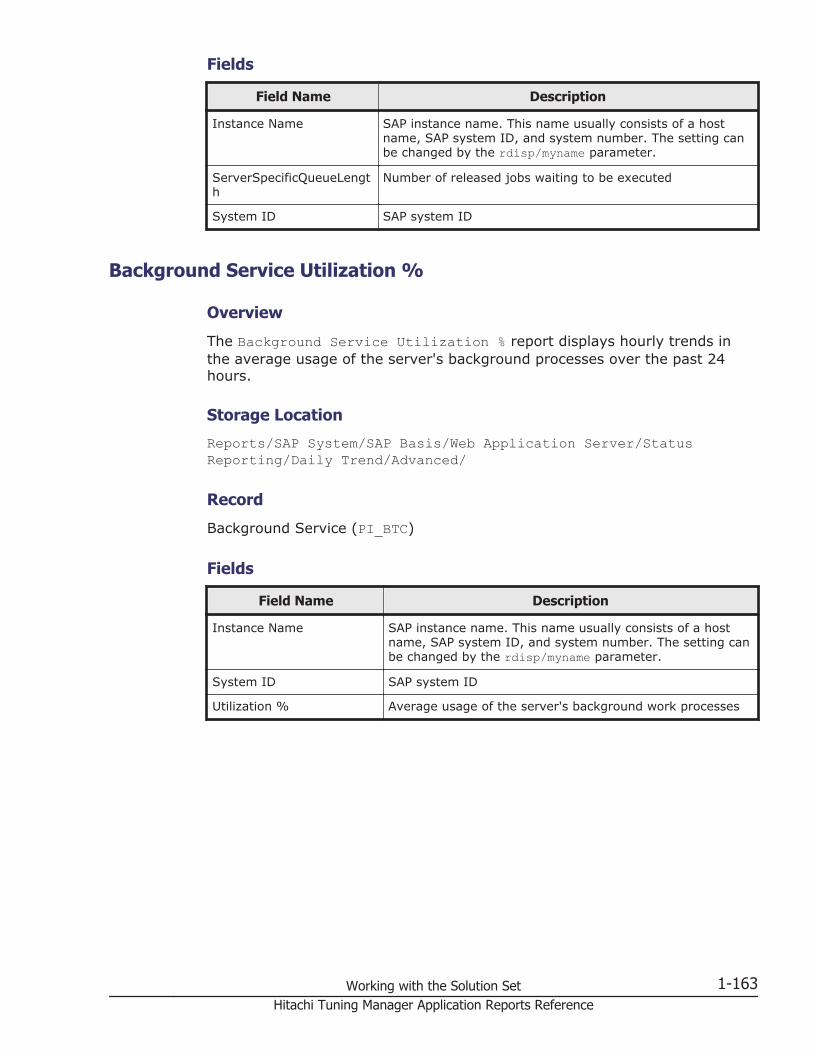
Fields
Field Name Description
Instance Name SAP instance name. This name usually consists of a hostname, SAP system ID, and system number. The setting canbe changed by the rdisp/myname parameter.
ServerSpecificQueueLength
Number of released jobs waiting to be executed
System ID SAP system ID
Background Service Utilization %
Overview
The Background Service Utilization % report displays hourly trends inthe average usage of the server's background processes over the past 24hours.
Storage Location
Reports/SAP System/SAP Basis/Web Application Server/StatusReporting/Daily Trend/Advanced/
Record
Background Service (PI_BTC)
Fields
Field Name Description
Instance Name SAP instance name. This name usually consists of a hostname, SAP system ID, and system number. The setting canbe changed by the rdisp/myname parameter.
System ID SAP system ID
Utilization % Average usage of the server's background work processes
Working with the Solution Set 1-163Hitachi Tuning Manager Application Reports Reference

1-164 Working with the Solution SetHitachi Tuning Manager Application Reports Reference
2Working with Records
This chapter describes the contents of the records collected by Agents. WithPerformance Reporter, you can use predefined solution set reports or userdefined reports to view the records collected by Agents. For details about thesolution set reports provided by each Agent, see Chapter 1, Working with theSolution Set on page 1-1.
□ Data Model Version
□ Format of Record Explanations
□ List of Common Key Fields
□ Field Values
□ Fields Added When Data Is Stored in a Store Database
□ Notes on Collecting Records
□ Agent for Oracle Records
□ Agent for Microsoft SQL Server Records
□ Agent for Microsoft Exchange Server Records
□ Agent for DB2 Records
□ Agent for Enterprise Applications Records
Working with Records 2-1Hitachi Tuning Manager Application Reports Reference

Data Model VersionThe definitions of an Agent's records and fields are collectively called a datamodel. Each Agent and its data model have a specific version number, aslisted in the following table.
The data model version of each Agent can be viewed from Agent properties inthe Agents window of Performance Reporter.
Table 2-1 Version Numbers for Each Agent and Its Data Model
Agent Name Agent Version Data Model Version
Agent for Oracle 8.1.2 9.0
Agent for Microsoft SQL Server 8.1.0 6.0
Agent for Microsoft ExchangeServer
8.1.2 4.0
Agent for DB2 8.1.2 6.0
Agent for Enterprise Applications 8.1.2 5.0
For the data model versions that correspond to Agent versions earlier thanthe versions indicated in the above table, see the appendix in the TuningManager Agent Administration Guide.
For details about the data model, see the chapter in the Tuning ManagerAgent Administration Guide that provides an overview of the data handled bythe Tuning Manager series programs.
Format of Record ExplanationsThis chapter describes the records for the Agents in alphabetical order. Eachrecord explanation contains the items shown below. Explanations and itemsspecific to each Agent are provided under the Agent name.
Function
Provides an overview of the performance data that is stored in the record andincludes important notes.
Default and Changeable Values
Consists of a table that lists default values of the performance data collectionconditions that are defined for the record and that indicates whether the usercan change the values.
If No is indicated in the Changeable? column, do not change the defaultvalue. Such a record does not support operations when using non-defaultvalues.
The Default and Changeable Values table for each record consists of theitems below. For details about the following items, see the chapter that
2-2 Working with RecordsHitachi Tuning Manager Application Reports Reference

explains how to manage data by using a Store database in the TuningManager Agent Administration Guide:
• Collection Interval (see Note)Indicates the performance data collection interval (in seconds). Thedefault value is recommended. To change the value, specify one of thefollowing:
¢ 0¢ A value from 60 to 3,600 that is a multiple of 60 and is also a whole
divisor of 3,600¢ A value from 3,600 to 86,400 that is a multiple of 3,600 and is also a
whole divisor of 86,400If a value other than those described above is specified, performance datamight not be stored properly. If 0 is specified, performance data will notbe collected.
• Collection Offset (see Note )Indicates the offset value (in seconds) used to shift the start time forcollecting performance data for each record. If a number of recordscollect data at the same time, the load on the hardware and programs tobe monitored might greatly increase. This offset value can be used todisperse the load caused by the collection. To change this value, specify avalue from 0 to 32,767 (in seconds, and within the range specified forCollection Interval), considering the load caused by the collectionprocessing.
• Log (see Note )Indicates whether to collect performance data to be stored in the Storedatabase. Specify one of the following values:
¢ Yes: Collect (however, if Collection Interval is set to 0, performancedata is not collected)
¢ No: Do not collect• LOGIF (see Note )
Indicates conditions for storing collected performance data in the Storedatabase.
Note: On the Tuning Manager server, to display the performance datacollected by an Agent, you must specify a value that satisfies both of thefollowing conditions for each item:
• Specification conditions required for the Agent (which are explained here)• Specification conditions required for the Tuning Manager serverFor details about the specification conditions required for the Tuning Managerserver, see the chapter that describes preparing for polling in the TuningManager Server Administration Guide.
Key Fields
Indicates fields that work as keys to identify an instance of a multi-instancerecord, in View-name (Manager-name) format. There are two types of key
Working with Records 2-3Hitachi Tuning Manager Application Reports Reference

fields: those common to all records, and those unique to a record. Key fieldsindicates the key fields unique to a record. For details about key fieldscommon to all records, see List of Common Key Fields on page 2-5.
Lifetime
Indicates the period during which consistency is guaranteed for theperformance data that is collected in the record. For details about thelifetime, see the chapter that provides an overview of the data handled by theTuning Manager series programs in the Tuning Manager Agent AdministrationGuide.
Record Size
Indicates the amount of performance data that can be collected and stored ina record at one time. In a multi-instance record, values are given for both thefixed part and variable part. For other kinds of records, the value for thevariable part is always 0. Estimate the Store database size by using thesevalues. For details about how to calculate this size, see the Tuning ManagerAgent Administration Guide.
Fields
Provides a table that describes the fields of each record. The table containsthe following items:
• View Name (Manager Name):
¢ View Name:Indicates the field name displayed by Performance Reporter.
¢ Manager Name:Indicates the field name used in the programs of the Tuning Managerseries.
• Description:Explanation of the value stored in the field. For Agent for DB2, see theDB2 documentation for details.
• Sum Rule:Indicates the method (summarization rules) to be used by Agent Storewhen summarizing data. For details about summarization rules, seeSummarization Rules on page 2-6.
• Format:Data type of the field value, such as double. For details about data types,see List of Data Types on page 2-9.
• Delta:If this item is Yes, you can switch the display of the real-time report froma differential value to a cumulative value. If this item is No, you cannotswitch the value. For details about delta, see Delta on page 2-10.
• Supported Version (in Agent for Oracle and Agent for DB2):
2-4 Working with RecordsHitachi Tuning Manager Application Reports Reference
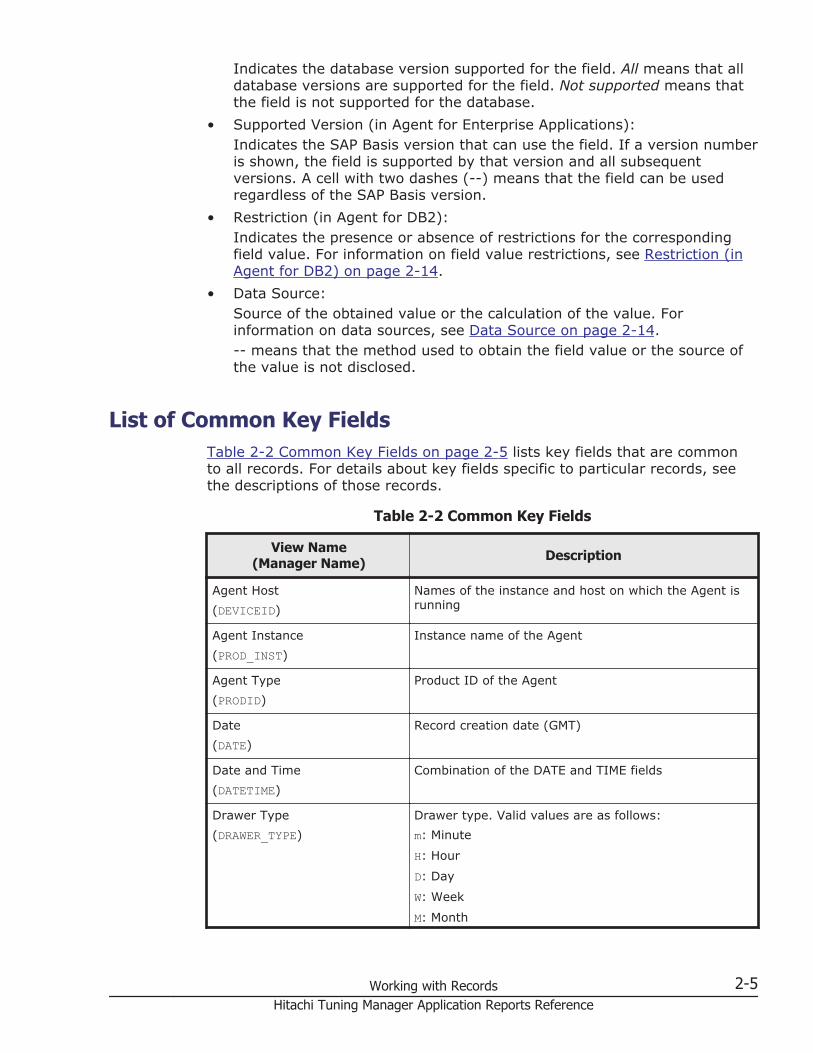
Indicates the database version supported for the field. All means that alldatabase versions are supported for the field. Not supported means thatthe field is not supported for the database.
• Supported Version (in Agent for Enterprise Applications):Indicates the SAP Basis version that can use the field. If a version numberis shown, the field is supported by that version and all subsequentversions. A cell with two dashes (--) means that the field can be usedregardless of the SAP Basis version.
• Restriction (in Agent for DB2):Indicates the presence or absence of restrictions for the correspondingfield value. For information on field value restrictions, see Restriction (inAgent for DB2) on page 2-14.
• Data Source:Source of the obtained value or the calculation of the value. Forinformation on data sources, see Data Source on page 2-14.-- means that the method used to obtain the field value or the source ofthe value is not disclosed.
List of Common Key FieldsTable 2-2 Common Key Fields on page 2-5 lists key fields that are commonto all records. For details about key fields specific to particular records, seethe descriptions of those records.
Table 2-2 Common Key Fields
View Name(Manager Name) Description
Agent Host(DEVICEID)
Names of the instance and host on which the Agent isrunning
Agent Instance(PROD_INST)
Instance name of the Agent
Agent Type(PRODID)
Product ID of the Agent
Date(DATE)
Record creation date (GMT)
Date and Time(DATETIME)
Combination of the DATE and TIME fields
Drawer Type(DRAWER_TYPE)
Drawer type. Valid values are as follows:m: Minute
H: Hour
D: Day
W: Week
M: Month
Working with Records 2-5Hitachi Tuning Manager Application Reports Reference
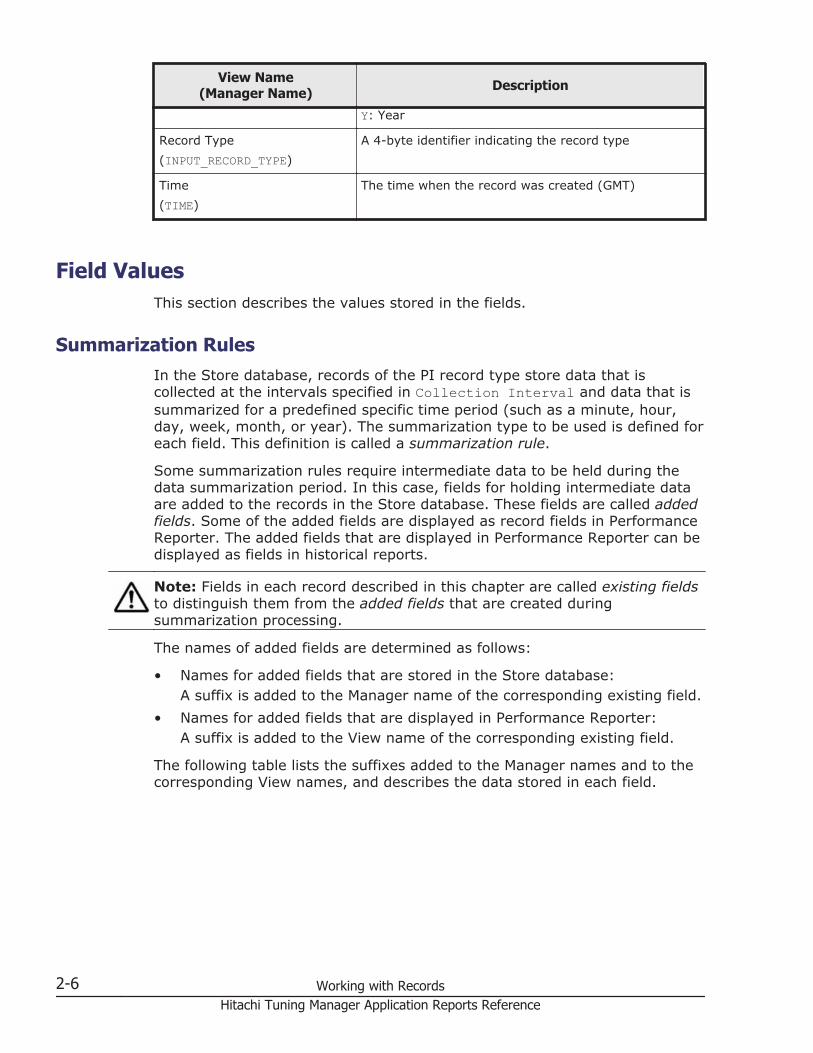
View Name(Manager Name) Description
Y: Year
Record Type(INPUT_RECORD_TYPE)
A 4-byte identifier indicating the record type
Time(TIME)
The time when the record was created (GMT)
Field ValuesThis section describes the values stored in the fields.
Summarization RulesIn the Store database, records of the PI record type store data that iscollected at the intervals specified in Collection Interval and data that issummarized for a predefined specific time period (such as a minute, hour,day, week, month, or year). The summarization type to be used is defined foreach field. This definition is called a summarization rule.
Some summarization rules require intermediate data to be held during thedata summarization period. In this case, fields for holding intermediate dataare added to the records in the Store database. These fields are called addedfields. Some of the added fields are displayed as record fields in PerformanceReporter. The added fields that are displayed in Performance Reporter can bedisplayed as fields in historical reports.
Note: Fields in each record described in this chapter are called existing fieldsto distinguish them from the added fields that are created duringsummarization processing.
The names of added fields are determined as follows:
• Names for added fields that are stored in the Store database:A suffix is added to the Manager name of the corresponding existing field.
• Names for added fields that are displayed in Performance Reporter:A suffix is added to the View name of the corresponding existing field.
The following table lists the suffixes added to the Manager names and to thecorresponding View names, and describes the data stored in each field.
2-6 Working with RecordsHitachi Tuning Manager Application Reports Reference

Table 2-3 Suffixes for Added Fields
SuffixAdded to
theManager
Name
Suffix Addedto the View
NameStored Data
_TOTAL (Total) Sum of the values of the field in the records collectedwithin the summarization period
_TOTAL_SEC (Total) Sum of the values of the field in the records collectedwithin the summarization period (when the data type ofthe field is utime)
_COUNT -- Number of records collected during the summarizationperiod
_HI (Max) Maximum value of the field in the records collectedwithin the summarization period
_LO (Min) Minimum value of the field in the records collected withinthe summarization period
_OV (OV) The number of times that the sum of the values of thefield in the records collected within the summarizationperiod overflowed.The value is determined by using the following formula:(sum-of-the-field-values) / (maximum-value-for-the-existing-field + 1)Note: Numbers after the decimal point are discarded.
Legend:
--: No added field
Table 2-4 Summarization Rules on page 2-7 describes summarizationrules.
Table 2-4 Summarization Rules
Name ofSummarization
RuleDescription
COPY The value of the field in the latest record collected within thesummarization period is stored as is.
AVG The average of the field values collected within the summarizationperiod is stored in the Store database.The average value is determined by using the following formula:(sum-of-the-field-values) / (number-of-records-collected)Added fields (Store database):• _TOTAL• _TOTAL_SEC (when the data type of the field is utime)
• _COUNT
Working with Records 2-7Hitachi Tuning Manager Application Reports Reference

Name ofSummarization
RuleDescription
Added field (Performance Reporter) (See Note 1 and Note 2):• (TOTAL)
ADD The sum of the field values collected within the summarizationperiod is stored in the Store database.
ADDBI The lower bytes of the sum of the field values collected within thesummarization period are stored in the Store database. Themaximum value is extended to 256 times the maximum value inthe ADD rule.The value is determined by using the following formula:(sum-of-the-field-values) % (maximum-value-for-the-existing-field)In the above formula, % indicates that there is a remainder.Added field (Store database):• _OVAdded field (Performance Reporter) (see Note 1 and Note 2):• (OV)
HI The maximum of the field values collected within the summarizationperiod is stored in the Store database.
LO The minimum of the field values collected within the summarizationperiod is stored in the Store database.
HILO The maximum, minimum, and average values of the data obtainedwithin the summarization period are stored in the Store database.For the existing fields, the average value is stored in the Storedatabase.The average value is determined by using the following formula:(sum-of-the-field-values) / (number-of-records-collected)Added fields (Store database):• _HI• _LO• _TOTAL• _TOTAL_SEC (when the data type of the field is utime)
• _COUNTAdded fields (Performance Reporter) (See Note 1 and Note 2):• (Max)• (Min)• (Total)
% The average of the field values collected within the summarizationperiod is stored in the Store database.This rule is mainly applied to the percentage-type fields.The average value is determined by using the following formula:(sum-of-the-field-values) / (number-of-records-collected)Added fields (Store database):
2-8 Working with RecordsHitachi Tuning Manager Application Reports Reference

Name ofSummarization
RuleDescription
• _TOTAL• _COUNT
R The average of the field values collected within the summarizationperiod is stored in the Store database.This rule is mainly applied to fields that indicate amounts persecond.The average value is determined by using the following formula:(sum-of-the-field-values) / (number-of-records-collected)For real-time reports for which delta is specified, a specialcalculation method, dividing the difference by the interval, is used.Added fields (Store database):• _TOTAL• _TOTAL_SEC (when the data type of the field is utime)
• _COUNTAdded field (Performance Reporter) (See Note 1 and Note 2):• (TOTAL)
-- This indicates that no data is summarized.
Note: 1.For utime type fields whose Manager names contain the character string_AVG, the (Total) fields that are added in Performance Reporter cannot beused for historical reports.
Note: 2.For fields whose Manager names contain any of the following characterstrings, the (Total) fields that are added in Performance Reporter cannot beused for historical reports:_PER_, PCT, PERCENT, _AVG, _RATE_TOTAL
List of Data TypesTable 2-5 Data Types on page 2-9 lists the data types for field values andthe corresponding C and C++ data types. The values shown in the Formatcolumn of each field table are those shown below in the Field column underData Type.
Table 2-5 Data Types
Data TypeBytes Description
Field C or C++
char(n) char( ) Number inparentheses
Character data with a length of n bytes
double double 8 Numeric value (1.7E±308 (15 digits))
Working with Records 2-9Hitachi Tuning Manager Application Reports Reference
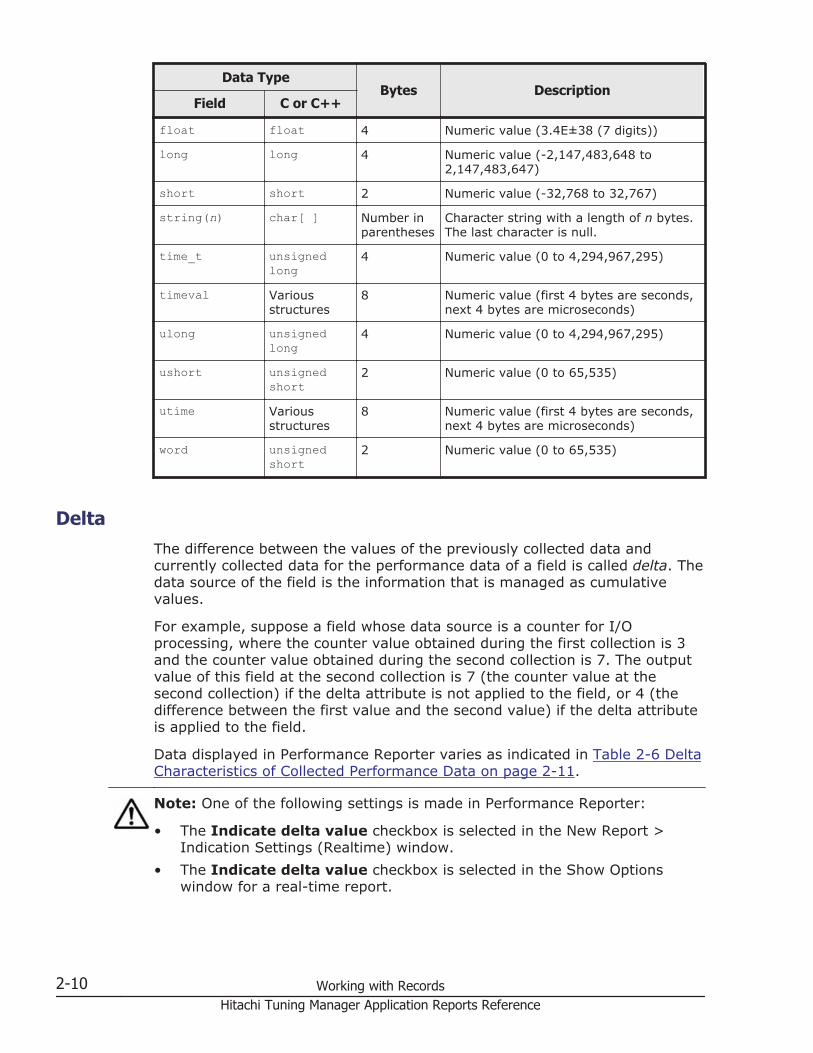
Data TypeBytes Description
Field C or C++
float float 4 Numeric value (3.4E±38 (7 digits))
long long 4 Numeric value (-2,147,483,648 to2,147,483,647)
short short 2 Numeric value (-32,768 to 32,767)
string(n) char[ ] Number inparentheses
Character string with a length of n bytes.The last character is null.
time_t unsignedlong
4 Numeric value (0 to 4,294,967,295)
timeval Variousstructures
8 Numeric value (first 4 bytes are seconds,next 4 bytes are microseconds)
ulong unsignedlong
4 Numeric value (0 to 4,294,967,295)
ushort unsignedshort
2 Numeric value (0 to 65,535)
utime Variousstructures
8 Numeric value (first 4 bytes are seconds,next 4 bytes are microseconds)
word unsignedshort
2 Numeric value (0 to 65,535)
DeltaThe difference between the values of the previously collected data andcurrently collected data for the performance data of a field is called delta. Thedata source of the field is the information that is managed as cumulativevalues.
For example, suppose a field whose data source is a counter for I/Oprocessing, where the counter value obtained during the first collection is 3and the counter value obtained during the second collection is 7. The outputvalue of this field at the second collection is 7 (the counter value at thesecond collection) if the delta attribute is not applied to the field, or 4 (thedifference between the first value and the second value) if the delta attributeis applied to the field.
Data displayed in Performance Reporter varies as indicated in Table 2-6 DeltaCharacteristics of Collected Performance Data on page 2-11.
Note: One of the following settings is made in Performance Reporter:
• The Indicate delta value checkbox is selected in the New Report >Indication Settings (Realtime) window.
• The Indicate delta value checkbox is selected in the Show Optionswindow for a real-time report.
2-10 Working with RecordsHitachi Tuning Manager Application Reports Reference

• TRUE is assigned to the indicate-delta-value attribute of realtime-indication-settings, in the parameter file passed as an argument tothe jpcrdef create command.
Table 2-6 Delta Characteristics of Collected Performance Data
Record Type Delta Report Type
Value of Deltais Set to beDisplayed(see Note)
Record Value
PI record type Yes Real-timereport
Yes The amount changed
No For Agent for Oracle, theamount of change isdisplayed.For Agent for MicrosoftSQL Server, Agent forMicrosoft ExchangeServer, or Agent for DB2,the value at the time ofcollection is displayed.For Agent for EnterpriseApplications, thecumulative value isdisplayed.
• Historicalreport
• Monitoringdata foralarms
Not applicable The amount changed
No Real-timereport
Yes The value at the time ofcollection
No
• Historicalreport
• Monitoringdata foralarms
Not applicable
PD record type Yes Real-timereport
Yes For Agent for Oracle,Agent for Microsoft SQLServer, and Agent forEnterprise Applications,the amount of change isdisplayed.For Agent for MicrosoftExchange Server orAgent for DB2, the valueat the time of collectionis displayed.
No For Agent for Oracle,Agent for Microsoft SQLServer, and Agent forEnterprise Applications,
Working with Records 2-11Hitachi Tuning Manager Application Reports Reference

Record Type Delta Report Type
Value of Deltais Set to beDisplayed(see Note)
Record Value
the cumulative value isdisplayed.For Agent for MicrosoftExchange Server orAgent for DB2, the valueat the time of collectionis displayed.
• Historicalreport
• Monitoringdata foralarms
Not applicable For Agent for Oracle,Agent for Microsoft SQLServer, and Agent forEnterprise Applications,the cumulative value isdisplayed.For Agent for MicrosoftExchange Server orAgent for DB2, the valueat the time of collectionis displayed.
No Real-timereport
Yes The value at the time ofcollection
No
• Historicalreport
• Monitoringdata foralarms
Not applicable
Please review the following points about the collection of performance data:
Agent for Oracle:
In the following cases, performance data values might become negative:
• If the monitored Oracle database is restarted while Agent for Oracle isrunning
• If resources are re-allocated for the monitored Oracle database whileAgent for Oracle is running
After the second data collection, the performance data values become zero(0) or larger because the differences between currently collected values andpreviously collected values are displayed.
Agent for Oracle and Agent for DB2:
• Performance data is not collected at the time you set Collection Intervalby using Performance Reporter.
• Because historical data of the PI record type includes data (such as deltavalues) that requires differences from data obtained during the previous
2-12 Working with RecordsHitachi Tuning Manager Application Reports Reference
collection, data from two or more collections is required. This means thatthe time required to store historical data in a Store database (from thetime the Agent service started or the time that Collection Interval is setby using Performance Reporter) is, at a maximum, twice the time that isset for Collection Interval.For example, if you start an Agent whose performance data collectioninterval is set to 300 seconds (5 minutes) at 6:32 PM, the first datacollection will start at 6:35 PM. However, the record to be stored in theStore database is not created at this time because the data required forcalculating the difference does not exist. At the next data collection(which starts at 6:40 PM), historical data will be created based on thedata collected at 6:35 PM and 6:40 PM, and then stored in the Storedatabase.
• Starting with the first collection, a real-time report displays data values.Note, however, that 0 is displayed as the first collected value in reportsrequiring previously collected data. The values displayed from the secondand subsequent data collections vary depending on the report.
• In the following cases, the value of the collected data is displayed at thetime of the second and subsequent data collections:
¢ In a real-time report of the PI record type, when no delta value is setto be displayed
¢ In a real-time report of the PD record type, when a delta value is setto be displayed
• In the case shown below, the difference between the data obtained at thefirst and second collections is displayed at the time of the secondcollection. For the third collection and all subsequent data collections, thevalue of the collected data is displayed.
¢ In a real-time report of the PI record type, when a delta value is setto be displayed
Agent for Microsoft SQL Server:
In the following cases, a real-time report displays data values obtained at thefirst collection:
• In a real-time report of the PI record type, when no delta value is set tobe displayed
• In a real-time report of the PD record type, when a delta value is set tobe displayedNote, however, that 0 is displayed as the first collected value in reportsrequiring previously collected data. For the second collection and allsubsequent data collections, a real-time report displays the differencesbetween the values of the previously collected data and those of thecurrently collected data.
Agent for Enterprise Applications:
If you select the Indicate delta value option for a real-time report, thevalue that is displayed is since the time the first data was collected. If the
Working with Records 2-13Hitachi Tuning Manager Application Reports Reference

report requires previous data, the initial value is 0. The value of the collecteddata is displayed after the second data collection.
Restriction (in Agent for DB2)Each field contains a value obtained from DB2 for the monitoring target, or avalue based on other such values and calculated according to a givenformula. The presence or absence of restrictions for the field value isindicated in the Restriction column.
• When two hyphens (--) are shownNo restrictions exist on the value of each field.
• When Y is shownDepending on the monitoring target, the data values obtained from DB2might exceed 32 bits. If the obtained data exceeds 32 bits, the maximum32-bit value is stored in the field. Also, the values of some fields arecalculated based on the value of this field, so values stored in those fieldsmight differ from the actual values. In this case, the following message isoutput to the common message log: KAVF29019-W An overflow errorhas occurred.
Data SourceEach field contains a value obtained from a Tuning Manager product orprogram being monitored or a value derived from applying a formula. In thetables, the Data Source column indicates the source of the value or theformula used to produce the value.
The character string in the Data Source column for Agent for EnterpriseApplications indicates the transaction code of the SAP system. It means thatthe value indicated by the corresponding transaction code is to be obtained.If the value cannot be identified by the transaction code alone, themonitoring tree element (MTE) name is also provided (for example, SAP-system-ID\SAP-instance-name\Background\Utilisation). For details aboutthe MTE name, see the documentation for your SAP system.
Whenever a field value is set by using processed performance data acquiredfrom a monitoring target, the calculation method used to get that field valueis displayed as a string in the Data Source column of Agent for Oracle, Agentfor Microsoft SQL Server, Agent for Microsoft Exchange Server, and Agent forDB2. The following sections provide examples for each Agent.
Agent for Oracle
• When upper-case characters are shown:Upper-case characters indicate name of a table in an Oracle databasewhen such a database is accessed using the Oracle OCI (Oracle CallInterface). For example, the Cursor Open Hits (CURSOR_OPEN_HITS) fieldof the Activity Summary (PD_PDAS) record stores a value that is collectedusing OCI of Oracle. For details about tables, see the Oracledocumentation.
2-14 Working with RecordsHitachi Tuning Manager Application Reports Reference

• When lower-case characters are shown:Lower-case characters indicate a key character string used to acquire theperformance data that is stored in an Oracle database table.For example, the Calls/Tran (CALLS_PER_TRANSACTION) field of theSystem Stat Summary (PD) record stores the value that is obtained bydividing the value obtained from user calls in the Name column of the V$SYSSTAT table by the value obtained from user commits in the Namecolumn of the V$SYSSTAT table.
• When Agent Collector is shown:Agent Collector means that the value stored in the field was obtainedfrom the Agent Collector service.
• When init.ora parameter name is shown:init.ora parameter name means that the value of the parameter namethat is set in the init.ora Oracle initialization parameter file is beingused.
Agent for Microsoft SQL Server
• When upper-case characters are shown:If the character string starts with DBCC, the character string indicates aDBCC statement of Microsoft SQL Server. If the character string startswith other characters, the character string indicates the Manager name ofa field in the same record.
• When characters other than a formula are shown:The character string indicates the system table name of Microsoft SQLServer, or the Transact-SQL command batch used to acquire data.
Agent for Microsoft Exchange Server
• When all upper-case characters are shown (e.g., RECORD_TIME):Upper-case characters indicate a key character string used to acquire theperformance data stored in Microsoft Exchange Server.
• When lower-case characters are shown (except for the first character of aword, which might be upper-case: e.g., Page File Bytes):Lower-case characters indicate the name of the Windows® performancecounter for which performance data was collected.
Agent for DB2
• When upper-case characters are shown:Upper-case characters indicate a key character string used to acquire theperformance data that is stored in the DB2.
• When Agent Collector is shown:Agent Collector means that the value stored in the field was obtainedfrom the Agent Collector service.
Working with Records 2-15Hitachi Tuning Manager Application Reports Reference

Fields Added When Data Is Stored in a Store DatabasePerformance data that was collected by an Agent is stored in its Storedatabase. This section describes the fields that are added to every record andthe fields that are output when data in the Store database is exported. Fordetails about the fields that are added to the Store database according tosummarization rules, see Summarization Rules on page 2-6.
Fields Added for All RecordsThe following table lists the fields that are added when data is stored in aStore database. These fields are supported for all monitored targets of eachAgent.
Table 2-7 Fields that Are Added When Data Is Stored in a Store Database
View Name(Manager
Name)Description Format Delta
Agent Host(DEVICEID)
Names of the instance and host onwhich the Agent is running. Theformat is as follows:instance-name[host-name]
string(256) No
Agent Instance(PROD_INST)
Instance name of the Agent string(256) No
Agent Type(PRODID)
Product ID of the Agent (1-byteidentifier)
char No
Date(DATE)
Record creation date (GMT)See Note 1 and Note 2
char(3) No
Date and Time(DATETIME)
Combination of the Date (DATE) andTime (TIME) fields
See Note 1
char(6) No
Drawer Type(DRAWER_TYPE)
For a record of the PI record type,the data summarization type
char No
GMT Offset(GMT_ADJUST)
Difference (in seconds) betweenGMT and the local time
long No
Time(TIME)
Record creation time (GMT)See Note 1 and Note 2
char(3) No
Note: 1.When performance data is displayed in the Performance Reporter reports, theDate field is displayed in YYYYMMDD format, the Date and Time field isdisplayed in YYYYMMDD hh:mm:ss format, and the Time field is displayed inhh:mm:ss format.
2-16 Working with RecordsHitachi Tuning Manager Application Reports Reference
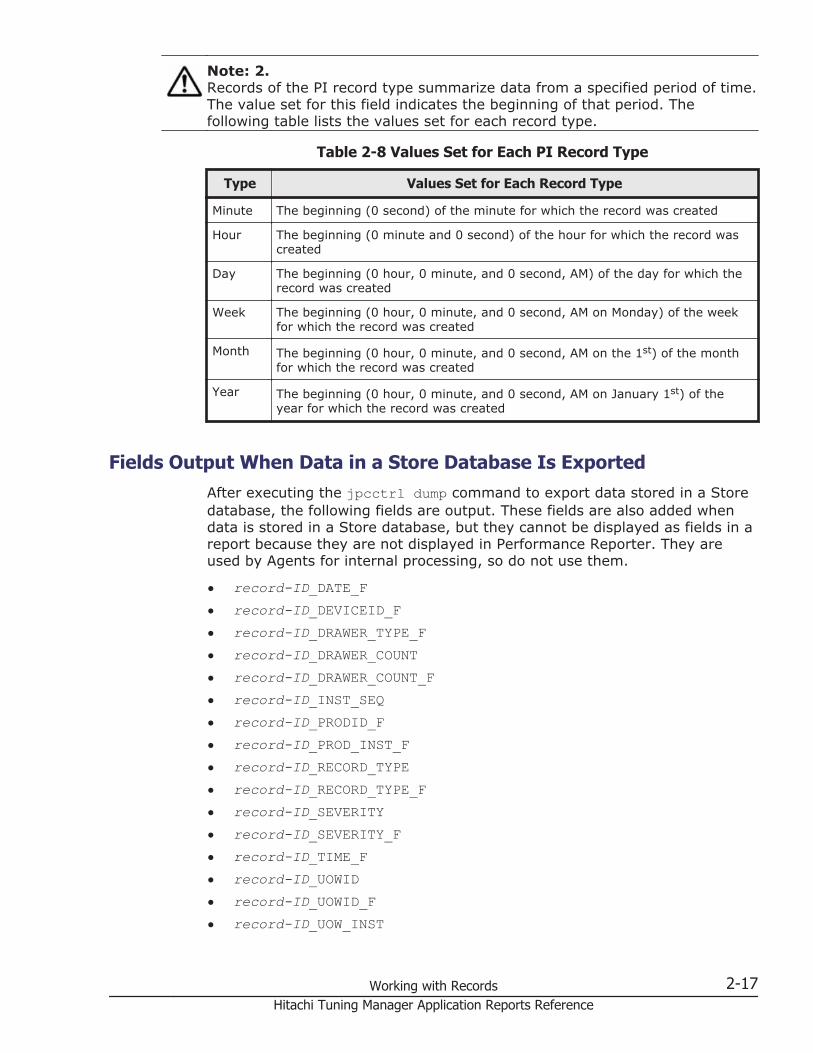
Note: 2.Records of the PI record type summarize data from a specified period of time.The value set for this field indicates the beginning of that period. Thefollowing table lists the values set for each record type.
Table 2-8 Values Set for Each PI Record Type
Type Values Set for Each Record Type
Minute The beginning (0 second) of the minute for which the record was created
Hour The beginning (0 minute and 0 second) of the hour for which the record wascreated
Day The beginning (0 hour, 0 minute, and 0 second, AM) of the day for which therecord was created
Week The beginning (0 hour, 0 minute, and 0 second, AM on Monday) of the weekfor which the record was created
Month The beginning (0 hour, 0 minute, and 0 second, AM on the 1st) of the monthfor which the record was created
Year The beginning (0 hour, 0 minute, and 0 second, AM on January 1st) of theyear for which the record was created
Fields Output When Data in a Store Database Is ExportedAfter executing the jpcctrl dump command to export data stored in a Storedatabase, the following fields are output. These fields are also added whendata is stored in a Store database, but they cannot be displayed as fields in areport because they are not displayed in Performance Reporter. They areused by Agents for internal processing, so do not use them.
• record-ID_DATE_F• record-ID_DEVICEID_F• record-ID_DRAWER_TYPE_F• record-ID_DRAWER_COUNT• record-ID_DRAWER_COUNT_F• record-ID_INST_SEQ• record-ID_PRODID_F• record-ID_PROD_INST_F• record-ID_RECORD_TYPE• record-ID_RECORD_TYPE_F• record-ID_SEVERITY• record-ID_SEVERITY_F• record-ID_TIME_F• record-ID_UOWID• record-ID_UOWID_F• record-ID_UOW_INST
Working with Records 2-17Hitachi Tuning Manager Application Reports Reference

• record-ID_UOW_INST_F• record-ID_Manager-name_SEC• record-ID_Manager-name_MSEC
Notes on Collecting Records
Agent for Oracle
When Oracle 10g® Is Monitored
When Oracle 10g is monitored, the value of the Addr field in the Latch(PD_PDLA) and Latch Interval (PI_PILA) records becomes invalid.
When Monitoring Databases that Have Many Data Segments
When a monitored database has many data segments, the Tuning Managerserver might be unable to display data in the database. In such a case,enable the collection field switching option.
Enabling this option changes the SQL statements when collecting the data ofthe following records and avoids this problem:
• Tablespace (PD_PDTS)• Database Interval (PI_PIDB)
The following table lists the environment variables used to enable this option.
Table 2-9 Environment Variables for Enabling the Collection FieldSwitching Option
Environment VariableName
Valuethat CanBe Set
Description Default
HTM_ORASET_SQL_OPTION ON or OFF ON: Enables the option.
OFF: Disables the option.
OFF
HTM_ORASET_NUMERIC_10 0 to 99999 This variable specifies the value tobe set in the fields for which datais not collected whenHTM_ORASET_SQL_OPTION is ON.
0
Note: When ON is specified for HTM_ORASET_SQL_OPTION, data for the fieldsshown below is not collected, and the value specified forHTM_ORASET_NUMERIC_10 is set for these fields.
You can also specify the collection field switching option by using sql_optionor numeric_10 of the Agent for Oracle instance information.
If you specify the HTM_ORASET_SQL_OPTION or HTM_ORASET_NUMERIC_10environment variable, the specification for sql_option or numeric_10 of the
2-18 Working with RecordsHitachi Tuning Manager Application Reports Reference

Agent for Oracle instance information will be invalid. For details about Agentfor Oracle instance information, see the chapter that describes setup in theTuning Manager Installation Guide.
Table 2-10 Fields for which the Value Specified inHTM_ORASET_NUMERIC_10 Will Be Set
Record Name (Record ID) Field Name
Tablespace (PD_PDTS) Segments
Extents
Database Interval (PI_PIDB) Blocks
DB Files %
Datafiles
Extents
Free %
Free Change
Free Extents
Free Mbytes
High Max Extent
I/O Ops/sec
Links
Links In Tran
Links Logged On
Links Open Cursors
Log Files %
Mbytes
Next Alloc Fails
Overextended
Reads/sec
Redo Files
Rollback Segments
Rollback Segments Hit %
Rollback Segments Trans
Segments
Sort Segments
Sorting Users
Tablespaces
Used Change
Working with Records 2-19Hitachi Tuning Manager Application Reports Reference

Record Name (Record ID) Field Name
Used Mbytes
Write %
Database Interval (PI_PIDB) Writes/sec
Note: If you specify a value that exceeds the maximum value of the datatype for the fields to be set (32767 for the short data type, or 65535 for theushort data type), the maximum value of the data type will be set. If thedata type of the fields in each record is float or double, the data willbecome a floating point number, and might be rounded and displayeddepending on the specified value.
Example: If you specify 32767 for numeric_10, 32760 might be displayed.
When ON is specified for HTM_ORASET_SQL_OPTION, the following fields of theDatabase Interval (PI_PIDB) record are always 0 because the value of thefields is the difference from the previously collected value:
• Physical Blocks Read• Physical Blocks Written• Physical Reads• Physical Writes
To enable the collection field switching option:
1. Specify ON for the environment variable HTM_ORASET_SQL_OPTION.2. If you do not want 0 to be specified as the default value for fields for
which data is not collected (see Table 2-10 Fields for which the ValueSpecified in HTM_ORASET_NUMERIC_10 Will Be Set on page 2-19),specify the desired value for the environment variableHTM_ORASET_NUMERIC_10.
3. Using the prompt from which you specified the environment variable,start the Agent for Oracle services.If you start the services from a different prompt, the environmentvariable does not take effect.
Notes on Specific Records
If you attempt to acquire the following records, you have to be carefulbecause the CPU usage rate and the CPU I/O Wait value for the Oracledatabase might become high:
• Cache Summary (PD_PDCS)• Cache Summary Interval (PI_PICS)• Shared Cursor Cache (PD_PDC)• SQL Text - Performance Based (PD_PDES)
2-20 Working with RecordsHitachi Tuning Manager Application Reports Reference
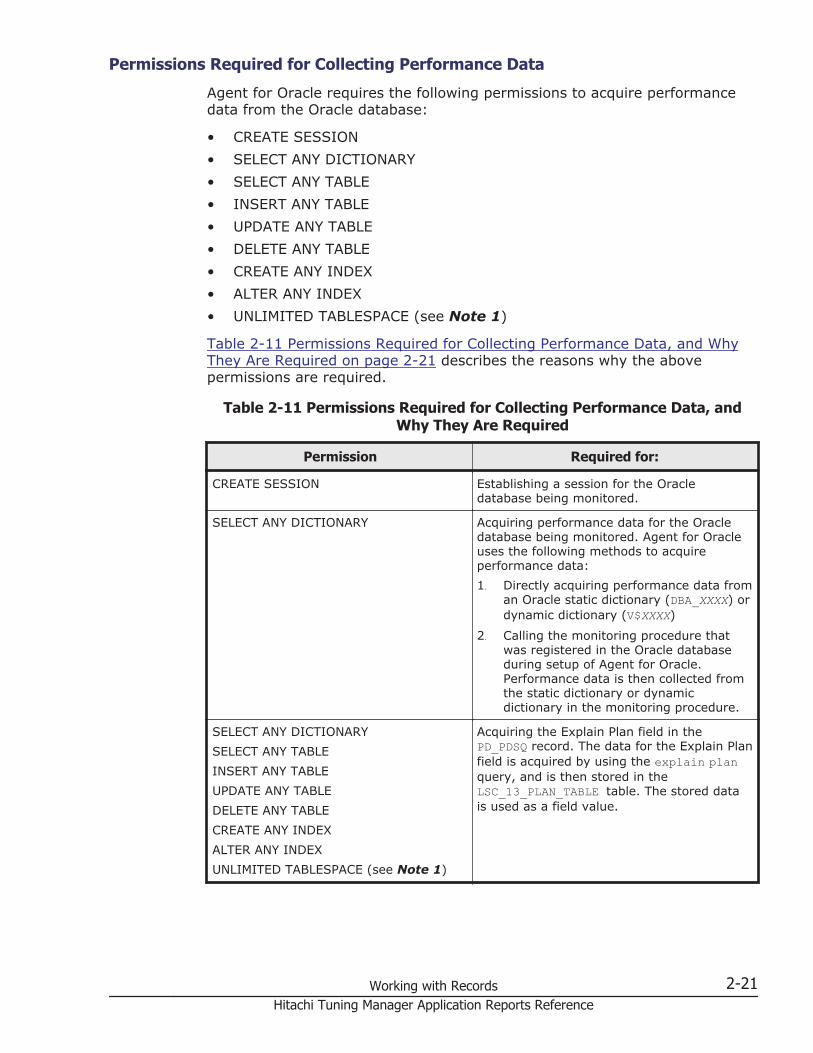
Permissions Required for Collecting Performance Data
Agent for Oracle requires the following permissions to acquire performancedata from the Oracle database:
• CREATE SESSION• SELECT ANY DICTIONARY• SELECT ANY TABLE• INSERT ANY TABLE• UPDATE ANY TABLE• DELETE ANY TABLE• CREATE ANY INDEX• ALTER ANY INDEX• UNLIMITED TABLESPACE (see Note 1)
Table 2-11 Permissions Required for Collecting Performance Data, and WhyThey Are Required on page 2-21 describes the reasons why the abovepermissions are required.
Table 2-11 Permissions Required for Collecting Performance Data, andWhy They Are Required
Permission Required for:
CREATE SESSION Establishing a session for the Oracledatabase being monitored.
SELECT ANY DICTIONARY Acquiring performance data for the Oracledatabase being monitored. Agent for Oracleuses the following methods to acquireperformance data:1. Directly acquiring performance data from
an Oracle static dictionary (DBA_XXXX) ordynamic dictionary (V$XXXX)
2. Calling the monitoring procedure thatwas registered in the Oracle databaseduring setup of Agent for Oracle.Performance data is then collected fromthe static dictionary or dynamicdictionary in the monitoring procedure.
SELECT ANY DICTIONARYSELECT ANY TABLEINSERT ANY TABLEUPDATE ANY TABLEDELETE ANY TABLECREATE ANY INDEXALTER ANY INDEXUNLIMITED TABLESPACE (see Note 1)
Acquiring the Explain Plan field in thePD_PDSQ record. The data for the Explain Planfield is acquired by using the explain planquery, and is then stored in theLSC_13_PLAN_TABLE table. The stored datais used as a field value.
Working with Records 2-21Hitachi Tuning Manager Application Reports Reference
Minimizing the permissions granted to a user account whenperformance data is collected
• When Agent for Oracle acquires the SQL Text (PD_PDSQ) record (see Note2), the user account requires nine permissions. However, if the PD_PDSQrecord is not acquired, the user account only requires two permissions.Permissions required for collecting the PD_PDSQ record:
¢ CREATE SESSION¢ SELECT ANY DICTIONARY¢ SELECT ANY TABLE¢ INSERT ANY TABLE¢ UPDATE ANY TABLE¢ DELETE ANY TABLE¢ CREATE ANY INDEX¢ ALTER ANY INDEX¢ UNLIMITED TABLESPACE(see Note 1)Permissions required for collecting other records:
¢ CREATE SESSION¢ SELECT ANY DICTIONARYYou can minimize the permissions granted to user accounts by setting upoperation such that the PD_PDSQ record is not acquired.
• If you use mk_user.sql to create a user account, that account is grantedthe following eight permissions and an unlimited allocation in the defaulttablespace:
¢ CREATE SESSION¢ SELECT ANY DICTIONARY¢ SELECT ANY TABLE¢ INSERT ANY TABLE¢ UPDATE ANY TABLE¢ DELETE ANY TABLE¢ CREATE ANY INDEX¢ ALTER ANY INDEXYou can limit the permissions granted to the user account to the minimumnecessary by using either of the following methods:- Create a user account that has only the necessary permissions, withoutusing mk_user.sql.- Delete or change unnecessary permissions from the user account thatwas created by using mk_user.sql.
Note: 1.This permission is not required if a limit is set for a write allocation in thedefault tablespace of the user account to be used for monitoring.
2-22 Working with RecordsHitachi Tuning Manager Application Reports Reference
Note: 2.By default, the PD_PDSQ record is not acquired.
Record Creation Result When Data Cannot Be Obtained
The following describes the record creation result in cases where the data tobe stored in a field cannot be obtained.
Records are not created when Agent for Oracle cannot:
• Acquire the performance data to be stored in a field defined as a key field.• Acquire the performance data to be stored in a field that indicates the
Oracle performance value.• Create a record within the interval of time specified for Collection Interval.
Agent for Microsoft SQL Server
When Records Are Not Created
If a database that is 2 TB or more exists in a monitored Microsoft SQL Server,the following records are not created:
• Database Detail (PD_DD)• Database Interval (PI_DI)• Database Replication Detail (PD_RD)• Database Space Detail (PD_DS)• Replication Published Database Overview (PI_RPDB)• Replication Summary Detail (PD_RS)• Server Space Detail (PD_SS)• Server Space Interval (PI_SI)
To avoid this problem, register the stored procedureA4QHITACHIPROCSPDATABASES in the target Microsoft SQL Server. For detailsabout how to register or delete this stored procedure, see the chapter thatdescribes the setup of Agent for Microsoft SQL Server in the Tuning ManagerInstallation Guide.
When the Correct Value Is Not Displayed in the Field
With Microsoft SQL Server, the database usage is not updated when there arenot enough transactions. If minor transactions result in a significant changein the database usage, the correct values might not be obtained for therecord fields listed below. If this has occurred, execute the DBCCUPDATEUSAGE command on the database to display the correct values. Fordetails about this command and how to execute it, see the Microsoft SQLServer manual.
Working with Records 2-23Hitachi Tuning Manager Application Reports Reference

Table 2-12 Records for which Correct Values Might Not Be Displayed in theField
Record Name (Record ID) View Name (Manager Name)
Database Interval (PI_DI) Data Growth % (DATA_GROWTH)
Index Growth % (IDX_GROWTH)
Database Space Detail (PD_DS) Data Mbytes (DATA)
Free % (PERC_FREE)
Free Mbytes (FREE_SPACE)
Index Mbytes (IDX)
Rsvd Mbytes (RESERVED)
Unused % (PERC_USED)
Unused Mbytes (UNUSED)
Server Space Detail (PD_SS) Data Mbytes (DATA)
Free % (PERC_FREE)
Free Mbytes (FREE_SPACE)
Index Mbytes (IDX)
Rsvd Mbytes (RESERVED)
Unused % (PERC_USED)
Unused Mbytes (UNUSED)
Server Space Interval (PI_SI) Data Mbytes (DATA)
Free % (PERC_FREE)
Free Mbytes (FREE_SPACE)
Index Mbytes (IDX)
Rsvd Mbytes (RESERVED)
Unused % (PERC_USED)
Unused Mbytes (UNUSED)
Records that Cannot Be Created During Execution of a Failover in a MirroringConfiguration
The following records are not created during execution of a failover in amirroring configuration. Note: An error that occurs during creation of arecord will not be reported by an alarm.
Database Detail (PD_DD)
Database Interval (PI_DI)
Database Replication Detail (PD_RD)
2-24 Working with RecordsHitachi Tuning Manager Application Reports Reference
Database Space Detail (PD_DS)
Replication Published Database Overview (PI_RPDB)
Replication Summary Detail (PD_RS)
Server Space Detail (PD_SS)
Server Space Interval (PI_SI)
Server Detail (PD) (See Note)
Note: An error occurs if any of the records indicated by 1 to 8 is collected atthe same time as a history.
Because the above records hold information about a database, suchinformation cannot be created during a failover.
Record Creation Results When the Monitored Microsoft SQL Server Is Offline
If the monitored Microsoft SQL Server is Microsoft SQL Server 2000, orMicrosoft SQL Server 2005 SP has not been applied to the monitoredMicrosoft SQL Server, when any of the databases that make up the monitoredMicrosoft SQL Server are placed offline, Agent for Microsoft SQL Server willnot be able to acquire performance data that is to be stored in the fields ofthe records listed below. If you want to acquire performance data for thefollowing records, place the offline databases online.
• PD_DD record• PD_DS record• PD_RD record• PD_RS record• PD_SS record• PI_DI record• PI_RPDB record• PI_SI record
If the monitored Microsoft SQL Server is Microsoft SQL Server 2005 SP1 orlater, Agent for Microsoft SQL Server can acquire performance data only fromdatabases that are not offline.
Record Creation Results When a Session to the Monitored Microsoft SQL ServerHas Been Disconnected
If a session to the monitored Microsoft SQL Server has been disconnected,record creation might fail. In this case, at the next record creation, thesession is re-established, and then a record is created.
Notes on the Lock Detail (PD_LD) Record
If a lot of transactions or lock accesses occur in a monitored SQL Server, a lotof records might be created when the Lock Detail (PD_LD) record is collected.
Working with Records 2-25Hitachi Tuning Manager Application Reports Reference
This will cause a huge demand on the memory, and possibly overload thesystem. As such, please be careful when performing the following operations:
• Collecting historical dataDo not collect the Lock Detail (PD_LD) record
• Displaying a real-time reportDo not display a real-time report that uses the Lock Detail (PD_LD) recordas the data source
• Issuing an alarmDo not use an alarm that uses the Lock Detail (PD_LD) record as the datasource
Record Creation Results When Data Cannot Be Obtained
The following describes record creation results in cases where the data to bestored in a field cannot be obtained. If an error occurs during performancedata collection, or if a field that is not supported by the monitored system isincluded in the created record, the record creation results are as follows:
• Records are not created in the following cases:
¢ When Agent for Microsoft SQL Server cannot acquire the performancedata to be stored in a field defined as a key field
¢ When Agent for Microsoft SQL Server cannot acquire the performancedata to be stored in a field that indicates a Microsoft SQL Serverperformance value
¢ When Agent for Microsoft SQL Server cannot create a record withinthe time set for Collection Interval
¢ When a mirror database exists on the monitored Microsoft SQL Server(Agent for Microsoft SQL Server cannot acquire the performance datafrom a mirror database to create a record)
• Records are created containing blank fields when Agent for Microsoft SQLServer:
¢ Fails to acquire character-type data.¢ Acquires character-type data containing no characters.
• Records are created containing fields with the value -1 when Agent forMicrosoft SQL Server fails to collect numeric-type configuration data.
• Records are created containing fields with the value Unknown when Agentfor Microsoft SQL Server:
¢ Acquires performance data that is not defined in the data model for afield that is defined in the data model.
¢ Fails to acquire data for a field that is defined in the data model.
2-26 Working with RecordsHitachi Tuning Manager Application Reports Reference
Agent for Microsoft Exchange Server
Precaution Before Collecting Performance Information
To use Agent for Microsoft Exchange Server to collect performance data, youmust install Microsoft Exchange Server before starting the Agent Collectorservice. In addition, any service added during installation must have startednormally. If installation of Microsoft Exchange Server fails or if an addedservice has stopped, the field value cannot be acquired or 0 is displayed,among other possibilities.Moreover, when restarting the server or MicrosoftExchange Server, you must also make sure that the Microsoft ExchangeServer services have started normally before starting the Agent Collectorservice.
Application Event Log When a Record Is Not Created Successfully
If the event shown in Table 2-13 Application Event Log When a Record Is NotCollected Successfully on page 2-27 has been recorded in the applicationevent log, the record corresponding to the service indicated by service-nameis not created. This problem occurs when the service has not been installedcorrectly.
To create the record, re-install the service for which the problem occurred.Alternatively, contact the developer of the service to determine the actionyou should take, and then correct the environment so that the applicationevent log will not be recorded.
Table 2-13 Application Event Log When a Record Is Not CollectedSuccessfully
Event ID Source Event Log Contents
1008 Perflib The Open procedure for service-name (DLL DLL-file-name-for-the-service) has failed. Performance data for this service is notavailable.
Table 2-14 Agent for Microsoft Exchange Server Records and CorrespondingServices on page 2-27 lists the Agent for Microsoft Exchange Server recordsand the corresponding services.
Table 2-14 Agent for Microsoft Exchange Server Records andCorresponding Services
Record Name Record ID Corresponding Services
Database PI_DB ESE
Epoxy PI_EPOX ExIPC
Managed Store Information PI_MSI MSExchangeISMSExchangeRPC
MSExchangeIS PI MSExchangeIS
MSExchangeIS Mailbox PI_ISM
Working with Records 2-27Hitachi Tuning Manager Application Reports Reference

Record Name Record ID Corresponding Services
MSExchangeIS Public PI_ISP
Process PD PerfProc
Note on Multi-Instance Records
For multi-instance records whose instance name is _Total, the total of thevalues or average value for all instances is collected as the record value. Ifinstance information is changed during a collection interval, the values mightbe inconsistent.
Notes on Changes to a Mounted Microsoft Exchange Server Store
Agent for Microsoft Exchange Server collects performance data about themounted Microsoft Exchange Server store (mailbox store and public folderstore). However, if the store status changes as shown in Table 2-15 Changesto the Status of a Microsoft Exchange Server Store That Affect PerformanceData Collection on page 2-28, the value of the performance data collectedthe first time after the change is 0. From the second time and later though,performance data is collected for the store that was mounted whenperformance data was collected the first time.
Table 2-15 Changes to the Status of a Microsoft Exchange Server StoreThat Affect Performance Data Collection
Change in the Microsoft ExchangeServer Store Status
Records Whose Performance DataCollected the First Time After the
Change Is 0
A mounted mailbox store is dismounted.(See Note 1)
• Database (PI_DB)
• MSExchangeIS Mailbox (PI_ISM)
A mounted public folder store isdismounted. (See Note 1)
• Database (PI_DB)
• MSExchangeIS Public (PI_ISP)
Microsoft Exchange Server is running in aDAG configuration, and one of the mailboxstores is switched due to the switching overor failing over of a server on which multiplemailbox stores are mounted. (See Note 2)
• Database (PI_DB)
• MSExchangeIS Mailbox (PI_ISM)
Note: 1.If a store is mounted that is not the store that was dismounted, the value ofthe performance data collected the first time after the change is 0.
Note: 2.If a store is mounted that is not the store that was switched over, the valueof the performance data collected the first time after the change is 0.
2-28 Working with RecordsHitachi Tuning Manager Application Reports Reference
Action to Take When Performance Data Cannot Be Collected (Restoration ofPerformance Object)
Agent for Microsoft Exchange Server references Microsoft Exchange Serverperformance objects. If a performance object is disabled by Windows, Agentfor Microsoft Exchange Server is no longer able to collect performance data,at which time event ID 1017 or 1018 is logged in the Windows event log.
If performance data cannot be collected, use the following procedure torestore the performance objects:
1. Remove the cause of the error that occurred prior to the logging of eventID 1017 or 1018.
2. Use the procedure under Reenabling an Extension by Using Regedit.exe inthe following Microsoft Support article to restore performance objects:http://support.microsoft.com/kb/248993/
Note:
• A value other than 0 and 1 (2 or 4) might be set for DisablePerformance Counters in the registry. If a value other than 0 is setfor Disable Performance Counters, set it to 0.
3. Restart Agent for Microsoft Exchange Server.
If the problem persists, the performance counter library might have beencorrupted, or another problem might have occurred. If that is the case,perform the procedure in the following Microsoft Support article to correct theperformance counter library, and then perform steps 1 to 3 again:
http://support.microsoft.com/kb/300956/
Record Creation Result When Data Cannot Be Obtained
The following describes the record creation result in cases where the data tobe stored in a field cannot be obtained.
Records are not created when Agent for Microsoft Exchange Server cannot:
• Acquire the performance data to be stored in a field that is defined as akey field.
• Acquire the performance data to be stored in a field that indicates aMicrosoft Exchange Server performance value.
• Create a record within the interval of time specified for Collection Interval.
What to do if KAVL12007-W is output when monitoring Microsoft ExchangeServer 2013
When monitoring Microsoft Exchange Server 2013, if aMicrosoft.Exchange.Store.Worker process (one such process is started foreach mailbox database) stops, KAVL12007-W might be temporarily output.The target records are the Database (PI_DB) record and the Process (PD)record. If the message is output temporarily and not continuously, no actionis required. The messages that are output are as follows:
Working with Records 2-29Hitachi Tuning Manager Application Reports Reference
KAVL12007-W Data could not be collected for the record PI_DB.(function=PdhGetFormattedCounterValue, rc=0x800007D8)KAVL12007-W Data could not be collected for the record PD.(function=PdhGetFormattedCounterValue, rc=0xC0000BC6)
Agent for DB2
Record Creation Result When Data Cannot Be Obtained
The following describes the record creation result in cases where the data tobe stored in a field cannot be obtained.
Records are not created when Agent for DB2 cannot:
• Acquire the performance data to be stored in a field that indicates a DB2performance value.
• Create a record within the interval of time specified for Collection Interval.
Agent for Enterprise Applications
Record Creation Result When Data Cannot Be Acquired
The following describes the record creation result when data to be stored infields cannot be acquired.
• No record is created.No record is created in the following cases:
¢ Agent for Enterprise Applications cannot collect the performance datathat is to be stored in the field defined as the key field.
¢ Agent for Enterprise Applications cannot collect the performance datathat is to be stored in the field indicating Enterprise Applications'performance value.
• A record with null fields is created.A record with null fields is created in the following cases:
¢ Agent for Enterprise Applications failed the collection of character-typedata.
¢ Agent for Enterprise Applications collected null character-type data.• A record containing a field with the value -1 is created.
If Agent for Enterprise Applications fails the collection of numeric-typecomponent data, a record containing a field with the value -1 is created.
• A record containing a field with the value Unknown is created.A record containing a field with the value Unknown is created in thefollowing cases:
¢ Field has a definition area in the data model, but the data collected byAgent for Enterprise Applications is not included in that definitionarea.
2-30 Working with RecordsHitachi Tuning Manager Application Reports Reference
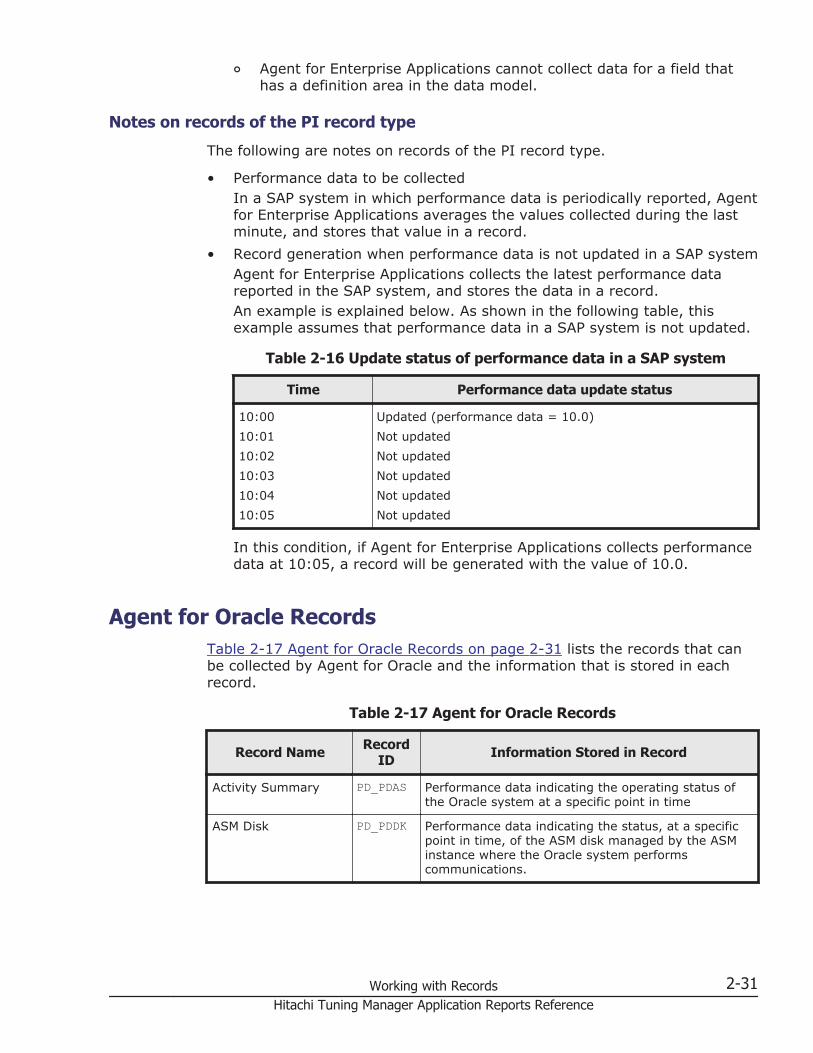
¢ Agent for Enterprise Applications cannot collect data for a field thathas a definition area in the data model.
Notes on records of the PI record type
The following are notes on records of the PI record type.
• Performance data to be collectedIn a SAP system in which performance data is periodically reported, Agentfor Enterprise Applications averages the values collected during the lastminute, and stores that value in a record.
• Record generation when performance data is not updated in a SAP systemAgent for Enterprise Applications collects the latest performance datareported in the SAP system, and stores the data in a record.An example is explained below. As shown in the following table, thisexample assumes that performance data in a SAP system is not updated.
Table 2-16 Update status of performance data in a SAP system
Time Performance data update status
10:0010:0110:0210:0310:0410:05
Updated (performance data = 10.0)Not updatedNot updatedNot updatedNot updatedNot updated
In this condition, if Agent for Enterprise Applications collects performancedata at 10:05, a record will be generated with the value of 10.0.
Agent for Oracle RecordsTable 2-17 Agent for Oracle Records on page 2-31 lists the records that canbe collected by Agent for Oracle and the information that is stored in eachrecord.
Table 2-17 Agent for Oracle Records
Record Name RecordID Information Stored in Record
Activity Summary PD_PDAS Performance data indicating the operating status ofthe Oracle system at a specific point in time
ASM Disk PD_PDDK Performance data indicating the status, at a specificpoint in time, of the ASM disk managed by the ASMinstance where the Oracle system performscommunications.
Working with Records 2-31Hitachi Tuning Manager Application Reports Reference
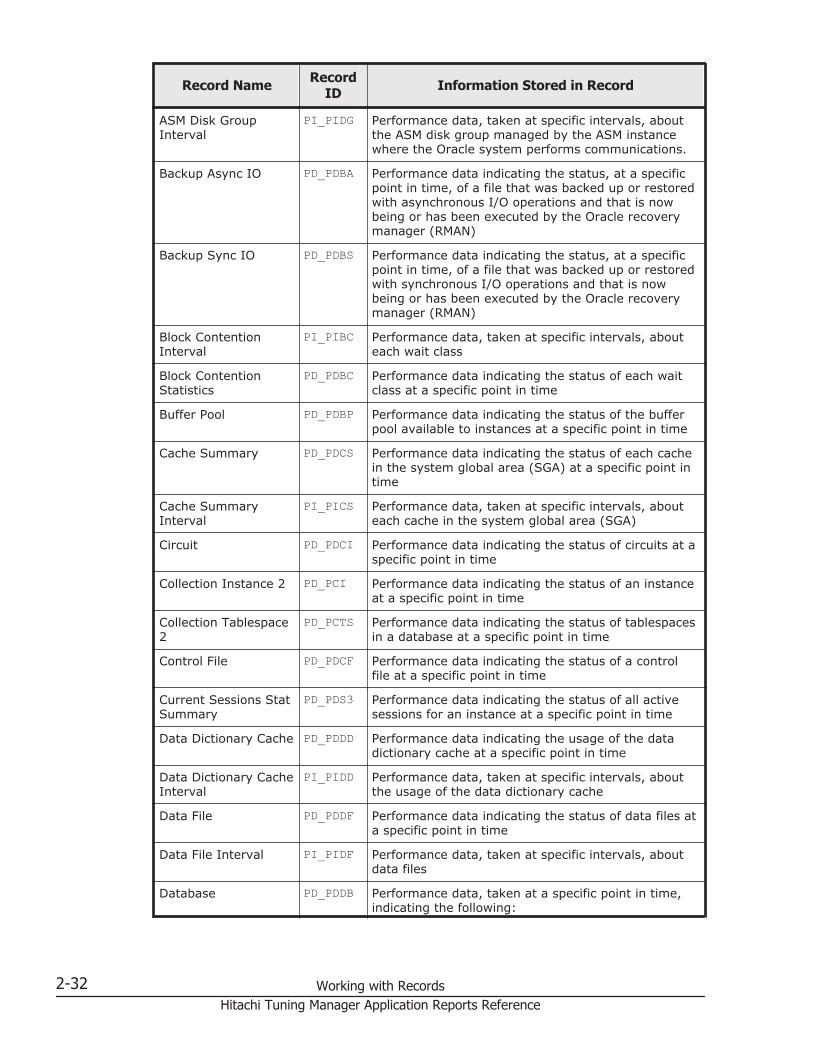
Record Name RecordID Information Stored in Record
ASM Disk GroupInterval
PI_PIDG Performance data, taken at specific intervals, aboutthe ASM disk group managed by the ASM instancewhere the Oracle system performs communications.
Backup Async IO PD_PDBA Performance data indicating the status, at a specificpoint in time, of a file that was backed up or restoredwith asynchronous I/O operations and that is nowbeing or has been executed by the Oracle recoverymanager (RMAN)
Backup Sync IO PD_PDBS Performance data indicating the status, at a specificpoint in time, of a file that was backed up or restoredwith synchronous I/O operations and that is nowbeing or has been executed by the Oracle recoverymanager (RMAN)
Block ContentionInterval
PI_PIBC Performance data, taken at specific intervals, abouteach wait class
Block ContentionStatistics
PD_PDBC Performance data indicating the status of each waitclass at a specific point in time
Buffer Pool PD_PDBP Performance data indicating the status of the bufferpool available to instances at a specific point in time
Cache Summary PD_PDCS Performance data indicating the status of each cachein the system global area (SGA) at a specific point intime
Cache SummaryInterval
PI_PICS Performance data, taken at specific intervals, abouteach cache in the system global area (SGA)
Circuit PD_PDCI Performance data indicating the status of circuits at aspecific point in time
Collection Instance 2 PD_PCI Performance data indicating the status of an instanceat a specific point in time
Collection Tablespace2
PD_PCTS Performance data indicating the status of tablespacesin a database at a specific point in time
Control File PD_PDCF Performance data indicating the status of a controlfile at a specific point in time
Current Sessions StatSummary
PD_PDS3 Performance data indicating the status of all activesessions for an instance at a specific point in time
Data Dictionary Cache PD_PDDD Performance data indicating the usage of the datadictionary cache at a specific point in time
Data Dictionary CacheInterval
PI_PIDD Performance data, taken at specific intervals, aboutthe usage of the data dictionary cache
Data File PD_PDDF Performance data indicating the status of data files ata specific point in time
Data File Interval PI_PIDF Performance data, taken at specific intervals, aboutdata files
Database PD_PDDB Performance data, taken at a specific point in time,indicating the following:
2-32 Working with RecordsHitachi Tuning Manager Application Reports Reference
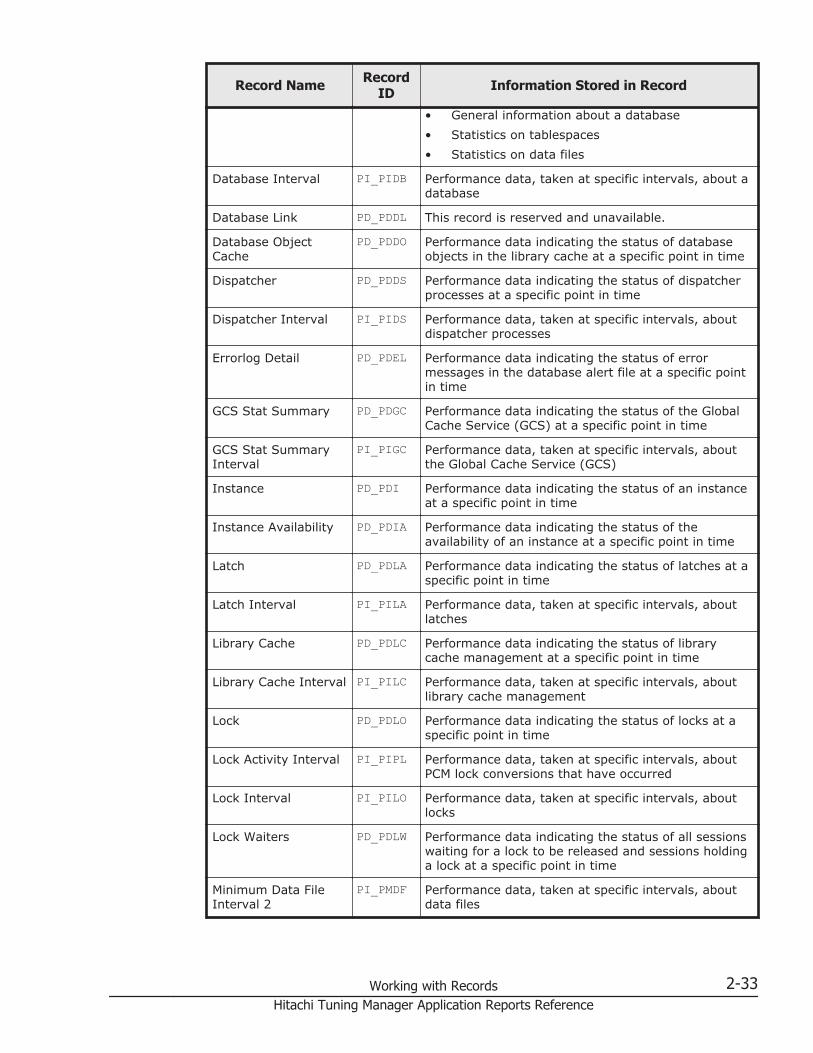
Record Name RecordID Information Stored in Record
• General information about a database• Statistics on tablespaces• Statistics on data files
Database Interval PI_PIDB Performance data, taken at specific intervals, about adatabase
Database Link PD_PDDL This record is reserved and unavailable.
Database ObjectCache
PD_PDDO Performance data indicating the status of databaseobjects in the library cache at a specific point in time
Dispatcher PD_PDDS Performance data indicating the status of dispatcherprocesses at a specific point in time
Dispatcher Interval PI_PIDS Performance data, taken at specific intervals, aboutdispatcher processes
Errorlog Detail PD_PDEL Performance data indicating the status of errormessages in the database alert file at a specific pointin time
GCS Stat Summary PD_PDGC Performance data indicating the status of the GlobalCache Service (GCS) at a specific point in time
GCS Stat SummaryInterval
PI_PIGC Performance data, taken at specific intervals, aboutthe Global Cache Service (GCS)
Instance PD_PDI Performance data indicating the status of an instanceat a specific point in time
Instance Availability PD_PDIA Performance data indicating the status of theavailability of an instance at a specific point in time
Latch PD_PDLA Performance data indicating the status of latches at aspecific point in time
Latch Interval PI_PILA Performance data, taken at specific intervals, aboutlatches
Library Cache PD_PDLC Performance data indicating the status of librarycache management at a specific point in time
Library Cache Interval PI_PILC Performance data, taken at specific intervals, aboutlibrary cache management
Lock PD_PDLO Performance data indicating the status of locks at aspecific point in time
Lock Activity Interval PI_PIPL Performance data, taken at specific intervals, aboutPCM lock conversions that have occurred
Lock Interval PI_PILO Performance data, taken at specific intervals, aboutlocks
Lock Waiters PD_PDLW Performance data indicating the status of all sessionswaiting for a lock to be released and sessions holdinga lock at a specific point in time
Minimum Data FileInterval 2
PI_PMDF Performance data, taken at specific intervals, aboutdata files
Working with Records 2-33Hitachi Tuning Manager Application Reports Reference

Record Name RecordID Information Stored in Record
Minimum DatabaseInterval 2
PI_PMDB Performance data, taken at specific intervals, about adatabase
Minimum TablespaceInterval 2
PI_PMTS Performance data, taken at specific intervals, abouttablespaces in a database
Multi - ThreadedServer
PD_PDMT Performance data indicating the status of the multi-thread server (MTS) options at a specific point in time
Multi - ThreadedServer Interval
PI_PIMT Performance data, taken at specific intervals, aboutthe multi-thread server (MTS) options
Open Cursor PD_PDOC Performance data indicating the status of cursors at aspecific point in time
Options Installed PD_PDO Performance data indicating the status of thesoftware options installed on the Oracle Server at aspecific point in time
Parallel Query Server PD_PDPQ Performance data indicating the status of parallelquery servers at a specific point in time
Parallel Query ServerInterval
PI_PIPQ Performance data, taken at specific intervals, aboutparallel query servers
Parallel QueryStatistics
PD_PDPS Performance data indicating the status of parallelquery options at a specific point in time
Parameter Values PD_PDP Performance data indicating the status of currentparameter values at a specific point in time
Ping Activity Interval PI_PIPP This record is reserved and unavailable.
Process Detail PD_PDOP Performance data indicating the status of processesat a specific point in time
Queue Statistics PD_PDQU Performance data indicating the status of queues at aspecific point in time
Resource Limit PD_PDRL Performance data indicating the usage of globalsystem resources at a specific point in time
Rollback Segment PD_PDRS Performance data indicating the status of eachrollback segment in a database at a specific point intime
Rollback SegmentInterval
PI_PIRS Performance data, taken at specific intervals, abouteach rollback segment in a database
Segment Detail PD_PDSM Performance data indicating the status of databasesegments at a specific point in time
Server Status PD_STAT Performance data indicating the status of the Oracleserver at a specific point in time
Session Detail PD_PDS Performance data indicating the status of sessions ata specific point in time
Session Event PD_PDEV Performance data indicating the status of sessionevents at a specific point in time
2-34 Working with RecordsHitachi Tuning Manager Application Reports Reference
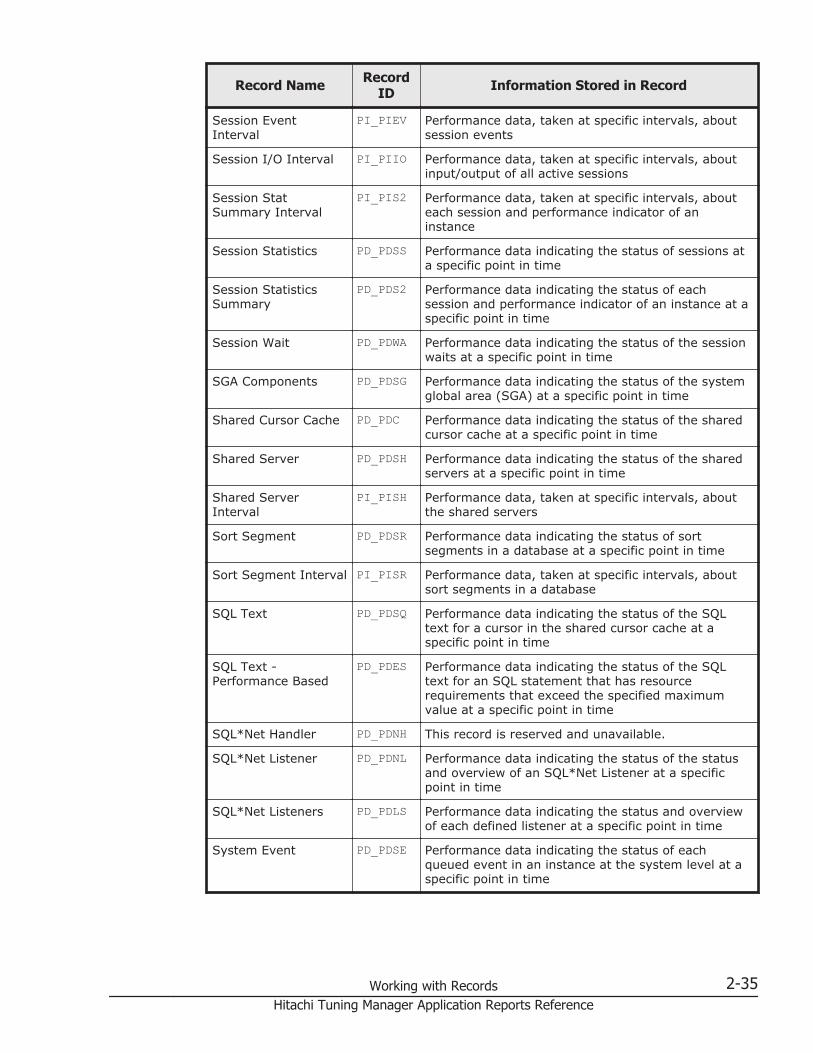
Record Name RecordID Information Stored in Record
Session EventInterval
PI_PIEV Performance data, taken at specific intervals, aboutsession events
Session I/O Interval PI_PIIO Performance data, taken at specific intervals, aboutinput/output of all active sessions
Session StatSummary Interval
PI_PIS2 Performance data, taken at specific intervals, abouteach session and performance indicator of aninstance
Session Statistics PD_PDSS Performance data indicating the status of sessions ata specific point in time
Session StatisticsSummary
PD_PDS2 Performance data indicating the status of eachsession and performance indicator of an instance at aspecific point in time
Session Wait PD_PDWA Performance data indicating the status of the sessionwaits at a specific point in time
SGA Components PD_PDSG Performance data indicating the status of the systemglobal area (SGA) at a specific point in time
Shared Cursor Cache PD_PDC Performance data indicating the status of the sharedcursor cache at a specific point in time
Shared Server PD_PDSH Performance data indicating the status of the sharedservers at a specific point in time
Shared ServerInterval
PI_PISH Performance data, taken at specific intervals, aboutthe shared servers
Sort Segment PD_PDSR Performance data indicating the status of sortsegments in a database at a specific point in time
Sort Segment Interval PI_PISR Performance data, taken at specific intervals, aboutsort segments in a database
SQL Text PD_PDSQ Performance data indicating the status of the SQLtext for a cursor in the shared cursor cache at aspecific point in time
SQL Text -Performance Based
PD_PDES Performance data indicating the status of the SQLtext for an SQL statement that has resourcerequirements that exceed the specified maximumvalue at a specific point in time
SQL*Net Handler PD_PDNH This record is reserved and unavailable.
SQL*Net Listener PD_PDNL Performance data indicating the status of the statusand overview of an SQL*Net Listener at a specificpoint in time
SQL*Net Listeners PD_PDLS Performance data indicating the status and overviewof each defined listener at a specific point in time
System Event PD_PDSE Performance data indicating the status of eachqueued event in an instance at the system level at aspecific point in time
Working with Records 2-35Hitachi Tuning Manager Application Reports Reference

Record Name RecordID Information Stored in Record
System Event Interval PI_PISE Performance data, taken at specific intervals, abouteach queued event in an instance at the system level
System Stat Interval PI_PIST Metric information about sessions
System StatSummary
PD Performance data indicating the status of keyperformance indicators at a specific point in time
System StatSummary Interval
PI Performance data, taken at specific intervals since thestart of an instance, about key performance indicators
System Statistics PD_PDST Performance data indicating the status of all sessionsin the system at a specific point in time
Table Access PD_PDTA Performance data indicating the status of a tableaccessed by sessions during data collection at aspecific point in time
Tablespace PD_PDTS Performance data indicating the status of tablespacesin a database at a specific point in time
TablespaceFragmentation
PD_PDTF Performance data indicating the status offragmentation of tablespaces at a specific point intime
Tablespace Interval PI_PITS Performance data, taken at specific intervals, abouttablespaces in a database
Transaction PD_PDTR Performance data indicating the status of transactionsat a specific point in time
Transaction Interval PI_PITR Performance data, taken at specific intervals, abouttransactions
Transaction Lock PD_PDTL Performance data indicating the status of transactionlocks at a specific point in time
Version PD_PDV Performance data, taken at a specific point in time,indicating the version number of a core component onthe Oracle server
Activity Summary (PD_PDAS)
Function
The Activity Summary (PD_PDAS) record stores performance data indicatingthe operating status of the Oracle system at a specific point in time.
Table 2-18 Activity Summary (PD_PDAS) Default and Changeable Values
Item Default Value Changeable?
Collection Interval 300 Yes
Collection Offset 30
Log No
2-36 Working with RecordsHitachi Tuning Manager Application Reports Reference

Item Default Value Changeable?
LOGIF (Blank)
Key Fields
None
Lifetime
From the creation to the deletion of an Oracle instance
Record Size
• Fixed part: 868 bytes• Variable part: 0 bytes
Table 2-19 Activity Summary (PD_PDAS) Fields
Activity Summary (PD_PDAS)
View Name(Manager Name) Description Sum
Rule Format DeltaSupport
edVersion
DataSource
Active Transactions(ACTIVE_TRANSACTIONS)
Number ofactivetransactionsin activesessions
-- long No All SUM(V$ROLLSTAT.XACTS)
Avg Wait(AVERAGE_WAIT)
Average waittime for allevents in allsessions inhundredthsof a second
-- ulong No All AVG(V$SESSION_EVENT.AVERAGE_WAIT)
Avg Wait String(AVERAGE_WAIT_STRING)
Average waittime(characterstring) for allevents in allsessions inseconds
-- string(30)
No All AVG(V$SESSION_EVENT.AVERAGE_WAIT) /100
Cursor Open Hit %(CURSOR_OPEN_HIT_PERCENTAGE)
Percentageof cursorsfound incursorsearchesthat wereopen cursors
-- double No All V$SYSTEM_CURSOR_CACHE.HIT_RATIO *100
Cursor Open Hits(CURSOR_OPEN_HITS)
Total cursoropen hits
-- ulong No All V$SYSTEM_CUR
Working with Records 2-37Hitachi Tuning Manager Application Reports Reference

Activity Summary (PD_PDAS)
View Name(Manager Name) Description Sum
Rule Format DeltaSupport
edVersion
DataSource
SOR_CACHE.HITS
Cursor Opens(CURSOR_OPENS)
Total cursoropens
-- ulong No All V$SYSTEM_CURSOR_CACHE.OPENS
DML Locks %(PERCENT_DML_LOCKS)
Ratio (as apercent) ofthe numberof DML locksto theDML_LOCKSparametervalue in theinit.ora file
-- double No All (COUNT(DBA_DML_LOCKS)/ init.oraDML_LOCKS)* 100
DML Locks Held(DML_LOCKS_HELD)
Number ofcurrent ofDML locks
-- long No All COUNT(DBA_DML_LOCKS)
Enqueue Resources %(PERCENT_ENQUEUE_RESOURCES)
Ratio (as apercent) ofthe numberof locks totheENQUEUE_RESOURCESparametervalue in theinit.ora file
If aninstance ofOracle 10gRelease 2 orlater is beingmonitored,the value isalways 0.
-- double No All (COUNT(V$LOCK)where V$LOCK.LMODEis NOTNULL /init.oraENQUEUE_RESOURCES) *100
Locks Held(LOCKS_HELD)
Number ofcurrent locks
-- long No All COUNT(V$LOCK)where V$LOCK.LMODEis NOT NULL
Open Cursors(OPEN_CURSORS)
Number ofcurrent opencursors
-- long No All COUNT(V$OPEN_CURSOR)
Open Cursors %(PERCENT_OPEN_CURSORS)
Ratio (as apercent) ofthe numberof open
-- double No All (COUNT(V$OPEN_CURSOR) /init.ora
2-38 Working with RecordsHitachi Tuning Manager Application Reports Reference

Activity Summary (PD_PDAS)
View Name(Manager Name) Description Sum
Rule Format DeltaSupport
edVersion
DataSource
cursors totheOPEN_CURSORS parametervalue in theinit.ora file
OPEN_CURSORS) * 100
Processes(PROCESSES)
Number ofcurrentOracleprocesses
-- ulong No All COUNT(V$PROCESS)
Processes %(PERCENT_PROCESSES)
Ratio (as apercent) ofthe numberof processesto thePROCESSESparametervalue in theinit.ora file
-- double No All (COUNT(V$PROCESS) /init.oraPROCESSES)* 100
Record Time(RECORD_TIME)
Collectionterminationtime for theperformancedata storedin the record
-- time_t No All AgentCollector
Record Type(INPUT_RECORD_TYPE)
Record name(alwaysPDAS)
-- string(4)
No All AgentCollector
Session Events(SESSION_EVENTS)
Number ofeventsqueued bysessions
-- ulong No All COUNT(V$SESSION_EVENT)
Session Waits(SESSION_WAITS)
Number ofsession waits
-- ulong No All COUNT(V$SESSION_WAIT)
Sessions(SESSIONS)
Number ofcurrentsessions
-- ulong No All COUNT(V$SESSION)
Sessions %(PERCENT_SESSIONS)
Ratio (as apercent) ofthe numberof sessionsto theSESSIONSparametervalue in theinit.ora file
-- double No All (COUNT(V$SESSION) /init.oraSESSIONS) *100
Working with Records 2-39Hitachi Tuning Manager Application Reports Reference
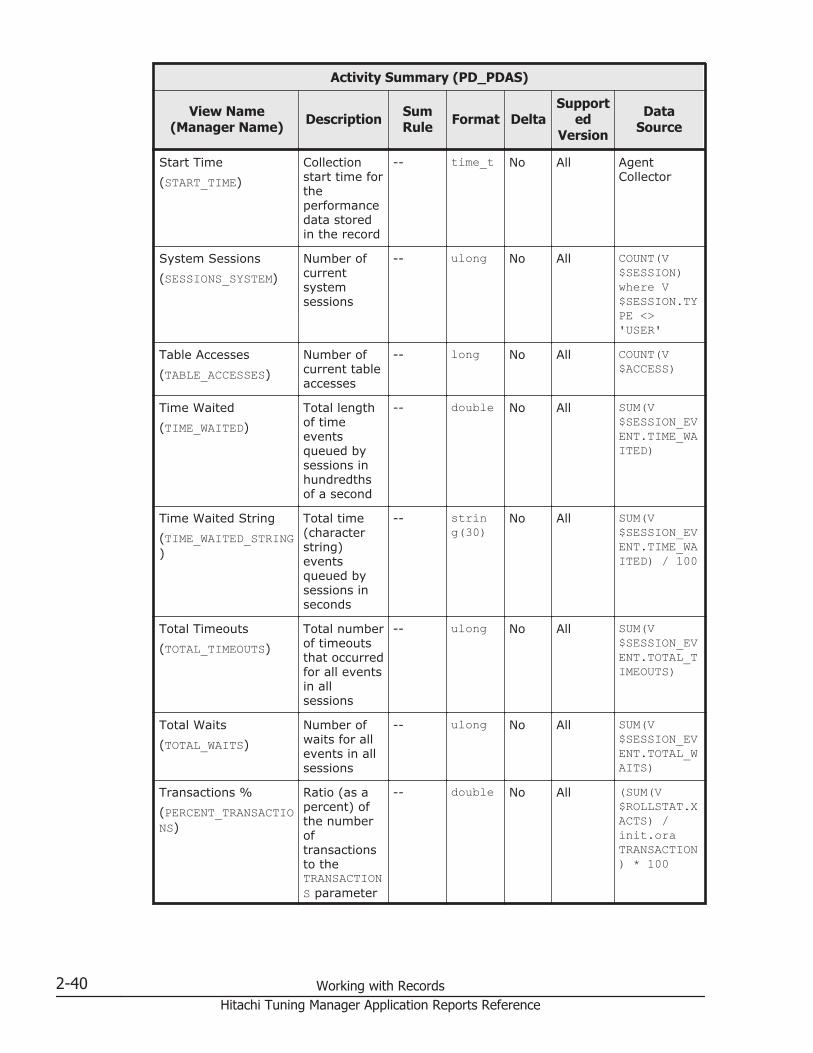
Activity Summary (PD_PDAS)
View Name(Manager Name) Description Sum
Rule Format DeltaSupport
edVersion
DataSource
Start Time(START_TIME)
Collectionstart time fortheperformancedata storedin the record
-- time_t No All AgentCollector
System Sessions(SESSIONS_SYSTEM)
Number ofcurrentsystemsessions
-- ulong No All COUNT(V$SESSION)where V$SESSION.TYPE <>'USER'
Table Accesses(TABLE_ACCESSES)
Number ofcurrent tableaccesses
-- long No All COUNT(V$ACCESS)
Time Waited(TIME_WAITED)
Total lengthof timeeventsqueued bysessions inhundredthsof a second
-- double No All SUM(V$SESSION_EVENT.TIME_WAITED)
Time Waited String(TIME_WAITED_STRING)
Total time(characterstring)eventsqueued bysessions inseconds
-- string(30)
No All SUM(V$SESSION_EVENT.TIME_WAITED) / 100
Total Timeouts(TOTAL_TIMEOUTS)
Total numberof timeoutsthat occurredfor all eventsin allsessions
-- ulong No All SUM(V$SESSION_EVENT.TOTAL_TIMEOUTS)
Total Waits(TOTAL_WAITS)
Number ofwaits for allevents in allsessions
-- ulong No All SUM(V$SESSION_EVENT.TOTAL_WAITS)
Transactions %(PERCENT_TRANSACTIONS)
Ratio (as apercent) ofthe numberoftransactionsto theTRANSACTIONS parameter
-- double No All (SUM(V$ROLLSTAT.XACTS) /init.oraTRANSACTION) * 100
2-40 Working with RecordsHitachi Tuning Manager Application Reports Reference

Activity Summary (PD_PDAS)
View Name(Manager Name) Description Sum
Rule Format DeltaSupport
edVersion
DataSource
value in theinit.ora file
User Sessions(SESSIONS_USER)
Number ofcurrent usersessions
-- ulong No All COUNT(V$SESSION)where V$SESSION.TYPE = 'USER'
ASM Disk (PD_PDDK)
Function
The ASM Disk (PD_PDDK) record stores performance data indicating thestatus, at a specific point in time, of the ASM disk managed by the ASMinstance where the Oracle system performs communications. This is a multi-instance record.
Note: - Collecting ASM Disk (PD_PDDK) records is supported for ASM andOracle Database only when both versions are 11.2.0 or later. Records cannotbe collected in versions 11.1.0 or earlier.- When the ASM disk group is not mounted, the Group Number becomes 0,and the Disk Group Name displays a blank space.
Table 2-20 ASM Disk (PD_PDDK) Default and Changeable Values
Item Default Value Changeable?
Collection Interval 3600 Yes
Collection Offset 260
Log No
LOGIF (Blank)
Key Fields
• PD_PDDK_DISK_NUMBER• PD_PDDK_GROUP_NUMBER
Lifetime
From the creation to the deletion of an ASM disk.
Working with Records 2-41Hitachi Tuning Manager Application Reports Reference
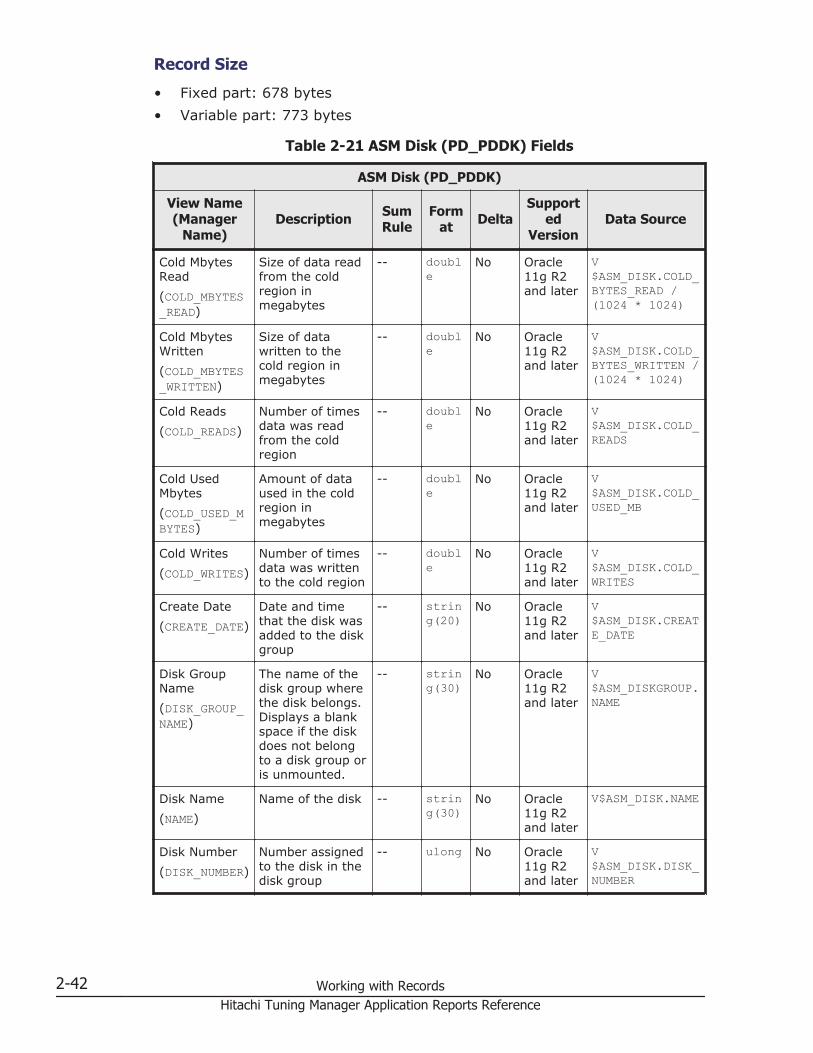
Record Size
• Fixed part: 678 bytes• Variable part: 773 bytes
Table 2-21 ASM Disk (PD_PDDK) Fields
ASM Disk (PD_PDDK)
View Name(Manager
Name)Description Sum
RuleForm
at DeltaSupport
edVersion
Data Source
Cold MbytesRead(COLD_MBYTES_READ)
Size of data readfrom the coldregion inmegabytes
-- double
No Oracle11g R2and later
V$ASM_DISK.COLD_BYTES_READ /(1024 * 1024)
Cold MbytesWritten(COLD_MBYTES_WRITTEN)
Size of datawritten to thecold region inmegabytes
-- double
No Oracle11g R2and later
V$ASM_DISK.COLD_BYTES_WRITTEN /(1024 * 1024)
Cold Reads(COLD_READS)
Number of timesdata was readfrom the coldregion
-- double
No Oracle11g R2and later
V$ASM_DISK.COLD_READS
Cold UsedMbytes(COLD_USED_MBYTES)
Amount of dataused in the coldregion inmegabytes
-- double
No Oracle11g R2and later
V$ASM_DISK.COLD_USED_MB
Cold Writes(COLD_WRITES)
Number of timesdata was writtento the cold region
-- double
No Oracle11g R2and later
V$ASM_DISK.COLD_WRITES
Create Date(CREATE_DATE)
Date and timethat the disk wasadded to the diskgroup
-- string(20)
No Oracle11g R2and later
V$ASM_DISK.CREATE_DATE
Disk GroupName(DISK_GROUP_NAME)
The name of thedisk group wherethe disk belongs.Displays a blankspace if the diskdoes not belongto a disk group oris unmounted.
-- string(30)
No Oracle11g R2and later
V$ASM_DISKGROUP.NAME
Disk Name(NAME)
Name of the disk -- string(30)
No Oracle11g R2and later
V$ASM_DISK.NAME
Disk Number(DISK_NUMBER)
Number assignedto the disk in thedisk group
-- ulong No Oracle11g R2and later
V$ASM_DISK.DISK_NUMBER
2-42 Working with RecordsHitachi Tuning Manager Application Reports Reference
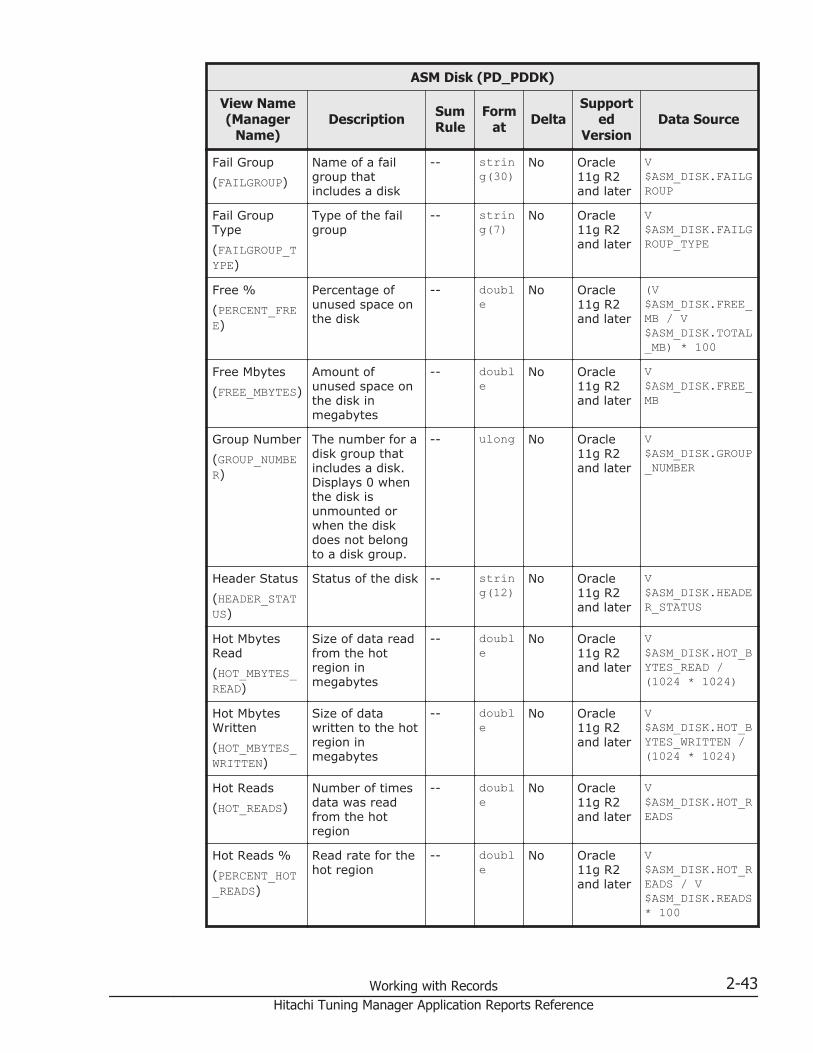
ASM Disk (PD_PDDK)
View Name(Manager
Name)Description Sum
RuleForm
at DeltaSupport
edVersion
Data Source
Fail Group(FAILGROUP)
Name of a failgroup thatincludes a disk
-- string(30)
No Oracle11g R2and later
V$ASM_DISK.FAILGROUP
Fail GroupType(FAILGROUP_TYPE)
Type of the failgroup
-- string(7)
No Oracle11g R2and later
V$ASM_DISK.FAILGROUP_TYPE
Free %(PERCENT_FREE)
Percentage ofunused space onthe disk
-- double
No Oracle11g R2and later
(V$ASM_DISK.FREE_MB / V$ASM_DISK.TOTAL_MB) * 100
Free Mbytes(FREE_MBYTES)
Amount ofunused space onthe disk inmegabytes
-- double
No Oracle11g R2and later
V$ASM_DISK.FREE_MB
Group Number(GROUP_NUMBER)
The number for adisk group thatincludes a disk.Displays 0 whenthe disk isunmounted orwhen the diskdoes not belongto a disk group.
-- ulong No Oracle11g R2and later
V$ASM_DISK.GROUP_NUMBER
Header Status(HEADER_STATUS)
Status of the disk -- string(12)
No Oracle11g R2and later
V$ASM_DISK.HEADER_STATUS
Hot MbytesRead(HOT_MBYTES_READ)
Size of data readfrom the hotregion inmegabytes
-- double
No Oracle11g R2and later
V$ASM_DISK.HOT_BYTES_READ /(1024 * 1024)
Hot MbytesWritten(HOT_MBYTES_WRITTEN)
Size of datawritten to the hotregion inmegabytes
-- double
No Oracle11g R2and later
V$ASM_DISK.HOT_BYTES_WRITTEN /(1024 * 1024)
Hot Reads(HOT_READS)
Number of timesdata was readfrom the hotregion
-- double
No Oracle11g R2and later
V$ASM_DISK.HOT_READS
Hot Reads %(PERCENT_HOT_READS)
Read rate for thehot region
-- double
No Oracle11g R2and later
V$ASM_DISK.HOT_READS / V$ASM_DISK.READS* 100
Working with Records 2-43Hitachi Tuning Manager Application Reports Reference

ASM Disk (PD_PDDK)
View Name(Manager
Name)Description Sum
RuleForm
at DeltaSupport
edVersion
Data Source
Hot Used %(PERCENT_HOT_USED)
Percentage of thehot region that isused
-- double
No Oracle11g R2and later
(V$ASM_DISK.HOT_USED_MB / (V$ASM_DISK.HOT_USED_MB + V$ASM_DISK.COLD_USED_MB)) * 100
Hot UsedMbytes(HOT_USED_MBYTES)
Amount of dataused in the hotregion inmegabytes
-- double
No Oracle11g R2and later
V$ASM_DISK.HOT_USED_MB
Hot Writes %(PERCENT_HOT_WRITES)
Write rate for thehot region
-- double
No Oracle11g R2and later
V$ASM_DISK.HOT_WRITES / V$ASM_DISK.WRITES * 100
Hot Writes(HOT_WRITES)
Number of timesdata was writtento the hot region
-- double
No Oracle11g R2and later
V$ASM_DISK.HOT_WRITES
Label(LABEL)
Disk label -- string(31)
No Oracle11g R2and later
V$ASM_DISK.LABEL
Mode Status(MODE_STATUS)
Global statusrelated to the I/Orequest typespermitted fromthe disk
-- string(7)
No Oracle11g R2and later
V$ASM_DISK.MODE_STATUS
Mount Date(MOUNT_DATE)
Date and timethat the disk wasmounted
-- string(20)
No Oracle11g R2and later
V$ASM_DISK.MOUNT_DATE
Mount Status(MOUNT_STATUS)
Status of the diskgroup where thedisk belongs
-- string(7)
No Oracle11g R2and later
V$ASM_DISK.MOUNT_STATUS
OS Mbytes(OS_MBYTES)
Disk size reportedto the OS inmegabytes
-- double
No Oracle11g R2and later
V$ASM_DISK.OS_MB
Path(PATH)
Path to the OS -- string(256)
No Oracle11g R2and later
V$ASM_DISK.PATH
Preferred Read(PREFERRED_READ)
Status of thepreferred failgroup
-- string(1)
No Oracle11g R2and later
V$ASM_DISK.PREFERRED_READ
2-44 Working with RecordsHitachi Tuning Manager Application Reports Reference
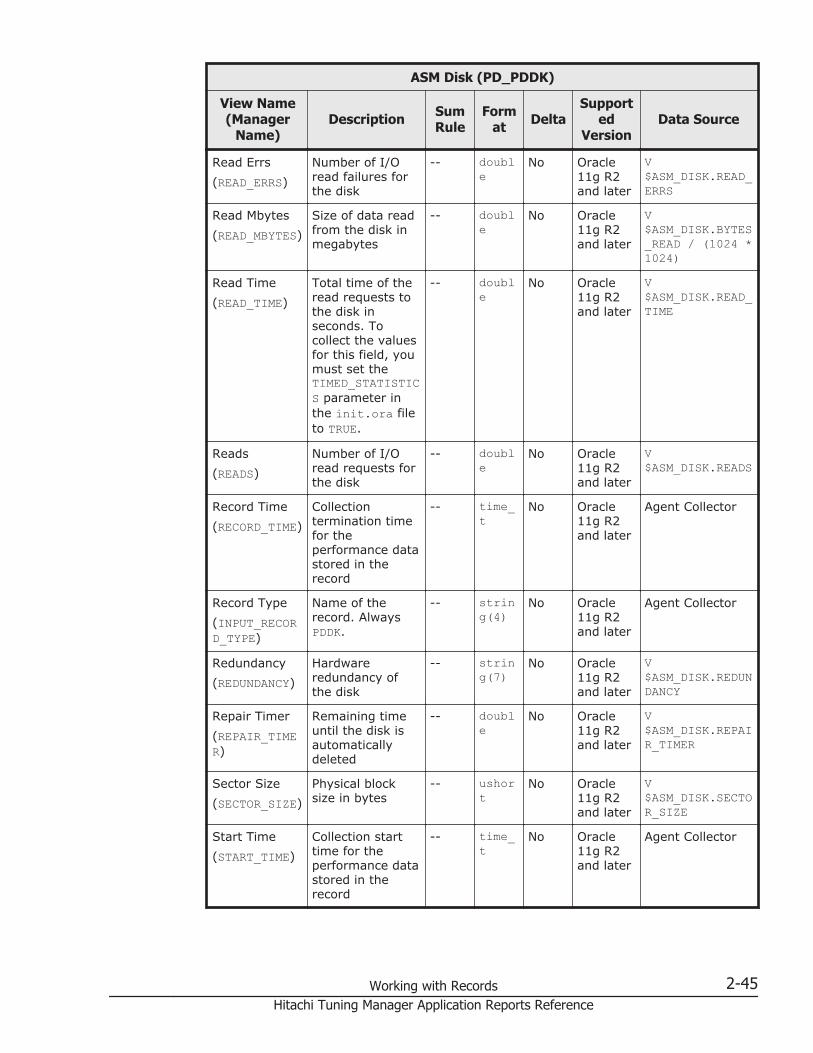
ASM Disk (PD_PDDK)
View Name(Manager
Name)Description Sum
RuleForm
at DeltaSupport
edVersion
Data Source
Read Errs(READ_ERRS)
Number of I/Oread failures forthe disk
-- double
No Oracle11g R2and later
V$ASM_DISK.READ_ERRS
Read Mbytes(READ_MBYTES)
Size of data readfrom the disk inmegabytes
-- double
No Oracle11g R2and later
V$ASM_DISK.BYTES_READ / (1024 *1024)
Read Time(READ_TIME)
Total time of theread requests tothe disk inseconds. Tocollect the valuesfor this field, youmust set theTIMED_STATISTICS parameter inthe init.ora fileto TRUE.
-- double
No Oracle11g R2and later
V$ASM_DISK.READ_TIME
Reads(READS)
Number of I/Oread requests forthe disk
-- double
No Oracle11g R2and later
V$ASM_DISK.READS
Record Time(RECORD_TIME)
Collectiontermination timefor theperformance datastored in therecord
-- time_t
No Oracle11g R2and later
Agent Collector
Record Type(INPUT_RECORD_TYPE)
Name of therecord. AlwaysPDDK.
-- string(4)
No Oracle11g R2and later
Agent Collector
Redundancy(REDUNDANCY)
Hardwareredundancy ofthe disk
-- string(7)
No Oracle11g R2and later
V$ASM_DISK.REDUNDANCY
Repair Timer(REPAIR_TIMER)
Remaining timeuntil the disk isautomaticallydeleted
-- double
No Oracle11g R2and later
V$ASM_DISK.REPAIR_TIMER
Sector Size(SECTOR_SIZE)
Physical blocksize in bytes
-- ushort
No Oracle11g R2and later
V$ASM_DISK.SECTOR_SIZE
Start Time(START_TIME)
Collection starttime for theperformance datastored in therecord
-- time_t
No Oracle11g R2and later
Agent Collector
Working with Records 2-45Hitachi Tuning Manager Application Reports Reference
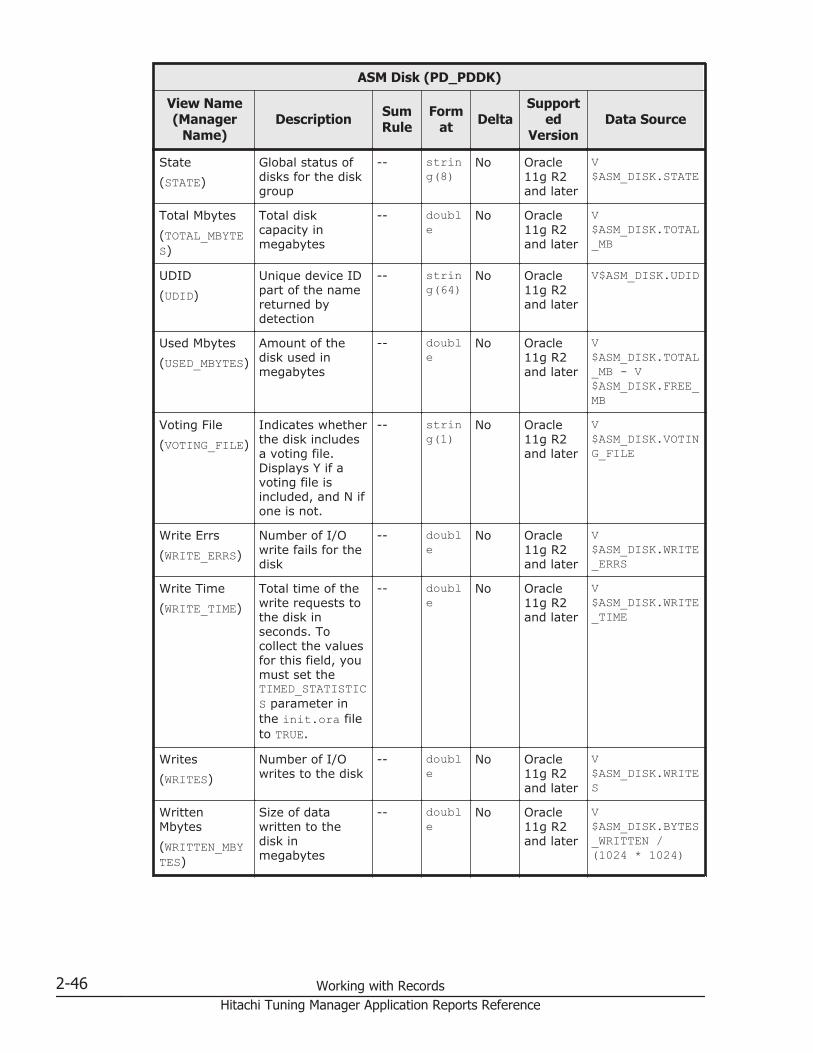
ASM Disk (PD_PDDK)
View Name(Manager
Name)Description Sum
RuleForm
at DeltaSupport
edVersion
Data Source
State(STATE)
Global status ofdisks for the diskgroup
-- string(8)
No Oracle11g R2and later
V$ASM_DISK.STATE
Total Mbytes(TOTAL_MBYTES)
Total diskcapacity inmegabytes
-- double
No Oracle11g R2and later
V$ASM_DISK.TOTAL_MB
UDID(UDID)
Unique device IDpart of the namereturned bydetection
-- string(64)
No Oracle11g R2and later
V$ASM_DISK.UDID
Used Mbytes(USED_MBYTES)
Amount of thedisk used inmegabytes
-- double
No Oracle11g R2and later
V$ASM_DISK.TOTAL_MB - V$ASM_DISK.FREE_MB
Voting File(VOTING_FILE)
Indicates whetherthe disk includesa voting file.Displays Y if avoting file isincluded, and N ifone is not.
-- string(1)
No Oracle11g R2and later
V$ASM_DISK.VOTING_FILE
Write Errs(WRITE_ERRS)
Number of I/Owrite fails for thedisk
-- double
No Oracle11g R2and later
V$ASM_DISK.WRITE_ERRS
Write Time(WRITE_TIME)
Total time of thewrite requests tothe disk inseconds. Tocollect the valuesfor this field, youmust set theTIMED_STATISTICS parameter inthe init.ora fileto TRUE.
-- double
No Oracle11g R2and later
V$ASM_DISK.WRITE_TIME
Writes(WRITES)
Number of I/Owrites to the disk
-- double
No Oracle11g R2and later
V$ASM_DISK.WRITES
WrittenMbytes(WRITTEN_MBYTES)
Size of datawritten to thedisk inmegabytes
-- double
No Oracle11g R2and later
V$ASM_DISK.BYTES_WRITTEN /(1024 * 1024)
2-46 Working with RecordsHitachi Tuning Manager Application Reports Reference

ASM Disk Group Interval (PI_PIDG)
Function
The ASM Disk Group Interval (PI_PIDG) record stores performance dataindicating the status, at a specific point in time, of the ASM disk groupmanaged by the ASM instance where Oracle system performscommunications. This is a multi-instance record.
If you want to use this record to monitor the amount of free space, themonitoring target is Free Mbyte field for a non-mirror configuration, andUsable File Mbytes field for a mirror configuration.
The following figure shows the field configuration related to the amount offree space for the ASM Disk Group Interval (PI_PIDG) record by using anexample of an ASM disk group with redundant mirror configuration.
Figure 2-1 Field configuration related to the amount of free space for theASM Disk Group Interval (PI_PIDG) record
#1:This is the amount of disk space required for a restoration when a failureoccurs in an ASM disk group in a mirror configuration. If the amount ofdisk space is insufficient, a restoration might not be performed in theevent of a failure.
#2:Indicates the area that can be used for mirroring the configuration. Thevalue takes the mirrored configuration into account, and is calculated bysubtracting the Required Mirror Mbytes field from the Free Mbytes field(for example, for a redundant mirror configuration, if Free Mbytes -Required Mirror Mbytes = 4 Gigabytes, the Usable File Mbytes will be halfof that value which is 2 Gigabytes).If the amount of disk space is insufficient, a new file cannot be created, orthe redundancy of the file might be impaired in the event of a failure.
Working with Records 2-47Hitachi Tuning Manager Application Reports Reference
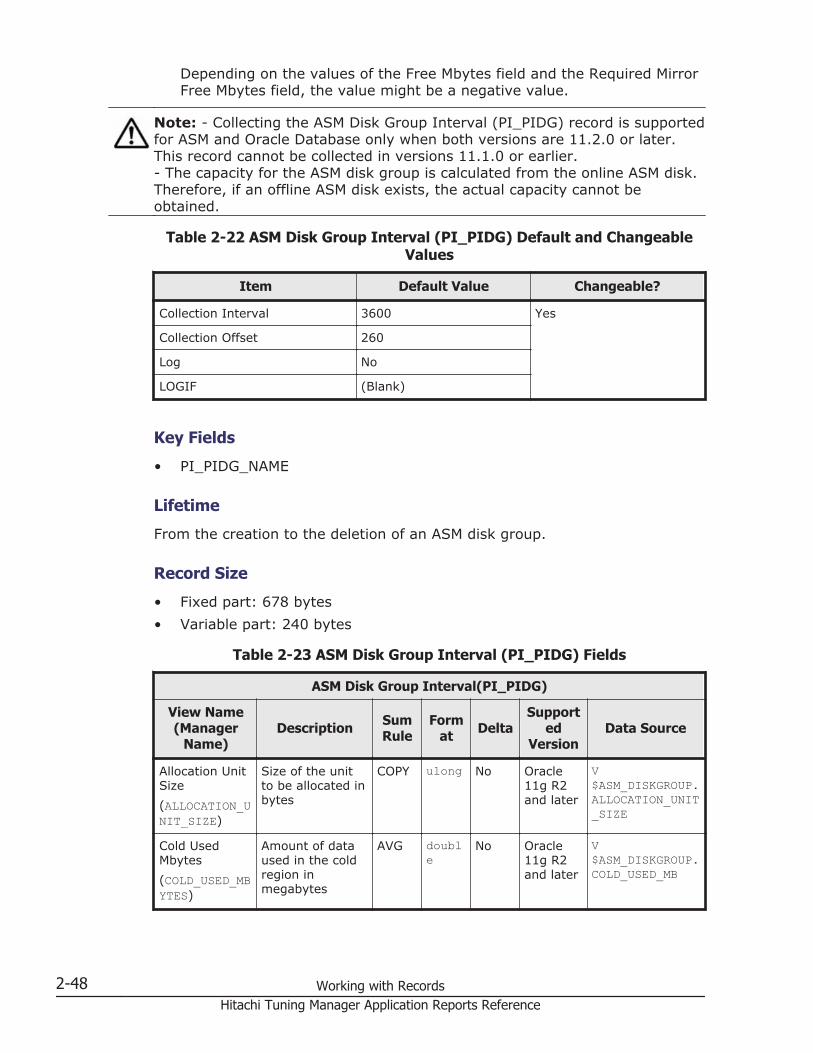
Depending on the values of the Free Mbytes field and the Required MirrorFree Mbytes field, the value might be a negative value.
Note: - Collecting the ASM Disk Group Interval (PI_PIDG) record is supportedfor ASM and Oracle Database only when both versions are 11.2.0 or later.This record cannot be collected in versions 11.1.0 or earlier.- The capacity for the ASM disk group is calculated from the online ASM disk.Therefore, if an offline ASM disk exists, the actual capacity cannot beobtained.
Table 2-22 ASM Disk Group Interval (PI_PIDG) Default and ChangeableValues
Item Default Value Changeable?
Collection Interval 3600 Yes
Collection Offset 260
Log No
LOGIF (Blank)
Key Fields
• PI_PIDG_NAME
Lifetime
From the creation to the deletion of an ASM disk group.
Record Size
• Fixed part: 678 bytes• Variable part: 240 bytes
Table 2-23 ASM Disk Group Interval (PI_PIDG) Fields
ASM Disk Group Interval(PI_PIDG)
View Name(Manager
Name)Description Sum
RuleForm
at DeltaSupport
edVersion
Data Source
Allocation UnitSize(ALLOCATION_UNIT_SIZE)
Size of the unitto be allocated inbytes
COPY ulong No Oracle11g R2and later
V$ASM_DISKGROUP.ALLOCATION_UNIT_SIZE
Cold UsedMbytes(COLD_USED_MBYTES)
Amount of dataused in the coldregion inmegabytes
AVG double
No Oracle11g R2and later
V$ASM_DISKGROUP.COLD_USED_MB
2-48 Working with RecordsHitachi Tuning Manager Application Reports Reference

ASM Disk Group Interval(PI_PIDG)
View Name(Manager
Name)Description Sum
RuleForm
at DeltaSupport
edVersion
Data Source
Free Mbytes(FREE_MBYTES)
Unused capacityof the disk groupin megabytes.
AVG double
No Oracle11g R2and later
V$ASM_DISKGROUP.FREE_MB
Group Number(GROUP_NUMBER)
Number of theentire clusterassigned to thedisk group
COPY ulong No Oracle11g R2and later
V$ASM_DISKGROUP.GROUP_NUMBER
Hot Used %(PERCENT_HOT_USED)
Percentage of thehot region used
AVG double
No Oracle11g R2and later
(V$ASM_DISKGROUP.HOT_USED_MB /(V$ASM_DISKGROUP.HOT_USED_MB + V$ASM_DISKGROUP.COLD_USED_MB) )* 100
Hot UsedMbytes(HOT_USED_MBYTES)
Amount of dataused in the hotregion inmegabytes
AVG double
No Oracle11g R2and later
V$ASM_DISKGROUP.HOT_USED_MB
Name(NAME)
Name of the diskgroup
COPY string(30)
No Oracle11g R2and later
V$ASM_DISKGROUP.NAME
Offline Disks(OFFLINE_DISKS)
Number of disksin the offlinestatus for thedisk group
AVG long No Oracle11g R2and later
V$ASM_DISKGROUP.OFFLINE_DISKS
Record Time(RECORD_TIME)
Collectiontermination timefor theperformance datastored in therecord
COPY time_t
No Oracle11g R2and later
Agent Collector
Record Type(INPUT_RECORD_TYPE)
Name of therecord. AlwaysPIDG.
COPY string(4)
No Oracle11g R2and later
Agent Collector
RequiredMirror FreeMbytes(REQUIRED_MIRROR_FREE_MBYTES)
Capacity requiredfor restoration inmegabytes
AVG double
No Oracle11g R2and later
V$ASM_DISKGROUP.REQUIRED_MIRROR_FREE_MB
Restore AreaLack
Indicateswhether therequired area forrestoration is
COPY short No Oracle11g R2and later
V$ASM_DISKGROUP.FREE_MB >= V$ASM_DISKGROUP.
Working with Records 2-49Hitachi Tuning Manager Application Reports Reference

ASM Disk Group Interval(PI_PIDG)
View Name(Manager
Name)Description Sum
RuleForm
at DeltaSupport
edVersion
Data Source
(RESTORE_AREA_LACK)
sufficient.Displays 1 if thearea isinsufficient, and0 if it is not.
REQUIRED_MIRROR_FREE_MB
Sector Size(SECTOR_SIZE)
Physical blocksize in bytes
COPY ushort
No Oracle11g R2and later
V$ASM_DISKGROUP.SECTOR_SIZE
Start Time(START_TIME)
Collection starttime for theperformance datastored in therecord
COPY time_t
No Oracle11g R2and later
Agent Collector
State(STATE)
Status of the diskgroup
COPY string(11)
No Oracle11g R2and later
V$ASM_DISKGROUP.STATE
Total Mbytes(TOTAL_MBYTES)
Total capacity ofthe disk group inmegabytes
AVG double
No Oracle11g R2and later
V$ASM_DISKGROUP.TOTAL_MB
Type(TYPE)
Redundancy typeof the disk group
COPY string(6)
No Oracle11g R2and later
V$ASM_DISKGROUP.TYPE
Usable FileMbytes(USABLE_FILE_MBYTES)
Amount of freecapacity that canbe used formirroring inmegabytes. Thevalue might benegative.
AVG double
No Oracle11g R2and later
V$ASM_DISKGROUP.USABLE_FILE_MB
Used Mbytes(USED_MBYTES)
Amount of dataused in the diskgroup inmegabytes
AVG double
No Oracle11g R2and later
V$ASM_DISKGROUP.TOTAL_MB - V$ASM_DISKGROUP.FREE_MB
Voting Files(VOTING_FILES)
Whether toinclude votingfiles in the diskgroup. Specify Yto include votingfiles, or N to notinclude them.
COPY string(1)
No Oracle11g R2and later
V$ASM_DISKGROUP.VOTING_FILES
2-50 Working with RecordsHitachi Tuning Manager Application Reports Reference
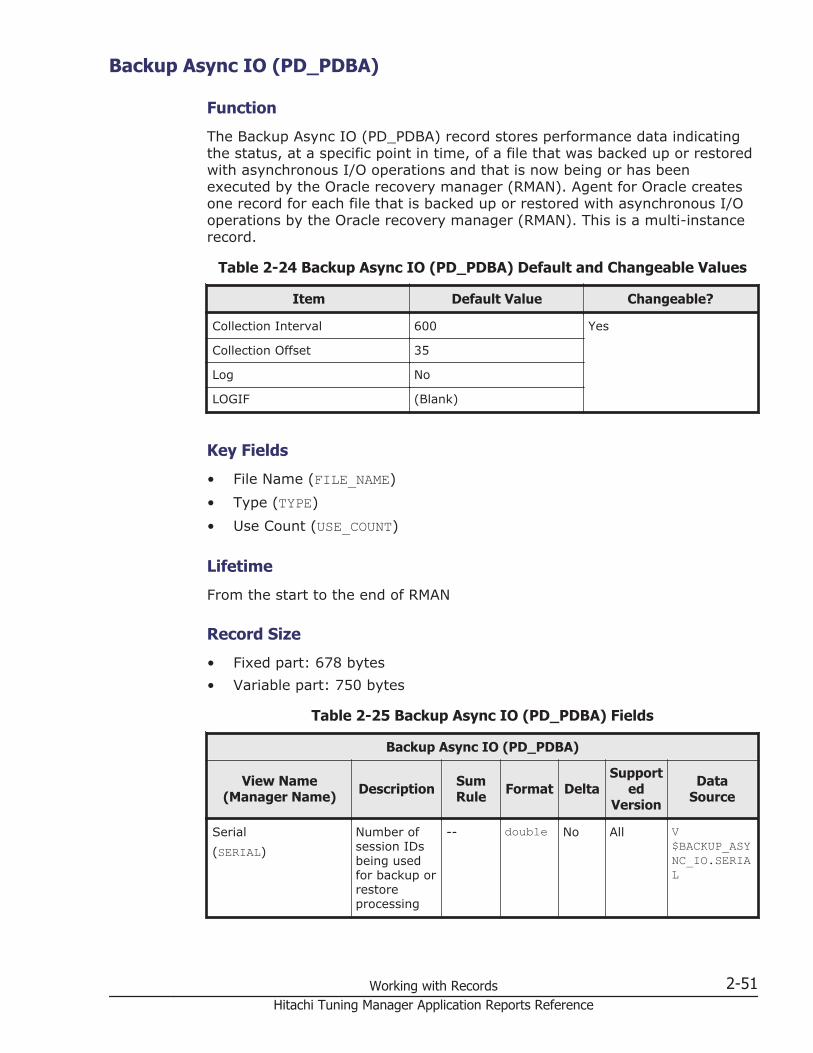
Backup Async IO (PD_PDBA)
Function
The Backup Async IO (PD_PDBA) record stores performance data indicatingthe status, at a specific point in time, of a file that was backed up or restoredwith asynchronous I/O operations and that is now being or has beenexecuted by the Oracle recovery manager (RMAN). Agent for Oracle createsone record for each file that is backed up or restored with asynchronous I/Ooperations by the Oracle recovery manager (RMAN). This is a multi-instancerecord.
Table 2-24 Backup Async IO (PD_PDBA) Default and Changeable Values
Item Default Value Changeable?
Collection Interval 600 Yes
Collection Offset 35
Log No
LOGIF (Blank)
Key Fields
• File Name (FILE_NAME)• Type (TYPE)• Use Count (USE_COUNT)
Lifetime
From the start to the end of RMAN
Record Size
• Fixed part: 678 bytes• Variable part: 750 bytes
Table 2-25 Backup Async IO (PD_PDBA) Fields
Backup Async IO (PD_PDBA)
View Name(Manager Name) Description Sum
Rule Format DeltaSupport
edVersion
DataSource
Serial(SERIAL)
Number ofsession IDsbeing usedfor backup orrestoreprocessing
-- double No All V$BACKUP_ASYNC_IO.SERIAL
Working with Records 2-51Hitachi Tuning Manager Application Reports Reference

Backup Async IO (PD_PDBA)
View Name(Manager Name) Description Sum
Rule Format DeltaSupport
edVersion
DataSource
Buffer Count(BUFFER_COUNT)
Number ofbuffers usedfor read orwriteoperations
-- double No All V$BACKUP_ASYNC_IO.BUFFER_COUNT
Buffer Size(BUFFER_SIZE)
Size of buffer(in kilobytes)used for fileread or writeoperations
-- double No All V$BACKUP_ASYNC_IO.BUFFER_SIZE /1024
Close Time(CLOSE_TIME)
Time file wasclosed (if thevalue of theType field isAGGREGATE,this is thetime all fileswere closedin batchmode)
-- string(20)
No All V$BACKUP_ASYNC_IO.CLOSE_TIME
Device Type(DEVICE_TYPE)
Type ofdevice wherethe file islocated
-- string(17)
No All V$BACKUP_ASYNC_IO.DEVICE_TYPE
Effective Rate(EFFECTIVE_KBYTES_PER_SEC)
Asynchronous I/O rate inkilobytes forthe deviceunderbackupprocessing
-- double No All V$BACKUP_ASYNC_IO.EFFECTIVE_BYTES_PER_SECOND/ 1024
Elapsed Time(ELAPSED_TIME)
Length oftime the filewas open inseconds
-- double Yes All V$BACKUP_ASYNC_IO.ELAPSED_TIME /100
FileName(FILE_NAME)
Name of thebackup file
-- string(513)
No All V$BACKUP_ASYNC_IO.FILENAME
IO Count(IO_COUNT)
Number ofasynchronous file I/Ooperations
-- double Yes All V$BACKUP_ASYNC_IO.IO_COUNT
Long Waits(LONG_WAITS)
Number oftimes thebufferbecame
-- double Yes All V$BACKUP_ASYNC_IO.LONG_WAITS
2-52 Working with RecordsHitachi Tuning Manager Application Reports Reference
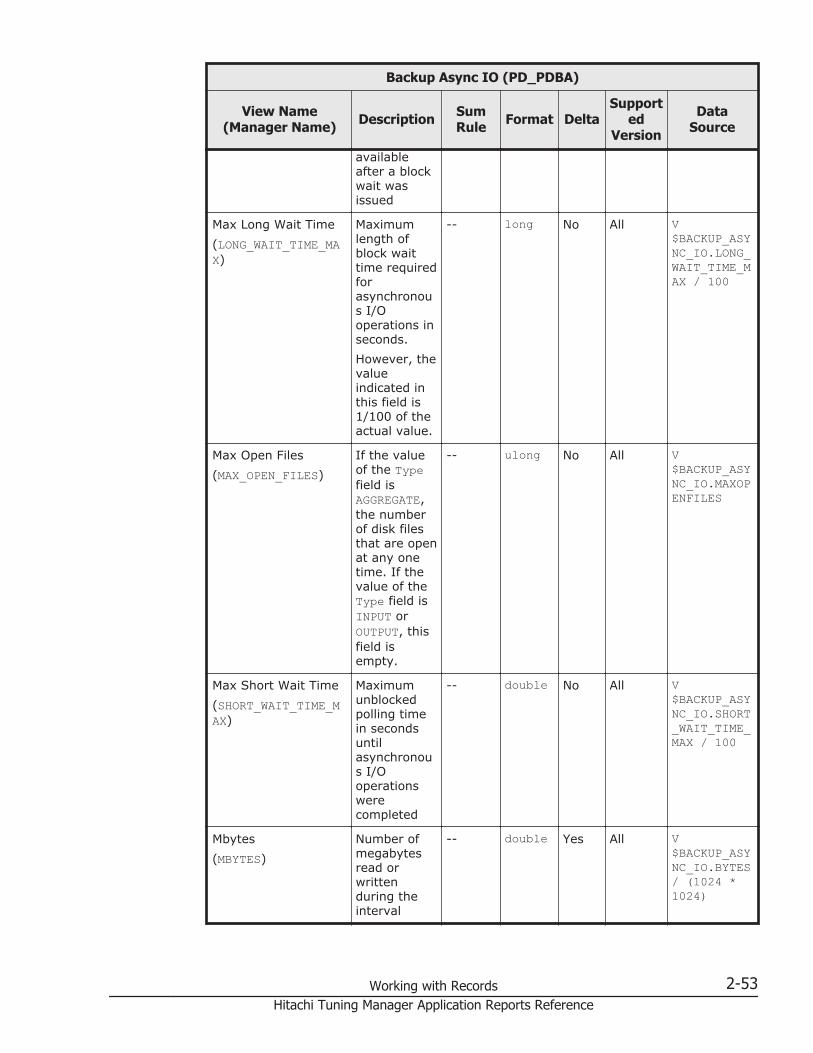
Backup Async IO (PD_PDBA)
View Name(Manager Name) Description Sum
Rule Format DeltaSupport
edVersion
DataSource
availableafter a blockwait wasissued
Max Long Wait Time(LONG_WAIT_TIME_MAX)
Maximumlength ofblock waittime requiredforasynchronous I/Ooperations inseconds.However, thevalueindicated inthis field is1/100 of theactual value.
-- long No All V$BACKUP_ASYNC_IO.LONG_WAIT_TIME_MAX / 100
Max Open Files(MAX_OPEN_FILES)
If the valueof the Typefield isAGGREGATE,the numberof disk filesthat are openat any onetime. If thevalue of theType field isINPUT orOUTPUT, thisfield isempty.
-- ulong No All V$BACKUP_ASYNC_IO.MAXOPENFILES
Max Short Wait Time(SHORT_WAIT_TIME_MAX)
Maximumunblockedpolling timein secondsuntilasynchronous I/Ooperationswerecompleted
-- double No All V$BACKUP_ASYNC_IO.SHORT_WAIT_TIME_MAX / 100
Mbytes(MBYTES)
Number ofmegabytesread orwrittenduring theinterval
-- double Yes All V$BACKUP_ASYNC_IO.BYTES/ (1024 *1024)
Working with Records 2-53Hitachi Tuning Manager Application Reports Reference

Backup Async IO (PD_PDBA)
View Name(Manager Name) Description Sum
Rule Format DeltaSupport
edVersion
DataSource
Open Time(OPEN_TIME)
Time the filewas opened(if the valueof the Typefield isAGGREGATE,the time thefirst file wasopened)
-- string(20)
No All V$BACKUP_ASYNC_IO.OPEN_TIME
Ready(READY)
Number ofasynchronous requestsfor whichbuffer wasmade ready
-- double No All V$BACKUP_ASYNC_IO.READY
Record Time(RECORD_TIME)
Collectionterminationtime for theperformancedata storedin the record
-- time_t No All AgentCollector
Record Type(INPUT_RECORD_TYPE)
Record name(alwaysPDBA)
-- string(4)
No All AgentCollector
SID(SID)
Oraclesession ID ofthe sessionthat isexecutingbackup orrestoreprocessing
-- ulong No All V$BACKUP_ASYNC_IO.SID
Set Count(SET_COUNT)
Number ofbackup setsunder reador writeoperation
-- double No All V$BACKUP_ASYNC_IO.SET_COUNT
Set Stamp(SET_STAMP)
Set stamp ofthe backupset underread or writeoperation
-- double No All V$BACKUP_ASYNC_IO.SET_STAMP
Short Waits(SHORT_WAITS)
Number oftimes bufferbecameavailableafter anasynchronou
-- double Yes All V$BACKUP_ASYNC_IO.SHORT_WAITS
2-54 Working with RecordsHitachi Tuning Manager Application Reports Reference

Backup Async IO (PD_PDBA)
View Name(Manager Name) Description Sum
Rule Format DeltaSupport
edVersion
DataSource
s I/Ooperationandunblockedpolling
Start Time(START_TIME)
Collectionstart time fortheperformancedata storedin the record
-- time_t No All AgentCollector
Status(STATUS)
Backup orrestorationstatus. Validvalues areFINISHED, INPROGRESS,and NOTSTARTED.
-- string(12)
No All V$BACKUP_ASYNC_IO.STATUS
Total Long Wait Time(LONG_WAIT_TIME_TOTAL)
Total blockwait time (inseconds)required tocompleteasynchronous I/Ooperations.
-- long Yes All V$BACKUP_ASYNC_IO.LONG_WAIT_TIME_TOTAL / 100
Total Mbytes(TOTAL_MBYTES)
Total numberof bytes inmegabytesread orwritten (ifthe value isunknown,this field isempty)
-- double Yes All V$BACKUP_ASYNC_IO.TOTAL_BYTES /(1024 *1024)
Total Short Wait Time(SHORT_WAIT_TIME_TOTAL)
Totalunblockedpolling time(in seconds)beforeasynchronous I/Ooperationwascompleted
-- double Yes All V$BACKUP_ASYNC_IO.SHORT_WAIT_TIME_TOTAL / 100
Type(TYPE)
Type ofbackup orrestore
-- string(10)
No All V$BACKUP_ASYNC_IO.TYPE
Working with Records 2-55Hitachi Tuning Manager Application Reports Reference
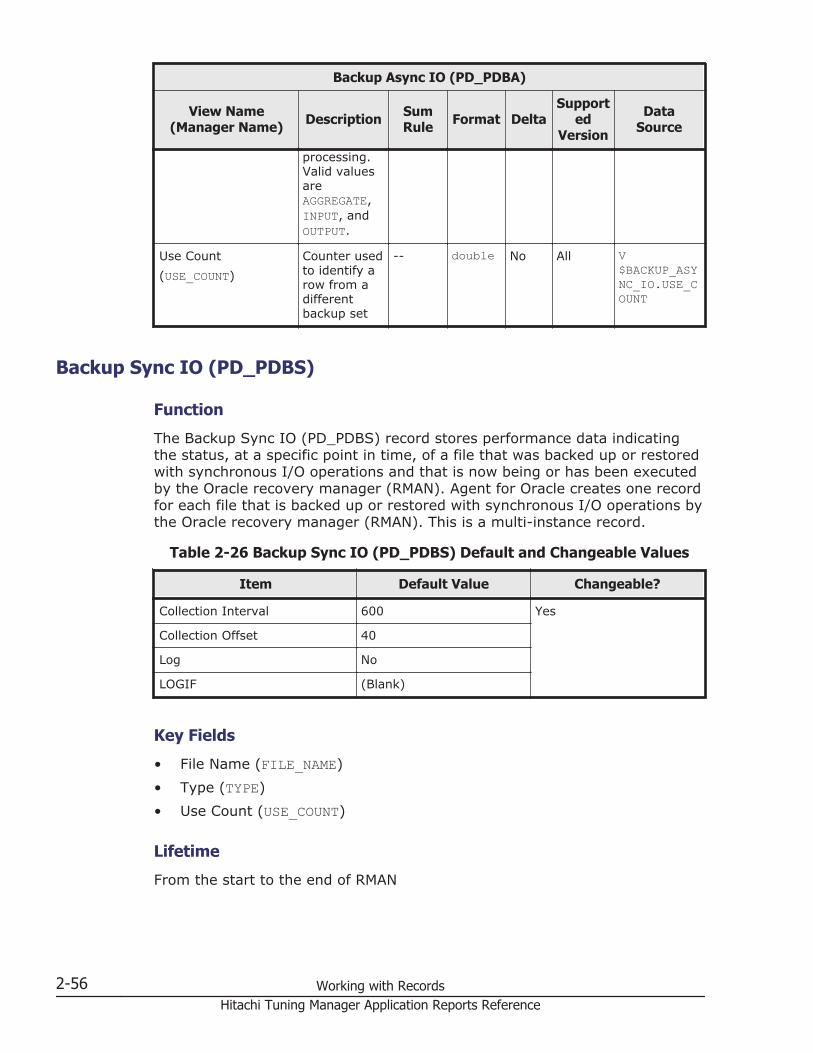
Backup Async IO (PD_PDBA)
View Name(Manager Name) Description Sum
Rule Format DeltaSupport
edVersion
DataSource
processing.Valid valuesareAGGREGATE,INPUT, andOUTPUT.
Use Count(USE_COUNT)
Counter usedto identify arow from adifferentbackup set
-- double No All V$BACKUP_ASYNC_IO.USE_COUNT
Backup Sync IO (PD_PDBS)
Function
The Backup Sync IO (PD_PDBS) record stores performance data indicatingthe status, at a specific point in time, of a file that was backed up or restoredwith synchronous I/O operations and that is now being or has been executedby the Oracle recovery manager (RMAN). Agent for Oracle creates one recordfor each file that is backed up or restored with synchronous I/O operations bythe Oracle recovery manager (RMAN). This is a multi-instance record.
Table 2-26 Backup Sync IO (PD_PDBS) Default and Changeable Values
Item Default Value Changeable?
Collection Interval 600 Yes
Collection Offset 40
Log No
LOGIF (Blank)
Key Fields
• File Name (FILE_NAME)• Type (TYPE)• Use Count (USE_COUNT)
Lifetime
From the start to the end of RMAN
2-56 Working with RecordsHitachi Tuning Manager Application Reports Reference

Record Size
• Fixed part: 678 bytes• Variable part: 718 bytes
Table 2-27 Backup Sync IO (PD_PDBS) Fields
Backup Sync IO (PD_PDBS)
View Name(Manager Name) Description Sum
Rule Format DeltaSupport
edVersion
DataSource
Serial(SERIAL)
Number ofsession IDsbeing usedfor backup orrestoreprocessing
-- double No All V$BACKUP_SYNC_IO.SERIAL
Avg Transfer Rate(DISCRETE_KBYTES_PER_SEC)
Average filetransfer ratein kilobytes
-- double No All V$BACKUP_SYNC_IO.DISCRETE_BYTES_PER_SECOND /1024
Buffer Count(BUFFER_COUNT)
Number ofbuffers usedfor file reador writeoperations
-- double No All V$BACKUP_SYNC_IO.BUFFER_COUNT
Buffer Size(BUFFER_SIZE)
Size of buffer(in kilobytes)used for fileread or writeoperations
-- double No All V$BACKUP_SYNC_IO.BUFFER_SIZE /1024
Close Time(CLOSE_TIME)
Time the filewas closed(if the valueof the Typefield isAGGREGATE,the time thefirst file wasclosed)
-- string(20)
No All V$BACKUP_SYNC_IO.CLOSE_TIME
Device Type(DEVICE_TYPE)
Type ofdevice wherethe file islocated
-- string(17)
No All V$BACKUP_SYNC_IO.DEVICE_TYPE
Effective Rate(EFFECTIVE_KBYTES_PER_SEC)
I/O rate ofthe deviceunderbackupprocessing inkilobytes
-- double No All V$BACKUP_SYNC_IO.EFFECTIVE_BYTES_PER_SECOND /1024
Working with Records 2-57Hitachi Tuning Manager Application Reports Reference
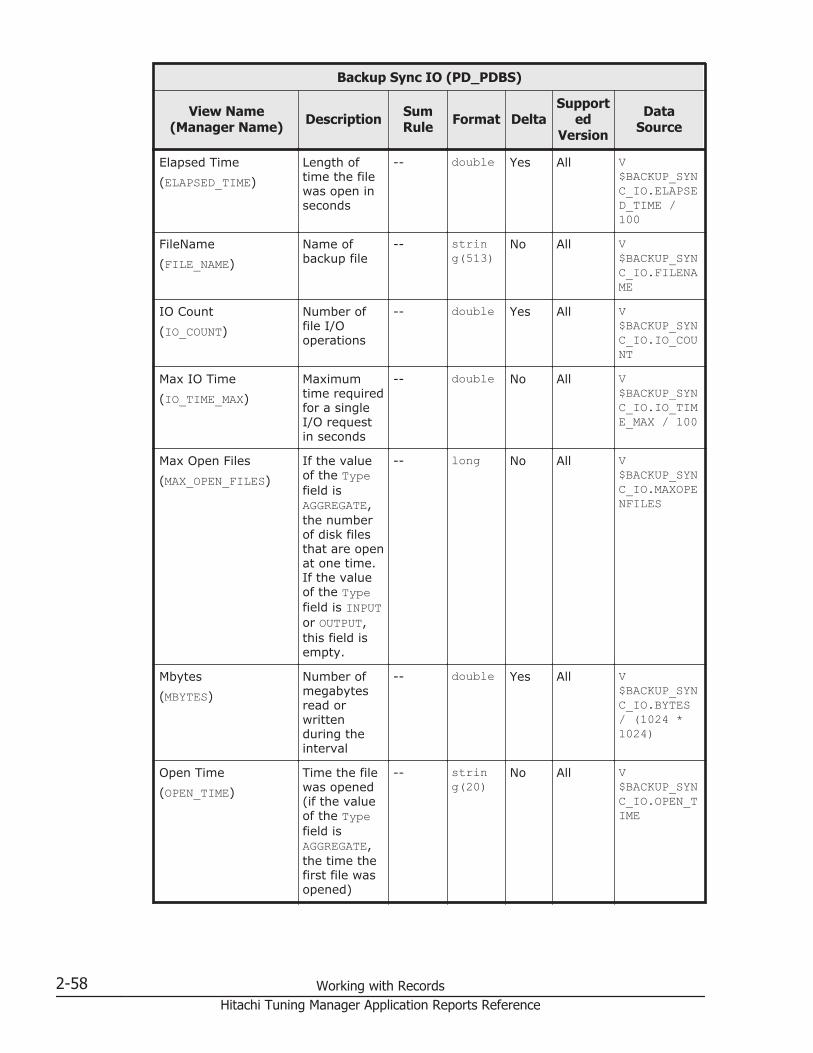
Backup Sync IO (PD_PDBS)
View Name(Manager Name) Description Sum
Rule Format DeltaSupport
edVersion
DataSource
Elapsed Time(ELAPSED_TIME)
Length oftime the filewas open inseconds
-- double Yes All V$BACKUP_SYNC_IO.ELAPSED_TIME /100
FileName(FILE_NAME)
Name ofbackup file
-- string(513)
No All V$BACKUP_SYNC_IO.FILENAME
IO Count(IO_COUNT)
Number offile I/Ooperations
-- double Yes All V$BACKUP_SYNC_IO.IO_COUNT
Max IO Time(IO_TIME_MAX)
Maximumtime requiredfor a singleI/O requestin seconds
-- double No All V$BACKUP_SYNC_IO.IO_TIME_MAX / 100
Max Open Files(MAX_OPEN_FILES)
If the valueof the Typefield isAGGREGATE,the numberof disk filesthat are openat one time.If the valueof the Typefield is INPUTor OUTPUT,this field isempty.
-- long No All V$BACKUP_SYNC_IO.MAXOPENFILES
Mbytes(MBYTES)
Number ofmegabytesread orwrittenduring theinterval
-- double Yes All V$BACKUP_SYNC_IO.BYTES/ (1024 *1024)
Open Time(OPEN_TIME)
Time the filewas opened(if the valueof the Typefield isAGGREGATE,the time thefirst file wasopened)
-- string(20)
No All V$BACKUP_SYNC_IO.OPEN_TIME
2-58 Working with RecordsHitachi Tuning Manager Application Reports Reference

Backup Sync IO (PD_PDBS)
View Name(Manager Name) Description Sum
Rule Format DeltaSupport
edVersion
DataSource
Record Time(RECORD_TIME)
Collectionterminationtime for theperformancedata storedin the record
-- time_t No All AgentCollector
Record Type(INPUT_RECORD_TYPE)
Record name(alwaysPDBS)
-- string(4)
No All AgentCollector
SID(SID)
Oraclesession ID ofthe sessionthat isexecutingbackup orrestoreprocessing
-- ulong No All V$BACKUP_SYNC_IO.SID
Set Count(SET_COUNT)
Number ofbackup setsunder reador writeoperation
-- double No All V$BACKUP_SYNC_IO.SET_COUNT
Set Stamp(SET_STAMP)
Set stamp ofthe backupset underread or writeoperation
-- double No All V$BACKUP_SYNC_IO.SET_STAMP
Start Time(START_TIME)
Collectionstart time fortheperformancedata storedin the record
-- time_t No All AgentCollector
Status(STATUS)
Backup orrestorationstatus. Validvalues areFINISHED, INPROGRESS,and NOTSTARTED.
-- string(12)
No All V$BACKUP_SYNC_IO.STATUS
Total IO Time(IO_TIME_TOTAL)
Total I/Otime on filesin seconds.
-- double Yes All V$BACKUP_SYNC_IO.IO_TIME_TOTAL /100
Working with Records 2-59Hitachi Tuning Manager Application Reports Reference
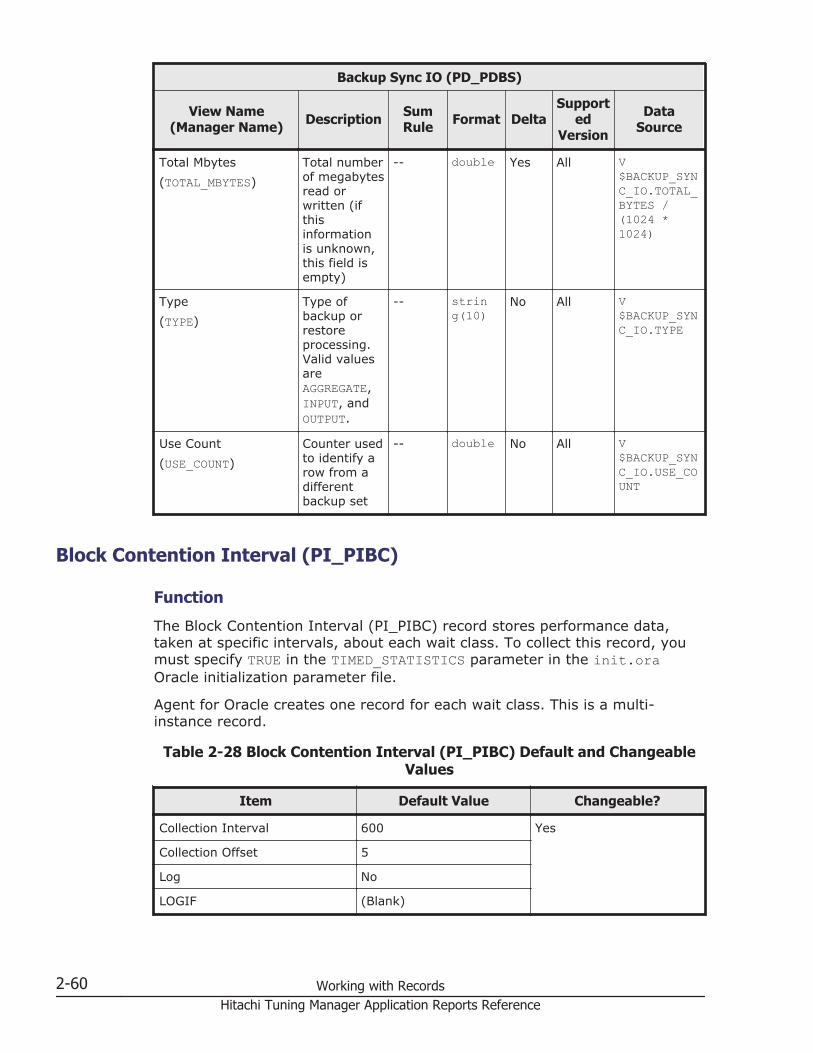
Backup Sync IO (PD_PDBS)
View Name(Manager Name) Description Sum
Rule Format DeltaSupport
edVersion
DataSource
Total Mbytes(TOTAL_MBYTES)
Total numberof megabytesread orwritten (ifthisinformationis unknown,this field isempty)
-- double Yes All V$BACKUP_SYNC_IO.TOTAL_BYTES /(1024 *1024)
Type(TYPE)
Type ofbackup orrestoreprocessing.Valid valuesareAGGREGATE,INPUT, andOUTPUT.
-- string(10)
No All V$BACKUP_SYNC_IO.TYPE
Use Count(USE_COUNT)
Counter usedto identify arow from adifferentbackup set
-- double No All V$BACKUP_SYNC_IO.USE_COUNT
Block Contention Interval (PI_PIBC)
Function
The Block Contention Interval (PI_PIBC) record stores performance data,taken at specific intervals, about each wait class. To collect this record, youmust specify TRUE in the TIMED_STATISTICS parameter in the init.oraOracle initialization parameter file.
Agent for Oracle creates one record for each wait class. This is a multi-instance record.
Table 2-28 Block Contention Interval (PI_PIBC) Default and ChangeableValues
Item Default Value Changeable?
Collection Interval 600 Yes
Collection Offset 5
Log No
LOGIF (Blank)
2-60 Working with RecordsHitachi Tuning Manager Application Reports Reference
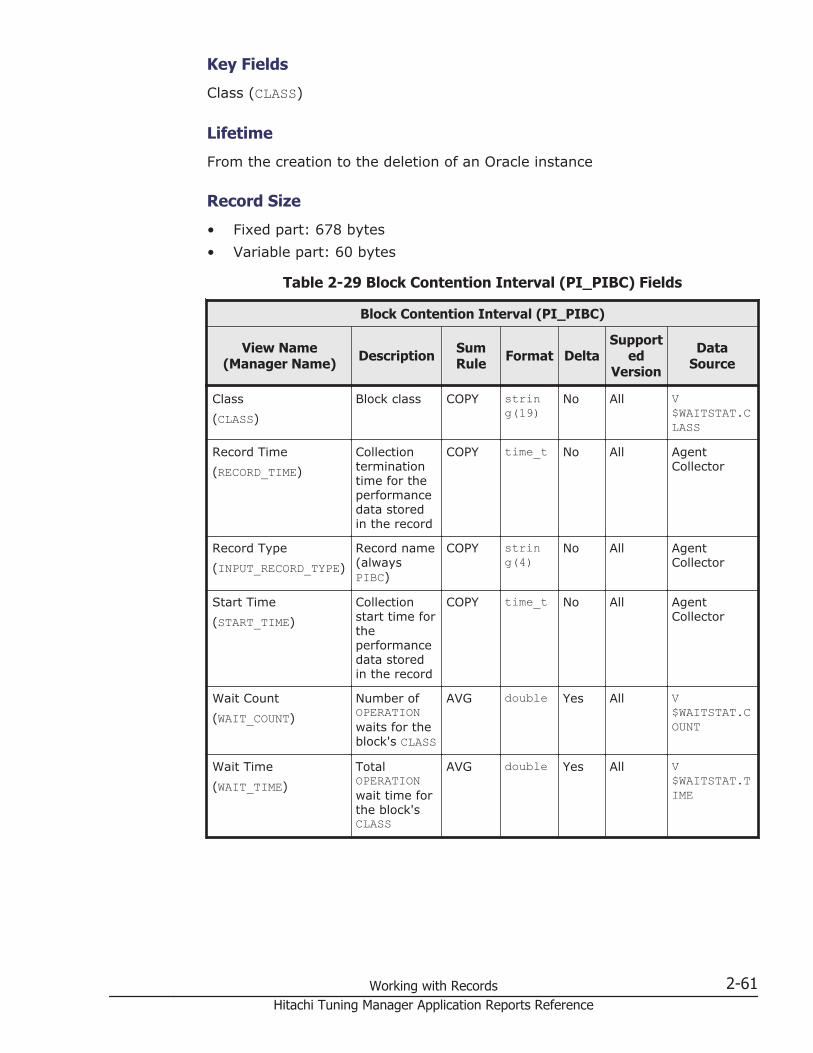
Key Fields
Class (CLASS)
Lifetime
From the creation to the deletion of an Oracle instance
Record Size
• Fixed part: 678 bytes• Variable part: 60 bytes
Table 2-29 Block Contention Interval (PI_PIBC) Fields
Block Contention Interval (PI_PIBC)
View Name(Manager Name) Description Sum
Rule Format DeltaSupport
edVersion
DataSource
Class(CLASS)
Block class COPY string(19)
No All V$WAITSTAT.CLASS
Record Time(RECORD_TIME)
Collectionterminationtime for theperformancedata storedin the record
COPY time_t No All AgentCollector
Record Type(INPUT_RECORD_TYPE)
Record name(alwaysPIBC)
COPY string(4)
No All AgentCollector
Start Time(START_TIME)
Collectionstart time fortheperformancedata storedin the record
COPY time_t No All AgentCollector
Wait Count(WAIT_COUNT)
Number ofOPERATIONwaits for theblock's CLASS
AVG double Yes All V$WAITSTAT.COUNT
Wait Time(WAIT_TIME)
TotalOPERATIONwait time forthe block'sCLASS
AVG double Yes All V$WAITSTAT.TIME
Working with Records 2-61Hitachi Tuning Manager Application Reports Reference
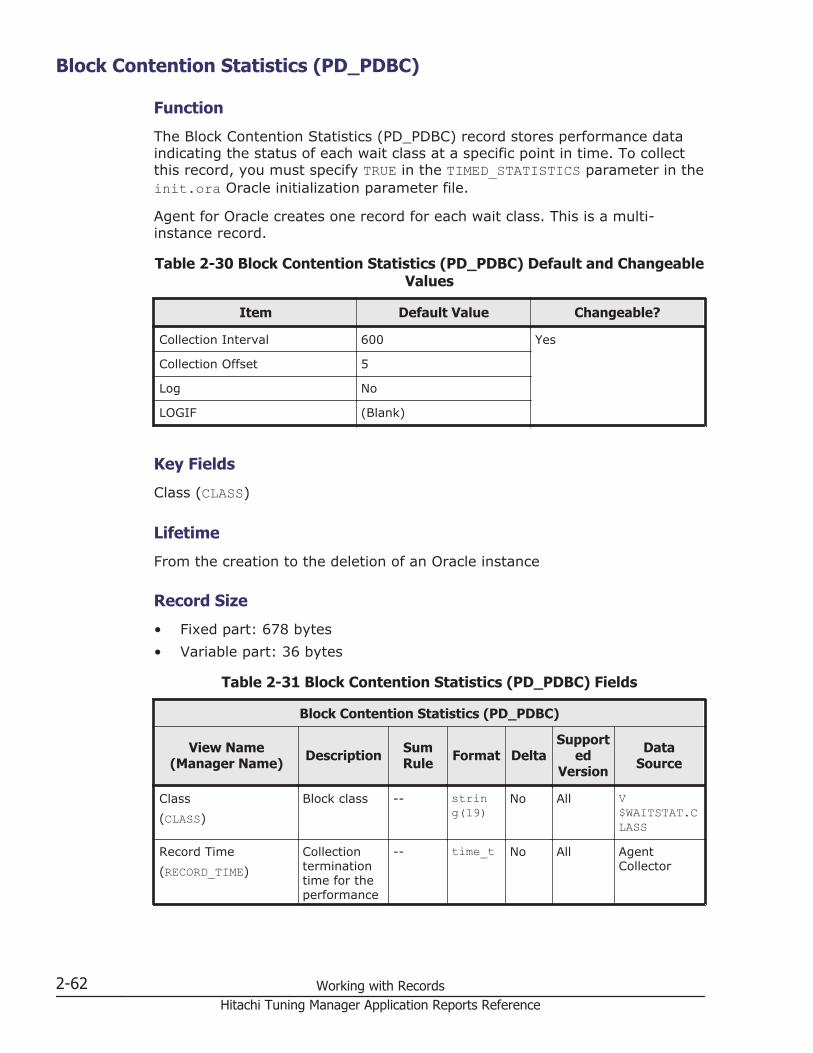
Block Contention Statistics (PD_PDBC)
Function
The Block Contention Statistics (PD_PDBC) record stores performance dataindicating the status of each wait class at a specific point in time. To collectthis record, you must specify TRUE in the TIMED_STATISTICS parameter in theinit.ora Oracle initialization parameter file.
Agent for Oracle creates one record for each wait class. This is a multi-instance record.
Table 2-30 Block Contention Statistics (PD_PDBC) Default and ChangeableValues
Item Default Value Changeable?
Collection Interval 600 Yes
Collection Offset 5
Log No
LOGIF (Blank)
Key Fields
Class (CLASS)
Lifetime
From the creation to the deletion of an Oracle instance
Record Size
• Fixed part: 678 bytes• Variable part: 36 bytes
Table 2-31 Block Contention Statistics (PD_PDBC) Fields
Block Contention Statistics (PD_PDBC)
View Name(Manager Name) Description Sum
Rule Format DeltaSupport
edVersion
DataSource
Class(CLASS)
Block class -- string(19)
No All V$WAITSTAT.CLASS
Record Time(RECORD_TIME)
Collectionterminationtime for theperformance
-- time_t No All AgentCollector
2-62 Working with RecordsHitachi Tuning Manager Application Reports Reference

Block Contention Statistics (PD_PDBC)
View Name(Manager Name) Description Sum
Rule Format DeltaSupport
edVersion
DataSource
data storedin the record
Record Type(INPUT_RECORD_TYPE)
Record name(alwaysPDBC)
-- string(4)
No All AgentCollector
Start Time(START_TIME)
Collectionstart time fortheperformancedata storedin the record
-- time_t No All AgentCollector
Wait Count(WAIT_COUNT)
Number ofOPERATIONwaits for theblock's CLASS
-- double No All V$WAITSTAT.COUNT
Wait Time(WAIT_TIME)
TotalOPERATIONwait time forthe block'sCLASS
-- double No All V$WAITSTAT.TIME
Buffer Pool (PD_PDBP)
Function
The Buffer Pool (PD_PDBP) record stores performance data indicating thestatus of the buffer pool available to instances at a specific point in time.Agent for Oracle creates one record for each buffer pool. This is a multi-instance record.
Table 2-32 Buffer Pool (PD_PDBP) Default and Changeable Values
Item Default Value Changeable?
Collection Interval 600 Yes
Collection Offset 45
Log No
LOGIF (Blank)
Key Fields
ID (ID)
Working with Records 2-63Hitachi Tuning Manager Application Reports Reference

Lifetime
From the start to the stop of an Oracle instance
Record Size
• Fixed part: 678 bytes• Variable part: 177 bytes
Table 2-33 Buffer Pool (PD_PDBP) Fields
Buffer Pool (PD_PDBP)
View Name(Manager Name) Description Sum
Rule Format DeltaSupport
edVersion
DataSource
Buffer Busy Wait(BUFFER_BUSY_WAIT)
Statisticsabout bufferbusy waits
-- double Yes All V$BUFFER_POOL_STATISTICS.BUFFER_BUSY_WAIT
Buffers(BUFFERS)
Number ofbuffers inbuffer pool
-- double No All V$BUFFER_POOL.BUFFERS
Consistent Gets(CONSISTENT_GETS)
Statisticsaboutconsistentgets
-- double Yes All V$BUFFER_POOL_STATISTICS.CONSISTENT_GETS
Db Block Change(DB_BLOCK_CHANGE)
Statisticsaboutchanges todatabaseblocks
-- double Yes All V$BUFFER_POOL_STATISTICS.DB_BLOCK_CHANGE
Db Block Gets(DB_BLOCK_GETS)
Statisticsaboutcollecteddatabaseblocks
-- double Yes All V$BUFFER_POOL_STATISTICS.DB_BLOCK_GETS
Dirty BuffersInspected(DIRTY_BUFFERS_INSPECTED)
Informationabout dirtybuffers
-- double Yes All V$BUFFER_POOL_STATISTICS.DIRTY_BUFFERS_INSPECTED
Free Buffer Inspected(FREE_BUFFER_INSPECTED)
Informationabout freebuffers
-- double Yes All V$BUFFER_POOL_STATISTICS.FREE_BUFFER_INSPECTED
2-64 Working with RecordsHitachi Tuning Manager Application Reports Reference
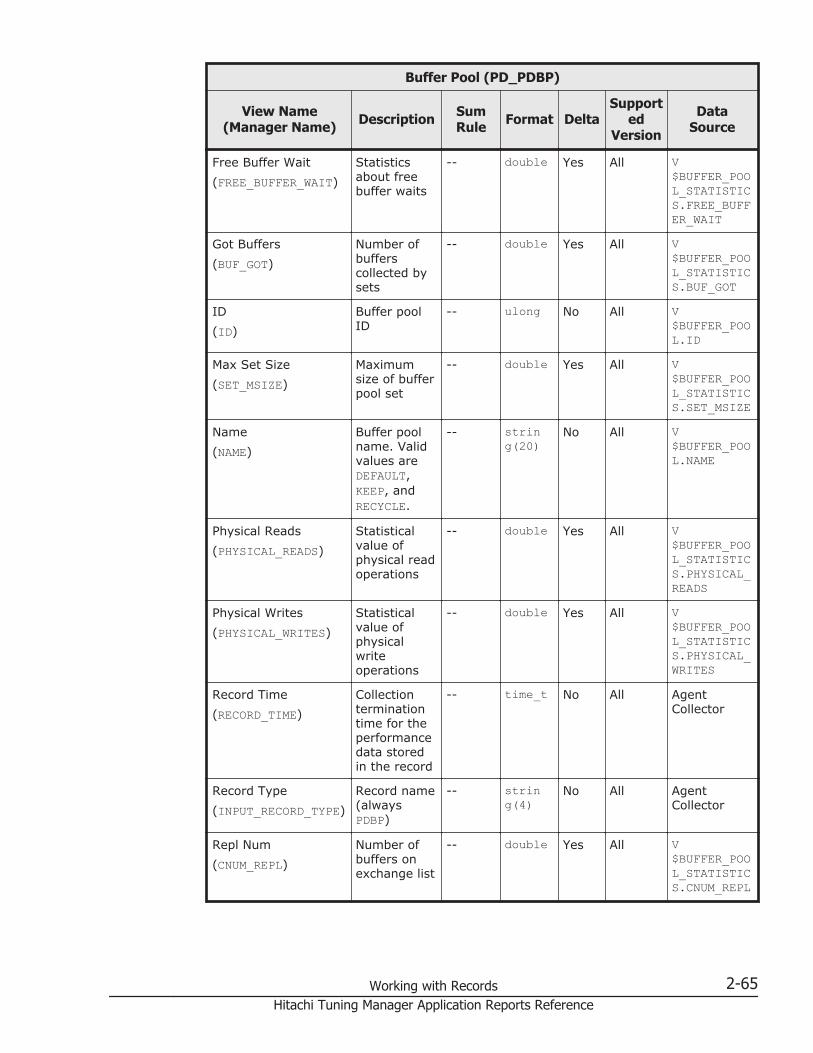
Buffer Pool (PD_PDBP)
View Name(Manager Name) Description Sum
Rule Format DeltaSupport
edVersion
DataSource
Free Buffer Wait(FREE_BUFFER_WAIT)
Statisticsabout freebuffer waits
-- double Yes All V$BUFFER_POOL_STATISTICS.FREE_BUFFER_WAIT
Got Buffers(BUF_GOT)
Number ofbufferscollected bysets
-- double Yes All V$BUFFER_POOL_STATISTICS.BUF_GOT
ID(ID)
Buffer poolID
-- ulong No All V$BUFFER_POOL.ID
Max Set Size(SET_MSIZE)
Maximumsize of bufferpool set
-- double Yes All V$BUFFER_POOL_STATISTICS.SET_MSIZE
Name(NAME)
Buffer poolname. Validvalues areDEFAULT,KEEP, andRECYCLE.
-- string(20)
No All V$BUFFER_POOL.NAME
Physical Reads(PHYSICAL_READS)
Statisticalvalue ofphysical readoperations
-- double Yes All V$BUFFER_POOL_STATISTICS.PHYSICAL_READS
Physical Writes(PHYSICAL_WRITES)
Statisticalvalue ofphysicalwriteoperations
-- double Yes All V$BUFFER_POOL_STATISTICS.PHYSICAL_WRITES
Record Time(RECORD_TIME)
Collectionterminationtime for theperformancedata storedin the record
-- time_t No All AgentCollector
Record Type(INPUT_RECORD_TYPE)
Record name(alwaysPDBP)
-- string(4)
No All AgentCollector
Repl Num(CNUM_REPL)
Number ofbuffers onexchange list
-- double Yes All V$BUFFER_POOL_STATISTICS.CNUM_REPL
Working with Records 2-65Hitachi Tuning Manager Application Reports Reference
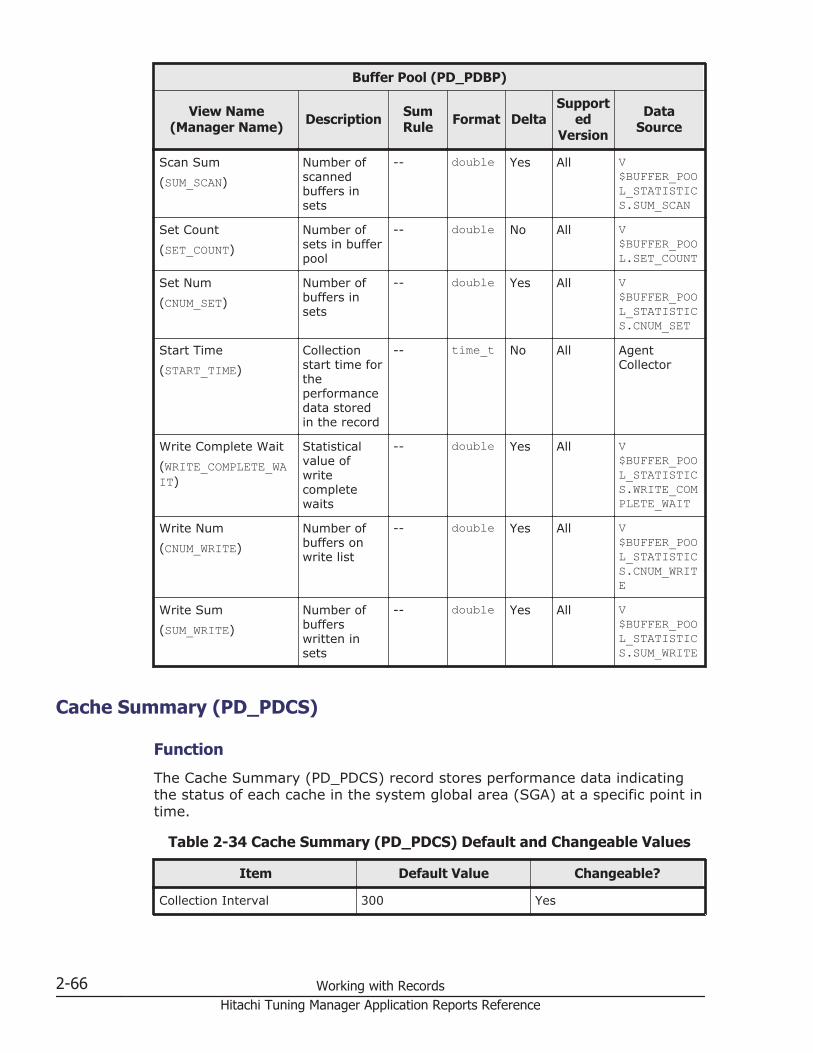
Buffer Pool (PD_PDBP)
View Name(Manager Name) Description Sum
Rule Format DeltaSupport
edVersion
DataSource
Scan Sum(SUM_SCAN)
Number ofscannedbuffers insets
-- double Yes All V$BUFFER_POOL_STATISTICS.SUM_SCAN
Set Count(SET_COUNT)
Number ofsets in bufferpool
-- double No All V$BUFFER_POOL.SET_COUNT
Set Num(CNUM_SET)
Number ofbuffers insets
-- double Yes All V$BUFFER_POOL_STATISTICS.CNUM_SET
Start Time(START_TIME)
Collectionstart time fortheperformancedata storedin the record
-- time_t No All AgentCollector
Write Complete Wait(WRITE_COMPLETE_WAIT)
Statisticalvalue ofwritecompletewaits
-- double Yes All V$BUFFER_POOL_STATISTICS.WRITE_COMPLETE_WAIT
Write Num(CNUM_WRITE)
Number ofbuffers onwrite list
-- double Yes All V$BUFFER_POOL_STATISTICS.CNUM_WRITE
Write Sum(SUM_WRITE)
Number ofbufferswritten insets
-- double Yes All V$BUFFER_POOL_STATISTICS.SUM_WRITE
Cache Summary (PD_PDCS)
Function
The Cache Summary (PD_PDCS) record stores performance data indicatingthe status of each cache in the system global area (SGA) at a specific point intime.
Table 2-34 Cache Summary (PD_PDCS) Default and Changeable Values
Item Default Value Changeable?
Collection Interval 300 Yes
2-66 Working with RecordsHitachi Tuning Manager Application Reports Reference
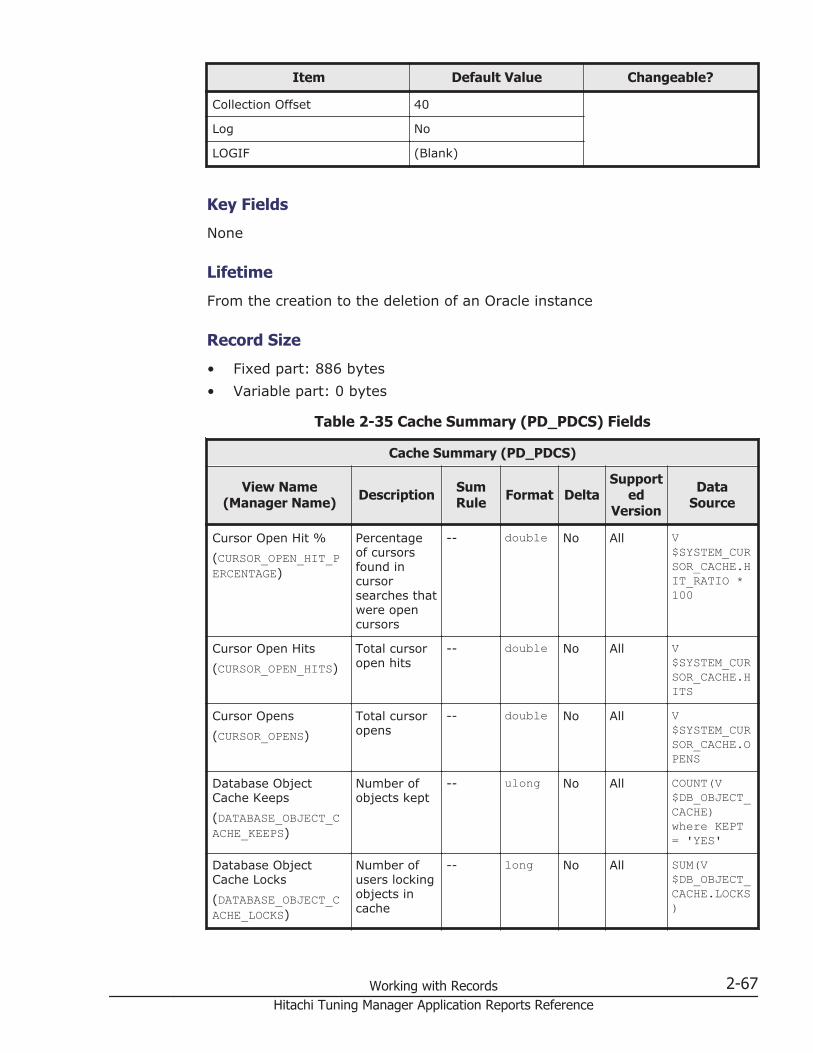
Item Default Value Changeable?
Collection Offset 40
Log No
LOGIF (Blank)
Key Fields
None
Lifetime
From the creation to the deletion of an Oracle instance
Record Size
• Fixed part: 886 bytes• Variable part: 0 bytes
Table 2-35 Cache Summary (PD_PDCS) Fields
Cache Summary (PD_PDCS)
View Name(Manager Name) Description Sum
Rule Format DeltaSupport
edVersion
DataSource
Cursor Open Hit %(CURSOR_OPEN_HIT_PERCENTAGE)
Percentageof cursorsfound incursorsearches thatwere opencursors
-- double No All V$SYSTEM_CURSOR_CACHE.HIT_RATIO *100
Cursor Open Hits(CURSOR_OPEN_HITS)
Total cursoropen hits
-- double No All V$SYSTEM_CURSOR_CACHE.HITS
Cursor Opens(CURSOR_OPENS)
Total cursoropens
-- double No All V$SYSTEM_CURSOR_CACHE.OPENS
Database ObjectCache Keeps(DATABASE_OBJECT_CACHE_KEEPS)
Number ofobjects kept
-- ulong No All COUNT(V$DB_OBJECT_CACHE)where KEPT= 'YES'
Database ObjectCache Locks(DATABASE_OBJECT_CACHE_LOCKS)
Number ofusers lockingobjects incache
-- long No All SUM(V$DB_OBJECT_CACHE.LOCKS)
Working with Records 2-67Hitachi Tuning Manager Application Reports Reference

Cache Summary (PD_PDCS)
View Name(Manager Name) Description Sum
Rule Format DeltaSupport
edVersion
DataSource
Database ObjectCache Pins(DATABASE_OBJECT_CACHE_PINS)
Number ofusers whohaveacquiredobjects incache
-- long No All SUM(V$DB_OBJECT_CACHE.PINS)
Dict Cache Fixed(DICTIONARY_CACHE_FIXED)
Number ofentries fixedin cache
-- double No All SUM(V$ROWCACHE.FIXED)
Dict Cache Flushes(DICTIONARY_CACHE_FLUSHES)
Number ofdisk flushes
-- double No All SUM(V$ROWCACHE.FLUSHES)
Dict Cache Get Miss%(DICTIONARY_CACHE_GET_MISSES_PERCENTAGE)
Percentageof datarequests forwhich acache missoccurred
-- double No All (SUM(V$ROWCACHE.GETMISSES) /SUM(V$ROWCACHE.GETS)) * 100
Dict Cache Get Misses(DICTIONARY_CACHE_GET_MISSES)
Number ofdatarequests forwhich acache missoccurred
-- double No All SUM(V$ROWCACHE.GETMISSES)
Dict Cache Gets(DICTIONARY_CACHE_GETS)
Number ofrequests forinformationabout dataobjects
-- double No All SUM(V$ROWCACHE.GETS)
Dict CacheModifications(DICTIONARY_CACHE_MODIFICATIONS)
Number ofinsert,update, anddeleteoperations
-- double No All SUM(V$ROWCACHE.MODIFICATIONS)
Dict Cache ScanCompletes(DICTIONARY_CACHE_SCAN_COMPLETES)
Number oftimesscanning of alist ofdependententries wascompleted
-- double No All SUM(V$ROWCACHE.SCANCOMPLETES)
Dict Cache ScanMisses(DICTIONARY_CACHE_SCAN_MISSES)
Number oftimes datawas notfound in
-- double No All SUM(V$ROWCACHE.SCANMISSES)
2-68 Working with RecordsHitachi Tuning Manager Application Reports Reference
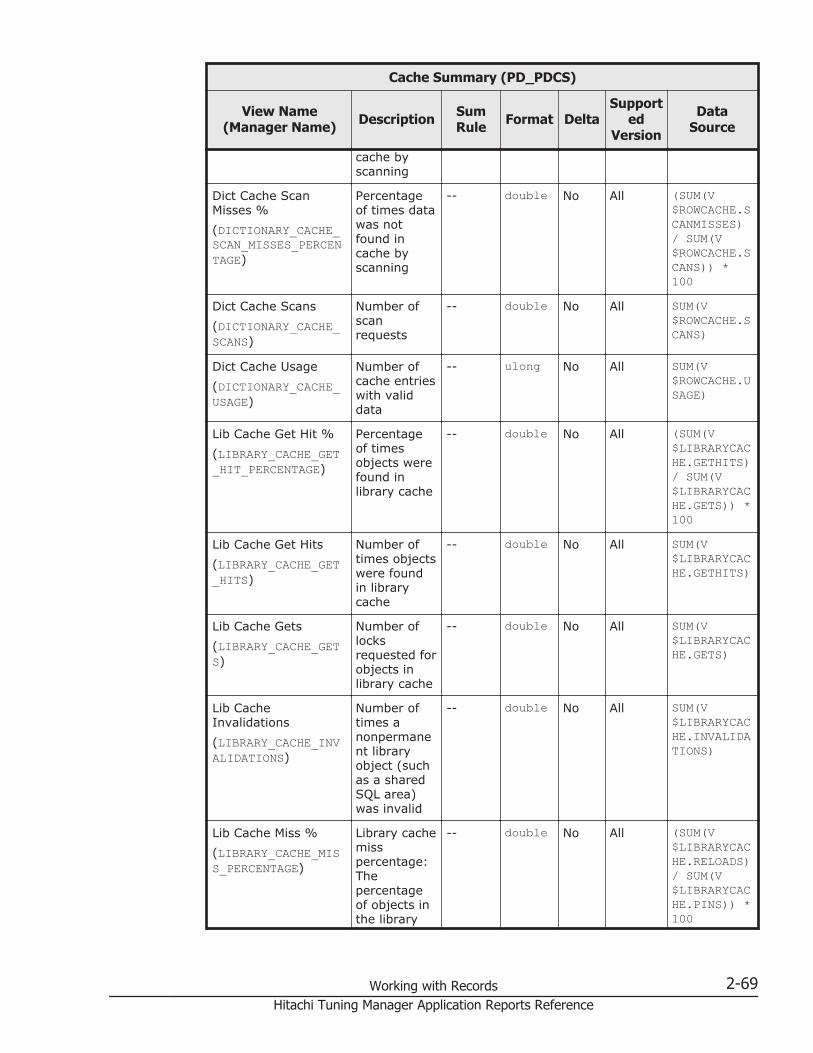
Cache Summary (PD_PDCS)
View Name(Manager Name) Description Sum
Rule Format DeltaSupport
edVersion
DataSource
cache byscanning
Dict Cache ScanMisses %(DICTIONARY_CACHE_SCAN_MISSES_PERCENTAGE)
Percentageof times datawas notfound incache byscanning
-- double No All (SUM(V$ROWCACHE.SCANMISSES)/ SUM(V$ROWCACHE.SCANS)) *100
Dict Cache Scans(DICTIONARY_CACHE_SCANS)
Number ofscanrequests
-- double No All SUM(V$ROWCACHE.SCANS)
Dict Cache Usage(DICTIONARY_CACHE_USAGE)
Number ofcache entrieswith validdata
-- ulong No All SUM(V$ROWCACHE.USAGE)
Lib Cache Get Hit %(LIBRARY_CACHE_GET_HIT_PERCENTAGE)
Percentageof timesobjects werefound inlibrary cache
-- double No All (SUM(V$LIBRARYCACHE.GETHITS)/ SUM(V$LIBRARYCACHE.GETS)) *100
Lib Cache Get Hits(LIBRARY_CACHE_GET_HITS)
Number oftimes objectswere foundin librarycache
-- double No All SUM(V$LIBRARYCACHE.GETHITS)
Lib Cache Gets(LIBRARY_CACHE_GETS)
Number oflocksrequested forobjects inlibrary cache
-- double No All SUM(V$LIBRARYCACHE.GETS)
Lib CacheInvalidations(LIBRARY_CACHE_INVALIDATIONS)
Number oftimes anonpermanent libraryobject (suchas a sharedSQL area)was invalid
-- double No All SUM(V$LIBRARYCACHE.INVALIDATIONS)
Lib Cache Miss %(LIBRARY_CACHE_MISS_PERCENTAGE)
Library cachemisspercentage:Thepercentageof objects inthe library
-- double No All (SUM(V$LIBRARYCACHE.RELOADS)/ SUM(V$LIBRARYCACHE.PINS)) *100
Working with Records 2-69Hitachi Tuning Manager Application Reports Reference
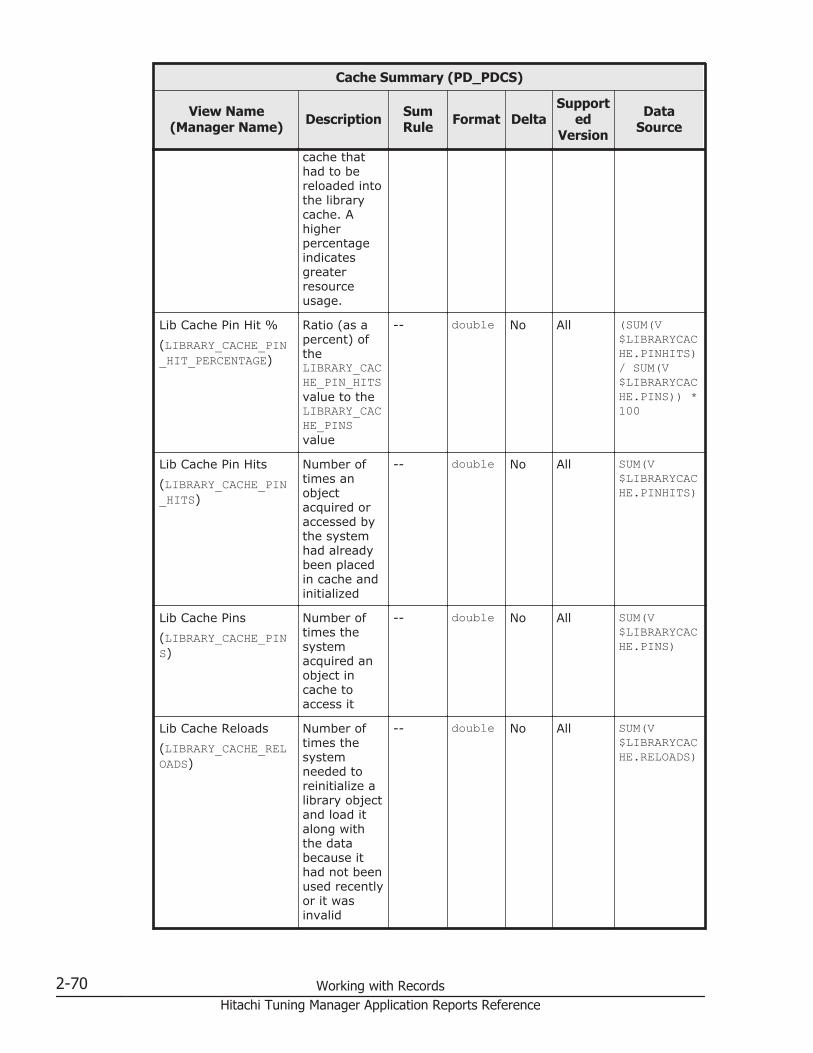
Cache Summary (PD_PDCS)
View Name(Manager Name) Description Sum
Rule Format DeltaSupport
edVersion
DataSource
cache thathad to bereloaded intothe librarycache. Ahigherpercentageindicatesgreaterresourceusage.
Lib Cache Pin Hit %(LIBRARY_CACHE_PIN_HIT_PERCENTAGE)
Ratio (as apercent) oftheLIBRARY_CACHE_PIN_HITSvalue to theLIBRARY_CACHE_PINSvalue
-- double No All (SUM(V$LIBRARYCACHE.PINHITS)/ SUM(V$LIBRARYCACHE.PINS)) *100
Lib Cache Pin Hits(LIBRARY_CACHE_PIN_HITS)
Number oftimes anobjectacquired oraccessed bythe systemhad alreadybeen placedin cache andinitialized
-- double No All SUM(V$LIBRARYCACHE.PINHITS)
Lib Cache Pins(LIBRARY_CACHE_PINS)
Number oftimes thesystemacquired anobject incache toaccess it
-- double No All SUM(V$LIBRARYCACHE.PINS)
Lib Cache Reloads(LIBRARY_CACHE_RELOADS)
Number oftimes thesystemneeded toreinitialize alibrary objectand load italong withthe databecause ithad not beenused recentlyor it wasinvalid
-- double No All SUM(V$LIBRARYCACHE.RELOADS)
2-70 Working with RecordsHitachi Tuning Manager Application Reports Reference
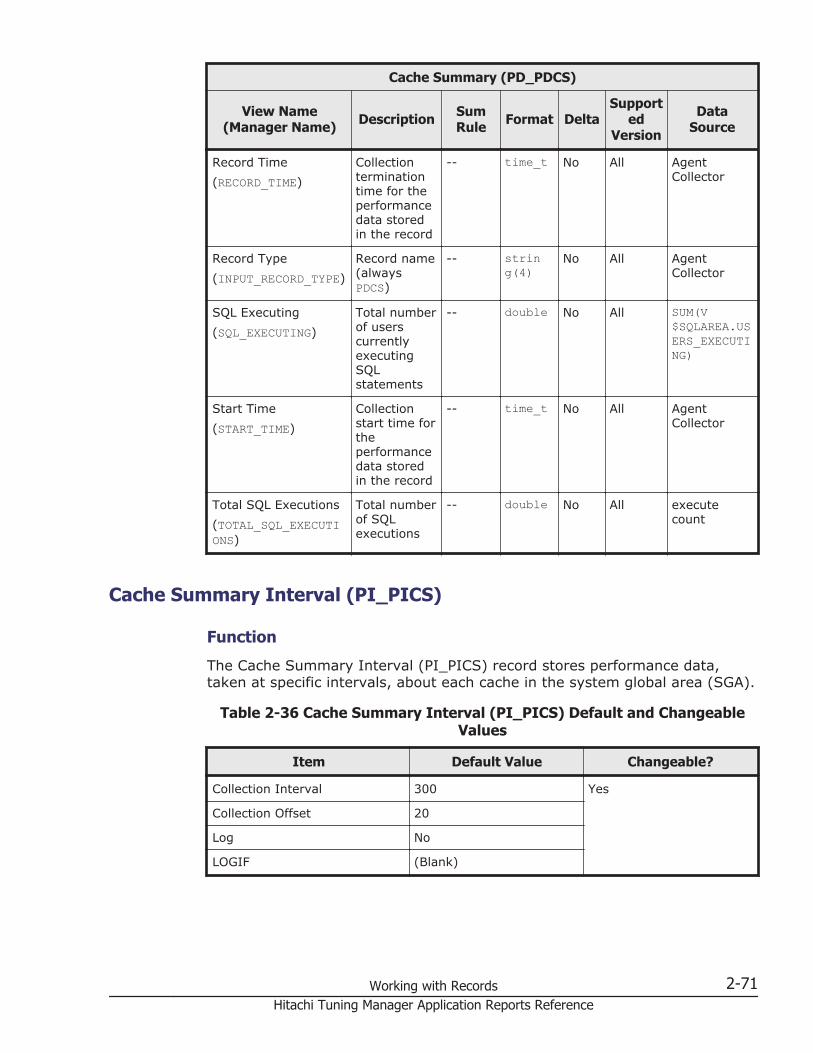
Cache Summary (PD_PDCS)
View Name(Manager Name) Description Sum
Rule Format DeltaSupport
edVersion
DataSource
Record Time(RECORD_TIME)
Collectionterminationtime for theperformancedata storedin the record
-- time_t No All AgentCollector
Record Type(INPUT_RECORD_TYPE)
Record name(alwaysPDCS)
-- string(4)
No All AgentCollector
SQL Executing(SQL_EXECUTING)
Total numberof userscurrentlyexecutingSQLstatements
-- double No All SUM(V$SQLAREA.USERS_EXECUTING)
Start Time(START_TIME)
Collectionstart time fortheperformancedata storedin the record
-- time_t No All AgentCollector
Total SQL Executions(TOTAL_SQL_EXECUTIONS)
Total numberof SQLexecutions
-- double No All executecount
Cache Summary Interval (PI_PICS)
Function
The Cache Summary Interval (PI_PICS) record stores performance data,taken at specific intervals, about each cache in the system global area (SGA).
Table 2-36 Cache Summary Interval (PI_PICS) Default and ChangeableValues
Item Default Value Changeable?
Collection Interval 300 Yes
Collection Offset 20
Log No
LOGIF (Blank)
Working with Records 2-71Hitachi Tuning Manager Application Reports Reference
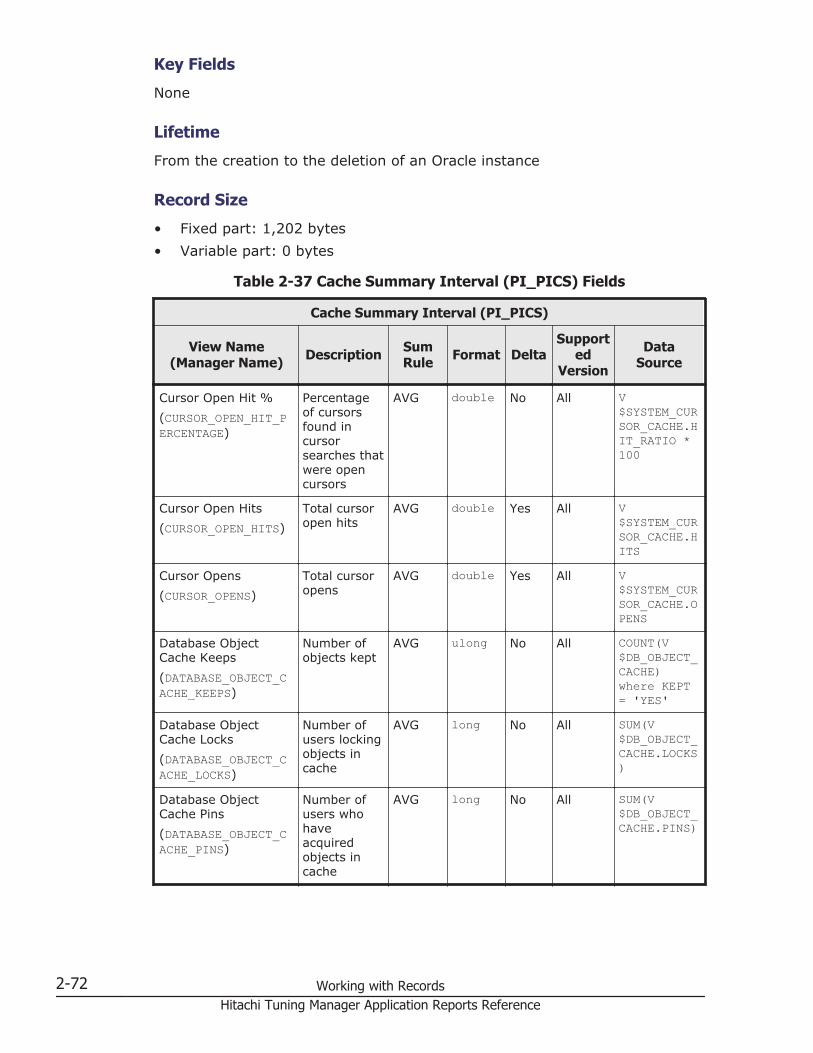
Key Fields
None
Lifetime
From the creation to the deletion of an Oracle instance
Record Size
• Fixed part: 1,202 bytes• Variable part: 0 bytes
Table 2-37 Cache Summary Interval (PI_PICS) Fields
Cache Summary Interval (PI_PICS)
View Name(Manager Name) Description Sum
Rule Format DeltaSupport
edVersion
DataSource
Cursor Open Hit %(CURSOR_OPEN_HIT_PERCENTAGE)
Percentageof cursorsfound incursorsearches thatwere opencursors
AVG double No All V$SYSTEM_CURSOR_CACHE.HIT_RATIO *100
Cursor Open Hits(CURSOR_OPEN_HITS)
Total cursoropen hits
AVG double Yes All V$SYSTEM_CURSOR_CACHE.HITS
Cursor Opens(CURSOR_OPENS)
Total cursoropens
AVG double Yes All V$SYSTEM_CURSOR_CACHE.OPENS
Database ObjectCache Keeps(DATABASE_OBJECT_CACHE_KEEPS)
Number ofobjects kept
AVG ulong No All COUNT(V$DB_OBJECT_CACHE)where KEPT= 'YES'
Database ObjectCache Locks(DATABASE_OBJECT_CACHE_LOCKS)
Number ofusers lockingobjects incache
AVG long No All SUM(V$DB_OBJECT_CACHE.LOCKS)
Database ObjectCache Pins(DATABASE_OBJECT_CACHE_PINS)
Number ofusers whohaveacquiredobjects incache
AVG long No All SUM(V$DB_OBJECT_CACHE.PINS)
2-72 Working with RecordsHitachi Tuning Manager Application Reports Reference

Cache Summary Interval (PI_PICS)
View Name(Manager Name) Description Sum
Rule Format DeltaSupport
edVersion
DataSource
Dict Cache Fixed(DICTIONARY_CACHE_FIXED)
Number ofentries fixedin cache
AVG double Yes All SUM(V$ROWCACHE.FIXED)
Dict Cache Flushes(DICTIONARY_CACHE_FLUSHES)
Number ofdisk flushes
AVG double Yes All SUM(V$ROWCACHE.FLUSHES)
Dict Cache Get Misses(DICTIONARY_CACHE_GET_MISSES)
Number ofdatarequests forwhich acache missoccurred
AVG double Yes All SUM(V$ROWCACHE.GETMISSES)
Dict Cache Get Misses%(DICTIONARY_CACHE_GET_MISSES_PERCENTAGE)
Percentageof datarequests forwhich acache missoccurred
AVG double No All (SUM(V$ROWCACHE.GETMISSES) /SUM(V$ROWCACHE.GETS)) * 100
Dict Cache Gets(DICTIONARY_CACHE_GETS)
Number ofrequests forinformationabout dataobjects
AVG double Yes All SUM(V$ROWCACHE.GETS)
Dict CacheModifications(DICTIONARY_CACHE_MODIFICATIONS)
Number ofinsert,update, anddeleteoperations
AVG double Yes All SUM(V$ROWCACHE.MODIFICATIONS)
Dict Cache ScanCompletes(DICTIONARY_CACHE_SCAN_COMPLETES)
Number oftimesscanning of alist ofdependententries wascompleted
AVG double Yes All SUM(V$ROWCACHE.SCANCOMPLETES)
Dict Cache Scan Miss%(DICTIONARY_CACHE_SCAN_MISSES_PERCENTAGE)
Percentageof times datawas notfound incache byscanning
AVG double No All (SUM(V$ROWCACHE.SCANMISSES)/ SUM(V$ROWCACHE.SCANS)) *100
Dict Cache ScanMisses(DICTIONARY_CACHE_SCAN_MISSES)
Number oftimes datawas notfound in
AVG double Yes All SUM(V$ROWCACHE.SCANMISSES)
Working with Records 2-73Hitachi Tuning Manager Application Reports Reference

Cache Summary Interval (PI_PICS)
View Name(Manager Name) Description Sum
Rule Format DeltaSupport
edVersion
DataSource
cache byscanning
Dict Cache Scans(DICTIONARY_CACHE_SCANS)
Number ofscanrequests
AVG double Yes All SUM(V$ROWCACHE.SCANS)
Dict Cache Usage(DICTIONARY_CACHE_USAGE)
Number ofcache entrieswith validdata
AVG double Yes All SUM(V$ROWCACHE.USAGE)
Lib Cache Get Hit %(LIBRARY_CACHE_GET_HIT_PERCENTAGE)
Percentageof timesobjects werefound inlibrary cache
AVG double No All (SUM(V$LIBRARYCACHE.GETHITS)/ SUM(V$LIBRARYCACHE.GETS)) *100
Lib Cache Get Hits(LIBRARY_CACHE_GET_HITS)
Number oftimes objectswere foundin librarycache
AVG double Yes All SUM(V$LIBRARYCACHE.GETHITS)
Lib Cache Gets(LIBRARY_CACHE_GETS)
Number oflocksrequested forobjects inlibrary cache
AVG double Yes All SUM(V$LIBRARYCACHE.GETS)
Lib CacheInvalidations(LIBRARY_CACHE_INVALIDATIONS)
Number oftimes anonpermanent libraryobject (suchas a sharedSQL area)was invalid
AVG double Yes All SUM(V$LIBRARYCACHE.INVALIDATIONS)
Lib Cache Miss %(LIBRARY_CACHE_MISS_PERCENTAGE)
Library cachemisspercentage:Thepercentageof objects inthe librarycache thathad to bereloaded intothe librarycache. Ahigher
AVG double No All (SUM(V$LIBRARYCACHE.RELOADS)/ SUM(V$LIBRARYCACHE.PINS)) *100
2-74 Working with RecordsHitachi Tuning Manager Application Reports Reference

Cache Summary Interval (PI_PICS)
View Name(Manager Name) Description Sum
Rule Format DeltaSupport
edVersion
DataSource
percentageindicatesgreaterresourceusage.
Lib Cache Pin Hit %(LIBRARY_CACHE_PIN_HIT_PERCENTAGE)
Ratio (as apercent) oftheLIBRARY_CACHE_PIN_HITSvalue to theLIBRARY_CACHE_PINSvalue
AVG double No All (SUM(V$LIBRARYCACHE.PINHITS)/ SUM(V$LIBRARYCACHE.PINS)) *100
Lib Cache Pin Hits(LIBRARY_CACHE_PIN_HITS)
Number oftimes anobjectacquired oraccessed bythe systemhad alreadybeen placedin cache andinitialized
AVG double Yes All SUM(V$LIBRARYCACHE.PINHITS)
Lib Cache Pins(LIBRARY_CACHE_PINS)
Number oftimes thesystemacquired anobject incache toaccess it
AVG double Yes All SUM(V$LIBRARYCACHE.PINS)
Lib Cache Reloads(LIBRARY_CACHE_RELOADS)
Number oftimes thesystemneeded toreinitialize alibrary objectand load italong withthe databecause ithad not beenused recentlyor it wasinvalid
AVG double Yes All SUM(V$LIBRARYCACHE.RELOADS)
Record Time(RECORD_TIME)
Collectionterminationtime for theperformance
COPY time_t No All AgentCollector
Working with Records 2-75Hitachi Tuning Manager Application Reports Reference
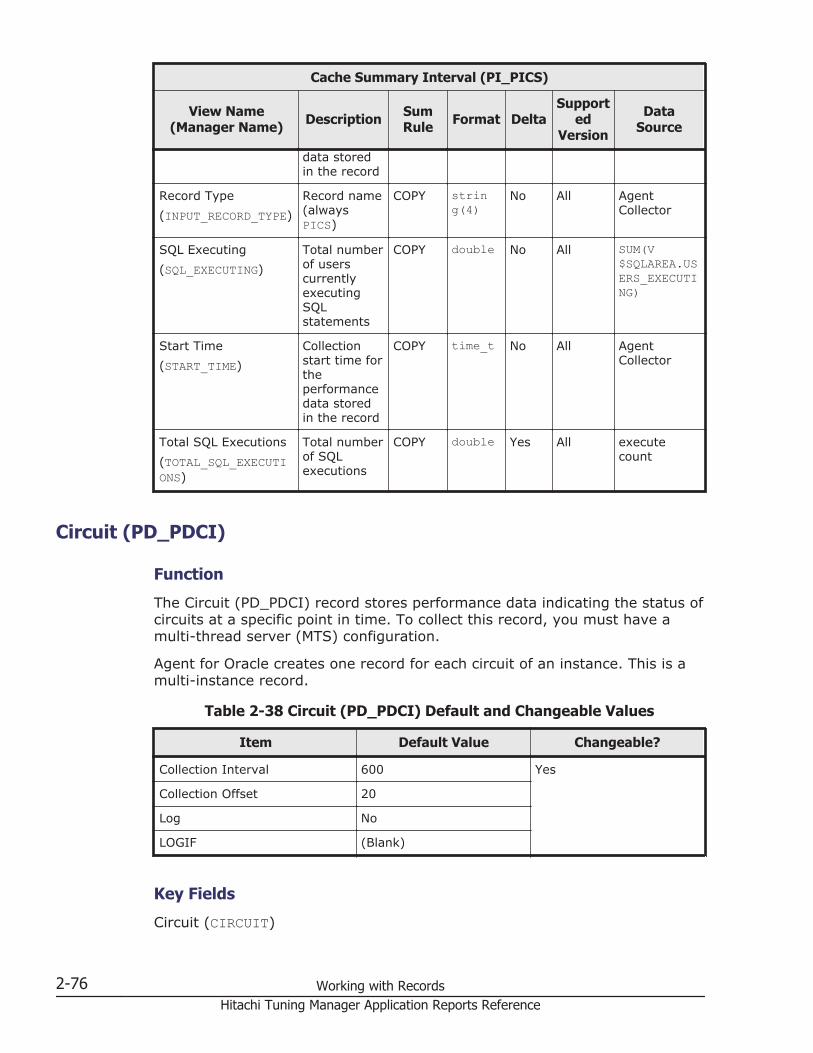
Cache Summary Interval (PI_PICS)
View Name(Manager Name) Description Sum
Rule Format DeltaSupport
edVersion
DataSource
data storedin the record
Record Type(INPUT_RECORD_TYPE)
Record name(alwaysPICS)
COPY string(4)
No All AgentCollector
SQL Executing(SQL_EXECUTING)
Total numberof userscurrentlyexecutingSQLstatements
COPY double No All SUM(V$SQLAREA.USERS_EXECUTING)
Start Time(START_TIME)
Collectionstart time fortheperformancedata storedin the record
COPY time_t No All AgentCollector
Total SQL Executions(TOTAL_SQL_EXECUTIONS)
Total numberof SQLexecutions
COPY double Yes All executecount
Circuit (PD_PDCI)
Function
The Circuit (PD_PDCI) record stores performance data indicating the status ofcircuits at a specific point in time. To collect this record, you must have amulti-thread server (MTS) configuration.
Agent for Oracle creates one record for each circuit of an instance. This is amulti-instance record.
Table 2-38 Circuit (PD_PDCI) Default and Changeable Values
Item Default Value Changeable?
Collection Interval 600 Yes
Collection Offset 20
Log No
LOGIF (Blank)
Key Fields
Circuit (CIRCUIT)
2-76 Working with RecordsHitachi Tuning Manager Application Reports Reference

Lifetime
From the start to the stop of an Oracle instance
Record Size
• Fixed part: 678 bytes• Variable part: 138 bytes
Table 2-39 Circuit (PD_PDCI) Fields
Circuit (PD_PDCI)
View Name(Manager Name) Description Sum
Rule Format DeltaSupport
edVersion
DataSource
Breaks(BREAKS)
Number ofcircuit breaks(pauses)
-- double No All V$CIRCUIT.BREAKS
Bytes(BYTES)
Number ofbytes thatpassedthrough thecircuit
-- double No All V$CIRCUIT.BYTES
Circuit(CIRCUIT)
Circuitaddress
-- string(16)
No All V$CIRCUIT.CIRCUIT
Circuit Server(SERVER)
Correctvaluescannot becollected forthis field.Currentserver'sprocessaddress
-- ulong No All V$CIRCUIT.SERVER
Dispatcher(DISPATCHER)
Correctvaluescannot becollected forthis field.Currentdispatcher'sprocessaddress
-- ulong No All V$CIRCUIT.DISPATCHER
Message0(MESSAGE0)
Size ofmessage inthe firstmessagebuffer inbytes
-- double No All V$CIRCUIT.MESSAGE0
Working with Records 2-77Hitachi Tuning Manager Application Reports Reference

Circuit (PD_PDCI)
View Name(Manager Name) Description Sum
Rule Format DeltaSupport
edVersion
DataSource
Message1(MESSAGE1)
Size ofmessage inthe secondmessagebuffer inbytes
-- double No All V$CIRCUIT.MESSAGE1
Messages(MESSAGES)
Number ofmessagesthat passedthrough thecircuit
-- double No All V$CIRCUIT.MESSAGES
Queue(QUEUE)
Currentqueue withcircuit. Thisfield containsone of thefollowingvalues:COMMON:Waiting forserverprocess incommonqueueDISPATCHER:Waiting fordispatcherSERVER:BeingprocessedOUTBOUND:Waiting foroutboundconnectionNONE: Idlecircuit
-- string(16)
No All V$CIRCUIT.QUEUE
Record Time(RECORD_TIME)
Collectionterminationtime for theperformancedata storedin the record
-- time_t No All AgentCollector
Record Type(INPUT_RECORD_TYPE)
Record name(alwaysPDCI)
-- string(4)
No All AgentCollector
2-78 Working with RecordsHitachi Tuning Manager Application Reports Reference
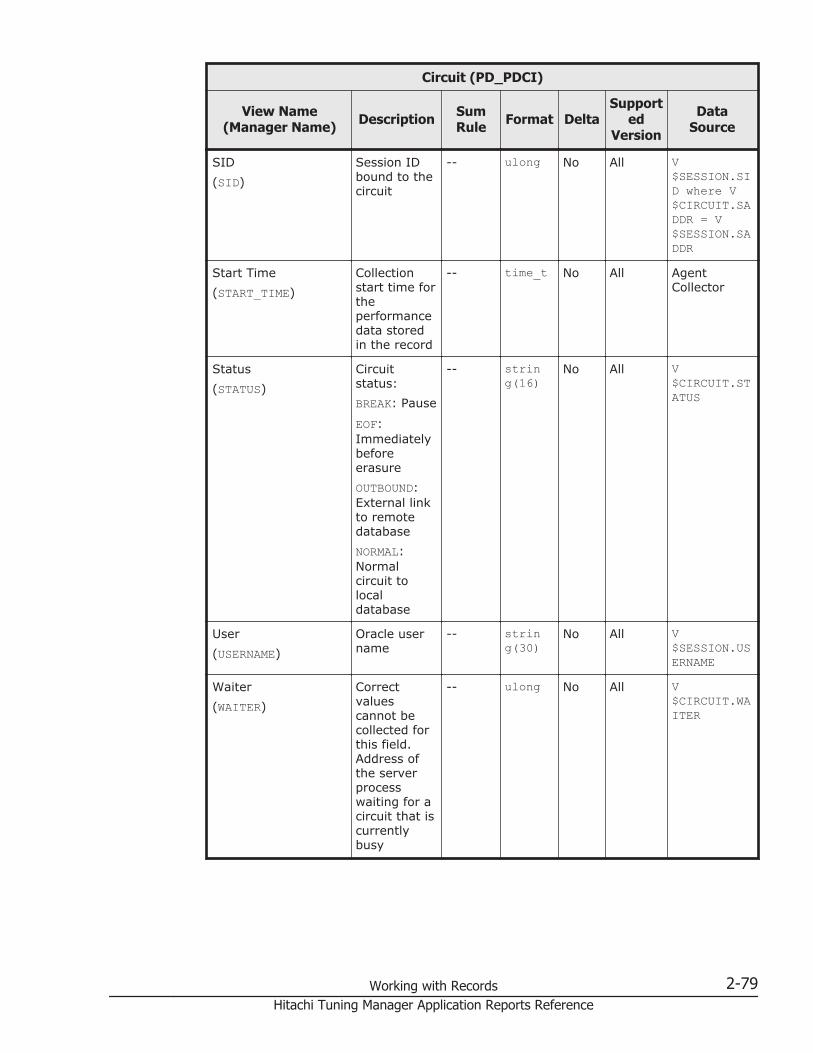
Circuit (PD_PDCI)
View Name(Manager Name) Description Sum
Rule Format DeltaSupport
edVersion
DataSource
SID(SID)
Session IDbound to thecircuit
-- ulong No All V$SESSION.SID where V$CIRCUIT.SADDR = V$SESSION.SADDR
Start Time(START_TIME)
Collectionstart time fortheperformancedata storedin the record
-- time_t No All AgentCollector
Status(STATUS)
Circuitstatus:BREAK: Pause
EOF:ImmediatelybeforeerasureOUTBOUND:External linkto remotedatabaseNORMAL:Normalcircuit tolocaldatabase
-- string(16)
No All V$CIRCUIT.STATUS
User(USERNAME)
Oracle username
-- string(30)
No All V$SESSION.USERNAME
Waiter(WAITER)
Correctvaluescannot becollected forthis field.Address ofthe serverprocesswaiting for acircuit that iscurrentlybusy
-- ulong No All V$CIRCUIT.WAITER
Working with Records 2-79Hitachi Tuning Manager Application Reports Reference
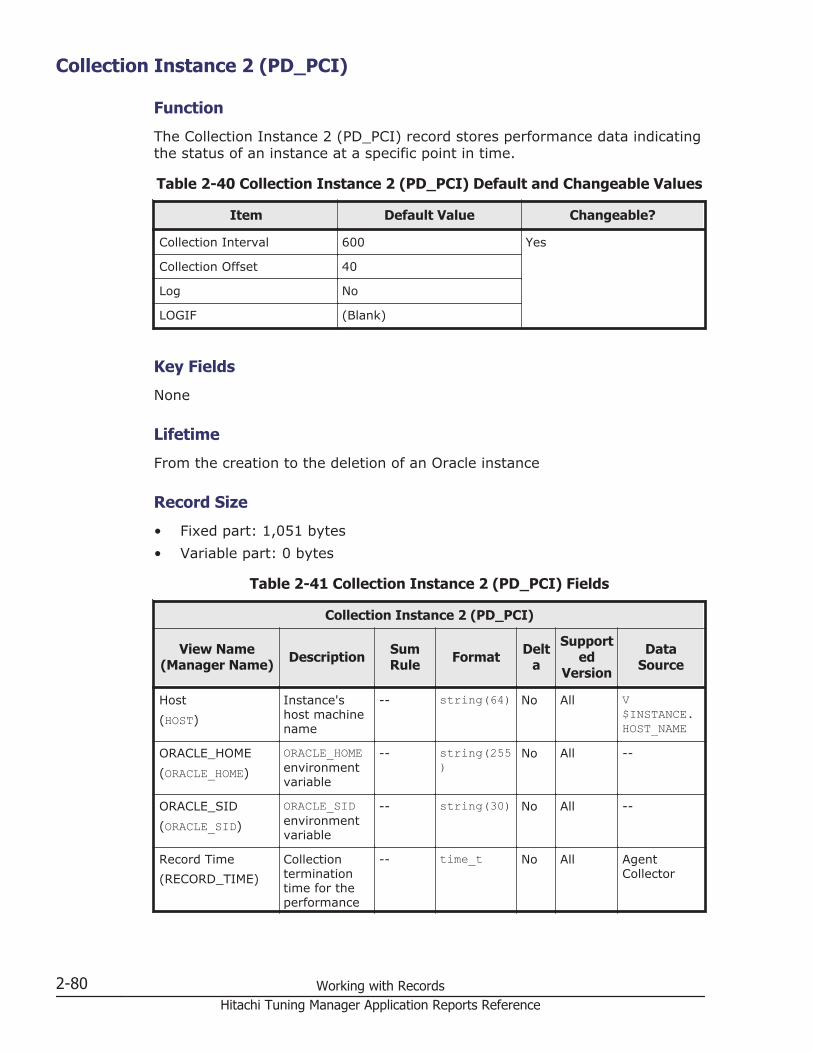
Collection Instance 2 (PD_PCI)
Function
The Collection Instance 2 (PD_PCI) record stores performance data indicatingthe status of an instance at a specific point in time.
Table 2-40 Collection Instance 2 (PD_PCI) Default and Changeable Values
Item Default Value Changeable?
Collection Interval 600 Yes
Collection Offset 40
Log No
LOGIF (Blank)
Key Fields
None
Lifetime
From the creation to the deletion of an Oracle instance
Record Size
• Fixed part: 1,051 bytes• Variable part: 0 bytes
Table 2-41 Collection Instance 2 (PD_PCI) Fields
Collection Instance 2 (PD_PCI)
View Name(Manager Name) Description Sum
Rule Format Delta
Supported
Version
DataSource
Host(HOST)
Instance'shost machinename
-- string(64) No All V$INSTANCE.HOST_NAME
ORACLE_HOME(ORACLE_HOME)
ORACLE_HOMEenvironmentvariable
-- string(255)
No All --
ORACLE_SID(ORACLE_SID)
ORACLE_SIDenvironmentvariable
-- string(30) No All --
Record Time(RECORD_TIME)
Collectionterminationtime for theperformance
-- time_t No All AgentCollector
2-80 Working with RecordsHitachi Tuning Manager Application Reports Reference
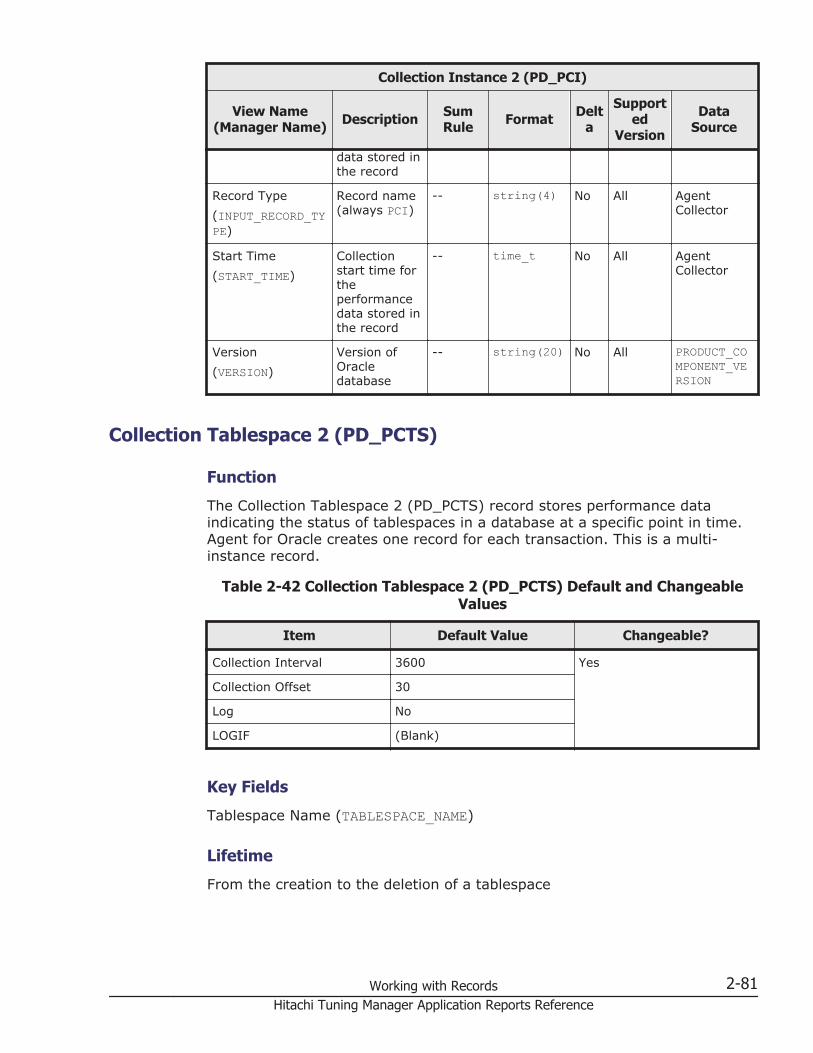
Collection Instance 2 (PD_PCI)
View Name(Manager Name) Description Sum
Rule Format Delta
Supported
Version
DataSource
data stored inthe record
Record Type(INPUT_RECORD_TYPE)
Record name(always PCI)
-- string(4) No All AgentCollector
Start Time(START_TIME)
Collectionstart time fortheperformancedata stored inthe record
-- time_t No All AgentCollector
Version(VERSION)
Version ofOracledatabase
-- string(20) No All PRODUCT_COMPONENT_VERSION
Collection Tablespace 2 (PD_PCTS)
Function
The Collection Tablespace 2 (PD_PCTS) record stores performance dataindicating the status of tablespaces in a database at a specific point in time.Agent for Oracle creates one record for each transaction. This is a multi-instance record.
Table 2-42 Collection Tablespace 2 (PD_PCTS) Default and ChangeableValues
Item Default Value Changeable?
Collection Interval 3600 Yes
Collection Offset 30
Log No
LOGIF (Blank)
Key Fields
Tablespace Name (TABLESPACE_NAME)
Lifetime
From the creation to the deletion of a tablespace
Working with Records 2-81Hitachi Tuning Manager Application Reports Reference
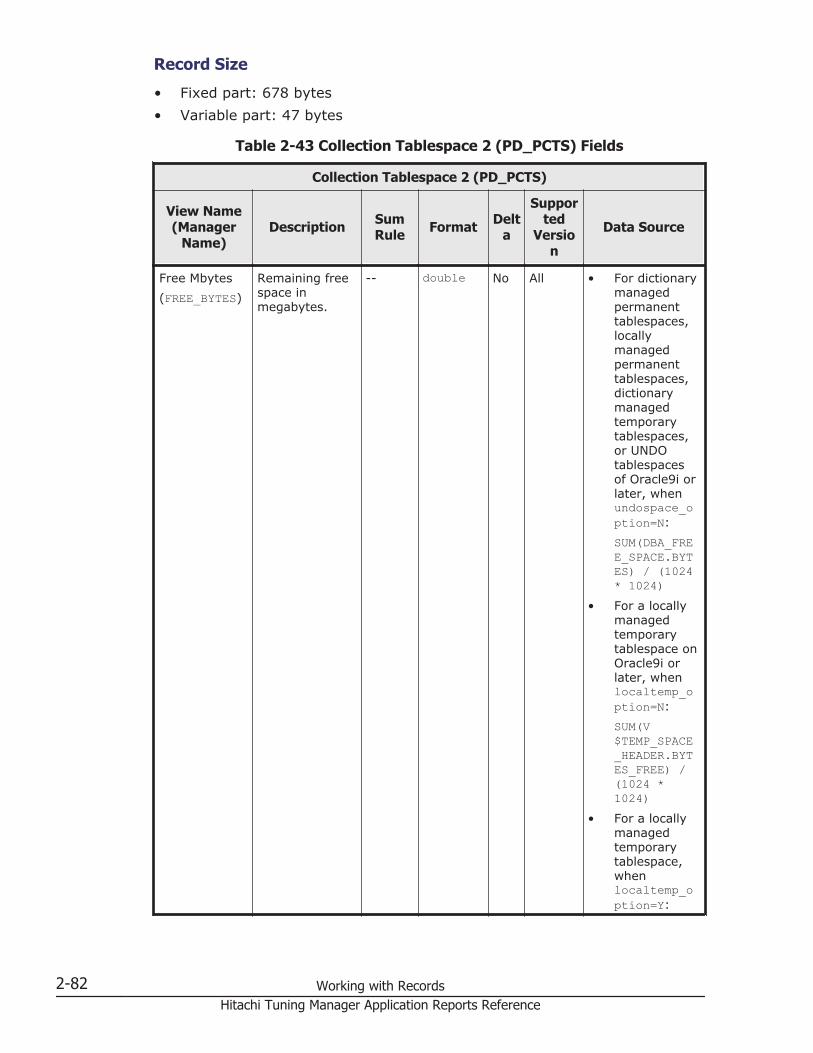
Record Size
• Fixed part: 678 bytes• Variable part: 47 bytes
Table 2-43 Collection Tablespace 2 (PD_PCTS) Fields
Collection Tablespace 2 (PD_PCTS)
View Name(Manager
Name)Description Sum
Rule Format Delta
Supported
Version
Data Source
Free Mbytes(FREE_BYTES)
Remaining freespace inmegabytes.
-- double No All • For dictionarymanagedpermanenttablespaces,locallymanagedpermanenttablespaces,dictionarymanagedtemporarytablespaces,or UNDOtablespacesof Oracle9i orlater, whenundospace_option=N:SUM(DBA_FREE_SPACE.BYTES) / (1024* 1024)
• For a locallymanagedtemporarytablespace onOracle9i orlater, whenlocaltemp_option=N:SUM(V$TEMP_SPACE_HEADER.BYTES_FREE) /(1024 *1024)
• For a locallymanagedtemporarytablespace,whenlocaltemp_option=Y:
2-82 Working with RecordsHitachi Tuning Manager Application Reports Reference
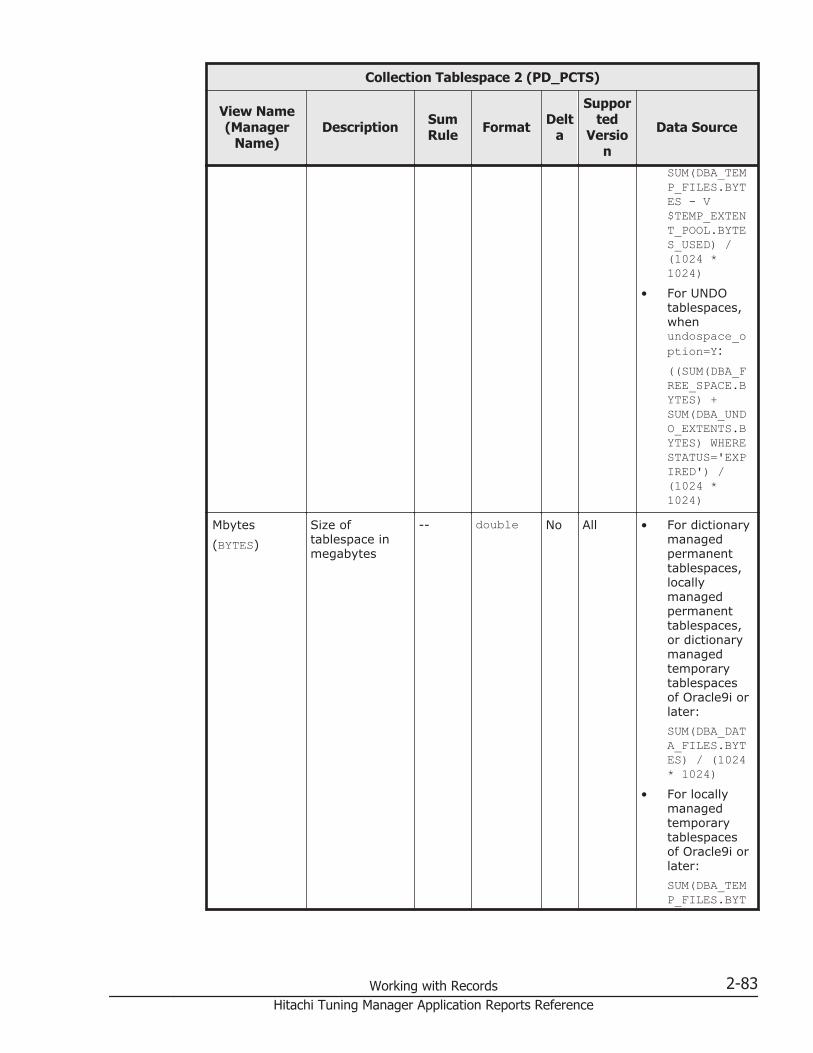
Collection Tablespace 2 (PD_PCTS)
View Name(Manager
Name)Description Sum
Rule Format Delta
Supported
Version
Data Source
SUM(DBA_TEMP_FILES.BYTES - V$TEMP_EXTENT_POOL.BYTES_USED) /(1024 *1024)
• For UNDOtablespaces,whenundospace_option=Y:((SUM(DBA_FREE_SPACE.BYTES) +SUM(DBA_UNDO_EXTENTS.BYTES) WHERESTATUS='EXPIRED') /(1024 *1024)
Mbytes(BYTES)
Size oftablespace inmegabytes
-- double No All • For dictionarymanagedpermanenttablespaces,locallymanagedpermanenttablespaces,or dictionarymanagedtemporarytablespacesof Oracle9i orlater:SUM(DBA_DATA_FILES.BYTES) / (1024* 1024)
• For locallymanagedtemporarytablespacesof Oracle9i orlater:SUM(DBA_TEMP_FILES.BYT
Working with Records 2-83Hitachi Tuning Manager Application Reports Reference
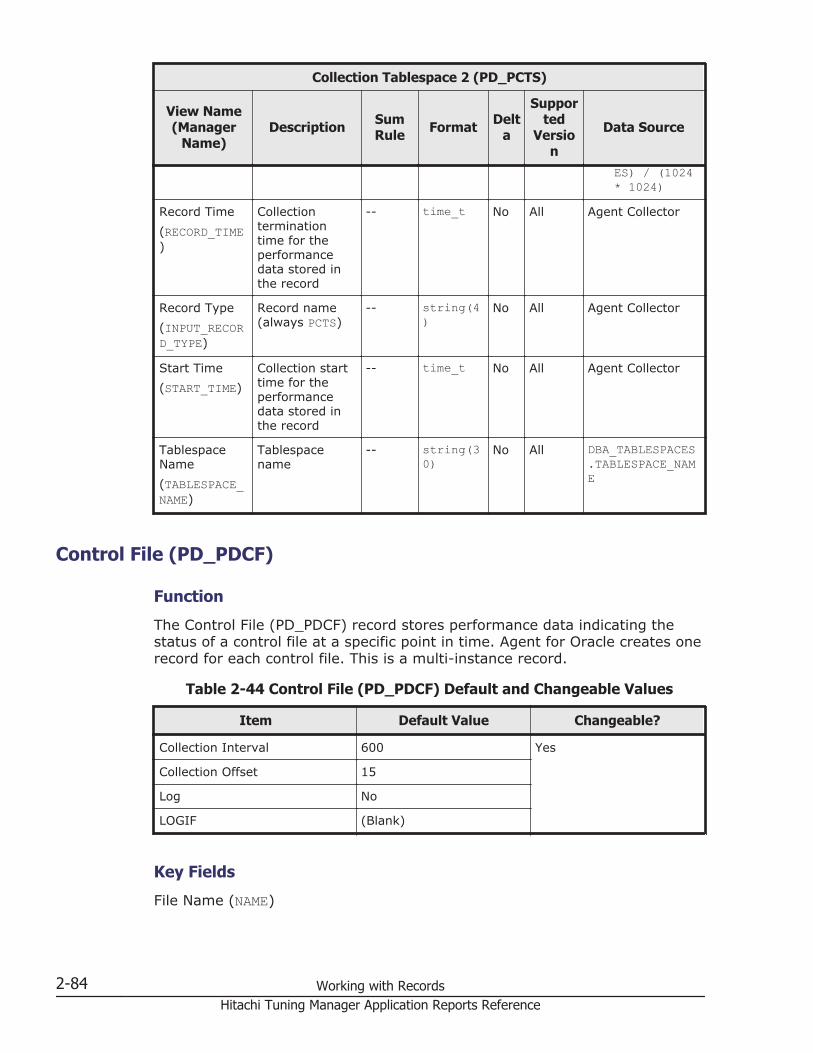
Collection Tablespace 2 (PD_PCTS)
View Name(Manager
Name)Description Sum
Rule Format Delta
Supported
Version
Data Source
ES) / (1024* 1024)
Record Time(RECORD_TIME)
Collectionterminationtime for theperformancedata stored inthe record
-- time_t No All Agent Collector
Record Type(INPUT_RECORD_TYPE)
Record name(always PCTS)
-- string(4)
No All Agent Collector
Start Time(START_TIME)
Collection starttime for theperformancedata stored inthe record
-- time_t No All Agent Collector
TablespaceName(TABLESPACE_NAME)
Tablespacename
-- string(30)
No All DBA_TABLESPACES.TABLESPACE_NAME
Control File (PD_PDCF)
Function
The Control File (PD_PDCF) record stores performance data indicating thestatus of a control file at a specific point in time. Agent for Oracle creates onerecord for each control file. This is a multi-instance record.
Table 2-44 Control File (PD_PDCF) Default and Changeable Values
Item Default Value Changeable?
Collection Interval 600 Yes
Collection Offset 15
Log No
LOGIF (Blank)
Key Fields
File Name (NAME)
2-84 Working with RecordsHitachi Tuning Manager Application Reports Reference

Lifetime
From the creation to the deletion of a database
Record Size
• Fixed part: 678 bytes• Variable part: 522 bytes
Table 2-45 Control File (PD_PDCF) Fields
Control File (PD_PDCF)
View Name(Manager Name) Description Sum
Rule Format DeltaSupport
edVersion
DataSource
File Name(NAME)
Name of thecontrol file
-- string(513)
No All V$CONTROLFILE.NAME
Record Time(RECORD_TIME)
Collectionterminationtime for theperformancedata storedin the record
-- time_t No All AgentCollector
Record Type(INPUT_RECORD_TYPE)
Record name(alwaysPDCF)
-- string(4)
No All AgentCollector
Start Time(START_TIME)
Collectionstart time fortheperformancedata storedin the record
-- time_t No All AgentCollector
Status(STATUS)
Status ofcontrol file:INVALID:Name cannotbe identifiedVALID: Namecan beidentified
-- string(7)
No All V$CONTROLFILE.STATUS
Current Sessions Stat Summary (PD_PDS3)
Function
The Current Sessions Stat Summary (PD_PDS3) record stores performancedata indicating the status of all active sessions for an instance at a specificpoint in time.
Working with Records 2-85Hitachi Tuning Manager Application Reports Reference
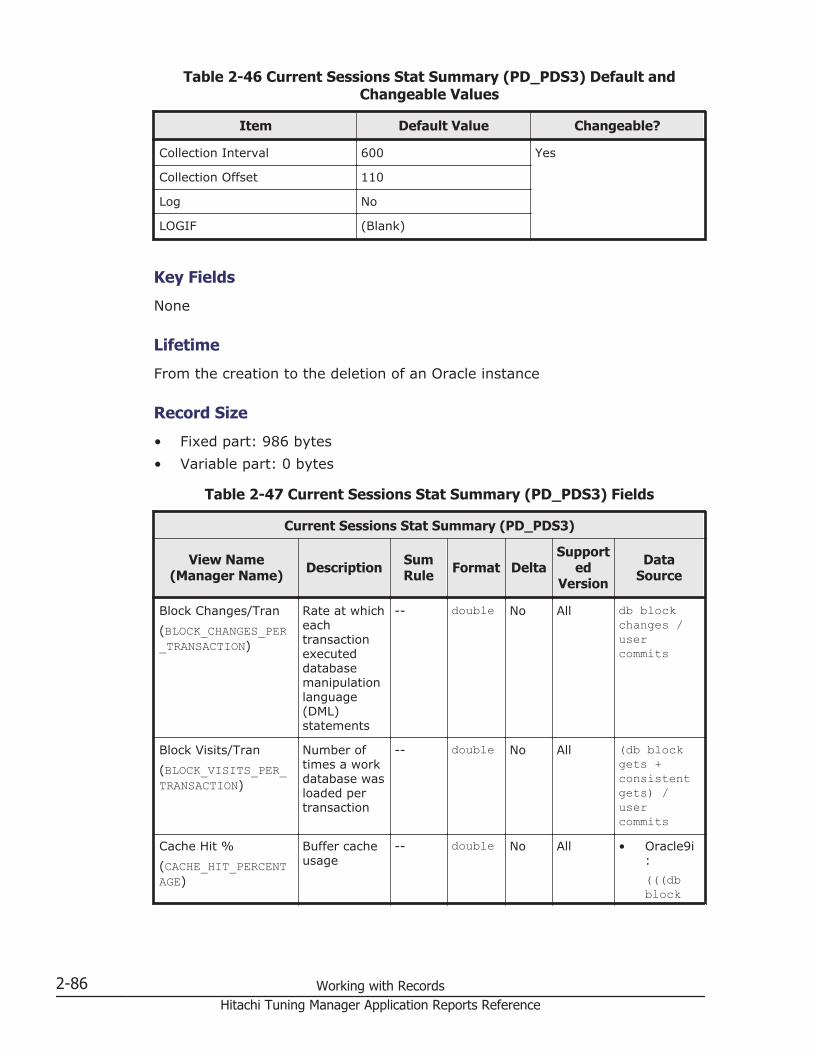
Table 2-46 Current Sessions Stat Summary (PD_PDS3) Default andChangeable Values
Item Default Value Changeable?
Collection Interval 600 Yes
Collection Offset 110
Log No
LOGIF (Blank)
Key Fields
None
Lifetime
From the creation to the deletion of an Oracle instance
Record Size
• Fixed part: 986 bytes• Variable part: 0 bytes
Table 2-47 Current Sessions Stat Summary (PD_PDS3) Fields
Current Sessions Stat Summary (PD_PDS3)
View Name(Manager Name) Description Sum
Rule Format DeltaSupport
edVersion
DataSource
Block Changes/Tran(BLOCK_CHANGES_PER_TRANSACTION)
Rate at whicheachtransactionexecuteddatabasemanipulationlanguage(DML)statements
-- double No All db blockchanges /usercommits
Block Visits/Tran(BLOCK_VISITS_PER_TRANSACTION)
Number oftimes a workdatabase wasloaded pertransaction
-- double No All (db blockgets +consistentgets) /usercommits
Cache Hit %(CACHE_HIT_PERCENTAGE)
Buffer cacheusage
-- double No All • Oracle9i:(((dbblock
2-86 Working with RecordsHitachi Tuning Manager Application Reports Reference

Current Sessions Stat Summary (PD_PDS3)
View Name(Manager Name) Description Sum
Rule Format DeltaSupport
edVersion
DataSource
gets +consistentgets) -physicalreads)/ (dbblockgets +consistentgets))* 100
• Oracle10g andlater:(1 -(physicalreadscache /(consistentgetsfromcache +dbblockgetsfromcache))) * 100
Calls/Tran(CALLS_PER_TRANSACTION)
Rate at whichclientrequestswereexecuted pertransaction
-- double No All usercalls /usercommits
Changed Block %(CHANGED_BLOCK_PERCENTAGE)
Ratio (as apercent) ofthe numberof queriesthat changedata(insertion,update, anddeletion) tothe numberof queries(search,insertion,
-- double No All (db blockchanges /(block gets+consistentgets)) *100
Working with Records 2-87Hitachi Tuning Manager Application Reports Reference

Current Sessions Stat Summary (PD_PDS3)
View Name(Manager Name) Description Sum
Rule Format DeltaSupport
edVersion
DataSource
update,deletion)executed onthe database
Consistent Change %(CONSISTENT_CHANGE_PERCENTAGE)
Ratio (as apercent) ofthe numberof timesrollbackentries wereapplied tomaintainreadconsistencyto thenumber ofreadconsistencyrequests bytheapplication
-- double No All (consistentchanges /consistentgets) * 100
Continued Row %(CONTINUED_ROW_PERCENTAGE)
Percentage offetched rowsthat werelonger thanone block orwere moved
-- double No All (tablefetchcontinuedrow /(tablefetch byrowid +table scanrowsgotten)) *100
Deadlocks(LOCK_DEADLOCKS)
Number ofprocessdeadlockscaused byDMLenqueuing(locking) inactivesession
-- double No All SUM(V$SESSTAT.VALUE)
Disk Sorts(SORTS_DISK)
Number ofdisk sortoperations
-- double No All SUM(V$SESSTAT.VALUE)
Lock Conversions(LOCK_CONVERSIONS)
Number ofenqueues(locks) whosemodechanged
-- double No All SUM(V$SESSTAT.VALUE)
2-88 Working with RecordsHitachi Tuning Manager Application Reports Reference
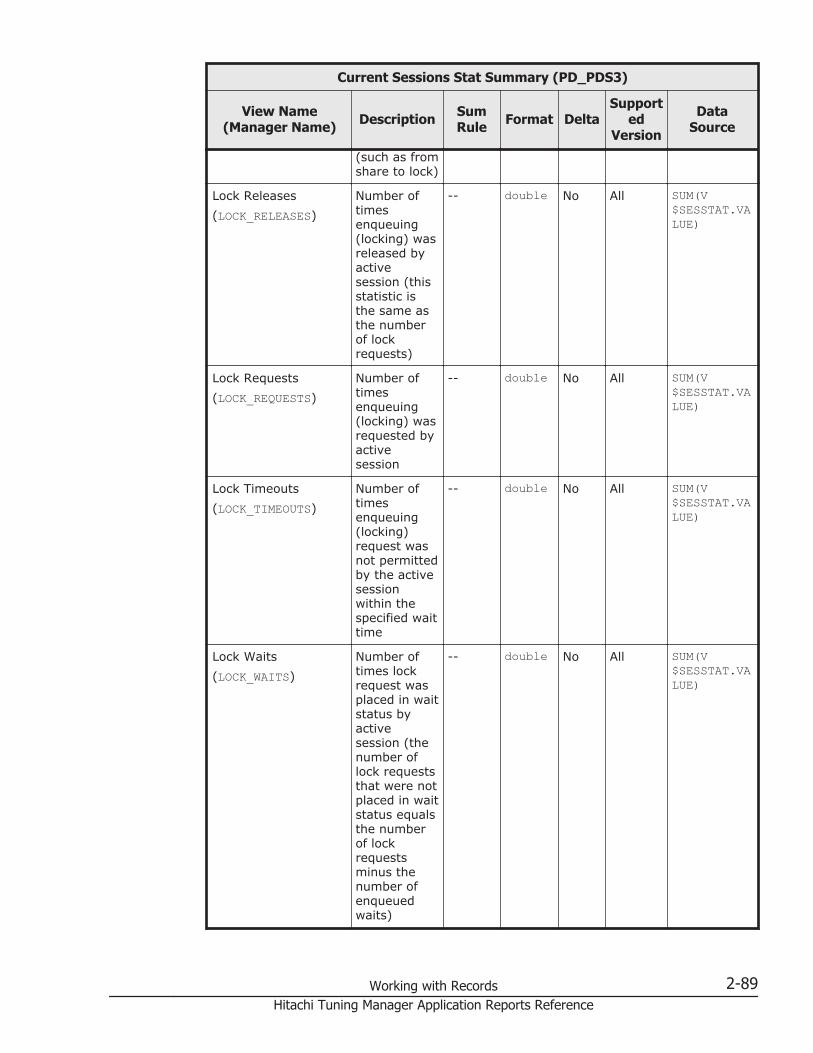
Current Sessions Stat Summary (PD_PDS3)
View Name(Manager Name) Description Sum
Rule Format DeltaSupport
edVersion
DataSource
(such as fromshare to lock)
Lock Releases(LOCK_RELEASES)
Number oftimesenqueuing(locking) wasreleased byactivesession (thisstatistic isthe same asthe numberof lockrequests)
-- double No All SUM(V$SESSTAT.VALUE)
Lock Requests(LOCK_REQUESTS)
Number oftimesenqueuing(locking) wasrequested byactivesession
-- double No All SUM(V$SESSTAT.VALUE)
Lock Timeouts(LOCK_TIMEOUTS)
Number oftimesenqueuing(locking)request wasnot permittedby the activesessionwithin thespecified waittime
-- double No All SUM(V$SESSTAT.VALUE)
Lock Waits(LOCK_WAITS)
Number oftimes lockrequest wasplaced in waitstatus byactivesession (thenumber oflock requeststhat were notplaced in waitstatus equalsthe numberof lockrequestsminus thenumber ofenqueuedwaits)
-- double No All SUM(V$SESSTAT.VALUE)
Working with Records 2-89Hitachi Tuning Manager Application Reports Reference

Current Sessions Stat Summary (PD_PDS3)
View Name(Manager Name) Description Sum
Rule Format DeltaSupport
edVersion
DataSource
Logical Reads(LOGICAL_READS)
Sum of thenumber oflogical readoperations inreadconsistencymode andthe numberof requeststo the currentcopy of theblock
-- double No All db blockgets +consistentgets
Non-Index Lookups %(NON_INDEX_LOOKUPS)
Percentage offull tablescans whereno caching isperformed
-- double No All (tablescans (longtables) /(tablescans(shorttables) +table scans(longtables))) *100
Physical Reads(PHYSICAL_READS)
Number oftimesdatabaseblock wasactually readfrom disk byactivesession
-- double No All physicalreads -physicalreads direct -physicalreads direct(lob)
Physical Writes(PHYSICAL_WRITES)
Number ofphysical writeoperations ondisk by DBWR
-- double No All SUM(V$SESSTAT.VALUE)
Record Time(RECORD_TIME)
Collectionterminationtime for theperformancedata storedin the record
-- time_t No All AgentCollector
Record Type(INPUT_RECORD_TYPE)
Record name(alwaysPDS3)
-- string(4)
No All AgentCollector
Recursive Calls(RECURSIVE_CALLS)
Number ofuser callsprocessed
-- double No All SUM(V$SESSTAT.VALUE)
2-90 Working with RecordsHitachi Tuning Manager Application Reports Reference

Current Sessions Stat Summary (PD_PDS3)
View Name(Manager Name) Description Sum
Rule Format DeltaSupport
edVersion
DataSource
Recursive to User Call%(RECURSIVE_TO_USER_CALL_PERCENTAGE)
Correctvalues cannotbe collectedfor this field.Ratio (as apercent) ofrecursivecalls to usercalls
-- double No All (recursivecalls /user calls)* 100
Redo Log SpaceRequests(REDO_LOG_SPACE_REQUESTS)
Number oftimes that,because theactive log filewas full, theOracle serverhad to waitfor disk spaceto beallocated fora REDO logentry.
-- double No All SUM(V$SESSTAT.VALUE)
Redo Log Space Wait%(REDO_LOG_SPACE_WAIT_PERCENTAGE)
Wait rate forallocations ofthe disk areato the REDOlog entry
-- double No All (redo logspacerequests /redoentries) *100
Row Source %(ROW_SOURCE_PERCENTAGE)
Percentage ofall rows thatwereobtained byfull tablescans
-- double No All (table scanrowsgotten /(tablefetch byrowid +table scanrowsgotten)) *100
Session CPU Usage(SESSION_CPU_USAGE)
Total CPUtime inhundredthsof a secondused toexecutestatementsduring datacollection
-- double No All SUM(V$SESSTAT.VALUE)
Session Cursor CacheCount
Number ofsessioncursorscached (the
-- double No All SUM(V$SESSTAT.VALUE)
Working with Records 2-91Hitachi Tuning Manager Application Reports Reference

Current Sessions Stat Summary (PD_PDS3)
View Name(Manager Name) Description Sum
Rule Format DeltaSupport
edVersion
DataSource
(SESSION_CURSOR_CACHE_COUNT)
maximumnumber ofcursors thatcan becached isdeterminedby theSESSION_CACHED_CURSORSparameter inthe init.orafile)
Session Cursor CacheHit %(SESSION_CURSOR_CACHE_HIT_PERCENTAGE)
Percentage ofsessioncursors thatwere reused
-- double No All (sessioncursorcachehits /sessioncursorcachecount) *100
Session Cursor CacheHits(SESSION_CURSOR_CACHE_HITS)
Number oftimes cachedsessioncursor wasreused
-- double No All SUM(V$SESSTAT.VALUE)
Session PGA Memory(SESSION_PGA_MEMORY)
Size of PGAmemory usedby activesessionduring datacollection
-- double No All SUM(V$SESSTAT.VALUE)
Session UGA Memory(SESSION_UGA_MEMORY)
Size of UGAmemory usedby activesession
-- double No All SUM(V$SESSTAT.VALUE)
Sessions(SESSIONS)
Number ofsessionsduring datacollection
-- ulong No All COUNT(V$SESSION)
Sort Overflow %(SORT_OVERFLOW_PERCENTAGE)
Percentage ofsorts thatusedtemporarysegments
-- double No All (sorts(disk) /(sorts(memory) +sorts(disk))) *100
2-92 Working with RecordsHitachi Tuning Manager Application Reports Reference
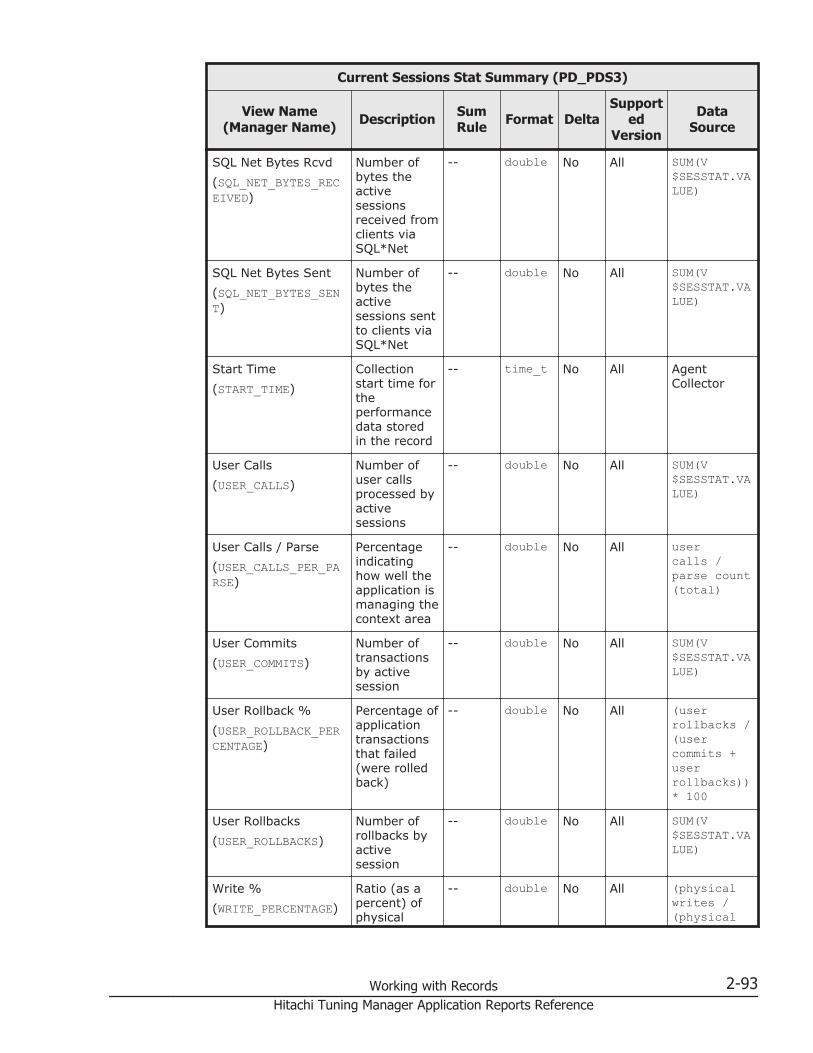
Current Sessions Stat Summary (PD_PDS3)
View Name(Manager Name) Description Sum
Rule Format DeltaSupport
edVersion
DataSource
SQL Net Bytes Rcvd(SQL_NET_BYTES_RECEIVED)
Number ofbytes theactivesessionsreceived fromclients viaSQL*Net
-- double No All SUM(V$SESSTAT.VALUE)
SQL Net Bytes Sent(SQL_NET_BYTES_SENT)
Number ofbytes theactivesessions sentto clients viaSQL*Net
-- double No All SUM(V$SESSTAT.VALUE)
Start Time(START_TIME)
Collectionstart time fortheperformancedata storedin the record
-- time_t No All AgentCollector
User Calls(USER_CALLS)
Number ofuser callsprocessed byactivesessions
-- double No All SUM(V$SESSTAT.VALUE)
User Calls / Parse(USER_CALLS_PER_PARSE)
Percentageindicatinghow well theapplication ismanaging thecontext area
-- double No All usercalls /parse count(total)
User Commits(USER_COMMITS)
Number oftransactionsby activesession
-- double No All SUM(V$SESSTAT.VALUE)
User Rollback %(USER_ROLLBACK_PERCENTAGE)
Percentage ofapplicationtransactionsthat failed(were rolledback)
-- double No All (userrollbacks /(usercommits +userrollbacks))* 100
User Rollbacks(USER_ROLLBACKS)
Number ofrollbacks byactivesession
-- double No All SUM(V$SESSTAT.VALUE)
Write %(WRITE_PERCENTAGE)
Ratio (as apercent) ofphysical
-- double No All (physicalwrites /(physical
Working with Records 2-93Hitachi Tuning Manager Application Reports Reference

Current Sessions Stat Summary (PD_PDS3)
View Name(Manager Name) Description Sum
Rule Format DeltaSupport
edVersion
DataSource
writes to allphysical I/Os(reads andwrites)
reads +physicalwrites)) *100
Data Dictionary Cache (PD_PDDD)
Function
The Data Dictionary Cache (PD_PDDD) record stores performance dataindicating the usage of the data dictionary cache at a specific point in time.Agent for Oracle creates one record for each data dictionary cache. This is amulti-instance record.
Table 2-48 Data Dictionary Cache (PD_PDDD) Default and ChangeableValues
Item Default Value Changeable?
Collection Interval 300 Yes
Collection Offset 40
Log No
LOGIF (Blank)
Key Fields
• Cache # (CACHE_NUM)• Subordinate # (SUBORDINATE_NUM)
Lifetime
From the start to the stop of an Oracle instance
Record Size
• Fixed part: 678 bytes• Variable part: 145 bytes
2-94 Working with RecordsHitachi Tuning Manager Application Reports Reference

Table 2-49 Data Dictionary Cache (PD_PDDD) Fields
Data Dictionary Cache (PD_PDDD)
View Name(Manager Name) Description Sum
Rule Format DeltaSupport
edVersion
DataSource
Cache #(CACHE_NUM)
ID number ofrow cache
-- double No All V$ROWCACHE.CACHE#
Count(COUNT)
Total numberof entries incache
-- long No All V$ROWCACHE.COUNT
Fixed(FIXED)
Number ofentries fixedin cache
-- ulong No All V$ROWCACHE.FIXED
Flushes(FLUSHES)
Number oftimes cachewas flushedto disk
-- double No All V$ROWCACHE.FLUSHES
Get Misses(GET_MISSES)
Number ofdatarequests forwhich acache missoccurred
-- double No All V$ROWCACHE.GETMISSES
Get Misses %(GET_MISSES_PERCENTAGE)
Percentageof datarequests forwhich acache missoccurredduring theinterval
-- double No All (V$ROWCACHE.GETMISSES /V$ROWCACHE.GETS) * 100
Gets(GETS)
Total numberof requeststo dataobjectinformation
-- double No All V$ROWCACHE.GETS
Modifications(MODIFICATIONS)
Number ofinsert,update, anddeleteoperations
-- double No All V$ROWCACHE.MODIFICATIONS
Parameter(PARAMETER)
Name ofinit.oraparameterthatdeterminesthe numberof entries indata
-- string(32)
No All V$ROWCACHE.PARAMETER
Working with Records 2-95Hitachi Tuning Manager Application Reports Reference

Data Dictionary Cache (PD_PDDD)
View Name(Manager Name) Description Sum
Rule Format DeltaSupport
edVersion
DataSource
dictionarycache
Record Time(RECORD_TIME)
Collectionterminationtime for theperformancedata storedin the record
-- time_t No All AgentCollector
Record Type(INPUT_RECORD_TYPE)
Record name(alwaysPDDD)
-- string(4)
No All AgentCollector
Scan Completes(SCAN_COMPLETES)
Number oftimes a list ofsubordinateentries wasscannedcompletely
-- double No All V$ROWCACHE.SCANCOMPLETES
Scan Misses(SCAN_MISSES)
Number ofscans duringwhich datawas notfound incache
-- double No All V$ROWCACHE.SCANMISSES
Scan Misses %(SCAN_MISSES_PERCENTAGE)
Percentageof scans inwhich datawas notfound incache
-- double No All (V$ROWCACHE.SCANMISSES /V$ROWCACHE.SCANS) * 100
Scans(SCANS)
Number ofscanrequests
-- double No All V$ROWCACHE.SCANS
Start Time(START_TIME)
Collectionstart time fortheperformancedata storedin the record
-- time_t No All AgentCollector
Subordinate #(SUBORDINATE_NUM)
Subordinateset number
-- double No All V$ROWCACHE.SUBORDINATE#
Type(TYPE)
Type ofmaster orsubordinaterow cache
-- string(11)
No All V$ROWCACHE.TYPE
2-96 Working with RecordsHitachi Tuning Manager Application Reports Reference

Data Dictionary Cache (PD_PDDD)
View Name(Manager Name) Description Sum
Rule Format DeltaSupport
edVersion
DataSource
Usage(USAGE)
Number ofcache entriescontainingvalid data
-- ulong No All V$ROWCACHE.USAGE
Data Dictionary Cache Interval (PI_PIDD)
Function
The Data Dictionary Cache Interval (PI_PIDD) record stores performancedata, taken at specific intervals, about usage of the data dictionary cache.Agent for Oracle creates one record for each data dictionary cache. This is amulti-instance record.
Table 2-50 Data Dictionary Cache Interval (PI_PIDD) Default andChangeable Values
Item Default Value Changeable?
Collection Interval 300 Yes
Collection Offset 30
Log No
LOGIF (Blank)
Key Fields
• Cache # (CACHE_NUM)• Subordinate # (SUBORDINATE_NUM)
Lifetime
From the start to the stop of an Oracle instance
Record Size
• Fixed part: 678 bytes• Variable part: 289 bytes
Working with Records 2-97Hitachi Tuning Manager Application Reports Reference

Table 2-51 Data Dictionary Cache Interval (PI_PIDD) Fields
Data Dictionary Cache Interval (PI_PIDD)
View Name(Manager Name) Description Sum
Rule Format DeltaSupport
edVersion
DataSource
Cache #(CACHE_NUM)
ID number ofrow cache
COPY double No All V$ROWCACHE.CACHE#
Count(COUNT)
Number ofentries incache
AVG long No All V$ROWCACHE.COUNT
Fixed(FIXED)
Number ofentries fixedin cache
AVG ulong No All V$ROWCACHE.FIXED
Flushes(FLUSHES)
Number ofdisk flushes
AVG double Yes All V$ROWCACHE.FLUSHES
Get Misses(GET_MISSES)
Number ofdatarequests forwhich acache missoccurredduring theinterval
AVG double Yes All V$ROWCACHE.GETMISSES
Get Misses %(GET_MISSES_PERCENTAGE)
Percentageof datarequests forwhich acache missoccurredduring theinterval
AVG double No All (V$ROWCACHE.GETMISSES /V$ROWCACHE.GETS) * 100
Gets(GETS)
Number ofrequests todata objectinformationduring theinterval
AVG double Yes All V$ROWCACHE.GETS
Modifications(MODIFICATIONS)
Number ofinsert,update, anddeleteoperations
AVG double Yes All V$ROWCACHE.MODIFICATIONS
Parameter(PARAMETER)
Name ofinit.oraparameterthatdeterminesthe numberof entries in
COPY string(32)
No All V$ROWCACHE.PARAMETER
2-98 Working with RecordsHitachi Tuning Manager Application Reports Reference
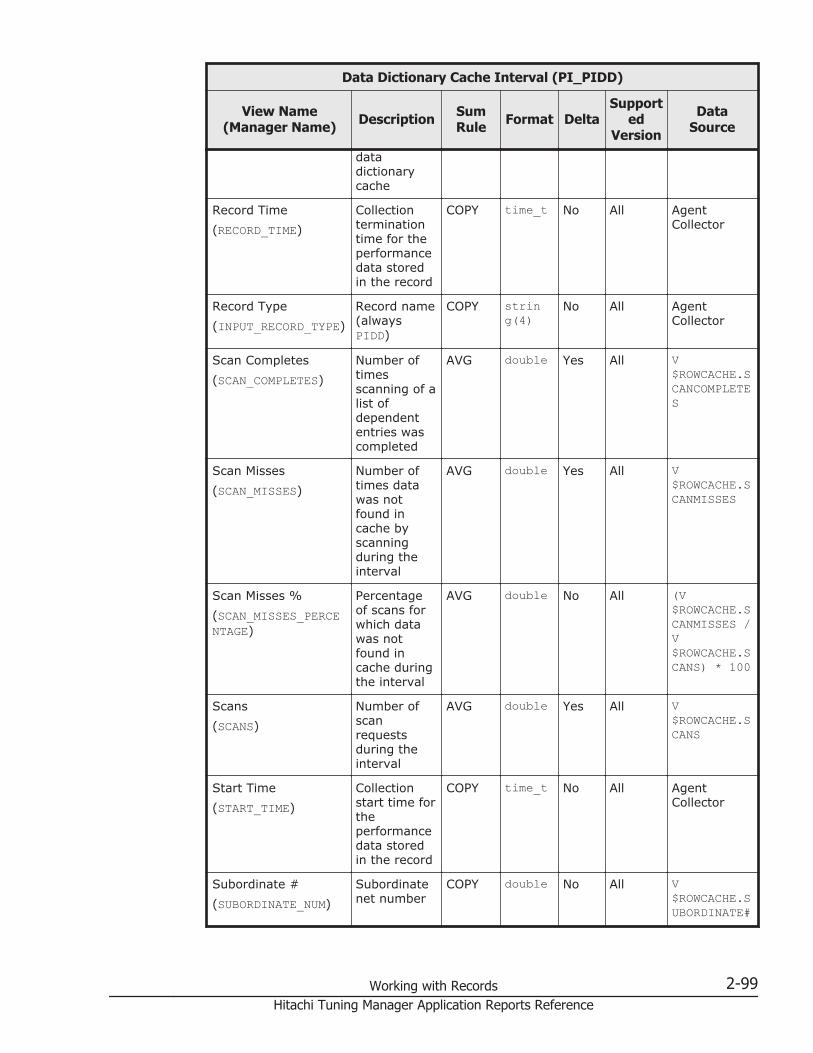
Data Dictionary Cache Interval (PI_PIDD)
View Name(Manager Name) Description Sum
Rule Format DeltaSupport
edVersion
DataSource
datadictionarycache
Record Time(RECORD_TIME)
Collectionterminationtime for theperformancedata storedin the record
COPY time_t No All AgentCollector
Record Type(INPUT_RECORD_TYPE)
Record name(alwaysPIDD)
COPY string(4)
No All AgentCollector
Scan Completes(SCAN_COMPLETES)
Number oftimesscanning of alist ofdependententries wascompleted
AVG double Yes All V$ROWCACHE.SCANCOMPLETES
Scan Misses(SCAN_MISSES)
Number oftimes datawas notfound incache byscanningduring theinterval
AVG double Yes All V$ROWCACHE.SCANMISSES
Scan Misses %(SCAN_MISSES_PERCENTAGE)
Percentageof scans forwhich datawas notfound incache duringthe interval
AVG double No All (V$ROWCACHE.SCANMISSES /V$ROWCACHE.SCANS) * 100
Scans(SCANS)
Number ofscanrequestsduring theinterval
AVG double Yes All V$ROWCACHE.SCANS
Start Time(START_TIME)
Collectionstart time fortheperformancedata storedin the record
COPY time_t No All AgentCollector
Subordinate #(SUBORDINATE_NUM)
Subordinatenet number
COPY double No All V$ROWCACHE.SUBORDINATE#
Working with Records 2-99Hitachi Tuning Manager Application Reports Reference

Data Dictionary Cache Interval (PI_PIDD)
View Name(Manager Name) Description Sum
Rule Format DeltaSupport
edVersion
DataSource
Type(TYPE)
Type ofmaster orsubordinatecache type
COPY string(11)
No All V$ROWCACHE.TYPE
Usage(USAGE)
Number ofcache entriescontainingvalid data
AVG ulong No All V$ROWCACHE.USAGE
Data File (PD_PDDF)
Function
The Data File (PD_PDDF) record stores performance data indicating the statusof data files at a specific point in time. Agent for Oracle creates one record foreach data file in a database. This is a multi-instance record.
Table 2-52 Data File (PD_PDDF) Default and Changeable Values
Item Default Value Changeable?
Collection Interval 300 Yes
Collection Offset 10
Log No
LOGIF (Blank)
Key Fields
• File # (FILE_NUM)• File Name (NAME)
Lifetime
From the creation to the deletion of a data file
Record Size
• Fixed part: 678 bytes• Variable part: 672 bytes
2-100 Working with RecordsHitachi Tuning Manager Application Reports Reference

Table 2-53 Data File (PD_PDDF) Fields
Data File (PD_PDDF)
View Name(Manager
Name)
Description
SumRule Format Delt
a
SupportedVersion
Data Source
Blocks(BLOCKS)
Oracleblock size
-- double No All • For dictionary managedpermanent tablespaces,dictionary managedtemporary tablespaces,or locally managedpermanent tablespaces:DBA_DATA_FILES.BLOCKS
• For locally managedtemporary tablespaces:DBA_TEMP_FILES.BLOCKS
CheckpointChange #(CHECKPOINT_CHANGE_NUM)
Systemchangenumber(SCN) atthe lastcheckpoint
-- double No All V$DATAFILE.CHECKPOINT_CHANGE#
Enabled(ENABLED)
Methodforaccessingfile usingSQL; thisfieldcontainsone ofthefollowingvalues:DISABLED, READONLY,READWRITE,UNKNOWN
-- string(10)
No All • For dictionary managedpermanent tablespaces,dictionary managedtemporary tablespaces,or locally managedpermanent tablespaces:V$DATAFILE.ENABLED
• For locally managedtemporary tablespaces:V$TEMPFILE.ENABLED
File #(FILE_NUM)
Fileidentificationnumber
-- long No All • For dictionary managedpermanent tablespaces,dictionary managedtemporary tablespaces,or locally managedpermanent tablespaces:V$DATAFILE.FILE#
• For locally managedtemporary tablespaces:V$TEMPFILE.FILE#
Working with Records 2-101Hitachi Tuning Manager Application Reports Reference

Data File (PD_PDDF)
View Name(Manager
Name)
Description
SumRule Format Delt
a
SupportedVersion
Data Source
File Name(NAME)
File name -- string(513)
No All • For dictionary managedpermanent tablespaces,dictionary managedtemporary tablespaces,or locally managedpermanent tablespaces:V$DATAFILE.NAME
• For locally managedtemporary tablespaces:V$TEMPFILE.NAME
Free %(PERCENT_FREE)
Percentage ofspacethat isfree
-- double No All • For dictionary managedpermanent tablespaces,dictionary managedtemporary tablespaces,locally managedpermanent tablespaces,or UNDO tablespaces,whenundospace_option=N:(SUM(DBA_FREE_SPACE.BYTES) / V$DATAFILE.BYTES) *100
• For a locally managedtemporary tablespace,whenlocaltemp_option=N:(V$TEMP_SPACE_HEADER /DBA_TEMP_FILES.BYTES)* 100
• For a locally managedtemporary tablespace,whenlocaltemp_option=Y:((V$TEMPFILE.BYTES -V$TEMP_EXTENT_POOL.BYTES_USED) / V$TEMPFILE.BYTES) *100
• For UNDO tablespaces,whenundospace_option=Y:
2-102 Working with RecordsHitachi Tuning Manager Application Reports Reference

Data File (PD_PDDF)
View Name(Manager
Name)
Description
SumRule Format Delt
a
SupportedVersion
Data Source
((SUM(DBA_FREE_SPACE.BYTES) +SUM(DBA_UNDO_EXTENTS.BYTES) WHERESTATUS='EXPIRED') / V$DATAFILE.BYTES) *100
Free Mbytes(FREE)
Remaining freespace inmegabytes
-- double No All • For dictionary managedpermanent tablespaces,dictionary managedtemporary tablespaces,locally managedpermanent tablespaces,or UNDO tablespaces,whenundospace_option=N:SUM(DBA_FREE_SPACE.BYTES) / (1024 * 1024)
• For a locally managedtemporary tablespace,whenlocaltemp_option=N:(V$TEMP_SPACE_HEADER.BYTES_FREE) / (1024 *1024)
• For a locally managedtemporary tablespace,whenlocaltemp_option=Y:(V$TEMPFILE.BYTES - V$TEMP_EXTENT_POOL.BYTES_USED) / (1024 *1024)
• For UNDO tablespaces,whenundospace_option=Y:((SUM(DBA_FREE_SPACE.BYTES) +SUM(DBA_UNDO_EXTENTS.BYTES) WHERESTATUS='EXPIRED') /(1024 * 1024)
MBytes(BYTES)
Percentage of diskspaceused by a
-- double No All • For dictionary managedpermanent tablespaces,dictionary managedtemporary tablespaces,
Working with Records 2-103Hitachi Tuning Manager Application Reports Reference

Data File (PD_PDDF)
View Name(Manager
Name)
Description
SumRule Format Delt
a
SupportedVersion
Data Source
filesystem,inmegabytes
or locally managedpermanent tablespaces:V$DATAFILE.BYTES /(1024 * 1024)
• For locally managedtemporary tablespaces:V$TEMPFILE.BYTES /(1024 * 1024)
Physical BlocksRead(PHYSICAL_BLOCKS_READ)
Numberofphysicalblockreadoperations
-- double No All • For dictionary managedpermanent tablespaces,dictionary managedtemporary tablespaces,or locally managedpermanent tablespaces:V$FILESTAT.PHYBLKRD
• For locally managedtemporary tablespaces:V$TEMPSTAT.PHYBLKRD
Physical BlocksWritten(PHYSICAL_BLOCKS_WRITTEN)
Numberofphysicalblockwriteoperations
-- double No All • For dictionary managedpermanent tablespaces,dictionary managedtemporary tablespaces,or locally managedpermanent tablespaces:V$FILESTAT.PHYBLKWRT
• For locally managedtemporary tablespaces:V$TEMPSTAT.PHYBLKWRT
Physical Reads(PHYSICAL_READS)
Numberofphysicalreadoperations thatwerecompleted
-- double No All • For dictionary managedpermanent tablespaces,dictionary managedtemporary tablespaces,or locally managedpermanent tablespaces:V$FILESTAT.PHYRDS
• For locally managedtemporary tablespaces:V$TEMPSTAT.PHYRDS
Physical Writes(PHYSICAL_WRITES)
Numberofphysicalwriteoperation
-- double No All • For dictionary managedpermanent tablespaces,dictionary managedtemporary tablespaces,or locally managedpermanent tablespaces:
2-104 Working with RecordsHitachi Tuning Manager Application Reports Reference

Data File (PD_PDDF)
View Name(Manager
Name)
Description
SumRule Format Delt
a
SupportedVersion
Data Source
s thatwerecompleted
V$FILESTAT.PHYWRTS• For locally managed
temporary tablespaces:V$TEMPSTAT.PHYWRTS
Read Time(READ_TIME)
Readoperationtime inhundredths of asecond
-- double No All • For dictionary managedpermanent tablespaces,dictionary managedtemporary tablespaces,or locally managedpermanent tablespaces:V$FILESTAT.READTIM
• For locally managedtemporary tablespaces:V$TEMPSTAT.READTIM
Record Time(RECORD_TIME)
Collectiontermination timefor theperformance datastored intherecord
-- time_t No All Agent Collector
Record Type(INPUT_RECORD_TYPE)
Recordname(alwaysPDDF)
-- string(4)
No All Agent Collector
Start Time(START_TIME)
Collectionstart timefor theperformance datastored intherecord
-- time_t No All Agent Collector
Status(STATUS)
File type(systemfile oruser file)and filestatus(OFFLINE, SYSOFF,ONLINE,SYSTEM,
-- string(7)
No All • For dictionary managedpermanent tablespaces,dictionary managedtemporary tablespaces,or locally managedpermanent tablespaces:V$DATAFILE.STATUS
• For locally managedtemporary tablespaces:V$TEMPFILE.STATUS
Working with Records 2-105Hitachi Tuning Manager Application Reports Reference
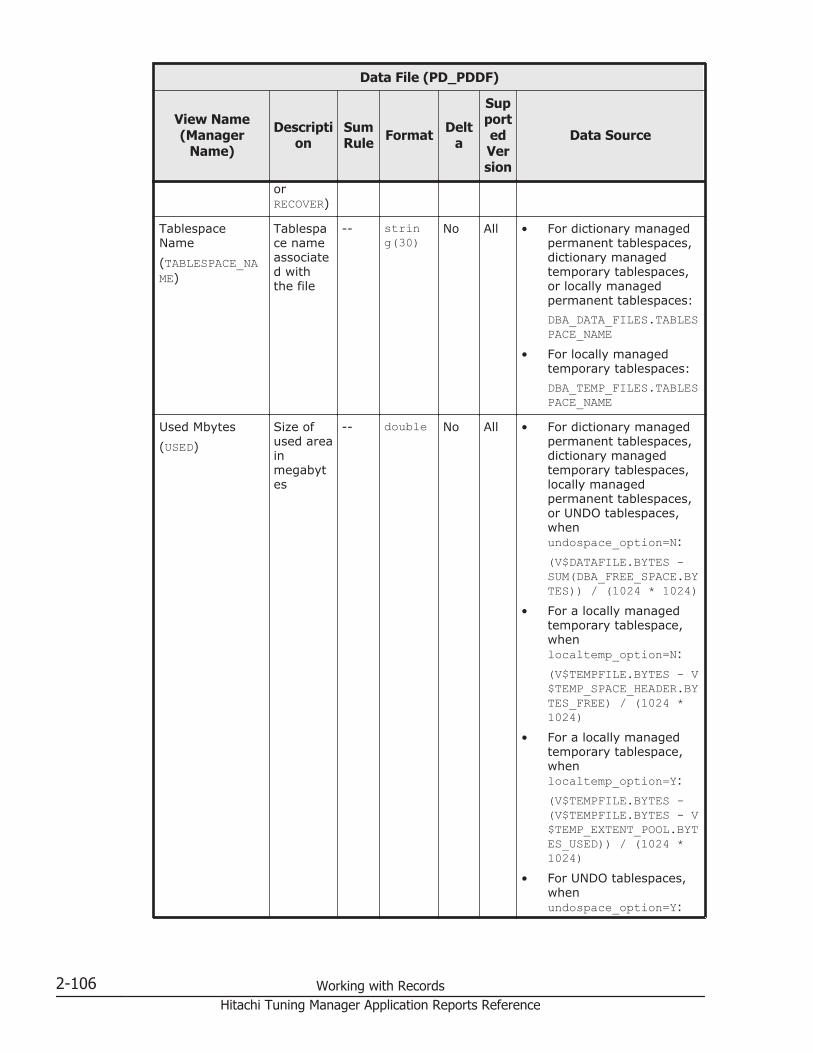
Data File (PD_PDDF)
View Name(Manager
Name)
Description
SumRule Format Delt
a
SupportedVersion
Data Source
orRECOVER)
TablespaceName(TABLESPACE_NAME)
Tablespace nameassociated withthe file
-- string(30)
No All • For dictionary managedpermanent tablespaces,dictionary managedtemporary tablespaces,or locally managedpermanent tablespaces:DBA_DATA_FILES.TABLESPACE_NAME
• For locally managedtemporary tablespaces:DBA_TEMP_FILES.TABLESPACE_NAME
Used Mbytes(USED)
Size ofused areainmegabytes
-- double No All • For dictionary managedpermanent tablespaces,dictionary managedtemporary tablespaces,locally managedpermanent tablespaces,or UNDO tablespaces,whenundospace_option=N:(V$DATAFILE.BYTES -SUM(DBA_FREE_SPACE.BYTES)) / (1024 * 1024)
• For a locally managedtemporary tablespace,whenlocaltemp_option=N:(V$TEMPFILE.BYTES - V$TEMP_SPACE_HEADER.BYTES_FREE) / (1024 *1024)
• For a locally managedtemporary tablespace,whenlocaltemp_option=Y:(V$TEMPFILE.BYTES -(V$TEMPFILE.BYTES - V$TEMP_EXTENT_POOL.BYTES_USED)) / (1024 *1024)
• For UNDO tablespaces,whenundospace_option=Y:
2-106 Working with RecordsHitachi Tuning Manager Application Reports Reference

Data File (PD_PDDF)
View Name(Manager
Name)
Description
SumRule Format Delt
a
SupportedVersion
Data Source
(V$DATAFILE.BYTES -SUM(DBA_FREE_SPACE.BYTES) -SUM(DBA_UNDO_EXTENTS.BYTES) WHERESTATUS='EXPIRED') /(1024 * 1024)
Write %(WRITE_PERCENTAGE)
Ratio (asapercent)ofphysicalwrites toallphysicalI/Os(readsandwrites)
-- double No All • For dictionary managedpermanent tablespaces,dictionary managedtemporary tablespaces,or locally managedpermanent tablespaces:(V$FILESTAT.PHYWRTS /(V$FILESTAT.PHYRDS +V$FILESTAT.PHYWRTS))* 100
• For locally managedtemporary tablespaces:(V$TEMPSTAT.PHYWRTS /(V$TEMPSTAT.PHYRDS +V$TEMPSTAT.PHYWRTS))* 100
Write Time(WRITE_TIME)
Writeoperationtime inhundredths of asecond
-- double No All • For dictionary managedpermanent tablespaces,dictionary managedtemporary tablespaces,or locally managedpermanent tablespaces:V$FILESTAT.WRITETIM
• For locally managedtemporary tablespaces:V$TEMPSTAT.WRITETIM
Data File Interval (PI_PIDF)
Function
The Data File Interval (PI_PIDF) record stores performance data, taken atspecific intervals, about data files. Agent for Oracle creates one record foreach data file in a database. This is a multi-instance record.
Working with Records 2-107Hitachi Tuning Manager Application Reports Reference
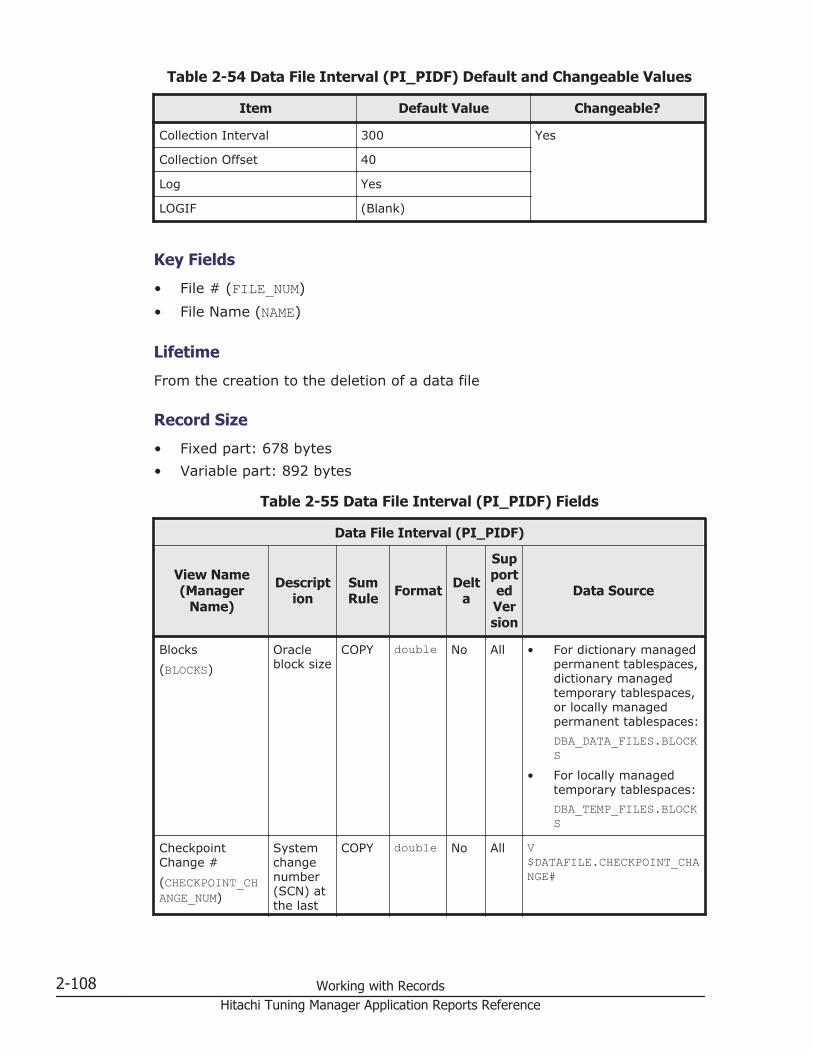
Table 2-54 Data File Interval (PI_PIDF) Default and Changeable Values
Item Default Value Changeable?
Collection Interval 300 Yes
Collection Offset 40
Log Yes
LOGIF (Blank)
Key Fields
• File # (FILE_NUM)• File Name (NAME)
Lifetime
From the creation to the deletion of a data file
Record Size
• Fixed part: 678 bytes• Variable part: 892 bytes
Table 2-55 Data File Interval (PI_PIDF) Fields
Data File Interval (PI_PIDF)
View Name(Manager
Name)
Description
SumRule Format Delt
a
SupportedVersion
Data Source
Blocks(BLOCKS)
Oracleblock size
COPY double No All • For dictionary managedpermanent tablespaces,dictionary managedtemporary tablespaces,or locally managedpermanent tablespaces:DBA_DATA_FILES.BLOCKS
• For locally managedtemporary tablespaces:DBA_TEMP_FILES.BLOCKS
CheckpointChange #(CHECKPOINT_CHANGE_NUM)
Systemchangenumber(SCN) atthe last
COPY double No All V$DATAFILE.CHECKPOINT_CHANGE#
2-108 Working with RecordsHitachi Tuning Manager Application Reports Reference
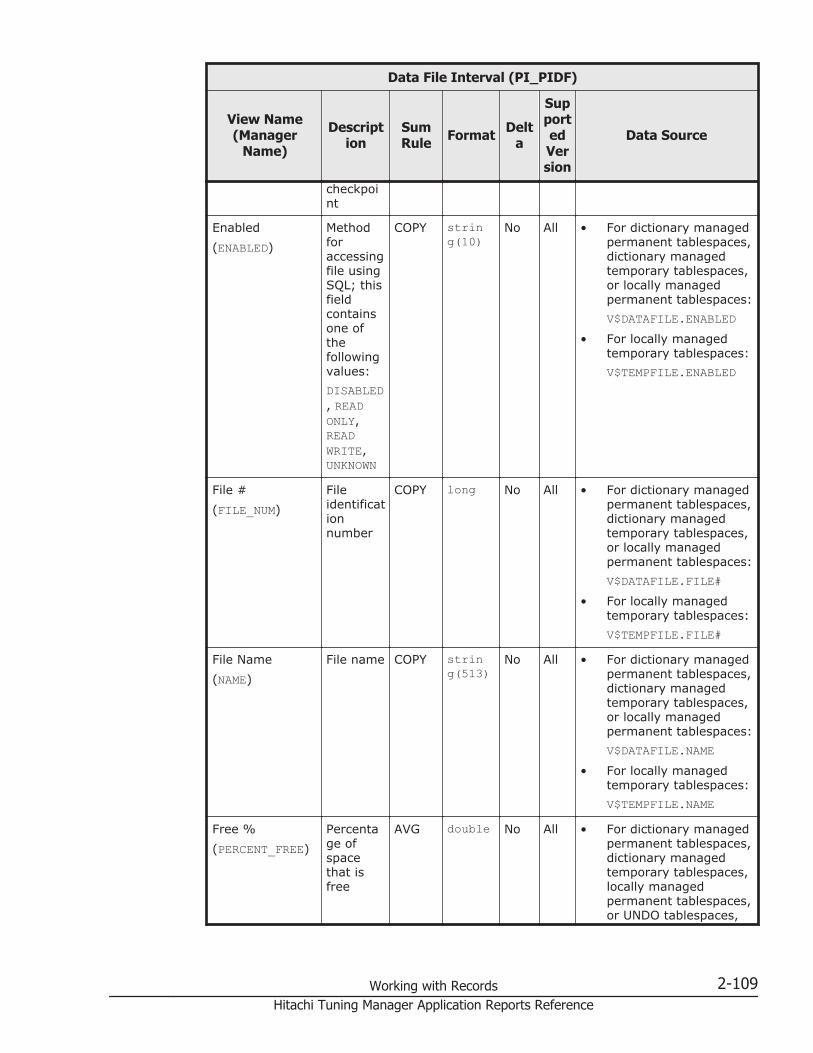
Data File Interval (PI_PIDF)
View Name(Manager
Name)
Description
SumRule Format Delt
a
SupportedVersion
Data Source
checkpoint
Enabled(ENABLED)
Methodforaccessingfile usingSQL; thisfieldcontainsone ofthefollowingvalues:DISABLED, READONLY,READWRITE,UNKNOWN
COPY string(10)
No All • For dictionary managedpermanent tablespaces,dictionary managedtemporary tablespaces,or locally managedpermanent tablespaces:V$DATAFILE.ENABLED
• For locally managedtemporary tablespaces:V$TEMPFILE.ENABLED
File #(FILE_NUM)
Fileidentificationnumber
COPY long No All • For dictionary managedpermanent tablespaces,dictionary managedtemporary tablespaces,or locally managedpermanent tablespaces:V$DATAFILE.FILE#
• For locally managedtemporary tablespaces:V$TEMPFILE.FILE#
File Name(NAME)
File name COPY string(513)
No All • For dictionary managedpermanent tablespaces,dictionary managedtemporary tablespaces,or locally managedpermanent tablespaces:V$DATAFILE.NAME
• For locally managedtemporary tablespaces:V$TEMPFILE.NAME
Free %(PERCENT_FREE)
Percentage ofspacethat isfree
AVG double No All • For dictionary managedpermanent tablespaces,dictionary managedtemporary tablespaces,locally managedpermanent tablespaces,or UNDO tablespaces,
Working with Records 2-109Hitachi Tuning Manager Application Reports Reference

Data File Interval (PI_PIDF)
View Name(Manager
Name)
Description
SumRule Format Delt
a
SupportedVersion
Data Source
whenundospace_option=N:(SUM(DBA_FREE_SPACE.BYTES) / V$DATAFILE.BYTES) *100
• For a locally managedtemporary tablespace,whenlocaltemp_option=N:(V$TEMP_SPACE_HEADER /V$TEMPFILE.BYTES) *100
• For a locally managedtemporary tablespace,whenlocaltemp_option=Y:((V$TEMPFILE.BYTES -V$TEMP_EXTENT_POOL.BYTES_USED) / V$TEMPFILE.BYTES) *100
• For UNDO tablespaces,whenundospace_option=Y:((SUM(DBA_FREE_SPACE.BYTES) +SUM(DBA_UNDO_EXTENTS.BYTES) WHERESTATUS='EXPIRED') /V$DATAFILE.BYTES) *100
Free Change(FREE_CHANGE)
Changeto thefreespace(differencebetweenthe valueobtainedthis timeand thevalueobtainedlast
AVG double No All • For dictionary managedpermanent tablespaces,dictionary managedtemporary tablespaces,locally managedpermanent tablespaces,or UNDO tablespaces,whenundospace_option=N:SUM(DBA_FREE_SPACE.BYTES) / (1024 *1024)
2-110 Working with RecordsHitachi Tuning Manager Application Reports Reference

Data File Interval (PI_PIDF)
View Name(Manager
Name)
Description
SumRule Format Delt
a
SupportedVersion
Data Source
time), inmegabytes
• For a locally managedtemporary tablespace,whenlocaltemp_option=N:(V$TEMP_SPACE_HEADER.BYTES_FREE) / (1024 *1024)
• For a locally managedtemporary tablespace,whenlocaltemp_option=Y:(V$TEMPFILE.BYTES -V$TEMP_EXTENT_POOL.BYTES_USED) / (1024 *1024)
• For UNDO tablespaces,whenundospace_option=Y:((SUM(DBA_FREE_SPACE.BYTES) +SUM(DBA_UNDO_EXTENTS.BYTES) WHERESTATUS='EXPIRED') /(1024 * 1024)
Free Mbytes(FREE_BYTES)
Remaining freespace inmegabytes
AVG double No All • For dictionary managedpermanent tablespaces,dictionary managedtemporary tablespaces,locally managedpermanent tablespaces,or UNDO tablespaces,whenundospace_option=N:SUM(DBA_FREE_SPACE.BYTES) / (1024 *1024)
• For a locally managedtemporary tablespace,whenlocaltemp_option=N:(V$TEMP_SPACE_HEADER.BYTES_FREE) / (1024 *1024)
Working with Records 2-111Hitachi Tuning Manager Application Reports Reference

Data File Interval (PI_PIDF)
View Name(Manager
Name)
Description
SumRule Format Delt
a
SupportedVersion
Data Source
• For a locally managedtemporary tablespace,whenlocaltemp_option=Y:(V$TEMPFILE.BYTES -V$TEMP_EXTENT_POOL.BYTES_USED) / (1024 *1024)
• For UNDO tablespaces,whenundospace_option=Y:((SUM(DBA_FREE_SPACE.BYTES) +SUM(DBA_UNDO_EXTENTS.BYTES) WHERESTATUS='EXPIRED') /(1024 * 1024)
I/O Ops/sec(IO_RATE)
Numberof I/Ooperations persecond
AVG double No All • For dictionary managedpermanent tablespaces,dictionary managedtemporary tablespaces,or locally managedpermanent tablespaces:(V$FILESTAT.PHYRDS +V$FILESTAT.PHYWRTS) /seconds-in-interval
• For locally managedtemporary tablespaces:(V$TEMPSTAT.PHYRDS +V$TEMPSTAT.PHYWRTS) /seconds-in-interval
Mbytes(BYTES)
Percentage of diskspaceused by afilesystem,inmegabytes
COPY double No All • For dictionary managedpermanent tablespaces,dictionary managedtemporary tablespaces,or locally managedpermanent tablespaces:V$DATAFILE.BYTES /(1024 * 1024)
• For locally managedtemporary tablespaces:V$TEMPFILE.BYTES /(1024 * 1024)
2-112 Working with RecordsHitachi Tuning Manager Application Reports Reference

Data File Interval (PI_PIDF)
View Name(Manager
Name)
Description
SumRule Format Delt
a
SupportedVersion
Data Source
Physical BlocksRead(PHYSICAL_BLOCKS_READ)
Numberofphysicalblockreadoperations duringtheinterval
AVG double Yes All • For dictionary managedpermanent tablespaces,dictionary managedtemporary tablespaces,or locally managedpermanent tablespaces:V$FILESTAT.PHYBLKRD
• For locally managedtemporary tablespaces:V$TEMPSTAT.PHYBLKRD
Physical BlocksWritten(PHYSICAL_BLOCKS_WRITTEN)
Numberofphysicalblockwriteoperations duringtheinterval
AVG double Yes All • For dictionary managedpermanent tablespaces,dictionary managedtemporary tablespaces,or locally managedpermanent tablespaces:V$FILESTAT.PHYBLKWRT
• For locally managedtemporary tablespaces:V$TEMPSTAT.PHYBLKWRT
Physical Reads(PHYSICAL_READS)
Numberofphysicalblockreadoperations thatwerecompleted duringtheinterval
AVG double Yes All • For dictionary managedpermanent tablespaces,dictionary managedtemporary tablespaces,or locally managedpermanent tablespaces:V$FILESTAT.PHYRDS
• For locally managedtemporary tablespaces:V$TEMPSTAT.PHYRDS
Physical Writes(PHYSICAL_WRITES)
Numberofphysicalblockwriteoperations thatwerecompleted duringtheinterval
AVG double Yes All • For dictionary managedpermanent tablespaces,dictionary managedtemporary tablespaces,or locally managedpermanent tablespaces:V$FILESTAT.PHYWRTS
• For locally managedtemporary tablespaces:V$TEMPSTAT.PHYWRTS
Working with Records 2-113Hitachi Tuning Manager Application Reports Reference
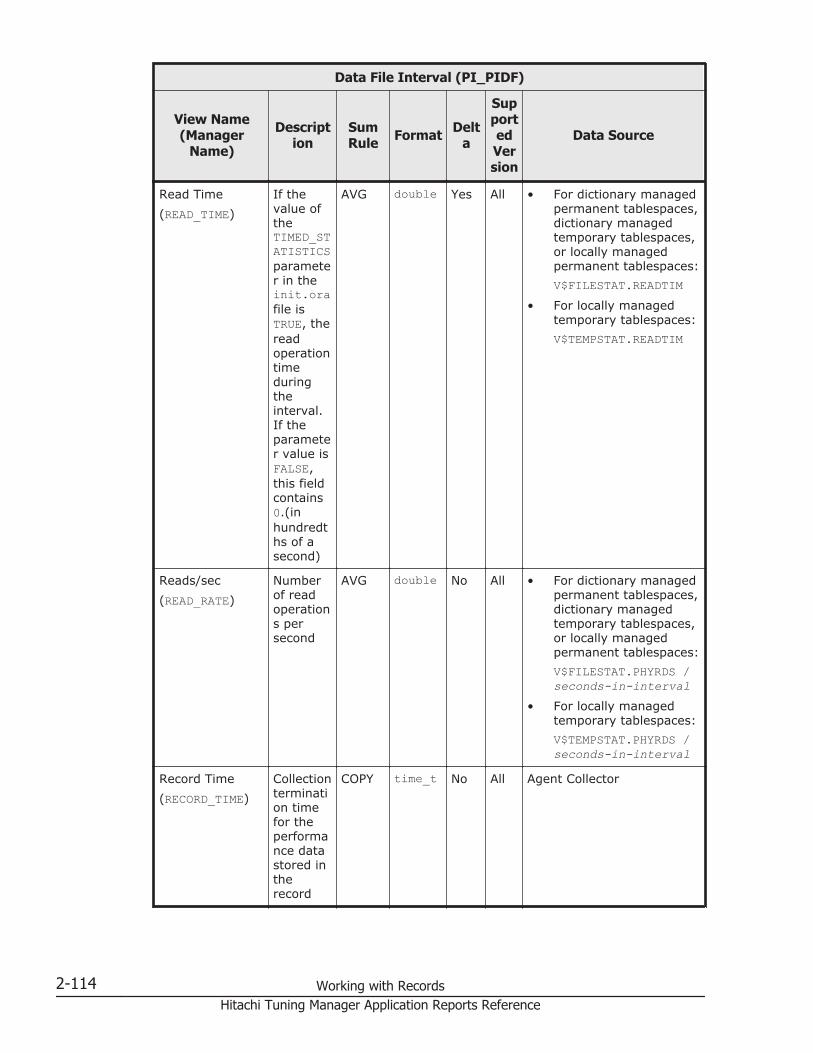
Data File Interval (PI_PIDF)
View Name(Manager
Name)
Description
SumRule Format Delt
a
SupportedVersion
Data Source
Read Time(READ_TIME)
If thevalue oftheTIMED_STATISTICSparameter in theinit.orafile isTRUE, thereadoperationtimeduringtheinterval.If theparameter value isFALSE,this fieldcontains0.(inhundredths of asecond)
AVG double Yes All • For dictionary managedpermanent tablespaces,dictionary managedtemporary tablespaces,or locally managedpermanent tablespaces:V$FILESTAT.READTIM
• For locally managedtemporary tablespaces:V$TEMPSTAT.READTIM
Reads/sec(READ_RATE)
Numberof readoperations persecond
AVG double No All • For dictionary managedpermanent tablespaces,dictionary managedtemporary tablespaces,or locally managedpermanent tablespaces:V$FILESTAT.PHYRDS /seconds-in-interval
• For locally managedtemporary tablespaces:V$TEMPSTAT.PHYRDS /seconds-in-interval
Record Time(RECORD_TIME)
Collectiontermination timefor theperformance datastored intherecord
COPY time_t No All Agent Collector
2-114 Working with RecordsHitachi Tuning Manager Application Reports Reference

Data File Interval (PI_PIDF)
View Name(Manager
Name)
Description
SumRule Format Delt
a
SupportedVersion
Data Source
Record Type(INPUT_RECORD_TYPE)
Recordname(alwaysPIDF)
COPY string(4)
No All Agent Collector
Start Time(START_TIME)
Collectionstart timefor theperformance datastored intherecord
COPY time_t No All Agent Collector
Status(STATUS)
File type(systemfile oruser file)and filestatus(OFFLINE, SYSOFF,ONLINE,SYSTEM,orRECOVER)
COPY string(7)
No All • For dictionary managedpermanent tablespaces,dictionary managedtemporary tablespaces,or locally managedpermanent tablespaces:V$DATAFILE.STATUS
• For locally managedtemporary tablespaces:V$TEMPFILE.STATUS
TablespaceName(TABLESPACE_NAME)
Tablespace nameassociated withthe file
COPY string(30)
No All • For dictionary managedpermanent tablespaces,dictionary managedtemporary tablespaces,or locally managedpermanent tablespaces:DBA_DATA_FILES.TABLESPACE_NAME
• For locally managedtemporary tablespaces:DBA_TEMP_FILES.TABLESPACE_NAME
Used Change(USED_CHANGE)
Usedspace(thedifferencebetweenthevaluesobtainedthis timeand the
AVG double No All • For dictionary managedpermanent tablespaces,dictionary managedtemporary tablespaces,locally managedpermanent tablespaces,or UNDO tablespaces,whenundospace_option=N:
Working with Records 2-115Hitachi Tuning Manager Application Reports Reference
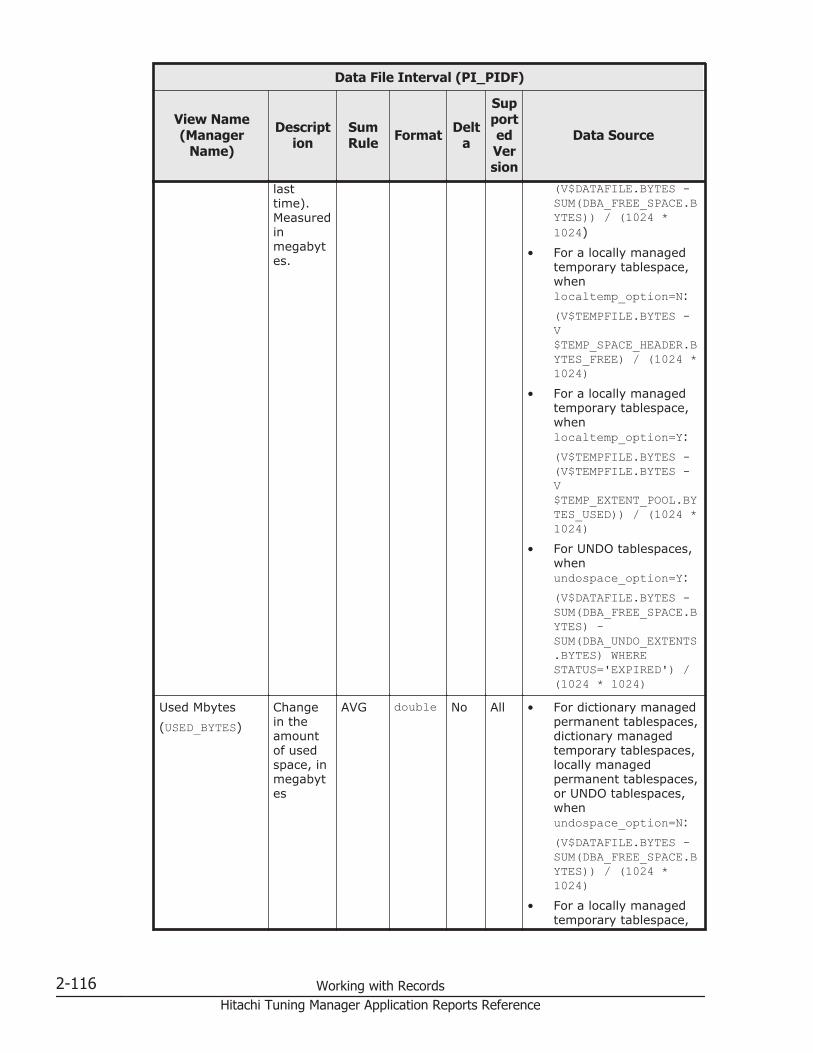
Data File Interval (PI_PIDF)
View Name(Manager
Name)
Description
SumRule Format Delt
a
SupportedVersion
Data Source
lasttime).Measuredinmegabytes.
(V$DATAFILE.BYTES -SUM(DBA_FREE_SPACE.BYTES)) / (1024 *1024)
• For a locally managedtemporary tablespace,whenlocaltemp_option=N:(V$TEMPFILE.BYTES -V$TEMP_SPACE_HEADER.BYTES_FREE) / (1024 *1024)
• For a locally managedtemporary tablespace,whenlocaltemp_option=Y:(V$TEMPFILE.BYTES -(V$TEMPFILE.BYTES -V$TEMP_EXTENT_POOL.BYTES_USED)) / (1024 *1024)
• For UNDO tablespaces,whenundospace_option=Y:(V$DATAFILE.BYTES -SUM(DBA_FREE_SPACE.BYTES) -SUM(DBA_UNDO_EXTENTS.BYTES) WHERESTATUS='EXPIRED') /(1024 * 1024)
Used Mbytes(USED_BYTES)
Changein theamountof usedspace, inmegabytes
AVG double No All • For dictionary managedpermanent tablespaces,dictionary managedtemporary tablespaces,locally managedpermanent tablespaces,or UNDO tablespaces,whenundospace_option=N:(V$DATAFILE.BYTES -SUM(DBA_FREE_SPACE.BYTES)) / (1024 *1024)
• For a locally managedtemporary tablespace,
2-116 Working with RecordsHitachi Tuning Manager Application Reports Reference

Data File Interval (PI_PIDF)
View Name(Manager
Name)
Description
SumRule Format Delt
a
SupportedVersion
Data Source
whenlocaltemp_option=N:(V$TEMPFILE.BYTES -V$TEMP_SPACE_HEADER.BYTES_FREE) / (1024 *1024)
• For a locally managedtemporary tablespace,whenlocaltemp_option=Y:(V$TEMPFILE.BYTES -(V$TEMPFILE.BYTES -V$TEMP_EXTENT_POOL.BYTES_USED)) / (1024 *1024)
• For UNDO tablespaces,whenundospace_option=Y:(V$DATAFILE.BYTES -SUM(DBA_FREE_SPACE.BYTES) -SUM(DBA_UNDO_EXTENTS.BYTES) WHERESTATUS='EXPIRED') /(1024 * 1024)
Write %(WRITE_PERCENTAGE)
Ratio (asapercent)ofphysicalwrites toallphysicalI/Os(readsandwrites)
AVG double No All • For dictionary managedpermanent tablespaces,dictionary managedtemporary tablespaces,or locally managedpermanent tablespaces:(V$FILESTAT.PHYWRTS /(V$FILESTAT.PHYRDS +V$FILESTAT.PHYWRTS))* 100
• For locally managedtemporary tablespaces:(V$TEMPSTAT.PHYWRTS /(V$TEMPSTAT.PHYRDS +V$TEMPSTAT.PHYWRTS))* 100
Working with Records 2-117Hitachi Tuning Manager Application Reports Reference

Data File Interval (PI_PIDF)
View Name(Manager
Name)
Description
SumRule Format Delt
a
SupportedVersion
Data Source
Write Time(WRITE_TIME)
If thevalue oftheTIMED_STATISTICSparameter in theinit.orafile isTRUE, thewriteoperationtimeduringtheinterval.If theparameter value isFALSE,this fieldcontains0.(inhundredths of asecond)
AVG double Yes All • For dictionary managedpermanent tablespaces,dictionary managedtemporary tablespaces,or locally managedpermanent tablespaces:V$FILESTAT.WRITETIM
• For locally managedtemporary tablespaces:V$TEMPSTAT.WRITETIM
Writes/sec(WRITES_RATE)
Numberof writeoperations persecond
AVG double No All • For dictionary managedpermanent tablespaces,dictionary managedtemporary tablespaces,or locally managedpermanent tablespaces:V$FILESTAT.PHYWRTS /seconds-in-interval
• For locally managedtemporary tablespaces:V$TEMPSTAT.PHYWRTS /seconds-in-interval
Database (PD_PDDB)
Function
The Database (PD_PDDB) record stores performance data, taken at a specificpoint in time, indicating the following:
• General information about a database
2-118 Working with RecordsHitachi Tuning Manager Application Reports Reference

• Statistics on tablespaces• Statistics on data files
If the sp_inst_seg2.sql script is executed instead of the sp_inst.sql scriptduring setup for Agent for Oracle, Agent for Oracle references theDBA_SEGMENTS_2 view instead of the DBA_SEGMENTS view when creating theDatabase (PD_PDDB) record.
• For details about the setup procedure for Agent for Oracle, see the TuningManager Installation Guide.
Table 2-56 Database (PD_PDDB) Default and Changeable Values
Item Default Value Changeable?
Collection Interval 3600 Yes
Collection Offset 20
Log No
LOGIF (Blank)
Key Fields
None
Lifetime
From the creation to the deletion of a database
Record Size
• Fixed part: 914 bytes• Variable part: 0 bytes
Table 2-57 Database (PD_PDDB) Fields
Database (PD_PDDB)
View Name(Manager
Name)
Description
SumRule Format Delt
a
SupportedVersion
Data Source
Archive Change#(ARCHIVE_CHANGE_NUM)
Lastarchivedsystemchangenumber(SCN)
-- double No All V$DATABASE.ARCHIVE_CHANGEE#
Blocks(BLOCKS)
Size oftablespace in
-- double No All • For Oracle9i or later,which does not have
Working with Records 2-119Hitachi Tuning Manager Application Reports Reference
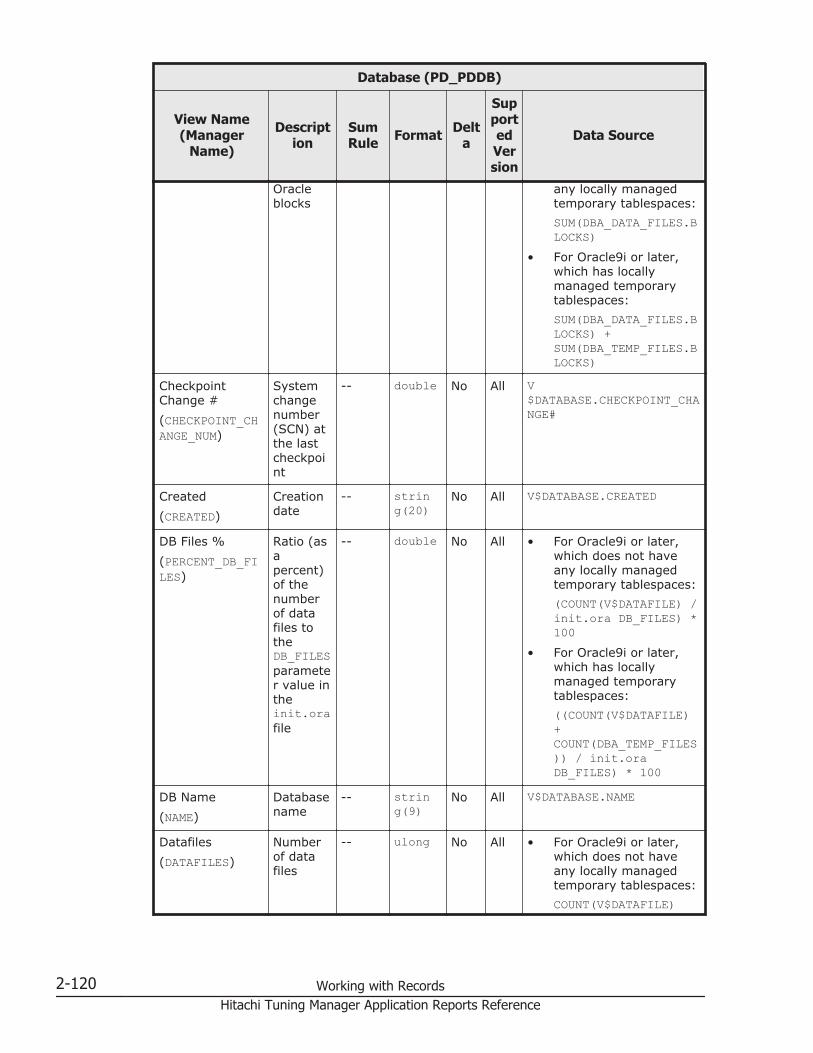
Database (PD_PDDB)
View Name(Manager
Name)
Description
SumRule Format Delt
a
SupportedVersion
Data Source
Oracleblocks
any locally managedtemporary tablespaces:SUM(DBA_DATA_FILES.BLOCKS)
• For Oracle9i or later,which has locallymanaged temporarytablespaces:SUM(DBA_DATA_FILES.BLOCKS) +SUM(DBA_TEMP_FILES.BLOCKS)
CheckpointChange #(CHECKPOINT_CHANGE_NUM)
Systemchangenumber(SCN) atthe lastcheckpoint
-- double No All V$DATABASE.CHECKPOINT_CHANGE#
Created(CREATED)
Creationdate
-- string(20)
No All V$DATABASE.CREATED
DB Files %(PERCENT_DB_FILES)
Ratio (asapercent)of thenumberof datafiles totheDB_FILESparameter value intheinit.orafile
-- double No All • For Oracle9i or later,which does not haveany locally managedtemporary tablespaces:(COUNT(V$DATAFILE) /init.ora DB_FILES) *100
• For Oracle9i or later,which has locallymanaged temporarytablespaces:((COUNT(V$DATAFILE)+COUNT(DBA_TEMP_FILES)) / init.oraDB_FILES) * 100
DB Name(NAME)
Databasename
-- string(9)
No All V$DATABASE.NAME
Datafiles(DATAFILES)
Numberof datafiles
-- ulong No All • For Oracle9i or later,which does not haveany locally managedtemporary tablespaces:COUNT(V$DATAFILE)
2-120 Working with RecordsHitachi Tuning Manager Application Reports Reference

Database (PD_PDDB)
View Name(Manager
Name)
Description
SumRule Format Delt
a
SupportedVersion
Data Source
• For Oracle9i or later,which has locallymanaged temporarytablespaces:COUNT(V$DATAFILE) +COUNT(DBA_TEMP_FILES)
Extents(EXTENTS)
Correctvaluescannotbecollectedfor thisfield.Numberofextents
-- double No All • For Oracle9i or later,which does not haveany locally managedtemporary tablespaces:SUM(DBA_SEGMENTS.EXTENTS)
• For Oracle9i or later,which has locallymanaged temporarytablespaces, whenlocaltemp_option=N:SUM(DBA_SEGMENTS.EXTENTS) + SUM(V$SORT_SEGMENT.TOTAL_EXTENTS)
• When a locallymanaged temporarytablespace exists, andlocaltemp_option=Y:SUM(DBA_SEGMENTS.EXTENTS) +SUM(DBA_TEMP_FILES.BYTES / V$TEMP_EXTENT_MAP.BYTES)
Free %(PERCENT_FREE)
Percentage ofspacethat isfree
-- double No All • For Oracle9i or later,which does not haveany locally managedtemporary tablespaces,or for UNDOtablespaces, whenundospace_option=N:(SUM(DBA_FREE_SPACE.BYTES) /DBA_DATA_FILES.BYTES) * 100
• For Oracle9i or later,which has locallymanaged temporary
Working with Records 2-121Hitachi Tuning Manager Application Reports Reference
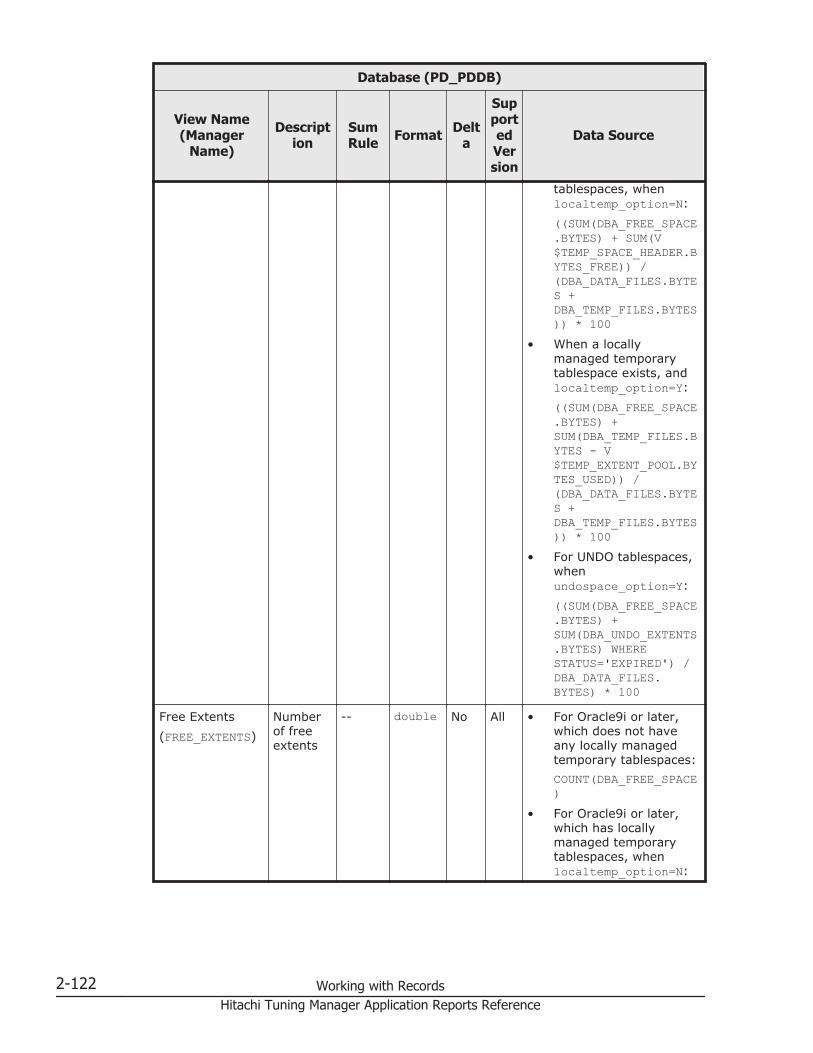
Database (PD_PDDB)
View Name(Manager
Name)
Description
SumRule Format Delt
a
SupportedVersion
Data Source
tablespaces, whenlocaltemp_option=N:((SUM(DBA_FREE_SPACE.BYTES) + SUM(V$TEMP_SPACE_HEADER.BYTES_FREE)) /(DBA_DATA_FILES.BYTES +DBA_TEMP_FILES.BYTES)) * 100
• When a locallymanaged temporarytablespace exists, andlocaltemp_option=Y:((SUM(DBA_FREE_SPACE.BYTES) +SUM(DBA_TEMP_FILES.BYTES - V$TEMP_EXTENT_POOL.BYTES_USED)) /(DBA_DATA_FILES.BYTES +DBA_TEMP_FILES.BYTES)) * 100
• For UNDO tablespaces,whenundospace_option=Y:((SUM(DBA_FREE_SPACE.BYTES) +SUM(DBA_UNDO_EXTENTS.BYTES) WHERESTATUS='EXPIRED') /DBA_DATA_FILES.BYTES) * 100
Free Extents(FREE_EXTENTS)
Numberof freeextents
-- double No All • For Oracle9i or later,which does not haveany locally managedtemporary tablespaces:COUNT(DBA_FREE_SPACE)
• For Oracle9i or later,which has locallymanaged temporarytablespaces, whenlocaltemp_option=N:
2-122 Working with RecordsHitachi Tuning Manager Application Reports Reference
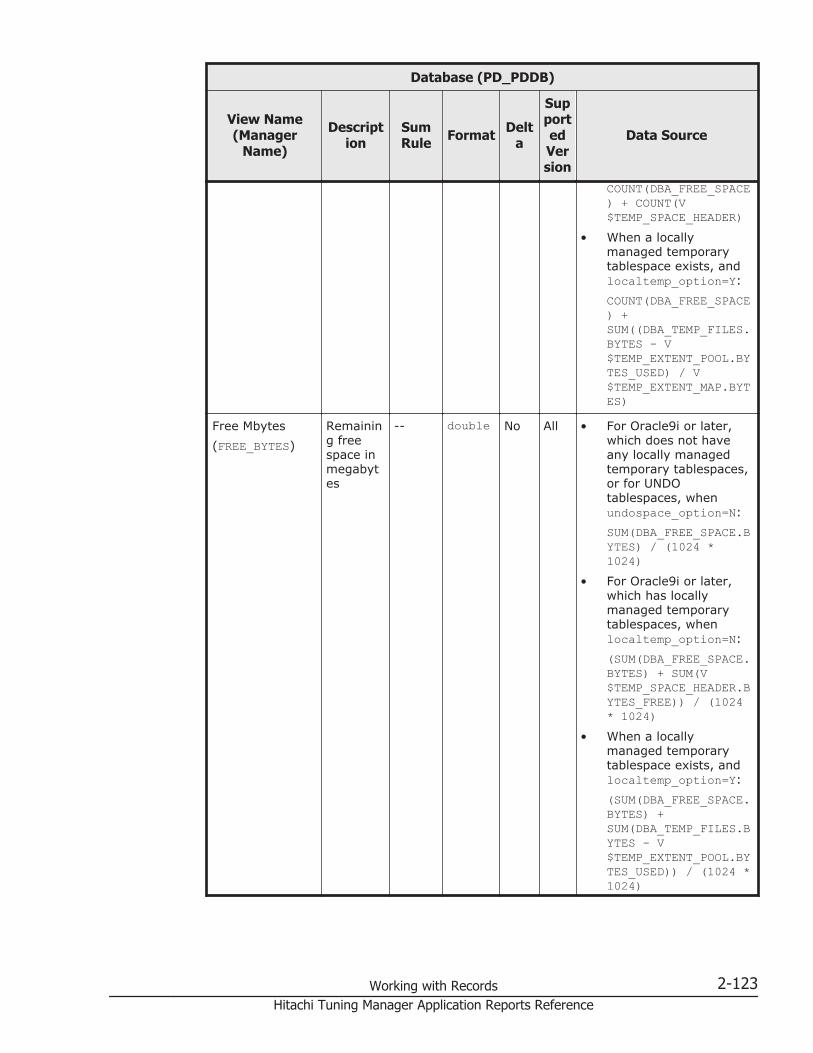
Database (PD_PDDB)
View Name(Manager
Name)
Description
SumRule Format Delt
a
SupportedVersion
Data Source
COUNT(DBA_FREE_SPACE) + COUNT(V$TEMP_SPACE_HEADER)
• When a locallymanaged temporarytablespace exists, andlocaltemp_option=Y:COUNT(DBA_FREE_SPACE) +SUM((DBA_TEMP_FILES.BYTES - V$TEMP_EXTENT_POOL.BYTES_USED) / V$TEMP_EXTENT_MAP.BYTES)
Free Mbytes(FREE_BYTES)
Remaining freespace inmegabytes
-- double No All • For Oracle9i or later,which does not haveany locally managedtemporary tablespaces,or for UNDOtablespaces, whenundospace_option=N:SUM(DBA_FREE_SPACE.BYTES) / (1024 *1024)
• For Oracle9i or later,which has locallymanaged temporarytablespaces, whenlocaltemp_option=N:(SUM(DBA_FREE_SPACE.BYTES) + SUM(V$TEMP_SPACE_HEADER.BYTES_FREE)) / (1024* 1024)
• When a locallymanaged temporarytablespace exists, andlocaltemp_option=Y:(SUM(DBA_FREE_SPACE.BYTES) +SUM(DBA_TEMP_FILES.BYTES - V$TEMP_EXTENT_POOL.BYTES_USED)) / (1024 *1024)
Working with Records 2-123Hitachi Tuning Manager Application Reports Reference

Database (PD_PDDB)
View Name(Manager
Name)
Description
SumRule Format Delt
a
SupportedVersion
Data Source
• For UNDO tablespaces,whenundospace_option=Y:((SUM(DBA_FREE_SPACE.BYTES) +SUM(DBA_UNDO_EXTENTS.BYTES) WHERESTATUS='EXPIRED') /(1024 * 1024)
High Max Extents(HIGH_MAX_EXTENTS)
Correctvaluescannotbecollectedfor thisfield.NumberofsegmentswhosePCT_MAX_EXTENTSexceeds90%
-- ulong No All • For Oracle9i or later,which does not haveany locally managedtemporary tablespaces:COUNT(DBA_SEGMENTS)whereDBA_SEGMENTS.EXTENTS> 0.9 *DBA_SEGMENTS.MAX_EXTENTS
• For Oracle9i or later,which has locallymanaged temporarytablespaces:COUNT(DBA_SEGMENTS)whereDBA_SEGMENTS.EXTENTS> 0.9 *DBA_SEGMENTS.MAX_EXTENTS + COUNT(V$SORT_SEGMENT) whereV$SORT_SEGMENT.TOTAL_EXTENTS > 0.9 * V$SORT_SEGMENT.MAX_SIZE
Links(LINKS)
This fieldis notsupported.Numberofdatabaselinks
-- short No Notsupported
COUNT(V$DBLINK)
Links In Tran(LINKS_IN_TRAN)
This fieldis notsupported.
-- short No Notsupported
SUM(V$DBLINK.IN_TRANSACTION)
2-124 Working with RecordsHitachi Tuning Manager Application Reports Reference

Database (PD_PDDB)
View Name(Manager
Name)
Description
SumRule Format Delt
a
SupportedVersion
Data Source
Numberof currentdatabaselinks intransaction
Links Logged On(LINKS_LOGGED_ON)
This fieldis notsupported.Numberofdatabaselinkscurrentlylogged on
-- short No Notsupported
SUM(V$DBLINK.LOGGED_ON)
Links OpenCursors(LINKS_OPEN_CURSORS)
This fieldis notsupported.Numberofdatabaselinks withopencursor
-- short No Notsupported
SUM(V$DBLINK.OPEN_CURSORS)
Log Files %(PERCENT_LOG_FILES)
Ratio (asapercent)of thenumberof REDOlog filesto theLOG_FILESparameter value intheinit.orafile.Correctvaluescannotbecollectedfor thisfield. The
-- double No All --
Working with Records 2-125Hitachi Tuning Manager Application Reports Reference
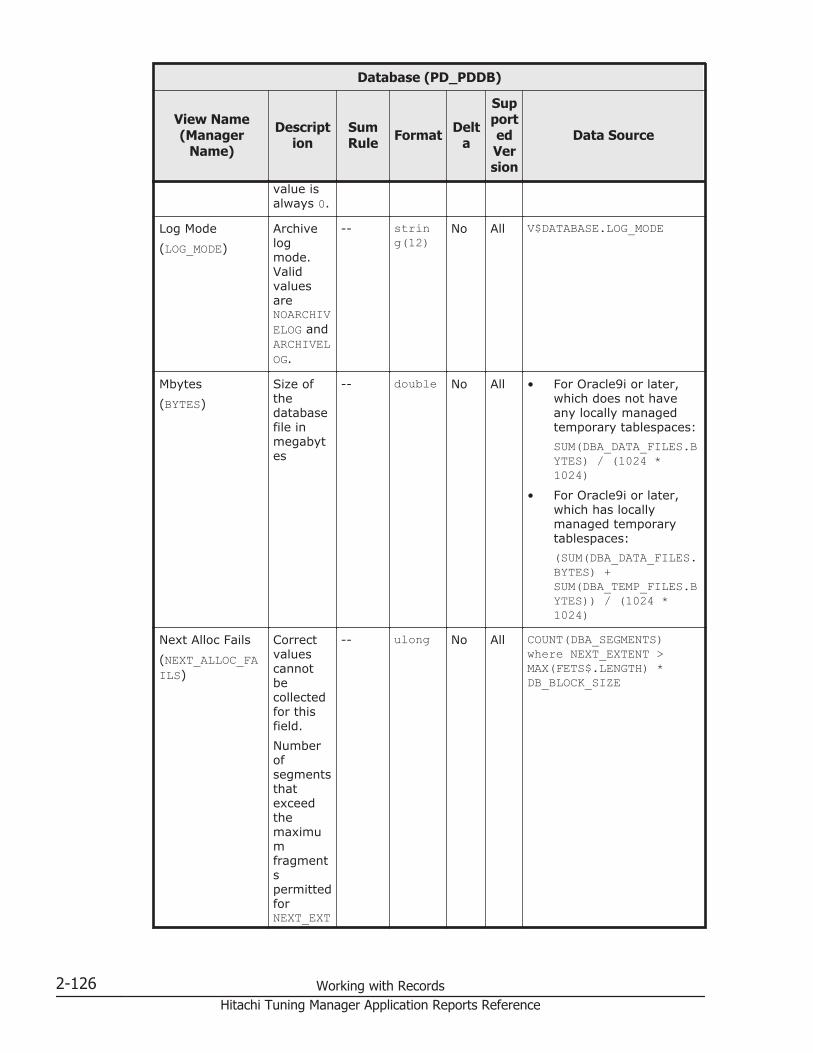
Database (PD_PDDB)
View Name(Manager
Name)
Description
SumRule Format Delt
a
SupportedVersion
Data Source
value isalways 0.
Log Mode(LOG_MODE)
Archivelogmode.ValidvaluesareNOARCHIVELOG andARCHIVELOG.
-- string(12)
No All V$DATABASE.LOG_MODE
Mbytes(BYTES)
Size ofthedatabasefile inmegabytes
-- double No All • For Oracle9i or later,which does not haveany locally managedtemporary tablespaces:SUM(DBA_DATA_FILES.BYTES) / (1024 *1024)
• For Oracle9i or later,which has locallymanaged temporarytablespaces:(SUM(DBA_DATA_FILES.BYTES) +SUM(DBA_TEMP_FILES.BYTES)) / (1024 *1024)
Next Alloc Fails(NEXT_ALLOC_FAILS)
Correctvaluescannotbecollectedfor thisfield.NumberofsegmentsthatexceedthemaximumfragmentspermittedforNEXT_EXT
-- ulong No All COUNT(DBA_SEGMENTS)where NEXT_EXTENT >MAX(FETS$.LENGTH) *DB_BLOCK_SIZE
2-126 Working with RecordsHitachi Tuning Manager Application Reports Reference

Database (PD_PDDB)
View Name(Manager
Name)
Description
SumRule Format Delt
a
SupportedVersion
Data Source
ENT. Fora locallymanagedtablespace, thevalue isalways 0.
Overextended(OVEREXTENDED)
Correctvaluescannotbecollectedfor thisfield.Numberofsegmentswithmorethan fiveextents
-- ulong No All • For Oracle9i or later,which does not haveany locally managedtemporary tablespaces:COUNT(DBA_SEGMENTS)where EXTENTS > 5
• For Oracle9i or later,which has locallymanaged temporarytablespaces:COUNT(DBA_SEGMENTS)where EXTENTS > 5 +COUNT(V$SORT_SEGMENT) whereTOTAL_EXTENTS > 5
Physical BlocksRead(PHYSICAL_BLOCKS_READ)
Numberofphysicalblockreadoperations
-- double No All SUM(V$FILESTAT.PHYBLKRD)
Physical BlocksWritten(PHYSICAL_BLOCKS_WRITTEN)
Numberofphysicalblockwriteoperations
-- double No All SUM(V$FILESTAT.PHYBLKWRT)
Physical Reads(PHYSICAL_READS)
Numberofphysicalreadoperations thatwerecompleted
-- double No All SUM(V$FILESTAT.PHYRDS)
Physical Writes Numberof
-- double No All SUM(V$FILESTAT.PHYWRTS)
Working with Records 2-127Hitachi Tuning Manager Application Reports Reference
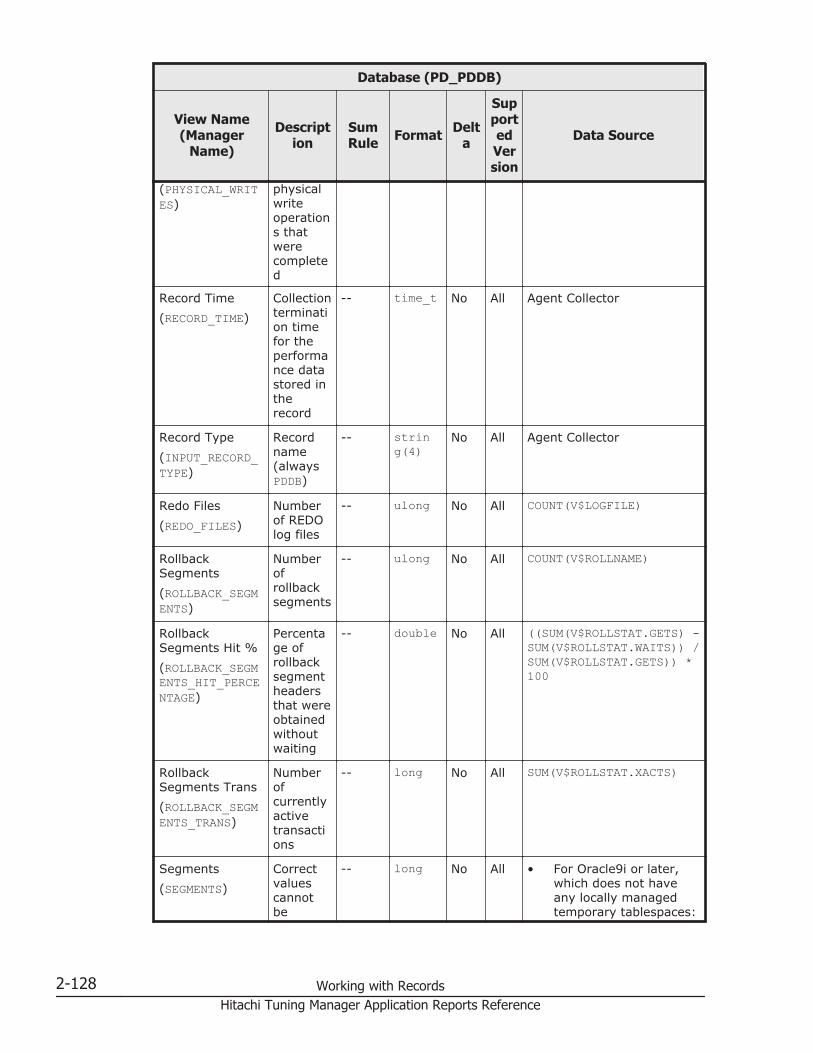
Database (PD_PDDB)
View Name(Manager
Name)
Description
SumRule Format Delt
a
SupportedVersion
Data Source
(PHYSICAL_WRITES)
physicalwriteoperations thatwerecompleted
Record Time(RECORD_TIME)
Collectiontermination timefor theperformance datastored intherecord
-- time_t No All Agent Collector
Record Type(INPUT_RECORD_TYPE)
Recordname(alwaysPDDB)
-- string(4)
No All Agent Collector
Redo Files(REDO_FILES)
Numberof REDOlog files
-- ulong No All COUNT(V$LOGFILE)
RollbackSegments(ROLLBACK_SEGMENTS)
Numberofrollbacksegments
-- ulong No All COUNT(V$ROLLNAME)
RollbackSegments Hit %(ROLLBACK_SEGMENTS_HIT_PERCENTAGE)
Percentage ofrollbacksegmentheadersthat wereobtainedwithoutwaiting
-- double No All ((SUM(V$ROLLSTAT.GETS) -SUM(V$ROLLSTAT.WAITS)) /SUM(V$ROLLSTAT.GETS)) *100
RollbackSegments Trans(ROLLBACK_SEGMENTS_TRANS)
Numberofcurrentlyactivetransactions
-- long No All SUM(V$ROLLSTAT.XACTS)
Segments(SEGMENTS)
Correctvaluescannotbe
-- long No All • For Oracle9i or later,which does not haveany locally managedtemporary tablespaces:
2-128 Working with RecordsHitachi Tuning Manager Application Reports Reference

Database (PD_PDDB)
View Name(Manager
Name)
Description
SumRule Format Delt
a
SupportedVersion
Data Source
collectedfor thisfield.Numberofsegments
COUNT(DBA_SEGMENTS)• For Oracle9i or later,
which has locallymanaged temporarytablespaces, whenlocaltemp_option=N:COUNT(DBA_SEGMENTS)+ COUNT(V$SORT_SEGMENT)
• When a locallymanaged temporarytablespace exists, andlocaltemp_option=Y:COUNT(DBA_SEGMENTS)+COUNT(DBA_TEMP_FILESGROUP BYTABLESPACE_NAME)
Sort Segments(SORT_SEGMENTS)
Correctvaluescannotbecollectedfor thisfield.Numberof sortsegments
-- ulong No All COUNT(V$SORT_SEGMENT)
Sorting Users(SORTING_USERS)
Numberof activeusers forthecurrentsortsegment
-- long No All SUM(V$SORT_SEGMENT.CURRENT_USERS)
Start Time(START_TIME)
Collectionstart timefor theperformance datastored intherecord
-- time_t No All Agent Collector
Tablespaces(TABLESPACES)
Numberof
-- double No All COUNT(DBA_TABLESPACES)
Working with Records 2-129Hitachi Tuning Manager Application Reports Reference

Database (PD_PDDB)
View Name(Manager
Name)
Description
SumRule Format Delt
a
SupportedVersion
Data Source
tablespaces
Used Mbytes(USED_BYTES)
Size ofusedarea inmegabytes. If aninstanceofOracle9ior later isbeingmonitored,performance dataabout thelocallymanagedtemporarytablespace is notcollected.
-- double No All • For tablespaces otherthan UNDOtablespaces, or forUNDO tablespaces,whenundospace_option=N:SUM(sm$ts_used.bytes) /(1024 * 1024)
• For UNDO tablespaces,whenundospace_option=Y:(SUM(sm$ts_used.bytes) -SUM(DBA_UNDO_EXTENTS.BYTES) WHERESTATUS='EXPIRED') /(1024 * 1024)
Write %(WRITE_PERCENTAGE)
Ratio (asapercent)ofphysicalwrites toallphysicalI/Os(readsandwrites)
-- double No All (SUM(V$FILESTAT.PHYWRTS) /(SUM(V$FILESTAT.PHYRDS)+ SUM(V$FILESTAT.PHYWRTS))) *100
Database Interval (PI_PIDB)
Function
The Database Interval (PI_PIDB) record stores performance data, taken atspecific intervals, about a database.
If the sp_inst_seg2.sql script is executed instead of the sp_inst.sql scriptduring setup for Agent for Oracle, Agent for Oracle references the
2-130 Working with RecordsHitachi Tuning Manager Application Reports Reference
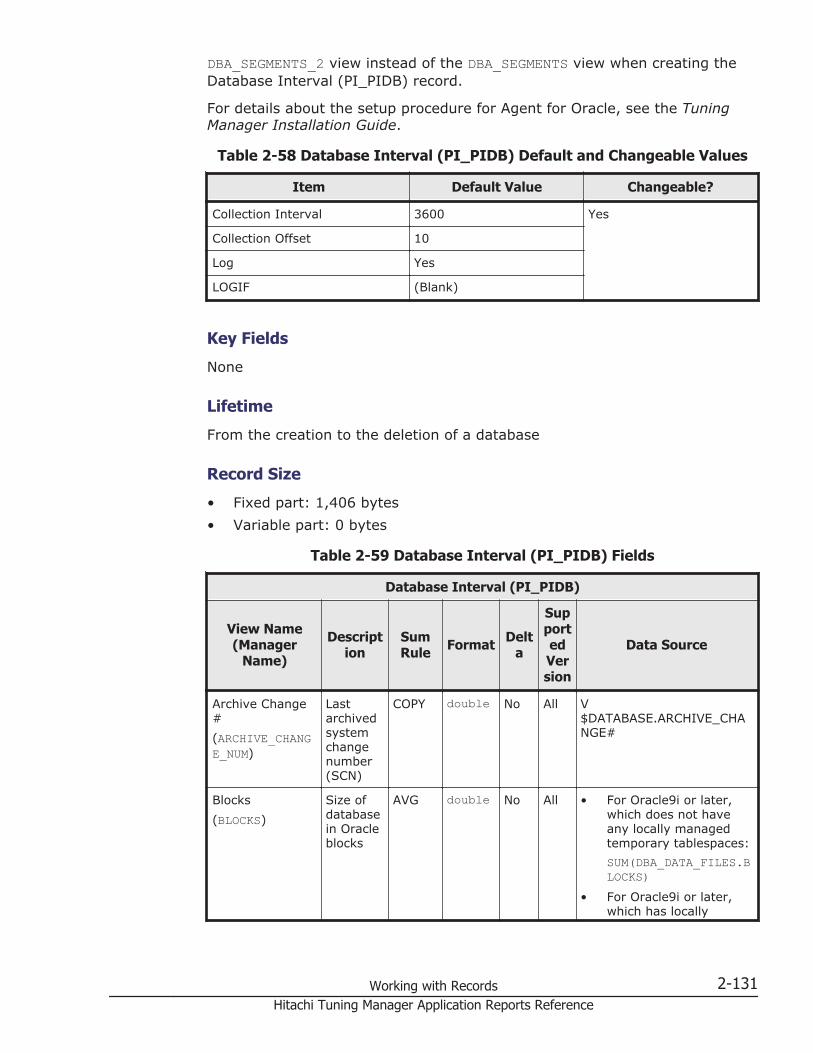
DBA_SEGMENTS_2 view instead of the DBA_SEGMENTS view when creating theDatabase Interval (PI_PIDB) record.
For details about the setup procedure for Agent for Oracle, see the TuningManager Installation Guide.
Table 2-58 Database Interval (PI_PIDB) Default and Changeable Values
Item Default Value Changeable?
Collection Interval 3600 Yes
Collection Offset 10
Log Yes
LOGIF (Blank)
Key Fields
None
Lifetime
From the creation to the deletion of a database
Record Size
• Fixed part: 1,406 bytes• Variable part: 0 bytes
Table 2-59 Database Interval (PI_PIDB) Fields
Database Interval (PI_PIDB)
View Name(Manager
Name)
Description
SumRule Format Delt
a
SupportedVersion
Data Source
Archive Change#(ARCHIVE_CHANGE_NUM)
Lastarchivedsystemchangenumber(SCN)
COPY double No All V$DATABASE.ARCHIVE_CHANGE#
Blocks(BLOCKS)
Size ofdatabasein Oracleblocks
AVG double No All • For Oracle9i or later,which does not haveany locally managedtemporary tablespaces:SUM(DBA_DATA_FILES.BLOCKS)
• For Oracle9i or later,which has locally
Working with Records 2-131Hitachi Tuning Manager Application Reports Reference

Database Interval (PI_PIDB)
View Name(Manager
Name)
Description
SumRule Format Delt
a
SupportedVersion
Data Source
managed temporarytablespaces:SUM(DBA_DATA_FILES.BLOCKS) +SUM(DBA_TEMP_FILES.BLOCKS)
CheckpointChange #(CHECKPOINT_CHANGE_NUM)
Systemchangenumber(SCN) atthe lastcheckpoint
COPY double No All V$DATABASE.CHECKPOINT_CHANGE#
Created(CREATED)
Creationdate
COPY string(20)
No All V$DATABASE.CREATED
Datafiles(DATAFILES)
Numberof datafiles
AVG ushort No All • For Oracle9i or later,which does not haveany locally managedtemporary tablespaces:COUNT(V$DATAFILE)
• For Oracle9i or later,which has locallymanaged temporarytablespaces:COUNT(V$DATAFILE) +COUNT(DBA_TEMP_FILES)
DB Files %(PERCENT_DB_FILES)
Ratio (asapercent)of thenumberof datafiles totheDB_FILESparameter value intheinit.orafile
AVG double No All • For Oracle9i or later,which does not haveany locally managedtemporary tablespaces:(COUNT(V$DATAFILE) /init.ora DB_FILES) *100
• For Oracle9i or later,which has locallymanaged temporarytablespaces:((COUNT(V$DATAFILE)+COUNT(DBA_TEMP_FILES)) / init.oraDB_FILES) * 100
DB Name Databasename
COPY string(9)
No All V$DATABASE.NAME
2-132 Working with RecordsHitachi Tuning Manager Application Reports Reference

Database Interval (PI_PIDB)
View Name(Manager
Name)
Description
SumRule Format Delt
a
SupportedVersion
Data Source
(NAME)
Extents(EXTENTS)
Correctvaluescannotbecollectedfor thisfield.Numberofextents
AVG double No All • For Oracle9i or later,which does not haveany locally managedtemporary tablespaces:SUM(DBA_SEGMENTS.EXTENTS)
• For Oracle9i or later,which has locallymanaged temporarytablespaces, whenlocaltemp_option=N:SUM(DBA_SEGMENTS.EXTENTS) + SUM(V$SORT_SEGMENT.TOTAL_EXTENTS)
• When a locallymanaged temporarytablespace exists, andlocaltemp_option=Y:SUM(DBA_SEGMENTS.EXTENTS) +SUM(DBA_TEMP_FILES.BYTES / V$TEMP_EXTENT_MAP.BYTES)
Free %(PERCENT_FREE)
Percentage ofspacethat isfree
AVG double No All • For Oracle9i or later,which does not haveany locally managedtemporary tablespaces,or for UNDOtablespaces, whenundospace_option=N:(SUM(DBA_FREE_SPACE.BYTES) /DBA_DATA_FILES.BYTES) * 100
• For Oracle9i or later,which has locallymanaged temporarytablespaces, whenlocaltemp_option=N:((SUM(DBA_FREE_SPACE.BYTES) + SUM(V$TEMP_SPACE_HEADER.BYTES_FREE)) /(DBA_DATA_FILES.BYTE
Working with Records 2-133Hitachi Tuning Manager Application Reports Reference
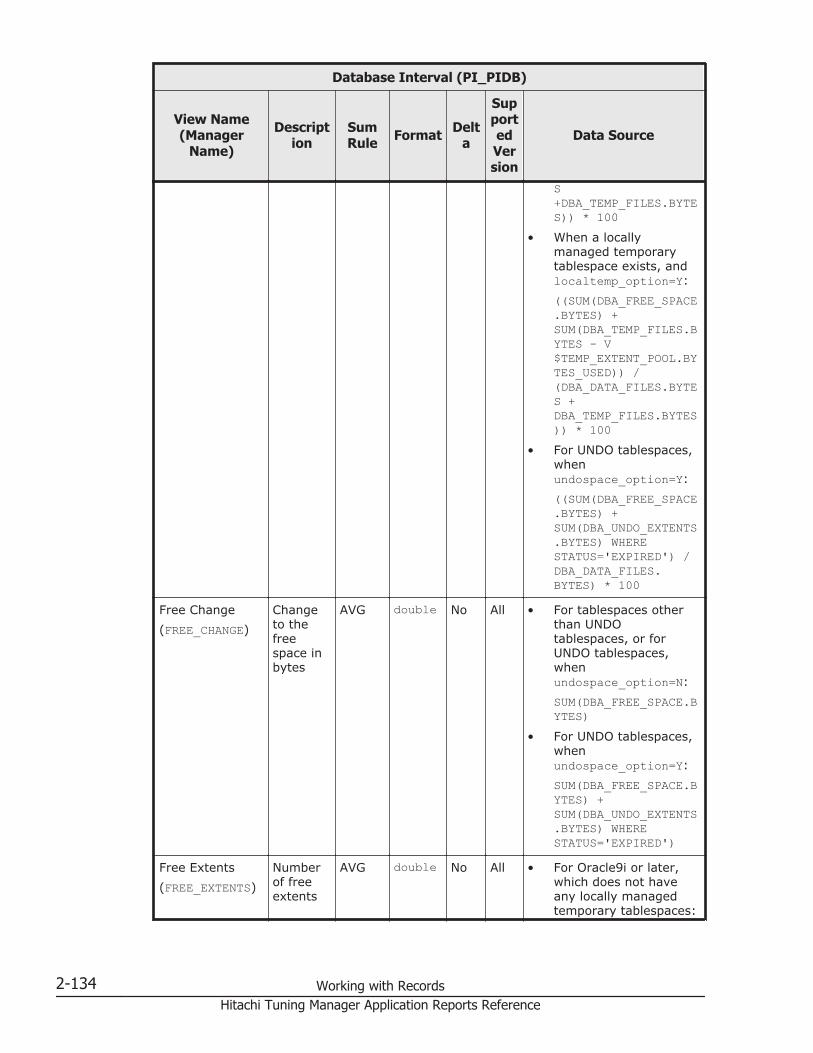
Database Interval (PI_PIDB)
View Name(Manager
Name)
Description
SumRule Format Delt
a
SupportedVersion
Data Source
S+DBA_TEMP_FILES.BYTES)) * 100
• When a locallymanaged temporarytablespace exists, andlocaltemp_option=Y:((SUM(DBA_FREE_SPACE.BYTES) +SUM(DBA_TEMP_FILES.BYTES - V$TEMP_EXTENT_POOL.BYTES_USED)) /(DBA_DATA_FILES.BYTES +DBA_TEMP_FILES.BYTES)) * 100
• For UNDO tablespaces,whenundospace_option=Y:((SUM(DBA_FREE_SPACE.BYTES) +SUM(DBA_UNDO_EXTENTS.BYTES) WHERESTATUS='EXPIRED') /DBA_DATA_FILES.BYTES) * 100
Free Change(FREE_CHANGE)
Changeto thefreespace inbytes
AVG double No All • For tablespaces otherthan UNDOtablespaces, or forUNDO tablespaces,whenundospace_option=N:SUM(DBA_FREE_SPACE.BYTES)
• For UNDO tablespaces,whenundospace_option=Y:SUM(DBA_FREE_SPACE.BYTES) +SUM(DBA_UNDO_EXTENTS.BYTES) WHERESTATUS='EXPIRED')
Free Extents(FREE_EXTENTS)
Numberof freeextents
AVG double No All • For Oracle9i or later,which does not haveany locally managedtemporary tablespaces:
2-134 Working with RecordsHitachi Tuning Manager Application Reports Reference
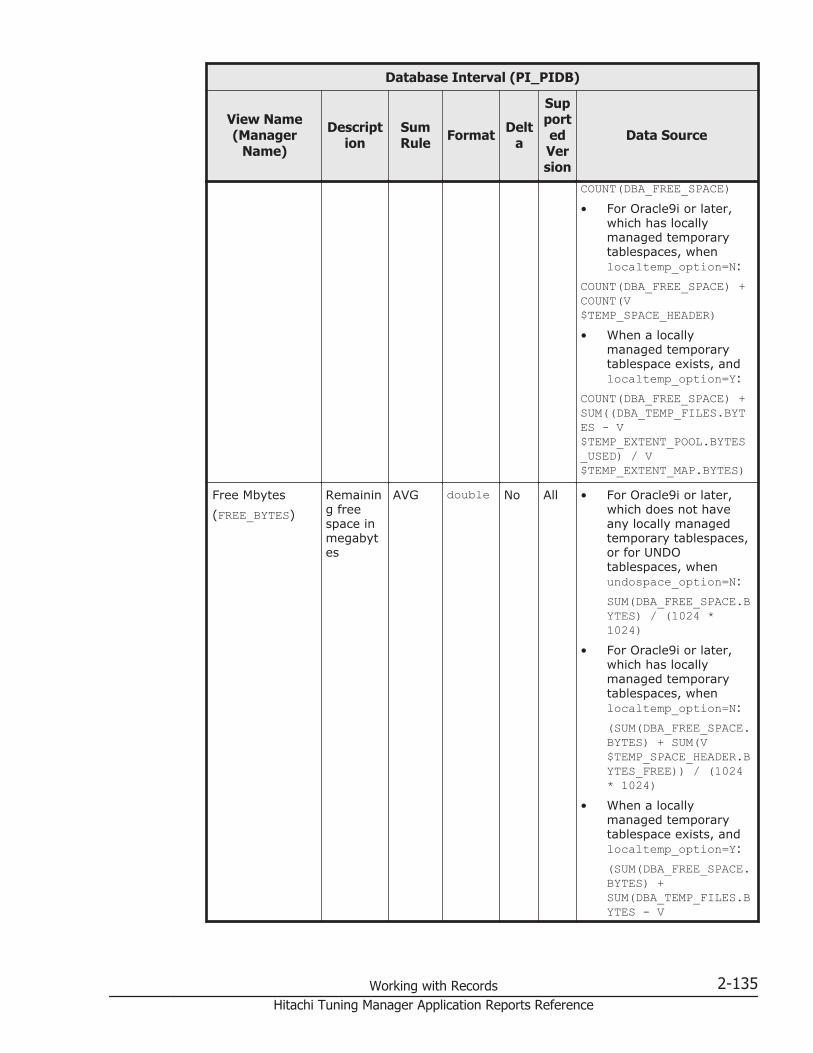
Database Interval (PI_PIDB)
View Name(Manager
Name)
Description
SumRule Format Delt
a
SupportedVersion
Data Source
COUNT(DBA_FREE_SPACE)• For Oracle9i or later,
which has locallymanaged temporarytablespaces, whenlocaltemp_option=N:
COUNT(DBA_FREE_SPACE) +COUNT(V$TEMP_SPACE_HEADER)• When a locally
managed temporarytablespace exists, andlocaltemp_option=Y:
COUNT(DBA_FREE_SPACE) +SUM((DBA_TEMP_FILES.BYTES - V$TEMP_EXTENT_POOL.BYTES_USED) / V$TEMP_EXTENT_MAP.BYTES)
Free Mbytes(FREE_BYTES)
Remaining freespace inmegabytes
AVG double No All • For Oracle9i or later,which does not haveany locally managedtemporary tablespaces,or for UNDOtablespaces, whenundospace_option=N:SUM(DBA_FREE_SPACE.BYTES) / (1024 *1024)
• For Oracle9i or later,which has locallymanaged temporarytablespaces, whenlocaltemp_option=N:(SUM(DBA_FREE_SPACE.BYTES) + SUM(V$TEMP_SPACE_HEADER.BYTES_FREE)) / (1024* 1024)
• When a locallymanaged temporarytablespace exists, andlocaltemp_option=Y:(SUM(DBA_FREE_SPACE.BYTES) +SUM(DBA_TEMP_FILES.BYTES - V
Working with Records 2-135Hitachi Tuning Manager Application Reports Reference

Database Interval (PI_PIDB)
View Name(Manager
Name)
Description
SumRule Format Delt
a
SupportedVersion
Data Source
$TEMP_EXTENT_POOL.BYTES_USED)) / (1024 *1024)
• For UNDO tablespaces,whenundospace_option=Y:((SUM(DBA_FREE_SPACE.BYTES) +SUM(DBA_UNDO_EXTENTS.BYTES) WHERESTATUS='EXPIRED') /(1024 * 1024)
High Max Extent(HIGH_MAX_EXTENTS)
Correctvaluescannotbecollectedfor thisfield.NumberofsegmentswhosePCT_MAX_EXTENTSexceeds90%
HILO ulong No All • For Oracle9i or later,which does not haveany locally managedtemporary tablespaces:COUNT(DBA_SEGMENTS)whereDBA_SEGMENTS.EXTENTS> 0.9 *DBA_SEGMENTS.MAX_EXTENTS
• For Oracle9i or later,which has locallymanaged temporarytablespaces:COUNT(DBA_SEGMENTS)whereDBA_SEGMENTS.EXTENTS> 0.9 *DBA_SEGMENTS.MAX_EXTENTS + COUNT(V$SORT_SEGMENT) whereV$SORT_SEGMENT.TOTAL_EXTENTS > 0.9 * V$SORT_SEGMENT.MAX_SIZE
I/O Ops/sec(IO_RATE)
Numberof I/Ooperations persecond
AVG double No All (SUM(V$FILESTAT.PHYRDS)+ SUM(V$FILESTAT.PHYWRTS)) /seconds in interval
Links(LINKS)
This fieldis notsupported.
AVG short No Notsupported
COUNT(V$DBLINK)
2-136 Working with RecordsHitachi Tuning Manager Application Reports Reference

Database Interval (PI_PIDB)
View Name(Manager
Name)
Description
SumRule Format Delt
a
SupportedVersion
Data Source
Numberofdatabaselinks
Links In Tran(LINKS_IN_TRAN)
This fieldis notsupported.Numberofcurrentdatabaselinks intransaction
AVG short No Notsupported
SUM(V$DBLINK.IN_TRANSACTION)
Links Logged On(LINKS_LOGGED_ON)
This fieldis notsupported.Numberofdatabaselinkscurrentlyloggedon
AVG short No Notsupported
SUM(V$DBLINK.LOGGED_ON)
Links OpenCursors(LINKS_OPEN_CURSORS)
This fieldis notsupported.Numberofdatabaselinks withopencursor
AVG short No Notsupported
SUM(V$DBLINK.OPEN_CURSORS)
Log Files %(PERCENT_LOG_FILES)
Ratio (asapercent)of thenumberof REDOlog filesto theLOG_FILESparameter value in
AVG double No All --
Working with Records 2-137Hitachi Tuning Manager Application Reports Reference
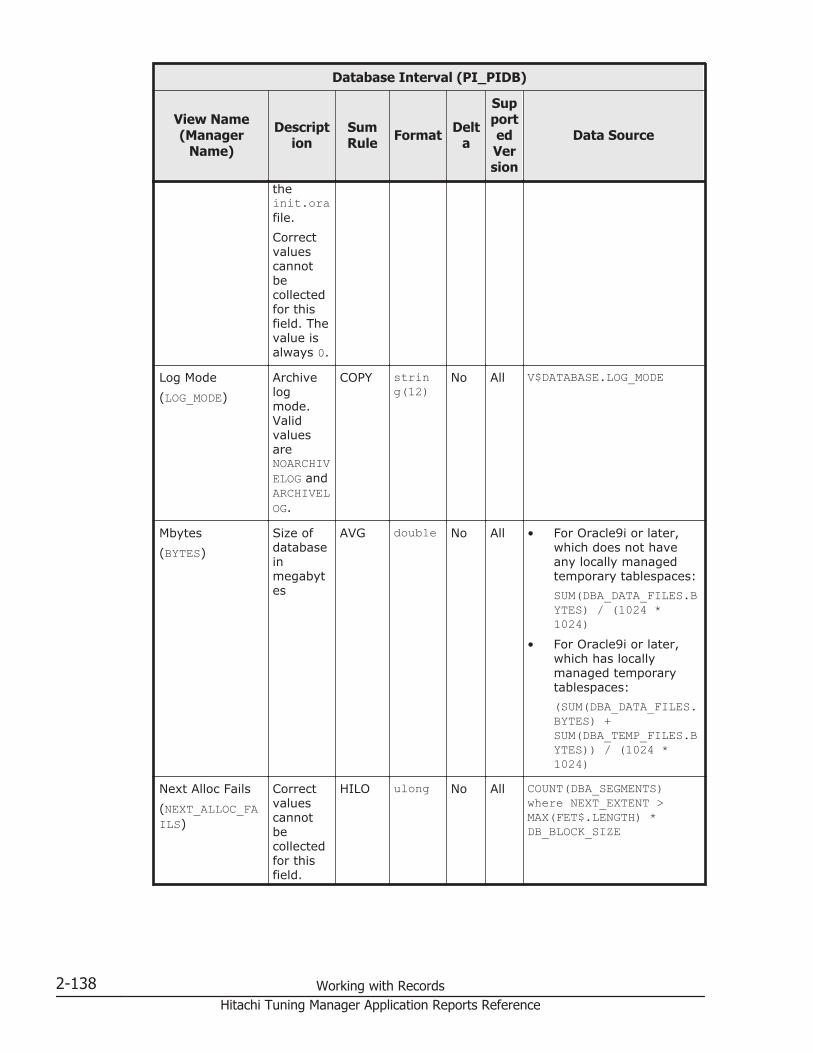
Database Interval (PI_PIDB)
View Name(Manager
Name)
Description
SumRule Format Delt
a
SupportedVersion
Data Source
theinit.orafile.Correctvaluescannotbecollectedfor thisfield. Thevalue isalways 0.
Log Mode(LOG_MODE)
Archivelogmode.ValidvaluesareNOARCHIVELOG andARCHIVELOG.
COPY string(12)
No All V$DATABASE.LOG_MODE
Mbytes(BYTES)
Size ofdatabaseinmegabytes
AVG double No All • For Oracle9i or later,which does not haveany locally managedtemporary tablespaces:SUM(DBA_DATA_FILES.BYTES) / (1024 *1024)
• For Oracle9i or later,which has locallymanaged temporarytablespaces:(SUM(DBA_DATA_FILES.BYTES) +SUM(DBA_TEMP_FILES.BYTES)) / (1024 *1024)
Next Alloc Fails(NEXT_ALLOC_FAILS)
Correctvaluescannotbecollectedfor thisfield.
HILO ulong No All COUNT(DBA_SEGMENTS)where NEXT_EXTENT >MAX(FET$.LENGTH) *DB_BLOCK_SIZE
2-138 Working with RecordsHitachi Tuning Manager Application Reports Reference

Database Interval (PI_PIDB)
View Name(Manager
Name)
Description
SumRule Format Delt
a
SupportedVersion
Data Source
Numberofsegmentsthatexceedthemaximumfragmentspermitted forNEXT_EXTENT. Fora locallymanagedtablespace, thevalue isalways 0.
Overextended(OVEREXTENDED)
Correctvaluescannotbecollectedfor thisfield.Numberofsegmentswithmorethan fiveextents
HILO ulong No All • For Oracle9i or later,which does not haveany locally managedtemporary tablespaces:COUNT(DBA_SEGMENTS)where EXTENTS > 5
• For Oracle9i or later,which has locallymanaged temporarytablespaces:COUNT(DBA_SEGMENTS)where EXTENTS > 5 +COUNT(V$SORT_SEGMENT) whereTOTAL_EXTENTS > 5
Physical BlocksRead(PHYSICAL_BLOCKS_READ)
Numberofphysicalblockreadoperations
AVG double Yes All SUM(V$FILESTAT.PHYBLKRD)
Physical BlocksWritten(PHYSICAL_BLOCKS_WRITTEN)
Numberofphysicalblockwrite
AVG double Yes All SUM(V$FILESTAT.PHYBLKWRT)
Working with Records 2-139Hitachi Tuning Manager Application Reports Reference

Database Interval (PI_PIDB)
View Name(Manager
Name)
Description
SumRule Format Delt
a
SupportedVersion
Data Source
operations
Physical Reads(PHYSICAL_READS)
Numberofphysicalreadoperations thatwerecompleted
AVG double Yes All SUM(V$FILESTAT.PHYRDS)
Physical Writes(PHYSICAL_WRITES)
Numberofphysicalwriteoperations thatwerecompleted
AVG double Yes All SUM(V$FILESTAT.PHYWRTS)
Reads/sec(READ_RATE)
Numberof readoperations persecond
AVG double No All SUM(V$FILESTAT.PHYRDS) /seconds in interval
Record Time(RECORD_TIME)
Collectiontermination timefor theperformance datastored intherecord
COPY time_t No All Agent Collector
Record Type(INPUT_RECORD_TYPE)
Recordname(alwaysPIDB)
COPY string(4)
No All Agent Collector
Redo Files(REDO_FILES)
Numberof REDOlog files
AVG ulong No All COUNT(V$LOGFILE)
RollbackSegments(ROLLBACK_SEGMENTS)
Numberofrollbacksegments
AVG ulong No All COUNT(V$ROLLNAME)
2-140 Working with RecordsHitachi Tuning Manager Application Reports Reference
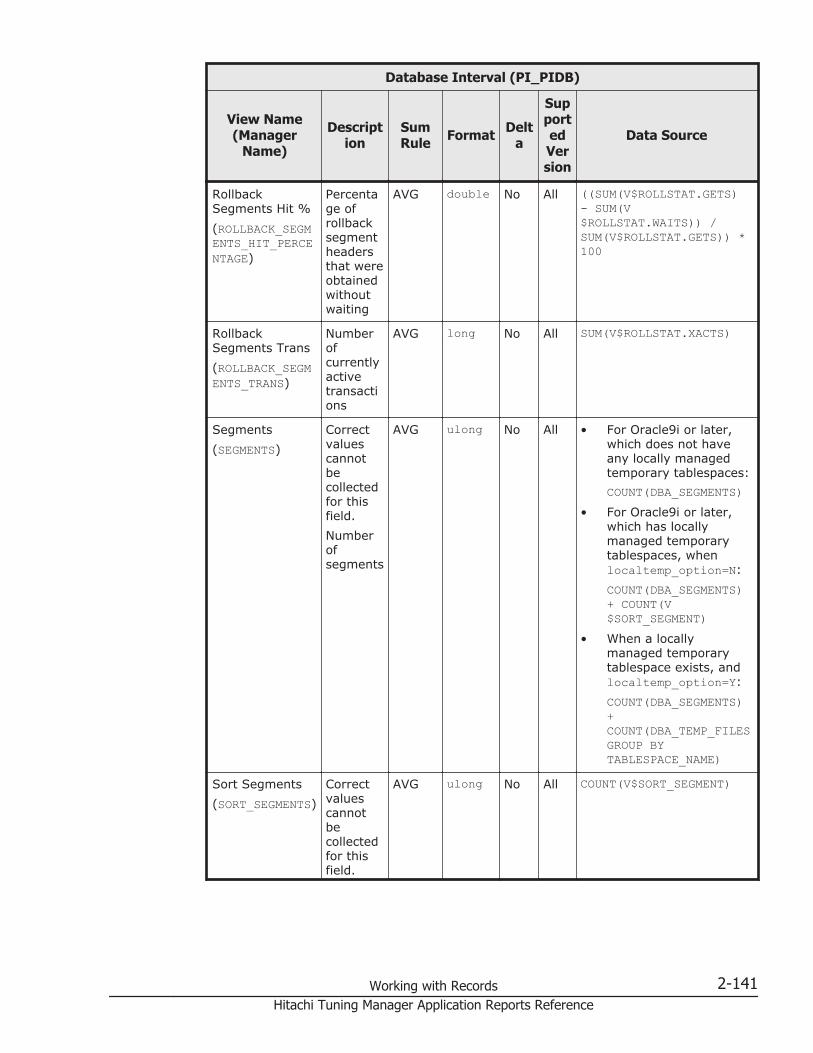
Database Interval (PI_PIDB)
View Name(Manager
Name)
Description
SumRule Format Delt
a
SupportedVersion
Data Source
RollbackSegments Hit %(ROLLBACK_SEGMENTS_HIT_PERCENTAGE)
Percentage ofrollbacksegmentheadersthat wereobtainedwithoutwaiting
AVG double No All ((SUM(V$ROLLSTAT.GETS)- SUM(V$ROLLSTAT.WAITS)) /SUM(V$ROLLSTAT.GETS)) *100
RollbackSegments Trans(ROLLBACK_SEGMENTS_TRANS)
Numberofcurrentlyactivetransactions
AVG long No All SUM(V$ROLLSTAT.XACTS)
Segments(SEGMENTS)
Correctvaluescannotbecollectedfor thisfield.Numberofsegments
AVG ulong No All • For Oracle9i or later,which does not haveany locally managedtemporary tablespaces:COUNT(DBA_SEGMENTS)
• For Oracle9i or later,which has locallymanaged temporarytablespaces, whenlocaltemp_option=N:COUNT(DBA_SEGMENTS)+ COUNT(V$SORT_SEGMENT)
• When a locallymanaged temporarytablespace exists, andlocaltemp_option=Y:COUNT(DBA_SEGMENTS)+COUNT(DBA_TEMP_FILESGROUP BYTABLESPACE_NAME)
Sort Segments(SORT_SEGMENTS)
Correctvaluescannotbecollectedfor thisfield.
AVG ulong No All COUNT(V$SORT_SEGMENT)
Working with Records 2-141Hitachi Tuning Manager Application Reports Reference
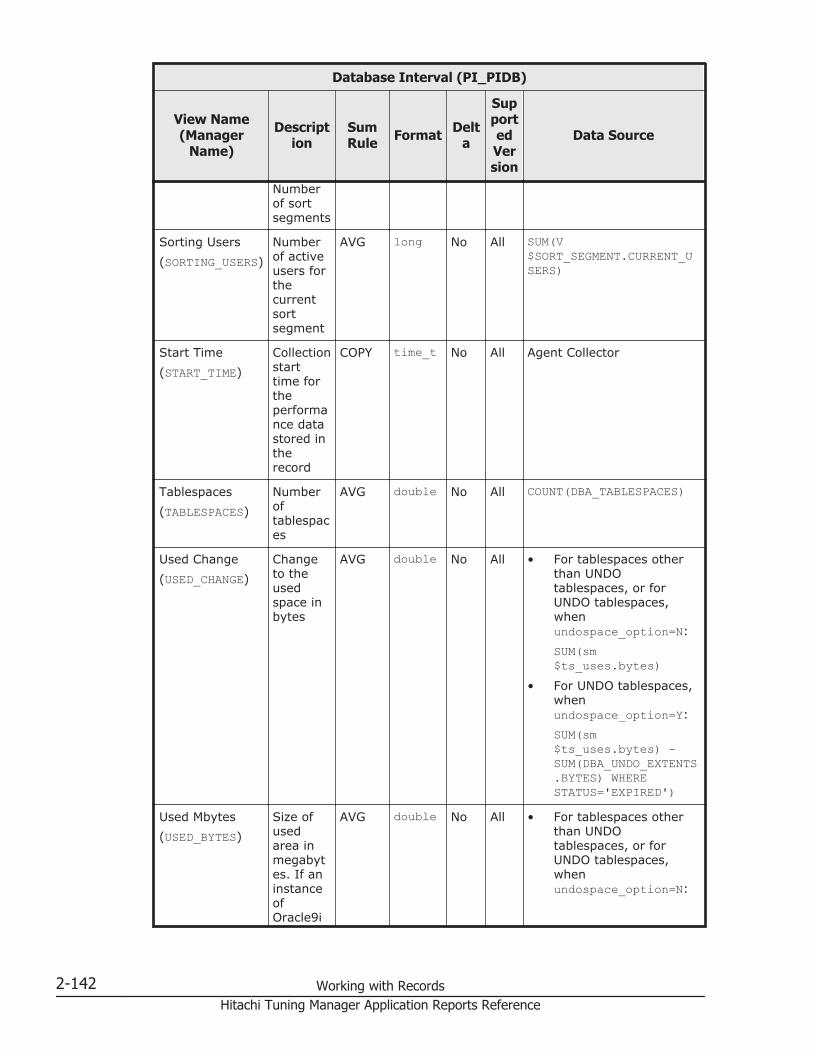
Database Interval (PI_PIDB)
View Name(Manager
Name)
Description
SumRule Format Delt
a
SupportedVersion
Data Source
Numberof sortsegments
Sorting Users(SORTING_USERS)
Numberof activeusers forthecurrentsortsegment
AVG long No All SUM(V$SORT_SEGMENT.CURRENT_USERS)
Start Time(START_TIME)
Collectionstarttime fortheperformance datastored intherecord
COPY time_t No All Agent Collector
Tablespaces(TABLESPACES)
Numberoftablespaces
AVG double No All COUNT(DBA_TABLESPACES)
Used Change(USED_CHANGE)
Changeto theusedspace inbytes
AVG double No All • For tablespaces otherthan UNDOtablespaces, or forUNDO tablespaces,whenundospace_option=N:SUM(sm$ts_uses.bytes)
• For UNDO tablespaces,whenundospace_option=Y:SUM(sm$ts_uses.bytes) -SUM(DBA_UNDO_EXTENTS.BYTES) WHERESTATUS='EXPIRED')
Used Mbytes(USED_BYTES)
Size ofusedarea inmegabytes. If aninstanceofOracle9i
AVG double No All • For tablespaces otherthan UNDOtablespaces, or forUNDO tablespaces,whenundospace_option=N:
2-142 Working with RecordsHitachi Tuning Manager Application Reports Reference
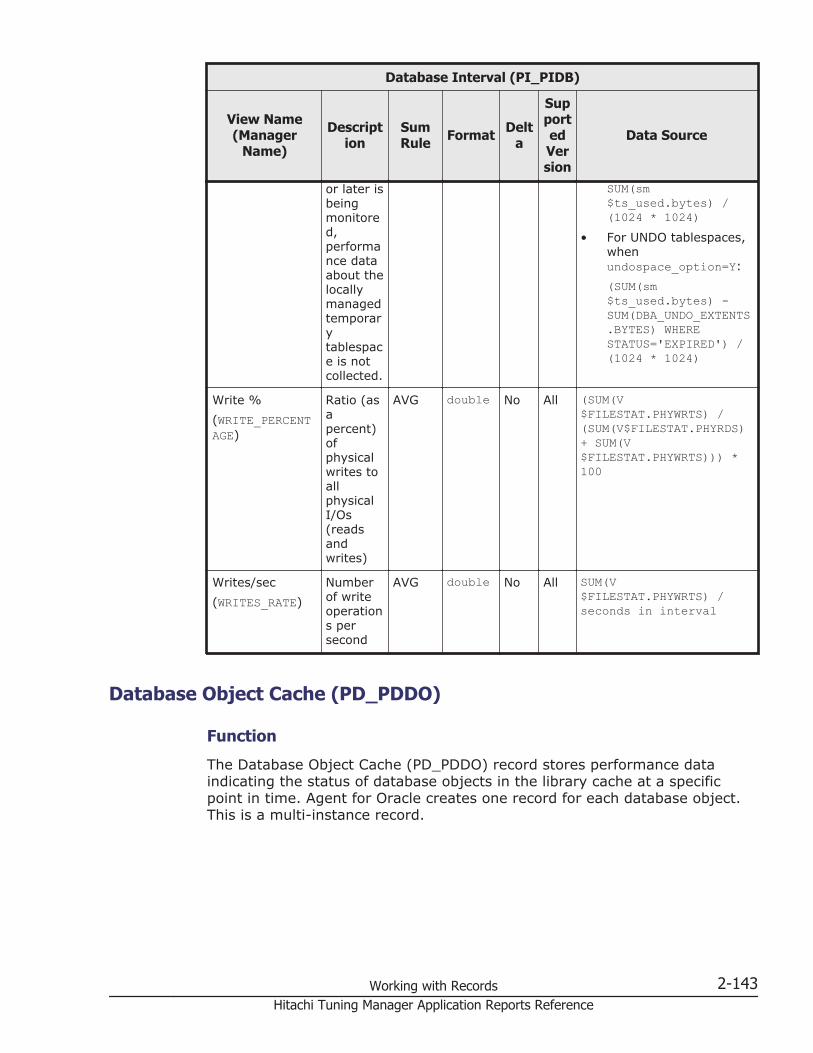
Database Interval (PI_PIDB)
View Name(Manager
Name)
Description
SumRule Format Delt
a
SupportedVersion
Data Source
or later isbeingmonitored,performance dataabout thelocallymanagedtemporarytablespace is notcollected.
SUM(sm$ts_used.bytes) /(1024 * 1024)
• For UNDO tablespaces,whenundospace_option=Y:(SUM(sm$ts_used.bytes) -SUM(DBA_UNDO_EXTENTS.BYTES) WHERESTATUS='EXPIRED') /(1024 * 1024)
Write %(WRITE_PERCENTAGE)
Ratio (asapercent)ofphysicalwrites toallphysicalI/Os(readsandwrites)
AVG double No All (SUM(V$FILESTAT.PHYWRTS) /(SUM(V$FILESTAT.PHYRDS)+ SUM(V$FILESTAT.PHYWRTS))) *100
Writes/sec(WRITES_RATE)
Numberof writeoperations persecond
AVG double No All SUM(V$FILESTAT.PHYWRTS) /seconds in interval
Database Object Cache (PD_PDDO)
Function
The Database Object Cache (PD_PDDO) record stores performance dataindicating the status of database objects in the library cache at a specificpoint in time. Agent for Oracle creates one record for each database object.This is a multi-instance record.
Working with Records 2-143Hitachi Tuning Manager Application Reports Reference

Table 2-60 Database Object Cache (PD_PDDO) Default and ChangeableValues
Item Default Value Changeable?
Collection Interval 600 Yes
Collection Offset 30
Log No
LOGIF (Blank)
Key Fields
Object Name (NAME)
Lifetime
From the loading to erasing of data in the library cache of the database object
Record Size
• Fixed part: 678 bytes• Variable part: 298 bytes
Table 2-61 Database Object Cache (PD_PDDO) Fields
Database Object Cache (PD_PDDO)
View Name(Manager
Name)
Description
SumRule Format Delt
a
SupportedVersion
Data Source
DB Link(DB_LINK)
Name ofthedatabaselink, if itexists
-- string(64)
No All V$DB_OBJECT_CACHE.DB_LINK
Executions(EXECUTIONS)
Numberof timesobjectwasexecuted
-- double No All V$DB_OBJECT_CACHE.EXECUTIONS
Kept(KEPT)
If theobjectwasretainedby theDBMS_SHARED_POOL
-- string(3)
No All V$DB_OBJECT_CACHE.KEPT
2-144 Working with RecordsHitachi Tuning Manager Application Reports Reference

Database Object Cache (PD_PDDO)
View Name(Manager
Name)
Description
SumRule Format Delt
a
SupportedVersion
Data Source
.KEEPPL/SQLprocedure, thevalue ofthis fieldis YES.Otherwise, thevalue isNO.
Loads(LOADS)
Numberof timestheobjectwasloaded(thisvalueincreasesevenwhen theobject isinvalid)
-- double No All V$DB_OBJECT_CACHE.LOADS
Locks(LOCKS)
Numberof userscurrentlylockingthisobject
-- long No All V$DB_OBJECT_CACHE.LOCKS
Namespace(NAMESPACE)
Object'snamespace inlibrarycache.ValidvaluesareTABLE/PROCEDURE, BODY,TRIGGER,INDEX,CLUSTER,andOBJECT.
-- string(15)
No All V$DB_OBJECT_CACHE.NAMESPACE
Object Name Objectname
-- string(100)
No All V$DB_OBJECT_CACHE.NAME
Working with Records 2-145Hitachi Tuning Manager Application Reports Reference

Database Object Cache (PD_PDDO)
View Name(Manager
Name)
Description
SumRule Format Delt
a
SupportedVersion
Data Source
(NAME)
Owner(OWNER)
Object'sowner
-- string(64)
No All V$DB_OBJECT_CACHE.OWNER
Pins(PINS)
Numberof userswhocurrentlyhave theobject
-- long No All V$DB_OBJECT_CACHE.PINS
Record Time(RECORD_TIME)
Collectiontermination timefor theperformance datastored intherecord
-- time_t No All Agent Collector
Record Type(INPUT_RECORD_TYPE)
Recordname(alwaysPDDO)
-- string(4)
No All Agent Collector
Sharable Mem(SHARABLE_MEM)
Size ofsharedmemory(inbytes)used bytheobject insharedpool
-- double No All V$DB_OBJECT_CACHE.SHARABLE_MEM
Start Time(START_TIME)
Collection starttime fortheperformance datastored intherecord
-- time_t No All Agent Collector
Type(TYPE)
Objecttype.Validvalues
-- string(14)
No All V$DB_OBJECT_CACHE.TYPE
2-146 Working with RecordsHitachi Tuning Manager Application Reports Reference
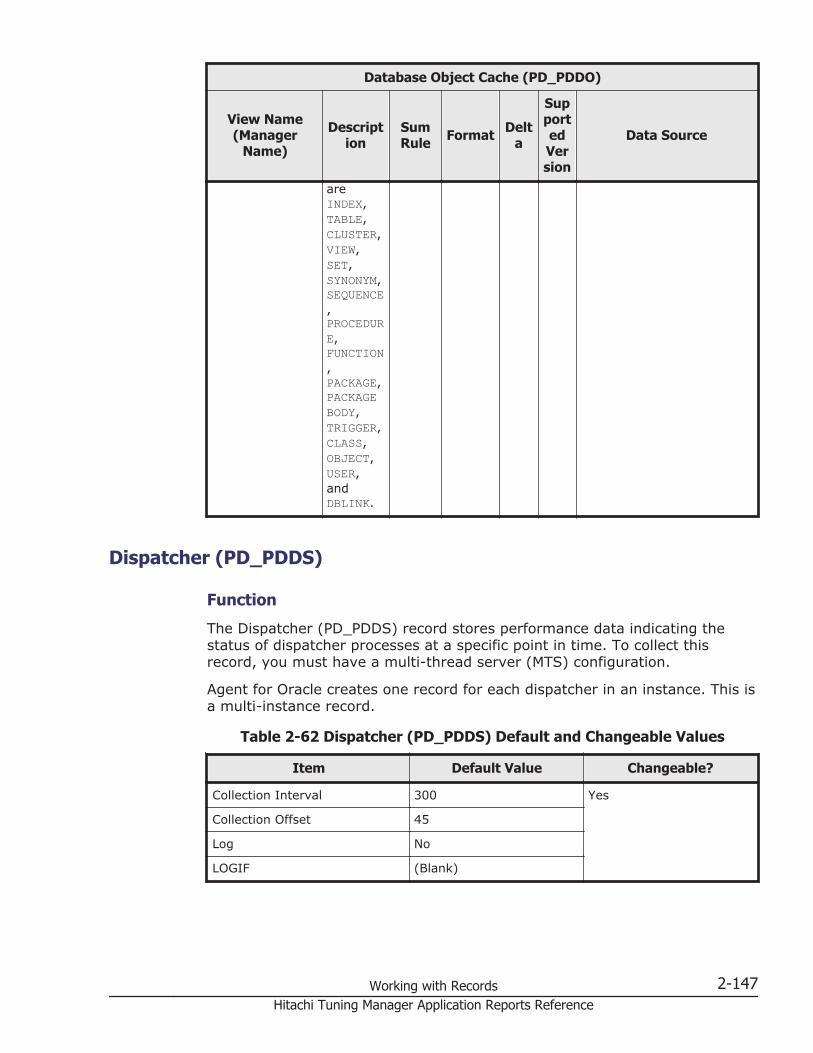
Database Object Cache (PD_PDDO)
View Name(Manager
Name)
Description
SumRule Format Delt
a
SupportedVersion
Data Source
areINDEX,TABLE,CLUSTER,VIEW,SET,SYNONYM,SEQUENCE,PROCEDURE,FUNCTION,PACKAGE,PACKAGEBODY,TRIGGER,CLASS,OBJECT,USER,andDBLINK.
Dispatcher (PD_PDDS)
Function
The Dispatcher (PD_PDDS) record stores performance data indicating thestatus of dispatcher processes at a specific point in time. To collect thisrecord, you must have a multi-thread server (MTS) configuration.
Agent for Oracle creates one record for each dispatcher in an instance. This isa multi-instance record.
Table 2-62 Dispatcher (PD_PDDS) Default and Changeable Values
Item Default Value Changeable?
Collection Interval 300 Yes
Collection Offset 45
Log No
LOGIF (Blank)
Working with Records 2-147Hitachi Tuning Manager Application Reports Reference
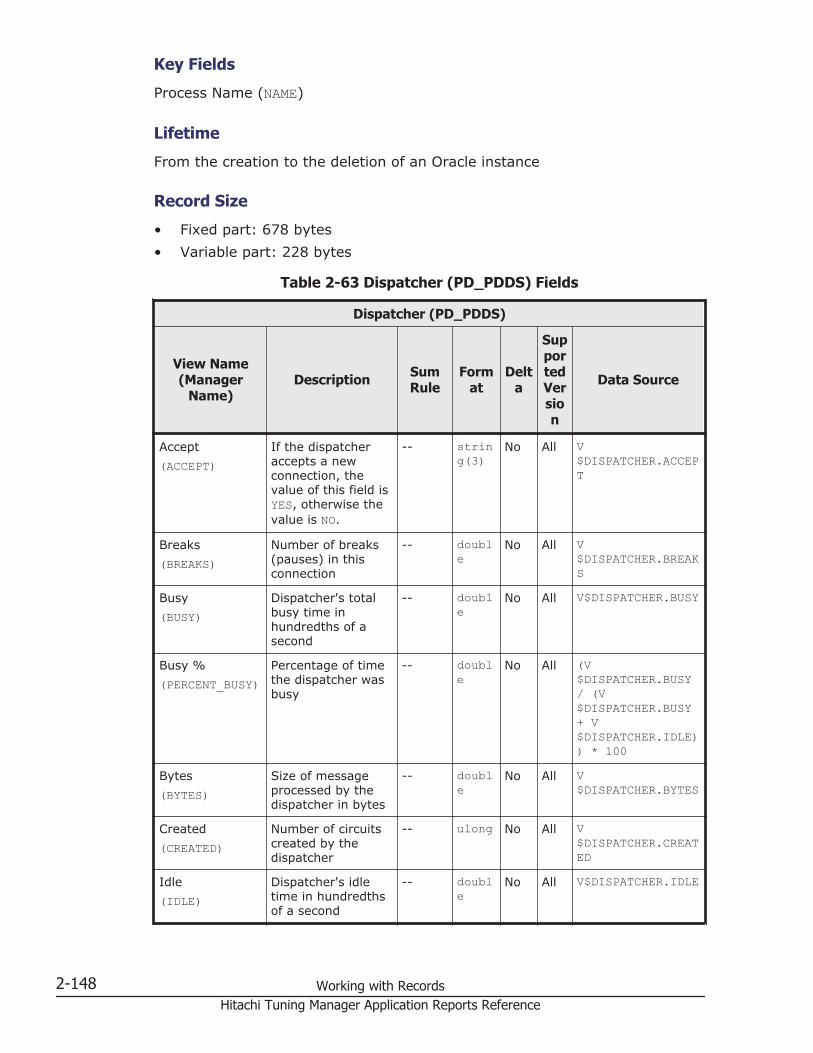
Key Fields
Process Name (NAME)
Lifetime
From the creation to the deletion of an Oracle instance
Record Size
• Fixed part: 678 bytes• Variable part: 228 bytes
Table 2-63 Dispatcher (PD_PDDS) Fields
Dispatcher (PD_PDDS)
View Name(Manager
Name)Description Sum
RuleForm
atDelt
a
SupportedVersion
Data Source
Accept(ACCEPT)
If the dispatcheraccepts a newconnection, thevalue of this field isYES, otherwise thevalue is NO.
-- string(3)
No All V$DISPATCHER.ACCEPT
Breaks(BREAKS)
Number of breaks(pauses) in thisconnection
-- double
No All V$DISPATCHER.BREAKS
Busy(BUSY)
Dispatcher's totalbusy time inhundredths of asecond
-- double
No All V$DISPATCHER.BUSY
Busy %(PERCENT_BUSY)
Percentage of timethe dispatcher wasbusy
-- double
No All (V$DISPATCHER.BUSY/ (V$DISPATCHER.BUSY+ V$DISPATCHER.IDLE)) * 100
Bytes(BYTES)
Size of messageprocessed by thedispatcher in bytes
-- double
No All V$DISPATCHER.BYTES
Created(CREATED)
Number of circuitscreated by thedispatcher
-- ulong No All V$DISPATCHER.CREATED
Idle(IDLE)
Dispatcher's idletime in hundredthsof a second
-- double
No All V$DISPATCHER.IDLE
2-148 Working with RecordsHitachi Tuning Manager Application Reports Reference
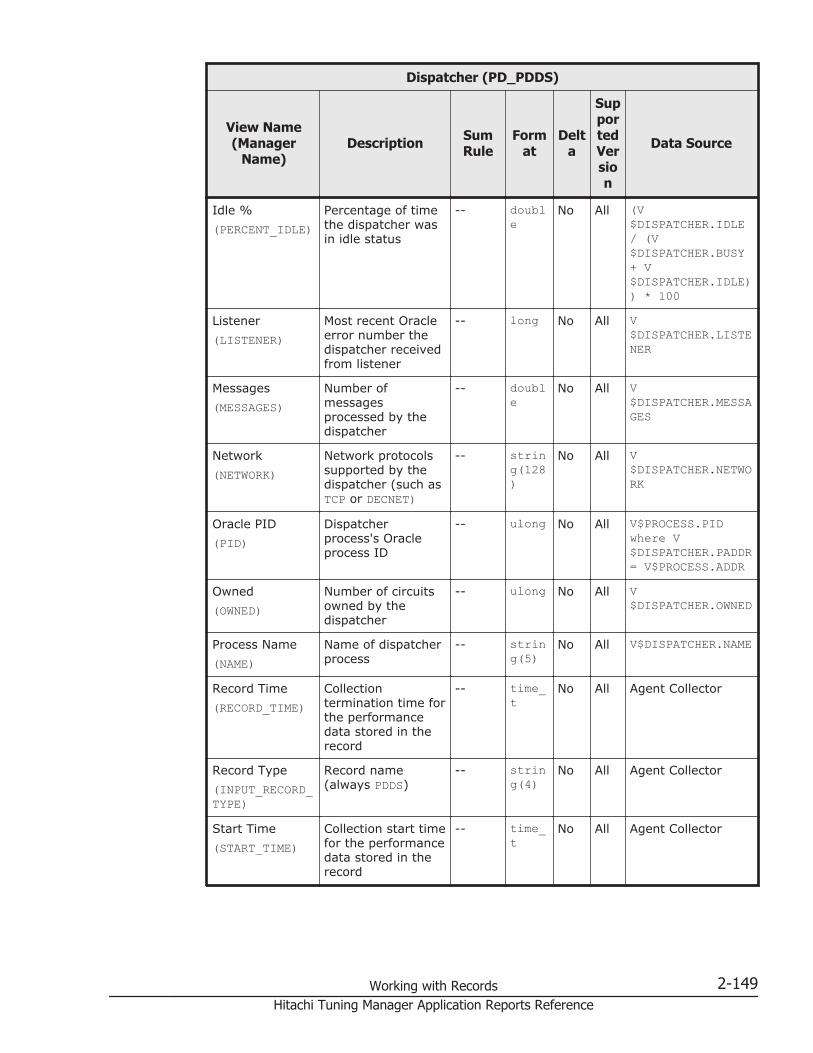
Dispatcher (PD_PDDS)
View Name(Manager
Name)Description Sum
RuleForm
atDelt
a
SupportedVersion
Data Source
Idle %(PERCENT_IDLE)
Percentage of timethe dispatcher wasin idle status
-- double
No All (V$DISPATCHER.IDLE/ (V$DISPATCHER.BUSY+ V$DISPATCHER.IDLE)) * 100
Listener(LISTENER)
Most recent Oracleerror number thedispatcher receivedfrom listener
-- long No All V$DISPATCHER.LISTENER
Messages(MESSAGES)
Number ofmessagesprocessed by thedispatcher
-- double
No All V$DISPATCHER.MESSAGES
Network(NETWORK)
Network protocolssupported by thedispatcher (such asTCP or DECNET)
-- string(128)
No All V$DISPATCHER.NETWORK
Oracle PID(PID)
Dispatcherprocess's Oracleprocess ID
-- ulong No All V$PROCESS.PIDwhere V$DISPATCHER.PADDR= V$PROCESS.ADDR
Owned(OWNED)
Number of circuitsowned by thedispatcher
-- ulong No All V$DISPATCHER.OWNED
Process Name(NAME)
Name of dispatcherprocess
-- string(5)
No All V$DISPATCHER.NAME
Record Time(RECORD_TIME)
Collectiontermination time forthe performancedata stored in therecord
-- time_t
No All Agent Collector
Record Type(INPUT_RECORD_TYPE)
Record name(always PDDS)
-- string(4)
No All Agent Collector
Start Time(START_TIME)
Collection start timefor the performancedata stored in therecord
-- time_t
No All Agent Collector
Working with Records 2-149Hitachi Tuning Manager Application Reports Reference
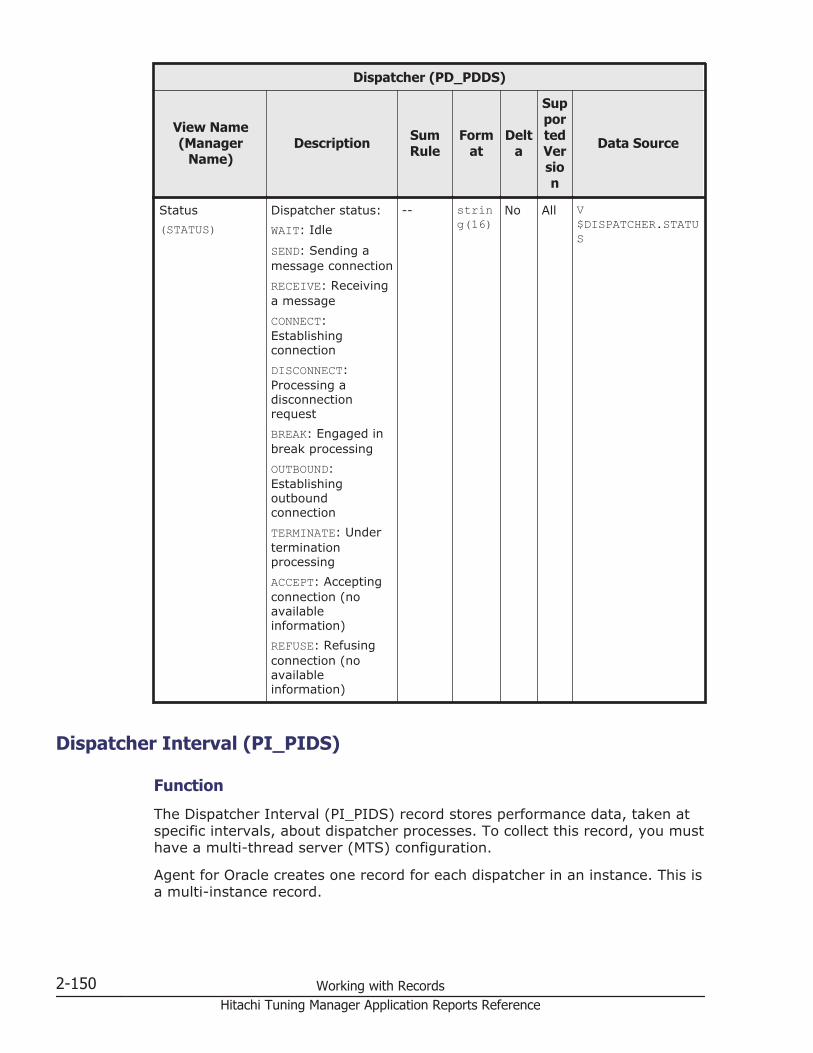
Dispatcher (PD_PDDS)
View Name(Manager
Name)Description Sum
RuleForm
atDelt
a
SupportedVersion
Data Source
Status(STATUS)
Dispatcher status:WAIT: Idle
SEND: Sending amessage connectionRECEIVE: Receivinga messageCONNECT:EstablishingconnectionDISCONNECT:Processing adisconnectionrequestBREAK: Engaged inbreak processingOUTBOUND:EstablishingoutboundconnectionTERMINATE: UnderterminationprocessingACCEPT: Acceptingconnection (noavailableinformation)REFUSE: Refusingconnection (noavailableinformation)
-- string(16)
No All V$DISPATCHER.STATUS
Dispatcher Interval (PI_PIDS)
Function
The Dispatcher Interval (PI_PIDS) record stores performance data, taken atspecific intervals, about dispatcher processes. To collect this record, you musthave a multi-thread server (MTS) configuration.
Agent for Oracle creates one record for each dispatcher in an instance. This isa multi-instance record.
2-150 Working with RecordsHitachi Tuning Manager Application Reports Reference
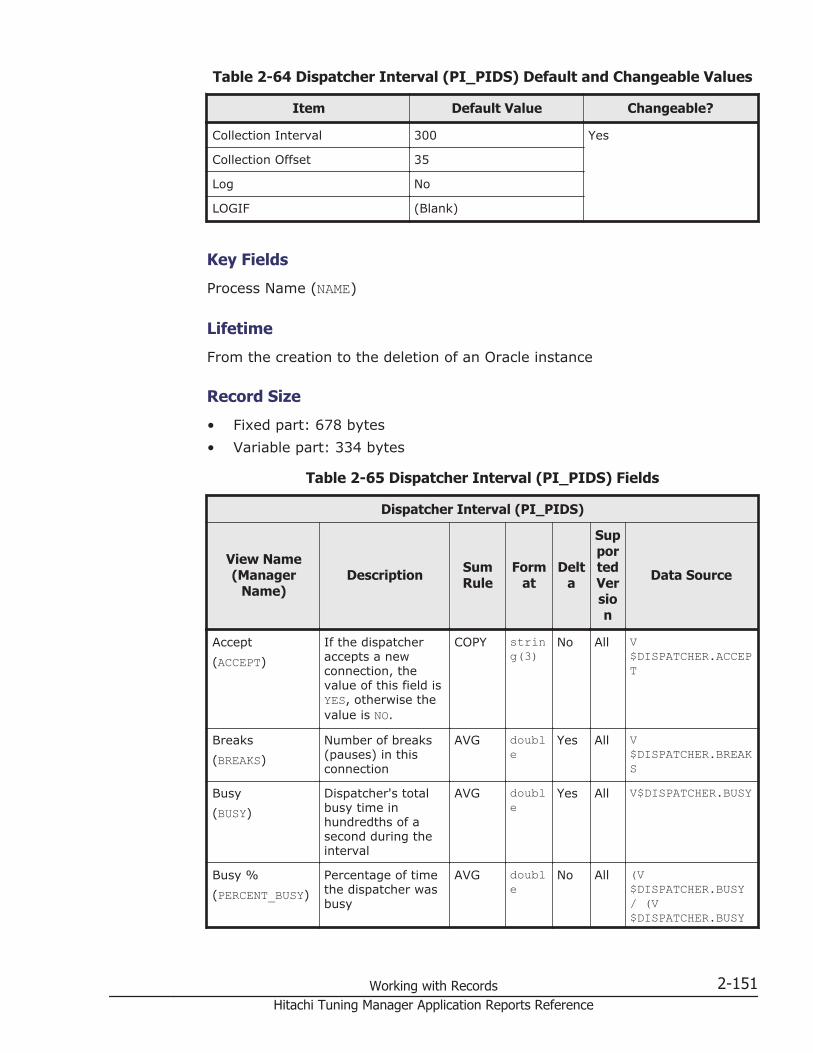
Table 2-64 Dispatcher Interval (PI_PIDS) Default and Changeable Values
Item Default Value Changeable?
Collection Interval 300 Yes
Collection Offset 35
Log No
LOGIF (Blank)
Key Fields
Process Name (NAME)
Lifetime
From the creation to the deletion of an Oracle instance
Record Size
• Fixed part: 678 bytes• Variable part: 334 bytes
Table 2-65 Dispatcher Interval (PI_PIDS) Fields
Dispatcher Interval (PI_PIDS)
View Name(Manager
Name)Description Sum
RuleForm
atDelt
a
SupportedVersion
Data Source
Accept(ACCEPT)
If the dispatcheraccepts a newconnection, thevalue of this field isYES, otherwise thevalue is NO.
COPY string(3)
No All V$DISPATCHER.ACCEPT
Breaks(BREAKS)
Number of breaks(pauses) in thisconnection
AVG double
Yes All V$DISPATCHER.BREAKS
Busy(BUSY)
Dispatcher's totalbusy time inhundredths of asecond during theinterval
AVG double
Yes All V$DISPATCHER.BUSY
Busy %(PERCENT_BUSY)
Percentage of timethe dispatcher wasbusy
AVG double
No All (V$DISPATCHER.BUSY/ (V$DISPATCHER.BUSY
Working with Records 2-151Hitachi Tuning Manager Application Reports Reference
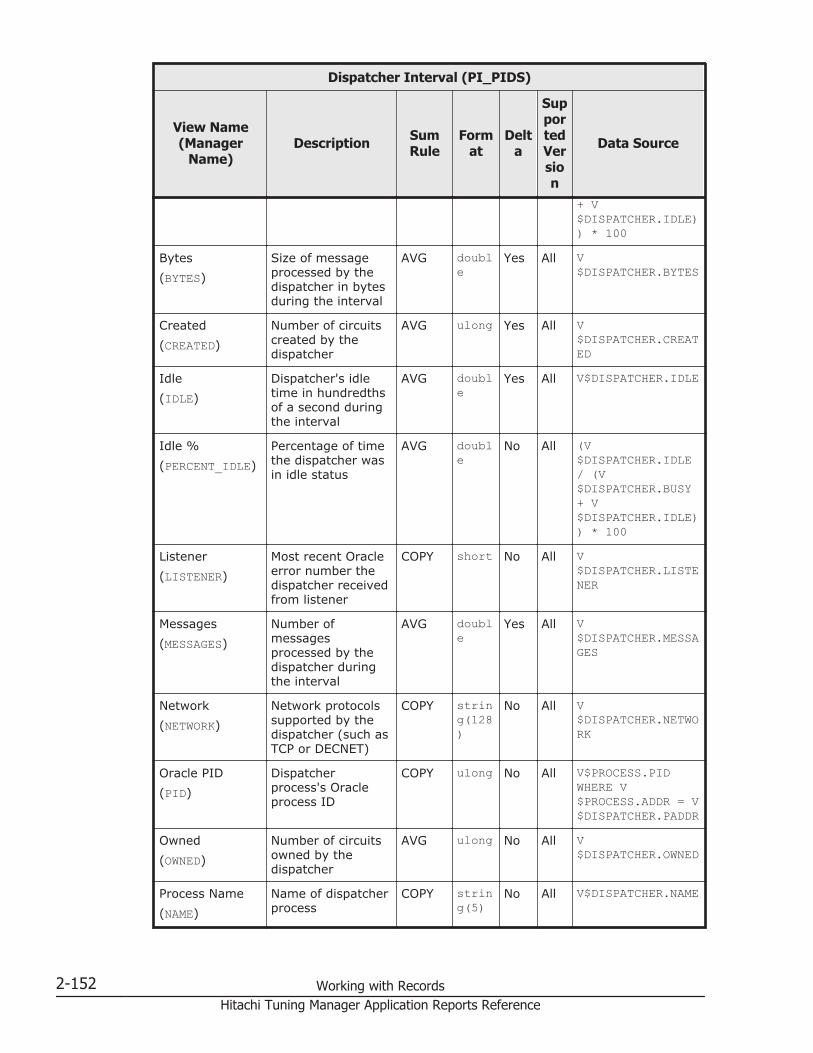
Dispatcher Interval (PI_PIDS)
View Name(Manager
Name)Description Sum
RuleForm
atDelt
a
SupportedVersion
Data Source
+ V$DISPATCHER.IDLE)) * 100
Bytes(BYTES)
Size of messageprocessed by thedispatcher in bytesduring the interval
AVG double
Yes All V$DISPATCHER.BYTES
Created(CREATED)
Number of circuitscreated by thedispatcher
AVG ulong Yes All V$DISPATCHER.CREATED
Idle(IDLE)
Dispatcher's idletime in hundredthsof a second duringthe interval
AVG double
Yes All V$DISPATCHER.IDLE
Idle %(PERCENT_IDLE)
Percentage of timethe dispatcher wasin idle status
AVG double
No All (V$DISPATCHER.IDLE/ (V$DISPATCHER.BUSY+ V$DISPATCHER.IDLE)) * 100
Listener(LISTENER)
Most recent Oracleerror number thedispatcher receivedfrom listener
COPY short No All V$DISPATCHER.LISTENER
Messages(MESSAGES)
Number ofmessagesprocessed by thedispatcher duringthe interval
AVG double
Yes All V$DISPATCHER.MESSAGES
Network(NETWORK)
Network protocolssupported by thedispatcher (such asTCP or DECNET)
COPY string(128)
No All V$DISPATCHER.NETWORK
Oracle PID(PID)
Dispatcherprocess's Oracleprocess ID
COPY ulong No All V$PROCESS.PIDWHERE V$PROCESS.ADDR = V$DISPATCHER.PADDR
Owned(OWNED)
Number of circuitsowned by thedispatcher
AVG ulong No All V$DISPATCHER.OWNED
Process Name(NAME)
Name of dispatcherprocess
COPY string(5)
No All V$DISPATCHER.NAME
2-152 Working with RecordsHitachi Tuning Manager Application Reports Reference
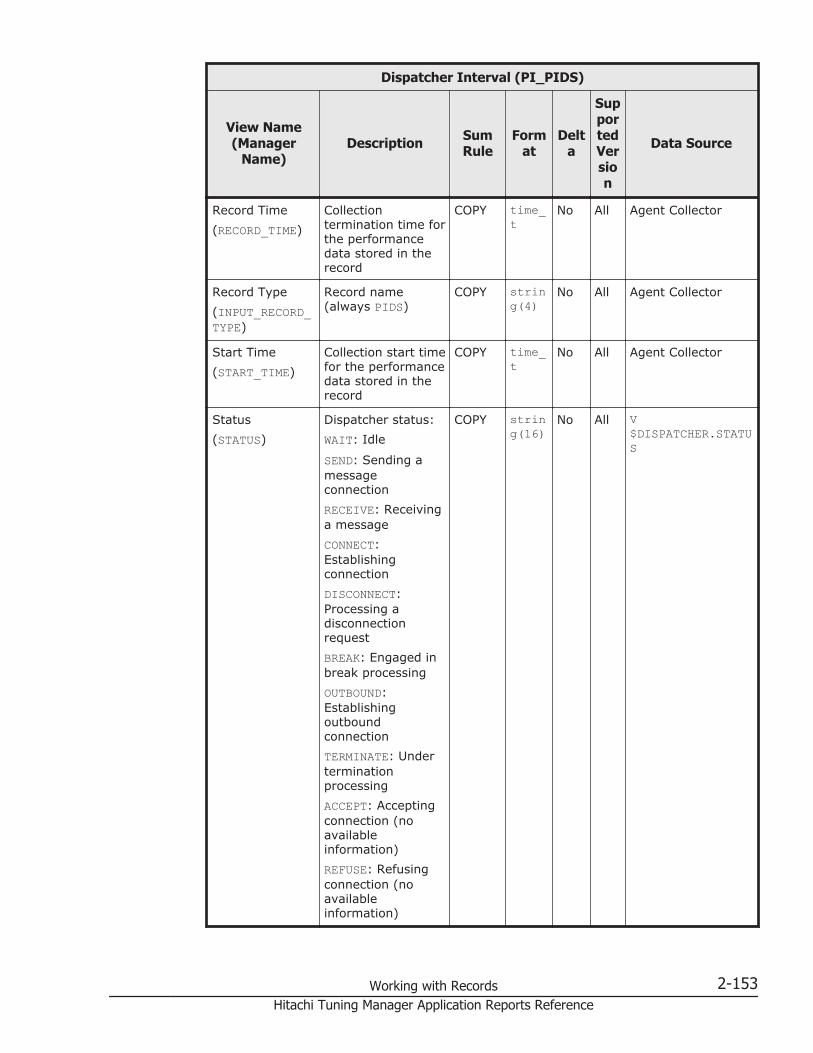
Dispatcher Interval (PI_PIDS)
View Name(Manager
Name)Description Sum
RuleForm
atDelt
a
SupportedVersion
Data Source
Record Time(RECORD_TIME)
Collectiontermination time forthe performancedata stored in therecord
COPY time_t
No All Agent Collector
Record Type(INPUT_RECORD_TYPE)
Record name(always PIDS)
COPY string(4)
No All Agent Collector
Start Time(START_TIME)
Collection start timefor the performancedata stored in therecord
COPY time_t
No All Agent Collector
Status(STATUS)
Dispatcher status:WAIT: Idle
SEND: Sending amessageconnectionRECEIVE: Receivinga messageCONNECT:EstablishingconnectionDISCONNECT:Processing adisconnectionrequestBREAK: Engaged inbreak processingOUTBOUND:EstablishingoutboundconnectionTERMINATE: UnderterminationprocessingACCEPT: Acceptingconnection (noavailableinformation)REFUSE: Refusingconnection (noavailableinformation)
COPY string(16)
No All V$DISPATCHER.STATUS
Working with Records 2-153Hitachi Tuning Manager Application Reports Reference
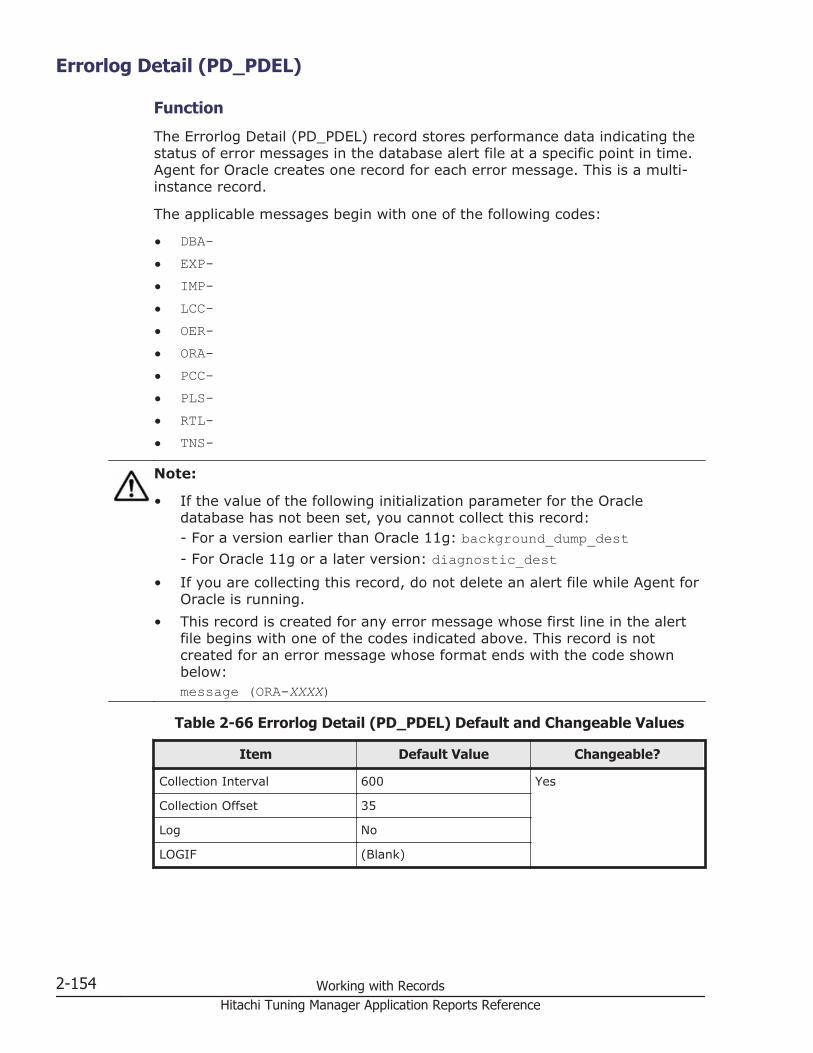
Errorlog Detail (PD_PDEL)
Function
The Errorlog Detail (PD_PDEL) record stores performance data indicating thestatus of error messages in the database alert file at a specific point in time.Agent for Oracle creates one record for each error message. This is a multi-instance record.
The applicable messages begin with one of the following codes:
• DBA-• EXP-• IMP-• LCC-• OER-• ORA-• PCC-• PLS-• RTL-• TNS-
Note:
• If the value of the following initialization parameter for the Oracledatabase has not been set, you cannot collect this record:- For a version earlier than Oracle 11g: background_dump_dest- For Oracle 11g or a later version: diagnostic_dest
• If you are collecting this record, do not delete an alert file while Agent forOracle is running.
• This record is created for any error message whose first line in the alertfile begins with one of the codes indicated above. This record is notcreated for an error message whose format ends with the code shownbelow:message (ORA-XXXX)
Table 2-66 Errorlog Detail (PD_PDEL) Default and Changeable Values
Item Default Value Changeable?
Collection Interval 600 Yes
Collection Offset 35
Log No
LOGIF (Blank)
2-154 Working with RecordsHitachi Tuning Manager Application Reports Reference
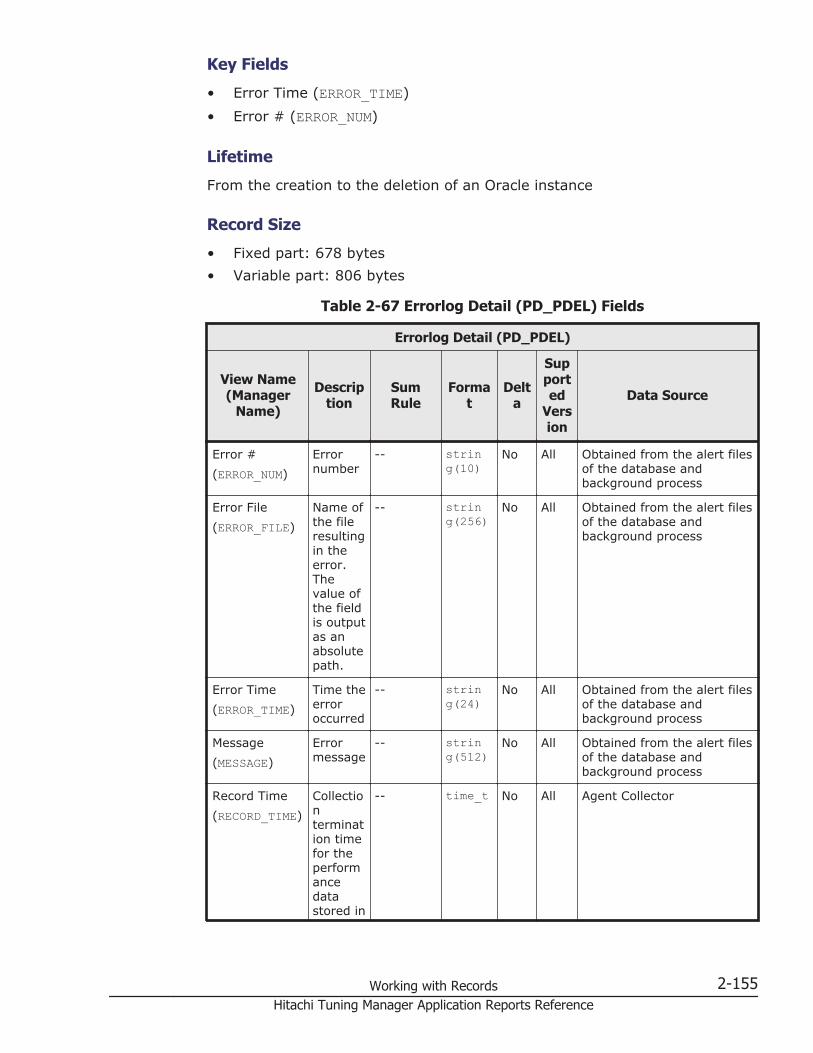
Key Fields
• Error Time (ERROR_TIME)• Error # (ERROR_NUM)
Lifetime
From the creation to the deletion of an Oracle instance
Record Size
• Fixed part: 678 bytes• Variable part: 806 bytes
Table 2-67 Errorlog Detail (PD_PDEL) Fields
Errorlog Detail (PD_PDEL)
View Name(Manager
Name)
Description
SumRule
Format
Delta
Supported
Version
Data Source
Error #(ERROR_NUM)
Errornumber
-- string(10)
No All Obtained from the alert filesof the database andbackground process
Error File(ERROR_FILE)
Name ofthe fileresultingin theerror.Thevalue ofthe fieldis outputas anabsolutepath.
-- string(256)
No All Obtained from the alert filesof the database andbackground process
Error Time(ERROR_TIME)
Time theerroroccurred
-- string(24)
No All Obtained from the alert filesof the database andbackground process
Message(MESSAGE)
Errormessage
-- string(512)
No All Obtained from the alert filesof the database andbackground process
Record Time(RECORD_TIME)
Collectiontermination timefor theperformancedatastored in
-- time_t No All Agent Collector
Working with Records 2-155Hitachi Tuning Manager Application Reports Reference
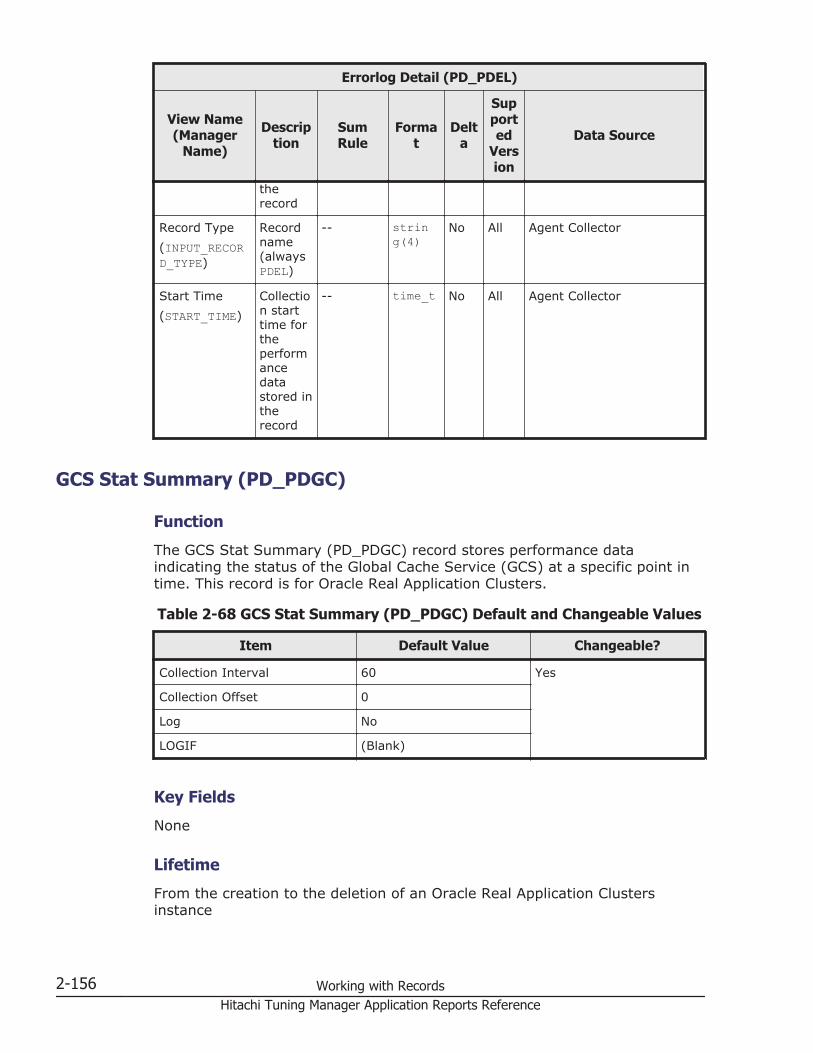
Errorlog Detail (PD_PDEL)
View Name(Manager
Name)
Description
SumRule
Format
Delta
Supported
Version
Data Source
therecord
Record Type(INPUT_RECORD_TYPE)
Recordname(alwaysPDEL)
-- string(4)
No All Agent Collector
Start Time(START_TIME)
Collection starttime fortheperformancedatastored intherecord
-- time_t No All Agent Collector
GCS Stat Summary (PD_PDGC)
Function
The GCS Stat Summary (PD_PDGC) record stores performance dataindicating the status of the Global Cache Service (GCS) at a specific point intime. This record is for Oracle Real Application Clusters.
Table 2-68 GCS Stat Summary (PD_PDGC) Default and Changeable Values
Item Default Value Changeable?
Collection Interval 60 Yes
Collection Offset 0
Log No
LOGIF (Blank)
Key Fields
None
Lifetime
From the creation to the deletion of an Oracle Real Application Clustersinstance
2-156 Working with RecordsHitachi Tuning Manager Application Reports Reference

Record Size
• Fixed part: 754 bytes• Variable part: 0 bytes
Table 2-69 GCS Stat Summary (PD_PDGC) Fields
GCS Stat Summary (PD_PDGC)
View Name(Manager
Name)
Description
SumRule
Format
Delta
Supported
Version
Data Source
GC BlocksCorrupt(GLOBAL_CACHE_BLOCKS_CORRUPT)
Numberofblocksthatresultedin somedamageorchecksum errorduringinterconnection
-- ulong No All • Oracle9i:GV$SYSSTAT.VALUEWHERE NAME= 'globalcache blockscorrupt' GROUP BYINST_ID
• Oracle 10g and later:GV$SYSSTAT.VALUEWHERE NAME= 'gcblocks corrupt'GROUP BY INST_ID
GC Blocks Lost(GLOBAL_CACHE_BLOCKS_LOST)
Numberof timesa globalcacherequestresultedin atimeoutdue todamageorchecksum errorsduringinterconnection
-- double No All • Oracle9i:GV$SYSSTAT.VALUEWHERE NAME= 'globalcache blocks lost'GROUP BY INST_ID
• Oracle 10g and later:GV$SYSSTAT.VALUEWHERE NAME= 'gcblocks lost' GROUPBY INST_ID
GC ConvertTime(GLOBAL_CACHE_CONVERT_TIME)
Totaltimethatelapsedduringlockconversion (seeNote)
-- double No All GV$SYSSTAT.VALUE WHERENAME = 'global cacheconvert time' GROUP BYINST_ID
GC Converts(GLOBAL_CACHE_CONVERTS)
Numberof lockconversions in
-- double No All GV$SYSSTAT.VALUE WHERENAME = 'global cacheconvert' GROUP BYINST_ID
Working with Records 2-157Hitachi Tuning Manager Application Reports Reference
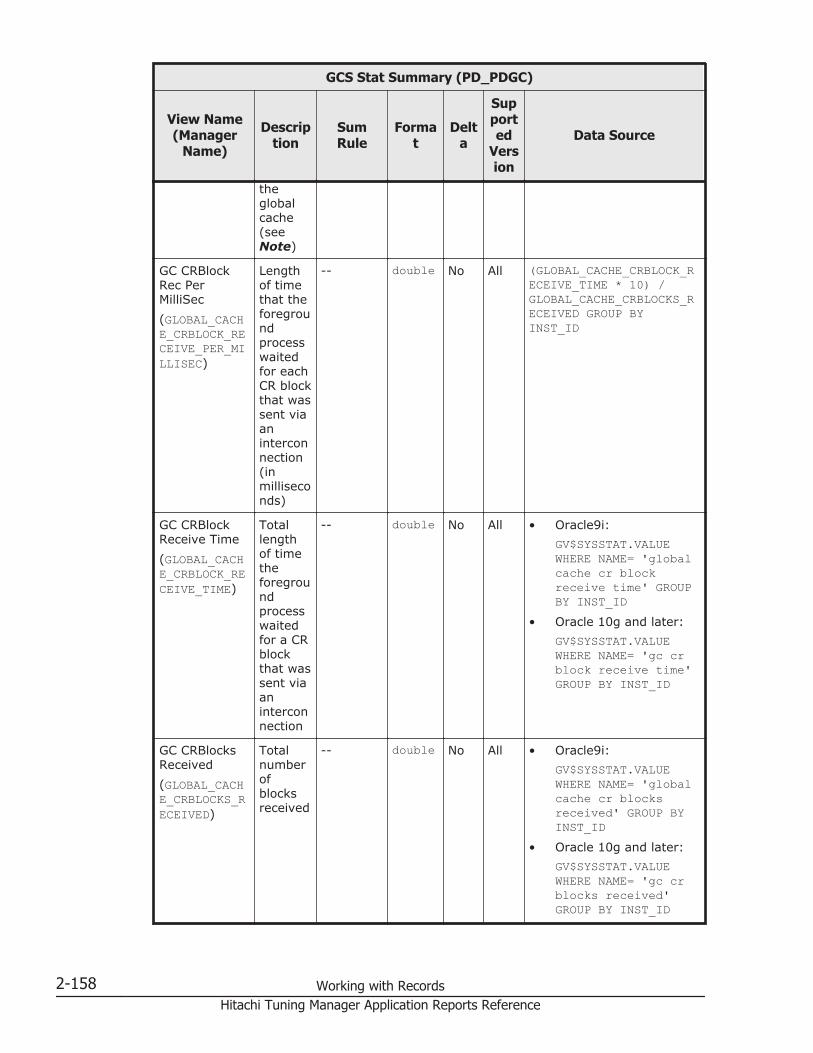
GCS Stat Summary (PD_PDGC)
View Name(Manager
Name)
Description
SumRule
Format
Delta
Supported
Version
Data Source
theglobalcache(seeNote)
GC CRBlockRec PerMilliSec(GLOBAL_CACHE_CRBLOCK_RECEIVE_PER_MILLISEC)
Lengthof timethat theforegroundprocesswaitedfor eachCR blockthat wassent viaaninterconnection(inmilliseconds)
-- double No All (GLOBAL_CACHE_CRBLOCK_RECEIVE_TIME * 10) /GLOBAL_CACHE_CRBLOCKS_RECEIVED GROUP BYINST_ID
GC CRBlockReceive Time(GLOBAL_CACHE_CRBLOCK_RECEIVE_TIME)
Totallengthof timetheforegroundprocesswaitedfor a CRblockthat wassent viaaninterconnection
-- double No All • Oracle9i:GV$SYSSTAT.VALUEWHERE NAME= 'globalcache cr blockreceive time' GROUPBY INST_ID
• Oracle 10g and later:GV$SYSSTAT.VALUEWHERE NAME= 'gc crblock receive time'GROUP BY INST_ID
GC CRBlocksReceived(GLOBAL_CACHE_CRBLOCKS_RECEIVED)
Totalnumberofblocksreceived
-- double No All • Oracle9i:GV$SYSSTAT.VALUEWHERE NAME= 'globalcache cr blocksreceived' GROUP BYINST_ID
• Oracle 10g and later:GV$SYSSTAT.VALUEWHERE NAME= 'gc crblocks received'GROUP BY INST_ID
2-158 Working with RecordsHitachi Tuning Manager Application Reports Reference

GCS Stat Summary (PD_PDGC)
View Name(Manager
Name)
Description
SumRule
Format
Delta
Supported
Version
Data Source
GC Get PerMilliSec(GLOBAL_CACHE_GET_PER_MILLISEC)
Waittime perrequest(inmilliseconds)(seeNote)
-- double No All (GLOBAL_CACHE_GET_TIME* 10) /GLOBAL_CACHE_GETS GROUPBY INST_ID
GC Get Time(GLOBAL_CACHE_GET_TIME)
Totalwaittime(seeNote)
-- double No All GV$SYSSTAT.VALUE WHERENAME = 'global cacheget time' GROUP BYINST_ID
GC Gets(GLOBAL_CACHE_GETS)
Numberof locksobtained(seeNote)
-- double No All GV$SYSSTAT.VALUE WHERENAME = 'global cachegets' GROUP BY INST_ID
Record Time(RECORD_TIME)
Collectiontermination timefor theperformancedatastoredin therecord
-- time_t No All Agent Collector
Record Type(INPUT_RECORD_TYPE)
Recordname(alwaysPDGC)
-- string(4)
No All Agent Collector
Start Time(START_TIME)
Collection starttime fortheperformancedatastoredin therecord
-- time_t No All Agent Collector
Note: In Oracle 10g and later, 0 is always displayed for this statistic.
Working with Records 2-159Hitachi Tuning Manager Application Reports Reference
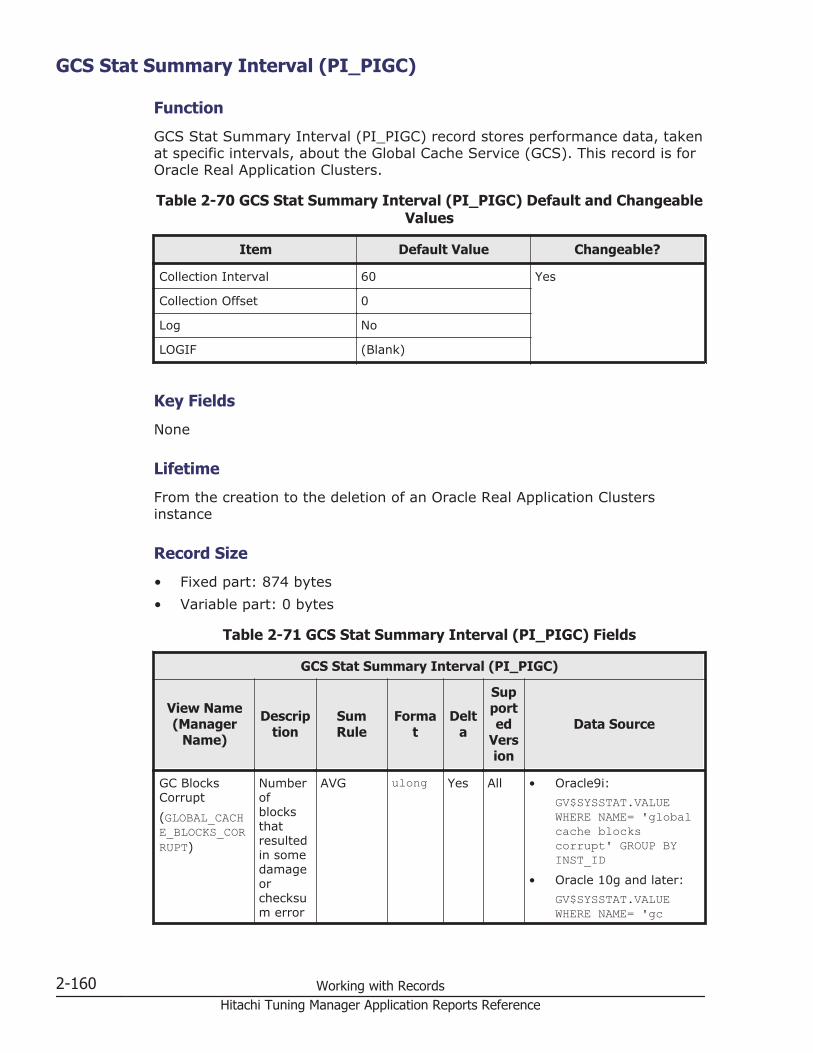
GCS Stat Summary Interval (PI_PIGC)
Function
GCS Stat Summary Interval (PI_PIGC) record stores performance data, takenat specific intervals, about the Global Cache Service (GCS). This record is forOracle Real Application Clusters.
Table 2-70 GCS Stat Summary Interval (PI_PIGC) Default and ChangeableValues
Item Default Value Changeable?
Collection Interval 60 Yes
Collection Offset 0
Log No
LOGIF (Blank)
Key Fields
None
Lifetime
From the creation to the deletion of an Oracle Real Application Clustersinstance
Record Size
• Fixed part: 874 bytes• Variable part: 0 bytes
Table 2-71 GCS Stat Summary Interval (PI_PIGC) Fields
GCS Stat Summary Interval (PI_PIGC)
View Name(Manager
Name)
Description
SumRule
Format
Delta
Supported
Version
Data Source
GC BlocksCorrupt(GLOBAL_CACHE_BLOCKS_CORRUPT)
Numberofblocksthatresultedin somedamageorchecksum error
AVG ulong Yes All • Oracle9i:GV$SYSSTAT.VALUEWHERE NAME= 'globalcache blockscorrupt' GROUP BYINST_ID
• Oracle 10g and later:GV$SYSSTAT.VALUEWHERE NAME= 'gc
2-160 Working with RecordsHitachi Tuning Manager Application Reports Reference
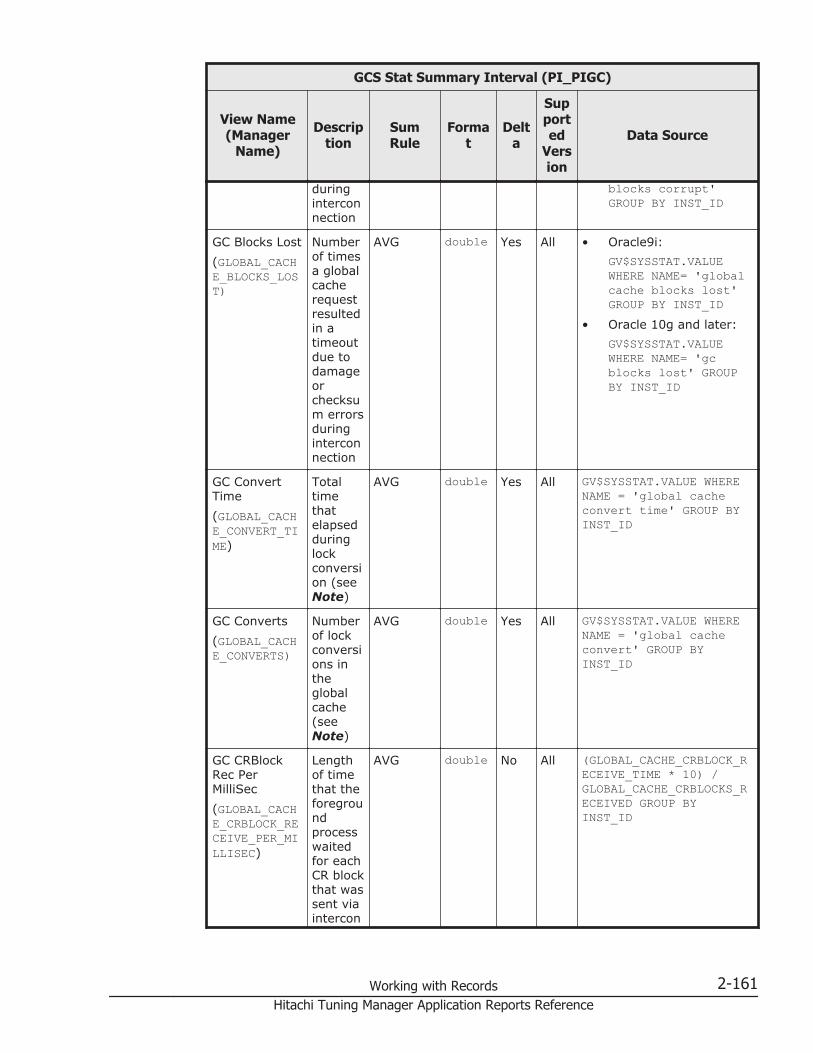
GCS Stat Summary Interval (PI_PIGC)
View Name(Manager
Name)
Description
SumRule
Format
Delta
Supported
Version
Data Source
duringinterconnection
blocks corrupt'GROUP BY INST_ID
GC Blocks Lost(GLOBAL_CACHE_BLOCKS_LOST)
Numberof timesa globalcacherequestresultedin atimeoutdue todamageorchecksum errorsduringinterconnection
AVG double Yes All • Oracle9i:GV$SYSSTAT.VALUEWHERE NAME= 'globalcache blocks lost'GROUP BY INST_ID
• Oracle 10g and later:GV$SYSSTAT.VALUEWHERE NAME= 'gcblocks lost' GROUPBY INST_ID
GC ConvertTime(GLOBAL_CACHE_CONVERT_TIME)
Totaltimethatelapsedduringlockconversion (seeNote)
AVG double Yes All GV$SYSSTAT.VALUE WHERENAME = 'global cacheconvert time' GROUP BYINST_ID
GC Converts(GLOBAL_CACHE_CONVERTS)
Numberof lockconversions intheglobalcache(seeNote)
AVG double Yes All GV$SYSSTAT.VALUE WHERENAME = 'global cacheconvert' GROUP BYINST_ID
GC CRBlockRec PerMilliSec(GLOBAL_CACHE_CRBLOCK_RECEIVE_PER_MILLISEC)
Lengthof timethat theforegroundprocesswaitedfor eachCR blockthat wassent viaintercon
AVG double No All (GLOBAL_CACHE_CRBLOCK_RECEIVE_TIME * 10) /GLOBAL_CACHE_CRBLOCKS_RECEIVED GROUP BYINST_ID
Working with Records 2-161Hitachi Tuning Manager Application Reports Reference
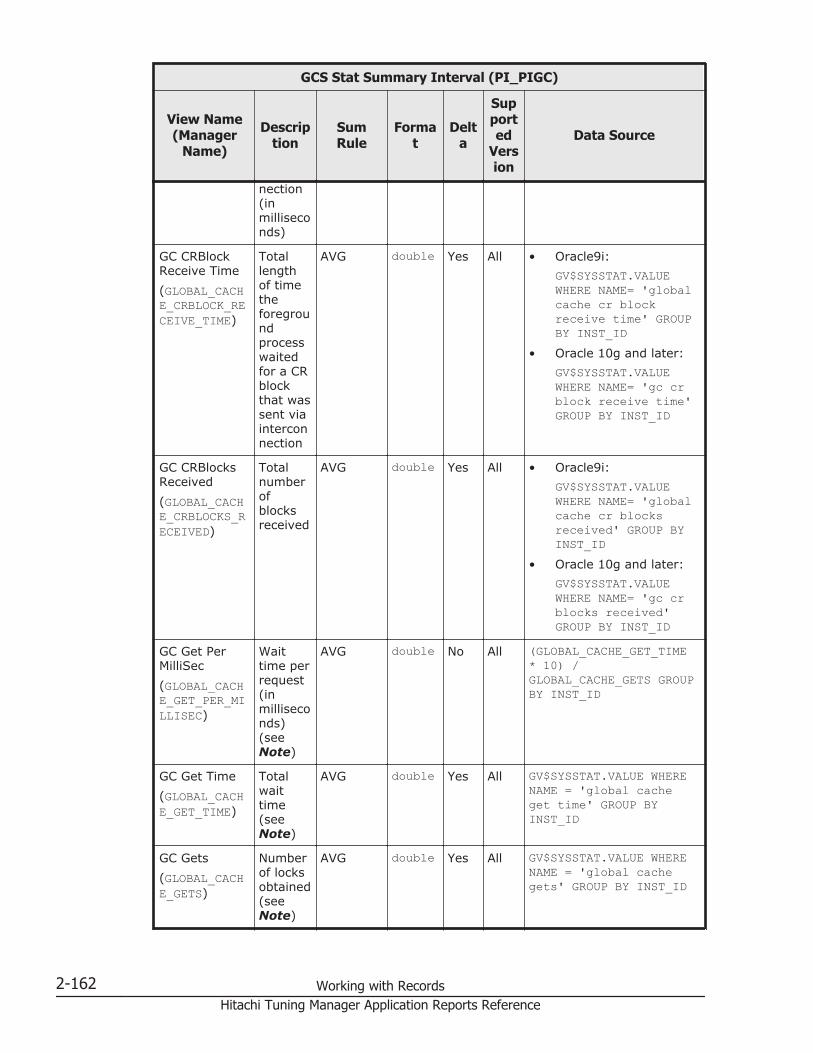
GCS Stat Summary Interval (PI_PIGC)
View Name(Manager
Name)
Description
SumRule
Format
Delta
Supported
Version
Data Source
nection(inmilliseconds)
GC CRBlockReceive Time(GLOBAL_CACHE_CRBLOCK_RECEIVE_TIME)
Totallengthof timetheforegroundprocesswaitedfor a CRblockthat wassent viainterconnection
AVG double Yes All • Oracle9i:GV$SYSSTAT.VALUEWHERE NAME= 'globalcache cr blockreceive time' GROUPBY INST_ID
• Oracle 10g and later:GV$SYSSTAT.VALUEWHERE NAME= 'gc crblock receive time'GROUP BY INST_ID
GC CRBlocksReceived(GLOBAL_CACHE_CRBLOCKS_RECEIVED)
Totalnumberofblocksreceived
AVG double Yes All • Oracle9i:GV$SYSSTAT.VALUEWHERE NAME= 'globalcache cr blocksreceived' GROUP BYINST_ID
• Oracle 10g and later:GV$SYSSTAT.VALUEWHERE NAME= 'gc crblocks received'GROUP BY INST_ID
GC Get PerMilliSec(GLOBAL_CACHE_GET_PER_MILLISEC)
Waittime perrequest(inmilliseconds)(seeNote)
AVG double No All (GLOBAL_CACHE_GET_TIME* 10) /GLOBAL_CACHE_GETS GROUPBY INST_ID
GC Get Time(GLOBAL_CACHE_GET_TIME)
Totalwaittime(seeNote)
AVG double Yes All GV$SYSSTAT.VALUE WHERENAME = 'global cacheget time' GROUP BYINST_ID
GC Gets(GLOBAL_CACHE_GETS)
Numberof locksobtained(seeNote)
AVG double Yes All GV$SYSSTAT.VALUE WHERENAME = 'global cachegets' GROUP BY INST_ID
2-162 Working with RecordsHitachi Tuning Manager Application Reports Reference
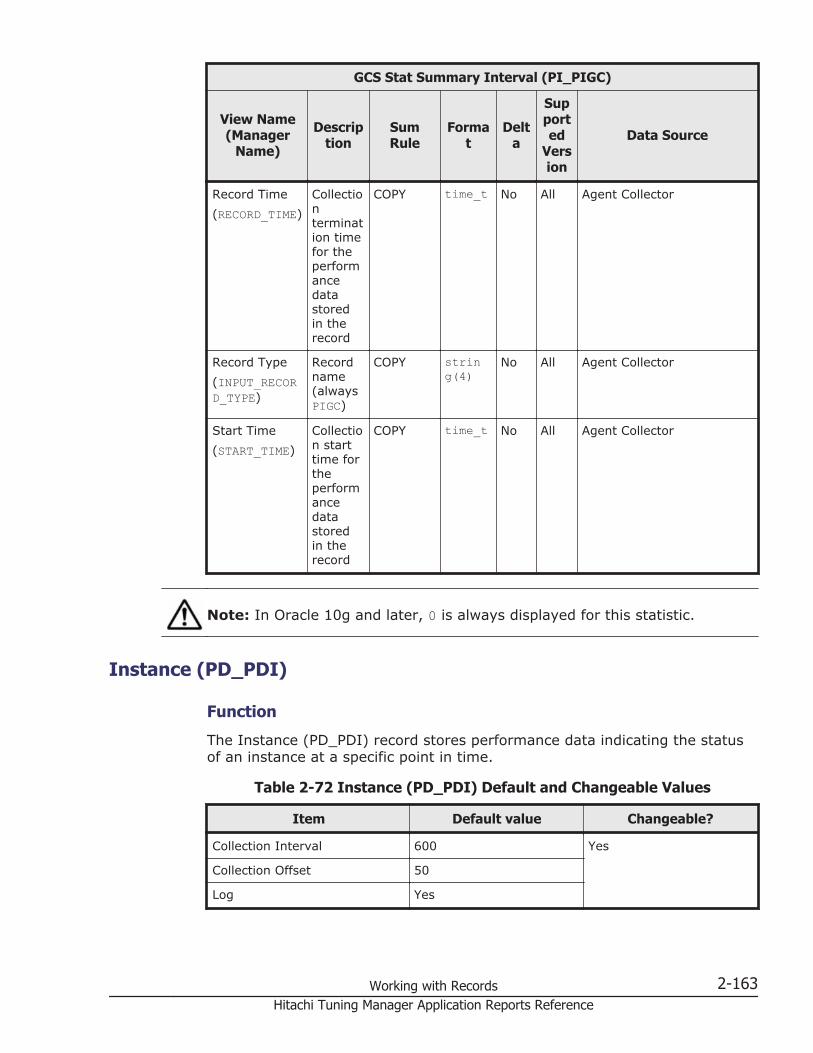
GCS Stat Summary Interval (PI_PIGC)
View Name(Manager
Name)
Description
SumRule
Format
Delta
Supported
Version
Data Source
Record Time(RECORD_TIME)
Collectiontermination timefor theperformancedatastoredin therecord
COPY time_t No All Agent Collector
Record Type(INPUT_RECORD_TYPE)
Recordname(alwaysPIGC)
COPY string(4)
No All Agent Collector
Start Time(START_TIME)
Collection starttime fortheperformancedatastoredin therecord
COPY time_t No All Agent Collector
Note: In Oracle 10g and later, 0 is always displayed for this statistic.
Instance (PD_PDI)
Function
The Instance (PD_PDI) record stores performance data indicating the statusof an instance at a specific point in time.
Table 2-72 Instance (PD_PDI) Default and Changeable Values
Item Default value Changeable?
Collection Interval 600 Yes
Collection Offset 50
Log Yes
Working with Records 2-163Hitachi Tuning Manager Application Reports Reference

Item Default value Changeable?
LOGIF (Blank)
Key Fields
None
Lifetime
From the creation to the deletion of an Oracle instance
Record Size
• Fixed part: 1,128 bytes• Variable part: 0 bytes
Table 2-73 Instance (PD_PDI) Fields
Instance (PD_PDI)
View Name(Manager Name) Description Sum
Rule Format DeltaSupport
edVersion
DataSource
Host(HOST)
Instance'shost machinename
-- string(64)
No All V$INSTANCE.HOST_NAME
ORACLE_HOME(ORACLE_HOME)
ORACLE_HOMEenvironmentvariable
-- string(255)
No All --
ORACLE_SID(ORACLE_SID)
ORACLE_SIDenvironmentvariable
-- string(30)
No All --
Record Time(RECORD_TIME)
Collectionterminationtime for theperformancedata storedin the record
-- time_t No All AgentCollector
Record Type(INPUT_RECORD_TYPE)
Record name(always PDI)
-- string(4)
No All AgentCollector
Restricted Mode(RESTRICTED_MODE)
This field isnotsupported.1 if theinstance is inrestrictedmode;otherwise, 0
-- short No Notsupported
V$INSTANCE.LOGINS
2-164 Working with RecordsHitachi Tuning Manager Application Reports Reference

Instance (PD_PDI)
View Name(Manager Name) Description Sum
Rule Format DeltaSupport
edVersion
DataSource
Session Current(SESSION_CURRENT)
Currentnumber ofconcurrentuser sessions
-- ulong No All V$LICENSE.SESSIONS_CURRENT
Session Highwater(SESSION_HIGHWATER)
Maximumnumber ofconcurrentuser sessionssince theinstancestarted
-- ulong No All V$LICENSE.SESSIONS_HIGHWATER
Sessions Max(SESSIONS_MAX)
Maximumnumber ofconcurrentuser sessionspermitted forthe instance
-- ulong No All V$LICENSE.SESSIONS_MAX
Sessions Warning(SESSIONS_WARNING)
Warning limitto theconcurrentuser sessionsfor theinstance
-- ulong No All V$LICENSE.SESSIONS_WARNING
SGA Database Buffers(SGA_DATABASE_BUFFERS)
Size of SGAdatabasebuffer inbytes
-- double No All V$SGA.VALUEwhere V$SGA.NAME ='DatabaseBuffers'
SGA Fixed Size(SGA_FIXED_SIZE)
Size of SGAfixedmemory inbytes
-- double No All V$SGA.VALUEwhere V$SGA.NAME ='FixedSize'
SGA Redo Buffers(SGA_REDO_BUFFERS)
Size of SGAREDO bufferin bytes
-- double No All V$SGA.VALUEwhere V$SGA.NAME ='RedoBuffers'
SGA Variable Size(SGA_VARIABLE_SIZE)
Size of SGAvariablememory inbytes
-- double No All V$SGA.VALUEwhere V$SGA.NAME ='VariableSize'
Shutdown Pending(SHUTDOWN_PENDING)
1 if shutdownis on hold;otherwise, 0
-- short No All V$INSTANCE.SHUTDOWN_PENDING
Working with Records 2-165Hitachi Tuning Manager Application Reports Reference

Instance (PD_PDI)
View Name(Manager Name) Description Sum
Rule Format DeltaSupport
edVersion
DataSource
Start Time(START_TIME)
Collectionstart time fortheperformancedata storedin the record
-- time_t No All AgentCollector
Startup Time(STARTUP_TIME)
Start dateand time
-- string(20)
No All V$INSTANCE.STARTUP_TIME
Users Max(USERS_MAX)
Maximumnumber ofuserspermitted forthe database
-- ulong No All V$LICENSE.USERS_MAX
Version(VERSION)
Version ofOracledatabase
-- string(20)
No All PRODUCT_COMPONENT_VERSION
Instance Availability (PD_PDIA)
Function
The Instance Availability (PD_PDIA) record stores performance dataindicating the status of the availability of an instance at a specific point intime. To create this record, Agent for Oracle attempts to connect to OracleDatabase, and then, after a successful connection, immediately disconnects.If Agent for Oracle has already connected to Oracle Database to createanother record, in order to collect performance data, there might be twoconnection sources temporarily.
Table 2-74 Instance Availability (PD_PDIA) Default and ChangeableValues
Item Default Value Changeable?
Collection Interval 60 Yes
Collection Offset 0
Log No
LOGIF (Blank)
Key Fields
None
2-166 Working with RecordsHitachi Tuning Manager Application Reports Reference

Lifetime
From the creation to the deletion of an Oracle instance
Record Size
• Fixed part: 695 bytes• Variable part: 0 byte
Table 2-75 Instance Availability (PD_PDIA) Fields
Instance Availability (PD_PDIA)
View Name(Manager Name) Description Sum
Rule Format DeltaSupport
edVersion
DataSource
Availability(AVAILABILITY)
Availabilitystatus (seeNote 1,Note 2); thisvalue can beeither 0(inactive) or1 (active)IfOracleDatabasecannot beconnected to,0 (inactive)is set. IfOracleDatabase canbe connectedto, 1 (active)is set.
-- short No All AgentCollector
Collect Time(COLLECT_TIME)
Time spentconnecting toanddisconnectingfrom OracleDatabase(milliseconds)
-- long No All AgentCollector
Error #(ERROR_NUM)
Error code ifan attemptto connect toOracleDatabasefailed (seeNote 3).Blank if theconnectionwassuccessful.
-- string(10)
No All AgentCollector
Working with Records 2-167Hitachi Tuning Manager Application Reports Reference

Instance Availability (PD_PDIA)
View Name(Manager Name) Description Sum
Rule Format DeltaSupport
edVersion
DataSource
Record Time(RECORD_TIME)
Collectionterminationtime for theperformancedata storedin the record
-- time_t No All AgentCollector
Record Type(INPUT_RECORD_TYPE)
Record name(alwaysPDIA)
-- string(4)
No All AgentCollector
Start Time(START_TIME)
Collectionstart time fortheperformancedata storedin the record
-- time_t No All AgentCollector
Note 1:The value in the Availability field differs depending on the sqlnet value,which is instance information specified when an Agent for Oracle instanceenvironment is configured. Table 2-76 Relationship Between the sqlnetValue and the Value in the Availability Field on page 2-168 shows therelationship between the sqlnet value and the value in the Availabilityfield.
Table 2-76 Relationship Between the sqlnet Value and the Value in theAvailability Field
sqlnet value Connections to OracleDatabase Value in the Availability field
Y The listener is used to connectto Oracle Database.
The status of the availability ofthe listener and Oracle Database
N The listener is not used toconnect to Oracle Database.
The status of the availability ofOracle Database only
Note 2:For details on how to configure the instance environment, see the TuningManager Installation Guide.Note the following points about the Availability field:
¢ Agent for Oracle attempts to connect to Oracle Database to create thePD_PDIA record. If, before the PD_PDIA record is created, themaximum number of simultaneous user sessions allowed by theOracle instance has been reached, the Availability field indicates 0(inactive), but the other records might be created normally.
2-168 Working with RecordsHitachi Tuning Manager Application Reports Reference

¢ If the Oracle instance stops operating during record creation, theAvailability field in the PD_PDIA record indicates 0 (inactive), but theother records might be created normally.
¢ If the Oracle instance that was inactive during record creation startsoperating, the Availability field in the PD_PDIA record indicates 1(active), but the other records might not be created.
Note 3:Table 2-77 Output Examples of the Error # Field and the CorrespondingMessage Codes on page 2-169 shows output examples of the Error # fieldand the corresponding message codes. Error codes in Table 2-77 OutputExamples of the Error # Field and the Corresponding Message Codes onpage 2-169 are output when Oracle is physically disconnected. For detailson messages corresponding to Oracle message codes, see the Oracledocumentation.
Table 2-77 Output Examples of the Error # Field and the CorrespondingMessage Codes
Output example of the Error # field(Oracle error code) Corresponding Oracle message code
28 ORA-00028
1012 ORA-01012
3113 ORA-03113
3114 ORA-03114
12571 ORA-12571
Latch (PD_PDLA)
Function
The Latch (PD_PDLA) record stores performance data indicating the status oflatches at a specific point in time. Agent for Oracle creates one record foreach latch in an instance. This is a multi-instance record.
Table 2-78 Latch (PD_PDLA) Default and Changeable Values
Item Default Value Changeable?
Collection Interval 300 Yes
Collection Offset 10
Log No
LOGIF (Blank)
Working with Records 2-169Hitachi Tuning Manager Application Reports Reference

Key Fields
• Latch # (LATCH_NUM)• Level # (LEVEL_NUM)
Lifetime
From the creation to the deletion of an Oracle instance
Record Size
• Fixed part: 678 bytes• Variable part: 284 bytes
Table 2-79 Latch (PD_PDLA) Fields
Latch (PD_PDLA)
View Name(Manager Name) Description Sum
Rule Format Delta
Supporte
dVersi
on
Data Source
Addr(ADDR)
Latchaddress
-- string(16)
No All V$LATCH.ADDR
Gets(GETS)
Number oftimes latcheswereobtained forrequests inthe willing-to-wait mode
-- double No All V$LATCH.GETS
Immediate Gets(IMMEDIATE_GETS)
Number oftimes latcheswereobtained forrequests inthe no waitmode
-- double No All V$LATCH.IMMEDIATE_GETS
Immediate Hit %(IMMEDIATE_HIT_PERCENTAGE)
Percentageof times thatlatches wereobtained inthe no waitmode (Rateat whichlatches wereobtained inthe firstattempt)
-- double No All (V$LATCH.IMMEDIATE_GETS/(V$LATCH.IMMEDIATE_GETS + V$LATCH.IMMEDIATE_MISSES))*100
Immediate Misses(IMMEDIATE_MISSES)
Number oftimes latchacquisition
-- double No All V$LATCH.IMMEDIATE_MISSES
2-170 Working with RecordsHitachi Tuning Manager Application Reports Reference

Latch (PD_PDLA)
View Name(Manager Name) Description Sum
Rule Format Delta
Supporte
dVersi
on
Data Source
failed forrequests inthe no waitmode
Latch #(LATCH_NUM)
Latchnumber
-- short No All V$LATCH.LATCH#
Latch Name(NAME)
Latch name -- string(50)
No All V$LATCHNAME.NAME
Level #(LEVEL_NUM)
Latch level -- double No All V$LATCH.LEVEL#
Misses(MISSES)
Number oftimes thefirst attemptat latchacquisitionfailed forrequests inthe willing-to-wait mode
-- double No All V$LATCH.MISSES
Oracle PID(PID)
Process ID towhich thelatch belongs
-- ulong No All V$LATCHHOLDER.PID
OS PID(OS_PID)
OS's clientprocess ID
-- string(12)
No All V$SESSION.PROCESS where V$LATCHHOLDER.SID = V$SESSION.SID
OS User(OS_USER)
OS's clientuser name
-- string(30)
No All V$SESSION.OSUSER where V$LATCHHOLDER.SID = V$SESSION.SID
Program(PROGRAM)
Name of theprogrambeingexecuted
-- string(48)
No All V$SESSION.PROGRAM where V$LATCHHOLDER.SID = V$SESSION.SID
Record Time(RECORD_TIME)
Collectiontermination
-- time_t No All Agent Collector
Working with Records 2-171Hitachi Tuning Manager Application Reports Reference
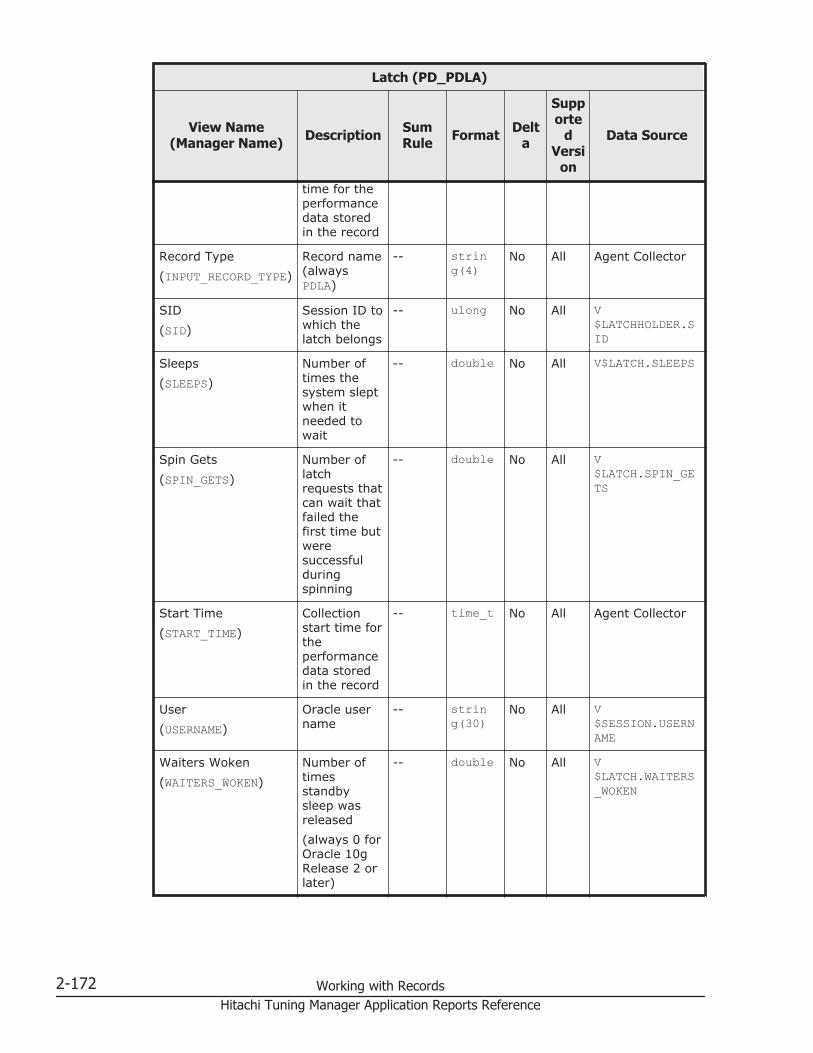
Latch (PD_PDLA)
View Name(Manager Name) Description Sum
Rule Format Delta
Supporte
dVersi
on
Data Source
time for theperformancedata storedin the record
Record Type(INPUT_RECORD_TYPE)
Record name(alwaysPDLA)
-- string(4)
No All Agent Collector
SID(SID)
Session ID towhich thelatch belongs
-- ulong No All V$LATCHHOLDER.SID
Sleeps(SLEEPS)
Number oftimes thesystem sleptwhen itneeded towait
-- double No All V$LATCH.SLEEPS
Spin Gets(SPIN_GETS)
Number oflatchrequests thatcan wait thatfailed thefirst time butweresuccessfulduringspinning
-- double No All V$LATCH.SPIN_GETS
Start Time(START_TIME)
Collectionstart time fortheperformancedata storedin the record
-- time_t No All Agent Collector
User(USERNAME)
Oracle username
-- string(30)
No All V$SESSION.USERNAME
Waiters Woken(WAITERS_WOKEN)
Number oftimesstandbysleep wasreleased(always 0 forOracle 10gRelease 2 orlater)
-- double No All V$LATCH.WAITERS_WOKEN
2-172 Working with RecordsHitachi Tuning Manager Application Reports Reference

Latch (PD_PDLA)
View Name(Manager Name) Description Sum
Rule Format Delta
Supporte
dVersi
on
Data Source
Waits Holding Latch(WAITS_HOLDING_LATCH)
Number ofwaits whenother latcheswere held(always 0 forOracle 10gRelease 2 orlater)
-- double No All V$LATCH.WAITS_HOLDING_LATCH
Willing To Wait Hit %(WILLING_TO_WAIT_HIT_PERCENTAGE)
Percentageof times thatlatches wereobtained inthe willing-to-wait mode(Rate atwhich latcheswereobtained inthe firstattempt)
-- double No All ((V$LATCH.GETS- V$LATCH.MISSES)/ V$LATCH.GETS) *100
Latch Interval (PI_PILA)
Function
The Latch Interval (PI_PILA) record stores performance data, taken atspecific intervals, about latches. Agent for Oracle creates one record for eachlatch in an instance. This is a multi-instance record.
For the monitored Oracle version, if the data in the ADDR column in theOracle static dictionary view V$LATCH is the same in every row, this recorddoes not operate normally. To monitor latches in this case, use the Latch(PD_PDLA) record.
You can use the Oracle command sqlplus to check whether the data in theADDR column is the same in every row. To do so, execute the following SQLstatement:SELECT ADDR FROM V$LATCHFor details about the sqlplus command, see the Oracle documentation.
Working with Records 2-173Hitachi Tuning Manager Application Reports Reference

Table 2-80 Latch Interval (PI_PILA) Default and Changeable Values
Item Default Value Changeable?
Collection Interval 300 Yes
Collection Offset 5
Log No
LOGIF (Blank)
Key Fields
Addr (ADDR)
Lifetime
From the creation to the deletion of an Oracle instance
Record Size
• Fixed part: 678 bytes• Variable part: 416 bytes
Table 2-81 Latch Interval (PI_PILA) Fields
Latch Interval (PI_PILA)
View Name(Manager Name) Description Sum
Rule Format Delta
Supporte
dVersi
on
Data Source
Addr(ADDR)
Latchaddress
COPY string(16)
No All V$LATCH.ADDR
Gets(GETS)
Number oftimes latcheswereobtained forrequests inthe willing-to-wait mode
AVG double Yes All V$LATCH.GETS
Immediate Gets(IMMEDIATE_GETS)
Number oftimes latcheswereobtained forrequests inthe no waitmode
AVG double Yes All V$LATCH.IMMEDIATE_GETS
Immediate Hit % Percentageof times that
AVG double No All (V$LATCH.IMMEDIA
2-174 Working with RecordsHitachi Tuning Manager Application Reports Reference
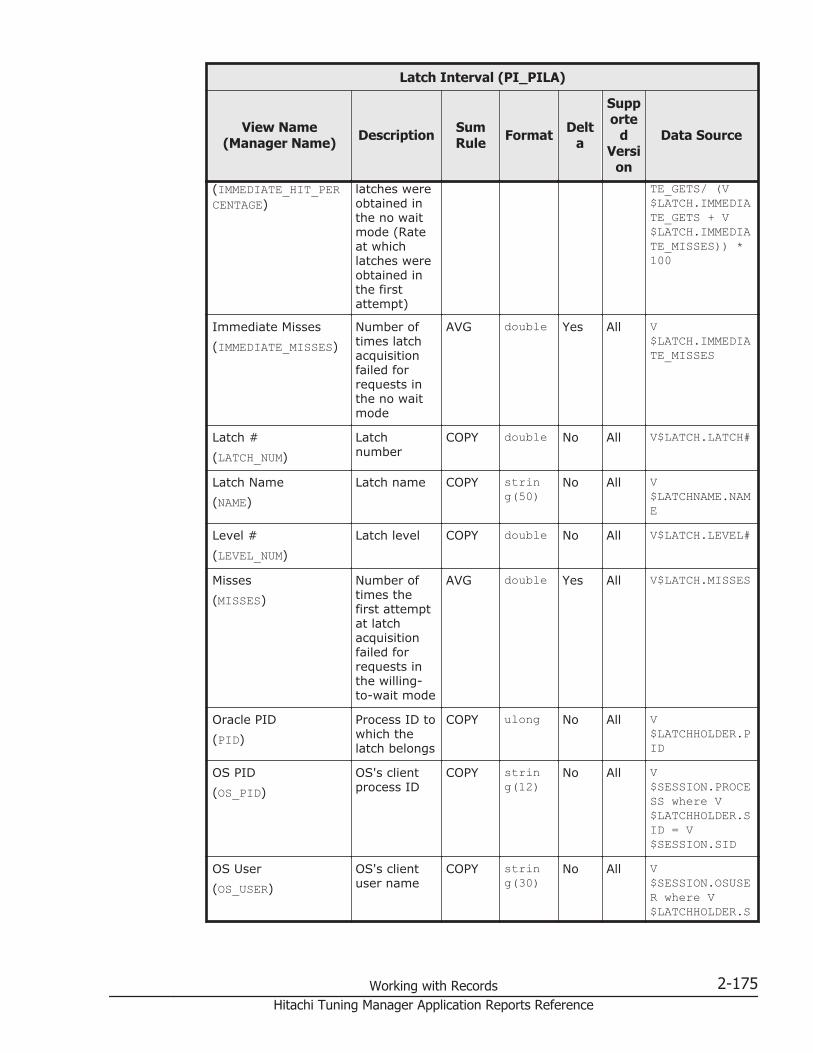
Latch Interval (PI_PILA)
View Name(Manager Name) Description Sum
Rule Format Delta
Supporte
dVersi
on
Data Source
(IMMEDIATE_HIT_PERCENTAGE)
latches wereobtained inthe no waitmode (Rateat whichlatches wereobtained inthe firstattempt)
TE_GETS/ (V$LATCH.IMMEDIATE_GETS + V$LATCH.IMMEDIATE_MISSES)) *100
Immediate Misses(IMMEDIATE_MISSES)
Number oftimes latchacquisitionfailed forrequests inthe no waitmode
AVG double Yes All V$LATCH.IMMEDIATE_MISSES
Latch #(LATCH_NUM)
Latchnumber
COPY double No All V$LATCH.LATCH#
Latch Name(NAME)
Latch name COPY string(50)
No All V$LATCHNAME.NAME
Level #(LEVEL_NUM)
Latch level COPY double No All V$LATCH.LEVEL#
Misses(MISSES)
Number oftimes thefirst attemptat latchacquisitionfailed forrequests inthe willing-to-wait mode
AVG double Yes All V$LATCH.MISSES
Oracle PID(PID)
Process ID towhich thelatch belongs
COPY ulong No All V$LATCHHOLDER.PID
OS PID(OS_PID)
OS's clientprocess ID
COPY string(12)
No All V$SESSION.PROCESS where V$LATCHHOLDER.SID = V$SESSION.SID
OS User(OS_USER)
OS's clientuser name
COPY string(30)
No All V$SESSION.OSUSER where V$LATCHHOLDER.S
Working with Records 2-175Hitachi Tuning Manager Application Reports Reference

Latch Interval (PI_PILA)
View Name(Manager Name) Description Sum
Rule Format Delta
Supporte
dVersi
on
Data Source
ID = V$SESSION.SID
Program(PROGRAM)
Name of theprogrambeingexecuted
COPY string(48)
No All V$SESSION.PROGRAM where V$LATCHHOLDER.SID = V$SESSION.SID
Record Time(RECORD_TIME)
Collectionterminationtime for theperformancedata storedin the record
COPY time_t No All Agent Collector
Record Type(INPUT_RECORD_TYPE)
Record name(alwaysPILA)
COPY string(4)
No All Agent Collector
SID(SID)
Session ID towhich thelatch belongs
COPY ulong No All V$LATCHHOLDER.SID
Sleeps(SLEEPS)
Number oftimes thesystem sleptwhen itneeded towait
AVG double Yes All V$LATCH.SLEEPS
Spin Gets(SPIN_GETS)
Number oflatchrequests thatcan wait thatfailed thefirst time butweresuccessfulduringspinning
AVG double Yes All V$LATCH.SPIN_GETS
Start Time(START_TIME)
Collectionstart time fortheperformancedata storedin the record
COPY time_t No All Agent Collector
User(USERNAME)
Oracle username
COPY string(30)
No All V$SESSION.USERNAME
2-176 Working with RecordsHitachi Tuning Manager Application Reports Reference
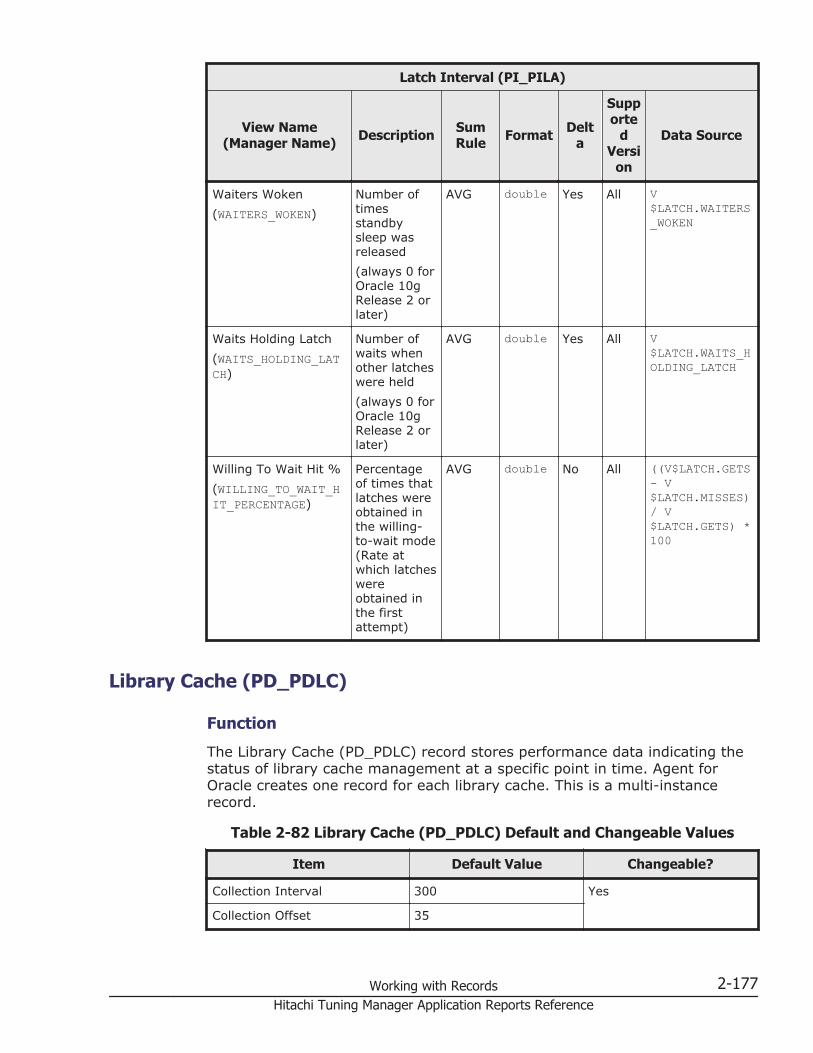
Latch Interval (PI_PILA)
View Name(Manager Name) Description Sum
Rule Format Delta
Supporte
dVersi
on
Data Source
Waiters Woken(WAITERS_WOKEN)
Number oftimesstandbysleep wasreleased(always 0 forOracle 10gRelease 2 orlater)
AVG double Yes All V$LATCH.WAITERS_WOKEN
Waits Holding Latch(WAITS_HOLDING_LATCH)
Number ofwaits whenother latcheswere held(always 0 forOracle 10gRelease 2 orlater)
AVG double Yes All V$LATCH.WAITS_HOLDING_LATCH
Willing To Wait Hit %(WILLING_TO_WAIT_HIT_PERCENTAGE)
Percentageof times thatlatches wereobtained inthe willing-to-wait mode(Rate atwhich latcheswereobtained inthe firstattempt)
AVG double No All ((V$LATCH.GETS- V$LATCH.MISSES)/ V$LATCH.GETS) *100
Library Cache (PD_PDLC)
Function
The Library Cache (PD_PDLC) record stores performance data indicating thestatus of library cache management at a specific point in time. Agent forOracle creates one record for each library cache. This is a multi-instancerecord.
Table 2-82 Library Cache (PD_PDLC) Default and Changeable Values
Item Default Value Changeable?
Collection Interval 300 Yes
Collection Offset 35
Working with Records 2-177Hitachi Tuning Manager Application Reports Reference
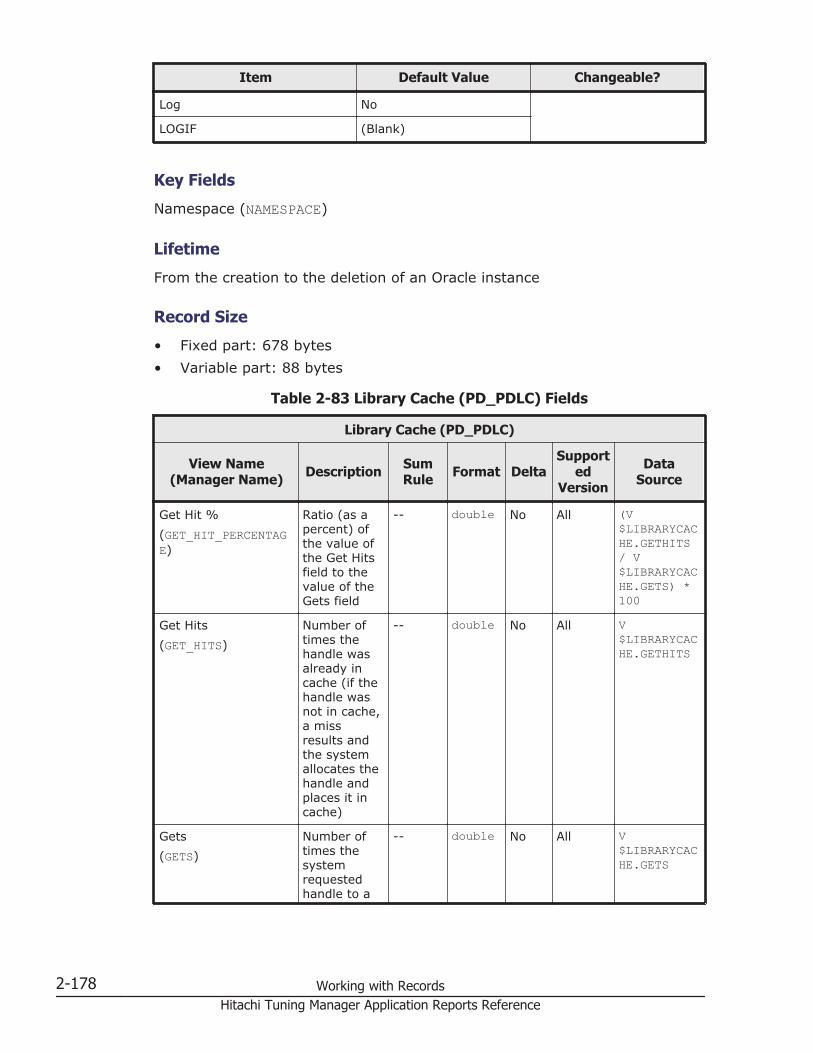
Item Default Value Changeable?
Log No
LOGIF (Blank)
Key Fields
Namespace (NAMESPACE)
Lifetime
From the creation to the deletion of an Oracle instance
Record Size
• Fixed part: 678 bytes• Variable part: 88 bytes
Table 2-83 Library Cache (PD_PDLC) Fields
Library Cache (PD_PDLC)
View Name(Manager Name) Description Sum
Rule Format DeltaSupport
edVersion
DataSource
Get Hit %(GET_HIT_PERCENTAGE)
Ratio (as apercent) ofthe value ofthe Get Hitsfield to thevalue of theGets field
-- double No All (V$LIBRARYCACHE.GETHITS/ V$LIBRARYCACHE.GETS) *100
Get Hits(GET_HITS)
Number oftimes thehandle wasalready incache (if thehandle wasnot in cache,a missresults andthe systemallocates thehandle andplaces it incache)
-- double No All V$LIBRARYCACHE.GETHITS
Gets(GETS)
Number oftimes thesystemrequestedhandle to a
-- double No All V$LIBRARYCACHE.GETS
2-178 Working with RecordsHitachi Tuning Manager Application Reports Reference
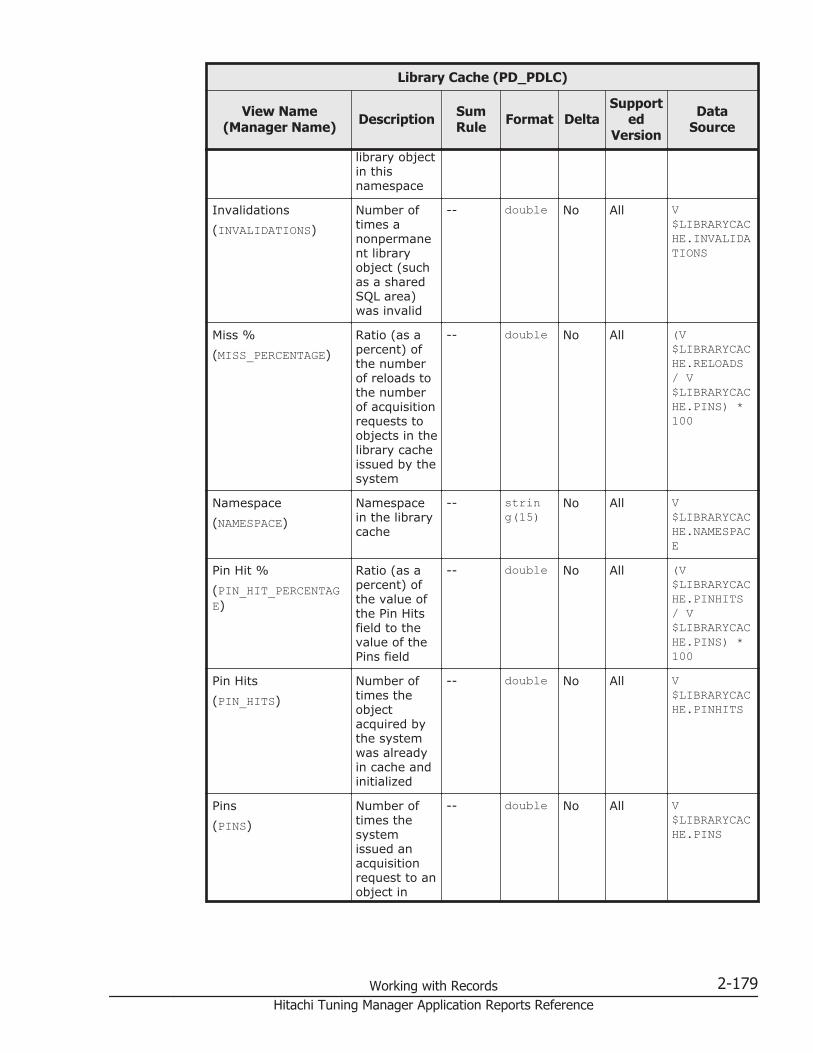
Library Cache (PD_PDLC)
View Name(Manager Name) Description Sum
Rule Format DeltaSupport
edVersion
DataSource
library objectin thisnamespace
Invalidations(INVALIDATIONS)
Number oftimes anonpermanent libraryobject (suchas a sharedSQL area)was invalid
-- double No All V$LIBRARYCACHE.INVALIDATIONS
Miss %(MISS_PERCENTAGE)
Ratio (as apercent) ofthe numberof reloads tothe numberof acquisitionrequests toobjects in thelibrary cacheissued by thesystem
-- double No All (V$LIBRARYCACHE.RELOADS/ V$LIBRARYCACHE.PINS) *100
Namespace(NAMESPACE)
Namespacein the librarycache
-- string(15)
No All V$LIBRARYCACHE.NAMESPACE
Pin Hit %(PIN_HIT_PERCENTAGE)
Ratio (as apercent) ofthe value ofthe Pin Hitsfield to thevalue of thePins field
-- double No All (V$LIBRARYCACHE.PINHITS/ V$LIBRARYCACHE.PINS) *100
Pin Hits(PIN_HITS)
Number oftimes theobjectacquired bythe systemwas alreadyin cache andinitialized
-- double No All V$LIBRARYCACHE.PINHITS
Pins(PINS)
Number oftimes thesystemissued anacquisitionrequest to anobject in
-- double No All V$LIBRARYCACHE.PINS
Working with Records 2-179Hitachi Tuning Manager Application Reports Reference
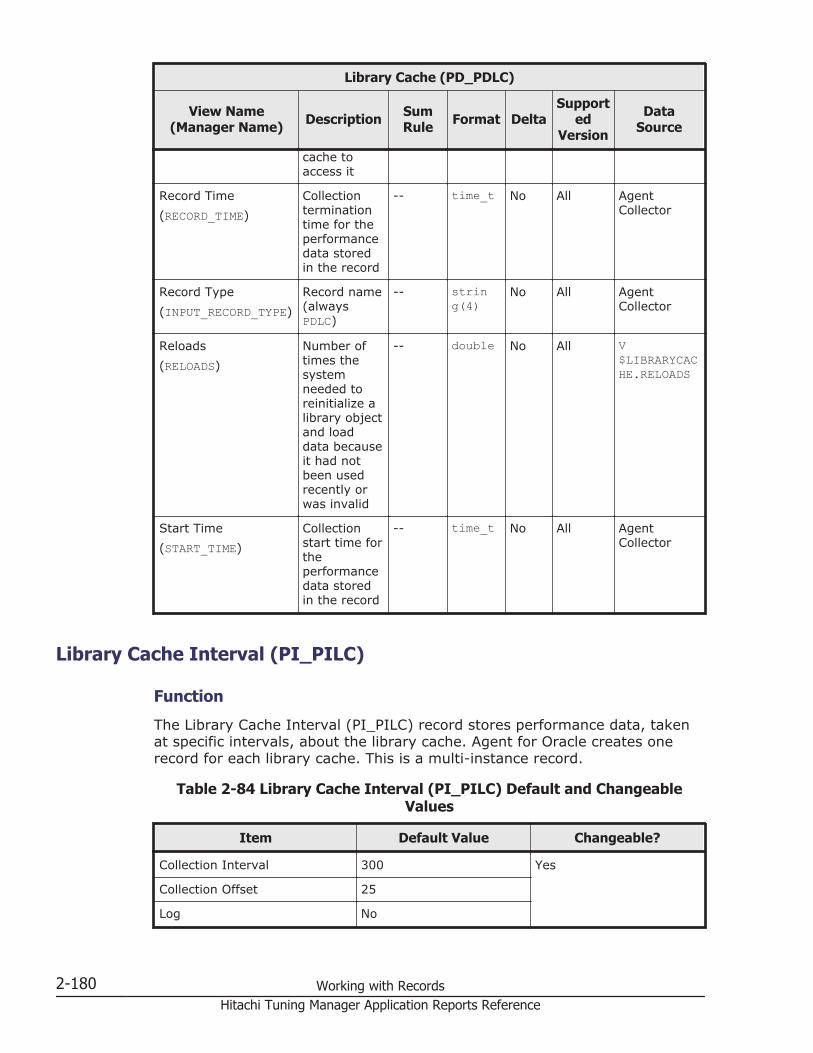
Library Cache (PD_PDLC)
View Name(Manager Name) Description Sum
Rule Format DeltaSupport
edVersion
DataSource
cache toaccess it
Record Time(RECORD_TIME)
Collectionterminationtime for theperformancedata storedin the record
-- time_t No All AgentCollector
Record Type(INPUT_RECORD_TYPE)
Record name(alwaysPDLC)
-- string(4)
No All AgentCollector
Reloads(RELOADS)
Number oftimes thesystemneeded toreinitialize alibrary objectand loaddata becauseit had notbeen usedrecently orwas invalid
-- double No All V$LIBRARYCACHE.RELOADS
Start Time(START_TIME)
Collectionstart time fortheperformancedata storedin the record
-- time_t No All AgentCollector
Library Cache Interval (PI_PILC)
Function
The Library Cache Interval (PI_PILC) record stores performance data, takenat specific intervals, about the library cache. Agent for Oracle creates onerecord for each library cache. This is a multi-instance record.
Table 2-84 Library Cache Interval (PI_PILC) Default and ChangeableValues
Item Default Value Changeable?
Collection Interval 300 Yes
Collection Offset 25
Log No
2-180 Working with RecordsHitachi Tuning Manager Application Reports Reference

Item Default Value Changeable?
LOGIF (Blank)
Key Fields
Namespace (NAMESPACE)
Lifetime
From the creation to the deletion of an Oracle instance
Record Size
• Fixed part: 678 bytes• Variable part: 196 bytes
Table 2-85 Library Cache Interval (PI_PILC) Fields
Library Cache Interval (PI_PILC)
View Name(Manager Name) Description Sum
Rule Format DeltaSupport
edVersion
DataSource
Get Hit %(GET_HIT_PERCENTAGE)
Ratio (as apercent) ofthe value ofthe Get Hitsfield to thevalue of theGets fieldduring theinterval
AVG double No All (V$LIBRARYCACHE.GETHITS/ V$LIBRARYCACHE.GETS) *100
Get Hits(GET_HITS)
Number oftimes thehandle wasalready incache duringthe interval
AVG double Yes All V$LIBRARYCACHE.GETHITS
Gets(GETS)
Number oftimes thesystemrequestedhandle to alibrary objectin thisnamespaceduring theinterval
AVG double Yes All V$LIBRARYCACHE.GETS
Invalidations(INVALIDATIONS)
Number oftimes a
AVG double Yes All V$LIBRARYCAC
Working with Records 2-181Hitachi Tuning Manager Application Reports Reference
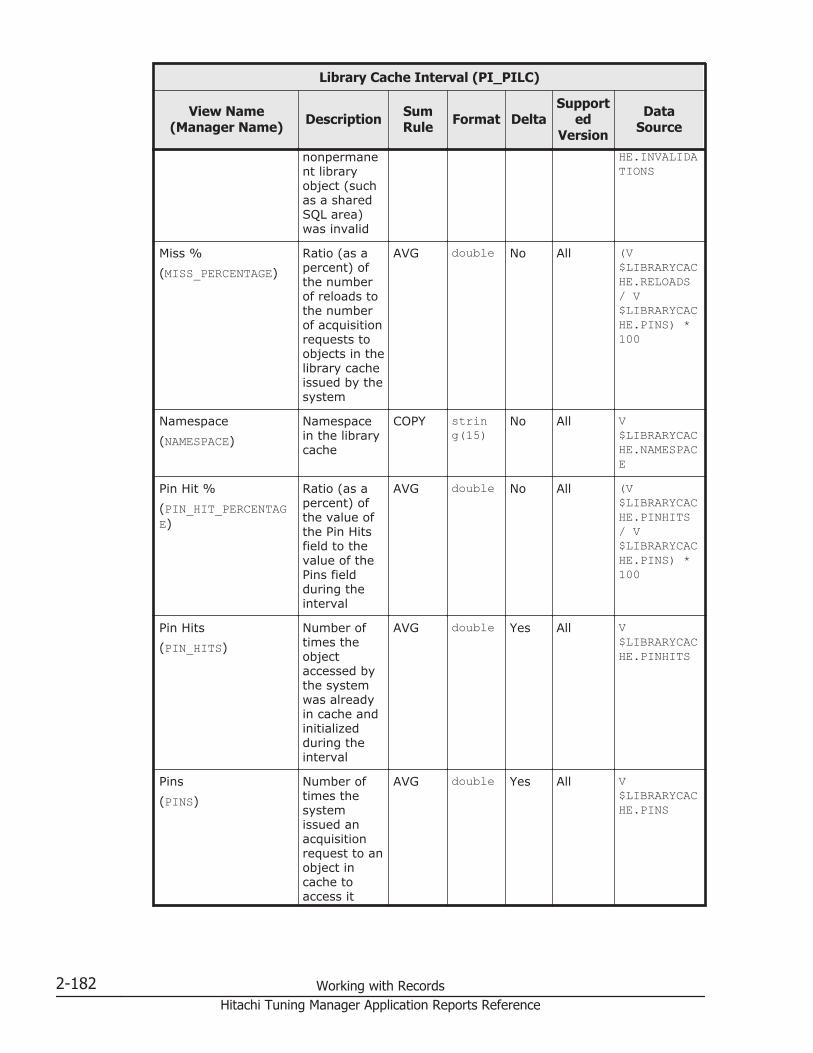
Library Cache Interval (PI_PILC)
View Name(Manager Name) Description Sum
Rule Format DeltaSupport
edVersion
DataSource
nonpermanent libraryobject (suchas a sharedSQL area)was invalid
HE.INVALIDATIONS
Miss %(MISS_PERCENTAGE)
Ratio (as apercent) ofthe numberof reloads tothe numberof acquisitionrequests toobjects in thelibrary cacheissued by thesystem
AVG double No All (V$LIBRARYCACHE.RELOADS/ V$LIBRARYCACHE.PINS) *100
Namespace(NAMESPACE)
Namespacein the librarycache
COPY string(15)
No All V$LIBRARYCACHE.NAMESPACE
Pin Hit %(PIN_HIT_PERCENTAGE)
Ratio (as apercent) ofthe value ofthe Pin Hitsfield to thevalue of thePins fieldduring theinterval
AVG double No All (V$LIBRARYCACHE.PINHITS/ V$LIBRARYCACHE.PINS) *100
Pin Hits(PIN_HITS)
Number oftimes theobjectaccessed bythe systemwas alreadyin cache andinitializedduring theinterval
AVG double Yes All V$LIBRARYCACHE.PINHITS
Pins(PINS)
Number oftimes thesystemissued anacquisitionrequest to anobject incache toaccess it
AVG double Yes All V$LIBRARYCACHE.PINS
2-182 Working with RecordsHitachi Tuning Manager Application Reports Reference

Library Cache Interval (PI_PILC)
View Name(Manager Name) Description Sum
Rule Format DeltaSupport
edVersion
DataSource
during theinterval
Record Time(RECORD_TIME)
Collectionterminationtime for theperformancedata storedin the record
COPY time_t No All AgentCollector
Record Type(INPUT_RECORD_TYPE)
Record name(alwaysPILC)
COPY string(4)
No All AgentCollector
Reloads(RELOADS)
Number oftimes thesystemneeded toreinitialize alibrary objectand loaddata becauseit had notbeen usedrecently orwas invalidduring theinterval
AVG double Yes All V$LIBRARYCACHE.RELOADS
Start Time(START_TIME)
Collectionstart time fortheperformancedata storedin the record
COPY time_t No All AgentCollector
Lock (PD_PDLO)
Function
The Lock (PD_PDLO) record stores performance data indicating the status oflocks at a specific point in time. Agent for Oracle creates one record for eachlock in an instance. This is a multi-instance record.
If you cannot view the performance data in this record, create Oracle's staticdata dictionary view DBA_WAITERS. To create this view, you must execute theCATBLOCK.SQL script that is provided by Oracle.
Working with Records 2-183Hitachi Tuning Manager Application Reports Reference
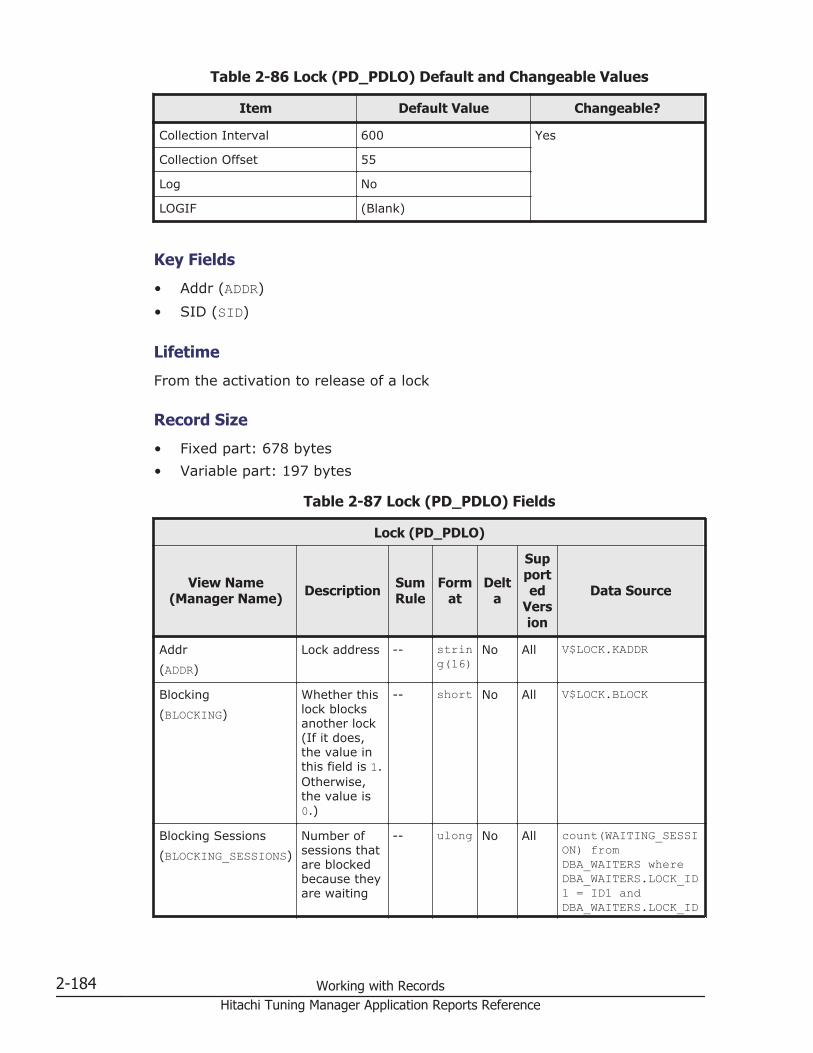
Table 2-86 Lock (PD_PDLO) Default and Changeable Values
Item Default Value Changeable?
Collection Interval 600 Yes
Collection Offset 55
Log No
LOGIF (Blank)
Key Fields
• Addr (ADDR)• SID (SID)
Lifetime
From the activation to release of a lock
Record Size
• Fixed part: 678 bytes• Variable part: 197 bytes
Table 2-87 Lock (PD_PDLO) Fields
Lock (PD_PDLO)
View Name(Manager Name) Description Sum
RuleForm
atDelt
a
Supported
Version
Data Source
Addr(ADDR)
Lock address -- string(16)
No All V$LOCK.KADDR
Blocking(BLOCKING)
Whether thislock blocksanother lock(If it does,the value inthis field is 1.Otherwise,the value is0.)
-- short No All V$LOCK.BLOCK
Blocking Sessions(BLOCKING_SESSIONS)
Number ofsessions thatare blockedbecause theyare waiting
-- ulong No All count(WAITING_SESSION) fromDBA_WAITERS whereDBA_WAITERS.LOCK_ID1 = ID1 andDBA_WAITERS.LOCK_ID
2-184 Working with RecordsHitachi Tuning Manager Application Reports Reference
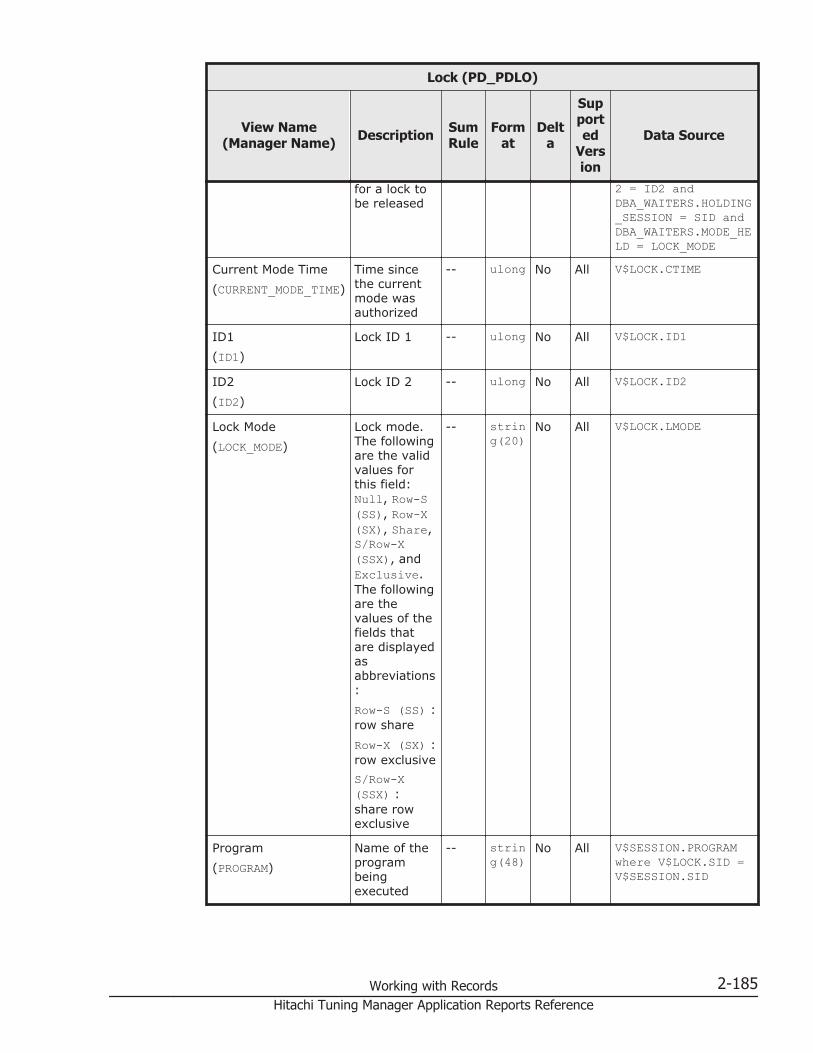
Lock (PD_PDLO)
View Name(Manager Name) Description Sum
RuleForm
atDelt
a
Supported
Version
Data Source
for a lock tobe released
2 = ID2 andDBA_WAITERS.HOLDING_SESSION = SID andDBA_WAITERS.MODE_HELD = LOCK_MODE
Current Mode Time(CURRENT_MODE_TIME)
Time sincethe currentmode wasauthorized
-- ulong No All V$LOCK.CTIME
ID1(ID1)
Lock ID 1 -- ulong No All V$LOCK.ID1
ID2(ID2)
Lock ID 2 -- ulong No All V$LOCK.ID2
Lock Mode(LOCK_MODE)
Lock mode.The followingare the validvalues forthis field:Null, Row-S(SS), Row-X(SX), Share,S/Row-X(SSX), andExclusive.The followingare thevalues of thefields thatare displayedasabbreviations:Row-S (SS) :row shareRow-X (SX) :row exclusiveS/Row-X(SSX) :share rowexclusive
-- string(20)
No All V$LOCK.LMODE
Program(PROGRAM)
Name of theprogrambeingexecuted
-- string(48)
No All V$SESSION.PROGRAMwhere V$LOCK.SID =V$SESSION.SID
Working with Records 2-185Hitachi Tuning Manager Application Reports Reference
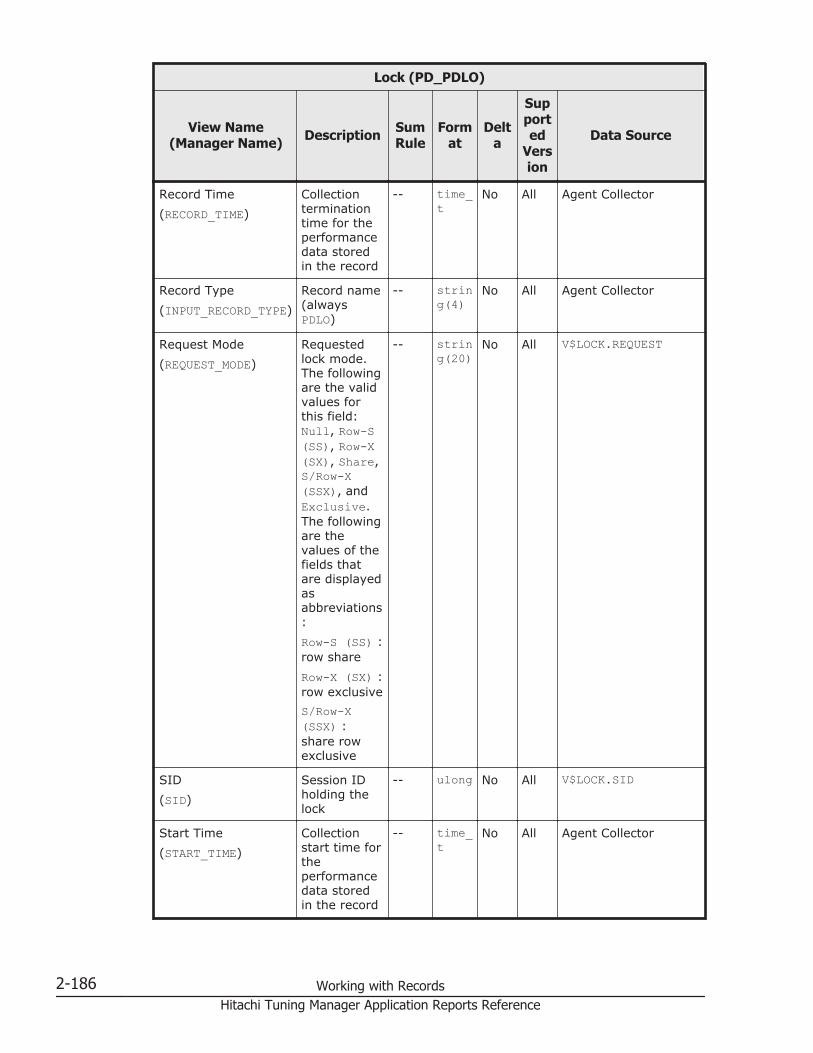
Lock (PD_PDLO)
View Name(Manager Name) Description Sum
RuleForm
atDelt
a
Supported
Version
Data Source
Record Time(RECORD_TIME)
Collectionterminationtime for theperformancedata storedin the record
-- time_t
No All Agent Collector
Record Type(INPUT_RECORD_TYPE)
Record name(alwaysPDLO)
-- string(4)
No All Agent Collector
Request Mode(REQUEST_MODE)
Requestedlock mode.The followingare the validvalues forthis field:Null, Row-S(SS), Row-X(SX), Share,S/Row-X(SSX), andExclusive.The followingare thevalues of thefields thatare displayedasabbreviations:Row-S (SS) :row shareRow-X (SX) :row exclusiveS/Row-X(SSX) :share rowexclusive
-- string(20)
No All V$LOCK.REQUEST
SID(SID)
Session IDholding thelock
-- ulong No All V$LOCK.SID
Start Time(START_TIME)
Collectionstart time fortheperformancedata storedin the record
-- time_t
No All Agent Collector
2-186 Working with RecordsHitachi Tuning Manager Application Reports Reference

Lock (PD_PDLO)
View Name(Manager Name) Description Sum
RuleForm
atDelt
a
Supported
Version
Data Source
Type(TYPE)
Lock type -- string(2)
No All V$LOCK.TYPE
Type Text(TYPE_TEXT)
Details oflock type
-- string(32)
No All V$LOCK.TYPE
User(USERNAME)
Oracle username
-- string(30)
No All V$SESSION.USERNAMEwhere V$LOCK.SID =V$SESSION.SID
Lock Activity Interval (PI_PIPL)
Function
The Lock Activity Interval (PI_PIPL) record stores performance data, taken atspecific intervals, about PCM lock conversions that have occurred. Agent forOracle creates one record each time a PCM lock conversion occurs. This is amulti-instance record for Oracle Real Application Clusters.
Table 2-88 Lock Activity Interval (PI_PIPL) Default and ChangeableValues
Item Default Value Changeable?
Collection Interval 600 Yes
Collection Offset 55
Log No
LOGIF (Blank)
Key Fields
• Initial State (INITIAL_STATE)• Final State (FINAL_STATE)
Lifetime
From the start to the stop of an Oracle instance
Record Size
• Fixed part: 678 bytes
Working with Records 2-187Hitachi Tuning Manager Application Reports Reference
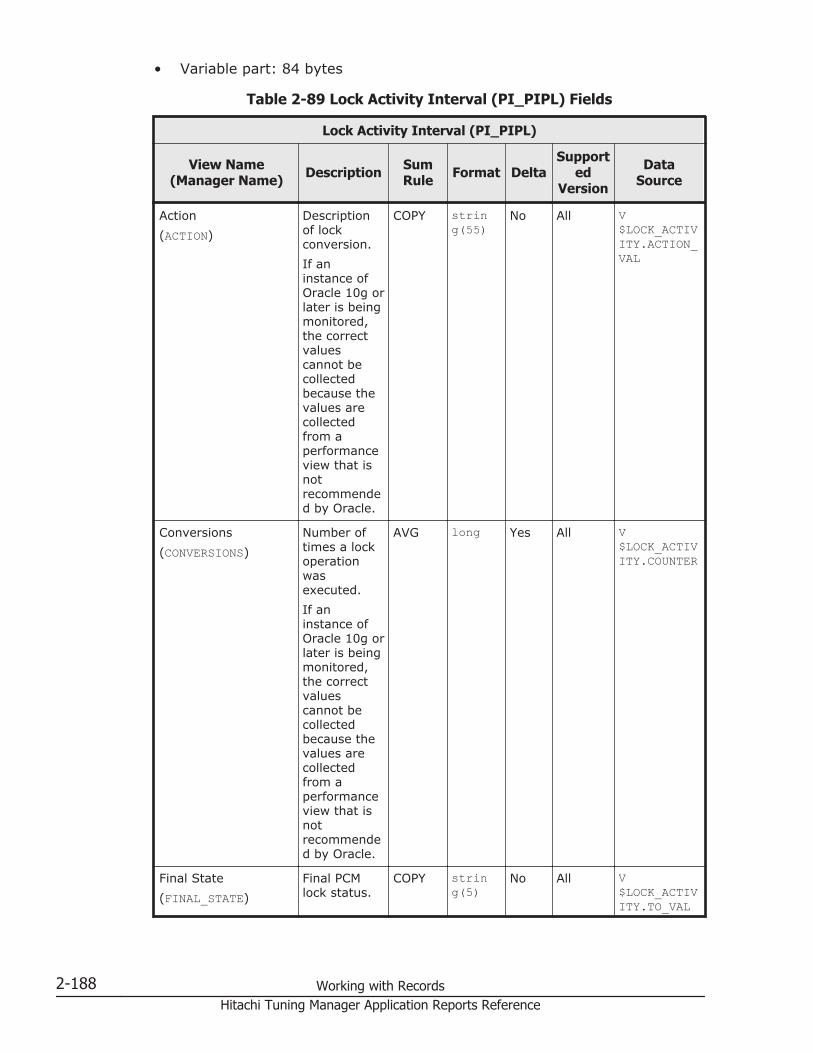
• Variable part: 84 bytes
Table 2-89 Lock Activity Interval (PI_PIPL) Fields
Lock Activity Interval (PI_PIPL)
View Name(Manager Name) Description Sum
Rule Format DeltaSupport
edVersion
DataSource
Action(ACTION)
Descriptionof lockconversion.If aninstance ofOracle 10g orlater is beingmonitored,the correctvaluescannot becollectedbecause thevalues arecollectedfrom aperformanceview that isnotrecommended by Oracle.
COPY string(55)
No All V$LOCK_ACTIVITY.ACTION_VAL
Conversions(CONVERSIONS)
Number oftimes a lockoperationwasexecuted.If aninstance ofOracle 10g orlater is beingmonitored,the correctvaluescannot becollectedbecause thevalues arecollectedfrom aperformanceview that isnotrecommended by Oracle.
AVG long Yes All V$LOCK_ACTIVITY.COUNTER
Final State(FINAL_STATE)
Final PCMlock status.
COPY string(5)
No All V$LOCK_ACTIVITY.TO_VAL
2-188 Working with RecordsHitachi Tuning Manager Application Reports Reference
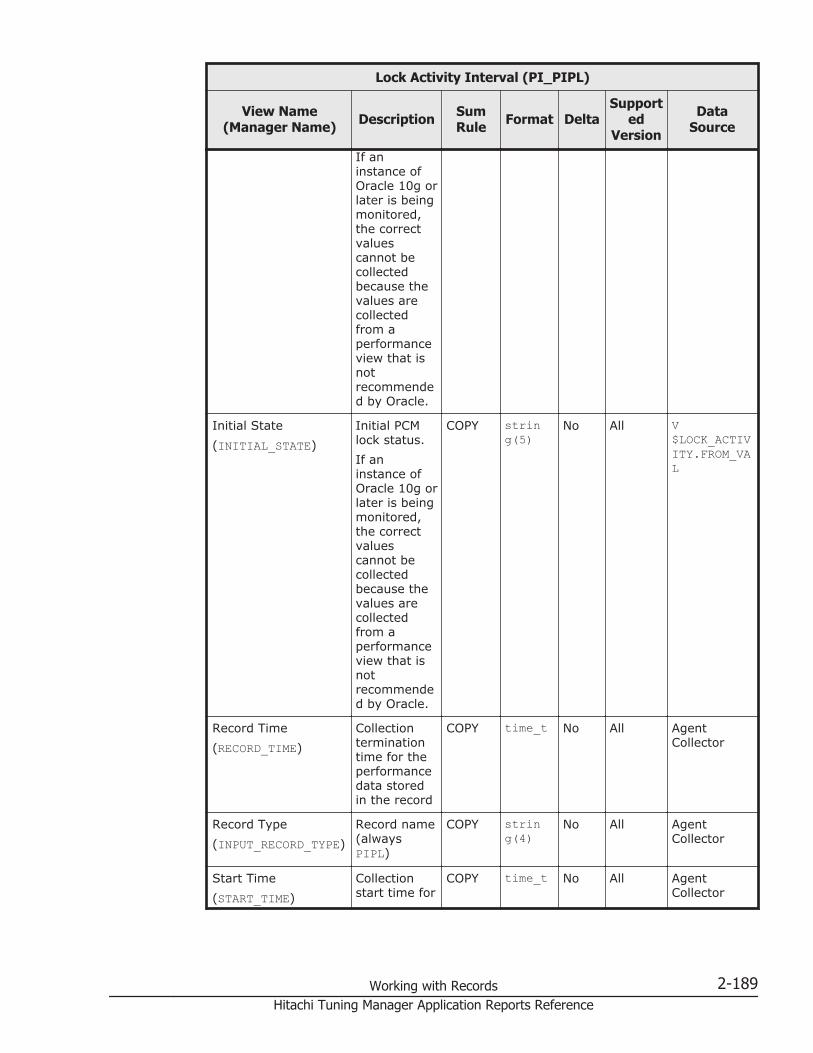
Lock Activity Interval (PI_PIPL)
View Name(Manager Name) Description Sum
Rule Format DeltaSupport
edVersion
DataSource
If aninstance ofOracle 10g orlater is beingmonitored,the correctvaluescannot becollectedbecause thevalues arecollectedfrom aperformanceview that isnotrecommended by Oracle.
Initial State(INITIAL_STATE)
Initial PCMlock status.If aninstance ofOracle 10g orlater is beingmonitored,the correctvaluescannot becollectedbecause thevalues arecollectedfrom aperformanceview that isnotrecommended by Oracle.
COPY string(5)
No All V$LOCK_ACTIVITY.FROM_VAL
Record Time(RECORD_TIME)
Collectionterminationtime for theperformancedata storedin the record
COPY time_t No All AgentCollector
Record Type(INPUT_RECORD_TYPE)
Record name(alwaysPIPL)
COPY string(4)
No All AgentCollector
Start Time(START_TIME)
Collectionstart time for
COPY time_t No All AgentCollector
Working with Records 2-189Hitachi Tuning Manager Application Reports Reference

Lock Activity Interval (PI_PIPL)
View Name(Manager Name) Description Sum
Rule Format DeltaSupport
edVersion
DataSource
theperformancedata storedin the record
Lock Interval (PI_PILO)
Function
The Lock Interval (PI_PILO) record stores performance data, taken at specificintervals, about locks. Agent for Oracle creates one record for each lock in aninstance. This is a multi-instance record.
If you cannot view the performance data in this record, create Oracle's staticdata dictionary view DBA_WAITERS. To create this view, you must execute theCATBLOCK.SQL script that is provided by Oracle.
Table 2-90 Lock Interval (PI_PILO) Default and Changeable Values
Item Default Value Changeable?
Collection Interval 600 Yes
Collection Offset 55
Log (see Note) No
LOGIF (Blank)
Note: When Log is set to Yes, if you collect history over a long period oftime, because of the short lifetime, it is not summarized in units of years ormonths. All instances are retained, resulting in a bloated store database. Inaddition, when the collected history is summarized, more memory is usedthan necessary. The memory shortage might cause monitoring to stop.If you want to collect history over a long period of time, use the Lock(PD_PDLD) record for monitoring.
Key Fields
• Addr (ADDR)• SID (SID)
Lifetime
From the activation to release of a lock
2-190 Working with RecordsHitachi Tuning Manager Application Reports Reference
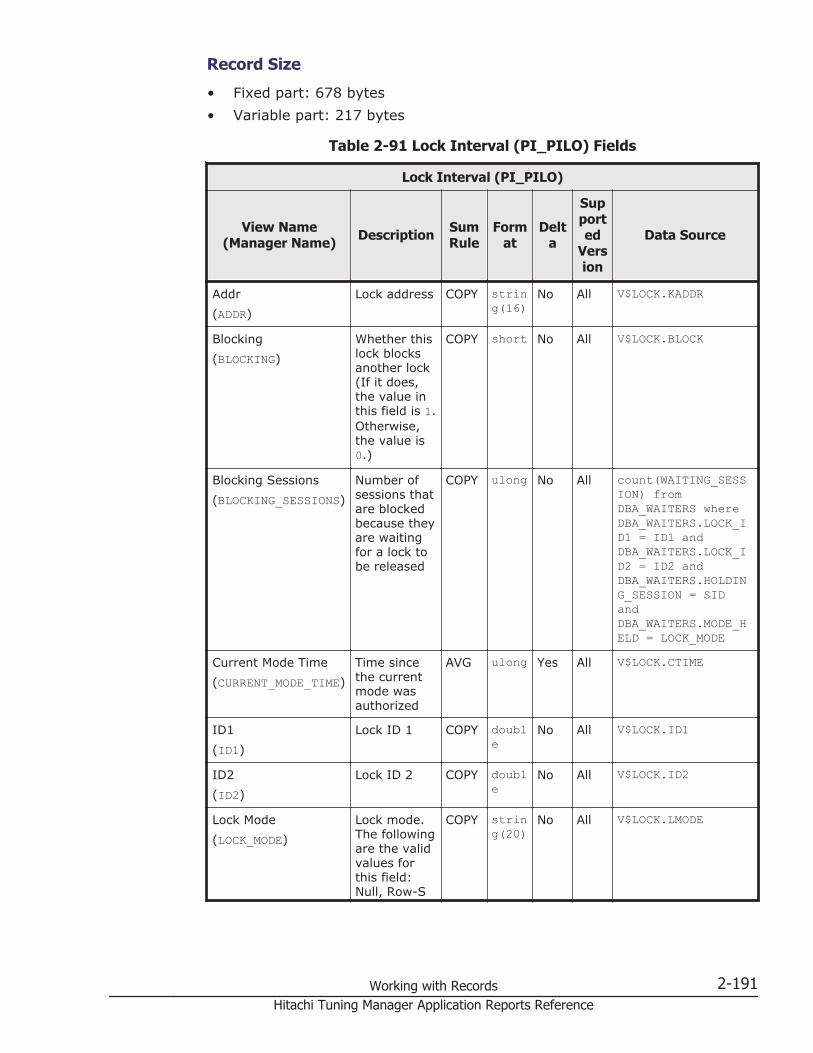
Record Size
• Fixed part: 678 bytes• Variable part: 217 bytes
Table 2-91 Lock Interval (PI_PILO) Fields
Lock Interval (PI_PILO)
View Name(Manager Name) Description Sum
RuleForm
atDelt
a
Supported
Version
Data Source
Addr(ADDR)
Lock address COPY string(16)
No All V$LOCK.KADDR
Blocking(BLOCKING)
Whether thislock blocksanother lock(If it does,the value inthis field is 1.Otherwise,the value is0.)
COPY short No All V$LOCK.BLOCK
Blocking Sessions(BLOCKING_SESSIONS)
Number ofsessions thatare blockedbecause theyare waitingfor a lock tobe released
COPY ulong No All count(WAITING_SESSION) fromDBA_WAITERS whereDBA_WAITERS.LOCK_ID1 = ID1 andDBA_WAITERS.LOCK_ID2 = ID2 andDBA_WAITERS.HOLDING_SESSION = SIDandDBA_WAITERS.MODE_HELD = LOCK_MODE
Current Mode Time(CURRENT_MODE_TIME)
Time sincethe currentmode wasauthorized
AVG ulong Yes All V$LOCK.CTIME
ID1(ID1)
Lock ID 1 COPY double
No All V$LOCK.ID1
ID2(ID2)
Lock ID 2 COPY double
No All V$LOCK.ID2
Lock Mode(LOCK_MODE)
Lock mode.The followingare the validvalues forthis field:Null, Row-S
COPY string(20)
No All V$LOCK.LMODE
Working with Records 2-191Hitachi Tuning Manager Application Reports Reference
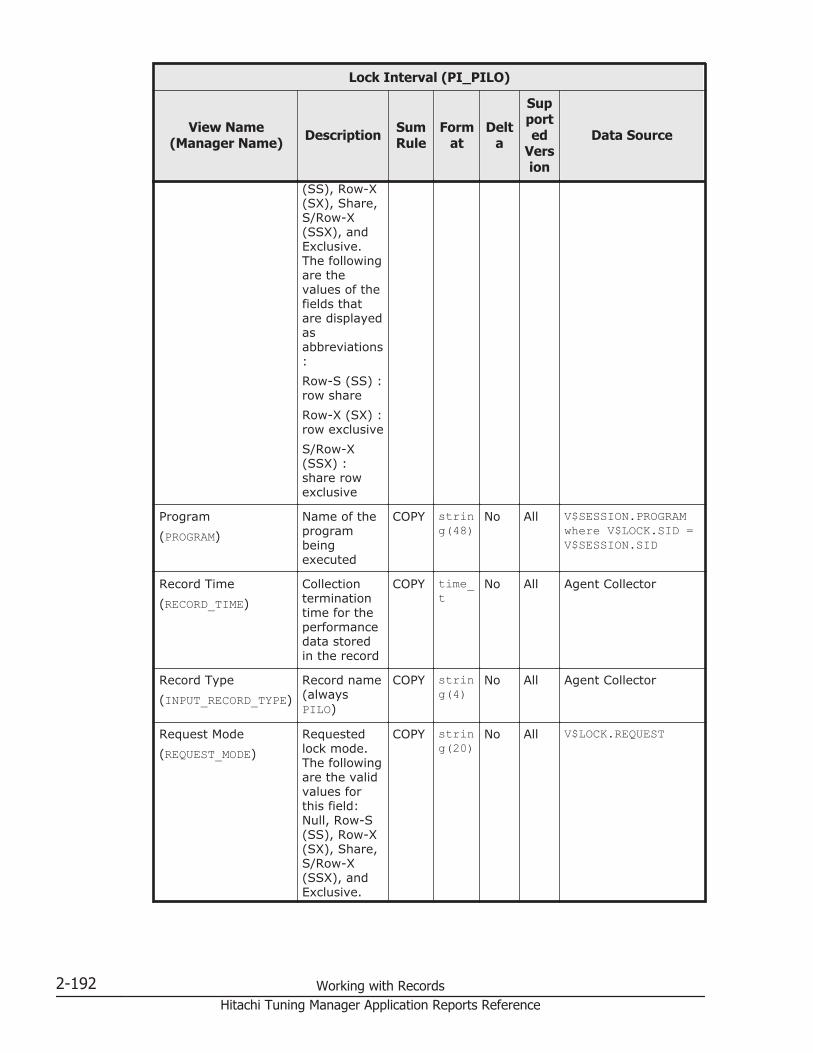
Lock Interval (PI_PILO)
View Name(Manager Name) Description Sum
RuleForm
atDelt
a
Supported
Version
Data Source
(SS), Row-X(SX), Share,S/Row-X(SSX), andExclusive.The followingare thevalues of thefields thatare displayedasabbreviations:Row-S (SS) :row shareRow-X (SX) :row exclusiveS/Row-X(SSX) :share rowexclusive
Program(PROGRAM)
Name of theprogrambeingexecuted
COPY string(48)
No All V$SESSION.PROGRAMwhere V$LOCK.SID =V$SESSION.SID
Record Time(RECORD_TIME)
Collectionterminationtime for theperformancedata storedin the record
COPY time_t
No All Agent Collector
Record Type(INPUT_RECORD_TYPE)
Record name(alwaysPILO)
COPY string(4)
No All Agent Collector
Request Mode(REQUEST_MODE)
Requestedlock mode.The followingare the validvalues forthis field:Null, Row-S(SS), Row-X(SX), Share,S/Row-X(SSX), andExclusive.
COPY string(20)
No All V$LOCK.REQUEST
2-192 Working with RecordsHitachi Tuning Manager Application Reports Reference

Lock Interval (PI_PILO)
View Name(Manager Name) Description Sum
RuleForm
atDelt
a
Supported
Version
Data Source
The followingare thevalues of thefields thatare displayedasabbreviations:Row-S (SS) :row shareRow-X (SX) :row exclusiveS/Row-X(SSX) :share rowexclusive
SID(SID)
Session IDholding orhaving thelock
COPY ulong No All V$LOCK.SID
Start Time(START_TIME)
Collectionstart time fortheperformancedata storedin the record
COPY time_t
No All Agent Collector
Type(TYPE)
Lock type COPY string(2)
No All V$LOCK.TYPE
Type Text(TYPE_TEXT)
Details oflock type
COPY string(32)
No All V$LOCK.TYPE
User(USERNAME)
Oracle username
COPY string(30)
No All V$SESSION.USERNAMEwhere V$LOCK.SID =V$SESSION.SID
Lock Waiters (PD_PDLW)
Function
The Lock Waiters (PD_PDLW) record stores performance data indicating thestatus of all sessions waiting for a lock to be released and sessions holding alock at a specific point in time. Agent for Oracle creates one record for eachlock that a session is waiting for. This is a multi-instance record.
Working with Records 2-193Hitachi Tuning Manager Application Reports Reference

If you cannot view the performance data in this record, create Oracle's staticdata dictionary view DBA_WAITERS. To create this view, you must execute theCATBLOCK.SQL script that is provided by Oracle.
Table 2-92 Lock Waiters (PD_PDLW) Default and Changeable Values
Item Default Value Changeable?
Collection Interval 600 Yes
Collection Offset 60
Log No
LOGIF (Blank)
Key Fields
None
Lifetime
From the start to the end of a deadlock
Record Size
• Fixed part: 678 bytes• Variable part: 428 bytes
Table 2-93 Lock Waiters (PD_PDLW) Fields
Lock Waiters (PD_PDLW)
View Name(Manager Name) Description Sum
RuleForma
tDelt
a
Supported
Version
Data Source
Holding OS PID(HOLDING_PID)
OS's clientprocess IDcorresponding to thesessionholding thelock
-- string(30)
No All V$SESSION.PROCESS
Holding Session(HOLDING_SESSION)
Session IDholding thelock
-- ulong No All DBA_WAITERS.HOLDING_SESSION
Holding User(HOLDING_USER)
User namefor thesessionholding thelock
-- string(30)
No All V$SESSION.USERNAME
2-194 Working with RecordsHitachi Tuning Manager Application Reports Reference

Lock Waiters (PD_PDLW)
View Name(Manager Name) Description Sum
RuleForma
tDelt
a
Supported
Version
Data Source
Lock ID1(LOCK_ID1)
Lock ID 1 -- string(40)
No All DBA_WAITERS.LOCK_ID1
Lock ID2(LOCK_ID2)
Lock ID 2 -- string(40)
No All DBA_WAITERS.LOCK_ID2
Lock Type(TYPE)
Lock type -- string(30)
No All DBA_WAITERS.TYPE
Mode Held(MODE_HELD)
Lock modeheld duringdatacollection
-- string(40)
No All DBA_WAITERS.MODE_HELD
Mode Requested(MODE_REQUESTED)
Lock moderequestedduring datacollection
-- string(40)
No All DBA_WAITERS.MODE_REQUESTED
Record Time(RECORD_TIME)
Collectionterminationtime for theperformancedata storedin the record
-- time_t No All Agent Collector
Record Type(INPUT_RECORD_TYPE)
Record name(alwaysPDLW)
-- string(4)
No All Agent Collector
Start Time(START_TIME)
Collectionstart time fortheperformancedata storedin the record
-- time_t No All Agent Collector
Waiting OS PID(WAITING_PID)
OS's clientprocess IDcorresponding to thesessionwaiting forthe lock
-- string(30)
No All V$SESSION.PROCESS
Waiting Session(WAITING_SESSION)
Session IDwaiting forthe lock
-- ulong No All DBA_WAITERS.WAITING_SESSION
Waiting User(WAITING_USER)
User namefor thesession
-- string(30)
No All V$SESSION.USERNAME
Working with Records 2-195Hitachi Tuning Manager Application Reports Reference
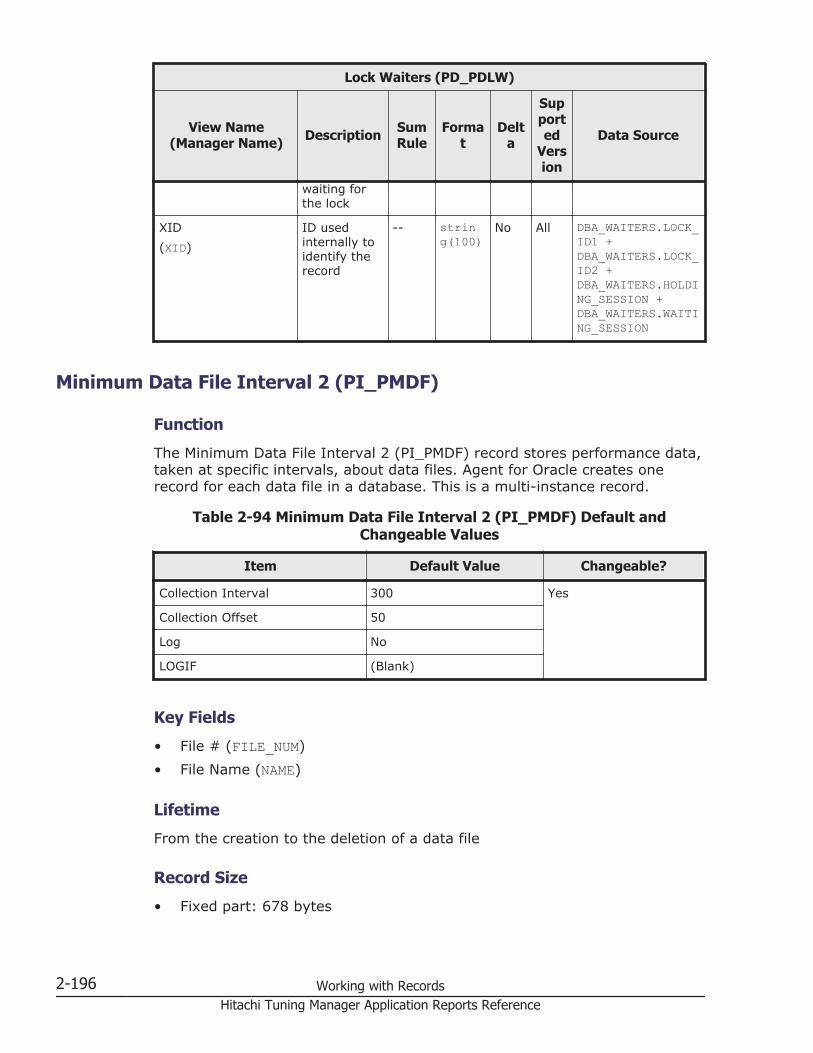
Lock Waiters (PD_PDLW)
View Name(Manager Name) Description Sum
RuleForma
tDelt
a
Supported
Version
Data Source
waiting forthe lock
XID(XID)
ID usedinternally toidentify therecord
-- string(100)
No All DBA_WAITERS.LOCK_ID1 +DBA_WAITERS.LOCK_ID2 +DBA_WAITERS.HOLDING_SESSION +DBA_WAITERS.WAITING_SESSION
Minimum Data File Interval 2 (PI_PMDF)
Function
The Minimum Data File Interval 2 (PI_PMDF) record stores performance data,taken at specific intervals, about data files. Agent for Oracle creates onerecord for each data file in a database. This is a multi-instance record.
Table 2-94 Minimum Data File Interval 2 (PI_PMDF) Default andChangeable Values
Item Default Value Changeable?
Collection Interval 300 Yes
Collection Offset 50
Log No
LOGIF (Blank)
Key Fields
• File # (FILE_NUM)• File Name (NAME)
Lifetime
From the creation to the deletion of a data file
Record Size
• Fixed part: 678 bytes
2-196 Working with RecordsHitachi Tuning Manager Application Reports Reference
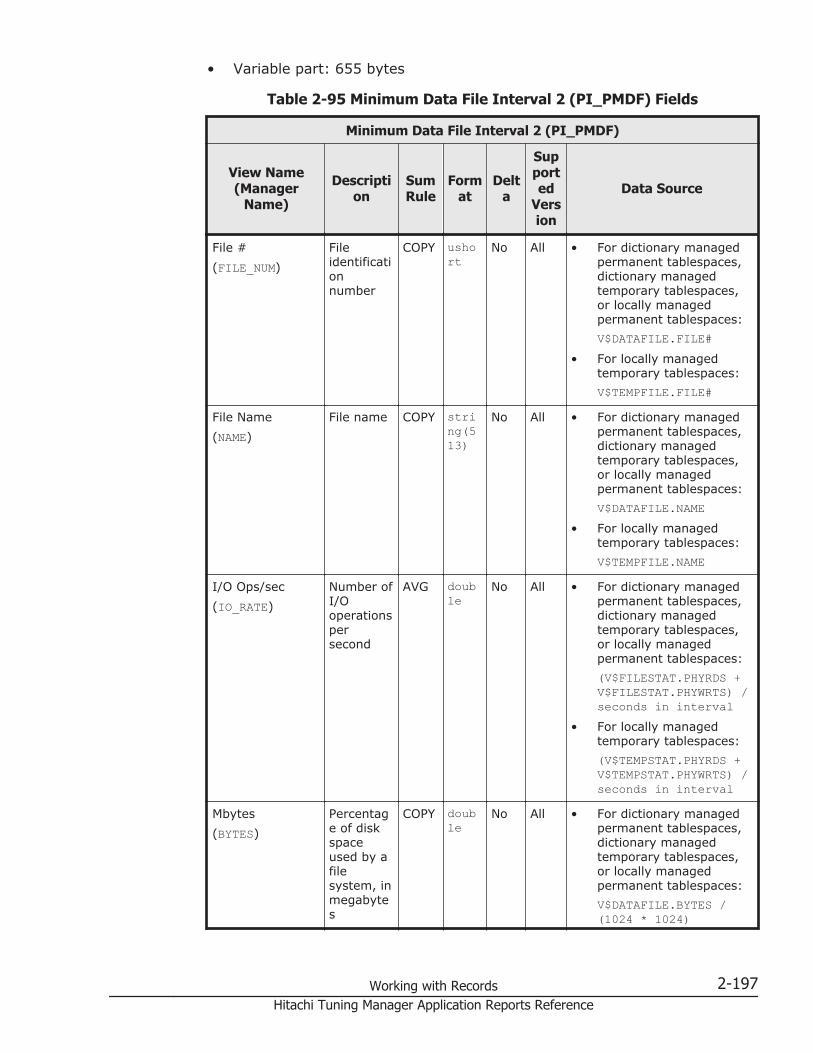
• Variable part: 655 bytes
Table 2-95 Minimum Data File Interval 2 (PI_PMDF) Fields
Minimum Data File Interval 2 (PI_PMDF)
View Name(Manager
Name)
Description
SumRule
Format
Delta
Supported
Version
Data Source
File #(FILE_NUM)
Fileidentificationnumber
COPY ushort
No All • For dictionary managedpermanent tablespaces,dictionary managedtemporary tablespaces,or locally managedpermanent tablespaces:V$DATAFILE.FILE#
• For locally managedtemporary tablespaces:V$TEMPFILE.FILE#
File Name(NAME)
File name COPY string(513)
No All • For dictionary managedpermanent tablespaces,dictionary managedtemporary tablespaces,or locally managedpermanent tablespaces:V$DATAFILE.NAME
• For locally managedtemporary tablespaces:V$TEMPFILE.NAME
I/O Ops/sec(IO_RATE)
Number ofI/Ooperationspersecond
AVG double
No All • For dictionary managedpermanent tablespaces,dictionary managedtemporary tablespaces,or locally managedpermanent tablespaces:(V$FILESTAT.PHYRDS +V$FILESTAT.PHYWRTS) /seconds in interval
• For locally managedtemporary tablespaces:(V$TEMPSTAT.PHYRDS +V$TEMPSTAT.PHYWRTS) /seconds in interval
Mbytes(BYTES)
Percentage of diskspaceused by afilesystem, inmegabytes
COPY double
No All • For dictionary managedpermanent tablespaces,dictionary managedtemporary tablespaces,or locally managedpermanent tablespaces:V$DATAFILE.BYTES /(1024 * 1024)
Working with Records 2-197Hitachi Tuning Manager Application Reports Reference

Minimum Data File Interval 2 (PI_PMDF)
View Name(Manager
Name)
Description
SumRule
Format
Delta
Supported
Version
Data Source
• For locally managedtemporary tablespaces:V$TEMPFILE.BYTES /(1024 * 1024)
Physical Reads(PHYSICAL_READS)
Number ofphysicalblock readoperationsthat werecompletedduring theinterval
AVG double
Yes All • For dictionary managedpermanent tablespaces,dictionary managedtemporary tablespaces,or locally managedpermanent tablespaces:V$FILESTAT.PHYRDS
• For locally managedtemporary tablespaces:V$TEMPSTAT.PHYRDS
Physical Writes(PHYSICAL_WRITES)
Number ofphysicalblockwriteoperationsthat werecompletedduring theinterval
AVG double
Yes All • For dictionary managedpermanent tablespaces,dictionary managedtemporary tablespaces,or locally managedpermanent tablespaces:V$FILESTAT.PHYWRTS
• For locally managedtemporary tablespaces:V$TEMPSTAT.PHYWRTS
Reads/sec(READ_RATE)
Number ofreadoperationspersecond
AVG double
No All • For dictionary managedpermanent tablespaces,dictionary managedtemporary tablespaces,or locally managedpermanent tablespaces:V$FILESTAT.PHYRDS /seconds in interval
• For locally managedtemporary tablespaces:V$TEMPSTAT.PHYRDS /seconds in interval
Record Time(RECORD_TIME)
Collectiontermination time fortheperformance datastored inthe record
COPY time_t
No All Agent Collector
2-198 Working with RecordsHitachi Tuning Manager Application Reports Reference

Minimum Data File Interval 2 (PI_PMDF)
View Name(Manager
Name)
Description
SumRule
Format
Delta
Supported
Version
Data Source
Record Type(INPUT_RECORD_TYPE)
Recordname(alwaysPMDF)
COPY string(4)
No All Agent Collector
Start Time(START_TIME)
Collectionstart timefor theperformance datastored inthe record
COPY time_t
No All Agent Collector
Tablespace Name(TABLESPACE_NAME)
Tablespace nameassociatedwith thefile
COPY string(30)
No All • For dictionary managedpermanent tablespaces,dictionary managedtemporary tablespaces,or locally managedpermanent tablespaces:DBA_DATA_FILES.TABLESPACE_NAME
• For locally managedtemporary tablespaces:DBA_TEMP_FILES.TABLESPACE_NAME
Writes/sec(WRITES_RATE)
Number ofwriteoperationspersecond
AVG double
No All • For dictionary managedpermanent tablespaces,dictionary managedtemporary tablespaces,or locally managedpermanent tablespaces:V$FILESTAT.PHYWRTS /seconds in interval
• For locally managedtemporary tablespaces:V$TEMPSTAT.PHYWRTS /seconds in interval
Minimum Database Interval 2 (PI_PMDB)
Function
The Minimum Database Interval 2 (PI_PMDB) record stores performancedata, taken at specific intervals, about a database.
Working with Records 2-199Hitachi Tuning Manager Application Reports Reference

Table 2-96 Minimum Database Interval 2 (PI_PMDB) Default andChangeable Values
Item Default Value Changeable?
Collection Interval 3600 Yes
Collection Offset 1810
Log No
LOGIF (Blank)
Key Fields
None
Lifetime
From the creation to the deletion of a database
Record Size
• Fixed part: 688 bytes• Variable part: 0 bytes
Table 2-97 Minimum Database Interval 2 (PI_PMDB) Fields
Minimum Database Interval 2 (PI_PMDB)
View Name(Manager
Name)Description Sum
RuleForma
tDelt
a
Supported
VersionData Source
DB Name(NAME)
Database name COPY string(9)
No All V$DATABASE.NAME
Record Time(RECORD_TIME)
Collectionterminationtime for theperformancedata stored inthe record
COPY time_t No All Agent Collector
Record Type(INPUT_RECORD_TYPE)
Record name(always PMDB)
COPY string(4)
No All Agent Collector
Start Time(START_TIME)
Collection starttime for theperformancedata stored inthe record
COPY time_t No All Agent Collector
2-200 Working with RecordsHitachi Tuning Manager Application Reports Reference

Minimum Tablespace Interval 2 (PI_PMTS)
Function
The Minimum Tablespace Interval 2 (PI_PMTS) record stores performancedata, taken at specific intervals, about tablespaces in a database. Agent forOracle creates one record for each tablespace in a database. This is a multi-instance record.
Table 2-98 Minimum Tablespace Interval 2 (PI_PMTS) Default andChangeable Values
Item Default Value Changeable?
Collection Interval 3600 Yes
Collection Offset 1510
Log No
LOGIF (Blank)
Key Fields
Tablespace Name (TABLESPACE_NAME)
Lifetime
From the creation to the deletion of a tablespace
Record Size
• Fixed part: 678 bytes• Variable part: 163 bytes
Table 2-99 Minimum Tablespace Interval 2 (PI_PMTS) Fields
Minimum Tablespace Interval 2 (PI_PMTS)
View Name(Manager
Name)Description Sum
RuleForm
atDelt
a
Supported
Version
Data Source
I/O Ops/sec(IO_RATE)
Number of I/Ooperations persecond
AVG double
No All (SUM(V$FILESTAT.PHYRDS) +SUM(V$FILESTAT.PHYWRTS))/seconds in interval
Physical Reads(PHYSICAL_READS)
Number ofphysical readoperations
AVG double
Yes All • For dictionarymanaged permanenttablespaces, locallymanaged permanent
Working with Records 2-201Hitachi Tuning Manager Application Reports Reference

Minimum Tablespace Interval 2 (PI_PMTS)
View Name(Manager
Name)Description Sum
RuleForm
atDelt
a
Supported
Version
Data Source
that werecompleted
tablespaces, ordictionary managedtemporarytablespaces ofOracle9i or later:SUM(V$FILESTAT.PHYRDS)
• For locally managedtemporarytablespaces ofOracle9i or later:SUM(V$TEMPSTAT.PHYRDS)
Physical Writes(PHYSICAL_WRITES)
Number ofphysical writeoperationsthat werecompleted
AVG double
Yes All • For dictionarymanaged permanenttablespaces, locallymanaged permanenttablespaces, ordictionary managedtemporarytablespaces ofOracle9i or later:SUM(V$FILESTAT.PHYWRTS)
• For locally managedtemporarytablespaces ofOracle9i or later:SUM(V$TEMPSTAT.PHYWRTS)
Reads/sec(READ_RATE)
Number ofreadoperations persecond
AVG double
No All SUM(V$FILESTAT.PHYRDS)/seconds in interval
Record Time(RECORD_TIME)
Collectionterminationtime for theperformancedata stored inthe record
COPY time_t
No All Agent Collector
Record Type(INPUT_RECORD_TYPE)
Record name(always PMTS)
COPY string(4)
No All Agent Collector
2-202 Working with RecordsHitachi Tuning Manager Application Reports Reference

Minimum Tablespace Interval 2 (PI_PMTS)
View Name(Manager
Name)Description Sum
RuleForm
atDelt
a
Supported
Version
Data Source
RollbackSegments(ROLLBACK_SEGMENTS)
Number ofrollbacksegments. Ifan instance ofOracle9i orlater is beingmonitored,performancedata about alocallymanagedtablespace isnot collected.
AVG ulong No All COUNT(DBA_ROLLBACK_SEGS)
Sort Segments(SORT_SEGMENTS)
Number ofsortsegments. Ifan instance ofOracle9i orlater is beingmonitored,performancedata about alocallymanagedpermanenttablespace isnot collected.
AVG ulong No All COUNT(V$SORT_SEGMENT)
Start Time(START_TIME)
Collectionstart time fortheperformancedata stored inthe record
COPY time_t
No All Agent Collector
TablespaceName(TABLESPACE_NAME)
Tablespacename
COPY string(30)
No All DBA_TABLESPACES.TABLESPACE_NAME
Writes/sec(WRITES_RATE)
Number ofwriteoperations persecond
AVG double
No All • For dictionarymanaged permanenttablespaces, locallymanaged permanenttablespaces, ordictionary managedtemporarytablespaces ofOracle9i or later:
Working with Records 2-203Hitachi Tuning Manager Application Reports Reference
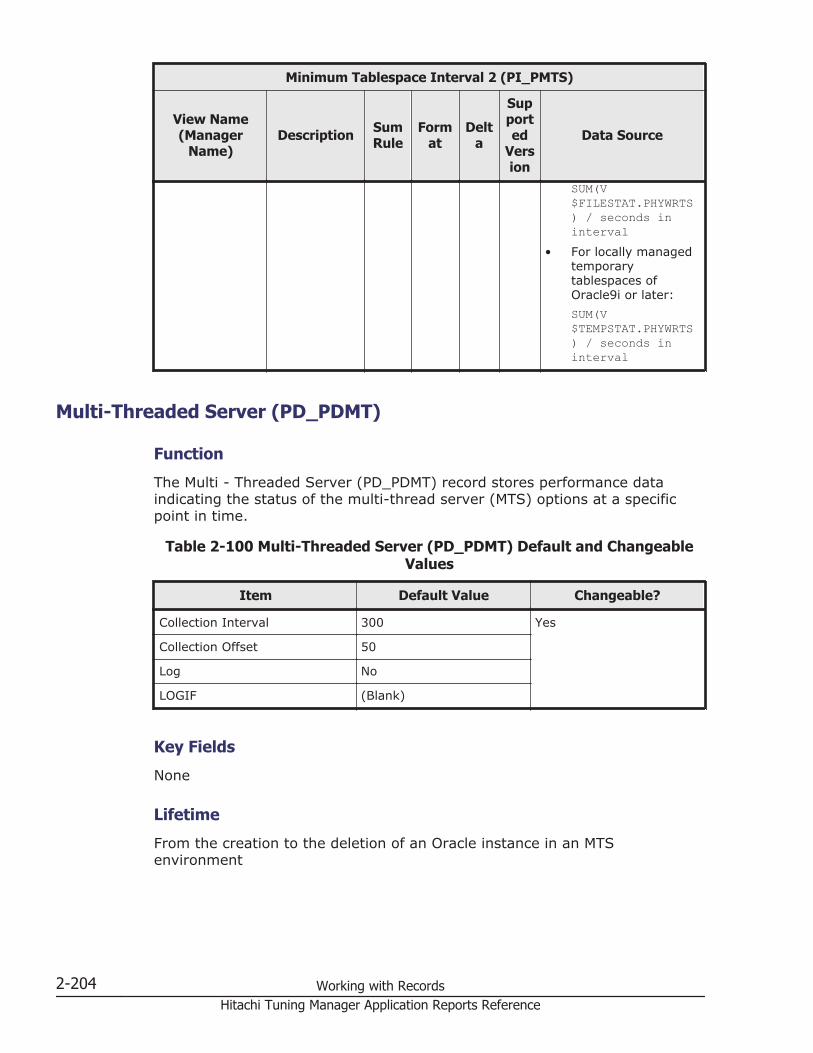
Minimum Tablespace Interval 2 (PI_PMTS)
View Name(Manager
Name)Description Sum
RuleForm
atDelt
a
Supported
Version
Data Source
SUM(V$FILESTAT.PHYWRTS) / seconds ininterval
• For locally managedtemporarytablespaces ofOracle9i or later:SUM(V$TEMPSTAT.PHYWRTS) / seconds ininterval
Multi-Threaded Server (PD_PDMT)
Function
The Multi - Threaded Server (PD_PDMT) record stores performance dataindicating the status of the multi-thread server (MTS) options at a specificpoint in time.
Table 2-100 Multi-Threaded Server (PD_PDMT) Default and ChangeableValues
Item Default Value Changeable?
Collection Interval 300 Yes
Collection Offset 50
Log No
LOGIF (Blank)
Key Fields
None
Lifetime
From the creation to the deletion of an Oracle instance in an MTSenvironment
2-204 Working with RecordsHitachi Tuning Manager Application Reports Reference
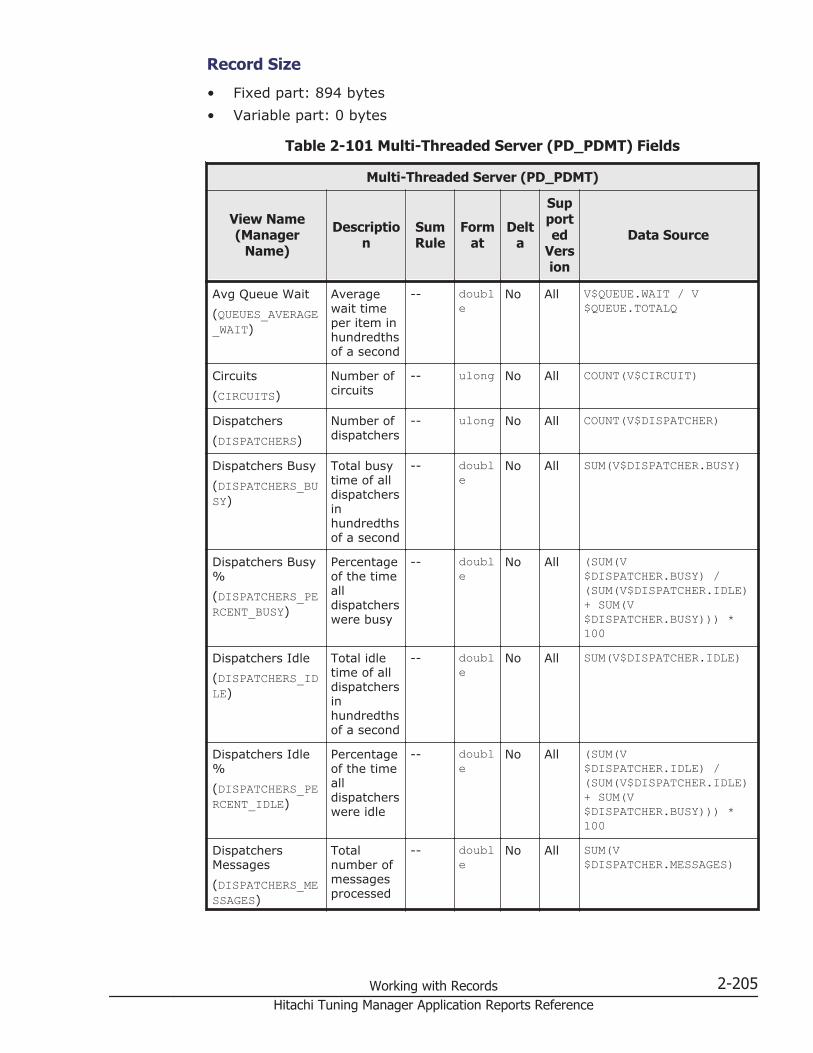
Record Size
• Fixed part: 894 bytes• Variable part: 0 bytes
Table 2-101 Multi-Threaded Server (PD_PDMT) Fields
Multi-Threaded Server (PD_PDMT)
View Name(Manager
Name)
Description
SumRule
Format
Delta
Supported
Version
Data Source
Avg Queue Wait(QUEUES_AVERAGE_WAIT)
Averagewait timeper item inhundredthsof a second
-- double
No All V$QUEUE.WAIT / V$QUEUE.TOTALQ
Circuits(CIRCUITS)
Number ofcircuits
-- ulong No All COUNT(V$CIRCUIT)
Dispatchers(DISPATCHERS)
Number ofdispatchers
-- ulong No All COUNT(V$DISPATCHER)
Dispatchers Busy(DISPATCHERS_BUSY)
Total busytime of alldispatchersinhundredthsof a second
-- double
No All SUM(V$DISPATCHER.BUSY)
Dispatchers Busy%(DISPATCHERS_PERCENT_BUSY)
Percentageof the timealldispatcherswere busy
-- double
No All (SUM(V$DISPATCHER.BUSY) /(SUM(V$DISPATCHER.IDLE)+ SUM(V$DISPATCHER.BUSY))) *100
Dispatchers Idle(DISPATCHERS_IDLE)
Total idletime of alldispatchersinhundredthsof a second
-- double
No All SUM(V$DISPATCHER.IDLE)
Dispatchers Idle%(DISPATCHERS_PERCENT_IDLE)
Percentageof the timealldispatcherswere idle
-- double
No All (SUM(V$DISPATCHER.IDLE) /(SUM(V$DISPATCHER.IDLE)+ SUM(V$DISPATCHER.BUSY))) *100
DispatchersMessages(DISPATCHERS_MESSAGES)
Totalnumber ofmessagesprocessed
-- double
No All SUM(V$DISPATCHER.MESSAGES)
Working with Records 2-205Hitachi Tuning Manager Application Reports Reference
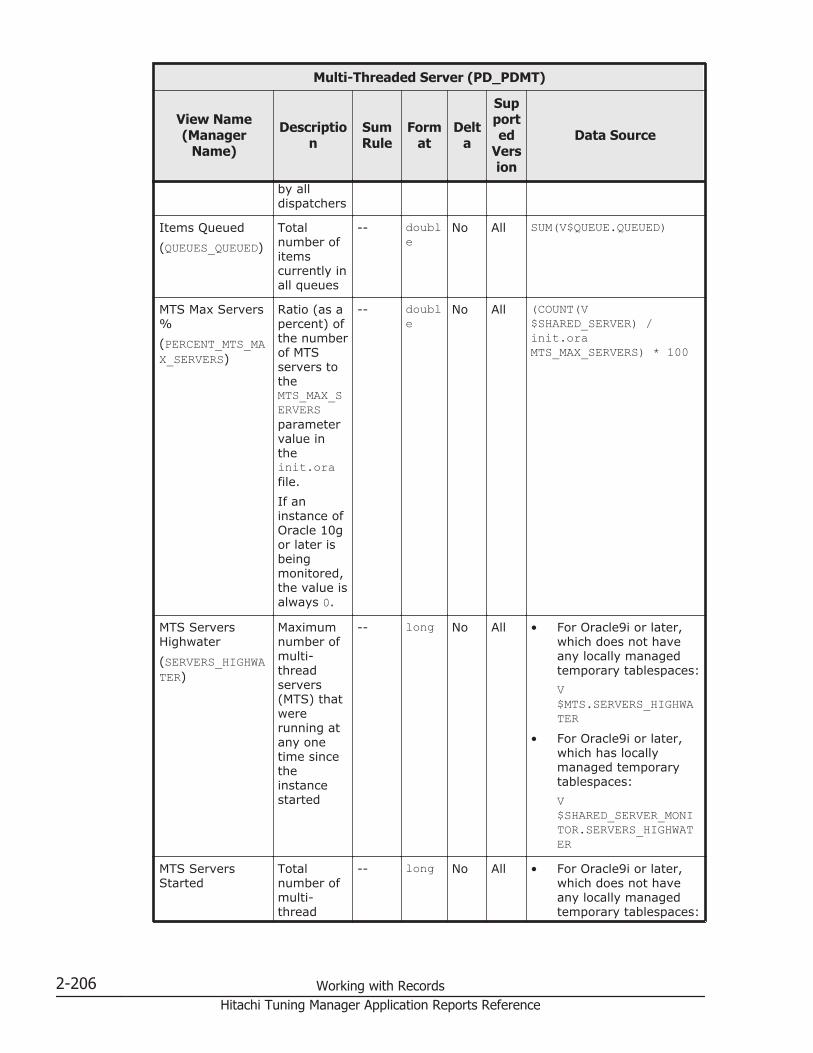
Multi-Threaded Server (PD_PDMT)
View Name(Manager
Name)
Description
SumRule
Format
Delta
Supported
Version
Data Source
by alldispatchers
Items Queued(QUEUES_QUEUED)
Totalnumber ofitemscurrently inall queues
-- double
No All SUM(V$QUEUE.QUEUED)
MTS Max Servers%(PERCENT_MTS_MAX_SERVERS)
Ratio (as apercent) ofthe numberof MTSservers totheMTS_MAX_SERVERSparametervalue intheinit.orafile.If aninstance ofOracle 10gor later isbeingmonitored,the value isalways 0.
-- double
No All (COUNT(V$SHARED_SERVER) /init.oraMTS_MAX_SERVERS) * 100
MTS ServersHighwater(SERVERS_HIGHWATER)
Maximumnumber ofmulti-threadservers(MTS) thatwererunning atany onetime sincetheinstancestarted
-- long No All • For Oracle9i or later,which does not haveany locally managedtemporary tablespaces:V$MTS.SERVERS_HIGHWATER
• For Oracle9i or later,which has locallymanaged temporarytablespaces:V$SHARED_SERVER_MONITOR.SERVERS_HIGHWATER
MTS ServersStarted
Totalnumber ofmulti-thread
-- long No All • For Oracle9i or later,which does not haveany locally managedtemporary tablespaces:
2-206 Working with RecordsHitachi Tuning Manager Application Reports Reference
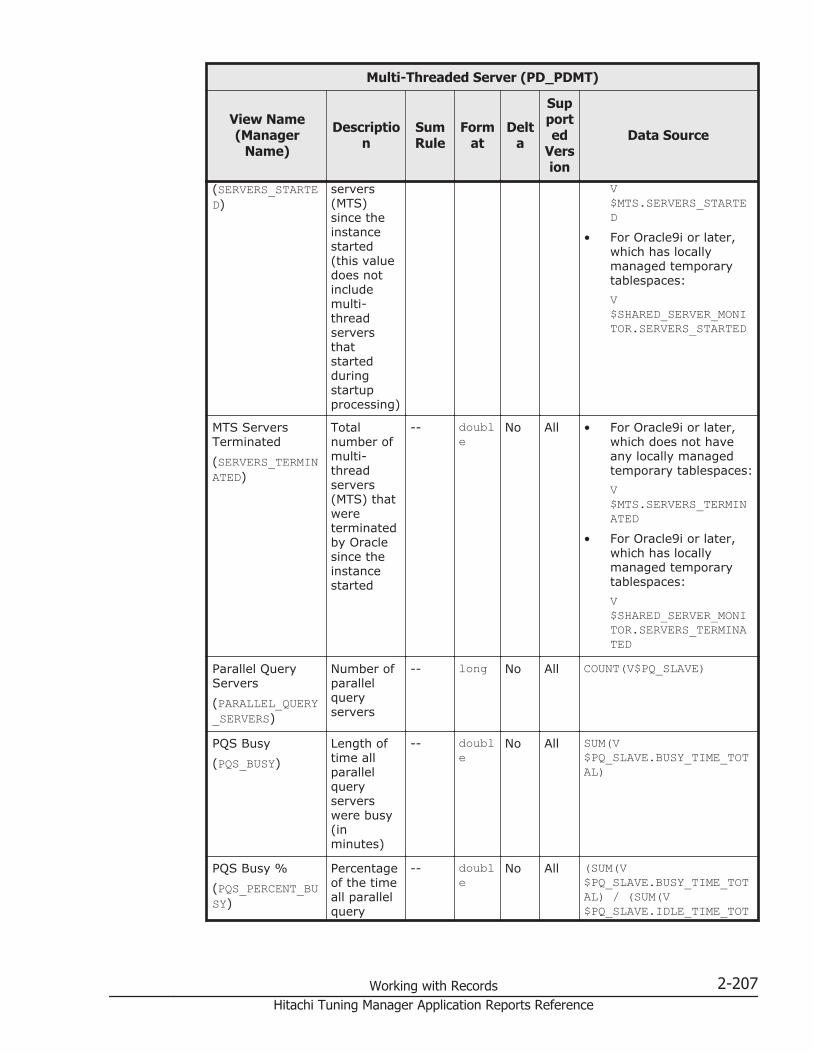
Multi-Threaded Server (PD_PDMT)
View Name(Manager
Name)
Description
SumRule
Format
Delta
Supported
Version
Data Source
(SERVERS_STARTED)
servers(MTS)since theinstancestarted(this valuedoes notincludemulti-threadserversthatstartedduringstartupprocessing)
V$MTS.SERVERS_STARTED
• For Oracle9i or later,which has locallymanaged temporarytablespaces:V$SHARED_SERVER_MONITOR.SERVERS_STARTED
MTS ServersTerminated(SERVERS_TERMINATED)
Totalnumber ofmulti-threadservers(MTS) thatwereterminatedby Oraclesince theinstancestarted
-- double
No All • For Oracle9i or later,which does not haveany locally managedtemporary tablespaces:V$MTS.SERVERS_TERMINATED
• For Oracle9i or later,which has locallymanaged temporarytablespaces:V$SHARED_SERVER_MONITOR.SERVERS_TERMINATED
Parallel QueryServers(PARALLEL_QUERY_SERVERS)
Number ofparallelqueryservers
-- long No All COUNT(V$PQ_SLAVE)
PQS Busy(PQS_BUSY)
Length oftime allparallelqueryserverswere busy(inminutes)
-- double
No All SUM(V$PQ_SLAVE.BUSY_TIME_TOTAL)
PQS Busy %(PQS_PERCENT_BUSY)
Percentageof the timeall parallelquery
-- double
No All (SUM(V$PQ_SLAVE.BUSY_TIME_TOTAL) / (SUM(V$PQ_SLAVE.IDLE_TIME_TOT
Working with Records 2-207Hitachi Tuning Manager Application Reports Reference

Multi-Threaded Server (PD_PDMT)
View Name(Manager
Name)
Description
SumRule
Format
Delta
Supported
Version
Data Source
serverswere busy
AL) + SUM(V$PQ_SLAVE.BUSY_TIME_TOTAL))) * 100
PQS CPU(PQS_CPU)
CPU timeused by allparallelqueryservers toprocessSQLstatements
-- double
No All SUM(V$PQ_SLAVE.CPU_SECS_TOTAL)
PQS Idle(PQS_IDLE)
Length oftime allparallelqueryserverswere idle(inminutes)
-- double
No All SUM(V$PQ_SLAVE.IDLE_TIME_TOTAL)
PQS Idle %(PQS_PERCENT_IDLE)
Percentageof the timeall parallelqueryserverswere idle
-- double
No All (SUM(V$PQ_SLAVE.IDLE_TIME_TOTAL) / (SUM(V$PQ_SLAVE.IDLE_TIME_TOTAL) + SUM(V$PQ_SLAVE.BUSY_TIME_TOTAL))) * 100
PQS Msgs Rcvd(PQS_MSGS_RCVD)
Totalnumber ofmessagesreceived byall parallelqueryservers
-- double
No All SUM(V$PQ_SLAVE.MSGS_RCVD_TOTAL)
PQS Msgs Sent(PQS_MSGS_SENT)
Totalnumber ofmessagessent by allparallelqueryservers
-- double
No All SUM(V$PQ_SLAVE.MSGS_SENT_TOTAL)
PQS Sessions(PQS_SESSIONS)
Number ofsessionsbeing usedby parallelqueryservers
-- ulong No All SUM(V$PQ_SLAVE.SESSIONS)
2-208 Working with RecordsHitachi Tuning Manager Application Reports Reference
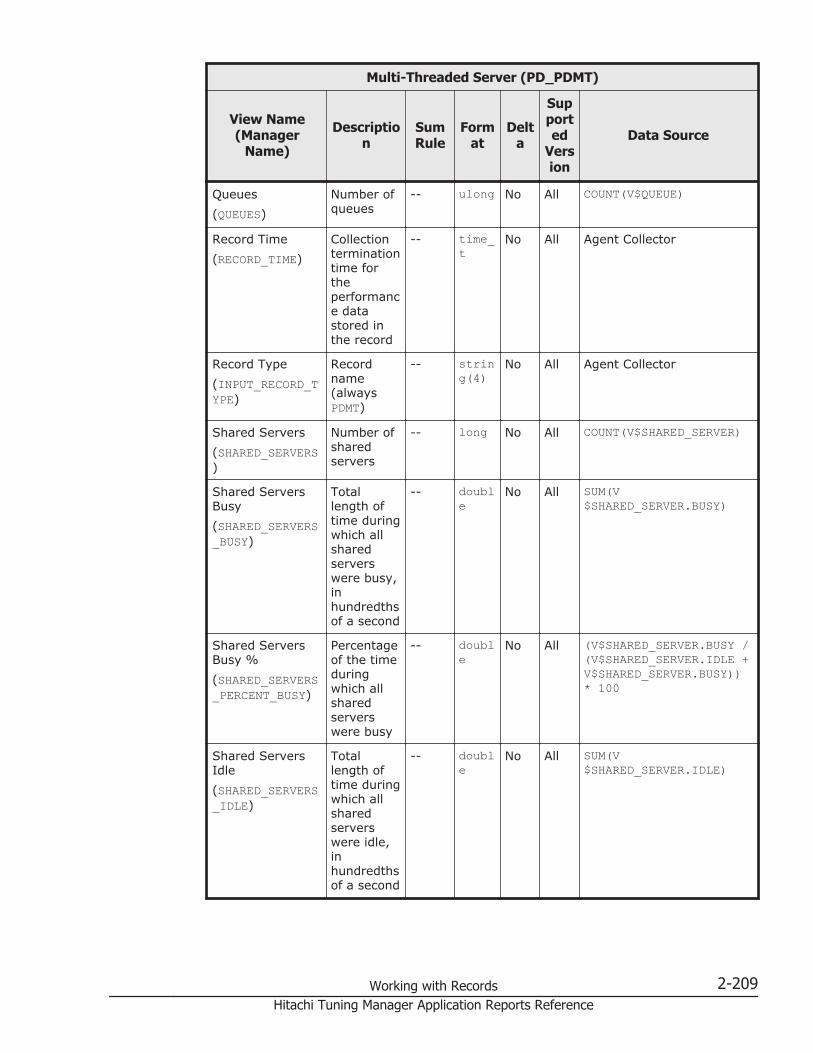
Multi-Threaded Server (PD_PDMT)
View Name(Manager
Name)
Description
SumRule
Format
Delta
Supported
Version
Data Source
Queues(QUEUES)
Number ofqueues
-- ulong No All COUNT(V$QUEUE)
Record Time(RECORD_TIME)
Collectionterminationtime fortheperformance datastored inthe record
-- time_t
No All Agent Collector
Record Type(INPUT_RECORD_TYPE)
Recordname(alwaysPDMT)
-- string(4)
No All Agent Collector
Shared Servers(SHARED_SERVERS)
Number ofsharedservers
-- long No All COUNT(V$SHARED_SERVER)
Shared ServersBusy(SHARED_SERVERS_BUSY)
Totallength oftime duringwhich allsharedserverswere busy,inhundredthsof a second
-- double
No All SUM(V$SHARED_SERVER.BUSY)
Shared ServersBusy %(SHARED_SERVERS_PERCENT_BUSY)
Percentageof the timeduringwhich allsharedserverswere busy
-- double
No All (V$SHARED_SERVER.BUSY /(V$SHARED_SERVER.IDLE +V$SHARED_SERVER.BUSY))* 100
Shared ServersIdle(SHARED_SERVERS_IDLE)
Totallength oftime duringwhich allsharedserverswere idle,inhundredthsof a second
-- double
No All SUM(V$SHARED_SERVER.IDLE)
Working with Records 2-209Hitachi Tuning Manager Application Reports Reference
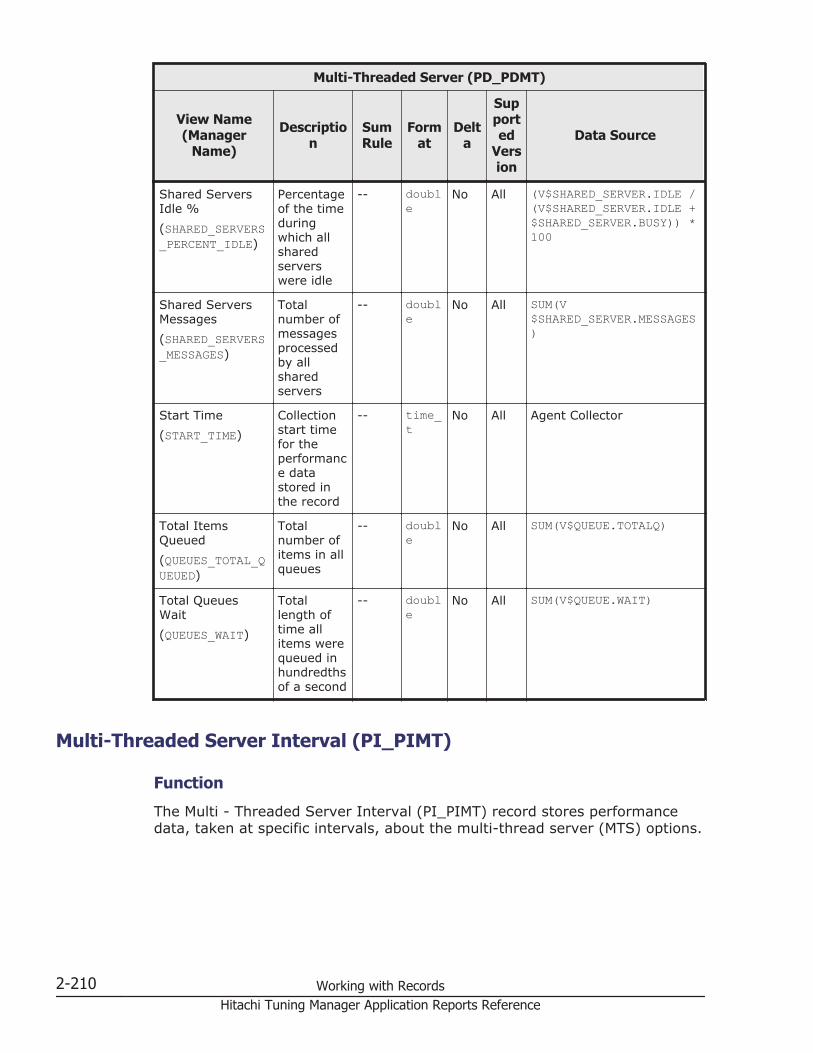
Multi-Threaded Server (PD_PDMT)
View Name(Manager
Name)
Description
SumRule
Format
Delta
Supported
Version
Data Source
Shared ServersIdle %(SHARED_SERVERS_PERCENT_IDLE)
Percentageof the timeduringwhich allsharedserverswere idle
-- double
No All (V$SHARED_SERVER.IDLE /(V$SHARED_SERVER.IDLE +$SHARED_SERVER.BUSY)) *100
Shared ServersMessages(SHARED_SERVERS_MESSAGES)
Totalnumber ofmessagesprocessedby allsharedservers
-- double
No All SUM(V$SHARED_SERVER.MESSAGES)
Start Time(START_TIME)
Collectionstart timefor theperformance datastored inthe record
-- time_t
No All Agent Collector
Total ItemsQueued(QUEUES_TOTAL_QUEUED)
Totalnumber ofitems in allqueues
-- double
No All SUM(V$QUEUE.TOTALQ)
Total QueuesWait(QUEUES_WAIT)
Totallength oftime allitems werequeued inhundredthsof a second
-- double
No All SUM(V$QUEUE.WAIT)
Multi-Threaded Server Interval (PI_PIMT)
Function
The Multi - Threaded Server Interval (PI_PIMT) record stores performancedata, taken at specific intervals, about the multi-thread server (MTS) options.
2-210 Working with RecordsHitachi Tuning Manager Application Reports Reference

Table 2-102 Multi-Threaded Server Interval (PI_PIMT) Default andChangeable Values
Item Default value Changeable?
Collection Interval 300 Yes
Collection Offset 30
Log No
LOGIF (Blank)
Key Fields
None
Lifetime
From the creation to the deletion of an Oracle instance in an MTSenvironment
Record Size
• Fixed part: 1,274 bytes• Variable part: 0 bytes
Table 2-103 Multi-Threaded Server Interval (PI_PIMT) Fields
Multi-Threaded Server Interval (PI_PIMT)
View Name(Manager Name) Description Sum
RuleForma
t Delta
Supporte
dVersi
on
Data Source
Avg Queue Wait(QUEUES_AVERAGE_WAIT)
Average waittime per iteminhundredthsof a second
AVG double No All V$QUEUE.WAIT / V$QUEUE.TOTALQ
Circuits(CIRCUITS)
Number ofcircuits
AVG ulong No All COUNT(V$CIRCUIT)
Dispatchers(DISPATCHERS)
Number ofdispatchers
AVG ulong No All COUNT(V$DISPATCHER)
Dispatchers Busy(DISPATCHERS_BUSY)
Total busytime of alldispatchersinhundredthsof a second
AVG double Yes All SUM(V$DISPATCHER.BUSY)
Working with Records 2-211Hitachi Tuning Manager Application Reports Reference
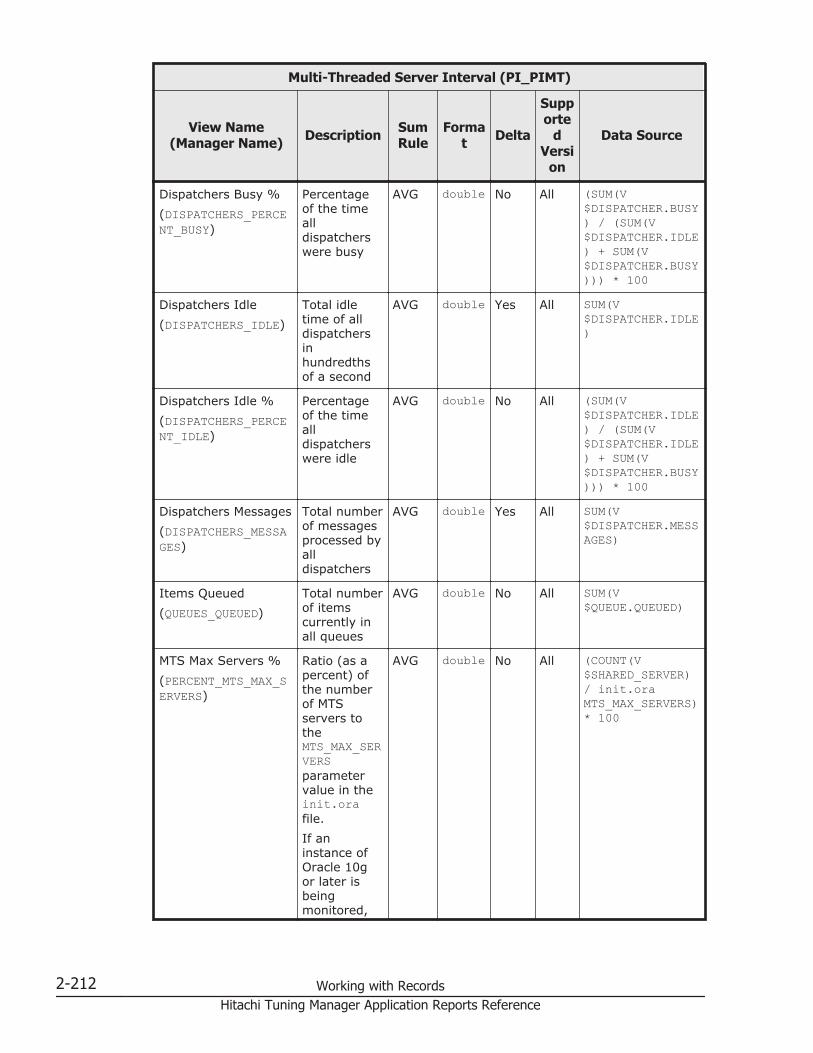
Multi-Threaded Server Interval (PI_PIMT)
View Name(Manager Name) Description Sum
RuleForma
t Delta
Supporte
dVersi
on
Data Source
Dispatchers Busy %(DISPATCHERS_PERCENT_BUSY)
Percentageof the timealldispatcherswere busy
AVG double No All (SUM(V$DISPATCHER.BUSY) / (SUM(V$DISPATCHER.IDLE) + SUM(V$DISPATCHER.BUSY))) * 100
Dispatchers Idle(DISPATCHERS_IDLE)
Total idletime of alldispatchersinhundredthsof a second
AVG double Yes All SUM(V$DISPATCHER.IDLE)
Dispatchers Idle %(DISPATCHERS_PERCENT_IDLE)
Percentageof the timealldispatcherswere idle
AVG double No All (SUM(V$DISPATCHER.IDLE) / (SUM(V$DISPATCHER.IDLE) + SUM(V$DISPATCHER.BUSY))) * 100
Dispatchers Messages(DISPATCHERS_MESSAGES)
Total numberof messagesprocessed byalldispatchers
AVG double Yes All SUM(V$DISPATCHER.MESSAGES)
Items Queued(QUEUES_QUEUED)
Total numberof itemscurrently inall queues
AVG double No All SUM(V$QUEUE.QUEUED)
MTS Max Servers %(PERCENT_MTS_MAX_SERVERS)
Ratio (as apercent) ofthe numberof MTSservers totheMTS_MAX_SERVERSparametervalue in theinit.orafile.If aninstance ofOracle 10gor later isbeingmonitored,
AVG double No All (COUNT(V$SHARED_SERVER)/ init.oraMTS_MAX_SERVERS)* 100
2-212 Working with RecordsHitachi Tuning Manager Application Reports Reference
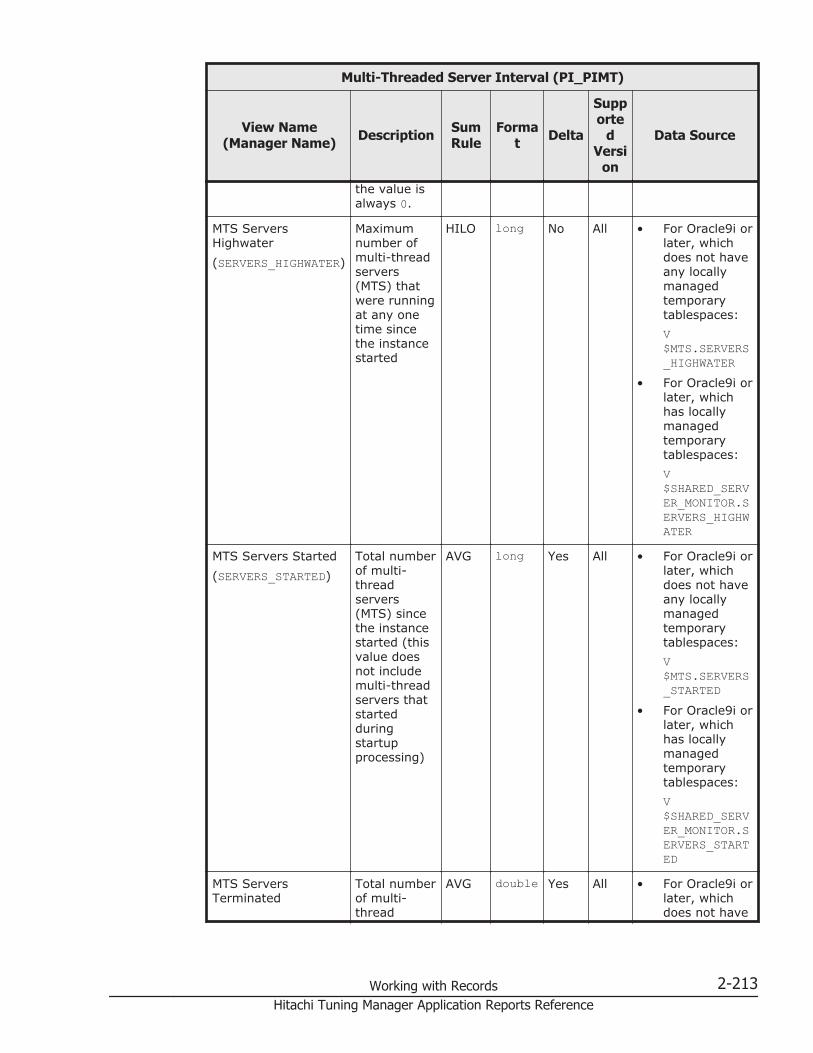
Multi-Threaded Server Interval (PI_PIMT)
View Name(Manager Name) Description Sum
RuleForma
t Delta
Supporte
dVersi
on
Data Source
the value isalways 0.
MTS ServersHighwater(SERVERS_HIGHWATER)
Maximumnumber ofmulti-threadservers(MTS) thatwere runningat any onetime sincethe instancestarted
HILO long No All • For Oracle9i orlater, whichdoes not haveany locallymanagedtemporarytablespaces:V$MTS.SERVERS_HIGHWATER
• For Oracle9i orlater, whichhas locallymanagedtemporarytablespaces:V$SHARED_SERVER_MONITOR.SERVERS_HIGHWATER
MTS Servers Started(SERVERS_STARTED)
Total numberof multi-threadservers(MTS) sincethe instancestarted (thisvalue doesnot includemulti-threadservers thatstartedduringstartupprocessing)
AVG long Yes All • For Oracle9i orlater, whichdoes not haveany locallymanagedtemporarytablespaces:V$MTS.SERVERS_STARTED
• For Oracle9i orlater, whichhas locallymanagedtemporarytablespaces:V$SHARED_SERVER_MONITOR.SERVERS_STARTED
MTS ServersTerminated
Total numberof multi-thread
AVG double Yes All • For Oracle9i orlater, whichdoes not have
Working with Records 2-213Hitachi Tuning Manager Application Reports Reference

Multi-Threaded Server Interval (PI_PIMT)
View Name(Manager Name) Description Sum
RuleForma
t Delta
Supporte
dVersi
on
Data Source
(SERVERS_TERMINATED)
servers(MTS) thatwereterminatedby Oraclesince theinstancestarted
any locallymanagedtemporarytablespaces:V$MTS.SERVERS_TERMINATED
• For Oracle9i orlater, whichhas locallymanagedtemporarytablespaces:V$SHARED_SERVER_MONITOR.SERVERS_TERMINATED
Parallel QueryServers(PARALLEL_QUERY_SERVERS)
Number ofparallelqueryservers
AVG long No All COUNT(V$PQ_SLAVE)
PQS Busy(PQS_BUSY)
Length oftime allparallelqueryservers werebusy (inminutes)
AVG double Yes All SUM(V$PQ_SLAVE.BUSY_TIME_TOTAL)
PQS Busy %(PQS_PERCENT_BUSY)
Percentageof the timeall parallelqueryservers werebusy
AVG double No All (SUM(V$PQ_SLAVE.BUSY_TIME_TOTAL) /(SUM(V$PQ_SLAVE.IDLE_TIME_TOTAL) +SUM(V$PQ_SLAVE.BUSY_TIME_TOTAL))) *100
PQS CPU(PQS_CPU)
CPU timeused by allparallelqueryservers toprocess SQLstatements
AVG double Yes All SUM(V$PQ_SLAVE.CPU_SECS_TOTAL)
2-214 Working with RecordsHitachi Tuning Manager Application Reports Reference
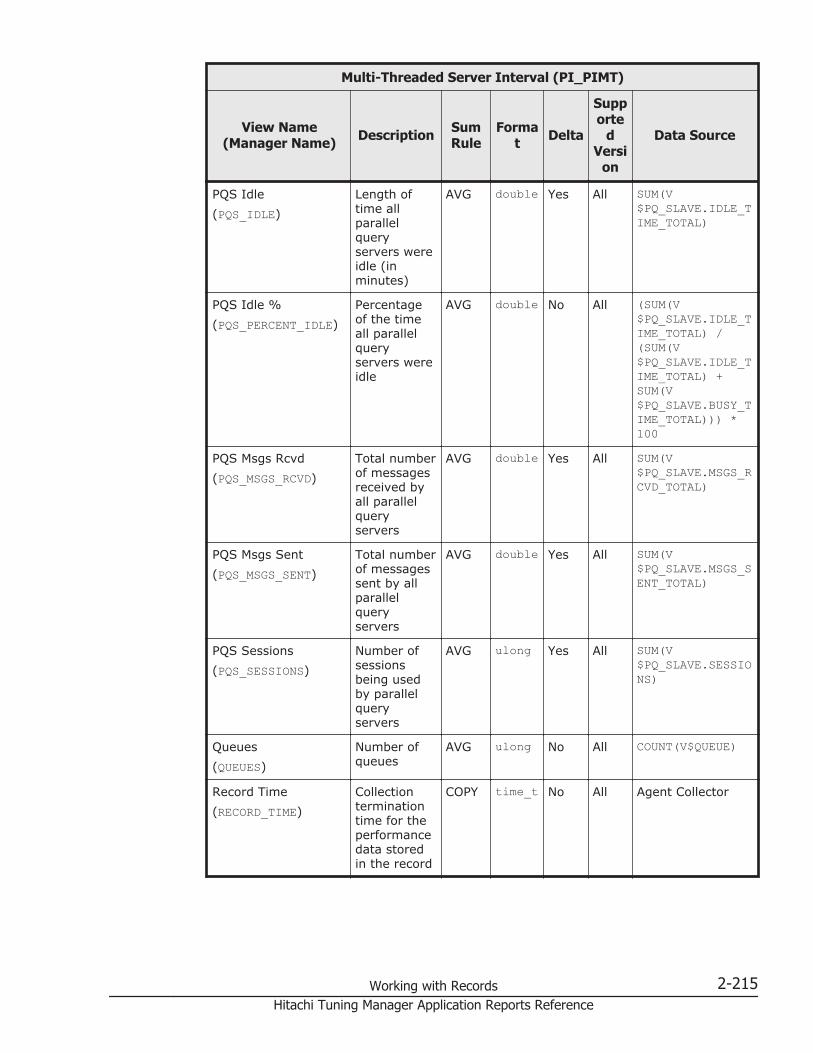
Multi-Threaded Server Interval (PI_PIMT)
View Name(Manager Name) Description Sum
RuleForma
t Delta
Supporte
dVersi
on
Data Source
PQS Idle(PQS_IDLE)
Length oftime allparallelqueryservers wereidle (inminutes)
AVG double Yes All SUM(V$PQ_SLAVE.IDLE_TIME_TOTAL)
PQS Idle %(PQS_PERCENT_IDLE)
Percentageof the timeall parallelqueryservers wereidle
AVG double No All (SUM(V$PQ_SLAVE.IDLE_TIME_TOTAL) /(SUM(V$PQ_SLAVE.IDLE_TIME_TOTAL) +SUM(V$PQ_SLAVE.BUSY_TIME_TOTAL))) *100
PQS Msgs Rcvd(PQS_MSGS_RCVD)
Total numberof messagesreceived byall parallelqueryservers
AVG double Yes All SUM(V$PQ_SLAVE.MSGS_RCVD_TOTAL)
PQS Msgs Sent(PQS_MSGS_SENT)
Total numberof messagessent by allparallelqueryservers
AVG double Yes All SUM(V$PQ_SLAVE.MSGS_SENT_TOTAL)
PQS Sessions(PQS_SESSIONS)
Number ofsessionsbeing usedby parallelqueryservers
AVG ulong Yes All SUM(V$PQ_SLAVE.SESSIONS)
Queues(QUEUES)
Number ofqueues
AVG ulong No All COUNT(V$QUEUE)
Record Time(RECORD_TIME)
Collectionterminationtime for theperformancedata storedin the record
COPY time_t No All Agent Collector
Working with Records 2-215Hitachi Tuning Manager Application Reports Reference
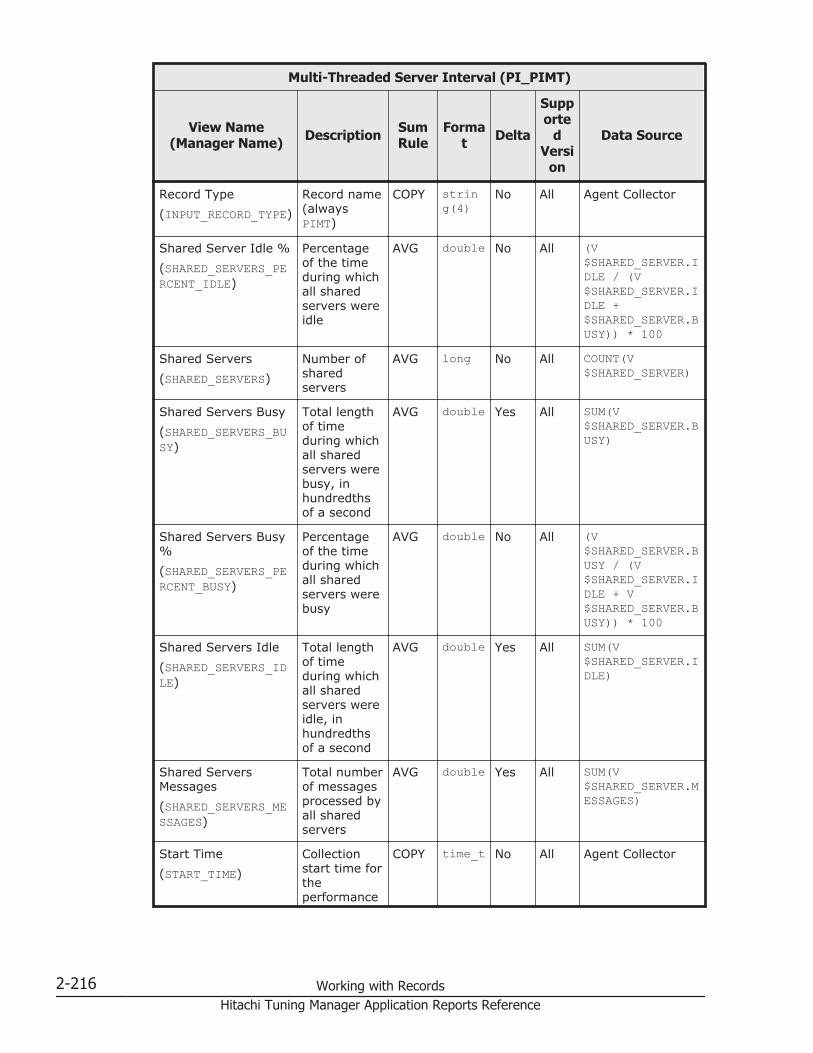
Multi-Threaded Server Interval (PI_PIMT)
View Name(Manager Name) Description Sum
RuleForma
t Delta
Supporte
dVersi
on
Data Source
Record Type(INPUT_RECORD_TYPE)
Record name(alwaysPIMT)
COPY string(4)
No All Agent Collector
Shared Server Idle %(SHARED_SERVERS_PERCENT_IDLE)
Percentageof the timeduring whichall sharedservers wereidle
AVG double No All (V$SHARED_SERVER.IDLE / (V$SHARED_SERVER.IDLE +$SHARED_SERVER.BUSY)) * 100
Shared Servers(SHARED_SERVERS)
Number ofsharedservers
AVG long No All COUNT(V$SHARED_SERVER)
Shared Servers Busy(SHARED_SERVERS_BUSY)
Total lengthof timeduring whichall sharedservers werebusy, inhundredthsof a second
AVG double Yes All SUM(V$SHARED_SERVER.BUSY)
Shared Servers Busy%(SHARED_SERVERS_PERCENT_BUSY)
Percentageof the timeduring whichall sharedservers werebusy
AVG double No All (V$SHARED_SERVER.BUSY / (V$SHARED_SERVER.IDLE + V$SHARED_SERVER.BUSY)) * 100
Shared Servers Idle(SHARED_SERVERS_IDLE)
Total lengthof timeduring whichall sharedservers wereidle, inhundredthsof a second
AVG double Yes All SUM(V$SHARED_SERVER.IDLE)
Shared ServersMessages(SHARED_SERVERS_MESSAGES)
Total numberof messagesprocessed byall sharedservers
AVG double Yes All SUM(V$SHARED_SERVER.MESSAGES)
Start Time(START_TIME)
Collectionstart time fortheperformance
COPY time_t No All Agent Collector
2-216 Working with RecordsHitachi Tuning Manager Application Reports Reference
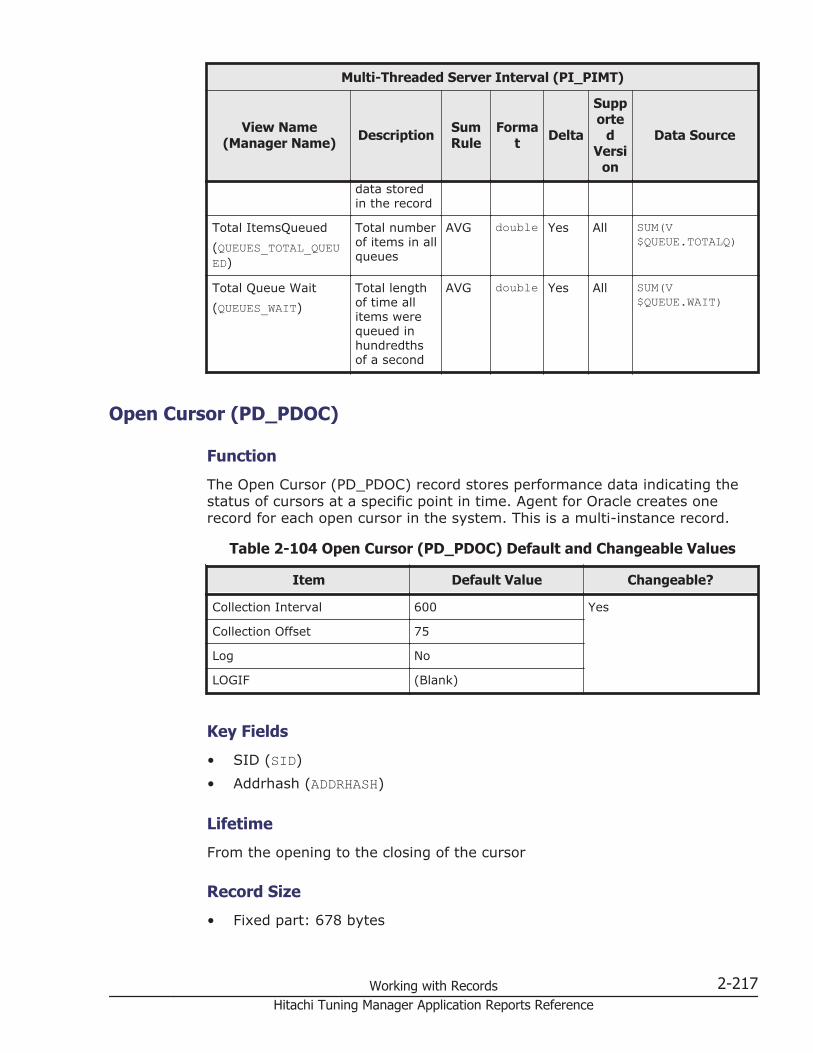
Multi-Threaded Server Interval (PI_PIMT)
View Name(Manager Name) Description Sum
RuleForma
t Delta
Supporte
dVersi
on
Data Source
data storedin the record
Total ItemsQueued(QUEUES_TOTAL_QUEUED)
Total numberof items in allqueues
AVG double Yes All SUM(V$QUEUE.TOTALQ)
Total Queue Wait(QUEUES_WAIT)
Total lengthof time allitems werequeued inhundredthsof a second
AVG double Yes All SUM(V$QUEUE.WAIT)
Open Cursor (PD_PDOC)
Function
The Open Cursor (PD_PDOC) record stores performance data indicating thestatus of cursors at a specific point in time. Agent for Oracle creates onerecord for each open cursor in the system. This is a multi-instance record.
Table 2-104 Open Cursor (PD_PDOC) Default and Changeable Values
Item Default Value Changeable?
Collection Interval 600 Yes
Collection Offset 75
Log No
LOGIF (Blank)
Key Fields
• SID (SID)• Addrhash (ADDRHASH)
Lifetime
From the opening to the closing of the cursor
Record Size
• Fixed part: 678 bytes
Working with Records 2-217Hitachi Tuning Manager Application Reports Reference

• Variable part: 184 bytes
Table 2-105 Open Cursor (PD_PDOC) Fields
Open Cursor (PD_PDOC)
View Name(Manager Name) Description Sum
Rule Format DeltaSupport
edVersion
DataSource
Addrhash(ADDRHASH)
Characterstring thatidentifies theSQLstatementbeingexecuted
-- string(38)
No All V$OPEN_CURSOR.ADDRESS +V$OPEN_CURSOR.HASH_VALUE
Program(PROGRAM)
Name of theprogrambeingexecuted
-- string(48)
No All V$SESSION.PROGRAM whereV$OPEN_CURSOR.SID = V$SESSION.SID
Record Time(RECORD_TIME)
Collectionterminationtime for theperformancedata storedin the record
-- time_t No All AgentCollector
Record Type(INPUT_RECORD_TYPE)
Record name(alwaysPDOC)
-- string(4)
No All AgentCollector
SID(SID)
Session ID -- ulong No All V$SESSION.SID where V$OPEN_CURSOR.SID = V$SESSION.SID
SQL Text(SQL_TEXT)
First 60characters ofthe SQLstatementthat isanalyzed bythe opencursor
-- string(60)
No All V$OPEN_CURSOR.SQL_TEXT
Start Time(START_TIME)
Collectionstart time fortheperformancedata storedin the record
-- time_t No All AgentCollector
2-218 Working with RecordsHitachi Tuning Manager Application Reports Reference

Open Cursor (PD_PDOC)
View Name(Manager Name) Description Sum
Rule Format DeltaSupport
edVersion
DataSource
User(USERNAME)
Oracle username
-- string(30)
No All V$SESSION.USERNAMEwhere V$OPEN_CURSOR.SID = V$SESSION.SID
Options Installed (PD_PDO)
Function
The Options Installed (PD_PDO) record stores performance data indicatingthe status of the software options installed on the Oracle Server at a specificpoint in time. Agent for Oracle creates one record for each installation option.This is a multi-instance record.
Table 2-106 Options Installed (PD_PDO) Default and Changeable Values
Item Default Value Changeable?
Collection Interval 600 Yes
Collection Offset 70
Log No
LOGIF (Blank)
Key Fields
Parameter (PARAMETER)
Lifetime
From the creation to the deletion of an Oracle instance
Record Size
• Fixed part: 678 bytes• Variable part: 130 bytes
Working with Records 2-219Hitachi Tuning Manager Application Reports Reference
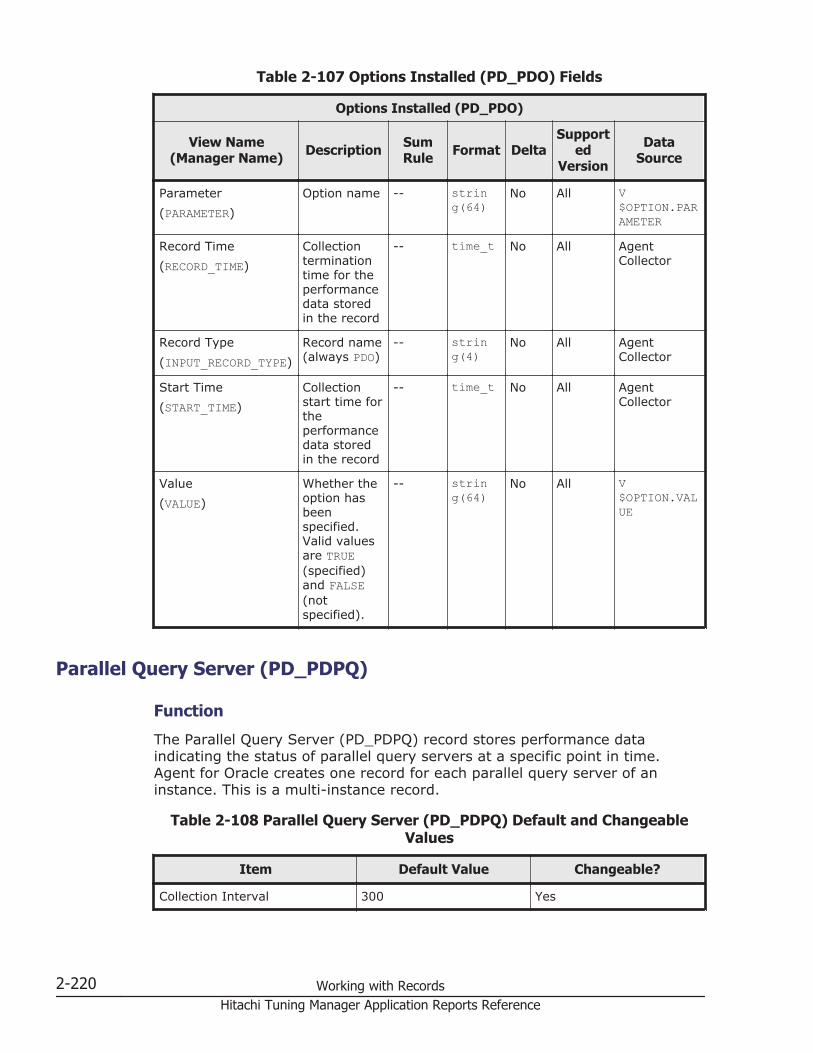
Table 2-107 Options Installed (PD_PDO) Fields
Options Installed (PD_PDO)
View Name(Manager Name) Description Sum
Rule Format DeltaSupport
edVersion
DataSource
Parameter(PARAMETER)
Option name -- string(64)
No All V$OPTION.PARAMETER
Record Time(RECORD_TIME)
Collectionterminationtime for theperformancedata storedin the record
-- time_t No All AgentCollector
Record Type(INPUT_RECORD_TYPE)
Record name(always PDO)
-- string(4)
No All AgentCollector
Start Time(START_TIME)
Collectionstart time fortheperformancedata storedin the record
-- time_t No All AgentCollector
Value(VALUE)
Whether theoption hasbeenspecified.Valid valuesare TRUE(specified)and FALSE(notspecified).
-- string(64)
No All V$OPTION.VALUE
Parallel Query Server (PD_PDPQ)
Function
The Parallel Query Server (PD_PDPQ) record stores performance dataindicating the status of parallel query servers at a specific point in time.Agent for Oracle creates one record for each parallel query server of aninstance. This is a multi-instance record.
Table 2-108 Parallel Query Server (PD_PDPQ) Default and ChangeableValues
Item Default Value Changeable?
Collection Interval 300 Yes
2-220 Working with RecordsHitachi Tuning Manager Application Reports Reference
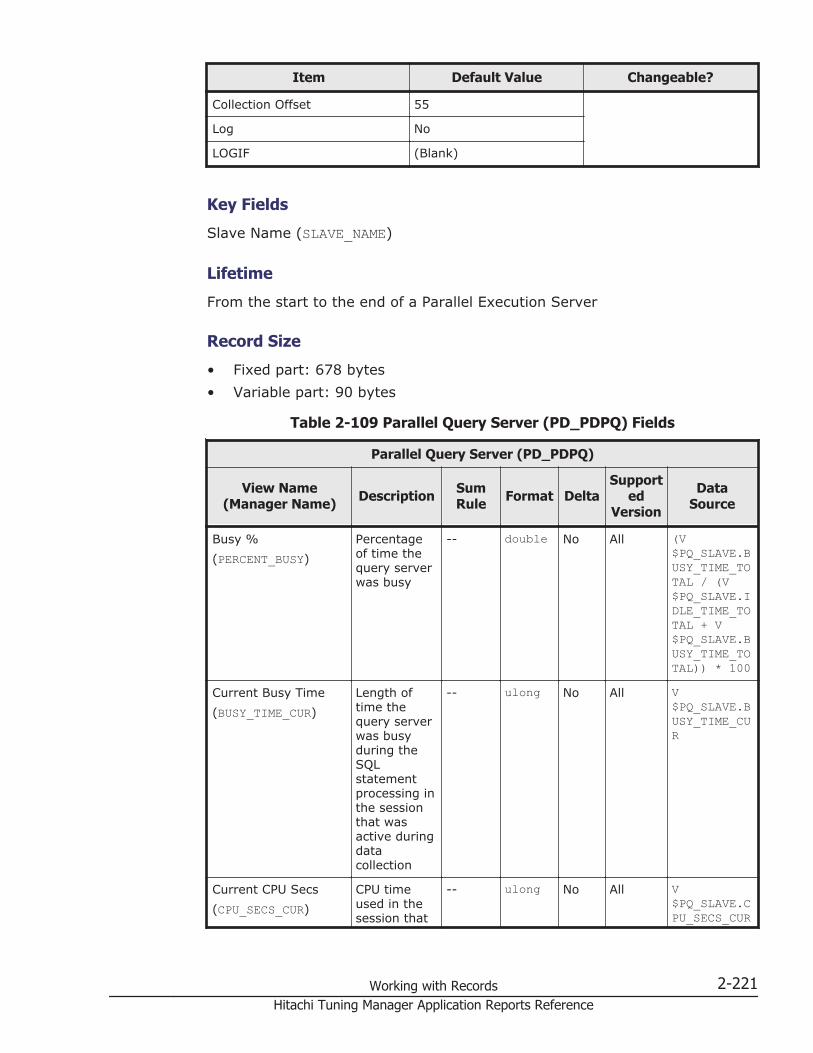
Item Default Value Changeable?
Collection Offset 55
Log No
LOGIF (Blank)
Key Fields
Slave Name (SLAVE_NAME)
Lifetime
From the start to the end of a Parallel Execution Server
Record Size
• Fixed part: 678 bytes• Variable part: 90 bytes
Table 2-109 Parallel Query Server (PD_PDPQ) Fields
Parallel Query Server (PD_PDPQ)
View Name(Manager Name) Description Sum
Rule Format DeltaSupport
edVersion
DataSource
Busy %(PERCENT_BUSY)
Percentageof time thequery serverwas busy
-- double No All (V$PQ_SLAVE.BUSY_TIME_TOTAL / (V$PQ_SLAVE.IDLE_TIME_TOTAL + V$PQ_SLAVE.BUSY_TIME_TOTAL)) * 100
Current Busy Time(BUSY_TIME_CUR)
Length oftime thequery serverwas busyduring theSQLstatementprocessing inthe sessionthat wasactive duringdatacollection
-- ulong No All V$PQ_SLAVE.BUSY_TIME_CUR
Current CPU Secs(CPU_SECS_CUR)
CPU timeused in thesession that
-- ulong No All V$PQ_SLAVE.CPU_SECS_CUR
Working with Records 2-221Hitachi Tuning Manager Application Reports Reference
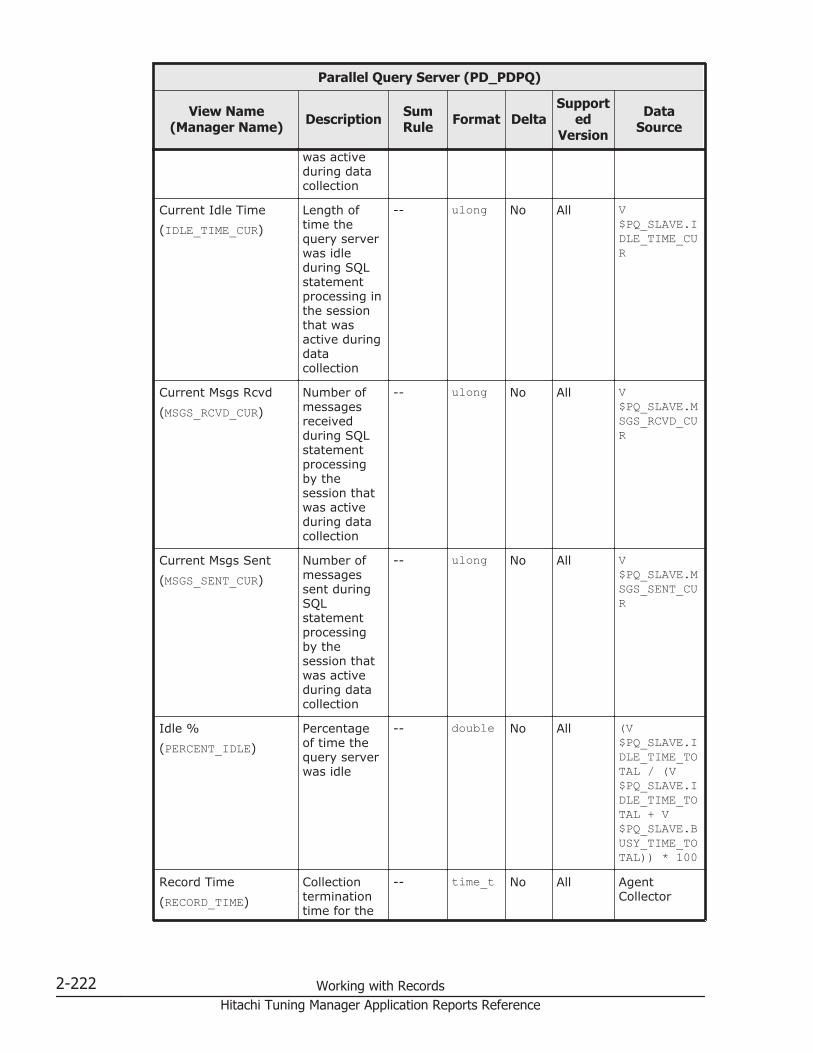
Parallel Query Server (PD_PDPQ)
View Name(Manager Name) Description Sum
Rule Format DeltaSupport
edVersion
DataSource
was activeduring datacollection
Current Idle Time(IDLE_TIME_CUR)
Length oftime thequery serverwas idleduring SQLstatementprocessing inthe sessionthat wasactive duringdatacollection
-- ulong No All V$PQ_SLAVE.IDLE_TIME_CUR
Current Msgs Rcvd(MSGS_RCVD_CUR)
Number ofmessagesreceivedduring SQLstatementprocessingby thesession thatwas activeduring datacollection
-- ulong No All V$PQ_SLAVE.MSGS_RCVD_CUR
Current Msgs Sent(MSGS_SENT_CUR)
Number ofmessagessent duringSQLstatementprocessingby thesession thatwas activeduring datacollection
-- ulong No All V$PQ_SLAVE.MSGS_SENT_CUR
Idle %(PERCENT_IDLE)
Percentageof time thequery serverwas idle
-- double No All (V$PQ_SLAVE.IDLE_TIME_TOTAL / (V$PQ_SLAVE.IDLE_TIME_TOTAL + V$PQ_SLAVE.BUSY_TIME_TOTAL)) * 100
Record Time(RECORD_TIME)
Collectionterminationtime for the
-- time_t No All AgentCollector
2-222 Working with RecordsHitachi Tuning Manager Application Reports Reference

Parallel Query Server (PD_PDPQ)
View Name(Manager Name) Description Sum
Rule Format DeltaSupport
edVersion
DataSource
performancedata storedin the record
Record Type(INPUT_RECORD_TYPE)
Record name(alwaysPDPQ)
-- string(4)
No All AgentCollector
Sessions(SESSIONS)
Number ofsessions inuse by theparallelquery server
-- ulong No All V$PQ_SLAVE.SESSIONS
Slave Name(SLAVE_NAME)
Name of theparallelquery server
-- string(4)
No All V$PQ_SLAVE.SLAVE_NAME
Start Time(START_TIME)
Collectionstart time fortheperformancedata storedin the record
-- time_t No All AgentCollector
Status(STATUS)
Status of theparallelquery serverduring datacollection.Valid valuesare BUSY andIDLE.
-- string(4)
No All V$PQ_SLAVE.STATUS
Total Busy Time(BUSY_TIME_TOTAL)
Total lengthof time thequery serverwas activeduring theinterval
-- double No All V$PQ_SLAVE.BUSY_TIME_TOTAL
Total CPU Secs(CPU_SECS_TOTAL)
Total CPUtime used bythe queryserver toprocess SQLstatementsduring theinterval
-- double No All V$PQ_SLAVE.CPU_SECS_TOTAL
Total Idle Time(IDLE_TIME_TOTAL)
Total lengthof time thequery serverwas idleduring theinterval
-- double No All V$PQ_SLAVE.DLE_TIME_TOTAL
Working with Records 2-223Hitachi Tuning Manager Application Reports Reference
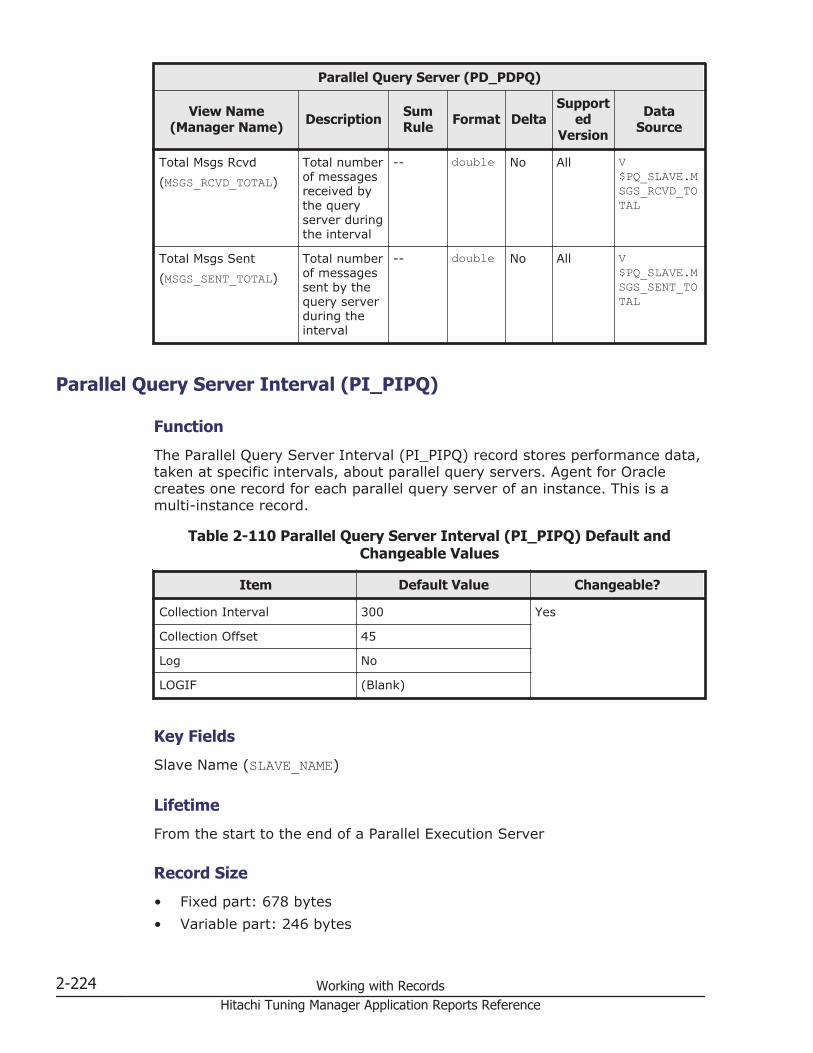
Parallel Query Server (PD_PDPQ)
View Name(Manager Name) Description Sum
Rule Format DeltaSupport
edVersion
DataSource
Total Msgs Rcvd(MSGS_RCVD_TOTAL)
Total numberof messagesreceived bythe queryserver duringthe interval
-- double No All V$PQ_SLAVE.MSGS_RCVD_TOTAL
Total Msgs Sent(MSGS_SENT_TOTAL)
Total numberof messagessent by thequery serverduring theinterval
-- double No All V$PQ_SLAVE.MSGS_SENT_TOTAL
Parallel Query Server Interval (PI_PIPQ)
Function
The Parallel Query Server Interval (PI_PIPQ) record stores performance data,taken at specific intervals, about parallel query servers. Agent for Oraclecreates one record for each parallel query server of an instance. This is amulti-instance record.
Table 2-110 Parallel Query Server Interval (PI_PIPQ) Default andChangeable Values
Item Default Value Changeable?
Collection Interval 300 Yes
Collection Offset 45
Log No
LOGIF (Blank)
Key Fields
Slave Name (SLAVE_NAME)
Lifetime
From the start to the end of a Parallel Execution Server
Record Size
• Fixed part: 678 bytes• Variable part: 246 bytes
2-224 Working with RecordsHitachi Tuning Manager Application Reports Reference
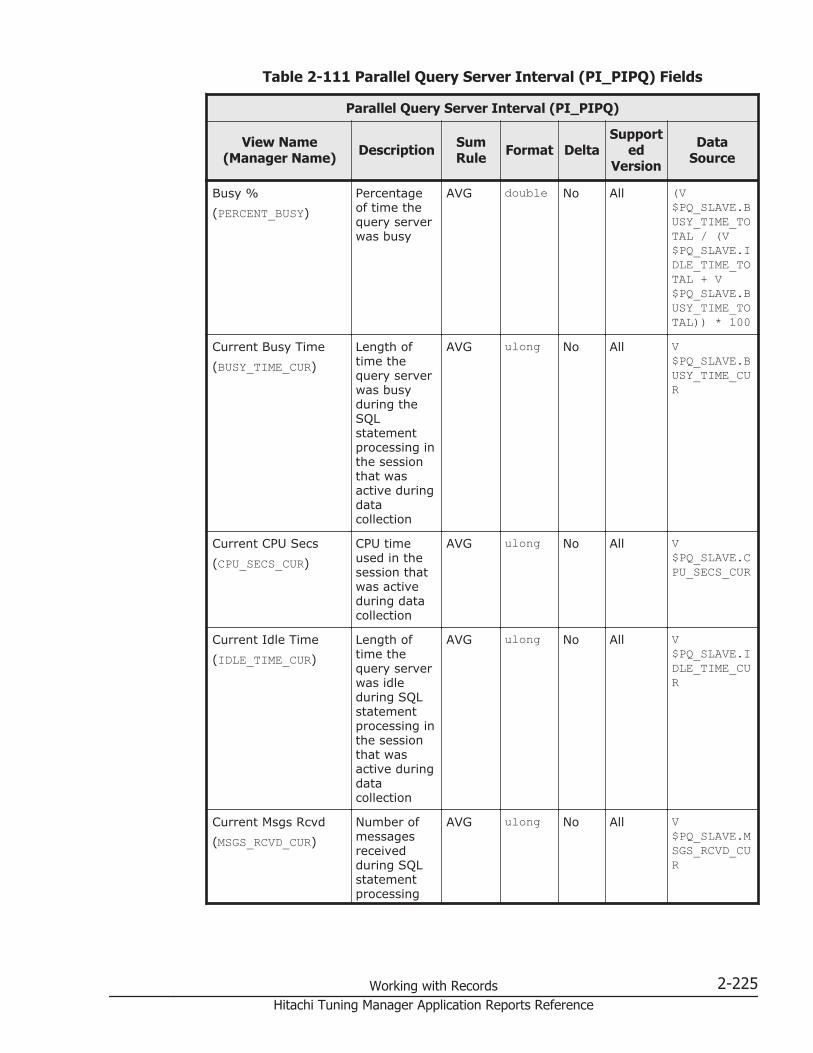
Table 2-111 Parallel Query Server Interval (PI_PIPQ) Fields
Parallel Query Server Interval (PI_PIPQ)
View Name(Manager Name) Description Sum
Rule Format DeltaSupport
edVersion
DataSource
Busy %(PERCENT_BUSY)
Percentageof time thequery serverwas busy
AVG double No All (V$PQ_SLAVE.BUSY_TIME_TOTAL / (V$PQ_SLAVE.IDLE_TIME_TOTAL + V$PQ_SLAVE.BUSY_TIME_TOTAL)) * 100
Current Busy Time(BUSY_TIME_CUR)
Length oftime thequery serverwas busyduring theSQLstatementprocessing inthe sessionthat wasactive duringdatacollection
AVG ulong No All V$PQ_SLAVE.BUSY_TIME_CUR
Current CPU Secs(CPU_SECS_CUR)
CPU timeused in thesession thatwas activeduring datacollection
AVG ulong No All V$PQ_SLAVE.CPU_SECS_CUR
Current Idle Time(IDLE_TIME_CUR)
Length oftime thequery serverwas idleduring SQLstatementprocessing inthe sessionthat wasactive duringdatacollection
AVG ulong No All V$PQ_SLAVE.IDLE_TIME_CUR
Current Msgs Rcvd(MSGS_RCVD_CUR)
Number ofmessagesreceivedduring SQLstatementprocessing
AVG ulong No All V$PQ_SLAVE.MSGS_RCVD_CUR
Working with Records 2-225Hitachi Tuning Manager Application Reports Reference
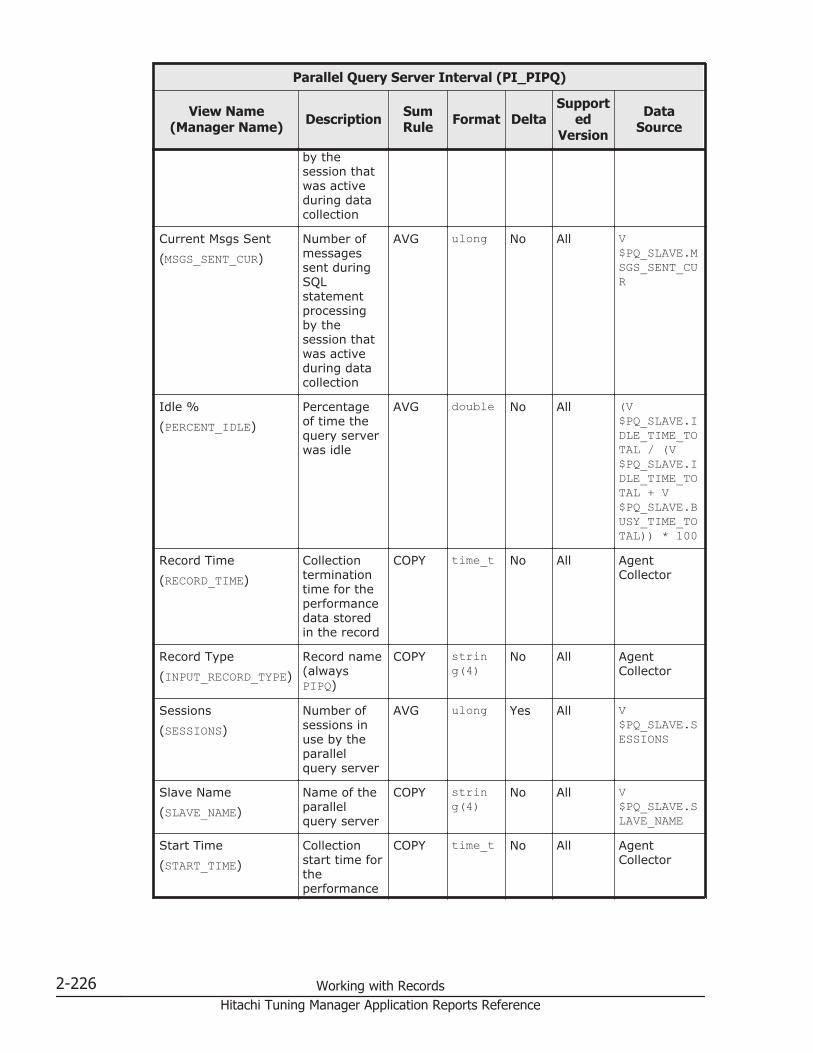
Parallel Query Server Interval (PI_PIPQ)
View Name(Manager Name) Description Sum
Rule Format DeltaSupport
edVersion
DataSource
by thesession thatwas activeduring datacollection
Current Msgs Sent(MSGS_SENT_CUR)
Number ofmessagessent duringSQLstatementprocessingby thesession thatwas activeduring datacollection
AVG ulong No All V$PQ_SLAVE.MSGS_SENT_CUR
Idle %(PERCENT_IDLE)
Percentageof time thequery serverwas idle
AVG double No All (V$PQ_SLAVE.IDLE_TIME_TOTAL / (V$PQ_SLAVE.IDLE_TIME_TOTAL + V$PQ_SLAVE.BUSY_TIME_TOTAL)) * 100
Record Time(RECORD_TIME)
Collectionterminationtime for theperformancedata storedin the record
COPY time_t No All AgentCollector
Record Type(INPUT_RECORD_TYPE)
Record name(alwaysPIPQ)
COPY string(4)
No All AgentCollector
Sessions(SESSIONS)
Number ofsessions inuse by theparallelquery server
AVG ulong Yes All V$PQ_SLAVE.SESSIONS
Slave Name(SLAVE_NAME)
Name of theparallelquery server
COPY string(4)
No All V$PQ_SLAVE.SLAVE_NAME
Start Time(START_TIME)
Collectionstart time fortheperformance
COPY time_t No All AgentCollector
2-226 Working with RecordsHitachi Tuning Manager Application Reports Reference

Parallel Query Server Interval (PI_PIPQ)
View Name(Manager Name) Description Sum
Rule Format DeltaSupport
edVersion
DataSource
data storedin the record
Status(STATUS)
Status of theparallelquery serverduring datacollection.Valid valuesare BUSY andIDLE.
COPY string(4)
No All V$PQ_SLAVE.STATUS
Total Busy Time(BUSY_TIME_TOTAL)
Total lengthof time thequery serverwas activeduring theinterval
AVG double Yes All V$PQ_SLAVE.BUSY_TIME_TOTAL
Total CPU Secs(CPU_SECS_TOTAL)
Total CPUtime used bythe queryserver toprocess SQLstatementsduring theinterval
AVG double Yes All V$PQ_SLAVE.CPU_SECS_TOTAL
Total Idle Time(IDLE_TIME_TOTAL)
Total lengthof time thequery serverwas idleduring theinterval
AVG double Yes All V$PQ_SLAVE.DLE_TIME_TOTAL
Total Msgs Rcvd(MSGS_RCVD_TOTAL)
Total numberof messagesreceived bythe queryserver duringthe interval
AVG double Yes All V$PQ_SLAVE.MSGS_RCVD_TOTAL
Total Msgs Sent(MSGS_SENT_TOTAL)
Total numberof messagessent by thequery serverduring theinterval
AVG double Yes All V$PQ_SLAVE.MSGS_SENT_TOTAL
Working with Records 2-227Hitachi Tuning Manager Application Reports Reference

Parallel Query Statistics (PD_PDPS)
Function
The Parallel Query Statistics (PD_PDPS) record stores performance dataindicating the status of parallel query options at a specific point in time.Agent for Oracle creates one record for each statistical value. To collect thisrecord, parallel query servers must be running.
Table 2-112 Parallel Query Statistics (PD_PDPS) Default and ChangeableValues
Item Default Value Changeable?
Collection Interval 600 Yes
Collection Offset 90
Log No
LOGIF (Blank)
Key Fields
Statistic (STATISTIC)
Lifetime
From the creation to the deletion of an Oracle instance
Record Size
• Fixed part: 678 bytes• Variable part: 39 bytes
Table 2-113 Parallel Query Statistics (PD_PDPS) Fields
Parallel Query Statistics (PD_PDPS)
View Name(Manager Name) Description Sum
Rule Format DeltaSupport
edVersion
DataSource
Record Time(RECORD_TIME)
Collectionterminationtime for theperformancedata storedin the record
-- time_t No All AgentCollector
Record Type(INPUT_RECORD_TYPE)
Record name(alwaysPDPS)
-- string(4)
No All AgentCollector
Start Time Collectionstart time for
-- time_t No All AgentCollector
2-228 Working with RecordsHitachi Tuning Manager Application Reports Reference

Parallel Query Statistics (PD_PDPS)
View Name(Manager Name) Description Sum
Rule Format DeltaSupport
edVersion
DataSource
(START_TIME) theperformancedata storedin the record
Statistic(STATISTIC)
Name of thestatistics
-- string(30)
No All V$PQ_SYSSTAT.NAME
Value(VALUE)
Statisticalvalue
-- double No All V$PQ_SYSSTAT.VALUE
Parameter Values (PD_PDP)
Function
The Parameter Values (PD_PDP) record stores performance data indicatingthe status of current parameter values at a specific point in time. Agent forOracle creates one record for each parameter. This is a multi-instance record.
Table 2-114 Parameter Values (PD_PDP) Default and Changeable Values
Item Default Value Changeable?
Collection Interval 600 Yes
Collection Offset 85
Log No
LOGIF (Blank)
Key Fields
Parameter Name (NAME)
Lifetime
From the creation to the deletion of an Oracle instance
Record Size
• Fixed part: 678 bytes• Variable part: 588 bytes
Working with Records 2-229Hitachi Tuning Manager Application Reports Reference

Table 2-115 Parameter Values (PD_PDP) Fields
Parameter Values (PD_PDP)
View Name(Manager Name) Description Sum
Rule Format DeltaSupport
edVersion
DataSource
Is Default(IS_DEFAULT)
Whether thevalue is thedefault. Validvalues areTRUE andFALSE.
-- string(9)
No All V$PARAMETER.ISDEFAULT
Parameter Name(NAME)
Parametername
-- string(64)
No All V$PARAMETER.NAME
Record Time(RECORD_TIME)
Collectionterminationtime for theperformancedata storedin the record
-- time_t No All AgentCollector
Record Type(INPUT_RECORD_TYPE)
Record name(always PDP)
-- string(4)
No All AgentCollector
Start Time(START_TIME)
Collectionstart time fortheperformancedata storedin the record
-- time_t No All AgentCollector
Value(VALUE)
Parametervalue
-- string(512)
No All V$PARAMETER.VALUE
Process Detail (PD_PDOP)
Function
The Process Detail (PD_PDOP) record stores performance data indicating thestatus of processes at a specific point in time. Agent for Oracle creates onerecord for each process in an instance. This is a multi-instance record.
Table 2-116 Process Detail (PD_PDOP) Default and Changeable Values
Item Default Value Changeable?
Collection Interval 600 Yes
Collection Offset 80
Log No
2-230 Working with RecordsHitachi Tuning Manager Application Reports Reference
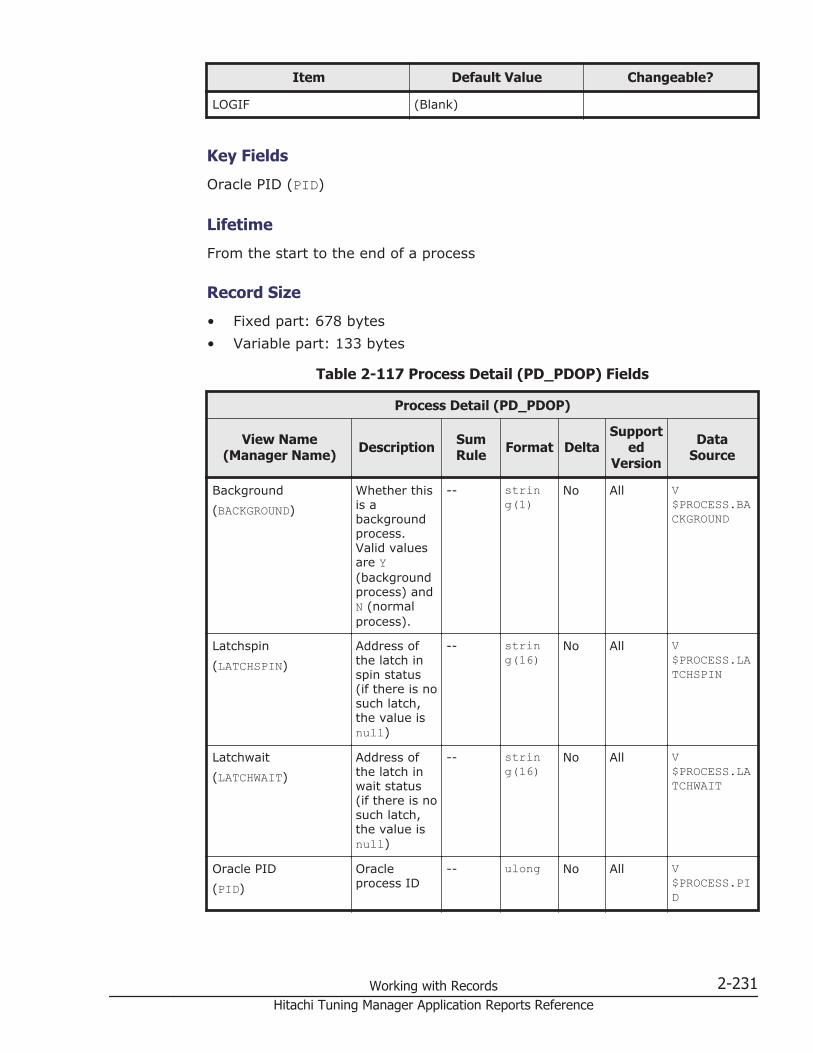
Item Default Value Changeable?
LOGIF (Blank)
Key Fields
Oracle PID (PID)
Lifetime
From the start to the end of a process
Record Size
• Fixed part: 678 bytes• Variable part: 133 bytes
Table 2-117 Process Detail (PD_PDOP) Fields
Process Detail (PD_PDOP)
View Name(Manager Name) Description Sum
Rule Format DeltaSupport
edVersion
DataSource
Background(BACKGROUND)
Whether thisis abackgroundprocess.Valid valuesare Y(backgroundprocess) andN (normalprocess).
-- string(1)
No All V$PROCESS.BACKGROUND
Latchspin(LATCHSPIN)
Address ofthe latch inspin status(if there is nosuch latch,the value isnull)
-- string(16)
No All V$PROCESS.LATCHSPIN
Latchwait(LATCHWAIT)
Address ofthe latch inwait status(if there is nosuch latch,the value isnull)
-- string(16)
No All V$PROCESS.LATCHWAIT
Oracle PID(PID)
Oracleprocess ID
-- ulong No All V$PROCESS.PID
Working with Records 2-231Hitachi Tuning Manager Application Reports Reference
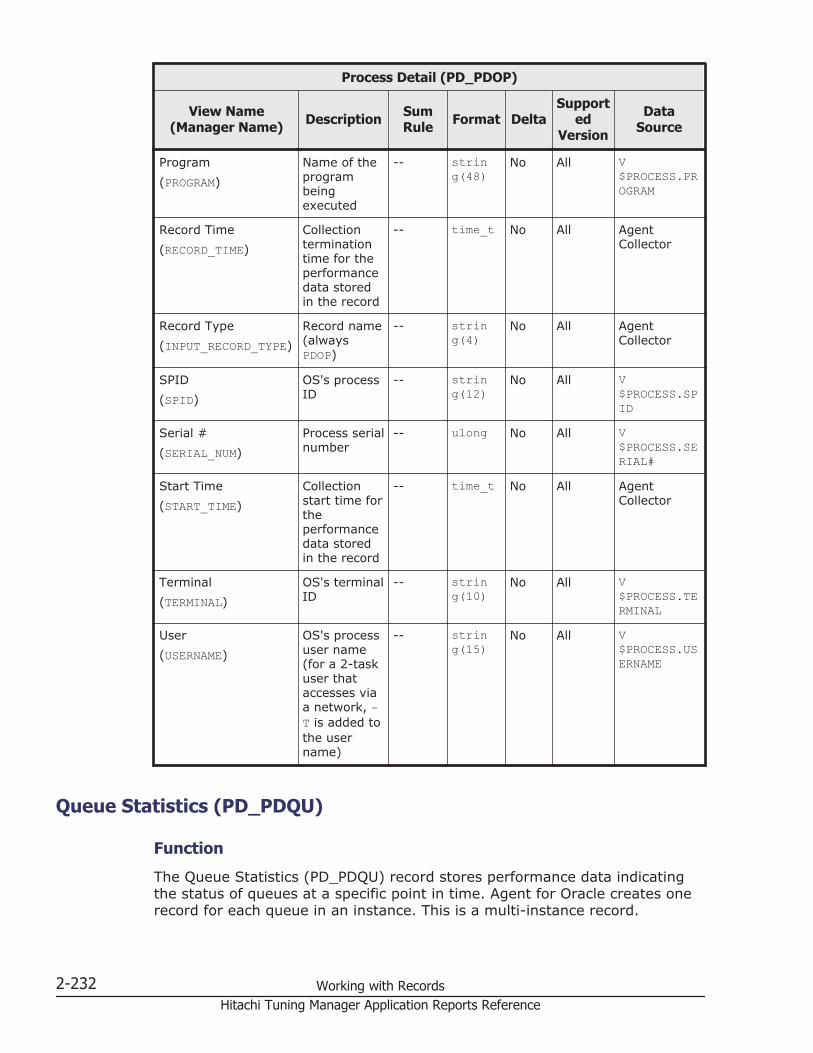
Process Detail (PD_PDOP)
View Name(Manager Name) Description Sum
Rule Format DeltaSupport
edVersion
DataSource
Program(PROGRAM)
Name of theprogrambeingexecuted
-- string(48)
No All V$PROCESS.PROGRAM
Record Time(RECORD_TIME)
Collectionterminationtime for theperformancedata storedin the record
-- time_t No All AgentCollector
Record Type(INPUT_RECORD_TYPE)
Record name(alwaysPDOP)
-- string(4)
No All AgentCollector
SPID(SPID)
OS's processID
-- string(12)
No All V$PROCESS.SPID
Serial #(SERIAL_NUM)
Process serialnumber
-- ulong No All V$PROCESS.SERIAL#
Start Time(START_TIME)
Collectionstart time fortheperformancedata storedin the record
-- time_t No All AgentCollector
Terminal(TERMINAL)
OS's terminalID
-- string(10)
No All V$PROCESS.TERMINAL
User(USERNAME)
OS's processuser name(for a 2-taskuser thataccesses viaa network, -T is added tothe username)
-- string(15)
No All V$PROCESS.USERNAME
Queue Statistics (PD_PDQU)
Function
The Queue Statistics (PD_PDQU) record stores performance data indicatingthe status of queues at a specific point in time. Agent for Oracle creates onerecord for each queue in an instance. This is a multi-instance record.
2-232 Working with RecordsHitachi Tuning Manager Application Reports Reference
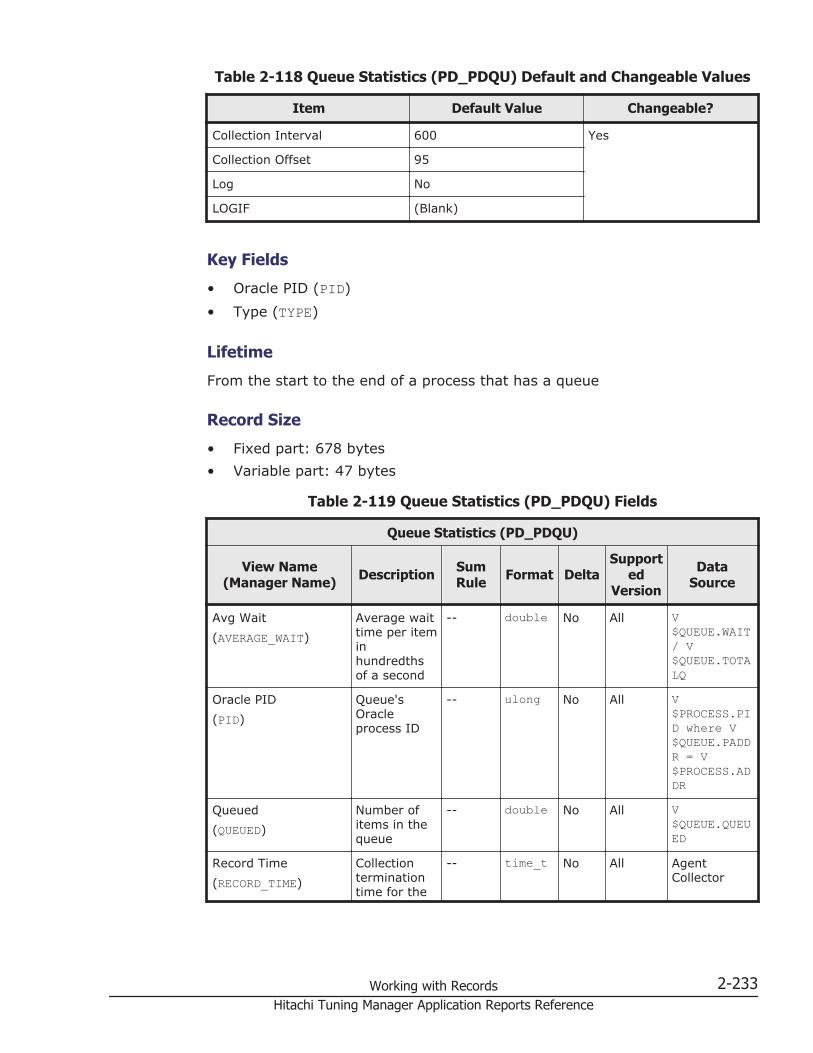
Table 2-118 Queue Statistics (PD_PDQU) Default and Changeable Values
Item Default Value Changeable?
Collection Interval 600 Yes
Collection Offset 95
Log No
LOGIF (Blank)
Key Fields
• Oracle PID (PID)• Type (TYPE)
Lifetime
From the start to the end of a process that has a queue
Record Size
• Fixed part: 678 bytes• Variable part: 47 bytes
Table 2-119 Queue Statistics (PD_PDQU) Fields
Queue Statistics (PD_PDQU)
View Name(Manager Name) Description Sum
Rule Format DeltaSupport
edVersion
DataSource
Avg Wait(AVERAGE_WAIT)
Average waittime per iteminhundredthsof a second
-- double No All V$QUEUE.WAIT/ V$QUEUE.TOTALQ
Oracle PID(PID)
Queue'sOracleprocess ID
-- ulong No All V$PROCESS.PID where V$QUEUE.PADDR = V$PROCESS.ADDR
Queued(QUEUED)
Number ofitems in thequeue
-- double No All V$QUEUE.QUEUED
Record Time(RECORD_TIME)
Collectionterminationtime for the
-- time_t No All AgentCollector
Working with Records 2-233Hitachi Tuning Manager Application Reports Reference
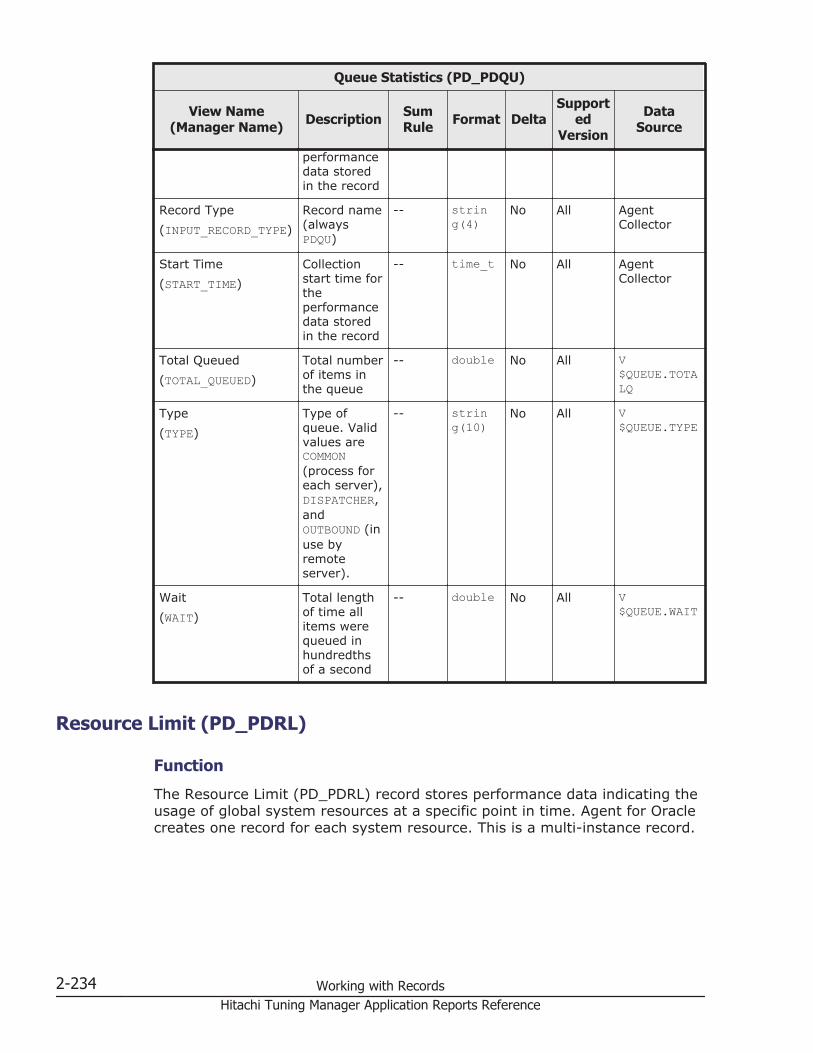
Queue Statistics (PD_PDQU)
View Name(Manager Name) Description Sum
Rule Format DeltaSupport
edVersion
DataSource
performancedata storedin the record
Record Type(INPUT_RECORD_TYPE)
Record name(alwaysPDQU)
-- string(4)
No All AgentCollector
Start Time(START_TIME)
Collectionstart time fortheperformancedata storedin the record
-- time_t No All AgentCollector
Total Queued(TOTAL_QUEUED)
Total numberof items inthe queue
-- double No All V$QUEUE.TOTALQ
Type(TYPE)
Type ofqueue. Validvalues areCOMMON(process foreach server),DISPATCHER,andOUTBOUND (inuse byremoteserver).
-- string(10)
No All V$QUEUE.TYPE
Wait(WAIT)
Total lengthof time allitems werequeued inhundredthsof a second
-- double No All V$QUEUE.WAIT
Resource Limit (PD_PDRL)
Function
The Resource Limit (PD_PDRL) record stores performance data indicating theusage of global system resources at a specific point in time. Agent for Oraclecreates one record for each system resource. This is a multi-instance record.
2-234 Working with RecordsHitachi Tuning Manager Application Reports Reference
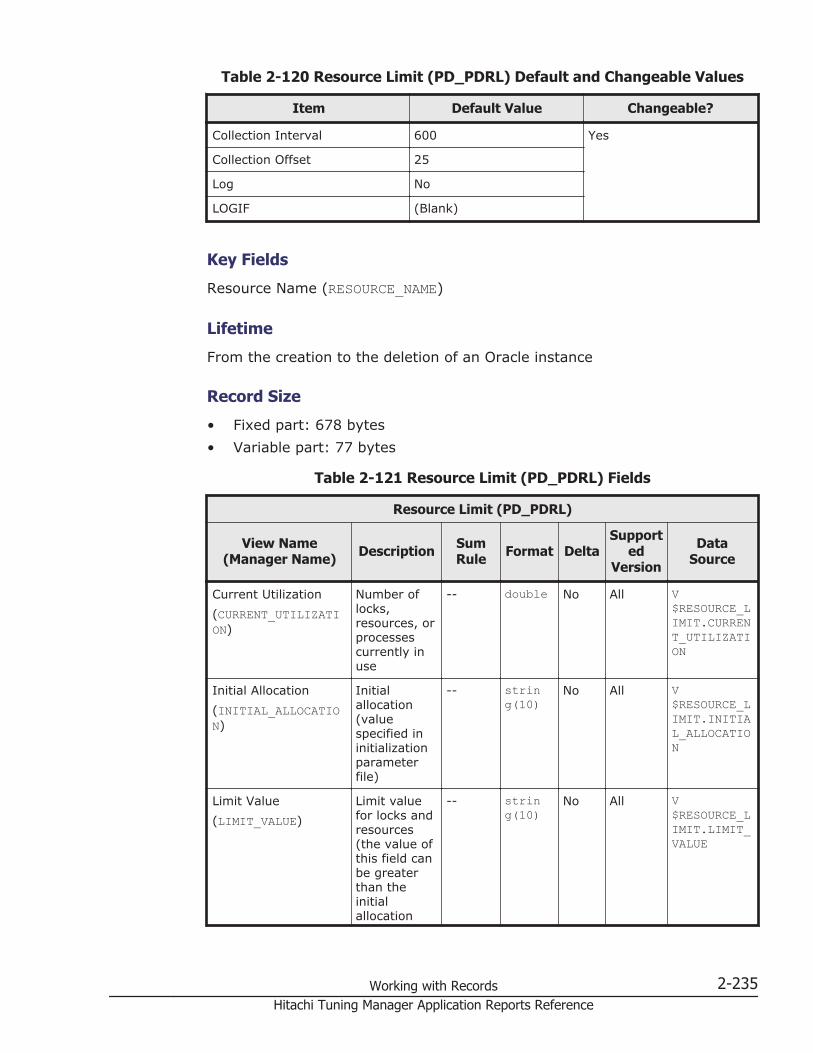
Table 2-120 Resource Limit (PD_PDRL) Default and Changeable Values
Item Default Value Changeable?
Collection Interval 600 Yes
Collection Offset 25
Log No
LOGIF (Blank)
Key Fields
Resource Name (RESOURCE_NAME)
Lifetime
From the creation to the deletion of an Oracle instance
Record Size
• Fixed part: 678 bytes• Variable part: 77 bytes
Table 2-121 Resource Limit (PD_PDRL) Fields
Resource Limit (PD_PDRL)
View Name(Manager Name) Description Sum
Rule Format DeltaSupport
edVersion
DataSource
Current Utilization(CURRENT_UTILIZATION)
Number oflocks,resources, orprocessescurrently inuse
-- double No All V$RESOURCE_LIMIT.CURRENT_UTILIZATION
Initial Allocation(INITIAL_ALLOCATION)
Initialallocation(valuespecified ininitializationparameterfile)
-- string(10)
No All V$RESOURCE_LIMIT.INITIAL_ALLOCATION
Limit Value(LIMIT_VALUE)
Limit valuefor locks andresources(the value ofthis field canbe greaterthan theinitialallocation
-- string(10)
No All V$RESOURCE_LIMIT.LIMIT_VALUE
Working with Records 2-235Hitachi Tuning Manager Application Reports Reference

Resource Limit (PD_PDRL)
View Name(Manager Name) Description Sum
Rule Format DeltaSupport
edVersion
DataSource
value; in thecase ofunlimitedallocation,the value ofthis field isUNLIMITED)
Max Utilization(MAX_UTILIZATION)
Maximumamount ofresourcesused sincethe lastinstancestarted
-- double No All V$RESOURCE_LIMIT.MAX_UTILIZATION
Record Time(RECORD_TIME)
Collectionterminationtime for theperformancedata storedin the record
-- time_t No All AgentCollector
Record Type(INPUT_RECORD_TYPE)
Record name(alwaysPDRL)
-- string(4)
No All AgentCollector
Resource Name(RESOURCE_NAME)
Resourcename
-- string(30)
No All V$RESOURCE_LIMIT.RESOURCE_NAME
Start Time(START_TIME)
Collectionstart time fortheperformancedata storedin the record
-- time_t No All AgentCollector
Utilization %(UTILIZATION_PERCENT)
Ratio (as apercent) ofthe currentutilizationvalue to themaximumutilizationvalue
-- double No All CURRENT_UTILIZATION /MAX_UTILIZATION * 100
2-236 Working with RecordsHitachi Tuning Manager Application Reports Reference

Rollback Segment (PD_PDRS)
Function
The Rollback Segment (PD_PDRS) record stores performance data indicatingthe status of each rollback segment in a database at a specific point in time.Agent for Oracle creates one record for each rollback segment. This is amulti-instance record.
Table 2-122 Rollback Segment (PD_PDRS) Default and Changeable Values
Item Default Value Changeable?
Collection Interval 300 Yes
Collection Offset 30
Log No
LOGIF (Blank)
Key Fields
USN (USN)
Lifetime
From the creation to the deletion of a rollback segment
Record Size
• Fixed part: 678 bytes• Variable part: 190 bytes
Table 2-123 Rollback Segment (PD_PDRS) Fields
Rollback Segment (PD_PDRS)
View Name(Manager Name) Description Sum
Rule Format DeltaSupport
edVersion
DataSource
Avg Active(AVG_ACTIVE)
Average sizeof an activeextent thathasuncommittedtransactiondata duringdatacollection
-- double No All V$ROLLSTAT.AVEACTIVE
Avg Shrink(AVG_SHRINK)
Total size ofreleasedextentsdivided by
-- double No All V$ROLLSTAT.AVESHRINK
Working with Records 2-237Hitachi Tuning Manager Application Reports Reference
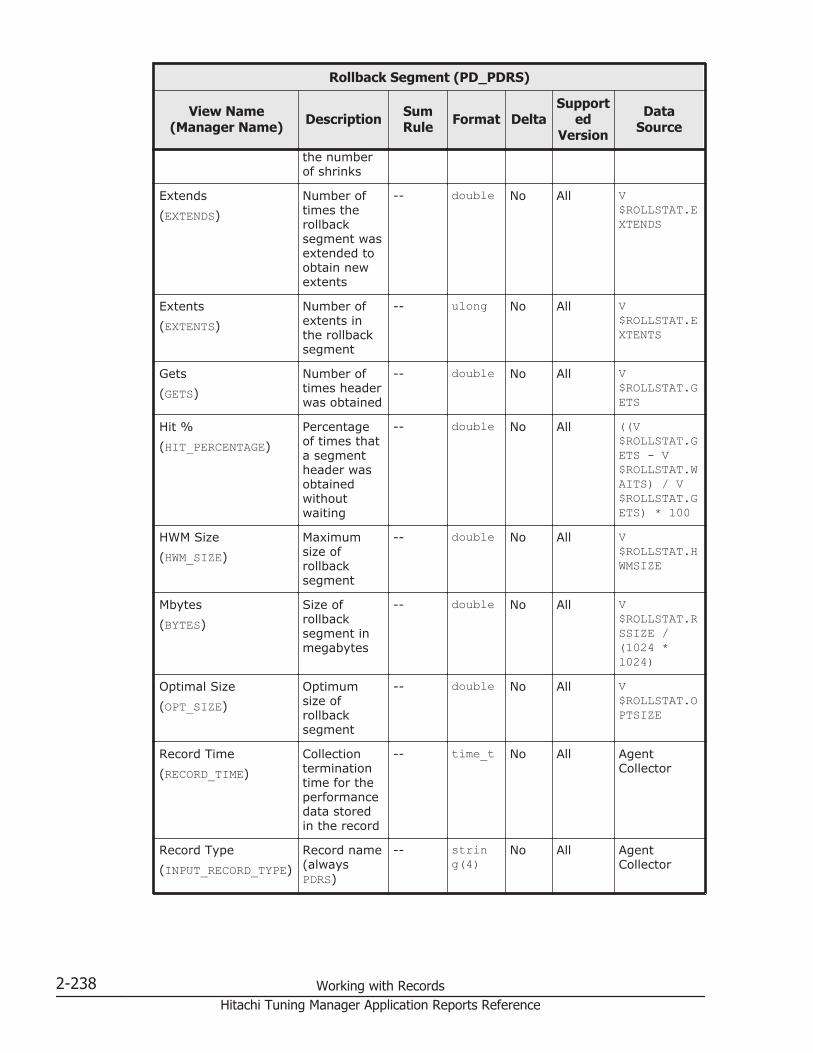
Rollback Segment (PD_PDRS)
View Name(Manager Name) Description Sum
Rule Format DeltaSupport
edVersion
DataSource
the numberof shrinks
Extends(EXTENDS)
Number oftimes therollbacksegment wasextended toobtain newextents
-- double No All V$ROLLSTAT.EXTENDS
Extents(EXTENTS)
Number ofextents inthe rollbacksegment
-- ulong No All V$ROLLSTAT.EXTENTS
Gets(GETS)
Number oftimes headerwas obtained
-- double No All V$ROLLSTAT.GETS
Hit %(HIT_PERCENTAGE)
Percentageof times thata segmentheader wasobtainedwithoutwaiting
-- double No All ((V$ROLLSTAT.GETS - V$ROLLSTAT.WAITS) / V$ROLLSTAT.GETS) * 100
HWM Size(HWM_SIZE)
Maximumsize ofrollbacksegment
-- double No All V$ROLLSTAT.HWMSIZE
Mbytes(BYTES)
Size ofrollbacksegment inmegabytes
-- double No All V$ROLLSTAT.RSSIZE /(1024 *1024)
Optimal Size(OPT_SIZE)
Optimumsize ofrollbacksegment
-- double No All V$ROLLSTAT.OPTSIZE
Record Time(RECORD_TIME)
Collectionterminationtime for theperformancedata storedin the record
-- time_t No All AgentCollector
Record Type(INPUT_RECORD_TYPE)
Record name(alwaysPDRS)
-- string(4)
No All AgentCollector
2-238 Working with RecordsHitachi Tuning Manager Application Reports Reference

Rollback Segment (PD_PDRS)
View Name(Manager Name) Description Sum
Rule Format DeltaSupport
edVersion
DataSource
Segment Name(NAME)
Name of therollbacksegment
-- string(30)
No All V$ROLLNAME.NAME
Shrinks(SHRINKS)
Number oftimes therollbacksegmentshrank bydeleting atleast oneadditionalextent
-- double No All V$ROLLSTAT.SHRINKS
Start Time(START_TIME)
Collectionstart time fortheperformancedata storedin the record
-- time_t No All AgentCollector
Status(STATUS)
Status. Validvalues areONLINE(segment isonline) andPENDINGOFFLINE(segment isoffline, butseveralactivetransactionsare used inthe rollbacksegment;segment isplaced offlinewhentransactionsarecompleted).
-- string(15)
No All V$ROLLSTAT.STATUS
Tablespace Name(TABLESPACE_NAME)
Name oftablespacethat containsthe segment
-- string(30)
No All DBA_ROLLBACK_SEGS.TABLESPACE_NAME
Transactions(TRANSACTIONS)
Number ofactivetransactions
-- long No All V$ROLLSTAT.XACTS
USN(USN)
Rollbacksegmentnumber
-- double No All V$ROLLSTAT.USN
Working with Records 2-239Hitachi Tuning Manager Application Reports Reference
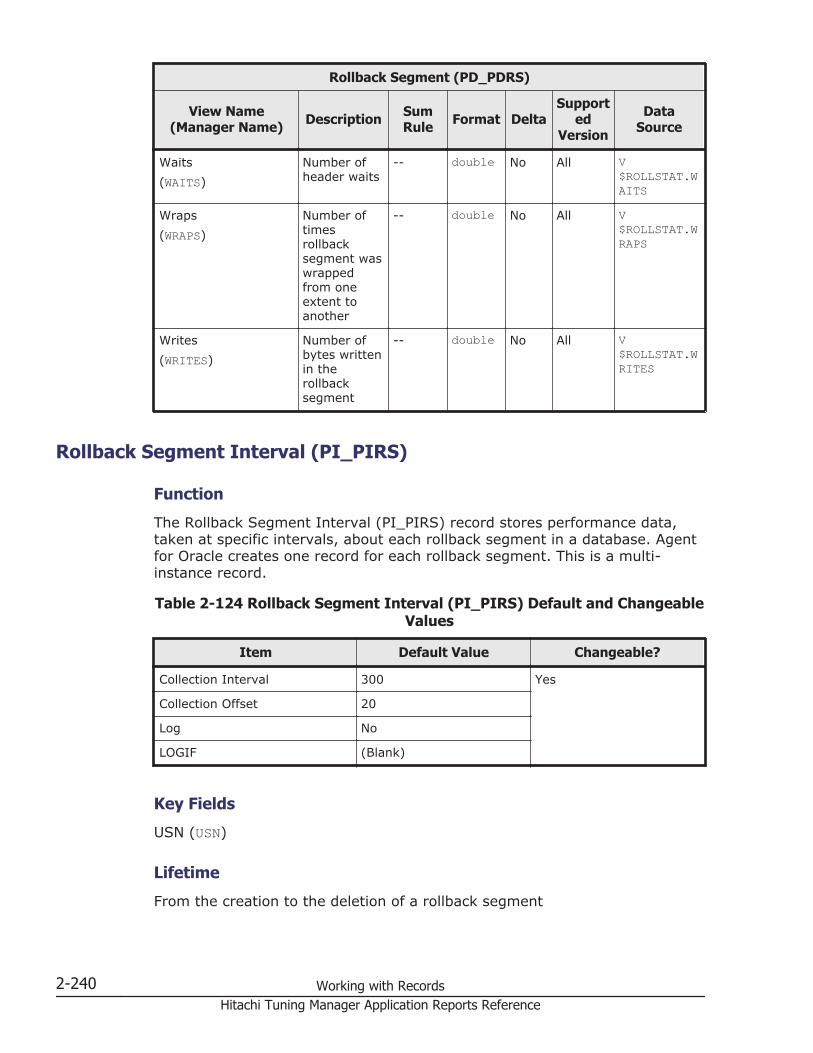
Rollback Segment (PD_PDRS)
View Name(Manager Name) Description Sum
Rule Format DeltaSupport
edVersion
DataSource
Waits(WAITS)
Number ofheader waits
-- double No All V$ROLLSTAT.WAITS
Wraps(WRAPS)
Number oftimesrollbacksegment waswrappedfrom oneextent toanother
-- double No All V$ROLLSTAT.WRAPS
Writes(WRITES)
Number ofbytes writtenin therollbacksegment
-- double No All V$ROLLSTAT.WRITES
Rollback Segment Interval (PI_PIRS)
Function
The Rollback Segment Interval (PI_PIRS) record stores performance data,taken at specific intervals, about each rollback segment in a database. Agentfor Oracle creates one record for each rollback segment. This is a multi-instance record.
Table 2-124 Rollback Segment Interval (PI_PIRS) Default and ChangeableValues
Item Default Value Changeable?
Collection Interval 300 Yes
Collection Offset 20
Log No
LOGIF (Blank)
Key Fields
USN (USN)
Lifetime
From the creation to the deletion of a rollback segment
2-240 Working with RecordsHitachi Tuning Manager Application Reports Reference

Record Size
• Fixed part: 678 bytes• Variable part: 426 bytes
Table 2-125 Rollback Segment Interval (PI_PIRS) Fields
Rollback Segment Interval (PI_PIRS)
View Name(Manager Name) Description Sum
Rule Format DeltaSupport
edVersion
DataSource
Avg Active(AVG_ACTIVE)
Average sizeof an activeextent thathasuncommittedtransactiondata duringdatacollection
AVG double No All V$ROLLSTAT.AVEACTIVE
Avg Shrink(AVG_SHRINK)
Total size ofreleasedextentsdivided bythe numberof shrinks
AVG double No All V$ROLLSTAT.AVESHRINK
Extends(EXTENDS)
Number oftimes therollbacksegment wasextended toobtain newextents
HILO double Yes All V$ROLLSTAT.EXTENDS
Extents(EXTENTS)
Number ofextents inthe rollbacksegment
AVG ulong No All V$ROLLSTAT.EXTENTS
Gets(GETS)
Number oftimes headerwas obtained
AVG double Yes All V$ROLLSTAT.GETS
Hit %(HIT_PERCENTAGE)
Percentageof times thata segmentheader wasobtainedwithoutwaiting
AVG double No All ((V$ROLLSTAT.GETS - V$ROLLSTAT.WAITS) / V$ROLLSTAT.GETS) * 100
HWM Size(HWM_SIZE)
Maximumsize ofrollbacksegment
AVG double No All V$ROLLSTAT.HWMSIZE
Working with Records 2-241Hitachi Tuning Manager Application Reports Reference
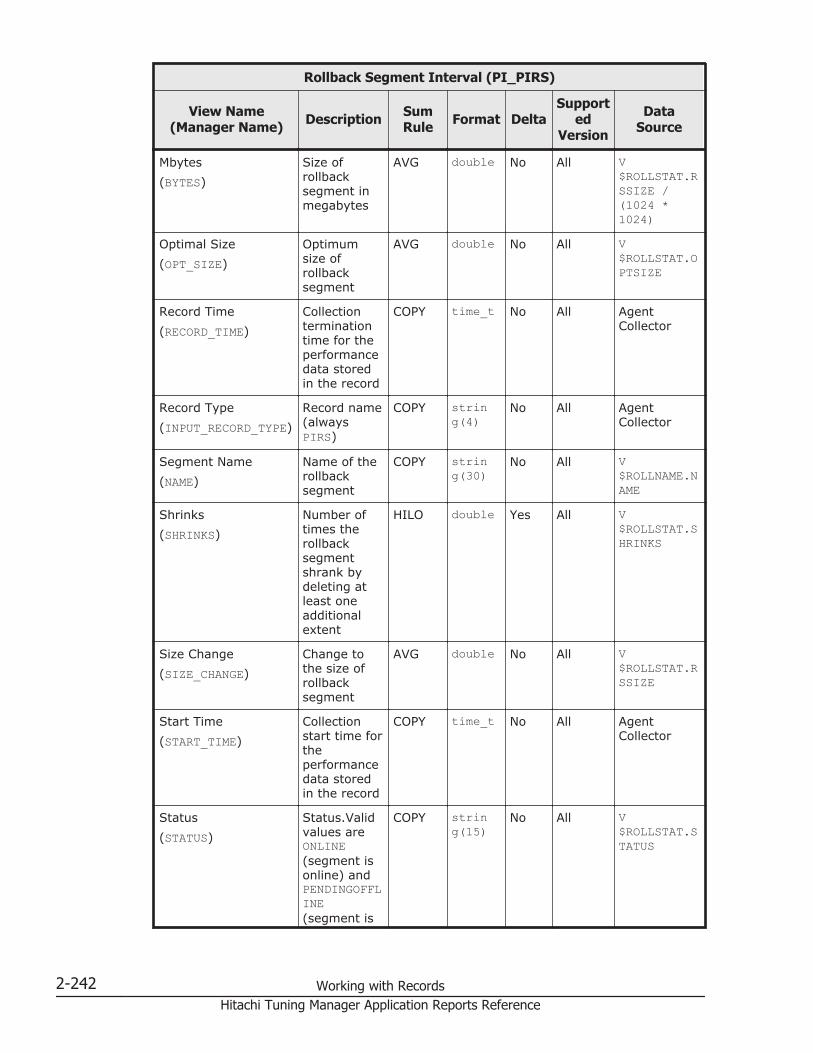
Rollback Segment Interval (PI_PIRS)
View Name(Manager Name) Description Sum
Rule Format DeltaSupport
edVersion
DataSource
Mbytes(BYTES)
Size ofrollbacksegment inmegabytes
AVG double No All V$ROLLSTAT.RSSIZE /(1024 *1024)
Optimal Size(OPT_SIZE)
Optimumsize ofrollbacksegment
AVG double No All V$ROLLSTAT.OPTSIZE
Record Time(RECORD_TIME)
Collectionterminationtime for theperformancedata storedin the record
COPY time_t No All AgentCollector
Record Type(INPUT_RECORD_TYPE)
Record name(alwaysPIRS)
COPY string(4)
No All AgentCollector
Segment Name(NAME)
Name of therollbacksegment
COPY string(30)
No All V$ROLLNAME.NAME
Shrinks(SHRINKS)
Number oftimes therollbacksegmentshrank bydeleting atleast oneadditionalextent
HILO double Yes All V$ROLLSTAT.SHRINKS
Size Change(SIZE_CHANGE)
Change tothe size ofrollbacksegment
AVG double No All V$ROLLSTAT.RSSIZE
Start Time(START_TIME)
Collectionstart time fortheperformancedata storedin the record
COPY time_t No All AgentCollector
Status(STATUS)
Status.Validvalues areONLINE(segment isonline) andPENDINGOFFLINE(segment is
COPY string(15)
No All V$ROLLSTAT.STATUS
2-242 Working with RecordsHitachi Tuning Manager Application Reports Reference
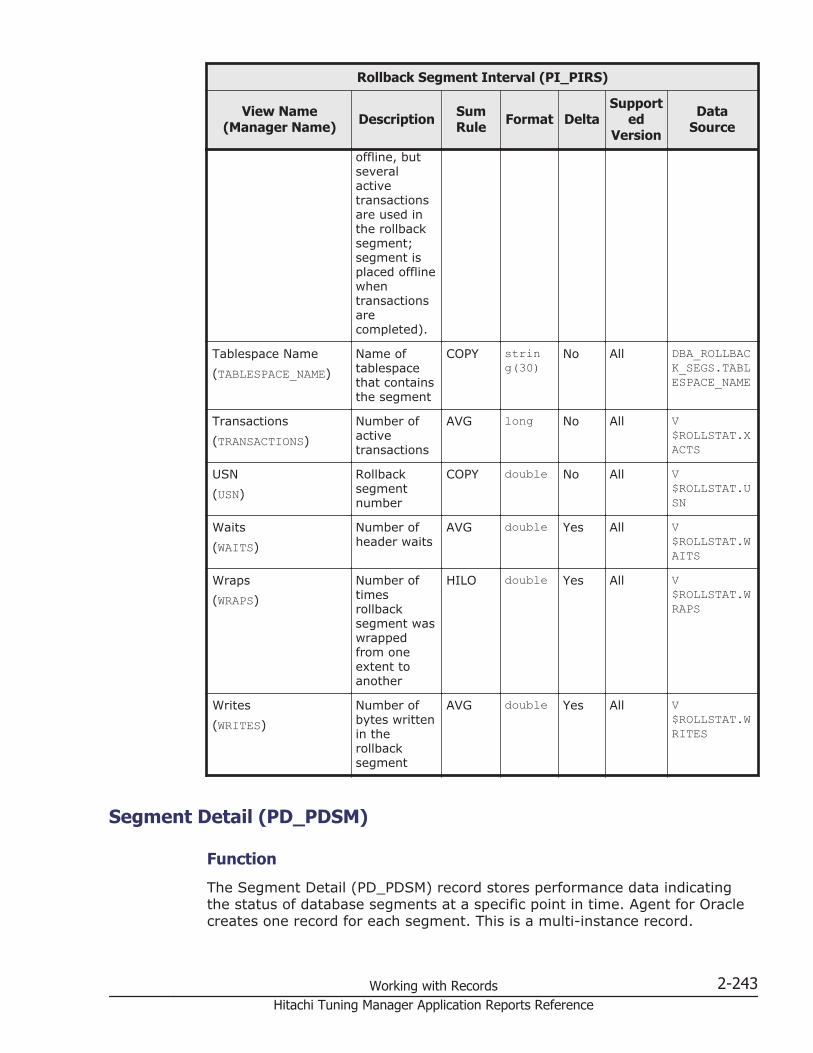
Rollback Segment Interval (PI_PIRS)
View Name(Manager Name) Description Sum
Rule Format DeltaSupport
edVersion
DataSource
offline, butseveralactivetransactionsare used inthe rollbacksegment;segment isplaced offlinewhentransactionsarecompleted).
Tablespace Name(TABLESPACE_NAME)
Name oftablespacethat containsthe segment
COPY string(30)
No All DBA_ROLLBACK_SEGS.TABLESPACE_NAME
Transactions(TRANSACTIONS)
Number ofactivetransactions
AVG long No All V$ROLLSTAT.XACTS
USN(USN)
Rollbacksegmentnumber
COPY double No All V$ROLLSTAT.USN
Waits(WAITS)
Number ofheader waits
AVG double Yes All V$ROLLSTAT.WAITS
Wraps(WRAPS)
Number oftimesrollbacksegment waswrappedfrom oneextent toanother
HILO double Yes All V$ROLLSTAT.WRAPS
Writes(WRITES)
Number ofbytes writtenin therollbacksegment
AVG double Yes All V$ROLLSTAT.WRITES
Segment Detail (PD_PDSM)
Function
The Segment Detail (PD_PDSM) record stores performance data indicatingthe status of database segments at a specific point in time. Agent for Oraclecreates one record for each segment. This is a multi-instance record.
Working with Records 2-243Hitachi Tuning Manager Application Reports Reference
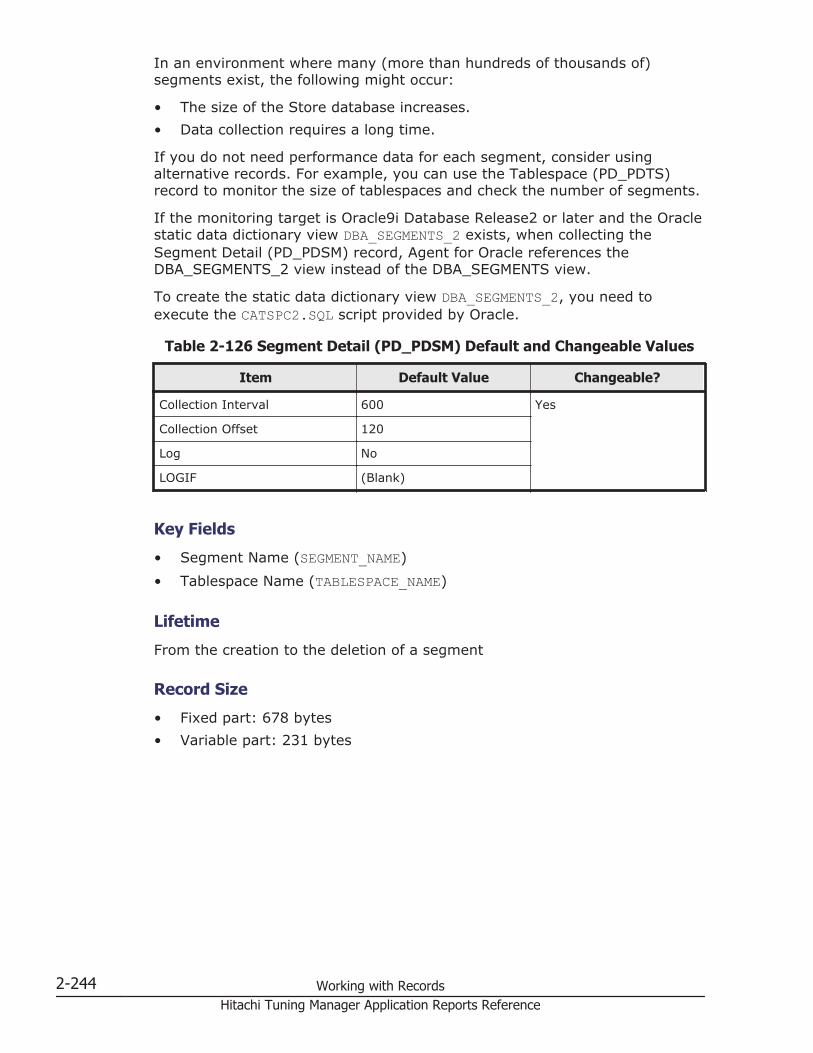
In an environment where many (more than hundreds of thousands of)segments exist, the following might occur:
• The size of the Store database increases.• Data collection requires a long time.
If you do not need performance data for each segment, consider usingalternative records. For example, you can use the Tablespace (PD_PDTS)record to monitor the size of tablespaces and check the number of segments.
If the monitoring target is Oracle9i Database Release2 or later and the Oraclestatic data dictionary view DBA_SEGMENTS_2 exists, when collecting theSegment Detail (PD_PDSM) record, Agent for Oracle references theDBA_SEGMENTS_2 view instead of the DBA_SEGMENTS view.
To create the static data dictionary view DBA_SEGMENTS_2, you need toexecute the CATSPC2.SQL script provided by Oracle.
Table 2-126 Segment Detail (PD_PDSM) Default and Changeable Values
Item Default Value Changeable?
Collection Interval 600 Yes
Collection Offset 120
Log No
LOGIF (Blank)
Key Fields
• Segment Name (SEGMENT_NAME)• Tablespace Name (TABLESPACE_NAME)
Lifetime
From the creation to the deletion of a segment
Record Size
• Fixed part: 678 bytes• Variable part: 231 bytes
2-244 Working with RecordsHitachi Tuning Manager Application Reports Reference
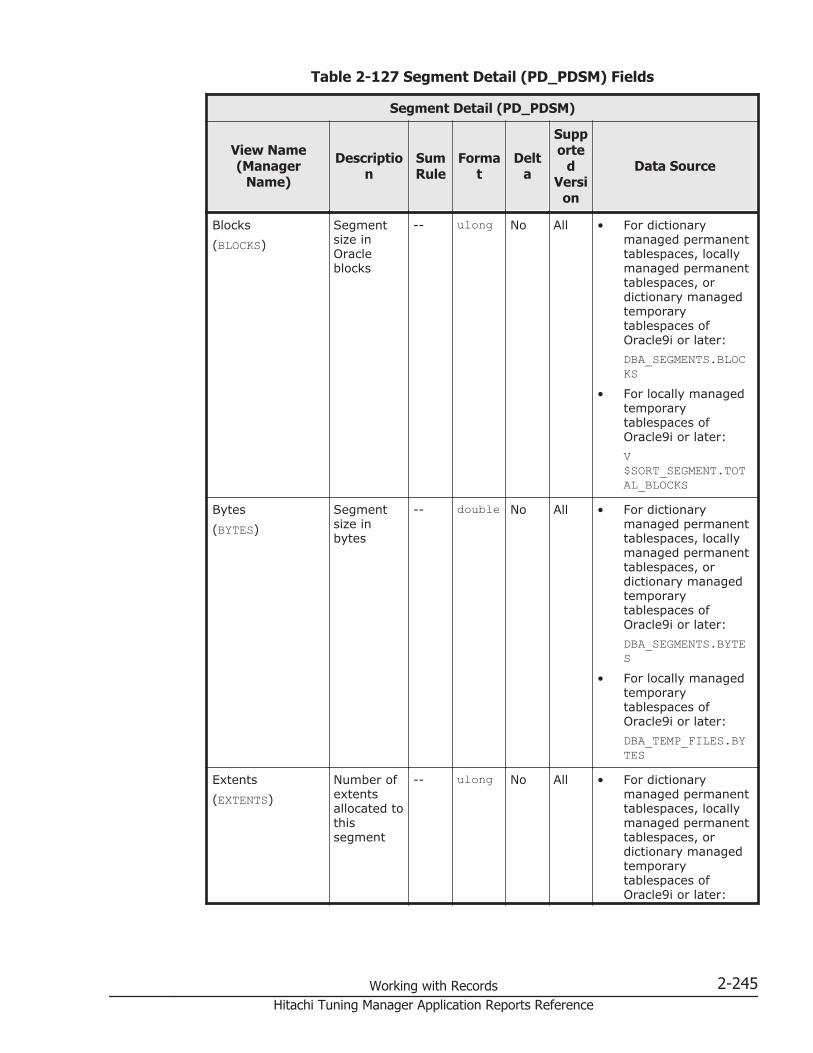
Table 2-127 Segment Detail (PD_PDSM) Fields
Segment Detail (PD_PDSM)
View Name(Manager
Name)
Description
SumRule
Format
Delta
Supporte
dVersi
on
Data Source
Blocks(BLOCKS)
Segmentsize inOracleblocks
-- ulong No All • For dictionarymanaged permanenttablespaces, locallymanaged permanenttablespaces, ordictionary managedtemporarytablespaces ofOracle9i or later:DBA_SEGMENTS.BLOCKS
• For locally managedtemporarytablespaces ofOracle9i or later:V$SORT_SEGMENT.TOTAL_BLOCKS
Bytes(BYTES)
Segmentsize inbytes
-- double No All • For dictionarymanaged permanenttablespaces, locallymanaged permanenttablespaces, ordictionary managedtemporarytablespaces ofOracle9i or later:DBA_SEGMENTS.BYTES
• For locally managedtemporarytablespaces ofOracle9i or later:DBA_TEMP_FILES.BYTES
Extents(EXTENTS)
Number ofextentsallocated tothissegment
-- ulong No All • For dictionarymanaged permanenttablespaces, locallymanaged permanenttablespaces, ordictionary managedtemporarytablespaces ofOracle9i or later:
Working with Records 2-245Hitachi Tuning Manager Application Reports Reference

Segment Detail (PD_PDSM)
View Name(Manager
Name)
Description
SumRule
Format
Delta
Supporte
dVersi
on
Data Source
DBA_SEGMENTS.EXTENTS
• For locally managedtemporarytablespaces ofOracle9i or later:V$SORT_SEGMENT.TOTAL_EXTENTS
Free list Groups(FREELIST_GROUPS)
Number offree listgroupsallocated tothesegment. Ifan instanceof Oracle9ior later isbeingmonitored,performance dataabout thelocallymanagedtemporarytablespaceis notcollected.
-- ulong No All DBA_SEGMENTS.FREELIST_GROUPS
Free lists(FREELISTS)
Number ofprocessfree listsallocated tothesegment. Ifan instanceof Oracle9ior later isbeingmonitored,performance dataabout thelocallymanagedtemporarytablespaceis notcollected.
-- ulong No All DBA_SEGMENTS.FREELISTS
2-246 Working with RecordsHitachi Tuning Manager Application Reports Reference

Segment Detail (PD_PDSM)
View Name(Manager
Name)
Description
SumRule
Format
Delta
Supporte
dVersi
on
Data Source
Header Block(HEADER_BLOCK)
Block IDincludingthesegmentheader. Ifan instanceof Oracle9ior later isbeingmonitored,performance dataabout thelocallymanagedtemporarytablespaceis notcollected.
-- ulong No All DBA_SEGMENTS.HEADER_BLOCK
Header File(HEADER_FILE)
File IDincludingthesegmentheader. Ifan instanceof Oracle9ior later isbeingmonitored,performance dataabout thelocallymanagedtemporarytablespaceis notcollected.
-- ushort No All DBA_SEGMENTS.HEADER_FILE
Increase %(PCT_INCREASE)
Thepercentageincrease insize of theextent dueto the nextextentallocation.If aninstance ofOracle9i orlater is
-- short No All DBA_SEGMENTS.PCT_INCREASE
Working with Records 2-247Hitachi Tuning Manager Application Reports Reference

Segment Detail (PD_PDSM)
View Name(Manager
Name)
Description
SumRule
Format
Delta
Supporte
dVersi
on
Data Source
beingmonitored,performance dataabout thelocallymanagedtemporarytablespaceis notcollected.
Initial Extent(INITIAL_EXTENT)
Size of theinitialextent forthesegment inbytes. If aninstance ofOracle9i orlater isbeingmonitored,performance dataabout thelocallymanagedtemporarytablespaceis notcollected.
-- double No All DBA_SEGMENTS.INITIAL_EXTENT
Max Extents(MAX_EXTENTS)
Maximumnumber ofextentspermittedfor thesegment. Ifan instanceof Oracle9ior later isbeingmonitored,performance dataabout thelocallymanagedtemporarytablespace
-- ulong No All DBA_SEGMENTS.MAX_EXTENTS
2-248 Working with RecordsHitachi Tuning Manager Application Reports Reference

Segment Detail (PD_PDSM)
View Name(Manager
Name)
Description
SumRule
Format
Delta
Supporte
dVersi
on
Data Source
is notcollected.
Max Extents %(PERCENT_MAX_EXTENTS)
Ratio (as apercent) ofthecurrentlyallocatedextents tothemaximumnumber ofextentspermittedfor thesegment. Ifan instanceof Oracle9ior later isbeingmonitored,performance dataabout thelocallymanagedtemporarytablespaceis notcollected.
-- double No All (DBA_SEGMENTS.EXTENTS/DBA_SEGMENTS.MAX_EXTENTS) * 100
Min Extents(MIN_EXTENTS)
Minimumnumber ofextentspermittedfor thesegment
-- ulong No All DBA_SEGMENTS.MIN_EXTENTS
Next Alloc Fails(NEXT_ALLOC_FAILS)
Correctvaluescannot becollectedfor thisfield.Failure ofthe nextextentallocation.If it fails,the valueof this fieldis 1.
-- short No All DBA_SEGMENTS.NEXT_EXTENT > MAX(fet$.length) *DB_BLOCK_SIZE
Working with Records 2-249Hitachi Tuning Manager Application Reports Reference
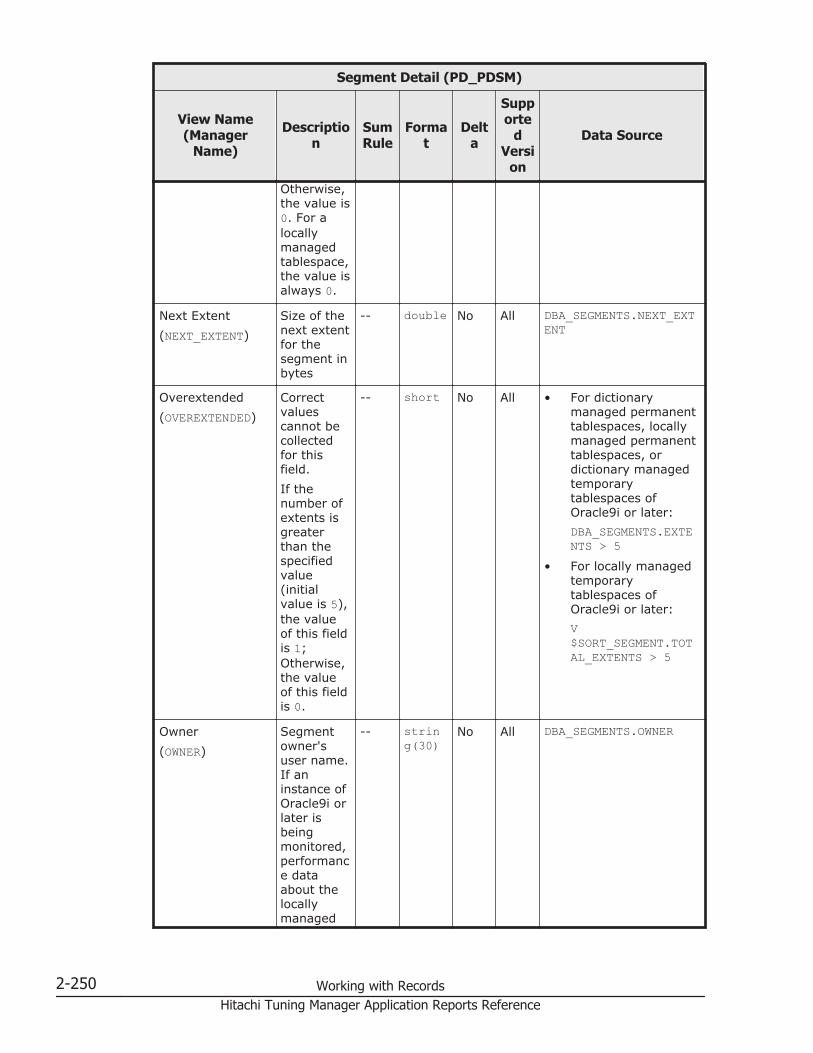
Segment Detail (PD_PDSM)
View Name(Manager
Name)
Description
SumRule
Format
Delta
Supporte
dVersi
on
Data Source
Otherwise,the value is0. For alocallymanagedtablespace,the value isalways 0.
Next Extent(NEXT_EXTENT)
Size of thenext extentfor thesegment inbytes
-- double No All DBA_SEGMENTS.NEXT_EXTENT
Overextended(OVEREXTENDED)
Correctvaluescannot becollectedfor thisfield.If thenumber ofextents isgreaterthan thespecifiedvalue(initialvalue is 5),the valueof this fieldis 1;Otherwise,the valueof this fieldis 0.
-- short No All • For dictionarymanaged permanenttablespaces, locallymanaged permanenttablespaces, ordictionary managedtemporarytablespaces ofOracle9i or later:DBA_SEGMENTS.EXTENTS > 5
• For locally managedtemporarytablespaces ofOracle9i or later:V$SORT_SEGMENT.TOTAL_EXTENTS > 5
Owner(OWNER)
Segmentowner'suser name.If aninstance ofOracle9i orlater isbeingmonitored,performance dataabout thelocallymanaged
-- string(30)
No All DBA_SEGMENTS.OWNER
2-250 Working with RecordsHitachi Tuning Manager Application Reports Reference
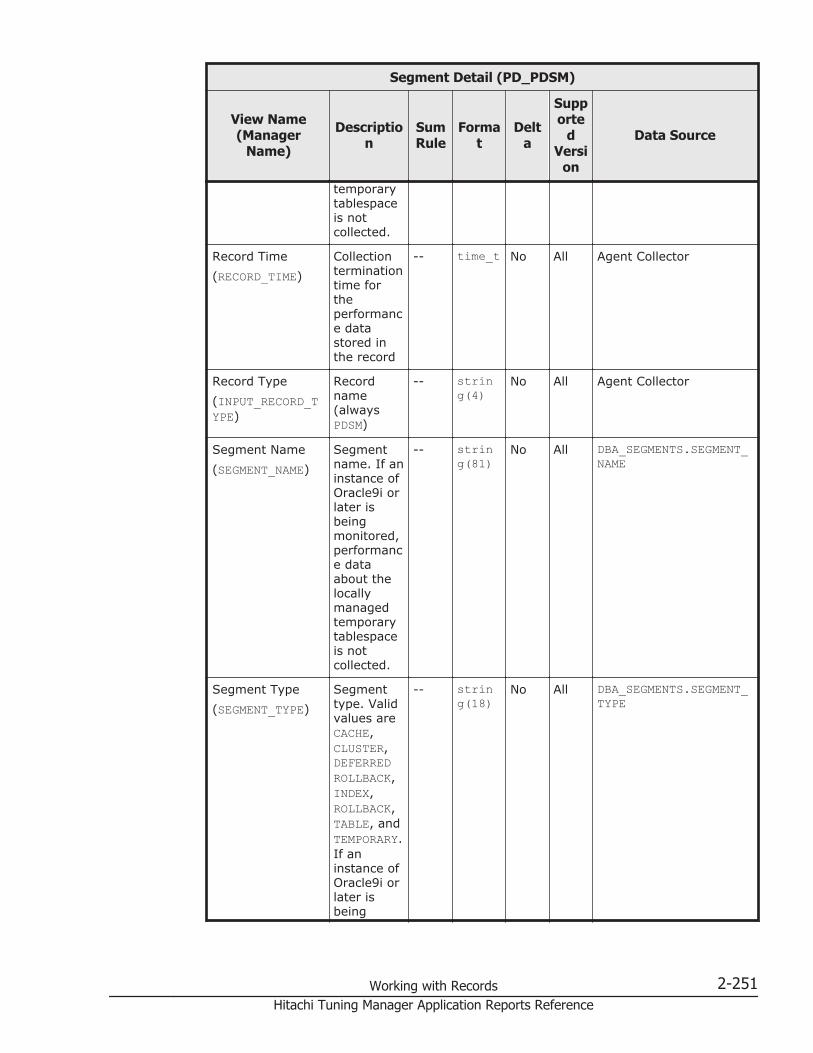
Segment Detail (PD_PDSM)
View Name(Manager
Name)
Description
SumRule
Format
Delta
Supporte
dVersi
on
Data Source
temporarytablespaceis notcollected.
Record Time(RECORD_TIME)
Collectionterminationtime fortheperformance datastored inthe record
-- time_t No All Agent Collector
Record Type(INPUT_RECORD_TYPE)
Recordname(alwaysPDSM)
-- string(4)
No All Agent Collector
Segment Name(SEGMENT_NAME)
Segmentname. If aninstance ofOracle9i orlater isbeingmonitored,performance dataabout thelocallymanagedtemporarytablespaceis notcollected.
-- string(81)
No All DBA_SEGMENTS.SEGMENT_NAME
Segment Type(SEGMENT_TYPE)
Segmenttype. Validvalues areCACHE,CLUSTER,DEFERREDROLLBACK,INDEX,ROLLBACK,TABLE, andTEMPORARY.If aninstance ofOracle9i orlater isbeing
-- string(18)
No All DBA_SEGMENTS.SEGMENT_TYPE
Working with Records 2-251Hitachi Tuning Manager Application Reports Reference
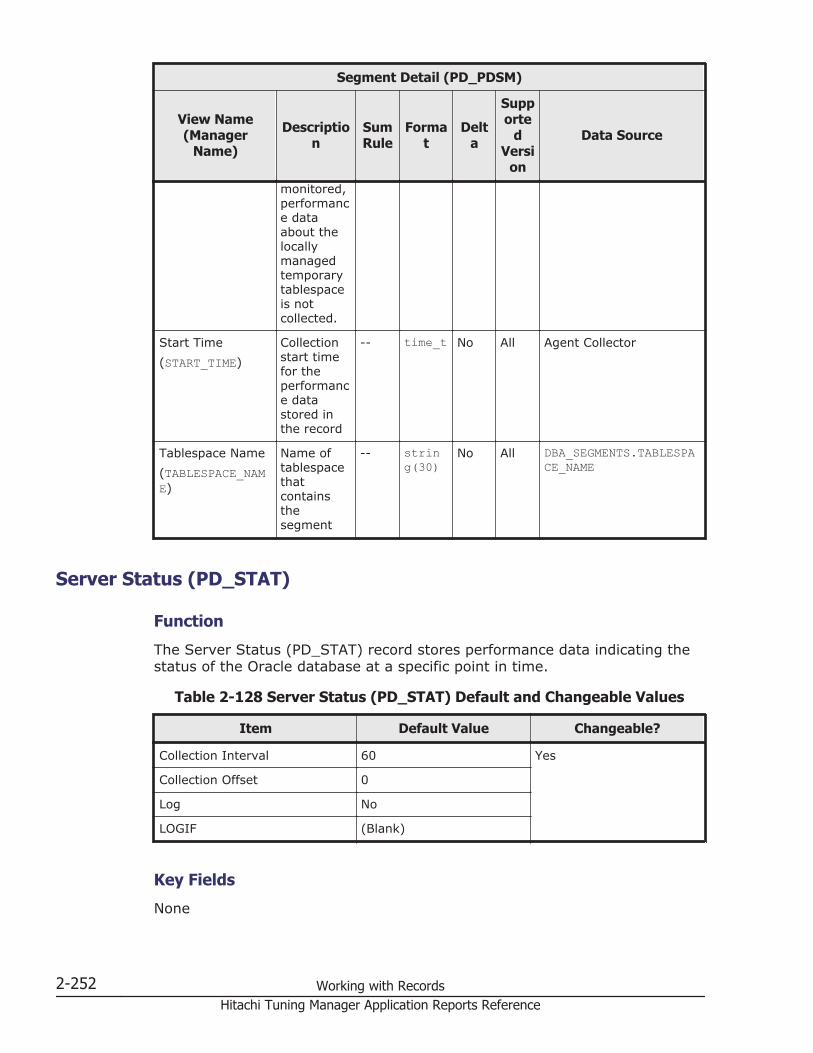
Segment Detail (PD_PDSM)
View Name(Manager
Name)
Description
SumRule
Format
Delta
Supporte
dVersi
on
Data Source
monitored,performance dataabout thelocallymanagedtemporarytablespaceis notcollected.
Start Time(START_TIME)
Collectionstart timefor theperformance datastored inthe record
-- time_t No All Agent Collector
Tablespace Name(TABLESPACE_NAME)
Name oftablespacethatcontainsthesegment
-- string(30)
No All DBA_SEGMENTS.TABLESPACE_NAME
Server Status (PD_STAT)
Function
The Server Status (PD_STAT) record stores performance data indicating thestatus of the Oracle database at a specific point in time.
Table 2-128 Server Status (PD_STAT) Default and Changeable Values
Item Default Value Changeable?
Collection Interval 60 Yes
Collection Offset 0
Log No
LOGIF (Blank)
Key Fields
None
2-252 Working with RecordsHitachi Tuning Manager Application Reports Reference
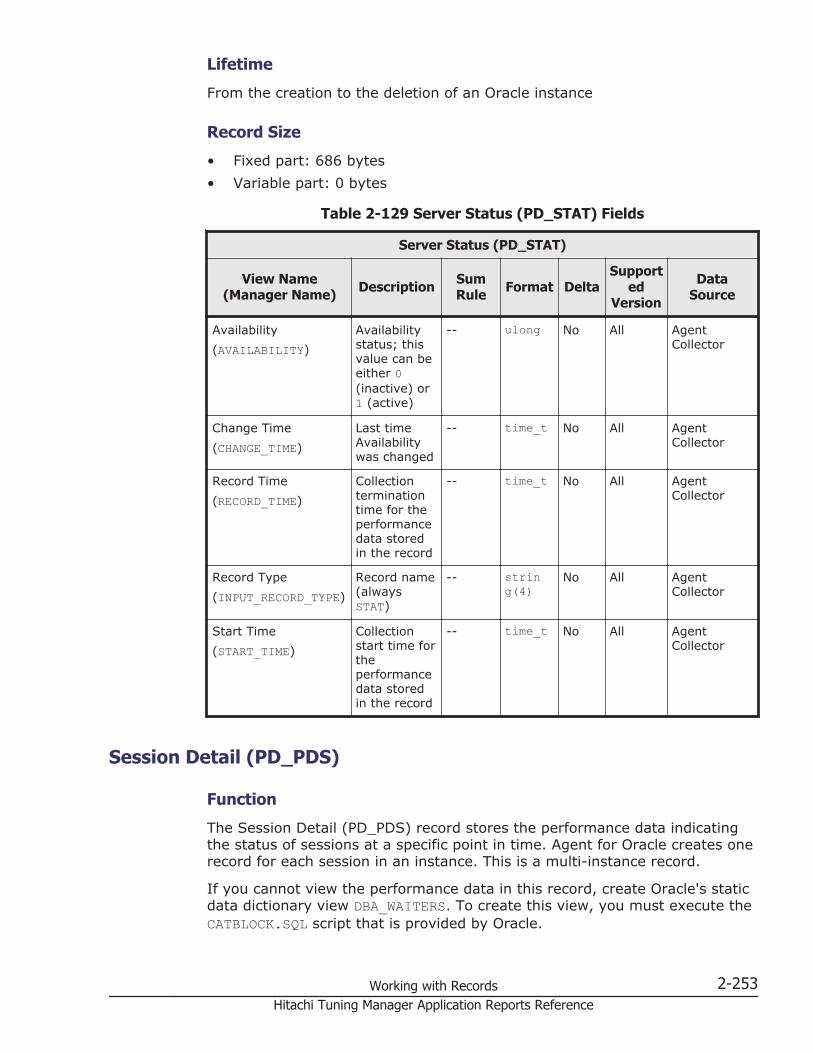
Lifetime
From the creation to the deletion of an Oracle instance
Record Size
• Fixed part: 686 bytes• Variable part: 0 bytes
Table 2-129 Server Status (PD_STAT) Fields
Server Status (PD_STAT)
View Name(Manager Name) Description Sum
Rule Format DeltaSupport
edVersion
DataSource
Availability(AVAILABILITY)
Availabilitystatus; thisvalue can beeither 0(inactive) or1 (active)
-- ulong No All AgentCollector
Change Time(CHANGE_TIME)
Last timeAvailabilitywas changed
-- time_t No All AgentCollector
Record Time(RECORD_TIME)
Collectionterminationtime for theperformancedata storedin the record
-- time_t No All AgentCollector
Record Type(INPUT_RECORD_TYPE)
Record name(alwaysSTAT)
-- string(4)
No All AgentCollector
Start Time(START_TIME)
Collectionstart time fortheperformancedata storedin the record
-- time_t No All AgentCollector
Session Detail (PD_PDS)
Function
The Session Detail (PD_PDS) record stores the performance data indicatingthe status of sessions at a specific point in time. Agent for Oracle creates onerecord for each session in an instance. This is a multi-instance record.
If you cannot view the performance data in this record, create Oracle's staticdata dictionary view DBA_WAITERS. To create this view, you must execute theCATBLOCK.SQL script that is provided by Oracle.
Working with Records 2-253Hitachi Tuning Manager Application Reports Reference

Table 2-130 Session Detail (PD_PDS) Default and Changeable Values
Item Default Value Changeable?
Collection Interval 600 Yes
Collection Offset 100
Log No
LOGIF (Blank)
Key Fields
• SID (SID)• Serial # (SERIAL_NUM)
Lifetime
From the start to the end of a session
Record Size
• Fixed part: 678 bytes• Variable part: 725 bytes
Table 2-131 Session Detail (PD_PDS) Fields
Session Detail (PD_PDS)
View Name(Manager Name) Description Sum
Rule Format DeltaSupport
edVersion
DataSource
Action(ACTION)
Name of theaction that isspecified bycalling theDBMS_APPLICATION_INFO.SET_ACTIONprocedureduring datacollection
-- string(32)
No All V$SESSION.ACTION
Addrhash(ADDRHASH)
Characterstring thatidentifies theSQLstatementbeingexecuted
-- string(38)
No All V$SESSION.SQL_ADDRESS +V$SESSION.SQL_HASH_VALUE
Auditing SID(AUDSID)
Auditingsession ID.
-- ulong No All V$SESSION.AUDSID
2-254 Working with RecordsHitachi Tuning Manager Application Reports Reference

Session Detail (PD_PDS)
View Name(Manager Name) Description Sum
Rule Format DeltaSupport
edVersion
DataSource
The value ofthis field is-1 whenOracleDatabase10g is beingmonitored orwhen thevalue of theUser field isSYS.
Avg Wait(AVERAGE_WAIT)
Average timeof all eventsthe session iswaiting for inhundredthsof a second(to collectthe value ofthis field, theTIMED_STATISTICSparametermust be setto TRUE inthe init.orafile)
-- ulong No All AVG(V$SESSION_EVENT.AVERAGE_WAIT)
Avg Wait String(AVERAGE_WAIT_STRING)
Average time(characterstring) of allevents thesession iswaiting for inseconds (tocollect thevalue of thisfield, theTIMED_STATISTICSparametermust be setto TRUE inthe init.orafile)
-- string(30)
No All AVG(V$SESSION_EVENT.AVERAGE_WAIT) /100
Blocking Locks(BLOCKING_LOCKS)
Number oflocksblockinganother lock
-- double No All COUNT(V$LOCK)where V$LOCK.BLOCK> 0
Working with Records 2-255Hitachi Tuning Manager Application Reports Reference

Session Detail (PD_PDS)
View Name(Manager Name) Description Sum
Rule Format DeltaSupport
edVersion
DataSource
Client Info(CLIENT_INFO)
Informationspecified bycalling theDBMS_APPLICATION_INFO.SET_CLIENT_INFOprocedure
-- string(64)
No All V$SESSION.CLIENT_INFO
Client PID(PROCESS)
OS's client ID -- string(12)
No All V$SESSION.PROCESS
Command(COMMAND)
Command orcommandnumberbeingexecuted
-- string(32)
No All V$SESSION.COMMAND
Fixed Table Sequence(FIXED_TABLE_SEQUENCE)
Value to beincreasedeach timethe sessioncompletes acall to thedatabase
-- double No All V$SESSION.FIXED_TABLE_SEQUENCE
Locks Held(LOCKS_HELD)
Number oflocks held bythe sessionduring datacollection
-- double No All COUNT(V$LOCKS)where V$LOCK.LMODEis NOT NULL
Locks Requested(LOCKS_REQUESTED)
Number oflocksrequestedbut that thesession wasnot holding
-- double No All COUNT(V$LOCKS)where V$LOCK.LMODEis NULL
Lockwait(LOCKWAIT)
Address ofthe lock thesession iswaiting for (ifthere is nosuch lock,the value isnull)
-- string(16)
No All V$SESSION.LOCKWAIT
Logon Seconds(LOGON_SECONDS)
Number ofsecondssince logon
-- ulong No All V$SESSION.LOGON_TIME
2-256 Working with RecordsHitachi Tuning Manager Application Reports Reference

Session Detail (PD_PDS)
View Name(Manager Name) Description Sum
Rule Format DeltaSupport
edVersion
DataSource
Logon Time(LOGON_TIME)
Sessionconnectiontime
-- string(20)
No All V$SESSION.LOGON_TIME
Machine(MACHINE)
OS's machinename
-- string(64)
No All V$SESSION.MACHINE
Module(MODULE)
Name of themodule beingexecutedthat isspecified bycalling theDBMS_APPLICATION_INFO.SET_MODULEprocedureduring datacollection
-- string(48)
No All V$SESSION.MODULE
Open Cursors(OPEN_CURSORS)
Number ofopen cursors
-- ulong No All COUNT(V$OPEN_CURSORS)
Oracle PID(PID)
Oracleprocess ID
-- ulong No All V$PROCESS.PID where V$SESSION.PADDR = V$PROCESS.ADDR
Oracle Server(SERVER)
Oracle servertype. Validvalues areDEDICATED,NONE,PSEUDO, andSHARED
-- string(9)
No All V$SESSION.SERVER
OS User(OSUSER)
OS's clientuser name
-- string(30)
No All V$SESSION.OSUSER
Program(PROGRAM)
OS'sprogramname
-- string(64)
No All V$SESSION.PROGRAM
Record Time(RECORD_TIME)
Collectionterminationtime for theperformancedata storedin the record
-- time_t No All AgentCollector
Working with Records 2-257Hitachi Tuning Manager Application Reports Reference
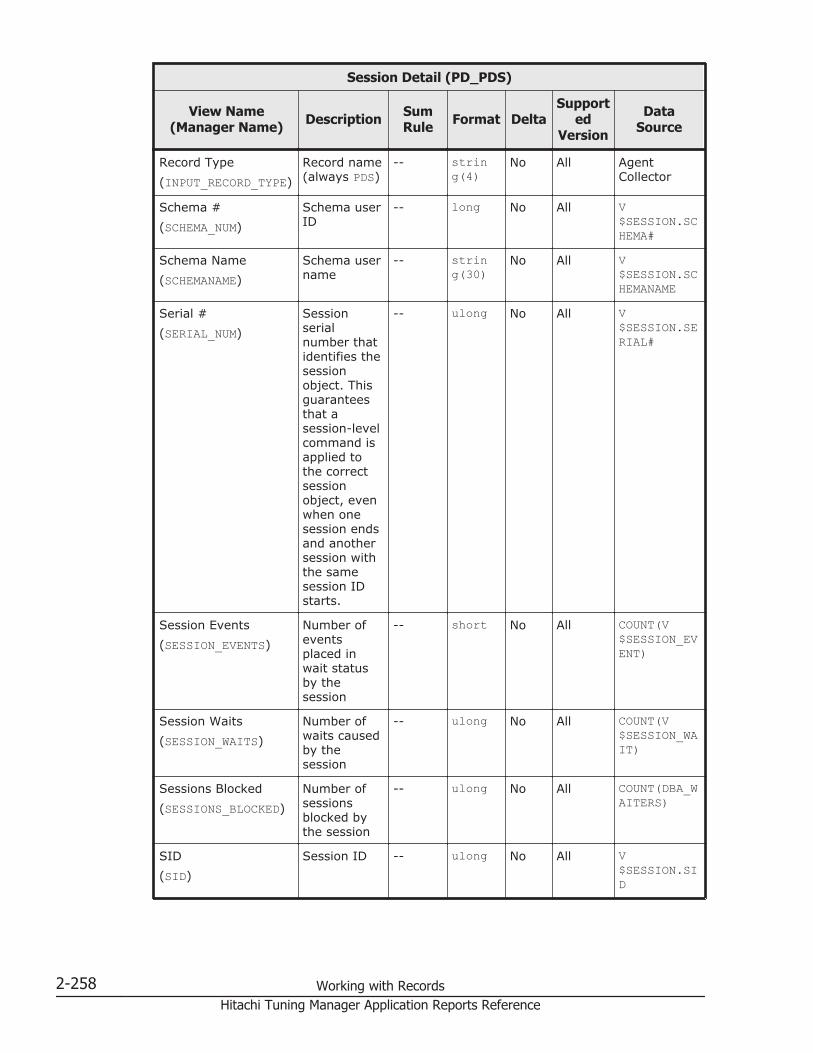
Session Detail (PD_PDS)
View Name(Manager Name) Description Sum
Rule Format DeltaSupport
edVersion
DataSource
Record Type(INPUT_RECORD_TYPE)
Record name(always PDS)
-- string(4)
No All AgentCollector
Schema #(SCHEMA_NUM)
Schema userID
-- long No All V$SESSION.SCHEMA#
Schema Name(SCHEMANAME)
Schema username
-- string(30)
No All V$SESSION.SCHEMANAME
Serial #(SERIAL_NUM)
Sessionserialnumber thatidentifies thesessionobject. Thisguaranteesthat asession-levelcommand isapplied tothe correctsessionobject, evenwhen onesession endsand anothersession withthe samesession IDstarts.
-- ulong No All V$SESSION.SERIAL#
Session Events(SESSION_EVENTS)
Number ofeventsplaced inwait statusby thesession
-- short No All COUNT(V$SESSION_EVENT)
Session Waits(SESSION_WAITS)
Number ofwaits causedby thesession
-- ulong No All COUNT(V$SESSION_WAIT)
Sessions Blocked(SESSIONS_BLOCKED)
Number ofsessionsblocked bythe session
-- ulong No All COUNT(DBA_WAITERS)
SID(SID)
Session ID -- ulong No All V$SESSION.SID
2-258 Working with RecordsHitachi Tuning Manager Application Reports Reference
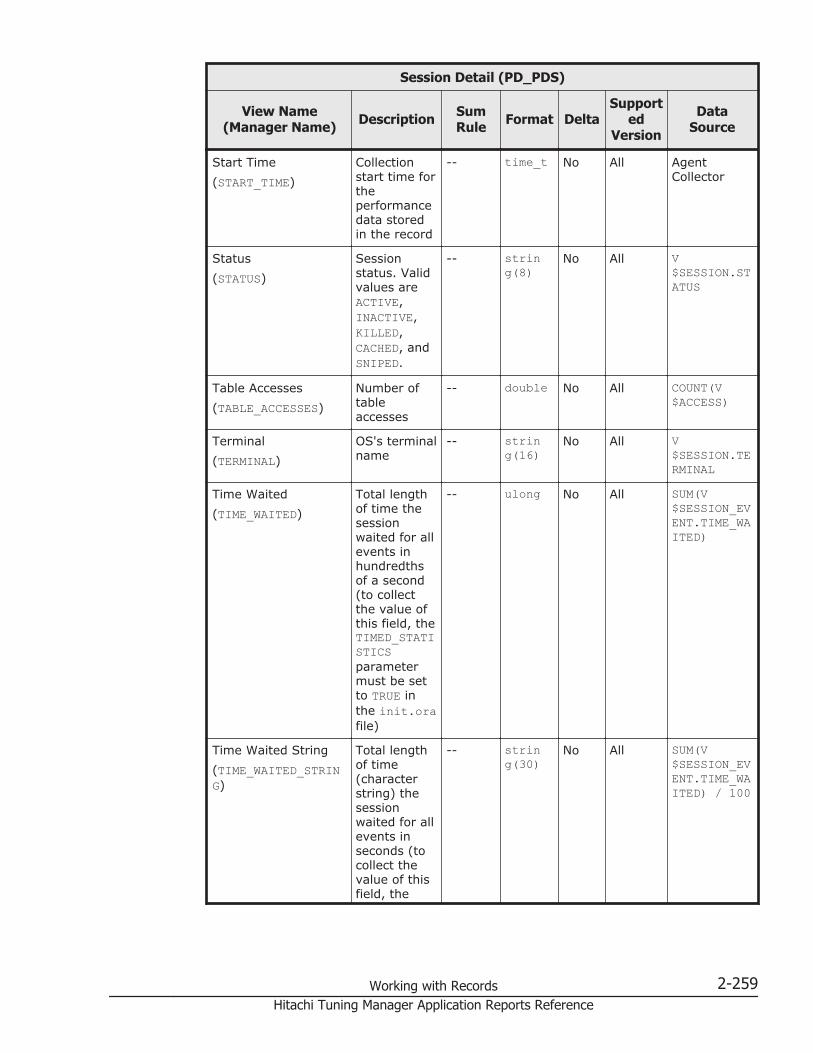
Session Detail (PD_PDS)
View Name(Manager Name) Description Sum
Rule Format DeltaSupport
edVersion
DataSource
Start Time(START_TIME)
Collectionstart time fortheperformancedata storedin the record
-- time_t No All AgentCollector
Status(STATUS)
Sessionstatus. Validvalues areACTIVE,INACTIVE,KILLED,CACHED, andSNIPED.
-- string(8)
No All V$SESSION.STATUS
Table Accesses(TABLE_ACCESSES)
Number oftableaccesses
-- double No All COUNT(V$ACCESS)
Terminal(TERMINAL)
OS's terminalname
-- string(16)
No All V$SESSION.TERMINAL
Time Waited(TIME_WAITED)
Total lengthof time thesessionwaited for allevents inhundredthsof a second(to collectthe value ofthis field, theTIMED_STATISTICSparametermust be setto TRUE inthe init.orafile)
-- ulong No All SUM(V$SESSION_EVENT.TIME_WAITED)
Time Waited String(TIME_WAITED_STRING)
Total lengthof time(characterstring) thesessionwaited for allevents inseconds (tocollect thevalue of thisfield, the
-- string(30)
No All SUM(V$SESSION_EVENT.TIME_WAITED) / 100
Working with Records 2-259Hitachi Tuning Manager Application Reports Reference

Session Detail (PD_PDS)
View Name(Manager Name) Description Sum
Rule Format DeltaSupport
edVersion
DataSource
TIMED_STATISTICSparametermust be setto TRUE inthe init.orafile)
Total Timeouts(TOTAL_TIMEOUTS)
Total numberof timeoutsfor thesessionevents
-- ulong No All SUM(V$SESSION_EVENT.TOTAL_TIMEOUTS)
Total Waits(TOTAL_WAITS)
Number ofwaits for allevents of thesession
-- double No All SUM(V$SESSION_EVENT.TOTAL_WAITS)
Transaction Address(TRANSACTION_ADDRESS)
Address ofthetransactionstate object
-- string(16)
No All V$SESSION.TADDR
Transactions(TRANSACTIONS)
Number ofactivetransactions
-- ulong No All COUNT(V$TRANSACTION)
Type(TYPE)
Session type -- string(10)
No All V$SESSION.TYPE
User(USERNAME)
Oracle usernameThis fieldalwaysincludes arecord forwhich NULLis specifiedasinformationfor the SYSuser.BecauseNULL cannotbe specifiedconditionallyforconnectionsfrom usersother thanspecial userA, use theUser # field
-- string(30)
No All V$SESSION.USERNAME
2-260 Working with RecordsHitachi Tuning Manager Application Reports Reference
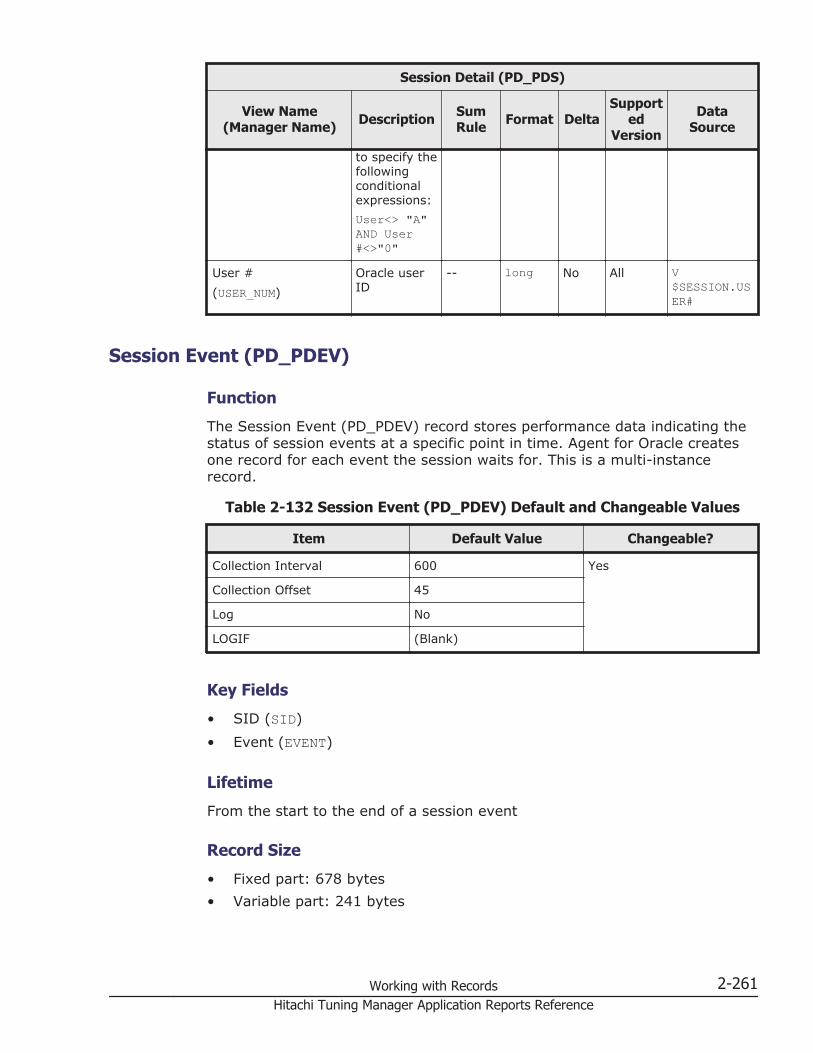
Session Detail (PD_PDS)
View Name(Manager Name) Description Sum
Rule Format DeltaSupport
edVersion
DataSource
to specify thefollowingconditionalexpressions:User<> "A"AND User#<>"0"
User #(USER_NUM)
Oracle userID
-- long No All V$SESSION.USER#
Session Event (PD_PDEV)
Function
The Session Event (PD_PDEV) record stores performance data indicating thestatus of session events at a specific point in time. Agent for Oracle createsone record for each event the session waits for. This is a multi-instancerecord.
Table 2-132 Session Event (PD_PDEV) Default and Changeable Values
Item Default Value Changeable?
Collection Interval 600 Yes
Collection Offset 45
Log No
LOGIF (Blank)
Key Fields
• SID (SID)• Event (EVENT)
Lifetime
From the start to the end of a session event
Record Size
• Fixed part: 678 bytes• Variable part: 241 bytes
Working with Records 2-261Hitachi Tuning Manager Application Reports Reference
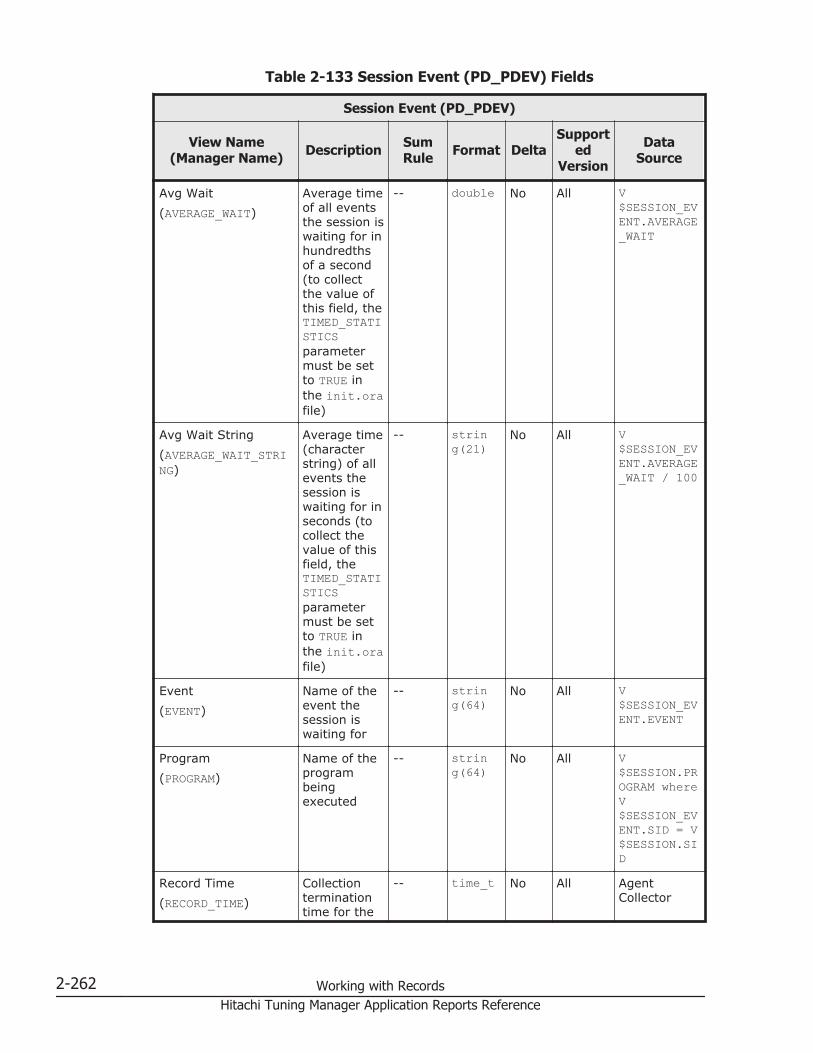
Table 2-133 Session Event (PD_PDEV) Fields
Session Event (PD_PDEV)
View Name(Manager Name) Description Sum
Rule Format DeltaSupport
edVersion
DataSource
Avg Wait(AVERAGE_WAIT)
Average timeof all eventsthe session iswaiting for inhundredthsof a second(to collectthe value ofthis field, theTIMED_STATISTICSparametermust be setto TRUE inthe init.orafile)
-- double No All V$SESSION_EVENT.AVERAGE_WAIT
Avg Wait String(AVERAGE_WAIT_STRING)
Average time(characterstring) of allevents thesession iswaiting for inseconds (tocollect thevalue of thisfield, theTIMED_STATISTICSparametermust be setto TRUE inthe init.orafile)
-- string(21)
No All V$SESSION_EVENT.AVERAGE_WAIT / 100
Event(EVENT)
Name of theevent thesession iswaiting for
-- string(64)
No All V$SESSION_EVENT.EVENT
Program(PROGRAM)
Name of theprogrambeingexecuted
-- string(64)
No All V$SESSION.PROGRAM whereV$SESSION_EVENT.SID = V$SESSION.SID
Record Time(RECORD_TIME)
Collectionterminationtime for the
-- time_t No All AgentCollector
2-262 Working with RecordsHitachi Tuning Manager Application Reports Reference

Session Event (PD_PDEV)
View Name(Manager Name) Description Sum
Rule Format DeltaSupport
edVersion
DataSource
performancedata storedin the record
Record Type(INPUT_RECORD_TYPE)
Record name(alwaysPDEV)
-- string(4)
No All AgentCollector
SID(SID)
Session ID -- ulong No All V$SESSION_EVENT.SID
Start Time(START_TIME)
Collectionstart time fortheperformancedata storedin the record
-- time_t No All AgentCollector
Time Waited(TIME_WAITED)
Total timethe sessionwas waitingfor events inhundredthsof a second(to collectthe value ofthis field, theTIMED_STATISTICSparametermust be setto TRUE inthe init.orafile)
-- double No All V$SESSION_EVENT.TIME_WAITED
Time Waited String(TIME_WAITED_STRING)
Total timethe sessionwas waitingfor events inseconds (tocollect thevalue of thisfield, theTIMED_STATISTICSparametermust be setto TRUE inthe init.orafile)
-- string(21)
No All V$SESSION_EVENT.TIME_WAITED / 100
Total Timeouts(TOTAL_TIMEOUTS)
Total numberof timeoutsfor the
-- double No All V$SESSION_EV
Working with Records 2-263Hitachi Tuning Manager Application Reports Reference
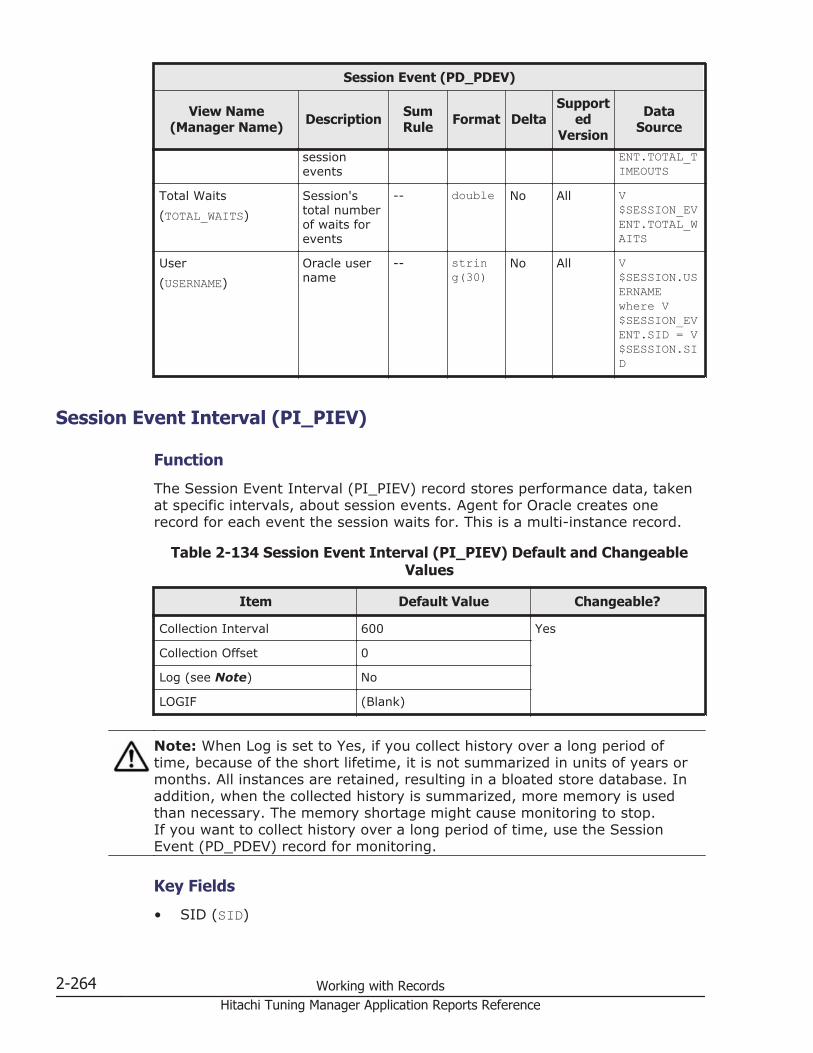
Session Event (PD_PDEV)
View Name(Manager Name) Description Sum
Rule Format DeltaSupport
edVersion
DataSource
sessionevents
ENT.TOTAL_TIMEOUTS
Total Waits(TOTAL_WAITS)
Session'stotal numberof waits forevents
-- double No All V$SESSION_EVENT.TOTAL_WAITS
User(USERNAME)
Oracle username
-- string(30)
No All V$SESSION.USERNAMEwhere V$SESSION_EVENT.SID = V$SESSION.SID
Session Event Interval (PI_PIEV)
Function
The Session Event Interval (PI_PIEV) record stores performance data, takenat specific intervals, about session events. Agent for Oracle creates onerecord for each event the session waits for. This is a multi-instance record.
Table 2-134 Session Event Interval (PI_PIEV) Default and ChangeableValues
Item Default Value Changeable?
Collection Interval 600 Yes
Collection Offset 0
Log (see Note) No
LOGIF (Blank)
Note: When Log is set to Yes, if you collect history over a long period oftime, because of the short lifetime, it is not summarized in units of years ormonths. All instances are retained, resulting in a bloated store database. Inaddition, when the collected history is summarized, more memory is usedthan necessary. The memory shortage might cause monitoring to stop.If you want to collect history over a long period of time, use the SessionEvent (PD_PDEV) record for monitoring.
Key Fields
• SID (SID)
2-264 Working with RecordsHitachi Tuning Manager Application Reports Reference

• Event (EVENT)
Lifetime
From the start to the end of a session event
Record Size
• Fixed part: 678 bytes• Variable part: 289 bytes
Table 2-135 Session Event Interval (PI_PIEV) Fields
Session Event Interval (PI_PIEV)
View Name(Manager Name) Description Sum
Rule Format DeltaSupport
edVersion
DataSource
Avg Wait(AVERAGE_WAIT)
Average timeof all eventsthe session iswaiting for inhundredthsof a second(to collectthe value ofthis field, theTIMED_STATISTICSparametermust be setto TRUE inthe init.orafile)
AVG double No All V$SESSION_EVENT.AVERAGE_WAIT
Avg Wait String(AVERAGE_WAIT_STRING)
Average time(characterstring) of allevents thesession iswaiting for inseconds (tocollect thevalue of thisfield, theTIMED_STATISTICSparametermust be setto TRUE inthe init.orafile)
COPY string(21)
No All V$SESSION_EVENT.AVERAGE_WAIT / 100
Event(EVENT)
Name of theevent thesession iswaiting for
COPY string(64)
No All V$SESSION_EVENT.EVENT
Working with Records 2-265Hitachi Tuning Manager Application Reports Reference

Session Event Interval (PI_PIEV)
View Name(Manager Name) Description Sum
Rule Format DeltaSupport
edVersion
DataSource
Program(PROGRAM)
Name of theprogrambeingexecuted
COPY string(64)
No All V$SESSION.PROGRAM whereV$SESSION_EVENT.SID = V$SESSION.SID
Record Time(RECORD_TIME)
Collectionterminationtime for theperformancedata storedin the record
COPY time_t No All AgentCollector
Record Type(INPUT_RECORD_TYPE)
Record name(alwaysPIEV)
COPY string(4)
No All AgentCollector
SID(SID)
Session ID COPY ulong No All V$SESSION_EVENT.SID
Start Time(START_TIME)
Collectionstart time fortheperformancedata storedin the record
COPY time_t No All AgentCollector
Time Waited(TIME_WAITED)
Total timethe sessionwas waitingfor event inhundredthsof a second(to collectthe value ofthis field, theTIMED_STATISTICSparametermust be setto TRUE inthe init.orafile)
AVG double Yes All V$SESSION_EVENT.TIME_WAITED
Time Waited String(TIME_WAITED_STRING)
Total timethe sessionwas waitingfor event inseconds (tocollect thevalue of this
COPY string(21)
No All V$SESSION_EVENT.TIME_WAITED / 100
2-266 Working with RecordsHitachi Tuning Manager Application Reports Reference
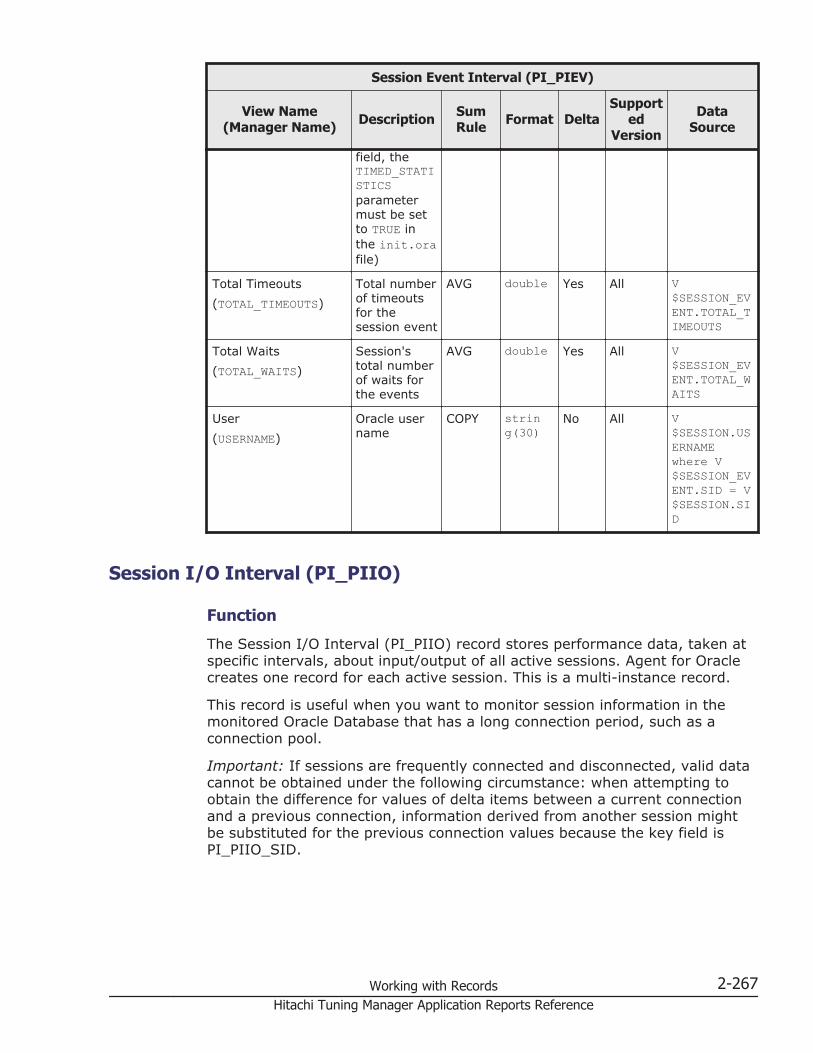
Session Event Interval (PI_PIEV)
View Name(Manager Name) Description Sum
Rule Format DeltaSupport
edVersion
DataSource
field, theTIMED_STATISTICSparametermust be setto TRUE inthe init.orafile)
Total Timeouts(TOTAL_TIMEOUTS)
Total numberof timeoutsfor thesession event
AVG double Yes All V$SESSION_EVENT.TOTAL_TIMEOUTS
Total Waits(TOTAL_WAITS)
Session'stotal numberof waits forthe events
AVG double Yes All V$SESSION_EVENT.TOTAL_WAITS
User(USERNAME)
Oracle username
COPY string(30)
No All V$SESSION.USERNAMEwhere V$SESSION_EVENT.SID = V$SESSION.SID
Session I/O Interval (PI_PIIO)
Function
The Session I/O Interval (PI_PIIO) record stores performance data, taken atspecific intervals, about input/output of all active sessions. Agent for Oraclecreates one record for each active session. This is a multi-instance record.
This record is useful when you want to monitor session information in themonitored Oracle Database that has a long connection period, such as aconnection pool.
Important: If sessions are frequently connected and disconnected, valid datacannot be obtained under the following circumstance: when attempting toobtain the difference for values of delta items between a current connectionand a previous connection, information derived from another session mightbe substituted for the previous connection values because the key field isPI_PIIO_SID.
Working with Records 2-267Hitachi Tuning Manager Application Reports Reference
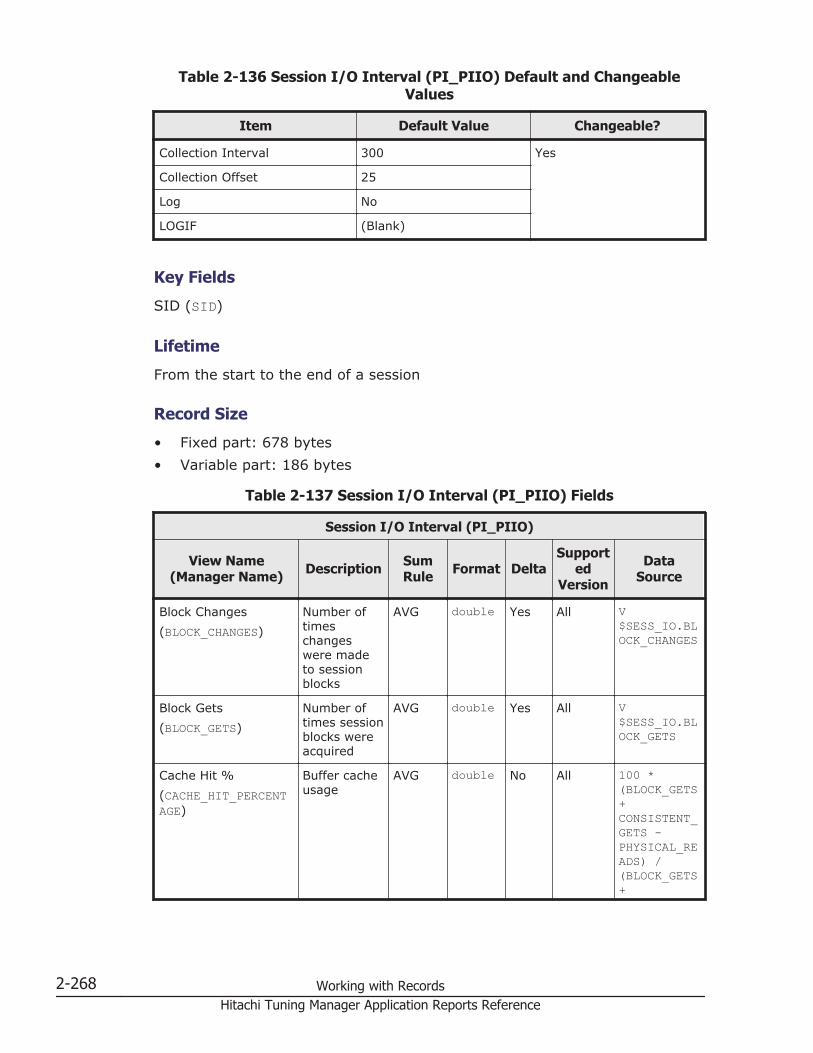
Table 2-136 Session I/O Interval (PI_PIIO) Default and ChangeableValues
Item Default Value Changeable?
Collection Interval 300 Yes
Collection Offset 25
Log No
LOGIF (Blank)
Key Fields
SID (SID)
Lifetime
From the start to the end of a session
Record Size
• Fixed part: 678 bytes• Variable part: 186 bytes
Table 2-137 Session I/O Interval (PI_PIIO) Fields
Session I/O Interval (PI_PIIO)
View Name(Manager Name) Description Sum
Rule Format DeltaSupport
edVersion
DataSource
Block Changes(BLOCK_CHANGES)
Number oftimeschangeswere madeto sessionblocks
AVG double Yes All V$SESS_IO.BLOCK_CHANGES
Block Gets(BLOCK_GETS)
Number oftimes sessionblocks wereacquired
AVG double Yes All V$SESS_IO.BLOCK_GETS
Cache Hit %(CACHE_HIT_PERCENTAGE)
Buffer cacheusage
AVG double No All 100 *(BLOCK_GETS+CONSISTENT_GETS -PHYSICAL_READS) /(BLOCK_GETS+
2-268 Working with RecordsHitachi Tuning Manager Application Reports Reference
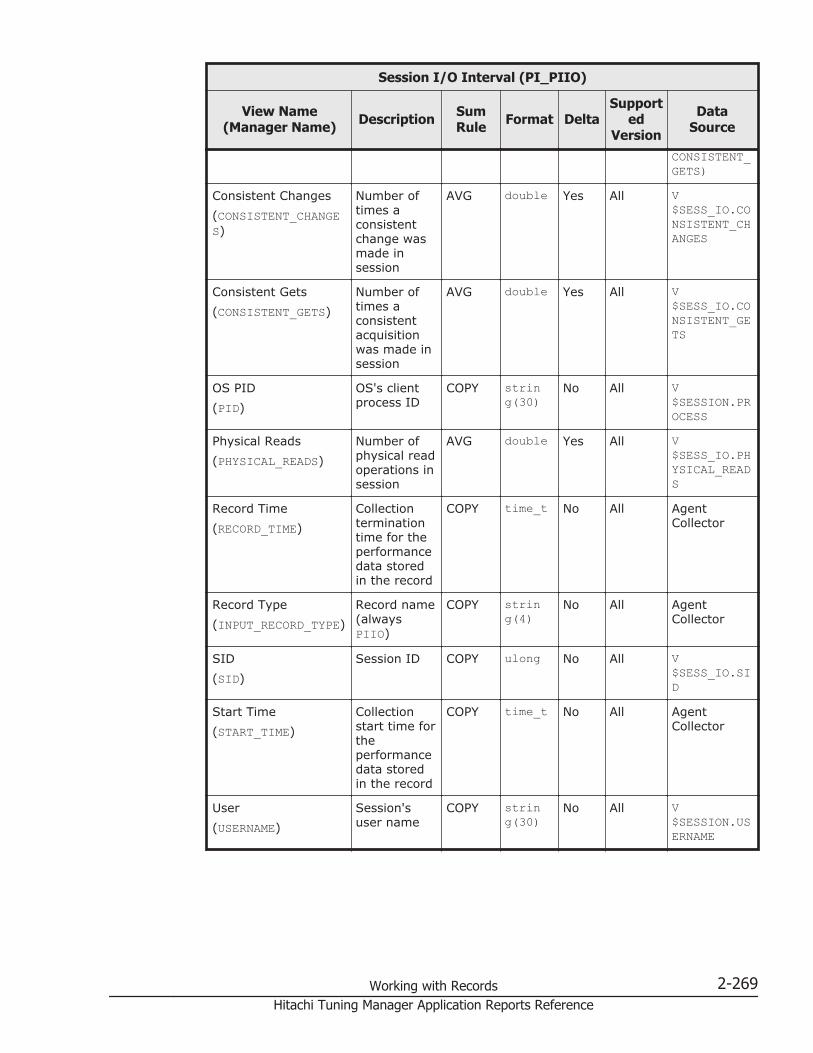
Session I/O Interval (PI_PIIO)
View Name(Manager Name) Description Sum
Rule Format DeltaSupport
edVersion
DataSource
CONSISTENT_GETS)
Consistent Changes(CONSISTENT_CHANGES)
Number oftimes aconsistentchange wasmade insession
AVG double Yes All V$SESS_IO.CONSISTENT_CHANGES
Consistent Gets(CONSISTENT_GETS)
Number oftimes aconsistentacquisitionwas made insession
AVG double Yes All V$SESS_IO.CONSISTENT_GETS
OS PID(PID)
OS's clientprocess ID
COPY string(30)
No All V$SESSION.PROCESS
Physical Reads(PHYSICAL_READS)
Number ofphysical readoperations insession
AVG double Yes All V$SESS_IO.PHYSICAL_READS
Record Time(RECORD_TIME)
Collectionterminationtime for theperformancedata storedin the record
COPY time_t No All AgentCollector
Record Type(INPUT_RECORD_TYPE)
Record name(alwaysPIIO)
COPY string(4)
No All AgentCollector
SID(SID)
Session ID COPY ulong No All V$SESS_IO.SID
Start Time(START_TIME)
Collectionstart time fortheperformancedata storedin the record
COPY time_t No All AgentCollector
User(USERNAME)
Session'suser name
COPY string(30)
No All V$SESSION.USERNAME
Working with Records 2-269Hitachi Tuning Manager Application Reports Reference
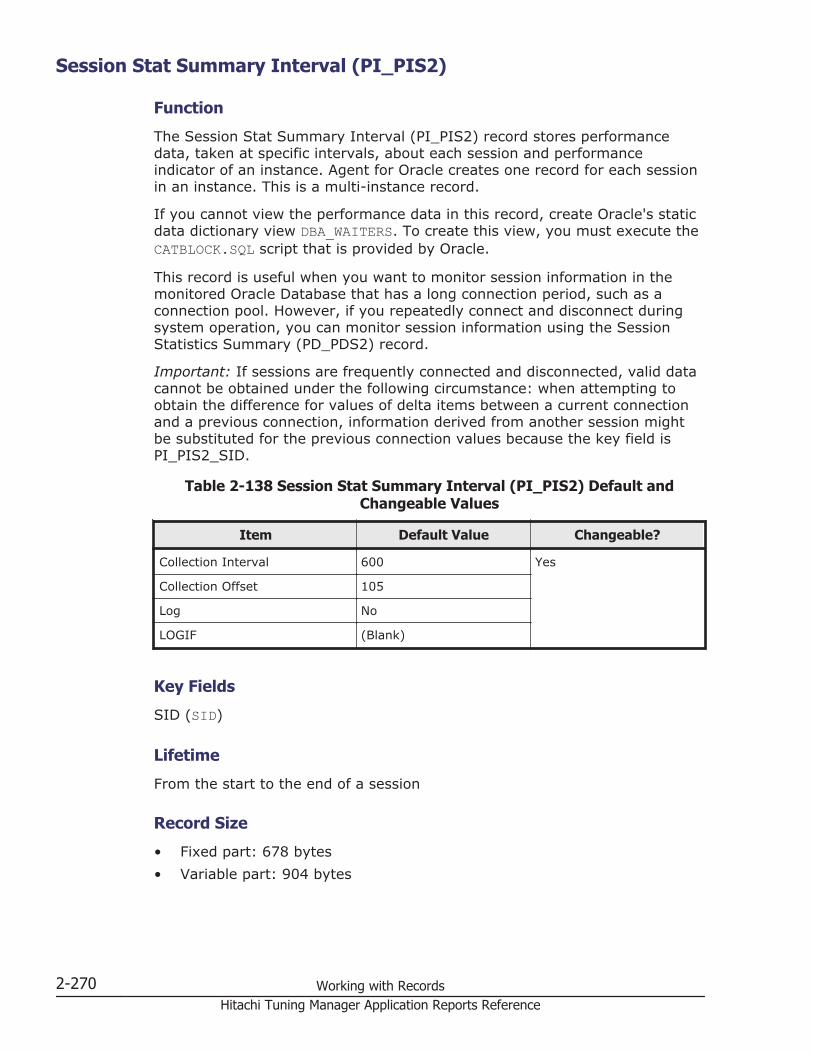
Session Stat Summary Interval (PI_PIS2)
Function
The Session Stat Summary Interval (PI_PIS2) record stores performancedata, taken at specific intervals, about each session and performanceindicator of an instance. Agent for Oracle creates one record for each sessionin an instance. This is a multi-instance record.
If you cannot view the performance data in this record, create Oracle's staticdata dictionary view DBA_WAITERS. To create this view, you must execute theCATBLOCK.SQL script that is provided by Oracle.
This record is useful when you want to monitor session information in themonitored Oracle Database that has a long connection period, such as aconnection pool. However, if you repeatedly connect and disconnect duringsystem operation, you can monitor session information using the SessionStatistics Summary (PD_PDS2) record.
Important: If sessions are frequently connected and disconnected, valid datacannot be obtained under the following circumstance: when attempting toobtain the difference for values of delta items between a current connectionand a previous connection, information derived from another session mightbe substituted for the previous connection values because the key field isPI_PIS2_SID.
Table 2-138 Session Stat Summary Interval (PI_PIS2) Default andChangeable Values
Item Default Value Changeable?
Collection Interval 600 Yes
Collection Offset 105
Log No
LOGIF (Blank)
Key Fields
SID (SID)
Lifetime
From the start to the end of a session
Record Size
• Fixed part: 678 bytes• Variable part: 904 bytes
2-270 Working with RecordsHitachi Tuning Manager Application Reports Reference
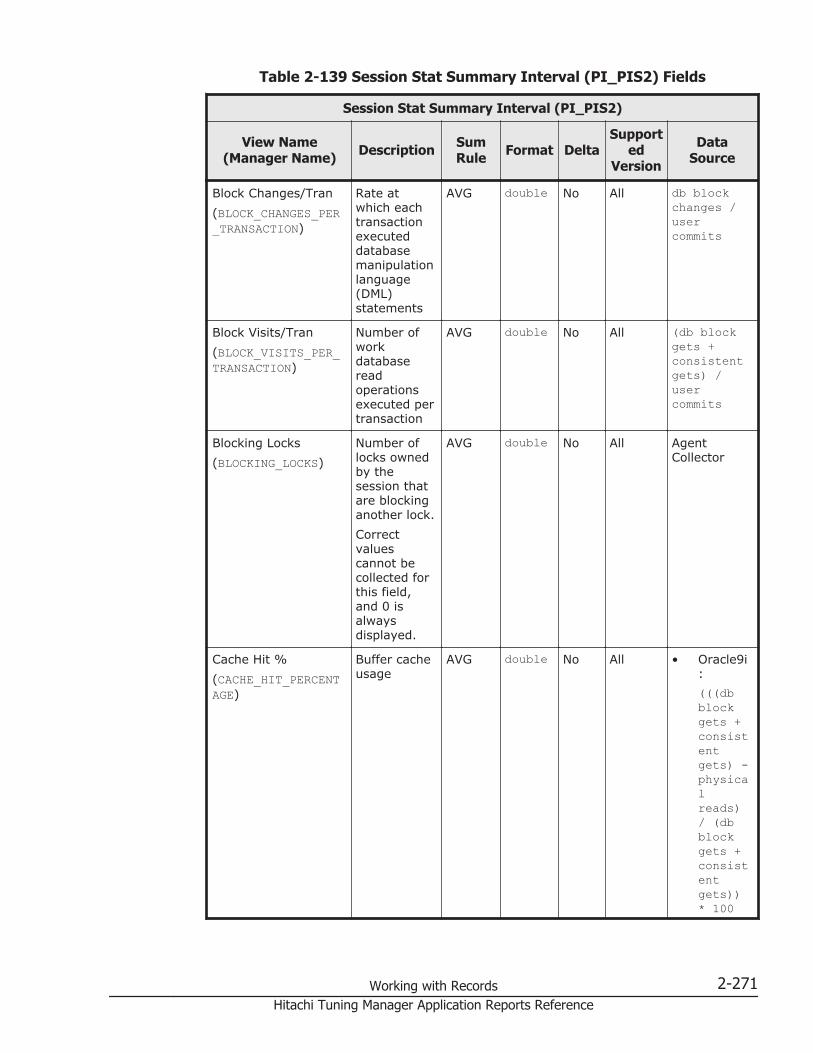
Table 2-139 Session Stat Summary Interval (PI_PIS2) Fields
Session Stat Summary Interval (PI_PIS2)
View Name(Manager Name) Description Sum
Rule Format DeltaSupport
edVersion
DataSource
Block Changes/Tran(BLOCK_CHANGES_PER_TRANSACTION)
Rate atwhich eachtransactionexecuteddatabasemanipulationlanguage(DML)statements
AVG double No All db blockchanges /usercommits
Block Visits/Tran(BLOCK_VISITS_PER_TRANSACTION)
Number ofworkdatabasereadoperationsexecuted pertransaction
AVG double No All (db blockgets +consistentgets) /usercommits
Blocking Locks(BLOCKING_LOCKS)
Number oflocks ownedby thesession thatare blockinganother lock.Correctvaluescannot becollected forthis field,and 0 isalwaysdisplayed.
AVG double No All AgentCollector
Cache Hit %(CACHE_HIT_PERCENTAGE)
Buffer cacheusage
AVG double No All • Oracle9i:(((dbblockgets +consistentgets) -physicalreads)/ (dbblockgets +consistentgets))* 100
Working with Records 2-271Hitachi Tuning Manager Application Reports Reference

Session Stat Summary Interval (PI_PIS2)
View Name(Manager Name) Description Sum
Rule Format DeltaSupport
edVersion
DataSource
• Oracle10g andlater:(1 -(physicalreadscache /(consistentgetsfromcache +dbblockgetsfromcache))) * 100
Calls/Tran(CALLS_PER_TRANSACTION)
Rate atwhich clientrequestswereexecuted pertransaction
AVG double No All usercalls /usercommits
Changed Block %(CHANGED_BLOCK_PERCENTAGE)
Ratio (as apercent) ofthe numberof queriesthat changedata(insertion,update, anddeletion) tothe numberof queries(search,insertion,update,deletion)executed onthe database
AVG double No All (db blockchanges /(block gets+consistentgets)) *100
Consistent Change %(CONSISTENT_CHANGE_PERCENTAGE)
Ratio (as apercent) ofthe numberof timesrollbackentries wereapplied tomaintainread
AVG double No All (consistentchanges /consistentgets) * 100
2-272 Working with RecordsHitachi Tuning Manager Application Reports Reference
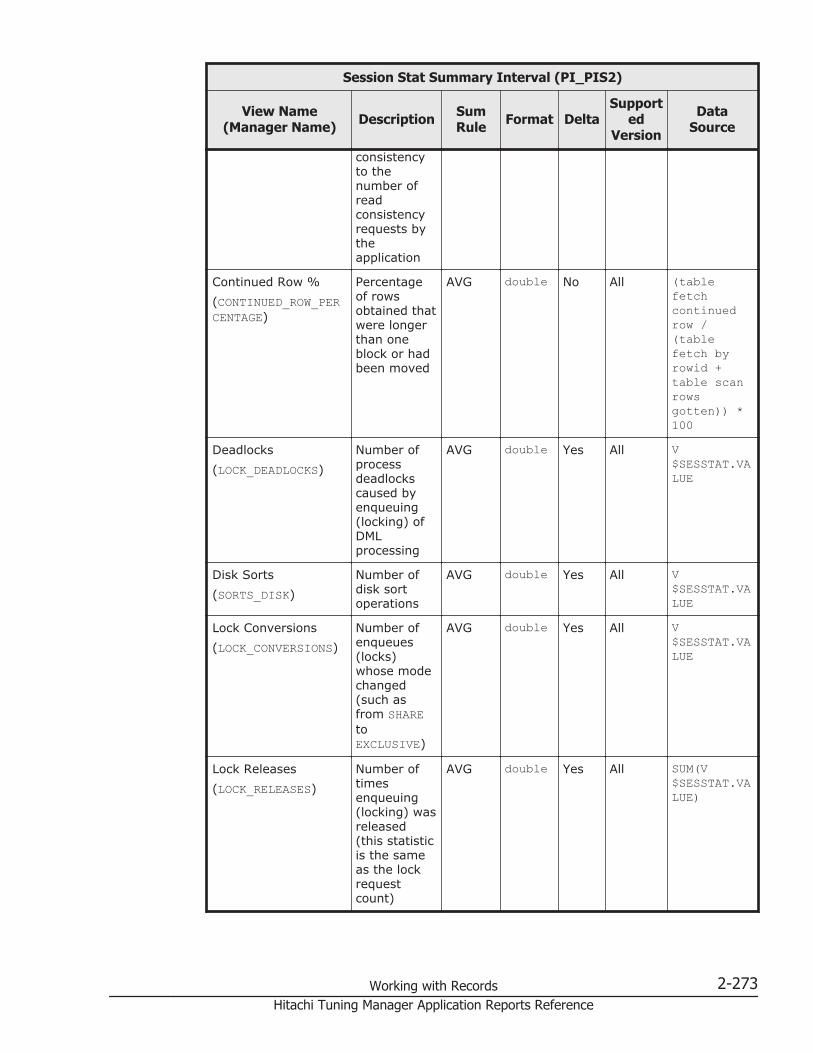
Session Stat Summary Interval (PI_PIS2)
View Name(Manager Name) Description Sum
Rule Format DeltaSupport
edVersion
DataSource
consistencyto thenumber ofreadconsistencyrequests bytheapplication
Continued Row %(CONTINUED_ROW_PERCENTAGE)
Percentageof rowsobtained thatwere longerthan oneblock or hadbeen moved
AVG double No All (tablefetchcontinuedrow /(tablefetch byrowid +table scanrowsgotten)) *100
Deadlocks(LOCK_DEADLOCKS)
Number ofprocessdeadlockscaused byenqueuing(locking) ofDMLprocessing
AVG double Yes All V$SESSTAT.VALUE
Disk Sorts(SORTS_DISK)
Number ofdisk sortoperations
AVG double Yes All V$SESSTAT.VALUE
Lock Conversions(LOCK_CONVERSIONS)
Number ofenqueues(locks)whose modechanged(such asfrom SHAREtoEXCLUSIVE)
AVG double Yes All V$SESSTAT.VALUE
Lock Releases(LOCK_RELEASES)
Number oftimesenqueuing(locking) wasreleased(this statisticis the sameas the lockrequestcount)
AVG double Yes All SUM(V$SESSTAT.VALUE)
Working with Records 2-273Hitachi Tuning Manager Application Reports Reference
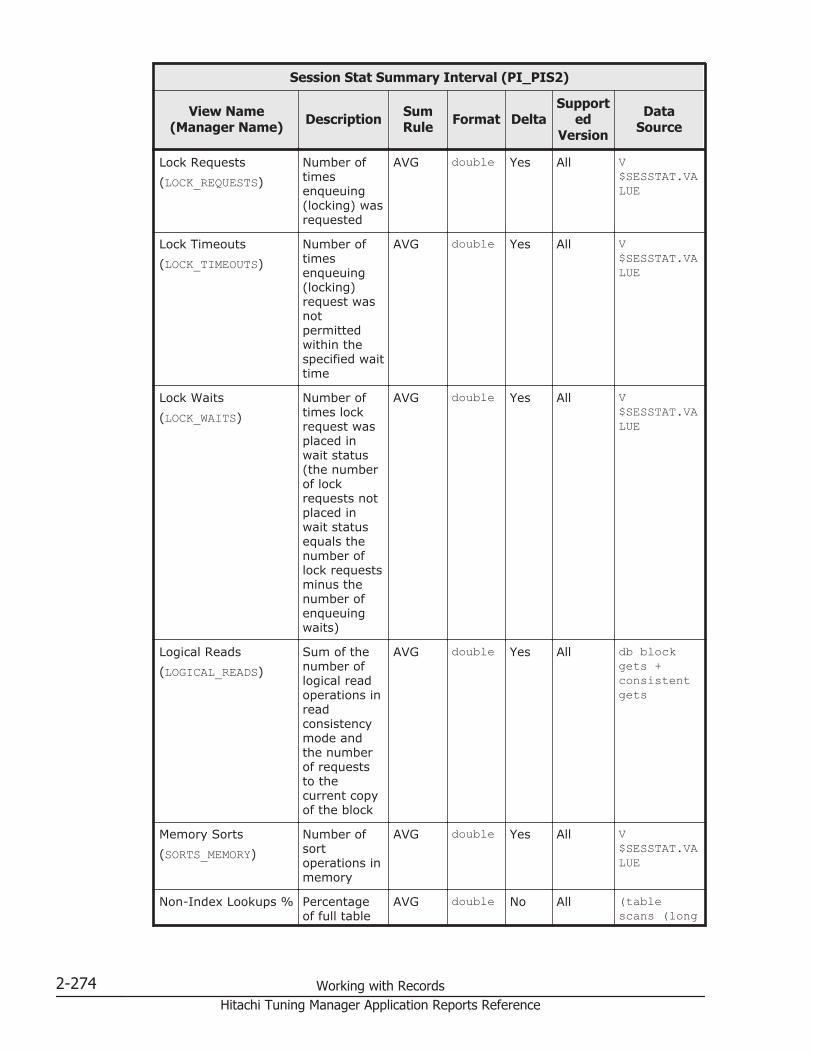
Session Stat Summary Interval (PI_PIS2)
View Name(Manager Name) Description Sum
Rule Format DeltaSupport
edVersion
DataSource
Lock Requests(LOCK_REQUESTS)
Number oftimesenqueuing(locking) wasrequested
AVG double Yes All V$SESSTAT.VALUE
Lock Timeouts(LOCK_TIMEOUTS)
Number oftimesenqueuing(locking)request wasnotpermittedwithin thespecified waittime
AVG double Yes All V$SESSTAT.VALUE
Lock Waits(LOCK_WAITS)
Number oftimes lockrequest wasplaced inwait status(the numberof lockrequests notplaced inwait statusequals thenumber oflock requestsminus thenumber ofenqueuingwaits)
AVG double Yes All V$SESSTAT.VALUE
Logical Reads(LOGICAL_READS)
Sum of thenumber oflogical readoperations inreadconsistencymode andthe numberof requeststo thecurrent copyof the block
AVG double Yes All db blockgets +consistentgets
Memory Sorts(SORTS_MEMORY)
Number ofsortoperations inmemory
AVG double Yes All V$SESSTAT.VALUE
Non-Index Lookups % Percentageof full table
AVG double No All (tablescans (long
2-274 Working with RecordsHitachi Tuning Manager Application Reports Reference
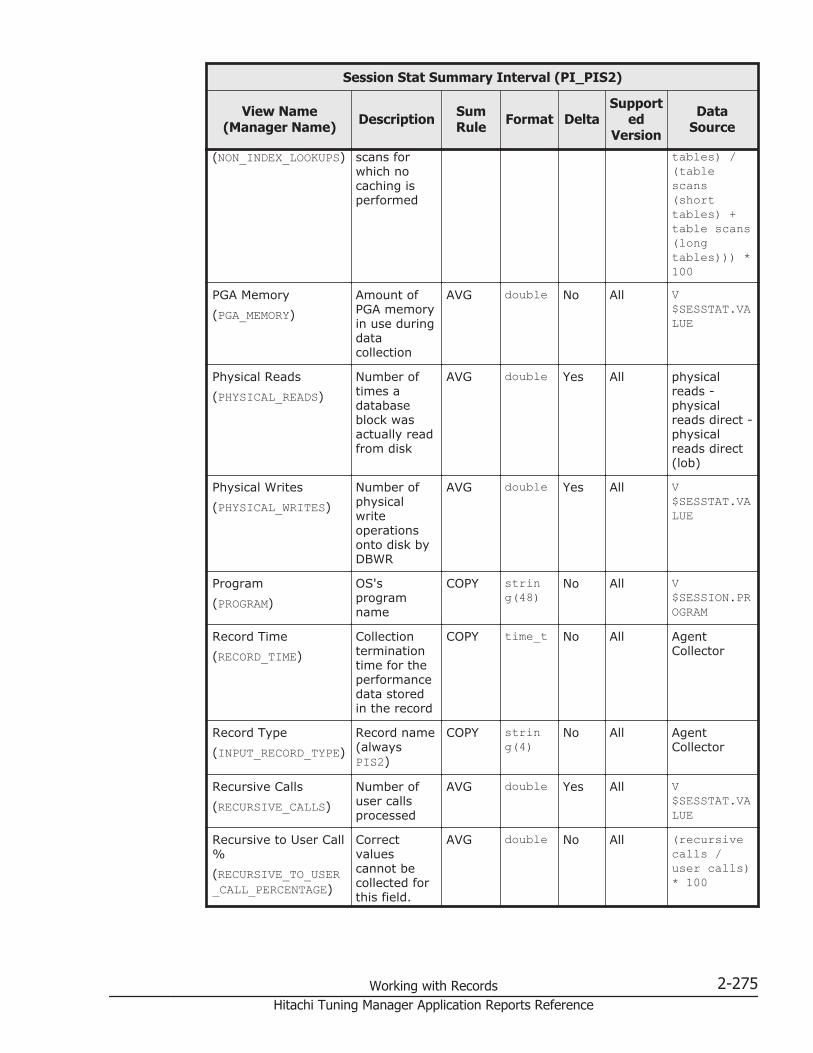
Session Stat Summary Interval (PI_PIS2)
View Name(Manager Name) Description Sum
Rule Format DeltaSupport
edVersion
DataSource
(NON_INDEX_LOOKUPS) scans forwhich nocaching isperformed
tables) /(tablescans(shorttables) +table scans(longtables))) *100
PGA Memory(PGA_MEMORY)
Amount ofPGA memoryin use duringdatacollection
AVG double No All V$SESSTAT.VALUE
Physical Reads(PHYSICAL_READS)
Number oftimes adatabaseblock wasactually readfrom disk
AVG double Yes All physicalreads -physicalreads direct -physicalreads direct(lob)
Physical Writes(PHYSICAL_WRITES)
Number ofphysicalwriteoperationsonto disk byDBWR
AVG double Yes All V$SESSTAT.VALUE
Program(PROGRAM)
OS'sprogramname
COPY string(48)
No All V$SESSION.PROGRAM
Record Time(RECORD_TIME)
Collectionterminationtime for theperformancedata storedin the record
COPY time_t No All AgentCollector
Record Type(INPUT_RECORD_TYPE)
Record name(alwaysPIS2)
COPY string(4)
No All AgentCollector
Recursive Calls(RECURSIVE_CALLS)
Number ofuser callsprocessed
AVG double Yes All V$SESSTAT.VALUE
Recursive to User Call%(RECURSIVE_TO_USER_CALL_PERCENTAGE)
Correctvaluescannot becollected forthis field.
AVG double No All (recursivecalls /user calls)* 100
Working with Records 2-275Hitachi Tuning Manager Application Reports Reference
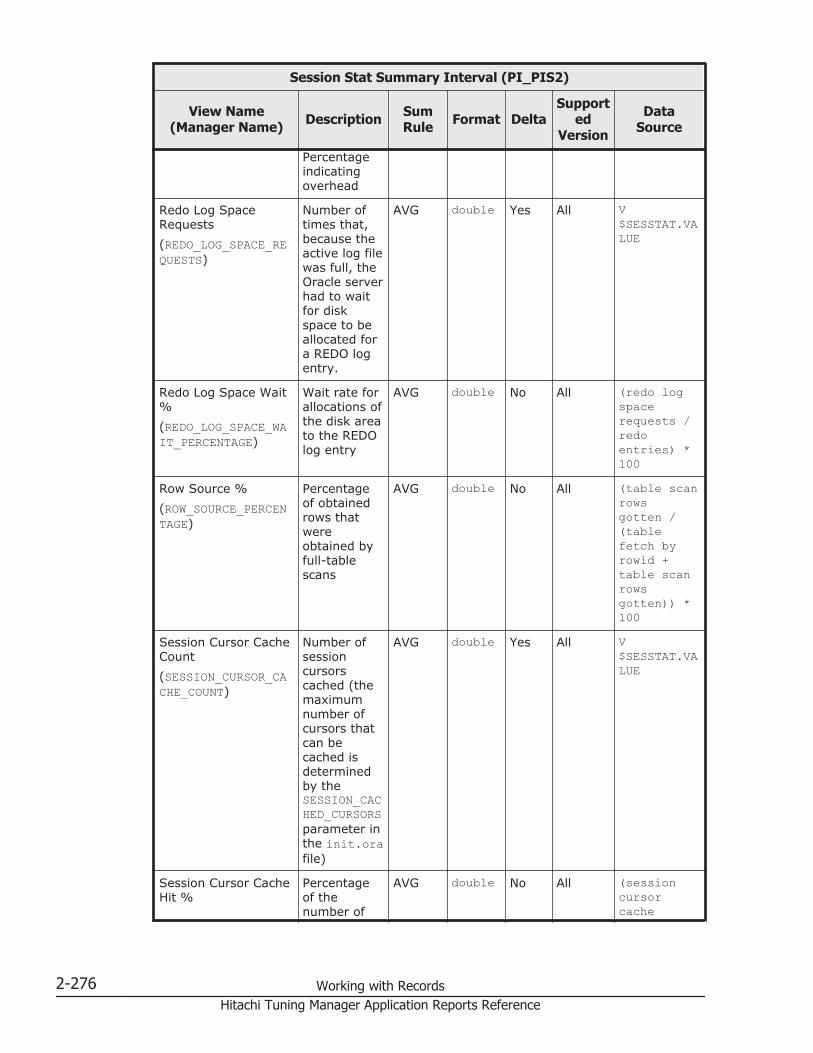
Session Stat Summary Interval (PI_PIS2)
View Name(Manager Name) Description Sum
Rule Format DeltaSupport
edVersion
DataSource
Percentageindicatingoverhead
Redo Log SpaceRequests(REDO_LOG_SPACE_REQUESTS)
Number oftimes that,because theactive log filewas full, theOracle serverhad to waitfor diskspace to beallocated fora REDO logentry.
AVG double Yes All V$SESSTAT.VALUE
Redo Log Space Wait%(REDO_LOG_SPACE_WAIT_PERCENTAGE)
Wait rate forallocations ofthe disk areato the REDOlog entry
AVG double No All (redo logspacerequests /redoentries) *100
Row Source %(ROW_SOURCE_PERCENTAGE)
Percentageof obtainedrows thatwereobtained byfull-tablescans
AVG double No All (table scanrowsgotten /(tablefetch byrowid +table scanrowsgotten)) *100
Session Cursor CacheCount(SESSION_CURSOR_CACHE_COUNT)
Number ofsessioncursorscached (themaximumnumber ofcursors thatcan becached isdeterminedby theSESSION_CACHED_CURSORSparameter inthe init.orafile)
AVG double Yes All V$SESSTAT.VALUE
Session Cursor CacheHit %
Percentageof thenumber of
AVG double No All (sessioncursorcache
2-276 Working with RecordsHitachi Tuning Manager Application Reports Reference

Session Stat Summary Interval (PI_PIS2)
View Name(Manager Name) Description Sum
Rule Format DeltaSupport
edVersion
DataSource
(SESSION_CURSOR_CACHE_HIT_PERCENTAGE)
sessioncursorsstored in thecache thatwere foundin the cacheafter anaccess wasmade
hits /sessioncursorcachecount) *100
Session Cursor CacheHits(SESSION_CURSOR_CACHE_HITS)
Recordedsessioncursor cachehit count
AVG double Yes All V$SESSTAT.VALUE
SID(SID)
Session ID COPY ulong No All V$SESSION.SID
Sort Overflow %(SORT_OVERFLOW_PERCENTAGE)
Percentageof sorts thatusedtemporarysegments
AVG double No All (sorts(disk) /(sorts(memory) +sorts(disk))) *100
SQL Net Bytes Rcvd(SQL_NET_BYTES_RECEIVED)
Number ofbytesreceivedfrom clientsvia SQL*Net
AVG double Yes All V$SESSTAT.VALUE
SQL Net Bytes Sent(SQL_NET_BYTES_SENT)
Number ofbytes sent toclients viaSQL*Net
AVG double Yes All V$SESSTAT.VALUE
Start Time(START_TIME)
Collectionstart time fortheperformancedata storedin the record
COPY time_t No All AgentCollector
Statement CPU(STATEMENT_CPU)
Total CPUtime used byactivestatementsduring datacollection inhundredthsof a second(to collect
AVG double Yes All V$SESSTAT.VALUE
Working with Records 2-277Hitachi Tuning Manager Application Reports Reference

Session Stat Summary Interval (PI_PIS2)
View Name(Manager Name) Description Sum
Rule Format DeltaSupport
edVersion
DataSource
the value ofthis field, theTIMED_STATISTICSparametermust be setto TRUE inthe init.orafile)
UGA Memory(UGA_MEMORY)
Number ofmemorysegmentsused
AVG double No All V$SESSTAT.VALUE
User(USERNAME)
Oracle username
COPY string(30)
No All V$SESSION.USERNAME
User Calls(USER_CALLS)
Number ofuser callsprocessed
AVG double Yes All V$SESSTAT.VALUE
User Calls / Parse(USER_CALLS_PER_PARSE)
Percentageindicatinghow well theapplication ismanagingthe contextarea
AVG double No All usercalls /parse count(total)
User Commits(USER_COMMITS)
Number oftransactions
AVG double Yes All V$SESSTAT.VALUE
User Rollback %(USER_ROLLBACK_PERCENTAGE)
Percentageof applicationtransactionsthat failed(were rolledback)
AVG double No All (userrollbacks /(usercommits +userrollbacks))* 100
User Rollbacks(USER_ROLLBACKS)
Number ofrollbacks
AVG double Yes All V$SESSTAT.VALUE
Waiting Locks(WAITING_LOCKS)
Number oflocks ownedby anothersession thatthis sessionis waitingfor.Correctvalues
AVG double No All --
2-278 Working with RecordsHitachi Tuning Manager Application Reports Reference
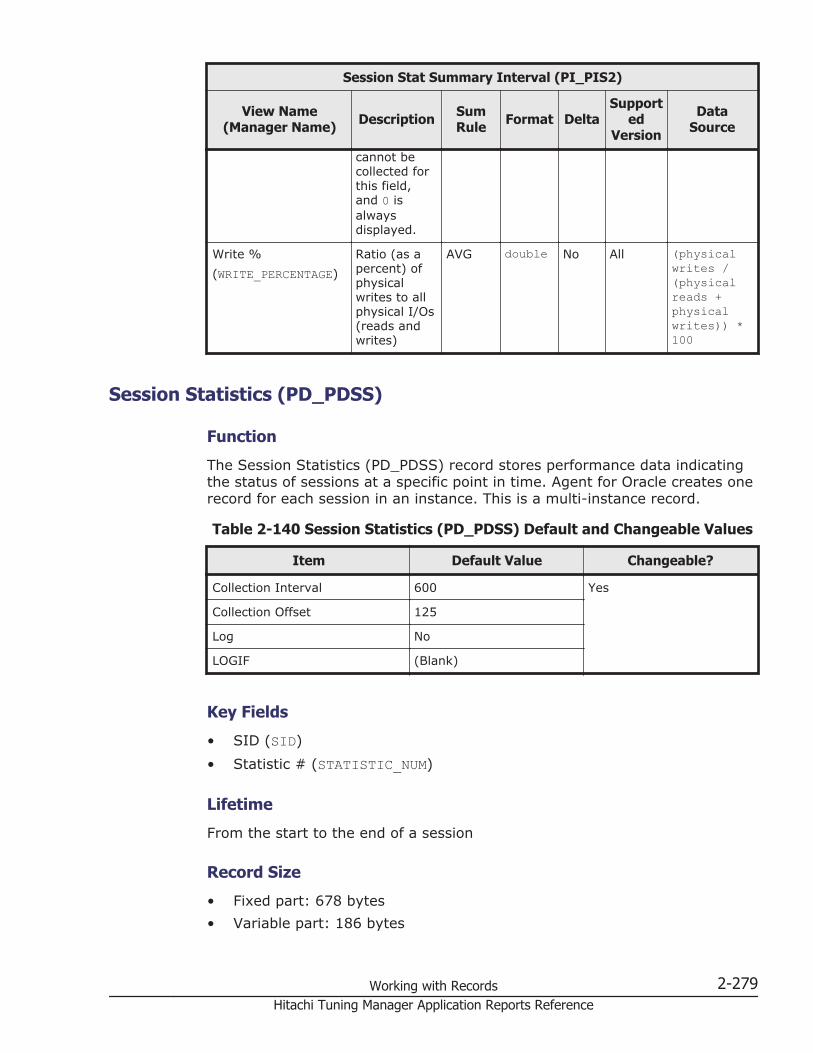
Session Stat Summary Interval (PI_PIS2)
View Name(Manager Name) Description Sum
Rule Format DeltaSupport
edVersion
DataSource
cannot becollected forthis field,and 0 isalwaysdisplayed.
Write %(WRITE_PERCENTAGE)
Ratio (as apercent) ofphysicalwrites to allphysical I/Os(reads andwrites)
AVG double No All (physicalwrites /(physicalreads +physicalwrites)) *100
Session Statistics (PD_PDSS)
Function
The Session Statistics (PD_PDSS) record stores performance data indicatingthe status of sessions at a specific point in time. Agent for Oracle creates onerecord for each session in an instance. This is a multi-instance record.
Table 2-140 Session Statistics (PD_PDSS) Default and Changeable Values
Item Default Value Changeable?
Collection Interval 600 Yes
Collection Offset 125
Log No
LOGIF (Blank)
Key Fields
• SID (SID)• Statistic # (STATISTIC_NUM)
Lifetime
From the start to the end of a session
Record Size
• Fixed part: 678 bytes• Variable part: 186 bytes
Working with Records 2-279Hitachi Tuning Manager Application Reports Reference

Table 2-141 Session Statistics (PD_PDSS) Fields
Session Statistics (PD_PDSS)
View Name(Manager Name) Description Sum
Rule Format DeltaSupport
edVersion
DataSource
Class(CLASS)
Statistic class -- string(20)
No All V$STATNAME.CLASS whereV$SESSTAT.STATISTIC# =V$STATNAME.STATISTIC#
Program(PROGRAM)
Name of theprogrambeingexecuted
-- string(48)
No All V$SESSION.PROGRAM whereV$SESSTAT.SID = V$SESSION.SID
Record Time(RECORD_TIME)
Collectionterminationtime for theperformancedata storedin the record
-- time_t No All AgentCollector
Record Type(INPUT_RECORD_TYPE)
Record name(alwaysPDSS)
-- string(4)
No All AgentCollector
SID(SID)
Session ID -- ulong No All V$SESSTAT.SID
Start Time(START_TIME)
Collectionstart time fortheperformancedata storedin the record
-- time_t No All AgentCollector
Statistic #(STATISTIC_NUM)
Statisticnumber
-- double No All V$SESSTAT.STATISTIC#
Statistic Name(NAME)
Statisticname
-- string(64)
No All V$STATNAME.NAME where V$SESSTAT.STATISTIC# =V$STATNAME.STATISTIC#
2-280 Working with RecordsHitachi Tuning Manager Application Reports Reference
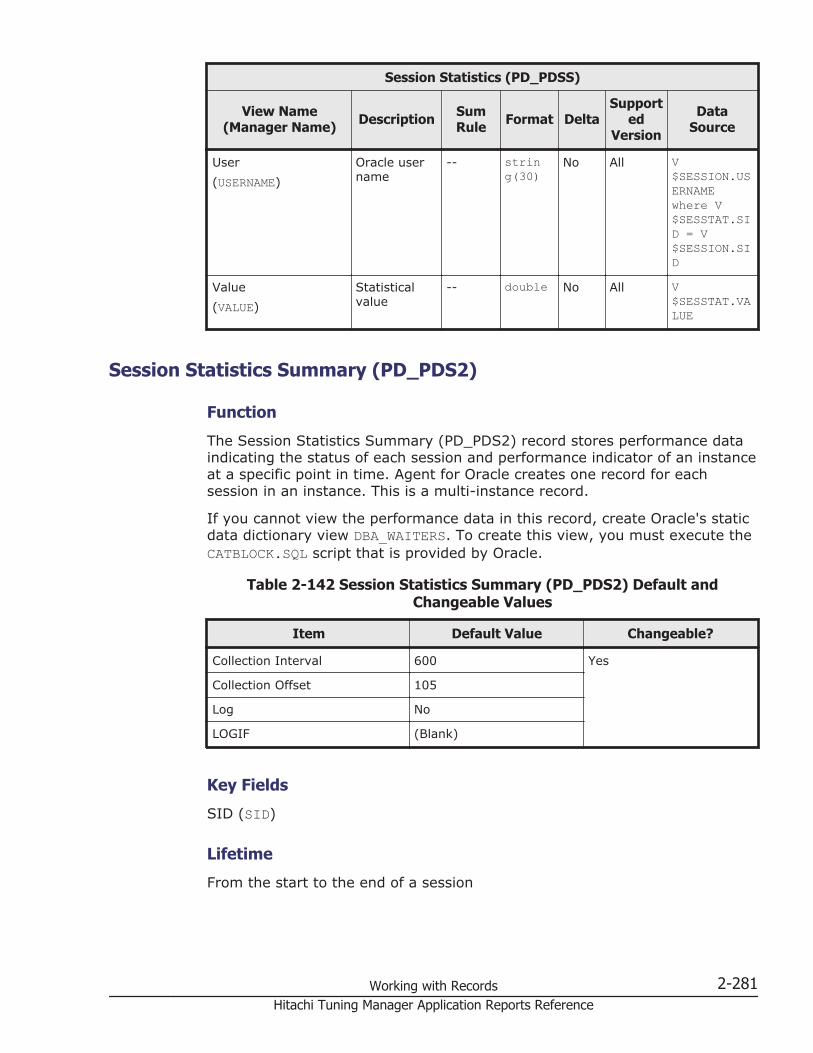
Session Statistics (PD_PDSS)
View Name(Manager Name) Description Sum
Rule Format DeltaSupport
edVersion
DataSource
User(USERNAME)
Oracle username
-- string(30)
No All V$SESSION.USERNAMEwhere V$SESSTAT.SID = V$SESSION.SID
Value(VALUE)
Statisticalvalue
-- double No All V$SESSTAT.VALUE
Session Statistics Summary (PD_PDS2)
Function
The Session Statistics Summary (PD_PDS2) record stores performance dataindicating the status of each session and performance indicator of an instanceat a specific point in time. Agent for Oracle creates one record for eachsession in an instance. This is a multi-instance record.
If you cannot view the performance data in this record, create Oracle's staticdata dictionary view DBA_WAITERS. To create this view, you must execute theCATBLOCK.SQL script that is provided by Oracle.
Table 2-142 Session Statistics Summary (PD_PDS2) Default andChangeable Values
Item Default Value Changeable?
Collection Interval 600 Yes
Collection Offset 105
Log No
LOGIF (Blank)
Key Fields
SID (SID)
Lifetime
From the start to the end of a session
Working with Records 2-281Hitachi Tuning Manager Application Reports Reference
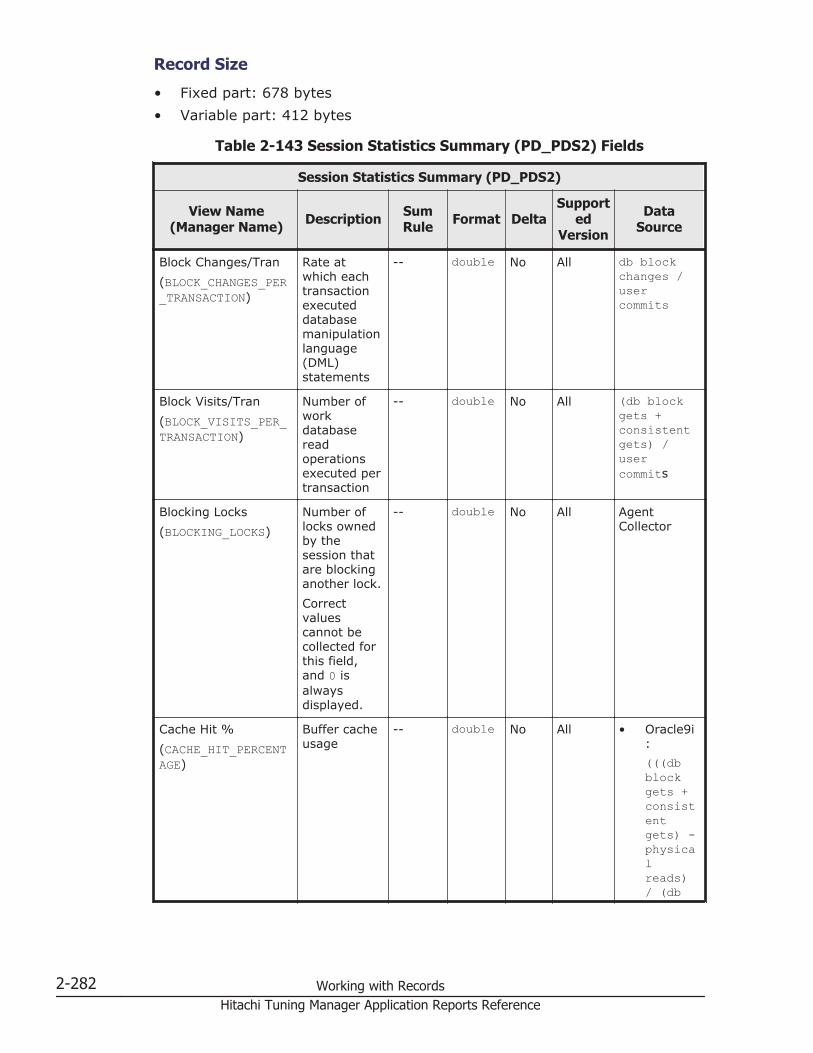
Record Size
• Fixed part: 678 bytes• Variable part: 412 bytes
Table 2-143 Session Statistics Summary (PD_PDS2) Fields
Session Statistics Summary (PD_PDS2)
View Name(Manager Name) Description Sum
Rule Format DeltaSupport
edVersion
DataSource
Block Changes/Tran(BLOCK_CHANGES_PER_TRANSACTION)
Rate atwhich eachtransactionexecuteddatabasemanipulationlanguage(DML)statements
-- double No All db blockchanges /usercommits
Block Visits/Tran(BLOCK_VISITS_PER_TRANSACTION)
Number ofworkdatabasereadoperationsexecuted pertransaction
-- double No All (db blockgets +consistentgets) /usercommits
Blocking Locks(BLOCKING_LOCKS)
Number oflocks ownedby thesession thatare blockinganother lock.Correctvaluescannot becollected forthis field,and 0 isalwaysdisplayed.
-- double No All AgentCollector
Cache Hit %(CACHE_HIT_PERCENTAGE)
Buffer cacheusage
-- double No All • Oracle9i:(((dbblockgets +consistentgets) -physicalreads)/ (db
2-282 Working with RecordsHitachi Tuning Manager Application Reports Reference

Session Statistics Summary (PD_PDS2)
View Name(Manager Name) Description Sum
Rule Format DeltaSupport
edVersion
DataSource
blockgets +consistentgets))* 100
• Oracle10g andlater:(1 -(physicalreadscache /(consistentgetsfromcache +dbblockgetsfromcache))) * 100
Calls/Tran(CALLS_PER_TRANSACTION)
Rate atwhich clientrequestswereexecuted pertransaction
-- double No All usercalls /usercommits
Changed Block %(CHANGED_BLOCK_PERCENTAGE)
Ratio (as apercent) ofthe numberof queriesthat changedata(insertion,update, anddeletion) tothe numberof queries(search,insertion,update,deletion)executed onthe database
-- double No All (db blockchanges /(block gets+consistentgets)) *100
Consistent Change % Ratio (as apercent) ofthe number
-- double No All (consistentchanges /
Working with Records 2-283Hitachi Tuning Manager Application Reports Reference

Session Statistics Summary (PD_PDS2)
View Name(Manager Name) Description Sum
Rule Format DeltaSupport
edVersion
DataSource
(CONSISTENT_CHANGE_PERCENTAGE)
of timesrollbackentries wereapplied tomaintainreadconsistencyto thenumber ofreadconsistencyrequests bytheapplication
consistentgets) * 100
Continued Row %(CONTINUED_ROW_PERCENTAGE)
Percentageof obtainedrows thatwere longerthan oneblock or hadbeen moved
-- double No All (tablefetchcontinuedrow /(tablefetch byrowid +table scanrowsgotten)) *100
Deadlocks(LOCK_DEADLOCKS)
Number ofprocessdeadlockscaused byenqueuing(locking) ofDMLprocessing
-- double No All V$SESSTAT.VALUE
Disk Sorts(SORTS_DISK)
Number ofdisk sortoperations
-- double No All V$SESSTAT.VALUE
Lock Conversions(LOCK_CONVERSIONS)
Number ofenqueues(locks)whose modechanged(such asfrom SHAREtoEXCLUSIVE)
-- double No All V$SESSTAT.VALUE
Lock Releases(LOCK_RELEASES)
Number oftimesenqueuing(locking) wasreleased
-- double No All SUM(V$SESSTAT.VALUE)
2-284 Working with RecordsHitachi Tuning Manager Application Reports Reference
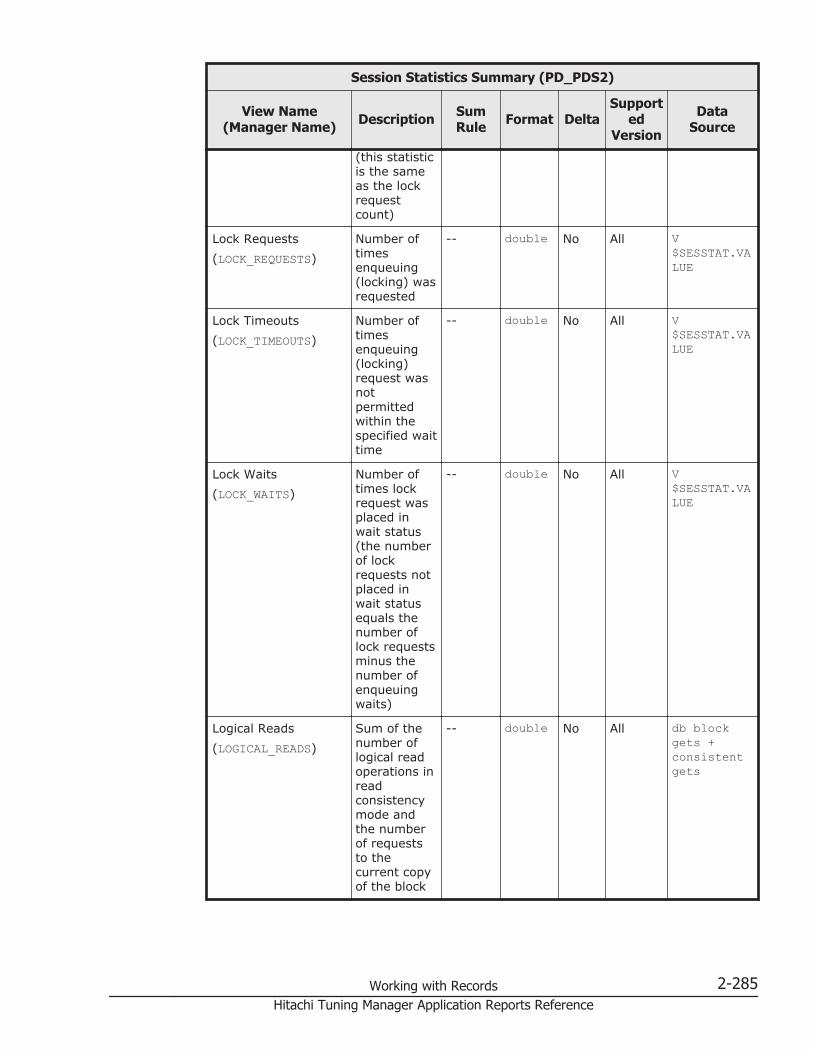
Session Statistics Summary (PD_PDS2)
View Name(Manager Name) Description Sum
Rule Format DeltaSupport
edVersion
DataSource
(this statisticis the sameas the lockrequestcount)
Lock Requests(LOCK_REQUESTS)
Number oftimesenqueuing(locking) wasrequested
-- double No All V$SESSTAT.VALUE
Lock Timeouts(LOCK_TIMEOUTS)
Number oftimesenqueuing(locking)request wasnotpermittedwithin thespecified waittime
-- double No All V$SESSTAT.VALUE
Lock Waits(LOCK_WAITS)
Number oftimes lockrequest wasplaced inwait status(the numberof lockrequests notplaced inwait statusequals thenumber oflock requestsminus thenumber ofenqueuingwaits)
-- double No All V$SESSTAT.VALUE
Logical Reads(LOGICAL_READS)
Sum of thenumber oflogical readoperations inreadconsistencymode andthe numberof requeststo thecurrent copyof the block
-- double No All db blockgets +consistentgets
Working with Records 2-285Hitachi Tuning Manager Application Reports Reference

Session Statistics Summary (PD_PDS2)
View Name(Manager Name) Description Sum
Rule Format DeltaSupport
edVersion
DataSource
Memory Sorts(SORTS_MEMORY)
Number ofsortoperations inmemory
-- double No All V$SESSTAT.VALUE
Non-Index Lookups %(NON_INDEX_LOOKUPS)
Percentageof full tablescans forwhich nocaching isperformed
-- double No All (tablescans (longtables) /(tablescans(shorttables) +table scans(longtables))) *100
PGA Memory(PGA_MEMORY)
Amount ofPGA memoryin use duringdatacollection
-- double No All V$SESSTAT.VALUE
Physical Writes(PHYSICAL_WRITES)
Number ofphysicalwriteoperationsonto disk byDBWR
-- double No All V$SESSTAT.VALUE
Physical Reads(PHYSICAL_READS)
Number oftimes adatabaseblock wasactually readfrom disk
-- double No All physicalreads -physicalreads direct -physicalreads direct(lob)
Program(PROGRAM)
OS'sprogramname
-- string(48)
No All V$SESSION.PROGRAM
Record Time(RECORD_TIME)
Collectionterminationtime for theperformancedata storedin the record
-- time_t No All AgentCollector
Record Type(INPUT_RECORD_TYPE)
Record name(alwaysPDS2)
-- string(4)
No All AgentCollector
2-286 Working with RecordsHitachi Tuning Manager Application Reports Reference
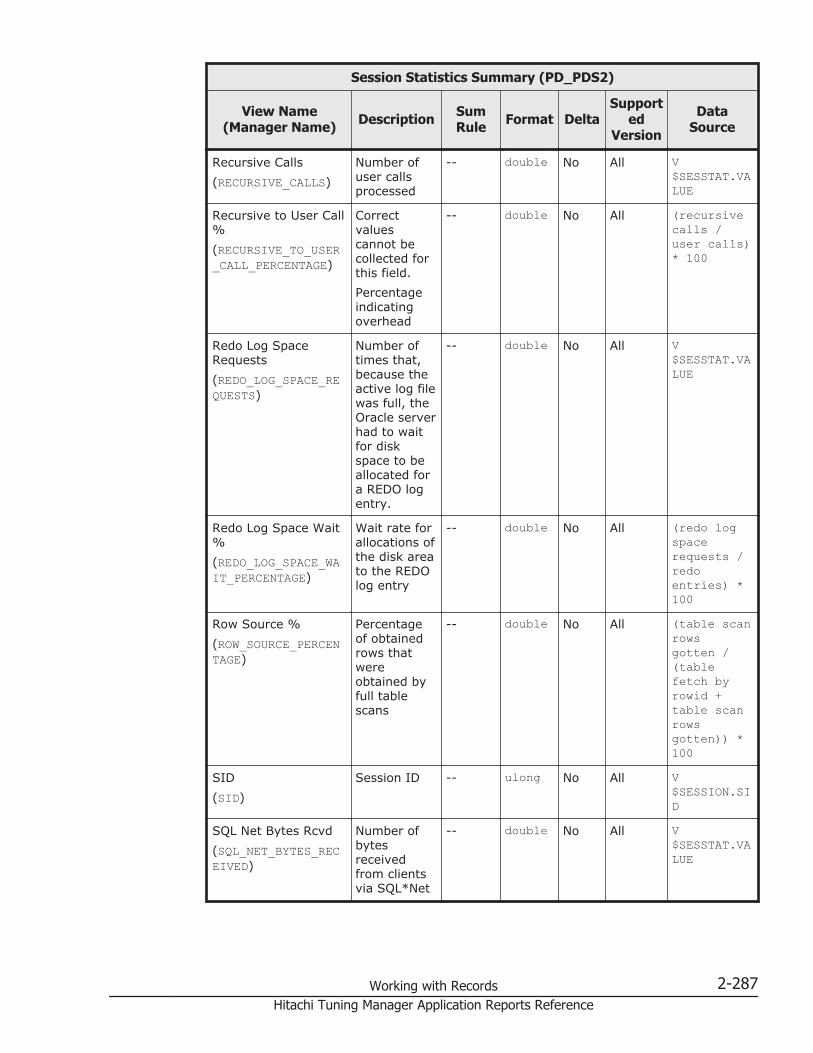
Session Statistics Summary (PD_PDS2)
View Name(Manager Name) Description Sum
Rule Format DeltaSupport
edVersion
DataSource
Recursive Calls(RECURSIVE_CALLS)
Number ofuser callsprocessed
-- double No All V$SESSTAT.VALUE
Recursive to User Call%(RECURSIVE_TO_USER_CALL_PERCENTAGE)
Correctvaluescannot becollected forthis field.Percentageindicatingoverhead
-- double No All (recursivecalls /user calls)* 100
Redo Log SpaceRequests(REDO_LOG_SPACE_REQUESTS)
Number oftimes that,because theactive log filewas full, theOracle serverhad to waitfor diskspace to beallocated fora REDO logentry.
-- double No All V$SESSTAT.VALUE
Redo Log Space Wait%(REDO_LOG_SPACE_WAIT_PERCENTAGE)
Wait rate forallocations ofthe disk areato the REDOlog entry
-- double No All (redo logspacerequests /redoentries) *100
Row Source %(ROW_SOURCE_PERCENTAGE)
Percentageof obtainedrows thatwereobtained byfull tablescans
-- double No All (table scanrowsgotten /(tablefetch byrowid +table scanrowsgotten)) *100
SID(SID)
Session ID -- ulong No All V$SESSION.SID
SQL Net Bytes Rcvd(SQL_NET_BYTES_RECEIVED)
Number ofbytesreceivedfrom clientsvia SQL*Net
-- double No All V$SESSTAT.VALUE
Working with Records 2-287Hitachi Tuning Manager Application Reports Reference
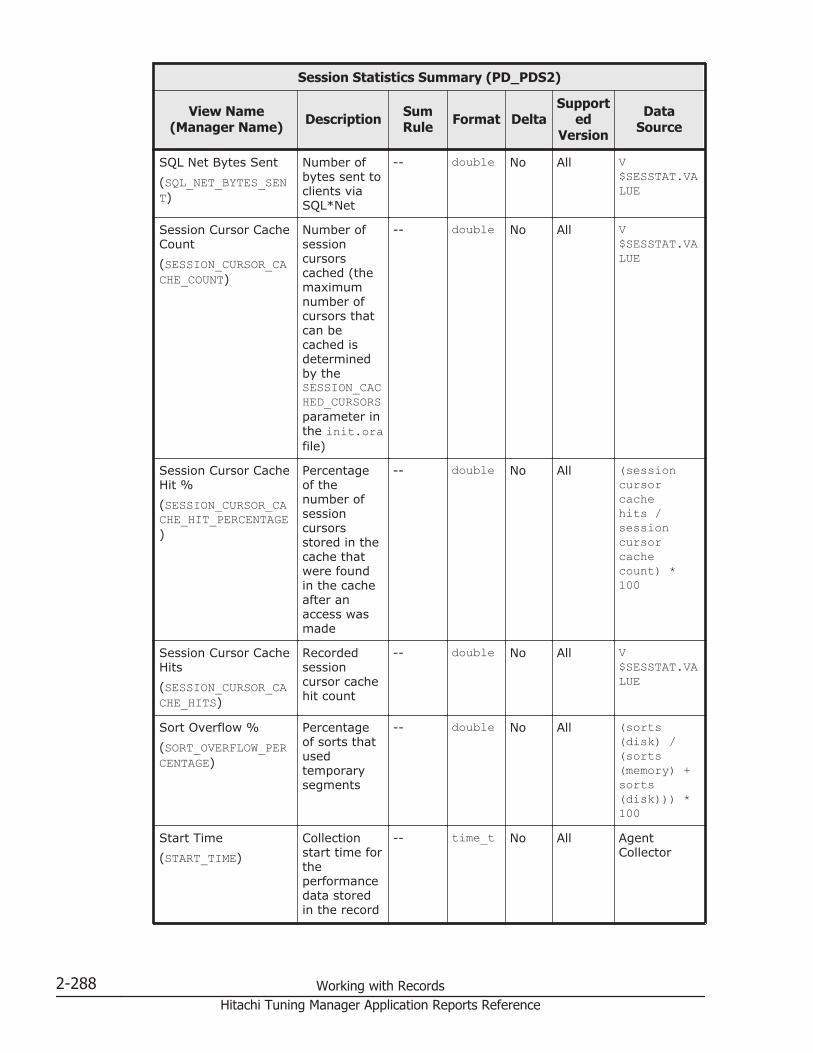
Session Statistics Summary (PD_PDS2)
View Name(Manager Name) Description Sum
Rule Format DeltaSupport
edVersion
DataSource
SQL Net Bytes Sent(SQL_NET_BYTES_SENT)
Number ofbytes sent toclients viaSQL*Net
-- double No All V$SESSTAT.VALUE
Session Cursor CacheCount(SESSION_CURSOR_CACHE_COUNT)
Number ofsessioncursorscached (themaximumnumber ofcursors thatcan becached isdeterminedby theSESSION_CACHED_CURSORSparameter inthe init.orafile)
-- double No All V$SESSTAT.VALUE
Session Cursor CacheHit %(SESSION_CURSOR_CACHE_HIT_PERCENTAGE)
Percentageof thenumber ofsessioncursorsstored in thecache thatwere foundin the cacheafter anaccess wasmade
-- double No All (sessioncursorcachehits /sessioncursorcachecount) *100
Session Cursor CacheHits(SESSION_CURSOR_CACHE_HITS)
Recordedsessioncursor cachehit count
-- double No All V$SESSTAT.VALUE
Sort Overflow %(SORT_OVERFLOW_PERCENTAGE)
Percentageof sorts thatusedtemporarysegments
-- double No All (sorts(disk) /(sorts(memory) +sorts(disk))) *100
Start Time(START_TIME)
Collectionstart time fortheperformancedata storedin the record
-- time_t No All AgentCollector
2-288 Working with RecordsHitachi Tuning Manager Application Reports Reference
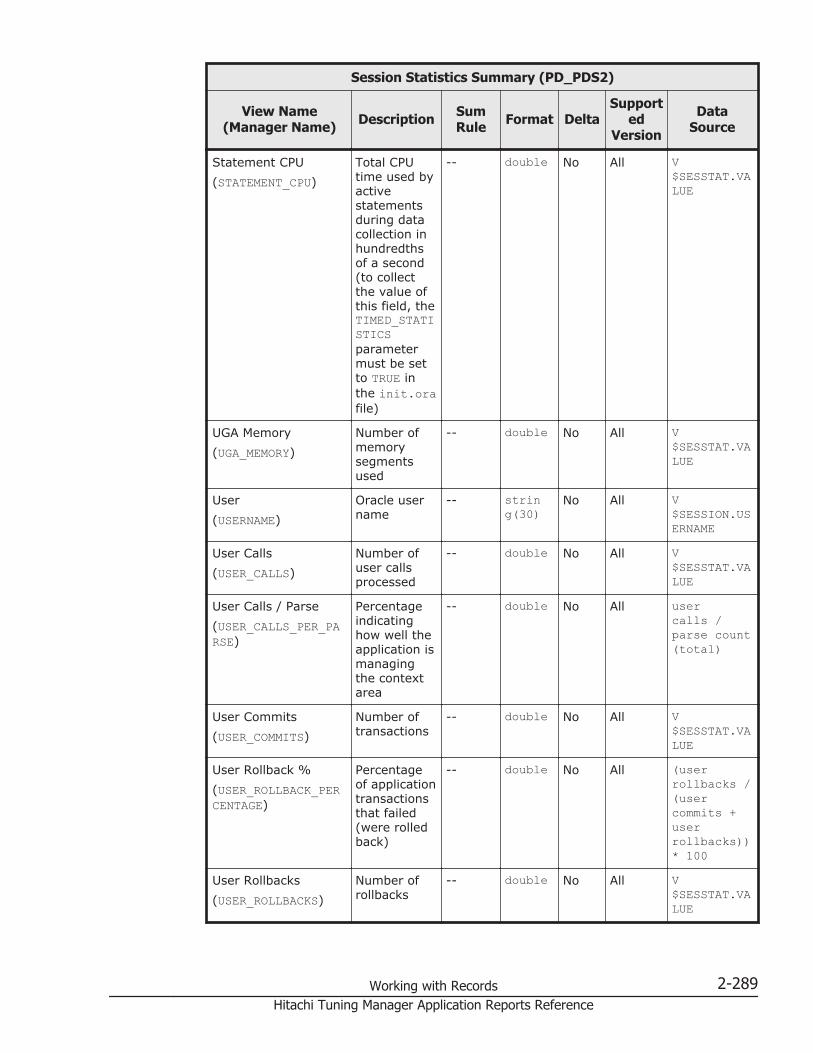
Session Statistics Summary (PD_PDS2)
View Name(Manager Name) Description Sum
Rule Format DeltaSupport
edVersion
DataSource
Statement CPU(STATEMENT_CPU)
Total CPUtime used byactivestatementsduring datacollection inhundredthsof a second(to collectthe value ofthis field, theTIMED_STATISTICSparametermust be setto TRUE inthe init.orafile)
-- double No All V$SESSTAT.VALUE
UGA Memory(UGA_MEMORY)
Number ofmemorysegmentsused
-- double No All V$SESSTAT.VALUE
User(USERNAME)
Oracle username
-- string(30)
No All V$SESSION.USERNAME
User Calls(USER_CALLS)
Number ofuser callsprocessed
-- double No All V$SESSTAT.VALUE
User Calls / Parse(USER_CALLS_PER_PARSE)
Percentageindicatinghow well theapplication ismanagingthe contextarea
-- double No All usercalls /parse count(total)
User Commits(USER_COMMITS)
Number oftransactions
-- double No All V$SESSTAT.VALUE
User Rollback %(USER_ROLLBACK_PERCENTAGE)
Percentageof applicationtransactionsthat failed(were rolledback)
-- double No All (userrollbacks /(usercommits +userrollbacks))* 100
User Rollbacks(USER_ROLLBACKS)
Number ofrollbacks
-- double No All V$SESSTAT.VALUE
Working with Records 2-289Hitachi Tuning Manager Application Reports Reference

Session Statistics Summary (PD_PDS2)
View Name(Manager Name) Description Sum
Rule Format DeltaSupport
edVersion
DataSource
Waiting Locks(WAITING_LOCKS)
Number oflocks ownedby anothersession thatthis sessionis waitingfor.Correctvaluescannot becollected forthis field,and 0 isalwaysdisplayed.
-- double No All --
Write %(WRITE_PERCENTAGE)
Ratio (as apercent) ofphysicalwrites to allphysical I/Os(reads andwrites)
-- double No All (physicalwrites /(physicalreads +physicalwrites)) *100
Session Wait (PD_PDWA)
Function
The Session Wait (PD_PDWA) record stores performance data indicating thestatus of session waits at a specific point in time. Agent for Oracle createsone record for each wait in a single session. This is a multi-instance record.
Table 2-144 Session Wait (PD_PDWA) Default and Changeable Values
Item Default Value Changeable?
Collection Interval 600 Yes
Collection Offset 155
Log No
LOGIF (Blank)
Key Fields
• SID (SID)• Seq # (SEQ_NUM)
2-290 Working with RecordsHitachi Tuning Manager Application Reports Reference
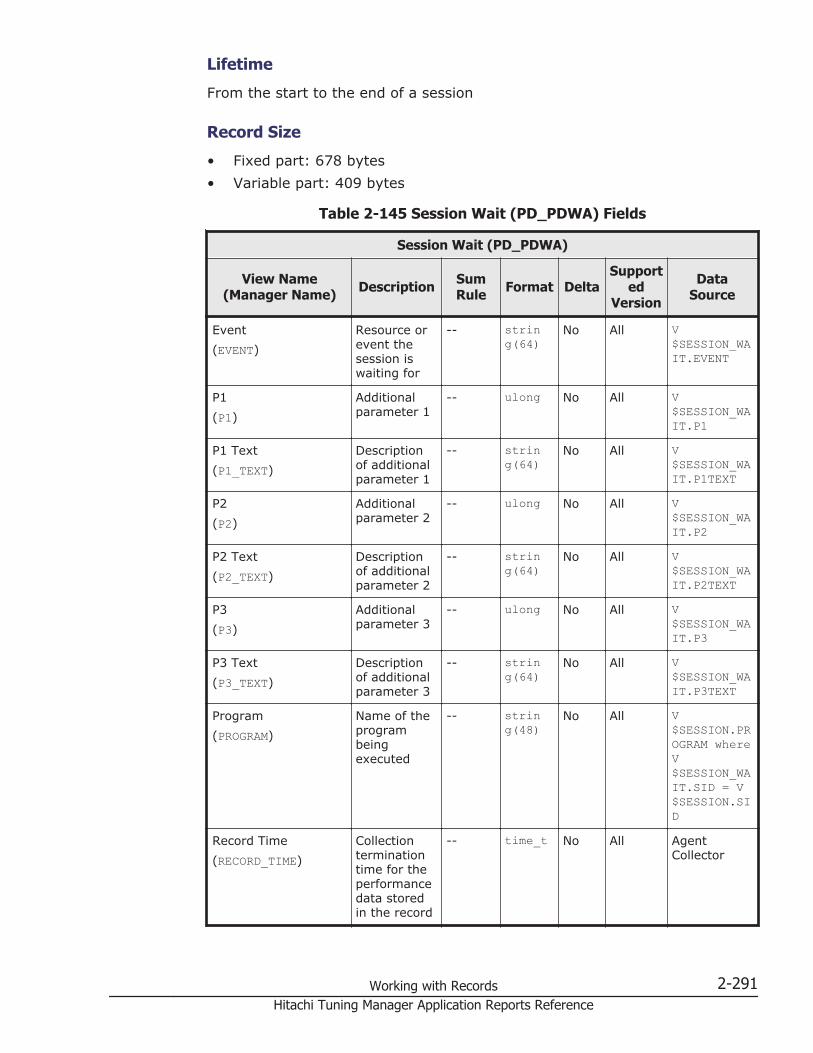
Lifetime
From the start to the end of a session
Record Size
• Fixed part: 678 bytes• Variable part: 409 bytes
Table 2-145 Session Wait (PD_PDWA) Fields
Session Wait (PD_PDWA)
View Name(Manager Name) Description Sum
Rule Format DeltaSupport
edVersion
DataSource
Event(EVENT)
Resource orevent thesession iswaiting for
-- string(64)
No All V$SESSION_WAIT.EVENT
P1(P1)
Additionalparameter 1
-- ulong No All V$SESSION_WAIT.P1
P1 Text(P1_TEXT)
Descriptionof additionalparameter 1
-- string(64)
No All V$SESSION_WAIT.P1TEXT
P2(P2)
Additionalparameter 2
-- ulong No All V$SESSION_WAIT.P2
P2 Text(P2_TEXT)
Descriptionof additionalparameter 2
-- string(64)
No All V$SESSION_WAIT.P2TEXT
P3(P3)
Additionalparameter 3
-- ulong No All V$SESSION_WAIT.P3
P3 Text(P3_TEXT)
Descriptionof additionalparameter 3
-- string(64)
No All V$SESSION_WAIT.P3TEXT
Program(PROGRAM)
Name of theprogrambeingexecuted
-- string(48)
No All V$SESSION.PROGRAM whereV$SESSION_WAIT.SID = V$SESSION.SID
Record Time(RECORD_TIME)
Collectionterminationtime for theperformancedata storedin the record
-- time_t No All AgentCollector
Working with Records 2-291Hitachi Tuning Manager Application Reports Reference
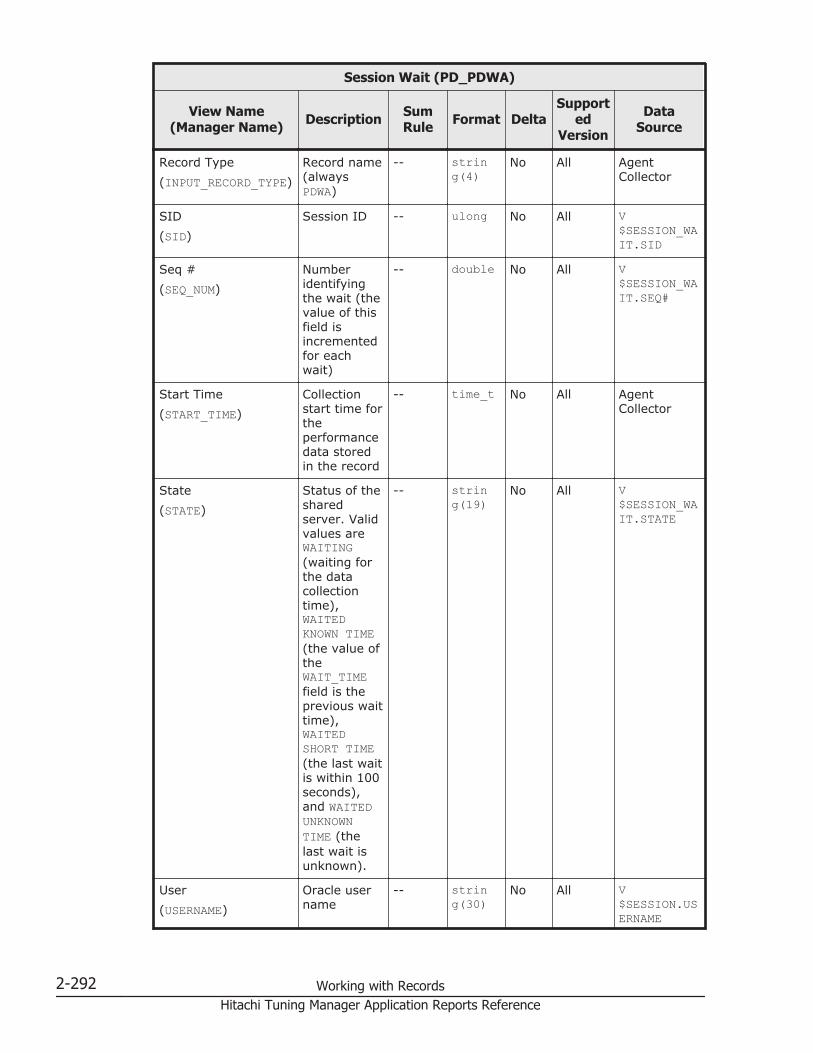
Session Wait (PD_PDWA)
View Name(Manager Name) Description Sum
Rule Format DeltaSupport
edVersion
DataSource
Record Type(INPUT_RECORD_TYPE)
Record name(alwaysPDWA)
-- string(4)
No All AgentCollector
SID(SID)
Session ID -- ulong No All V$SESSION_WAIT.SID
Seq #(SEQ_NUM)
Numberidentifyingthe wait (thevalue of thisfield isincrementedfor eachwait)
-- double No All V$SESSION_WAIT.SEQ#
Start Time(START_TIME)
Collectionstart time fortheperformancedata storedin the record
-- time_t No All AgentCollector
State(STATE)
Status of thesharedserver. Validvalues areWAITING(waiting forthe datacollectiontime),WAITEDKNOWN TIME(the value oftheWAIT_TIMEfield is theprevious waittime),WAITEDSHORT TIME(the last waitis within 100seconds),and WAITEDUNKNOWNTIME (thelast wait isunknown).
-- string(19)
No All V$SESSION_WAIT.STATE
User(USERNAME)
Oracle username
-- string(30)
No All V$SESSION.USERNAME
2-292 Working with RecordsHitachi Tuning Manager Application Reports Reference
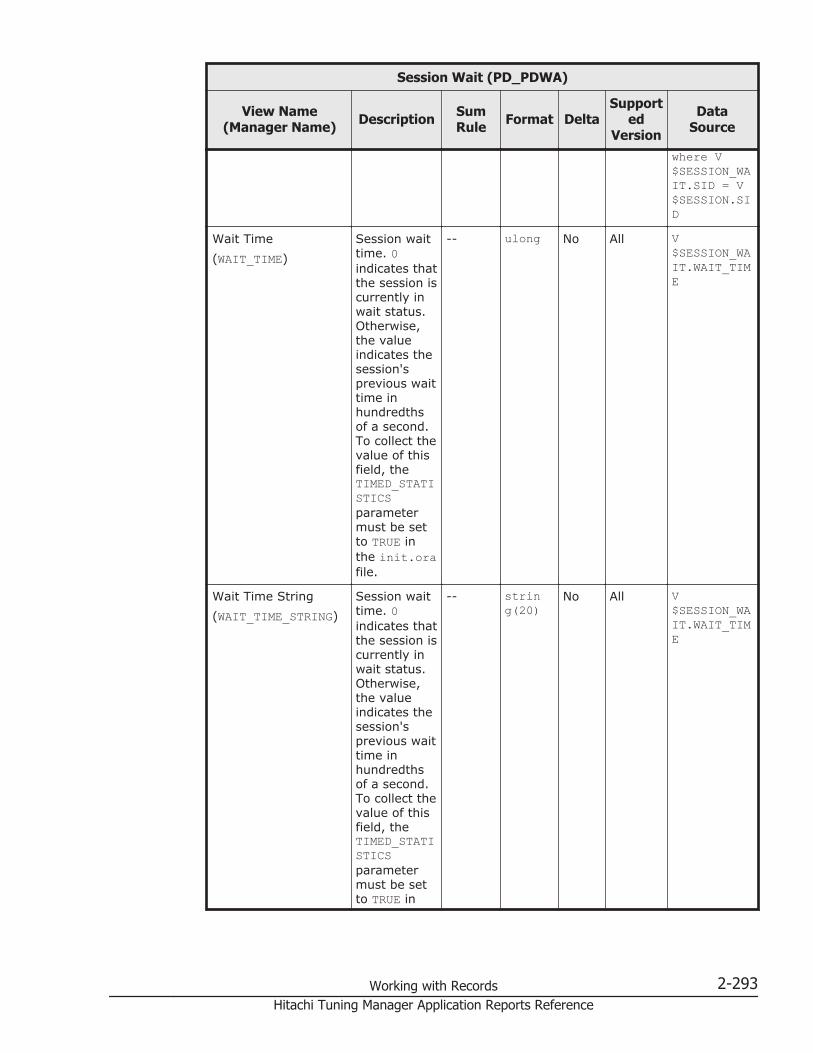
Session Wait (PD_PDWA)
View Name(Manager Name) Description Sum
Rule Format DeltaSupport
edVersion
DataSource
where V$SESSION_WAIT.SID = V$SESSION.SID
Wait Time(WAIT_TIME)
Session waittime. 0indicates thatthe session iscurrently inwait status.Otherwise,the valueindicates thesession'sprevious waittime inhundredthsof a second.To collect thevalue of thisfield, theTIMED_STATISTICSparametermust be setto TRUE inthe init.orafile.
-- ulong No All V$SESSION_WAIT.WAIT_TIME
Wait Time String(WAIT_TIME_STRING)
Session waittime. 0indicates thatthe session iscurrently inwait status.Otherwise,the valueindicates thesession'sprevious waittime inhundredthsof a second.To collect thevalue of thisfield, theTIMED_STATISTICSparametermust be setto TRUE in
-- string(20)
No All V$SESSION_WAIT.WAIT_TIME
Working with Records 2-293Hitachi Tuning Manager Application Reports Reference

Session Wait (PD_PDWA)
View Name(Manager Name) Description Sum
Rule Format DeltaSupport
edVersion
DataSource
the init.orafile.
SGA Components (PD_PDSG)
Function
The SGA Components (PD_PDSG) record stores performance data indicatingthe status of the system global area (SGA) at a specific point in time. Agentfor Oracle creates one record for each system global area (SGA). This is amulti-instance record.
Table 2-146 SGA Components (PD_PDSG) Default and Changeable Values
Item Default Value Changeable?
Collection Interval 600 Yes
Collection Offset 115
Log No
LOGIF (Blank)
Key Fields
Component Name (NAME)
Lifetime
From the creation to the deletion of an Oracle instance
Record Size
• Fixed part: 678 bytes• Variable part: 56 bytes
2-294 Working with RecordsHitachi Tuning Manager Application Reports Reference

Table 2-147 SGA Components (PD_PDSG) Fields
SGA Components (PD_PDSG)
View Name(Manager Name) Description Sum
Rule Format DeltaSupport
edVersion
DataSource
Bytes(BYTES)
Allocatedmemory sizein bytes
-- double No All • V$SGASTAT.BYTES
• V$SGA_DYNAMIC_COMPONENTS.CURRENT_SIZE
Component Name(NAME)
Name of theSGAcomponent
-- string(26)
No All • V$SGASTAT.NAME
• V$SGA_DYNAMIC_COMPONENTS.COMPONENT
Pool(POOL)
Pool in whichthe memoryfor thecomponentnamesexists. Thefollowing fourtypes ofpools areavailable:shared poollarge pooljava poolstreamspoolThis field isblank if anyof the abovevalues isindicated intheComponentName field orif there is noapplicablepool.
-- string(12)
No 8.2 orlater
• V$SGASTAT.POOL
Working with Records 2-295Hitachi Tuning Manager Application Reports Reference

SGA Components (PD_PDSG)
View Name(Manager Name) Description Sum
Rule Format DeltaSupport
edVersion
DataSource
Record Time(RECORD_TIME)
Collectionterminationtime for theperformancedata storedin the record
-- time_t No All AgentCollector
Record Type(INPUT_RECORD_TYPE)
Record name(alwaysPDSG)
-- string(4)
No All AgentCollector
Start Time(START_TIME)
Collectionstart time fortheperformancedata storedin the record
-- time_t No All AgentCollector
Total Bytes(TOTAL_BYTES)
Total size ofmemory (inbytes)allocated toeach SGAcomponent
-- double No All V$SGASTAT.BYTES
Shared Cursor Cache (PD_PDC)
Function
The Shared Cursor Cache (PD_PDC) record stores performance dataindicating the status of the shared cursor cache at a specific point in time.Agent for Oracle creates one record for each shared cursor cache. This is amulti-instance record.
Table 2-148 Shared Cursor Cache (PD_PDC) Default and ChangeableValues
Item Default Value Changeable?
Collection Interval 600 Yes
Collection Offset 10
Log No
LOGIF (Blank)
Key Fields
Addrhash (ADDRHASH)
2-296 Working with RecordsHitachi Tuning Manager Application Reports Reference
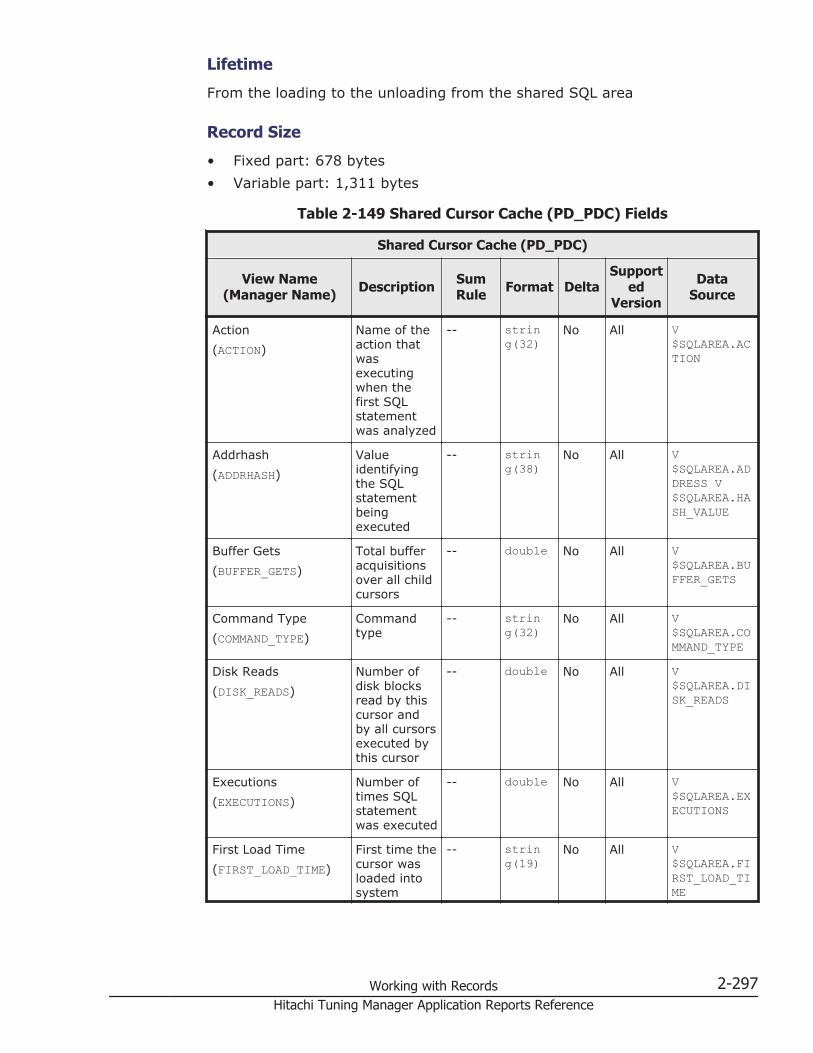
Lifetime
From the loading to the unloading from the shared SQL area
Record Size
• Fixed part: 678 bytes• Variable part: 1,311 bytes
Table 2-149 Shared Cursor Cache (PD_PDC) Fields
Shared Cursor Cache (PD_PDC)
View Name(Manager Name) Description Sum
Rule Format DeltaSupport
edVersion
DataSource
Action(ACTION)
Name of theaction thatwasexecutingwhen thefirst SQLstatementwas analyzed
-- string(32)
No All V$SQLAREA.ACTION
Addrhash(ADDRHASH)
Valueidentifyingthe SQLstatementbeingexecuted
-- string(38)
No All V$SQLAREA.ADDRESS V$SQLAREA.HASH_VALUE
Buffer Gets(BUFFER_GETS)
Total bufferacquisitionsover all childcursors
-- double No All V$SQLAREA.BUFFER_GETS
Command Type(COMMAND_TYPE)
Commandtype
-- string(32)
No All V$SQLAREA.COMMAND_TYPE
Disk Reads(DISK_READS)
Number ofdisk blocksread by thiscursor andby all cursorsexecuted bythis cursor
-- double No All V$SQLAREA.DISK_READS
Executions(EXECUTIONS)
Number oftimes SQLstatementwas executed
-- double No All V$SQLAREA.EXECUTIONS
First Load Time(FIRST_LOAD_TIME)
First time thecursor wasloaded intosystem
-- string(19)
No All V$SQLAREA.FIRST_LOAD_TIME
Working with Records 2-297Hitachi Tuning Manager Application Reports Reference
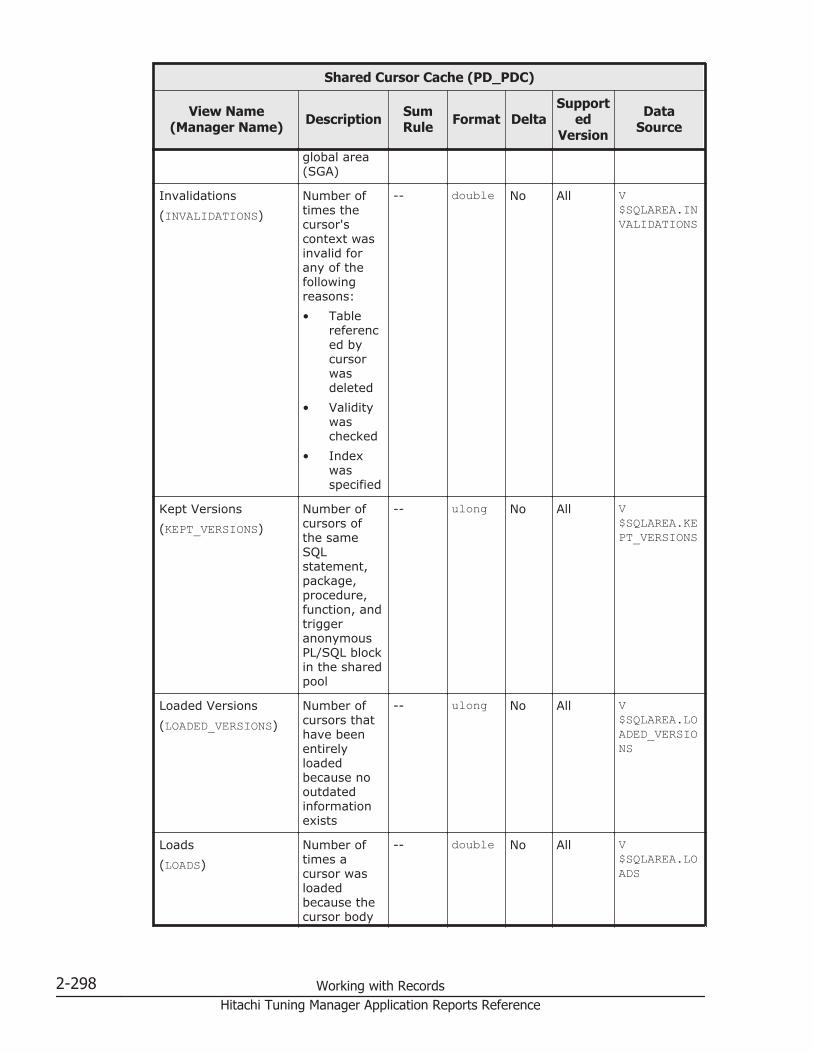
Shared Cursor Cache (PD_PDC)
View Name(Manager Name) Description Sum
Rule Format DeltaSupport
edVersion
DataSource
global area(SGA)
Invalidations(INVALIDATIONS)
Number oftimes thecursor'scontext wasinvalid forany of thefollowingreasons:• Table
referenced bycursorwasdeleted
• Validitywaschecked
• Indexwasspecified
-- double No All V$SQLAREA.INVALIDATIONS
Kept Versions(KEPT_VERSIONS)
Number ofcursors ofthe sameSQLstatement,package,procedure,function, andtriggeranonymousPL/SQL blockin the sharedpool
-- ulong No All V$SQLAREA.KEPT_VERSIONS
Loaded Versions(LOADED_VERSIONS)
Number ofcursors thathave beenentirelyloadedbecause nooutdatedinformationexists
-- ulong No All V$SQLAREA.LOADED_VERSIONS
Loads(LOADS)
Number oftimes acursor wasloadedbecause thecursor body
-- double No All V$SQLAREA.LOADS
2-298 Working with RecordsHitachi Tuning Manager Application Reports Reference

Shared Cursor Cache (PD_PDC)
View Name(Manager Name) Description Sum
Rule Format DeltaSupport
edVersion
DataSource
was not usedwhile thetext of theSQLstatementwas in cacheor becausethe cursorwas nolonger valid
Module(MODULE)
Module namewhen thefirst SQLstatementwas analyzed
-- string(64)
No All V$SQLAREA.MODULE
Open Versions(OPEN_VERSIONS)
Number ofopen cursorsthat belongto the user
-- ulong No All V$SQLAREA.OPEN_VERSIONS
Parse Calls(PARSE_CALLS)
Number oftimes a userissued ananalysis callto a cursor
-- double No All V$SQLAREA.PARSE_CALLS
Parsing Schema ID(PARSING_SCHEMA_ID)
Schema IDused toanalyze SQLstatements
-- long No All V$SQLAREA.PARSING_SCHEMA_ID
Parsing User ID(PARSING_USER_ID)
User ID thatanalyzed theSQLstatements
-- long No All V$SQLAREA.PARSING_USER_ID
Persistent Mem(PERSISTENT_MEM)
Amount ofmemory (inbytes) peruser whilethe cursorwas valid
-- double No All V$SQLAREA.PERSISTENT_MEM
Record Time(RECORD_TIME)
Collectionterminationtime for theperformancedata storedin the record
-- time_t No All AgentCollector
Record Type(INPUT_RECORD_TYPE)
Record name(always PDC)
-- string(4)
No All AgentCollector
Working with Records 2-299Hitachi Tuning Manager Application Reports Reference
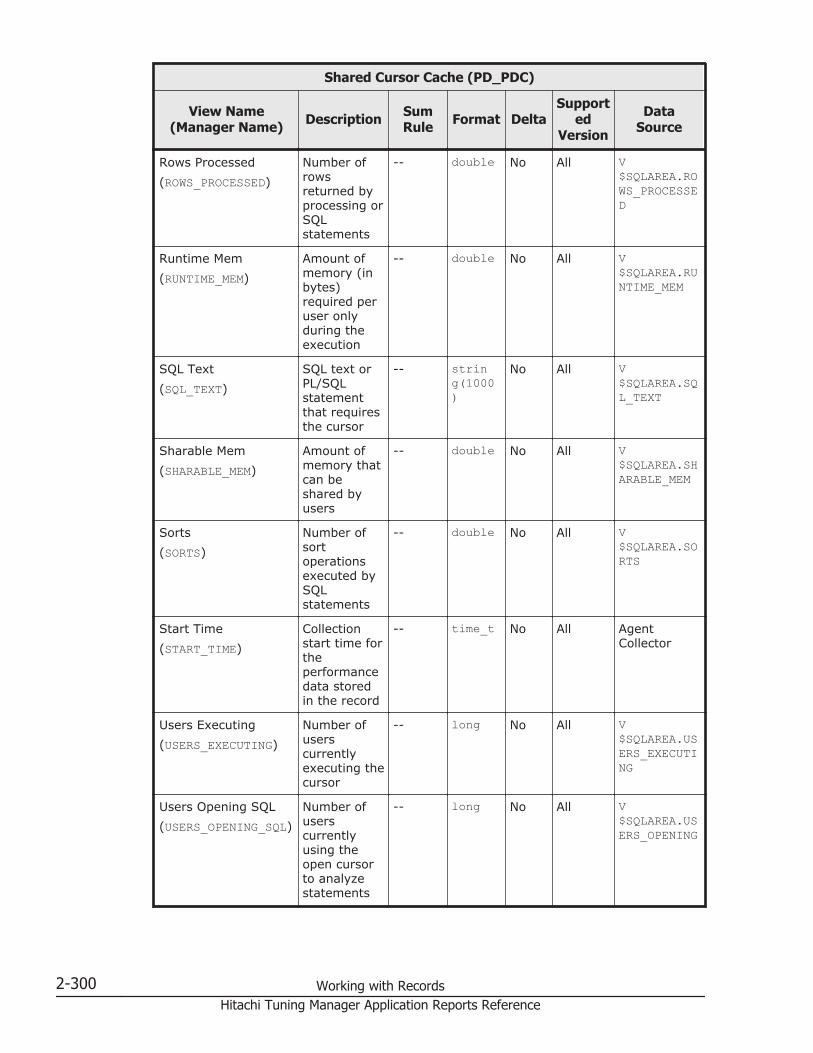
Shared Cursor Cache (PD_PDC)
View Name(Manager Name) Description Sum
Rule Format DeltaSupport
edVersion
DataSource
Rows Processed(ROWS_PROCESSED)
Number ofrowsreturned byprocessing orSQLstatements
-- double No All V$SQLAREA.ROWS_PROCESSED
Runtime Mem(RUNTIME_MEM)
Amount ofmemory (inbytes)required peruser onlyduring theexecution
-- double No All V$SQLAREA.RUNTIME_MEM
SQL Text(SQL_TEXT)
SQL text orPL/SQLstatementthat requiresthe cursor
-- string(1000)
No All V$SQLAREA.SQL_TEXT
Sharable Mem(SHARABLE_MEM)
Amount ofmemory thatcan beshared byusers
-- double No All V$SQLAREA.SHARABLE_MEM
Sorts(SORTS)
Number ofsortoperationsexecuted bySQLstatements
-- double No All V$SQLAREA.SORTS
Start Time(START_TIME)
Collectionstart time fortheperformancedata storedin the record
-- time_t No All AgentCollector
Users Executing(USERS_EXECUTING)
Number ofuserscurrentlyexecuting thecursor
-- long No All V$SQLAREA.USERS_EXECUTING
Users Opening SQL(USERS_OPENING_SQL)
Number ofuserscurrentlyusing theopen cursorto analyzestatements
-- long No All V$SQLAREA.USERS_OPENING
2-300 Working with RecordsHitachi Tuning Manager Application Reports Reference

Shared Cursor Cache (PD_PDC)
View Name(Manager Name) Description Sum
Rule Format DeltaSupport
edVersion
DataSource
Version Count(VERSION_COUNT)
Number ofcursors(Multipleusers mightexecute thesame SQLstatement ondifferentversions of asingle table.)
-- ulong No All V$SQLAREA.VERSION_COUNT
Shared Server (PD_PDSH)
Function
The Shared Server (PD_PDSH) record stores performance data indicating thestatus of the shared servers at a specific point in time. Agent for Oraclecreates one record for each shared server in an instance. This is a multi-instance record.
Table 2-150 Shared Server (PD_PDSH) Default and Changeable Values
Item Default Value Changeable?
Collection Interval 300 Yes
Collection Offset 50
Log No
LOGIF (Blank)
Key Fields
Shared Server Name (NAME)
Lifetime
From the creation to the deletion of an Oracle instance
Record Size
• Fixed part: 678 bytes• Variable part: 108 bytes
Working with Records 2-301Hitachi Tuning Manager Application Reports Reference

Table 2-151 Shared Server (PD_PDSH) Fields
Shared Server (PD_PDSH)
View Name(Manager Name) Description Sum
Rule Format DeltaSupport
edVersion
DataSource
Breaks(BREAKS)
Number ofbreaks(pauses)
-- double No All V$SHARED_SERVER.BREAKS
Busy(BUSY)
Total busytime inhundredthsof a second
-- double No All V$SHARED_SERVER.BUSY
Busy %(PERCENT_BUSY)
Percentageof time thesharedserver wasbusy
-- double No All (V$SHARED_SERVER.BUSY /(V$SHARED_SERVER.BUSY +V$SHARED_SERVER.IDLE))* 100
Bytes(BYTES)
Total size ofmessages inbytes
-- double No All V$SHARED_SERVER.BYTES
Circuit(CIRCUIT)
Address ofthe circuitthat iscurrentlyproviding theservice
-- string(16)
No All V$SHARED_SERVER.CIRCUIT
Idle(IDLE)
Total idletime inhundredthsof a second
-- double No All V$SHARED_SERVER.IDLE
Idle %(PERCENT_IDLE)
Percentageof time thesharedserver wasidle
-- double No All (V$SHARED_SERVER.IDLE /(V$SHARED_SERVER.BUSY +V$SHARED_SERVER.IDLE))* 100
Messages(MESSAGES)
Number ofmessagesprocessed
-- double No All V$SHARED_SERVER.MESSAGES
Oracle PID Oracleprocess ID of
-- ulong No All V$PROCESS.PI
2-302 Working with RecordsHitachi Tuning Manager Application Reports Reference

Shared Server (PD_PDSH)
View Name(Manager Name) Description Sum
Rule Format DeltaSupport
edVersion
DataSource
(PID) the sharedserverprocess
D where V$SHARED_SERVER.PADDR =V$PROCESS.ADDR
Record Time(RECORD_TIME)
Collectionterminationtime for theperformancedata storedin the record
-- time_t No All AgentCollector
Record Type(INPUT_RECORD_TYPE)
Record name(alwaysPDSH)
-- string(4)
No All AgentCollector
Requests(REQUESTS)
Number ofrequestsretrievedfrom thecommonqueue whilethe serverwas running
-- double No All V$SHARED_SERVER.REQUESTS
Shared Server Name(NAME)
Name of thesharedserver
-- string(5)
No All V$SHARED_SERVER.NAME
Start Time(START_TIME)
Collectionstart time fortheperformancedata storedin the record
-- time_t No All AgentCollector
Status(STATUS)
Status; oneof thefollowing:EXEC: UnderSQLexecutionWAIT (ENQ):Waiting forlockWAIT(SEND):Waiting totransfer datato userWAIT(COMMON):
-- string(16)
No All V$SHARED_SERVER.STATUS
Working with Records 2-303Hitachi Tuning Manager Application Reports Reference

Shared Server (PD_PDSH)
View Name(Manager Name) Description Sum
Rule Format DeltaSupport
edVersion
DataSource
Idle, waitingfor a userrequestWAIT(RESET):Waiting for acircuit toreset afterbreakQUIT:Terminating
Shared Server Interval (PI_PISH)
Function
The Shared Server Interval (PI_PISH) record stores performance data, takenat specific intervals, about shared servers. Agent for Oracle creates onerecord for each shared server in an instance. This is a multi-instance record.
Table 2-152 Shared Server Interval (PI_PISH) Default and ChangeableValues
Item Default Value Changeable?
Collection Interval 300 Yes
Collection Offset 40
Log No
LOGIF (Blank)
Key Fields
Shared Server Name (NAME)
Lifetime
From the creation to the deletion of an Oracle instance
Record Size
• Fixed part: 678 bytes• Variable part: 204 bytes
2-304 Working with RecordsHitachi Tuning Manager Application Reports Reference

Table 2-153 Shared Server Interval (PI_PISH) Fields
Shared Server Interval (PI_PISH)
View Name(Manager Name) Description Sum
Rule Format DeltaSupport
edVersion
DataSource
Breaks(BREAKS)
Number ofbreaks(pauses)
AVG double Yes All V$SHARED_SERVER.BREAKS
Busy(BUSY)
Total busytime inhundredthsof a second
AVG double Yes All V$SHARED_SERVER.BUSY
Busy %(PERCENT_BUSY)
Percentageof time thesharedserver wasbusy
AVG double No All (V$SHARED_SERVER.BUSY /(V$SHARED_SERVER.BUSY +V$SHARED_SERVER.IDLE))* 100
Bytes(BYTES)
Total size ofmessages inbytes
AVG double Yes All V$SHARED_SERVER.BYTES
Circuit(CIRCUIT)
Address ofthe circuitthat iscurrentlyproviding theservice
COPY string(16)
No All V$SHARED_SERVER.CIRCUIT
Idle(IDLE)
Total idletime inhundredthsof a second
AVG double Yes All V$SHARED_SERVER.IDLE
Idle %(PERCENT_IDLE)
Percentageof time thesharedserver wasidle
AVG double No All (V$SHARED_SERVER.IDLE /(V$SHARED_SERVER.BUSY +V$SHARED_SERVER.IDLE))* 100
Messages(MESSAGES)
Number ofmessagesprocessed
AVG double Yes All V$SHARED_SERVER.MESSAGES
Oracle PID Oracleprocess ID of
COPY ulong No All V$PROCESS.PI
Working with Records 2-305Hitachi Tuning Manager Application Reports Reference

Shared Server Interval (PI_PISH)
View Name(Manager Name) Description Sum
Rule Format DeltaSupport
edVersion
DataSource
(PID) the sharedserverprocess
D where V$SHARED_SERVER.PADDR =V$PROCESS.ADDR
Record Time(RECORD_TIME)
Collectionterminationtime for theperformancedata storedin the record
COPY time_t No All AgentCollector
Record Type(INPUT_RECORD_TYPE)
Record name(alwaysPISH)
COPY string(4)
No All AgentCollector
Requests(REQUESTS)
Number ofrequestsretrievedfrom thecommonqueue whilethe serverwas running
AVG double Yes All V$SHARED_SERVER.REQUESTS
Shared Server Name(NAME)
Name of thesharedserver
COPY string(5)
No All V$SHARED_SERVER.NAME
Start Time(START_TIME)
Collectionstart time fortheperformancedata storedin the record
COPY time_t No All AgentCollector
Status(STATUS)
Status; oneof thefollowing:EXEC: UnderSQLexecutionWAIT (ENQ):Waiting for alock to bereleasedWAIT(SEND):Waiting totransfer datato user
COPY string(16)
No All V$SHARED_SERVER.STATUS
2-306 Working with RecordsHitachi Tuning Manager Application Reports Reference
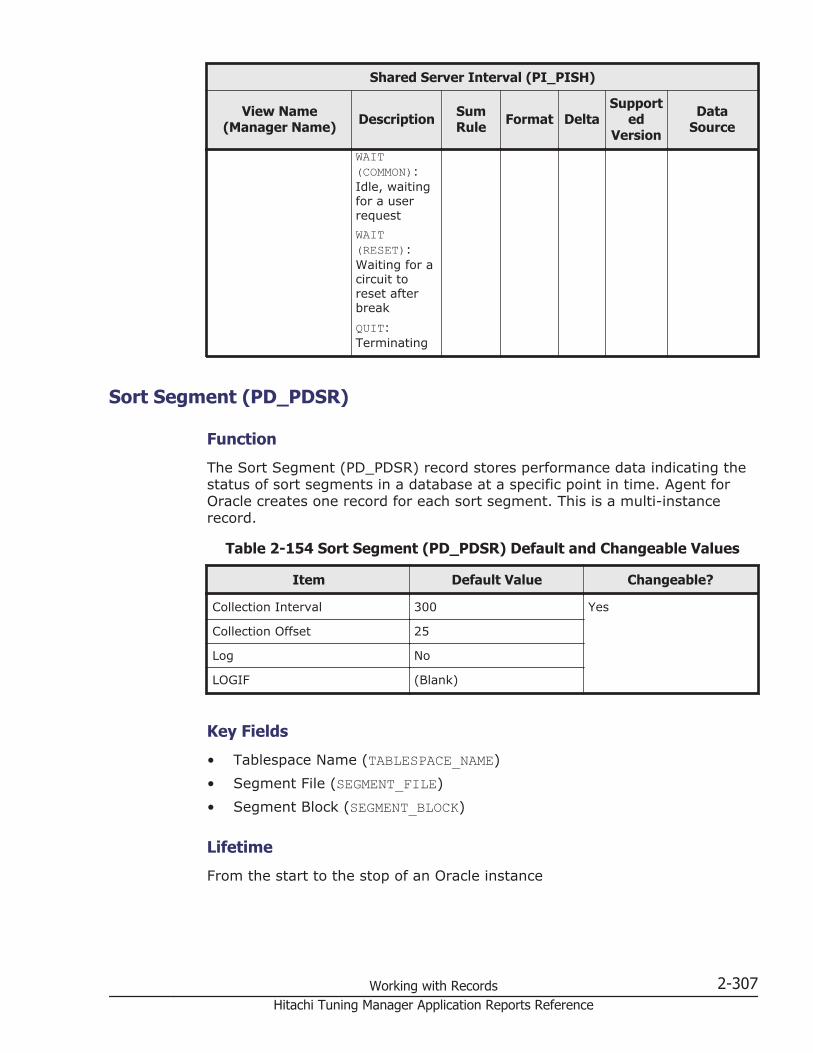
Shared Server Interval (PI_PISH)
View Name(Manager Name) Description Sum
Rule Format DeltaSupport
edVersion
DataSource
WAIT(COMMON):Idle, waitingfor a userrequestWAIT(RESET):Waiting for acircuit toreset afterbreakQUIT:Terminating
Sort Segment (PD_PDSR)
Function
The Sort Segment (PD_PDSR) record stores performance data indicating thestatus of sort segments in a database at a specific point in time. Agent forOracle creates one record for each sort segment. This is a multi-instancerecord.
Table 2-154 Sort Segment (PD_PDSR) Default and Changeable Values
Item Default Value Changeable?
Collection Interval 300 Yes
Collection Offset 25
Log No
LOGIF (Blank)
Key Fields
• Tablespace Name (TABLESPACE_NAME)• Segment File (SEGMENT_FILE)• Segment Block (SEGMENT_BLOCK)
Lifetime
From the start to the stop of an Oracle instance
Working with Records 2-307Hitachi Tuning Manager Application Reports Reference
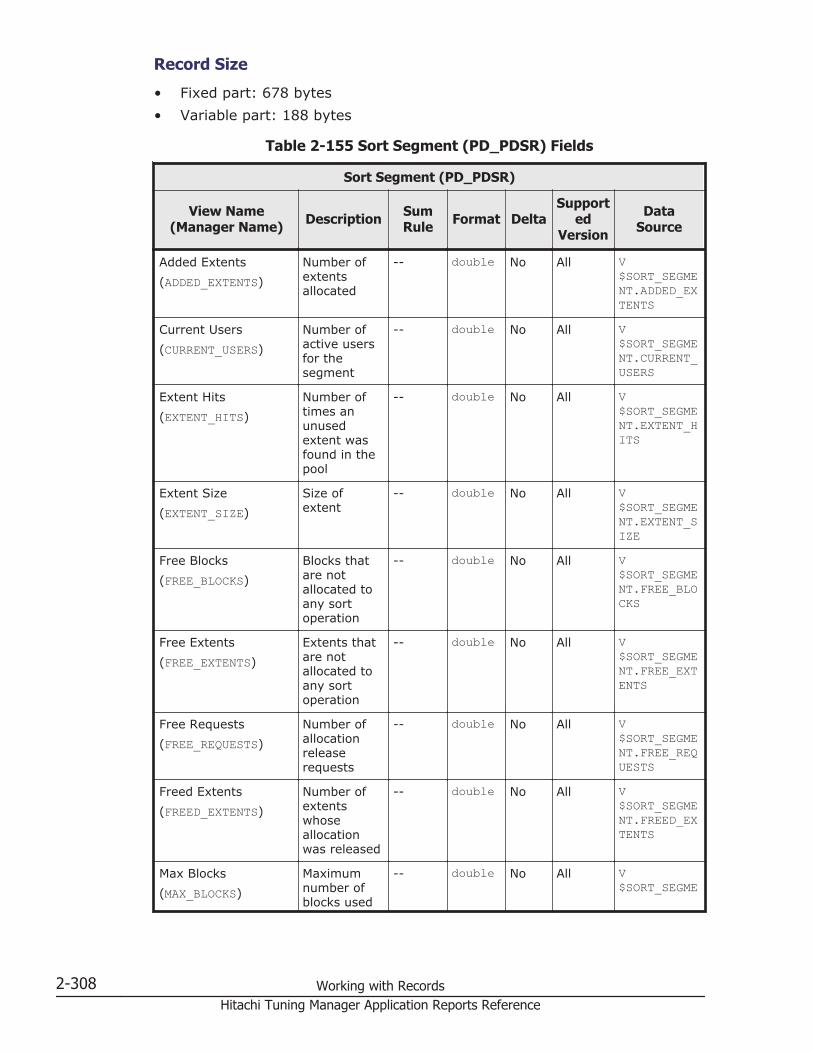
Record Size
• Fixed part: 678 bytes• Variable part: 188 bytes
Table 2-155 Sort Segment (PD_PDSR) Fields
Sort Segment (PD_PDSR)
View Name(Manager Name) Description Sum
Rule Format DeltaSupport
edVersion
DataSource
Added Extents(ADDED_EXTENTS)
Number ofextentsallocated
-- double No All V$SORT_SEGMENT.ADDED_EXTENTS
Current Users(CURRENT_USERS)
Number ofactive usersfor thesegment
-- double No All V$SORT_SEGMENT.CURRENT_USERS
Extent Hits(EXTENT_HITS)
Number oftimes anunusedextent wasfound in thepool
-- double No All V$SORT_SEGMENT.EXTENT_HITS
Extent Size(EXTENT_SIZE)
Size ofextent
-- double No All V$SORT_SEGMENT.EXTENT_SIZE
Free Blocks(FREE_BLOCKS)
Blocks thatare notallocated toany sortoperation
-- double No All V$SORT_SEGMENT.FREE_BLOCKS
Free Extents(FREE_EXTENTS)
Extents thatare notallocated toany sortoperation
-- double No All V$SORT_SEGMENT.FREE_EXTENTS
Free Requests(FREE_REQUESTS)
Number ofallocationreleaserequests
-- double No All V$SORT_SEGMENT.FREE_REQUESTS
Freed Extents(FREED_EXTENTS)
Number ofextentswhoseallocationwas released
-- double No All V$SORT_SEGMENT.FREED_EXTENTS
Max Blocks(MAX_BLOCKS)
Maximumnumber ofblocks used
-- double No All V$SORT_SEGME
2-308 Working with RecordsHitachi Tuning Manager Application Reports Reference

Sort Segment (PD_PDSR)
View Name(Manager Name) Description Sum
Rule Format DeltaSupport
edVersion
DataSource
NT.MAX_BLOCKS
Max Size(MAX_SIZE)
Maximumnumber ofextents used
-- double No All V$SORT_SEGMENT.MAX_SIZE
Max Sort Blocks(MAX_SORT_BLOCKS)
Maximumnumber ofblocks usedin individualsortoperations
-- double No All V$SORT_SEGMENT.MAX_SORT_BLOCKS
Max Sort Size(MAX_SORT_SIZE)
Maximumnumber ofextents usedin individualsortoperations
-- double No All V$SORT_SEGMENT.MAX_SORT_SIZE
Max Used Blocks(MAX_USED_BLOCKS)
Maximumnumber ofblocks usedin all sortoperations
-- double No All V$SORT_SEGMENT.MAX_USED_BLOCKS
Max Used Size(MAX_USED_SIZE)
Maximumnumber ofextents usedin all sortoperations
-- double No All V$SORT_SEGMENT.MAX_USED_SIZE
Record Time(RECORD_TIME)
Collectionterminationtime for theperformancedata storedin the record
-- time_t No All AgentCollector
Record Type(INPUT_RECORD_TYPE)
Record name(alwaysPDSR)
-- string(4)
No All AgentCollector
Segment Block(SEGMENT_BLOCK)
Blocknumber offirst extent
-- double No All V$SORT_SEGMENT.SEGMENT_BLOCK
Segment File(SEGMENT_FILE)
File numberof first extent
-- ulong No All V$SORT_SEGMENT.SEGMENT_FILE
Start Time(START_TIME)
Collectionstart time forthe
-- time_t No All AgentCollector
Working with Records 2-309Hitachi Tuning Manager Application Reports Reference
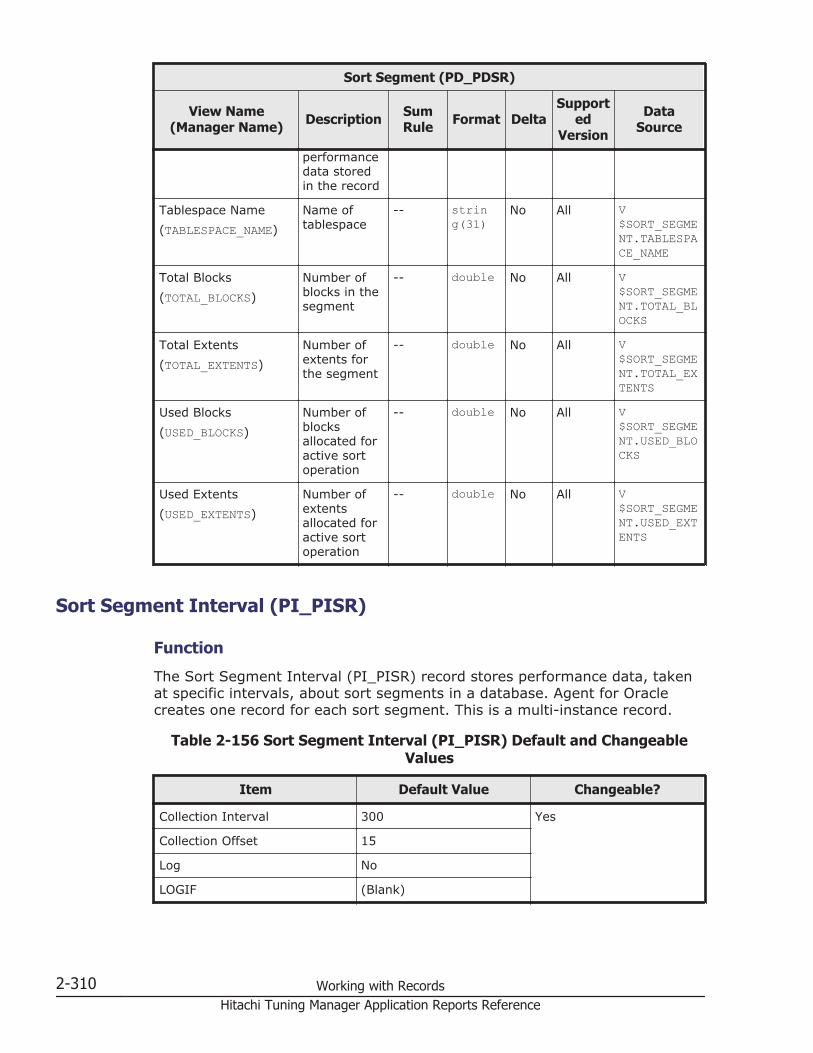
Sort Segment (PD_PDSR)
View Name(Manager Name) Description Sum
Rule Format DeltaSupport
edVersion
DataSource
performancedata storedin the record
Tablespace Name(TABLESPACE_NAME)
Name oftablespace
-- string(31)
No All V$SORT_SEGMENT.TABLESPACE_NAME
Total Blocks(TOTAL_BLOCKS)
Number ofblocks in thesegment
-- double No All V$SORT_SEGMENT.TOTAL_BLOCKS
Total Extents(TOTAL_EXTENTS)
Number ofextents forthe segment
-- double No All V$SORT_SEGMENT.TOTAL_EXTENTS
Used Blocks(USED_BLOCKS)
Number ofblocksallocated foractive sortoperation
-- double No All V$SORT_SEGMENT.USED_BLOCKS
Used Extents(USED_EXTENTS)
Number ofextentsallocated foractive sortoperation
-- double No All V$SORT_SEGMENT.USED_EXTENTS
Sort Segment Interval (PI_PISR)
Function
The Sort Segment Interval (PI_PISR) record stores performance data, takenat specific intervals, about sort segments in a database. Agent for Oraclecreates one record for each sort segment. This is a multi-instance record.
Table 2-156 Sort Segment Interval (PI_PISR) Default and ChangeableValues
Item Default Value Changeable?
Collection Interval 300 Yes
Collection Offset 15
Log No
LOGIF (Blank)
2-310 Working with RecordsHitachi Tuning Manager Application Reports Reference
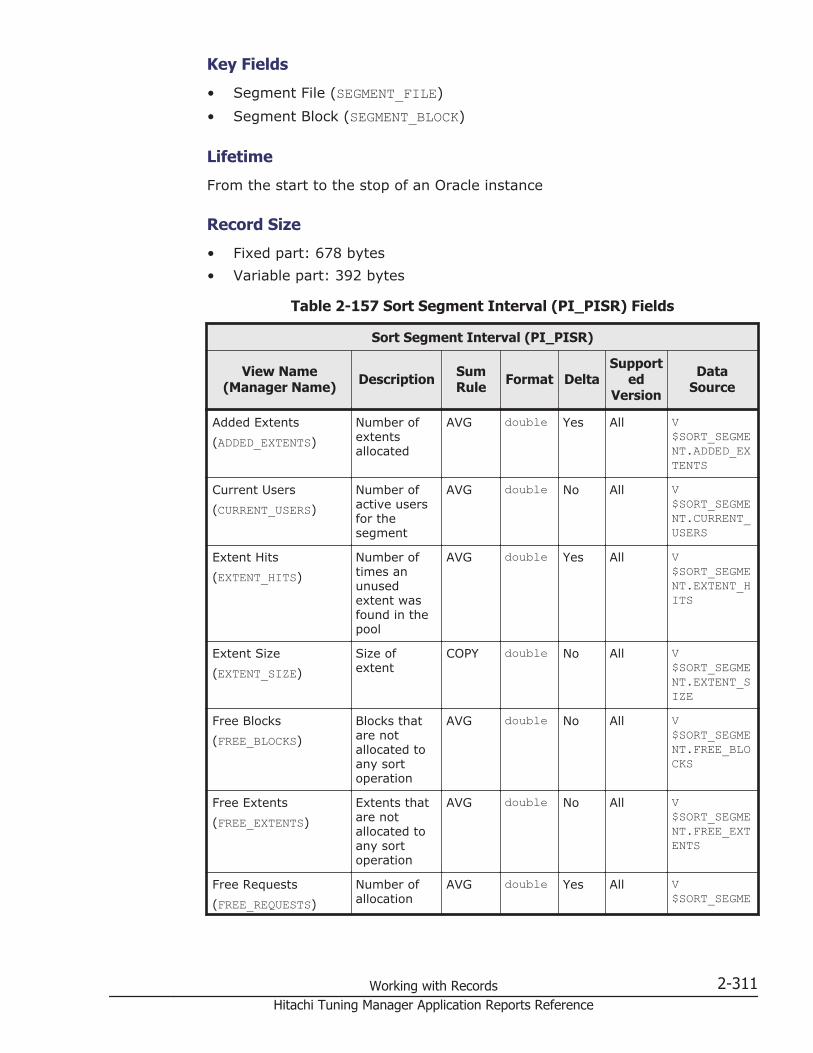
Key Fields
• Segment File (SEGMENT_FILE)• Segment Block (SEGMENT_BLOCK)
Lifetime
From the start to the stop of an Oracle instance
Record Size
• Fixed part: 678 bytes• Variable part: 392 bytes
Table 2-157 Sort Segment Interval (PI_PISR) Fields
Sort Segment Interval (PI_PISR)
View Name(Manager Name) Description Sum
Rule Format DeltaSupport
edVersion
DataSource
Added Extents(ADDED_EXTENTS)
Number ofextentsallocated
AVG double Yes All V$SORT_SEGMENT.ADDED_EXTENTS
Current Users(CURRENT_USERS)
Number ofactive usersfor thesegment
AVG double No All V$SORT_SEGMENT.CURRENT_USERS
Extent Hits(EXTENT_HITS)
Number oftimes anunusedextent wasfound in thepool
AVG double Yes All V$SORT_SEGMENT.EXTENT_HITS
Extent Size(EXTENT_SIZE)
Size ofextent
COPY double No All V$SORT_SEGMENT.EXTENT_SIZE
Free Blocks(FREE_BLOCKS)
Blocks thatare notallocated toany sortoperation
AVG double No All V$SORT_SEGMENT.FREE_BLOCKS
Free Extents(FREE_EXTENTS)
Extents thatare notallocated toany sortoperation
AVG double No All V$SORT_SEGMENT.FREE_EXTENTS
Free Requests(FREE_REQUESTS)
Number ofallocation
AVG double Yes All V$SORT_SEGME
Working with Records 2-311Hitachi Tuning Manager Application Reports Reference

Sort Segment Interval (PI_PISR)
View Name(Manager Name) Description Sum
Rule Format DeltaSupport
edVersion
DataSource
releaserequests
NT.FREE_REQUESTS
Freed Extents(FREED_EXTENTS)
Number ofextentswhoseallocationwas released
AVG double Yes All V$SORT_SEGMENT.FREED_EXTENTS
Max Blocks(MAX_BLOCKS)
Maximumnumber ofblocks used
AVG double No All V$SORT_SEGMENT.MAX_BLOCKS
Max Size(MAX_SIZE)
Maximumnumber ofextents used
AVG double No All V$SORT_SEGMENT.MAX_SIZE
Max Sort Blocks(MAX_SORT_BLOCKS)
Maximumnumber ofblocks usedin individualsortoperations
AVG double No All V$SORT_SEGMENT.MAX_SORT_BLOCKS
Max Sort Size(MAX_SORT_SIZE)
Maximumnumber ofextents usedin individualsortoperations
AVG double No All V$SORT_SEGMENT.MAX_SORT_SIZE
Max Used Blocks(MAX_USED_BLOCKS)
Maximumnumber ofblocks usedin all sortoperations
AVG double No All V$SORT_SEGMENT.MAX_USED_BLOCKS
Max Used Size(MAX_USED_SIZE)
Maximumnumber ofextents usedin all sortoperations
AVG double No All V$SORT_SEGMENT.MAX_USED_SIZE
Record Time(RECORD_TIME)
Collectionterminationtime for theperformancedata storedin the record
COPY time_t No All AgentCollector
Record Type(INPUT_RECORD_TYPE)
Record name(alwaysPISR)
COPY string(4)
No All AgentCollector
2-312 Working with RecordsHitachi Tuning Manager Application Reports Reference
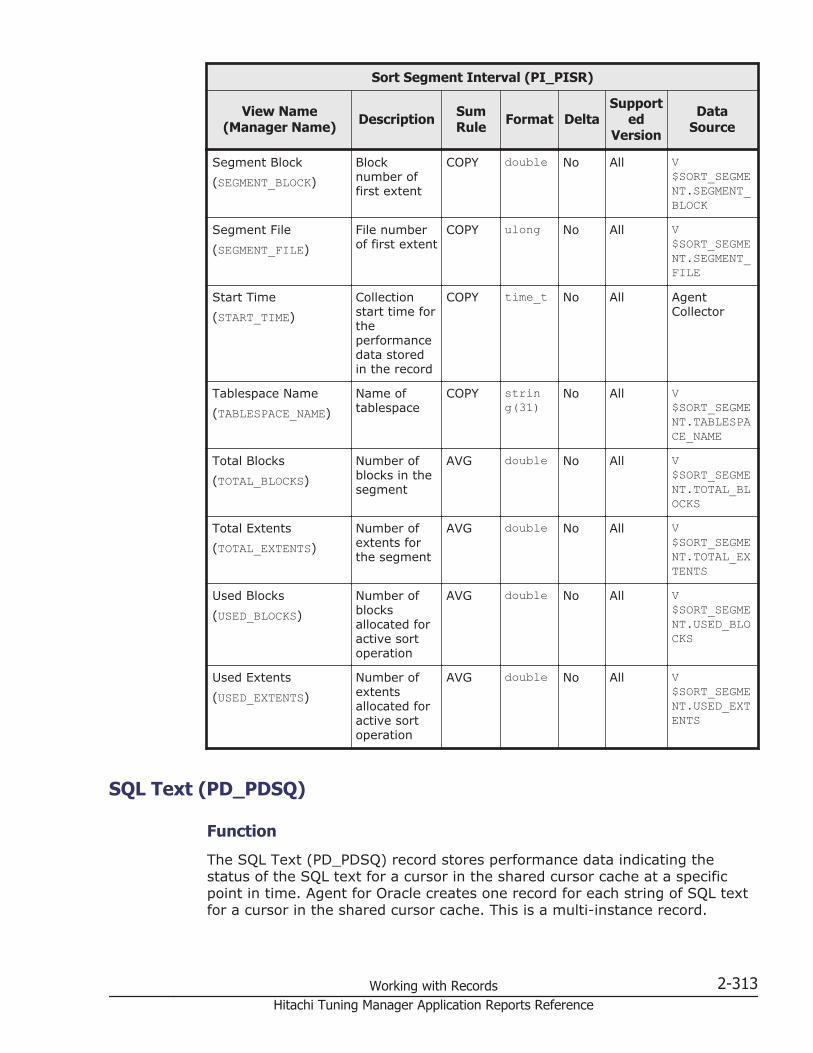
Sort Segment Interval (PI_PISR)
View Name(Manager Name) Description Sum
Rule Format DeltaSupport
edVersion
DataSource
Segment Block(SEGMENT_BLOCK)
Blocknumber offirst extent
COPY double No All V$SORT_SEGMENT.SEGMENT_BLOCK
Segment File(SEGMENT_FILE)
File numberof first extent
COPY ulong No All V$SORT_SEGMENT.SEGMENT_FILE
Start Time(START_TIME)
Collectionstart time fortheperformancedata storedin the record
COPY time_t No All AgentCollector
Tablespace Name(TABLESPACE_NAME)
Name oftablespace
COPY string(31)
No All V$SORT_SEGMENT.TABLESPACE_NAME
Total Blocks(TOTAL_BLOCKS)
Number ofblocks in thesegment
AVG double No All V$SORT_SEGMENT.TOTAL_BLOCKS
Total Extents(TOTAL_EXTENTS)
Number ofextents forthe segment
AVG double No All V$SORT_SEGMENT.TOTAL_EXTENTS
Used Blocks(USED_BLOCKS)
Number ofblocksallocated foractive sortoperation
AVG double No All V$SORT_SEGMENT.USED_BLOCKS
Used Extents(USED_EXTENTS)
Number ofextentsallocated foractive sortoperation
AVG double No All V$SORT_SEGMENT.USED_EXTENTS
SQL Text (PD_PDSQ)
Function
The SQL Text (PD_PDSQ) record stores performance data indicating thestatus of the SQL text for a cursor in the shared cursor cache at a specificpoint in time. Agent for Oracle creates one record for each string of SQL textfor a cursor in the shared cursor cache. This is a multi-instance record.
Working with Records 2-313Hitachi Tuning Manager Application Reports Reference
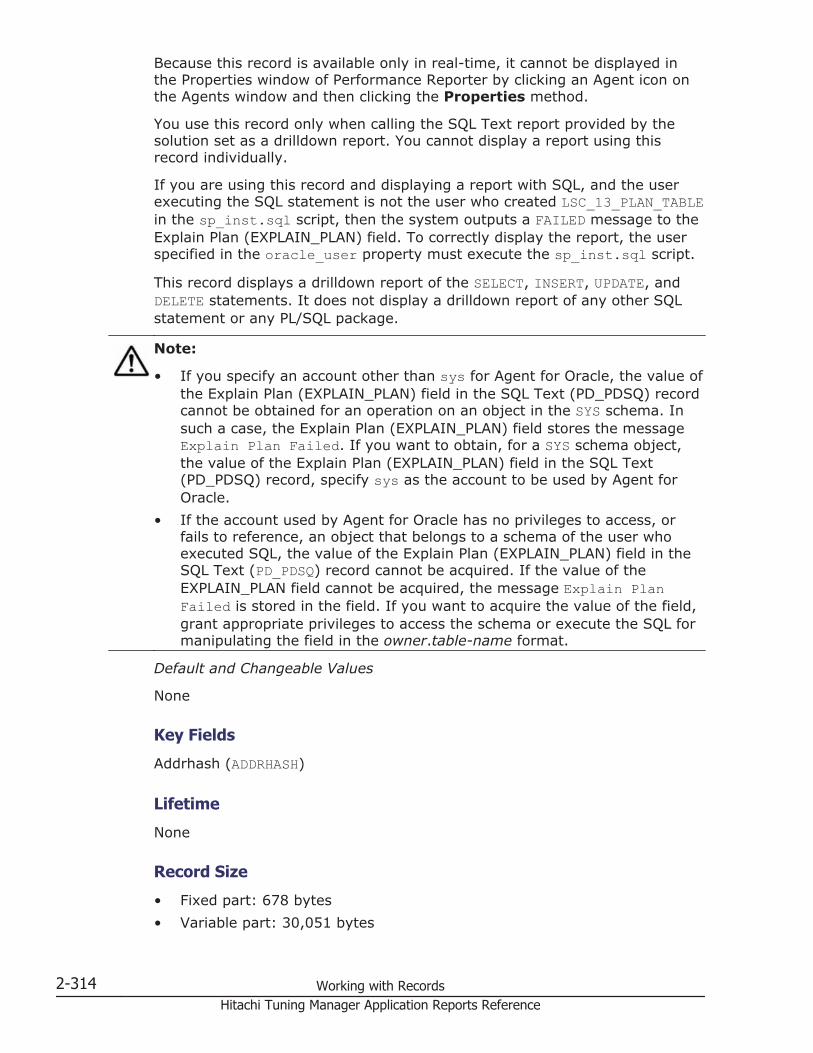
Because this record is available only in real-time, it cannot be displayed inthe Properties window of Performance Reporter by clicking an Agent icon onthe Agents window and then clicking the Properties method.
You use this record only when calling the SQL Text report provided by thesolution set as a drilldown report. You cannot display a report using thisrecord individually.
If you are using this record and displaying a report with SQL, and the userexecuting the SQL statement is not the user who created LSC_13_PLAN_TABLEin the sp_inst.sql script, then the system outputs a FAILED message to theExplain Plan (EXPLAIN_PLAN) field. To correctly display the report, the userspecified in the oracle_user property must execute the sp_inst.sql script.
This record displays a drilldown report of the SELECT, INSERT, UPDATE, andDELETE statements. It does not display a drilldown report of any other SQLstatement or any PL/SQL package.
Note:
• If you specify an account other than sys for Agent for Oracle, the value ofthe Explain Plan (EXPLAIN_PLAN) field in the SQL Text (PD_PDSQ) recordcannot be obtained for an operation on an object in the SYS schema. Insuch a case, the Explain Plan (EXPLAIN_PLAN) field stores the messageExplain Plan Failed. If you want to obtain, for a SYS schema object,the value of the Explain Plan (EXPLAIN_PLAN) field in the SQL Text(PD_PDSQ) record, specify sys as the account to be used by Agent forOracle.
• If the account used by Agent for Oracle has no privileges to access, orfails to reference, an object that belongs to a schema of the user whoexecuted SQL, the value of the Explain Plan (EXPLAIN_PLAN) field in theSQL Text (PD_PDSQ) record cannot be acquired. If the value of theEXPLAIN_PLAN field cannot be acquired, the message Explain PlanFailed is stored in the field. If you want to acquire the value of the field,grant appropriate privileges to access the schema or execute the SQL formanipulating the field in the owner.table-name format.
Default and Changeable Values
None
Key Fields
Addrhash (ADDRHASH)
Lifetime
None
Record Size
• Fixed part: 678 bytes• Variable part: 30,051 bytes
2-314 Working with RecordsHitachi Tuning Manager Application Reports Reference

Table 2-158 SQL Text (PD_PDSQ) Fields
SQL Text (PD_PDSQ)
View Name(Manager Name) Description Sum
Rule Format DeltaSupport
edVersion
DataSource
Addrhash(ADDRHASH)
Address andhash valueused toidentify thecachedcursor
-- string(38)
No All V$SQLTEXT.ADDRESS V$SQLTEXT.HASH_VALUE
Command Type(COMMAND_TYPE)
Type of SQLstatement
-- string(10)
No All V$SQLTEXT.COMMAND_TYPE
Explain Plan(EXPLAIN_PLAN)
Executionplan of theSELECT,UPDATE,INSERT, andDELETEstatementsselected bythe Oracleoptimizer.
-- string(30000)
No All AgentCollector
Record Time(RECORD_TIME)
Collectionterminationtime for theperformancedata storedin the record
-- time_t No All AgentCollector
Record Type(INPUT_RECORD_TYPE)
Record name(alwaysPDSQ)
-- string(4)
No All AgentCollector
SQL Text(SQL_TEXT)
Portion of theSQL text
-- string(30000)
No All V$SQLTEXT.SQL_TEXT
Start Time(START_TIME)
Collectionstart time fortheperformancedata storedin the record
-- time_t No All AgentCollector
SQL Text - Performance Based (PD_PDES)
Function
The SQL Text - Performance Based (PD_PDES) record stores performancedata indicating the status of SQL text that satisfies the following conditions at
Working with Records 2-315Hitachi Tuning Manager Application Reports Reference
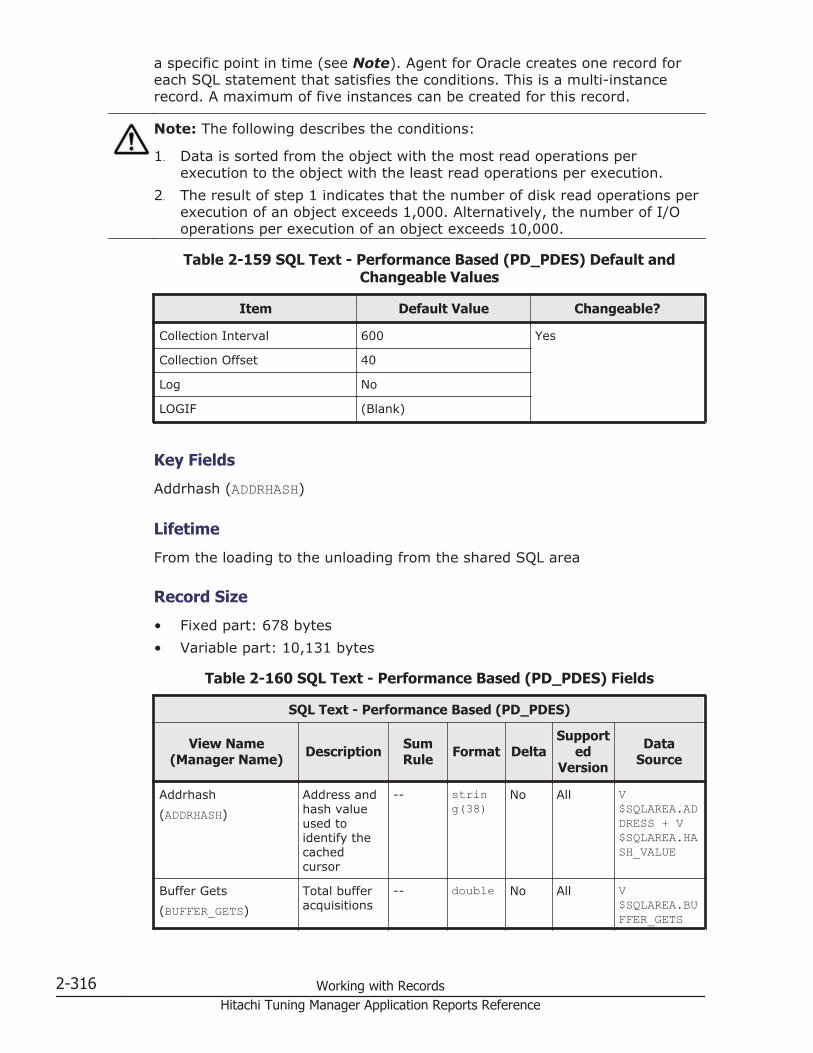
a specific point in time (see Note). Agent for Oracle creates one record foreach SQL statement that satisfies the conditions. This is a multi-instancerecord. A maximum of five instances can be created for this record.
Note: The following describes the conditions:
1. Data is sorted from the object with the most read operations perexecution to the object with the least read operations per execution.
2. The result of step 1 indicates that the number of disk read operations perexecution of an object exceeds 1,000. Alternatively, the number of I/Ooperations per execution of an object exceeds 10,000.
Table 2-159 SQL Text - Performance Based (PD_PDES) Default andChangeable Values
Item Default Value Changeable?
Collection Interval 600 Yes
Collection Offset 40
Log No
LOGIF (Blank)
Key Fields
Addrhash (ADDRHASH)
Lifetime
From the loading to the unloading from the shared SQL area
Record Size
• Fixed part: 678 bytes• Variable part: 10,131 bytes
Table 2-160 SQL Text - Performance Based (PD_PDES) Fields
SQL Text - Performance Based (PD_PDES)
View Name(Manager Name) Description Sum
Rule Format DeltaSupport
edVersion
DataSource
Addrhash(ADDRHASH)
Address andhash valueused toidentify thecachedcursor
-- string(38)
No All V$SQLAREA.ADDRESS + V$SQLAREA.HASH_VALUE
Buffer Gets(BUFFER_GETS)
Total bufferacquisitions
-- double No All V$SQLAREA.BUFFER_GETS
2-316 Working with RecordsHitachi Tuning Manager Application Reports Reference

SQL Text - Performance Based (PD_PDES)
View Name(Manager Name) Description Sum
Rule Format DeltaSupport
edVersion
DataSource
over all childcursors
Disk Reads(DISK_READS)
Total diskreadoperationsover all childcursors
-- double No All V$SQLAREA.DISK_READS
Disk Reads/Exec(DISK_READS_PER_EXECUTION)
Number ofphysical readoperationsrequired perexecution
-- double No All V$SQLAREA.DISK_READS /V$SQLAREA.EXECUTIONS
Executions(EXECUTIONS)
Number oftimes theobject wasexecutedafter thisobject wasplaced in thelibrary cache
-- double No All V$SQLAREA.EXECUTIONS
Hit %(HIT_PERCENTAGE)
Ratio (as apercent) ofbuffer readoperations toall readoperations
-- double No All 100 * (V$SQLAREA.BUFFER_GETS -V$SQLAREA.DISK_READS) /V$SQLAREA.BUFFER_GETS
Logical Reads/Exec(LOGICAL_IO_PER_EXECUTION)
Number oflogical readoperationsrequired perexecution
-- double No All V$SQLAREA.BUFFER_GETS /V$SQLAREA.EXECUTIONS
Parsing User(PARSING_USER)
User whoanalyzed theSQLstatement (ifconnecting toOracle 12cR1 or later,the user ID)
-- string(30)
No All USER$.NAMEwhere USER$.USER# = V$SQLAREA.PARSING_USER_IDIn Oracle 12cR1 and later:V$SQLAREA.PARSING_USER_ID
Working with Records 2-317Hitachi Tuning Manager Application Reports Reference

SQL Text - Performance Based (PD_PDES)
View Name(Manager Name) Description Sum
Rule Format DeltaSupport
edVersion
DataSource
Record Time(RECORD_TIME)
Collectionterminationtime for theperformancedata storedin the record
-- time_t No All AgentCollector
Record Type(INPUT_RECORD_TYPE)
Record name(alwaysPDES)
-- string(4)
No All AgentCollector
SEQNO(SEQUENCE)
Number oftimes thecursor wasfound duringdatacollection
-- ulong No All AgentCollector
SQL Text(SQL_TEXT)
SQL text forthe cursor
-- string(10000)
No All V$SQLTEXT.SQL_TEXT
Sorts(SORTS)
Total numberof sortoperationsexecuted onall childcursors
-- double No All V$SQLAREA.SORTS
Start Time(START_TIME)
Collectionstart time fortheperformancedata storedin the record
-- time_t No All AgentCollector
SQL*Net Listener (PD_PDNL)
Function
The SQL*Net Listener (PD_PDNL) record stores performance data indicatingthe status and overview of an SQL*Net Listener at a specific point in time.This status information includes the status of, and overview informationabout, the default SQL*Net Listener. If the listener is not active, the Aliasfield is empty.
If SQL*Net has not been installed, an attempt to display a report that usesthis record will display the No records returned message.
2-318 Working with RecordsHitachi Tuning Manager Application Reports Reference
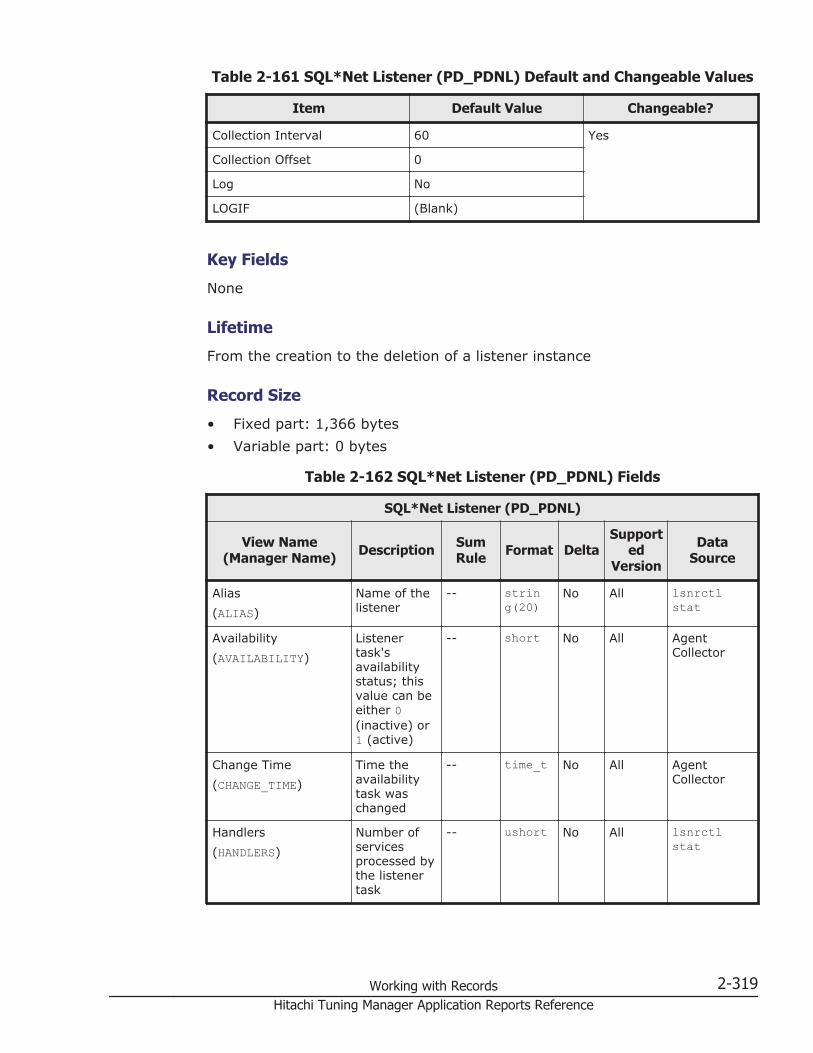
Table 2-161 SQL*Net Listener (PD_PDNL) Default and Changeable Values
Item Default Value Changeable?
Collection Interval 60 Yes
Collection Offset 0
Log No
LOGIF (Blank)
Key Fields
None
Lifetime
From the creation to the deletion of a listener instance
Record Size
• Fixed part: 1,366 bytes• Variable part: 0 bytes
Table 2-162 SQL*Net Listener (PD_PDNL) Fields
SQL*Net Listener (PD_PDNL)
View Name(Manager Name) Description Sum
Rule Format DeltaSupport
edVersion
DataSource
Alias(ALIAS)
Name of thelistener
-- string(20)
No All lsnrctlstat
Availability(AVAILABILITY)
Listenertask'savailabilitystatus; thisvalue can beeither 0(inactive) or1 (active)
-- short No All AgentCollector
Change Time(CHANGE_TIME)
Time theavailabilitytask waschanged
-- time_t No All AgentCollector
Handlers(HANDLERS)
Number ofservicesprocessed bythe listenertask
-- ushort No All lsnrctlstat
Working with Records 2-319Hitachi Tuning Manager Application Reports Reference
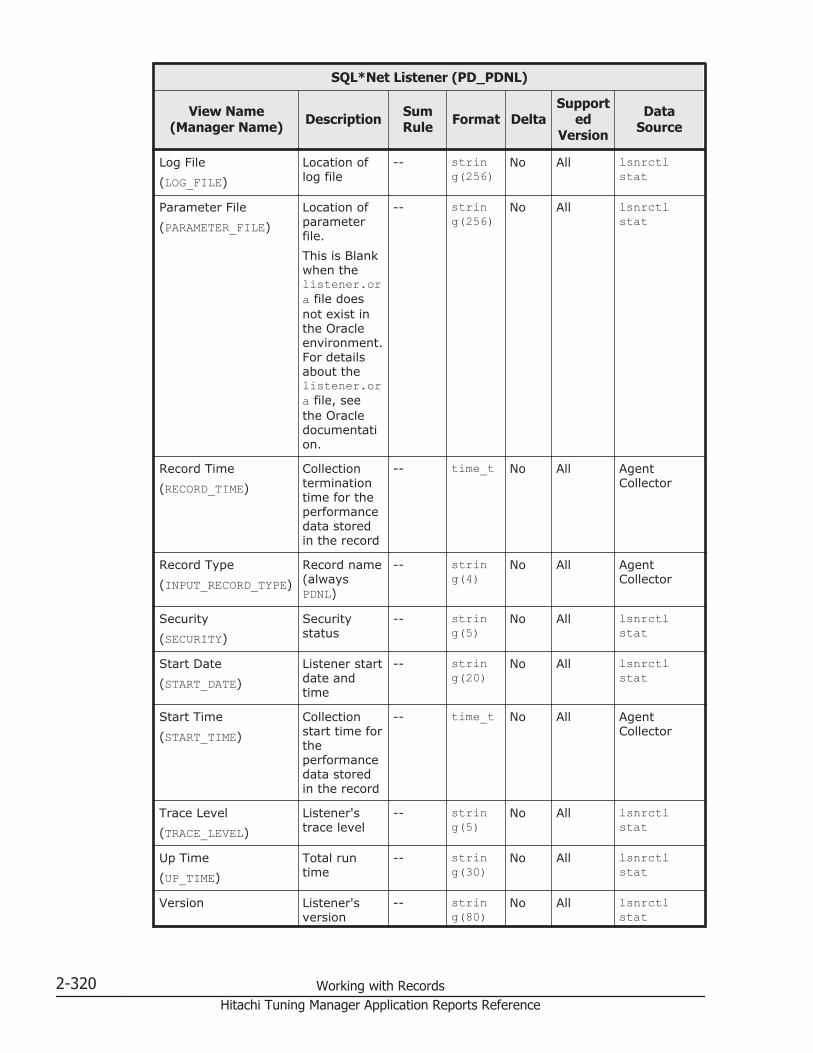
SQL*Net Listener (PD_PDNL)
View Name(Manager Name) Description Sum
Rule Format DeltaSupport
edVersion
DataSource
Log File(LOG_FILE)
Location oflog file
-- string(256)
No All lsnrctlstat
Parameter File(PARAMETER_FILE)
Location ofparameterfile.This is Blankwhen thelistener.ora file doesnot exist inthe Oracleenvironment.For detailsabout thelistener.ora file, seethe Oracledocumentation.
-- string(256)
No All lsnrctlstat
Record Time(RECORD_TIME)
Collectionterminationtime for theperformancedata storedin the record
-- time_t No All AgentCollector
Record Type(INPUT_RECORD_TYPE)
Record name(alwaysPDNL)
-- string(4)
No All AgentCollector
Security(SECURITY)
Securitystatus
-- string(5)
No All lsnrctlstat
Start Date(START_DATE)
Listener startdate andtime
-- string(20)
No All lsnrctlstat
Start Time(START_TIME)
Collectionstart time fortheperformancedata storedin the record
-- time_t No All AgentCollector
Trace Level(TRACE_LEVEL)
Listener'strace level
-- string(5)
No All lsnrctlstat
Up Time(UP_TIME)
Total runtime
-- string(30)
No All lsnrctlstat
Version Listener'sversion
-- string(80)
No All lsnrctlstat
2-320 Working with RecordsHitachi Tuning Manager Application Reports Reference

SQL*Net Listener (PD_PDNL)
View Name(Manager Name) Description Sum
Rule Format DeltaSupport
edVersion
DataSource
(VERSION)
SQL*Net Listeners (PD_PDLS)
Function
The SQL*Net Listeners (PD_PDLS) record stores performance data indicatingthe status and overview of each defined listener at a specific point in time.Agent for Oracle creates one record for each name specified inlistener_name. Only one listener can be monitored.
If you omit the listener name when setting an instance, Agent for Oraclemonitors the default listener. If the listener is not active, the Alias field isempty.
If SQL*Net has not been installed, an attempt to display a report that usesthis record will display the No records returned message.
Table 2-163 SQL*Net Listeners (PD_PDLS) Default and Changeable Values
Item Default Value Changeable?
Collection Interval 60 Yes
Collection Offset 0
Log No
LOGIF (Blank)
Key Fields
Alias (ALIAS)
Lifetime
From the creation to the deletion of a listener instance
Record Size
• Fixed part: 678 bytes• Variable part: 688 bytes
Working with Records 2-321Hitachi Tuning Manager Application Reports Reference
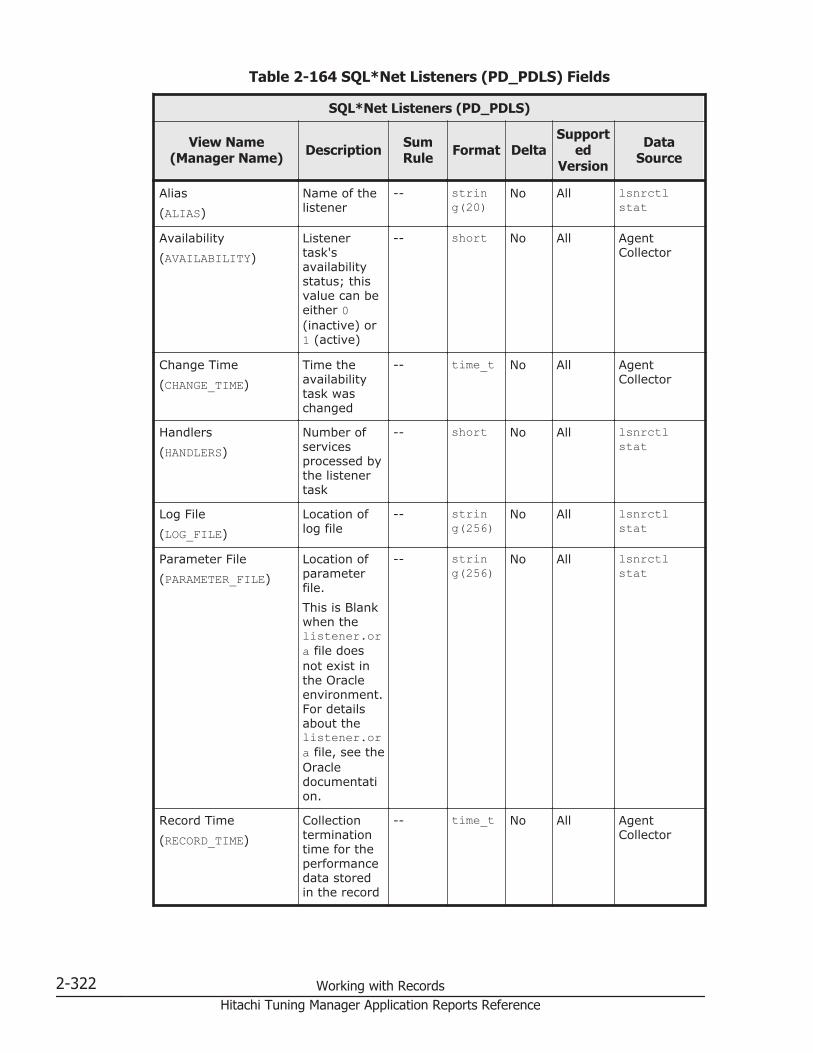
Table 2-164 SQL*Net Listeners (PD_PDLS) Fields
SQL*Net Listeners (PD_PDLS)
View Name(Manager Name) Description Sum
Rule Format DeltaSupport
edVersion
DataSource
Alias(ALIAS)
Name of thelistener
-- string(20)
No All lsnrctlstat
Availability(AVAILABILITY)
Listenertask'savailabilitystatus; thisvalue can beeither 0(inactive) or1 (active)
-- short No All AgentCollector
Change Time(CHANGE_TIME)
Time theavailabilitytask waschanged
-- time_t No All AgentCollector
Handlers(HANDLERS)
Number ofservicesprocessed bythe listenertask
-- short No All lsnrctlstat
Log File(LOG_FILE)
Location oflog file
-- string(256)
No All lsnrctlstat
Parameter File(PARAMETER_FILE)
Location ofparameterfile.This is Blankwhen thelistener.ora file doesnot exist inthe Oracleenvironment.For detailsabout thelistener.ora file, see theOracledocumentation.
-- string(256)
No All lsnrctlstat
Record Time(RECORD_TIME)
Collectionterminationtime for theperformancedata storedin the record
-- time_t No All AgentCollector
2-322 Working with RecordsHitachi Tuning Manager Application Reports Reference
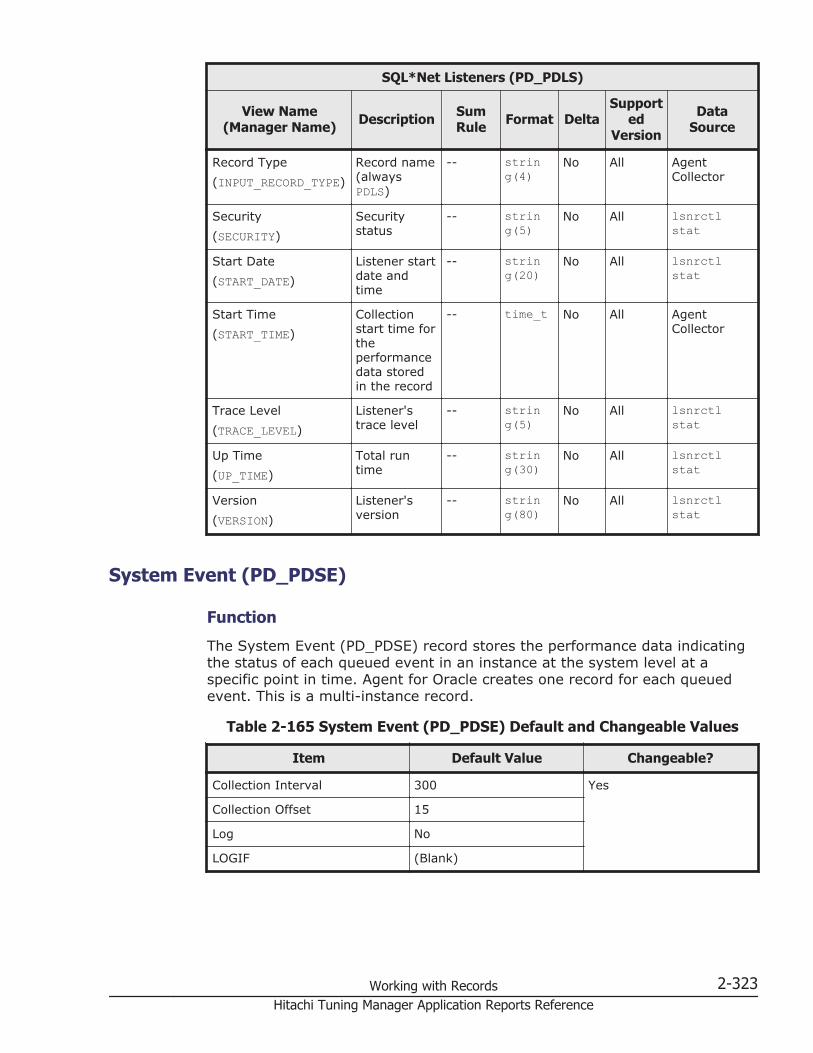
SQL*Net Listeners (PD_PDLS)
View Name(Manager Name) Description Sum
Rule Format DeltaSupport
edVersion
DataSource
Record Type(INPUT_RECORD_TYPE)
Record name(alwaysPDLS)
-- string(4)
No All AgentCollector
Security(SECURITY)
Securitystatus
-- string(5)
No All lsnrctlstat
Start Date(START_DATE)
Listener startdate andtime
-- string(20)
No All lsnrctlstat
Start Time(START_TIME)
Collectionstart time fortheperformancedata storedin the record
-- time_t No All AgentCollector
Trace Level(TRACE_LEVEL)
Listener'strace level
-- string(5)
No All lsnrctlstat
Up Time(UP_TIME)
Total runtime
-- string(30)
No All lsnrctlstat
Version(VERSION)
Listener'sversion
-- string(80)
No All lsnrctlstat
System Event (PD_PDSE)
Function
The System Event (PD_PDSE) record stores the performance data indicatingthe status of each queued event in an instance at the system level at aspecific point in time. Agent for Oracle creates one record for each queuedevent. This is a multi-instance record.
Table 2-165 System Event (PD_PDSE) Default and Changeable Values
Item Default Value Changeable?
Collection Interval 300 Yes
Collection Offset 15
Log No
LOGIF (Blank)
Working with Records 2-323Hitachi Tuning Manager Application Reports Reference

Key Fields
Event (EVENT)
Lifetime
From the creation to the deletion of an Oracle instance
Record Size
• Fixed part: 678 bytes• Variable part: 97 bytes
Table 2-166 System Event (PD_PDSE) Fields
System Event (PD_PDSE)
View Name(Manager Name) Description Sum
Rule Format DeltaSupport
edVersion
DataSource
Avg Wait(AVERAGE_WAIT)
Average waittime for theevent inhundredthsof a second(to collectthe value ofthis field, theTIMED_STATISTICSparametermust be setto TRUE inthe init.orafile)
-- double No All V$SYSTEM_EVENT.AVERAGE_WAIT
Event(EVENT)
Name of theevent thesystem iswaiting for
-- string(64)
No All V$SYSTEM_EVENT.EVENT
Record Time(RECORD_TIME)
Collectionterminationtime for theperformancedata storedin the record
-- time_t No All AgentCollector
Record Type(INPUT_RECORD_TYPE)
Record name(alwaysPDSE)
-- string(4)
No All AgentCollector
Start Time(START_TIME)
Collectionstart time fortheperformancedata storedin the record
-- time_t No All AgentCollector
2-324 Working with RecordsHitachi Tuning Manager Application Reports Reference

System Event (PD_PDSE)
View Name(Manager Name) Description Sum
Rule Format DeltaSupport
edVersion
DataSource
Time Waited(TIME_WAITED)
Total waittime for theevent inhundredthsof a second(to collectthe value ofthis field, theTIMED_STATISTICSparametermust be setto TRUE inthe init.orafile)
-- double No All V$SYSTEM_EVENT.TIME_WAITED
Total Timeouts(TOTAL_TIMEOUTS)
Number oftimeouts forthe event
-- double No All V$SYSTEM_EVENT.TOTAL_TIMEOUTS
Total Waits(TOTAL_WAITS)
Number ofwaits for theevent
-- double No All V$SYSTEM_EVENT.TOTAL_WAITS
System Event Interval (PI_PISE)
Function
The System Event Interval (PI_PISE) record stores performance data, takenat specific intervals, about each queued event in an instance at the systemlevel. Agent for Oracle creates one record for each queued event. This is amulti-instance record.
Table 2-167 System Event Interval (PI_PISE) Default and ChangeableValues
Item Default Value Changeable?
Collection Interval 300 Yes
Collection Offset 10
Log No
LOGIF (Blank)
Working with Records 2-325Hitachi Tuning Manager Application Reports Reference
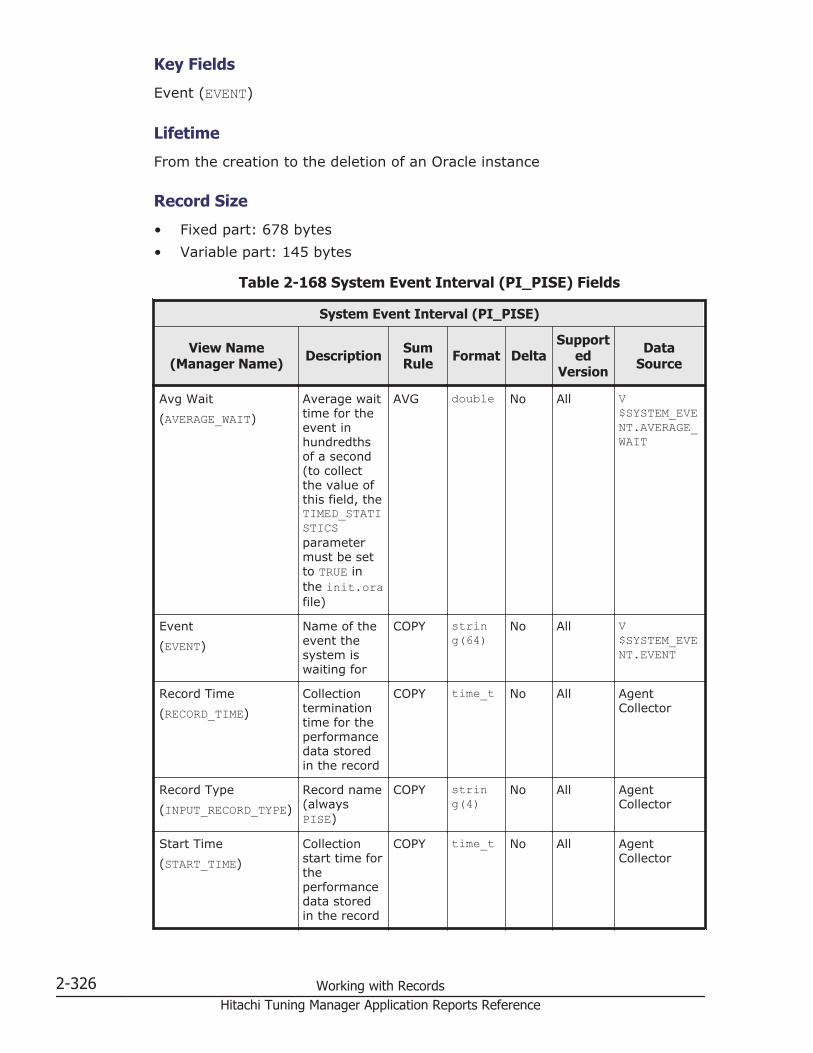
Key Fields
Event (EVENT)
Lifetime
From the creation to the deletion of an Oracle instance
Record Size
• Fixed part: 678 bytes• Variable part: 145 bytes
Table 2-168 System Event Interval (PI_PISE) Fields
System Event Interval (PI_PISE)
View Name(Manager Name) Description Sum
Rule Format DeltaSupport
edVersion
DataSource
Avg Wait(AVERAGE_WAIT)
Average waittime for theevent inhundredthsof a second(to collectthe value ofthis field, theTIMED_STATISTICSparametermust be setto TRUE inthe init.orafile)
AVG double No All V$SYSTEM_EVENT.AVERAGE_WAIT
Event(EVENT)
Name of theevent thesystem iswaiting for
COPY string(64)
No All V$SYSTEM_EVENT.EVENT
Record Time(RECORD_TIME)
Collectionterminationtime for theperformancedata storedin the record
COPY time_t No All AgentCollector
Record Type(INPUT_RECORD_TYPE)
Record name(alwaysPISE)
COPY string(4)
No All AgentCollector
Start Time(START_TIME)
Collectionstart time fortheperformancedata storedin the record
COPY time_t No All AgentCollector
2-326 Working with RecordsHitachi Tuning Manager Application Reports Reference
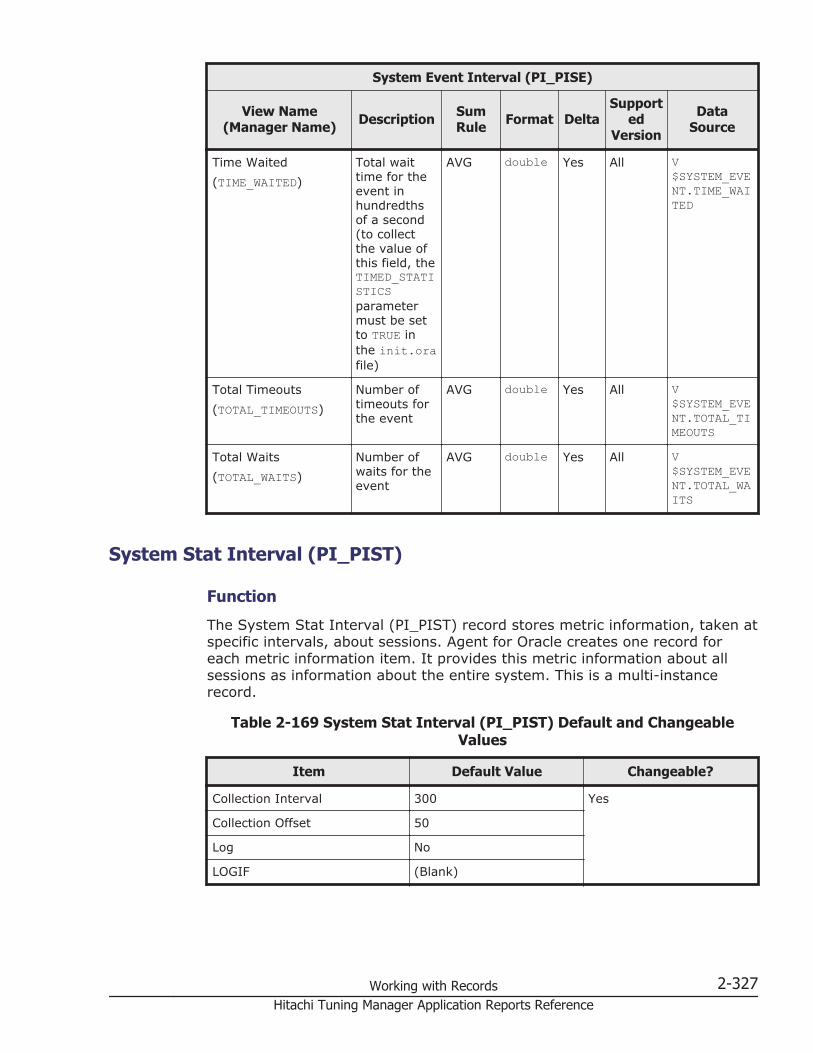
System Event Interval (PI_PISE)
View Name(Manager Name) Description Sum
Rule Format DeltaSupport
edVersion
DataSource
Time Waited(TIME_WAITED)
Total waittime for theevent inhundredthsof a second(to collectthe value ofthis field, theTIMED_STATISTICSparametermust be setto TRUE inthe init.orafile)
AVG double Yes All V$SYSTEM_EVENT.TIME_WAITED
Total Timeouts(TOTAL_TIMEOUTS)
Number oftimeouts forthe event
AVG double Yes All V$SYSTEM_EVENT.TOTAL_TIMEOUTS
Total Waits(TOTAL_WAITS)
Number ofwaits for theevent
AVG double Yes All V$SYSTEM_EVENT.TOTAL_WAITS
System Stat Interval (PI_PIST)
Function
The System Stat Interval (PI_PIST) record stores metric information, taken atspecific intervals, about sessions. Agent for Oracle creates one record foreach metric information item. It provides this metric information about allsessions as information about the entire system. This is a multi-instancerecord.
Table 2-169 System Stat Interval (PI_PIST) Default and ChangeableValues
Item Default Value Changeable?
Collection Interval 300 Yes
Collection Offset 50
Log No
LOGIF (Blank)
Working with Records 2-327Hitachi Tuning Manager Application Reports Reference
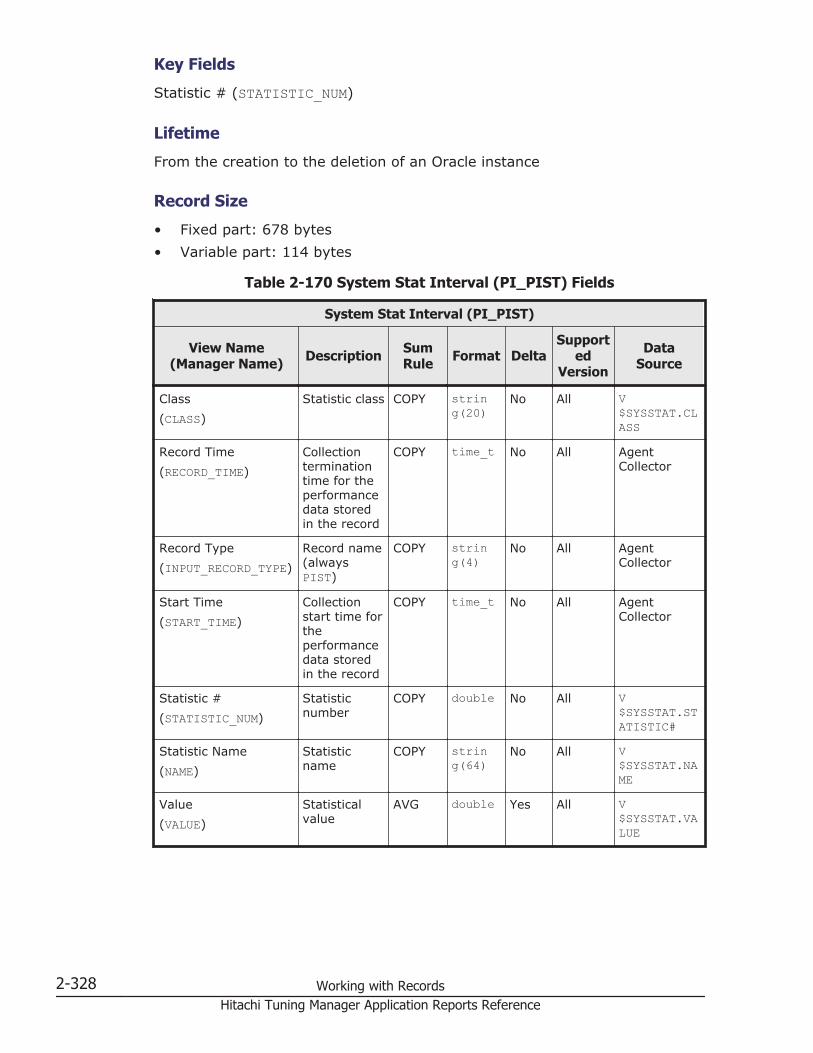
Key Fields
Statistic # (STATISTIC_NUM)
Lifetime
From the creation to the deletion of an Oracle instance
Record Size
• Fixed part: 678 bytes• Variable part: 114 bytes
Table 2-170 System Stat Interval (PI_PIST) Fields
System Stat Interval (PI_PIST)
View Name(Manager Name) Description Sum
Rule Format DeltaSupport
edVersion
DataSource
Class(CLASS)
Statistic class COPY string(20)
No All V$SYSSTAT.CLASS
Record Time(RECORD_TIME)
Collectionterminationtime for theperformancedata storedin the record
COPY time_t No All AgentCollector
Record Type(INPUT_RECORD_TYPE)
Record name(alwaysPIST)
COPY string(4)
No All AgentCollector
Start Time(START_TIME)
Collectionstart time fortheperformancedata storedin the record
COPY time_t No All AgentCollector
Statistic #(STATISTIC_NUM)
Statisticnumber
COPY double No All V$SYSSTAT.STATISTIC#
Statistic Name(NAME)
Statisticname
COPY string(64)
No All V$SYSSTAT.NAME
Value(VALUE)
Statisticalvalue
AVG double Yes All V$SYSSTAT.VALUE
2-328 Working with RecordsHitachi Tuning Manager Application Reports Reference
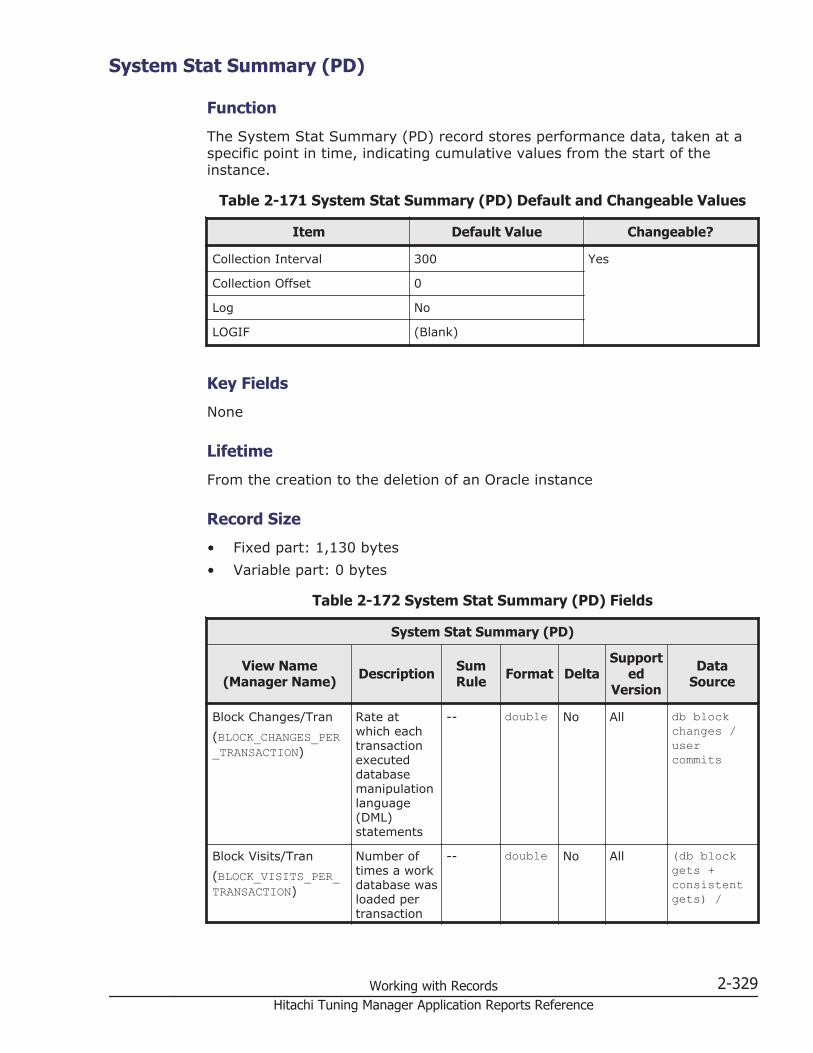
System Stat Summary (PD)
Function
The System Stat Summary (PD) record stores performance data, taken at aspecific point in time, indicating cumulative values from the start of theinstance.
Table 2-171 System Stat Summary (PD) Default and Changeable Values
Item Default Value Changeable?
Collection Interval 300 Yes
Collection Offset 0
Log No
LOGIF (Blank)
Key Fields
None
Lifetime
From the creation to the deletion of an Oracle instance
Record Size
• Fixed part: 1,130 bytes• Variable part: 0 bytes
Table 2-172 System Stat Summary (PD) Fields
System Stat Summary (PD)
View Name(Manager Name) Description Sum
Rule Format DeltaSupport
edVersion
DataSource
Block Changes/Tran(BLOCK_CHANGES_PER_TRANSACTION)
Rate atwhich eachtransactionexecuteddatabasemanipulationlanguage(DML)statements
-- double No All db blockchanges /usercommits
Block Visits/Tran(BLOCK_VISITS_PER_TRANSACTION)
Number oftimes a workdatabase wasloaded pertransaction
-- double No All (db blockgets +consistentgets) /
Working with Records 2-329Hitachi Tuning Manager Application Reports Reference
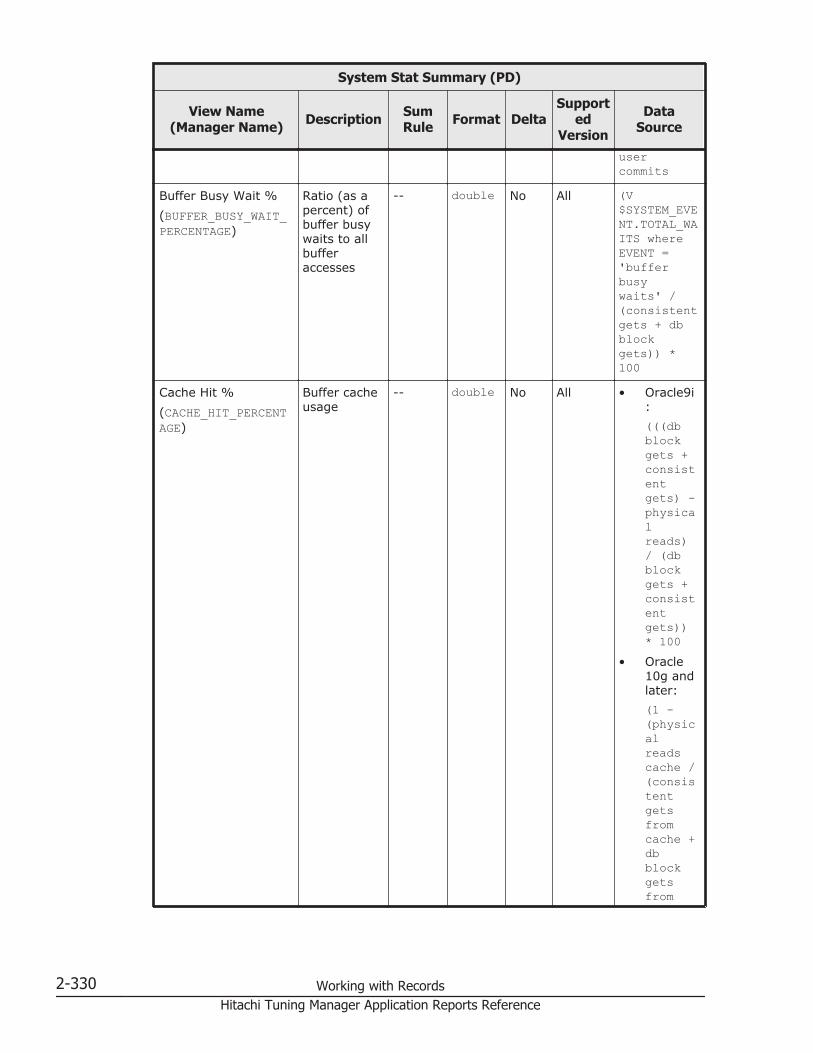
System Stat Summary (PD)
View Name(Manager Name) Description Sum
Rule Format DeltaSupport
edVersion
DataSource
usercommits
Buffer Busy Wait %(BUFFER_BUSY_WAIT_PERCENTAGE)
Ratio (as apercent) ofbuffer busywaits to allbufferaccesses
-- double No All (V$SYSTEM_EVENT.TOTAL_WAITS whereEVENT ='bufferbusywaits' /(consistentgets + dbblockgets)) *100
Cache Hit %(CACHE_HIT_PERCENTAGE)
Buffer cacheusage
-- double No All • Oracle9i:(((dbblockgets +consistentgets) -physicalreads)/ (dbblockgets +consistentgets))* 100
• Oracle10g andlater:(1 -(physicalreadscache /(consistentgetsfromcache +dbblockgetsfrom
2-330 Working with RecordsHitachi Tuning Manager Application Reports Reference
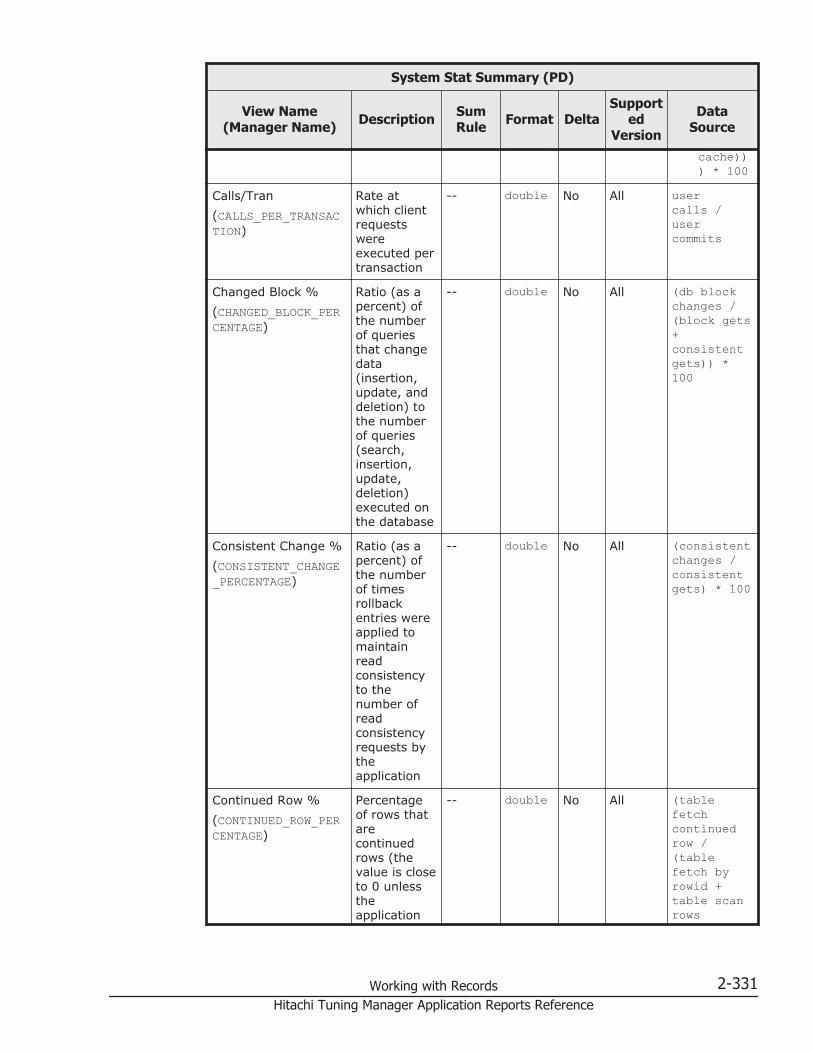
System Stat Summary (PD)
View Name(Manager Name) Description Sum
Rule Format DeltaSupport
edVersion
DataSource
cache))) * 100
Calls/Tran(CALLS_PER_TRANSACTION)
Rate atwhich clientrequestswereexecuted pertransaction
-- double No All usercalls /usercommits
Changed Block %(CHANGED_BLOCK_PERCENTAGE)
Ratio (as apercent) ofthe numberof queriesthat changedata(insertion,update, anddeletion) tothe numberof queries(search,insertion,update,deletion)executed onthe database
-- double No All (db blockchanges /(block gets+consistentgets)) *100
Consistent Change %(CONSISTENT_CHANGE_PERCENTAGE)
Ratio (as apercent) ofthe numberof timesrollbackentries wereapplied tomaintainreadconsistencyto thenumber ofreadconsistencyrequests bytheapplication
-- double No All (consistentchanges /consistentgets) * 100
Continued Row %(CONTINUED_ROW_PERCENTAGE)
Percentageof rows thatarecontinuedrows (thevalue is closeto 0 unlesstheapplication
-- double No All (tablefetchcontinuedrow /(tablefetch byrowid +table scanrows
Working with Records 2-331Hitachi Tuning Manager Application Reports Reference
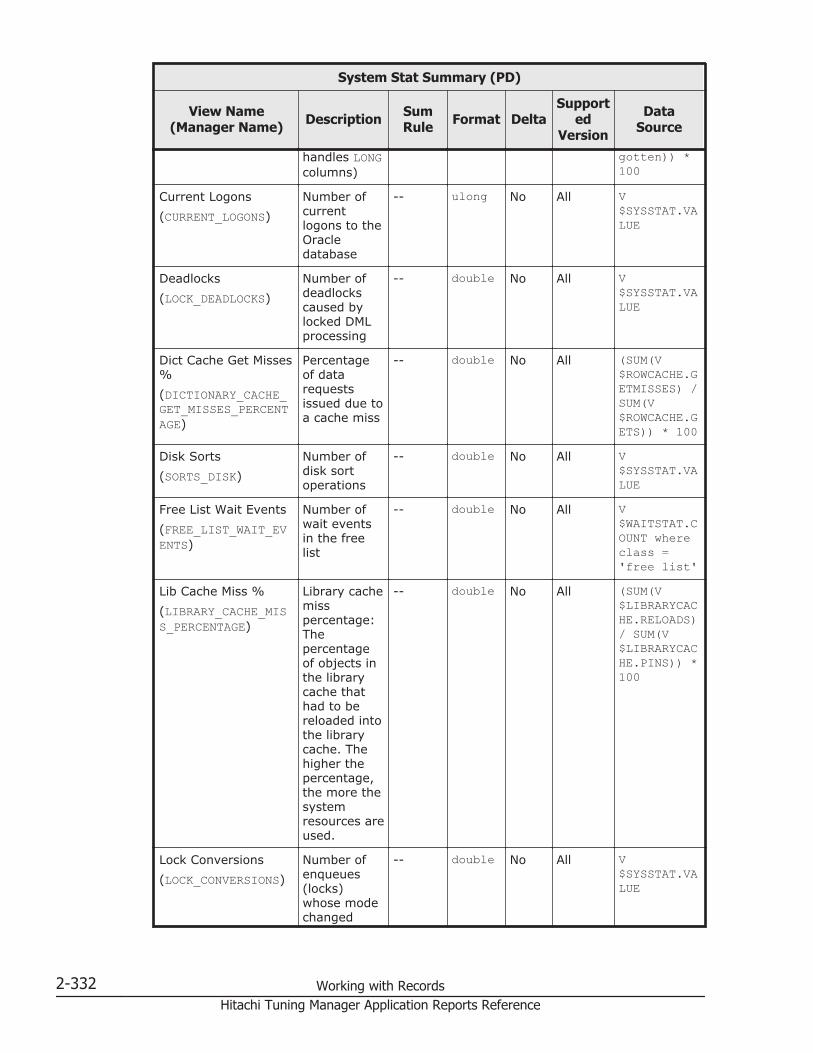
System Stat Summary (PD)
View Name(Manager Name) Description Sum
Rule Format DeltaSupport
edVersion
DataSource
handles LONGcolumns)
gotten)) *100
Current Logons(CURRENT_LOGONS)
Number ofcurrentlogons to theOracledatabase
-- ulong No All V$SYSSTAT.VALUE
Deadlocks(LOCK_DEADLOCKS)
Number ofdeadlockscaused bylocked DMLprocessing
-- double No All V$SYSSTAT.VALUE
Dict Cache Get Misses%(DICTIONARY_CACHE_GET_MISSES_PERCENTAGE)
Percentageof datarequestsissued due toa cache miss
-- double No All (SUM(V$ROWCACHE.GETMISSES) /SUM(V$ROWCACHE.GETS)) * 100
Disk Sorts(SORTS_DISK)
Number ofdisk sortoperations
-- double No All V$SYSSTAT.VALUE
Free List Wait Events(FREE_LIST_WAIT_EVENTS)
Number ofwait eventsin the freelist
-- double No All V$WAITSTAT.COUNT whereclass ='free list'
Lib Cache Miss %(LIBRARY_CACHE_MISS_PERCENTAGE)
Library cachemisspercentage:Thepercentageof objects inthe librarycache thathad to bereloaded intothe librarycache. Thehigher thepercentage,the more thesystemresources areused.
-- double No All (SUM(V$LIBRARYCACHE.RELOADS)/ SUM(V$LIBRARYCACHE.PINS)) *100
Lock Conversions(LOCK_CONVERSIONS)
Number ofenqueues(locks)whose modechanged
-- double No All V$SYSSTAT.VALUE
2-332 Working with RecordsHitachi Tuning Manager Application Reports Reference
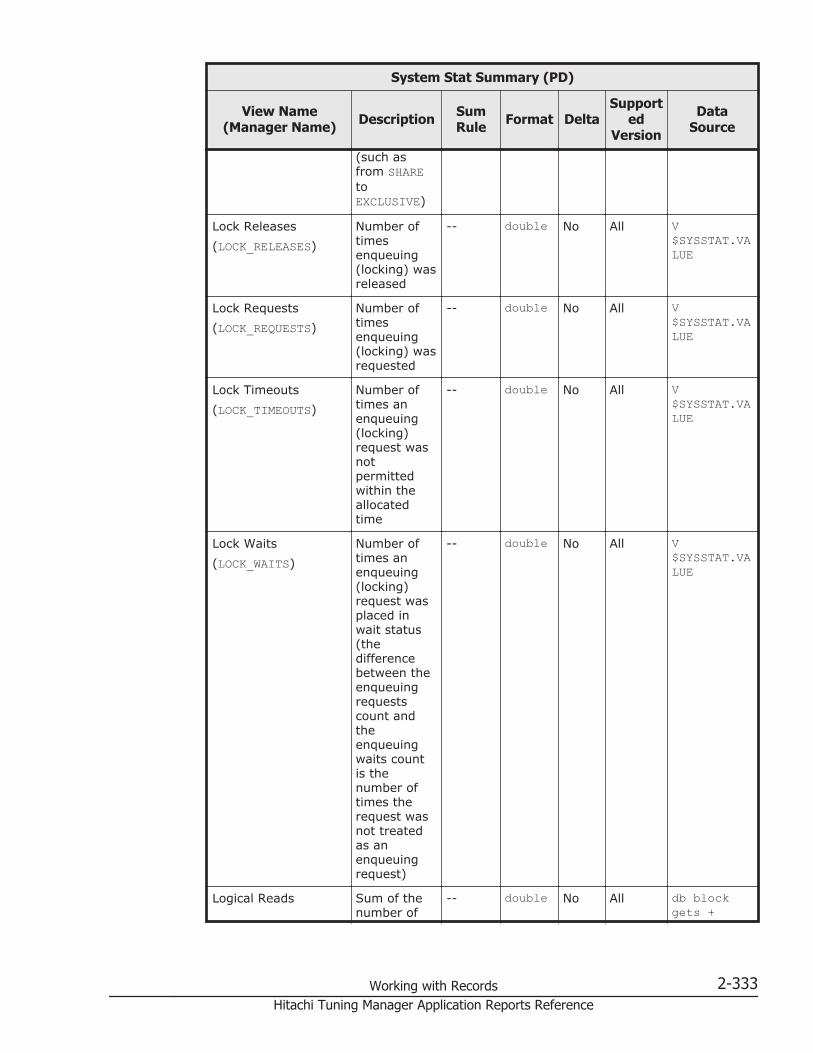
System Stat Summary (PD)
View Name(Manager Name) Description Sum
Rule Format DeltaSupport
edVersion
DataSource
(such asfrom SHAREtoEXCLUSIVE)
Lock Releases(LOCK_RELEASES)
Number oftimesenqueuing(locking) wasreleased
-- double No All V$SYSSTAT.VALUE
Lock Requests(LOCK_REQUESTS)
Number oftimesenqueuing(locking) wasrequested
-- double No All V$SYSSTAT.VALUE
Lock Timeouts(LOCK_TIMEOUTS)
Number oftimes anenqueuing(locking)request wasnotpermittedwithin theallocatedtime
-- double No All V$SYSSTAT.VALUE
Lock Waits(LOCK_WAITS)
Number oftimes anenqueuing(locking)request wasplaced inwait status(thedifferencebetween theenqueuingrequestscount andtheenqueuingwaits countis thenumber oftimes therequest wasnot treatedas anenqueuingrequest)
-- double No All V$SYSSTAT.VALUE
Logical Reads Sum of thenumber of
-- double No All db blockgets +
Working with Records 2-333Hitachi Tuning Manager Application Reports Reference
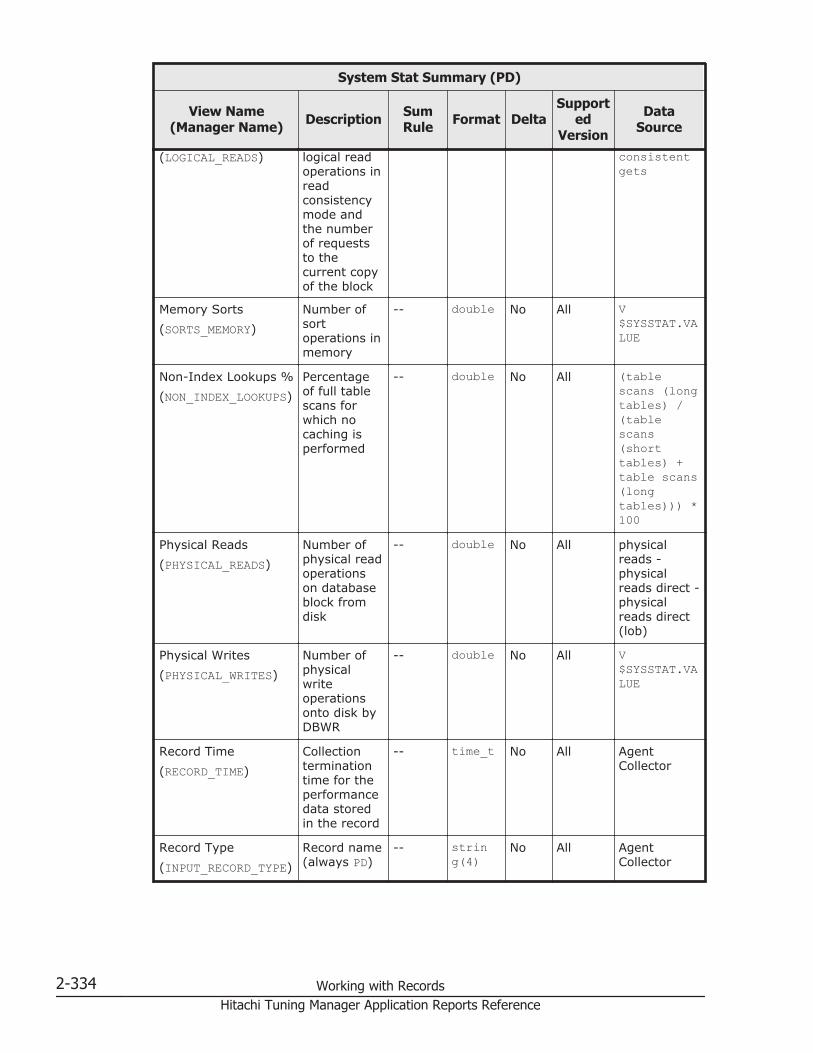
System Stat Summary (PD)
View Name(Manager Name) Description Sum
Rule Format DeltaSupport
edVersion
DataSource
(LOGICAL_READS) logical readoperations inreadconsistencymode andthe numberof requeststo thecurrent copyof the block
consistentgets
Memory Sorts(SORTS_MEMORY)
Number ofsortoperations inmemory
-- double No All V$SYSSTAT.VALUE
Non-Index Lookups %(NON_INDEX_LOOKUPS)
Percentageof full tablescans forwhich nocaching isperformed
-- double No All (tablescans (longtables) /(tablescans(shorttables) +table scans(longtables))) *100
Physical Reads(PHYSICAL_READS)
Number ofphysical readoperationson databaseblock fromdisk
-- double No All physicalreads -physicalreads direct -physicalreads direct(lob)
Physical Writes(PHYSICAL_WRITES)
Number ofphysicalwriteoperationsonto disk byDBWR
-- double No All V$SYSSTAT.VALUE
Record Time(RECORD_TIME)
Collectionterminationtime for theperformancedata storedin the record
-- time_t No All AgentCollector
Record Type(INPUT_RECORD_TYPE)
Record name(always PD)
-- string(4)
No All AgentCollector
2-334 Working with RecordsHitachi Tuning Manager Application Reports Reference

System Stat Summary (PD)
View Name(Manager Name) Description Sum
Rule Format DeltaSupport
edVersion
DataSource
Recursive Calls(RECURSIVE_CALLS)
Number ofuser callsprocessed
-- double No All V$SYSSTAT.VALUE
Recursive To UserCall %(RECURSIVE_TO_USER_CALL_PERCENTAGE)
Correctvaluescannot becollected forthis field.Percentageindicatingoverhead
-- double No All (recursivecalls /user calls)* 100
Redo Alloc Immediate%(REDO_ALLOC_IMMEDIATE_HIT_PERCENTAGE)
Success rateofimmediatelyacquiringREDOallocationlatch
-- double No All (1 - (V$LATCH.IMMEDIATE_MISSES / (V$LATCH.IMMEDIATE_GETS+ V$LATCH.IMMEDIATE_MISSES))) * 100where V$LATCH.NAME= 'redoallocation'
Redo Alloc Willing toWait %(REDO_ALLOC_WILLING_TO_WAIT_HIT_PERCENTAGE)
Success rateof acquiringREDOallocationlatch fromcache
-- double No All (1 - (V$LATCH.MISSES / V$LATCH.GETS)) * 100where name= 'redoallocation'
Redo Copy Immediate%(REDO_COPY_IMMEDIATE_HIT_PERCENTAGE)
Success rateofimmediatelyacquiringREDO copylatch
-- double No All (1 - (V$LATCH.IMMEDIATE_MISSES / (V$LATCH.MMEDIATE_GETS +V$LATCH.IMMEDIATE_MISSES))) * 100where name= 'redocopy'
Redo Copy Willing toWait %
Success rateof acquiringREDO copy
-- double No All (1 - (V$LATCH.MISSES / V
Working with Records 2-335Hitachi Tuning Manager Application Reports Reference
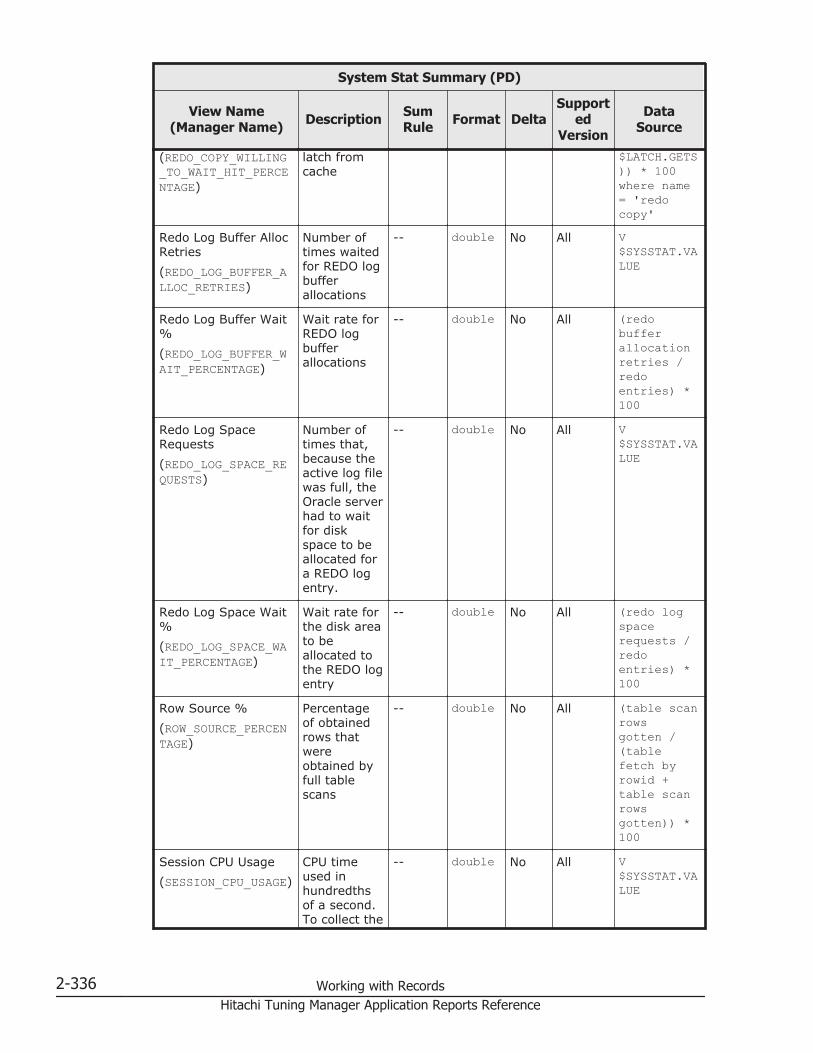
System Stat Summary (PD)
View Name(Manager Name) Description Sum
Rule Format DeltaSupport
edVersion
DataSource
(REDO_COPY_WILLING_TO_WAIT_HIT_PERCENTAGE)
latch fromcache
$LATCH.GETS)) * 100where name= 'redocopy'
Redo Log Buffer AllocRetries(REDO_LOG_BUFFER_ALLOC_RETRIES)
Number oftimes waitedfor REDO logbufferallocations
-- double No All V$SYSSTAT.VALUE
Redo Log Buffer Wait%(REDO_LOG_BUFFER_WAIT_PERCENTAGE)
Wait rate forREDO logbufferallocations
-- double No All (redobufferallocationretries /redoentries) *100
Redo Log SpaceRequests(REDO_LOG_SPACE_REQUESTS)
Number oftimes that,because theactive log filewas full, theOracle serverhad to waitfor diskspace to beallocated fora REDO logentry.
-- double No All V$SYSSTAT.VALUE
Redo Log Space Wait%(REDO_LOG_SPACE_WAIT_PERCENTAGE)
Wait rate forthe disk areato beallocated tothe REDO logentry
-- double No All (redo logspacerequests /redoentries) *100
Row Source %(ROW_SOURCE_PERCENTAGE)
Percentageof obtainedrows thatwereobtained byfull tablescans
-- double No All (table scanrowsgotten /(tablefetch byrowid +table scanrowsgotten)) *100
Session CPU Usage(SESSION_CPU_USAGE)
CPU timeused inhundredthsof a second.To collect the
-- double No All V$SYSSTAT.VALUE
2-336 Working with RecordsHitachi Tuning Manager Application Reports Reference

System Stat Summary (PD)
View Name(Manager Name) Description Sum
Rule Format DeltaSupport
edVersion
DataSource
value of thisfield, theTIMED_STATISTICSparametermust be setto TRUE inthe init.orafile.
Session Cursor CacheCount(SESSION_CURSOR_CACHE_COUNT)
Number ofsessioncursorscached (themaximumnumber ofcursors thatcan becached isdeterminedby theSESSION_CACHED_CURSORSparameter inthe init.orafile)
-- double No All V$SYSSTAT.VALUE
Session Cursor CacheHit %(SESSION_CURSOR_CACHE_HIT_PERCENTAGE)
Hit rate ofanalysis callsin session'scursor cache
-- double No All (sessioncursorcachehits /sessioncursorcachecount) *100
Session Cursor CacheHits(SESSION_CURSOR_CACHE_HITS)
Number oftimes acursor wasfound in thesession'scursor cacheby analysiscall
-- double No All V$SYSSTAT.VALUE
Session PGA Memory(SESSION_PGA_MEMORY)
Size of PGAmemorycurrentlybeing used inbytes
-- double No All SUM(V$SESSTAT.VALUE)
Session UGA Memory Size of usedsession
-- double No All SUM(V$SESSTAT.VALUE)
Working with Records 2-337Hitachi Tuning Manager Application Reports Reference

System Stat Summary (PD)
View Name(Manager Name) Description Sum
Rule Format DeltaSupport
edVersion
DataSource
(SESSION_UGA_MEMORY)
memory inbytes
Sort Overflow %(SORT_OVERFLOW_PERCENTAGE)
Percentageof sorts thatusedtemporarysegments
-- double No All (sorts(disk) /(sorts(memory) +sorts(disk))) *100
SQL Executing(SQL_EXECUTING)
This field isnotsupported.Number ofcurrent SQLexecutions
-- double No Unsupported
AgentCollector
SQL Net Bytes Rcvd(SQL_NET_BYTES_RECEIVED)
Amount ofdata receivedfrom clientvia SQL*Net
-- double No All V$SYSSTAT.VALUE
SQL Net Bytes Sent(SQL_NET_BYTES_SENT)
Amount ofdata sent toclient viaSQL*Net
-- double No All V$SYSSTAT.VALUE
Start Time(START_TIME)
Collectionstart time fortheperformancedata storedin the record
-- time_t No All AgentCollector
Sys Undo Blk WaitEvents(SYSTEM_UNDO_BLOCK_WAIT_EVENTS)
Number ofblock waitevents forsystem'srollbacksegment
-- double No All V$WAITSTAT.COUNT whereclass ='systemundo block'
Sys Undo Hdr WaitEvents(SYSTEM_UNDO_HEADER_WAIT_EVENTS)
Number ofheader blockwait eventsfor system'srollbacksegment
-- double No All V$WAITSTAT.COUNT whereclass ='systemundoheader'
Total Logons(TOTAL_LOGONS)
Number oflogons to theserver
-- double No All V$SYSSTAT.VALUE
2-338 Working with RecordsHitachi Tuning Manager Application Reports Reference

System Stat Summary (PD)
View Name(Manager Name) Description Sum
Rule Format DeltaSupport
edVersion
DataSource
Total SQL Executions(TOTAL_SQL_EXECUTIONS)
Total numberof SQLexecutions
-- double No All executecount
Undo Blk Wait Events(UNDO_BLOCK_WAIT_EVENTS)
Number ofblock waitevents forotherrollbacksegments
-- double No All V$WAITSTAT.COUNT whereclass ='undoblock'
Undo Hdr Wait Events(UNDO_HEADER_WAIT_EVENTS)
Number ofheader blockwait eventsfor otherrollbacksegments
-- double No All V$WAITSTAT.COUNT whereclass ='undoheader'
User Calls(USER_CALLS)
Number ofuser callsprocessed
-- double No All V$SYSSTAT.VALUE
User Calls / Parse(USER_CALLS_PER_PARSE)
Applicationmanagementstatus in thecontext area
-- double No All usercalls /parse count(total)
User Commits(USER_COMMITS)
Number oftransactions
-- double No All V$SYSSTAT.VALUE
User Rollback %(USER_ROLLBACK_PERCENTAGE)
Percentageof applicationtransactionsthat failed
-- double No All (userrollbacks /(usercommits +userrollbacks))* 100
User Rollbacks(USER_ROLLBACKS)
Number ofrollbacks
-- double No All V$SYSSTAT.VALUE
Write %(WRITE_PERCENTAGE)
Ratio (as apercent) ofphysicalwrites to allphysical I/Os(reads andwrites)
-- double No All (physicalwrites /(physicalreads +physicalwrites)) *100
Working with Records 2-339Hitachi Tuning Manager Application Reports Reference
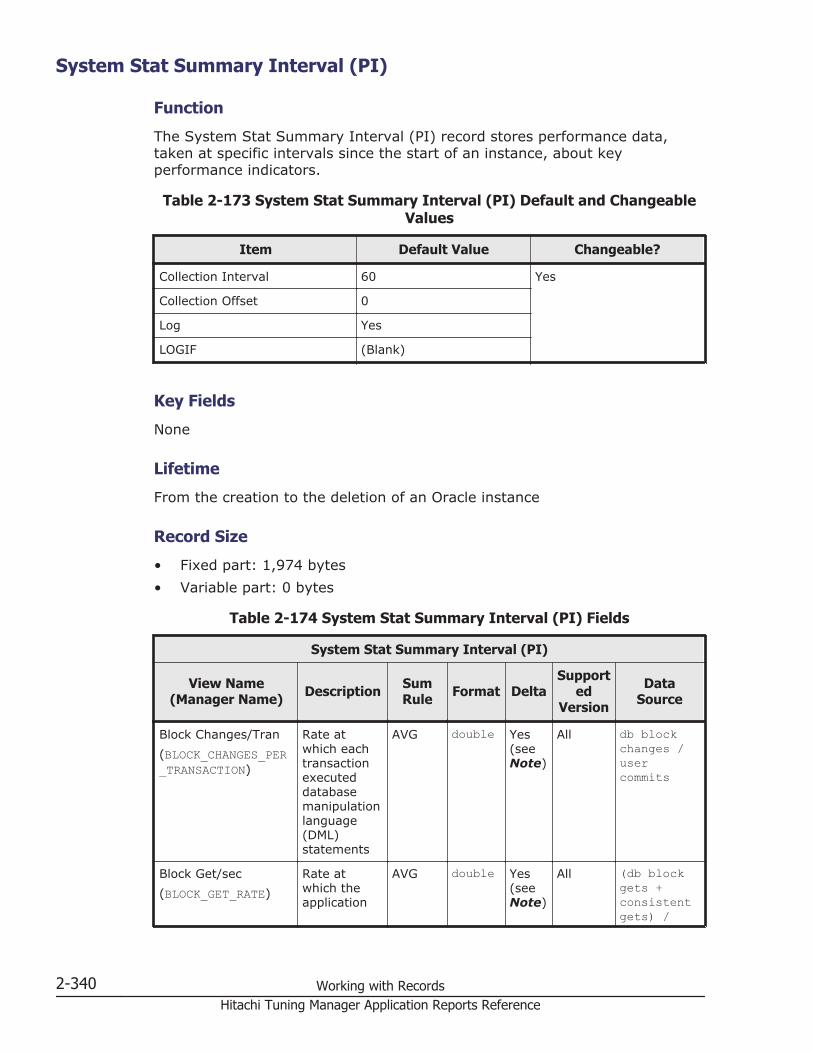
System Stat Summary Interval (PI)
Function
The System Stat Summary Interval (PI) record stores performance data,taken at specific intervals since the start of an instance, about keyperformance indicators.
Table 2-173 System Stat Summary Interval (PI) Default and ChangeableValues
Item Default Value Changeable?
Collection Interval 60 Yes
Collection Offset 0
Log Yes
LOGIF (Blank)
Key Fields
None
Lifetime
From the creation to the deletion of an Oracle instance
Record Size
• Fixed part: 1,974 bytes• Variable part: 0 bytes
Table 2-174 System Stat Summary Interval (PI) Fields
System Stat Summary Interval (PI)
View Name(Manager Name) Description Sum
Rule Format DeltaSupport
edVersion
DataSource
Block Changes/Tran(BLOCK_CHANGES_PER_TRANSACTION)
Rate atwhich eachtransactionexecuteddatabasemanipulationlanguage(DML)statements
AVG double Yes(seeNote)
All db blockchanges /usercommits
Block Get/sec(BLOCK_GET_RATE)
Rate atwhich theapplication
AVG double Yes(seeNote)
All (db blockgets +consistentgets) /
2-340 Working with RecordsHitachi Tuning Manager Application Reports Reference
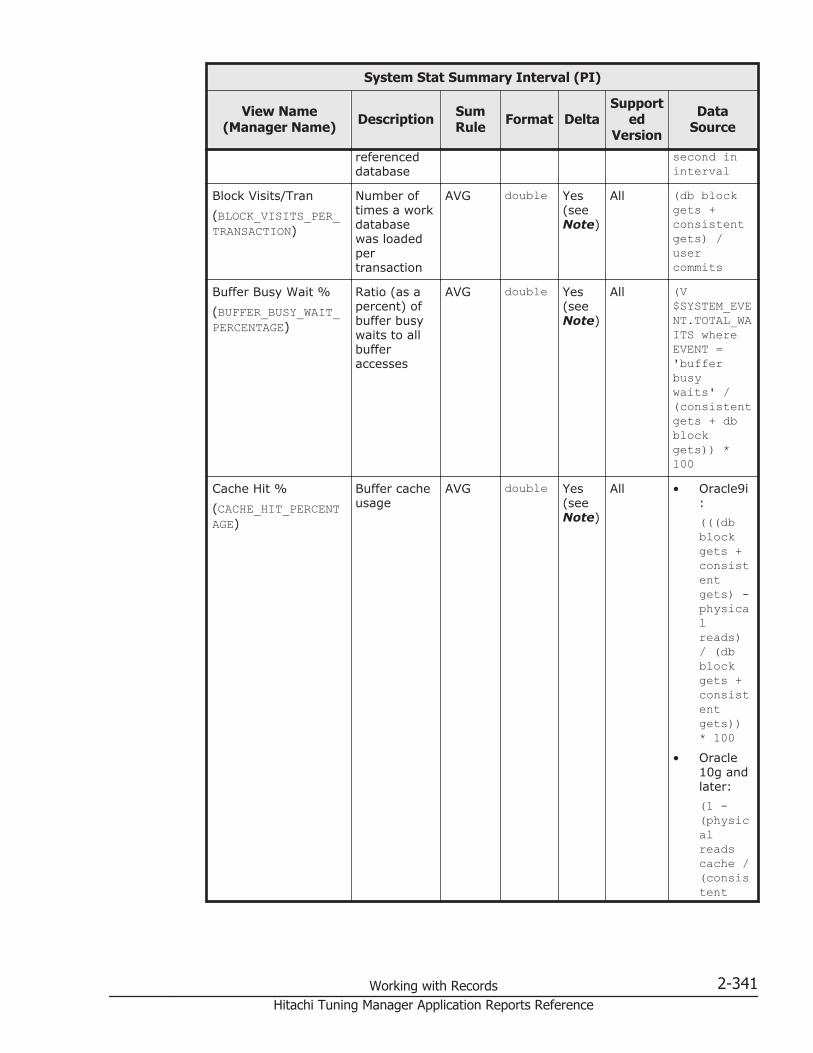
System Stat Summary Interval (PI)
View Name(Manager Name) Description Sum
Rule Format DeltaSupport
edVersion
DataSource
referenceddatabase
second ininterval
Block Visits/Tran(BLOCK_VISITS_PER_TRANSACTION)
Number oftimes a workdatabasewas loadedpertransaction
AVG double Yes(seeNote)
All (db blockgets +consistentgets) /usercommits
Buffer Busy Wait %(BUFFER_BUSY_WAIT_PERCENTAGE)
Ratio (as apercent) ofbuffer busywaits to allbufferaccesses
AVG double Yes(seeNote)
All (V$SYSTEM_EVENT.TOTAL_WAITS whereEVENT ='bufferbusywaits' /(consistentgets + dbblockgets)) *100
Cache Hit %(CACHE_HIT_PERCENTAGE)
Buffer cacheusage
AVG double Yes(seeNote)
All • Oracle9i:(((dbblockgets +consistentgets) -physicalreads)/ (dbblockgets +consistentgets))* 100
• Oracle10g andlater:(1 -(physicalreadscache /(consistent
Working with Records 2-341Hitachi Tuning Manager Application Reports Reference

System Stat Summary Interval (PI)
View Name(Manager Name) Description Sum
Rule Format DeltaSupport
edVersion
DataSource
getsfromcache +dbblockgetsfromcache))) * 100
Call/sec(CALL_RATE)
Workdemand rateapplied tothe instanceby all workresources
AVG double Yes(seeNote)
All recursivecalls +usercalls /seconds ininterval
Calls/Tran(CALLS_PER_TRANSACTION)
Rate atwhich clientrequestswereexecuted pertransaction(you can usethe value ofthis field todetect achange intheapplicationor theutilizationstatus; thisvalue mightincreasesignificantlywhen uniquequeriesincrease)
AVG double No All usercalls /usercommits
Changed Block %(CHANGED_BLOCK_PERCENTAGE)
Ratio (as apercent) ofthe numberof queriesthat changedata(insertion,update, anddeletion) tothe numberof queries(search,insertion,update,deletion)
AVG double Yes(seeNote)
All (db blockchanges /(block gets+consistentgets)) *100
2-342 Working with RecordsHitachi Tuning Manager Application Reports Reference
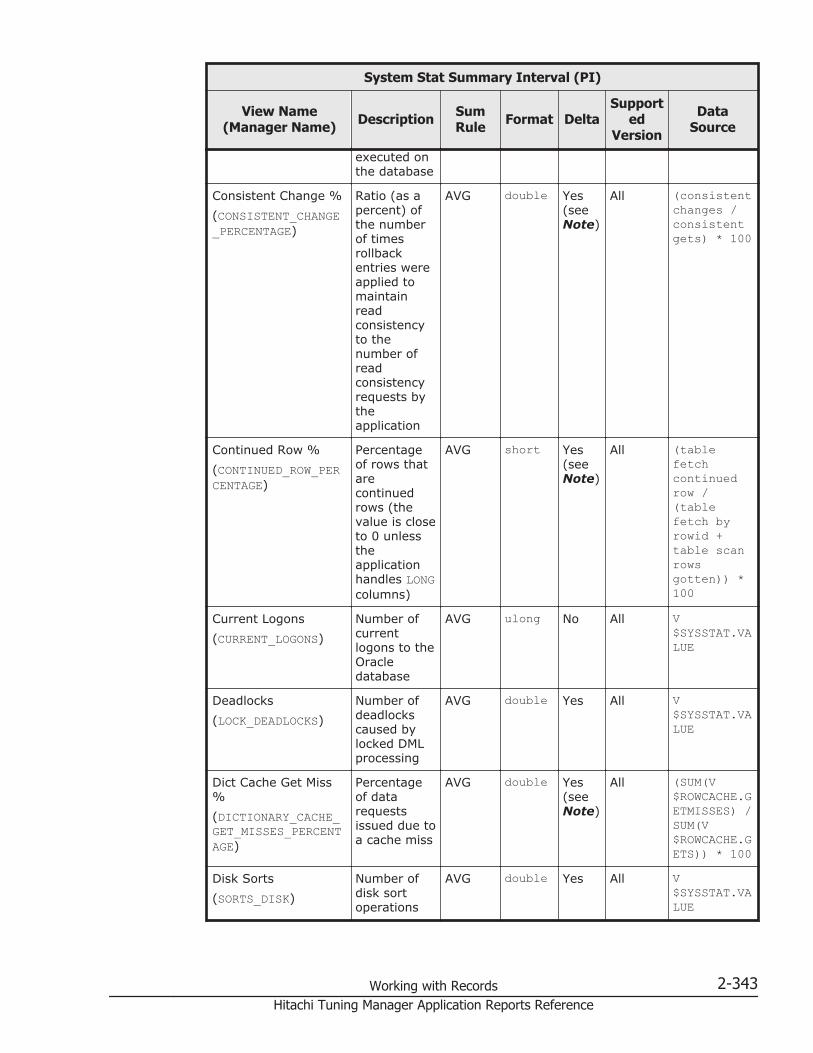
System Stat Summary Interval (PI)
View Name(Manager Name) Description Sum
Rule Format DeltaSupport
edVersion
DataSource
executed onthe database
Consistent Change %(CONSISTENT_CHANGE_PERCENTAGE)
Ratio (as apercent) ofthe numberof timesrollbackentries wereapplied tomaintainreadconsistencyto thenumber ofreadconsistencyrequests bytheapplication
AVG double Yes(seeNote)
All (consistentchanges /consistentgets) * 100
Continued Row %(CONTINUED_ROW_PERCENTAGE)
Percentageof rows thatarecontinuedrows (thevalue is closeto 0 unlesstheapplicationhandles LONGcolumns)
AVG short Yes(seeNote)
All (tablefetchcontinuedrow /(tablefetch byrowid +table scanrowsgotten)) *100
Current Logons(CURRENT_LOGONS)
Number ofcurrentlogons to theOracledatabase
AVG ulong No All V$SYSSTAT.VALUE
Deadlocks(LOCK_DEADLOCKS)
Number ofdeadlockscaused bylocked DMLprocessing
AVG double Yes All V$SYSSTAT.VALUE
Dict Cache Get Miss%(DICTIONARY_CACHE_GET_MISSES_PERCENTAGE)
Percentageof datarequestsissued due toa cache miss
AVG double Yes(seeNote)
All (SUM(V$ROWCACHE.GETMISSES) /SUM(V$ROWCACHE.GETS)) * 100
Disk Sorts(SORTS_DISK)
Number ofdisk sortoperations
AVG double Yes All V$SYSSTAT.VALUE
Working with Records 2-343Hitachi Tuning Manager Application Reports Reference
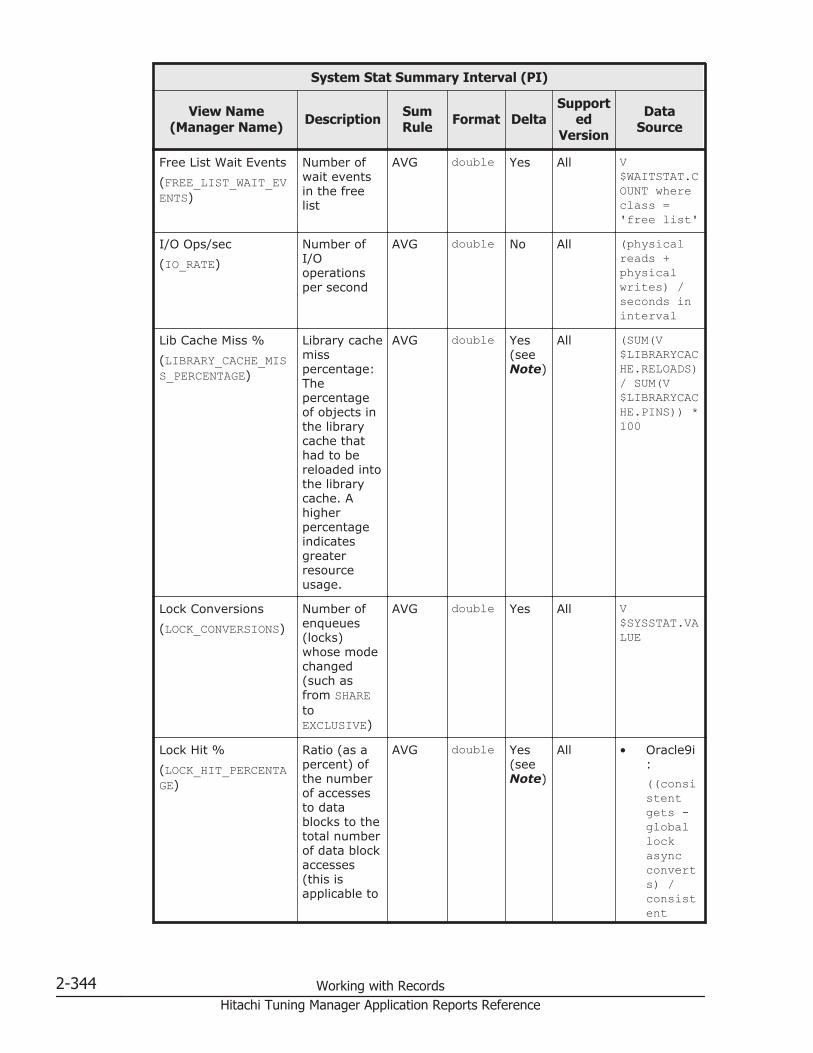
System Stat Summary Interval (PI)
View Name(Manager Name) Description Sum
Rule Format DeltaSupport
edVersion
DataSource
Free List Wait Events(FREE_LIST_WAIT_EVENTS)
Number ofwait eventsin the freelist
AVG double Yes All V$WAITSTAT.COUNT whereclass ='free list'
I/O Ops/sec(IO_RATE)
Number ofI/Ooperationsper second
AVG double No All (physicalreads +physicalwrites) /seconds ininterval
Lib Cache Miss %(LIBRARY_CACHE_MISS_PERCENTAGE)
Library cachemisspercentage:Thepercentageof objects inthe librarycache thathad to bereloaded intothe librarycache. Ahigherpercentageindicatesgreaterresourceusage.
AVG double Yes(seeNote)
All (SUM(V$LIBRARYCACHE.RELOADS)/ SUM(V$LIBRARYCACHE.PINS)) *100
Lock Conversions(LOCK_CONVERSIONS)
Number ofenqueues(locks)whose modechanged(such asfrom SHAREtoEXCLUSIVE)
AVG double Yes All V$SYSSTAT.VALUE
Lock Hit %(LOCK_HIT_PERCENTAGE)
Ratio (as apercent) ofthe numberof accessesto datablocks to thetotal numberof data blockaccesses(this isapplicable to
AVG double Yes(seeNote)
All • Oracle9i:((consistentgets -globallockasyncconverts) /consistent
2-344 Working with RecordsHitachi Tuning Manager Application Reports Reference

System Stat Summary Interval (PI)
View Name(Manager Name) Description Sum
Rule Format DeltaSupport
edVersion
DataSource
accesses thatdo notinvolve lockconversion;it is alsoapplicable toOracle RACconfigurations only)
gets) *100
• Oracle10g andlater:((consistentgets –globalenqueuegetsasync)/consistentgets) *100
Lock Releases(LOCK_RELEASES)
Number oftimesenqueuing(locking) wasreleased
AVG double Yes All V$SYSSTAT.VALUE
Lock Requests(LOCK_REQUESTS)
Number oftimesenqueuing(locking) wasrequested
AVG double Yes All V$SYSSTAT.VALUE
Lock Timeouts(LOCK_TIMEOUTS)
Number oftimes anenqueuing(locking)request wasnotpermittedwithin theallocatedtime
AVG double Yes All V$SYSSTAT.VALUE
Lock Waits(LOCK_WAITS)
Number oftimesenqueuing(locking)request wasplaced inwait status(thedifferencebetween theenqueuingrequestscount and
AVG double Yes All V$SYSSTAT.VALUE
Working with Records 2-345Hitachi Tuning Manager Application Reports Reference
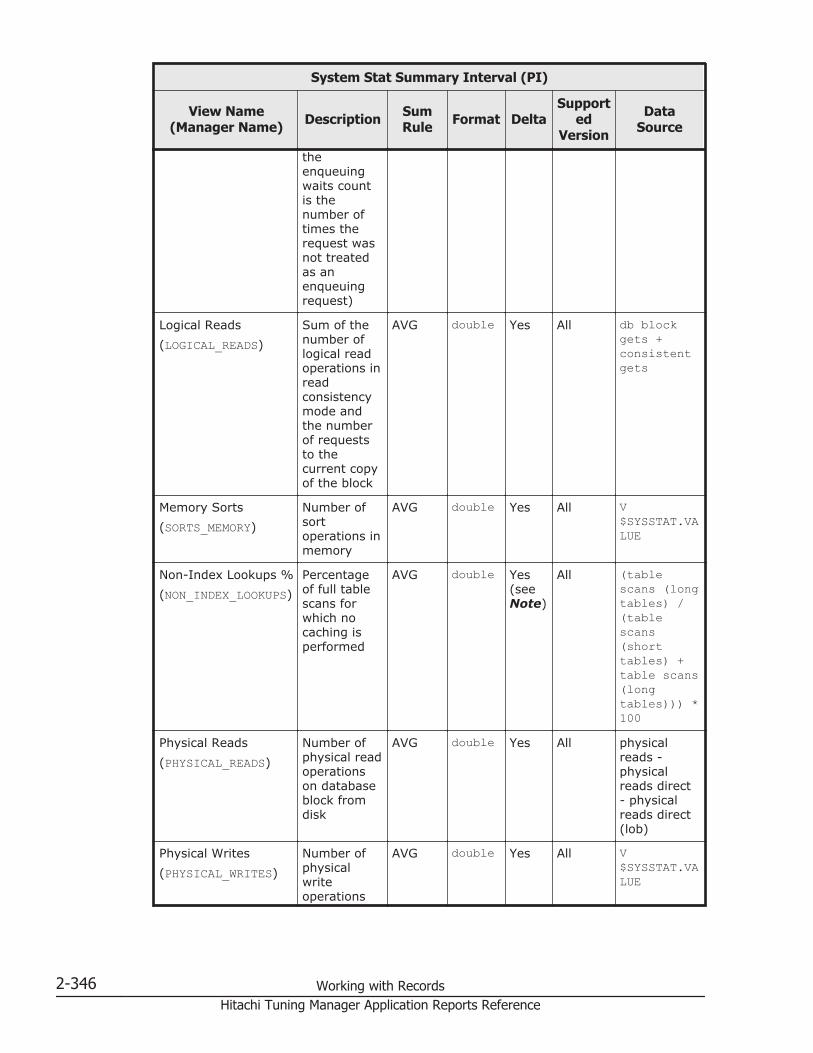
System Stat Summary Interval (PI)
View Name(Manager Name) Description Sum
Rule Format DeltaSupport
edVersion
DataSource
theenqueuingwaits countis thenumber oftimes therequest wasnot treatedas anenqueuingrequest)
Logical Reads(LOGICAL_READS)
Sum of thenumber oflogical readoperations inreadconsistencymode andthe numberof requeststo thecurrent copyof the block
AVG double Yes All db blockgets +consistentgets
Memory Sorts(SORTS_MEMORY)
Number ofsortoperations inmemory
AVG double Yes All V$SYSSTAT.VALUE
Non-Index Lookups %(NON_INDEX_LOOKUPS)
Percentageof full tablescans forwhich nocaching isperformed
AVG double Yes(seeNote)
All (tablescans (longtables) /(tablescans(shorttables) +table scans(longtables))) *100
Physical Reads(PHYSICAL_READS)
Number ofphysical readoperationson databaseblock fromdisk
AVG double Yes All physicalreads -physicalreads direct- physicalreads direct(lob)
Physical Writes(PHYSICAL_WRITES)
Number ofphysicalwriteoperations
AVG double Yes All V$SYSSTAT.VALUE
2-346 Working with RecordsHitachi Tuning Manager Application Reports Reference

System Stat Summary Interval (PI)
View Name(Manager Name) Description Sum
Rule Format DeltaSupport
edVersion
DataSource
onto disk byDBWR
Ping Write %(PING_WRITE_PERCENTAGE)
A large valuemeans thatlockconversionoccurredfrequently
AVG double Yes(seeNote)
All (DBWR crossinstancewrites /physicalwrites) *100
Read/sec(READ_RATE)
Number ofreadoperationsper second
AVG double No All physicalreads /seconds ininterval
Record Time(RECORD_TIME)
Collectionterminationtime for theperformancedata storedin the record
COPY time_t No All AgentCollector
Record Type(INPUT_RECORD_TYPE)
Record name(always PI)
COPY string(4)
No All AgentCollector
Recursive Calls(RECURSIVE_CALLS)
Number ofuser callsprocessed
AVG double Yes All V$SYSSTAT.VALUE
Recursive To UserCall %(RECURSIVE_TO_USER_CALL_PERCENTAGE)
Correctvaluescannot becollected forthis field.Percentageindicatingoverhead
AVG double Yes(seeNote)
All (recursivecalls /user calls)* 100
Redo Alloc Immediate%(REDO_ALLOC_IMMEDIATE_HIT_PERCENTAGE)
Success rateofimmediatelyacquiringREDOallocationlatch
AVG double Yes(seeNote)
All (1 - (V$LATCH.IMMEDIATE_MISSES / (V$LATCH.IMMEDIATE_GETS+ V$LATCH.IMMEDIATE_MISSES))) * 100where V$LATCH.NAME= 'redoallocation'
Working with Records 2-347Hitachi Tuning Manager Application Reports Reference
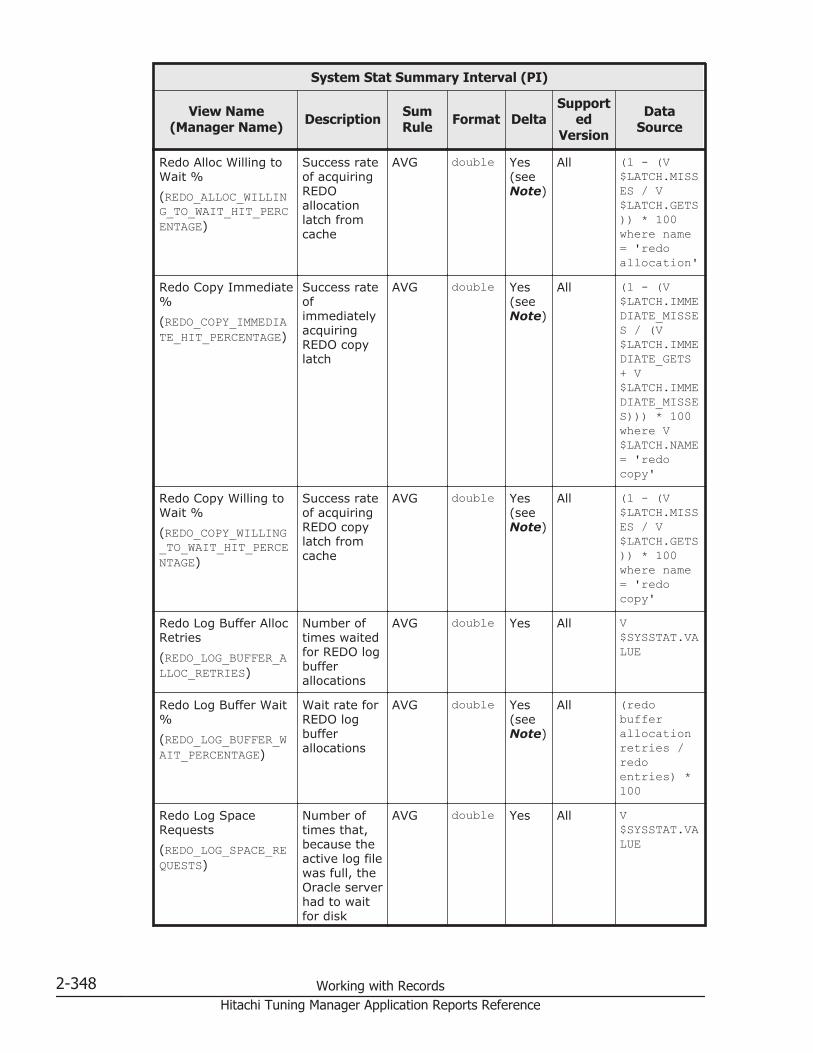
System Stat Summary Interval (PI)
View Name(Manager Name) Description Sum
Rule Format DeltaSupport
edVersion
DataSource
Redo Alloc Willing toWait %(REDO_ALLOC_WILLING_TO_WAIT_HIT_PERCENTAGE)
Success rateof acquiringREDOallocationlatch fromcache
AVG double Yes(seeNote)
All (1 - (V$LATCH.MISSES / V$LATCH.GETS)) * 100where name= 'redoallocation'
Redo Copy Immediate%(REDO_COPY_IMMEDIATE_HIT_PERCENTAGE)
Success rateofimmediatelyacquiringREDO copylatch
AVG double Yes(seeNote)
All (1 - (V$LATCH.IMMEDIATE_MISSES / (V$LATCH.IMMEDIATE_GETS+ V$LATCH.IMMEDIATE_MISSES))) * 100where V$LATCH.NAME= 'redocopy'
Redo Copy Willing toWait %(REDO_COPY_WILLING_TO_WAIT_HIT_PERCENTAGE)
Success rateof acquiringREDO copylatch fromcache
AVG double Yes(seeNote)
All (1 - (V$LATCH.MISSES / V$LATCH.GETS)) * 100where name= 'redocopy'
Redo Log Buffer AllocRetries(REDO_LOG_BUFFER_ALLOC_RETRIES)
Number oftimes waitedfor REDO logbufferallocations
AVG double Yes All V$SYSSTAT.VALUE
Redo Log Buffer Wait%(REDO_LOG_BUFFER_WAIT_PERCENTAGE)
Wait rate forREDO logbufferallocations
AVG double Yes(seeNote)
All (redobufferallocationretries /redoentries) *100
Redo Log SpaceRequests(REDO_LOG_SPACE_REQUESTS)
Number oftimes that,because theactive log filewas full, theOracle serverhad to waitfor disk
AVG double Yes All V$SYSSTAT.VALUE
2-348 Working with RecordsHitachi Tuning Manager Application Reports Reference

System Stat Summary Interval (PI)
View Name(Manager Name) Description Sum
Rule Format DeltaSupport
edVersion
DataSource
space to beallocated fora REDO logentry.
Redo Log Space Wait%(REDO_LOG_SPACE_WAIT_PERCENTAGE)
Wait rate forthe disk areato beallocated tothe REDO logentry
AVG double Yes(seeNote)
All (redo logspacerequests /redoentries) *100
Row Source %(ROW_SOURCE_PERCENTAGE)
Percentageof obtainedrows thatwereobtained byfull tablescans
AVG double Yes(seeNote)
All (table scanrowsgotten /(tablefetch byrowid +table scanrowsgotten)) *100
Session CPU Usage(SESSION_CPU_USAGE)
CPU time (inhundredthsof a second)used whentheTIMED_STATISTICSparameter isset to TRUEin theinit.orafile. If thisparameter isset to FALSE,this fieldindicates 0.
AVG double Yes All V$SYSSTAT.VALUE
Session Cursor CacheCount(SESSION_CURSOR_CACHE_COUNT)
Number ofsessioncursorscached (themaximumnumber ofcursors thatcan becached isdeterminedby theSESSION_CACHED_CURSORSparameter inthe
AVG double Yes All V$SYSSTAT.VALUE
Working with Records 2-349Hitachi Tuning Manager Application Reports Reference
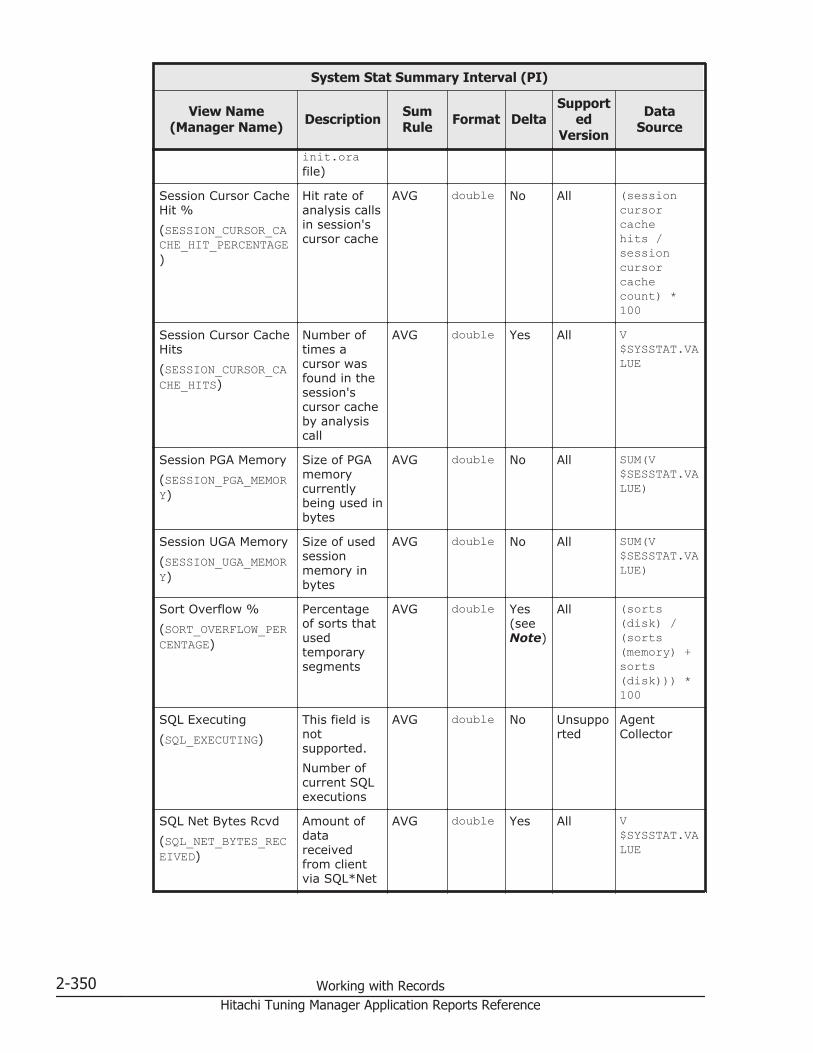
System Stat Summary Interval (PI)
View Name(Manager Name) Description Sum
Rule Format DeltaSupport
edVersion
DataSource
init.orafile)
Session Cursor CacheHit %(SESSION_CURSOR_CACHE_HIT_PERCENTAGE)
Hit rate ofanalysis callsin session'scursor cache
AVG double No All (sessioncursorcachehits /sessioncursorcachecount) *100
Session Cursor CacheHits(SESSION_CURSOR_CACHE_HITS)
Number oftimes acursor wasfound in thesession'scursor cacheby analysiscall
AVG double Yes All V$SYSSTAT.VALUE
Session PGA Memory(SESSION_PGA_MEMORY)
Size of PGAmemorycurrentlybeing used inbytes
AVG double No All SUM(V$SESSTAT.VALUE)
Session UGA Memory(SESSION_UGA_MEMORY)
Size of usedsessionmemory inbytes
AVG double No All SUM(V$SESSTAT.VALUE)
Sort Overflow %(SORT_OVERFLOW_PERCENTAGE)
Percentageof sorts thatusedtemporarysegments
AVG double Yes(seeNote)
All (sorts(disk) /(sorts(memory) +sorts(disk))) *100
SQL Executing(SQL_EXECUTING)
This field isnotsupported.Number ofcurrent SQLexecutions
AVG double No Unsupported
AgentCollector
SQL Net Bytes Rcvd(SQL_NET_BYTES_RECEIVED)
Amount ofdatareceivedfrom clientvia SQL*Net
AVG double Yes All V$SYSSTAT.VALUE
2-350 Working with RecordsHitachi Tuning Manager Application Reports Reference
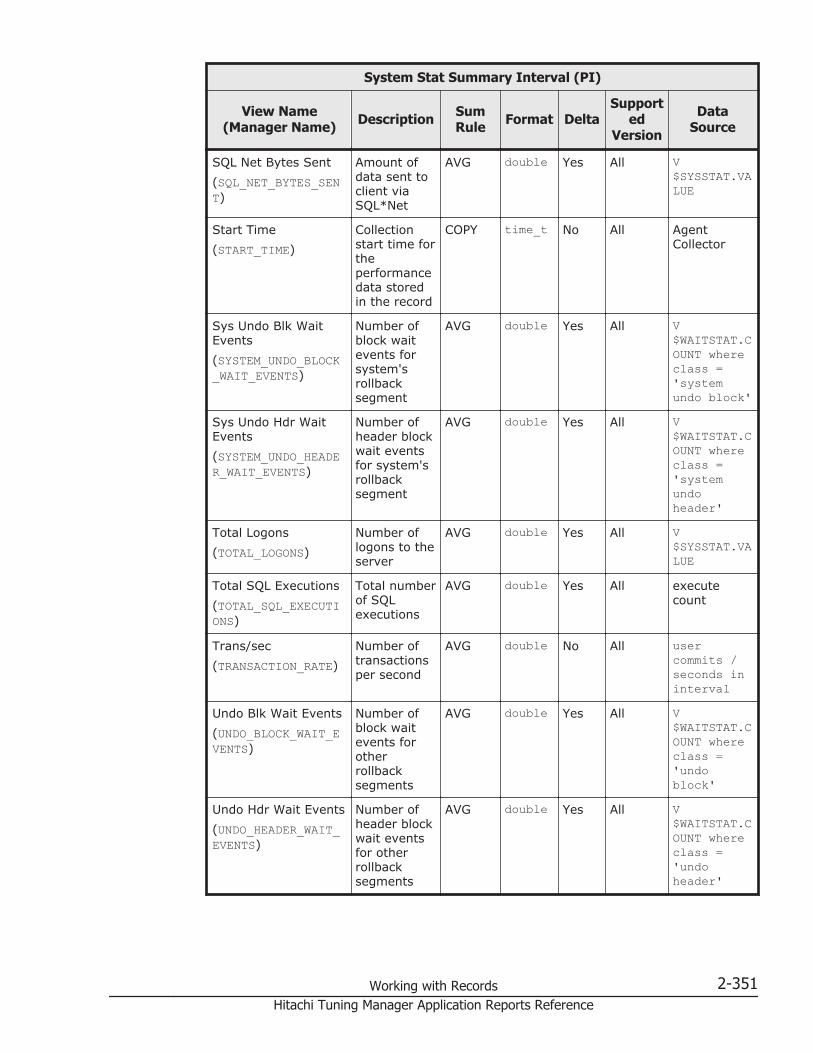
System Stat Summary Interval (PI)
View Name(Manager Name) Description Sum
Rule Format DeltaSupport
edVersion
DataSource
SQL Net Bytes Sent(SQL_NET_BYTES_SENT)
Amount ofdata sent toclient viaSQL*Net
AVG double Yes All V$SYSSTAT.VALUE
Start Time(START_TIME)
Collectionstart time fortheperformancedata storedin the record
COPY time_t No All AgentCollector
Sys Undo Blk WaitEvents(SYSTEM_UNDO_BLOCK_WAIT_EVENTS)
Number ofblock waitevents forsystem'srollbacksegment
AVG double Yes All V$WAITSTAT.COUNT whereclass ='systemundo block'
Sys Undo Hdr WaitEvents(SYSTEM_UNDO_HEADER_WAIT_EVENTS)
Number ofheader blockwait eventsfor system'srollbacksegment
AVG double Yes All V$WAITSTAT.COUNT whereclass ='systemundoheader'
Total Logons(TOTAL_LOGONS)
Number oflogons to theserver
AVG double Yes All V$SYSSTAT.VALUE
Total SQL Executions(TOTAL_SQL_EXECUTIONS)
Total numberof SQLexecutions
AVG double Yes All executecount
Trans/sec(TRANSACTION_RATE)
Number oftransactionsper second
AVG double No All usercommits /seconds ininterval
Undo Blk Wait Events(UNDO_BLOCK_WAIT_EVENTS)
Number ofblock waitevents forotherrollbacksegments
AVG double Yes All V$WAITSTAT.COUNT whereclass ='undoblock'
Undo Hdr Wait Events(UNDO_HEADER_WAIT_EVENTS)
Number ofheader blockwait eventsfor otherrollbacksegments
AVG double Yes All V$WAITSTAT.COUNT whereclass ='undoheader'
Working with Records 2-351Hitachi Tuning Manager Application Reports Reference
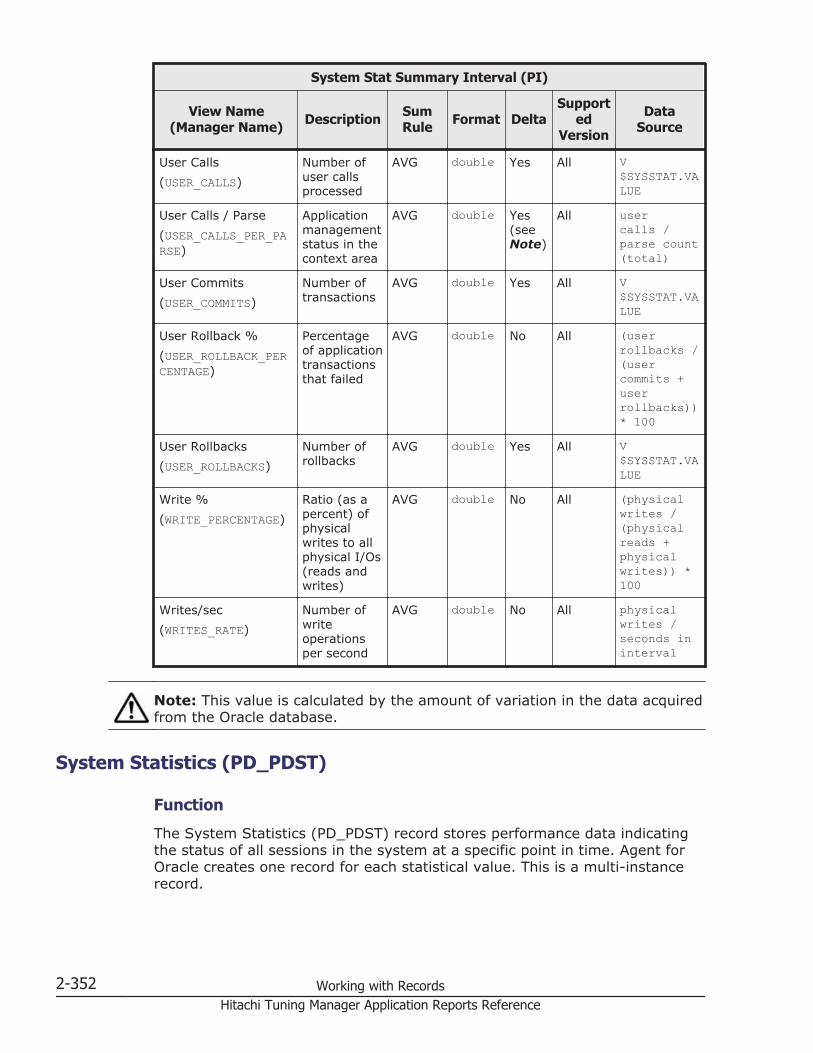
System Stat Summary Interval (PI)
View Name(Manager Name) Description Sum
Rule Format DeltaSupport
edVersion
DataSource
User Calls(USER_CALLS)
Number ofuser callsprocessed
AVG double Yes All V$SYSSTAT.VALUE
User Calls / Parse(USER_CALLS_PER_PARSE)
Applicationmanagementstatus in thecontext area
AVG double Yes(seeNote)
All usercalls /parse count(total)
User Commits(USER_COMMITS)
Number oftransactions
AVG double Yes All V$SYSSTAT.VALUE
User Rollback %(USER_ROLLBACK_PERCENTAGE)
Percentageof applicationtransactionsthat failed
AVG double No All (userrollbacks /(usercommits +userrollbacks))* 100
User Rollbacks(USER_ROLLBACKS)
Number ofrollbacks
AVG double Yes All V$SYSSTAT.VALUE
Write %(WRITE_PERCENTAGE)
Ratio (as apercent) ofphysicalwrites to allphysical I/Os(reads andwrites)
AVG double No All (physicalwrites /(physicalreads +physicalwrites)) *100
Writes/sec(WRITES_RATE)
Number ofwriteoperationsper second
AVG double No All physicalwrites /seconds ininterval
Note: This value is calculated by the amount of variation in the data acquiredfrom the Oracle database.
System Statistics (PD_PDST)
Function
The System Statistics (PD_PDST) record stores performance data indicatingthe status of all sessions in the system at a specific point in time. Agent forOracle creates one record for each statistical value. This is a multi-instancerecord.
2-352 Working with RecordsHitachi Tuning Manager Application Reports Reference

Table 2-175 System Statistics (PD_PDST) Default and Changeable Values
Item Default Value Changeable?
Collection Interval 300 Yes
Collection Offset 5
Log No
LOGIF (Blank)
Key Fields
Statistic Name (NAME)
Lifetime
From the creation to the deletion of an Oracle instance
Record Size
• Fixed part: 678 bytes• Variable part: 96 bytes
Table 2-176 System Statistics (PD_PDST) Fields
System Statistics (PD_PDST)
View Name(Manager Name) Description Sum
Rule Format DeltaSupport
edVersion
DataSource
Class(CLASS)
Statistic class -- string(20)
No All V$SYSSTAT.CLASS
Record Time(RECORD_TIME)
Collectionterminationtime for theperformancedata storedin the record
-- time_t No All AgentCollector
Record Type(INPUT_RECORD_TYPE)
Record name(alwaysPDST)
-- string(4)
No All AgentCollector
Start Time(START_TIME)
Collectionstart time fortheperformancedata storedin the record
-- time_t No All AgentCollector
Working with Records 2-353Hitachi Tuning Manager Application Reports Reference

System Statistics (PD_PDST)
View Name(Manager Name) Description Sum
Rule Format DeltaSupport
edVersion
DataSource
Statistic #(STATISTIC_NUM)
Statisticnumber
-- short No All V$SYSSTAT.STATISTIC#
Statistic Name(NAME)
Statisticname
-- string(64)
No All V$SYSSTAT.NAME
Value(VALUE)
Statisticalvalue
-- double No All V$SYSSTAT.VALUE
Table Access (PD_PDTA)
Function
The Table Access (PD_PDTA) record stores performance data indicating thestatus of a table accessed by sessions during data collection at a specificpoint in time. Agent for Oracle creates one record for each table accessed bysessions. This is a multi-instance record.
Table 2-177 Table Access (PD_PDTA) Default and Changeable Values
Item Default Value Changeable?
Collection Interval 600 Yes
Collection Offset 130
Log No
LOGIF (Blank)
Key Fields
• SID (SID)• Object (OBJECT)
Lifetime
From the locking to the unlocking of an object
Record Size
• Fixed part: 678 bytes• Variable part: 250 bytes
2-354 Working with RecordsHitachi Tuning Manager Application Reports Reference

Table 2-178 Table Access (PD_PDTA) Fields
Table Access (PD_PDTA)
View Name(Manager Name) Description Sum
Rule Format DeltaSupport
edVersion
DataSource
Object(OBJECT)
Object name -- string(100)
No All V$ACCESS.OBJECT
Owner(OWNER)
Object'sowner
-- string(64)
No All V$ACCESS.OWNER
Program(PROGRAM)
Name of theprogrambeingexecuted
-- string(48)
No All V$SESSION.PROGRAM whereV$ACCESS.SID= V$SESSION.SID
Record Time(RECORD_TIME)
Collectionterminationtime for theperformancedata storedin the record
-- time_t No All AgentCollector
Record Type(INPUT_RECORD_TYPE)
Record name(alwaysPDTA)
-- string(4)
No All AgentCollector
SID(SID)
Session IDaccessing theobject whosename isspecified inthe Objectfield
-- ulong No All V$ACCESS.SIDwhere V$ACCESS.SID= V$SESSION.SID
Start Time(START_TIME)
Collectionstart time fortheperformancedata storedin the record
-- time_t No All AgentCollector
User(USERNAME)
Oracle username
-- string(30)
No All V$SESSION.USERNAMEwhere V$ACCESS.SID= V$ACCESS.SID
Working with Records 2-355Hitachi Tuning Manager Application Reports Reference
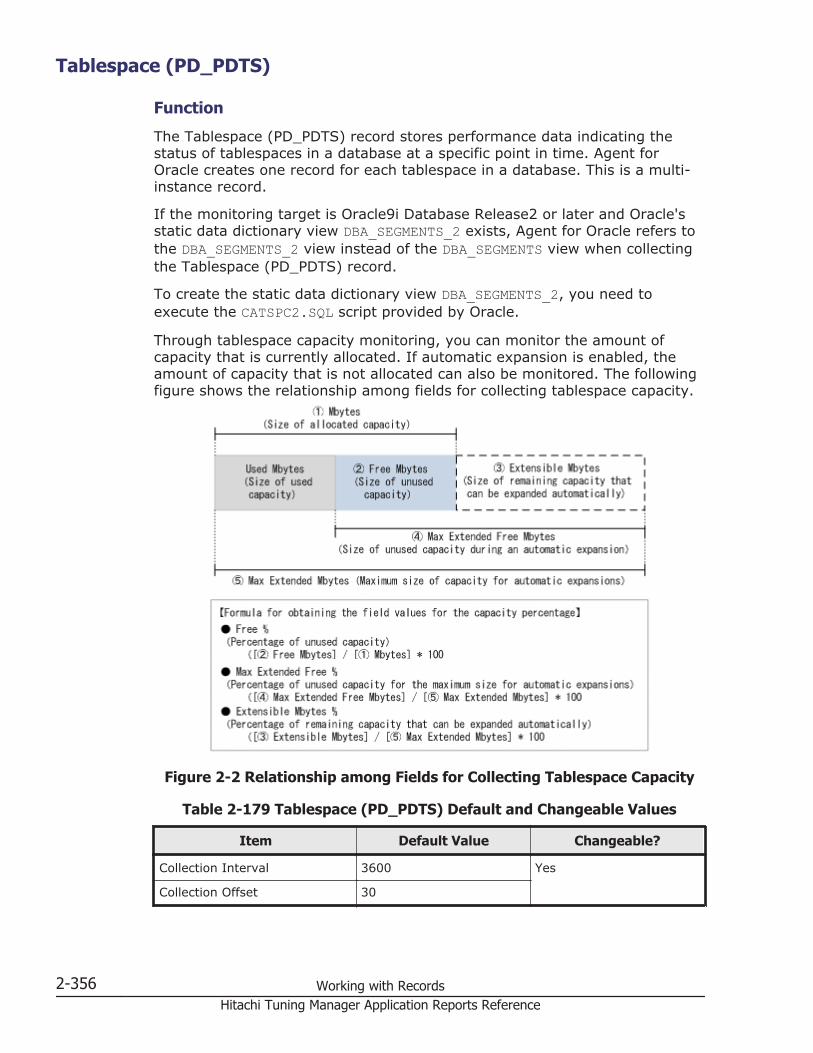
Tablespace (PD_PDTS)
Function
The Tablespace (PD_PDTS) record stores performance data indicating thestatus of tablespaces in a database at a specific point in time. Agent forOracle creates one record for each tablespace in a database. This is a multi-instance record.
If the monitoring target is Oracle9i Database Release2 or later and Oracle'sstatic data dictionary view DBA_SEGMENTS_2 exists, Agent for Oracle refers tothe DBA_SEGMENTS_2 view instead of the DBA_SEGMENTS view when collectingthe Tablespace (PD_PDTS) record.
To create the static data dictionary view DBA_SEGMENTS_2, you need toexecute the CATSPC2.SQL script provided by Oracle.
Through tablespace capacity monitoring, you can monitor the amount ofcapacity that is currently allocated. If automatic expansion is enabled, theamount of capacity that is not allocated can also be monitored. The followingfigure shows the relationship among fields for collecting tablespace capacity.
Figure 2-2 Relationship among Fields for Collecting Tablespace Capacity
Table 2-179 Tablespace (PD_PDTS) Default and Changeable Values
Item Default Value Changeable?
Collection Interval 3600 Yes
Collection Offset 30
2-356 Working with RecordsHitachi Tuning Manager Application Reports Reference

Item Default Value Changeable?
Log Yes
LOGIF (Blank)
Key Fields
Tablespace Name (TABLESPACE_NAME)
Lifetime
From the creation to the deletion of a tablespace
Record Size
• Fixed part: 678 bytes• Variable part: 161 bytes
Table 2-180 Tablespace (PD_PDTS) Fields
Tablespace (PD_PDTS)
View Name(Manager
Name)
Description
SumRule
Format
Delta
Supported
Version
Data Source
AutoExtensible(AUTO_EXTENSIBLE)
Indicateswhetherautomaticexpansionfor thetable areais enabledwhen themonitoringtarget isOracleDatabase11gR2 orlater.DisplaysYES ifautomaticexpansionsareenabled,and NO ifthey arenot.Among thedata filesthat make
-- string(3)
No All DBA_DATA_FILES.AUTOEXTENSIBLE
Working with Records 2-357Hitachi Tuning Manager Application Reports Reference

Tablespace (PD_PDTS)
View Name(Manager
Name)
Description
SumRule
Format
Delta
Supported
Version
Data Source
up thetablespace, YES isdisplayedeven whena singleautomaticextensionis valid.If themonitoringtarget isOracleDatabase11gR1 orearlier, ablank isdisplayed.
Blocks(BLOCKS)
Size oftablespacein Oracleblocks
-- ulong No All • For dictionary managedpermanent tablespaces,locally managedpermanent tablespaces,or dictionary managedtemporary tablespaces ofOracle9i or later:SUM(DBA_DATA_FILES.BLOCKS)
• For locally managedtemporary tablespaces ofOracle9i or later:SUM(DBA_TEMP_FILES.BLOCKS)
Data Files(DATAFILES)
Number ofdata filesin use bythetablespace
-- ushort No All • For dictionary managedpermanent tablespaces,locally managedpermanent tablespaces,or dictionary managedtemporary tablespaces ofOracle9i or later:COUNT(DBA_DATA_FILES)
• For locally managedtemporary tablespaces ofOracle9i or later:COUNT(DBA_TEMP_FILES)
ExtensibleMbytes
Size, inmegabytes, of the
-- double No All MAX_BYTES - BYTES
2-358 Working with RecordsHitachi Tuning Manager Application Reports Reference
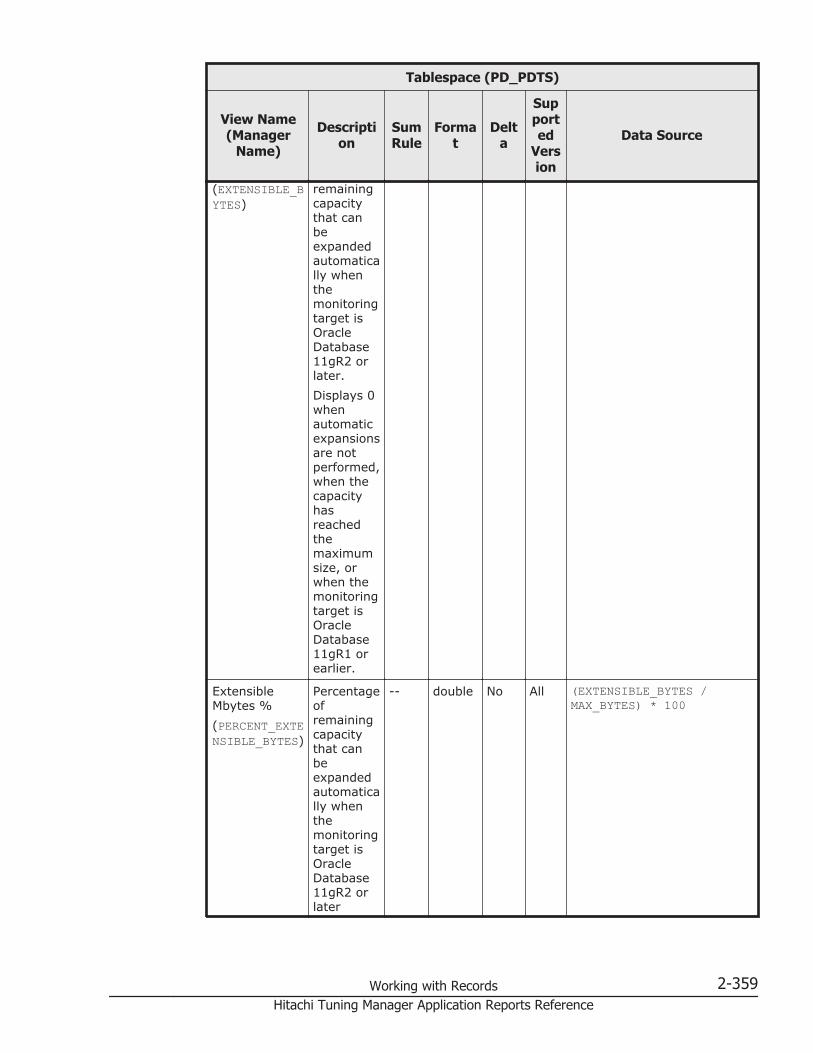
Tablespace (PD_PDTS)
View Name(Manager
Name)
Description
SumRule
Format
Delta
Supported
Version
Data Source
(EXTENSIBLE_BYTES)
remainingcapacitythat canbeexpandedautomatically whenthemonitoringtarget isOracleDatabase11gR2 orlater.Displays 0whenautomaticexpansionsare notperformed,when thecapacityhasreachedthemaximumsize, orwhen themonitoringtarget isOracleDatabase11gR1 orearlier.
ExtensibleMbytes %(PERCENT_EXTENSIBLE_BYTES)
Percentageofremainingcapacitythat canbeexpandedautomatically whenthemonitoringtarget isOracleDatabase11gR2 orlater
-- double No All (EXTENSIBLE_BYTES /MAX_BYTES) * 100
Working with Records 2-359Hitachi Tuning Manager Application Reports Reference
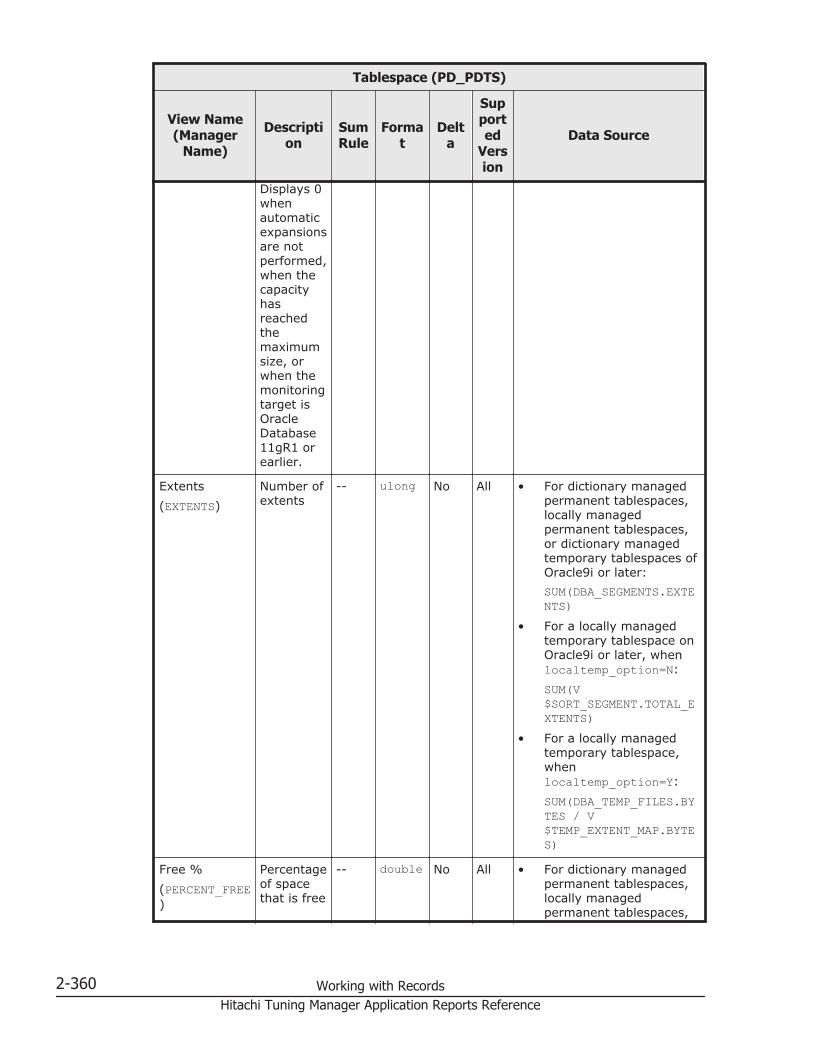
Tablespace (PD_PDTS)
View Name(Manager
Name)
Description
SumRule
Format
Delta
Supported
Version
Data Source
Displays 0whenautomaticexpansionsare notperformed,when thecapacityhasreachedthemaximumsize, orwhen themonitoringtarget isOracleDatabase11gR1 orearlier.
Extents(EXTENTS)
Number ofextents
-- ulong No All • For dictionary managedpermanent tablespaces,locally managedpermanent tablespaces,or dictionary managedtemporary tablespaces ofOracle9i or later:SUM(DBA_SEGMENTS.EXTENTS)
• For a locally managedtemporary tablespace onOracle9i or later, whenlocaltemp_option=N:SUM(V$SORT_SEGMENT.TOTAL_EXTENTS)
• For a locally managedtemporary tablespace,whenlocaltemp_option=Y:SUM(DBA_TEMP_FILES.BYTES / V$TEMP_EXTENT_MAP.BYTES)
Free %(PERCENT_FREE)
Percentageof spacethat is free
-- double No All • For dictionary managedpermanent tablespaces,locally managedpermanent tablespaces,
2-360 Working with RecordsHitachi Tuning Manager Application Reports Reference

Tablespace (PD_PDTS)
View Name(Manager
Name)
Description
SumRule
Format
Delta
Supported
Version
Data Source
dictionary managedtemporary tablespaces,or UNDO tablespaces ofOracle9i or later, whenundospace_option=N:(SUM(DBA_FREE_SPACE.BYTES) /DBA_DATA_FILES.BYTES)* 100
• For a locally managedtemporary tablespace onOracle9i or later, whenlocaltemp_option=N:(SUM(V$TEMP_SPACE_HEADER.BYTES_FREE) /(DBA_TEMP_FILES.BYTES)) * 100
• For a locally managedtemporary tablespace,whenlocaltemp_option=Y:(SUM(DBA_TEMP_FILES.BYTES - V$TEMP_EXTENT_POOL.BYTES_USED) /(DBA_TEMP_FILES.BYTES)) * 100
• For UNDO tablespaces,whenundospace_option=Y:((SUM(DBA_FREE_SPACE.BYTES) +SUM(DBA_UNDO_EXTENTS.BYTES) WHERESTATUS='EXPIRED') /DBA_DATA_FILES.BYTES)* 100
Free Extents(FREE_EXTENTS)
Number offreeextents.
-- ulong No All • For dictionary managedpermanent tablespaces,locally managedpermanent tablespaces,or dictionary managedtemporary tablespaces ofOracle9i or later:COUNT(DBA_FREE_SPACE)
Working with Records 2-361Hitachi Tuning Manager Application Reports Reference
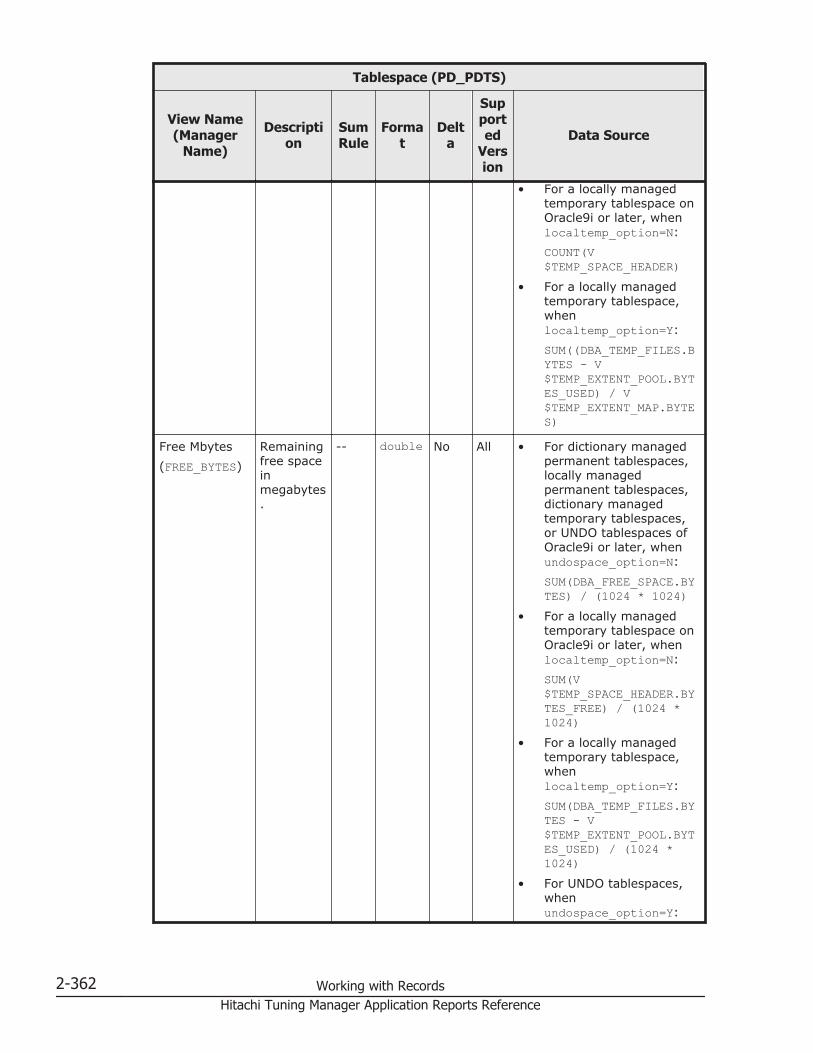
Tablespace (PD_PDTS)
View Name(Manager
Name)
Description
SumRule
Format
Delta
Supported
Version
Data Source
• For a locally managedtemporary tablespace onOracle9i or later, whenlocaltemp_option=N:COUNT(V$TEMP_SPACE_HEADER)
• For a locally managedtemporary tablespace,whenlocaltemp_option=Y:SUM((DBA_TEMP_FILES.BYTES - V$TEMP_EXTENT_POOL.BYTES_USED) / V$TEMP_EXTENT_MAP.BYTES)
Free Mbytes(FREE_BYTES)
Remainingfree spaceinmegabytes.
-- double No All • For dictionary managedpermanent tablespaces,locally managedpermanent tablespaces,dictionary managedtemporary tablespaces,or UNDO tablespaces ofOracle9i or later, whenundospace_option=N:SUM(DBA_FREE_SPACE.BYTES) / (1024 * 1024)
• For a locally managedtemporary tablespace onOracle9i or later, whenlocaltemp_option=N:SUM(V$TEMP_SPACE_HEADER.BYTES_FREE) / (1024 *1024)
• For a locally managedtemporary tablespace,whenlocaltemp_option=Y:SUM(DBA_TEMP_FILES.BYTES - V$TEMP_EXTENT_POOL.BYTES_USED) / (1024 *1024)
• For UNDO tablespaces,whenundospace_option=Y:
2-362 Working with RecordsHitachi Tuning Manager Application Reports Reference

Tablespace (PD_PDTS)
View Name(Manager
Name)
Description
SumRule
Format
Delta
Supported
Version
Data Source
((SUM(DBA_FREE_SPACE.BYTES) +SUM(DBA_UNDO_EXTENTS.BYTES) WHERESTATUS='EXPIRED') /(1024 * 1024)
Increase %(PCT_INCREASE)
Defaultrate ofincrease inthe extentsize
-- short No All DBA_TABLESPACES.PCT_INCREASE
Initial Extent(INITIAL_EXTENT)
Defaultsize ofinitialextent
-- double No All DBA_TABLESPACES.INITIAL_EXTENT
Max ExtendFree %(MAX_PERCENT_FREE)
Ratio (as apercent) ofthe size ofunusedcapacity tothemaximumsize ofautomaticexpansionwhen themonitoringtarget isOracleDatabase11gR2 orlater.This valueis thesame asthe Free %field whenautomaticexpansionsare notperformed,or whenthecapacityhasreachedthemaximumsize.
-- double No All (MAX_FREE_BYTES /MAX_BYTES) * 100
Working with Records 2-363Hitachi Tuning Manager Application Reports Reference
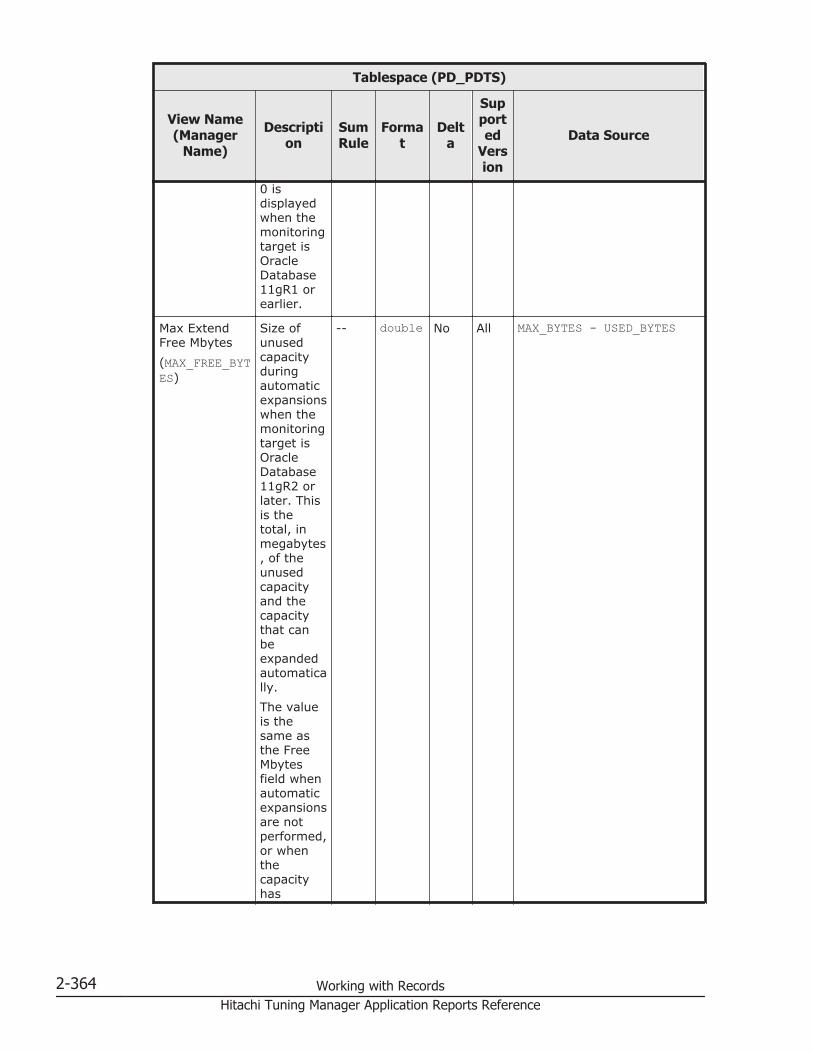
Tablespace (PD_PDTS)
View Name(Manager
Name)
Description
SumRule
Format
Delta
Supported
Version
Data Source
0 isdisplayedwhen themonitoringtarget isOracleDatabase11gR1 orearlier.
Max ExtendFree Mbytes(MAX_FREE_BYTES)
Size ofunusedcapacityduringautomaticexpansionswhen themonitoringtarget isOracleDatabase11gR2 orlater. Thisis thetotal, inmegabytes, of theunusedcapacityand thecapacitythat canbeexpandedautomatically.The valueis thesame asthe FreeMbytesfield whenautomaticexpansionsare notperformed,or whenthecapacityhas
-- double No All MAX_BYTES - USED_BYTES
2-364 Working with RecordsHitachi Tuning Manager Application Reports Reference

Tablespace (PD_PDTS)
View Name(Manager
Name)
Description
SumRule
Format
Delta
Supported
Version
Data Source
reachedthemaximumsize.0 isdisplayedwhen themonitoringtarget isOracleDatabase11gR1 orearlier.
Max ExtendMbytes(MAX_BYTES)
Maximumsize of thecapacity,inmegabytes, forautomaticexpansionswhen themonitoringtarget isOracleDatabase11gR2 orlater.The valueis thesame asthe Mbytesfield whenautomaticexpansionsare notperformed,or whenthecapacityhasreachedthemaximumsize.0 isdisplayedwhen themonitoringtarget is
-- double No All • For permanenttablespaces for dictionarymanagement, permanenttablespaces for localmanagement, ortemporary tablespacesfor dictionarymanagement:SUM(DBA_DATA_FILES.MAXBYTES) /(1024 * 1024)
• For temporarytablespaces for localmanagement:SUM(DBA_TEMP_FILES.MAXBYTES) /(1024 * 1024)
Working with Records 2-365Hitachi Tuning Manager Application Reports Reference
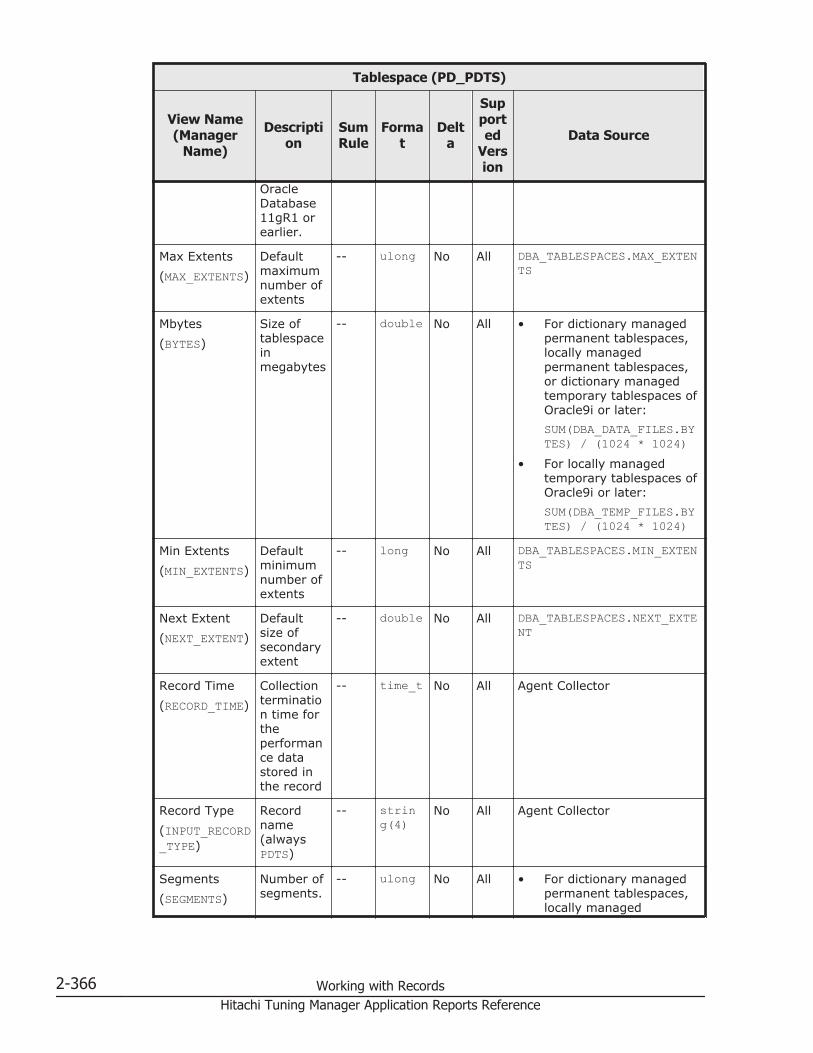
Tablespace (PD_PDTS)
View Name(Manager
Name)
Description
SumRule
Format
Delta
Supported
Version
Data Source
OracleDatabase11gR1 orearlier.
Max Extents(MAX_EXTENTS)
Defaultmaximumnumber ofextents
-- ulong No All DBA_TABLESPACES.MAX_EXTENTS
Mbytes(BYTES)
Size oftablespaceinmegabytes
-- double No All • For dictionary managedpermanent tablespaces,locally managedpermanent tablespaces,or dictionary managedtemporary tablespaces ofOracle9i or later:SUM(DBA_DATA_FILES.BYTES) / (1024 * 1024)
• For locally managedtemporary tablespaces ofOracle9i or later:SUM(DBA_TEMP_FILES.BYTES) / (1024 * 1024)
Min Extents(MIN_EXTENTS)
Defaultminimumnumber ofextents
-- long No All DBA_TABLESPACES.MIN_EXTENTS
Next Extent(NEXT_EXTENT)
Defaultsize ofsecondaryextent
-- double No All DBA_TABLESPACES.NEXT_EXTENT
Record Time(RECORD_TIME)
Collectiontermination time fortheperformance datastored inthe record
-- time_t No All Agent Collector
Record Type(INPUT_RECORD_TYPE)
Recordname(alwaysPDTS)
-- string(4)
No All Agent Collector
Segments(SEGMENTS)
Number ofsegments.
-- ulong No All • For dictionary managedpermanent tablespaces,locally managed
2-366 Working with RecordsHitachi Tuning Manager Application Reports Reference
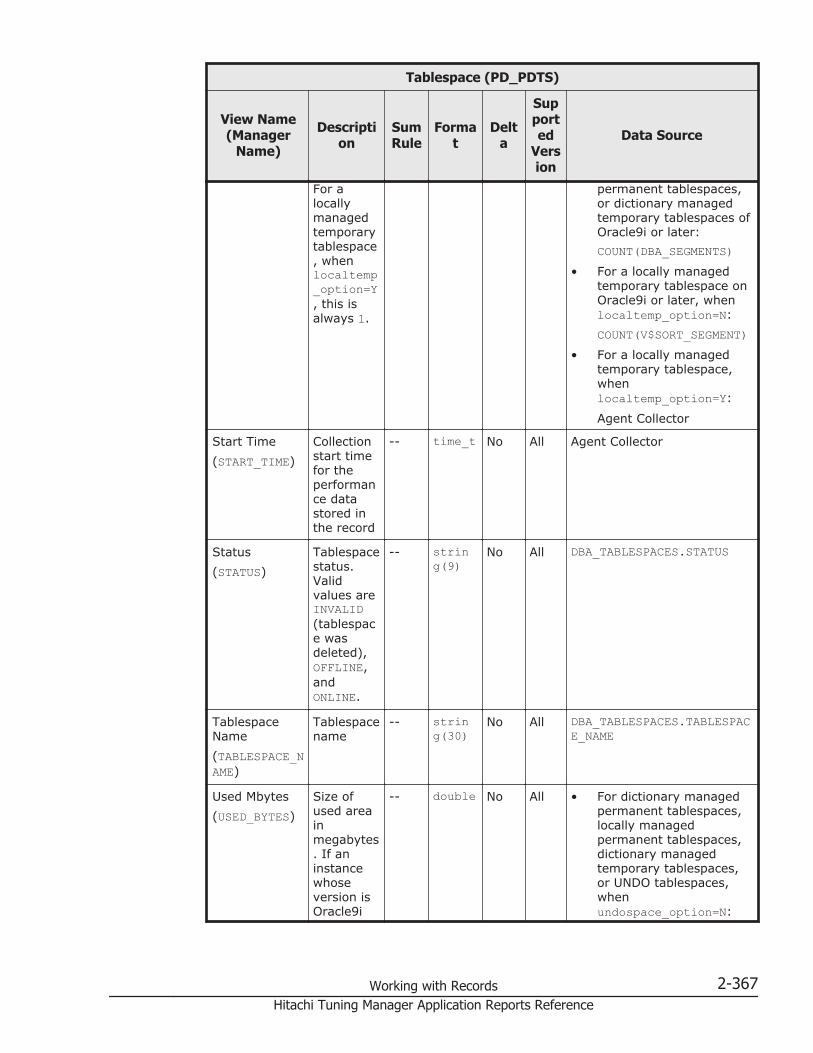
Tablespace (PD_PDTS)
View Name(Manager
Name)
Description
SumRule
Format
Delta
Supported
Version
Data Source
For alocallymanagedtemporarytablespace, whenlocaltemp_option=Y, this isalways 1.
permanent tablespaces,or dictionary managedtemporary tablespaces ofOracle9i or later:COUNT(DBA_SEGMENTS)
• For a locally managedtemporary tablespace onOracle9i or later, whenlocaltemp_option=N:COUNT(V$SORT_SEGMENT)
• For a locally managedtemporary tablespace,whenlocaltemp_option=Y:
Agent Collector
Start Time(START_TIME)
Collectionstart timefor theperformance datastored inthe record
-- time_t No All Agent Collector
Status(STATUS)
Tablespacestatus.Validvalues areINVALID(tablespace wasdeleted),OFFLINE,andONLINE.
-- string(9)
No All DBA_TABLESPACES.STATUS
TablespaceName(TABLESPACE_NAME)
Tablespacename
-- string(30)
No All DBA_TABLESPACES.TABLESPACE_NAME
Used Mbytes(USED_BYTES)
Size ofused areainmegabytes. If aninstancewhoseversion isOracle9i
-- double No All • For dictionary managedpermanent tablespaces,locally managedpermanent tablespaces,dictionary managedtemporary tablespaces,or UNDO tablespaces,whenundospace_option=N:
Working with Records 2-367Hitachi Tuning Manager Application Reports Reference

Tablespace (PD_PDTS)
View Name(Manager
Name)
Description
SumRule
Format
Delta
Supported
Version
Data Source
R9.2.0.3or earlieris beingmonitored,performance dataabout thelocallymanagedtemporarytablespacewill not becollected.
(SUM(DBA_DATA_FILES.BYTES) -SUM(DBA_FREE_SPACE.BYTES)) / (1024 *1024)
• For a locally managedtemporary tablespace,whenlocaltemp_option=N:(SUM(DBA_TEMP_FILES.BYTES) - SUM(V$TEMP_SPACE_HEADER.BYTES_FREE)) / (1024 *1024)
• For a locally managedtemporary tablespace,whenlocaltemp_option=Y:(SUM(DBA_TEMP_FILES.BYTES) -SUM(DBA_TEMP_FILES.BYTES - V$TEMP_EXTENT_POOL.BYTES_USED)) / (1024 *1024)
• For UNDO tablespaces,whenundospace_option=Y:(DBA_DATA_FILES.BYTES-SUM(DBA_FREE_SPACE.BYTES) -SUM(DBA_UNDO_EXTENTS.BYTES) WHERESTATUS='EXPIRED') /(1024 * 1024)
Tablespace Fragmentation (PD_PDTF)
Function
The Tablespace Fragmentation (PD_PDTF) record stores performance dataindicating the status of fragmentation of tablespaces at a specific point intime. Agent for Oracle creates one record for each tablespace in a database.This is a multi-instance record.
2-368 Working with RecordsHitachi Tuning Manager Application Reports Reference
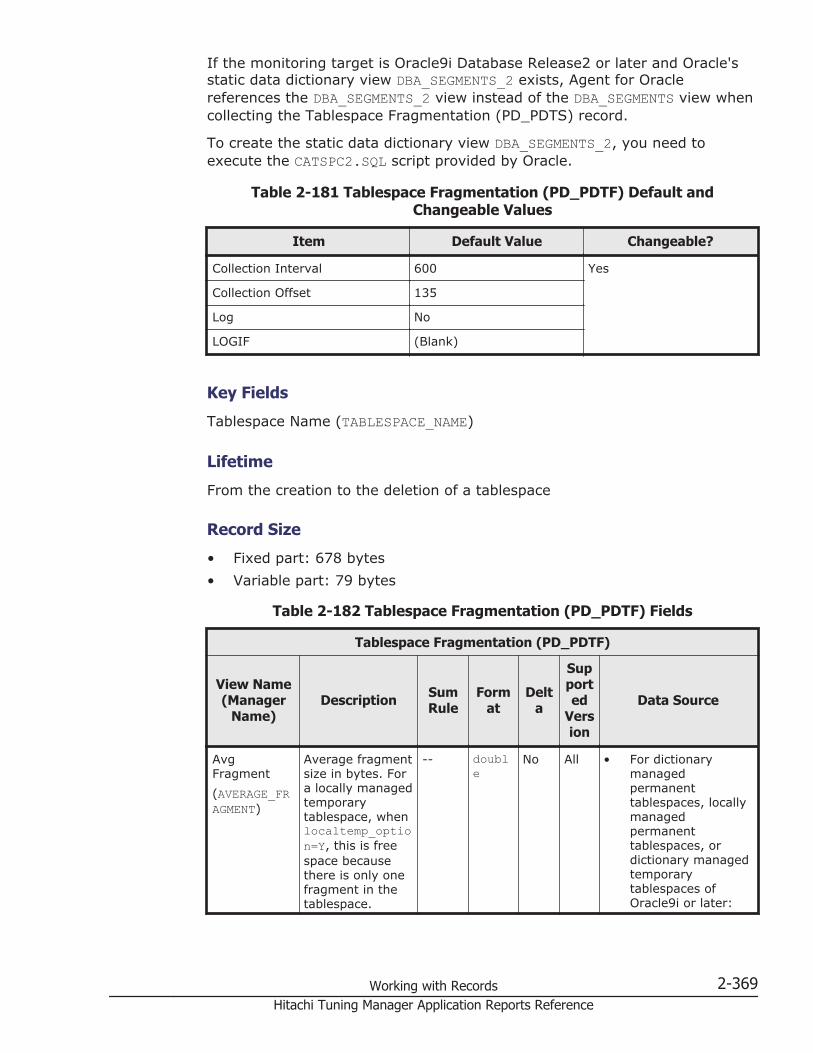
If the monitoring target is Oracle9i Database Release2 or later and Oracle'sstatic data dictionary view DBA_SEGMENTS_2 exists, Agent for Oraclereferences the DBA_SEGMENTS_2 view instead of the DBA_SEGMENTS view whencollecting the Tablespace Fragmentation (PD_PDTS) record.
To create the static data dictionary view DBA_SEGMENTS_2, you need toexecute the CATSPC2.SQL script provided by Oracle.
Table 2-181 Tablespace Fragmentation (PD_PDTF) Default andChangeable Values
Item Default Value Changeable?
Collection Interval 600 Yes
Collection Offset 135
Log No
LOGIF (Blank)
Key Fields
Tablespace Name (TABLESPACE_NAME)
Lifetime
From the creation to the deletion of a tablespace
Record Size
• Fixed part: 678 bytes• Variable part: 79 bytes
Table 2-182 Tablespace Fragmentation (PD_PDTF) Fields
Tablespace Fragmentation (PD_PDTF)
View Name(Manager
Name)Description Sum
RuleForm
atDelt
a
Supported
Version
Data Source
AvgFragment(AVERAGE_FRAGMENT)
Average fragmentsize in bytes. Fora locally managedtemporarytablespace, whenlocaltemp_option=Y, this is freespace becausethere is only onefragment in thetablespace.
-- double
No All • For dictionarymanagedpermanenttablespaces, locallymanagedpermanenttablespaces, ordictionary managedtemporarytablespaces ofOracle9i or later:
Working with Records 2-369Hitachi Tuning Manager Application Reports Reference

Tablespace Fragmentation (PD_PDTF)
View Name(Manager
Name)Description Sum
RuleForm
atDelt
a
Supported
Version
Data Source
SUM(DBA_FREE_SPACE.BYTES) /COUNT(DBA_FREE_SPACE) whereDBA_TABLESPACES.TABLESPACE_NAME =DBA_FREE_SPACE.TABLESPACE_NAME(+)
• For a locallymanaged temporarytablespace onOracle9i or later,whenlocaltemp_option=N:SUM(V$TEMP_SPACE_HEADER.BYTES_FREE) /COUNT(V$TEMP_SPACE_HEADER) whereDBA_TEMP_FILES.FILE_ID = V$TEMP_SPACE_HEADER.FILE_ID(+)
• For a locallymanaged temporarytablespace, whenlocaltemp_option=Y:SUM(DBA_TEMP_FILES.BYTES - V$TEMP_EXTENT_POOL.BYTES_USED)
Extents(EXTENTS)
Number ofextents
-- ulong No All • For dictionarymanagedpermanenttablespaces, locallymanagedpermanenttablespaces, ordictionary managedtemporarytablespaces ofOracle9i or later:SUM(DBA_SEGMENTS.EXTENTS)
2-370 Working with RecordsHitachi Tuning Manager Application Reports Reference

Tablespace Fragmentation (PD_PDTF)
View Name(Manager
Name)Description Sum
RuleForm
atDelt
a
Supported
Version
Data Source
• For a locallymanaged temporarytablespace onOracle9i or later,whenlocaltemp_option=N:SUM(V$SORT_SEGMENT.TOTAL_EXTENTS)
• For a locallymanaged temporarytablespace, whenlocaltemp_option=Y:SUM(DBA_TEMP_FILES.BYTES / V$TEMP_EXTENT_MAP.BYTES)
Fragments(FRAGMENTS)
Number offragments. For alocally managedtemporarytablespace, whenlocaltemp_option=Y, this isalways 1.
-- ulong No All • For dictionarymanagedpermanenttablespaces, locallymanagedpermanenttablespaces, ordictionary managedtemporarytablespaces ofOracle9i or later:COUNT(DBA_FREE_SPACE)whereDBA_TABLESPACES.TABLESPACE_NAME =DBA_FREE_SPACE.TABLESPACE_NAME(+)
• For a locallymanaged temporarytablespace onOracle9i or later,whenlocaltemp_option=N:COUNT(V$TEMP_SPACE_HEADER) whereDBA_TEMP_FILES.FI
Working with Records 2-371Hitachi Tuning Manager Application Reports Reference

Tablespace Fragmentation (PD_PDTF)
View Name(Manager
Name)Description Sum
RuleForm
atDelt
a
Supported
Version
Data Source
LE_ID = V$TEMP_SPACE_HEADER.FILE_ID(+)
• For a locallymanaged temporarytablespace, whenlocaltemp_option=Y:
Agent Collector
High MaxExtents(HIGH_MAX_EXTENTS)
Number ofsegments whosePCT_MAX_EXTENTSexceeds 90%
-- ulong No All • For dictionarymanagedpermanenttablespaces, locallymanagedpermanenttablespaces, ordictionary managedtemporarytablespaces ofOracle9i or later:COUNT(DBA_SEGMENTS) where EXTENTS> MAX_EXTENTS *0.9
• For locally managedtemporarytablespaces ofOracle9i or later:COUNT(V$SORT_SEGMENT)where EXTENT_SIZE> TOTAL_EXTENTS *0.9
LargestFragment(LARGEST_FRAGMENT)
Largest fragmentsize in bytes For alocally managedtemporarytablespace, whenlocaltemp_option=Y, this is freespace becausethere is only onefragment in thetablespace.
-- double
No All • For dictionarymanagedpermanenttablespaces, locallymanagedpermanenttablespaces, ordictionary managedtemporarytablespaces ofOracle9i or later:MAX(DBA_FREE_SPACE.BYTES) whereDBA_TABLESPACES.TABLESPACE_NAME =
2-372 Working with RecordsHitachi Tuning Manager Application Reports Reference

Tablespace Fragmentation (PD_PDTF)
View Name(Manager
Name)Description Sum
RuleForm
atDelt
a
Supported
Version
Data Source
DBA_FREE_SPACE.TABLESPACE_NAME(+)
• For a locallymanaged temporarytablespace onOracle9i or later,whenlocaltemp_option=N:MAX(V$TEMP_SPACE_HEADER.BYTES_FREE)whereDBA_TEMP_FILES.FILE_ID = V$TEMP_SPACE_HEADER.FILE_ID(+)
• For a locallymanaged temporarytablespace, whenlocaltemp_option=Y:SUM(DBA_TEMP_FILES.BYTES - V$TEMP_EXTENT_POOL.BYTES_USED)
LargestFragment %(LARGEST_FRAGMENT_PERCENT)
Ratio (as apercent) of thelargest fragmentto the tablespace
-- double
No All • For dictionarymanagedpermanenttablespaces, locallymanagedpermanenttablespaces, ordictionary managedtemporarytablespaces ofOracle9i or later:(MAX(DBA_FREE_SPACE.BYTES) /SUM(DBA_DATA_FILES.BYTES)) * 100
• For a locallymanaged temporarytablespace onOracle9i or later,whenlocaltemp_option=N:
Working with Records 2-373Hitachi Tuning Manager Application Reports Reference
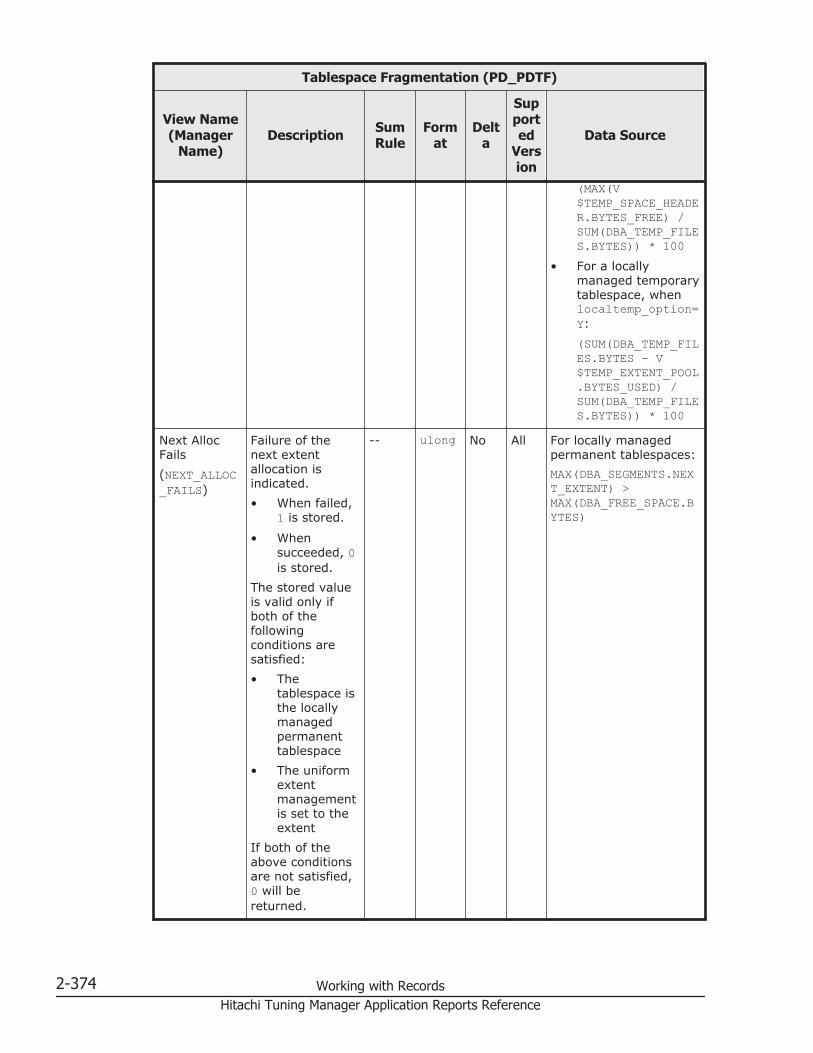
Tablespace Fragmentation (PD_PDTF)
View Name(Manager
Name)Description Sum
RuleForm
atDelt
a
Supported
Version
Data Source
(MAX(V$TEMP_SPACE_HEADER.BYTES_FREE) /SUM(DBA_TEMP_FILES.BYTES)) * 100
• For a locallymanaged temporarytablespace, whenlocaltemp_option=Y:(SUM(DBA_TEMP_FILES.BYTES - V$TEMP_EXTENT_POOL.BYTES_USED) /SUM(DBA_TEMP_FILES.BYTES)) * 100
Next AllocFails(NEXT_ALLOC_FAILS)
Failure of thenext extentallocation isindicated.• When failed,
1 is stored.
• Whensucceeded, 0is stored.
The stored valueis valid only ifboth of thefollowingconditions aresatisfied:• The
tablespace isthe locallymanagedpermanenttablespace
• The uniformextentmanagementis set to theextent
If both of theabove conditionsare not satisfied,0 will bereturned.
-- ulong No All For locally managedpermanent tablespaces:MAX(DBA_SEGMENTS.NEXT_EXTENT) >MAX(DBA_FREE_SPACE.BYTES)
2-374 Working with RecordsHitachi Tuning Manager Application Reports Reference

Tablespace Fragmentation (PD_PDTF)
View Name(Manager
Name)Description Sum
RuleForm
atDelt
a
Supported
Version
Data Source
Overextended(OVEREXTENDED)
Number ofsegments withmore than fiveextents
-- ulong No All • For dictionarymanagedpermanenttablespaces, locallymanagedpermanenttablespaces, ordictionary managedtemporarytablespaces ofOracle9i or later:COUNT(DBA_SEGMENTS) where EXTENTS> 5
• For locally managedtemporarytablespaces ofOracle9i or later:COUNT(V$SORT_SEGMENT)whereTOTAL_EXTENTS >5
Record Time(RECORD_TIME)
Collectiontermination timefor theperformance datastored in therecord
-- time_t
No All Agent Collector
Record Type(INPUT_RECORD_TYPE)
Record name(always PDTF)
-- string(4)
No All Agent Collector
Segments(SEGMENTS)
Number ofsegments.For a locallymanagedtemporarytablespace, whenlocaltemp_option=Y, this isalways 1.
-- ulong No All • For dictionarymanagedpermanenttablespaces, locallymanagedpermanenttablespaces, ordictionary managedtemporarytablespaces ofOracle9i or later:COUNT(DBA_SEGMENTS)
• For a locallymanaged temporarytablespace on
Working with Records 2-375Hitachi Tuning Manager Application Reports Reference

Tablespace Fragmentation (PD_PDTF)
View Name(Manager
Name)Description Sum
RuleForm
atDelt
a
Supported
Version
Data Source
Oracle9i or later,whenlocaltemp_option=N:COUNT(V$SORT_SEGMENT)
• For a locallymanaged temporarytablespace, whenlocaltemp_option=Y:
Agent Collector
Start Time(START_TIME)
Collection starttime for theperformance datastored in therecord
-- time_t
No All Agent Collector
TablespaceName(TABLESPACE_NAME)
Tablespace name -- string(30)
No All DBA_TABLESPACES.TABLESPACE_NAME
Tablespace Interval (PI_PITS)
Function
The Tablespace Interval (PI_PITS) record stores performance data, taken atspecific intervals, about tablespaces in a database. Agent for Oracle createsone record for each tablespace in a database. This is a multi-instance record.
Table 2-183 Tablespace Interval (PI_PITS) Default and Changeable Values
Item Default Value Changeable?
Collection Interval 3600 Yes
Collection Offset 50
Log Yes
LOGIF (Blank)
Key Fields
Tablespace Name (TABLESPACE_NAME)
2-376 Working with RecordsHitachi Tuning Manager Application Reports Reference
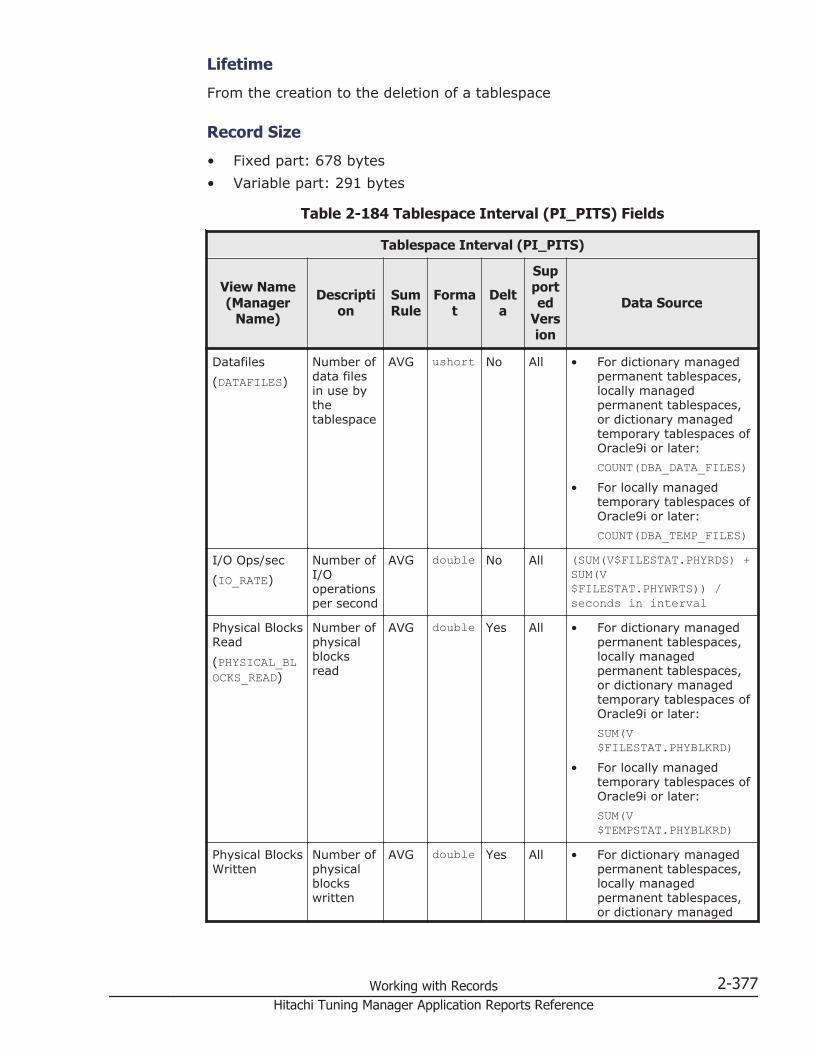
Lifetime
From the creation to the deletion of a tablespace
Record Size
• Fixed part: 678 bytes• Variable part: 291 bytes
Table 2-184 Tablespace Interval (PI_PITS) Fields
Tablespace Interval (PI_PITS)
View Name(Manager
Name)
Description
SumRule
Format
Delta
Supported
Version
Data Source
Datafiles(DATAFILES)
Number ofdata filesin use bythetablespace
AVG ushort No All • For dictionary managedpermanent tablespaces,locally managedpermanent tablespaces,or dictionary managedtemporary tablespaces ofOracle9i or later:COUNT(DBA_DATA_FILES)
• For locally managedtemporary tablespaces ofOracle9i or later:COUNT(DBA_TEMP_FILES)
I/O Ops/sec(IO_RATE)
Number ofI/Ooperationsper second
AVG double No All (SUM(V$FILESTAT.PHYRDS) +SUM(V$FILESTAT.PHYWRTS)) /seconds in interval
Physical BlocksRead(PHYSICAL_BLOCKS_READ)
Number ofphysicalblocksread
AVG double Yes All • For dictionary managedpermanent tablespaces,locally managedpermanent tablespaces,or dictionary managedtemporary tablespaces ofOracle9i or later:SUM(V$FILESTAT.PHYBLKRD)
• For locally managedtemporary tablespaces ofOracle9i or later:SUM(V$TEMPSTAT.PHYBLKRD)
Physical BlocksWritten
Number ofphysicalblockswritten
AVG double Yes All • For dictionary managedpermanent tablespaces,locally managedpermanent tablespaces,or dictionary managed
Working with Records 2-377Hitachi Tuning Manager Application Reports Reference
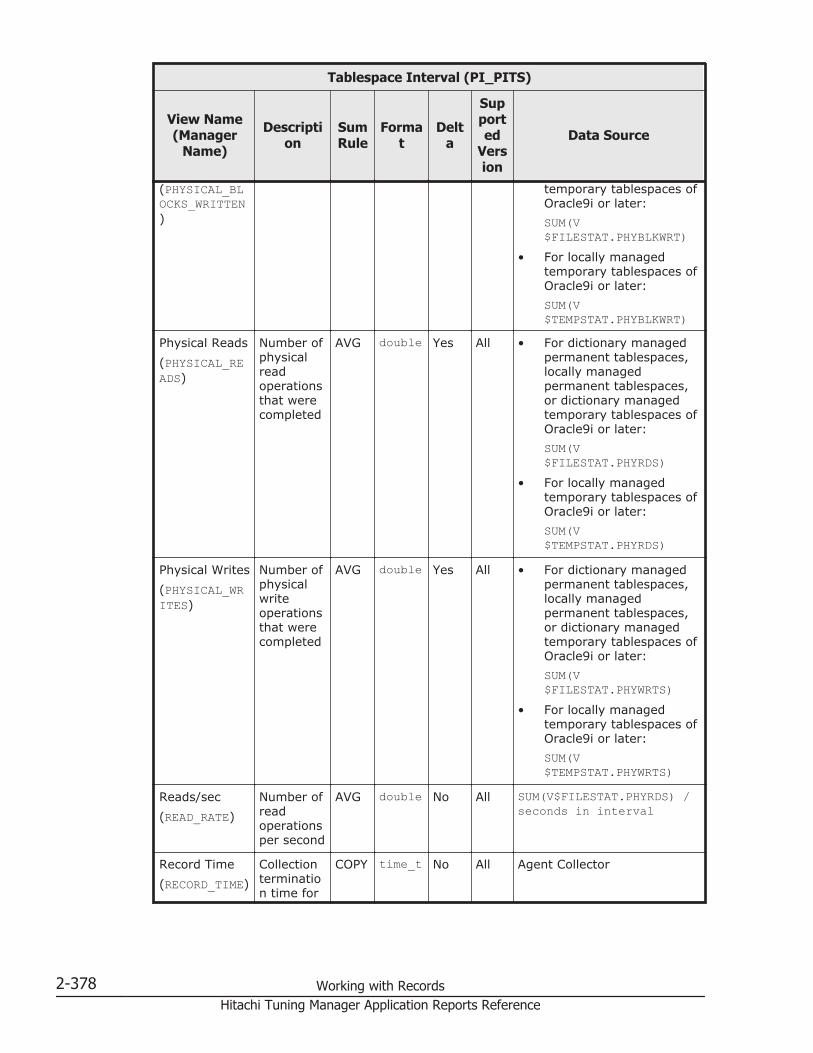
Tablespace Interval (PI_PITS)
View Name(Manager
Name)
Description
SumRule
Format
Delta
Supported
Version
Data Source
(PHYSICAL_BLOCKS_WRITTEN)
temporary tablespaces ofOracle9i or later:SUM(V$FILESTAT.PHYBLKWRT)
• For locally managedtemporary tablespaces ofOracle9i or later:SUM(V$TEMPSTAT.PHYBLKWRT)
Physical Reads(PHYSICAL_READS)
Number ofphysicalreadoperationsthat werecompleted
AVG double Yes All • For dictionary managedpermanent tablespaces,locally managedpermanent tablespaces,or dictionary managedtemporary tablespaces ofOracle9i or later:SUM(V$FILESTAT.PHYRDS)
• For locally managedtemporary tablespaces ofOracle9i or later:SUM(V$TEMPSTAT.PHYRDS)
Physical Writes(PHYSICAL_WRITES)
Number ofphysicalwriteoperationsthat werecompleted
AVG double Yes All • For dictionary managedpermanent tablespaces,locally managedpermanent tablespaces,or dictionary managedtemporary tablespaces ofOracle9i or later:SUM(V$FILESTAT.PHYWRTS)
• For locally managedtemporary tablespaces ofOracle9i or later:SUM(V$TEMPSTAT.PHYWRTS)
Reads/sec(READ_RATE)
Number ofreadoperationsper second
AVG double No All SUM(V$FILESTAT.PHYRDS) /seconds in interval
Record Time(RECORD_TIME)
Collectiontermination time for
COPY time_t No All Agent Collector
2-378 Working with RecordsHitachi Tuning Manager Application Reports Reference

Tablespace Interval (PI_PITS)
View Name(Manager
Name)
Description
SumRule
Format
Delta
Supported
Version
Data Source
theperformance datastored inthe record
Record Type(INPUT_RECORD_TYPE)
Recordname(alwaysPITS)
COPY string(4)
No All Agent Collector
RollbackSegments(ROLLBACK_SEGMENTS)
Number ofrollbacksegments.If aninstance ofOracle9i orlater isbeingmonitored,performance dataabout thelocallymanagedtablespaceis notcollected.
AVG ulong No All COUNT(DBA_ROLLBACK_SEGS)
RollbackSegments Hit%(ROLLBACK_SEGMENTS_HIT_PERCENTAGE)
Ratio (as apercent) ofthe HITvalue tothe GETvalue. Ifaninstance ofOracle9i orlater isbeingmonitored,performance dataabout thelocallymanagedtablespaceis notcollected.
AVG double No All ((SUM(V$ROLLSTAT.GETS) -SUM(V$ROLLSTAT.WAITS)) /SUM (V$ROLLSTAT.GETS)) *100
Working with Records 2-379Hitachi Tuning Manager Application Reports Reference
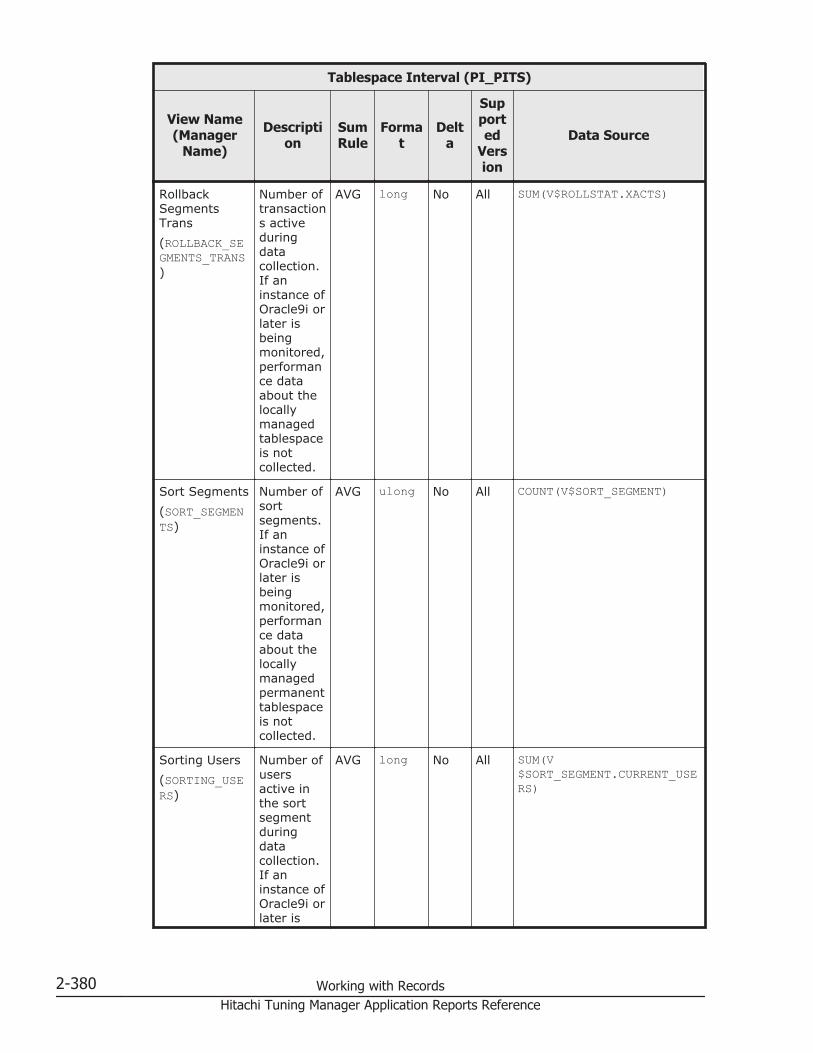
Tablespace Interval (PI_PITS)
View Name(Manager
Name)
Description
SumRule
Format
Delta
Supported
Version
Data Source
RollbackSegmentsTrans(ROLLBACK_SEGMENTS_TRANS)
Number oftransactions activeduringdatacollection.If aninstance ofOracle9i orlater isbeingmonitored,performance dataabout thelocallymanagedtablespaceis notcollected.
AVG long No All SUM(V$ROLLSTAT.XACTS)
Sort Segments(SORT_SEGMENTS)
Number ofsortsegments.If aninstance ofOracle9i orlater isbeingmonitored,performance dataabout thelocallymanagedpermanenttablespaceis notcollected.
AVG ulong No All COUNT(V$SORT_SEGMENT)
Sorting Users(SORTING_USERS)
Number ofusersactive inthe sortsegmentduringdatacollection.If aninstance ofOracle9i orlater is
AVG long No All SUM(V$SORT_SEGMENT.CURRENT_USERS)
2-380 Working with RecordsHitachi Tuning Manager Application Reports Reference
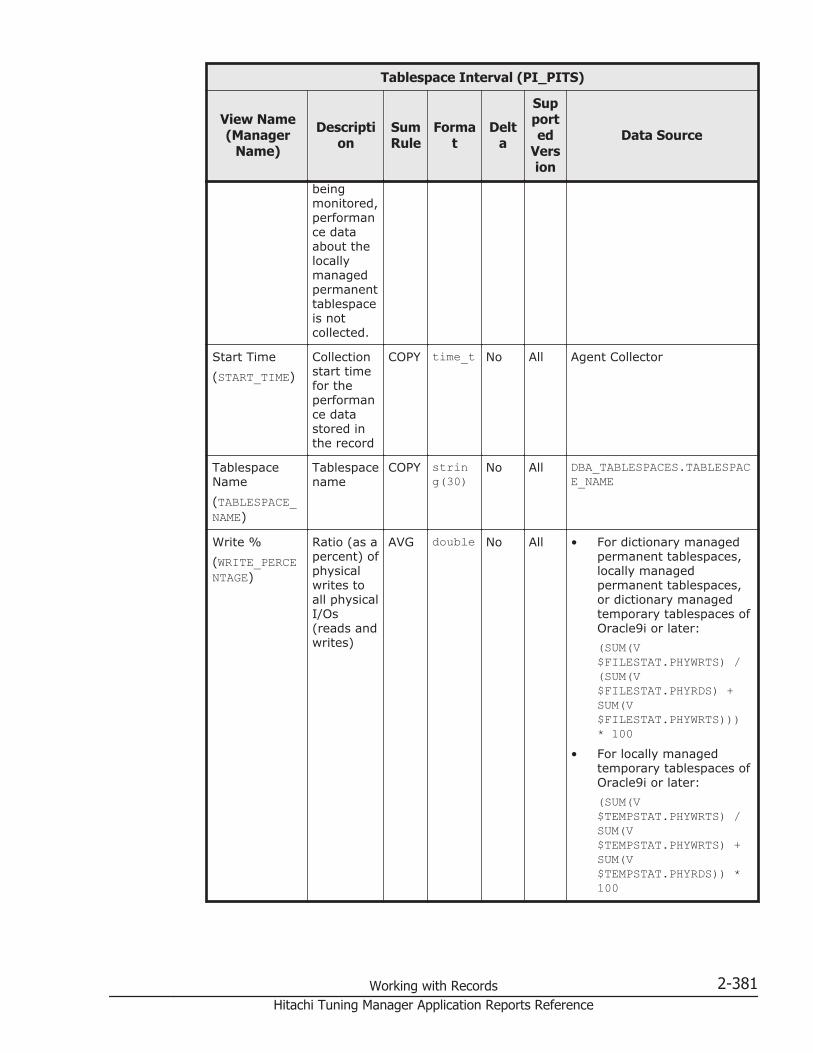
Tablespace Interval (PI_PITS)
View Name(Manager
Name)
Description
SumRule
Format
Delta
Supported
Version
Data Source
beingmonitored,performance dataabout thelocallymanagedpermanenttablespaceis notcollected.
Start Time(START_TIME)
Collectionstart timefor theperformance datastored inthe record
COPY time_t No All Agent Collector
TablespaceName(TABLESPACE_NAME)
Tablespacename
COPY string(30)
No All DBA_TABLESPACES.TABLESPACE_NAME
Write %(WRITE_PERCENTAGE)
Ratio (as apercent) ofphysicalwrites toall physicalI/Os(reads andwrites)
AVG double No All • For dictionary managedpermanent tablespaces,locally managedpermanent tablespaces,or dictionary managedtemporary tablespaces ofOracle9i or later:(SUM(V$FILESTAT.PHYWRTS) /(SUM(V$FILESTAT.PHYRDS) +SUM(V$FILESTAT.PHYWRTS)))* 100
• For locally managedtemporary tablespaces ofOracle9i or later:(SUM(V$TEMPSTAT.PHYWRTS) /SUM(V$TEMPSTAT.PHYWRTS) +SUM(V$TEMPSTAT.PHYRDS)) *100
Working with Records 2-381Hitachi Tuning Manager Application Reports Reference
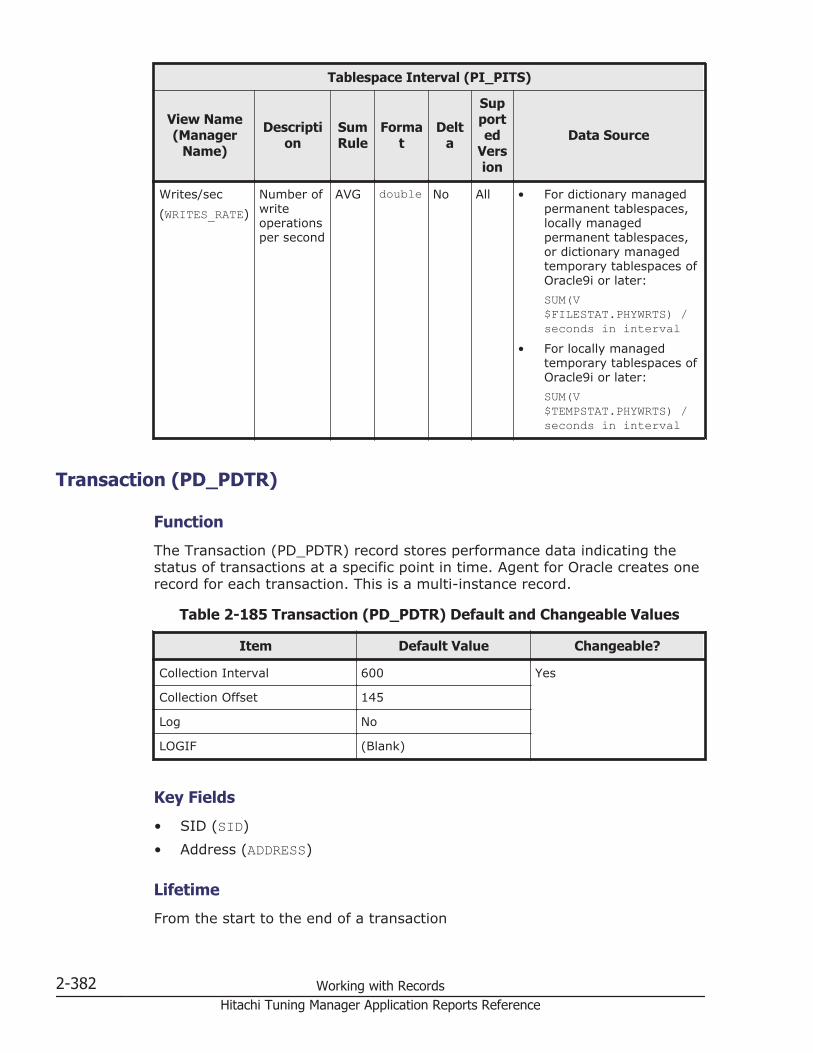
Tablespace Interval (PI_PITS)
View Name(Manager
Name)
Description
SumRule
Format
Delta
Supported
Version
Data Source
Writes/sec(WRITES_RATE)
Number ofwriteoperationsper second
AVG double No All • For dictionary managedpermanent tablespaces,locally managedpermanent tablespaces,or dictionary managedtemporary tablespaces ofOracle9i or later:SUM(V$FILESTAT.PHYWRTS) /seconds in interval
• For locally managedtemporary tablespaces ofOracle9i or later:SUM(V$TEMPSTAT.PHYWRTS) /seconds in interval
Transaction (PD_PDTR)
Function
The Transaction (PD_PDTR) record stores performance data indicating thestatus of transactions at a specific point in time. Agent for Oracle creates onerecord for each transaction. This is a multi-instance record.
Table 2-185 Transaction (PD_PDTR) Default and Changeable Values
Item Default Value Changeable?
Collection Interval 600 Yes
Collection Offset 145
Log No
LOGIF (Blank)
Key Fields
• SID (SID)• Address (ADDRESS)
Lifetime
From the start to the end of a transaction
2-382 Working with RecordsHitachi Tuning Manager Application Reports Reference
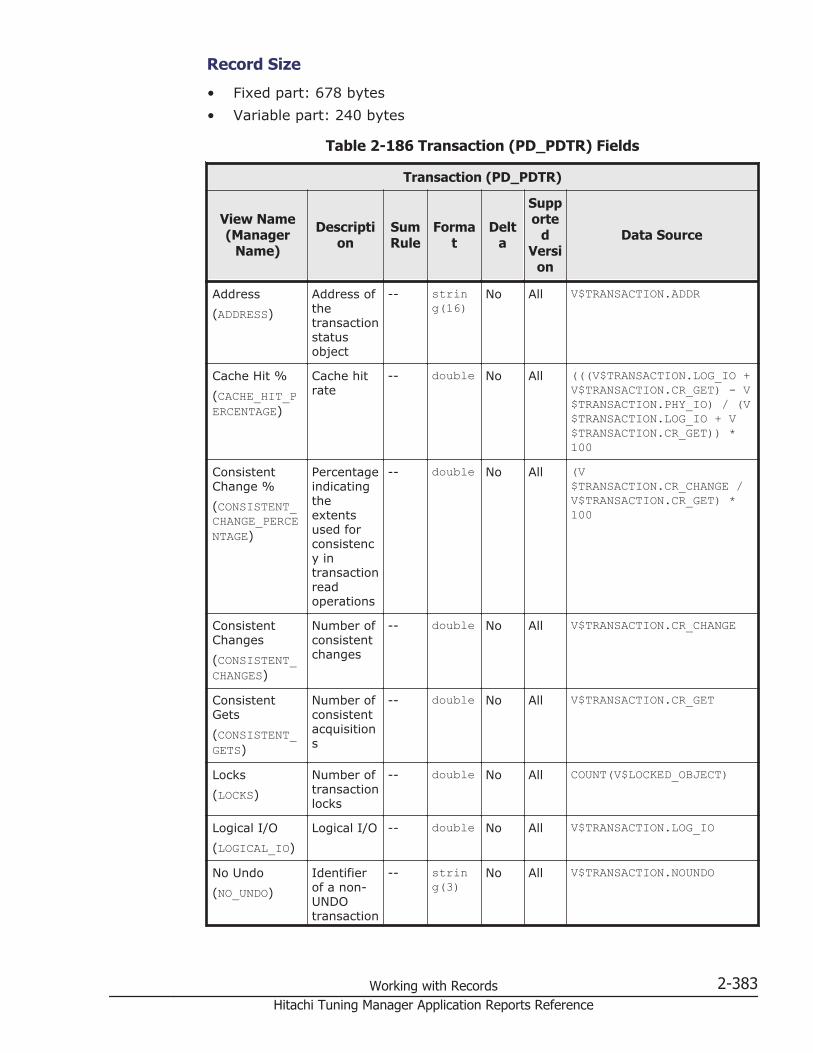
Record Size
• Fixed part: 678 bytes• Variable part: 240 bytes
Table 2-186 Transaction (PD_PDTR) Fields
Transaction (PD_PDTR)
View Name(Manager
Name)
Description
SumRule
Format
Delta
Supporte
dVersi
on
Data Source
Address(ADDRESS)
Address ofthetransactionstatusobject
-- string(16)
No All V$TRANSACTION.ADDR
Cache Hit %(CACHE_HIT_PERCENTAGE)
Cache hitrate
-- double No All (((V$TRANSACTION.LOG_IO +V$TRANSACTION.CR_GET) - V$TRANSACTION.PHY_IO) / (V$TRANSACTION.LOG_IO + V$TRANSACTION.CR_GET)) *100
ConsistentChange %(CONSISTENT_CHANGE_PERCENTAGE)
Percentageindicatingtheextentsused forconsistency intransactionreadoperations
-- double No All (V$TRANSACTION.CR_CHANGE /V$TRANSACTION.CR_GET) *100
ConsistentChanges(CONSISTENT_CHANGES)
Number ofconsistentchanges
-- double No All V$TRANSACTION.CR_CHANGE
ConsistentGets(CONSISTENT_GETS)
Number ofconsistentacquisitions
-- double No All V$TRANSACTION.CR_GET
Locks(LOCKS)
Number oftransactionlocks
-- double No All COUNT(V$LOCKED_OBJECT)
Logical I/O(LOGICAL_IO)
Logical I/O -- double No All V$TRANSACTION.LOG_IO
No Undo(NO_UNDO)
Identifierof a non-UNDOtransaction
-- string(3)
No All V$TRANSACTION.NOUNDO
Working with Records 2-383Hitachi Tuning Manager Application Reports Reference

Transaction (PD_PDTR)
View Name(Manager
Name)
Description
SumRule
Format
Delta
Supporte
dVersi
on
Data Source
(if this is anon-UNDOtransaction, the valueof this fieldis Yes;otherwise,the valueis No)
Physical I/O(PHYSICAL_IO)
PhysicalI/O
-- double No All V$TRANSACTION.PHY_IO
Previous XID(PREVIOUS_XID)
ParenttransactionID
-- string(30)
No All V$TRANSACTION.PRV_XIDUSN+ V$TRANSACTION.PRV_XIDSLT +V$TRANSACTION.PRV_XIDSQN
Record Time(RECORD_TIME)
Collectiontermination time fortheperformance datastored inthe record
-- time_t No All Agent Collector
Record Type(INPUT_RECORD_TYPE)
Recordname(alwaysPDTR)
-- string(4)
No All Agent Collector
Recursive(RECURSIVE)
Identifierof arecursivetransaction(if this is arecursivetransaction, the valueof this fieldis Yes;otherwise,the valueis No)
-- string(3)
No All V$TRANSACTION.RECURSIVE
SID(SID)
Session ID -- ulong No All V$SESSION.SID where V$TRANSACTION.SES_ADDR = V$SESSION.ADDR
Space(SPACE)
Identifierof a spacetransaction
-- string(3)
No All V$TRANSACTION.SPACE
2-384 Working with RecordsHitachi Tuning Manager Application Reports Reference
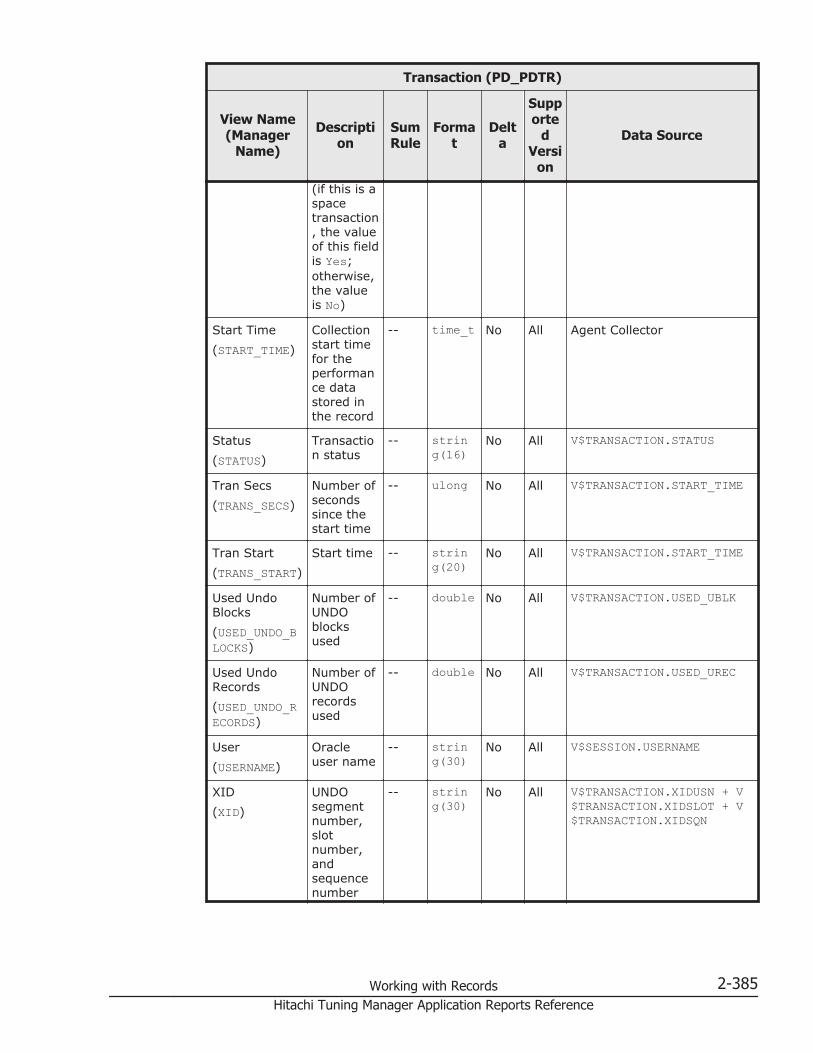
Transaction (PD_PDTR)
View Name(Manager
Name)
Description
SumRule
Format
Delta
Supporte
dVersi
on
Data Source
(if this is aspacetransaction, the valueof this fieldis Yes;otherwise,the valueis No)
Start Time(START_TIME)
Collectionstart timefor theperformance datastored inthe record
-- time_t No All Agent Collector
Status(STATUS)
Transaction status
-- string(16)
No All V$TRANSACTION.STATUS
Tran Secs(TRANS_SECS)
Number ofsecondssince thestart time
-- ulong No All V$TRANSACTION.START_TIME
Tran Start(TRANS_START)
Start time -- string(20)
No All V$TRANSACTION.START_TIME
Used UndoBlocks(USED_UNDO_BLOCKS)
Number ofUNDOblocksused
-- double No All V$TRANSACTION.USED_UBLK
Used UndoRecords(USED_UNDO_RECORDS)
Number ofUNDOrecordsused
-- double No All V$TRANSACTION.USED_UREC
User(USERNAME)
Oracleuser name
-- string(30)
No All V$SESSION.USERNAME
XID(XID)
UNDOsegmentnumber,slotnumber,andsequencenumber
-- string(30)
No All V$TRANSACTION.XIDUSN + V$TRANSACTION.XIDSLOT + V$TRANSACTION.XIDSQN
Working with Records 2-385Hitachi Tuning Manager Application Reports Reference
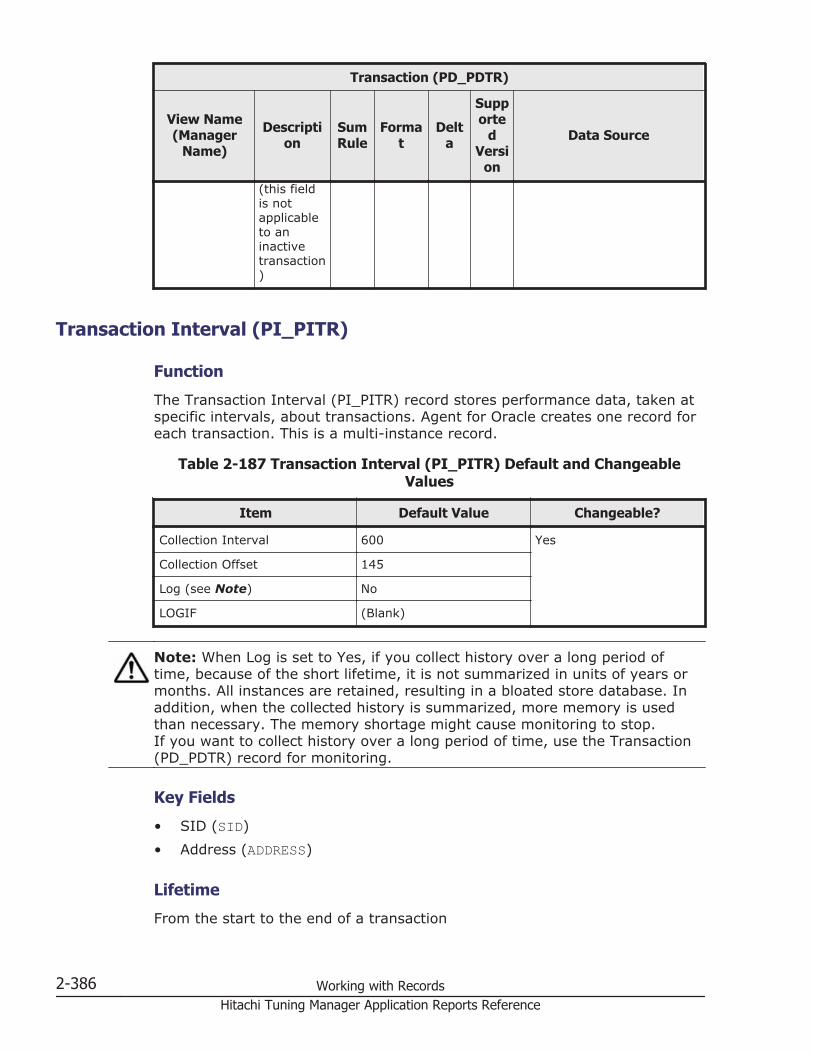
Transaction (PD_PDTR)
View Name(Manager
Name)
Description
SumRule
Format
Delta
Supporte
dVersi
on
Data Source
(this fieldis notapplicableto aninactivetransaction)
Transaction Interval (PI_PITR)
Function
The Transaction Interval (PI_PITR) record stores performance data, taken atspecific intervals, about transactions. Agent for Oracle creates one record foreach transaction. This is a multi-instance record.
Table 2-187 Transaction Interval (PI_PITR) Default and ChangeableValues
Item Default Value Changeable?
Collection Interval 600 Yes
Collection Offset 145
Log (see Note) No
LOGIF (Blank)
Note: When Log is set to Yes, if you collect history over a long period oftime, because of the short lifetime, it is not summarized in units of years ormonths. All instances are retained, resulting in a bloated store database. Inaddition, when the collected history is summarized, more memory is usedthan necessary. The memory shortage might cause monitoring to stop.If you want to collect history over a long period of time, use the Transaction(PD_PDTR) record for monitoring.
Key Fields
• SID (SID)• Address (ADDRESS)
Lifetime
From the start to the end of a transaction
2-386 Working with RecordsHitachi Tuning Manager Application Reports Reference

Record Size
• Fixed part: 678 bytes• Variable part: 348 bytes
Table 2-188 Transaction Interval (PI_PITR) Fields
Transaction Interval (PI_PITR)
View Name(Manager Name) Description Sum
Rule Format DeltaSupport
edVersion
DataSource
Address(ADDRESS)
Address ofthetransactionstatus object
COPY string(16)
No All V$TRANSACTION.ADDR
Cache Hit %(CACHE_HIT_PERCENTAGE)
Cache hitrate
AVG double No All ((V$TRANSACTION.LOG_IO -V$TRANSACTION.PHY_IO) /V$TRANSACTION.LOG_IO) *100
Consistent Change %(CONSISTENT_CHANGE_PERCENTAGE)
Percentageindicating theextents usedforconsistencyintransactionreadoperations
AVG double No All (V$TRANSACTION.CR_CHANGE/ V$TRANSACTION.CR_GET) *100
Consistent Changes(CONSISTENT_CHANGES)
Number ofconsistentchanges
AVG double Yes All V$TRANSACTION.CR_CHANGE
Consistent Gets(CONSISTENT_GETS)
Number ofconsistentacquisitions
AVG double Yes All V$TRANSACTION.CR_GET
Locks(LOCKS)
Number oflocks causedby thetransaction
AVG double Yes All COUNT(V$LOCKED_OBJECT)
Logical I/O(LOGICAL_IO)
Logical I/O AVG double Yes All V$TRANSACTION.LOG_IO
No Undo(NO_UNDO)
Identifier of anon-UNDOtransaction(if this is anon-UNDO
COPY string(3)
No All V$TRANSACTION.NOUNDO
Working with Records 2-387Hitachi Tuning Manager Application Reports Reference

Transaction Interval (PI_PITR)
View Name(Manager Name) Description Sum
Rule Format DeltaSupport
edVersion
DataSource
transaction,the value ofthis field isYes;otherwise,the value isNo)
Physical I/O(PHYSICAL_IO)
Physical I/O AVG double Yes All V$TRANSACTION.PHY_IO
Previous XID(PREVIOUS_XID)
ParenttransactionID
COPY string(30)
No All V$TRANSACTION.PRV_XIDUSN + V$TRANSACTION.PRV_XIDSLT + V$TRANSACTION.PRV_XIDSQN
Record Time(RECORD_TIME)
Collectionterminationtime for theperformancedata storedin the record
COPY time_t No All AgentCollector
Record Type(INPUT_RECORD_TYPE)
Record name(alwaysPITR)
COPY string(4)
No All AgentCollector
Recursive(RECURSIVE)
Identifier of arecursivetransaction(if this is arecursivetransaction,the value ofthis field isYes;otherwise,the value isNo)
COPY string(3)
No All V$TRANSACTION.RECURSIVE
SID(SID)
Session ID COPY ulong No All V$SESSION.SID where V$TRANSACTION.SES_ADDR= V$SESSION.ADDR
2-388 Working with RecordsHitachi Tuning Manager Application Reports Reference

Transaction Interval (PI_PITR)
View Name(Manager Name) Description Sum
Rule Format DeltaSupport
edVersion
DataSource
Space(SPACE)
Identifier of aspacetransaction(if this is aspacetransaction,the value ofthis field isYes;otherwise,the value isNo)
COPY string(3)
No All V$TRANSACTION.SPACE
Start Time(START_TIME)
Collectionstart time fortheperformancedata storedin the record
COPY time_t No All AgentCollector
Status(STATUS)
Transactionstatus
COPY string(16)
No All V$TRANSACTION.STATUS
Tran Secs(TRANS_SECS)
Number ofsecondssince thestart time
COPY ulong No All V$TRANSACTION.START_TIME
Tran Start(TRANS_START)
Start time COPY string(20)
No All V$TRANSACTION.START_TIME
Used Undo Blocks(USED_UNDO_BLOCKS)
Number ofUNDO blocksused
AVG double Yes All V$TRANSACTION.USED_UBLK
Used Undo Records(USED_UNDO_RECORDS)
Number ofUNDOrecords used
AVG double Yes All V$TRANSACTION.USED_UREC
User(USERNAME)
Oracle username
COPY string(30)
No All V$SESSION.USERNAME
XID(XID)
UNDOsegmentnumber, slotnumber, andsequencenumber (thisfield is notapplicable to
COPY string(30)
No All V$TRANSACTION.XIDUSN +V$TRANSACTION.XIDSLOT +V$TRANSACTION.XIDSQN
Working with Records 2-389Hitachi Tuning Manager Application Reports Reference
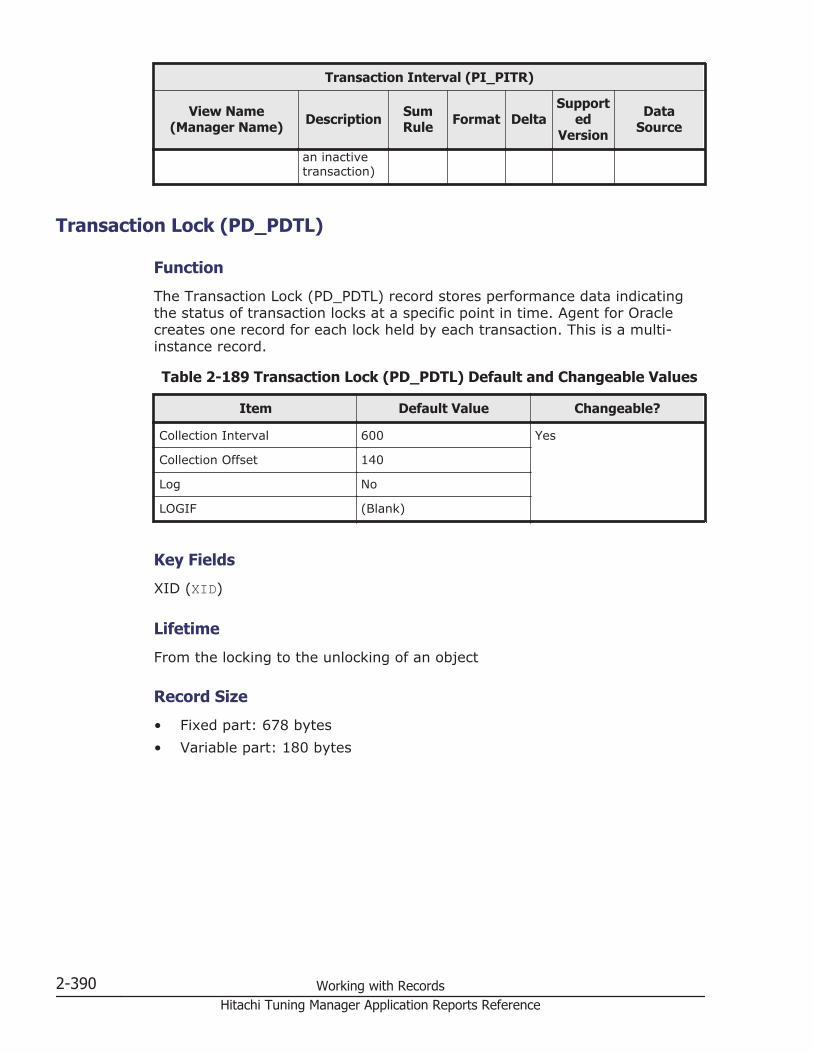
Transaction Interval (PI_PITR)
View Name(Manager Name) Description Sum
Rule Format DeltaSupport
edVersion
DataSource
an inactivetransaction)
Transaction Lock (PD_PDTL)
Function
The Transaction Lock (PD_PDTL) record stores performance data indicatingthe status of transaction locks at a specific point in time. Agent for Oraclecreates one record for each lock held by each transaction. This is a multi-instance record.
Table 2-189 Transaction Lock (PD_PDTL) Default and Changeable Values
Item Default Value Changeable?
Collection Interval 600 Yes
Collection Offset 140
Log No
LOGIF (Blank)
Key Fields
XID (XID)
Lifetime
From the locking to the unlocking of an object
Record Size
• Fixed part: 678 bytes• Variable part: 180 bytes
2-390 Working with RecordsHitachi Tuning Manager Application Reports Reference

Table 2-190 Transaction Lock (PD_PDTL) Fields
Transaction Lock (PD_PDTL)
View Name(Manager Name) Description Sum
Rule Format DeltaSupport
edVersion
DataSource
Locked Mode(LOCKED_MODE)
Lock mode -- string(20)
No All V$LOCKED_OBJECT.LOCKED_MODE
Object Name(OBJECT_NAME)
Name of thelocked object
-- string(30)
No All DBA_OBJECTS.OBJECT_NAME whereDBA_OBJECTS.OBJECT_ID= V$LOCKED_OBJECT.OBJECT_ID
Object Type(OBJECT_TYPE)
Object type -- string(30)
No All DBA_OBJECTS.OBJECT_TYPE whereDBA_OBJECTS.OBJECT_ID= V$LOCKED_OBJECT.OBJECT_ID
Owner(OWNER)
Object'sowner
-- string(30)
No All DBA_OBJECTS.OWNERwhereDBA_OBJECTS.OBJECT_ID= V$LOCKED_OBJECT.OBJECT_ID
Record Time(RECORD_TIME)
Collectionterminationtime for theperformancedata storedin the record
-- time_t No All AgentCollector
Record Type(INPUT_RECORD_TYPE)
Record name(alwaysPDTL)
-- string(4)
No All AgentCollector
SID(SID)
Session ID -- ulong No All V$LOCKED_OBJECT.SESSION_ID
Start Time Collectionstart time for
-- time_t No All AgentCollector
Working with Records 2-391Hitachi Tuning Manager Application Reports Reference
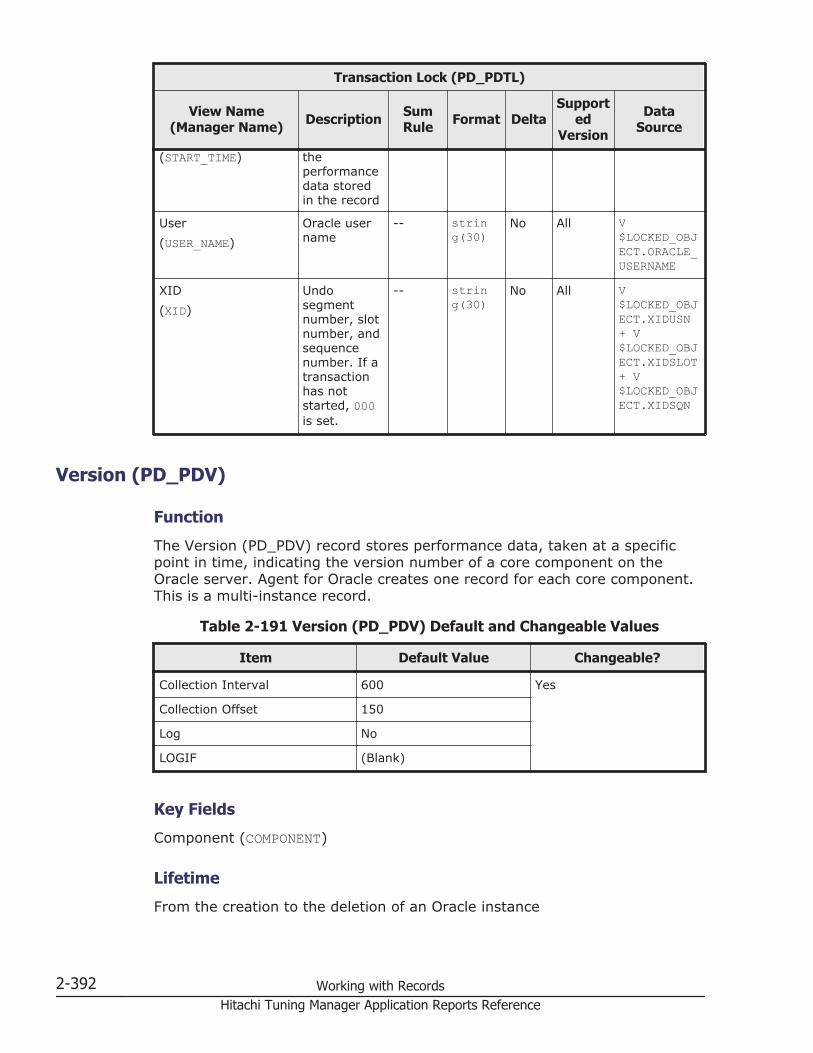
Transaction Lock (PD_PDTL)
View Name(Manager Name) Description Sum
Rule Format DeltaSupport
edVersion
DataSource
(START_TIME) theperformancedata storedin the record
User(USER_NAME)
Oracle username
-- string(30)
No All V$LOCKED_OBJECT.ORACLE_USERNAME
XID(XID)
Undosegmentnumber, slotnumber, andsequencenumber. If atransactionhas notstarted, 000is set.
-- string(30)
No All V$LOCKED_OBJECT.XIDUSN+ V$LOCKED_OBJECT.XIDSLOT+ V$LOCKED_OBJECT.XIDSQN
Version (PD_PDV)
Function
The Version (PD_PDV) record stores performance data, taken at a specificpoint in time, indicating the version number of a core component on theOracle server. Agent for Oracle creates one record for each core component.This is a multi-instance record.
Table 2-191 Version (PD_PDV) Default and Changeable Values
Item Default Value Changeable?
Collection Interval 600 Yes
Collection Offset 150
Log No
LOGIF (Blank)
Key Fields
Component (COMPONENT)
Lifetime
From the creation to the deletion of an Oracle instance
2-392 Working with RecordsHitachi Tuning Manager Application Reports Reference

Record Size
• Fixed part: 678 bytes• Variable part: 195 bytes
Table 2-192 Version (PD_PDV) Fields
Version (PD_PDV)
View Name(Manager Name) Description Sum
Rule Format DeltaSupport
edVersion
DataSource
Component(COMPONENT)
Componentname
-- string(64)
No All PRODUCT_COMPONENT_VERSION.PRODUCT
Record Time(RECORD_TIME)
Collectionterminationtime for theperformancedata storedin the record
-- time_t No All AgentCollector
Record Type(INPUT_RECORD_TYPE)
Record name(always PDV)
-- string(4)
No All AgentCollector
Start Time(START_TIME)
Collectionstart time fortheperformancedata storedin the record
-- time_t No All AgentCollector
Status(STATUS)
Componentstatus
-- string(64)
No All PRODUCT_COMPONENT_VERSION.STATUS
Version(VERSION)
Component'sversionnumber
-- string(64)
No All PRODUCT_COMPONENT_VERSION.VERSION
Reserved RecordsThe following records are reserved and unavailable:
• Ping Activity Interval (PI_PIPP)• Database Link (PD_PDDL)• SQL*Net Handler (PD_PDNH)
Agent for Microsoft SQL Server RecordsTable 2-193 Agent for Microsoft SQL Server Records on page 2-394 lists therecords that can be collected by Agent for Microsoft SQL Server and theinformation that is stored in each record.
Working with Records 2-393Hitachi Tuning Manager Application Reports Reference
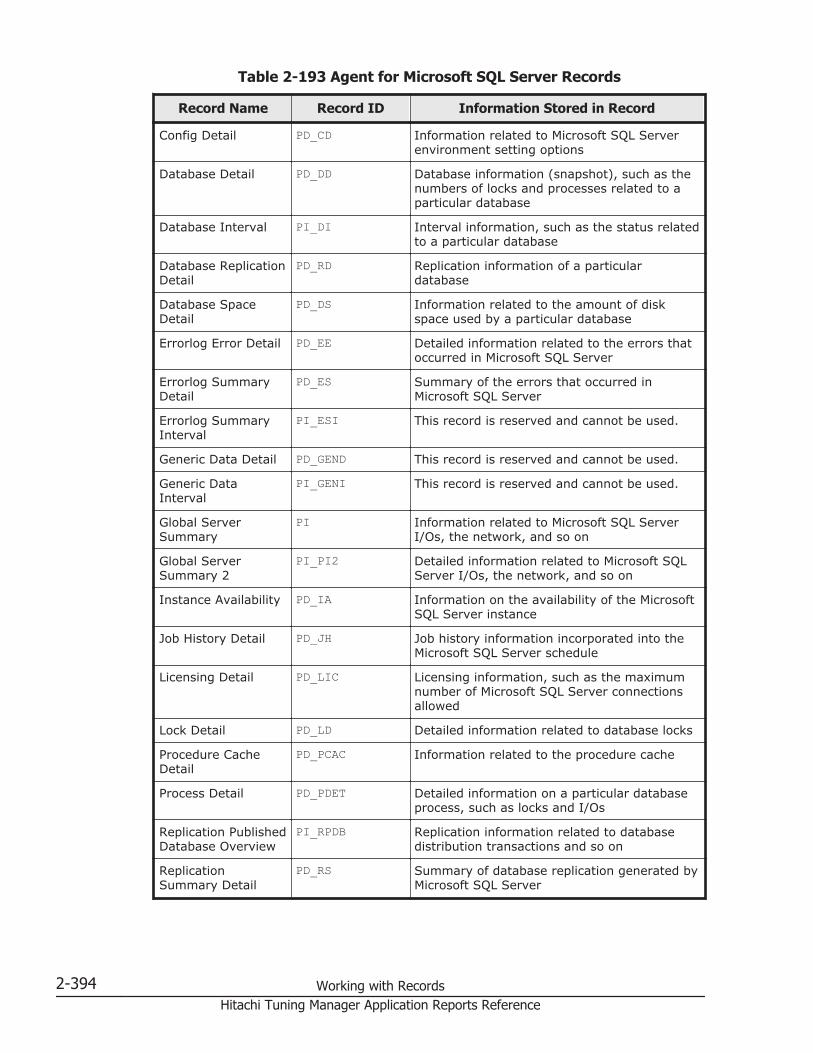
Table 2-193 Agent for Microsoft SQL Server Records
Record Name Record ID Information Stored in Record
Config Detail PD_CD Information related to Microsoft SQL Serverenvironment setting options
Database Detail PD_DD Database information (snapshot), such as thenumbers of locks and processes related to aparticular database
Database Interval PI_DI Interval information, such as the status relatedto a particular database
Database ReplicationDetail
PD_RD Replication information of a particulardatabase
Database SpaceDetail
PD_DS Information related to the amount of diskspace used by a particular database
Errorlog Error Detail PD_EE Detailed information related to the errors thatoccurred in Microsoft SQL Server
Errorlog SummaryDetail
PD_ES Summary of the errors that occurred inMicrosoft SQL Server
Errorlog SummaryInterval
PI_ESI This record is reserved and cannot be used.
Generic Data Detail PD_GEND This record is reserved and cannot be used.
Generic DataInterval
PI_GENI This record is reserved and cannot be used.
Global ServerSummary
PI Information related to Microsoft SQL ServerI/Os, the network, and so on
Global ServerSummary 2
PI_PI2 Detailed information related to Microsoft SQLServer I/Os, the network, and so on
Instance Availability PD_IA Information on the availability of the MicrosoftSQL Server instance
Job History Detail PD_JH Job history information incorporated into theMicrosoft SQL Server schedule
Licensing Detail PD_LIC Licensing information, such as the maximumnumber of Microsoft SQL Server connectionsallowed
Lock Detail PD_LD Detailed information related to database locks
Procedure CacheDetail
PD_PCAC Information related to the procedure cache
Process Detail PD_PDET Detailed information on a particular databaseprocess, such as locks and I/Os
Replication PublishedDatabase Overview
PI_RPDB Replication information related to databasedistribution transactions and so on
ReplicationSummary Detail
PD_RS Summary of database replication generated byMicrosoft SQL Server
2-394 Working with RecordsHitachi Tuning Manager Application Reports Reference

Record Name Record ID Information Stored in Record
Restore HistoryDetail
PD_RH This record is reserved and cannot be used.
Server Detail PD Detailed information on Microsoft SQL Server,such as locks and I/Os
Server Locks Detail PD_LOCK Information related to Microsoft SQL Serverlocks
Server Overview PI_SERV Overall information related to Microsoft SQLServer, such as the rate of cache hits and I/Os
Server Overview 2 PI_SRV2 Detailed information related to Microsoft SQLServer, such as the rate of cache hits and I/Os
Server Space Detail PD_SS Information related to the amount of diskspace used by Microsoft SQL Server
Server SpaceInterval
PI_SI Interval information related to the amount ofdisk space used by Microsoft SQL Server
SQL Text PD_SQL This record displays the execution informationon the last query issued by the process.
SQL Text -Performance-Based
PD_PDES This record is reserved and cannot be used.
Transaction LogOverview
PI_TLOG Information related to transaction log space
User-DefinedCounter Overview
PI_UCTR Information related to each user-definedcounter
User Process Detail PD_USER Information related to each logged-on user
Config Detail (PD_CD)
Function
The Config Detail (PD_CD) record indicates information related to MicrosoftSQL Server environment setting options. One record is created for eachoption. This is a multi-instance record.
Table 2-194 Config Detail (PD_CD) Default and Changeable Values
Item Default Value Changeable?
Collection Interval 60 Yes
Collection Offset 0
Log No
LOGIF (Blank)
Working with Records 2-395Hitachi Tuning Manager Application Reports Reference

Key Fields
Name (NAME)
Lifetime
From the time a Microsoft SQL Server instance is created until the time it isdeleted
Record Size
• Fixed part: 681 bytes• Variable part: 157 bytes
Table 2-195 Config Detail (PD_CD) Fields
Config Detail (PD_CD)
View Name(Manager Name) Description Sum
Rule Format Delta
DataSource
Config Value(CONFIG_VALUE)
Environment settingoption value
-- long No sp_configure.config_value
Current Run Value(RUN_VALUE)
Environment settingoption value (executionvalue at datacollection)
-- long No sp_configure.run_value
Max Value(MAXIMUM)
Maximum value ofenvironment settingoption
-- long No sp_configure.maximum
Min Value(MINIMUM)
Minimum value ofenvironment settingoption
-- long No sp_configure.minimum
Name(NAME)
Name of environmentsetting option
-- string(141)
No sp_configure.name
Record Time(RECORD_TIME)
Interval end time (GMTformat)
-- time_t No AgentCollector
Record Type(INPUT_RECORD_TYPE)
Record type (alwaysCD)
-- char(8) No AgentCollector
Start Time(START_TIME)
Interval start time(GMT format)
-- time_t No AgentCollector
2-396 Working with RecordsHitachi Tuning Manager Application Reports Reference
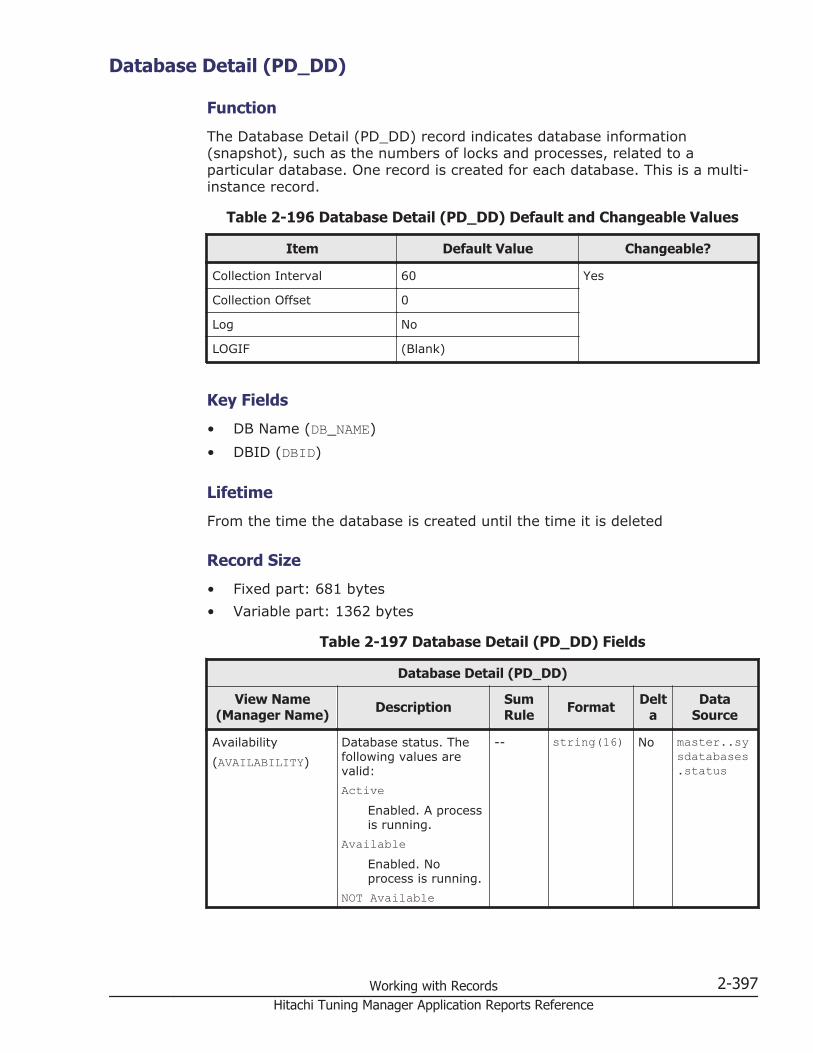
Database Detail (PD_DD)
Function
The Database Detail (PD_DD) record indicates database information(snapshot), such as the numbers of locks and processes, related to aparticular database. One record is created for each database. This is a multi-instance record.
Table 2-196 Database Detail (PD_DD) Default and Changeable Values
Item Default Value Changeable?
Collection Interval 60 Yes
Collection Offset 0
Log No
LOGIF (Blank)
Key Fields
• DB Name (DB_NAME)• DBID (DBID)
Lifetime
From the time the database is created until the time it is deleted
Record Size
• Fixed part: 681 bytes• Variable part: 1362 bytes
Table 2-197 Database Detail (PD_DD) Fields
Database Detail (PD_DD)
View Name(Manager Name) Description Sum
Rule Format Delta
DataSource
Availability(AVAILABILITY)
Database status. Thefollowing values arevalid:Active
Enabled. A processis running.
AvailableEnabled. Noprocess is running.
NOT Available
-- string(16) No master..sysdatabases.status
Working with Records 2-397Hitachi Tuning Manager Application Reports Reference

Database Detail (PD_DD)
View Name(Manager Name) Description Sum
Rule Format Delta
DataSource
A crash or problemmight haveoccurred duringloading, and, as aresult, thedatabase cannotbe opened or usedin its current state.
RestrictedThe database canbe used only by itsowner or a singleuser.
Blocked Processes(BLOCKED)
Number of blockedprocesses
-- word No Totalnumber ofprocesseswhosemaster..sysprocesses.blocked isnot 0
Blocking Locks(BLOCKING)
Number of blockinglocks
-- ulong No Totalnumber oflocks whosemaster..syslockinfo.req_statusvalue is 3(standby)
Create Date(CREATE_DATE)
Database creation date -- time_t No master..sysdatabases.crdate
DB Name(DB_NAME)
Database name -- string(257)
No master..sysdatabases.name
DB Owner(DBO)
Database owner -- string(513)
No User namefor whommaster..sysdatabases.sid =master..syslogins.sid
DBID(DBID)
Database ID -- word No master..sysdatabases.dbid
Demand Locks(DEMAND)
Number of requestlocks
-- ulong No master..syslockinfo
2-398 Working with RecordsHitachi Tuning Manager Application Reports Reference
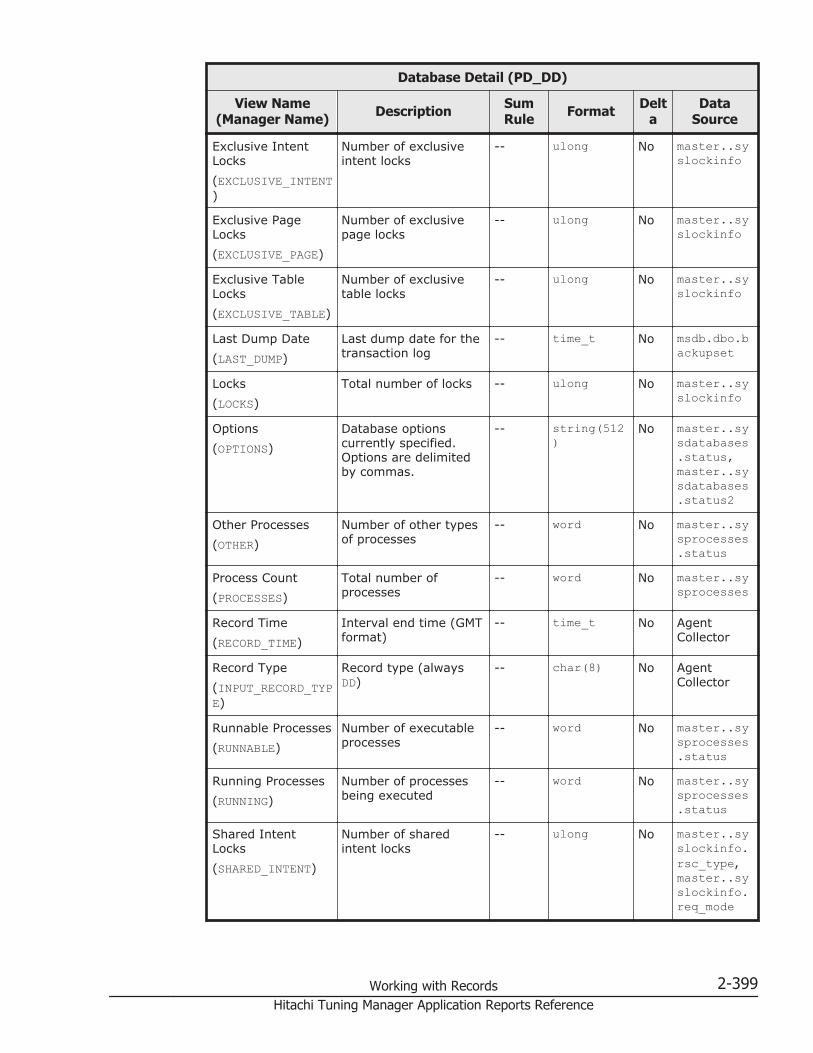
Database Detail (PD_DD)
View Name(Manager Name) Description Sum
Rule Format Delta
DataSource
Exclusive IntentLocks(EXCLUSIVE_INTENT)
Number of exclusiveintent locks
-- ulong No master..syslockinfo
Exclusive PageLocks(EXCLUSIVE_PAGE)
Number of exclusivepage locks
-- ulong No master..syslockinfo
Exclusive TableLocks(EXCLUSIVE_TABLE)
Number of exclusivetable locks
-- ulong No master..syslockinfo
Last Dump Date(LAST_DUMP)
Last dump date for thetransaction log
-- time_t No msdb.dbo.backupset
Locks(LOCKS)
Total number of locks -- ulong No master..syslockinfo
Options(OPTIONS)
Database optionscurrently specified.Options are delimitedby commas.
-- string(512)
No master..sysdatabases.status,master..sysdatabases.status2
Other Processes(OTHER)
Number of other typesof processes
-- word No master..sysprocesses.status
Process Count(PROCESSES)
Total number ofprocesses
-- word No master..sysprocesses
Record Time(RECORD_TIME)
Interval end time (GMTformat)
-- time_t No AgentCollector
Record Type(INPUT_RECORD_TYPE)
Record type (alwaysDD)
-- char(8) No AgentCollector
Runnable Processes(RUNNABLE)
Number of executableprocesses
-- word No master..sysprocesses.status
Running Processes(RUNNING)
Number of processesbeing executed
-- word No master..sysprocesses.status
Shared IntentLocks(SHARED_INTENT)
Number of sharedintent locks
-- ulong No master..syslockinfo.rsc_type,master..syslockinfo.req_mode
Working with Records 2-399Hitachi Tuning Manager Application Reports Reference
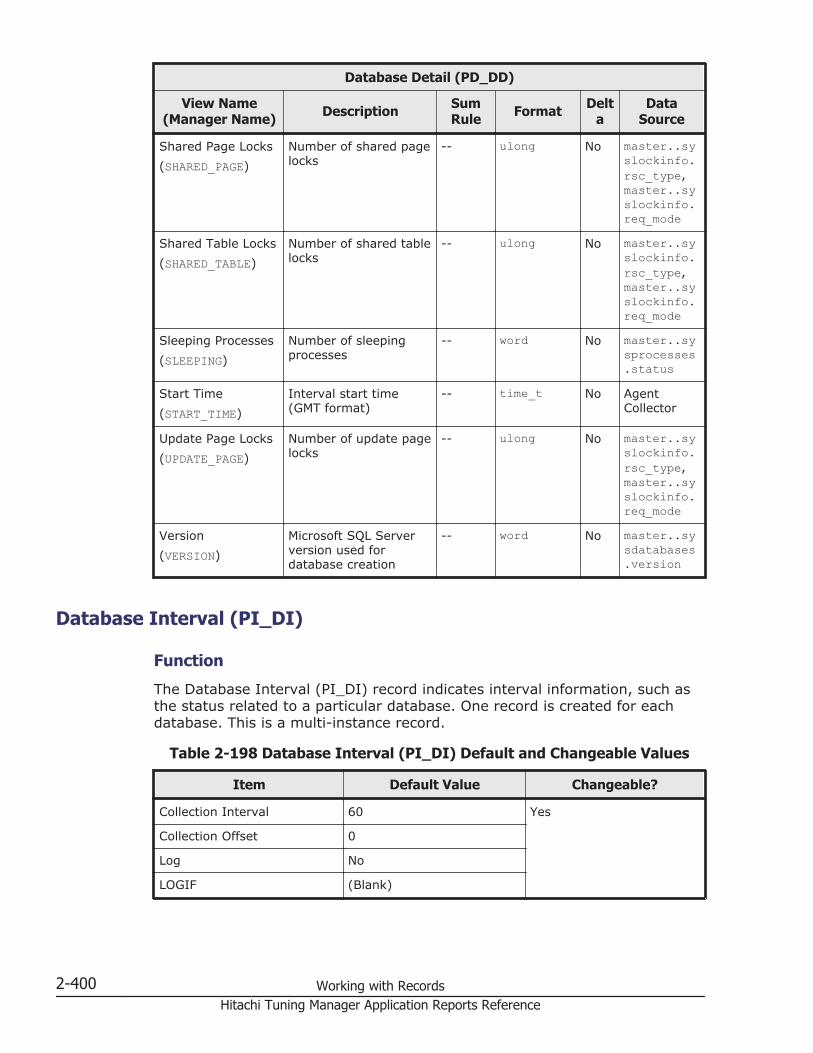
Database Detail (PD_DD)
View Name(Manager Name) Description Sum
Rule Format Delta
DataSource
Shared Page Locks(SHARED_PAGE)
Number of shared pagelocks
-- ulong No master..syslockinfo.rsc_type,master..syslockinfo.req_mode
Shared Table Locks(SHARED_TABLE)
Number of shared tablelocks
-- ulong No master..syslockinfo.rsc_type,master..syslockinfo.req_mode
Sleeping Processes(SLEEPING)
Number of sleepingprocesses
-- word No master..sysprocesses.status
Start Time(START_TIME)
Interval start time(GMT format)
-- time_t No AgentCollector
Update Page Locks(UPDATE_PAGE)
Number of update pagelocks
-- ulong No master..syslockinfo.rsc_type,master..syslockinfo.req_mode
Version(VERSION)
Microsoft SQL Serverversion used fordatabase creation
-- word No master..sysdatabases.version
Database Interval (PI_DI)
Function
The Database Interval (PI_DI) record indicates interval information, such asthe status related to a particular database. One record is created for eachdatabase. This is a multi-instance record.
Table 2-198 Database Interval (PI_DI) Default and Changeable Values
Item Default Value Changeable?
Collection Interval 60 Yes
Collection Offset 0
Log No
LOGIF (Blank)
2-400 Working with RecordsHitachi Tuning Manager Application Reports Reference
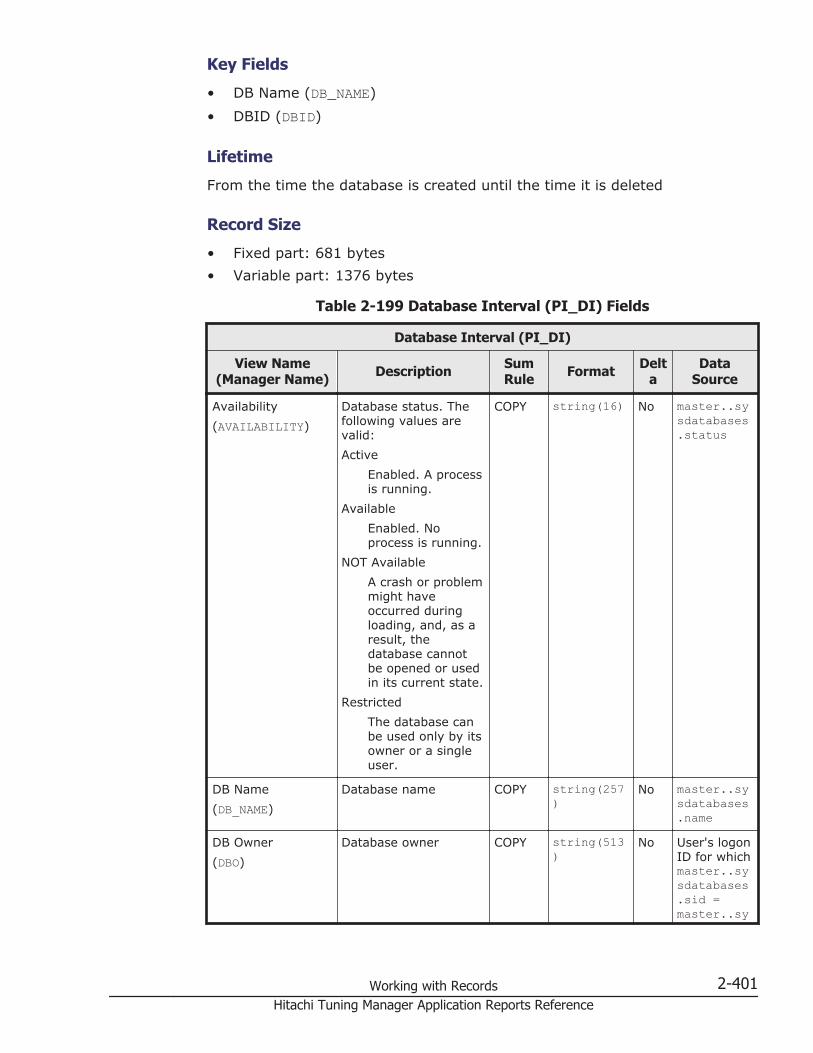
Key Fields
• DB Name (DB_NAME)• DBID (DBID)
Lifetime
From the time the database is created until the time it is deleted
Record Size
• Fixed part: 681 bytes• Variable part: 1376 bytes
Table 2-199 Database Interval (PI_DI) Fields
Database Interval (PI_DI)
View Name(Manager Name) Description Sum
Rule Format Delta
DataSource
Availability(AVAILABILITY)
Database status. Thefollowing values arevalid:Active
Enabled. A processis running.
AvailableEnabled. Noprocess is running.
NOT AvailableA crash or problemmight haveoccurred duringloading, and, as aresult, thedatabase cannotbe opened or usedin its current state.
RestrictedThe database canbe used only by itsowner or a singleuser.
COPY string(16) No master..sysdatabases.status
DB Name(DB_NAME)
Database name COPY string(257)
No master..sysdatabases.name
DB Owner(DBO)
Database owner COPY string(513)
No User's logonID for whichmaster..sysdatabases.sid =master..sy
Working with Records 2-401Hitachi Tuning Manager Application Reports Reference

Database Interval (PI_DI)
View Name(Manager Name) Description Sum
Rule Format Delta
DataSource
slogins.sid
DBID(DBID)
Database ID COPY word No master..sysdatabases.dbid
Data Growth %(DATA_GROWTH)
Rate of increase of dataspace during theinterval
AVG double No • ForMicrosoft SQLServer2000:Eachdatabase'ssysindexestable
• ForMicrosoft SQLServer2005 orlater:sys.partitions,sys.allocation_units, andsys.internal_tables
Index Growth %(IDX_GROWTH)
Rate of increase ofindex space during theinterval
AVG double No • ForMicrosoft SQLServer2000:Eachdatabase'ssysindexestable
• ForMicrosoft SQLServer2005 orlater:
2-402 Working with RecordsHitachi Tuning Manager Application Reports Reference

Database Interval (PI_DI)
View Name(Manager Name) Description Sum
Rule Format Delta
DataSourcesys.partitions,sys.allocation_units, andsys.internal_tables
Log Growth %(LOG_GROWTH)
Rate of increase of logspace during theinterval
AVG double No DBCCSQLPERF(LOGSPACE)
Options(OPTIONS)
Database optionscurrently specified.Options are delimitedby commas.
COPY string(512)
No master..sysdatabases.status,master..sysdatabases.status2
Record Time(RECORD_TIME)
Interval end time (GMTformat)
COPY time_t No AgentCollector
Record Type(INPUT_RECORD_TYPE)
Record type (alwaysDI)
COPY char(8) No AgentCollector
Start Time(START_TIME)
Interval start time(GMT format)
COPY time_t No AgentCollector
Tran Log Dumps(DUMPED_TRAN)
Number of transactionlog dumps collectedduring the relevantinterval
AVG long Yes msdb.dbo.backupset
Database Replication Detail (PD_RD)
Function
The Database Replication Detail (PD_RD) record indicates the replicationinformation of a particular database. One record is created for eachreplication of the database. This is a multi-instance record.
As indicated in the following table, the fields that can be acquired for thisrecord differ depending on the database type.
Working with Records 2-403Hitachi Tuning Manager Application Reports Reference
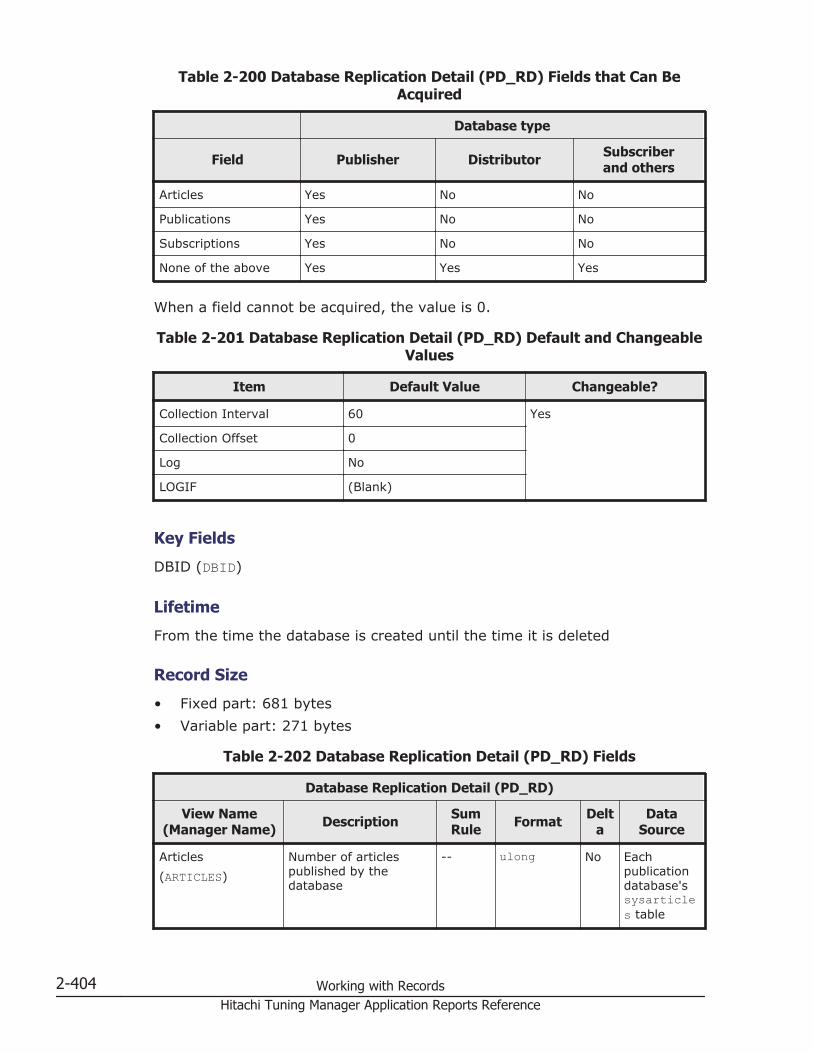
Table 2-200 Database Replication Detail (PD_RD) Fields that Can BeAcquired
Database type
Field Publisher Distributor Subscriberand others
Articles Yes No No
Publications Yes No No
Subscriptions Yes No No
None of the above Yes Yes Yes
When a field cannot be acquired, the value is 0.
Table 2-201 Database Replication Detail (PD_RD) Default and ChangeableValues
Item Default Value Changeable?
Collection Interval 60 Yes
Collection Offset 0
Log No
LOGIF (Blank)
Key Fields
DBID (DBID)
Lifetime
From the time the database is created until the time it is deleted
Record Size
• Fixed part: 681 bytes• Variable part: 271 bytes
Table 2-202 Database Replication Detail (PD_RD) Fields
Database Replication Detail (PD_RD)
View Name(Manager Name) Description Sum
Rule Format Delta
DataSource
Articles(ARTICLES)
Number of articlespublished by thedatabase
-- ulong No Eachpublicationdatabase'ssysarticles table
2-404 Working with RecordsHitachi Tuning Manager Application Reports Reference
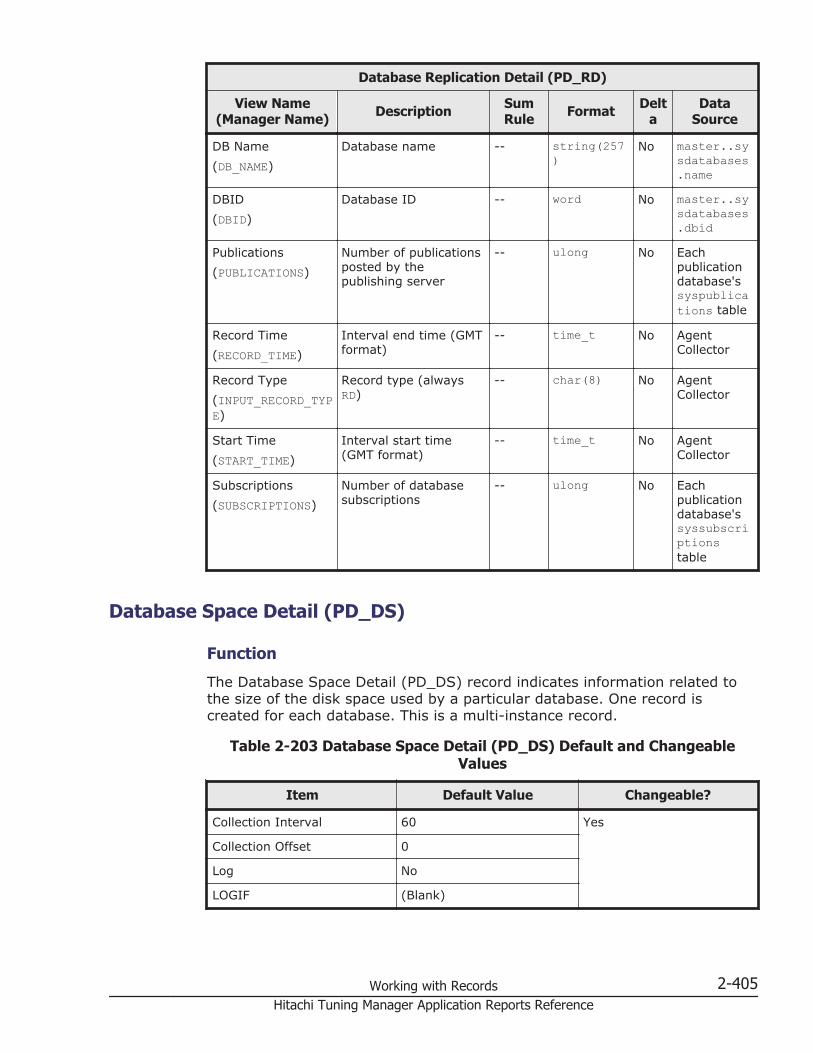
Database Replication Detail (PD_RD)
View Name(Manager Name) Description Sum
Rule Format Delta
DataSource
DB Name(DB_NAME)
Database name -- string(257)
No master..sysdatabases.name
DBID(DBID)
Database ID -- word No master..sysdatabases.dbid
Publications(PUBLICATIONS)
Number of publicationsposted by thepublishing server
-- ulong No Eachpublicationdatabase'ssyspublications table
Record Time(RECORD_TIME)
Interval end time (GMTformat)
-- time_t No AgentCollector
Record Type(INPUT_RECORD_TYPE)
Record type (alwaysRD)
-- char(8) No AgentCollector
Start Time(START_TIME)
Interval start time(GMT format)
-- time_t No AgentCollector
Subscriptions(SUBSCRIPTIONS)
Number of databasesubscriptions
-- ulong No Eachpublicationdatabase'ssyssubscriptionstable
Database Space Detail (PD_DS)
Function
The Database Space Detail (PD_DS) record indicates information related tothe size of the disk space used by a particular database. One record iscreated for each database. This is a multi-instance record.
Table 2-203 Database Space Detail (PD_DS) Default and ChangeableValues
Item Default Value Changeable?
Collection Interval 60 Yes
Collection Offset 0
Log No
LOGIF (Blank)
Working with Records 2-405Hitachi Tuning Manager Application Reports Reference

Key Fields
• DB Name (DB_NAME)• DBID (DBID)
Lifetime
From the time the database is created until the time it is deleted
Record Size
• Fixed part: 681 bytes• Variable part: 331 bytes
Table 2-204 Database Space Detail (PD_DS) Fields
Database Space Detail (PD_DS)
View Name(Manager Name) Description Sum
Rule Format Delta
DataSource
DB Name(DB_NAME)
Database name -- string(257)
No master..sysdatabases.name
DB Size(SIZE)
Database size (inmegabytes)
-- double No • ForMicrosoft SQLServer2000:sp_databases.db_size
• ForMicrosoft SQLServer2005 orlater:dbo.sysfiles
DBID(DBID)
Database ID -- word No master..sysdatabases.dbid
Data Mbytes(DATA)
Size of the data spacebeing used (inmegabytes)
-- double No • ForMicrosoft SQLServer2000:Eachdatabase'ssysind
2-406 Working with RecordsHitachi Tuning Manager Application Reports Reference
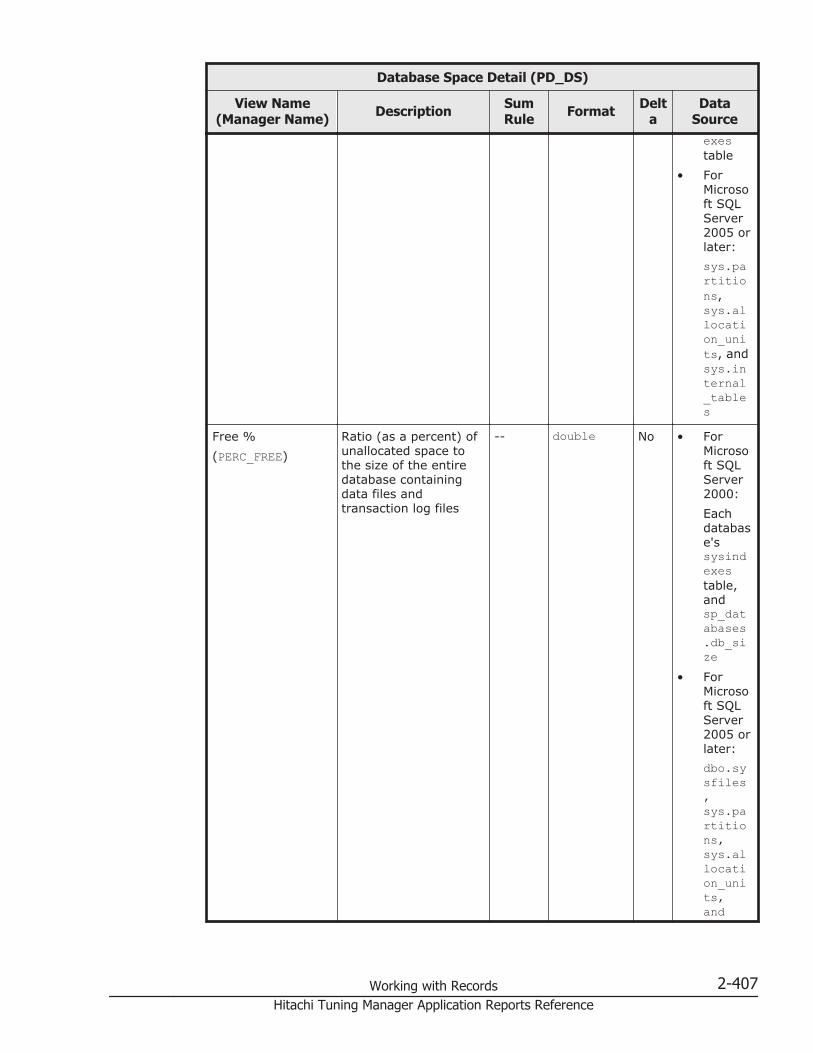
Database Space Detail (PD_DS)
View Name(Manager Name) Description Sum
Rule Format Delta
DataSourceexestable
• ForMicrosoft SQLServer2005 orlater:sys.partitions,sys.allocation_units, andsys.internal_tables
Free %(PERC_FREE)
Ratio (as a percent) ofunallocated space tothe size of the entiredatabase containingdata files andtransaction log files
-- double No • ForMicrosoft SQLServer2000:Eachdatabase'ssysindexestable,andsp_databases.db_size
• ForMicrosoft SQLServer2005 orlater:dbo.sysfiles,sys.partitions,sys.allocation_units,and
Working with Records 2-407Hitachi Tuning Manager Application Reports Reference
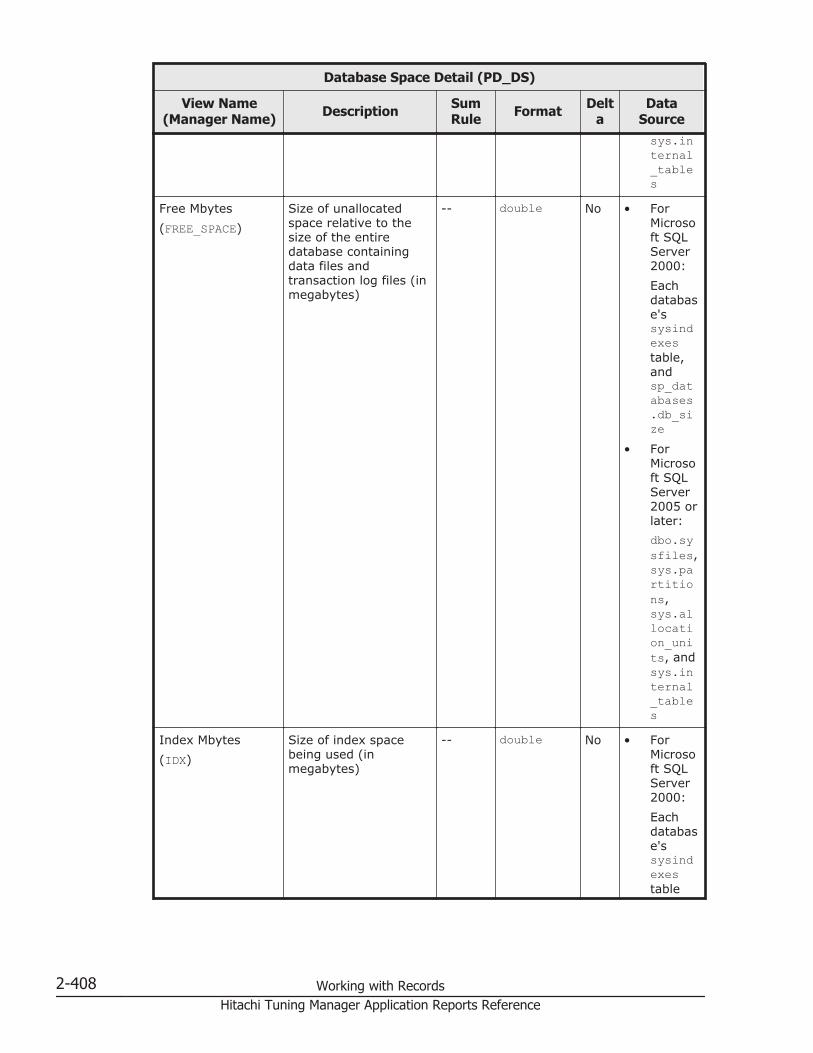
Database Space Detail (PD_DS)
View Name(Manager Name) Description Sum
Rule Format Delta
DataSourcesys.internal_tables
Free Mbytes(FREE_SPACE)
Size of unallocatedspace relative to thesize of the entiredatabase containingdata files andtransaction log files (inmegabytes)
-- double No • ForMicrosoft SQLServer2000:Eachdatabase'ssysindexestable,andsp_databases.db_size
• ForMicrosoft SQLServer2005 orlater:dbo.sysfiles,sys.partitions,sys.allocation_units, andsys.internal_tables
Index Mbytes(IDX)
Size of index spacebeing used (inmegabytes)
-- double No • ForMicrosoft SQLServer2000:Eachdatabase'ssysindexestable
2-408 Working with RecordsHitachi Tuning Manager Application Reports Reference
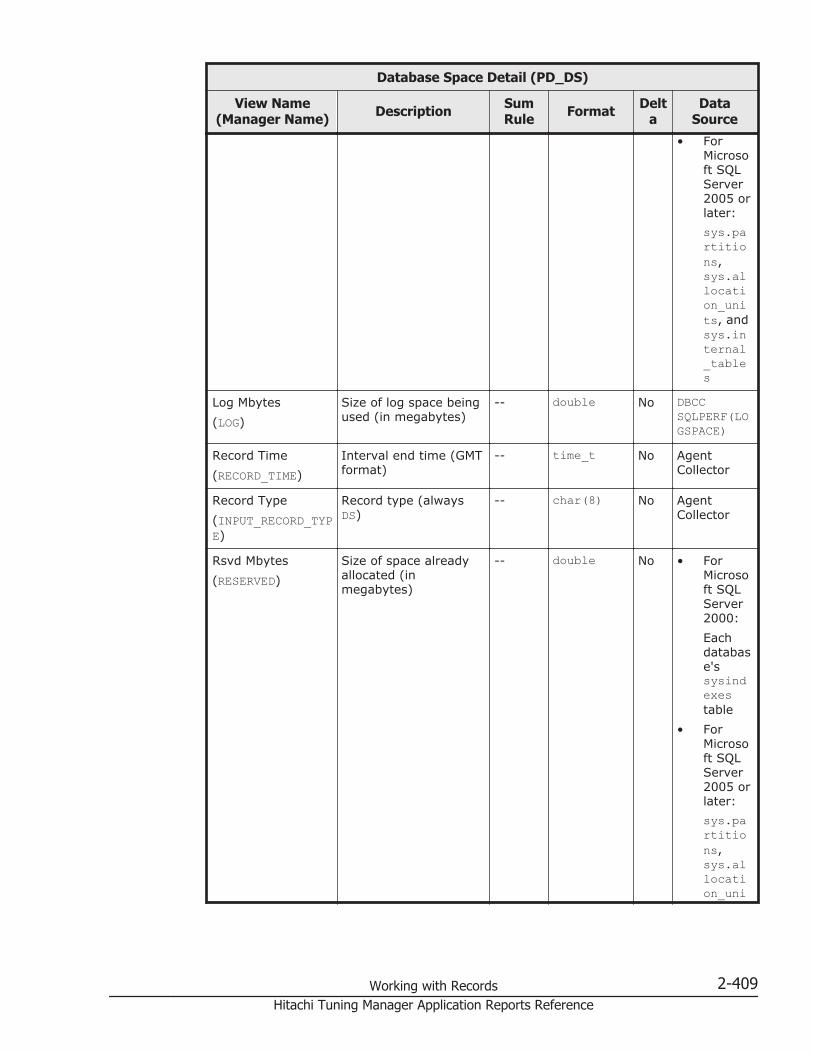
Database Space Detail (PD_DS)
View Name(Manager Name) Description Sum
Rule Format Delta
DataSource
• ForMicrosoft SQLServer2005 orlater:sys.partitions,sys.allocation_units, andsys.internal_tables
Log Mbytes(LOG)
Size of log space beingused (in megabytes)
-- double No DBCCSQLPERF(LOGSPACE)
Record Time(RECORD_TIME)
Interval end time (GMTformat)
-- time_t No AgentCollector
Record Type(INPUT_RECORD_TYPE)
Record type (alwaysDS)
-- char(8) No AgentCollector
Rsvd Mbytes(RESERVED)
Size of space alreadyallocated (inmegabytes)
-- double No • ForMicrosoft SQLServer2000:Eachdatabase'ssysindexestable
• ForMicrosoft SQLServer2005 orlater:sys.partitions,sys.allocation_uni
Working with Records 2-409Hitachi Tuning Manager Application Reports Reference

Database Space Detail (PD_DS)
View Name(Manager Name) Description Sum
Rule Format Delta
DataSource
ts, andsys.internal_tables
Start Time(START_TIME)
Interval start time(GMT format)
-- time_t No AgentCollector
Unused %(PERC_USED)
Ratio (as a percent) ofallocated but unusedspace relative toallocated space
-- double No • ForMicrosoft SQLServer2000:Eachdatabase'ssysindexestable
• ForMicrosoft SQLServer2005 orlater:sys.partitions,sys.allocation_units, andsys.internal_tables
Unused Mbytes(UNUSED)
Size of allocated butunused space (inmegabytes)
-- double No • ForMicrosoft SQLServer2000:Eachdatabase'ssysindexestable
• ForMicrosoft SQLServer
2-410 Working with RecordsHitachi Tuning Manager Application Reports Reference
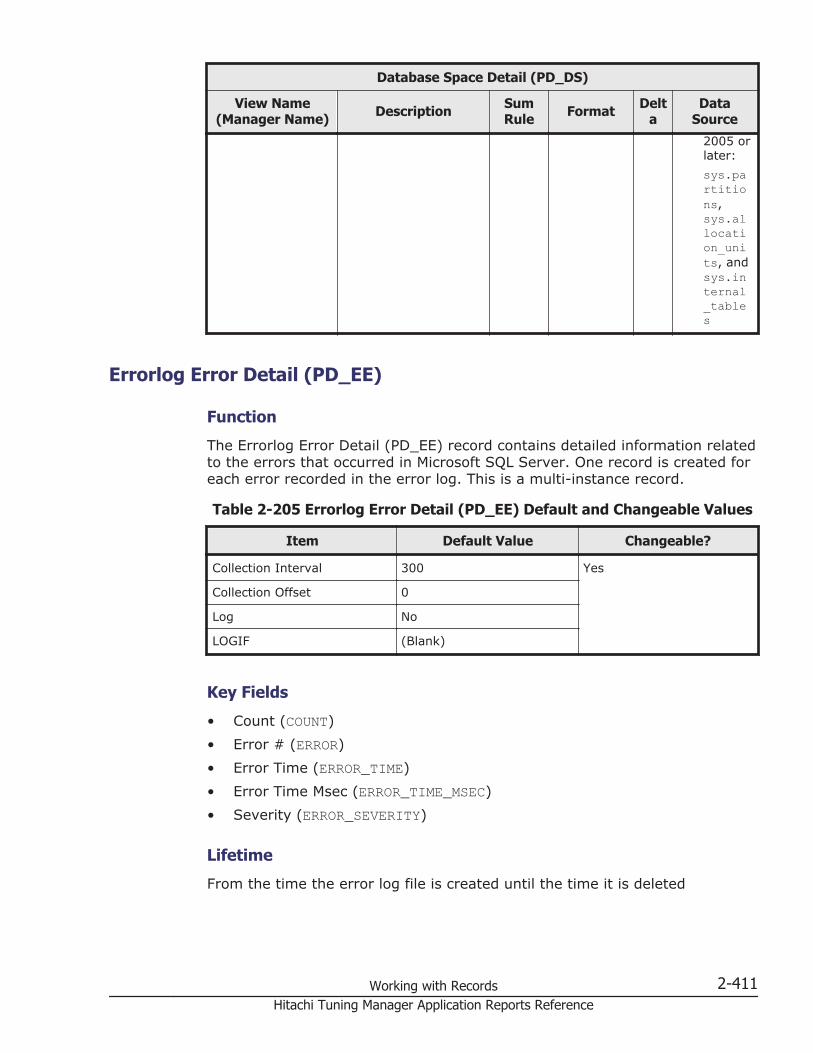
Database Space Detail (PD_DS)
View Name(Manager Name) Description Sum
Rule Format Delta
DataSource
2005 orlater:sys.partitions,sys.allocation_units, andsys.internal_tables
Errorlog Error Detail (PD_EE)
Function
The Errorlog Error Detail (PD_EE) record contains detailed information relatedto the errors that occurred in Microsoft SQL Server. One record is created foreach error recorded in the error log. This is a multi-instance record.
Table 2-205 Errorlog Error Detail (PD_EE) Default and Changeable Values
Item Default Value Changeable?
Collection Interval 300 Yes
Collection Offset 0
Log No
LOGIF (Blank)
Key Fields
• Count (COUNT)• Error # (ERROR)• Error Time (ERROR_TIME)• Error Time Msec (ERROR_TIME_MSEC)• Severity (ERROR_SEVERITY)
Lifetime
From the time the error log file is created until the time it is deleted
Working with Records 2-411Hitachi Tuning Manager Application Reports Reference
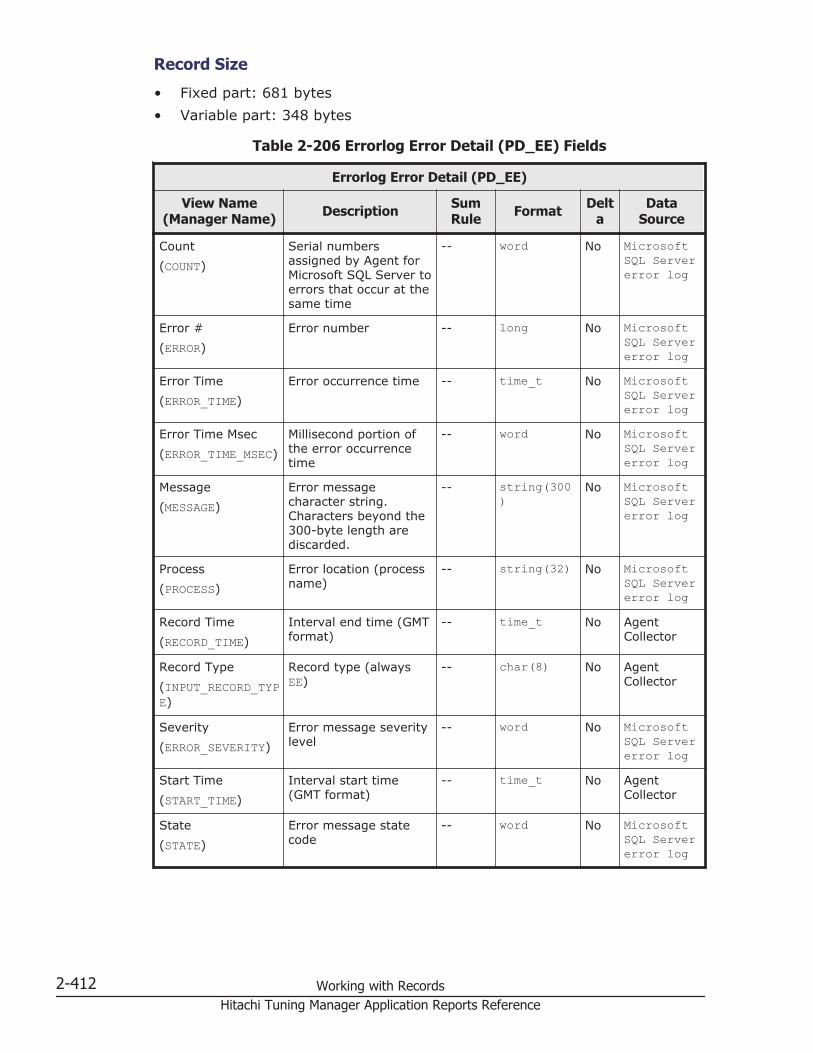
Record Size
• Fixed part: 681 bytes• Variable part: 348 bytes
Table 2-206 Errorlog Error Detail (PD_EE) Fields
Errorlog Error Detail (PD_EE)
View Name(Manager Name) Description Sum
Rule Format Delta
DataSource
Count(COUNT)
Serial numbersassigned by Agent forMicrosoft SQL Server toerrors that occur at thesame time
-- word No MicrosoftSQL Servererror log
Error #(ERROR)
Error number -- long No MicrosoftSQL Servererror log
Error Time(ERROR_TIME)
Error occurrence time -- time_t No MicrosoftSQL Servererror log
Error Time Msec(ERROR_TIME_MSEC)
Millisecond portion ofthe error occurrencetime
-- word No MicrosoftSQL Servererror log
Message(MESSAGE)
Error messagecharacter string.Characters beyond the300-byte length arediscarded.
-- string(300)
No MicrosoftSQL Servererror log
Process(PROCESS)
Error location (processname)
-- string(32) No MicrosoftSQL Servererror log
Record Time(RECORD_TIME)
Interval end time (GMTformat)
-- time_t No AgentCollector
Record Type(INPUT_RECORD_TYPE)
Record type (alwaysEE)
-- char(8) No AgentCollector
Severity(ERROR_SEVERITY)
Error message severitylevel
-- word No MicrosoftSQL Servererror log
Start Time(START_TIME)
Interval start time(GMT format)
-- time_t No AgentCollector
State(STATE)
Error message statecode
-- word No MicrosoftSQL Servererror log
2-412 Working with RecordsHitachi Tuning Manager Application Reports Reference

Errorlog Summary Detail (PD_ES)
Function
The Errorlog Summary Detail (PD_ES) record indicates a summary of theerrors that occurred in Microsoft SQL Server. Only one record is created.
Table 2-207 Errorlog Summary Detail (PD_ES) Default and ChangeableValues
Item Default Value Changeable?
Collection Interval 300 Yes
Collection Offset 0
Log No
LOGIF (Blank)
Key Fields
None
Lifetime
From the time the error log file is created until the time it is deleted
Record Size
• Fixed part: 701 bytes• Variable part: 0 bytes
Table 2-208 Errorlog Summary Detail (PD_ES) Fields
Errorlog Summary Detail (PD_ES)
View Name(Manager Name) Description Sum
Rule Format Delta
DataSource
Errorlog Errors(ERRORLOG_ERRORS)
Total number of errorsrecorded in the errorlog
-- ulong No MicrosoftSQL Servererror log
Fatal Errors(FATAL_ERRORS)
Total number of fatalerrors recorded in theerror log
-- ulong No MicrosoftSQL Servererror log
Internal Errors(INTERNAL_ERRORS)
Total number ofinternal errors recordedin the error log
-- ulong No MicrosoftSQL Servererror log
Last Error Time(LAST_ERROR)
Time at which the lasterror occurred
-- time_t No MicrosoftSQL Servererror log
Working with Records 2-413Hitachi Tuning Manager Application Reports Reference
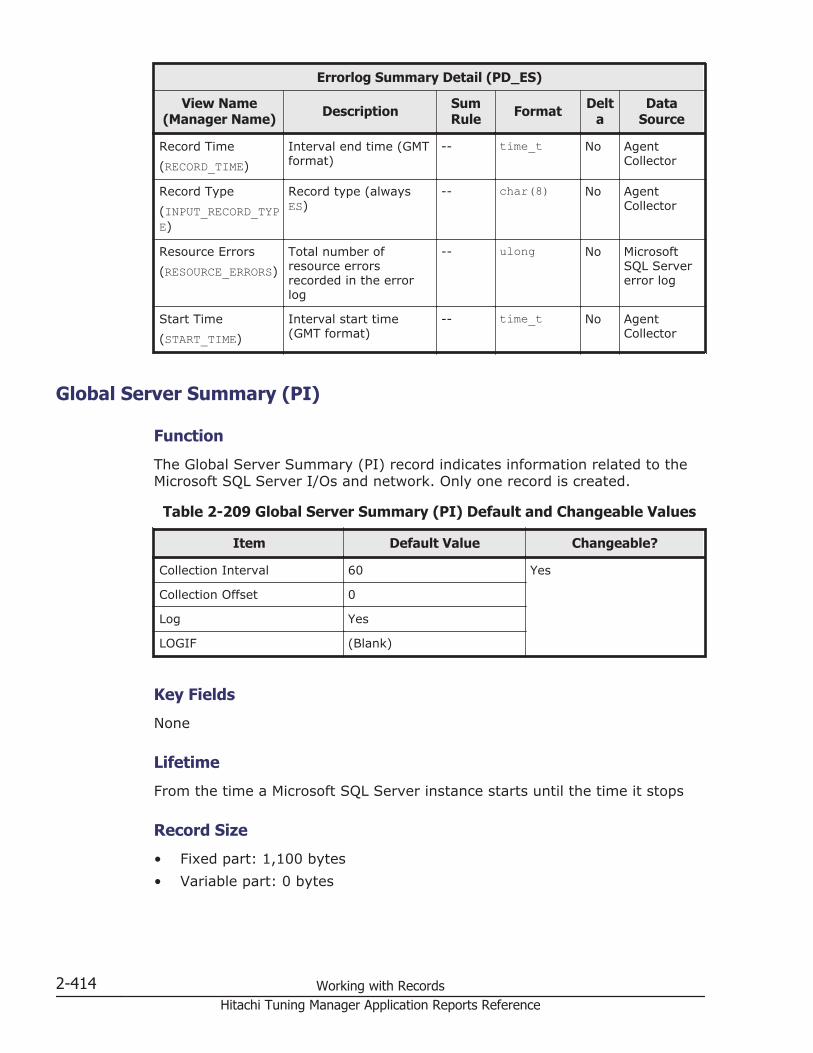
Errorlog Summary Detail (PD_ES)
View Name(Manager Name) Description Sum
Rule Format Delta
DataSource
Record Time(RECORD_TIME)
Interval end time (GMTformat)
-- time_t No AgentCollector
Record Type(INPUT_RECORD_TYPE)
Record type (alwaysES)
-- char(8) No AgentCollector
Resource Errors(RESOURCE_ERRORS)
Total number ofresource errorsrecorded in the errorlog
-- ulong No MicrosoftSQL Servererror log
Start Time(START_TIME)
Interval start time(GMT format)
-- time_t No AgentCollector
Global Server Summary (PI)
Function
The Global Server Summary (PI) record indicates information related to theMicrosoft SQL Server I/Os and network. Only one record is created.
Table 2-209 Global Server Summary (PI) Default and Changeable Values
Item Default Value Changeable?
Collection Interval 60 Yes
Collection Offset 0
Log Yes
LOGIF (Blank)
Key Fields
None
Lifetime
From the time a Microsoft SQL Server instance starts until the time it stops
Record Size
• Fixed part: 1,100 bytes• Variable part: 0 bytes
2-414 Working with RecordsHitachi Tuning Manager Application Reports Reference
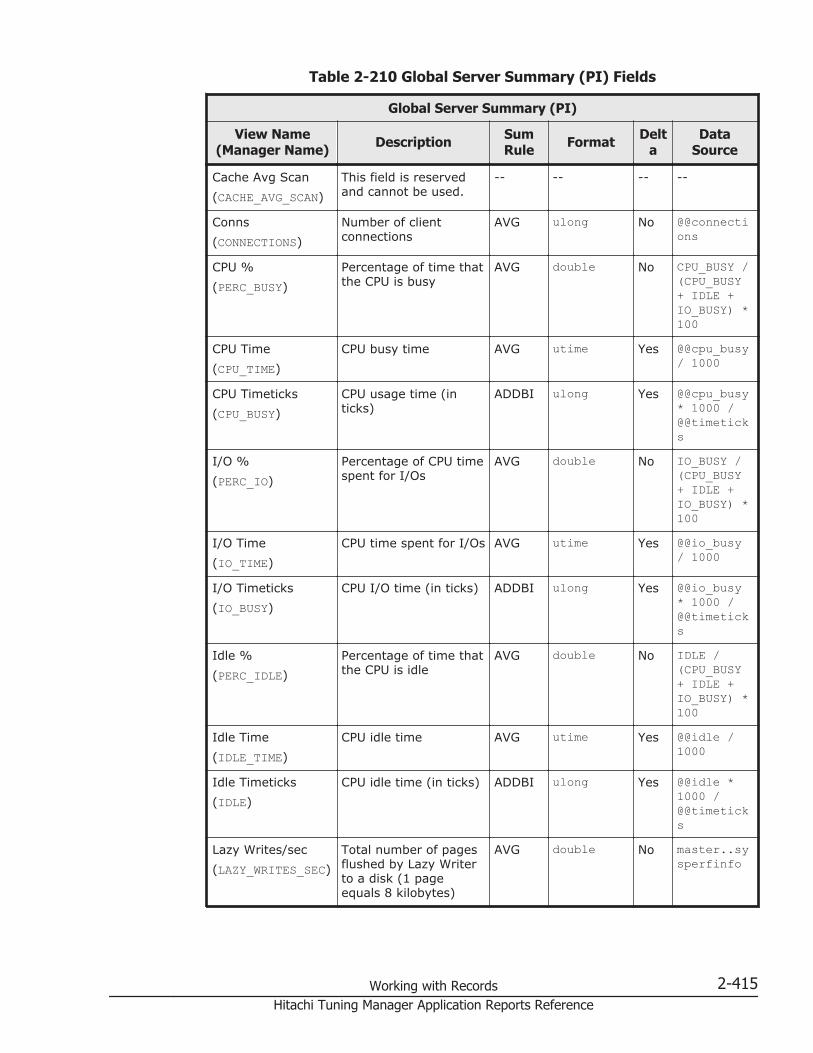
Table 2-210 Global Server Summary (PI) Fields
Global Server Summary (PI)
View Name(Manager Name) Description Sum
Rule Format Delta
DataSource
Cache Avg Scan(CACHE_AVG_SCAN)
This field is reservedand cannot be used.
-- -- -- --
Conns(CONNECTIONS)
Number of clientconnections
AVG ulong No @@connections
CPU %(PERC_BUSY)
Percentage of time thatthe CPU is busy
AVG double No CPU_BUSY /(CPU_BUSY+ IDLE +IO_BUSY) *100
CPU Time(CPU_TIME)
CPU busy time AVG utime Yes @@cpu_busy/ 1000
CPU Timeticks(CPU_BUSY)
CPU usage time (inticks)
ADDBI ulong Yes @@cpu_busy* 1000 /@@timeticks
I/O %(PERC_IO)
Percentage of CPU timespent for I/Os
AVG double No IO_BUSY /(CPU_BUSY+ IDLE +IO_BUSY) *100
I/O Time(IO_TIME)
CPU time spent for I/Os AVG utime Yes @@io_busy/ 1000
I/O Timeticks(IO_BUSY)
CPU I/O time (in ticks) ADDBI ulong Yes @@io_busy* 1000 /@@timeticks
Idle %(PERC_IDLE)
Percentage of time thatthe CPU is idle
AVG double No IDLE /(CPU_BUSY+ IDLE +IO_BUSY) *100
Idle Time(IDLE_TIME)
CPU idle time AVG utime Yes @@idle /1000
Idle Timeticks(IDLE)
CPU idle time (in ticks) ADDBI ulong Yes @@idle *1000 /@@timeticks
Lazy Writes/sec(LAZY_WRITES_SEC)
Total number of pagesflushed by Lazy Writerto a disk (1 pageequals 8 kilobytes)
AVG double No master..sysperfinfo
Working with Records 2-415Hitachi Tuning Manager Application Reports Reference
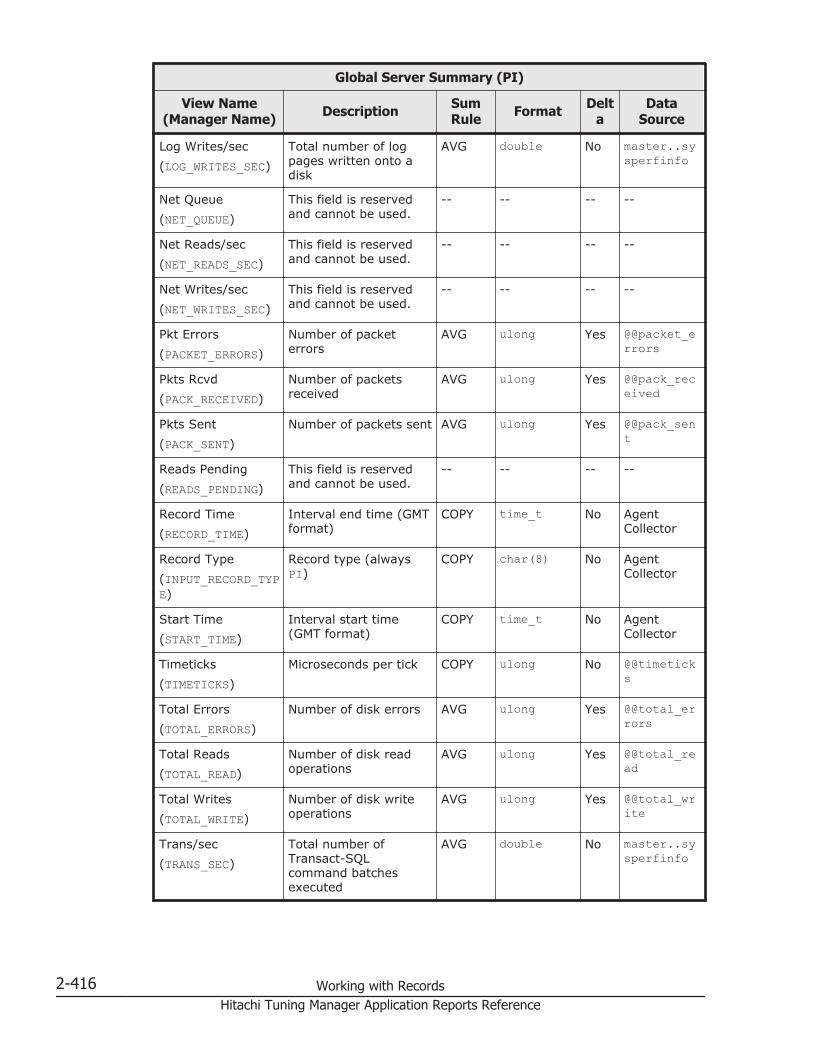
Global Server Summary (PI)
View Name(Manager Name) Description Sum
Rule Format Delta
DataSource
Log Writes/sec(LOG_WRITES_SEC)
Total number of logpages written onto adisk
AVG double No master..sysperfinfo
Net Queue(NET_QUEUE)
This field is reservedand cannot be used.
-- -- -- --
Net Reads/sec(NET_READS_SEC)
This field is reservedand cannot be used.
-- -- -- --
Net Writes/sec(NET_WRITES_SEC)
This field is reservedand cannot be used.
-- -- -- --
Pkt Errors(PACKET_ERRORS)
Number of packeterrors
AVG ulong Yes @@packet_errors
Pkts Rcvd(PACK_RECEIVED)
Number of packetsreceived
AVG ulong Yes @@pack_received
Pkts Sent(PACK_SENT)
Number of packets sent AVG ulong Yes @@pack_sent
Reads Pending(READS_PENDING)
This field is reservedand cannot be used.
-- -- -- --
Record Time(RECORD_TIME)
Interval end time (GMTformat)
COPY time_t No AgentCollector
Record Type(INPUT_RECORD_TYPE)
Record type (alwaysPI)
COPY char(8) No AgentCollector
Start Time(START_TIME)
Interval start time(GMT format)
COPY time_t No AgentCollector
Timeticks(TIMETICKS)
Microseconds per tick COPY ulong No @@timeticks
Total Errors(TOTAL_ERRORS)
Number of disk errors AVG ulong Yes @@total_errors
Total Reads(TOTAL_READ)
Number of disk readoperations
AVG ulong Yes @@total_read
Total Writes(TOTAL_WRITE)
Number of disk writeoperations
AVG ulong Yes @@total_write
Trans/sec(TRANS_SEC)
Total number ofTransact-SQLcommand batchesexecuted
AVG double No master..sysperfinfo
2-416 Working with RecordsHitachi Tuning Manager Application Reports Reference
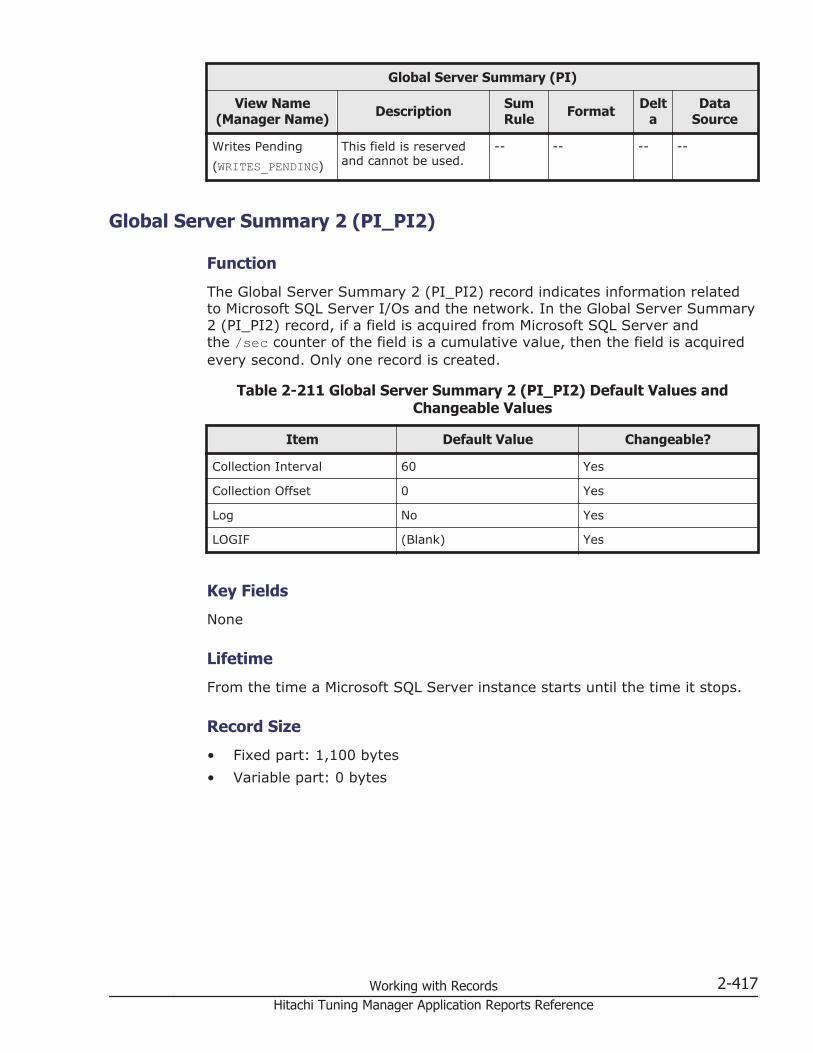
Global Server Summary (PI)
View Name(Manager Name) Description Sum
Rule Format Delta
DataSource
Writes Pending(WRITES_PENDING)
This field is reservedand cannot be used.
-- -- -- --
Global Server Summary 2 (PI_PI2)
Function
The Global Server Summary 2 (PI_PI2) record indicates information relatedto Microsoft SQL Server I/Os and the network. In the Global Server Summary2 (PI_PI2) record, if a field is acquired from Microsoft SQL Server andthe /sec counter of the field is a cumulative value, then the field is acquiredevery second. Only one record is created.
Table 2-211 Global Server Summary 2 (PI_PI2) Default Values andChangeable Values
Item Default Value Changeable?
Collection Interval 60 Yes
Collection Offset 0 Yes
Log No Yes
LOGIF (Blank) Yes
Key Fields
None
Lifetime
From the time a Microsoft SQL Server instance starts until the time it stops.
Record Size
• Fixed part: 1,100 bytes• Variable part: 0 bytes
Working with Records 2-417Hitachi Tuning Manager Application Reports Reference

Table 2-212 Global Server Summary 2 (PI_PI2) Fields
Global Server Summary 2 (PI_PI2)
View Name(Manager Name) Description Sum
Rule Format Delta
DataSource
CPU %(PERC_BUSY)
Percentage of time thatthe CPU is busy
AVG double No CPU_BUSY /(CPU_BUSY+ IDLE +IO_BUSY) *100
CPU Time(CPU_TIME)
Amount of time theCPU is busy
AVG utime Yes @@cpu_busy/ 1000
CPU Timeticks(CPU_BUSY)
CPU usage time (inticks)
ADDBI ulong Yes @@cpu_busy* 1000 /@@timeticks
Cache Avg Scan(CACHE_AVG_SCAN)
This field is reservedand cannot be used.
-- -- -- --
Conns(CONNECTIONS)
Number of clientconnections
AVG ulong No @@connections
I/O %(PERC_IO)
Percentage of timespent on CPU I/Os
AVG double No IO_BUSY /(CPU_BUSY+ IDLE +IO_BUSY) *100
I/O Time(IO_TIME)
Amount of time spenton CPU I/Os
AVG utime Yes @@io_busy/ 1000
I/O Timeticks(IO_BUSY)
CPU I/O time (in ticks) ADDBI ulong Yes @@io_busy* 1000 /@@timeticks
Idle %(PERC_IDLE)
Percentage of time thatthe CPU is idle
AVG double No IDLE /(CPU_BUSY+ IDLE +IO_BUSY) *100
Idle Time(IDLE_TIME)
Amount of time theCPU is idle
AVG utime Yes @@idle /1000
Idle Timeticks(IDLE)
CPU idle time (in ticks) ADDBI ulong Yes @@idle *1000 /@@timeticks
Lazy Writes/sec(LAZY_WRITES_SEC)
Number of pages(where a page is 8 KB)flushed per second to adisk by Lazy Writer
AVG double Yes(SeeNote)
master..sysperfinfo
2-418 Working with RecordsHitachi Tuning Manager Application Reports Reference
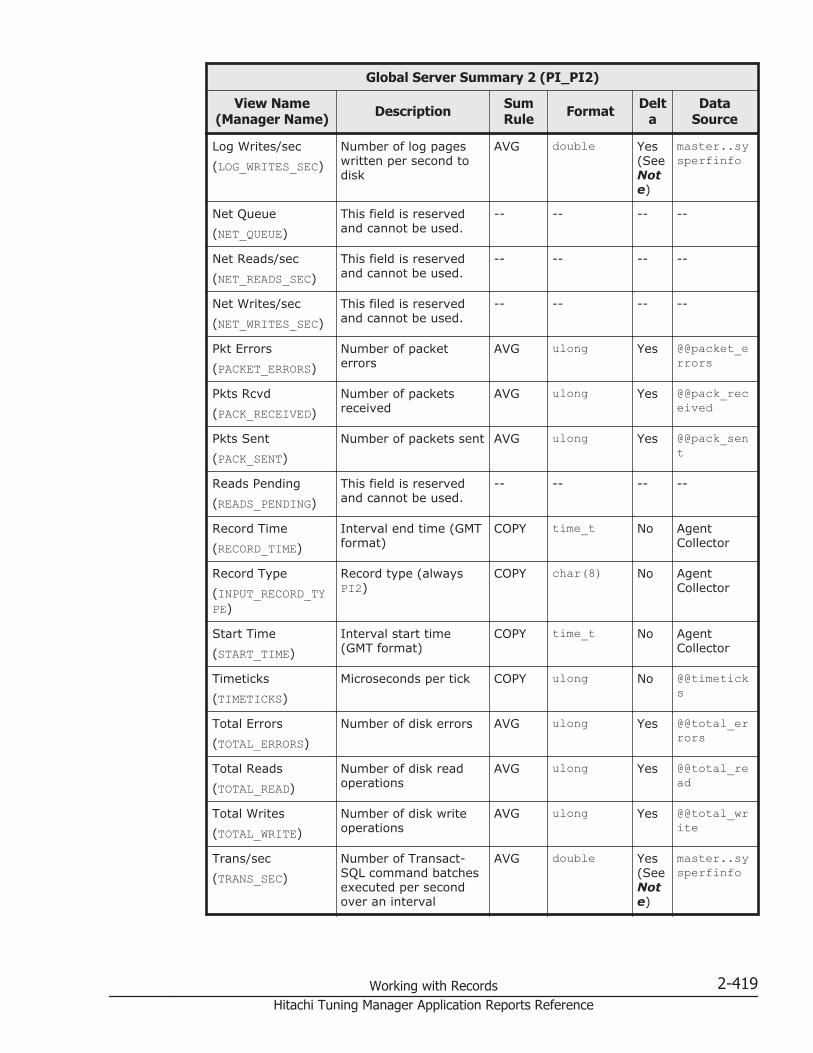
Global Server Summary 2 (PI_PI2)
View Name(Manager Name) Description Sum
Rule Format Delta
DataSource
Log Writes/sec(LOG_WRITES_SEC)
Number of log pageswritten per second todisk
AVG double Yes(SeeNote)
master..sysperfinfo
Net Queue(NET_QUEUE)
This field is reservedand cannot be used.
-- -- -- --
Net Reads/sec(NET_READS_SEC)
This field is reservedand cannot be used.
-- -- -- --
Net Writes/sec(NET_WRITES_SEC)
This filed is reservedand cannot be used.
-- -- -- --
Pkt Errors(PACKET_ERRORS)
Number of packeterrors
AVG ulong Yes @@packet_errors
Pkts Rcvd(PACK_RECEIVED)
Number of packetsreceived
AVG ulong Yes @@pack_received
Pkts Sent(PACK_SENT)
Number of packets sent AVG ulong Yes @@pack_sent
Reads Pending(READS_PENDING)
This field is reservedand cannot be used.
-- -- -- --
Record Time(RECORD_TIME)
Interval end time (GMTformat)
COPY time_t No AgentCollector
Record Type(INPUT_RECORD_TYPE)
Record type (alwaysPI2)
COPY char(8) No AgentCollector
Start Time(START_TIME)
Interval start time(GMT format)
COPY time_t No AgentCollector
Timeticks(TIMETICKS)
Microseconds per tick COPY ulong No @@timeticks
Total Errors(TOTAL_ERRORS)
Number of disk errors AVG ulong Yes @@total_errors
Total Reads(TOTAL_READ)
Number of disk readoperations
AVG ulong Yes @@total_read
Total Writes(TOTAL_WRITE)
Number of disk writeoperations
AVG ulong Yes @@total_write
Trans/sec(TRANS_SEC)
Number of Transact-SQL command batchesexecuted per secondover an interval
AVG double Yes(SeeNote)
master..sysperfinfo
Working with Records 2-419Hitachi Tuning Manager Application Reports Reference
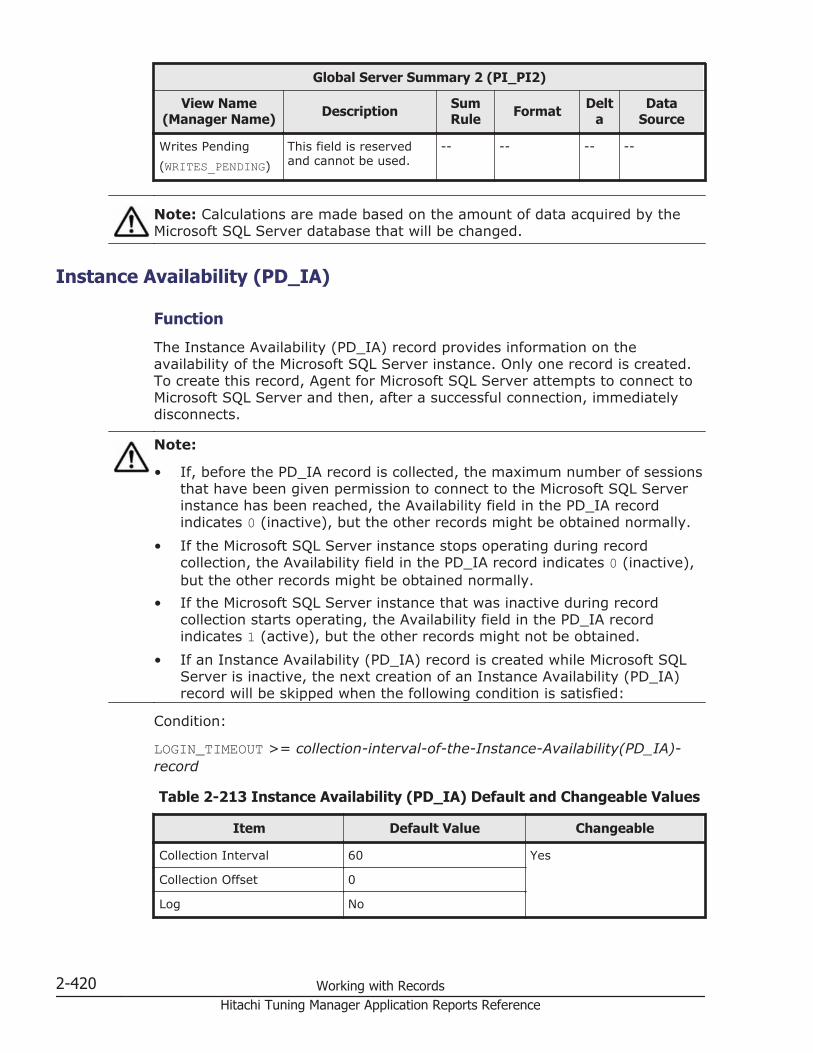
Global Server Summary 2 (PI_PI2)
View Name(Manager Name) Description Sum
Rule Format Delta
DataSource
Writes Pending(WRITES_PENDING)
This field is reservedand cannot be used.
-- -- -- --
Note: Calculations are made based on the amount of data acquired by theMicrosoft SQL Server database that will be changed.
Instance Availability (PD_IA)
Function
The Instance Availability (PD_IA) record provides information on theavailability of the Microsoft SQL Server instance. Only one record is created.To create this record, Agent for Microsoft SQL Server attempts to connect toMicrosoft SQL Server and then, after a successful connection, immediatelydisconnects.
Note:
• If, before the PD_IA record is collected, the maximum number of sessionsthat have been given permission to connect to the Microsoft SQL Serverinstance has been reached, the Availability field in the PD_IA recordindicates 0 (inactive), but the other records might be obtained normally.
• If the Microsoft SQL Server instance stops operating during recordcollection, the Availability field in the PD_IA record indicates 0 (inactive),but the other records might be obtained normally.
• If the Microsoft SQL Server instance that was inactive during recordcollection starts operating, the Availability field in the PD_IA recordindicates 1 (active), but the other records might not be obtained.
• If an Instance Availability (PD_IA) record is created while Microsoft SQLServer is inactive, the next creation of an Instance Availability (PD_IA)record will be skipped when the following condition is satisfied:
Condition:
LOGIN_TIMEOUT >= collection-interval-of-the-Instance-Availability(PD_IA)-record
Table 2-213 Instance Availability (PD_IA) Default and Changeable Values
Item Default Value Changeable
Collection Interval 60 Yes
Collection Offset 0
Log No
2-420 Working with RecordsHitachi Tuning Manager Application Reports Reference

Item Default Value Changeable
LOGIF (Blank)
Key Fields
None
Lifetime
None
Record Size
• Fixed part: 987 bytes• Variable part: 0 byte
Table 2-214 Instance Availability (PD_IA) Fields
Instance Availability (PD_IA) Fields
View Name(Manager Name) Description Sum
Rule Format Delta
DataSource
Availability(AVAILABILITY)
Availability status; thisvalue can be either 0(inactive) or 1 (active)
-- word No AgentCollector
Collect Time(COLLECT_TIME)
Time spent connectingto and disconnectingfrom Microsoft SQLServer (milliseconds)
-- ulong No AgentCollector
Message(MESSAGE)
Character string of theerror message when anattempt to connect toMicrosoft SQL Serverfails.This is blank when theconnection issuccessful.
-- string(300)
No AgentCollector
Record Time(RECORD_TIME)
Interval end time (GMTformat)
-- time_t No AgentCollector
Record Type(INPUT_RECORD_TYPE)
Record type (alwaysIA)
-- char(8) No AgentCollector
Start Time(START_TIME)
Interval start time(GMT format)
-- time_t No AgentCollector
Working with Records 2-421Hitachi Tuning Manager Application Reports Reference

Job History Detail (PD_JH)
Function
The Job History Detail (PD_JH) record indicates job history informationincorporated into the Microsoft SQL Server schedule. One record is createdfor each case of job step history. This is a multi-instance record.
Table 2-215 Job History Detail (PD_JH) Default and Changeable Values
Item Default Value Changeable?
Collection Interval 300 Yes
Collection Offset 0
Log No
LOGIF (Blank)
Key Fields
• Completion Time (COMPLETION_TIME)• Instance ID (INSTANCE_ID)• Step ID (STEP_ID)
Lifetime
From the time a job incorporated into the Microsoft SQL Server schedule iscreated until the time it is deleted
Record Size
• Fixed part: 681 bytes• Variable part: 8,374 bytes
Table 2-216 Job History Detail (PD_JH) Fields
Job History Detail (PD_JH) Fields
View Name(Manager Name) Description Sum
Rule Format Delta
DataSource
Command(COMMAND)
Command executed bya subcommand
-- string(8001)
No msdb..sysjobsteps.command
Completion Time(COMPLETION_TIME)
Job or step completiontime
-- time_t No msdb..sysjobhistory.(run_date+run_time+run_duration)
2-422 Working with RecordsHitachi Tuning Manager Application Reports Reference

Job History Detail (PD_JH) Fields
View Name(Manager Name) Description Sum
Rule Format Delta
DataSource
Instance ID(INSTANCE_ID)
Job history ID -- long No msdb..sysjobhistory.instance_id
Record Time(RECORD_TIME)
Interval end time (GMTformat)
-- time_t No AgentCollector
Record Type(INPUT_RECORD_TYPE)
Record type (alwaysJH)
-- char(8) No AgentCollector
Retries(RETRIES)
Job or step retry count -- long No msdb..sysjobhistory.retries_attempted
Run Duration(RUN_DURATION)
Time required for jobor step completion (inHHMMSS format)
-- long No msdb..sysjobhistory.run_duration
Run Status(RUN_STATUS)
Execution status. Thefollowing values arevalid: Failure,Success, Retry,Cancelled, or Inprogress.
-- string(15) No msdb..sysjobhistory.run_status
Start Time(START_TIME)
Interval start time(GMT format)
-- time_t No AgentCollector
Subsystem(SUBSYSTEM)
Subsystem used forexecuting the step.Values such asLogReader and Syncare valid.
-- string(81) No msdb..sysjobsteps.subsystem
Step ID(STEP_ID)
Step ID -- long No msdb..sysjobsteps.step_id
Step Name(STEP_NAME)
Step name -- string(257)
No msdb..sysjobsteps.step_name
Licensing Detail (PD_LIC)
Function
The Licensing Detail (PD_LIC) record indicates licensing information, such asthe maximum number of Microsoft SQL Server connections allowed. Only onerecord is created.
Working with Records 2-423Hitachi Tuning Manager Application Reports Reference

Table 2-217 Licensing Detail (PD_LIC) Default and Changeable Values
Item Default Value Changeable?
Collection Interval 60 Yes
Collection Offset 0
Log No
LOGIF (Blank)
Key Fields
None
Lifetime
From the time a Microsoft SQL Server instance is created until the time it isdeleted
Record Size
• Fixed part: 689 bytes• Variable part: 0 bytes
Table 2-218 Licensing Detail (PD_LIC) Fields
Licensing Detail (PD_LIC)
View Name(Manager Name) Description Sum
Rule Format Delta
DataSource
Record Time(RECORD_TIME)
Interval end time (GMTformat)
-- time_t No AgentCollector
Record Type(INPUT_RECORD_TYPE)
Record type (alwaysLIC)
-- char(8) No AgentCollector
Session Count(CLIENT_COUNT)
Number of sessionsconnected to theMicrosoft SQL Serverduring data collection
-- ulong No master..sysperfinfo
Session Limit(CLIENT_LIMIT)
Maximum number ofsessions allowed toconnect to theMicrosoft SQL Server
-- ulong No @@max_connections
Start Time(START_TIME)
Interval start time(GMT format)
-- time_t No AgentCollector
2-424 Working with RecordsHitachi Tuning Manager Application Reports Reference
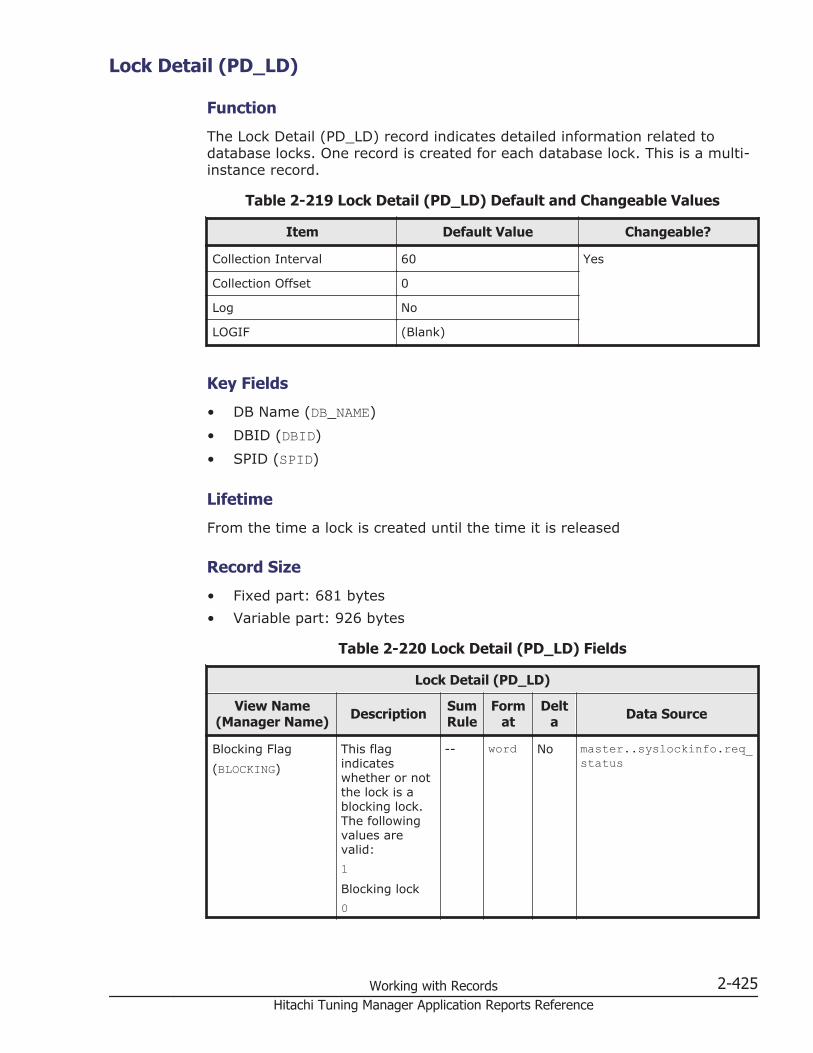
Lock Detail (PD_LD)
Function
The Lock Detail (PD_LD) record indicates detailed information related todatabase locks. One record is created for each database lock. This is a multi-instance record.
Table 2-219 Lock Detail (PD_LD) Default and Changeable Values
Item Default Value Changeable?
Collection Interval 60 Yes
Collection Offset 0
Log No
LOGIF (Blank)
Key Fields
• DB Name (DB_NAME)• DBID (DBID)• SPID (SPID)
Lifetime
From the time a lock is created until the time it is released
Record Size
• Fixed part: 681 bytes• Variable part: 926 bytes
Table 2-220 Lock Detail (PD_LD) Fields
Lock Detail (PD_LD)
View Name(Manager Name) Description Sum
RuleForm
atDelt
a Data Source
Blocking Flag(BLOCKING)
This flagindicateswhether or notthe lock is ablocking lock.The followingvalues arevalid:1Blocking lock0
-- word No master..syslockinfo.req_status
Working with Records 2-425Hitachi Tuning Manager Application Reports Reference

Lock Detail (PD_LD)
View Name(Manager Name) Description Sum
RuleForm
atDelt
a Data Source
Not a blockinglock
DB Name(DB_NAME)
Database namerelated to lockresource
-- string(257)
No master..syslockinfo.db_name(rsc_dbid)
DBID(DBID)
Database IDrelated to lockresource
-- word No master..syslockinfo.rsc_dbid
Demand Flag(DEMAND)
This flagindicateswhether or notthe lock is arequest lock.The followingvalues arevalid:1Request lock0Not a requestlock
-- word No master..syslockinfo.rsc_type,master..syslockinfo.
Lock Type(TYPE)
Lock type (lockrequest modeand lockresource type)
-- string(80)
No master..syslockinfo.req_mode
Orphan Flag(ORPHAN)
This flagindicateswhether or notthe lock is anisolated lock.The followingvalues arevalid:1Isolated lock0Not an isolatedlock
-- word No master..sysprocesses
Page #(PAGE)
Number ofpages allocatedto the lockresource
-- ulong No master..syslockinfo.rsc_text
Program(PROGRAM)
Name of theapplicationprogram that isrequesting thelock
-- string(257)
No master..sysprocesses.program_name
2-426 Working with RecordsHitachi Tuning Manager Application Reports Reference
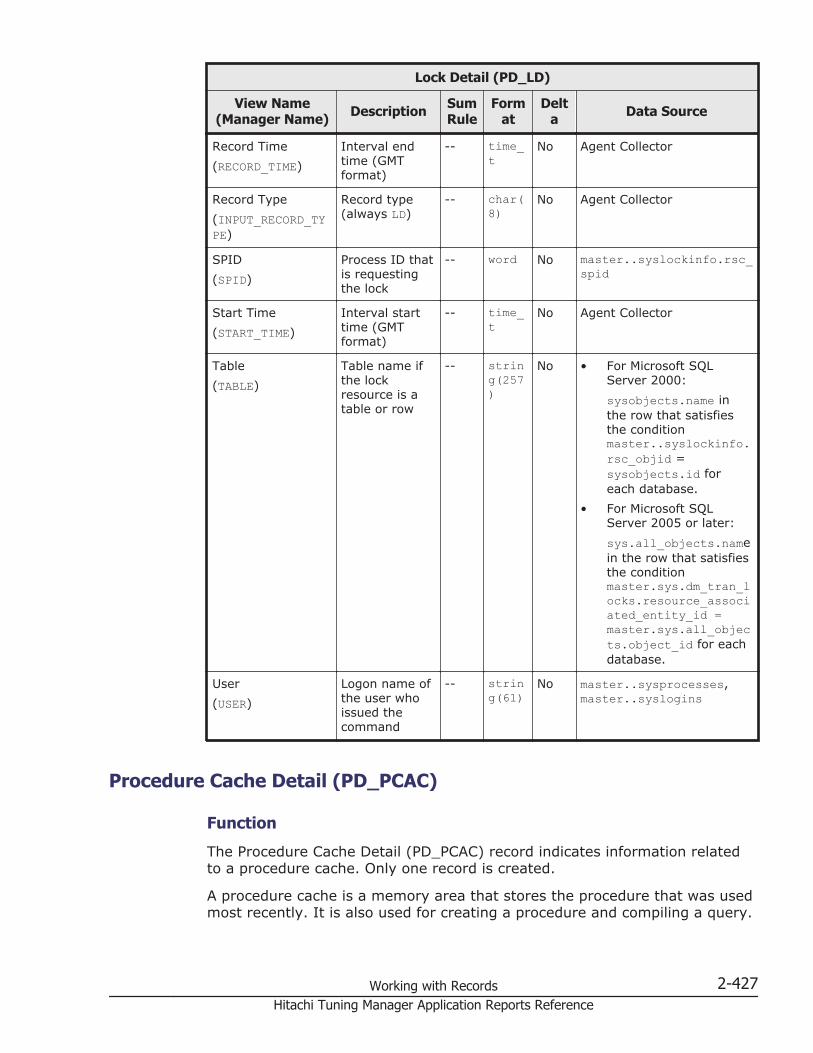
Lock Detail (PD_LD)
View Name(Manager Name) Description Sum
RuleForm
atDelt
a Data Source
Record Time(RECORD_TIME)
Interval endtime (GMTformat)
-- time_t
No Agent Collector
Record Type(INPUT_RECORD_TYPE)
Record type(always LD)
-- char(8)
No Agent Collector
SPID(SPID)
Process ID thatis requestingthe lock
-- word No master..syslockinfo.rsc_spid
Start Time(START_TIME)
Interval starttime (GMTformat)
-- time_t
No Agent Collector
Table(TABLE)
Table name ifthe lockresource is atable or row
-- string(257)
No • For Microsoft SQLServer 2000:sysobjects.name inthe row that satisfiesthe conditionmaster..syslockinfo.rsc_objid =sysobjects.id foreach database.
• For Microsoft SQLServer 2005 or later:sys.all_objects.namein the row that satisfiesthe conditionmaster.sys.dm_tran_locks.resource_associated_entity_id =master.sys.all_objects.object_id for eachdatabase.
User(USER)
Logon name ofthe user whoissued thecommand
-- string(61)
No master..sysprocesses,master..syslogins
Procedure Cache Detail (PD_PCAC)
Function
The Procedure Cache Detail (PD_PCAC) record indicates information relatedto a procedure cache. Only one record is created.
A procedure cache is a memory area that stores the procedure that was usedmost recently. It is also used for creating a procedure and compiling a query.
Working with Records 2-427Hitachi Tuning Manager Application Reports Reference

Table 2-221 Procedure Cache Detail (PD_PCAC) Default and ChangeableValues
Item Default Value Changeable?
Collection Interval 60 Yes
Collection Offset 0
Log No
LOGIF (Blank)
Key Fields
None
Lifetime
From the time a Microsoft SQL Server instance starts until the time it stops
Record Size
• Fixed part: 761 bytes• Variable part: 0 bytes
Table 2-222 Procedure Cache Detail (PD_PCAC) Fields
Procedure Cache Detail (PD_PCAC)
View Name(Manager Name) Description Sum
Rule Format Delta
DataSource
Max Proc BuffersActive %(MAX_PROCEDURE_BUFFERS_ACTIVE_PCT)
Maximum percentageof procedure cacheslots that were used bythe stored proceduresbeing executed duringthe monitoring period
-- double No DBCCPROCCACHE
Max Proc BuffersUsed %(MAX_PROCEDURE_BUFFERS_USED_PCT)
Maximum percentageof procedure cacheslots that were usedduring the monitoringperiod
-- double No DBCCPROCCACHE
Max Proc CacheActive %(MAX_PROCEDURE_CACHE_ACTIVE_PCT)
Maximum percentageof procedure cache sizethat was used by thestored proceduresbeing executed duringthe monitoring period
-- double No DBCCPROCCACHE
Max Proc CacheUsed %
Maximum percentageof procedure cache sizethat was used duringthe monitoring period
-- double No DBCCPROCCACHE
2-428 Working with RecordsHitachi Tuning Manager Application Reports Reference

Procedure Cache Detail (PD_PCAC)
View Name(Manager Name) Description Sum
Rule Format Delta
DataSource
(MAX_PROCEDURE_CACHE_USED_PCT)
Proc Buffers Active%(PROCEDURE_BUFFERS_ACTIVE_PCT)
Percentage ofprocedure cache slotsthat were used by thestored proceduresbeing executed duringthe monitoring period
-- double No DBCCPROCCACHE
Proc Buffers Used%(PROCEDURE_BUFFERS_USED_PCT)
Percentage ofprocedure cache slotsthat were used duringthe monitoring period
-- double No DBCCPROCCACHE
Proc Cache Active%(PROCEDURE_CACHE_ACTIVE_PCT)
Percentage ofprocedure cache sizethat was used by thestored proceduresbeing executed duringthe monitoring period
-- double No DBCCPROCCACHE
Proc Cache Size(PROCEDURE_CACHE_SIZE)
Total procedure cachesize (in pages; 1 pageequals 8 kilobytes)
-- double No DBCCPROCCACHE
Proc Cache Used %(PROCEDURE_CACHE_USED_PCT)
Percentage ofprocedure cache sizethat was used duringthe monitoring period
-- double No DBCCPROCCACHE
Record Time(RECORD_TIME)
Interval end time (GMTformat)
-- time_t No AgentCollector
Record Type(INPUT_RECORD_TYPE)
Record type (alwaysPCAC)
-- char(8) No AgentCollector
Start Time(START_TIME)
Interval start time(GMT format)
-- time_t No AgentCollector
Total Proc Buffers(TOTAL_PROCEDURE_BUFFERS)
Number of procedurecache slots inside theprocedure cache (afixed value based onthe rate of procedurecache alreadyallocated)
-- double No DBCCPROCCACHE
Working with Records 2-429Hitachi Tuning Manager Application Reports Reference
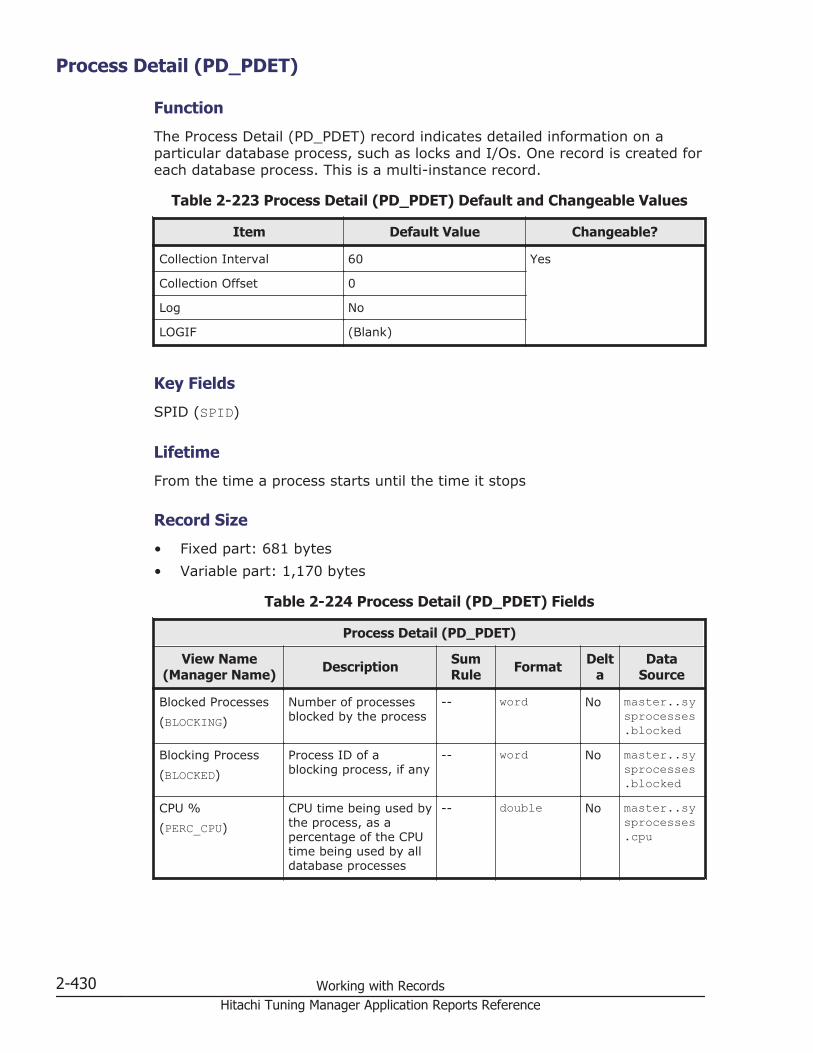
Process Detail (PD_PDET)
Function
The Process Detail (PD_PDET) record indicates detailed information on aparticular database process, such as locks and I/Os. One record is created foreach database process. This is a multi-instance record.
Table 2-223 Process Detail (PD_PDET) Default and Changeable Values
Item Default Value Changeable?
Collection Interval 60 Yes
Collection Offset 0
Log No
LOGIF (Blank)
Key Fields
SPID (SPID)
Lifetime
From the time a process starts until the time it stops
Record Size
• Fixed part: 681 bytes• Variable part: 1,170 bytes
Table 2-224 Process Detail (PD_PDET) Fields
Process Detail (PD_PDET)
View Name(Manager Name) Description Sum
Rule Format Delta
DataSource
Blocked Processes(BLOCKING)
Number of processesblocked by the process
-- word No master..sysprocesses.blocked
Blocking Process(BLOCKED)
Process ID of ablocking process, if any
-- word No master..sysprocesses.blocked
CPU %(PERC_CPU)
CPU time being used bythe process, as apercentage of the CPUtime being used by alldatabase processes
-- double No master..sysprocesses.cpu
2-430 Working with RecordsHitachi Tuning Manager Application Reports Reference

Process Detail (PD_PDET)
View Name(Manager Name) Description Sum
Rule Format Delta
DataSource
CPU Timeticks(CPU)
Total CPU time of theprocess (in ticks)
-- ulong No master..sysprocesses.cpu
Command(COMMAND)
Name of the commandexecuted
-- string(33) No master..sysprocesses.cmd
DB Name(DB_NAME)
Name of the databasebeing used by theprocess at the time ofrecord acquisition
-- string(257)
No db_name(master..sysprocesses.dbid)
DBID(DBID)
Database ID beingused by the process atthe time of recordacquisition
-- word No master..sysprocesses.dbid
GID(GID)
This field is reservedand cannot be used.
-- -- -- --
Host(HOST)
Name of the hostcomputer
-- string(257)
No master..sysprocesses.hostname
Host PID(HOST_PID)
ID of the host process -- long No master..sysprocesses.hostprocess
Locks(LOCKS)
Number of locks beingrequested by theprocess at the time ofrecord acquisition
-- long No master..syslockinfo.req_spid
Mem Usage(MEMUSAGE)
Number of procedurecache pages allocatedto the process (1 pageequals 8 kilobytes)
-- double No master..sysprocesses.memusage
Physical I/O(PHYSICAL_IO)
Total number of timesthe process executedread/write operationsto disks
-- double No master..sysprocesses.physical_io
Program(PROGRAM)
Application programname
-- string(257)
No master..sysprocesses.program_name
Record Time(RECORD_TIME)
Interval end time (GMTformat)
-- time_t No AgentCollector
Record Type(INPUT_RECORD_TYPE)
Record type (alwaysPDET)
-- char(8) No AgentCollector
Working with Records 2-431Hitachi Tuning Manager Application Reports Reference
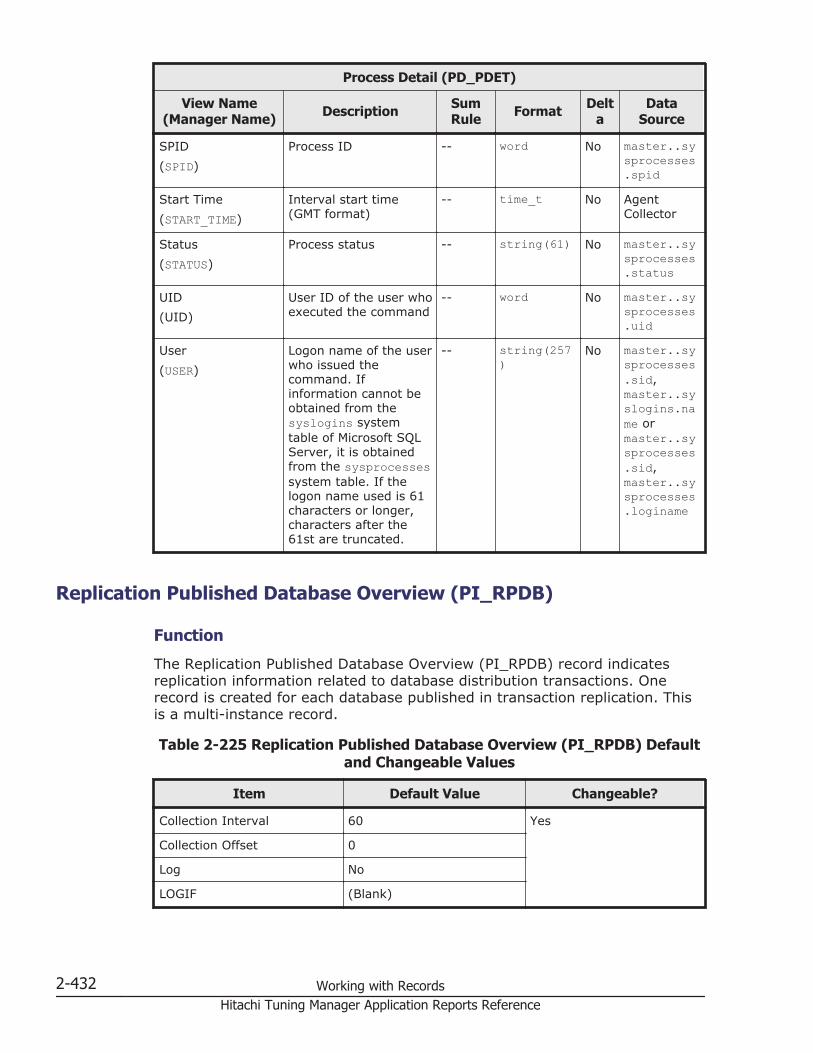
Process Detail (PD_PDET)
View Name(Manager Name) Description Sum
Rule Format Delta
DataSource
SPID(SPID)
Process ID -- word No master..sysprocesses.spid
Start Time(START_TIME)
Interval start time(GMT format)
-- time_t No AgentCollector
Status(STATUS)
Process status -- string(61) No master..sysprocesses.status
UID(UID)
User ID of the user whoexecuted the command
-- word No master..sysprocesses.uid
User(USER)
Logon name of the userwho issued thecommand. Ifinformation cannot beobtained from thesyslogins systemtable of Microsoft SQLServer, it is obtainedfrom the sysprocessessystem table. If thelogon name used is 61characters or longer,characters after the61st are truncated.
-- string(257)
No master..sysprocesses.sid,master..syslogins.name ormaster..sysprocesses.sid,master..sysprocesses.loginame
Replication Published Database Overview (PI_RPDB)
Function
The Replication Published Database Overview (PI_RPDB) record indicatesreplication information related to database distribution transactions. Onerecord is created for each database published in transaction replication. Thisis a multi-instance record.
Table 2-225 Replication Published Database Overview (PI_RPDB) Defaultand Changeable Values
Item Default Value Changeable?
Collection Interval 60 Yes
Collection Offset 0
Log No
LOGIF (Blank)
2-432 Working with RecordsHitachi Tuning Manager Application Reports Reference

Key Fields
DB Name (DB_NAME)
Lifetime
From the time a publisher database is created until the time it is deleted
Record Size
• Fixed part: 681 bytes• Variable part: 313 bytes
Table 2-226 Replication Published Database Overview (PI_RPDB) Fields
Replication Published Database Overview (PI_RPDB)
View Name(Manager Name) Description Sum
Rule Format Delta
DataSource
DB Name(DB_NAME)
Database name COPY string(257)
No sp_replcounters.Database
Record Time(RECORD_TIME)
Interval end time (GMTformat)
COPY time_t No AgentCollector
Record Type(INPUT_RECORD_TYPE)
Record type (alwaysRPDB)
COPY char(8) No AgentCollector
Replicated Trans(REPLICATED_TRANSACTIONS)
Number of transactionsinside the log that arewaiting to bedistributed to thedistribution database
AVG ulong No sp_replcounters.replicatedtransactions
ReplicatedTrans/sec(REPLICATED_TRANSACTIONS_PER_SEC)
Number of transactionsper second distributedto the distributiondatabase
AVG double No sp_replcounters.replicationratetrans/sec
Replication Latency(REPLICATION_LATENCY)
The average latency (inseconds) from when atransaction isregistered into a log towhen the transaction isdistributed
AVG double No sp_replcounters.replicationlatency(sec)
Start Time(START_TIME)
Interval start time(GMT format)
COPY time_t No AgentCollector
Working with Records 2-433Hitachi Tuning Manager Application Reports Reference

Replication Summary Detail (PD_RS)
Function
The Replication Summary Detail (PD_RS) record indicates a summary ofdatabase replication generated by Microsoft SQL Server. Only one record iscreated.
As indicated in the following table, the fields that can be acquired for thisrecord differ depending on the database type.
Table 2-227 Replication Summary Detail (PD_RS) Fields that Can BeAcquired
Database Type
Field Publisher Distributor Subscriberand Others
Articles Yes No No
Delivered Jobs No Yes No
Delivery Latency No Yes No
Delivery Rate No Yes No
Publications Yes No No
Subscriptions Yes No No
None of the above Yes Yes Yes
When a field cannot be acquired, the value is 0.
Table 2-228 Replication Summary Detail (PD_RS) Default and ChangeableValues
Item Default Value Changeable?
Collection Interval 60 Yes
Collection Offset 0
Log No
LOGIF (Blank)
Key Fields
None
Lifetime
From the time a Microsoft SQL Server instance is created until the time it isdeleted
2-434 Working with RecordsHitachi Tuning Manager Application Reports Reference
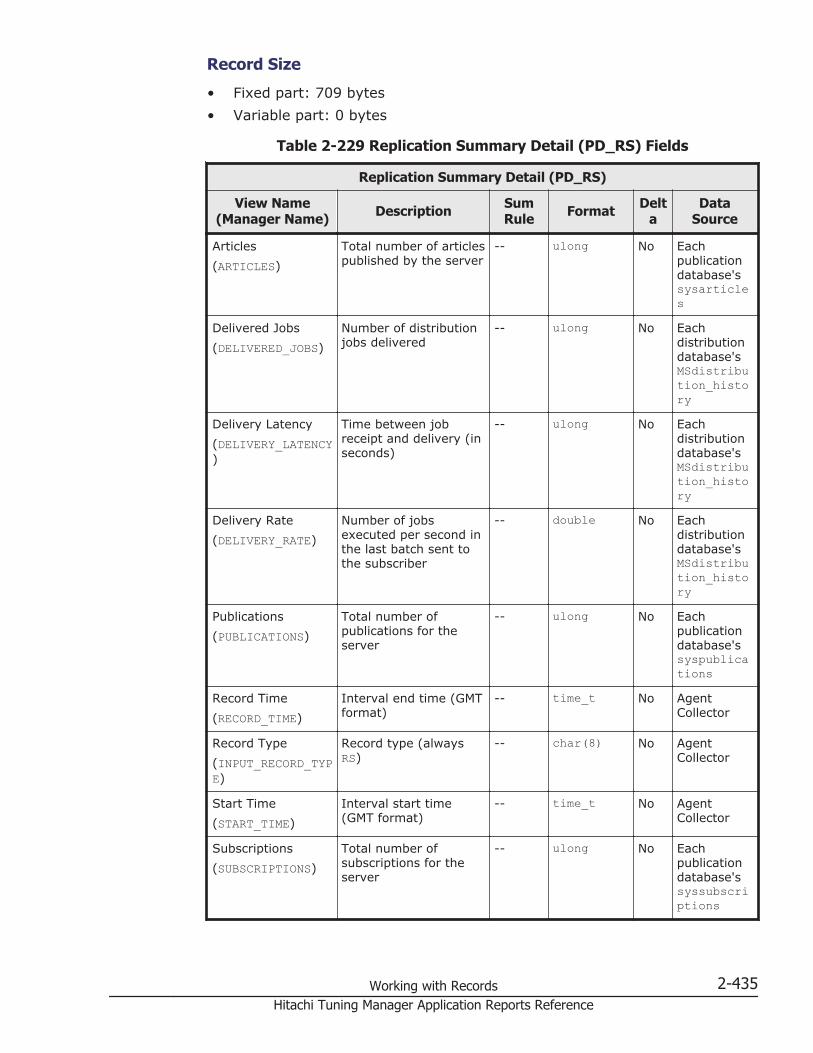
Record Size
• Fixed part: 709 bytes• Variable part: 0 bytes
Table 2-229 Replication Summary Detail (PD_RS) Fields
Replication Summary Detail (PD_RS)
View Name(Manager Name) Description Sum
Rule Format Delta
DataSource
Articles(ARTICLES)
Total number of articlespublished by the server
-- ulong No Eachpublicationdatabase'ssysarticles
Delivered Jobs(DELIVERED_JOBS)
Number of distributionjobs delivered
-- ulong No Eachdistributiondatabase'sMSdistribution_history
Delivery Latency(DELIVERY_LATENCY)
Time between jobreceipt and delivery (inseconds)
-- ulong No Eachdistributiondatabase'sMSdistribution_history
Delivery Rate(DELIVERY_RATE)
Number of jobsexecuted per second inthe last batch sent tothe subscriber
-- double No Eachdistributiondatabase'sMSdistribution_history
Publications(PUBLICATIONS)
Total number ofpublications for theserver
-- ulong No Eachpublicationdatabase'ssyspublications
Record Time(RECORD_TIME)
Interval end time (GMTformat)
-- time_t No AgentCollector
Record Type(INPUT_RECORD_TYPE)
Record type (alwaysRS)
-- char(8) No AgentCollector
Start Time(START_TIME)
Interval start time(GMT format)
-- time_t No AgentCollector
Subscriptions(SUBSCRIPTIONS)
Total number ofsubscriptions for theserver
-- ulong No Eachpublicationdatabase'ssyssubscriptions
Working with Records 2-435Hitachi Tuning Manager Application Reports Reference

Server Detail (PD)
Function
The Server Detail (PD) record indicates detailed information on Microsoft SQLServer, such as I/Os and locks. Only one record is created.
Table 2-230 Server Detail (PD) Default and Changeable Values
Item Default Value Changeable?
Collection Interval 60 Yes
Collection Offset 0
Log No
LOGIF (Blank)
Key Fields
None
Lifetime
From the time a Microsoft SQL Server instance starts until the time it stops
Record Size
• Fixed part: 1,303 bytes• Variable part: 0 bytes
Table 2-231 Server Detail (PD) Fields
Server Detail (PD)
View Name(Manager Name) Description Sum
Rule Format Delta
DataSource
Avg Cache Scan(CACHE_AVG_SCAN)
This field is reservedand cannot be used.
-- -- -- --
Blocked Processes(BLOCKED)
Number of processesthat are waitingbecause a processrunning on MicrosoftSQL Server is locked
-- word No master..sysprocesses.blocked
Blocking Locks(BLOCKING)
Number of blockinglocks
-- ulong No master..syslockinfo.req_status
Boot Time(BOOT_TIME)
Time at which theserver was started
-- time_t No MicrosoftSQL Servererror log
2-436 Working with RecordsHitachi Tuning Manager Application Reports Reference

Server Detail (PD)
View Name(Manager Name) Description Sum
Rule Format Delta
DataSource
Cache Buffers Free(CACHE_FREE_BUFFERS)
Number of data cachebuffers inside a freepool
-- word No master..sysperfinfo.free pages
Cache Hit %(CACHE_HIT_RATIO)
Percentage of timesthat data pages werefound inside the datacache within an interval
-- double No master..sysperfinfo.buffercache hitratio /buffercache hitratio base* 100
Conns(CONNECTIONS)
Number of clientconnections
-- ulong No @@connections
CPU %(PERC_BUSY)
Percentage of time thatthe CPU is busy
-- double No CPU_BUSY /(CPU_BUSY+ IDLE +IO_BUSY) *100
CPU Time(CPU_TIME)
CPU busy time -- utime Yes @@cpu_busy/ 1000
CPU Timeticks(CPU_BUSY)
CPU usage time (inticks)
-- ulong Yes @@cpu_busy* 1000 /@@timeticks
Database Count(DATABASES)
Database count -- word No master..sysdatabases
Demand Locks(DEMAND)
Number of requestlocks
-- ulong No master..syslockinfo.rsc_type,master..syslockinfo.req_mode
DSQuery(DS_QUERY)
Value of DSQUERYenvironment variable.Character string istruncated at 30 bytes.
-- string(31) No (See Note)
Exclusive IntentLocks(EXCLUSIVE_INTENT)
Number of exclusiveintent locks
-- ulong No master..syslockinfo.rsc_type,master..syslockinfo.req_mode
Working with Records 2-437Hitachi Tuning Manager Application Reports Reference

Server Detail (PD)
View Name(Manager Name) Description Sum
Rule Format Delta
DataSource
Exclusive PageLocks(EXCLUSIVE_PAGE)
Number of exclusivepage locks
-- ulong No master..syslockinfo.rsc_type,master..syslockinfo.req_mode
Exclusive TableLocks(EXCLUSIVE_TABLE)
Number of exclusivetable locks
-- ulong No master..syslockinfo.rsc_type,master..syslockinfo.req_mode
Host OS(OS)
OS under whichMicrosoft SQL Server isrunning. Data istruncated after 30bytes.
-- string(31) No Value ofregistry keyHKEY_LOCAL_MACHINE\SOFTWARE\Microsoft\WindowsNT\CurrentVersion\ProductName
Host Type(HOST_TYPE)
Type of machine onwhich Microsoft SQLServer is running
-- string(31) No @@version
I/O %(PERC_IO)
Percentage of CPU timespent for I/Os
-- double No IO_BUSY /(CPU_BUSY+ IDLE +IO_BUSY) *100
I/O Time(IO_TIME)
Percentage of CPU timespent for I/Os
-- utime Yes @@io_busy/ 1000
I/O Timeticks(IO_BUSY)
CPU I/O time (in ticks) -- ulong Yes @@io_busy* 1000 /@@timeticks
Idle %(PERC_IDLE)
Percentage of time thatthe CPU is idle
-- double No IDLE /(CPU_BUSY+ IDLE +IO_BUSY) *100
Idle Time(IDLE_TIME)
CPU idle time -- utime Yes @@idle /1000
Idle Timeticks(IDLE)
CPU idle time (in ticks) -- ulong Yes @@idle *1000 /
2-438 Working with RecordsHitachi Tuning Manager Application Reports Reference
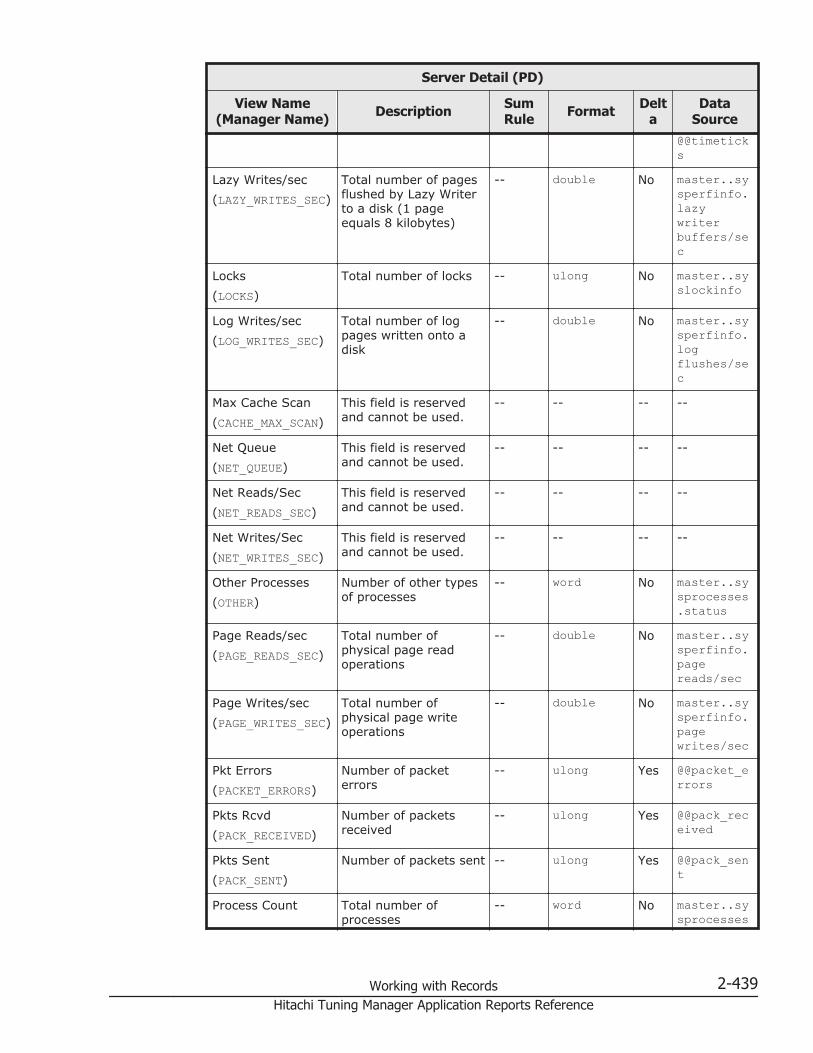
Server Detail (PD)
View Name(Manager Name) Description Sum
Rule Format Delta
DataSource
@@timeticks
Lazy Writes/sec(LAZY_WRITES_SEC)
Total number of pagesflushed by Lazy Writerto a disk (1 pageequals 8 kilobytes)
-- double No master..sysperfinfo.lazywriterbuffers/sec
Locks(LOCKS)
Total number of locks -- ulong No master..syslockinfo
Log Writes/sec(LOG_WRITES_SEC)
Total number of logpages written onto adisk
-- double No master..sysperfinfo.logflushes/sec
Max Cache Scan(CACHE_MAX_SCAN)
This field is reservedand cannot be used.
-- -- -- --
Net Queue(NET_QUEUE)
This field is reservedand cannot be used.
-- -- -- --
Net Reads/Sec(NET_READS_SEC)
This field is reservedand cannot be used.
-- -- -- --
Net Writes/Sec(NET_WRITES_SEC)
This field is reservedand cannot be used.
-- -- -- --
Other Processes(OTHER)
Number of other typesof processes
-- word No master..sysprocesses.status
Page Reads/sec(PAGE_READS_SEC)
Total number ofphysical page readoperations
-- double No master..sysperfinfo.pagereads/sec
Page Writes/sec(PAGE_WRITES_SEC)
Total number ofphysical page writeoperations
-- double No master..sysperfinfo.pagewrites/sec
Pkt Errors(PACKET_ERRORS)
Number of packeterrors
-- ulong Yes @@packet_errors
Pkts Rcvd(PACK_RECEIVED)
Number of packetsreceived
-- ulong Yes @@pack_received
Pkts Sent(PACK_SENT)
Number of packets sent -- ulong Yes @@pack_sent
Process Count Total number ofprocesses
-- word No master..sysprocesses
Working with Records 2-439Hitachi Tuning Manager Application Reports Reference

Server Detail (PD)
View Name(Manager Name) Description Sum
Rule Format Delta
DataSource
(PROCESSES)
RA Pages Fetched(RA_PAGES_FETCHED)
Total number of pagesprefetched into thecache by Read AheadManager
-- double No master..sysperfinfo.readaheadpages/sec
RA Pages Found(RA_PAGES_FOUND)
This field is reservedand cannot be used.
-- -- -- --
RA Reads/sec(RA_READS_SEC)
Total number ofphysical readoperations executed byRead Ahead Manager
-- double No master..sysperfinfo.pagereads/sec
RA Slots Used(RA_SLOTS_USED)
This field is reservedand cannot be used.
-- -- -- --
Reads Pending(READS_PENDING)
This field is reservedand cannot be used.
-- -- -- --
Record Time(RECORD_TIME)
Interval end time (GMTformat)
-- time_t No AgentCollector
Record Type(INPUT_RECORD_TYPE)
Record type (alwaysPD)
-- char(8) No AgentCollector
Runnable Processes(RUNNABLE)
Number of executableprocesses
-- word No master..sysprocesses.status
Running Processes(RUNNING)
Number of processesbeing executed
-- word No master..sysprocesses.status
Server Name(SERVER_NAME)
Name of machine onwhich Microsoft SQLServer is running
-- string(257)
No @@servername
Shared IntentLocks(SHARED_INTENT)
Number of sharedintent locks
-- ulong No master..syslockinfo.rsc_type,master..syslockinfo.req_mode
Shared Page Locks(SHARED_PAGE)
Number of shared pagelocks
-- ulong No master..syslockinfo.rsc_type,master..syslockinfo.req_mode
2-440 Working with RecordsHitachi Tuning Manager Application Reports Reference

Server Detail (PD)
View Name(Manager Name) Description Sum
Rule Format Delta
DataSource
Shared Table Locks(SHARED_TABLE)
Number of shared tablelocks
-- ulong No master..syslockinfo.rsc_type,master..syslockinfo.req_mode
Sleeping Processes(SLEEPING)
Number of sleepingprocesses
-- word No master..sysprocesses.status
Start Time(START_TIME)
Interval start time(GMT format)
-- time_t No AgentCollector
Timeticks(TIMETICKS)
Microseconds per tick -- ulong No @@timeticks
Total Errors(TOTAL_ERRORS)
Number of disk errors -- ulong Yes @@total_errors
Total Reads(TOTAL_READ)
Number of disk readoperations
-- ulong Yes @@total_read
Total Writes(TOTAL_WRITE)
Number of disk writeoperations
-- ulong Yes @@total_write
Trans/sec(TRANS_SEC)
Total number ofTransact-SQLcommand batchesexecuted
-- double No master..sysperfinfo.batchrequests/sec
Update Page Locks(UPDATE_PAGE)
Number of update pagelocks
-- ulong No master..syslockinfo.rsc_type,master..syslockinfo.req_mode
Version(SERVER_VERSION)
Microsoft SQL Serverversion
-- string(20) No SERVERPROPERTY('productversion')
Writes Pending(WRITES_PENDING)
This field is reservedand cannot be used.
-- -- -- --
Notes:
• For Microsoft SQL Server 2000:If the registry HKEY_LOCAL_MACHINE\SOFTWARE\Microsoft\MSSQLServer\Client\ConnectTo\DSQUERY exists, the value of this registry key isdisplayed. If this registry does not exist, N/A is displayed.
Working with Records 2-441Hitachi Tuning Manager Application Reports Reference
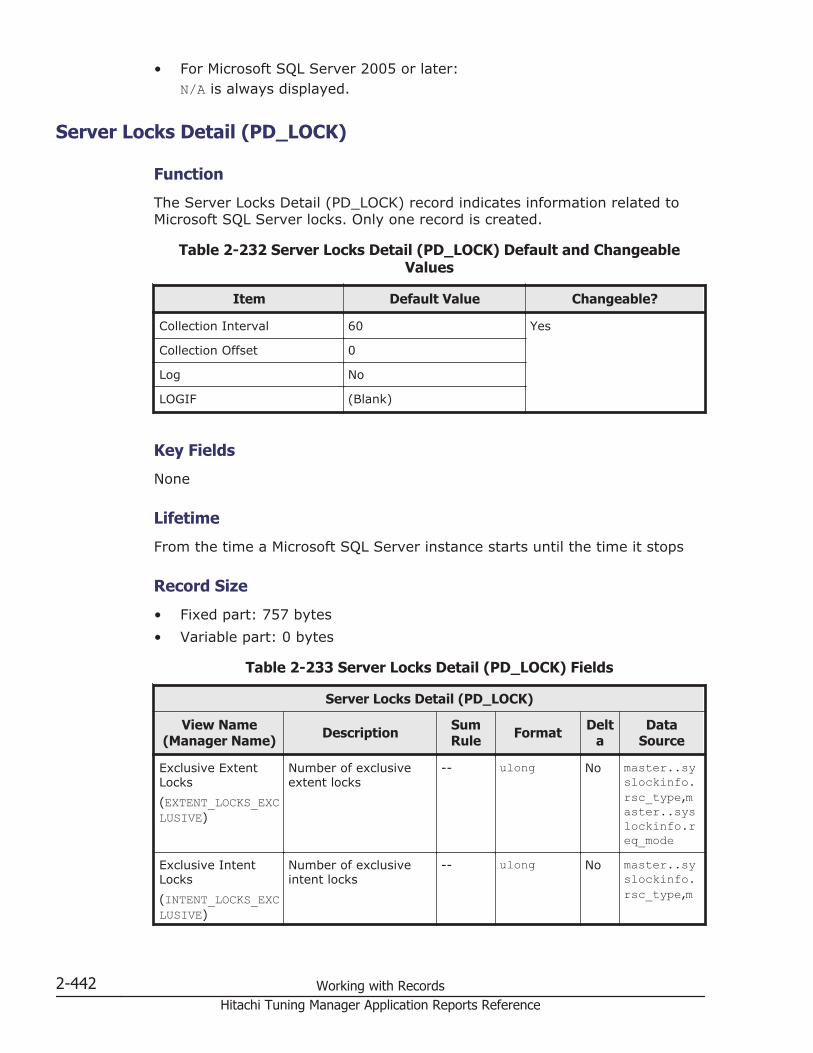
• For Microsoft SQL Server 2005 or later:N/A is always displayed.
Server Locks Detail (PD_LOCK)
Function
The Server Locks Detail (PD_LOCK) record indicates information related toMicrosoft SQL Server locks. Only one record is created.
Table 2-232 Server Locks Detail (PD_LOCK) Default and ChangeableValues
Item Default Value Changeable?
Collection Interval 60 Yes
Collection Offset 0
Log No
LOGIF (Blank)
Key Fields
None
Lifetime
From the time a Microsoft SQL Server instance starts until the time it stops
Record Size
• Fixed part: 757 bytes• Variable part: 0 bytes
Table 2-233 Server Locks Detail (PD_LOCK) Fields
Server Locks Detail (PD_LOCK)
View Name(Manager Name) Description Sum
Rule Format Delta
DataSource
Exclusive ExtentLocks(EXTENT_LOCKS_EXCLUSIVE)
Number of exclusiveextent locks
-- ulong No master..syslockinfo.rsc_type,master..syslockinfo.req_mode
Exclusive IntentLocks(INTENT_LOCKS_EXCLUSIVE)
Number of exclusiveintent locks
-- ulong No master..syslockinfo.rsc_type,m
2-442 Working with RecordsHitachi Tuning Manager Application Reports Reference

Server Locks Detail (PD_LOCK)
View Name(Manager Name) Description Sum
Rule Format Delta
DataSource
aster..syslockinfo.req_mode
Exclusive PageLocks(PAGE_LOCKS_EXCLUSIVE)
Number of exclusivepage locks
-- ulong No master..syslockinfo.rsc_type,master..syslockinfo.req_mode
Exclusive TableLocks(TABLE_LOCKS_EXCLUSIVE)
Number of exclusivetable locks
-- ulong No master..syslockinfo.rsc_type,master..syslockinfo.req_mode
Max Users Blocked(MAX_USERS_BLOCKED)
Maximum number ofusers who wereblocked by other usersduring the monitoringperiod
-- ulong No master..sysprocesses.blocked
Record Time(RECORD_TIME)
Interval end time (GMTformat)
-- time_t No AgentCollector
Record Type(INPUT_RECORD_TYPE)
Record type (alwaysLOCK)
-- char(8) No AgentCollector
Shared IntentLocks(INTENT_LOCKS_SHARED)
Number of sharedintent locks
-- ulong No master..syslockinfo.rsc_type,master..syslockinfo.req_mode
Shared Page Locks(PAGE_LOCKS_SHARED)
Number of shared pagelocks
-- ulong No master..syslockinfo.rsc_type,master..syslockinfo.req_mode
Shared Table Locks(TABLE_LOCKS_SHARED)
Number of shared tablelocks
-- ulong No master..syslockinfo.rsc_type,master..syslockinfo.req_mode
Start Time(START_TIME)
Interval start time(GMT format)
-- time_t No AgentCollector
Working with Records 2-443Hitachi Tuning Manager Application Reports Reference
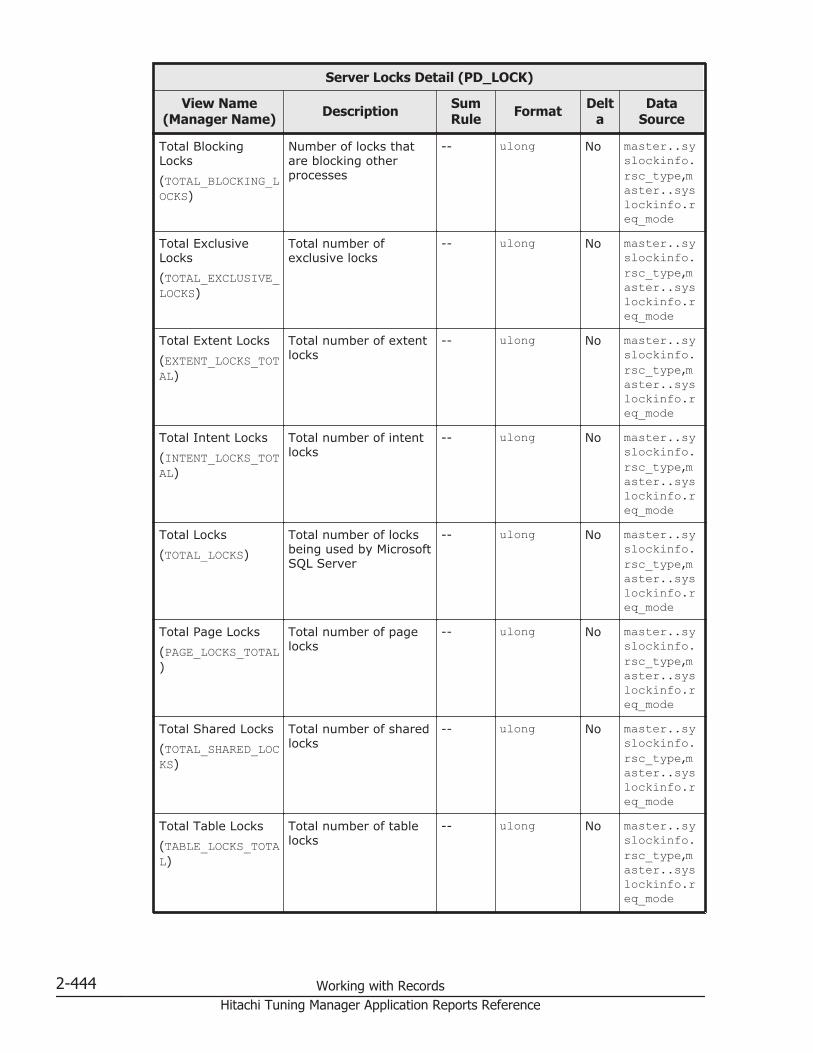
Server Locks Detail (PD_LOCK)
View Name(Manager Name) Description Sum
Rule Format Delta
DataSource
Total BlockingLocks(TOTAL_BLOCKING_LOCKS)
Number of locks thatare blocking otherprocesses
-- ulong No master..syslockinfo.rsc_type,master..syslockinfo.req_mode
Total ExclusiveLocks(TOTAL_EXCLUSIVE_LOCKS)
Total number ofexclusive locks
-- ulong No master..syslockinfo.rsc_type,master..syslockinfo.req_mode
Total Extent Locks(EXTENT_LOCKS_TOTAL)
Total number of extentlocks
-- ulong No master..syslockinfo.rsc_type,master..syslockinfo.req_mode
Total Intent Locks(INTENT_LOCKS_TOTAL)
Total number of intentlocks
-- ulong No master..syslockinfo.rsc_type,master..syslockinfo.req_mode
Total Locks(TOTAL_LOCKS)
Total number of locksbeing used by MicrosoftSQL Server
-- ulong No master..syslockinfo.rsc_type,master..syslockinfo.req_mode
Total Page Locks(PAGE_LOCKS_TOTAL)
Total number of pagelocks
-- ulong No master..syslockinfo.rsc_type,master..syslockinfo.req_mode
Total Shared Locks(TOTAL_SHARED_LOCKS)
Total number of sharedlocks
-- ulong No master..syslockinfo.rsc_type,master..syslockinfo.req_mode
Total Table Locks(TABLE_LOCKS_TOTAL)
Total number of tablelocks
-- ulong No master..syslockinfo.rsc_type,master..syslockinfo.req_mode
2-444 Working with RecordsHitachi Tuning Manager Application Reports Reference

Server Locks Detail (PD_LOCK)
View Name(Manager Name) Description Sum
Rule Format Delta
DataSource
Update ExtentLocks(EXTENT_LOCKS_UPDATE)
Number of updateextent locks
-- ulong No master..syslockinfo.rsc_type,master..syslockinfo.req_mode
Update Page Locks(PAGE_LOCKS_UPDATE)
Number of update pagelocks
-- ulong No master..syslockinfo.rsc_type,master..syslockinfo.req_mode
Users Blocked(USERS_BLOCKED)
Number of usersblocked by other users
-- ulong No master..sysprocesses.blocked
Server Overview (PI_SERV)
Function
The Server Overview (PI_SERV) record indicates overall information relatedto Microsoft SQL Server, such as the rate of cache hits and I/Os. Only onerecord is created.
Table 2-234 Server Overview (PI_SERV) Default and Changeable Values
Item Default Value Changeable?
Collection Interval 60 Yes
Collection Offset 0
Log No
LOGIF (Blank)
Key Fields
None
Lifetime
From the time a Microsoft SQL Server instance starts until the time it stops
Record Size
• Fixed part: 1,009 bytes
Working with Records 2-445Hitachi Tuning Manager Application Reports Reference

• Variable part: 0 bytes
Table 2-235 Server Overview (PI_SERV) Fields
Server Overview (PI_SERV)
View Name(Manager Name) Description Sum
Rule Format Delta
DataSource
Avg Cache Scan(CACHE_AVG_FREE_PAGE_SCAN)
This field is reservedand cannot be used.
-- -- -- --
Cache Buffers Free(CACHE_NUMBER_OF_FREE_BUFFERS)
Number of data cachebuffers inside a freepool at the time of datacollection
AVG ulong No master..sysperfinfo.free pages
Cache Hit %(CACHE_HIT_RATIO)
Percentage of timesthat data pages werefound inside the datacache
AVG double No master..sysperfinfo.buffercache hitratio /buffercache hitratio base* 100
Command QueueLength(NET_COMMAND_QUEUE_LENGTH)
This field is reservedand cannot be used.
-- -- -- --
Lazy Writes/sec(IO_LAZY_WRITES_PER_SEC)
Total number of pagesflushed by Lazy Writerto a disk (1 pageequals 8 kilobytes)
AVG double No master..sysperfinfo.Lazywrites/sec
Log Writes/sec(IO_LOG_WRITES_PER_SEC)
Total number of logpages physicallywritten onto a disk
AVG double No master..sysperfinfo.logflushes/sec
Max Cache Scan(CACHE_MAX_FREE_PAGE_SCAN)
This field is reservedand cannot be used.
-- -- -- --
Max Tempdb SpaceUsed Mbytes(MAX_TEMPDB_SPACE_USED_MB)
Maximum value of thespace used in tempdbwithin an interval (inmegabytes)
HI double No master..sysperfinfo.datafile(s)size(kb) /1024
Max Users Conn'd(MAX_USERS_CONNECTED)
Maximum number ofuser connectionsestablished within aninterval
HI ulong No master..sysperfinfo.user
2-446 Working with RecordsHitachi Tuning Manager Application Reports Reference

Server Overview (PI_SERV)
View Name(Manager Name) Description Sum
Rule Format Delta
DataSource
connections
Net Reads/sec(NET_NETWORK_READS_PER_SEC)
This field is reservedand cannot be used.
-- -- -- --
Net Writes/sec(NET_NETWORK_WRITES_PER_SEC)
This field is reservedand cannot be used.
-- -- -- --
Page Reads/sec(IO_PAGE_READS_PER_SEC)
Total number ofphysical page readoperations executed
AVG double No master..sysperfinfo.pagereads/sec
Page Writes/sec(IO_PAGE_WRITES_PER_SEC)
Total number ofphysical page writeoperations executed
AVG double No master..sysperfinfo.pagewrites/sec
RA Pages Fetchedinto Cache/sec(RA_PAGES_FETCHED_INTO_CACHE_PER_SEC)
Total number of pagesprefetched into thecache by Read AheadManager
AVG double No master..sysperfinfo.readaheadpages/sec
RA Pages Found inCache/sec(RA_PAGES_FOUND_IN_CACHE_PER_SEC)
This field is reservedand cannot be used.
-- -- -- --
RA PhysicalReads/sec(RA_PHYSICAL_READS_PER_SEC)
Total number ofphysical readoperations issued byRead Ahead Manager.(A single readoperation is 8 pages,each of which is 8kilobytes.)
AVG double No master..sysperfinfo.pagereads/sec
RA Slots Used(RA_SLOTS_USED)
This field is reservedand cannot be used.
-- -- -- --
Reads Pending(IO_OUTSTANDING_READS)
This field is reservedand cannot be used.
-- -- -- --
Record Time(RECORD_TIME)
Interval end time (GMTformat)
COPY time_t No AgentCollector
Record Type(INPUT_RECORD_TYPE)
Record type (alwaysSERV)
COPY char(8) No AgentCollector
Working with Records 2-447Hitachi Tuning Manager Application Reports Reference

Server Overview (PI_SERV)
View Name(Manager Name) Description Sum
Rule Format Delta
DataSource
Start Time(START_TIME)
Interval start time(GMT format)
COPY time_t No AgentCollector
Trans/sec(IO_TRANSACTIONS_PER_SEC)
Total number ofTransact-SQLcommand batchesexecuted
AVG double No master..sysperfinfo.batchrequests/sec
User Conns(USER_CONNECTIONS)
Number of clientconnections
COPY ulong No master..sysperfinfo.userconnections
Writes Pending(IO_OUTSTANDING_WRITES)
This field is reservedand cannot be used.
-- -- -- --
Server Overview 2 (PI_SRV2)
Function
The Server Overview 2 (PI_SRV2) record indicates the information related toMicrosoft SQL Server, such as the rate of cache hits and I/Os. In the ServerOverview 2 (PI_SRV2) record, if a field is acquired from Microsoft SQL Serverand the /sec counter of the field is a cumulative value, then the field isacquired every second. Only one record is created.
Table 2-236 Server Overview 2 (PI_SRV2) Default and Changeable Values
Item Default Value Changeable?
Collection Interval 60 Yes
Collection Offset 0
Log No
LOGIF (Blank)
Key Fields
None
Lifetime
From the time a Microsoft SQL Server instance starts until the time it stops.
2-448 Working with RecordsHitachi Tuning Manager Application Reports Reference

Record Size
• Fixed part: 1,009 bytes• Variable part: 0 bytes
Table 2-237 Server Overview 2 (PI_SRV2) Fields
Server Overview 2 (PI_SRV2)
View Name(Manager Name) Description Sum
Rule Format Delta
DataSource
Avg Cache Scan(CACHE_AVG_FREE_PAGE_SCAN)
This field is reservedand cannot be used.
-- -- -- --
Cache Buffers Free(CACHE_NUMBER_OF_FREE_BUFFERS)
Number of data cachebuffers inside a freepool at the time of datacollection
AVG ulong No master..sysperfinfo.free pages
Cache Hit %(CACHE_HIT_RATIO)
Percentage of timesthat data pages werefound in the data cache
AVG double No master..sysperfinfo.buffercache hitratio /buffercache hitratio base* 100
Command QueueLength(NET_COMMAND_QUEUE_LENGTH)
This field is reservedand cannot be used.
-- -- -- --
Lazy Writes/sec(IO_LAZY_WRITES_PER_SEC)
Number of pages(where 1 page is 8 KB)flushed per second to adisk by Lazy Writer
AVG double Yes(SeeNote)
master..sysperfinfo.Lazywrites/sec
Log Writes/sec(IO_LOG_WRITES_PER_SEC)
Number of log pageswritten per second tophysical disk
AVG double Yes(SeeNote)
master..sysperfinfo.logflushes/sec
Max Cache Scan(CACHE_MAX_FREE_PAGE_SCAN)
This field is reservedand cannot be used.
-- -- -- --
Max Tempdb SpaceUsed Mbytes(MAX_TEMPDB_SPACE_USED_MB)
Maximum value of thespace used by thetempdb over an interval(in megabytes)
HI double No master..sysperfinfo.datafile(s)size(kb) /1024
Working with Records 2-449Hitachi Tuning Manager Application Reports Reference

Server Overview 2 (PI_SRV2)
View Name(Manager Name) Description Sum
Rule Format Delta
DataSource
Max Users Conn'd(MAX_USERS_CONNECTED)
Maximum number ofuser connectionsestablished over aninterval
HI ulong No master..sysperfinfo.userconnections
Net Reads/sec(NET_NETWORK_READS_PER_SEC)
This filed is reservedand cannot be used.
-- -- -- --
Net Writes/sec(NET_NETWORK_WRITES_PER_SEC)
This field is reservedand cannot be used.
-- -- -- --
Page Reads/sec(IO_PAGE_READS_PER_SEC)
Number of physicalpage read operationsexecuted per second
AVG double Yes(SeeNote)
master..sysperfinfo.pagereads/sec
Page Writes/sec(IO_PAGE_WRITES_PER_SEC)
Number of physicalpage write operationsexecuted per second
AVG double Yes(SeeNote)
master..sysperfinfo.pagewrites/sec
RA Pages Fetchedinto Cache/sec(RA_PAGES_FETCHED_INTO_CACHE_PER_SEC)
Number of pagesprefetched per secondinto the cache by ReadAhead Manager
AVG double Yes(SeeNote)
master..sysperfinfo.readaheadpages/sec
RA Pages Found inCache/sec(RA_PAGES_FOUND_IN_CACHE_PER_SEC)
This field is reservedand cannot be used.
-- -- -- --
RA PhysicalReads/sec(RA_PHYSICAL_READS_PER_SEC)
Number of physicalread operations issuedper second by ReadAhead Manager. (Asingle read operation is8 pages, each of whichis 8 kilobytes.)
AVG double Yes(SeeNote)
master..sysperfinfo.pagereads/sec
RA Slots Used(RA_SLOTS_USED)
This field is reservedand cannot be used.
-- -- -- --
Reads Pending(IO_OUTSTANDING_READS)
This field is reservedand cannot be used.
-- -- -- --
Record Time(RECORD_TIME)
Interval end time (GMTformat)
COPY time_t No AgentCollector
2-450 Working with RecordsHitachi Tuning Manager Application Reports Reference
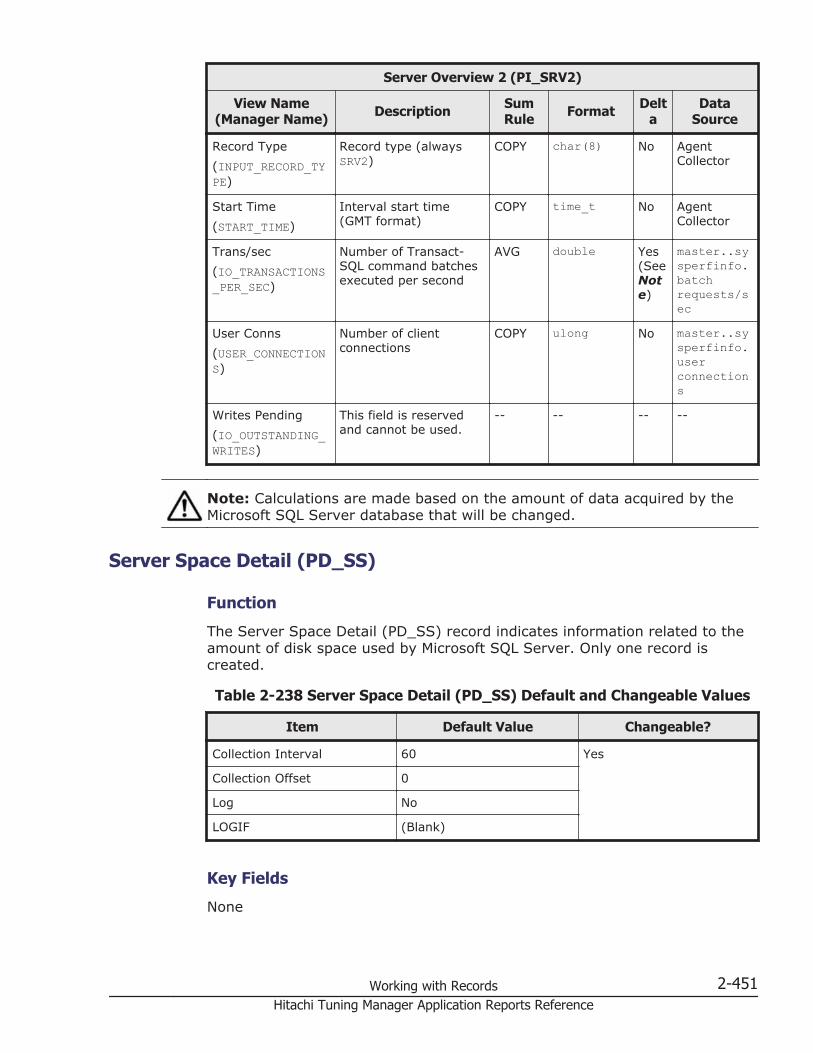
Server Overview 2 (PI_SRV2)
View Name(Manager Name) Description Sum
Rule Format Delta
DataSource
Record Type(INPUT_RECORD_TYPE)
Record type (alwaysSRV2)
COPY char(8) No AgentCollector
Start Time(START_TIME)
Interval start time(GMT format)
COPY time_t No AgentCollector
Trans/sec(IO_TRANSACTIONS_PER_SEC)
Number of Transact-SQL command batchesexecuted per second
AVG double Yes(SeeNote)
master..sysperfinfo.batchrequests/sec
User Conns(USER_CONNECTIONS)
Number of clientconnections
COPY ulong No master..sysperfinfo.userconnections
Writes Pending(IO_OUTSTANDING_WRITES)
This field is reservedand cannot be used.
-- -- -- --
Note: Calculations are made based on the amount of data acquired by theMicrosoft SQL Server database that will be changed.
Server Space Detail (PD_SS)
Function
The Server Space Detail (PD_SS) record indicates information related to theamount of disk space used by Microsoft SQL Server. Only one record iscreated.
Table 2-238 Server Space Detail (PD_SS) Default and Changeable Values
Item Default Value Changeable?
Collection Interval 60 Yes
Collection Offset 0
Log No
LOGIF (Blank)
Key Fields
None
Working with Records 2-451Hitachi Tuning Manager Application Reports Reference
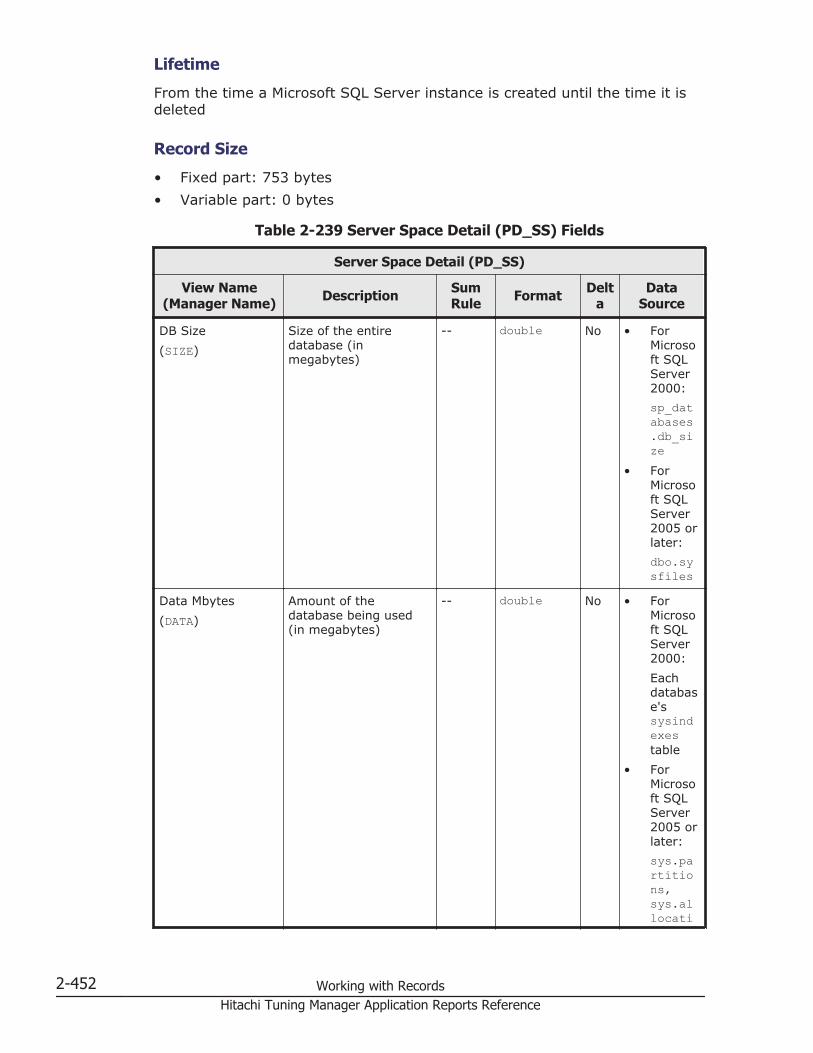
Lifetime
From the time a Microsoft SQL Server instance is created until the time it isdeleted
Record Size
• Fixed part: 753 bytes• Variable part: 0 bytes
Table 2-239 Server Space Detail (PD_SS) Fields
Server Space Detail (PD_SS)
View Name(Manager Name) Description Sum
Rule Format Delta
DataSource
DB Size(SIZE)
Size of the entiredatabase (inmegabytes)
-- double No • ForMicrosoft SQLServer2000:sp_databases.db_size
• ForMicrosoft SQLServer2005 orlater:dbo.sysfiles
Data Mbytes(DATA)
Amount of thedatabase being used(in megabytes)
-- double No • ForMicrosoft SQLServer2000:Eachdatabase'ssysindexestable
• ForMicrosoft SQLServer2005 orlater:sys.partitions,sys.allocati
2-452 Working with RecordsHitachi Tuning Manager Application Reports Reference
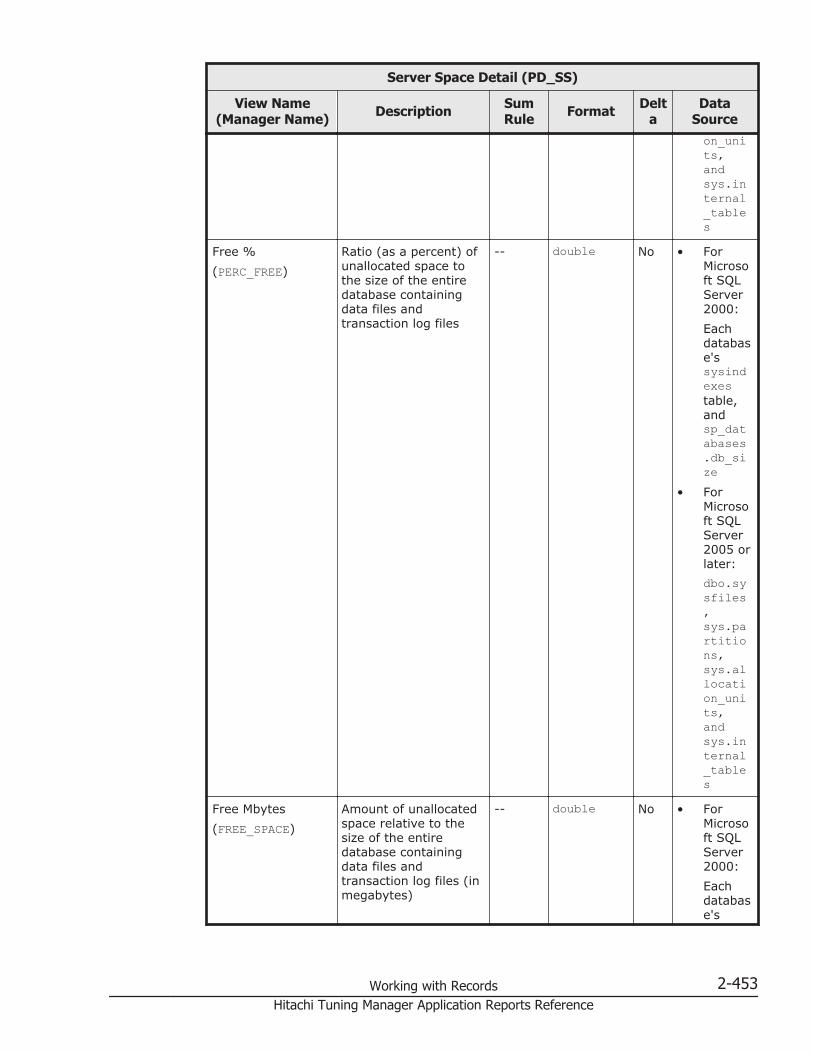
Server Space Detail (PD_SS)
View Name(Manager Name) Description Sum
Rule Format Delta
DataSourceon_units,andsys.internal_tables
Free %(PERC_FREE)
Ratio (as a percent) ofunallocated space tothe size of the entiredatabase containingdata files andtransaction log files
-- double No • ForMicrosoft SQLServer2000:Eachdatabase'ssysindexestable,andsp_databases.db_size
• ForMicrosoft SQLServer2005 orlater:dbo.sysfiles,sys.partitions,sys.allocation_units,andsys.internal_tables
Free Mbytes(FREE_SPACE)
Amount of unallocatedspace relative to thesize of the entiredatabase containingdata files andtransaction log files (inmegabytes)
-- double No • ForMicrosoft SQLServer2000:Eachdatabase's
Working with Records 2-453Hitachi Tuning Manager Application Reports Reference

Server Space Detail (PD_SS)
View Name(Manager Name) Description Sum
Rule Format Delta
DataSourcesysindexestable,andsp_databases.db_size
• ForMicrosoft SQLServer2005 orlater:dbo.sysfiles,sys.partitions,sys.allocation_units, andsys.internal_tables
Index Mbytes(IDX)
Amount of index spacebeing used (inmegabytes)
-- double No • ForMicrosoft SQLServer2000:Eachdatabase'ssysindexestable
• ForMicrosoft SQLServer2005 orlater:sys.partitions,sys.allocation_units, andsys.in
2-454 Working with RecordsHitachi Tuning Manager Application Reports Reference

Server Space Detail (PD_SS)
View Name(Manager Name) Description Sum
Rule Format Delta
DataSourceternal_tables
Log Mbytes(LOG)
Amount of log spacebeing used (inmegabytes)
-- double No DBCCSQLPERF(LOGSPACE)
Record Time(RECORD_TIME)
Interval end time (GMTformat)
-- time_t No AgentCollector
Record Type(INPUT_RECORD_TYPE)
Record type (alwaysSS)
-- char(8) No AgentCollector
Rsvd Mbytes(RESERVED)
Amount of spacealready allocated (inmegabytes)
-- double No • ForMicrosoft SQLServer2000:Eachdatabase'ssysindexestable
• ForMicrosoft SQLServer2005 orlater:sys.partitions,sys.allocation_units, andsys.internal_tables
Start Time(START_TIME)
Interval start time(GMT format)
-- time_t No AgentCollector
Unused %(PERC_USED)
Ratio (as a percent) ofallocated but unusedspace relative toallocated space
-- double No • ForMicrosoft SQLServer2000:Eachdatabas
Working with Records 2-455Hitachi Tuning Manager Application Reports Reference

Server Space Detail (PD_SS)
View Name(Manager Name) Description Sum
Rule Format Delta
DataSource
e'ssysindexestable
• ForMicrosoft SQLServer2005 orlater:sys.partitions,sys.allocation_units, andsys.internal_tables
Unused Mbytes(UNUSED)
Amount of allocatedbut unused space (inmegabytes)
-- double No • ForMicrosoft SQLServer2000:Eachdatabase'ssysindexestable
• ForMicrosoft SQLServer2005 orlater:sys.partitions,sys.allocation_units, andsys.internal_tables
2-456 Working with RecordsHitachi Tuning Manager Application Reports Reference

Server Space Interval (PI_SI)
Function
The Server Space Interval (PI_SI) record indicates interval informationrelated to the amount of disk space used by Microsoft SQL Server. Only onerecord is created.
Table 2-240 Server Space Interval (PI_SI) Default and Changeable Values
Item Default Value Changeable?
Collection Interval 60 Yes
Collection Offset 0
Log No
LOGIF (Blank)
Key Fields
None
Lifetime
From the time a Microsoft SQL Server instance is created until the time it isdeleted
Record Size
• Fixed part: 777 bytes• Variable part: 0 bytes
Table 2-241 Server Space Interval (PI_SI) Fields
Server Space Interval (PI_SI)
View Name(Manager Name) Description Sum
Rule Format Delta
DataSource
Data Mbytes(DATA)
Amount of databasebeing used (inmegabytes)
COPY double No • ForMicrosoft SQLServer2000:Eachdatabase'ssysindexestable
• ForMicrosoft SQL
Working with Records 2-457Hitachi Tuning Manager Application Reports Reference

Server Space Interval (PI_SI)
View Name(Manager Name) Description Sum
Rule Format Delta
DataSource
Server2005 orlater:sys.partitions,sys.allocation_units, andsys.internal_tables
DB Size(SIZE)
Size of the entiredatabase (inmegabytes)
COPY double No • ForMicrosoft SQLServer2000:sp_databases.db_size
• ForMicrosoft SQLServer2005 orlater:dbo.sysfiles
Free %(PERC_FREE)
Ratio (as a percent) ofunallocated space tothe size of the entiredatabase containingdata files andtransaction log files
AVG double No • ForMicrosoft SQLServer2000:Eachdatabase'ssysindexestable,andsp_databases.db_size
• ForMicrosoft SQLServer
2-458 Working with RecordsHitachi Tuning Manager Application Reports Reference

Server Space Interval (PI_SI)
View Name(Manager Name) Description Sum
Rule Format Delta
DataSource
2005 orlater:dbo.sysfiles,sys.partitions,sys.allocation_units, andsys.internal_tables
Free Mbytes(FREE_SPACE)
Amount of unallocatedspace relative to thesize of the entiredatabase containingdata files andtransaction log files (inmegabytes)
LO double No • ForMicrosoft SQLServer2000:Eachdatabase'ssysindexestable,andsp_databases.db_size
• ForMicrosoft SQLServer2005 orlater:dbo.sysfiles,sys.partitions,sys.allocation_units, andsys.internal_tables
Working with Records 2-459Hitachi Tuning Manager Application Reports Reference

Server Space Interval (PI_SI)
View Name(Manager Name) Description Sum
Rule Format Delta
DataSource
Index Mbytes(IDX)
Amount of index spacebeing used (inmegabytes)
COPY double No • ForMicrosoft SQLServer2000:Eachdatabase'ssysindexestable
• ForMicrosoft SQLServer2005 orlater:sys.partitions,sys.allocation_units, andsys.internal_tables
Log Mbytes(LOG)
Amount of log spacebeing used (inmegabytes)
COPY double No DBCCSQLPERF(LOGSPACE)
Record Time(RECORD_TIME)
Interval end time (GMTformat)
COPY time_t No AgentCollector
Record Type(INPUT_RECORD_TYPE)
Record type (alwaysSI)
COPY char(8) No AgentCollector
Rsvd Mbytes(RESERVED)
Amount of spacealready allocated (inmegabytes)
COPY double No • ForMicrosoft SQLServer2000:Eachdatabase'ssysindexestable
• ForMicroso
2-460 Working with RecordsHitachi Tuning Manager Application Reports Reference

Server Space Interval (PI_SI)
View Name(Manager Name) Description Sum
Rule Format Delta
DataSource
ft SQLServer2005 orlater:sys.partitions,sys.allocation_units, andsys.internal_tables
Start Time(START_TIME)
Interval start time(GMT format)
COPY time_t No AgentCollector
Unused %(PERC_USED)
Ratio (as a percent) ofallocated but unusedspace relative toallocated space
AVG double No • ForMicrosoft SQLServer2000:Eachdatabase'ssysindexestable
• ForMicrosoft SQLServer2005 orlater:sys.partitions,sys.allocation_units, andsys.internal_tables
Unused Mbytes(UNUSED)
Amount of allocatedbut unused space (inmegabytes)
COPY double No • ForMicrosoft SQLServer2000:
Working with Records 2-461Hitachi Tuning Manager Application Reports Reference
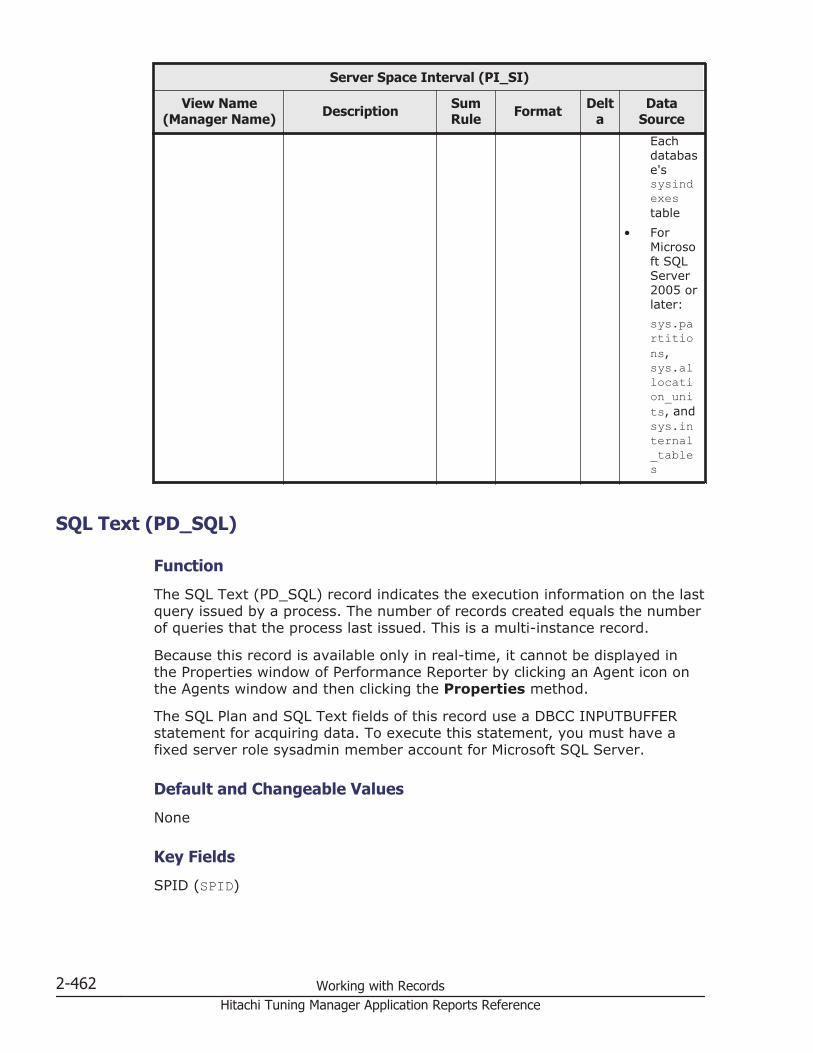
Server Space Interval (PI_SI)
View Name(Manager Name) Description Sum
Rule Format Delta
DataSource
Eachdatabase'ssysindexestable
• ForMicrosoft SQLServer2005 orlater:sys.partitions,sys.allocation_units, andsys.internal_tables
SQL Text (PD_SQL)
Function
The SQL Text (PD_SQL) record indicates the execution information on the lastquery issued by a process. The number of records created equals the numberof queries that the process last issued. This is a multi-instance record.
Because this record is available only in real-time, it cannot be displayed inthe Properties window of Performance Reporter by clicking an Agent icon onthe Agents window and then clicking the Properties method.
The SQL Plan and SQL Text fields of this record use a DBCC INPUTBUFFERstatement for acquiring data. To execute this statement, you must have afixed server role sysadmin member account for Microsoft SQL Server.
Default and Changeable Values
None
Key Fields
SPID (SPID)
2-462 Working with RecordsHitachi Tuning Manager Application Reports Reference

Lifetime
None
Record Size
• Fixed part: 681 bytes• Variable part: 30,464 bytes
Table 2-242 SQL Text (PD_SQL) Fields
SQL Text (PD_SQL)
View Name(Manager Name) Description Sum
Rule Format Delta
DataSource
Command(COMMAND)
The last commandexecuted
-- string(33) No master..sysprocesses.cmd
Record Time(RECORD_TIME)
Interval end time (GMTformat)
-- time_t No AgentCollector
Record Type(INPUT_RECORD_TYPE)
Record type (alwaysSQL)
-- char(8) No AgentCollector
SID(SID)
User's security ID -- string(171)
No master..syslogins.sid
SPID(SPID)
Process ID -- word No master..sysprocesses.spid
SQL Plan(SQL_PLAN)
Displays the executioninformation for an SQLstatement.
-- string(30001)
No Resultobtainedwhen SETSHOWPLAN_ALL ON andSET NOEXECON arespecified forexecutingthe SQLTextstatement
SQL Text(SQL_TEXT)
Displays the laststatement sent by thisprocess.
-- string(30001)
No DBCCINPUTBUFFER(master..sysprocesses.spid)
Start Time(START_TIME)
Interval start time(GMT format)
-- time_t No AgentCollector
Working with Records 2-463Hitachi Tuning Manager Application Reports Reference

SQL Text (PD_SQL)
View Name(Manager Name) Description Sum
Rule Format Delta
DataSource
User(USER)
Logon name of the userwho issued thecommand
-- string(257)
No master..sysprocesses.loginame
Transaction Log Overview (PI_TLOG)
Function
The Transaction Log Overview (PI_TLOG) record indicates information relatedto transaction log space. One record is created for each database transactionlog. This is a multi-instance record.
Table 2-243 Transaction Log Overview (PI_TLOG) Default and ChangeableValues
Item Default Value Changeable?
Collection Interval 60 Yes
Collection Offset 0
Log No
LOGIF (Blank)
Key Fields
DB Name (DB_Name)
Lifetime
From the time a database is created until the time it is deleted
Record Size
• Fixed part: 681 bytes• Variable part: 313 bytes
Table 2-244 Transaction Log Overview (PI_TLOG) Fields
Transaction Log Overview (PI_TLOG)
View Name(Manager Name) Description Sum
Rule Format Delta
DataSource
DB Name(DB_NAME)
Database name COPY string(257)
No DBCCSQLPERF(LOGSPACE)
2-464 Working with RecordsHitachi Tuning Manager Application Reports Reference
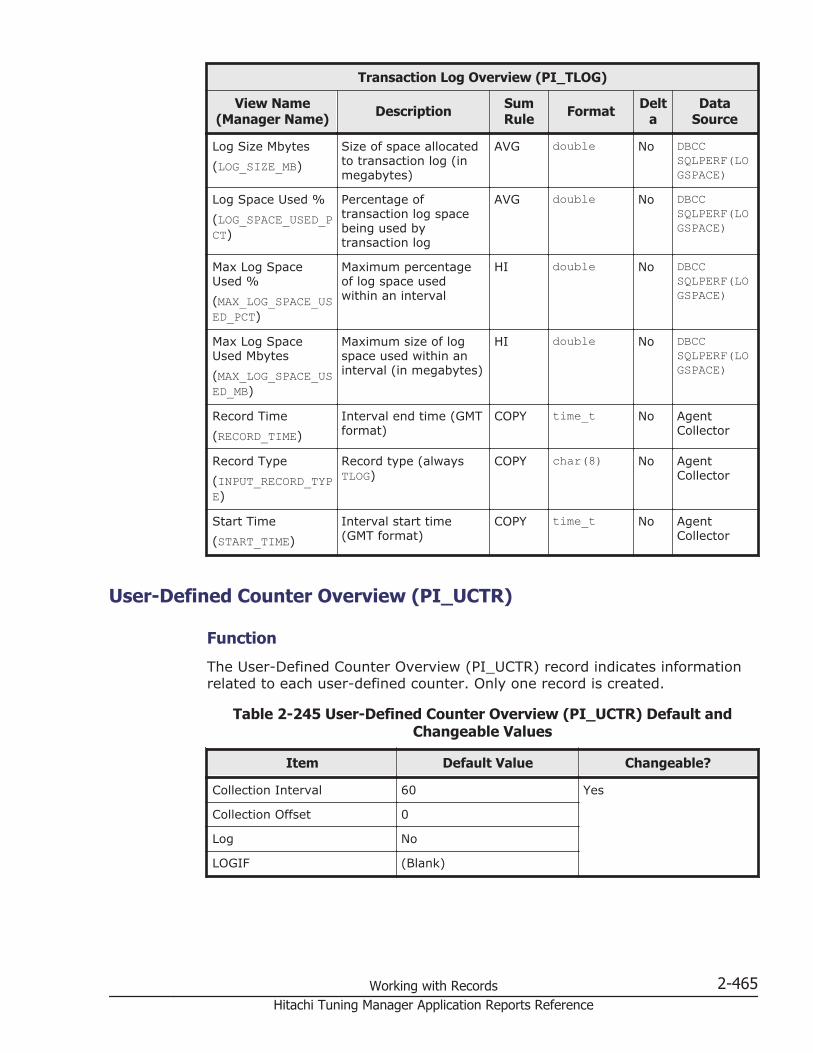
Transaction Log Overview (PI_TLOG)
View Name(Manager Name) Description Sum
Rule Format Delta
DataSource
Log Size Mbytes(LOG_SIZE_MB)
Size of space allocatedto transaction log (inmegabytes)
AVG double No DBCCSQLPERF(LOGSPACE)
Log Space Used %(LOG_SPACE_USED_PCT)
Percentage oftransaction log spacebeing used bytransaction log
AVG double No DBCCSQLPERF(LOGSPACE)
Max Log SpaceUsed %(MAX_LOG_SPACE_USED_PCT)
Maximum percentageof log space usedwithin an interval
HI double No DBCCSQLPERF(LOGSPACE)
Max Log SpaceUsed Mbytes(MAX_LOG_SPACE_USED_MB)
Maximum size of logspace used within aninterval (in megabytes)
HI double No DBCCSQLPERF(LOGSPACE)
Record Time(RECORD_TIME)
Interval end time (GMTformat)
COPY time_t No AgentCollector
Record Type(INPUT_RECORD_TYPE)
Record type (alwaysTLOG)
COPY char(8) No AgentCollector
Start Time(START_TIME)
Interval start time(GMT format)
COPY time_t No AgentCollector
User-Defined Counter Overview (PI_UCTR)
Function
The User-Defined Counter Overview (PI_UCTR) record indicates informationrelated to each user-defined counter. Only one record is created.
Table 2-245 User-Defined Counter Overview (PI_UCTR) Default andChangeable Values
Item Default Value Changeable?
Collection Interval 60 Yes
Collection Offset 0
Log No
LOGIF (Blank)
Working with Records 2-465Hitachi Tuning Manager Application Reports Reference
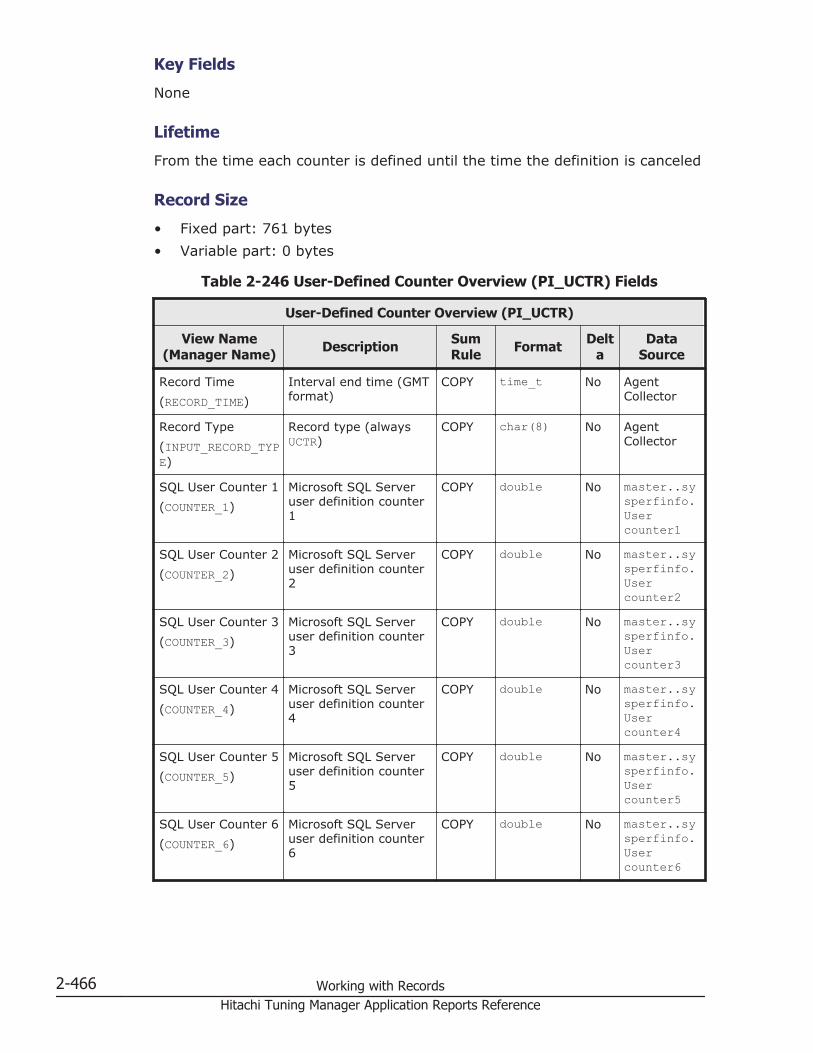
Key Fields
None
Lifetime
From the time each counter is defined until the time the definition is canceled
Record Size
• Fixed part: 761 bytes• Variable part: 0 bytes
Table 2-246 User-Defined Counter Overview (PI_UCTR) Fields
User-Defined Counter Overview (PI_UCTR)
View Name(Manager Name) Description Sum
Rule Format Delta
DataSource
Record Time(RECORD_TIME)
Interval end time (GMTformat)
COPY time_t No AgentCollector
Record Type(INPUT_RECORD_TYPE)
Record type (alwaysUCTR)
COPY char(8) No AgentCollector
SQL User Counter 1(COUNTER_1)
Microsoft SQL Serveruser definition counter1
COPY double No master..sysperfinfo.Usercounter1
SQL User Counter 2(COUNTER_2)
Microsoft SQL Serveruser definition counter2
COPY double No master..sysperfinfo.Usercounter2
SQL User Counter 3(COUNTER_3)
Microsoft SQL Serveruser definition counter3
COPY double No master..sysperfinfo.Usercounter3
SQL User Counter 4(COUNTER_4)
Microsoft SQL Serveruser definition counter4
COPY double No master..sysperfinfo.Usercounter4
SQL User Counter 5(COUNTER_5)
Microsoft SQL Serveruser definition counter5
COPY double No master..sysperfinfo.Usercounter5
SQL User Counter 6(COUNTER_6)
Microsoft SQL Serveruser definition counter6
COPY double No master..sysperfinfo.Usercounter6
2-466 Working with RecordsHitachi Tuning Manager Application Reports Reference

User-Defined Counter Overview (PI_UCTR)
View Name(Manager Name) Description Sum
Rule Format Delta
DataSource
SQL User Counter 7(COUNTER_7)
Microsoft SQL Serveruser definition counter7
COPY double No master..sysperfinfo.Usercounter7
SQL User Counter 8(COUNTER_8)
Microsoft SQL Serveruser definition counter8
COPY double No master..sysperfinfo.Usercounter8
SQL User Counter 9(COUNTER_9)
Microsoft SQL Serveruser definition counter9
COPY double No master..sysperfinfo.Usercounter9
SQL User Counter10(COUNTER_10)
Microsoft SQL Serveruser definition counter10
COPY double No master..sysperfinfo.Usercounter10
Start Time(START_TIME)
Interval start time(GMT format)
COPY time_t No AgentCollector
User Process Detail (PD_USER)
Function
The User Process Detail (PD_USER) record indicates information related toeach logged-on user. One record is created for each user process. This is amulti-instance record.
Table 2-247 User Process Detail (PD_USER) Default and ChangeableValues
Item Default Value Changeable?
Collection Interval 60 Yes
Collection Offset 0
Log No
LOGIF (Blank)
Key Fields
• SID (SID)• SPID (SPID)
Working with Records 2-467Hitachi Tuning Manager Application Reports Reference

Lifetime
From the time a process starts until the time it stops
Record Size
• Fixed part: 681 bytes• Variable part: 791 bytes
Table 2-248 User Process Detail (PD_USER) Fields
User Process Detail (PD_USER)
View Name(Manager Name) Description Sum
Rule Format Delta
DataSource
CPU Time(CPU_TIME)
Total time the CPU wasbusy for the user
-- utime No master..sysprocesses.cpu
Locks held(LOCKS_HELD)
Number of locks heldby user connection
-- ulong No master..syslockinfo.req_spid
Login Name(LOGIN_NAME)
Actual name of theuser
-- string(257)
No master..syslogins.loginame
Mem Pages(MEMORY)
Amount of memoryallocated to userconnection (1 pageequals 8 kilobytes)
-- ulong No master..sysprocesses.memusage
Physical I/O(PHYSICAL_IO)
Total number of diskread and writeoperations by the user
-- double No master..sysprocesses.physical_io
Record Time(RECORD_TIME)
Interval end time (GMTformat)
-- time_t No AgentCollector
Record Type(INPUT_RECORD_TYPE)
Record type (alwaysUSER)
-- char(8) No AgentCollector
Role(ROLE)
Fixed server role towhich the user belongs.Options are delimitedby commas.
-- string(80) No master..syslogins
SID(SID)
Security ID of the user.Hexadecimal. Ifinformation cannot beobtained from thesyslogins systemtable of Microsoft SQLServer, it is obtainedfrom the sysprocessessystem table.
-- string(171)
No master..syslogins.sid ormaster..sysprocesses.sid
2-468 Working with RecordsHitachi Tuning Manager Application Reports Reference

User Process Detail (PD_USER)
View Name(Manager Name) Description Sum
Rule Format Delta
DataSource
SPID(SPID)
Connection process IDof the user
-- word No master..sysprocesses.spid
Start Time(START_TIME)
Interval start time(GMT format)
-- time_t No AgentCollector
User(USER_ID)
User ID. If informationcannot be obtainedfrom the sysloginssystem table ofMicrosoft SQL Server, itis obtained from thesysprocesses systemtable. If the logonname used is 61characters or longer,the part exceeding 61characters is cut off.
-- string(257)
No master..sysprocesses.sid,master..syslogins.name ormaster..sysprocesses.sid,master..sysprocesses.loginame
Reserved RecordsThe following records are reserved and unavailable:
• Errorlog Summary Interval (PI_ESI)• Generic Data Detail (PD_GEND)• Generic Data Interval (PI_GENI)• Restore History Detail (PD_RH)• SQL Text - Performance-Based (PD_PDES)
Agent for Microsoft Exchange Server RecordsTable 2-249 Agent for Microsoft Exchange Server Records on page 2-470 liststhe records that can be collected by the Agent for Microsoft Exchange Serverand the information that is stored in each record.
Working with Records 2-469Hitachi Tuning Manager Application Reports Reference
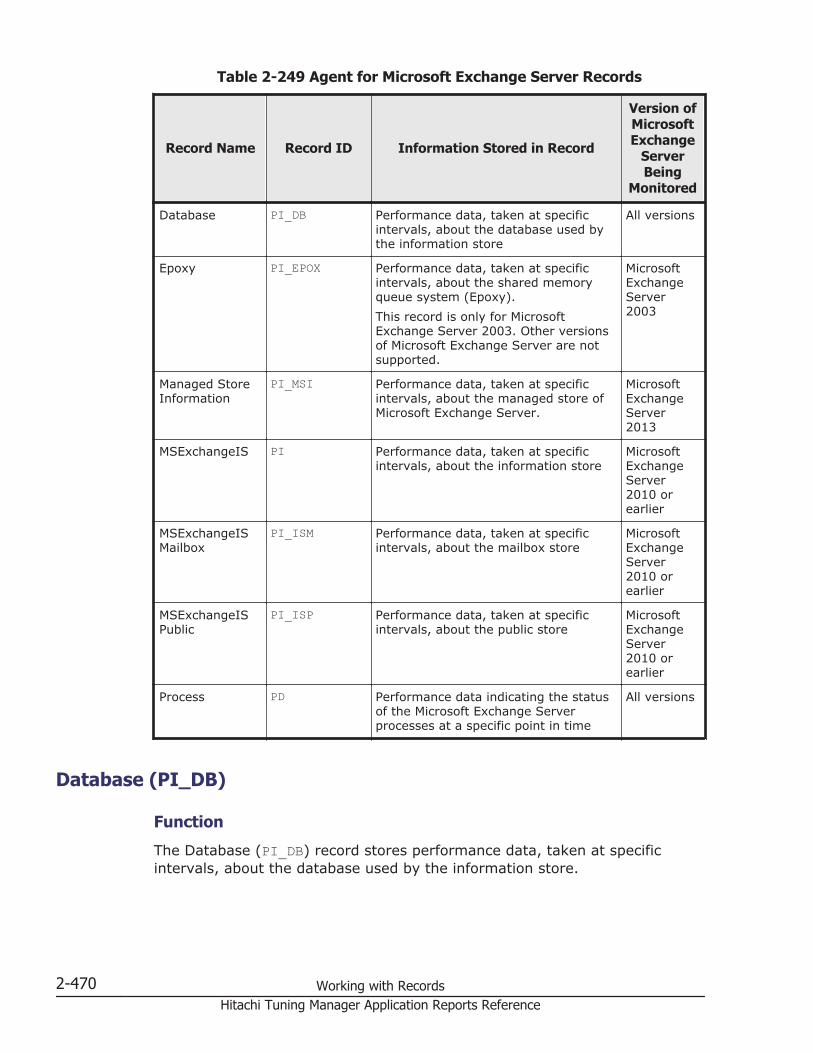
Table 2-249 Agent for Microsoft Exchange Server Records
Record Name Record ID Information Stored in Record
Version ofMicrosoftExchange
ServerBeing
Monitored
Database PI_DB Performance data, taken at specificintervals, about the database used bythe information store
All versions
Epoxy PI_EPOX Performance data, taken at specificintervals, about the shared memoryqueue system (Epoxy).This record is only for MicrosoftExchange Server 2003. Other versionsof Microsoft Exchange Server are notsupported.
MicrosoftExchangeServer2003
Managed StoreInformation
PI_MSI Performance data, taken at specificintervals, about the managed store ofMicrosoft Exchange Server.
MicrosoftExchangeServer2013
MSExchangeIS PI Performance data, taken at specificintervals, about the information store
MicrosoftExchangeServer2010 orearlier
MSExchangeISMailbox
PI_ISM Performance data, taken at specificintervals, about the mailbox store
MicrosoftExchangeServer2010 orearlier
MSExchangeISPublic
PI_ISP Performance data, taken at specificintervals, about the public store
MicrosoftExchangeServer2010 orearlier
Process PD Performance data indicating the statusof the Microsoft Exchange Serverprocesses at a specific point in time
All versions
Database (PI_DB)
Function
The Database (PI_DB) record stores performance data, taken at specificintervals, about the database used by the information store.
2-470 Working with RecordsHitachi Tuning Manager Application Reports Reference

Table 2-250 Database (PI_DB) Default and Changeable Values
Item Default Value Changeable?
Collection Interval 60 Yes
Collection Offset 0
Log Yes
LOGIF (Blank)
Key Fields
None
Lifetime
From starting to stopping of the Microsoft Exchange Server service
Record Size
• Fixed part: 729 bytes• Variable part: 0 bytes
Table 2-251 Database (PI_DB) Fields
Database (PI_DB)
View Name(Manager Name) Description Sum
Rule Format Delta
DataSource
Database Cache %Hit(DB_CACHE_PERCENT_HIT)
Database Cache % Hitis the percentage ofdatabase file pagerequests that werefulfilled by thedatabase cache withoutcausing a fileoperation. If thispercentage is too low,the database cache sizemay be too small.
AVG double No --
Database CacheSize(DB_CACHE_SIZE)
Database Cache Size isthe amount of systemmemory used by thedatabase cachemanager to holdcommonly usedinformation from thedatabase file(s) toprevent file operations.If the database cachesize seems to be toosmall for optimalperformance and there
AVG double No --
Working with Records 2-471Hitachi Tuning Manager Application Reports Reference

Database (PI_DB)
View Name(Manager Name) Description Sum
Rule Format Delta
DataSource
is very little availablememory on the system(see Memory/AvailableBytes), adding morememory to the systemmay increaseperformance. If there isa lot of availablememory on the systemand the database cachesize is not growingbeyond a certain point,the database cache sizemay be capped at anartificially low limit.Increasing this limitmay increaseperformance.
Database PageFault Stalls/sec(DB_PAGE_FAULT_STALLS_PER_SEC)
Database Page FaultStalls/sec is the rate ofpage faults that cannotbe serviced becausethere are no pagesavailable for allocationfrom the databasecache. If this counter isnon-zero most of thetime, the cleanthreshold may be toolow.
AVG double No --
Interval(INTERVAL)
Interval, in seconds,over which theinformation wascollected.
COPY ulong No RECORD_TIME -CURRENT_SYSTEM_BOOT_TIME
Log RecordStalls/sec(LOG_RECORD_STALLS_PER_SEC)
Log Record Stalls/sec isthe number of logrecords that cannot beadded to the logbuffers per secondbecause they are full. Ifthis counter is non-zeromost of the time, thelog buffer size may bea bottleneck.
AVG double No --
Log ThreadsWaiting(LOG_THREADS_WAITING)
Log Threads Waiting isthe number of threadswaiting for their data tobe written to the log inorder to complete anupdate of the database.If this number is too
AVG double No --
2-472 Working with RecordsHitachi Tuning Manager Application Reports Reference

Database (PI_DB)
View Name(Manager Name) Description Sum
Rule Format Delta
DataSource
high, the log may be abottleneck.
Record Time(RECORD_TIME)
Greenwich mean timeat which the record wascreated.
COPY time_t No --
Record Type(INPUT_RECORD_TYPE)
Record type identifier.always "DB".
COPY char(8) No --
Table Open Cache% Hit(TABLE_OPEN_CACHE_PERCENT_HIT)
Table Open Cache %Hit is the percentage ofdatabase tables openedusing cached schemainformation. If thispercentage is too low,the table cache sizemay be too small.
AVG double No --
Epoxy (PI_EPOX)
Function
The Epoxy (PI_EPOX) record stores performance data, taken at specificintervals, about the shared memory queue system (Epoxy). This is a multi-instance record.
Note:
• For Microsoft Exchange Server 2007 or later, this record cannot be usedbecause it is reserved.
• This record is only for Microsoft Exchange Server 2003. Other versions ofMicrosoft Exchange Server are not supported.
Table 2-252 Epoxy (PI_EPOX) Default and Changeable Values
Item Default Value Changeable?
Collection Interval 60 Yes
Collection Offset 0
Log No
LOGIF (Blank)
Key Fields
Protocol Name (PROTOCOL_NAME)
Working with Records 2-473Hitachi Tuning Manager Application Reports Reference
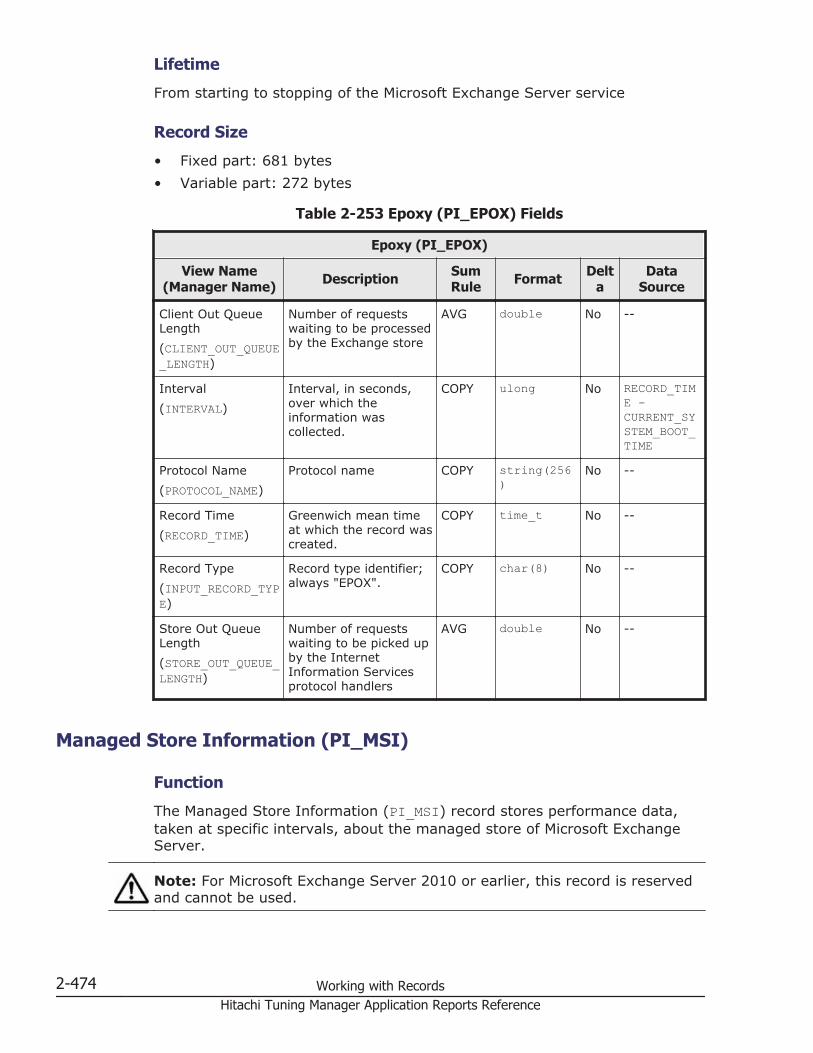
Lifetime
From starting to stopping of the Microsoft Exchange Server service
Record Size
• Fixed part: 681 bytes• Variable part: 272 bytes
Table 2-253 Epoxy (PI_EPOX) Fields
Epoxy (PI_EPOX)
View Name(Manager Name) Description Sum
Rule Format Delta
DataSource
Client Out QueueLength(CLIENT_OUT_QUEUE_LENGTH)
Number of requestswaiting to be processedby the Exchange store
AVG double No --
Interval(INTERVAL)
Interval, in seconds,over which theinformation wascollected.
COPY ulong No RECORD_TIME -CURRENT_SYSTEM_BOOT_TIME
Protocol Name(PROTOCOL_NAME)
Protocol name COPY string(256)
No --
Record Time(RECORD_TIME)
Greenwich mean timeat which the record wascreated.
COPY time_t No --
Record Type(INPUT_RECORD_TYPE)
Record type identifier;always "EPOX".
COPY char(8) No --
Store Out QueueLength(STORE_OUT_QUEUE_LENGTH)
Number of requestswaiting to be picked upby the InternetInformation Servicesprotocol handlers
AVG double No --
Managed Store Information (PI_MSI)
Function
The Managed Store Information (PI_MSI) record stores performance data,taken at specific intervals, about the managed store of Microsoft ExchangeServer.
Note: For Microsoft Exchange Server 2010 or earlier, this record is reservedand cannot be used.
2-474 Working with RecordsHitachi Tuning Manager Application Reports Reference
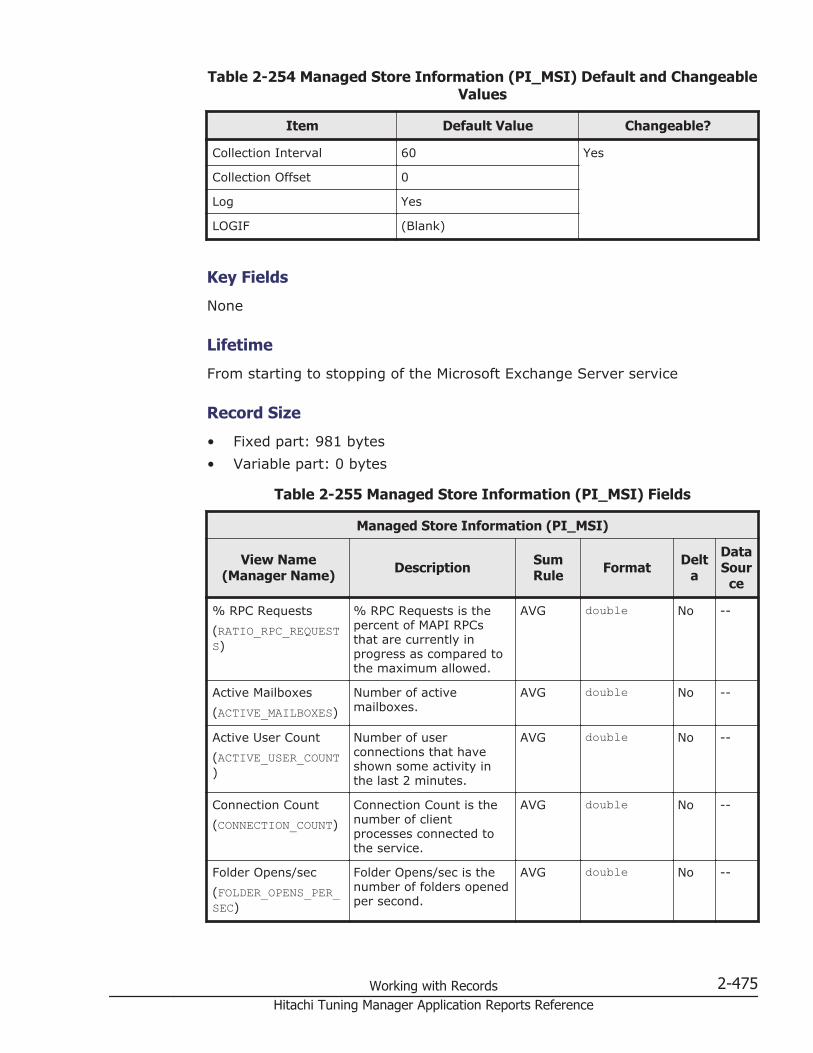
Table 2-254 Managed Store Information (PI_MSI) Default and ChangeableValues
Item Default Value Changeable?
Collection Interval 60 Yes
Collection Offset 0
Log Yes
LOGIF (Blank)
Key Fields
None
Lifetime
From starting to stopping of the Microsoft Exchange Server service
Record Size
• Fixed part: 981 bytes• Variable part: 0 bytes
Table 2-255 Managed Store Information (PI_MSI) Fields
Managed Store Information (PI_MSI)
View Name(Manager Name) Description Sum
Rule Format Delta
DataSour
ce
% RPC Requests(RATIO_RPC_REQUESTS)
% RPC Requests is thepercent of MAPI RPCsthat are currently inprogress as compared tothe maximum allowed.
AVG double No --
Active Mailboxes(ACTIVE_MAILBOXES)
Number of activemailboxes.
AVG double No --
Active User Count(ACTIVE_USER_COUNT)
Number of userconnections that haveshown some activity inthe last 2 minutes.
AVG double No --
Connection Count(CONNECTION_COUNT)
Connection Count is thenumber of clientprocesses connected tothe service.
AVG double No --
Folder Opens/sec(FOLDER_OPENS_PER_SEC)
Folder Opens/sec is thenumber of folders openedper second.
AVG double No --
Working with Records 2-475Hitachi Tuning Manager Application Reports Reference

Managed Store Information (PI_MSI)
View Name(Manager Name) Description Sum
Rule Format Delta
DataSour
ce
Interval(INTERVAL)
Interval, in seconds, overwhich the informationwas collected.
COPY ulong No RECORD_TIME-CURRENT_SYSTEM_BOOT_TIME
Message Opens/sec(MESSAGE_OPENS_PER_SEC)
Message Opens/sec is thenumber of top levelmessages opened persecond.
AVG double No --
Message RecipientsDelivered/min(MSG_RECIPIENTS_DELIVERED_PER_MIN)
Message RecipientsDelivered/min is thenumber of messagesdelivered to the databaseper minute.
AVG double No MessageDelivered/sec *60
MessagesSubmitted/min(MESSAGES_SUBMITTED_MIN)
Messages Submitted/minis the number ofmessages submitted fromthe database per minute.
AVG double No MessagesSubmitted/sec *60
Record Time(RECORD_TIME)
Greenwich mean time atwhich the record wascreated.
COPY time_t No --
Record Type(INPUT_RECORD_TYPE)
Record type identifier;always "MSI".
COPY char(8) No --
RPC AveragedLatency(RPC_AVERAGED_LATENCY)
Average amount of timespent in a MAPI RPC inmilliseconds.
AVG double No --
RPC Operations/sec(RPC_OPERATIONS_PER_SEC)
RPC Operations/sec is thenumber of RPC operationsthat are processed eachsecond.
AVG double No --
RPC Requests(RPC_REQUESTS)
RPC Requests is thenumber of MAPI RPCsthat are currently inprogress.
AVG double No --
2-476 Working with RecordsHitachi Tuning Manager Application Reports Reference

Managed Store Information (PI_MSI)
View Name(Manager Name) Description Sum
Rule Format Delta
DataSour
ce
Search/sec(SEARCH_SEC)
Number of searchqueries/second receivedper database.
AVG double No --
Search Results/sec(SEARCH_RESULTS_SEC)
Number of searches persecond received for adatabase.
AVG double No --
SuccessfulSearch/sec(SUCCESSFUL_SEARCH_SEC)
Number of successfulsearches/second receivedper database.
AVG double No --
User Count(USER_COUNT)
User Count is the numberof users connected to theservice.
AVG double No --
MSExchangeIS (PI)
Function
The MSExchangeIS (PI) record stores performance data, taken at specificintervals, about the information store.
Note: For Microsoft Exchange Server 2013, this record is reserved andcannot be used.
Table 2-256 MSExchangeIS (PI) Default and Changeable Values
Item Default Value Changeable?
Collection Interval 60 Yes
Collection Offset 0
Log Yes
LOGIF (Blank)
Key Fields
None
Lifetime
From starting to stopping of the Microsoft Exchange Server service
Working with Records 2-477Hitachi Tuning Manager Application Reports Reference

Record Size
• Fixed part: 785 bytes• Variable part: 0 bytes
Table 2-257 MSExchangeIS (PI) Fields
MSExchangeIS (PI)
View Name(Manager Name) Description Sum
Rule Format Delta
DataSource
Active User Count(ACTIVE_USER_COUNT)
Number of userconnections that haveshown some activity inthe last 10 minutes.
AVG double No --
Connection Count(CONNECTION_COUNT)
Connection Count is thenumber of clientprocesses connected tothe information store.
AVG double No --
ExchmemAdditional Heaps(EXCHMEM_ADDITIONAL_HEAPS)
The number ofExchmem heapscreated byMSExchangeIS afterstartup.
AVG double No --
Exchmem Heapswith Memory Errors(EXCHMEM_HEAPS_WITH_MEMORY_ERR)
The total number ofExchmem heaps thatfailed allocations due toinsufficient availablememory.
AVG double No --
Exchmem MemoryErrors(EXCHMEM_MEMORY_ERR)
The total number ofExchmem allocationsthat could not besatisfied by availablememory.
AVG double No --
Interval(INTERVAL)
Interval, in seconds,over which theinformation wascollected.
COPY ulong No RECORD_TIME -CURRENT_SYSTEM_BOOT_TIME
Record Time(RECORD_TIME)
Greenwich mean timeat which the record wascreated.
COPY time_t No --
Record Type(INPUT_RECORD_TYPE)
Record type identifier;always "PI".
COPY char(8) No --
RPC AveragedLatency(RPC_AVERAGED_LATENCY)
RPC latency inmilliseconds averagedfor the past 1024packets.
AVG double No --
2-478 Working with RecordsHitachi Tuning Manager Application Reports Reference
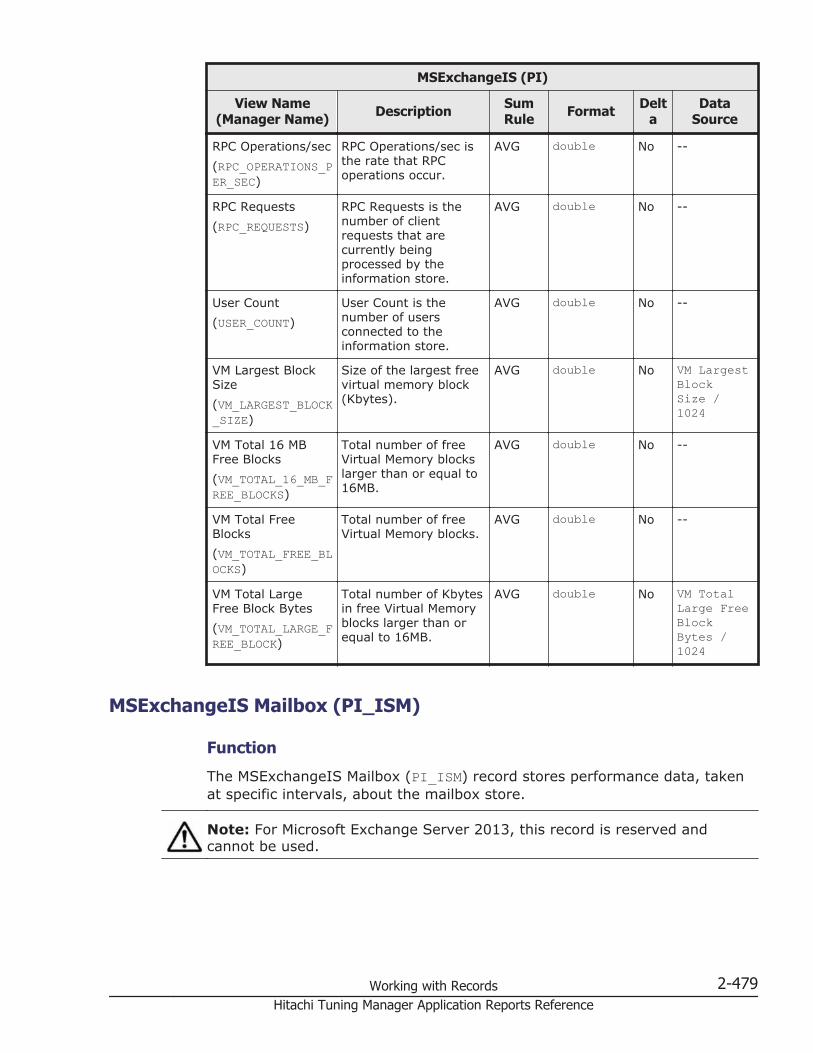
MSExchangeIS (PI)
View Name(Manager Name) Description Sum
Rule Format Delta
DataSource
RPC Operations/sec(RPC_OPERATIONS_PER_SEC)
RPC Operations/sec isthe rate that RPCoperations occur.
AVG double No --
RPC Requests(RPC_REQUESTS)
RPC Requests is thenumber of clientrequests that arecurrently beingprocessed by theinformation store.
AVG double No --
User Count(USER_COUNT)
User Count is thenumber of usersconnected to theinformation store.
AVG double No --
VM Largest BlockSize(VM_LARGEST_BLOCK_SIZE)
Size of the largest freevirtual memory block(Kbytes).
AVG double No VM LargestBlockSize /1024
VM Total 16 MBFree Blocks(VM_TOTAL_16_MB_FREE_BLOCKS)
Total number of freeVirtual Memory blockslarger than or equal to16MB.
AVG double No --
VM Total FreeBlocks(VM_TOTAL_FREE_BLOCKS)
Total number of freeVirtual Memory blocks.
AVG double No --
VM Total LargeFree Block Bytes(VM_TOTAL_LARGE_FREE_BLOCK)
Total number of Kbytesin free Virtual Memoryblocks larger than orequal to 16MB.
AVG double No VM TotalLarge FreeBlockBytes /1024
MSExchangeIS Mailbox (PI_ISM)
Function
The MSExchangeIS Mailbox (PI_ISM) record stores performance data, takenat specific intervals, about the mailbox store.
Note: For Microsoft Exchange Server 2013, this record is reserved andcannot be used.
Working with Records 2-479Hitachi Tuning Manager Application Reports Reference

Table 2-258 MSExchangeIS Mailbox (PI_ISM) Default and ChangeableValues
Item Default Value Changeable?
Collection Interval 60 Yes
Collection Offset 0
Log Yes
LOGIF (Blank)
Key Fields
None
Lifetime
From starting to stopping of the Microsoft Exchange Server service
Record Size
• Fixed part: 841 bytes• Variable part: 0 bytes
Table 2-259 MSExchangeIS Mailbox (PI_ISM) Fields
MSExchangeIS Mailbox (PI_ISM)
View Name(Manager Name) Description Sum
Rule Format Delta
DataSource
Average DeliveryTime(AVERAGE_DELIVERY_TIME)
Average Delivery Timeis the average time inmilliseconds betweenthe submission of amessage to themailbox store and thedelivery to all localrecipients (recipientson the same server) forthe last 10 messages.
AVG double No --
Folder Opens/sec(FOLDER_OPENS_PER_SEC)
Folder opens/sec is therate that requests toopen folders aresubmitted to theinformation store.
AVG double No --
Interval(INTERVAL)
Interval, in seconds,over which theinformation wascollected.
COPY ulong No RECORD_TIME -CURRENT_SYSTEM_BOOT_TIME
2-480 Working with RecordsHitachi Tuning Manager Application Reports Reference

MSExchangeIS Mailbox (PI_ISM)
View Name(Manager Name) Description Sum
Rule Format Delta
DataSource
Message Opens/sec(MESSAGE_OPENS_PER_SEC)
Message Opens/sec isthe rate that requeststo open messages aresubmitted to theinformation store.
AVG double No --
MessagesSubmitted(MESSAGES_SUBMITTED)
Messages Submitted isthe total number ofmessages submitted byclients since servicestartup.
AVG double No --
MessagesSubmitted/min(MESSAGES_SUBMITTED_MIN)
MessagesSubmitted/min is therate that messages aresubmitted by clients.
AVG double No MessageSubmitted/sec * 60
Message RecipientsDelivered/min(MSG_RECIPIENTS_DELIVERED_PER_MIN)
Message RecipientsDelivered/min is therate that recipientsreceive messages.
AVG double No MessageRecipientsDelivered/sec * 60
Receive Queue Size(RECEIVE_QUEUE_SIZE)
This field is reservedand cannot be used.
-- -- -- --
Record Time(RECORD_TIME)
Greenwich mean timeat which the record wascreated.
COPY time_t No --
Record Type(INPUT_RECORD_TYPE)
Record type identifier;always "ISM".
COPY char(8) No --
Send Queue Size(SEND_QUEUE_SIZE)
Send Queue Size is thenumber of messages inthe mailbox store'ssend queue.Note: For MicrosoftExchange Server 2007or later, this fieldcannot be usedbecause it is reserved.
AVG double No Send QueueSize
MSExchangeIS Public (PI_ISP)
Function
The MSExchangeIS Public (PI_ISP) record stores performance data, taken atspecific intervals, about the public store.
Working with Records 2-481Hitachi Tuning Manager Application Reports Reference

Note: For Microsoft Exchange Server 2013, this record is reserved andcannot be used.
Table 2-260 MSExchangeIS Public (PI_ISP) Default and ChangeableValues
Item Default Value Changeable?
Collection Interval 60 Yes
Collection Offset 0
Log Yes
LOGIF (Blank)
Key Fields
None
Lifetime
From starting to stopping of the Microsoft Exchange Server service
Record Size
• Fixed part: 841 bytes• Variable part: 0 bytes
Table 2-261 MSExchangeIS Public (PI_ISP) Fields
MSExchangeIS Public (PI_ISP)
View Name(Manager Name) Description Sum
Rule Format Delta
DataSource
Average DeliveryTime(AVERAGE_DELIVERY_TIME)
Average Delivery Timeis the average time inmilliseconds betweenthe submission of amessage to the publicstore and the deliveryto all local recipients(recipients on the sameserver) for the last 10messages.
AVG double No --
Folder Opens/sec(FOLDER_OPENS_PER_SEC)
Folder opens/sec is therate that requests toopen folders aresubmitted to theinformation store.
AVG double No --
Interval(INTERVAL)
Interval, in seconds,over which the
COPY ulong No RECORD_TIME -CURRENT_SY
2-482 Working with RecordsHitachi Tuning Manager Application Reports Reference
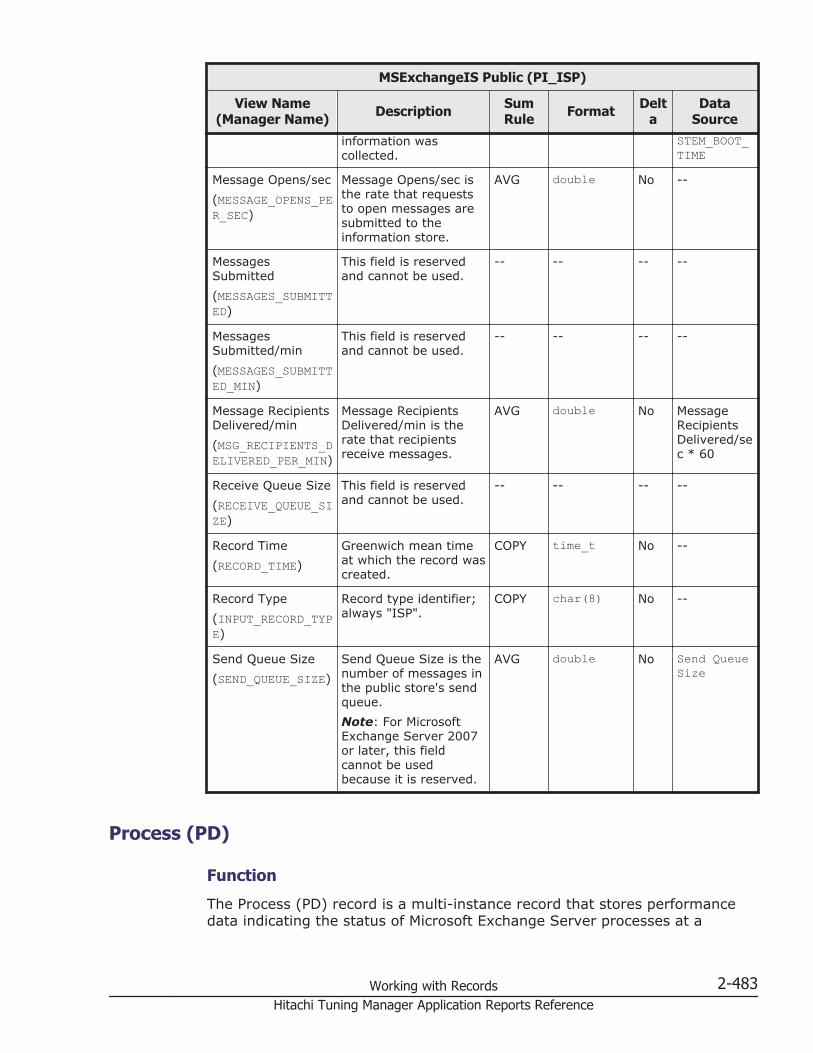
MSExchangeIS Public (PI_ISP)
View Name(Manager Name) Description Sum
Rule Format Delta
DataSource
information wascollected.
STEM_BOOT_TIME
Message Opens/sec(MESSAGE_OPENS_PER_SEC)
Message Opens/sec isthe rate that requeststo open messages aresubmitted to theinformation store.
AVG double No --
MessagesSubmitted(MESSAGES_SUBMITTED)
This field is reservedand cannot be used.
-- -- -- --
MessagesSubmitted/min(MESSAGES_SUBMITTED_MIN)
This field is reservedand cannot be used.
-- -- -- --
Message RecipientsDelivered/min(MSG_RECIPIENTS_DELIVERED_PER_MIN)
Message RecipientsDelivered/min is therate that recipientsreceive messages.
AVG double No MessageRecipientsDelivered/sec * 60
Receive Queue Size(RECEIVE_QUEUE_SIZE)
This field is reservedand cannot be used.
-- -- -- --
Record Time(RECORD_TIME)
Greenwich mean timeat which the record wascreated.
COPY time_t No --
Record Type(INPUT_RECORD_TYPE)
Record type identifier;always "ISP".
COPY char(8) No --
Send Queue Size(SEND_QUEUE_SIZE)
Send Queue Size is thenumber of messages inthe public store's sendqueue.Note: For MicrosoftExchange Server 2007or later, this fieldcannot be usedbecause it is reserved.
AVG double No Send QueueSize
Process (PD)
Function
The Process (PD) record is a multi-instance record that stores performancedata indicating the status of Microsoft Exchange Server processes at a
Working with Records 2-483Hitachi Tuning Manager Application Reports Reference

specific point in time. For Microsoft Exchange Server 2007 or MicrosoftExchange Server 2010, the relevant processes are store.exe and mad.exe.For Microsoft Exchange Server 2013, the relevant processes areMicrosoft.Exchange.Store.Service.exe andMicrosoft.Exchange.Store.Worker.exe. There are as manyMicrosoft.Exchange.Store.Worker processes as there are mailboxdatabases.
Table 2-262 Process (PD) Default and Changeable Values
Item Default Value Changeable?
Collection Interval 60 Yes
Collection Offset 0
Log No
LOGIF (Blank)
Key Fields
Process Name (PROCESS_NAME)
Lifetime
From starting to stopping of the Microsoft Exchange Server service
Record Size
• Fixed part: 681 bytes• Variable part: 300 bytes
Table 2-263 Process (PD) Fields
Process (PD)
View Name(Manager Name) Description Sum
Rule Format Delta
DataSource
% Processor Time(PERCENT_PROCESSOR_TIME)
% Processor Time isthe percentage ofelapsed time that all ofprocess threads usedthe processor toexecution instructions.An instruction is thebasic unit of executionin a computer, a threadis the object thatexecutes instructions,and a process is theobject created when aprogram is run. Codeexecuted to handlesome hardware
-- double No --
2-484 Working with RecordsHitachi Tuning Manager Application Reports Reference

Process (PD)
View Name(Manager Name) Description Sum
Rule Format Delta
DataSource
interrupts and trapconditions are includedin this count.
Elapsed Time(ELAPSED_TIME)
The total elapsed time,in seconds, that thisprocess has beenrunning.
-- double No --
Interval(INTERVAL)
Interval, in seconds,over which theinformation wascollected.
-- ulong No RECORD_TIME -CURRENT_SYSTEM_BOOT_TIME
Page Faults/sec(PAGE_FAULTS_PER_SEC)
Page Faults/sec is therate at which pagefaults by the threadsexecuting in thisprocess are occurring.A page fault occurswhen a thread refers toa virtual memory pagethat is not in itsworking set in mainmemory. This may notcause the page to befetched from disk if it ison the standby list andhence already in mainmemory, or if it is inuse by another processwith whom the page isshared.
-- double No --
Page File Bytes(PAGE_FILE_BYTES)
Page File Bytes is thecurrent amount ofvirtual memory, inKbytes, that thisprocess has reservedfor use in the pagingfile(s). Paging files areused to store pages ofmemory used by theprocess that are notcontained in other files.Paging files are sharedby all processes, andthe lack of space inpaging files canprevent otherprocesses fromallocating memory. Ifthere is no paging file,this counter reflects thecurrent amount of
-- double No Page FileBytes /1024
Working with Records 2-485Hitachi Tuning Manager Application Reports Reference
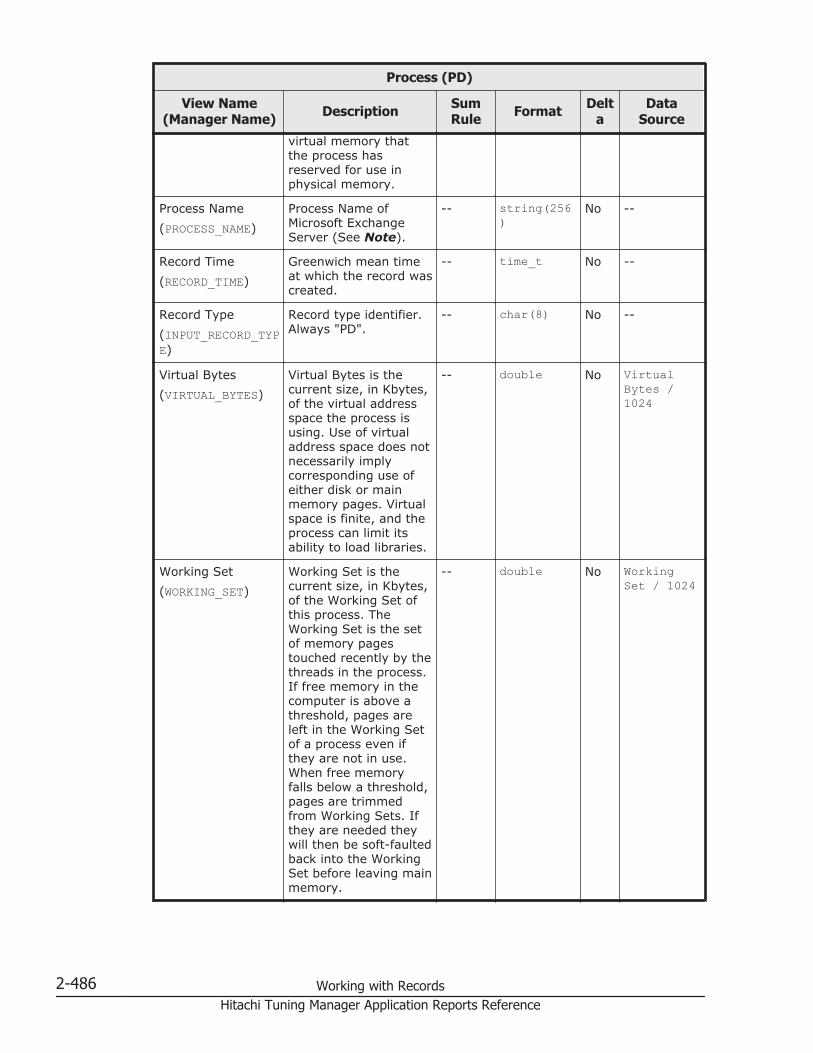
Process (PD)
View Name(Manager Name) Description Sum
Rule Format Delta
DataSource
virtual memory thatthe process hasreserved for use inphysical memory.
Process Name(PROCESS_NAME)
Process Name ofMicrosoft ExchangeServer (See Note).
-- string(256)
No --
Record Time(RECORD_TIME)
Greenwich mean timeat which the record wascreated.
-- time_t No --
Record Type(INPUT_RECORD_TYPE)
Record type identifier.Always "PD".
-- char(8) No --
Virtual Bytes(VIRTUAL_BYTES)
Virtual Bytes is thecurrent size, in Kbytes,of the virtual addressspace the process isusing. Use of virtualaddress space does notnecessarily implycorresponding use ofeither disk or mainmemory pages. Virtualspace is finite, and theprocess can limit itsability to load libraries.
-- double No VirtualBytes /1024
Working Set(WORKING_SET)
Working Set is thecurrent size, in Kbytes,of the Working Set ofthis process. TheWorking Set is the setof memory pagestouched recently by thethreads in the process.If free memory in thecomputer is above athreshold, pages areleft in the Working Setof a process even ifthey are not in use.When free memoryfalls below a threshold,pages are trimmedfrom Working Sets. Ifthey are needed theywill then be soft-faultedback into the WorkingSet before leaving mainmemory.
-- double No WorkingSet / 1024
2-486 Working with RecordsHitachi Tuning Manager Application Reports Reference
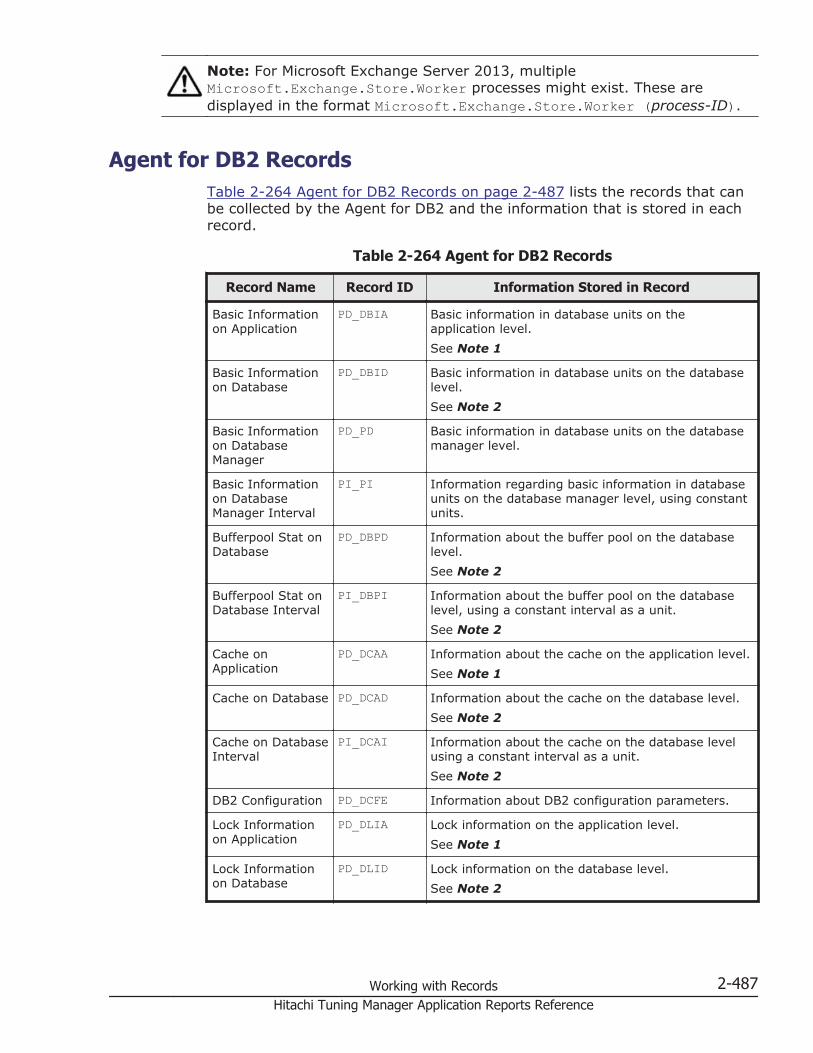
Note: For Microsoft Exchange Server 2013, multipleMicrosoft.Exchange.Store.Worker processes might exist. These aredisplayed in the format Microsoft.Exchange.Store.Worker (process-ID).
Agent for DB2 RecordsTable 2-264 Agent for DB2 Records on page 2-487 lists the records that canbe collected by the Agent for DB2 and the information that is stored in eachrecord.
Table 2-264 Agent for DB2 Records
Record Name Record ID Information Stored in Record
Basic Informationon Application
PD_DBIA Basic information in database units on theapplication level.See Note 1
Basic Informationon Database
PD_DBID Basic information in database units on the databaselevel.See Note 2
Basic Informationon DatabaseManager
PD_PD Basic information in database units on the databasemanager level.
Basic Informationon DatabaseManager Interval
PI_PI Information regarding basic information in databaseunits on the database manager level, using constantunits.
Bufferpool Stat onDatabase
PD_DBPD Information about the buffer pool on the databaselevel.See Note 2
Bufferpool Stat onDatabase Interval
PI_DBPI Information about the buffer pool on the databaselevel, using a constant interval as a unit.See Note 2
Cache onApplication
PD_DCAA Information about the cache on the application level.See Note 1
Cache on Database PD_DCAD Information about the cache on the database level.See Note 2
Cache on DatabaseInterval
PI_DCAI Information about the cache on the database levelusing a constant interval as a unit.See Note 2
DB2 Configuration PD_DCFE Information about DB2 configuration parameters.
Lock Informationon Application
PD_DLIA Lock information on the application level.See Note 1
Lock Informationon Database
PD_DLID Lock information on the database level.See Note 2
Working with Records 2-487Hitachi Tuning Manager Application Reports Reference
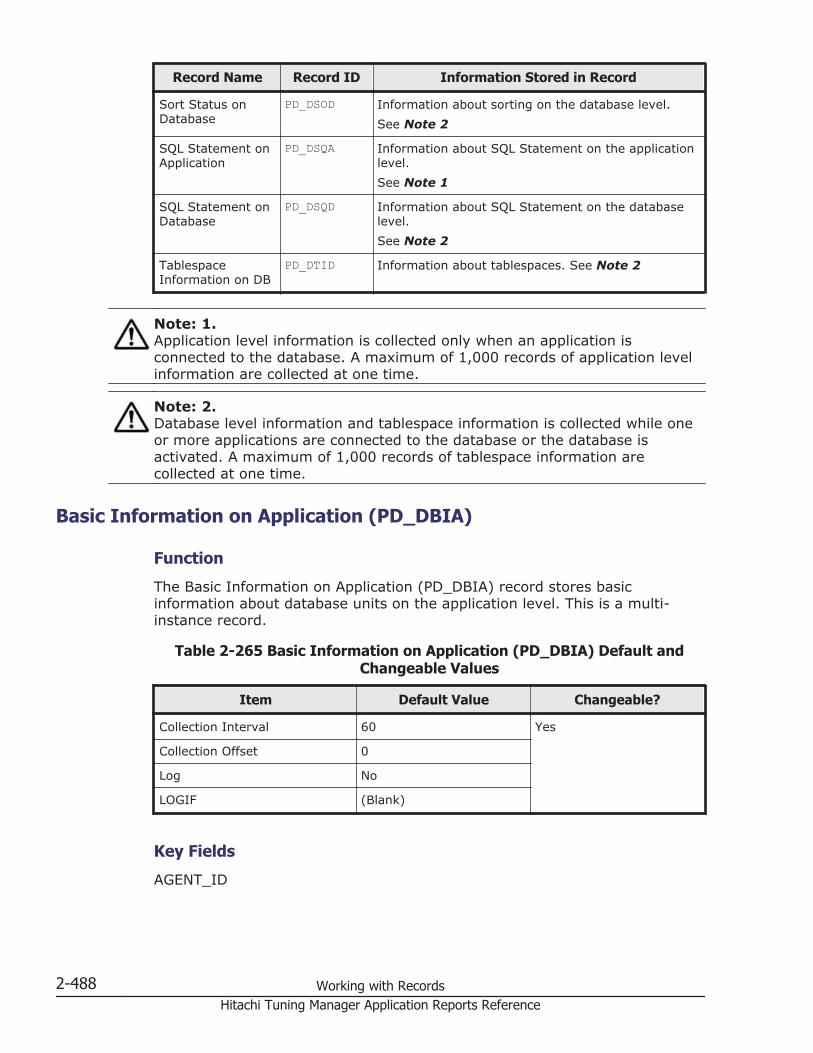
Record Name Record ID Information Stored in Record
Sort Status onDatabase
PD_DSOD Information about sorting on the database level.See Note 2
SQL Statement onApplication
PD_DSQA Information about SQL Statement on the applicationlevel.See Note 1
SQL Statement onDatabase
PD_DSQD Information about SQL Statement on the databaselevel.See Note 2
TablespaceInformation on DB
PD_DTID Information about tablespaces. See Note 2
Note: 1.Application level information is collected only when an application isconnected to the database. A maximum of 1,000 records of application levelinformation are collected at one time.
Note: 2.Database level information and tablespace information is collected while oneor more applications are connected to the database or the database isactivated. A maximum of 1,000 records of tablespace information arecollected at one time.
Basic Information on Application (PD_DBIA)
Function
The Basic Information on Application (PD_DBIA) record stores basicinformation about database units on the application level. This is a multi-instance record.
Table 2-265 Basic Information on Application (PD_DBIA) Default andChangeable Values
Item Default Value Changeable?
Collection Interval 60 Yes
Collection Offset 0
Log No
LOGIF (Blank)
Key Fields
AGENT_ID
2-488 Working with RecordsHitachi Tuning Manager Application Reports Reference

Lifetime
While an application is connected to the database.
Record Size
• Fixed part: 681 bytes• Variable part: 629 bytes
Table 2-266 Basic Information on Application (PD_DBIA) Fields
Basic Information on Application (PD_DBIA)
View Name(Manager
Name)Description Sum
RuleForma
tDelt
a
Supported
Versions
Restriction
DataSource
Agent Id(AGENT_ID)
Applicationspecific ID.
-- ulong No All -- SQLM_ELM_AGENT_ID
Agents Top(AGENTS_TOP)
On theapplicationlevel, themaximumnumber ofagents usedwhenexecuting astatement. Onthe databaselevel, themaximumnumber ofagents for anapplication.
-- ulong No All -- SQLM_ELM_AGENTS_TOP
Appl Id(APPL_ID)
ID for anapplicationwhen itconnects to adatabase ofthe databasemanager.
-- string(33)
No All -- SQLM_ELM_APPL_ID
Appl Name(APPL_NAME)
Name of theapplicationthat is beingexecuted onthe client.
-- string(257)
No All -- SQLM_ELM_APPL_NAME
Appl SectionInserts(APPL_SECTION_INSERTS)
Number ofinserted SQLsections byapplications inan SQL workarea.
-- ulong No All -- SQLM_ELM_APPL_SECTION_INSERTS
Working with Records 2-489Hitachi Tuning Manager Application Reports Reference

Basic Information on Application (PD_DBIA)
View Name(Manager
Name)Description Sum
RuleForma
tDelt
a
Supported
Versions
Restriction
DataSource
Appl SectionLookups(APPL_SECTION_LOOKUPS)
Number ofSQL sectionreferences byapplicationsfrom the SQLwork area.
-- ulong No All -- SQLM_ELM_APPL_SECTION_LOOKUPS
Auth Id(AUTH_ID)
AuthorizationID of the userwho has calledthe applicationthat is beingmonitored.
-- string(33)
No All -- SQLM_ELM_AUTH_ID
DB Name(DB_NAME)
Real name ofthe databasewhere theinformation iscollected, orreal name ofthe databaseat theapplicationconnectiontarget.
-- string(9)
No All -- SQLM_ELM_DB_NAME
DB Path(DB_PATH)
Absolute pathto the locationof thedatabasestored on themonitoring-target system.
-- string(257)
No All -- SQLM_ELM_DB_PATH
Hash JoinOverflows(HASH_JOIN_OVERFLOWS)
Number oftimes hashjoin dataexceeded theusable sortheap space.
-- ulong No All -- SQLM_ELM_HASH_JOIN_OVERFLOWS
Hash JoinOverflowsRate(HASH_JOIN_OVERFLOWS_RATE)
Ratio ofhash_join_small_overflows tohash_join_overflows.
-- float No All -- ( HASH_JOIN_SMALL_OVERFLOWS /HASH_JOIN_OVERFLOWS) *100
Hash JoinSmallOverflows
Number oftimes hashjoin dataexceeded theusable sort
-- ulong No All -- SQLM_ELM_HASH_JOIN_SMALL_OVERFLOWS
2-490 Working with RecordsHitachi Tuning Manager Application Reports Reference

Basic Information on Application (PD_DBIA)
View Name(Manager
Name)Description Sum
RuleForma
tDelt
a
Supported
Versions
Restriction
DataSource
(HASH_JOIN_SMALL_OVERFLOWS)
heap spacewithoutexceeding10%.
Interval(INTERVAL)
Time forinformationcollected, inseconds.
-- ulong No All -- RECORD_TIME -CURRENT_SYSTEM_BOOT_TIME
Num AssocAgents(NUM_ASSOC_AGENTS)
Number ofsubagentsassociatedwith oneapplication.
-- ulong No All -- SQLM_ELM_NUM_ASSOC_AGENTS
Record Time(RECORD_TIME)
Collection endtime for theperformancedata stored inthe record.
-- time_t No All -- AgentCollector
Record Type(INPUT_RECORD_TYPE)
Record name.This is alwaysDBIA.
-- char(8)
No All -- AgentCollector
Total HashJoins(TOTAL_HASH_JOINS)
Total numberof executedhash joins.
-- ulong No All -- SQLM_ELM_TOTAL_HASH_JOINS
Total HashLoops(TOTAL_HASH_LOOPS)
Total numberof times thatthe singlepartition of thehash join waslarger than theusable sortheap space.
-- ulong No All -- SQLM_ELM_TOTAL_HASH_LOOPS
Basic Information on Database (PD_DBID)
Function
The Basic Information on Database (PD_DBID) record stores basicinformation about database units on the database level.
Working with Records 2-491Hitachi Tuning Manager Application Reports Reference

Table 2-267 Basic Information on Database (PD_DBID) Default andChangeable Values
Item Default Value Changeable?
Collection Interval 60 Yes
Collection Offset 0
Log No
LOGIF (Blank)
Key Fields
None
Lifetime
While one or more applications are connected to the database or thedatabase is activated.
Record Size
• Fixed part: 1,038 bytes• Variable part: 0 bytes
Table 2-268 Basic Information on Database (PD_DBID) Fields
Basic Information on Database (PD_DBID)
View Name(Manager
Name)Description Sum
RuleForma
tDelt
a
Supported
Versions
Restriction
DataSource
Agents Top(AGENTS_TOP)
On theapplicationlevel, themaximumnumber ofagents usedwhenexecuting astatement. Ondatabaselevel, themaximumnumber ofagents for anapplication.
-- ulong No All -- SQLM_ELM_AGENTS_TOP
Appl SectionInserts
Number ofSQL sectioninserts byapplications
-- ulong No All -- SQLM_ELM_APPL_SECTION_INSERTS
2-492 Working with RecordsHitachi Tuning Manager Application Reports Reference
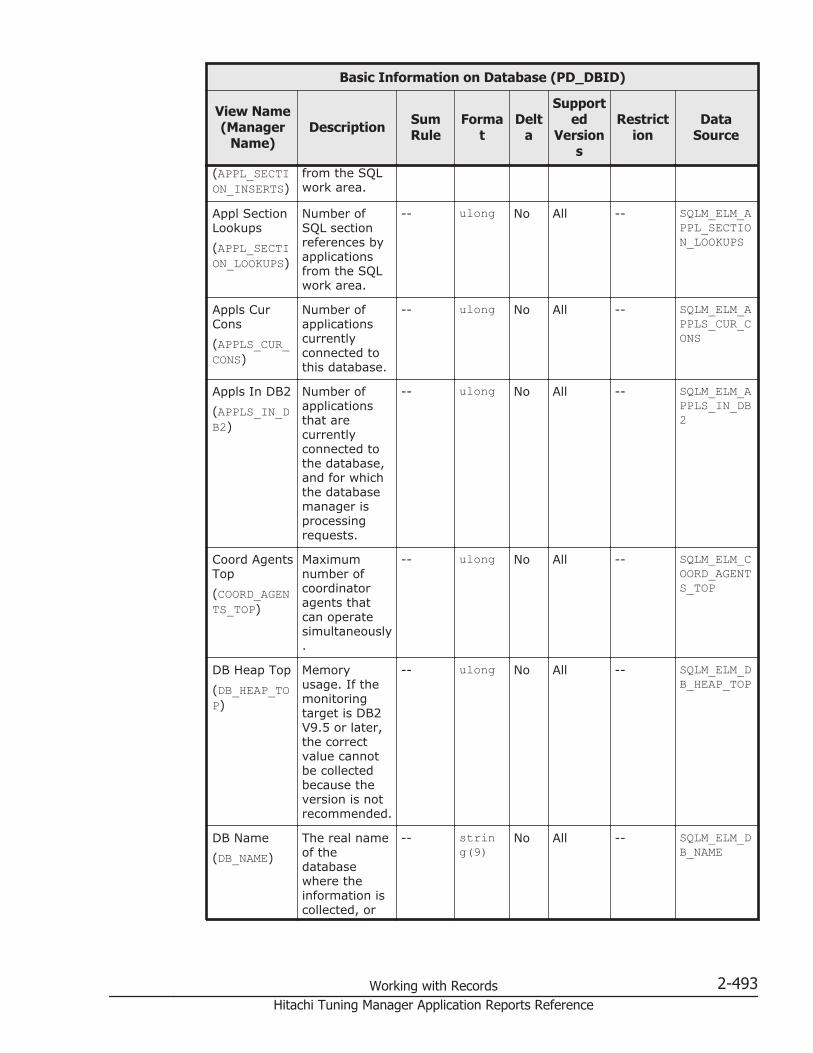
Basic Information on Database (PD_DBID)
View Name(Manager
Name)Description Sum
RuleForma
tDelt
a
Supported
Versions
Restriction
DataSource
(APPL_SECTION_INSERTS)
from the SQLwork area.
Appl SectionLookups(APPL_SECTION_LOOKUPS)
Number ofSQL sectionreferences byapplicationsfrom the SQLwork area.
-- ulong No All -- SQLM_ELM_APPL_SECTION_LOOKUPS
Appls CurCons(APPLS_CUR_CONS)
Number ofapplicationscurrentlyconnected tothis database.
-- ulong No All -- SQLM_ELM_APPLS_CUR_CONS
Appls In DB2(APPLS_IN_DB2)
Number ofapplicationsthat arecurrentlyconnected tothe database,and for whichthe databasemanager isprocessingrequests.
-- ulong No All -- SQLM_ELM_APPLS_IN_DB2
Coord AgentsTop(COORD_AGENTS_TOP)
Maximumnumber ofcoordinatoragents thatcan operatesimultaneously.
-- ulong No All -- SQLM_ELM_COORD_AGENTS_TOP
DB Heap Top(DB_HEAP_TOP)
Memoryusage. If themonitoringtarget is DB2V9.5 or later,the correctvalue cannotbe collectedbecause theversion is notrecommended.
-- ulong No All -- SQLM_ELM_DB_HEAP_TOP
DB Name(DB_NAME)
The real nameof thedatabasewhere theinformation iscollected, or
-- string(9)
No All -- SQLM_ELM_DB_NAME
Working with Records 2-493Hitachi Tuning Manager Application Reports Reference
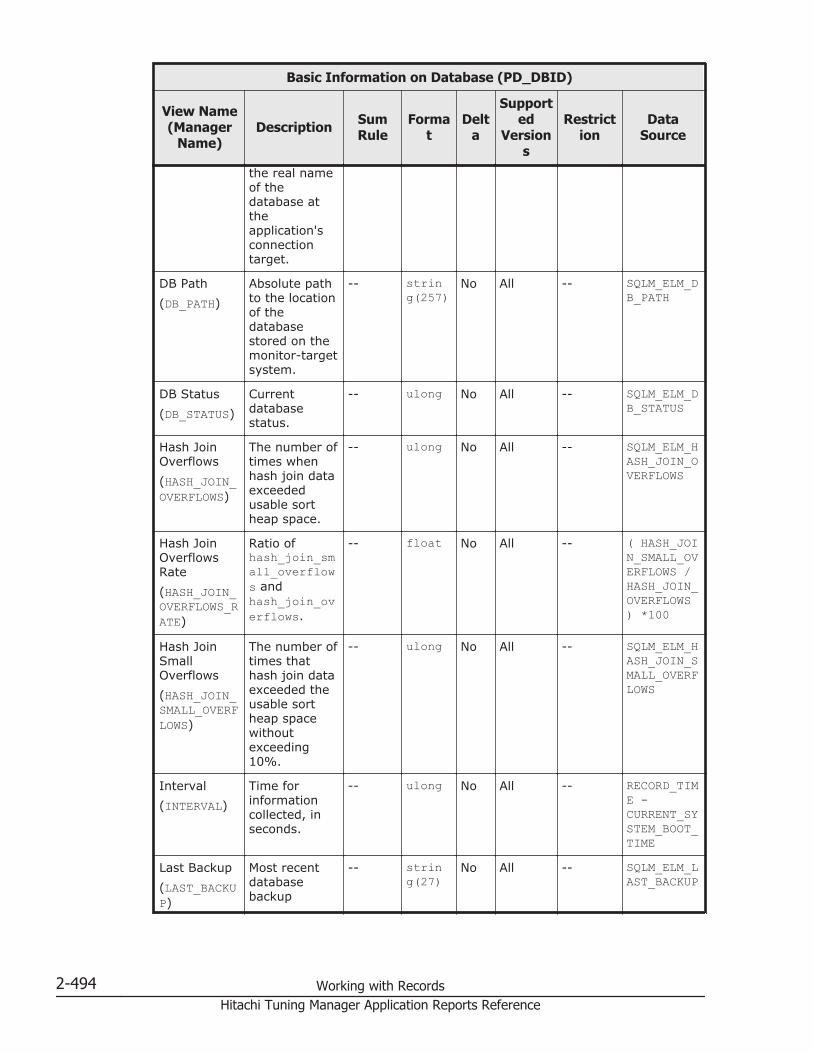
Basic Information on Database (PD_DBID)
View Name(Manager
Name)Description Sum
RuleForma
tDelt
a
Supported
Versions
Restriction
DataSource
the real nameof thedatabase attheapplication'sconnectiontarget.
DB Path(DB_PATH)
Absolute pathto the locationof thedatabasestored on themonitor-targetsystem.
-- string(257)
No All -- SQLM_ELM_DB_PATH
DB Status(DB_STATUS)
Currentdatabasestatus.
-- ulong No All -- SQLM_ELM_DB_STATUS
Hash JoinOverflows(HASH_JOIN_OVERFLOWS)
The number oftimes whenhash join dataexceededusable sortheap space.
-- ulong No All -- SQLM_ELM_HASH_JOIN_OVERFLOWS
Hash JoinOverflowsRate(HASH_JOIN_OVERFLOWS_RATE)
Ratio ofhash_join_small_overflows andhash_join_overflows.
-- float No All -- ( HASH_JOIN_SMALL_OVERFLOWS /HASH_JOIN_OVERFLOWS) *100
Hash JoinSmallOverflows(HASH_JOIN_SMALL_OVERFLOWS)
The number oftimes thathash join dataexceeded theusable sortheap spacewithoutexceeding10%.
-- ulong No All -- SQLM_ELM_HASH_JOIN_SMALL_OVERFLOWS
Interval(INTERVAL)
Time forinformationcollected, inseconds.
-- ulong No All -- RECORD_TIME -CURRENT_SYSTEM_BOOT_TIME
Last Backup(LAST_BACKUP)
Most recentdatabasebackup
-- string(27)
No All -- SQLM_ELM_LAST_BACKUP
2-494 Working with RecordsHitachi Tuning Manager Application Reports Reference

Basic Information on Database (PD_DBID)
View Name(Manager
Name)Description Sum
RuleForma
tDelt
a
Supported
Versions
Restriction
DataSource
completiondate.
Num AssocAgents(NUM_ASSOC_AGENTS)
On theapplicationlevel, thenumber ofsubagentsassociatedwith oneapplication.On thedatabaselevel, the totalnumber ofsubagents forallapplications.
-- ulong No All -- SQLM_ELM_NUM_ASSOC_AGENTS
Record Time(RECORD_TIME)
Collection endtime for theperformancedata stored inthe record.
-- time_t No All -- AgentCollector
Record Type(INPUT_RECORD_TYPE)
Record name.This is alwaysDBID.
-- char(8)
No All -- AgentCollector
Total HashJoins(TOTAL_HASH_JOINS)
Total numberof executedhash joins.
-- ulong No All -- SQLM_ELM_TOTAL_HASH_JOINS
Total HashLoops(TOTAL_HASH_LOOPS)
The totalnumber oftimes whenthe singlepartition of thehash join waslarger than theusable sortheap space.
-- ulong No All -- SQLM_ELM_TOTAL_HASH_LOOPS
Total LogAvailable(TOTAL_LOG_AVAILABLE)
The amount ofactive logspace (units:KB) that is notused by atransactionwithoutcommitment,in a database.
-- ulong No All Y SQLM_ELM_TOTAL_LOG_AVAILABLE
Working with Records 2-495Hitachi Tuning Manager Application Reports Reference
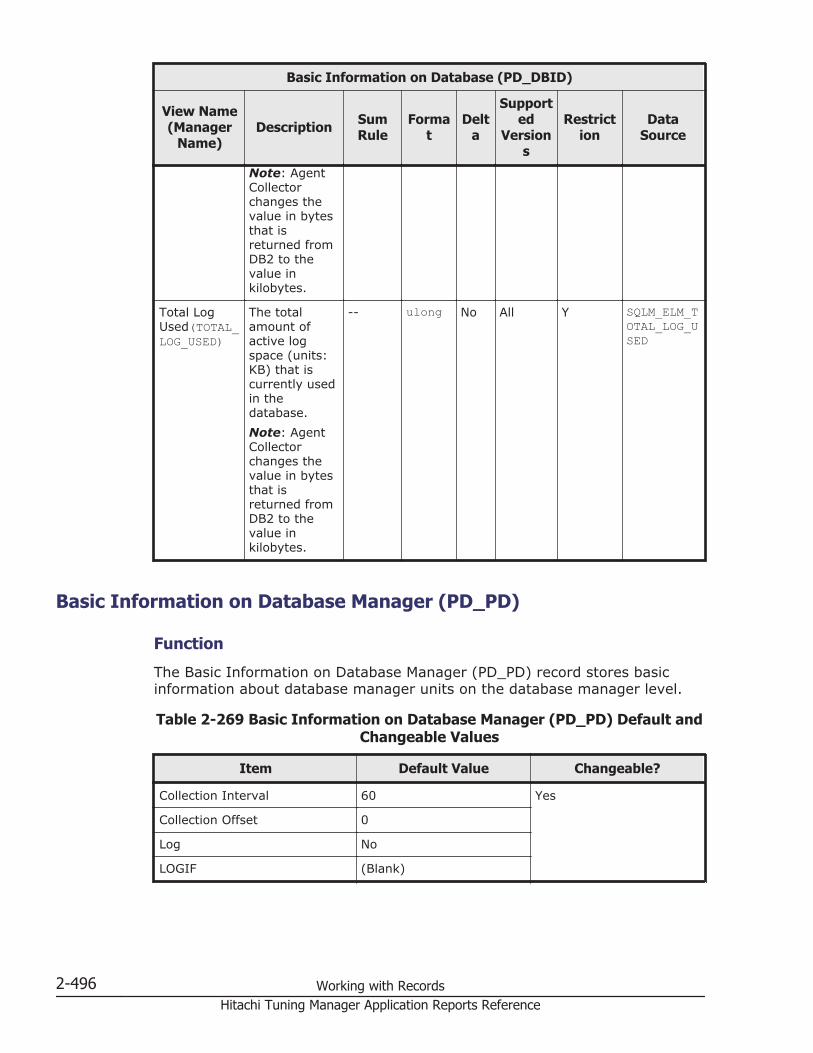
Basic Information on Database (PD_DBID)
View Name(Manager
Name)Description Sum
RuleForma
tDelt
a
Supported
Versions
Restriction
DataSource
Note: AgentCollectorchanges thevalue in bytesthat isreturned fromDB2 to thevalue inkilobytes.
Total LogUsed(TOTAL_LOG_USED)
The totalamount ofactive logspace (units:KB) that iscurrently usedin thedatabase.Note: AgentCollectorchanges thevalue in bytesthat isreturned fromDB2 to thevalue inkilobytes.
-- ulong No All Y SQLM_ELM_TOTAL_LOG_USED
Basic Information on Database Manager (PD_PD)
Function
The Basic Information on Database Manager (PD_PD) record stores basicinformation about database manager units on the database manager level.
Table 2-269 Basic Information on Database Manager (PD_PD) Default andChangeable Values
Item Default Value Changeable?
Collection Interval 60 Yes
Collection Offset 0
Log No
LOGIF (Blank)
2-496 Working with RecordsHitachi Tuning Manager Application Reports Reference

Key Fields
None
Lifetime
While the database is running.
Record Size
• Fixed part: 845 bytes• Variable part: 0 bytes
Table 2-270 Basic Information on Database Manager (PD_PD) Fields
Basic Information on Database Manager (PD_PD)
View Name(Manager
Name)Description Sum
RuleForma
tDelt
a
Supported
Versions
Restriction
DataSource
AgentsCreatedEmpty Pool(AGENTS_CREATED_EMPTY_POOL)
Number ofagents createddue to theagent poolbeing empty.
-- ulong No All -- SQLM_ELM_AGENTS_CREATED_EMPTY_POOL
AgentsCreated PoolRate(AGENTS_CREATED_POOL_RATE)
Frequencywith whichagents werecreated due tothe agent poolbeing empty.
-- float No All -- ( AGENTS_CREATED_EMPTY_POOL /AGENTS_FROM_POOL )*100
Agents FromPool(AGENTS_FROM_POOL)
The number ofagentsassigned fromthe agentpool.
-- ulong No All -- SQLM_ELM_AGENTS_FROM_POOL
AgentsRegistered(AGENTS_REGISTERED)
The number ofagents(coordinatoragents andsubagents)registeredwith themonitoreddatabasemanagerinstance.
-- ulong No All -- SQLM_ELM_AGENTS_REGISTERED
AgentsRegisteredTop
The maximumnumber ofagents(coordinator
-- ulong No All -- SQLM_ELM_AGENTS_REGISTERED_TOP
Working with Records 2-497Hitachi Tuning Manager Application Reports Reference
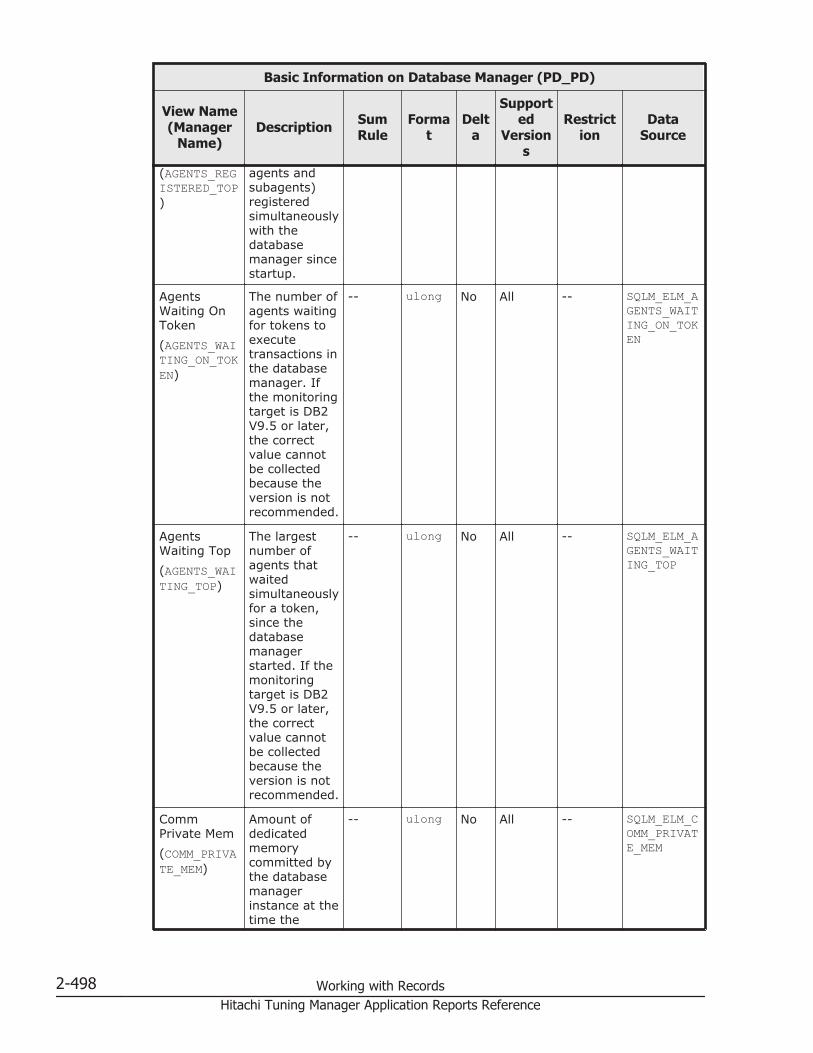
Basic Information on Database Manager (PD_PD)
View Name(Manager
Name)Description Sum
RuleForma
tDelt
a
Supported
Versions
Restriction
DataSource
(AGENTS_REGISTERED_TOP)
agents andsubagents)registeredsimultaneouslywith thedatabasemanager sincestartup.
AgentsWaiting OnToken(AGENTS_WAITING_ON_TOKEN)
The number ofagents waitingfor tokens toexecutetransactions inthe databasemanager. Ifthe monitoringtarget is DB2V9.5 or later,the correctvalue cannotbe collectedbecause theversion is notrecommended.
-- ulong No All -- SQLM_ELM_AGENTS_WAITING_ON_TOKEN
AgentsWaiting Top(AGENTS_WAITING_TOP)
The largestnumber ofagents thatwaitedsimultaneouslyfor a token,since thedatabasemanagerstarted. If themonitoringtarget is DB2V9.5 or later,the correctvalue cannotbe collectedbecause theversion is notrecommended.
-- ulong No All -- SQLM_ELM_AGENTS_WAITING_TOP
CommPrivate Mem(COMM_PRIVATE_MEM)
Amount ofdedicatedmemorycommitted bythe databasemanagerinstance at thetime the
-- ulong No All -- SQLM_ELM_COMM_PRIVATE_MEM
2-498 Working with RecordsHitachi Tuning Manager Application Reports Reference
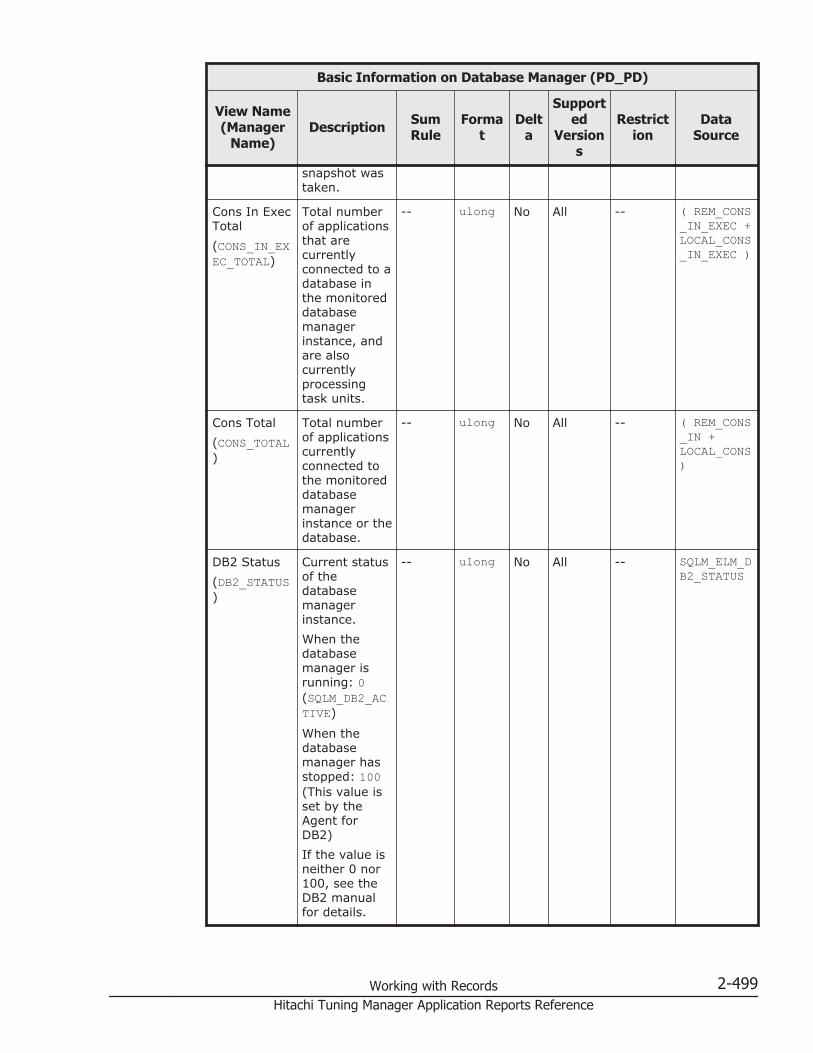
Basic Information on Database Manager (PD_PD)
View Name(Manager
Name)Description Sum
RuleForma
tDelt
a
Supported
Versions
Restriction
DataSource
snapshot wastaken.
Cons In ExecTotal(CONS_IN_EXEC_TOTAL)
Total numberof applicationsthat arecurrentlyconnected to adatabase inthe monitoreddatabasemanagerinstance, andare alsocurrentlyprocessingtask units.
-- ulong No All -- ( REM_CONS_IN_EXEC +LOCAL_CONS_IN_EXEC )
Cons Total(CONS_TOTAL)
Total numberof applicationscurrentlyconnected tothe monitoreddatabasemanagerinstance or thedatabase.
-- ulong No All -- ( REM_CONS_IN +LOCAL_CONS)
DB2 Status(DB2_STATUS)
Current statusof thedatabasemanagerinstance.When thedatabasemanager isrunning: 0(SQLM_DB2_ACTIVE)
When thedatabasemanager hasstopped: 100(This value isset by theAgent forDB2)If the value isneither 0 nor100, see theDB2 manualfor details.
-- ulong No All -- SQLM_ELM_DB2_STATUS
Working with Records 2-499Hitachi Tuning Manager Application Reports Reference

Basic Information on Database Manager (PD_PD)
View Name(Manager
Name)Description Sum
RuleForma
tDelt
a
Supported
Versions
Restriction
DataSource
Interval(INTERVAL)
Time for theinformationcollected, inseconds.
-- ulong No All -- RECORD_TIME -CURRENT_SYSTEM_BOOT_TIME
Local Cons(LOCAL_CONS)
Number oflocalapplicationscurrentlyconnected to adatabase inthe monitoreddatabasemanagerinstance.
-- ulong No All -- SQLM_ELM_LOCAL_CONS
Local ConsIn Exec(LOCAL_CONS_IN_EXEC)
Number oflocalapplicationsthat arecurrentlyconnected to adatabase inthe monitoreddatabasemanagerinstance, andare alsocurrentlyprocessingtask units.
-- ulong No All -- SQLM_ELM_LOCAL_CONS_IN_EXEC
PostThresholdHash Joins(POST_THRESHOLD_HASH_JOINS)
Total numberof times that ahash join heaprequest waslimitedbecause theshared ordedicated sortheap spacewasconcurrentlyused.
-- ulong No All -- SQLM_ELM_POST_THRESHOLD_HASH_JOINS
ProductName(PRODUCT_NAME)
Detailedversioninformation onthe currentlyexecuting DB2instance.
-- string(48)
No All -- SQLM_ELM_PRODUCT_NAME
2-500 Working with RecordsHitachi Tuning Manager Application Reports Reference
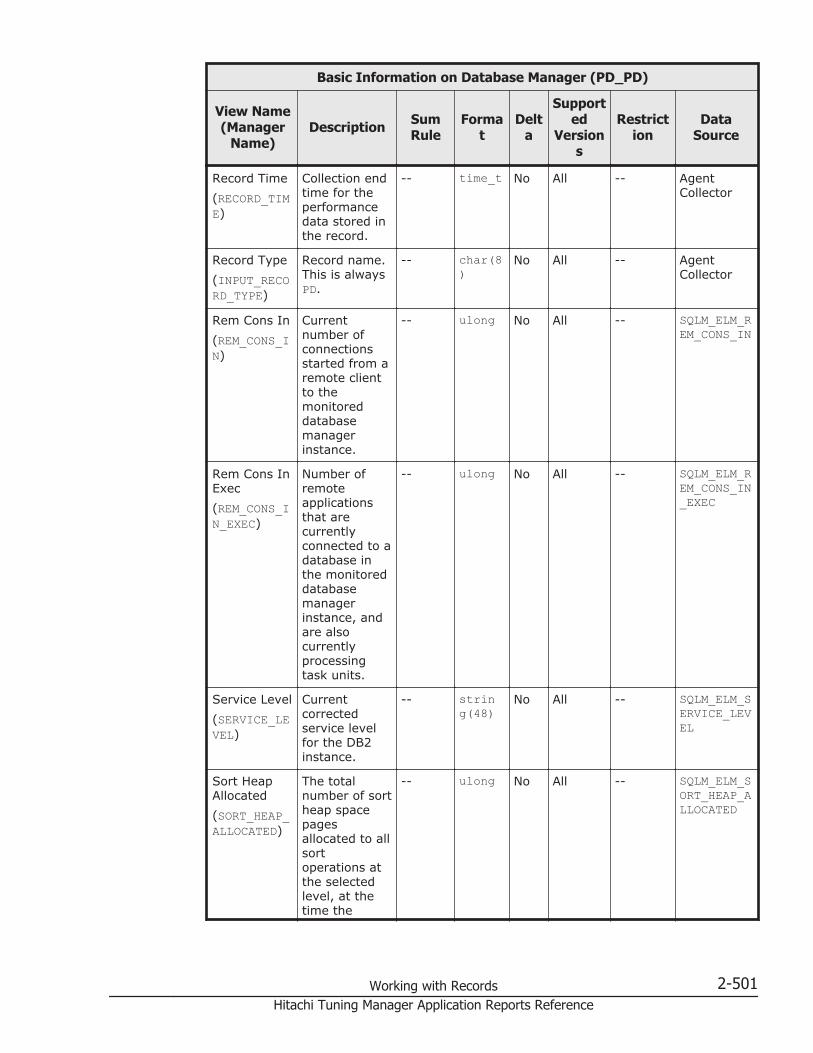
Basic Information on Database Manager (PD_PD)
View Name(Manager
Name)Description Sum
RuleForma
tDelt
a
Supported
Versions
Restriction
DataSource
Record Time(RECORD_TIME)
Collection endtime for theperformancedata stored inthe record.
-- time_t No All -- AgentCollector
Record Type(INPUT_RECORD_TYPE)
Record name.This is alwaysPD.
-- char(8)
No All -- AgentCollector
Rem Cons In(REM_CONS_IN)
Currentnumber ofconnectionsstarted from aremote clientto themonitoreddatabasemanagerinstance.
-- ulong No All -- SQLM_ELM_REM_CONS_IN
Rem Cons InExec(REM_CONS_IN_EXEC)
Number ofremoteapplicationsthat arecurrentlyconnected to adatabase inthe monitoreddatabasemanagerinstance, andare alsocurrentlyprocessingtask units.
-- ulong No All -- SQLM_ELM_REM_CONS_IN_EXEC
Service Level(SERVICE_LEVEL)
Currentcorrectedservice levelfor the DB2instance.
-- string(48)
No All -- SQLM_ELM_SERVICE_LEVEL
Sort HeapAllocated(SORT_HEAP_ALLOCATED)
The totalnumber of sortheap spacepagesallocated to allsortoperations atthe selectedlevel, at thetime the
-- ulong No All -- SQLM_ELM_SORT_HEAP_ALLOCATED
Working with Records 2-501Hitachi Tuning Manager Application Reports Reference
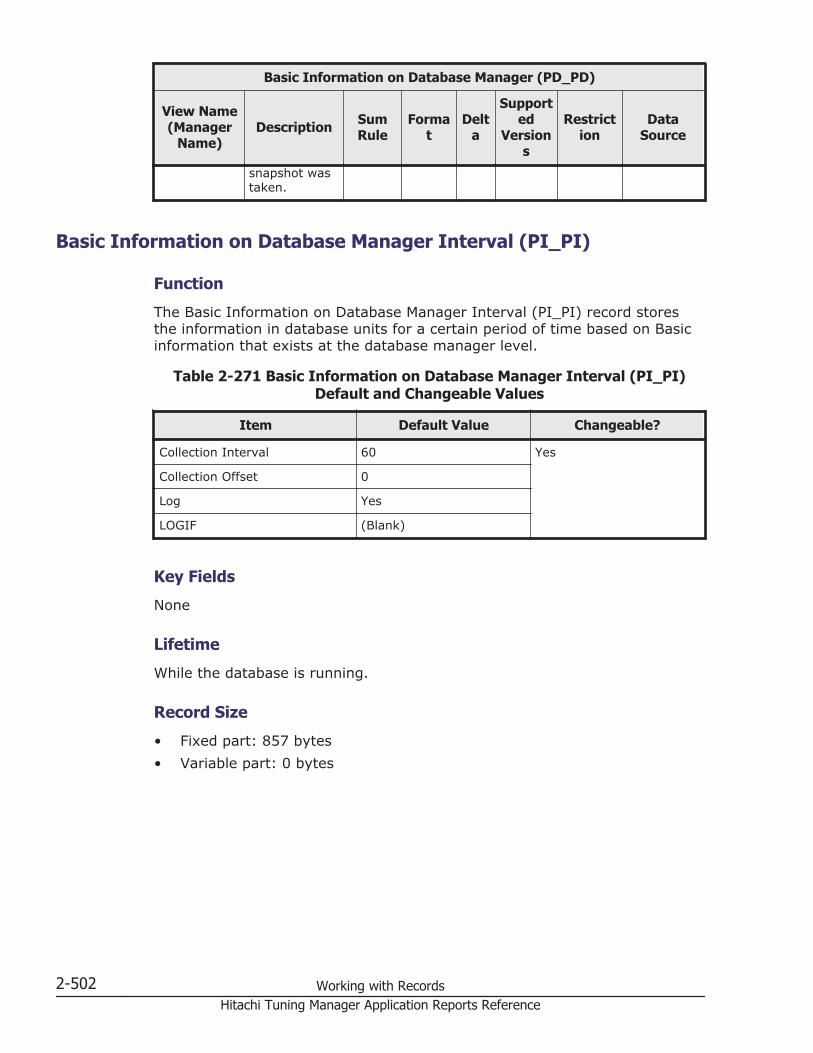
Basic Information on Database Manager (PD_PD)
View Name(Manager
Name)Description Sum
RuleForma
tDelt
a
Supported
Versions
Restriction
DataSource
snapshot wastaken.
Basic Information on Database Manager Interval (PI_PI)
Function
The Basic Information on Database Manager Interval (PI_PI) record storesthe information in database units for a certain period of time based on Basicinformation that exists at the database manager level.
Table 2-271 Basic Information on Database Manager Interval (PI_PI)Default and Changeable Values
Item Default Value Changeable?
Collection Interval 60 Yes
Collection Offset 0
Log Yes
LOGIF (Blank)
Key Fields
None
Lifetime
While the database is running.
Record Size
• Fixed part: 857 bytes• Variable part: 0 bytes
2-502 Working with RecordsHitachi Tuning Manager Application Reports Reference

Table 2-272 Basic Information on Database Manager Interval (PI_PI)Fields
Basic Information on Database Manager Interval (PI_PI)
View Name(Manager
Name)Description Sum
RuleForma
tDelt
a
Supported
Versions
Restriction
DataSource
AgentsCreatedEmpty Pool(AGENTS_CREATED_EMPTY_POOL)
Number ofagents createddue to theagent poolbeing empty.
COPY ulong No All -- SQLM_ELM_AGENTS_CREATED_EMPTY_POOL
AgentsCreated PoolRate(AGENTS_CREATED_POOL_RATE)
Frequencywith whichagents werecreated due tothe agent poolbeing empty.
AVG float No All -- ( AGENTS_CREATED_EMPTY_POOL /AGENTS_FROM_POOL )*100
Agents FromPool(AGENTS_FROM_POOL)
The number ofagentsassigned fromthe agentpool.
COPY ulong No All -- SQLM_ELM_AGENTS_FROM_POOL
AgentsRegistered(AGENTS_REGISTERED)
The number ofagents(coordinatoragents andsubagents)registeredwith themonitoreddatabasemanagerinstance.
COPY ulong No All -- SQLM_ELM_AGENTS_REGISTERED
AgentsRegisteredTop(AGENTS_REGISTERED_TOP)
The maximumnumber ofagents(coordinatoragents andsubagents)registeredsimultaneouslywith thedatabasemanager sincestartup.
COPY ulong No All -- SQLM_ELM_AGENTS_REGISTERED_TOP
AgentsWaiting OnToken
The number ofagents waitingfor tokens toexecute a
COPY ulong No All -- SQLM_ELM_AGENTS_WAITING_ON_TOKEN
Working with Records 2-503Hitachi Tuning Manager Application Reports Reference

Basic Information on Database Manager Interval (PI_PI)
View Name(Manager
Name)Description Sum
RuleForma
tDelt
a
Supported
Versions
Restriction
DataSource
(AGENTS_WAITING_ON_TOKEN)
transaction inthe databasemanager. Ifthe monitoringtarget is DB2V9.5 or later,the correctvalue cannotbe collectedbecause theversion is notrecommended.
AgentsWaiting Top(AGENTS_WAITING_TOP)
The largestnumber ofagents thatwaitedsimultaneouslyfor a token,since thedatabasemanagerstarted. If themonitoringtarget is DB2V9.5 or later,the correctvalue cannotbe collectedbecause theversion is notrecommended.
COPY ulong No All -- SQLM_ELM_AGENTS_WAITING_TOP
CommPrivate Mem(COMM_PRIVATE_MEM)
Amount ofdedicatedmemorycommitted bythe databasemanagerinstance at thetime thesnapshot wastaken.
COPY ulong No All -- SQLM_ELM_COMM_PRIVATE_MEM
Cons In ExecTotal(CONS_IN_EXEC_TOTAL)
Total numberof applicationsthat areconnected to adatabase inthe monitoreddatabasemanagerinstance, andare also
COPY ulong No All -- ( REM_CONS_IN_EXEC +LOCAL_CONS_IN_EXEC )
2-504 Working with RecordsHitachi Tuning Manager Application Reports Reference

Basic Information on Database Manager Interval (PI_PI)
View Name(Manager
Name)Description Sum
RuleForma
tDelt
a
Supported
Versions
Restriction
DataSource
processingtask units.
Cons Total(CONS_TOTAL)
Total numberof applicationsconnected tomonitoreddatabasemanagerinstance ordatabase.
COPY ulong No All -- ( REM_CONS_IN +LOCAL_CONS)
DB2 Status(DB2_STATUS)
Current statusof thedatabasemanagerinstance.When thedatabasemanager isrunning: 0(SQLM_DB2_ACTIVE)
When thedatabasemanager hasstopped: 100(This value isset by theAgent forDB2)If the value isneither 0 nor100, see theDB2 manualfor details.
COPY ulong No All -- SQLM_ELM_DB2_STATUS
Interval(INTERVAL)
Time for theinformationcollected, inseconds.
COPY ulong No All -- RECORD_TIME -CURRENT_SYSTEM_BOOT_TIME
Local Cons(LOCAL_CONS)
Number oflocalapplicationsconnected tothe databasein themonitoreddatabase
COPY ulong No All -- SQLM_ELM_LOCAL_CONS
Working with Records 2-505Hitachi Tuning Manager Application Reports Reference

Basic Information on Database Manager Interval (PI_PI)
View Name(Manager
Name)Description Sum
RuleForma
tDelt
a
Supported
Versions
Restriction
DataSource
managerinstance.
Local ConsIn Exec(LOCAL_CONS_IN_EXEC)
Number oflocalapplicationsthat areconnected to adatabase inthe monitoreddatabasemanagerinstance, andare alsoprocessingtask units.
COPY ulong No All -- SQLM_ELM_LOCAL_CONS_IN_EXEC
PostThresholdHash Joins(POST_THRESHOLD_HASH_JOINS)
Total numberof times that ahash join heaprequest waslimitedbecause theshared ordedicated sortheap spacewasconcurrentlyused.
COPY ulong No All -- SQLM_ELM_POST_THRESHOLD_HASH_JOINS
ProductName(PRODUCT_NAME)
Detailedversioninformation onthe currentlyexecuting DB2instance.
COPY string(48)
No All -- SQLM_ELM_PRODUCT_NAME
Record Time(RECORD_TIME)
Collection endtime for theperformancedata stored inthe record.
COPY time_t No All -- AgentCollector
Record Type(INPUT_RECORD_TYPE)
Record name.This is alwaysPI.
COPY char(8)
No All -- AgentCollector
Rem Cons In(REM_CONS_IN)
Number ofcurrentconnectionsinitiated fromremote clientsto thedatabase
COPY ulong No All -- SQLM_ELM_REM_CONS_IN
2-506 Working with RecordsHitachi Tuning Manager Application Reports Reference

Basic Information on Database Manager Interval (PI_PI)
View Name(Manager
Name)Description Sum
RuleForma
tDelt
a
Supported
Versions
Restriction
DataSource
managerinstance thatis beingmonitored.
Rem Cons InExec(REM_CONS_IN_EXEC)
Number ofremoteapplicationsthat arecurrentlyconnected to adatabase inthe monitoreddatabasemanagerinstance, andare currentlyprocessing aunit of work.
COPY ulong No All -- SQLM_ELM_REM_CONS_IN_EXEC
Service Level(SERVICE_LEVEL)
Currentcorrectedservice levelfor the DB2instance.
COPY string(48)
No All -- SQLM_ELM_SERVICE_LEVEL
Sort HeapAllocated(SORT_HEAP_ALLOCATED)
The totalnumber of sortheap spacepagesallocated to allsortoperations atthe selectedlevel, at thetime thesnapshot wastaken.
COPY ulong No All -- SQLM_ELM_SORT_HEAP_ALLOCATED
Bufferpool Stat on Database (PD_DBPD)
Function
The Bufferpool Stat on Database (PD_DBPD) record stores information aboutthe buffer pool on the database level.
Working with Records 2-507Hitachi Tuning Manager Application Reports Reference
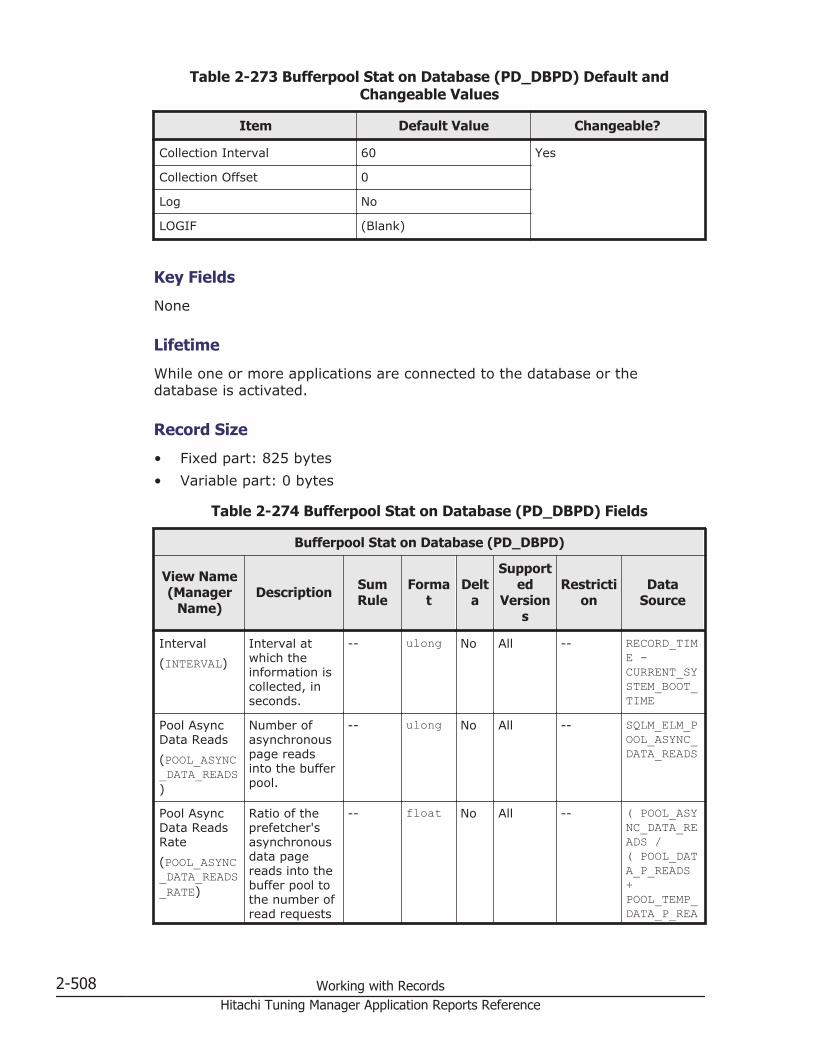
Table 2-273 Bufferpool Stat on Database (PD_DBPD) Default andChangeable Values
Item Default Value Changeable?
Collection Interval 60 Yes
Collection Offset 0
Log No
LOGIF (Blank)
Key Fields
None
Lifetime
While one or more applications are connected to the database or thedatabase is activated.
Record Size
• Fixed part: 825 bytes• Variable part: 0 bytes
Table 2-274 Bufferpool Stat on Database (PD_DBPD) Fields
Bufferpool Stat on Database (PD_DBPD)
View Name(Manager
Name)Description Sum
RuleForma
tDelt
a
Supported
Versions
Restriction
DataSource
Interval(INTERVAL)
Interval atwhich theinformation iscollected, inseconds.
-- ulong No All -- RECORD_TIME -CURRENT_SYSTEM_BOOT_TIME
Pool AsyncData Reads(POOL_ASYNC_DATA_READS)
Number ofasynchronouspage readsinto the bufferpool.
-- ulong No All -- SQLM_ELM_POOL_ASYNC_DATA_READS
Pool AsyncData ReadsRate(POOL_ASYNC_DATA_READS_RATE)
Ratio of theprefetcher'sasynchronousdata pagereads into thebuffer pool tothe number ofread requests
-- float No All -- ( POOL_ASYNC_DATA_READS /( POOL_DATA_P_READS+POOL_TEMP_DATA_P_REA
2-508 Working with RecordsHitachi Tuning Manager Application Reports Reference
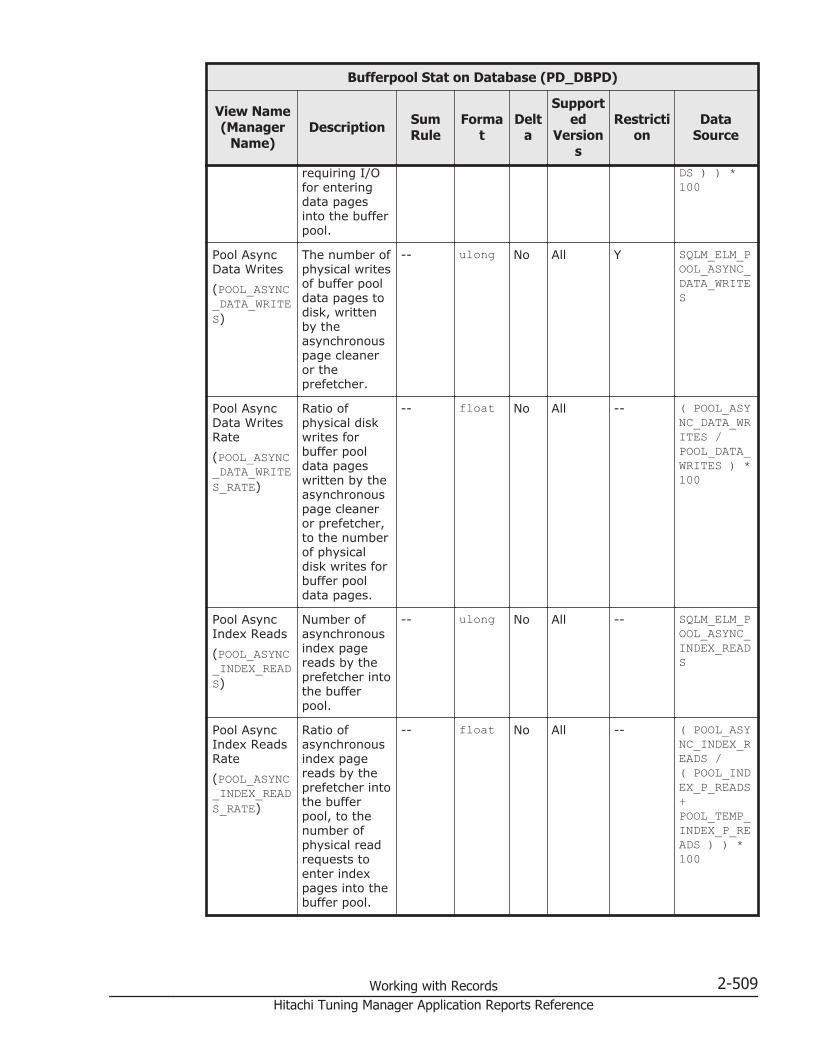
Bufferpool Stat on Database (PD_DBPD)
View Name(Manager
Name)Description Sum
RuleForma
tDelt
a
Supported
Versions
Restriction
DataSource
requiring I/Ofor enteringdata pagesinto the bufferpool.
DS ) ) *100
Pool AsyncData Writes(POOL_ASYNC_DATA_WRITES)
The number ofphysical writesof buffer pooldata pages todisk, writtenby theasynchronouspage cleaneror theprefetcher.
-- ulong No All Y SQLM_ELM_POOL_ASYNC_DATA_WRITES
Pool AsyncData WritesRate(POOL_ASYNC_DATA_WRITES_RATE)
Ratio ofphysical diskwrites forbuffer pooldata pageswritten by theasynchronouspage cleaneror prefetcher,to the numberof physicaldisk writes forbuffer pooldata pages.
-- float No All -- ( POOL_ASYNC_DATA_WRITES /POOL_DATA_WRITES ) *100
Pool AsyncIndex Reads(POOL_ASYNC_INDEX_READS)
Number ofasynchronousindex pagereads by theprefetcher intothe bufferpool.
-- ulong No All -- SQLM_ELM_POOL_ASYNC_INDEX_READS
Pool AsyncIndex ReadsRate(POOL_ASYNC_INDEX_READS_RATE)
Ratio ofasynchronousindex pagereads by theprefetcher intothe bufferpool, to thenumber ofphysical readrequests toenter indexpages into thebuffer pool.
-- float No All -- ( POOL_ASYNC_INDEX_READS /( POOL_INDEX_P_READS+POOL_TEMP_INDEX_P_READS ) ) *100
Working with Records 2-509Hitachi Tuning Manager Application Reports Reference
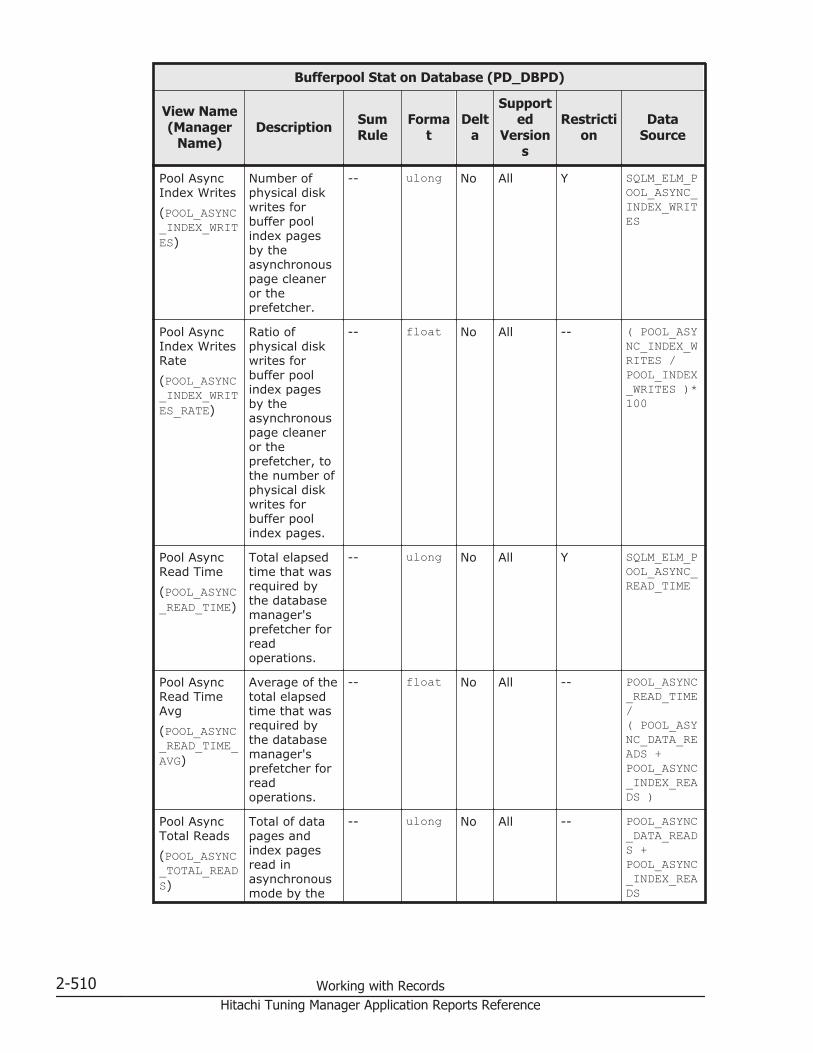
Bufferpool Stat on Database (PD_DBPD)
View Name(Manager
Name)Description Sum
RuleForma
tDelt
a
Supported
Versions
Restriction
DataSource
Pool AsyncIndex Writes(POOL_ASYNC_INDEX_WRITES)
Number ofphysical diskwrites forbuffer poolindex pagesby theasynchronouspage cleaneror theprefetcher.
-- ulong No All Y SQLM_ELM_POOL_ASYNC_INDEX_WRITES
Pool AsyncIndex WritesRate(POOL_ASYNC_INDEX_WRITES_RATE)
Ratio ofphysical diskwrites forbuffer poolindex pagesby theasynchronouspage cleaneror theprefetcher, tothe number ofphysical diskwrites forbuffer poolindex pages.
-- float No All -- ( POOL_ASYNC_INDEX_WRITES /POOL_INDEX_WRITES )*100
Pool AsyncRead Time(POOL_ASYNC_READ_TIME)
Total elapsedtime that wasrequired bythe databasemanager'sprefetcher forreadoperations.
-- ulong No All Y SQLM_ELM_POOL_ASYNC_READ_TIME
Pool AsyncRead TimeAvg(POOL_ASYNC_READ_TIME_AVG)
Average of thetotal elapsedtime that wasrequired bythe databasemanager'sprefetcher forreadoperations.
-- float No All -- POOL_ASYNC_READ_TIME/( POOL_ASYNC_DATA_READS +POOL_ASYNC_INDEX_READS )
Pool AsyncTotal Reads(POOL_ASYNC_TOTAL_READS)
Total of datapages andindex pagesread inasynchronousmode by the
-- ulong No All -- POOL_ASYNC_DATA_READS +POOL_ASYNC_INDEX_READS
2-510 Working with RecordsHitachi Tuning Manager Application Reports Reference

Bufferpool Stat on Database (PD_DBPD)
View Name(Manager
Name)Description Sum
RuleForma
tDelt
a
Supported
Versions
Restriction
DataSource
prefetcher intothe bufferpool.
Pool AsyncTotal Writes(POOL_ASYNC_TOTAL_WRITES)
Number ofphysical diskwrites forbuffer pooldata pages orindex pagesby theasynchronouspage cleaneror theprefetcher.
-- ulong No All -- POOL_ASYNC_DATA_WRITES +POOL_ASYNC_INDEX_WRITES
Pool AsyncWrite Time(POOL_ASYNC_WRITE_TIME)
Total elapsedtime, forwriting bufferpool datapages or indexpages fromthe buffer poolto disk, thatwas requiredby the pagecleaner of thedatabasemanager.
-- ulong No All Y SQLM_ELM_POOL_ASYNC_WRITE_TIME
Pool AsyncWrite TimeAvg(POOL_ASYNC_WRITE_TIME_AVG)
Average of thetotal elapsedtime that wasrequired bythe databasemanager'spage cleanerfor writingdata pages orindex pagesfrom thebuffer pool todisk.
-- float No All -- POOL_ASYNC_WRITE_TIME /( POOL_ASYNC_DATA_WRITES +POOL_ASYNC_INDEX_WRITES )
Pool DataFrom Estore(POOL_DATA_FROM_ESTORE)
Number ofdata pagescopied fromextendedstorage to thebuffer pool.Correct valuescannot becollected forthis field if the
-- ulong No All Y SQLM_ELM_POOL_DATA_FROM_ESTORE
Working with Records 2-511Hitachi Tuning Manager Application Reports Reference

Bufferpool Stat on Database (PD_DBPD)
View Name(Manager
Name)Description Sum
RuleForma
tDelt
a
Supported
Versions
Restriction
DataSource
monitoringtarget is DB2V9.1 or later.
Pool Data HitRate(POOL_DATA_HIT_RATE)
Data page hitrate.
-- float No All -- • If themonitoringtargetis DB2V9.1:( 1 -( POOL_DATA_P_READS /POOL_DATA_L_READS) ) *100
• If themonitoringtargetis DB2V9.5 orlater:( 1 -( ( POOL_DATA_P_READS -POOL_ASYNC_DATA_READS )/POOL_DATA_L_READS) ) *100
Pool Data LReads(POOL_DATA_L_READS)
Number oflogical readrequests fordata pagesthat passedthrough thebuffer pool.
-- ulong No All Y SQLM_ELM_POOL_DATA_L_READS
2-512 Working with RecordsHitachi Tuning Manager Application Reports Reference
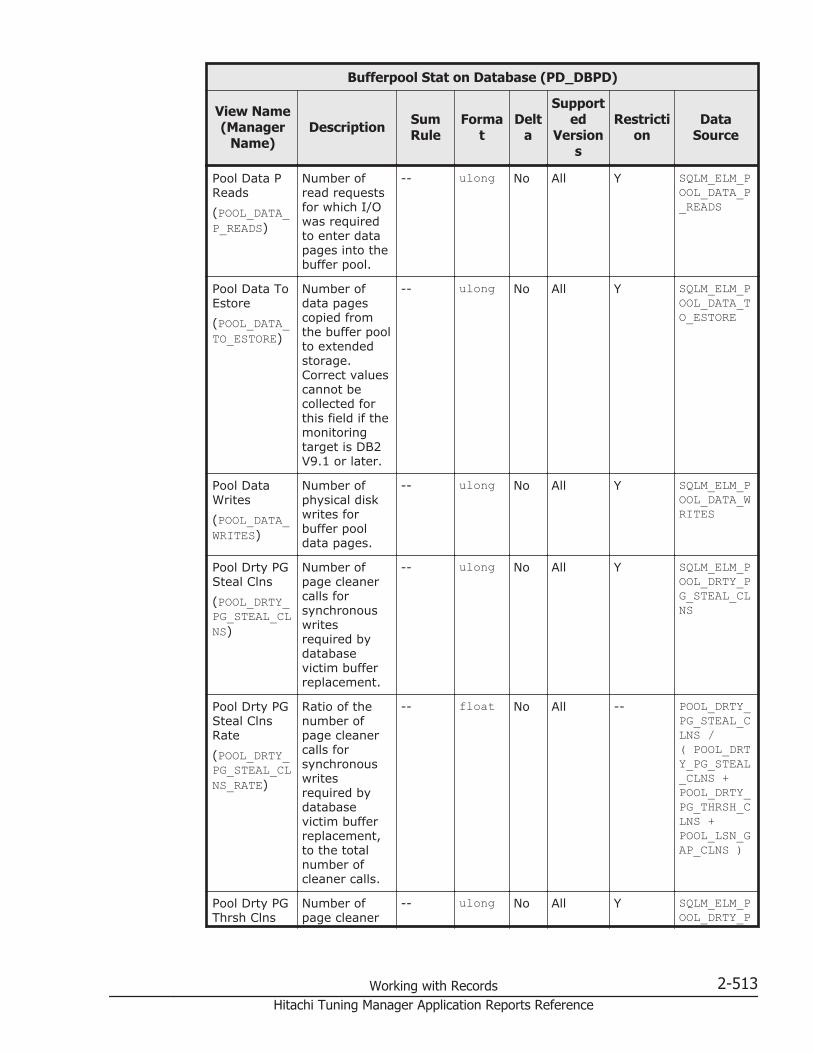
Bufferpool Stat on Database (PD_DBPD)
View Name(Manager
Name)Description Sum
RuleForma
tDelt
a
Supported
Versions
Restriction
DataSource
Pool Data PReads(POOL_DATA_P_READS)
Number ofread requestsfor which I/Owas requiredto enter datapages into thebuffer pool.
-- ulong No All Y SQLM_ELM_POOL_DATA_P_READS
Pool Data ToEstore(POOL_DATA_TO_ESTORE)
Number ofdata pagescopied fromthe buffer poolto extendedstorage.Correct valuescannot becollected forthis field if themonitoringtarget is DB2V9.1 or later.
-- ulong No All Y SQLM_ELM_POOL_DATA_TO_ESTORE
Pool DataWrites(POOL_DATA_WRITES)
Number ofphysical diskwrites forbuffer pooldata pages.
-- ulong No All Y SQLM_ELM_POOL_DATA_WRITES
Pool Drty PGSteal Clns(POOL_DRTY_PG_STEAL_CLNS)
Number ofpage cleanercalls forsynchronouswritesrequired bydatabasevictim bufferreplacement.
-- ulong No All Y SQLM_ELM_POOL_DRTY_PG_STEAL_CLNS
Pool Drty PGSteal ClnsRate(POOL_DRTY_PG_STEAL_CLNS_RATE)
Ratio of thenumber ofpage cleanercalls forsynchronouswritesrequired bydatabasevictim bufferreplacement,to the totalnumber ofcleaner calls.
-- float No All -- POOL_DRTY_PG_STEAL_CLNS /( POOL_DRTY_PG_STEAL_CLNS +POOL_DRTY_PG_THRSH_CLNS +POOL_LSN_GAP_CLNS )
Pool Drty PGThrsh Clns
Number ofpage cleaner
-- ulong No All Y SQLM_ELM_POOL_DRTY_P
Working with Records 2-513Hitachi Tuning Manager Application Reports Reference

Bufferpool Stat on Database (PD_DBPD)
View Name(Manager
Name)Description Sum
RuleForma
tDelt
a
Supported
Versions
Restriction
DataSource
(POOL_DRTY_PG_THRSH_CLNS)
calls due tothe buffer poolreaching thedirty pagethreshold forthe database.
G_THRSH_CLNS
Pool IndexFrom Estore(POOL_INDEX_FROM_ESTORE)
Number ofbuffer poolindex pagescopied fromextendedstorage.Correct valuescannot becollected forthis field if themonitoringtarget is DB2V9.1 or later.
-- ulong No All Y SQLM_ELM_POOL_INDEX_FROM_ESTORE
Pool IndexHit Rate(POOL_INDEX_HIT_RATE)
Index page hitrate.
-- float No All -- • If themonitoringtargetis DB2V9.1:( 1 -( POOL_INDEX_P_READS /POOL_INDEX_L_READS) ) *100
• If themonitoringtargetis DB2V9.5 orlater:( 1 -( ( POOL_INDEX_P_READS -POOL_ASYNC_INDEX_R
2-514 Working with RecordsHitachi Tuning Manager Application Reports Reference

Bufferpool Stat on Database (PD_DBPD)
View Name(Manager
Name)Description Sum
RuleForma
tDelt
a
Supported
Versions
Restriction
DataSource
EADS )/POOL_INDEX_l_READS) ) *100
Pool Index LReads(POOL_INDEX_L_READS)
Number oflogical readrequests forindex pagesthat passedthrough thebuffer pool.
-- ulong No All Y SQLM_ELM_POOL_INDEX_L_READS
Pool Index PReads(POOL_INDEX_P_READS)
Number ofphysical readrequests toenter indexpages into thebuffer pool.
-- ulong No All Y SQLM_ELM_POOL_INDEX_P_READS
Pool IndexTo Estore(POOL_INDEX_TO_ESTORE)
Number ofindex pagescopied fromthe buffer poolto extendedstorage.Correct valuescannot becollected forthis field if themonitoringtarget is DB2V9.1 or later.
-- ulong No All Y SQLM_ELM_POOL_INDEX_TO_ESTORE
Pool IndexWrites(POOL_INDEX_WRITES)
Number ofphysical diskwrites forbuffer poolindex pages.
-- ulong No All Y SQLM_ELM_POOL_INDEX_WRITES
Pool Lsn GapClns(POOL_LSN_GAP_CLNS)
Number oftimes the pagecleaner wascalled becausethe loggingspace in usereached thedefinedstandard forthe database.
-- ulong No All Y SQLM_ELM_POOL_LSN_GAP_CLNS
Working with Records 2-515Hitachi Tuning Manager Application Reports Reference

Bufferpool Stat on Database (PD_DBPD)
View Name(Manager
Name)Description Sum
RuleForma
tDelt
a
Supported
Versions
Restriction
DataSource
Pool ReadTime(POOL_READ_TIME)
Total time forread requestprocessing,where physicalreads of dataor indexpages, from adisk or thebuffer pool,werenecessary.
-- ulong No All Y SQLM_ELM_POOL_READ_TIME
Pool ReadTime Avg(POOL_READ_TIME_AVG)
Average timefor readrequestprocessing,where physicalreads of dataor indexpages, from adisk or thebuffer pool,werenecessary.
-- float No All -- POOL_READ_TIME /( POOL_DATA_P_READS+POOL_INDEX_P_READS +POOL_XDA_P_READS +POOL_TEMP_DATA_P_READS +POOL_TEMP_INDEX_P_READS +POOL_TEMP_XDA_P_READS )
Pool Total HitRate(POOL_TOTAL_HIT_RATE)
Total bufferpool hit rate.
-- float No All -- 1 -( ( POOL_DATA_P_READS +POOL_XDA_P_READS +POOL_INDEX_P_READS +POOL_TEMP_DATA_P_READS +POOL_TEMP_XDA_P_READS +POOL_TEMP_INDEX_P_READS ) /( POOL_DATA_L_READS+POOL_INDEX_L_READS +
2-516 Working with RecordsHitachi Tuning Manager Application Reports Reference

Bufferpool Stat on Database (PD_DBPD)
View Name(Manager
Name)Description Sum
RuleForma
tDelt
a
Supported
Versions
Restriction
DataSource
POOL_XDA_L_READS +POOL_TEMP_DATA_L_READS +POOL_TEMP_INDEX_L_READS +POOL_TEMP_XDA_L_READS ) ) *100
Pool TotalWrites(POOL_TOTAL_WRITES)
Total numberof physicalwrites ofbuffer pooldata pagesand bufferpool indexpages to disk.
-- ulong No All -- POOL_DATA_WRITES +POOL_INDEX_WRITES +POOL_XDA_WRITES
Pool WriteTime(POOL_WRITE_TIME)
Total timetaken forphysical writesof data pagesor index pagesfrom thebuffer pool todisk.
-- ulong No All Y SQLM_ELM_POOL_WRITE_TIME
Pool WriteTime Avg(POOL_WRITE_TIME_AVG)
Average timetaken forphysical writesof data pagesor index pagesfrom thebuffer pool todisk.
-- float No All -- POOL_WRITE_TIME /( POOL_DATA_WRITES +POOL_INDEX_WRITES +POOL_XDA_WRITES )
Record Time(RECORD_TIME)
Collection endtime forperformancedata stored inthe record.
-- time_t No All -- AgentCollector
Record Type(INPUT_RECORD_TYPE)
Record name.This is alwaysDBPD.
-- char(8)
No All -- AgentCollector
Working with Records 2-517Hitachi Tuning Manager Application Reports Reference

Bufferpool Stat on Database Interval (PI_DBPI)
Function
The Bufferpool Stat on Database Interval (PI_DBPI) record stores basicinformation about the buffer pool on the database level, using a constantinterval as a unit.
Table 2-275 Bufferpool Stat on Database Interval (PI_DBPI) Default andChangeable Values
Item Default Value Changeable?
Collection Interval 60 Yes
Collection Offset 0
Log Yes
LOGIF (Blank)
Key Fields
None
Lifetime
While one or more applications are connected to the database or thedatabase is activated.
Record Size
• Fixed part: 969 bytes• Variable part: 0 bytes
Table 2-276 Bufferpool Stat on Database Interval (PI_DBPI) Fields
Bufferpool Stat on Database Interval (PI_DBPI)
View Name(Manager
Name)Description Sum
RuleForma
tDelt
a
Supported
Versions
Restriction
DataSource
Interval(INTERVAL)
Interval atwhich theinformation iscollected, inseconds.
COPY ulong No All -- RECORD_TIME -CURRENT_SYSTEM_BOOT_TIME
Pool AsyncData Reads(POOL_ASYNC_DATA_READS)
Number ofasynchronouspage readsinto the bufferpool.
COPY ulong Yes All Y SQLM_ELM_POOL_ASYNC_DATA_READS
2-518 Working with RecordsHitachi Tuning Manager Application Reports Reference
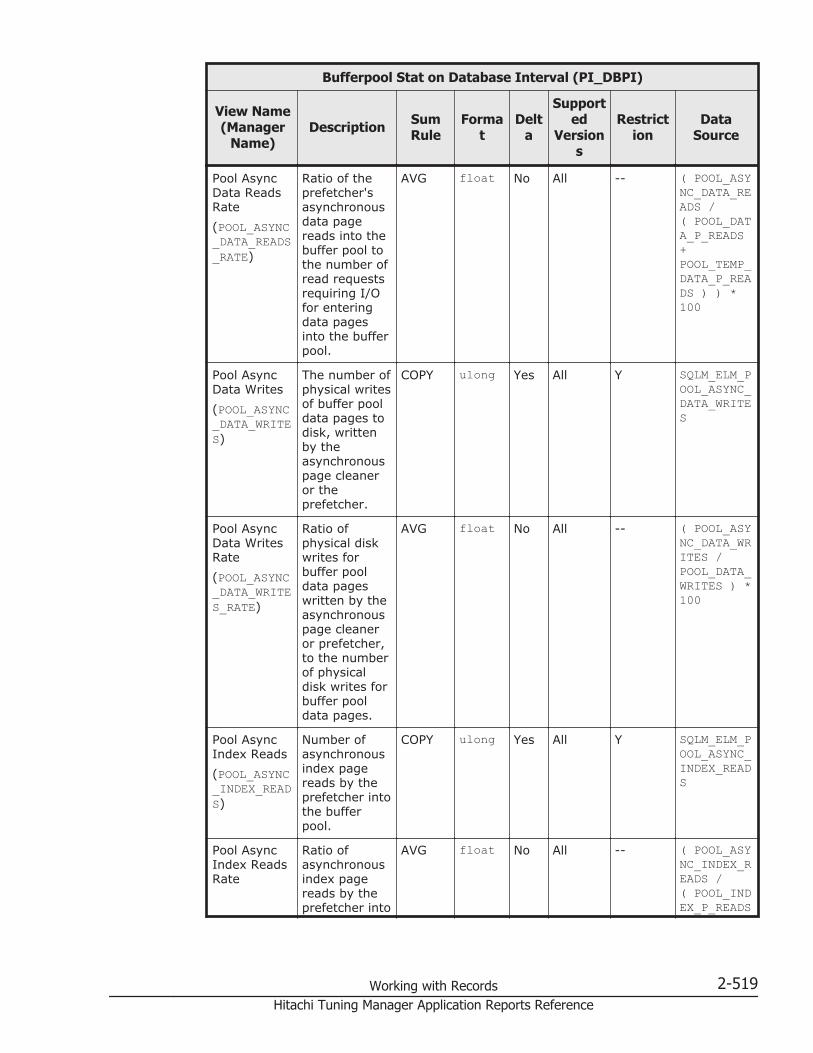
Bufferpool Stat on Database Interval (PI_DBPI)
View Name(Manager
Name)Description Sum
RuleForma
tDelt
a
Supported
Versions
Restriction
DataSource
Pool AsyncData ReadsRate(POOL_ASYNC_DATA_READS_RATE)
Ratio of theprefetcher'sasynchronousdata pagereads into thebuffer pool tothe number ofread requestsrequiring I/Ofor enteringdata pagesinto the bufferpool.
AVG float No All -- ( POOL_ASYNC_DATA_READS /( POOL_DATA_P_READS+POOL_TEMP_DATA_P_READS ) ) *100
Pool AsyncData Writes(POOL_ASYNC_DATA_WRITES)
The number ofphysical writesof buffer pooldata pages todisk, writtenby theasynchronouspage cleaneror theprefetcher.
COPY ulong Yes All Y SQLM_ELM_POOL_ASYNC_DATA_WRITES
Pool AsyncData WritesRate(POOL_ASYNC_DATA_WRITES_RATE)
Ratio ofphysical diskwrites forbuffer pooldata pageswritten by theasynchronouspage cleaneror prefetcher,to the numberof physicaldisk writes forbuffer pooldata pages.
AVG float No All -- ( POOL_ASYNC_DATA_WRITES /POOL_DATA_WRITES ) *100
Pool AsyncIndex Reads(POOL_ASYNC_INDEX_READS)
Number ofasynchronousindex pagereads by theprefetcher intothe bufferpool.
COPY ulong Yes All Y SQLM_ELM_POOL_ASYNC_INDEX_READS
Pool AsyncIndex ReadsRate
Ratio ofasynchronousindex pagereads by theprefetcher into
AVG float No All -- ( POOL_ASYNC_INDEX_READS /( POOL_INDEX_P_READS
Working with Records 2-519Hitachi Tuning Manager Application Reports Reference
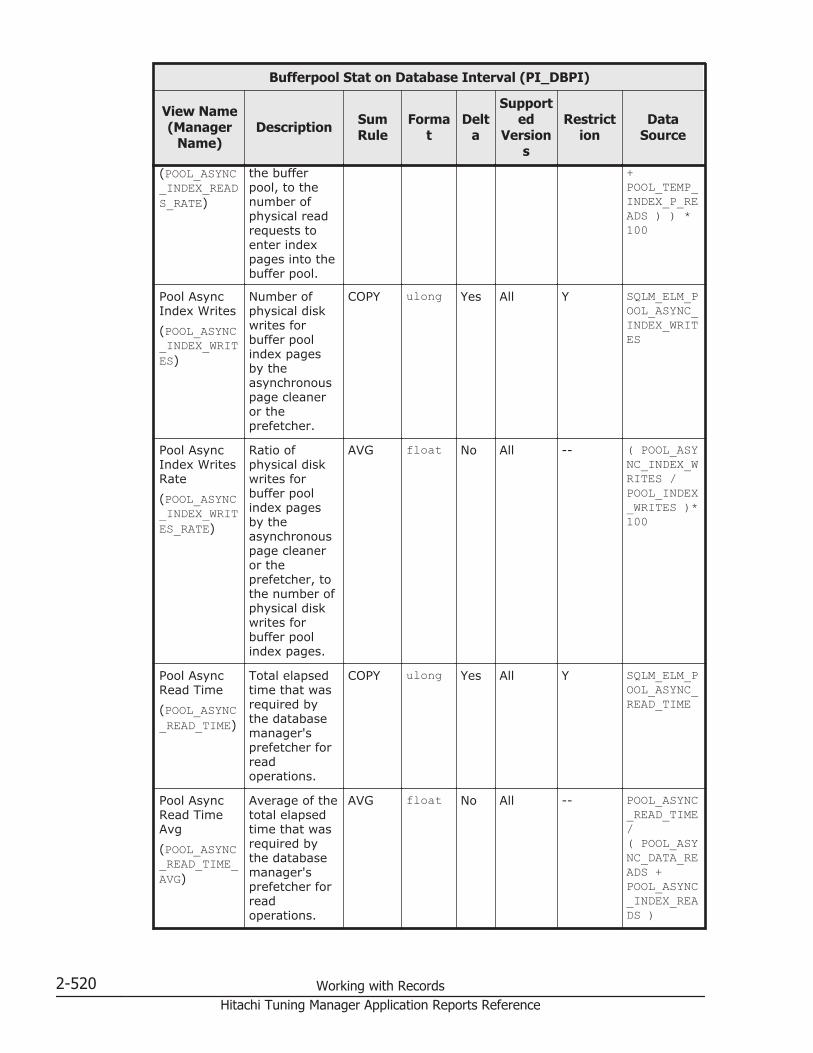
Bufferpool Stat on Database Interval (PI_DBPI)
View Name(Manager
Name)Description Sum
RuleForma
tDelt
a
Supported
Versions
Restriction
DataSource
(POOL_ASYNC_INDEX_READS_RATE)
the bufferpool, to thenumber ofphysical readrequests toenter indexpages into thebuffer pool.
+POOL_TEMP_INDEX_P_READS ) ) *100
Pool AsyncIndex Writes(POOL_ASYNC_INDEX_WRITES)
Number ofphysical diskwrites forbuffer poolindex pagesby theasynchronouspage cleaneror theprefetcher.
COPY ulong Yes All Y SQLM_ELM_POOL_ASYNC_INDEX_WRITES
Pool AsyncIndex WritesRate(POOL_ASYNC_INDEX_WRITES_RATE)
Ratio ofphysical diskwrites forbuffer poolindex pagesby theasynchronouspage cleaneror theprefetcher, tothe number ofphysical diskwrites forbuffer poolindex pages.
AVG float No All -- ( POOL_ASYNC_INDEX_WRITES /POOL_INDEX_WRITES )*100
Pool AsyncRead Time(POOL_ASYNC_READ_TIME)
Total elapsedtime that wasrequired bythe databasemanager'sprefetcher forreadoperations.
COPY ulong Yes All Y SQLM_ELM_POOL_ASYNC_READ_TIME
Pool AsyncRead TimeAvg(POOL_ASYNC_READ_TIME_AVG)
Average of thetotal elapsedtime that wasrequired bythe databasemanager'sprefetcher forreadoperations.
AVG float No All -- POOL_ASYNC_READ_TIME/( POOL_ASYNC_DATA_READS +POOL_ASYNC_INDEX_READS )
2-520 Working with RecordsHitachi Tuning Manager Application Reports Reference

Bufferpool Stat on Database Interval (PI_DBPI)
View Name(Manager
Name)Description Sum
RuleForma
tDelt
a
Supported
Versions
Restriction
DataSource
Pool AsyncTotal Reads(POOL_ASYNC_TOTAL_READS)
Total of datapages andindex pagesread inasynchronousmode by theprefetcher intobuffer pool.
COPY ulong Yes All -- POOL_ASYNC_DATA_READS +POOL_ASYNC_INDEX_READS
Pool AsyncTotal Writes(POOL_ASYNC_TOTAL_WRITES)
Number ofphysical diskwrites forbuffer pooldata pages orindex pagesby theasynchronouspage cleaneror theprefetcher.
COPY ulong Yes All -- POOL_ASYNC_DATA_WRITES +POOL_ASYNC_INDEX_WRITES
Pool AsyncWrite Time(POOL_ASYNC_WRITE_TIME)
Total elapsedtime, forwriting bufferpool datapages or indexpages fromthe buffer poolto disk, thatwas requiredby the pagecleaner of thedatabasemanager.
COPY ulong Yes All Y SQLM_ELM_POOL_ASYNC_WRITE_TIME
Pool AsyncWrite TimeAvg(POOL_ASYNC_WRITE_TIME_AVG)
Average of thetotal elapsedtime that wasrequired bythe databasemanager'spage cleanerfor writingdata pages orindex pagesfrom thebuffer pool todisk.
AVG float No All -- POOL_ASYNC_WRITE_TIME /( POOL_ASYNC_DATA_WRITES +POOL_ASYNC_INDEX_WRITES )
Pool DataFrom Estore
Number ofdata pagescopied fromextended
COPY ulong Yes All Y SQLM_ELM_POOL_DATA_FROM_ESTORE
Working with Records 2-521Hitachi Tuning Manager Application Reports Reference

Bufferpool Stat on Database Interval (PI_DBPI)
View Name(Manager
Name)Description Sum
RuleForma
tDelt
a
Supported
Versions
Restriction
DataSource
(POOL_DATA_FROM_ESTORE)
storage to thebuffer pool.Correct valuescannot becollected forthis field if themonitoringtarget is DB2V9.1 or later.
Pool Data HitRate(POOL_DATA_HIT_RATE)
Data page hitrate.
AVG float No All -- • If themonitoringtargetis DB2V9.1:( 1 -( POOL_DATA_P_READS /POOL_DATA_L_READS) ) *100
• If themonitoringtargetis DB2V9.5 orlater:( 1 -( ( POOL_DATA_P_READS -POOL_ASYNC_DATA_READS )/POOL_DATA_L_READS) ) *100
Pool Data LReads
Number oflogical readrequests for
COPY ulong Yes All Y SQLM_ELM_POOL_DATA_L_READS
2-522 Working with RecordsHitachi Tuning Manager Application Reports Reference
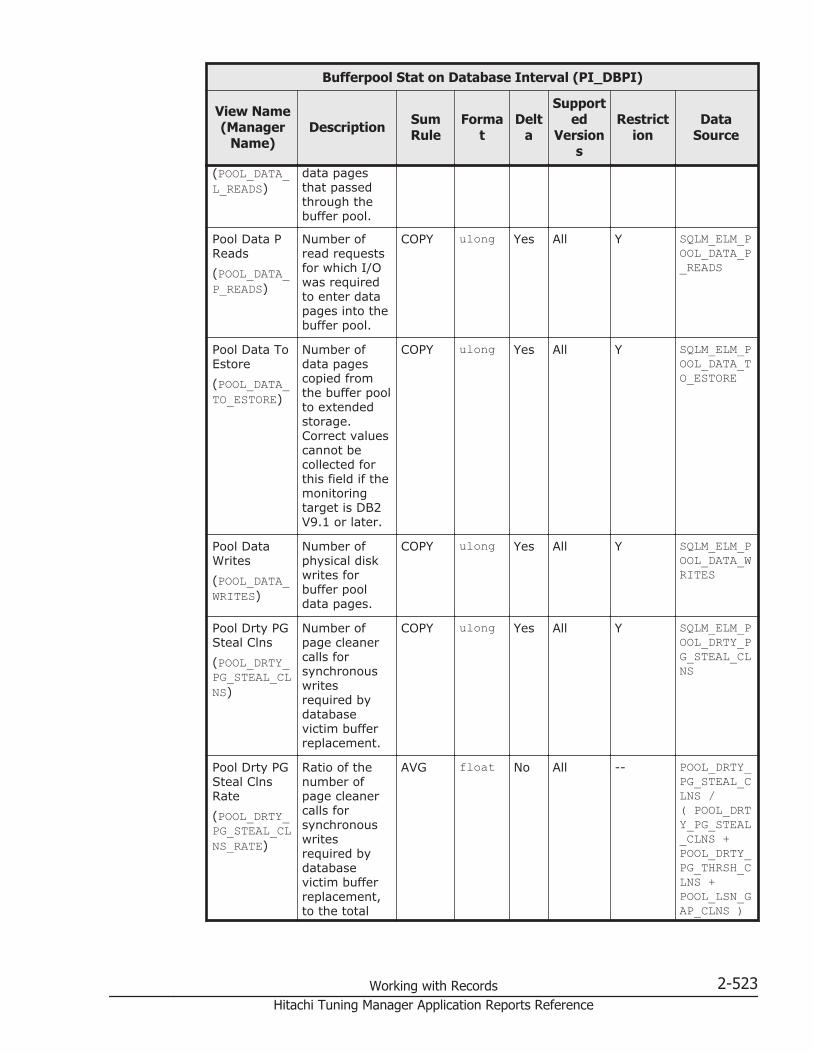
Bufferpool Stat on Database Interval (PI_DBPI)
View Name(Manager
Name)Description Sum
RuleForma
tDelt
a
Supported
Versions
Restriction
DataSource
(POOL_DATA_L_READS)
data pagesthat passedthrough thebuffer pool.
Pool Data PReads(POOL_DATA_P_READS)
Number ofread requestsfor which I/Owas requiredto enter datapages into thebuffer pool.
COPY ulong Yes All Y SQLM_ELM_POOL_DATA_P_READS
Pool Data ToEstore(POOL_DATA_TO_ESTORE)
Number ofdata pagescopied fromthe buffer poolto extendedstorage.Correct valuescannot becollected forthis field if themonitoringtarget is DB2V9.1 or later.
COPY ulong Yes All Y SQLM_ELM_POOL_DATA_TO_ESTORE
Pool DataWrites(POOL_DATA_WRITES)
Number ofphysical diskwrites forbuffer pooldata pages.
COPY ulong Yes All Y SQLM_ELM_POOL_DATA_WRITES
Pool Drty PGSteal Clns(POOL_DRTY_PG_STEAL_CLNS)
Number ofpage cleanercalls forsynchronouswritesrequired bydatabasevictim bufferreplacement.
COPY ulong Yes All Y SQLM_ELM_POOL_DRTY_PG_STEAL_CLNS
Pool Drty PGSteal ClnsRate(POOL_DRTY_PG_STEAL_CLNS_RATE)
Ratio of thenumber ofpage cleanercalls forsynchronouswritesrequired bydatabasevictim bufferreplacement,to the total
AVG float No All -- POOL_DRTY_PG_STEAL_CLNS /( POOL_DRTY_PG_STEAL_CLNS +POOL_DRTY_PG_THRSH_CLNS +POOL_LSN_GAP_CLNS )
Working with Records 2-523Hitachi Tuning Manager Application Reports Reference

Bufferpool Stat on Database Interval (PI_DBPI)
View Name(Manager
Name)Description Sum
RuleForma
tDelt
a
Supported
Versions
Restriction
DataSource
number ofcleaner calls.
Pool Drty PGThrsh Clns(POOL_DRTY_PG_THRSH_CLNS)
Number ofpage cleanercalls due tothe buffer poolreaching thedirty pagethreshold forthe database.
COPY ulong Yes All Y SQLM_ELM_POOL_DRTY_PG_THRSH_CLNS
Pool IndexFrom Estore(POOL_INDEX_FROM_ESTORE)
Number ofbuffer poolindex pagescopied fromextendedstorage.Correct valuescannot becollected forthis field if themonitoringtarget is DB2V9.1 or later.
COPY ulong Yes All Y SQLM_ELM_POOL_INDEX_FROM_ESTORE
Pool IndexHit Rate(POOL_INDEX_HIT_RATE)
Index page hitrate.
AVG float No All -- • If themonitoringtargetis DB2V9.1:( 1 -( POOL_INDEX_P_READS /POOL_INDEX_L_READS) ) *100
• If themonitoringtargetis DB2V9.5 orlater:( 1 -( ( PO
2-524 Working with RecordsHitachi Tuning Manager Application Reports Reference
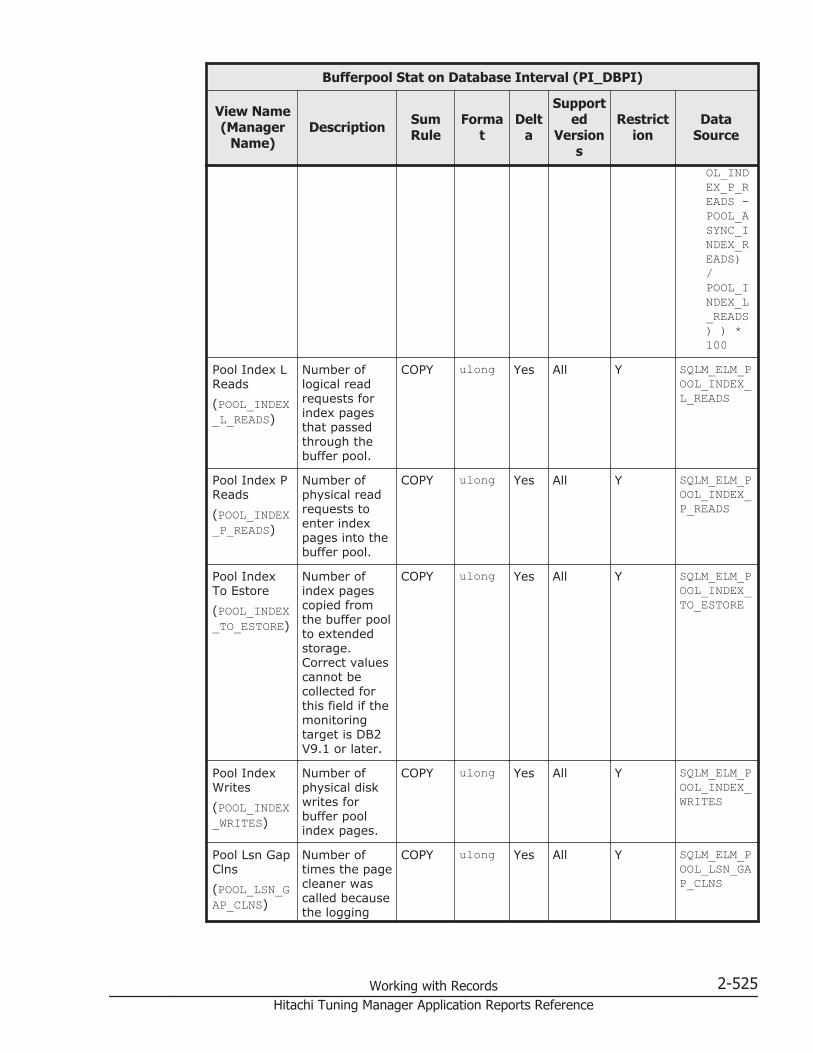
Bufferpool Stat on Database Interval (PI_DBPI)
View Name(Manager
Name)Description Sum
RuleForma
tDelt
a
Supported
Versions
Restriction
DataSource
OL_INDEX_P_READS -POOL_ASYNC_INDEX_READS)/POOL_INDEX_L_READS) ) *100
Pool Index LReads(POOL_INDEX_L_READS)
Number oflogical readrequests forindex pagesthat passedthrough thebuffer pool.
COPY ulong Yes All Y SQLM_ELM_POOL_INDEX_L_READS
Pool Index PReads(POOL_INDEX_P_READS)
Number ofphysical readrequests toenter indexpages into thebuffer pool.
COPY ulong Yes All Y SQLM_ELM_POOL_INDEX_P_READS
Pool IndexTo Estore(POOL_INDEX_TO_ESTORE)
Number ofindex pagescopied fromthe buffer poolto extendedstorage.Correct valuescannot becollected forthis field if themonitoringtarget is DB2V9.1 or later.
COPY ulong Yes All Y SQLM_ELM_POOL_INDEX_TO_ESTORE
Pool IndexWrites(POOL_INDEX_WRITES)
Number ofphysical diskwrites forbuffer poolindex pages.
COPY ulong Yes All Y SQLM_ELM_POOL_INDEX_WRITES
Pool Lsn GapClns(POOL_LSN_GAP_CLNS)
Number oftimes the pagecleaner wascalled becausethe logging
COPY ulong Yes All Y SQLM_ELM_POOL_LSN_GAP_CLNS
Working with Records 2-525Hitachi Tuning Manager Application Reports Reference

Bufferpool Stat on Database Interval (PI_DBPI)
View Name(Manager
Name)Description Sum
RuleForma
tDelt
a
Supported
Versions
Restriction
DataSource
space in usehas reachedthe definedstandard forthe database.
Pool ReadTime(POOL_READ_TIME)
Total time forread requestprocessing,where physicalreads of dataor indexpages, from adisk or thebuffer pool,werenecessary.
COPY ulong Yes All Y SQLM_ELM_POOL_READ_TIME
Pool ReadTime Avg(POOL_READ_TIME_AVG)
Average timefor readrequestprocessing,where physicalreads of dataor indexpages, from adisk or thebuffer pool,werenecessary.
AVG float No All -- POOL_READ_TIME /( POOL_DATA_P_READS+POOL_INDEX_P_READS +POOL_XDA_P_READS +POOL_TEMP_DATA_P_READS +POOL_TEMP_INDEX_P_READS +POOL_TEMP_XDA_P_READS )
Pool Total HitRate(POOL_TOTAL_HIT_RATE)
Total bufferpool hit rate.
AVG float No All -- 1 -( ( POOL_DATA_P_READS +POOL_XDA_P_READS +POOL_INDEX_P_READS +POOL_TEMP_DATA_P_READS +POOL_TEMP_XDA_P_READS +POOL_TEMP_
2-526 Working with RecordsHitachi Tuning Manager Application Reports Reference
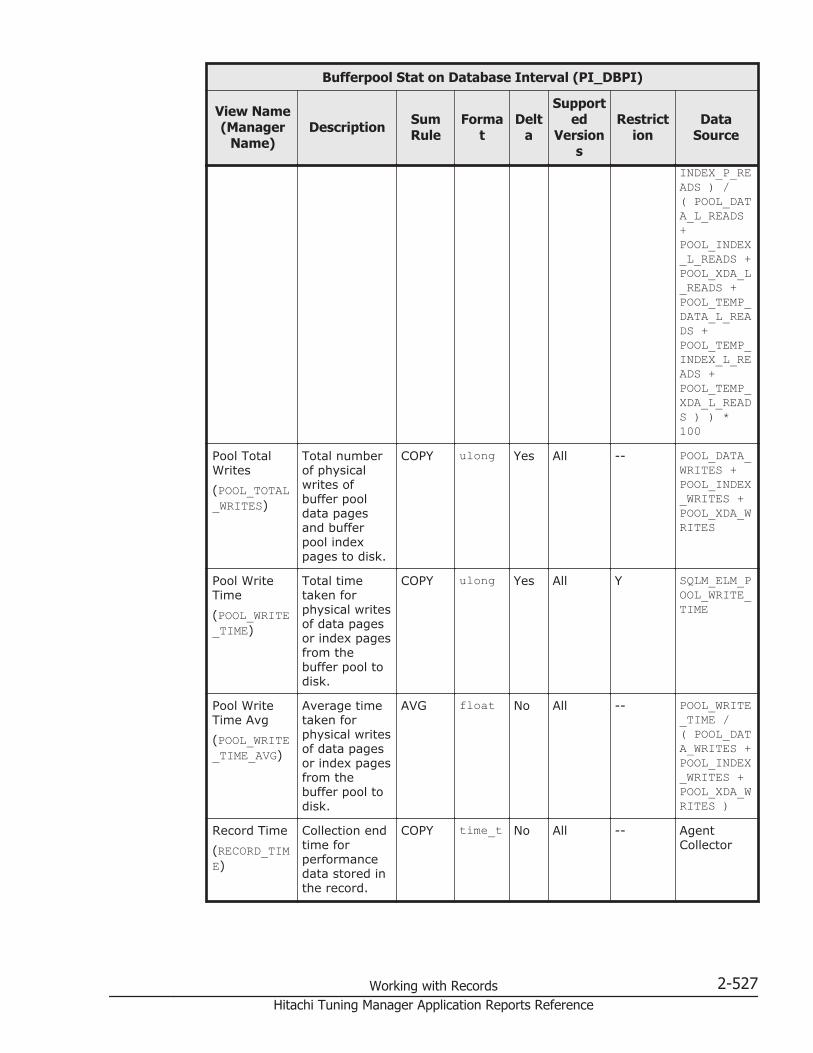
Bufferpool Stat on Database Interval (PI_DBPI)
View Name(Manager
Name)Description Sum
RuleForma
tDelt
a
Supported
Versions
Restriction
DataSource
INDEX_P_READS ) /( POOL_DATA_L_READS+POOL_INDEX_L_READS +POOL_XDA_L_READS +POOL_TEMP_DATA_L_READS +POOL_TEMP_INDEX_L_READS +POOL_TEMP_XDA_L_READS ) ) *100
Pool TotalWrites(POOL_TOTAL_WRITES)
Total numberof physicalwrites ofbuffer pooldata pagesand bufferpool indexpages to disk.
COPY ulong Yes All -- POOL_DATA_WRITES +POOL_INDEX_WRITES +POOL_XDA_WRITES
Pool WriteTime(POOL_WRITE_TIME)
Total timetaken forphysical writesof data pagesor index pagesfrom thebuffer pool todisk.
COPY ulong Yes All Y SQLM_ELM_POOL_WRITE_TIME
Pool WriteTime Avg(POOL_WRITE_TIME_AVG)
Average timetaken forphysical writesof data pagesor index pagesfrom thebuffer pool todisk.
AVG float No All -- POOL_WRITE_TIME /( POOL_DATA_WRITES +POOL_INDEX_WRITES +POOL_XDA_WRITES )
Record Time(RECORD_TIME)
Collection endtime forperformancedata stored inthe record.
COPY time_t No All -- AgentCollector
Working with Records 2-527Hitachi Tuning Manager Application Reports Reference
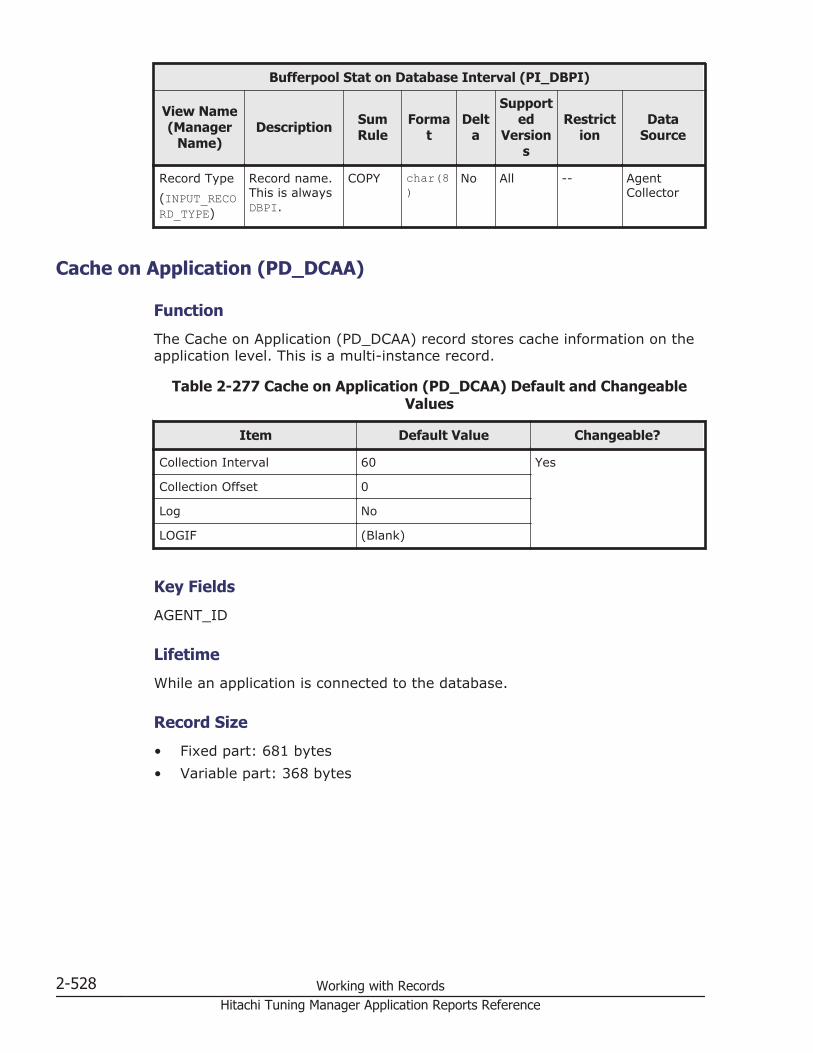
Bufferpool Stat on Database Interval (PI_DBPI)
View Name(Manager
Name)Description Sum
RuleForma
tDelt
a
Supported
Versions
Restriction
DataSource
Record Type(INPUT_RECORD_TYPE)
Record name.This is alwaysDBPI.
COPY char(8)
No All -- AgentCollector
Cache on Application (PD_DCAA)
Function
The Cache on Application (PD_DCAA) record stores cache information on theapplication level. This is a multi-instance record.
Table 2-277 Cache on Application (PD_DCAA) Default and ChangeableValues
Item Default Value Changeable?
Collection Interval 60 Yes
Collection Offset 0
Log No
LOGIF (Blank)
Key Fields
AGENT_ID
Lifetime
While an application is connected to the database.
Record Size
• Fixed part: 681 bytes• Variable part: 368 bytes
2-528 Working with RecordsHitachi Tuning Manager Application Reports Reference
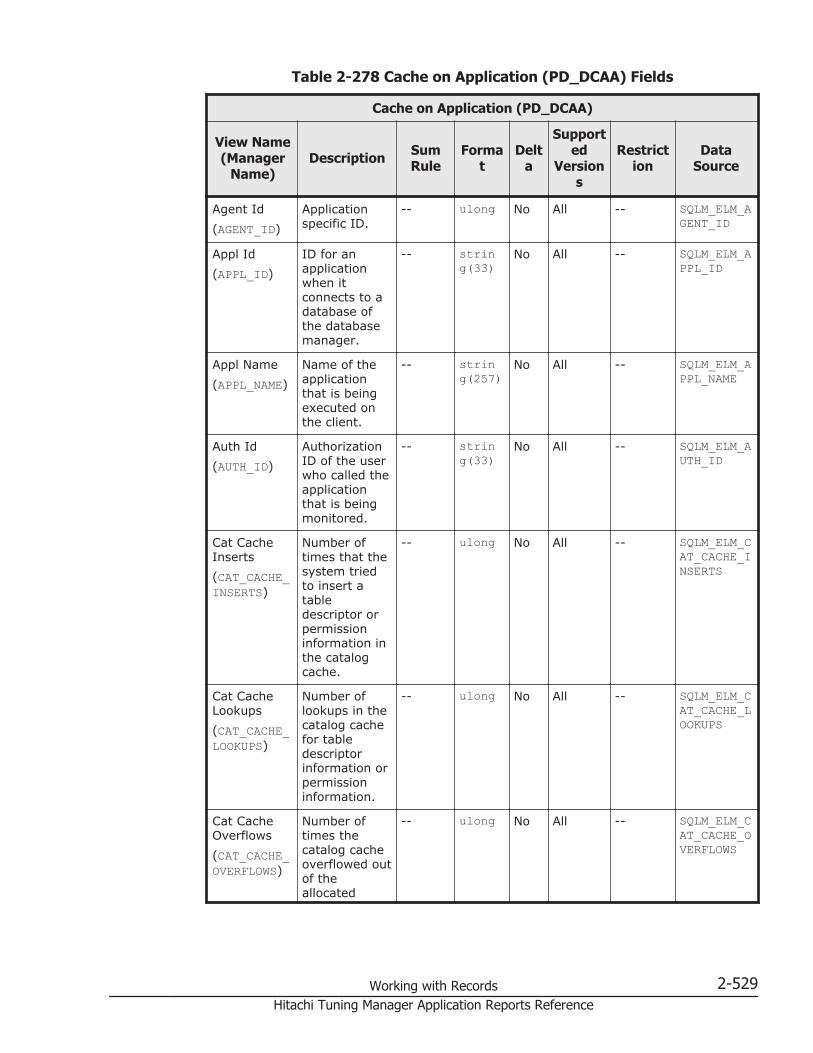
Table 2-278 Cache on Application (PD_DCAA) Fields
Cache on Application (PD_DCAA)
View Name(Manager
Name)Description Sum
RuleForma
tDelt
a
Supported
Versions
Restriction
DataSource
Agent Id(AGENT_ID)
Applicationspecific ID.
-- ulong No All -- SQLM_ELM_AGENT_ID
Appl Id(APPL_ID)
ID for anapplicationwhen itconnects to adatabase ofthe databasemanager.
-- string(33)
No All -- SQLM_ELM_APPL_ID
Appl Name(APPL_NAME)
Name of theapplicationthat is beingexecuted onthe client.
-- string(257)
No All -- SQLM_ELM_APPL_NAME
Auth Id(AUTH_ID)
AuthorizationID of the userwho called theapplicationthat is beingmonitored.
-- string(33)
No All -- SQLM_ELM_AUTH_ID
Cat CacheInserts(CAT_CACHE_INSERTS)
Number oftimes that thesystem triedto insert atabledescriptor orpermissioninformation inthe catalogcache.
-- ulong No All -- SQLM_ELM_CAT_CACHE_INSERTS
Cat CacheLookups(CAT_CACHE_LOOKUPS)
Number oflookups in thecatalog cachefor tabledescriptorinformation orpermissioninformation.
-- ulong No All -- SQLM_ELM_CAT_CACHE_LOOKUPS
Cat CacheOverflows(CAT_CACHE_OVERFLOWS)
Number oftimes thecatalog cacheoverflowed outof theallocated
-- ulong No All -- SQLM_ELM_CAT_CACHE_OVERFLOWS
Working with Records 2-529Hitachi Tuning Manager Application Reports Reference

Cache on Application (PD_DCAA)
View Name(Manager
Name)Description Sum
RuleForma
tDelt
a
Supported
Versions
Restriction
DataSource
memoryenvironment.
Catcache HitRate(CATCACHE_HIT_RATE)
Catalog cachehit rate.
-- float No All -- ( 1 -( CAT_CACHE_INSERTS/CAT_CACHE_LOOKUPS )) * 100
DB Name(DB_NAME)
Real name ofthe databasewhere theinformation iscollected, orreal name ofthe databaseat theapplicationconnectiontarget.
-- string(9)
No All -- SQLM_ELM_DB_NAME
Interval(INTERVAL)
Time forinformationcollected(seconds).
-- ulong No All -- RECORD_TIME -CURRENT_SYSTEM_BOOT_TIME
Num AssocAgents(NUM_ASSOC_AGENTS)
Number ofsubagentsassociatedwith oneapplication.
-- ulong No All -- SQLM_ELM_NUM_ASSOC_AGENTS
Pkg CacheHit Rate(PKG_CACHE_HIT_RATE)
Package cachehit rate.
-- float No All -- ( 1-( PKG_CACHE_INSERTS/PKG_CACHE_LOOKUPS )) * 100
Pkg CacheInserts(PKG_CACHE_INSERTS)
Number oftimes packagecache insertswerenecessarybecause therequestedsection couldnot be used.
-- ulong No All -- SQLM_ELM_PKG_CACHE_INSERTS
2-530 Working with RecordsHitachi Tuning Manager Application Reports Reference

Cache on Application (PD_DCAA)
View Name(Manager
Name)Description Sum
RuleForma
tDelt
a
Supported
Versions
Restriction
DataSource
Pkg CacheLookups(PKG_CACHE_LOOKUPS)
Number ofsection andpackagesearches inthe packagecache thatwereperformed byapplications.
-- ulong No All -- SQLM_ELM_PKG_CACHE_LOOKUPS
Record Time(RECORD_TIME)
Collection endtime for theperformancedata stored inthe record.
-- time_t No All -- AgentCollector
Record Type(INPUT_RECORD_TYPE)
Record name.This is alwaysDCAA.
-- char(8)
No All -- AgentCollector
Cache on Database (PD_DCAD)
Function
The Cache on Database (PD_DCAD) record stores information about thecache on the database level.
Table 2-279 Cache on Database (PD_DCAD) Default and ChangeableValues
Item Default Value Changeable?
Collection Interval 60 Yes
Collection Offset 0
Log No
LOGIF (Blank)
Key Fields
None
Lifetime
While one or more applications are connected to the database or thedatabase is activated.
Working with Records 2-531Hitachi Tuning Manager Application Reports Reference

Record Size
• Fixed part: 729 bytes• Variable part: 0 bytes
Table 2-280 Cache on Database (PD_DCAD) Fields
Cache on Database (PD_DCAD)
View Name(Manager
Name)Description Sum
RuleForma
tDelt
a
Supported
Versions
Restriction
DataSource
Cat CacheInserts(CAT_CACHE_INSERTS)
Number oftimes that thesystem triedto insert atabledescriptor orpermissioninformationinto thecatalog cache.
-- ulong No All -- SQLM_ELM_CAT_CACHE_INSERTS
Cat CacheLookups(CAT_CACHE_LOOKUPS)
Number oflookups in thecatalog cachefor tabledescriptorinformation orpermissioninformation.
-- ulong No All -- SQLM_ELM_CAT_CACHE_LOOKUPS
Cat CacheNeededMinisize(CAT_CACHE_NEEDED_MINISIZE)
Minimumrequiredcatalog cachesize in page (4KB) units.
-- ulong No All -- ( CAT_CACHE_SIZE_TOP+4,095 ) /4,096 +0.9(theresult isto berounded upto thenearestinteger)
Cat CacheOverflows(CAT_CACHE_OVERFLOWS)
Number oftimes thecatalog cachehasoverflowed outof theallocatedmemoryenvironment.
-- ulong No All -- SQLM_ELM_CAT_CACHE_OVERFLOWS
2-532 Working with RecordsHitachi Tuning Manager Application Reports Reference

Cache on Database (PD_DCAD)
View Name(Manager
Name)Description Sum
RuleForma
tDelt
a
Supported
Versions
Restriction
DataSource
Cat CacheSize Top(CAT_CACHE_SIZE_TOP)
Maximum sizereached by thecatalog cache,in bytes.
-- ulong No All Y SQLM_ELM_CAT_CACHE_SIZE_TOP
Catcache HitRate(CATCACHE_HIT_RATE)
Catalog cachehit rate.
-- float No All -- ( 1 -( CAT_CACHE_INSERTS/CAT_CACHE_LOOKUPS )) * 100
Interval(INTERVAL)
Interval atwhich theinformation iscollected, inseconds.
-- ulong No All -- RECORD_TIME -CURRENT_SYSTEM_BOOT_TIME
Pkg CacheHit Rate(PKG_CACHE_HIT_RATE)
Package cachehit rate.
-- float No All -- ( 1-( PKG_CACHE_INSERTS/PKG_CACHE_LOOKUPS )) * 100
Pkg CacheInserts(PKG_CACHE_INSERTS)
Number ofoccurrenceswherepackage cacheinserts werenecessarybecause therequestedsection couldnot be used.
-- ulong No All -- SQLM_ELM_PKG_CACHE_INSERTS
Pkg CacheLookups(PKG_CACHE_LOOKUPS)
The number ofsection andpackagesearches inthe packagecache thatwereperformed byapplications.
-- ulong No All -- SQLM_ELM_PKG_CACHE_LOOKUPS
Pkg CacheNeededMinisize
Minimumpackage cachesize required,in page (4 KB)units. If the
-- ulong No All -- ( PKG_CACHE_SIZE_TOP+4,095 ) /
Working with Records 2-533Hitachi Tuning Manager Application Reports Reference

Cache on Database (PD_DCAD)
View Name(Manager
Name)Description Sum
RuleForma
tDelt
a
Supported
Versions
Restriction
DataSource
(PKG_CACHE_NEEDED_MINISIZE)
monitoringtarget is DB2V9.5 or later,the correctvalue cannotbe collectedbecause theversion is notrecommended.
4,096 +0.9(theresult isto berounded upto thenearestinteger)
Pkg CacheNumOverflows(PKG_CACHE_NUM_OVERFLOWS)
Number oftimes thepackage cachehasoverflowed outof theallocatedmemoryenvironment.
-- ulong No All -- SQLM_ELM_PKG_CACHE_NUM_OVERFLOWS
Pkg CacheSize Top(PKG_CACHE_SIZE_TOP)
Maximum sizereached by thepackagecache, inbytes. If themonitoringtarget is DB2V9.5 or later,the correctvalue cannotbe collectedbecause theversion is notrecommended.
-- ulong No All Y SQLM_ELM_PKG_CACHE_SIZE_TOP
Record Time(RECORD_TIME)
Collection endtime for theperformancedata stored inthe record.
-- time_t No All -- AgentCollector
Record Type(INPUT_RECORD_TYPE)
Record name.This is alwaysDCAD.
-- char(8)
No All -- AgentCollector
Cache on Database Interval (PI_DCAI)
Function
The Cache on Database Interval (PI_DCAI) record stores information aboutthe cache on the database level, using a constant interval as a unit.
2-534 Working with RecordsHitachi Tuning Manager Application Reports Reference
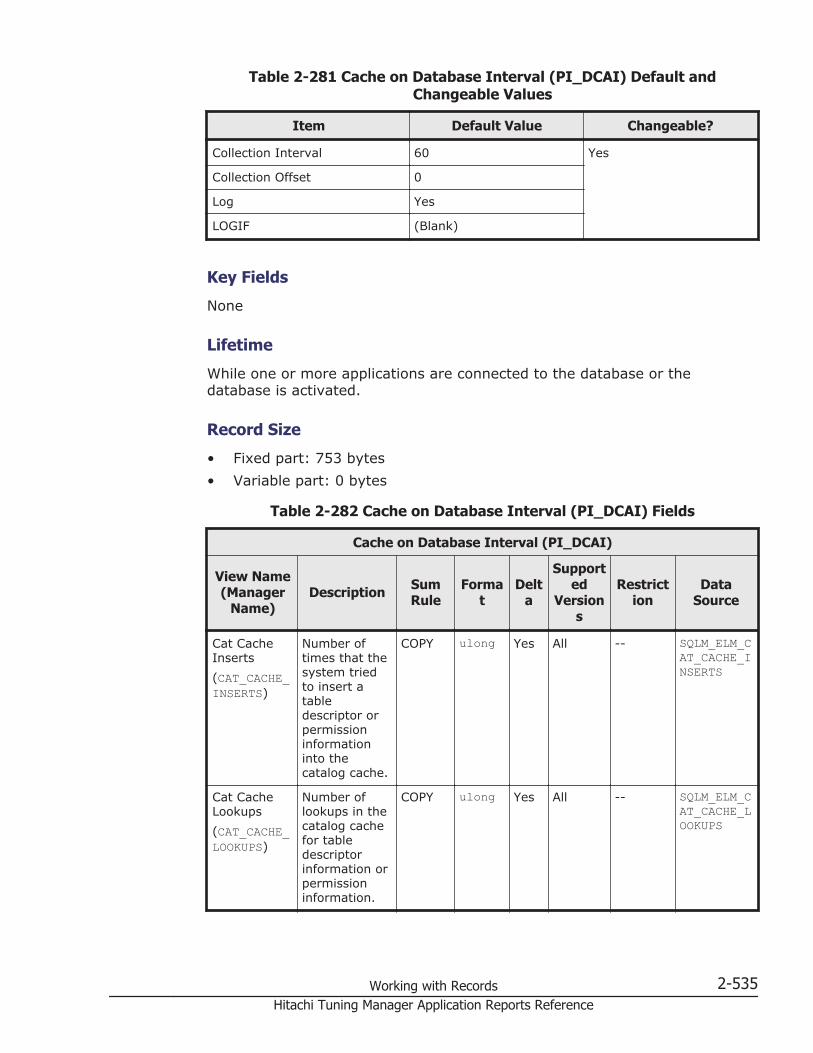
Table 2-281 Cache on Database Interval (PI_DCAI) Default andChangeable Values
Item Default Value Changeable?
Collection Interval 60 Yes
Collection Offset 0
Log Yes
LOGIF (Blank)
Key Fields
None
Lifetime
While one or more applications are connected to the database or thedatabase is activated.
Record Size
• Fixed part: 753 bytes• Variable part: 0 bytes
Table 2-282 Cache on Database Interval (PI_DCAI) Fields
Cache on Database Interval (PI_DCAI)
View Name(Manager
Name)Description Sum
RuleForma
tDelt
a
Supported
Versions
Restriction
DataSource
Cat CacheInserts(CAT_CACHE_INSERTS)
Number oftimes that thesystem triedto insert atabledescriptor orpermissioninformationinto thecatalog cache.
COPY ulong Yes All -- SQLM_ELM_CAT_CACHE_INSERTS
Cat CacheLookups(CAT_CACHE_LOOKUPS)
Number oflookups in thecatalog cachefor tabledescriptorinformation orpermissioninformation.
COPY ulong Yes All -- SQLM_ELM_CAT_CACHE_LOOKUPS
Working with Records 2-535Hitachi Tuning Manager Application Reports Reference

Cache on Database Interval (PI_DCAI)
View Name(Manager
Name)Description Sum
RuleForma
tDelt
a
Supported
Versions
Restriction
DataSource
Cat CacheNeededMinisize(CAT_CACHE_NEEDED_MINISIZE)
Minimumrequiredcatalog cachesize in page (4KB) units.
COPY ulong Yes All -- ( CAT_CACHE_SIZE_TOP+4,095 ) /4,096 +0.9(theresult isto berounded upto thenearestinteger)
Cat CacheOverflows(CAT_CACHE_OVERFLOWS)
Number oftimes thecatalog cachehasoverflowed outof theallocatedmemoryenvironment.
COPY ulong Yes All -- SQLM_ELM_CAT_CACHE_OVERFLOWS
Cat CacheSize Top(CAT_CACHE_SIZE_TOP)
Maximum sizereached by thecatalog cache,in bytes.
COPY ulong Yes All Y SQLM_ELM_CAT_CACHE_SIZE_TOP
Catcache HitRate(CATCACHE_HIT_RATE)
Catalog cachehit rate.
AVG float No All -- ( 1 -( CAT_CACHE_INSERTS/CAT_CACHE_LOOKUPS )) * 100
Interval(INTERVAL)
Interval atwhich theinformation iscollected, inseconds.
COPY ulong No All -- RECORD_TIME -CURRENT_SYSTEM_BOOT_TIME
Pkg CacheHit Rate(PKG_CACHE_HIT_RATE)
Package cachehit rate.
AVG float No All -- ( 1-( PKG_CACHE_INSERTS/PKG_CACHE_LOOKUPS )) * 100
2-536 Working with RecordsHitachi Tuning Manager Application Reports Reference

Cache on Database Interval (PI_DCAI)
View Name(Manager
Name)Description Sum
RuleForma
tDelt
a
Supported
Versions
Restriction
DataSource
Pkg CacheInserts(PKG_CACHE_INSERTS)
Total numberof occurrenceswherepackage cacheinserts werenecessarybecause therequestedsection couldnot be used.
COPY ulong Yes All -- SQLM_ELM_PKG_CACHE_INSERTS
Pkg CacheLookups(PKG_CACHE_LOOKUPS)
The number ofsection andpackagesearches inthe packagecache thatwereperformed byapplications.
COPY ulong Yes All -- SQLM_ELM_PKG_CACHE_LOOKUPS
Pkg CacheNeededMinisize(PKG_CACHE_NEEDED_MINISIZE)
Minimumpackage cachesize required,in page (4 KB)units. If themonitoringtarget is DB2V9.5 or later,the correctvalue cannotbe collectedbecause theversion is notrecommended.
COPY ulong Yes All -- ( PKG_CACHE_SIZE_TOP+4,095 ) /4,096 +0.9(theresult isto berounded upto thenearestinteger)
Pkg CacheNumOverflows(PKG_CACHE_NUM_OVERFLOWS)
Number oftimes thepackage cachehasoverflowed outof theallocatedmemoryenvironment.
COPY ulong Yes All -- SQLM_ELM_PKG_CACHE_NUM_OVERFLOWS
Pkg CacheSize Top(PKG_CACHE_SIZE_TOP)
Maximum sizereached by thepackagecache, inbytes. If themonitoring
COPY ulong Yes All Y SQLM_ELM_PKG_CACHE_SIZE_TOP
Working with Records 2-537Hitachi Tuning Manager Application Reports Reference

Cache on Database Interval (PI_DCAI)
View Name(Manager
Name)Description Sum
RuleForma
tDelt
a
Supported
Versions
Restriction
DataSource
target is DB2V9.5 or later,the correctvalue cannotbe collectedbecause theversion is notrecommended.
Record Time(RECORD_TIME)
Collection endtime for theperformancedata stored inthe record.
COPY time_t No All -- AgentCollector
Record Type(INPUT_RECORD_TYPE)
Record name.This is alwaysDCAI.
COPY char(8)
No All -- AgentCollector
DB2 Configuration (PD_DCFE)
Function
The DB2 Configuration (PD_DCFE) record stores information about DB2configuration parameters.
Table 2-283 DB2 Configuration (PD_DCFE) Default and Changeable Values
Item Default Value Changeable?
Collection Interval 3600 Yes
Collection Offset 0
Log No
LOGIF (Blank)
Key Fields
None
Lifetime
From the creation to the deletion of the database.
2-538 Working with RecordsHitachi Tuning Manager Application Reports Reference

Record Size
• Fixed part: 757 bytes• Variable part: 0 bytes
Table 2-284 DB2 Configuration (PD_DCFE) Fields
DB2 Configuration (PD_DCFE)
View Name(Manager
Name)Description Sum
RuleForma
tDelt
a
Supported
Versions
Restriction
DataSource
App Ctl HeapSZ(APP_CTL_HEAP_SZ)
Applicationcontrol heapsize, in page(4 KB) units.If themonitoringtarget is DB2V9.5 or later,the correctvalue cannotbe collectedbecause theversion is notrecommended.
-- word No All -- SQLF_DBTN_APP_CTL_HEAP_SZ
AppgroupMem SZ(APPGROUP_MEM_SZ)
Maximum sizeof theapplicationgroup memoryset, in page (4KB) units. Ifthe monitoringtarget is DB2V9.5 or later,the correctvalue cannotbe collectedbecause theversion is notrecommended.
-- ulong No All -- SQLF_DBTN_APPGROUP_MEM_SZ
ApplheapSZ(APPLHEAPSZ)
Applicationheap size, inpage (4 KB)units.
-- word No All -- SQLF_DBTN_APPLHEAPSZ
CatalogcacheSZ(CATALOGCACHE_SZ)
Catalog cachesize, in page(4 KB) units.
-- long No All -- SQLF_DBTN_CATALOGCACHE_SZ
ChngpgsThresh(CHNGPGS_THRESH)
Thresholdvalue for thenumber ofchangedpages.
-- word No All -- SQLF_DBTN_CHNGPGS_THRESH
Working with Records 2-539Hitachi Tuning Manager Application Reports Reference
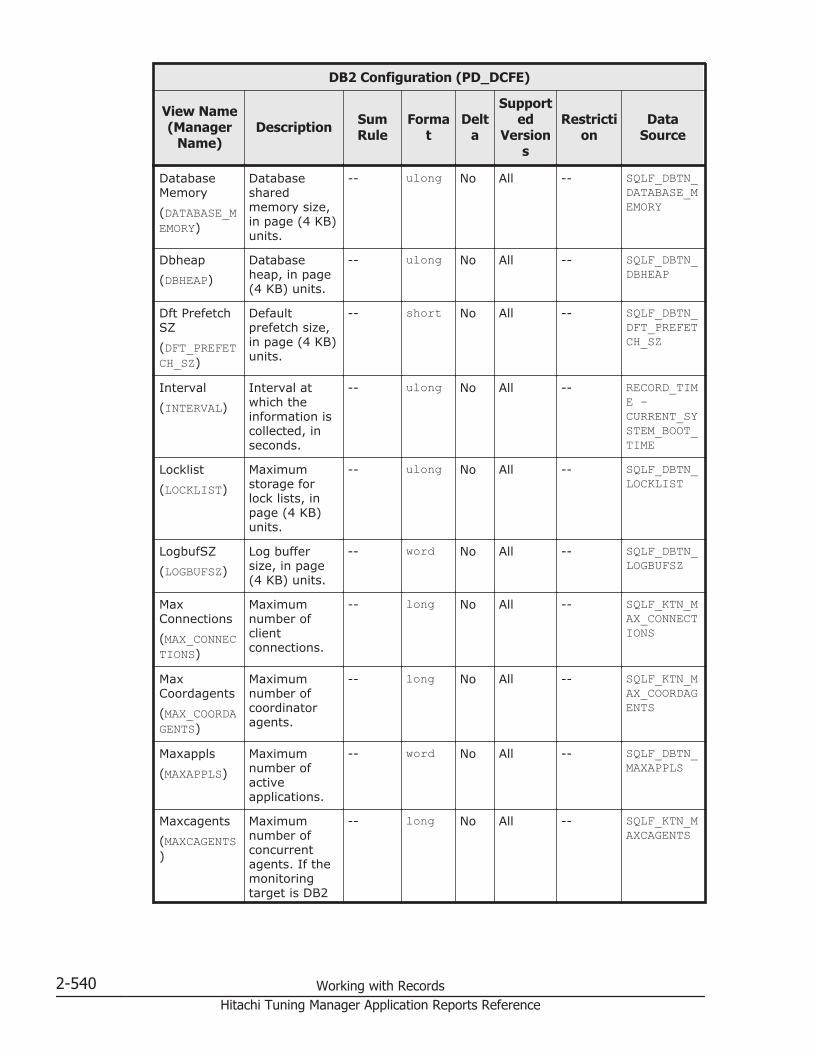
DB2 Configuration (PD_DCFE)
View Name(Manager
Name)Description Sum
RuleForma
tDelt
a
Supported
Versions
Restriction
DataSource
DatabaseMemory(DATABASE_MEMORY)
Databasesharedmemory size,in page (4 KB)units.
-- ulong No All -- SQLF_DBTN_DATABASE_MEMORY
Dbheap(DBHEAP)
Databaseheap, in page(4 KB) units.
-- ulong No All -- SQLF_DBTN_DBHEAP
Dft PrefetchSZ(DFT_PREFETCH_SZ)
Defaultprefetch size,in page (4 KB)units.
-- short No All -- SQLF_DBTN_DFT_PREFETCH_SZ
Interval(INTERVAL)
Interval atwhich theinformation iscollected, inseconds.
-- ulong No All -- RECORD_TIME -CURRENT_SYSTEM_BOOT_TIME
Locklist(LOCKLIST)
Maximumstorage forlock lists, inpage (4 KB)units.
-- ulong No All -- SQLF_DBTN_LOCKLIST
LogbufSZ(LOGBUFSZ)
Log buffersize, in page(4 KB) units.
-- word No All -- SQLF_DBTN_LOGBUFSZ
MaxConnections(MAX_CONNECTIONS)
Maximumnumber ofclientconnections.
-- long No All -- SQLF_KTN_MAX_CONNECTIONS
MaxCoordagents(MAX_COORDAGENTS)
Maximumnumber ofcoordinatoragents.
-- long No All -- SQLF_KTN_MAX_COORDAGENTS
Maxappls(MAXAPPLS)
Maximumnumber ofactiveapplications.
-- word No All -- SQLF_DBTN_MAXAPPLS
Maxcagents(MAXCAGENTS)
Maximumnumber ofconcurrentagents. If themonitoringtarget is DB2
-- long No All -- SQLF_KTN_MAXCAGENTS
2-540 Working with RecordsHitachi Tuning Manager Application Reports Reference
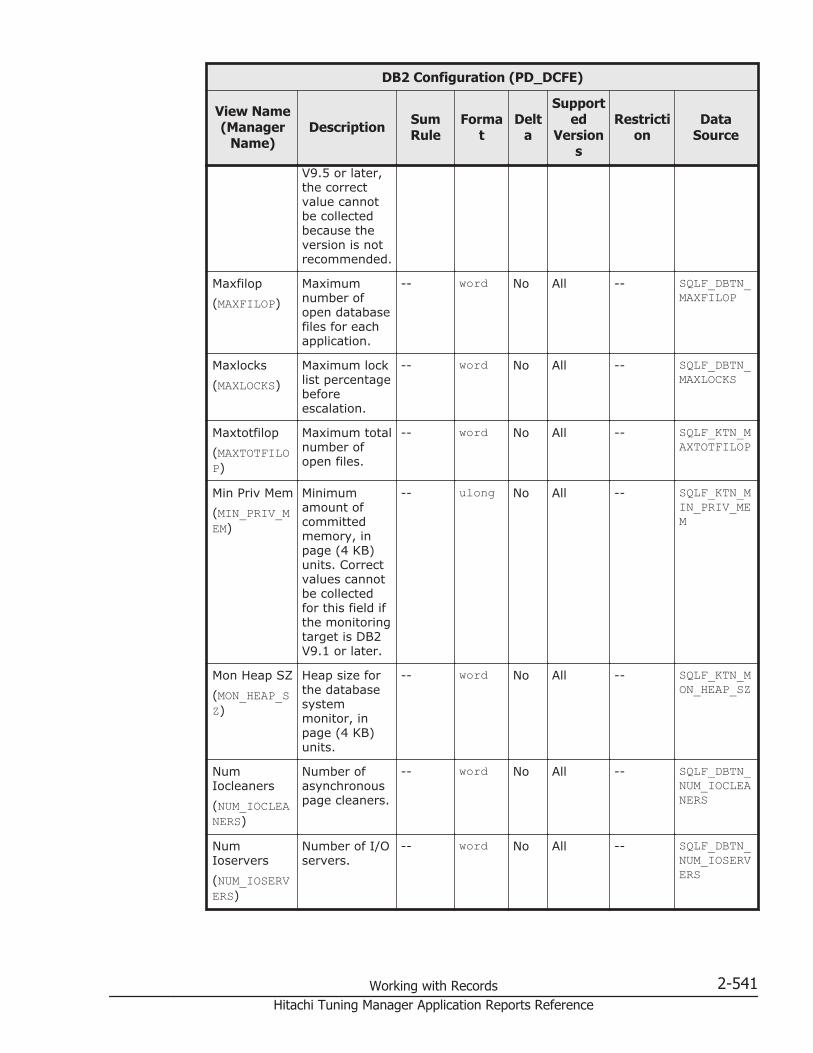
DB2 Configuration (PD_DCFE)
View Name(Manager
Name)Description Sum
RuleForma
tDelt
a
Supported
Versions
Restriction
DataSource
V9.5 or later,the correctvalue cannotbe collectedbecause theversion is notrecommended.
Maxfilop(MAXFILOP)
Maximumnumber ofopen databasefiles for eachapplication.
-- word No All -- SQLF_DBTN_MAXFILOP
Maxlocks(MAXLOCKS)
Maximum locklist percentagebeforeescalation.
-- word No All -- SQLF_DBTN_MAXLOCKS
Maxtotfilop(MAXTOTFILOP)
Maximum totalnumber ofopen files.
-- word No All -- SQLF_KTN_MAXTOTFILOP
Min Priv Mem(MIN_PRIV_MEM)
Minimumamount ofcommittedmemory, inpage (4 KB)units. Correctvalues cannotbe collectedfor this field ifthe monitoringtarget is DB2V9.1 or later.
-- ulong No All -- SQLF_KTN_MIN_PRIV_MEM
Mon Heap SZ(MON_HEAP_SZ)
Heap size forthe databasesystemmonitor, inpage (4 KB)units.
-- word No All -- SQLF_KTN_MON_HEAP_SZ
NumIocleaners(NUM_IOCLEANERS)
Number ofasynchronouspage cleaners.
-- word No All -- SQLF_DBTN_NUM_IOCLEANERS
NumIoservers(NUM_IOSERVERS)
Number of I/Oservers.
-- word No All -- SQLF_DBTN_NUM_IOSERVERS
Working with Records 2-541Hitachi Tuning Manager Application Reports Reference
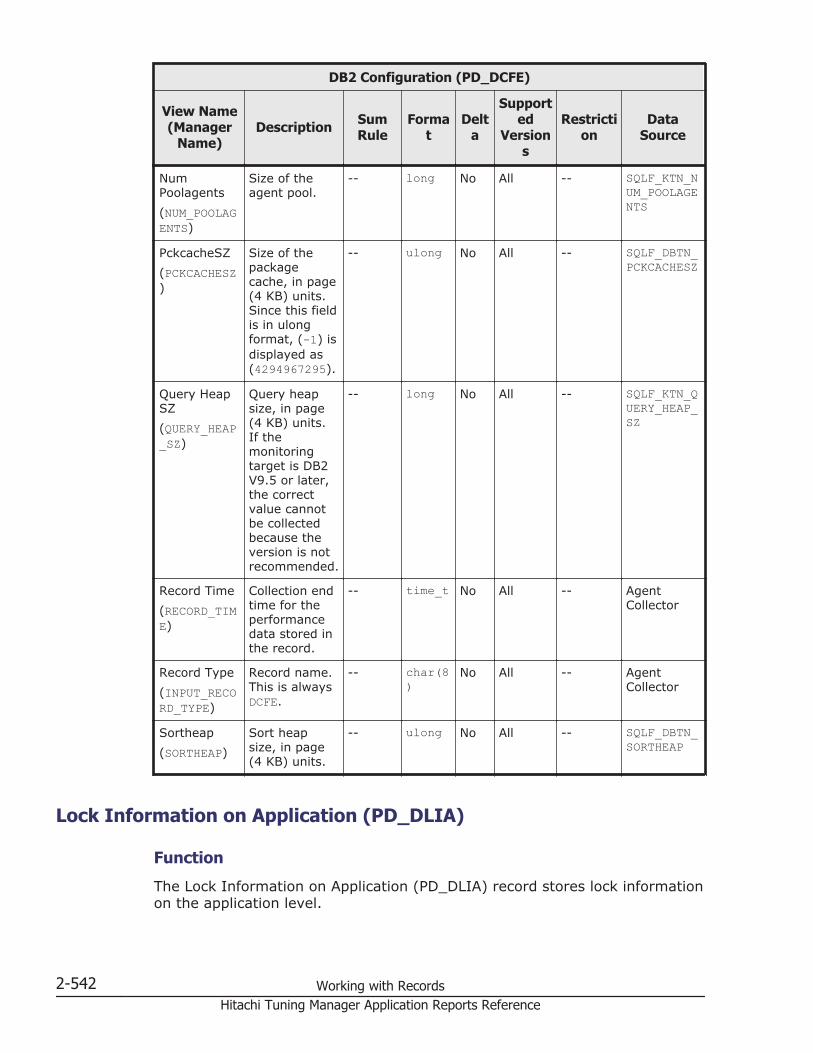
DB2 Configuration (PD_DCFE)
View Name(Manager
Name)Description Sum
RuleForma
tDelt
a
Supported
Versions
Restriction
DataSource
NumPoolagents(NUM_POOLAGENTS)
Size of theagent pool.
-- long No All -- SQLF_KTN_NUM_POOLAGENTS
PckcacheSZ(PCKCACHESZ)
Size of thepackagecache, in page(4 KB) units.Since this fieldis in ulongformat, (-1) isdisplayed as(4294967295).
-- ulong No All -- SQLF_DBTN_PCKCACHESZ
Query HeapSZ(QUERY_HEAP_SZ)
Query heapsize, in page(4 KB) units.If themonitoringtarget is DB2V9.5 or later,the correctvalue cannotbe collectedbecause theversion is notrecommended.
-- long No All -- SQLF_KTN_QUERY_HEAP_SZ
Record Time(RECORD_TIME)
Collection endtime for theperformancedata stored inthe record.
-- time_t No All -- AgentCollector
Record Type(INPUT_RECORD_TYPE)
Record name.This is alwaysDCFE.
-- char(8)
No All -- AgentCollector
Sortheap(SORTHEAP)
Sort heapsize, in page(4 KB) units.
-- ulong No All -- SQLF_DBTN_SORTHEAP
Lock Information on Application (PD_DLIA)
Function
The Lock Information on Application (PD_DLIA) record stores lock informationon the application level.
2-542 Working with RecordsHitachi Tuning Manager Application Reports Reference

Table 2-285 Lock Information on Application (PD_DLIA) Default andChangeable Values
Item Default Value Changeable?
Collection Interval 60 Yes
Collection Offset 0
Log No
LOGIF (Blank)
Key Fields
AGENT_ID
Lifetime
While an application is connected to the database.
Record Size
• Fixed part: 681 bytes• Variable part: 380 bytes
Table 2-286 Lock Information on Application (PD_DLIA) Fields
Lock Information on Application (PD_DLIA)
View Name(Manager
Name)Description Sum
RuleForma
tDelt
a
Supported
Versions
Restriction
DataSource
Agent Id(AGENT_ID)
Applicationspecific ID.
-- ulong No All -- SQLM_ELM_AGENT_ID
Appl Id(APPL_ID)
ID of anapplicationwhen itconnects tothe databaseof thedatabasemanager.
-- string(33)
No All -- SQLM_ELM_APPL_ID
Appl Name(APPL_NAME)
Name of theapplicationthat is beingexecuted onthe client.
-- string(257)
No All -- SQLM_ELM_APPL_NAME
Auth Id(AUTH_ID)
AuthorizationID of the user
-- string(33)
No All -- SQLM_ELM_AUTH_ID
Working with Records 2-543Hitachi Tuning Manager Application Reports Reference
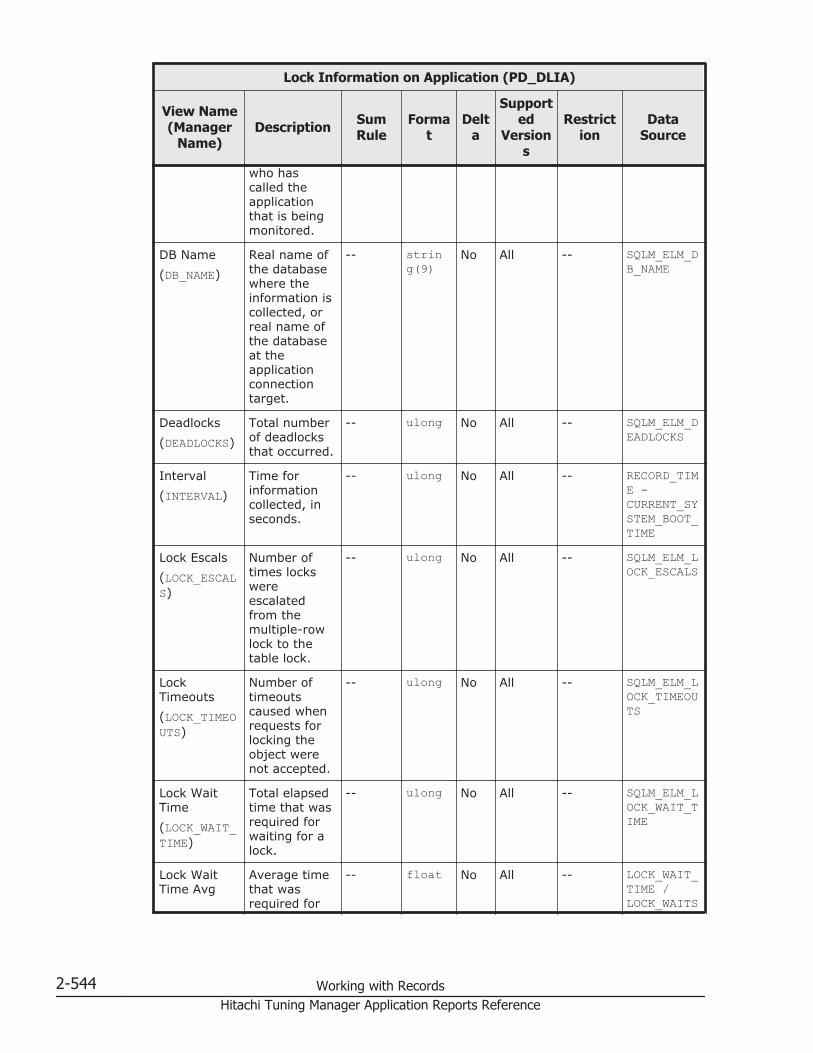
Lock Information on Application (PD_DLIA)
View Name(Manager
Name)Description Sum
RuleForma
tDelt
a
Supported
Versions
Restriction
DataSource
who hascalled theapplicationthat is beingmonitored.
DB Name(DB_NAME)
Real name ofthe databasewhere theinformation iscollected, orreal name ofthe databaseat theapplicationconnectiontarget.
-- string(9)
No All -- SQLM_ELM_DB_NAME
Deadlocks(DEADLOCKS)
Total numberof deadlocksthat occurred.
-- ulong No All -- SQLM_ELM_DEADLOCKS
Interval(INTERVAL)
Time forinformationcollected, inseconds.
-- ulong No All -- RECORD_TIME -CURRENT_SYSTEM_BOOT_TIME
Lock Escals(LOCK_ESCALS)
Number oftimes lockswereescalatedfrom themultiple-rowlock to thetable lock.
-- ulong No All -- SQLM_ELM_LOCK_ESCALS
LockTimeouts(LOCK_TIMEOUTS)
Number oftimeoutscaused whenrequests forlocking theobject werenot accepted.
-- ulong No All -- SQLM_ELM_LOCK_TIMEOUTS
Lock WaitTime(LOCK_WAIT_TIME)
Total elapsedtime that wasrequired forwaiting for alock.
-- ulong No All -- SQLM_ELM_LOCK_WAIT_TIME
Lock WaitTime Avg
Average timethat wasrequired for
-- float No All -- LOCK_WAIT_TIME /LOCK_WAITS
2-544 Working with RecordsHitachi Tuning Manager Application Reports Reference

Lock Information on Application (PD_DLIA)
View Name(Manager
Name)Description Sum
RuleForma
tDelt
a
Supported
Versions
Restriction
DataSource
(LOCK_WAIT_TIME_AVG)
waiting for alock.
Lock Waits(LOCK_WAITS)
Total numberof times theapplication orconnectionwaited for alock.
-- ulong No All -- SQLM_ELM_LOCK_WAITS
Locks Held(LOCKS_HELD)
Number oflocks that arecurrently held.
-- ulong No All -- SQLM_ELM_LOCKS_HELD
LocksWaiting(LOCKS_WAITING)
Number ofagents thatare waiting forlocks.
-- ulong No All -- SQLM_ELM_LOCKS_WAITING
Num AssocAgents(NUM_ASSOC_AGENTS)
Number ofsubagentsassociatedwith oneapplication.
-- ulong No All -- SQLM_ELM_NUM_ASSOC_AGENTS
Record_Time(RECORD_TIME)
Collection endtime for theperformancedata stored inthe record.
-- time_t No All -- AgentCollector
Record_Type(INPUT_RECORD_TYPE)
Record name.This is alwaysDLIA.
-- char(8)
Yes All -- AgentCollector
Uow LockWait Time(UOW_LOCK_WAIT_TIME)
Total elapsedtime that wasrequired forthis task unitto wait for alock.
-- ulong No All -- SQLM_ELM_UOW_LOCK_WAIT_TIME
X Lock Escals(X_LOCK_ESCALS)
Number oftimes lockswereescalatedfrom themultiple-rowlock to theexclusivetable lock.Alternatively,
-- ulong No All -- SQLM_ELM_X_LOCK_ESCALS
Working with Records 2-545Hitachi Tuning Manager Application Reports Reference

Lock Information on Application (PD_DLIA)
View Name(Manager
Name)Description Sum
RuleForma
tDelt
a
Supported
Versions
Restriction
DataSource
the number oftimes thetable lockswere changedto theexclusivelocks due tothe exclusiverow lock.
Lock Information on Database (PD_DLID)
Function
The Lock Information on Database (PD_DLID) record stores lock informationon the database level.
Table 2-287 Lock Information on Database (PD_DLID) Default andChangeable Values
Item Default Value Changeable?
Collection Interval 60 Yes
Collection Offset 0
Log No
LOGIF (Blank)
Key Fields
None
Lifetime
While one or more applications are connected to the database, or thedatabase is activated.
Record Size
• Fixed part: 721 bytes• Variable part: 0 bytes
2-546 Working with RecordsHitachi Tuning Manager Application Reports Reference
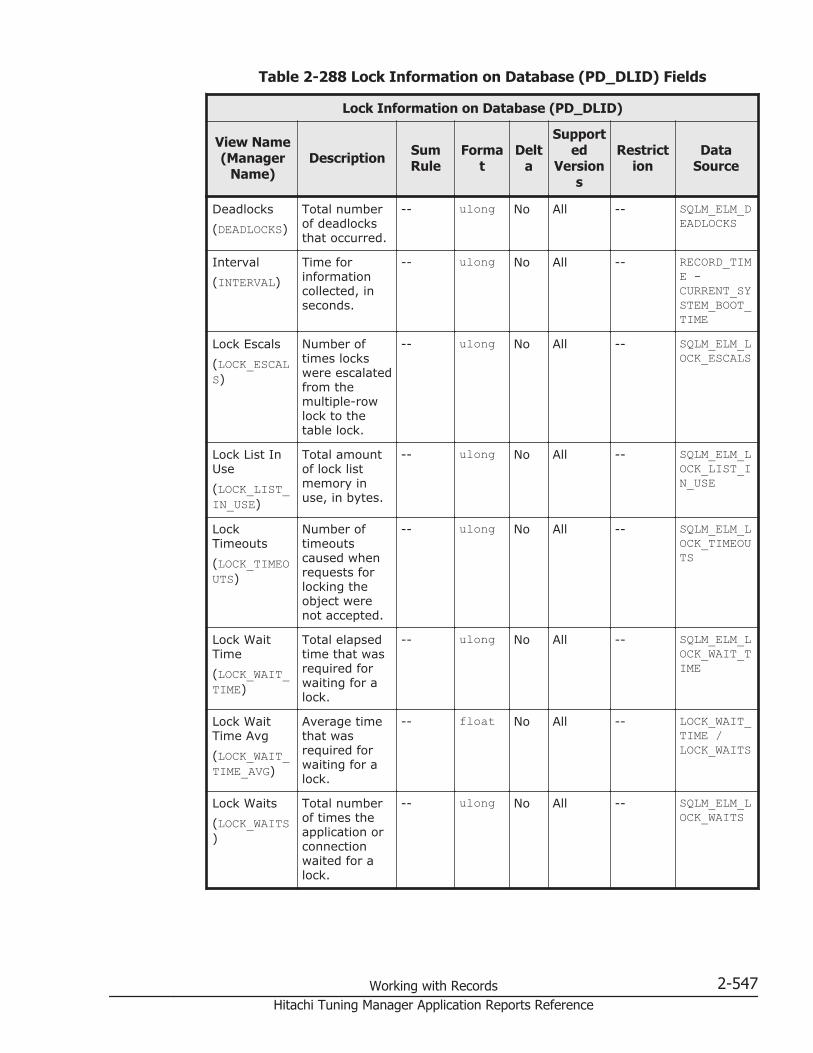
Table 2-288 Lock Information on Database (PD_DLID) Fields
Lock Information on Database (PD_DLID)
View Name(Manager
Name)Description Sum
RuleForma
tDelt
a
Supported
Versions
Restriction
DataSource
Deadlocks(DEADLOCKS)
Total numberof deadlocksthat occurred.
-- ulong No All -- SQLM_ELM_DEADLOCKS
Interval(INTERVAL)
Time forinformationcollected, inseconds.
-- ulong No All -- RECORD_TIME -CURRENT_SYSTEM_BOOT_TIME
Lock Escals(LOCK_ESCALS)
Number oftimes lockswere escalatedfrom themultiple-rowlock to thetable lock.
-- ulong No All -- SQLM_ELM_LOCK_ESCALS
Lock List InUse(LOCK_LIST_IN_USE)
Total amountof lock listmemory inuse, in bytes.
-- ulong No All -- SQLM_ELM_LOCK_LIST_IN_USE
LockTimeouts(LOCK_TIMEOUTS)
Number oftimeoutscaused whenrequests forlocking theobject werenot accepted.
-- ulong No All -- SQLM_ELM_LOCK_TIMEOUTS
Lock WaitTime(LOCK_WAIT_TIME)
Total elapsedtime that wasrequired forwaiting for alock.
-- ulong No All -- SQLM_ELM_LOCK_WAIT_TIME
Lock WaitTime Avg(LOCK_WAIT_TIME_AVG)
Average timethat wasrequired forwaiting for alock.
-- float No All -- LOCK_WAIT_TIME /LOCK_WAITS
Lock Waits(LOCK_WAITS)
Total numberof times theapplication orconnectionwaited for alock.
-- ulong No All -- SQLM_ELM_LOCK_WAITS
Working with Records 2-547Hitachi Tuning Manager Application Reports Reference

Lock Information on Database (PD_DLID)
View Name(Manager
Name)Description Sum
RuleForma
tDelt
a
Supported
Versions
Restriction
DataSource
Locks Held(LOCKS_HELD)
Number oflocks that arecurrently held.
-- ulong No All -- SQLM_ELM_LOCKS_HELD
LocksWaiting(LOCKS_WAITING)
Number ofagents thatare waiting forlocks.
-- float No All -- SQLM_ELM_LOCKS_WAITING
Record_Time(ERECORD_TIM)
Collection endtime for theperformancedata stored inthe record.
-- time_t No All -- AgentCollector
Record_Type(INPUT_RECORD_TYPE)
Record name.This is alwaysDLID
-- char(8)
No All -- AgentCollector
X Lock Escals(X_LOCK_ESCALS)
Number oftimes lockswere escalatedfrom themultiple-rowlock to theexclusive tablelock.Alternatively,the number oftimes thetable lockswere changedto theexclusive locksdue to theexclusive rowlock.
-- ulong No All -- SQLM_ELM_X_LOCK_ESCALS
Sort Status on Database (PD_DSOD)
Function
The Sort Status on Database (PD_DSOD) record stores information aboutsorting on the database level.
2-548 Working with RecordsHitachi Tuning Manager Application Reports Reference
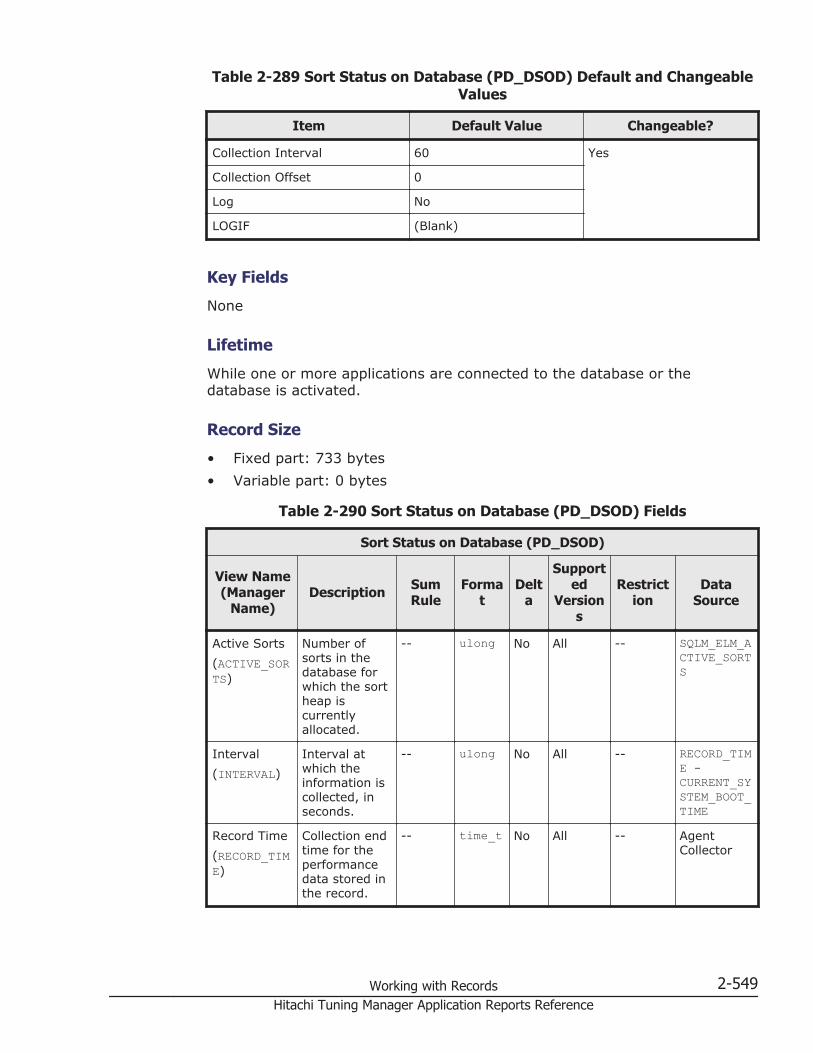
Table 2-289 Sort Status on Database (PD_DSOD) Default and ChangeableValues
Item Default Value Changeable?
Collection Interval 60 Yes
Collection Offset 0
Log No
LOGIF (Blank)
Key Fields
None
Lifetime
While one or more applications are connected to the database or thedatabase is activated.
Record Size
• Fixed part: 733 bytes• Variable part: 0 bytes
Table 2-290 Sort Status on Database (PD_DSOD) Fields
Sort Status on Database (PD_DSOD)
View Name(Manager
Name)Description Sum
RuleForma
tDelt
a
Supported
Versions
Restriction
DataSource
Active Sorts(ACTIVE_SORTS)
Number ofsorts in thedatabase forwhich the sortheap iscurrentlyallocated.
-- ulong No All -- SQLM_ELM_ACTIVE_SORTS
Interval(INTERVAL)
Interval atwhich theinformation iscollected, inseconds.
-- ulong No All -- RECORD_TIME -CURRENT_SYSTEM_BOOT_TIME
Record Time(RECORD_TIME)
Collection endtime for theperformancedata stored inthe record.
-- time_t No All -- AgentCollector
Working with Records 2-549Hitachi Tuning Manager Application Reports Reference
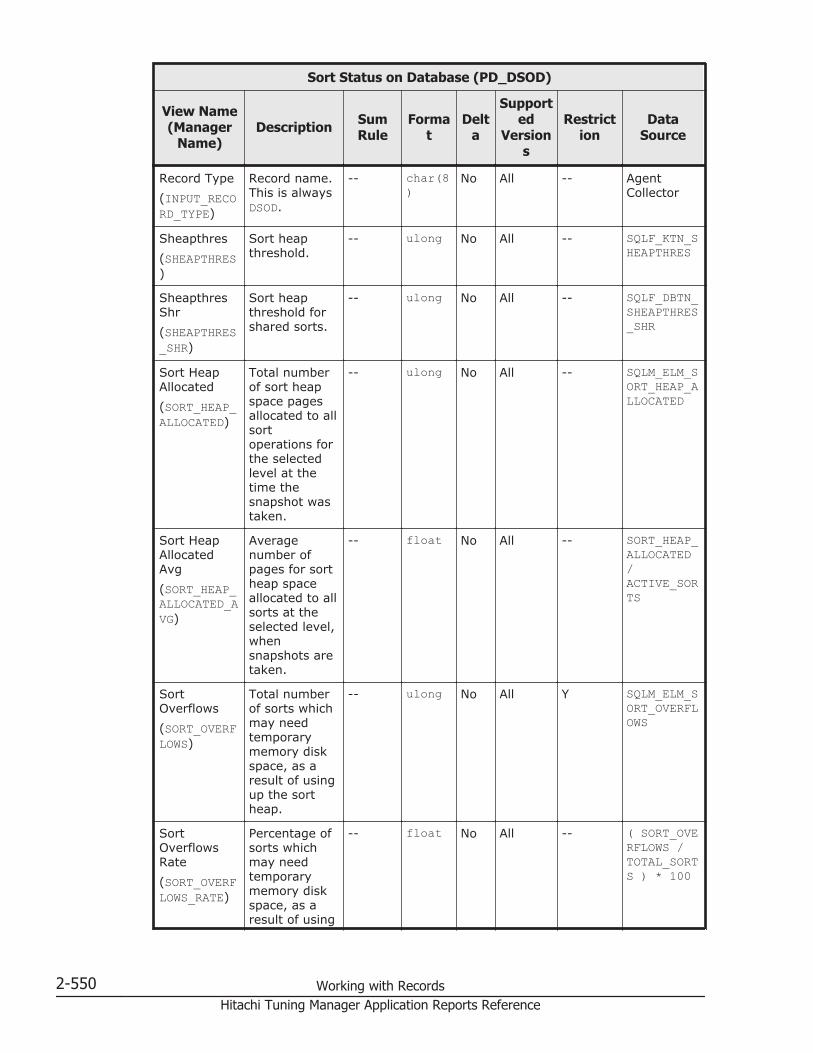
Sort Status on Database (PD_DSOD)
View Name(Manager
Name)Description Sum
RuleForma
tDelt
a
Supported
Versions
Restriction
DataSource
Record Type(INPUT_RECORD_TYPE)
Record name.This is alwaysDSOD.
-- char(8)
No All -- AgentCollector
Sheapthres(SHEAPTHRES)
Sort heapthreshold.
-- ulong No All -- SQLF_KTN_SHEAPTHRES
SheapthresShr(SHEAPTHRES_SHR)
Sort heapthreshold forshared sorts.
-- ulong No All -- SQLF_DBTN_SHEAPTHRES_SHR
Sort HeapAllocated(SORT_HEAP_ALLOCATED)
Total numberof sort heapspace pagesallocated to allsortoperations forthe selectedlevel at thetime thesnapshot wastaken.
-- ulong No All -- SQLM_ELM_SORT_HEAP_ALLOCATED
Sort HeapAllocatedAvg(SORT_HEAP_ALLOCATED_AVG)
Averagenumber ofpages for sortheap spaceallocated to allsorts at theselected level,whensnapshots aretaken.
-- float No All -- SORT_HEAP_ALLOCATED/ACTIVE_SORTS
SortOverflows(SORT_OVERFLOWS)
Total numberof sorts whichmay needtemporarymemory diskspace, as aresult of usingup the sortheap.
-- ulong No All Y SQLM_ELM_SORT_OVERFLOWS
SortOverflowsRate(SORT_OVERFLOWS_RATE)
Percentage ofsorts whichmay needtemporarymemory diskspace, as aresult of using
-- float No All -- ( SORT_OVERFLOWS /TOTAL_SORTS ) * 100
2-550 Working with RecordsHitachi Tuning Manager Application Reports Reference

Sort Status on Database (PD_DSOD)
View Name(Manager
Name)Description Sum
RuleForma
tDelt
a
Supported
Versions
Restriction
DataSource
up the sortheap.
Sort ShrheapAllocated(SORT_SHRHEAP_ALLOCATED)
Currentlyallocated sortshared heap.
-- ulong No All -- SQLM_ELM_SORT_SHRHEAP_ALLOCATED
Sort ShrheapAllocatedRate(SORT_SHRHEAP_ALLOCATED_RATE)
Shared sortmemory usagefor thedatabase.
-- float No All -- SHEAPTHRES_SHR !=0 ?( SORT_SHRHEAP_ALLOCATED /SHEAPTHRES_SHR ) *100 :( SORT_SHRHEAP_ALLOCATED /SHEAPTHRES) * 100
Sort ShrheapTop(SORT_SHRHEAP_TOP)
Maximumwatermark forthe sortshared heap.
-- ulong No All -- SQLM_ELM_SORT_SHRHEAP_TOP
Total SortTime(TOTAL_SORT_TIME)
Total timeelapsed for allexecutedsorts, inmilliseconds.
-- ulong No All -- SQLM_ELM_TOTAL_SORT_TIME
Total SortTime Avg(TOTAL_SORT_TIME_AVG)
Average timeelapsed for allexecutedsorts, inmilliseconds.
-- ulong No All -- TOTAL_SORT_TIME /TOTAL_SORTS
Total Sorts(TOTAL_SORTS)
Total numberof sortsexecuted.
-- ulong No All Y SQLM_ELM_TOTAL_SORTS
Working with Records 2-551Hitachi Tuning Manager Application Reports Reference

SQL Statement on Application (PD_DSQA)
Function
The SQL Statement on Application (PD_DSQA) record stores SQL Statementinformation on the application level. This is a multi-instance record.
Table 2-291 SQL Statement on Application (PD_DSQA) Default andChangeable Values
Item Default Value Changeable?
Collection Interval 60 Yes
Collection Offset 0
Log No
LOGIF (Blank)
Key Fields
AGENT_ID
Lifetime
While an application is connected to the database.
Record Size
• Fixed part: 681 bytes• Variable part: 424 bytes
Table 2-292 SQL Statement on Application (PD_DSQA) Fields
SQL Statement on Application (PD_DSQA)
View Name(Manager
Name)Description Sum
RuleForma
tDelt
a
Supported
Versions
Restriction
DataSource
Agent Id(AGENT_ID)
Applicationspecific ID.
-- ulong No All -- SQLM_ELM_AGENT_ID
Appl Id(APPL_ID)
ID for anapplicationwhen itconnects to adatabase ofthe databasemanager.
-- string(33)
No All -- SQLM_ELM_APPL_ID
Appl Name(APPL_NAME)
Name of theapplicationthat is being
-- string(257)
No All -- SQLM_ELM_APPL_NAME
2-552 Working with RecordsHitachi Tuning Manager Application Reports Reference
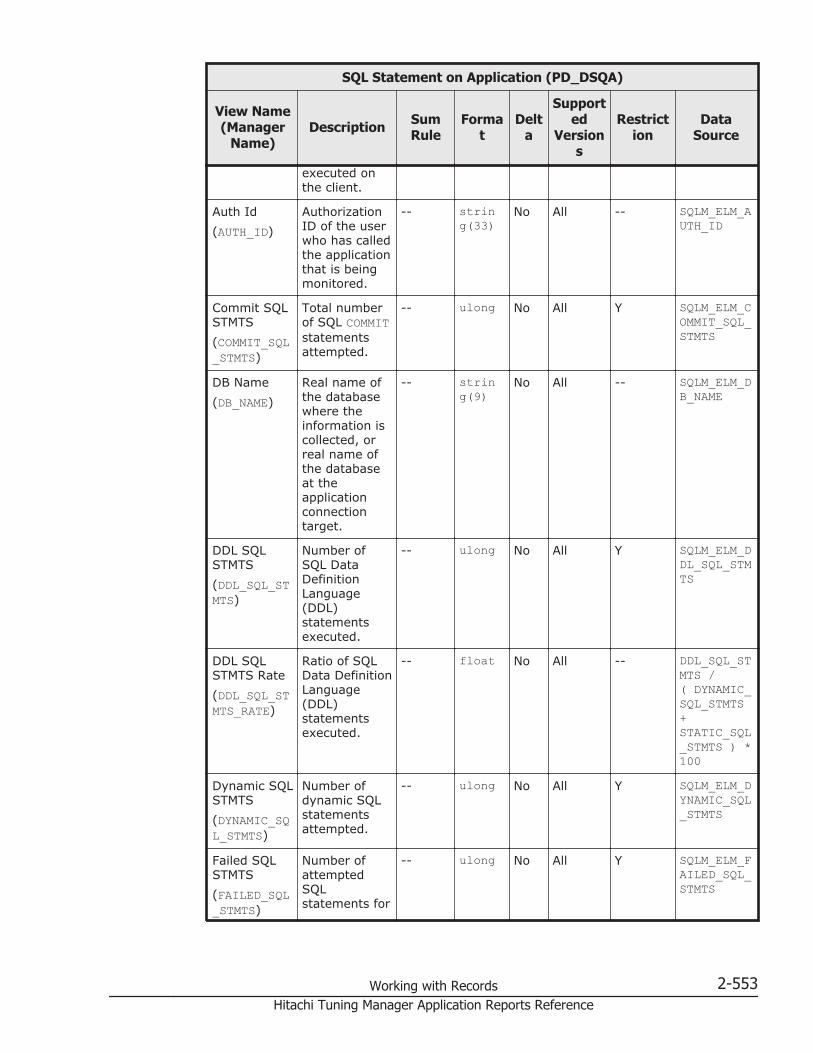
SQL Statement on Application (PD_DSQA)
View Name(Manager
Name)Description Sum
RuleForma
tDelt
a
Supported
Versions
Restriction
DataSource
executed onthe client.
Auth Id(AUTH_ID)
AuthorizationID of the userwho has calledthe applicationthat is beingmonitored.
-- string(33)
No All -- SQLM_ELM_AUTH_ID
Commit SQLSTMTS(COMMIT_SQL_STMTS)
Total numberof SQL COMMITstatementsattempted.
-- ulong No All Y SQLM_ELM_COMMIT_SQL_STMTS
DB Name(DB_NAME)
Real name ofthe databasewhere theinformation iscollected, orreal name ofthe databaseat theapplicationconnectiontarget.
-- string(9)
No All -- SQLM_ELM_DB_NAME
DDL SQLSTMTS(DDL_SQL_STMTS)
Number ofSQL DataDefinitionLanguage(DDL)statementsexecuted.
-- ulong No All Y SQLM_ELM_DDL_SQL_STMTS
DDL SQLSTMTS Rate(DDL_SQL_STMTS_RATE)
Ratio of SQLData DefinitionLanguage(DDL)statementsexecuted.
-- float No All -- DDL_SQL_STMTS /( DYNAMIC_SQL_STMTS+STATIC_SQL_STMTS ) *100
Dynamic SQLSTMTS(DYNAMIC_SQL_STMTS)
Number ofdynamic SQLstatementsattempted.
-- ulong No All Y SQLM_ELM_DYNAMIC_SQL_STMTS
Failed SQLSTMTS(FAILED_SQL_STMTS)
Number ofattemptedSQLstatements for
-- ulong No All Y SQLM_ELM_FAILED_SQL_STMTS
Working with Records 2-553Hitachi Tuning Manager Application Reports Reference
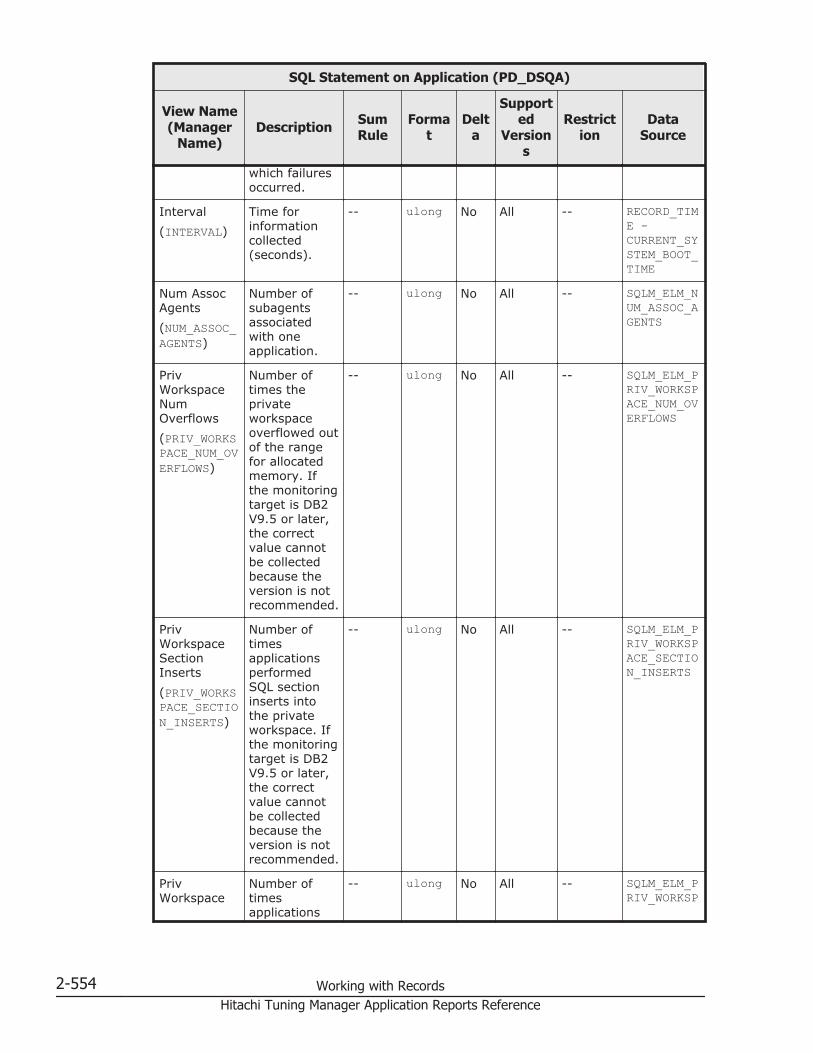
SQL Statement on Application (PD_DSQA)
View Name(Manager
Name)Description Sum
RuleForma
tDelt
a
Supported
Versions
Restriction
DataSource
which failuresoccurred.
Interval(INTERVAL)
Time forinformationcollected(seconds).
-- ulong No All -- RECORD_TIME -CURRENT_SYSTEM_BOOT_TIME
Num AssocAgents(NUM_ASSOC_AGENTS)
Number ofsubagentsassociatedwith oneapplication.
-- ulong No All -- SQLM_ELM_NUM_ASSOC_AGENTS
PrivWorkspaceNumOverflows(PRIV_WORKSPACE_NUM_OVERFLOWS)
Number oftimes theprivateworkspaceoverflowed outof the rangefor allocatedmemory. Ifthe monitoringtarget is DB2V9.5 or later,the correctvalue cannotbe collectedbecause theversion is notrecommended.
-- ulong No All -- SQLM_ELM_PRIV_WORKSPACE_NUM_OVERFLOWS
PrivWorkspaceSectionInserts(PRIV_WORKSPACE_SECTION_INSERTS)
Number oftimesapplicationsperformedSQL sectioninserts intothe privateworkspace. Ifthe monitoringtarget is DB2V9.5 or later,the correctvalue cannotbe collectedbecause theversion is notrecommended.
-- ulong No All -- SQLM_ELM_PRIV_WORKSPACE_SECTION_INSERTS
PrivWorkspace
Number oftimesapplications
-- ulong No All -- SQLM_ELM_PRIV_WORKSP
2-554 Working with RecordsHitachi Tuning Manager Application Reports Reference
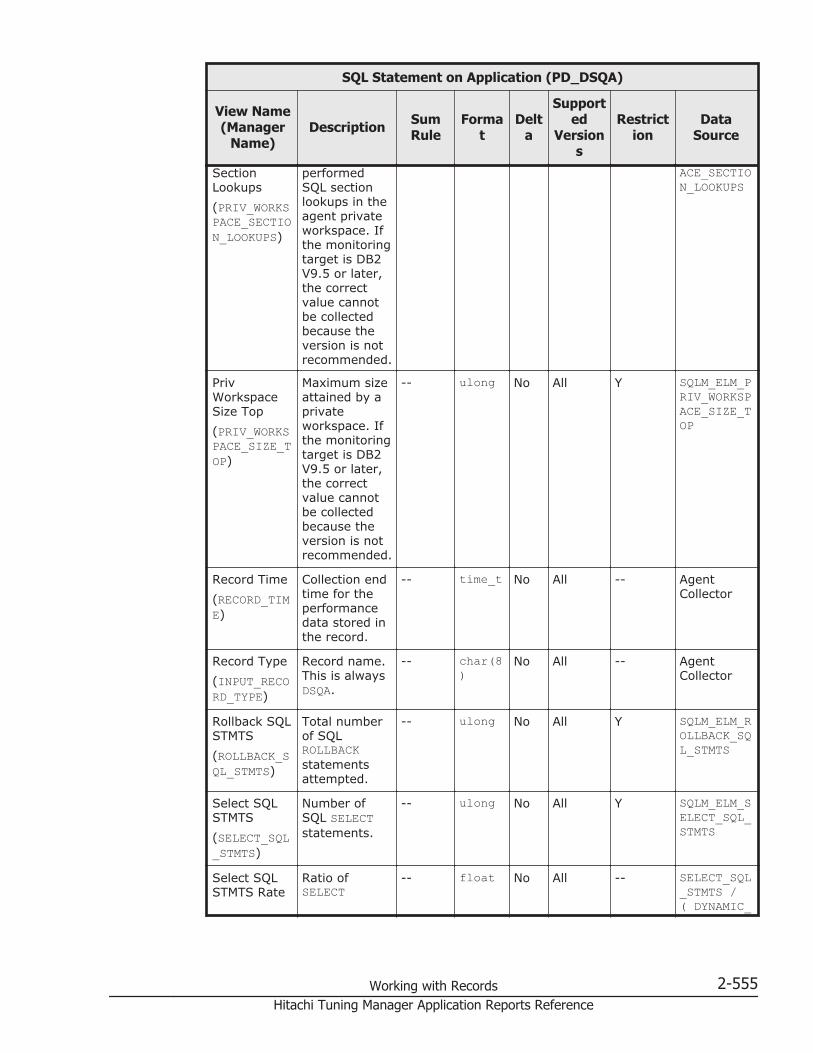
SQL Statement on Application (PD_DSQA)
View Name(Manager
Name)Description Sum
RuleForma
tDelt
a
Supported
Versions
Restriction
DataSource
SectionLookups(PRIV_WORKSPACE_SECTION_LOOKUPS)
performedSQL sectionlookups in theagent privateworkspace. Ifthe monitoringtarget is DB2V9.5 or later,the correctvalue cannotbe collectedbecause theversion is notrecommended.
ACE_SECTION_LOOKUPS
PrivWorkspaceSize Top(PRIV_WORKSPACE_SIZE_TOP)
Maximum sizeattained by aprivateworkspace. Ifthe monitoringtarget is DB2V9.5 or later,the correctvalue cannotbe collectedbecause theversion is notrecommended.
-- ulong No All Y SQLM_ELM_PRIV_WORKSPACE_SIZE_TOP
Record Time(RECORD_TIME)
Collection endtime for theperformancedata stored inthe record.
-- time_t No All -- AgentCollector
Record Type(INPUT_RECORD_TYPE)
Record name.This is alwaysDSQA.
-- char(8)
No All -- AgentCollector
Rollback SQLSTMTS(ROLLBACK_SQL_STMTS)
Total numberof SQLROLLBACKstatementsattempted.
-- ulong No All Y SQLM_ELM_ROLLBACK_SQL_STMTS
Select SQLSTMTS(SELECT_SQL_STMTS)
Number ofSQL SELECTstatements.
-- ulong No All Y SQLM_ELM_SELECT_SQL_STMTS
Select SQLSTMTS Rate
Ratio ofSELECT
-- float No All -- SELECT_SQL_STMTS /( DYNAMIC_
Working with Records 2-555Hitachi Tuning Manager Application Reports Reference

SQL Statement on Application (PD_DSQA)
View Name(Manager
Name)Description Sum
RuleForma
tDelt
a
Supported
Versions
Restriction
DataSource
(SELECT_SQL_STMTS_RATE)
statements toall statements.
SQL_STMTS+STATIC_SQL_STMTS ) *100
ShrWorkspaceHit Rate(SHR_WORKSPACE_HIT_RATE)
Sharedworkspace hitrate. If themonitoringtarget is DB2V9.5 or later,the correctvalue cannotbe collectedbecause theversion is notrecommended.
-- float No All -- ( 1 -( SHR_WORKSPACE_SECTION_INSERTS /SHR_WORKSPACE_SECTION_LOOKUPS) ) * 100
ShrWorkspaceNumOverflows(SHR_WORKSPACE_NUM_OVERFLOWS)
Number oftimes thesharedworkspaceoverflowed outof the rangefor allocatedmemory. Ifthe monitoringtarget is DB2V9.5 or later,the correctvalue cannotbe collectedbecause theversion is notrecommended.
-- ulong No All -- SQLM_ELM_SHR_WORKSPACE_NUM_OVERFLOWS
ShrWorkspaceSectionInserts(SHR_WORKSPACE_SECTION_INSERTS)
Number oftimesapplicationsperformedSQL sectioninserts intothe sharedworkspace. Ifthe monitoringtarget is DB2V9.5 or later,the correctvalue cannotbe collectedbecause the
-- ulong No All -- SQLM_ELM_SHR_WORKSPACE_SECTION_INSERTS
2-556 Working with RecordsHitachi Tuning Manager Application Reports Reference

SQL Statement on Application (PD_DSQA)
View Name(Manager
Name)Description Sum
RuleForma
tDelt
a
Supported
Versions
Restriction
DataSource
version is notrecommended.
ShrWorkspaceSectionLookups(SHR_WORKSPACE_SECTION_LOOKUPS)
Number oftimesapplicationsperformedSQL sectionlookups in thesharedworkspace. Ifthe monitoringtarget is DB2V9.5 or later,the correctvalue cannotbe collectedbecause theversion is notrecommended.
-- ulong No All -- SQLM_ELM_SHR_WORKSPACE_SECTION_LOOKUPS
ShrWorkspaceSize Top(SHR_WORKSPACE_SIZE_TOP)
Maximum sizeattained by asharedworkspace. Ifthe monitoringtarget is DB2V9.5 or later,the correctvalue cannotbe collectedbecause theversion is notrecommended.
-- ulong No All Y SQLM_ELM_SHR_WORKSPACE_SIZE_TOP
Static SQLSTMTS(STATIC_SQL_STMTS)
Number ofstatic SQLstatementsattempted.
-- ulong No All Y SQLM_ELM_STATIC_SQL_STMTS
ThroughtputSQL STMTS(THROUGHTPUT_SQL_STMTS)
Total numberof successfulSQLstatements.
-- ulong No All -- ( DYNAMIC_SQL_STMTS+STATIC_SQL_STMTS ) -FAILED_SQL_STMTS
UID SQLSTMTS(UID_SQL_STMTS)
Number ofSQL UPDATE,INSERT, andDELETE
-- ulong No All Y SQLM_ELM_UID_SQL_STMTS
Working with Records 2-557Hitachi Tuning Manager Application Reports Reference

SQL Statement on Application (PD_DSQA)
View Name(Manager
Name)Description Sum
RuleForma
tDelt
a
Supported
Versions
Restriction
DataSource
statementsexecuted.
UID SQLSTMTS Rate(UID_SQL_STMTS_RATE)
Ratio of SQLUPDATE,INSERT, andDELETEstatementsexecuted.
-- float No All -- UID_SQL_STMTS /( DYNAMIC_SQL_STMTS+STATIC_SQL_STMTS ) *100
SQL Statement on Database (PD_DSQD)
Function
The SQL Statement on Database (PD_DSQD) record stores information aboutSQL statements on the database level.
Table 2-293 SQL Statement on Database (PD_DSQD) Default andChangeable Values
Item Default Value Changeable?
Collection Interval 60 Yes
Collection Offset 0
Log No
LOGIF (Blank)
Key Fields
None
Lifetime
While one or more applications are connected to the database or thedatabase is activated.
Record Size
• Fixed part: 765 bytes• Variable part: 0 bytes
2-558 Working with RecordsHitachi Tuning Manager Application Reports Reference

Table 2-294 SQL Statement on Database (PD_DSQD) Fields
SQL Statement on Database (PD_DSQD)
View Name(Manager
Name)Description Sum
RuleForma
tDelt
a
Supported
Versions
Restriction
DataSource
Commit SQLSTMTS(COMMIT_SQL_STMTS)
Total numberof SQL COMMITstatementsattempted.
-- ulong No All Y SQLM_ELM_COMMIT_SQL_STMTS
DDL SQLSTMTS(DDL_SQL_STMTS)
Number ofSQL DataDefinitionLanguage(DDL)statementsexecuted.
-- ulong No All Y SQLM_ELM_DDL_SQL_STMTS
DDL SQLSTMTS Rate(DDL_SQL_STMTS_RATE)
Ratio of SQLData DefinitionLanguage(DDL)statementsexecuted.
-- float No All -- DDL_SQL_STMTS /( DYNAMIC_SQL_STMTS+STATIC_SQL_STMTS ) *100
Dynamic SQLSTMTS(DYNAMIC_SQL_STMTS)
Number ofdynamic SQLstatementsattempted.
-- ulong No All Y SQLM_ELM_DYNAMIC_SQL_STMTS
Failed SQLSTMTS(FAILED_SQL_STMTS)
Number ofattemptedSQLstatements forwhich failuresoccurred.
-- ulong No All Y SQLM_ELM_FAILED_SQL_STMTS
Interval(INTERVAL)
Interval atwhich theinformationcollected, inseconds.
-- ulong No All -- RECORD_TIME -CURRENT_SYSTEM_BOOT_TIME
PrivWorkspaceNumOverflows(PRIV_WORKSPACE_NUM_OVERFLOWS)
Number oftimes theprivateworkspaceoverflowed outof theboundary forthe allocatedmemory. Ifthe monitoringtarget is DB2
-- ulong No All -- SQLM_ELM_PRIV_WORKSPACE_NUM_OVERFLOWS
Working with Records 2-559Hitachi Tuning Manager Application Reports Reference

SQL Statement on Database (PD_DSQD)
View Name(Manager
Name)Description Sum
RuleForma
tDelt
a
Supported
Versions
Restriction
DataSource
V9.5 or later,the correctvalue cannotbe collectedbecause theversion is notrecommended.
PrivWorkspaceSectionInserts(PRIV_WORKSPACE_SECTION_INSERTS)
Number oftimesapplicationsperformedSQL sectioninserts intothe privateworkspace. Ifthe monitoringtarget is DB2V9.5 or later,the correctvalue cannotbe collectedbecause theversion is notrecommended.
-- ulong No All -- SQLM_ELM_PRIV_WORKSPACE_SECTION_INSERTS
PrivWorkspaceSectionLookups(PRIV_WORKSPACE_SECTION_LOOKUPS)
Number oftimesapplicationsperformedSQL sectionlookups in theagent privateworkspace. Ifthe monitoringtarget is DB2V9.5 or later,the correctvalue cannotbe collectedbecause theversion is notrecommended.
-- ulong No All -- SQLM_ELM_PRIV_WORKSPACE_SECTION_LOOKUPS
PrivWorkspaceSize Top(PRIV_WORKSPACE_SIZE_TOP)
Maximum sizeattained by aprivateworkspace. Ifthe monitoringtarget is DB2V9.5 or later,the correct
-- ulong No All Y SQLM_ELM_PRIV_WORKSPACE_SIZE_TOP
2-560 Working with RecordsHitachi Tuning Manager Application Reports Reference

SQL Statement on Database (PD_DSQD)
View Name(Manager
Name)Description Sum
RuleForma
tDelt
a
Supported
Versions
Restriction
DataSource
value cannotbe collectedbecause theversion is notrecommended.
Record Time(RECORD_TIME)
Collection endtime for theperformancedata stored inthe record.
-- time_t No All -- AgentCollector
Record Type(INPUT_RECORD_TYPE)
Record name.This is alwaysDSQD.
-- char(8)
No All -- AgentCollector
Rollback SQLSTMTS(ROLLBACK_SQL_STMTS)
Total numberof SQLROLLBACKstatementsattempted.
-- ulong No All Y SQLM_ELM_ROLLBACK_SQL_STMTS
Select SQLSTMTS(SELECT_SQL_STMTS)
Number ofSQL SELECTstatements.
-- ulong No All Y SQLM_ELM_SELECT_SQL_STMTS
Select SQLSTMTS Rate(SELECT_SQL_STMTS_RATE)
Ratio ofSELECTstatements toall statements.
-- float No All -- SELECT_SQL_STMTS /( DYNAMIC_SQL_STMTS+STATIC_SQL_STMTS ) *100
ShrWorkspaceHit Rate(SHR_WORKSPACE_HIT_RATE)
Sharedworkspace hitrate. If themonitoringtarget is DB2V9.5 or later,the correctvalue cannotbe collectedbecause theversion is notrecommended.
-- float No All -- ( 1 -( SHR_WORKSPACE_SECTION_INSERTS /SHR_WORKSPACE_SECTION_LOOKUPS) ) * 100
ShrWorkspaceNumOverflows
Number oftimes thesharedworkspaceoverflowed out
-- ulong No All -- SQLM_ELM_SHR_WORKSPACE_NUM_OVERFLOWS
Working with Records 2-561Hitachi Tuning Manager Application Reports Reference

SQL Statement on Database (PD_DSQD)
View Name(Manager
Name)Description Sum
RuleForma
tDelt
a
Supported
Versions
Restriction
DataSource
(SHR_WORKSPACE_NUM_OVERFLOWS)
of theboundary forthe allocatedmemory. Ifthe monitoringtarget is DB2V9.5 or later,the correctvalue cannotbe collectedbecause theversion is notrecommended.
ShrWorkspaceSectionInserts(SHR_WORKSPACE_SECTION_INSERTS)
Number oftimesapplicationsperformedSQL sectioninserts intothe sharedworkspace. Ifthe monitoringtarget is DB2V9.5 or later,the correctvalue cannotbe collectedbecause theversion is notrecommended.
-- ulong No All -- SQLM_ELM_SHR_WORKSPACE_SECTION_INSERTS
ShrWorkspaceSectionLookups(SHR_WORKSPACE_SECTION_LOOKUPS)
Number oftimesapplicationsperformedSQL sectionlookups in thesharedworkspace. Ifthe monitoringtarget is DB2V9.5 or later,the correctvalue cannotbe collectedbecause theversion is notrecommended.
-- ulong No All -- SQLM_ELM_SHR_WORKSPACE_SECTION_LOOKUPS
ShrWorkspaceSize Top
Maximum sizeattained by asharedworkspace. If
-- ulong No All Y SQLM_ELM_SHR_WORKSPACE_SIZE_TOP
2-562 Working with RecordsHitachi Tuning Manager Application Reports Reference

SQL Statement on Database (PD_DSQD)
View Name(Manager
Name)Description Sum
RuleForma
tDelt
a
Supported
Versions
Restriction
DataSource
(SHR_WORKSPACE_SIZE_TOP)
the monitoringtarget is DB2V9.5 or later,the correctvalue cannotbe collectedbecause theversion is notrecommended.
Static SQLSTMTS(STATIC_SQL_STMTS)
Number ofstatic SQLstatementsattempted.
-- ulong No All Y SQLM_ELM_STATIC_SQL_STMTS
ThroughtputSQL STMTS(THROUGHTPUT_SQL_STMTS)
Total numberof successfulSQLstatements.
-- ulong No All -- ( DYNAMIC_SQL_STMTS+STATIC_SQL_STMTS ) -FAILED_SQL_STMTS
UID SQLSTMTS(UID_SQL_STMTS)
Number ofSQL UPDATE,INSERT, andDELETEstatementsexecuted.
-- ulong No All Y SQLM_ELM_UID_SQL_STMTS
UID SQLSTMTS Rate(UID_SQL_STMTS_RATE)
Ratio of SQLUPDATE,INSERT, andDELETEstatementsexecuted.
-- float No All -- UID_SQL_STMTS /( DYNAMIC_SQL_STMTS+STATIC_SQL_STMTS ) *100
Tablespace Information on DB (PD_DTID)
Function
The Tablespace Information on DB (PD_DTID) record stores tablespaceinformation. This is a multi-instance record.
Working with Records 2-563Hitachi Tuning Manager Application Reports Reference
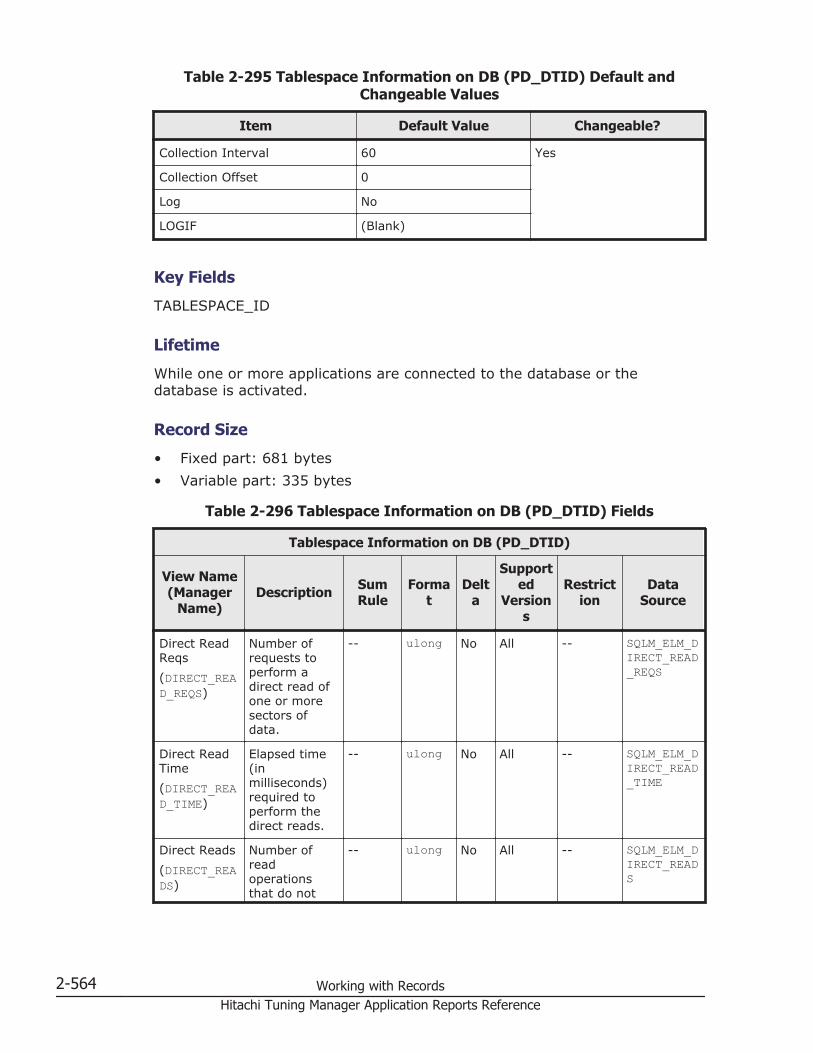
Table 2-295 Tablespace Information on DB (PD_DTID) Default andChangeable Values
Item Default Value Changeable?
Collection Interval 60 Yes
Collection Offset 0
Log No
LOGIF (Blank)
Key Fields
TABLESPACE_ID
Lifetime
While one or more applications are connected to the database or thedatabase is activated.
Record Size
• Fixed part: 681 bytes• Variable part: 335 bytes
Table 2-296 Tablespace Information on DB (PD_DTID) Fields
Tablespace Information on DB (PD_DTID)
View Name(Manager
Name)Description Sum
RuleForma
tDelt
a
Supported
Versions
Restriction
DataSource
Direct ReadReqs(DIRECT_READ_REQS)
Number ofrequests toperform adirect read ofone or moresectors ofdata.
-- ulong No All -- SQLM_ELM_DIRECT_READ_REQS
Direct ReadTime(DIRECT_READ_TIME)
Elapsed time(inmilliseconds)required toperform thedirect reads.
-- ulong No All -- SQLM_ELM_DIRECT_READ_TIME
Direct Reads(DIRECT_READS)
Number ofreadoperationsthat do not
-- ulong No All -- SQLM_ELM_DIRECT_READS
2-564 Working with RecordsHitachi Tuning Manager Application Reports Reference
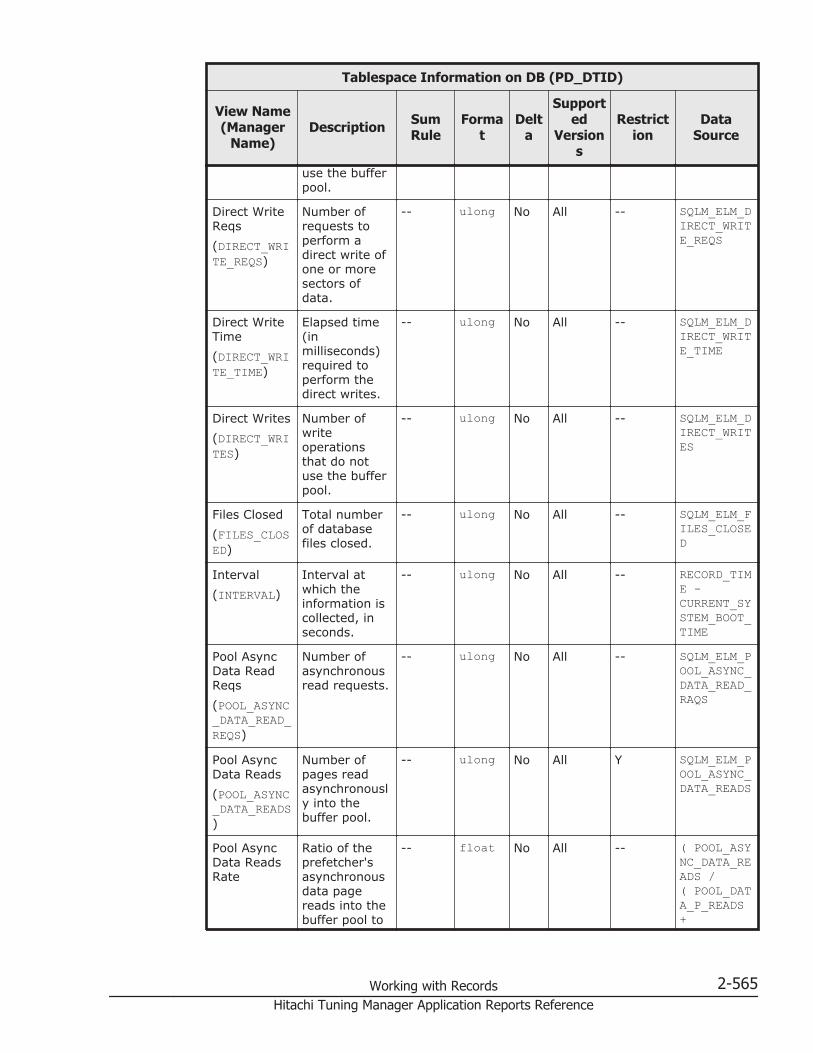
Tablespace Information on DB (PD_DTID)
View Name(Manager
Name)Description Sum
RuleForma
tDelt
a
Supported
Versions
Restriction
DataSource
use the bufferpool.
Direct WriteReqs(DIRECT_WRITE_REQS)
Number ofrequests toperform adirect write ofone or moresectors ofdata.
-- ulong No All -- SQLM_ELM_DIRECT_WRITE_REQS
Direct WriteTime(DIRECT_WRITE_TIME)
Elapsed time(inmilliseconds)required toperform thedirect writes.
-- ulong No All -- SQLM_ELM_DIRECT_WRITE_TIME
Direct Writes(DIRECT_WRITES)
Number ofwriteoperationsthat do notuse the bufferpool.
-- ulong No All -- SQLM_ELM_DIRECT_WRITES
Files Closed(FILES_CLOSED)
Total numberof databasefiles closed.
-- ulong No All -- SQLM_ELM_FILES_CLOSED
Interval(INTERVAL)
Interval atwhich theinformation iscollected, inseconds.
-- ulong No All -- RECORD_TIME -CURRENT_SYSTEM_BOOT_TIME
Pool AsyncData ReadReqs(POOL_ASYNC_DATA_READ_REQS)
Number ofasynchronousread requests.
-- ulong No All -- SQLM_ELM_POOL_ASYNC_DATA_READ_RAQS
Pool AsyncData Reads(POOL_ASYNC_DATA_READS)
Number ofpages readasynchronously into thebuffer pool.
-- ulong No All Y SQLM_ELM_POOL_ASYNC_DATA_READS
Pool AsyncData ReadsRate
Ratio of theprefetcher'sasynchronousdata pagereads into thebuffer pool to
-- float No All -- ( POOL_ASYNC_DATA_READS /( POOL_DATA_P_READS+
Working with Records 2-565Hitachi Tuning Manager Application Reports Reference

Tablespace Information on DB (PD_DTID)
View Name(Manager
Name)Description Sum
RuleForma
tDelt
a
Supported
Versions
Restriction
DataSource
(POOL_ASYNC_DATA_READS_RATE)
the number ofread requestsrequiring I/Ofor enteringdata pagesinto the bufferpool.
POOL_TEMP_DATA_P_READS ) ) *100
Pool AsyncData Writes(POOL_ASYNC_DATA_WRITES)
Number oftimes a bufferpool data pagewas physicallywritten to diskby either anasynchronouspage cleaner,or aprefetcher.
-- ulong No All Y SQLM_ELM_POOL_ASYNC_DATA_WRITES
Pool AsyncData WritesRate(POOL_ASYNC_DATA_WRITES_RATE)
Ratio ofphysical diskwrites forbuffer pooldata pageswritten by theasynchronouspage cleaneror prefetcher,to the numberof physicaldisk writes forbuffer pooldata pages.
-- float No All -- POOL_ASYNC_DATA_WRITES /POOL_DATA_WRITES *100
Pool AsyncIndex Reads(POOL_ASYNC_INDEX_READS)
Number ofasynchronousindex pagereads by theprefetcher intothe bufferpool.
-- ulong No All Y SQLM_ELM_POOL_ASYNC_INDEX_READS
Pool AsyncIndex ReadsRate(POOL_ASYNC_INDEX_READS_RATE)
Ratio ofasynchronousindex pagereads by theprefetcher intothe bufferpool, to thenumber ofphysical readrequests toenter index
-- float No All -- ( POOL_ASYNC_INDEX_READS /( POOL_INDEX_P_READS+POOL_TEMP_INDEX_P_READS ) ) *100
2-566 Working with RecordsHitachi Tuning Manager Application Reports Reference
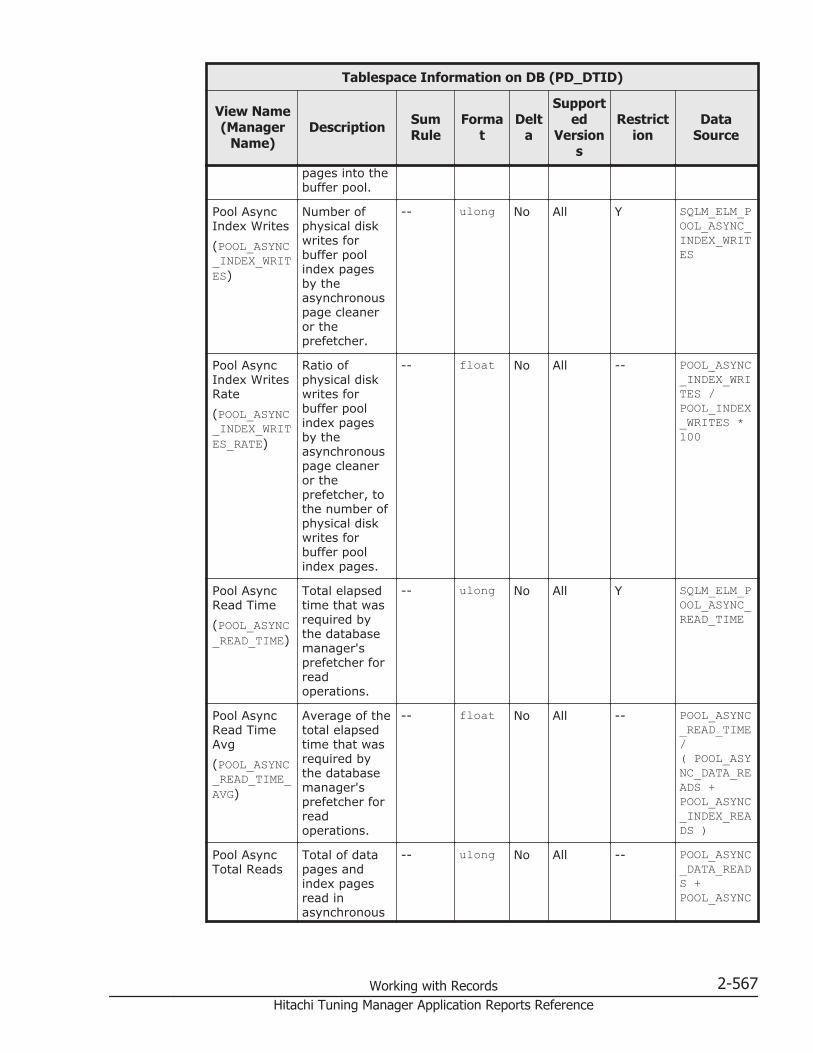
Tablespace Information on DB (PD_DTID)
View Name(Manager
Name)Description Sum
RuleForma
tDelt
a
Supported
Versions
Restriction
DataSource
pages into thebuffer pool.
Pool AsyncIndex Writes(POOL_ASYNC_INDEX_WRITES)
Number ofphysical diskwrites forbuffer poolindex pagesby theasynchronouspage cleaneror theprefetcher.
-- ulong No All Y SQLM_ELM_POOL_ASYNC_INDEX_WRITES
Pool AsyncIndex WritesRate(POOL_ASYNC_INDEX_WRITES_RATE)
Ratio ofphysical diskwrites forbuffer poolindex pagesby theasynchronouspage cleaneror theprefetcher, tothe number ofphysical diskwrites forbuffer poolindex pages.
-- float No All -- POOL_ASYNC_INDEX_WRITES /POOL_INDEX_WRITES *100
Pool AsyncRead Time(POOL_ASYNC_READ_TIME)
Total elapsedtime that wasrequired bythe databasemanager'sprefetcher forreadoperations.
-- ulong No All Y SQLM_ELM_POOL_ASYNC_READ_TIME
Pool AsyncRead TimeAvg(POOL_ASYNC_READ_TIME_AVG)
Average of thetotal elapsedtime that wasrequired bythe databasemanager'sprefetcher forreadoperations.
-- float No All -- POOL_ASYNC_READ_TIME/( POOL_ASYNC_DATA_READS +POOL_ASYNC_INDEX_READS )
Pool AsyncTotal Reads
Total of datapages andindex pagesread inasynchronous
-- ulong No All -- POOL_ASYNC_DATA_READS +POOL_ASYNC
Working with Records 2-567Hitachi Tuning Manager Application Reports Reference
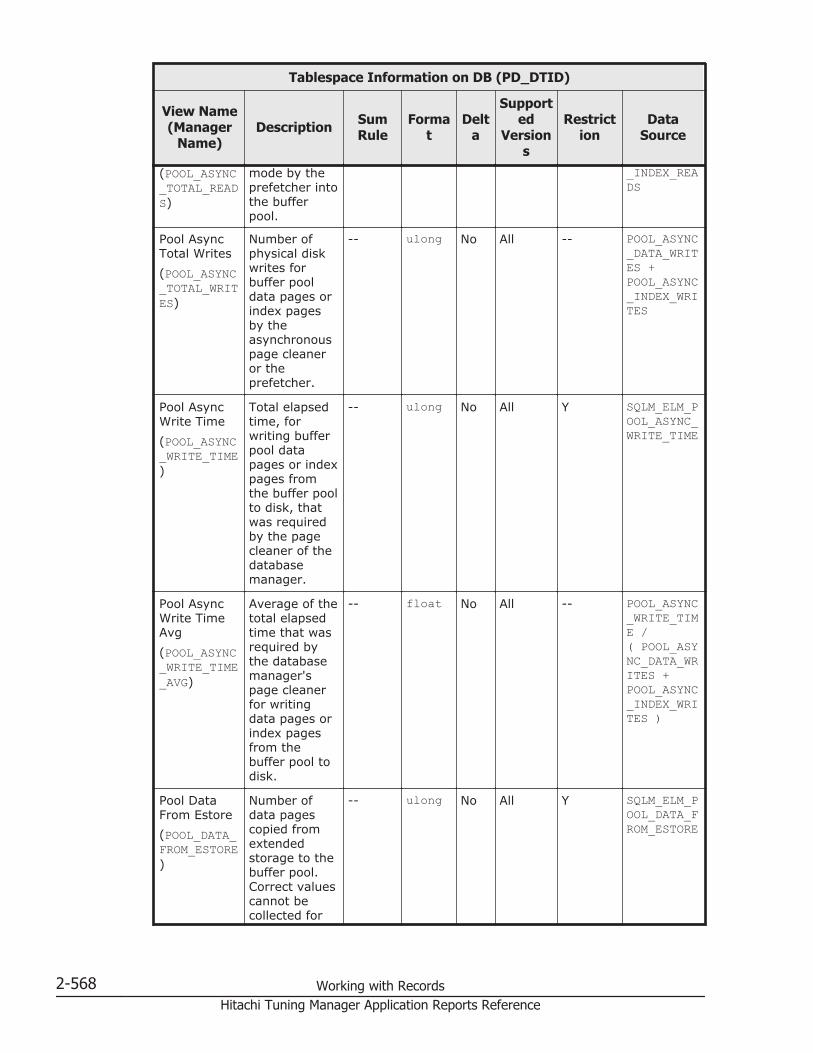
Tablespace Information on DB (PD_DTID)
View Name(Manager
Name)Description Sum
RuleForma
tDelt
a
Supported
Versions
Restriction
DataSource
(POOL_ASYNC_TOTAL_READS)
mode by theprefetcher intothe bufferpool.
_INDEX_READS
Pool AsyncTotal Writes(POOL_ASYNC_TOTAL_WRITES)
Number ofphysical diskwrites forbuffer pooldata pages orindex pagesby theasynchronouspage cleaneror theprefetcher.
-- ulong No All -- POOL_ASYNC_DATA_WRITES +POOL_ASYNC_INDEX_WRITES
Pool AsyncWrite Time(POOL_ASYNC_WRITE_TIME)
Total elapsedtime, forwriting bufferpool datapages or indexpages fromthe buffer poolto disk, thatwas requiredby the pagecleaner of thedatabasemanager.
-- ulong No All Y SQLM_ELM_POOL_ASYNC_WRITE_TIME
Pool AsyncWrite TimeAvg(POOL_ASYNC_WRITE_TIME_AVG)
Average of thetotal elapsedtime that wasrequired bythe databasemanager'spage cleanerfor writingdata pages orindex pagesfrom thebuffer pool todisk.
-- float No All -- POOL_ASYNC_WRITE_TIME /( POOL_ASYNC_DATA_WRITES +POOL_ASYNC_INDEX_WRITES )
Pool DataFrom Estore(POOL_DATA_FROM_ESTORE)
Number ofdata pagescopied fromextendedstorage to thebuffer pool.Correct valuescannot becollected for
-- ulong No All Y SQLM_ELM_POOL_DATA_FROM_ESTORE
2-568 Working with RecordsHitachi Tuning Manager Application Reports Reference

Tablespace Information on DB (PD_DTID)
View Name(Manager
Name)Description Sum
RuleForma
tDelt
a
Supported
Versions
Restriction
DataSource
this field if themonitoringtarget is DB2V9.1 or later.
Pool Data HitRate(POOL_DATA_HIT_RATE)
Data page hitrate.
-- float No All -- • If themonitoringtargetis DB2V9.1:( 1 -( POOL_DATA_P_READS /POOL_DATA_L_READS) ) *100
• If themonitoringtargetis DB2V9.5 orlater:( 1 -( ( POOL_DATA_P_READS -POOL_ASYNC_DATA_READS )/POOL_DATA_L_READS) ) *100
Pool Data LReads(POOL_DATA_L_READS)
Number oflogical readrequests fordata pagesthat passedthrough thebuffer pool.
-- ulong No All Y SQLM_ELM_POOL_DATA_L_READS
Working with Records 2-569Hitachi Tuning Manager Application Reports Reference

Tablespace Information on DB (PD_DTID)
View Name(Manager
Name)Description Sum
RuleForma
tDelt
a
Supported
Versions
Restriction
DataSource
Pool Data PReads(POOL_DATA_P_READS)
Number ofread requestsfor which I/Owas requiredto enter datapages into thebuffer pool.
-- ulong No All Y SQLM_ELM_POOL_DATA_P_READS
Pool Data ToEstore(POOL_DATA_TO_ESTORE)
Number ofdata pagescopied fromthe buffer poolto extendedstorage.Correct valuescannot becollected forthis field if themonitoringtarget is DB2V9.1 or later.
-- ulong No All Y SQLM_ELM_POOL_DATA_TO_ESTORE
Pool DataWrites(POOL_DATA_WRITES)
Number ofphysical diskwrites forbuffer pooldata pages.
-- ulong No All Y SQLM_ELM_POOL_DATA_WRITES
Pool IndexFrom Estore(POOL_INDEX_FROM_ESTORE)
Number ofbuffer poolindex pagescopied fromextendedstorage.Correct valuescannot becollected forthis field if themonitoringtarget is DB2V9.1 or later.
-- ulong No All Y SQLM_ELM_POOL_INDEX_FROM_ESTORE
Pool IndexHit Rate(POOL_INDEX_HIT_RATE)
Index page hitrate.
-- float No All -- • If themonitoringtargetis DB2V9.1:( 1 -( POOL_INDEX_P_READS /
2-570 Working with RecordsHitachi Tuning Manager Application Reports Reference
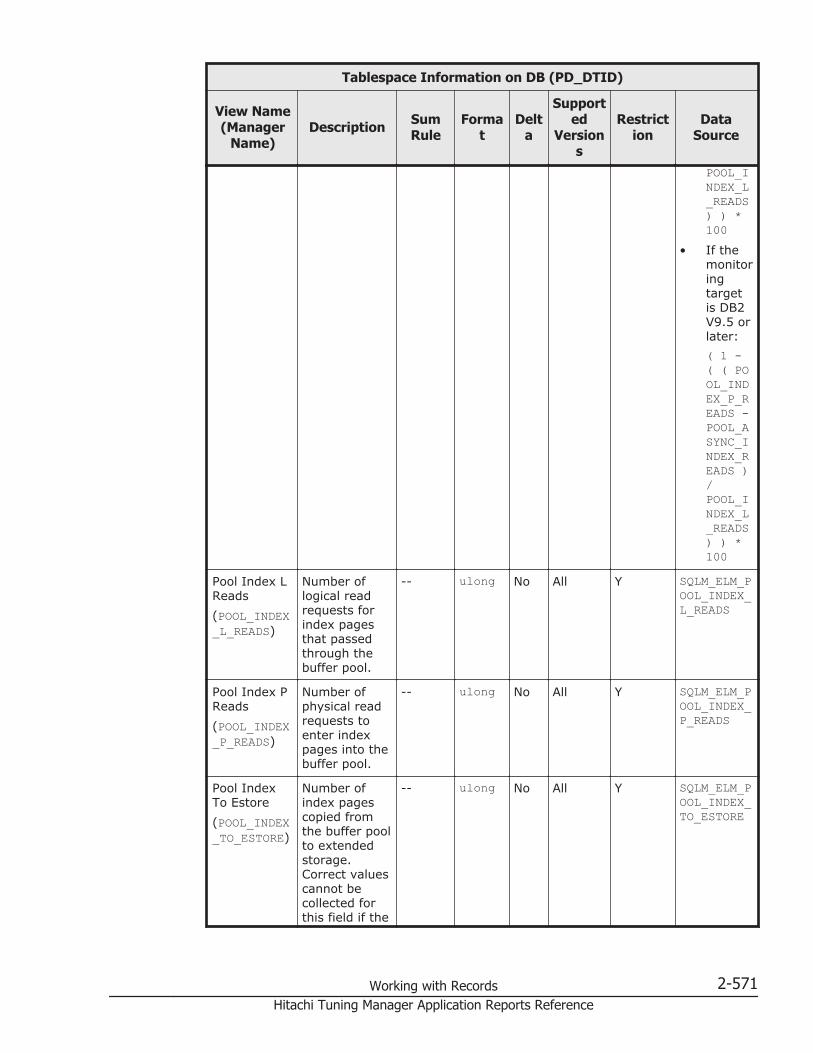
Tablespace Information on DB (PD_DTID)
View Name(Manager
Name)Description Sum
RuleForma
tDelt
a
Supported
Versions
Restriction
DataSource
POOL_INDEX_L_READS) ) *100
• If themonitoringtargetis DB2V9.5 orlater:( 1 -( ( POOL_INDEX_P_READS -POOL_ASYNC_INDEX_READS )/POOL_INDEX_L_READS) ) *100
Pool Index LReads(POOL_INDEX_L_READS)
Number oflogical readrequests forindex pagesthat passedthrough thebuffer pool.
-- ulong No All Y SQLM_ELM_POOL_INDEX_L_READS
Pool Index PReads(POOL_INDEX_P_READS)
Number ofphysical readrequests toenter indexpages into thebuffer pool.
-- ulong No All Y SQLM_ELM_POOL_INDEX_P_READS
Pool IndexTo Estore(POOL_INDEX_TO_ESTORE)
Number ofindex pagescopied fromthe buffer poolto extendedstorage.Correct valuescannot becollected forthis field if the
-- ulong No All Y SQLM_ELM_POOL_INDEX_TO_ESTORE
Working with Records 2-571Hitachi Tuning Manager Application Reports Reference
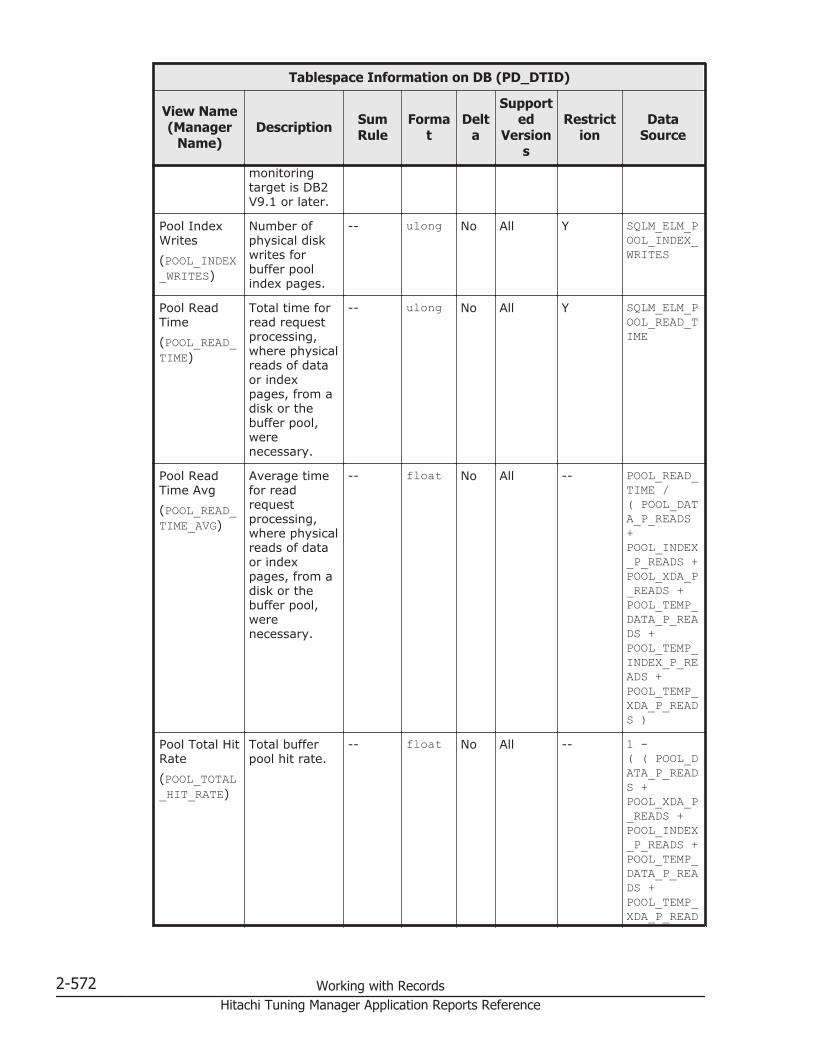
Tablespace Information on DB (PD_DTID)
View Name(Manager
Name)Description Sum
RuleForma
tDelt
a
Supported
Versions
Restriction
DataSource
monitoringtarget is DB2V9.1 or later.
Pool IndexWrites(POOL_INDEX_WRITES)
Number ofphysical diskwrites forbuffer poolindex pages.
-- ulong No All Y SQLM_ELM_POOL_INDEX_WRITES
Pool ReadTime(POOL_READ_TIME)
Total time forread requestprocessing,where physicalreads of dataor indexpages, from adisk or thebuffer pool,werenecessary.
-- ulong No All Y SQLM_ELM_POOL_READ_TIME
Pool ReadTime Avg(POOL_READ_TIME_AVG)
Average timefor readrequestprocessing,where physicalreads of dataor indexpages, from adisk or thebuffer pool,werenecessary.
-- float No All -- POOL_READ_TIME /( POOL_DATA_P_READS+POOL_INDEX_P_READS +POOL_XDA_P_READS +POOL_TEMP_DATA_P_READS +POOL_TEMP_INDEX_P_READS +POOL_TEMP_XDA_P_READS )
Pool Total HitRate(POOL_TOTAL_HIT_RATE)
Total bufferpool hit rate.
-- float No All -- 1 -( ( POOL_DATA_P_READS +POOL_XDA_P_READS +POOL_INDEX_P_READS +POOL_TEMP_DATA_P_READS +POOL_TEMP_XDA_P_READ
2-572 Working with RecordsHitachi Tuning Manager Application Reports Reference

Tablespace Information on DB (PD_DTID)
View Name(Manager
Name)Description Sum
RuleForma
tDelt
a
Supported
Versions
Restriction
DataSource
S +POOL_TEMP_INDEX_P_READS ) /( POOL_DATA_L_READS+POOL_INDEX_L_READS +POOL_XDA_L_READS +POOL_TEMP_DATA_L_READS +POOL_TEMP_INDEX_L_READS +POOL_TEMP_XDA_L_READS ) ) *100
Pool TotalWrites(POOL_TOTAL_WRITES)
Total numberof physicalwrites ofbuffer pooldata pagesand bufferpool indexpages to disk.
-- ulong No All -- POOL_DATA_WRITES +POOL_INDEX_WRITES +POOL_XDA_WRITES
Pool WriteTime(POOL_WRITE_TIME)
Total timetaken forphysical writesof data pagesor index pagesfrom thebuffer pool todisk.
-- ulong No All Y SQLM_ELM_POOL_WRITE_TIME
Pool WriteTime Avg(POOL_WRITE_TIME_AVG)
Average timetaken forphysical writesof data pagesor index pagesfrom thebuffer pool todisk.
-- float No All -- POOL_WRITE_TIME /( POOL_DATA_WRITES +POOL_INDEX_WRITES +POOL_XDA_WRITES )
Record Time(RECORD_TIME)
Collection endtime for theperformance
-- time_t No All -- AgentCollector
Working with Records 2-573Hitachi Tuning Manager Application Reports Reference

Tablespace Information on DB (PD_DTID)
View Name(Manager
Name)Description Sum
RuleForma
tDelt
a
Supported
Versions
Restriction
DataSource
data stored inthe record.
Record Type(INPUT_RECORD_TYPE)
Record name.This is alwaysDTID.
-- char(8)
No All -- AgentCollector
TablespaceContent Type(TABLESPACE_CONTENT_TYPE)
Type ofcontent in atablespace.
-- unsignedchar
No All -- SQLM_ELM_TABLESPACE_CONTENT_TYPE
TablespaceCur Pool Id(TABLESPACE_CUR_POOL_ID)
Buffer poolidentifier for abuffer poolthat atablespace iscurrentlyusing.
-- ulong No All -- SQLM_ELM_TABLESPACE_CUR_POOL_ID
TablespaceExtent Size(TABLESPACE_EXTENT_SIZE)
Extent sizeused by atablespace.
-- ulong No All -- SQLM_ELM_TABLESPACE_EXTENT_SIZE
TablespaceFree Pages(TABLESPACE_FREE_PAGES)
Total numberof pages thatare currentlyfree in atablespace.
-- ulong No All -- SQLM_ELM_TABLESPACE_FREE_PAGES
TablespaceId(TABLESPACE_ID)
An integerthat uniquelyrepresents atablespaceused by thecurrentdatabase.
-- ulong No All -- SQLM_ELM_TABLESPACE_ID
TablespaceMin RecoveryTime(TABLESPACE_MIN_RECOVERY_TIME)
A timestampshowing theearliest pointin time towhich atablespace canbe rolledforward (thenumber ofaccumulatedseconds since1 Jan 1970
-- ulong No All -- SQLM_ELM_TABLESPACE_MIN_RECOVERY_TIME
2-574 Working with RecordsHitachi Tuning Manager Application Reports Reference
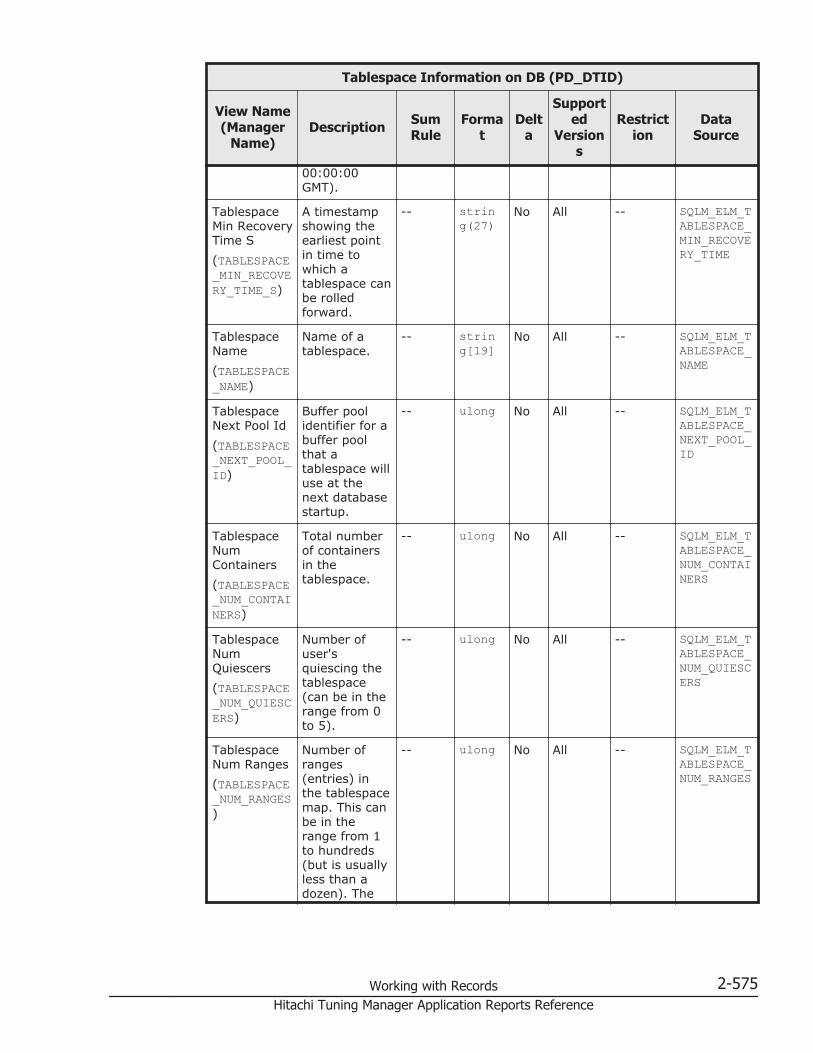
Tablespace Information on DB (PD_DTID)
View Name(Manager
Name)Description Sum
RuleForma
tDelt
a
Supported
Versions
Restriction
DataSource
00:00:00GMT).
TablespaceMin RecoveryTime S(TABLESPACE_MIN_RECOVERY_TIME_S)
A timestampshowing theearliest pointin time towhich atablespace canbe rolledforward.
-- string(27)
No All -- SQLM_ELM_TABLESPACE_MIN_RECOVERY_TIME
TablespaceName(TABLESPACE_NAME)
Name of atablespace.
-- string[19]
No All -- SQLM_ELM_TABLESPACE_NAME
TablespaceNext Pool Id(TABLESPACE_NEXT_POOL_ID)
Buffer poolidentifier for abuffer poolthat atablespace willuse at thenext databasestartup.
-- ulong No All -- SQLM_ELM_TABLESPACE_NEXT_POOL_ID
TablespaceNumContainers(TABLESPACE_NUM_CONTAINERS)
Total numberof containersin thetablespace.
-- ulong No All -- SQLM_ELM_TABLESPACE_NUM_CONTAINERS
TablespaceNumQuiescers(TABLESPACE_NUM_QUIESCERS)
Number ofuser'squiescing thetablespace(can be in therange from 0to 5).
-- ulong No All -- SQLM_ELM_TABLESPACE_NUM_QUIESCERS
TablespaceNum Ranges(TABLESPACE_NUM_RANGES)
Number ofranges(entries) inthe tablespacemap. This canbe in therange from 1to hundreds(but is usuallyless than adozen). The
-- ulong No All -- SQLM_ELM_TABLESPACE_NUM_RANGES
Working with Records 2-575Hitachi Tuning Manager Application Reports Reference
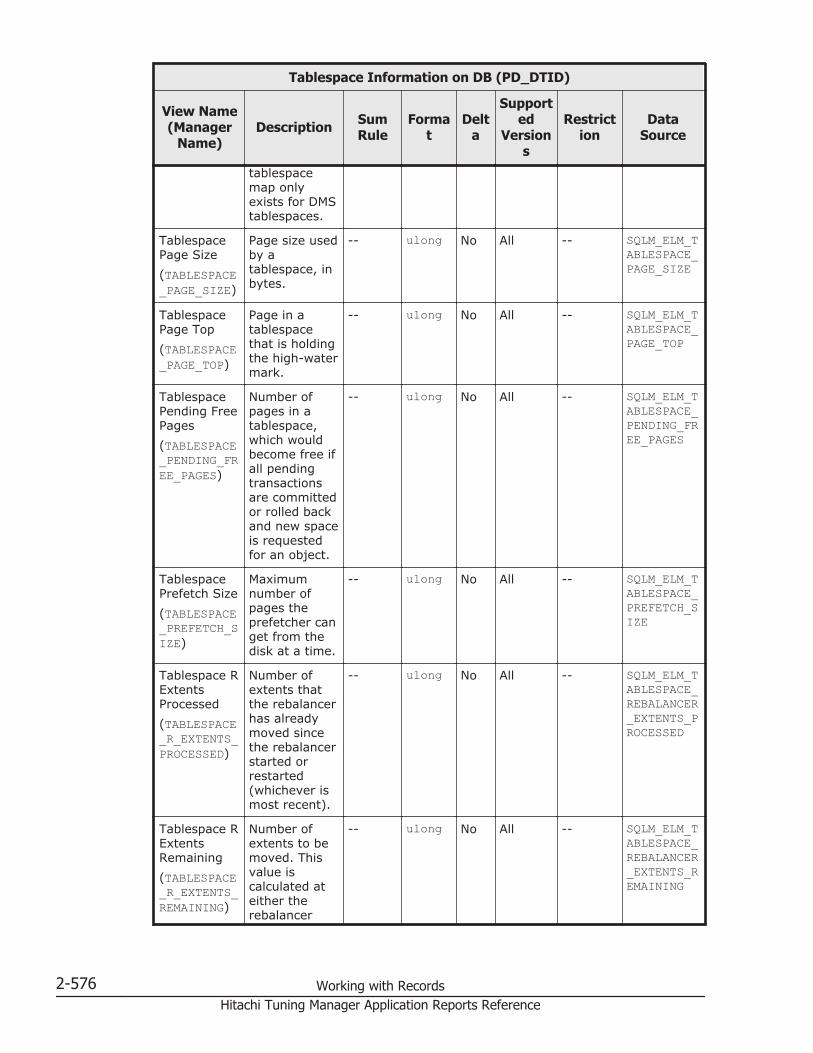
Tablespace Information on DB (PD_DTID)
View Name(Manager
Name)Description Sum
RuleForma
tDelt
a
Supported
Versions
Restriction
DataSource
tablespacemap onlyexists for DMStablespaces.
TablespacePage Size(TABLESPACE_PAGE_SIZE)
Page size usedby atablespace, inbytes.
-- ulong No All -- SQLM_ELM_TABLESPACE_PAGE_SIZE
TablespacePage Top(TABLESPACE_PAGE_TOP)
Page in atablespacethat is holdingthe high-watermark.
-- ulong No All -- SQLM_ELM_TABLESPACE_PAGE_TOP
TablespacePending FreePages(TABLESPACE_PENDING_FREE_PAGES)
Number ofpages in atablespace,which wouldbecome free ifall pendingtransactionsare committedor rolled backand new spaceis requestedfor an object.
-- ulong No All -- SQLM_ELM_TABLESPACE_PENDING_FREE_PAGES
TablespacePrefetch Size(TABLESPACE_PREFETCH_SIZE)
Maximumnumber ofpages theprefetcher canget from thedisk at a time.
-- ulong No All -- SQLM_ELM_TABLESPACE_PREFETCH_SIZE
Tablespace RExtentsProcessed(TABLESPACE_R_EXTENTS_PROCESSED)
Number ofextents thatthe rebalancerhas alreadymoved sincethe rebalancerstarted orrestarted(whichever ismost recent).
-- ulong No All -- SQLM_ELM_TABLESPACE_REBALANCER_EXTENTS_PROCESSED
Tablespace RExtentsRemaining(TABLESPACE_R_EXTENTS_REMAINING)
Number ofextents to bemoved. Thisvalue iscalculated ateither therebalancer
-- ulong No All -- SQLM_ELM_TABLESPACE_REBALANCER_EXTENTS_REMAINING
2-576 Working with RecordsHitachi Tuning Manager Application Reports Reference

Tablespace Information on DB (PD_DTID)
View Name(Manager
Name)Description Sum
RuleForma
tDelt
a
Supported
Versions
Restriction
DataSource
start time orrestart time(whichever ismost recent).
Tablespace RLast ExtentMoved(TABLESPACE_R_LAST_EXTENT_MOVED)
Last extentmoved by therebalancer.
-- ulong No All -- SQLM_ELM_TABLESPACE_REBALANCER_LAST_EXTENT_MOVED
TablespaceRebalancerMode(TABLESPACE_REBALANCER_MODE)
An integerthatrepresentswhether aforward orreverserebalance istaking place.Its values(defined insqlmon.h) areas follows:No rebalancingtaking place:SQLM_TABLESPACE_NO_REBALForward:SQLM_TABLESPACE_FWD_REBALReverse:SQLM_TABLESPACE_REV_REBAL
-- unsignedchar
No All -- SQLM_ELM_TABLESPACE_REBALANCER_MODE
TablespaceRebalancerPriority(TABLESPACE_REBALANCER_PRIORITY)
Priority atwhich therebalancer isrunning in thedatabase.
-- ulong No All -- SQLM_ELM_TABLESPACE_REBALANCER_PRIORITY
Tablespace RRestart Time(TABLESPACE_R_RESTART_TIME)
Timestamprepresentingwhen arebalancerrestarted after
-- string[27]
No All -- SQLM_ELM_TABLESPACE_REBALANCER_RESTART_TIME
Working with Records 2-577Hitachi Tuning Manager Application Reports Reference

Tablespace Information on DB (PD_DTID)
View Name(Manager
Name)Description Sum
RuleForma
tDelt
a
Supported
Versions
Restriction
DataSource
being pausedor stopped.
Tablespace RStart Time(TABLESPACE_R_START_TIME)
Timestamprepresentingwhen arebalancerstarted for thefirst time.
-- string[27]
No All -- SQLM_ELM_TABLESPACE_REBALANCER_START_TIME
TablespaceState(TABLESPACE_STATE)
This elementdescribes thecurrent stateof atablespace.
-- string[11]
No All -- SQLM_ELM_TABLESPACE_STATE
TablespaceStateChange ObjId(TABLESPACE_STATE_CHANGE_OBJ_ID)
Object thatcaused thetablespacestate to be setto Loadpending orDeletepending.
-- ulong No All -- SQLM_ELM_TABLESPACE_STATE_CHANGE_OBJECT_ID
TablespaceTotal Pages(TABLESPACE_TOTAL_PAGES)
Total numberof pages in atablespace.
-- ulong No All -- SQLM_ELM_TABLESPACE_TOTAL_PAGES
TablespaceType(TABLESPACE_TYPE)
Type of atablespace.
-- unsignedchar
No All -- SQLM_ELM_TABLESPACE_TYPE
TablespaceUsable Pages(TABLESPACE_USABLE_PAGES)
Total numberof pages in atablespaceminusoverheadpages.
-- ulong No All -- SQLM_ELM_TABLESPACE_USABLE_PAGES
TablespaceUsed Pages(TABLESPACE_USED_PAGES)
Total numberof pages thatare currentlyused (notfree) in atablespace.
-- ulong No All -- SQLM_ELM_TABLESPACE_USED_PAGES
TablespaceUsed PagesRate
Ratio of theused pages ina tablespace.
-- float No All -- TABLESPACE_USED_PAGES /TABLESPACE
2-578 Working with RecordsHitachi Tuning Manager Application Reports Reference
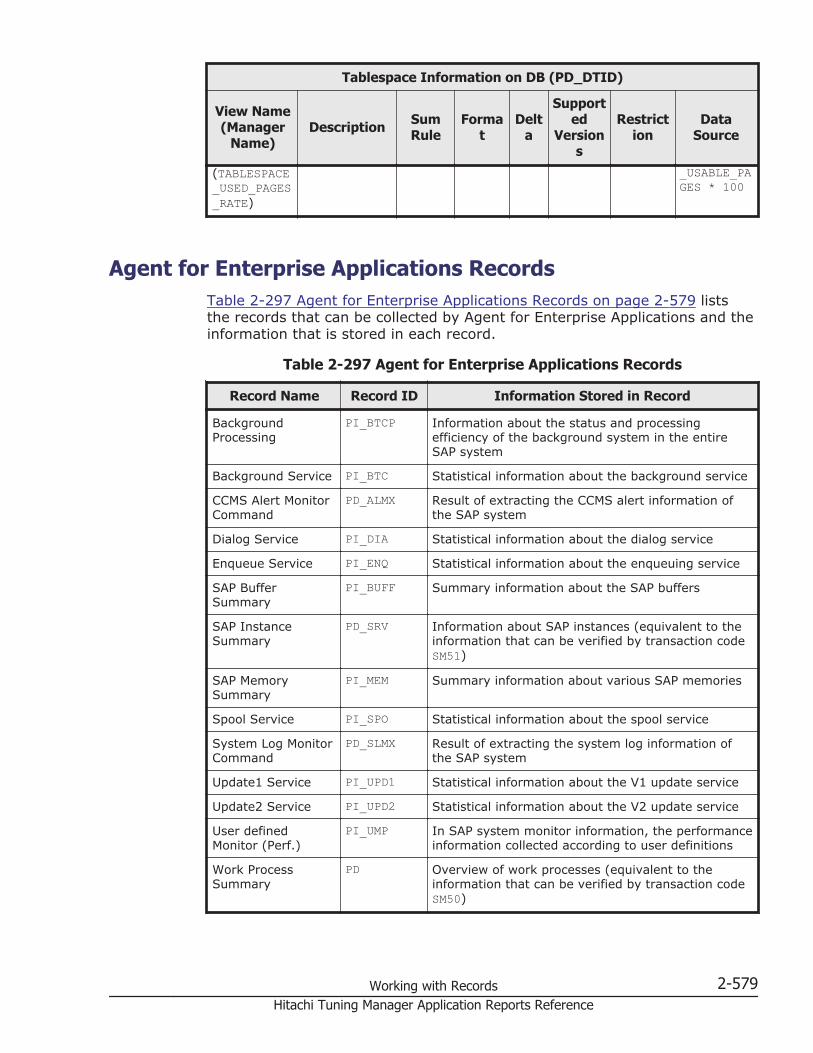
Tablespace Information on DB (PD_DTID)
View Name(Manager
Name)Description Sum
RuleForma
tDelt
a
Supported
Versions
Restriction
DataSource
(TABLESPACE_USED_PAGES_RATE)
_USABLE_PAGES * 100
Agent for Enterprise Applications RecordsTable 2-297 Agent for Enterprise Applications Records on page 2-579 liststhe records that can be collected by Agent for Enterprise Applications and theinformation that is stored in each record.
Table 2-297 Agent for Enterprise Applications Records
Record Name Record ID Information Stored in Record
BackgroundProcessing
PI_BTCP Information about the status and processingefficiency of the background system in the entireSAP system
Background Service PI_BTC Statistical information about the background service
CCMS Alert MonitorCommand
PD_ALMX Result of extracting the CCMS alert information ofthe SAP system
Dialog Service PI_DIA Statistical information about the dialog service
Enqueue Service PI_ENQ Statistical information about the enqueuing service
SAP BufferSummary
PI_BUFF Summary information about the SAP buffers
SAP InstanceSummary
PD_SRV Information about SAP instances (equivalent to theinformation that can be verified by transaction codeSM51)
SAP MemorySummary
PI_MEM Summary information about various SAP memories
Spool Service PI_SPO Statistical information about the spool service
System Log MonitorCommand
PD_SLMX Result of extracting the system log information ofthe SAP system
Update1 Service PI_UPD1 Statistical information about the V1 update service
Update2 Service PI_UPD2 Statistical information about the V2 update service
User definedMonitor (Perf.)
PI_UMP In SAP system monitor information, the performanceinformation collected according to user definitions
Work ProcessSummary
PD Overview of work processes (equivalent to theinformation that can be verified by transaction codeSM50)
Working with Records 2-579Hitachi Tuning Manager Application Reports Reference

Record Name Record ID Information Stored in Record
WorkLoad SummaryInterval
PI Information needed to obtain and analyze the dialogtask's workload time statistics
Background Processing (PI_BTCP)
Function
The Background Processing (PI_BTCP) record stores information about thestatus and processing efficiency of the background system of the entire SAPsystem.
Table 2-298 Background Processing (PI_BTCP) Default and ChangeableValues
Item Default Value Changeable?
Collection Interval 600 Yes
Collection Offset 40
Log No
LOGIF (Blank)
Key Fields
None
Lifetime
None
Record Size
• Fixed part: 743 bytes• Variable part: 0 bytes
Table 2-299 Background Processing (PI_BTCP) Fields
Background Processing (PI_BTCP)
View Name(Manager
Name)Description Sum
RuleForma
tDelt
a
Supported
Version
DataSource
Instance Name(INSTANCE_NAME)
SAP instance name.This name usuallyconsists of a hostname, SAP system ID,and system number.This setting can be
COPY string(21)
No -- --
2-580 Working with RecordsHitachi Tuning Manager Application Reports Reference
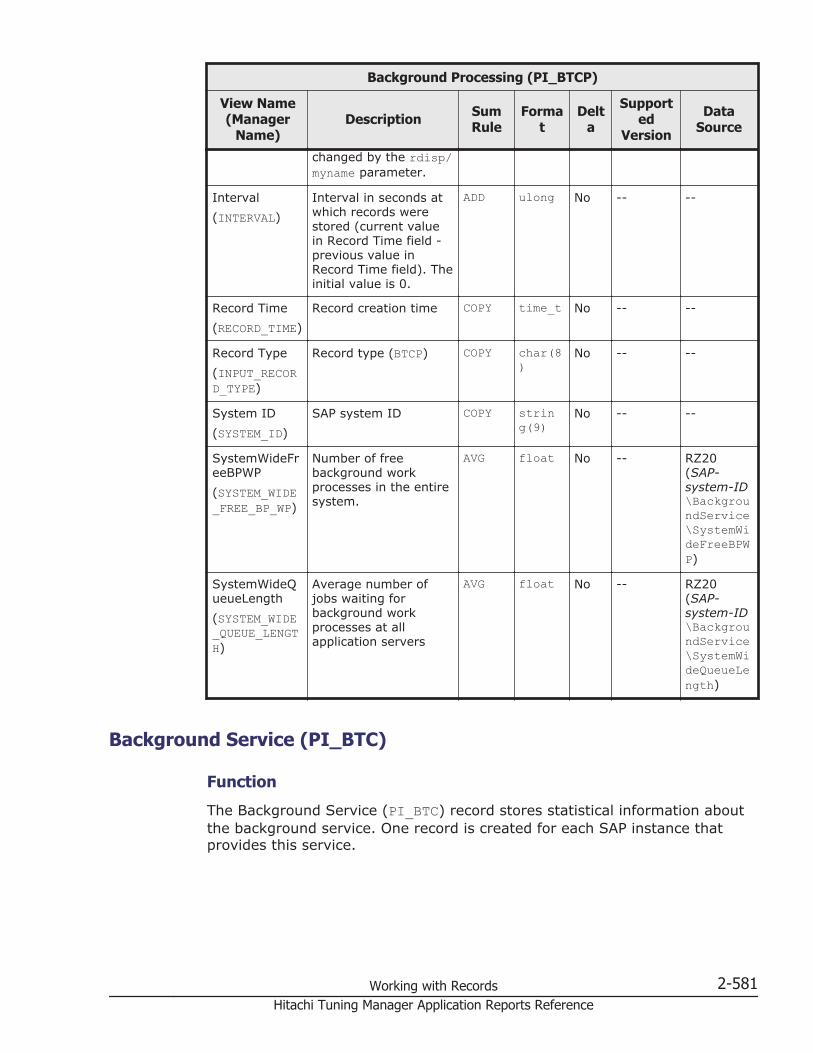
Background Processing (PI_BTCP)
View Name(Manager
Name)Description Sum
RuleForma
tDelt
a
Supported
Version
DataSource
changed by the rdisp/myname parameter.
Interval(INTERVAL)
Interval in seconds atwhich records werestored (current valuein Record Time field -previous value inRecord Time field). Theinitial value is 0.
ADD ulong No -- --
Record Time(RECORD_TIME)
Record creation time COPY time_t No -- --
Record Type(INPUT_RECORD_TYPE)
Record type (BTCP) COPY char(8)
No -- --
System ID(SYSTEM_ID)
SAP system ID COPY string(9)
No -- --
SystemWideFreeBPWP(SYSTEM_WIDE_FREE_BP_WP)
Number of freebackground workprocesses in the entiresystem.
AVG float No -- RZ20(SAP-system-ID\BackgroundService\SystemWideFreeBPWP)
SystemWideQueueLength(SYSTEM_WIDE_QUEUE_LENGTH)
Average number ofjobs waiting forbackground workprocesses at allapplication servers
AVG float No -- RZ20(SAP-system-ID\BackgroundService\SystemWideQueueLength)
Background Service (PI_BTC)
Function
The Background Service (PI_BTC) record stores statistical information aboutthe background service. One record is created for each SAP instance thatprovides this service.
Working with Records 2-581Hitachi Tuning Manager Application Reports Reference

Table 2-300 Background Service (PI_BTC) Default and Changeable Values
Item Default Value Changeable?
Collection Interval 600 Yes
Collection Offset 40
Log No
LOGIF (Blank)
Key Fields
None
Lifetime
None
Record Size
• Fixed part: 759 bytes• Variable part: 0 bytes
Table 2-301 Background Service (PI_BTC) Fields
Background Service (PI_BTC)
View Name(Manager
Name)Description Sum
RuleForma
tDelt
a
Supported
Version
DataSource
Instance Name(INSTANCE_NAME)
SAP instance name.This name usuallyconsists of a hostname, SAP system ID,and system number.This setting can bechanged by the rdisp/myname parameter.
COPY string(21)
No -- --
Interval(INTERVAL)
Interval in seconds atwhich records werestored (current value inRecord Time field -previous value inRecord Time field). Theinitial value is 0.
ADD ulong No -- --
NumberOfWpBTC(NUMBER_OF_WP_BTC)
Number of backgroundwork processes on asingle applicationserver
AVG float No -- RZ20(SAP-system-ID\SAP-instance-name\Backgrou
2-582 Working with RecordsHitachi Tuning Manager Application Reports Reference
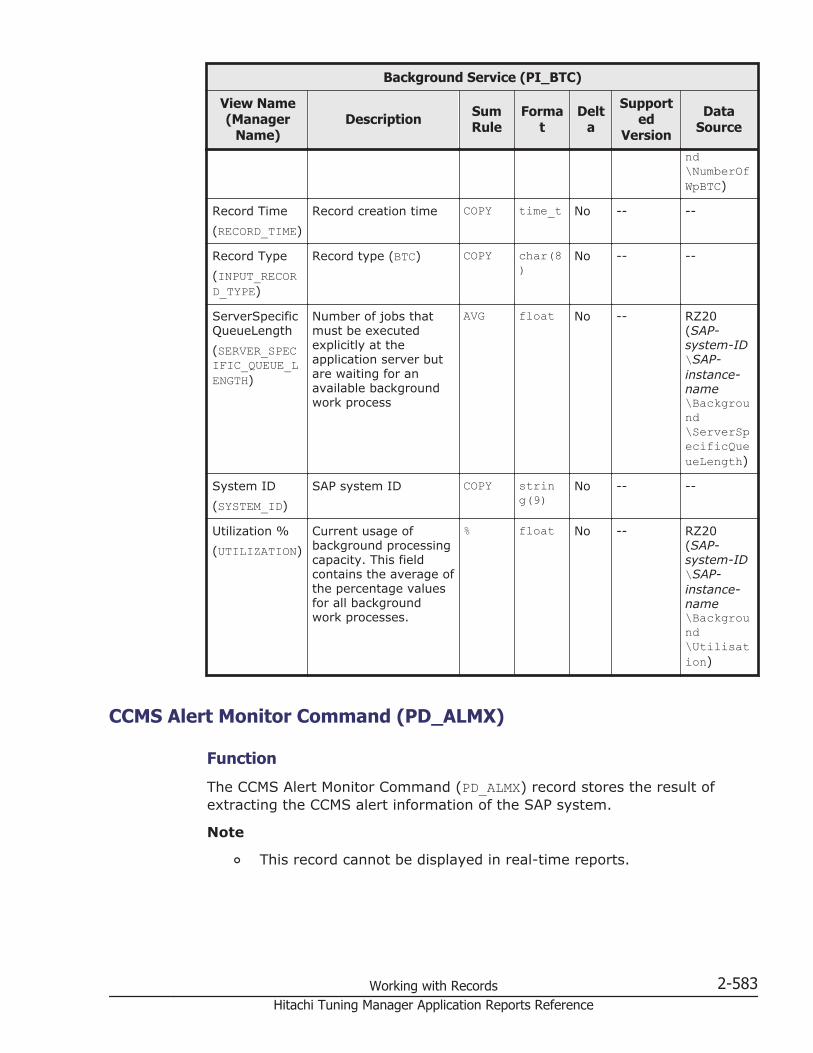
Background Service (PI_BTC)
View Name(Manager
Name)Description Sum
RuleForma
tDelt
a
Supported
Version
DataSource
nd\NumberOfWpBTC)
Record Time(RECORD_TIME)
Record creation time COPY time_t No -- --
Record Type(INPUT_RECORD_TYPE)
Record type (BTC) COPY char(8)
No -- --
ServerSpecificQueueLength(SERVER_SPECIFIC_QUEUE_LENGTH)
Number of jobs thatmust be executedexplicitly at theapplication server butare waiting for anavailable backgroundwork process
AVG float No -- RZ20(SAP-system-ID\SAP-instance-name\Background\ServerSpecificQueueLength)
System ID(SYSTEM_ID)
SAP system ID COPY string(9)
No -- --
Utilization %(UTILIZATION)
Current usage ofbackground processingcapacity. This fieldcontains the average ofthe percentage valuesfor all backgroundwork processes.
% float No -- RZ20(SAP-system-ID\SAP-instance-name\Background\Utilisation)
CCMS Alert Monitor Command (PD_ALMX)
Function
The CCMS Alert Monitor Command (PD_ALMX) record stores the result ofextracting the CCMS alert information of the SAP system.
Note
¢ This record cannot be displayed in real-time reports.
Working with Records 2-583Hitachi Tuning Manager Application Reports Reference
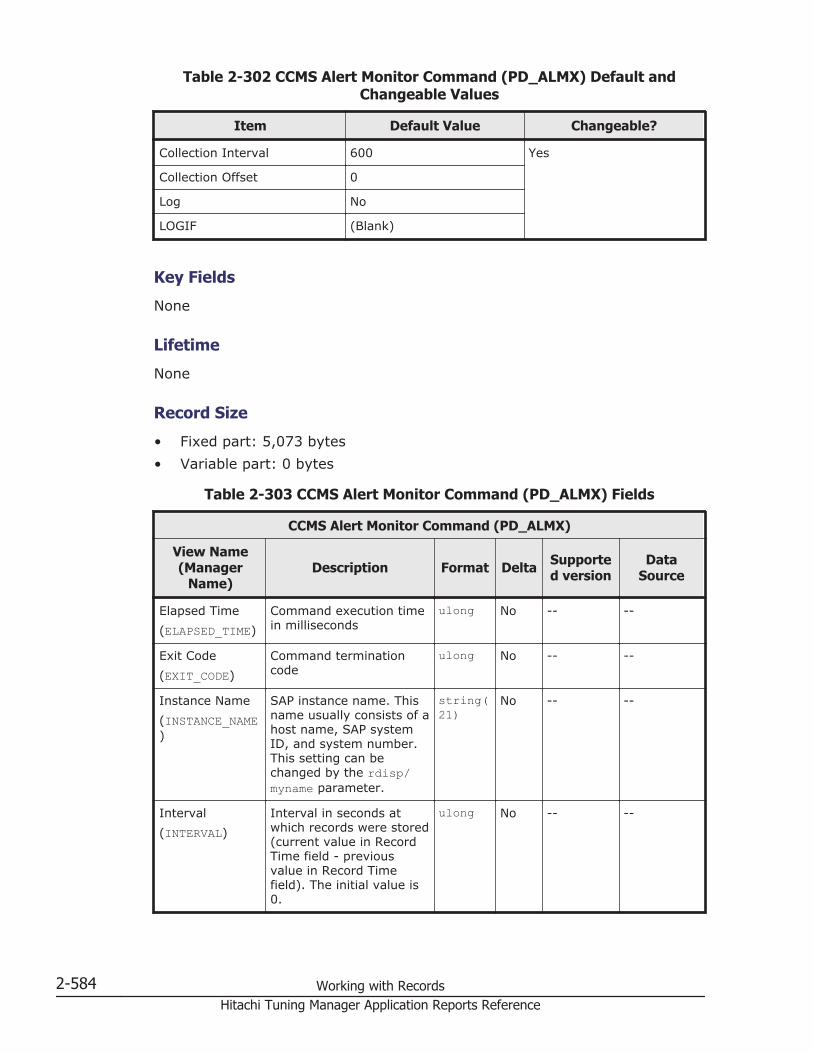
Table 2-302 CCMS Alert Monitor Command (PD_ALMX) Default andChangeable Values
Item Default Value Changeable?
Collection Interval 600 Yes
Collection Offset 0
Log No
LOGIF (Blank)
Key Fields
None
Lifetime
None
Record Size
• Fixed part: 5,073 bytes• Variable part: 0 bytes
Table 2-303 CCMS Alert Monitor Command (PD_ALMX) Fields
CCMS Alert Monitor Command (PD_ALMX)
View Name(Manager
Name)Description Format Delta Supporte
d versionData
Source
Elapsed Time(ELAPSED_TIME)
Command execution timein milliseconds
ulong No -- --
Exit Code(EXIT_CODE)
Command terminationcode
ulong No -- --
Instance Name(INSTANCE_NAME)
SAP instance name. Thisname usually consists of ahost name, SAP systemID, and system number.This setting can bechanged by the rdisp/myname parameter.
string(21)
No -- --
Interval(INTERVAL)
Interval in seconds atwhich records were stored(current value in RecordTime field - previousvalue in Record Timefield). The initial value is0.
ulong No -- --
2-584 Working with RecordsHitachi Tuning Manager Application Reports Reference
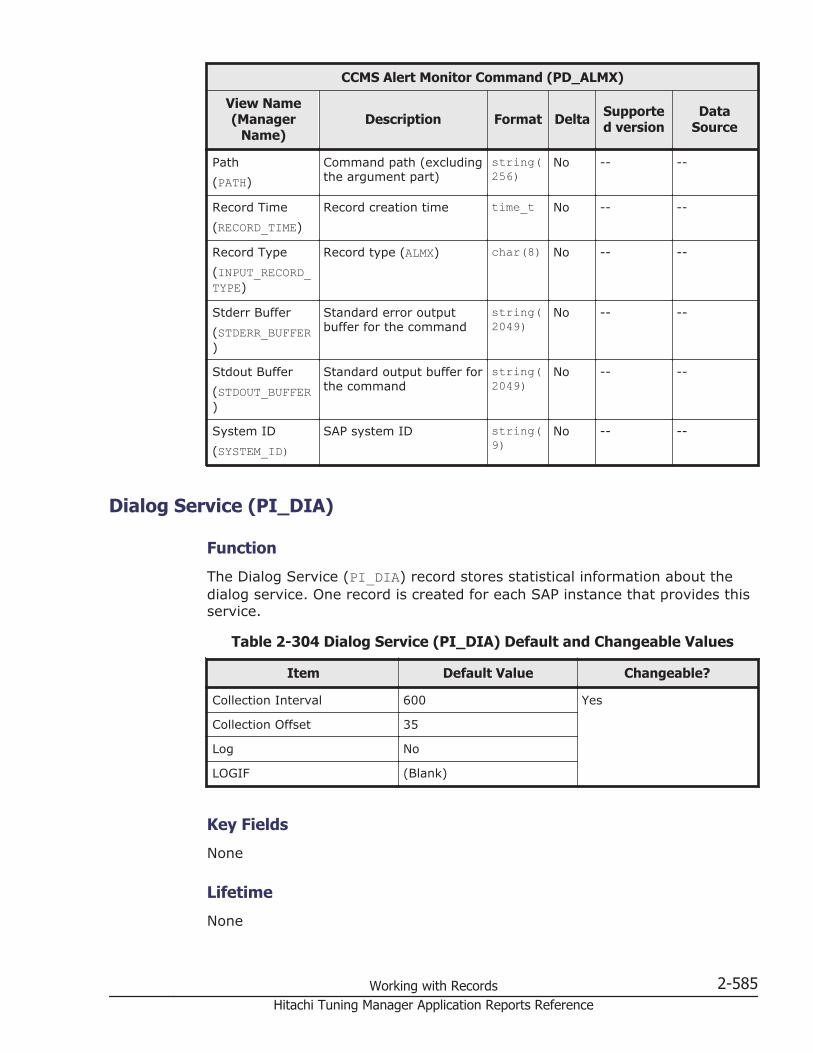
CCMS Alert Monitor Command (PD_ALMX)
View Name(Manager
Name)Description Format Delta Supporte
d versionData
Source
Path(PATH)
Command path (excludingthe argument part)
string(256)
No -- --
Record Time(RECORD_TIME)
Record creation time time_t No -- --
Record Type(INPUT_RECORD_TYPE)
Record type (ALMX) char(8) No -- --
Stderr Buffer(STDERR_BUFFER)
Standard error outputbuffer for the command
string(2049)
No -- --
Stdout Buffer(STDOUT_BUFFER)
Standard output buffer forthe command
string(2049)
No -- --
System ID(SYSTEM_ID)
SAP system ID string(9)
No -- --
Dialog Service (PI_DIA)
Function
The Dialog Service (PI_DIA) record stores statistical information about thedialog service. One record is created for each SAP instance that provides thisservice.
Table 2-304 Dialog Service (PI_DIA) Default and Changeable Values
Item Default Value Changeable?
Collection Interval 600 Yes
Collection Offset 35
Log No
LOGIF (Blank)
Key Fields
None
Lifetime
None
Working with Records 2-585Hitachi Tuning Manager Application Reports Reference

Record Size
• Fixed part: 959 bytes• Variable part: 0 bytes
Table 2-305 Dialog Service (PI_DIA) Fields
Dialog Service (PI_DIA)
View Name(Manager
Name)Description Sum
RuleForma
tDelt
a
Supported
Version
DataSource
DBRequestTime(DB_REQUEST_TIME)
Average time forprocessing logicaldatabase requests inmilliseconds
AVG float No -- RZ20(SAP-system-ID\SAP-instance-name\Dialog\DBRequestTime)
DialogSteps(DIALOG_STEPS)
Average number ofdialog steps per minute
AVG float No -- RZ20(SAP-system-ID\SAP-instance-name\Dialog\DialogSteps)
FrontendNetTime(FRONTEND_NET_TIME)
Network time (inmilliseconds) used forthe first data transferfrom front end toapplication server andfor the last datatransfer fromapplication server tofront end. This doesnot include the value ofthe GuiCallBackTimefield.
AVG float No -- RZ20(SAP-system-ID\SAP-instance-name\Dialog\FrontEndNetTime)
FrontendResponseTime(FRONTEND_RESPONSE_TIME)
Average time (inmilliseconds) the userwaited at the front endfor a request to beprocessed. This is theaverage of the totals ofresponse time, networktransfer time, andfront-end processingtime.
AVG float No -- RZ20(SAP-system-ID\SAP-instance-name\Dialog\FrontendResponseTime)
GuiCallBackTime
Average time (inmilliseconds) the workprocess waited for the
AVG float No -- RZ20(SAP-system-ID
2-586 Working with RecordsHitachi Tuning Manager Application Reports Reference
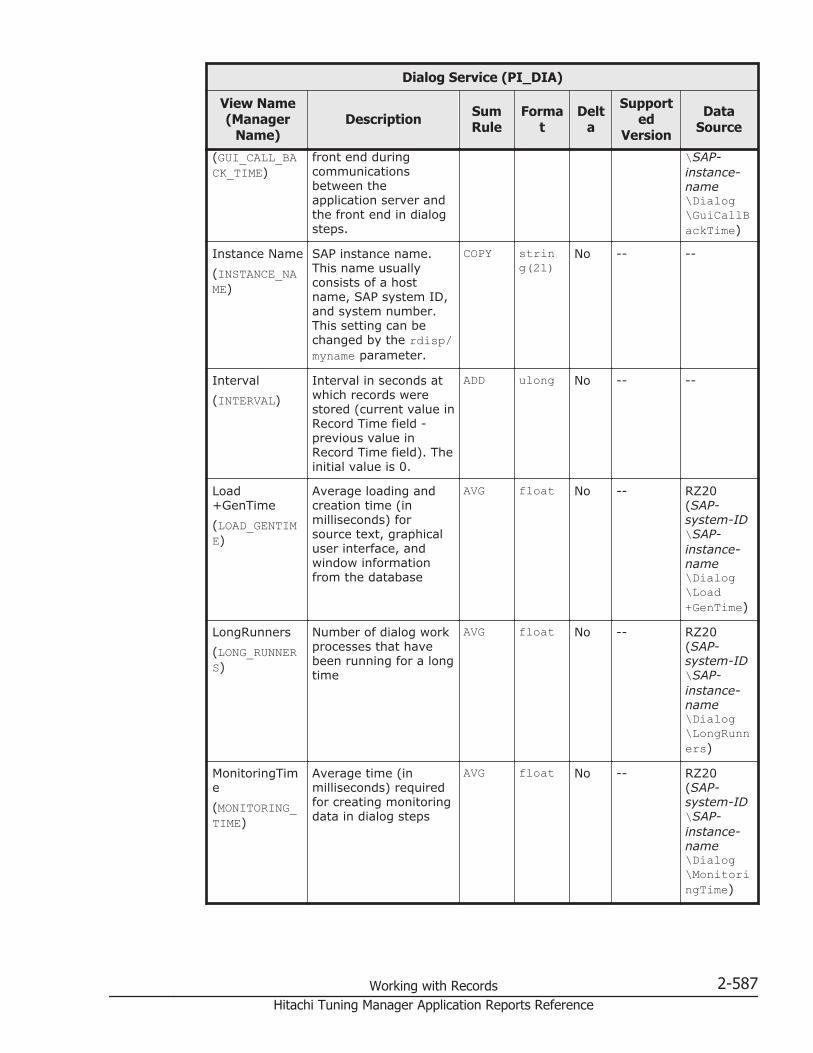
Dialog Service (PI_DIA)
View Name(Manager
Name)Description Sum
RuleForma
tDelt
a
Supported
Version
DataSource
(GUI_CALL_BACK_TIME)
front end duringcommunicationsbetween theapplication server andthe front end in dialogsteps.
\SAP-instance-name\Dialog\GuiCallBackTime)
Instance Name(INSTANCE_NAME)
SAP instance name.This name usuallyconsists of a hostname, SAP system ID,and system number.This setting can bechanged by the rdisp/myname parameter.
COPY string(21)
No -- --
Interval(INTERVAL)
Interval in seconds atwhich records werestored (current value inRecord Time field -previous value inRecord Time field). Theinitial value is 0.
ADD ulong No -- --
Load+GenTime(LOAD_GENTIME)
Average loading andcreation time (inmilliseconds) forsource text, graphicaluser interface, andwindow informationfrom the database
AVG float No -- RZ20(SAP-system-ID\SAP-instance-name\Dialog\Load+GenTime)
LongRunners(LONG_RUNNERS)
Number of dialog workprocesses that havebeen running for a longtime
AVG float No -- RZ20(SAP-system-ID\SAP-instance-name\Dialog\LongRunners)
MonitoringTime(MONITORING_TIME)
Average time (inmilliseconds) requiredfor creating monitoringdata in dialog steps
AVG float No -- RZ20(SAP-system-ID\SAP-instance-name\Dialog\MonitoringTime)
Working with Records 2-587Hitachi Tuning Manager Application Reports Reference

Dialog Service (PI_DIA)
View Name(Manager
Name)Description Sum
RuleForma
tDelt
a
Supported
Version
DataSource
NumberOfWPDia(NUMBER_OF_WP_DIA)
Number of dialog workprocesses
AVG float No -- RZ20(SAP-system-ID\SAP-instance-name\Dialog\NumberOfWpDIA)
QueueLength%(QUEUE_LENGTH)
Average usage of thedispatcher queue
% float No -- RZ20(SAP-system-ID\SAP-instance-name\Dialog\QueueLength)
QueueTime(QUEUE_TIME)
Average wait time (inmilliseconds) in thedispatcher queue foruser requests
AVG float No -- RZ20(SAP-system-ID\SAP-instance-name\Dialog\QueueTime)
Record Time(RECORD_TIME)
Record creation time COPY time_t No -- --
Record Type(INPUT_RECORD_TYPE)
Record type (DIA) COPY char(8)
No -- --
ResponseTime(RESPONSE_TIME)
Average dialog stepprocessing time inmilliseconds. This isthe total time requiredfor processing a dialogstep; it includes thedatabase processingtime but not thenetwork transfer timeor front-end processingtime. For time periodsin which no dialog stepexists, the averageprocessing time for thelast time period in
AVG float No -- RZ20(SAP-system-ID\SAP-instance-name\Dialog\ResponseTime)
2-588 Working with RecordsHitachi Tuning Manager Application Reports Reference
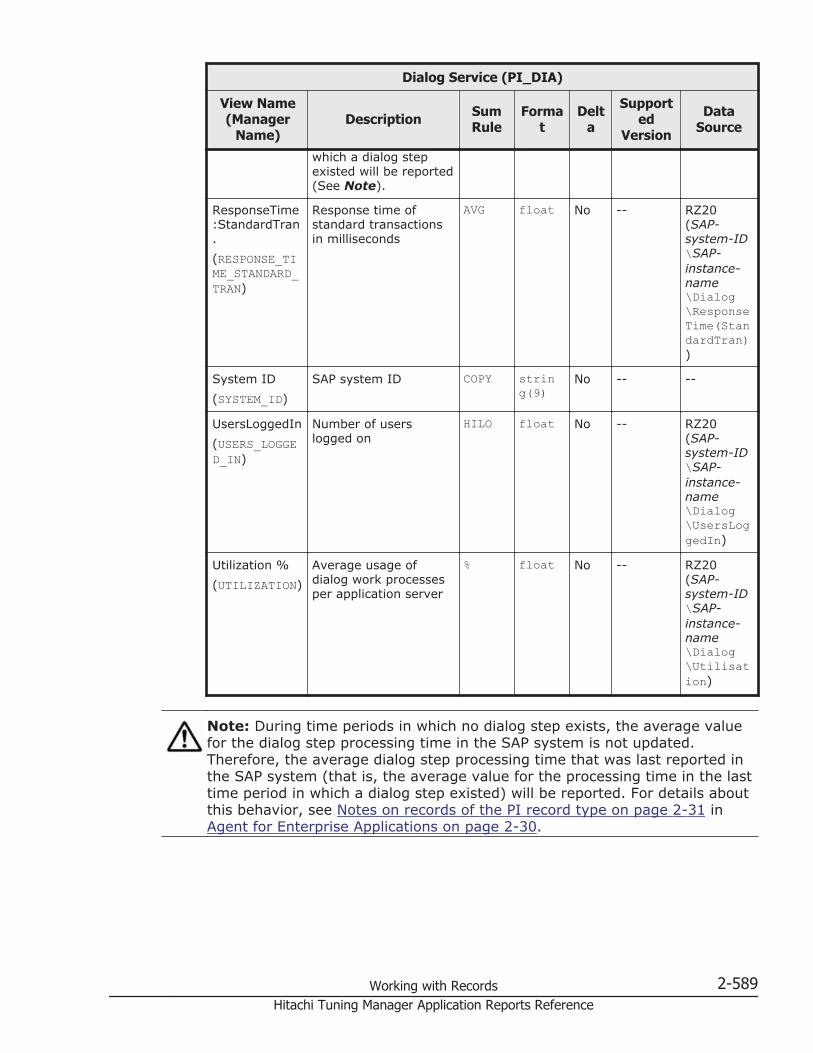
Dialog Service (PI_DIA)
View Name(Manager
Name)Description Sum
RuleForma
tDelt
a
Supported
Version
DataSource
which a dialog stepexisted will be reported(See Note).
ResponseTime:StandardTran.(RESPONSE_TIME_STANDARD_TRAN)
Response time ofstandard transactionsin milliseconds
AVG float No -- RZ20(SAP-system-ID\SAP-instance-name\Dialog\ResponseTime(StandardTran))
System ID(SYSTEM_ID)
SAP system ID COPY string(9)
No -- --
UsersLoggedIn(USERS_LOGGED_IN)
Number of userslogged on
HILO float No -- RZ20(SAP-system-ID\SAP-instance-name\Dialog\UsersLoggedIn)
Utilization %(UTILIZATION)
Average usage ofdialog work processesper application server
% float No -- RZ20(SAP-system-ID\SAP-instance-name\Dialog\Utilisation)
Note: During time periods in which no dialog step exists, the average valuefor the dialog step processing time in the SAP system is not updated.Therefore, the average dialog step processing time that was last reported inthe SAP system (that is, the average value for the processing time in the lasttime period in which a dialog step existed) will be reported. For details aboutthis behavior, see Notes on records of the PI record type on page 2-31 inAgent for Enterprise Applications on page 2-30.
Working with Records 2-589Hitachi Tuning Manager Application Reports Reference

Enqueue Service (PI_ENQ)
Function
The Enqueue Service (PI_ENQ) record stores statistical information about theenqueuing service. One record is created for each SAP instance.
Table 2-306 Enqueue Service (PI_ENQ) Default and Changeable Values
Item Default Value Changeable?
Collection Interval 600 Yes
Collection Offset 40
Log No
LOGIF (Blank)
Key Fields
None
Lifetime
None
Record Size
• Fixed part: 743 bytes• Variable part: 0 bytes
Table 2-307 Enqueue Service (PI_ENQ) Fields
Enqueue Service (PI_ENQ)
View Name(Manager
Name)Description Sum
RuleForma
tDelt
a
Supported
Version
DataSource
EnqueueClientEnqueueFreq(ENQUEUE_CLIENT_ENQUEUE_FREQ)
Number of enqueueprocesses per minutefrom another instanceto the central instance(logical data lock)
AVG float No -- RZ20(SAP-system-ID\SAP-instance-name\EnqueueClient\EnqueuFreq)
EnqueueServer QueueLength%
Percentage of theenqueue service'squeue length.Note that this fielddoes not exist in a SAP
% float No -- RZ20(SAP-system-ID\SAP-instance-
2-590 Working with RecordsHitachi Tuning Manager Application Reports Reference

Enqueue Service (PI_ENQ)
View Name(Manager
Name)Description Sum
RuleForma
tDelt
a
Supported
Version
DataSource
(ENQUEUE_SERVER_QUEUE_LENGTH)
system that is set upas an ASCS instance.In this case, the valueof 0 is set in this field.
name\EnqueueServer\QueueLength)
Instance Name(INSTANCE_NAME)
SAP instance name.This name usuallyconsists of a hostname, SAP system ID,and system number.This setting can bechanged by the rdisp/myname parameter.
COPY string(21)
No -- --
Interval(INTERVAL)
Interval in seconds atwhich records werestored (current value inRecord Time field -previous value inRecord Time field). Theinitial value is 0.
ADD ulong No -- --
Record Time(RECORD_TIME)
Record creation time COPY time_t No -- --
Record Type(INPUT_RECORD_TYPE)
Record type (ENQ) COPY char(8)
No -- --
System ID(SYSTEM_ID)
SAP system ID COPY string(9)
No -- --
SAP Buffer Summary (PI_BUFF)
Function
The SAP Buffer Summary (PI_BUFF) record stores summary informationabout the SAP buffers. One record is created for each SAP instance.
• Nametab buffer (NTAB buffer)
¢ Field description buffer (FTAB buffer, table DDNTF)This buffer stores the description of repository items.
¢ Initial record buffer (IREC buffer)This buffer stores the layout of data records in a table.
¢ Short nametab buffer (short NTAB buffer, SNTAB buffer)This buffer combines the field description and table definition buffersand stores only the most important information in each buffer.
Working with Records 2-591Hitachi Tuning Manager Application Reports Reference
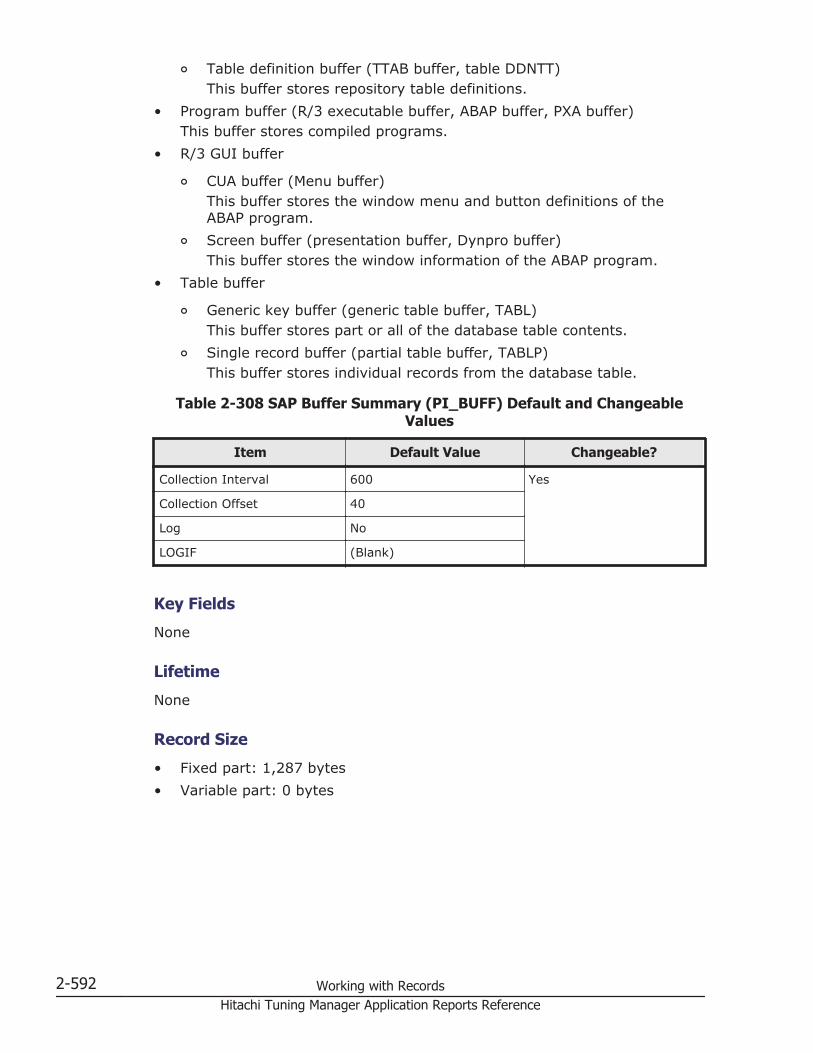
¢ Table definition buffer (TTAB buffer, table DDNTT)This buffer stores repository table definitions.
• Program buffer (R/3 executable buffer, ABAP buffer, PXA buffer)This buffer stores compiled programs.
• R/3 GUI buffer
¢ CUA buffer (Menu buffer)This buffer stores the window menu and button definitions of theABAP program.
¢ Screen buffer (presentation buffer, Dynpro buffer)This buffer stores the window information of the ABAP program.
• Table buffer
¢ Generic key buffer (generic table buffer, TABL)This buffer stores part or all of the database table contents.
¢ Single record buffer (partial table buffer, TABLP)This buffer stores individual records from the database table.
Table 2-308 SAP Buffer Summary (PI_BUFF) Default and ChangeableValues
Item Default Value Changeable?
Collection Interval 600 Yes
Collection Offset 40
Log No
LOGIF (Blank)
Key Fields
None
Lifetime
None
Record Size
• Fixed part: 1,287 bytes• Variable part: 0 bytes
2-592 Working with RecordsHitachi Tuning Manager Application Reports Reference
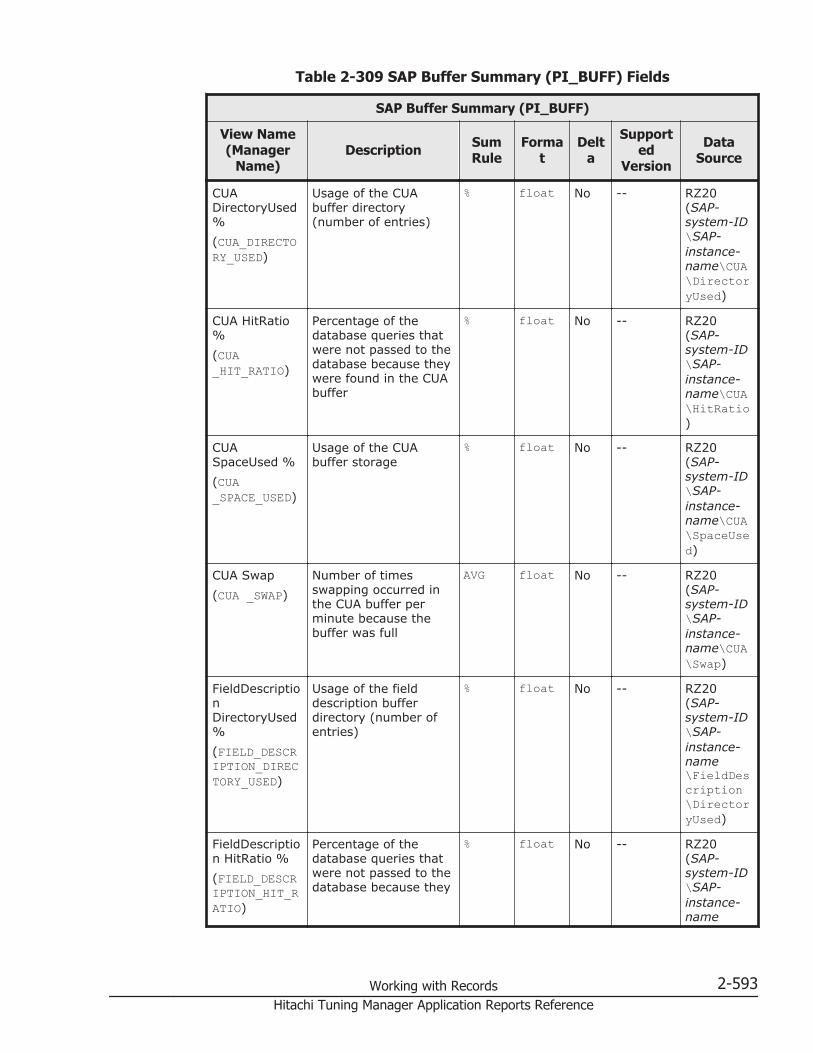
Table 2-309 SAP Buffer Summary (PI_BUFF) Fields
SAP Buffer Summary (PI_BUFF)
View Name(Manager
Name)Description Sum
RuleForma
tDelt
a
Supported
Version
DataSource
CUADirectoryUsed%(CUA_DIRECTORY_USED)
Usage of the CUAbuffer directory(number of entries)
% float No -- RZ20(SAP-system-ID\SAP-instance-name\CUA\DirectoryUsed)
CUA HitRatio%(CUA_HIT_RATIO)
Percentage of thedatabase queries thatwere not passed to thedatabase because theywere found in the CUAbuffer
% float No -- RZ20(SAP-system-ID\SAP-instance-name\CUA\HitRatio)
CUASpaceUsed %(CUA_SPACE_USED)
Usage of the CUAbuffer storage
% float No -- RZ20(SAP-system-ID\SAP-instance-name\CUA\SpaceUsed)
CUA Swap(CUA _SWAP)
Number of timesswapping occurred inthe CUA buffer perminute because thebuffer was full
AVG float No -- RZ20(SAP-system-ID\SAP-instance-name\CUA\Swap)
FieldDescriptionDirectoryUsed%(FIELD_DESCRIPTION_DIRECTORY_USED)
Usage of the fielddescription bufferdirectory (number ofentries)
% float No -- RZ20(SAP-system-ID\SAP-instance-name\FieldDescription\DirectoryUsed)
FieldDescription HitRatio %(FIELD_DESCRIPTION_HIT_RATIO)
Percentage of thedatabase queries thatwere not passed to thedatabase because they
% float No -- RZ20(SAP-system-ID\SAP-instance-name
Working with Records 2-593Hitachi Tuning Manager Application Reports Reference

SAP Buffer Summary (PI_BUFF)
View Name(Manager
Name)Description Sum
RuleForma
tDelt
a
Supported
Version
DataSource
were found in the fielddescription buffer
\FieldDescription\HitRatio)
FieldDescription SpaceUsed%(FIELD_DESCRIPTION_SPACE_USED)
Usage of the fielddescription bufferstorage
% float No -- RZ20(SAP-system-ID\SAP-instance-name\FieldDescription\SpaceUsed)
FieldDescription Swap(FIELD_DESCRIPTION_SWAP)
Number of timesswapping occurred inthe field descriptionbuffer per minutebecause the buffer wasfull
AVG float No -- RZ20(SAP-system-ID\SAP-instance-name\FieldDescription\Swap)
GenericKeyDirectoryUsed%(GENERIC_KEY_DIRECTORY_USED)
Usage of the generickey buffer directory(number of entries)
% float No -- RZ20(SAP-system-ID\SAP-instance-name\GenericKey\DirectoryUsed)
GenericKeyHitRatio %(GENERIC_KEY_HIT_RATIO)
Percentage of thedatabase queries thatwere not passed to thedatabase because theywere found in thegeneric key buffer
% float No -- RZ20(SAP-system-ID\SAP-instance-name\GenericKey\HitRatio)
GenericKeySpaceUsed %(GENERIC_KEY_SPACE_USED)
Usage of the generickey buffer storage
% float No -- RZ20(SAP-system-ID\SAP-instance-name\GenericK
2-594 Working with RecordsHitachi Tuning Manager Application Reports Reference

SAP Buffer Summary (PI_BUFF)
View Name(Manager
Name)Description Sum
RuleForma
tDelt
a
Supported
Version
DataSource
ey\SpaceUsed)
GenericKeySwap(GENERIC_KEY_SWAP)
Number of timesswapping occurred inthe generic key bufferper minute becausethe buffer was full
AVG float No -- RZ20(SAP-system-ID\SAP-instance-name\GenericKey\Swap)
InitialRecordsDirectoryUsed%(INITIAL_RECORDS_DIRECTORY_USED)
Usage of the initialrecords buffer directory(number of entries)
% float No -- RZ20(SAP-system-ID\SAP-instance-name\InitialRecords\DirectoryUsed)
InitialRecordsHitRatio %(INITIAL_RECORDS_HIT_RATIO)
Percentage of thedatabase queries thatwere not passed to thedatabase because theywere found in theinitial records buffer
% float No -- RZ20(SAP-system-ID\SAP-instance-name\InitialRecords\HitRatio)
InitialRecordsSpaceUsed %(INITIAL_RECORDS_SPACE_USED)
Usage of the initialrecords buffer storage
% float No -- RZ20(SAP-system-ID\SAP-instance-name\InitialRecords\SpaceUsed)
InitialRecordsSwap(INITIAL_RECORDS_SWAP)
Number of timesswapping occurred inthe initial recordsbuffer per minutebecause the buffer wasfull
AVG float No -- RZ20(SAP-system-ID\SAP-instance-name\InitialR
Working with Records 2-595Hitachi Tuning Manager Application Reports Reference
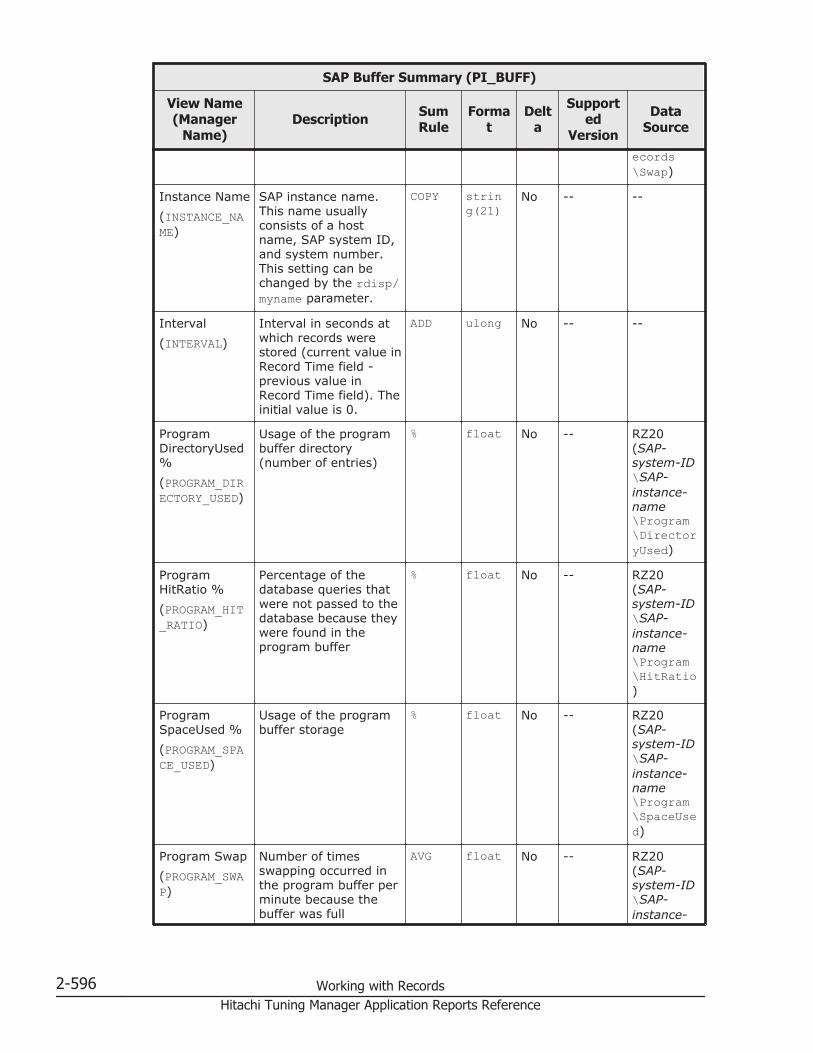
SAP Buffer Summary (PI_BUFF)
View Name(Manager
Name)Description Sum
RuleForma
tDelt
a
Supported
Version
DataSource
ecords\Swap)
Instance Name(INSTANCE_NAME)
SAP instance name.This name usuallyconsists of a hostname, SAP system ID,and system number.This setting can bechanged by the rdisp/myname parameter.
COPY string(21)
No -- --
Interval(INTERVAL)
Interval in seconds atwhich records werestored (current value inRecord Time field -previous value inRecord Time field). Theinitial value is 0.
ADD ulong No -- --
ProgramDirectoryUsed%(PROGRAM_DIRECTORY_USED)
Usage of the programbuffer directory(number of entries)
% float No -- RZ20(SAP-system-ID\SAP-instance-name\Program\DirectoryUsed)
ProgramHitRatio %(PROGRAM_HIT_RATIO)
Percentage of thedatabase queries thatwere not passed to thedatabase because theywere found in theprogram buffer
% float No -- RZ20(SAP-system-ID\SAP-instance-name\Program\HitRatio)
ProgramSpaceUsed %(PROGRAM_SPACE_USED)
Usage of the programbuffer storage
% float No -- RZ20(SAP-system-ID\SAP-instance-name\Program\SpaceUsed)
Program Swap(PROGRAM_SWAP)
Number of timesswapping occurred inthe program buffer perminute because thebuffer was full
AVG float No -- RZ20(SAP-system-ID\SAP-instance-
2-596 Working with RecordsHitachi Tuning Manager Application Reports Reference
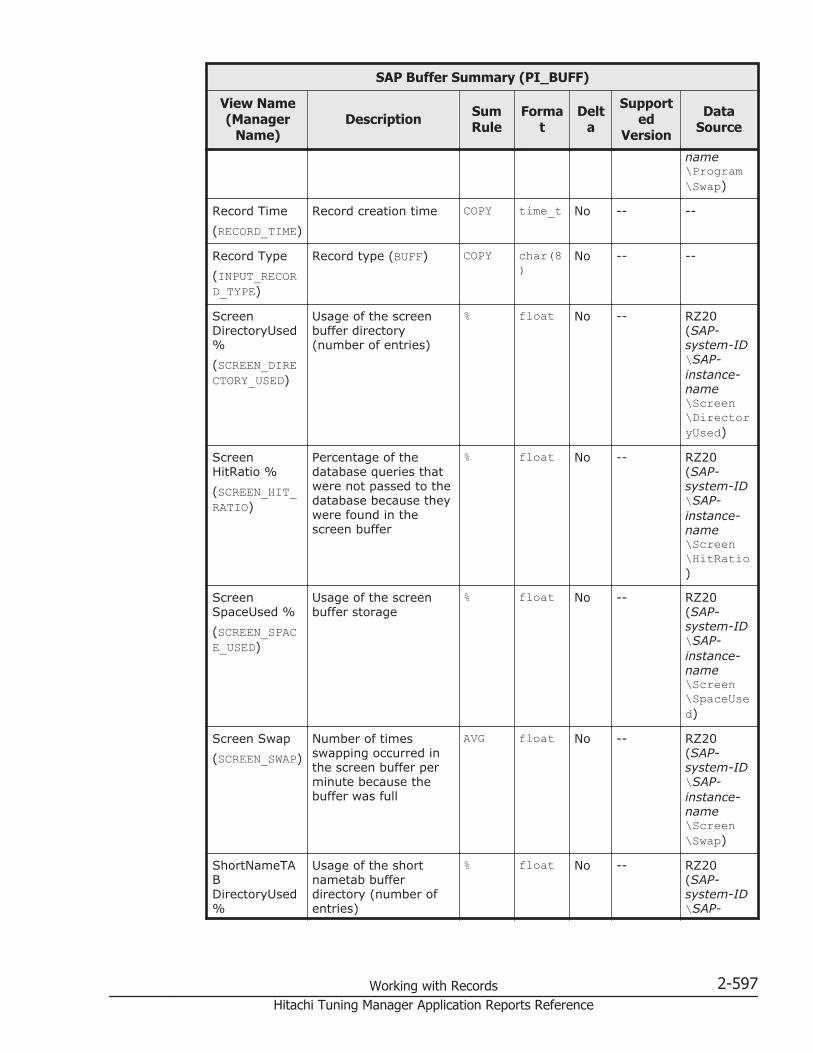
SAP Buffer Summary (PI_BUFF)
View Name(Manager
Name)Description Sum
RuleForma
tDelt
a
Supported
Version
DataSource
name\Program\Swap)
Record Time(RECORD_TIME)
Record creation time COPY time_t No -- --
Record Type(INPUT_RECORD_TYPE)
Record type (BUFF) COPY char(8)
No -- --
ScreenDirectoryUsed%(SCREEN_DIRECTORY_USED)
Usage of the screenbuffer directory(number of entries)
% float No -- RZ20(SAP-system-ID\SAP-instance-name\Screen\DirectoryUsed)
ScreenHitRatio %(SCREEN_HIT_RATIO)
Percentage of thedatabase queries thatwere not passed to thedatabase because theywere found in thescreen buffer
% float No -- RZ20(SAP-system-ID\SAP-instance-name\Screen\HitRatio)
ScreenSpaceUsed %(SCREEN_SPACE_USED)
Usage of the screenbuffer storage
% float No -- RZ20(SAP-system-ID\SAP-instance-name\Screen\SpaceUsed)
Screen Swap(SCREEN_SWAP)
Number of timesswapping occurred inthe screen buffer perminute because thebuffer was full
AVG float No -- RZ20(SAP-system-ID\SAP-instance-name\Screen\Swap)
ShortNameTABDirectoryUsed%
Usage of the shortnametab bufferdirectory (number ofentries)
% float No -- RZ20(SAP-system-ID\SAP-
Working with Records 2-597Hitachi Tuning Manager Application Reports Reference

SAP Buffer Summary (PI_BUFF)
View Name(Manager
Name)Description Sum
RuleForma
tDelt
a
Supported
Version
DataSource
(SHORT_NAME_TAB_DIRECTORY_USED)
instance-name\ShortNameTAB\DirectoryUsed)
ShortNameTAB HitRatio %(SHORT_NAME_TAB_HIT_RATIO)
Percentage of thedatabase queries thatwere not passed to thedatabase because theywere found in the shortnametab buffer
% float No -- RZ20(SAP-system-ID\SAP-instance-name\ShortNameTAB\HitRatio)
ShortNameTAB SpaceUsed%(SHORT_NAME_TAB_SPACE_USED)
Usage of the shortnametab buffer storage
% float No -- RZ20(SAP-system-ID\SAP-instance-name\ShortNameTAB\SpaceUsed)
ShortNameTAB Swap(SHORT_NAME_TAB_SWAP)
Number of timesswapping occurred inthe short nametabbuffer per minutebecause the buffer wasfull
AVG float No -- RZ20(SAP-system-ID\SAP-instance-name\ShortNameTAB\Swap)
SingleRecordDirectoryUsed%(SINGLE_RECORD_DIRECTORY_USED)
Usage of the singlerecord buffer directory(number of entries)
% float No -- RZ20(SAP-system-ID\SAP-instance-name\SingleRecord\DirectoryUsed)
SingleRecordHitRatio %
Percentage of thedatabase queries thatwere not passed to thedatabase because they
% float No -- RZ20(SAP-system-ID\SAP-instance-
2-598 Working with RecordsHitachi Tuning Manager Application Reports Reference

SAP Buffer Summary (PI_BUFF)
View Name(Manager
Name)Description Sum
RuleForma
tDelt
a
Supported
Version
DataSource
(SINGLE_RECORD_HIT_RATIO)
were found in thesingle record buffer
name\SingleRecord\HitRatio)
SingleRecordSpaceUsed %(SINGLE_RECORD_SPACE_USED)
Usage of the singlerecord buffer storage
% float No -- RZ20(SAP-system-ID\SAP-instance-name\SingleRecord\SpaceUsed)
SingleRecordSwap(SINGLE_RECORD_SWAP)
Number of timesswapping occurred inthe single record bufferper minute becausethe buffer was full
AVG float No -- RZ20(SAP-system-ID\SAP-instance-name\SingleRecord\Swap)
System ID(SYSTEM_ID)
SAP system ID COPY string(9)
No -- --
TableDefinitionDirectoryUsed%(TABLE_DEFINITION_DIRECTORY_USED)
Usage of the tabledefinition bufferdirectory (number ofentries)
% float No -- RZ20(SAP-system-ID\SAP-instance-name\TableDefinition\DirectoryUsed)
TableDefinitionHitRatio %(TABLE_DEFINITION_HIT_RATIO)
Percentage of thedatabase queries thatwere not passed to thedatabase because theywere found in the tabledefinition buffer
% float No -- RZ20(SAP-system-ID\SAP-instance-name\TableDefinition\HitRatio)
TableDefinitionSpaceUsed %
Usage of the tabledefinition bufferstorage
% float No -- RZ20(SAP-system-ID
Working with Records 2-599Hitachi Tuning Manager Application Reports Reference
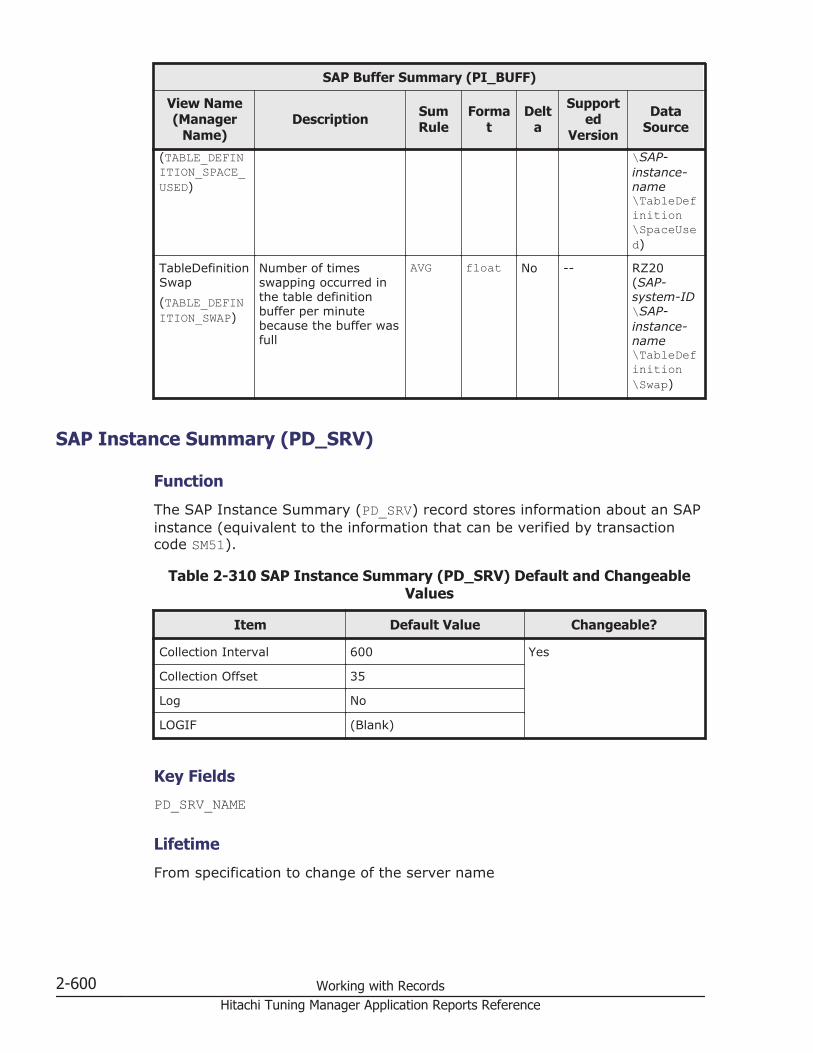
SAP Buffer Summary (PI_BUFF)
View Name(Manager
Name)Description Sum
RuleForma
tDelt
a
Supported
Version
DataSource
(TABLE_DEFINITION_SPACE_USED)
\SAP-instance-name\TableDefinition\SpaceUsed)
TableDefinitionSwap(TABLE_DEFINITION_SWAP)
Number of timesswapping occurred inthe table definitionbuffer per minutebecause the buffer wasfull
AVG float No -- RZ20(SAP-system-ID\SAP-instance-name\TableDefinition\Swap)
SAP Instance Summary (PD_SRV)
Function
The SAP Instance Summary (PD_SRV) record stores information about an SAPinstance (equivalent to the information that can be verified by transactioncode SM51).
Table 2-310 SAP Instance Summary (PD_SRV) Default and ChangeableValues
Item Default Value Changeable?
Collection Interval 600 Yes
Collection Offset 35
Log No
LOGIF (Blank)
Key Fields
PD_SRV_NAME
Lifetime
From specification to change of the server name
2-600 Working with RecordsHitachi Tuning Manager Application Reports Reference

Record Size
• Fixed part: 681 bytes• Variable part: 102 bytes
Table 2-311 SAP Instance Summary (PD_SRV) Fields
SAP Instance Summary (PD_SRV)
View Name(Manager
Name)Description Format Delta Supporte
d VersionData
Source
Host(HOST)
Name of the host wherethe SAP instance is run
string(21)
No -- SM51
Instance Name(INSTANCE_NAME)
SAP instance name. Thisname usually consists of ahost name, SAP systemID, and system number.This setting can bechanged by the rdisp/myname parameter.
string(21)
No -- --
Interval(INTERVAL)
Interval in seconds atwhich records were stored(current value in RecordTime field - previousvalue in Record Timefield). The initial value is0.
ulong No -- --
Name(NAME)
SAP instance name. Thisname usually consists of ahost name, SAP systemID, and system number.This setting can bechanged by the rdisp/myname parameter.
string(21)
No -- SM51
Record Time(RECORD_TIME)
Record creation time time_t No -- --
Record Type(INPUT_RECORD_TYPE)
Record type (SRV) char(8) No -- --
Serv(SERV)
Service name string(21)
No -- SM51
System ID(SYSTEM_ID)
SAP system ID string(9)
No -- --
TypeList(TYPELIST)
SAP instance's type list string(9)
No -- SM51
Working with Records 2-601Hitachi Tuning Manager Application Reports Reference
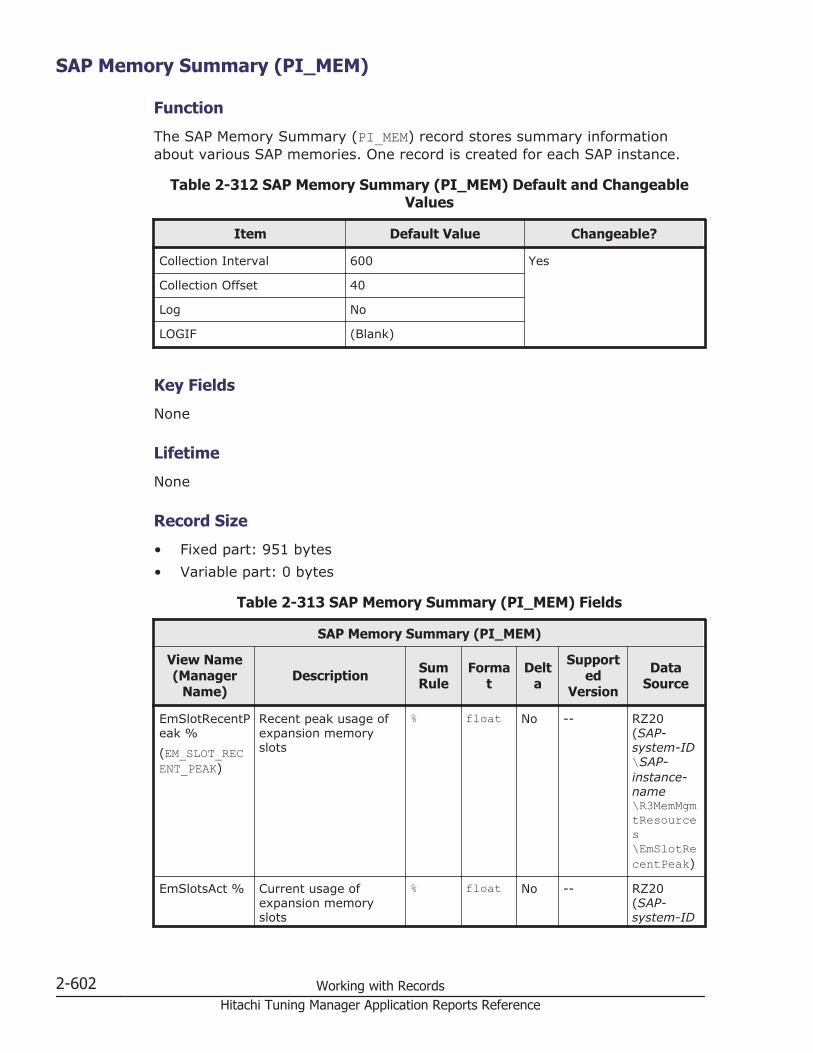
SAP Memory Summary (PI_MEM)
Function
The SAP Memory Summary (PI_MEM) record stores summary informationabout various SAP memories. One record is created for each SAP instance.
Table 2-312 SAP Memory Summary (PI_MEM) Default and ChangeableValues
Item Default Value Changeable?
Collection Interval 600 Yes
Collection Offset 40
Log No
LOGIF (Blank)
Key Fields
None
Lifetime
None
Record Size
• Fixed part: 951 bytes• Variable part: 0 bytes
Table 2-313 SAP Memory Summary (PI_MEM) Fields
SAP Memory Summary (PI_MEM)
View Name(Manager
Name)Description Sum
RuleForma
tDelt
a
Supported
Version
DataSource
EmSlotRecentPeak %(EM_SLOT_RECENT_PEAK)
Recent peak usage ofexpansion memoryslots
% float No -- RZ20(SAP-system-ID\SAP-instance-name\R3MemMgmtResources\EmSlotRecentPeak)
EmSlotsAct % Current usage ofexpansion memoryslots
% float No -- RZ20(SAP-system-ID
2-602 Working with RecordsHitachi Tuning Manager Application Reports Reference

SAP Memory Summary (PI_MEM)
View Name(Manager
Name)Description Sum
RuleForma
tDelt
a
Supported
Version
DataSource
(EM_SLOTS_ACT)
\SAP-instance-name\R3MemMgmtResources\EmSlotsAct)
EmSlotsPeak%(EM_SLOTS_PEAK)
Peak usage ofexpansion memoryslots
% float No -- RZ20(SAP-system-ID\SAP-instance-name\R3MemMgmtResources\EmSlotsPeak)
EmSlotsTotal(EM_SLOTS_TOTAL)
Total number ofexpansion memoryslots
COPY float No -- RZ20(SAP-system-ID\SAP-instance-name\R3MemMgmtResources\EmSlotsTotal)
EsAct %(ES_ACT)
Current usage ofextended memory
% float No -- RZ20(SAP-system-ID\SAP-instance-name\R3MemMgmtResources\EsAct)
EsAttached %(ES_ATTACHED)
Usage of attachedextended memory
% float No -- RZ20(SAP-system-ID\SAP-instance-name\R3MemMgmtResources\EsAttached)
Working with Records 2-603Hitachi Tuning Manager Application Reports Reference

SAP Memory Summary (PI_MEM)
View Name(Manager
Name)Description Sum
RuleForma
tDelt
a
Supported
Version
DataSource
EsPeak %(ES_PEAK)
Peak usage ofextended memory
% float No -- RZ20(SAP-system-ID\SAP-instance-name\R3MemMgmtResources\EsPeak)
EsRecentPeak%(ES_RECENT_PEAK)
Recent peak usage ofextended memory
% float No -- RZ20(SAP-system-ID\SAP-instance-name\R3MemMgmtResources\EsRecentPeak)
EsTotal(ES_TOTAL)
Size of extendedmemory in megabytes
COPY float No -- RZ20(SAP-system-ID\SAP-instance-name\R3MemMgmtResources\EsTotal)
HeapAct %(HEAP_ACT)
Current usage of heaparea
% float No -- RZ20(SAP-system-ID\SAP-instance-name\R3MemMgmtResources\HeapAct)
HeapPeak %(HEAP_PEAK)
Peak usage of heaparea
% float No -- RZ20(SAP-system-ID\SAP-instance-name\R3MemMgmtResources
2-604 Working with RecordsHitachi Tuning Manager Application Reports Reference

SAP Memory Summary (PI_MEM)
View Name(Manager
Name)Description Sum
RuleForma
tDelt
a
Supported
Version
DataSource
\HeapPeak)
HeapRecentPeak %(HEAP_RECENT_PEAK)
Recent peak usage ofheap area
% float No -- RZ20(SAP-system-ID\SAP-instance-name\R3MemMgmtResources\HeapRecentPeak)
HeapTotal(HEAP_TOTAL)
Total size of heap areain megabytes
COPY float No -- RZ20(SAP-system-ID\SAP-instance-name\R3MemMgmtResources\HeapTotal)
Instance Name(INSTANCE_NAME)
SAP instance name.This name usuallyconsists of a hostname, SAP system ID,and system number.This setting can bechanged by the rdisp/myname parameter.
COPY string(21)
No -- --
Interval(INTERVAL)
Interval in seconds atwhich records werestored (current value inRecord Time field -previous value inRecord Time field). Theinitial value is 0.
ADD ulong No -- --
PrivWpNo(PRIV_WP_NO)
Number of workprocesses placed in thePRIV mode
HILO float No -- RZ20(SAP-system-ID\SAP-instance-name\R3MemMgmtResources
Working with Records 2-605Hitachi Tuning Manager Application Reports Reference
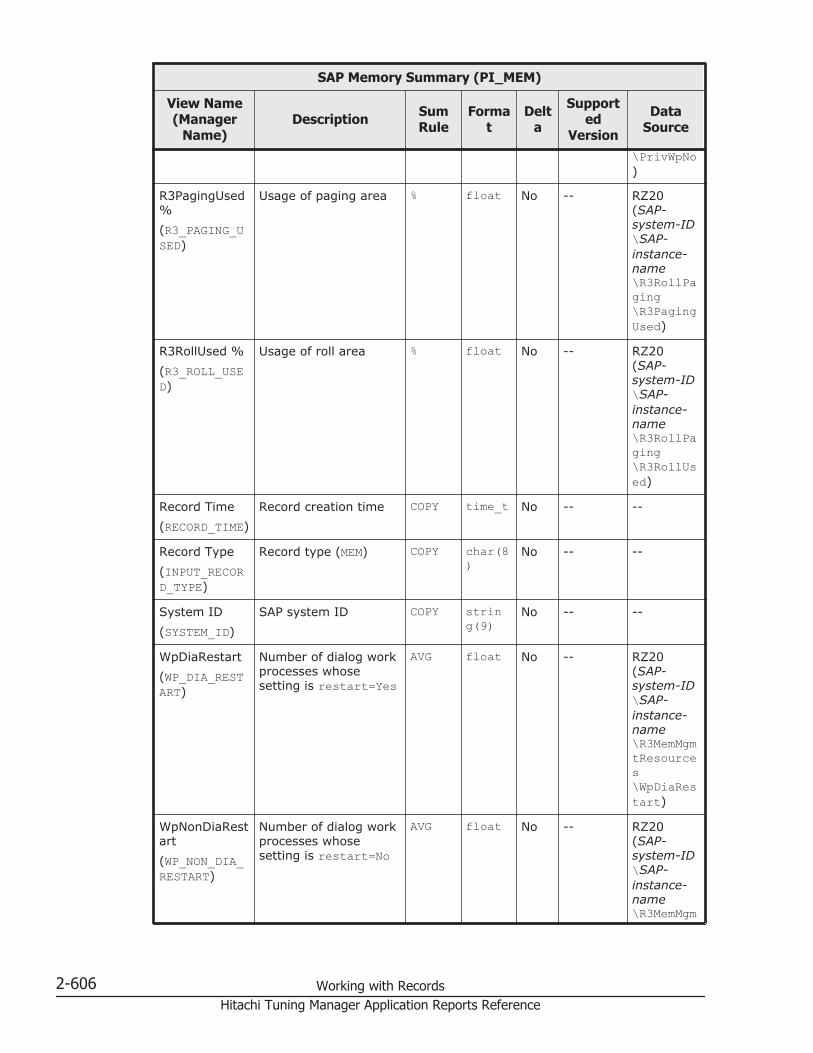
SAP Memory Summary (PI_MEM)
View Name(Manager
Name)Description Sum
RuleForma
tDelt
a
Supported
Version
DataSource
\PrivWpNo)
R3PagingUsed%(R3_PAGING_USED)
Usage of paging area % float No -- RZ20(SAP-system-ID\SAP-instance-name\R3RollPaging\R3PagingUsed)
R3RollUsed %(R3_ROLL_USED)
Usage of roll area % float No -- RZ20(SAP-system-ID\SAP-instance-name\R3RollPaging\R3RollUsed)
Record Time(RECORD_TIME)
Record creation time COPY time_t No -- --
Record Type(INPUT_RECORD_TYPE)
Record type (MEM) COPY char(8)
No -- --
System ID(SYSTEM_ID)
SAP system ID COPY string(9)
No -- --
WpDiaRestart(WP_DIA_RESTART)
Number of dialog workprocesses whosesetting is restart=Yes
AVG float No -- RZ20(SAP-system-ID\SAP-instance-name\R3MemMgmtResources\WpDiaRestart)
WpNonDiaRestart(WP_NON_DIA_RESTART)
Number of dialog workprocesses whosesetting is restart=No
AVG float No -- RZ20(SAP-system-ID\SAP-instance-name\R3MemMgm
2-606 Working with RecordsHitachi Tuning Manager Application Reports Reference

SAP Memory Summary (PI_MEM)
View Name(Manager
Name)Description Sum
RuleForma
tDelt
a
Supported
Version
DataSource
tResources\WpNonDiaRestart)
Spool Service (PI_SPO)
Function
The Spool Service (PI_SPO) record stores statistical information about thespool service. One record is created for each SAP instance that provides thisservice.
Table 2-314 Spool Service (PI_SPO) Default and Changeable Values
Item Default Value Changeable?
Collection Interval 600 Yes
Collection Offset 40
Log No
LOGIF (Blank)
Key Fields
None
Lifetime
None
Record Size
• Fixed part: 855 bytes• Variable part: 0 bytes
Working with Records 2-607Hitachi Tuning Manager Application Reports Reference

Table 2-315 Spool Service (PI_SPO) Fields
Spool Service (PI_SPO)
View Name(Manager
Name)Description Sum
RuleForma
tDelt
a
Supported
Version
DataSource
DeviceCacheFixed %(DEVICE_CACHE_FIXED)
Percentage of usedarea in the fixed devicecache
% float No -- RZ20(SAP-system-ID\SAP-instance-name\SpoolService\DeviceCacheFixed)
DeviceCacheUsed %(DEVICE_CACHE_USED)
Percentage of usedarea in the entiredevice cache
% float No -- RZ20(SAP-system-ID\SAP-instance-name\SpoolService\DeviceCacheUsed)
HostspoolListUsed %(HOSTSPOOL_LIST_USED)
Percentage of usedarea in the host spoolrequest list
% float No -- RZ20(SAP-system-ID\SAP-instance-name\SpoolService\HostspoolListUsed)
Instance Name(INSTANCE_NAME)
SAP instance name.This name usuallyconsists of a hostname, SAP system ID,and system number.This setting can bechanged by the rdisp/myname parameter.
COPY string(21)
No -- --
Interval(INTERVAL)
Interval in seconds atwhich records werestored (current value inRecord Time field -previous value inRecord Time field). Theinitial value is 0.
ADD ulong No -- --
2-608 Working with RecordsHitachi Tuning Manager Application Reports Reference

Spool Service (PI_SPO)
View Name(Manager
Name)Description Sum
RuleForma
tDelt
a
Supported
Version
DataSource
NumberOfWpSPO(NUMBER_OF_WP_SPO)
Number of spool workprocesses
AVG float No -- RZ20(SAP-system-ID\SAP-instance-name\SpoolService\NumberOfWpSPO)
QueueLength%(QUEUE_LENGTH)
Percentage of usedarea in the dispatcherqueue
% float No -- RZ20(SAP-system-ID\SAP-instance-name\SpoolService\QueueLength)
Record Time(RECORD_TIME)
Record creation time COPY time_t No -- --
Record Type(INPUT_RECORD_TYPE)
Record type (SPO) COPY char(8)
No -- --
ServiceQueue%(SERVICE_QUEUE)
Percentage of usedarea in the spoolrequest queue
% float No -- RZ20(SAP-system-ID\SAP-instance-name\SpoolService\ServiceQueue)
ServiceQueuePages(SERVICE_QUEUE_PAGES)
Number of pages in thespool request queue
AVG float No -- RZ20(SAP-system-ID\SAP-instance-name\SpoolService\ServiceQueuePages)
Working with Records 2-609Hitachi Tuning Manager Application Reports Reference
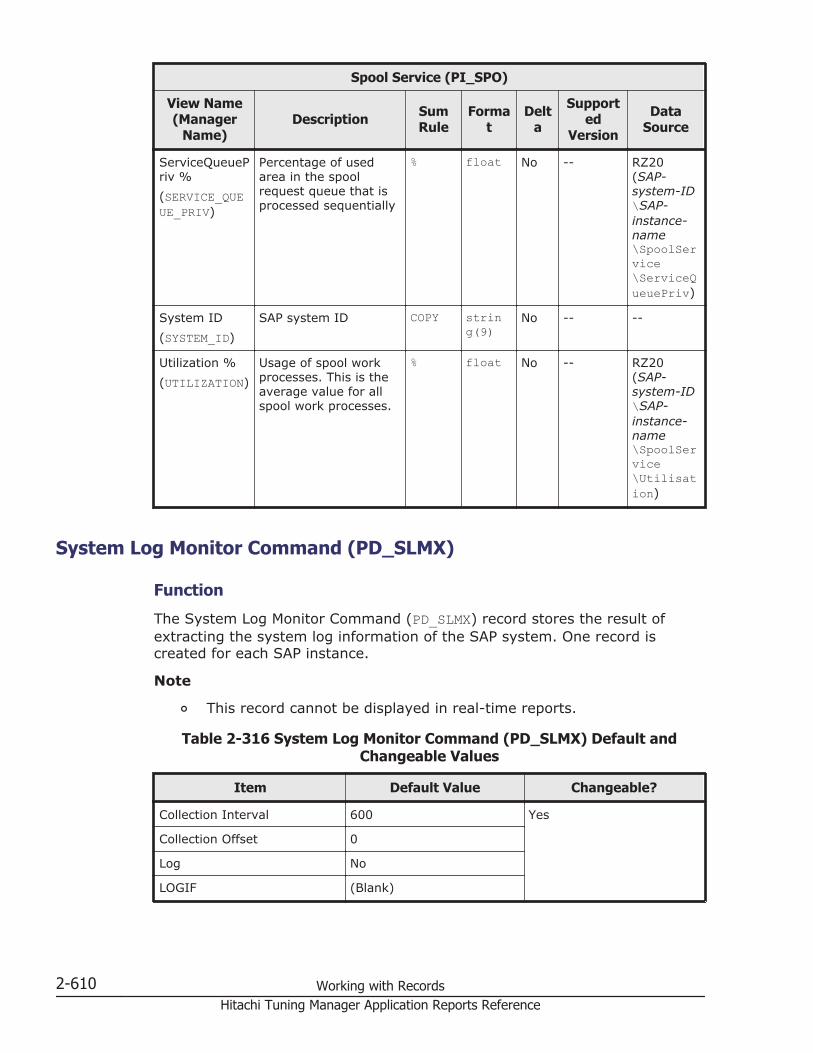
Spool Service (PI_SPO)
View Name(Manager
Name)Description Sum
RuleForma
tDelt
a
Supported
Version
DataSource
ServiceQueuePriv %(SERVICE_QUEUE_PRIV)
Percentage of usedarea in the spoolrequest queue that isprocessed sequentially
% float No -- RZ20(SAP-system-ID\SAP-instance-name\SpoolService\ServiceQueuePriv)
System ID(SYSTEM_ID)
SAP system ID COPY string(9)
No -- --
Utilization %(UTILIZATION)
Usage of spool workprocesses. This is theaverage value for allspool work processes.
% float No -- RZ20(SAP-system-ID\SAP-instance-name\SpoolService\Utilisation)
System Log Monitor Command (PD_SLMX)
Function
The System Log Monitor Command (PD_SLMX) record stores the result ofextracting the system log information of the SAP system. One record iscreated for each SAP instance.
Note
¢ This record cannot be displayed in real-time reports.
Table 2-316 System Log Monitor Command (PD_SLMX) Default andChangeable Values
Item Default Value Changeable?
Collection Interval 600 Yes
Collection Offset 0
Log No
LOGIF (Blank)
2-610 Working with RecordsHitachi Tuning Manager Application Reports Reference

Key Fields
None
Lifetime
None
Record Size
• Fixed part: 5,073 bytes• Variable part: 0 bytes
Table 2-317 System Log Monitor Command (PD_SLMX) Fields
System Log Monitor Command (PD_SLMX)
View Name(Manager
Name)Description Format Delta Supporte
d VersionData
Source
Elapsed Time(ELAPSED_TIME)
Command execution timein milliseconds
ulong No -- --
Exit Code(EXIT_CODE)
Command terminationcode
ulong No -- --
Instance Name(INSTANCE_NAME)
SAP instance name. Thisname usually consists of ahost name, SAP systemID, and system number.This setting can bechanged by the rdisp/myname parameter.
string(21)
No -- --
Interval(INTERVAL)
Interval in seconds atwhich records were stored(current value in RecordTime field - previousvalue in Record Timefield). The initial value is0.
ulong No -- --
Path(PATH)
Command path (excludingthe argument part)
string(256)
No -- --
Record Time(RECORD_TIME)
Record creation time time_t No -- --
Record Type(INPUT_RECORD_TYPE)
Record type (SLMX) char(8) No -- --
Stderr Buffer(STDERR_BUFFER)
Standard error outputbuffer for the command
string(2049)
No -- --
Working with Records 2-611Hitachi Tuning Manager Application Reports Reference
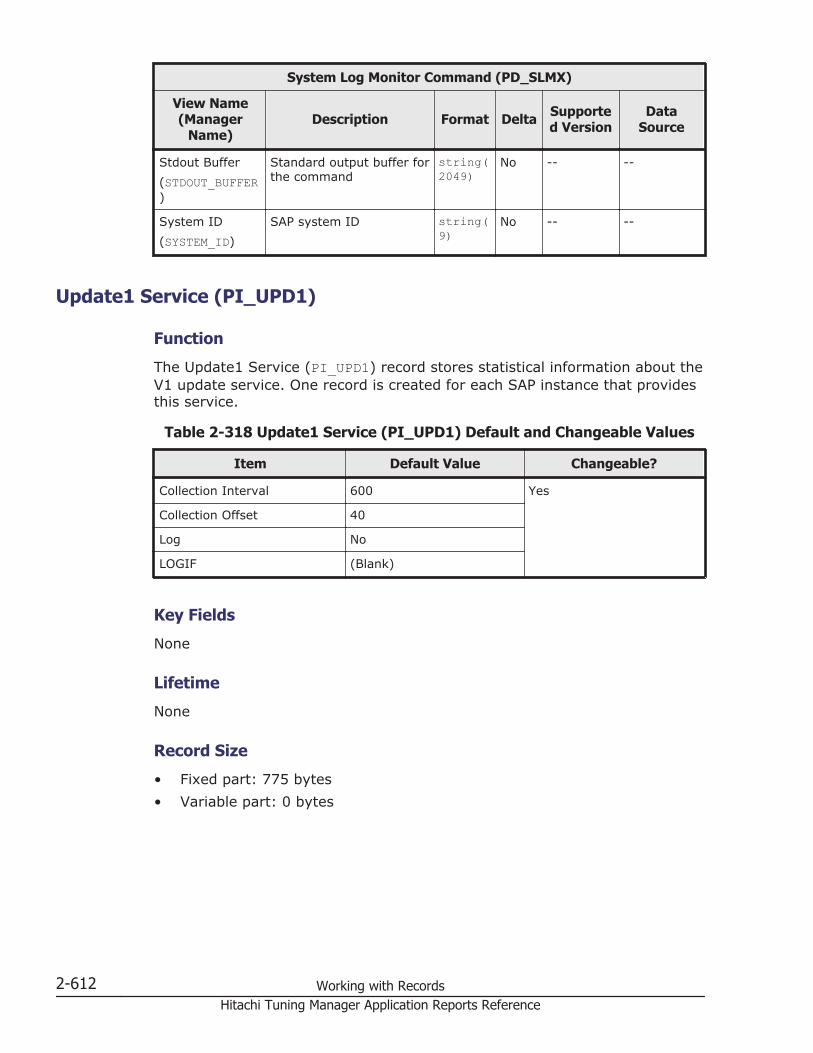
System Log Monitor Command (PD_SLMX)
View Name(Manager
Name)Description Format Delta Supporte
d VersionData
Source
Stdout Buffer(STDOUT_BUFFER)
Standard output buffer forthe command
string(2049)
No -- --
System ID(SYSTEM_ID)
SAP system ID string(9)
No -- --
Update1 Service (PI_UPD1)
Function
The Update1 Service (PI_UPD1) record stores statistical information about theV1 update service. One record is created for each SAP instance that providesthis service.
Table 2-318 Update1 Service (PI_UPD1) Default and Changeable Values
Item Default Value Changeable?
Collection Interval 600 Yes
Collection Offset 40
Log No
LOGIF (Blank)
Key Fields
None
Lifetime
None
Record Size
• Fixed part: 775 bytes• Variable part: 0 bytes
2-612 Working with RecordsHitachi Tuning Manager Application Reports Reference

Table 2-319 Update1 Service (PI_UPD1) Fields
Update1 Service (PI_UPD1)
View name(Manager
Name)Description Sum
RuleForma
tDelt
a
Supported
Version
DataSource
Instance Name(INSTANCE_NAME)
SAP instance name.This name usuallyconsists of a hostname, SAP system ID,and system number.This setting can bechanged by the rdisp/myname parameter.
COPY string(21)
No -- --
Interval(INTERVAL)
Interval in seconds atwhich records werestored (current value inRecord Time field -previous value inRecord Time field). Theinitial value is 0.
ADD ulong No -- --
NumberOfWpUD1(NUMBER_OF_WP_UD1)
Number of updatework processes
AVG float No -- RZ20(SAP-system-ID\SAP-instance-name\PerformanceU1\NumberOfWpUD1)
QueueTime(QUEUE_TIME)
Average wait time (inmilliseconds) in thedispatcher queue
AVG float No -- RZ20(SAP-system-ID\SAP-instance-name\PerformanceU1\QueueTime)
Record Time(RECORD_TIME)
Record creation time COPY time_t No -- --
Record Type(INPUT_RECORD_TYPE)
Record type (UPD1) COPY char(8)
No -- --
ResponseTime(RESPONSE_TIME)
Average response time(in milliseconds) ofupdate services
AVG float No -- RZ20(SAP-system-ID\SAP-instance-name\Performa
Working with Records 2-613Hitachi Tuning Manager Application Reports Reference

Update1 Service (PI_UPD1)
View name(Manager
Name)Description Sum
RuleForma
tDelt
a
Supported
Version
DataSource
nceU1\ResponseTime)
System ID(SYSTEM_ID)
SAP system ID COPY string(9)
No -- --
Utilization %(UTILIZATION)
Usage of update workprocesses. This is theaverage value for allupdate work processes.
% float No -- RZ20(SAP-system-ID\SAP-instance-name\PerformanceU1\Utilisation)
Update2 Service (PI_UPD2)
Function
The Update2 Service (PI_UPD2) record stores statistical information about theV2 update service. One record is created for each SAP instance that providesthis service.
Table 2-320 Update2 Service (PI_UPD2) Default and Changeable Values
Item Default Value Changeable?
Collection Interval 600 Yes
Collection Offset 40
Log No
LOGIF (Blank)
Key Fields
None
Lifetime
None
Record Size
• Fixed part: 775 bytes
2-614 Working with RecordsHitachi Tuning Manager Application Reports Reference

• Variable part: 0 bytes
Table 2-321 Update2 Service (PI_UPD2) Fields
Update2 Service (PI_UPD2)
View Name(Manager
Name)Description Sum
RuleForma
tDelt
a
Supported
Version
DataSource
Instance Name(INSTANCE_NAME)
SAP instance name.This name usuallyconsists of a hostname, SAP system ID,and system number.This setting can bechanged by the rdisp/myname parameter.
COPY string(21)
No -- --
Interval(INTERVAL)
Interval in seconds atwhich records werestored (current value inRecord Time field -previous value inRecord Time field). Theinitial value is 0.
ADD ulong No -- --
NumberOfWpUD2(NUMBER_OF_WP_UD2)
Number of updatework processes
AVG float No -- RZ20(SAP-system-ID\SAP-instance-name\PerformanceU2\NumberOfWpUD2)
QueueTime(QUEUE_TIME)
Average wait time (inmilliseconds) in thedispatcher queue
AVG float No -- RZ20(SAP-system-ID\SAP-instance-name\PerformanceU2\QueueTime)
Record Time(RECORD_TIME)
Record creation time COPY time_t No -- --
Record Type(INPUT_RECORD_TYPE)
Record type (UPD2) COPY char(8)
No -- --
ResponseTime(RESPONSE_TIME)
Average response time(in milliseconds) ofupdate services
AVG float No -- RZ20(SAP-system-ID\SAP-instance-
Working with Records 2-615Hitachi Tuning Manager Application Reports Reference

Update2 Service (PI_UPD2)
View Name(Manager
Name)Description Sum
RuleForma
tDelt
a
Supported
Version
DataSource
name\PerformanceU2\ResponseTime)
System ID(SYSTEM_ID)
SAP system ID COPY string(9)
No -- --
Utilization %(UTILIZATION)
Usage of update workprocesses. This is theaverage value for allupdate work processes.
% float No -- RZ20(SAP-system-ID\SAP-instance-name\PerformanceU2\Utilisation)
User defined Monitor (Perf.) (PI_UMP)
Function
In SAP system monitor information, the User defined Monitor (Perf.) (PI_UMP)record stores performance data collected according to user definitions. Onerecord is created for each MTE whose MTE type is the performance attributein the specified SAP system monitor information.
Table 2-322 User defined Monitor (Perf.) (PI_UMP) Default andChangeable Values
Item Default Value Changeable?
Collection Interval 600 Yes
Collection Offset 45
Log No
LOGIF (Blank)
Key Fields
PI_UMP_MTE_NAME
Lifetime
None
2-616 Working with RecordsHitachi Tuning Manager Application Reports Reference

Record Size
• Fixed part: 833 bytes• Variable part: 293 bytes
Table 2-323 User defined Monitor (Perf.) (PI_UMP) Fields
User defined Monitor (Perf.) (PI_UMP)
View Name(Manager
Name)Description Sum
RuleForma
tDelt
aSupported Version
DataSource
Instance Name(INSTANCE_NAME)
SAP instance name.This name usuallyconsists of a hostname, SAP system ID,and system number.This setting can bechanged by the rdisp/myname parameter.
COPY string(21)
No -- --
Interval(INTERVAL)
Interval in seconds atwhich records werestored (current value inRecord Time field -previous value inRecord Time field). Theinitial value is 0.
ADD ulong No -- --
Measured Date(MEASURED_DATE)
Measured date for theperformance value(Measured Value)
COPY String(9)
No -- RZ20
Measured Time(MEASURED_TIME)
Measured time for theperformance value(Measured Value)
COPY String(7)
No -- RZ20
MeasuredValue(MEASURED_VALUE)
Performance value(already obtained inthe SAP system)
HILO float No -- RZ20
Monitor Name(MONITOR_NAME)
Monitor name COPY string(61)
No -- RZ20
Monitor Set(MONITOR_SET)
Monitor set name COPY string(61)
No -- RZ20
MTE Context(MTE_CONTEXT)
Name of Context partof MTE
COPY string(41)
No -- RZ20
MTE Name(MTE_NAME)
MTE name (MTE'sSystem ID part,Context part,Objectname part, andShortname partconnected by a
COPY string(132)
No -- RZ20
Working with Records 2-617Hitachi Tuning Manager Application Reports Reference
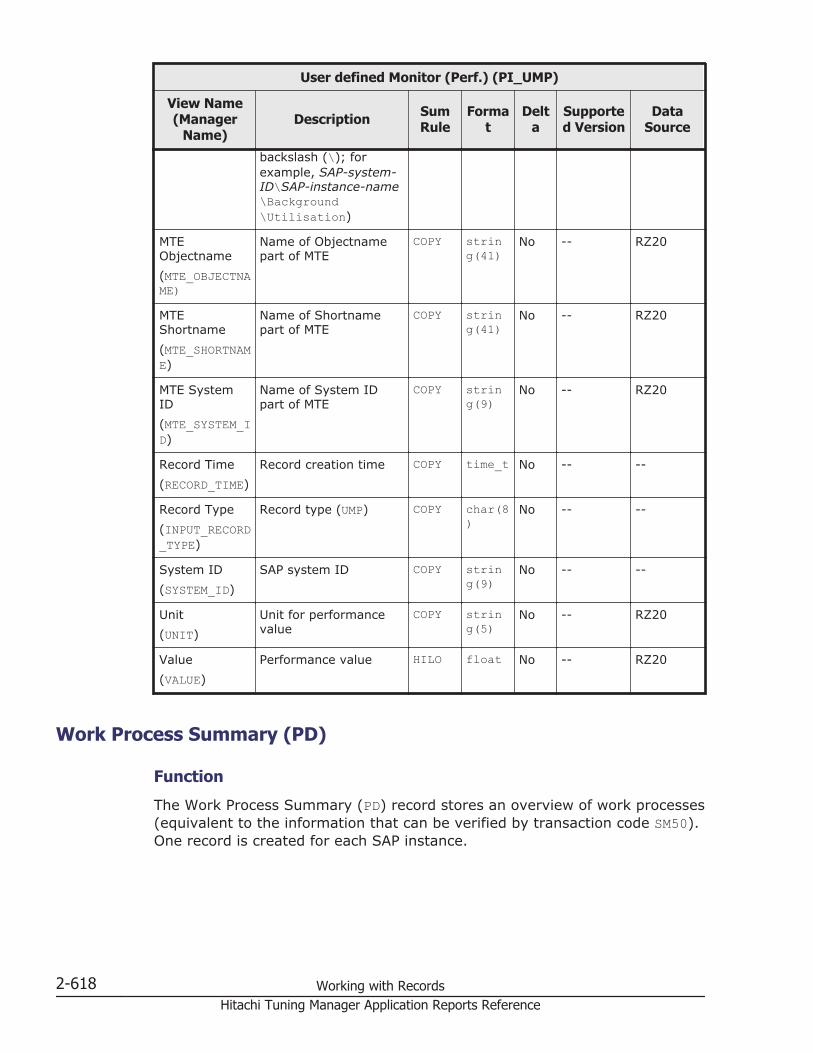
User defined Monitor (Perf.) (PI_UMP)
View Name(Manager
Name)Description Sum
RuleForma
tDelt
aSupported Version
DataSource
backslash (\); forexample, SAP-system-ID\SAP-instance-name\Background\Utilisation)
MTEObjectname(MTE_OBJECTNAME)
Name of Objectnamepart of MTE
COPY string(41)
No -- RZ20
MTEShortname(MTE_SHORTNAME)
Name of Shortnamepart of MTE
COPY string(41)
No -- RZ20
MTE SystemID(MTE_SYSTEM_ID)
Name of System IDpart of MTE
COPY string(9)
No -- RZ20
Record Time(RECORD_TIME)
Record creation time COPY time_t No -- --
Record Type(INPUT_RECORD_TYPE)
Record type (UMP) COPY char(8)
No -- --
System ID(SYSTEM_ID)
SAP system ID COPY string(9)
No -- --
Unit(UNIT)
Unit for performancevalue
COPY string(5)
No -- RZ20
Value(VALUE)
Performance value HILO float No -- RZ20
Work Process Summary (PD)
Function
The Work Process Summary (PD) record stores an overview of work processes(equivalent to the information that can be verified by transaction code SM50).One record is created for each SAP instance.
2-618 Working with RecordsHitachi Tuning Manager Application Reports Reference
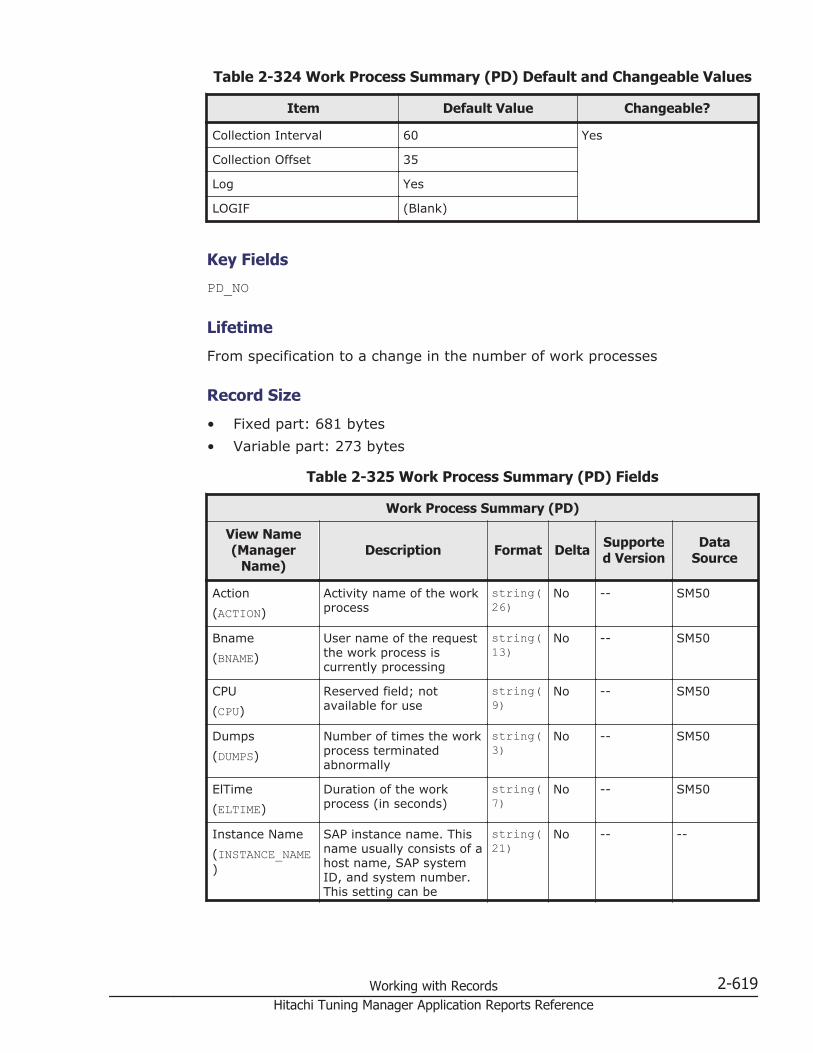
Table 2-324 Work Process Summary (PD) Default and Changeable Values
Item Default Value Changeable?
Collection Interval 60 Yes
Collection Offset 35
Log Yes
LOGIF (Blank)
Key Fields
PD_NO
Lifetime
From specification to a change in the number of work processes
Record Size
• Fixed part: 681 bytes• Variable part: 273 bytes
Table 2-325 Work Process Summary (PD) Fields
Work Process Summary (PD)
View Name(Manager
Name)Description Format Delta Supporte
d VersionData
Source
Action(ACTION)
Activity name of the workprocess
string(26)
No -- SM50
Bname(BNAME)
User name of the requestthe work process iscurrently processing
string(13)
No -- SM50
CPU(CPU)
Reserved field; notavailable for use
string(9)
No -- SM50
Dumps(DUMPS)
Number of times the workprocess terminatedabnormally
string(3)
No -- SM50
ElTime(ELTIME)
Duration of the workprocess (in seconds)
string(7)
No -- SM50
Instance Name(INSTANCE_NAME)
SAP instance name. Thisname usually consists of ahost name, SAP systemID, and system number.This setting can be
string(21)
No -- --
Working with Records 2-619Hitachi Tuning Manager Application Reports Reference

Work Process Summary (PD)
View Name(Manager
Name)Description Format Delta Supporte
d VersionData
Source
changed by the rdisp/myname parameter.
Interval(INTERVAL)
Interval in seconds atwhich records were stored(current value in RecordTime field - previousvalue in Record Timefield). The initial value is0.
ulong No -- --
ManDt(MANDT)
Client name of therequest the work processis currently processing
string(4)
No -- SM50
No(NO)
Work process number string(3)
No -- SM50
Pid(PID)
Process ID of the workprocess in the hostsystem
string(9)
No -- SM50
Record Time(RECORD_TIME)
Record creation time time_t No -- --
Record Type(INPUT_RECORD_TYPE)
Record type (PD) char(8) No -- --
Report(REPORT)
Name of the report thework process is executing
string(41)
No -- SM50
Restart(RESTART)
Y or N indicating whetherthe work process will bere-executed automaticallyin the event of abnormaltermination.
string(5)
No -- SM50
Sem(SEM)
Semaphore number atwhich the work process isin wait status
string(3)
No -- SM50
Server(SERVER)
Server name string(21)
No -- SM50
Status(STATUS)
Current status of the workprocess (example:Waiting or Running)
string(8)
No -- SM50
System ID(SYSTEM_ID)
SAP system ID string(9)
No -- --
2-620 Working with RecordsHitachi Tuning Manager Application Reports Reference
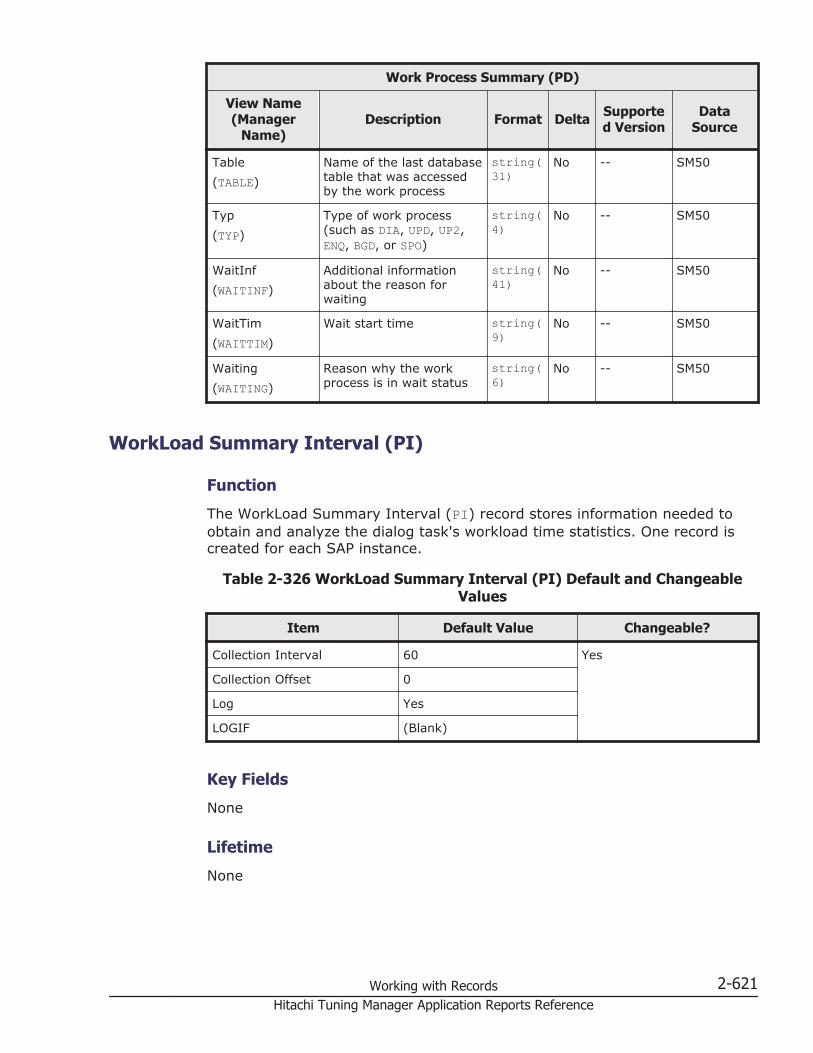
Work Process Summary (PD)
View Name(Manager
Name)Description Format Delta Supporte
d VersionData
Source
Table(TABLE)
Name of the last databasetable that was accessedby the work process
string(31)
No -- SM50
Typ(TYP)
Type of work process(such as DIA, UPD, UP2,ENQ, BGD, or SPO)
string(4)
No -- SM50
WaitInf(WAITINF)
Additional informationabout the reason forwaiting
string(41)
No -- SM50
WaitTim(WAITTIM)
Wait start time string(9)
No -- SM50
Waiting(WAITING)
Reason why the workprocess is in wait status
string(6)
No -- SM50
WorkLoad Summary Interval (PI)
Function
The WorkLoad Summary Interval (PI) record stores information needed toobtain and analyze the dialog task's workload time statistics. One record iscreated for each SAP instance.
Table 2-326 WorkLoad Summary Interval (PI) Default and ChangeableValues
Item Default Value Changeable?
Collection Interval 60 Yes
Collection Offset 0
Log Yes
LOGIF (Blank)
Key Fields
None
Lifetime
None
Working with Records 2-621Hitachi Tuning Manager Application Reports Reference

Record Size
• Fixed part: 1,075 bytes• Variable part: 0 bytes
Table 2-327 WorkLoad Summary Interval (PI) Fields
WorkLoad Summary Interval (PI)
View Name(Manager
Name)Description Sum
RuleForma
tDelt
a
Supported
Version
DataSource
CUA HitRatio%(CUA_HIT_RATIO)
Percentage of thedatabase queries thatwere not passed to thedatabase because theywere found in the CUAbuffer. For detailsabout the CUA buffer,see the SAP BufferSummary (PI_BUFF)record.
% float No -- RZ20(SAP-system-ID\SAP-instance-name\CUA\HitRatio)
DBRequestTime(DB_REQUEST_TIME)
Average time forprocessing logicaldatabase requests inmilliseconds
AVG float No -- RZ20(SAP-system-ID\SAP-instance-name\Dialog\DBRequestTime)
DialogSteps(DIALOG_STEPS)
Average number ofdialog steps per minute
AVG float No -- RZ20(SAP-system-ID\SAP-instance-name\Dialog\DialogSteps)
EsAct %(ES_ACT)
Current usage ofextended memory
% float No -- RZ20(SAP-system-ID\SAP-instance-name\R3MemMgmtResources\EsAct)
FieldDescription HitRatio %(FIELD_DESCRIPTION_HIT_RATIO)
Percentage of thedatabase queries thatwere not passed to thedatabase because theywere found in the fielddescription buffer. For
% float No -- RZ20(SAP-system-ID\SAP-instance-name
2-622 Working with RecordsHitachi Tuning Manager Application Reports Reference

WorkLoad Summary Interval (PI)
View Name(Manager
Name)Description Sum
RuleForma
tDelt
a
Supported
Version
DataSource
details about the fielddescription buffer, seethe SAP BufferSummary (PI_BUFF)record.
\FieldDescription\HitRatio)
FrontendNetTime(FRONTEND_NET_TIME)
Network time (inmilliseconds) used forthe first data transferfrom front end toapplication server andfor the last datatransfer fromapplication server tofront end. This doesnot include the value ofthe GuiCallBackTimefield.
AVG float No -- RZ20(SAP-system-ID\SAP-instance-name\Dialog\FrontEndNetTime)
FrontendResponseTime(FRONTEND_RESPONSE_TIME)
Average time (inmilliseconds) the userwaited at the front endfor a request to beprocessed. This is theaverage of the totals ofresponse time, networktransfer time, andfront-end processingtime.
AVG float No -- RZ20(SAP-system-ID\SAP-instance-name\Dialog\FrontendResponseTime)
GenericKeyHitRatio %(GENERIC_KEY_HIT_RATIO)
Percentage of thedatabase queries thatwere not passed to thedatabase because theywere found in thegeneric key buffer. Fordetails about thegeneric key buffer, seethe SAP BufferSummary (PI_BUFF)record.
% float No -- RZ20(SAP-system-ID\SAP-instance-name\GenericKey\HitRatio)
HeapAct %(HEAP_ACT)
Current usage of theheap area
% float No -- RZ20(SAP-system-ID\SAP-instance-name\R3MemMgmtResources\HeapAct)
Working with Records 2-623Hitachi Tuning Manager Application Reports Reference

WorkLoad Summary Interval (PI)
View Name(Manager
Name)Description Sum
RuleForma
tDelt
a
Supported
Version
DataSource
InitialRecordsHitRatio %(INITIAL_RECORDS_HIT_RATIO)
Percentage of thedatabase queries thatwere not passed to thedatabase because theywere found in theinitial records buffer.For details about theinitial records buffer,see the SAP BufferSummary (PI_BUFF)record.
% float No -- RZ20(SAP-system-ID\SAP-instance-name\InitialRecords\HitRatio)
Instance Name(INSTANCE_NAME)
SAP instance name.This name usuallyconsists of a hostname, SAP system ID,and system number.This setting can bechanged by the rdisp/myname parameter.
COPY string(21)
No -- --
Interval(INTERVAL)
Interval in seconds atwhich records werestored (current value inRecord Time field -previous value inRecord Time field). Theinitial value is 0.
ADD ulong No -- --
Load+GenTime(LOAD_GENTIME)
Average loading andcreation time (inmilliseconds) forsource text, graphicaluser interface, andwindow informationfrom the database.
AVG float No -- RZ20(SAP-system-ID\SAP-instance-name\Dialog\Load+GenTime)
PrivWpNo(PRIV_WP_NO)
Number of workprocesses placed in thePRIV mode
HI float No -- RZ20(SAP-system-ID\SAP-instance-name\R3MemMgmtResources\PrivWpNo)
ProgramHitRatio %
Percentage of thedatabase queries thatwere not passed to the
% float No -- RZ20(SAP-system-ID
2-624 Working with RecordsHitachi Tuning Manager Application Reports Reference
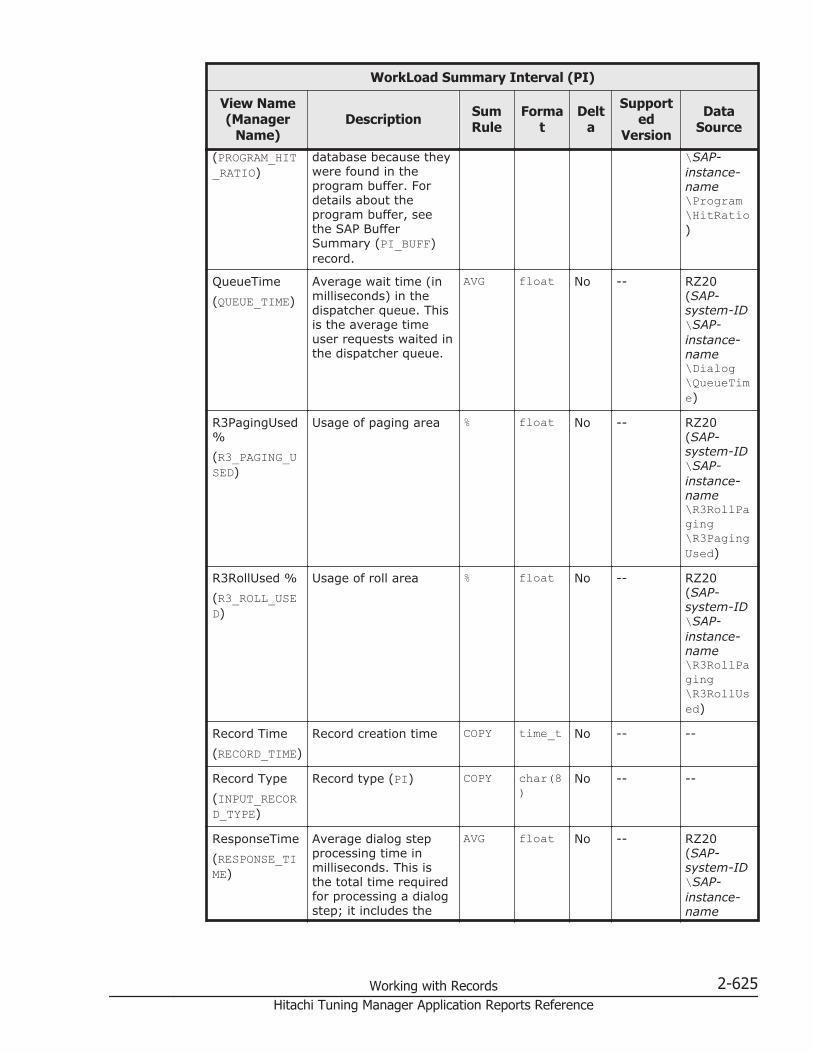
WorkLoad Summary Interval (PI)
View Name(Manager
Name)Description Sum
RuleForma
tDelt
a
Supported
Version
DataSource
(PROGRAM_HIT_RATIO)
database because theywere found in theprogram buffer. Fordetails about theprogram buffer, seethe SAP BufferSummary (PI_BUFF)record.
\SAP-instance-name\Program\HitRatio)
QueueTime(QUEUE_TIME)
Average wait time (inmilliseconds) in thedispatcher queue. Thisis the average timeuser requests waited inthe dispatcher queue.
AVG float No -- RZ20(SAP-system-ID\SAP-instance-name\Dialog\QueueTime)
R3PagingUsed%(R3_PAGING_USED)
Usage of paging area % float No -- RZ20(SAP-system-ID\SAP-instance-name\R3RollPaging\R3PagingUsed)
R3RollUsed %(R3_ROLL_USED)
Usage of roll area % float No -- RZ20(SAP-system-ID\SAP-instance-name\R3RollPaging\R3RollUsed)
Record Time(RECORD_TIME)
Record creation time COPY time_t No -- --
Record Type(INPUT_RECORD_TYPE)
Record type (PI) COPY char(8)
No -- --
ResponseTime(RESPONSE_TIME)
Average dialog stepprocessing time inmilliseconds. This isthe total time requiredfor processing a dialogstep; it includes the
AVG float No -- RZ20(SAP-system-ID\SAP-instance-name
Working with Records 2-625Hitachi Tuning Manager Application Reports Reference
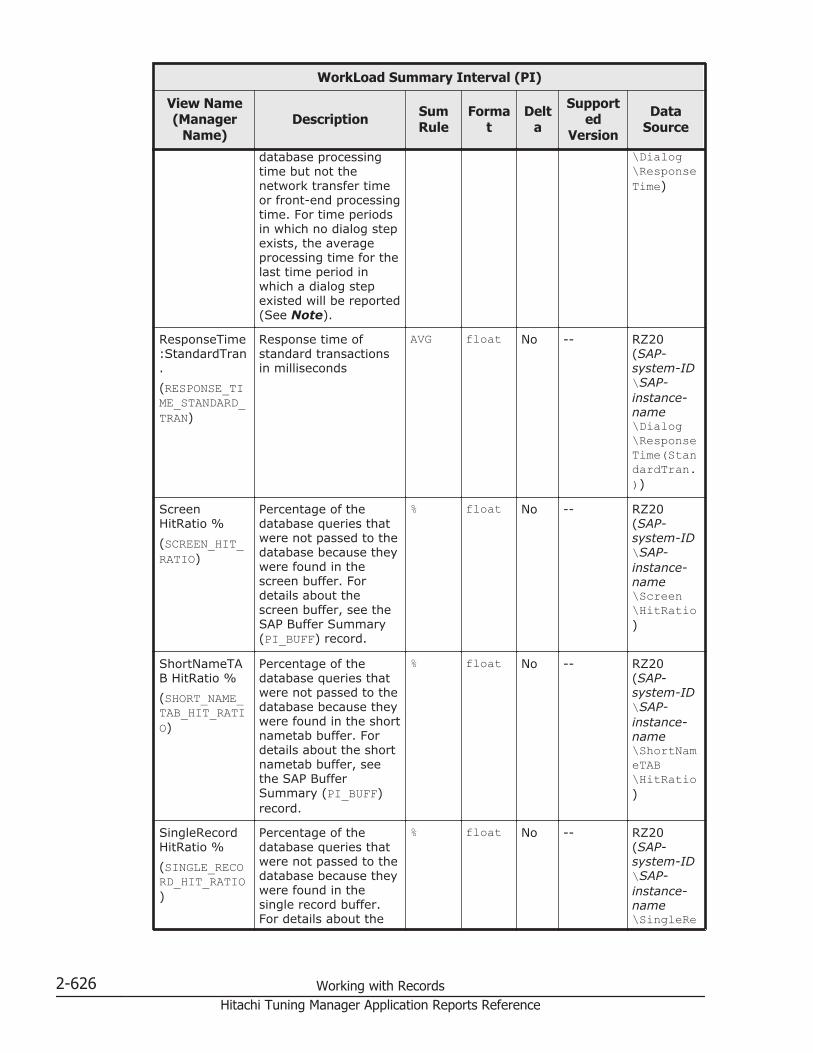
WorkLoad Summary Interval (PI)
View Name(Manager
Name)Description Sum
RuleForma
tDelt
a
Supported
Version
DataSource
database processingtime but not thenetwork transfer timeor front-end processingtime. For time periodsin which no dialog stepexists, the averageprocessing time for thelast time period inwhich a dialog stepexisted will be reported(See Note).
\Dialog\ResponseTime)
ResponseTime:StandardTran.(RESPONSE_TIME_STANDARD_TRAN)
Response time ofstandard transactionsin milliseconds
AVG float No -- RZ20(SAP-system-ID\SAP-instance-name\Dialog\ResponseTime(StandardTran.))
ScreenHitRatio %(SCREEN_HIT_RATIO)
Percentage of thedatabase queries thatwere not passed to thedatabase because theywere found in thescreen buffer. Fordetails about thescreen buffer, see theSAP Buffer Summary(PI_BUFF) record.
% float No -- RZ20(SAP-system-ID\SAP-instance-name\Screen\HitRatio)
ShortNameTAB HitRatio %(SHORT_NAME_TAB_HIT_RATIO)
Percentage of thedatabase queries thatwere not passed to thedatabase because theywere found in the shortnametab buffer. Fordetails about the shortnametab buffer, seethe SAP BufferSummary (PI_BUFF)record.
% float No -- RZ20(SAP-system-ID\SAP-instance-name\ShortNameTAB\HitRatio)
SingleRecordHitRatio %(SINGLE_RECORD_HIT_RATIO)
Percentage of thedatabase queries thatwere not passed to thedatabase because theywere found in thesingle record buffer.For details about the
% float No -- RZ20(SAP-system-ID\SAP-instance-name\SingleRe
2-626 Working with RecordsHitachi Tuning Manager Application Reports Reference
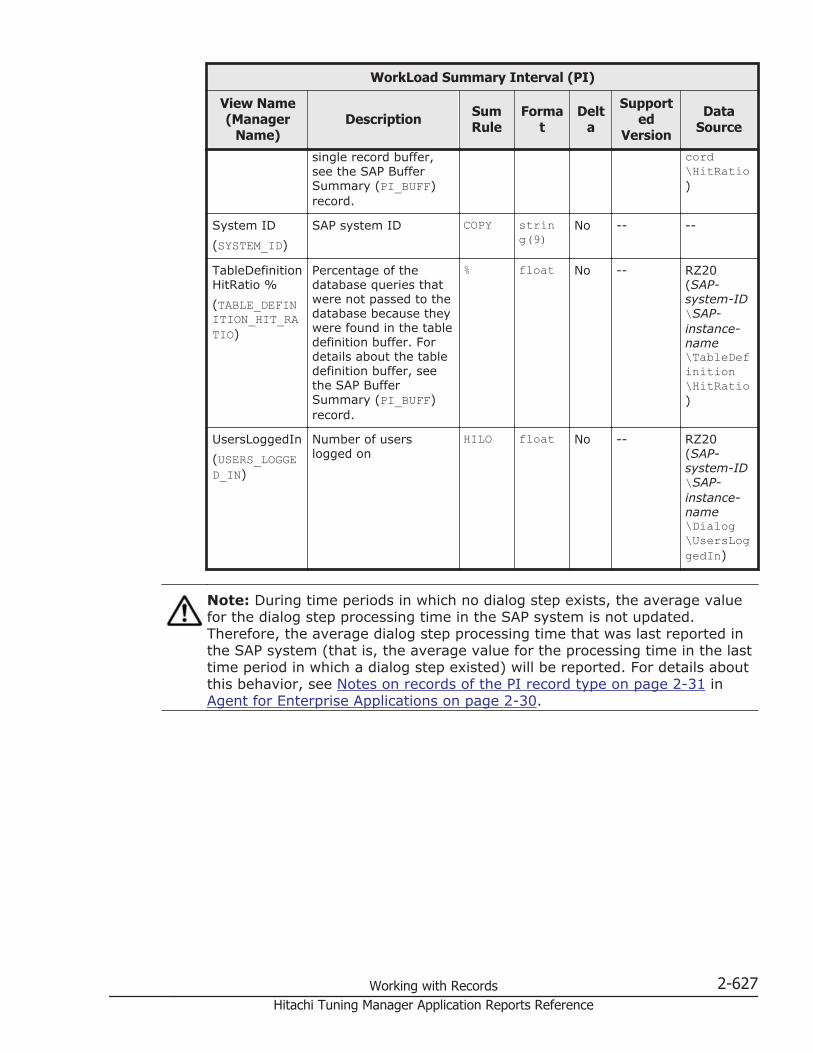
WorkLoad Summary Interval (PI)
View Name(Manager
Name)Description Sum
RuleForma
tDelt
a
Supported
Version
DataSource
single record buffer,see the SAP BufferSummary (PI_BUFF)record.
cord\HitRatio)
System ID(SYSTEM_ID)
SAP system ID COPY string(9)
No -- --
TableDefinitionHitRatio %(TABLE_DEFINITION_HIT_RATIO)
Percentage of thedatabase queries thatwere not passed to thedatabase because theywere found in the tabledefinition buffer. Fordetails about the tabledefinition buffer, seethe SAP BufferSummary (PI_BUFF)record.
% float No -- RZ20(SAP-system-ID\SAP-instance-name\TableDefinition\HitRatio)
UsersLoggedIn(USERS_LOGGED_IN)
Number of userslogged on
HILO float No -- RZ20(SAP-system-ID\SAP-instance-name\Dialog\UsersLoggedIn)
Note: During time periods in which no dialog step exists, the average valuefor the dialog step processing time in the SAP system is not updated.Therefore, the average dialog step processing time that was last reported inthe SAP system (that is, the average value for the processing time in the lasttime period in which a dialog step existed) will be reported. For details aboutthis behavior, see Notes on records of the PI record type on page 2-31 inAgent for Enterprise Applications on page 2-30.
Working with Records 2-627Hitachi Tuning Manager Application Reports Reference

2-628 Working with RecordsHitachi Tuning Manager Application Reports Reference
Acronyms and Abbreviations
This manual uses the following acronyms and abbreviations:
A
ABAPAdvanced Business Application Programming
ASCSABAP Sap Central Services
C
CCMSComputer Center Management System
CPUCentral Processing Unit
D
DAGDatabase Availability Group
DBMSDatabase Management System
DDLData Definition Language
# A B C D E F G H I J K L M N O P Q R S T U V W X Y Z
Acronyms-1Hitachi Tuning Manager Application Reports Reference

DMLData Manipulation Language
G
GCSGlobal Cache Service
H
HTMHitachi Tuning Manager
I
I/OInput/Output
IDIdentifier, Identification
M
MAPIMessaging Application Programming Interface
MTEMonitoring Tree Element
MTSMulti-Thread Server
N
NASNetwork Attached Storage
# A B C D E F G H I J K L M N O P Q R S T U V W X Y Z
Acronyms-2Hitachi Tuning Manager Application Reports Reference
O
OCIOracle Call Interface
OSOperating System
R
RMANRecovery Manager
RPCRemote Procedure Call
S
SANStorage Area Network
SGASystem Global Area
SNMPSimple Network Management Protocol
T
TCPTransmission Control Protocol
W
WWNWorld Wide Name
# A B C D E F G H I J K L M N O P Q R S T U V W X Y Z
Acronyms-3Hitachi Tuning Manager Application Reports Reference

# A B C D E F G H I J K L M N O P Q R S T U V W X Y Z
Acronyms-4Hitachi Tuning Manager Application Reports Reference

Hitachi Tuning Manager Application Reports Reference

Hitachi Data Systems
Corporate Headquarters2845 Lafayette StreetSanta Clara, California 95050-2639U.S.A.www.hds.com
Regional Contact Information
Americas+1 408 970 [email protected]
Europe, Middle East, and Africa+44 (0)1753 [email protected]
Asia Pacific+852 3189 [email protected]
MK-95HC113-18