Embed Size (px)
Citation preview
History of Welfare-to-Work Performance-based Contracts in NYC:
Lessons Learned
Swati Desai, Ph.D. Rockefeller Institute of Government, SUNY and Urban Institute
Lisa Garabedian, New York City Human Resources Administration
Karl Snyder, New York City Human Resources Administration
The paper was presented at the International APPAM conference, Moscow, Russia, June, 2011,
1
Introduction
This paper looks back over more than ten years of performance-based contracting in the Welfare to Work program of New York City’s Human Resources Administration/Department of Social Services. It documents the evolution of the program, the evolution of vendor-based contracting and looks at issues which were encountered resulting in modifications in program, contracting, and management. In the process of reviewing this history this paper details lessons learned from this experience of managing the program in partnership with the private sector, and specifically lessons learned in the effective use of contracts to achieve goals of welfare reform. The paper is the first description of the ten years of this contracting process begun at the beginning of Welfare Reform.
History of the Process in NYC
Contracting out social services to not-for-profit and faith-based organizations has been done since the turn of the 20th Century. But contracting out welfare (TANF) services, especially welfare-to-work services became an important practice after the enactment of the Personal Responsibility and Work Opportunities Act, (PRWOA), in 1996. A small number of states, Wisconsin, whose program was the best known among them, contracted out both case management and eligibility determination to the private sector. The majority of states kept the determination of eligibility in house and contracted out the employment-related services.12 New York State and, specifically, New York City was a part of this group. In talking of these contracts for employment-related services, they could be divided in three groups: Pure-pay-for performance, cost reimbursement and fixed price for services. NYC’s Human Resources contracts, the topic at the heart of this paper, fall in the first category.
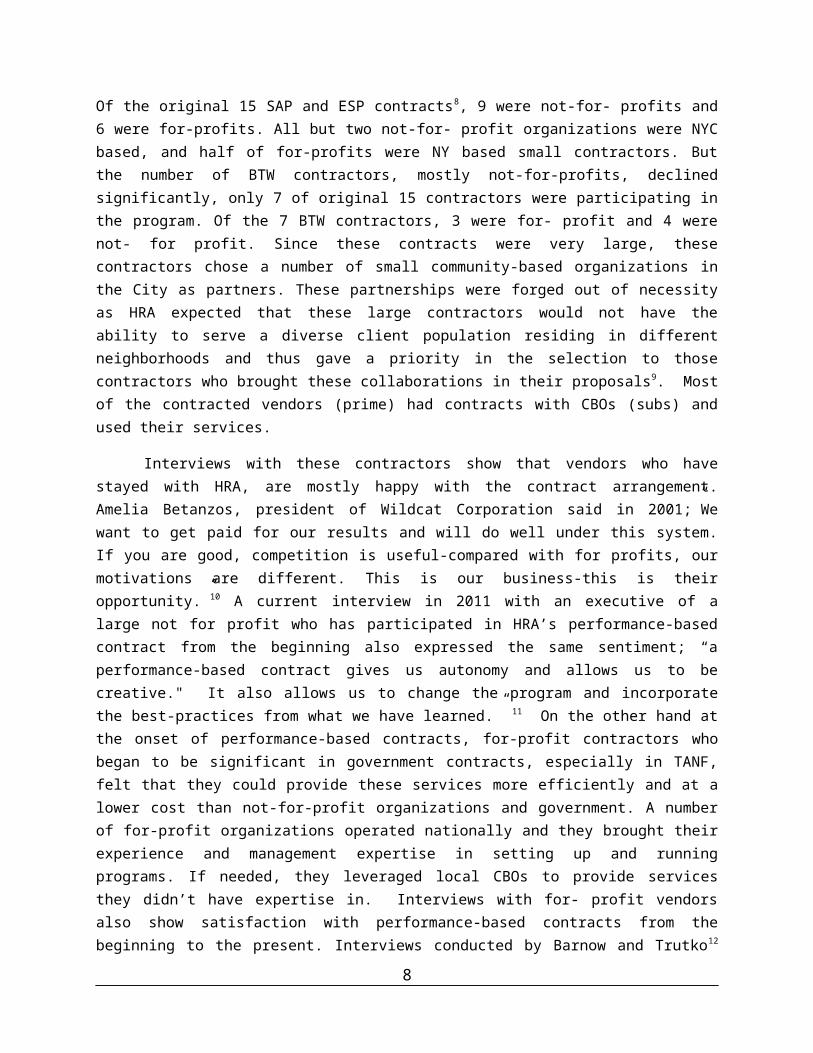
After the enactment of the TANF program, the emphasis of public assistance programs shifted from income maintenance to finding work for welfare recipients. Federal mandates for caseload engagement in work activities and job placement put a significant pressure on states and localities. This was especially true for New York City where 1.1 million of its 8 million the total population was on welfare. (Figure1). In NYC, Mayor Giuliani's campaign focused on the reduction in crime and a reduction in the welfare population. Jason Turner, who became Commissioner of the City’s Human Resources Administration in 1998, strongly believed that all welfare recipients should work or participate in activities that lead them to employment and ultimately self-sufficiency. So the concept of “full engagement” was introduced. “Full engagement” required that all who manage welfare cases should know what activity each welfare recipient is involved in and whether these activities were helping them to move towards employment and self-sufficiency. Prior to the passage of PRWOA, HRA, like many other states and localities did not have strong employment components in their programs. So contracting out enabled NYC to expand capacity and restructure service delivery system quickly with flexibility. Contracting out for services fitted with Commissioner Turner’s philosophy that private sector could provide services more efficiently. According to the first Deputy Commissioner Mark Hoover, “Government is best at setting outcomes, designing policy and overseeing and supervising performance. It is not great at operational activities and service delivery. There are simply too many processes and inefficiencies. Contracting out is better, cheaper and more flexible, allowing you to add and contract when needed.” 3 NYC contracted out employment activities in 1999.
Initial contracts were divided in two parts, employment services for applicants for welfare, Skill Assessment and Job Placement, (SAJP) and employment services for welfare recipients who were
2
considered “employable” or able to work, Employment Services and Placement (ESP). There were 5 SAJP contracts serving all applicants in all job centers and 12 ESP contractors. These contractors (also referred as vendors here) varied in size. They included large national for-profit companies and non-profit companies and small local for- profit and not-for-profit companies and local community colleges. A number of contractors also used local community-based organizations (CBO) as their subcontractors.
Figure 1: NYC Caseload, Employment Contracts and Other Important Events4
The contracts were performance-based and were awarded on a negotiated basis to each contractor. The unit price was negotiated between the contractor and HRA and did vary among contractors. The contracting method used is known as Negotiated acquisition. This method allowed the agency to negotiate combined milestone payments or the unit price with each contractors and it required less contract process time.
The average unit price for SAJP (interchangeably also used as SAP) contracts were $2,500. Payments were contingent upon meeting the performance milestones tied to participant’s assessment, engagement, job placement and retention in jobs. The unit price per contract for SAJP was distributed in the following milestones: Assessment - 10%, Engagement - 20%, Placement - 60%, 90 day Retention - 10% and a bonus milestone for a case closure due to earnings at 90 th day. (See the summary table for contract history in Appendix I.) SAJP services were aimed at quickly assessing individual needs and interest, providing job readiness skills and attempting to attach applicants to jobs as quickly as possible before the application for welfare was approved. Some SAJP vendors located a staff at a job center to enroll applicants and conduct intake. On an average, the client stayed with the SAJP vendor for 4-6 weeks. If the individual was placed in a job, the welfare case could get rejected or closed and the vendor was expected to track the individual and to help him/her retain the job.
3
0
200
400
600
800
1,000
1,200
1,400
95 96 97 98 99 00 01 02 03 04 05 06 07 08 09 10
NYC
Cas
h A
ssis
tanc
e R
ecip
ient
s (in
thou
sand
s) SAP and ESP Contracts BTW Contracts
Original Renewed
Passage of PRWORA TANF Reathorization
WeCARE Contracts
Special PopulationsContracts
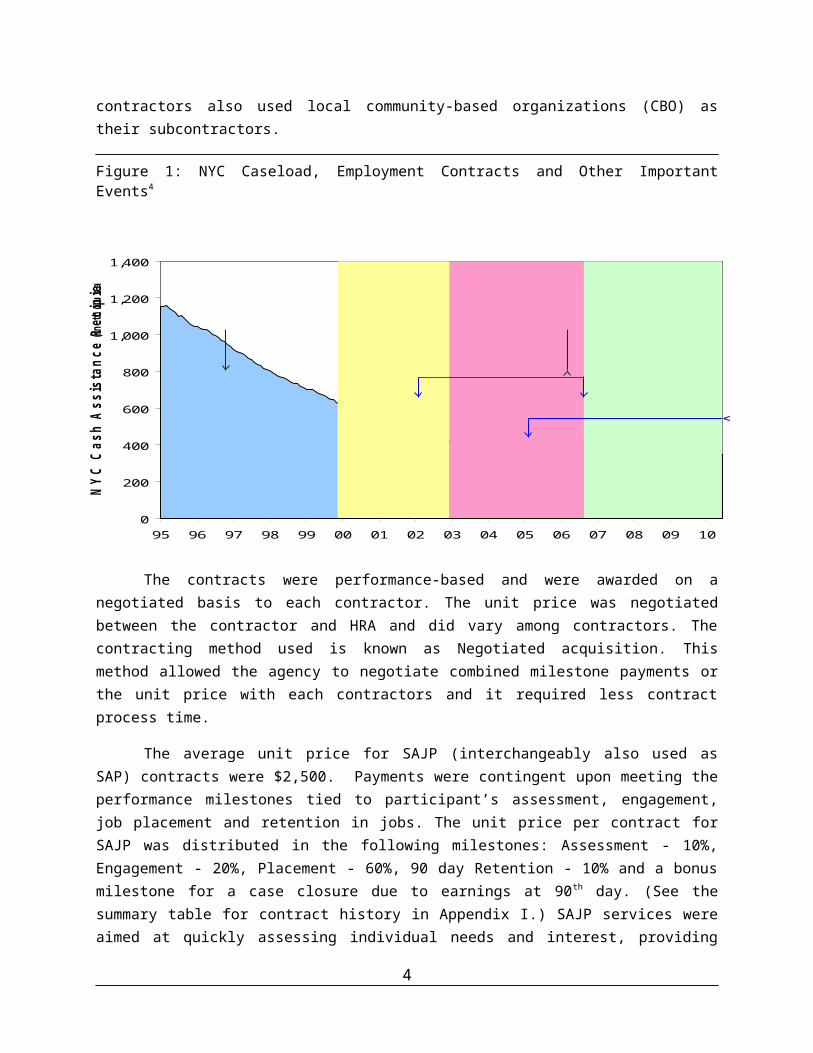
On the other hand average unit price for ESP contracts varied between $4,600 and $5,500 and the milestone payments once again were focused on the recipient’s job placement and retentions. The unit price was distributed as follows: Job Placement - 37%, 90 day retention - 36%, 180 day retention - 27% and bonus milestones for a job with high wage at 90 days and a case closure due to earnings at 180 days. Clients that did not get a job during the application phase and those who were already receiving assistance were randomly assigned to ESP to receive services for two days a week as a part of “full engagement Model”. Other three days a week the recipients were required to participate in the Work Experience Program (WEP). 5 In ESP contracts clients received more intensive mix of services compared to SAJP that included job search, job placement assistance, short-term training such as computer training and other trainings (home care aide, security guard, food service). After recipients were placed in jobs, in some contracts, the case managers checked with participants to see how they were adjusting to the work place and collect paychecks for retention milestones. Other contractors offered the bonus payments to those clients who brought paystubs. Employed participants in addition to transitional child care and Medicaid, also received bus/subway passes, training in financial literacy, and in some cases, ITA (Individual Training Account) vouchers to upgrade skill while working. Those who did not get a job in 6 months were reassigned to another vendor in the same borough.
At the inception of the contracts, annual value of SAP contracts was $29.9 mn. and of ESP $78.5 mn.
The contract design and milestones development went hand in hand. According to Commissioner Turner6, design rationale for these initial contracts was:
SAP allowed for a lower performance payment because the vendor had access to all new applicants, not just long term recipients who are presumably harder to place. We wanted to “cream” the easy to serve cheaply, leaving larger performance payments for ESP for those needing more help The result would be that overall costs to HRA would be lower and that the higher payments reserved for ESP would permit more intensive service, as opposed to a standard lower blended rate for both applicants and recipients.
SAP had access to referrals for a fixed period, four to six weeks, after which they were referred to an ESP. Therefore SAPs had every incentive to work with all referrals to the max.
Also as HRA wanted the applicants to get jobs quickly, the higher proportion of unit price was allocated to job placement in both SAJP and ESP.
In 2002, these contracts were renewed with some modifications, especially the distribution between placement and retention milestones were changed. In SAP, the payment rate of placement milestone was decreased from 60% to 35% and the 90 day retention milestone was increased from 10% to 35%. Similarly in ESP, the rate of placement milestone decreased from 37% to 23%. But the 90 day retention rate was increased from 36% to 50%. The 180 day milestone percentages remained the same. Even though the budgeted value of renewed SAP contract went up, the value of renewed ESP contract declined. The overall value of renewed contracts declined from $108.4 mn. to $87.7 mn. due to the significant decline in the welfare caseload.
The focus on full engagement, emphasize on placement and successful implementation of employment contracts led to a big decline in the caseload (figure 1). At that time automated client tracking and accountability system (NYCWY), monitoring system (VendorStat) and automated payment and claiming system (PACS) were developed to manage the contracts efficiently That also allowed the
4
Agency to focus on those with mental and physical barriers and the Agency developed WeCARE (Wellness, Comprehensive Assessment, Rehabilitation and Employment) program. The WeCARE contracts combined medical and employments services were a mix of output and outcome milestone payments, not a pure performance-based contract. The ultimate goal of this contract was to obtain SSDI/SSI for disabled clients and to stabilize others enough to get them employment.
The 2nd generation of employment contracts which replaced ESP and SAP became operational in 2006 and were renewed in 2009. These contracts called Back to Work or BTW were almost 100% performance-based with some significant changes from the previous contracts. Under the BTW contracts, the same employment contractor was responsible for both applicants and recipients for a designated welfare office allowing each client to receive a continuous set of services. In addition, in these contracts the milestone distribution changed. In the previous contracts (SAP and ESP) the payment milestone for job placement was paid as long as recipients had a paystub even if it was only for a day’s work, In the BTW contracts, more emphasize was given to job retention and vendors were paid only if clients kept a job for 30 days. Also the placement milestone for both applicants and recipients increased from 23% in ESP to 35% in BTW. The 90 day retention payment milestone decreased to 29%, the 180 day retention milestone remained at 25% about the same as it was in ESP. In addition, there were two process milestones, one, that was the same as in the original contracts, Assessment - 5% and a new one, Job Retention and Career plan, -5%. In addition, the contracts included additional bonus milestones; a) job placement for sanctioned, 2) job placement for time-limited participants, 3) wage gain at 180 days and 4) case closure at 90 days. These payment points were a small fixed dollar amount. The unit price payment in BTW contract was an average of SAP and ESP unit prices. The total value of the contract declined from $97 mn, in ESP and SAP to $53 mn. in BTW. And the contracting method changed from the Negotiated Acquisition to the standard contracting model, Request for Proposal - RFP.
Vendors and their Perceptions
A performance-based contract requires a nimble organization that can operate within the constraints of performance payments, an organization that can survive with back end payments 7 and can handle a large flow of clients. Since, some CBOs might not be able to operate under either of these conditions; they might have difficult time succeeding under the conditions of the performance-based contracts. This became clear during the renewal of SAP and ESP contracts, one of the ESP contract could not perform under this conditions and withdrew. Of the original 15 SAP and ESP contracts 8, 9 were not-for- profits and 6 were for-profits. All but two not-for- profit organizations were NYC based, and half of for-profits were NY based small contractors. But the number of BTW contractors, mostly not-for-profits, declined significantly, only 7 of original 15 contractors were participating in the program. Of the 7 BTW contractors, 3 were for- profit and 4 were not- for profit. Since these contracts were very large, these contractors chose a number of small community-based organizations in the City as partners. These partnerships were forged out of necessity as HRA expected that these large contractors would not have the ability to serve a diverse client population residing in different neighborhoods and thus gave a priority in the selection to those contractors who brought these collaborations in their proposals9. Most of the contracted vendors (prime) had contracts with CBOs (subs) and used their services.
Interviews with these contractors show that vendors who have stayed with HRA, are mostly happy with the contract arrangement. Amelia Betanzos, president of Wildcat Corporation said in 2001;”We want to get paid for our results and will do well under this system. If you are good, competition
5
is useful-compared with for profits, our motivations are different. This is our business-this is their opportunity.”10 A current interview in 2011 with an executive of a large not for profit who has participated in HRA’s performance-based contract from the beginning also expressed the same sentiment; “a performance-based contract gives us autonomy and allows us to be creative." It also allows us to change the program and incorporate the best-practices from what we have learned.” 11 On the other hand at the onset of performance-based contracts, for-profit contractors who began to be significant in government contracts, especially in TANF, felt that they could provide these services more efficiently and at a lower cost than not-for-profit organizations and government. A number of for-profit organizations operated nationally and they brought their experience and management expertise in setting up and running programs. If needed, they leveraged local CBOs to provide services they didn’t have expertise in. Interviews with for- profit vendors also show satisfaction with performance-based contracts from the beginning to the present. Interviews conducted by Barnow and Trutko12 in 2003 show that all contractors particularly, for-profit contractors were enthusiastic about performance-based contracts. “With performance-based contract you get paid for results, not process.” Recent interviews with two for profit organizations show 13that they continue to be satisfied with performance-based contracts. According to one vendor, “performance-based contracts create a level playing field. “ They feel that those contractors, who can deliver services with innovative strategies as client-base changes, will be competitive and stay in the business. But another small for-profit contractor felt that the burden of paperwork in the Back to Work contracts has increased, especially after TANF reauthorization when states and localities were required to track attendance. According to this vendor, the contract should be hybrid, a line item for extra paperwork and a performance payment for outcomes such as placement and retention.
What milestones were achieved?
1) Both reported (direct) and unreported (indirect) job placements increased.
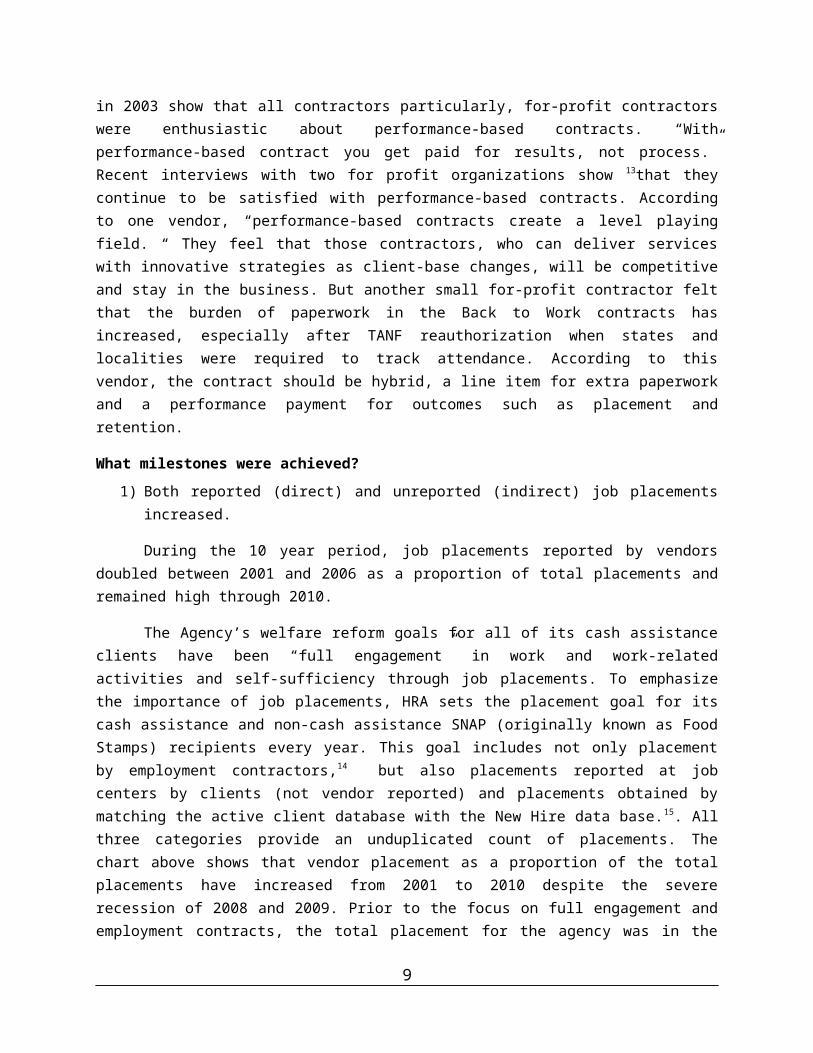
During the 10 year period, job placements reported by vendors doubled between 2001 and 2006 as a proportion of total placements and remained high through 2010.
The Agency’s welfare reform goals for all of its cash assistance clients have been “full engagement” in work and work-related activities and self-sufficiency through job placements. To emphasize the importance of job placements, HRA sets the placement goal for its cash assistance and non-cash assistance SNAP (originally known as Food Stamps) recipients every year. This goal includes not only placement by employment contractors,14 but also placements reported at job centers by clients (not vendor reported) and placements obtained by matching the active client database with the New Hire data base.15. All three categories provide an unduplicated count of placements. The chart above shows that vendor placement as a proportion of the total placements have increased from 2001 to 2010 despite the severe recession of 2008 and 2009. Prior to the focus on full engagement and employment contracts, the total placement for the agency was in the range of 40,000-60,000. Since 1999, the total placements have continued to increase reaching over 100,000 between 1999 and 2003, Even during the 2008-2010 recession, placements have remained between 75,000 and 85,000. This table highlights the adage, “what you measure, will happen.”As the focus on employment increased with performance-based contracts, agency-wide job placements also increased.
Figure-2
6
Job Placements
Year Goal
Self Reported Placements
Employer Reported
NPA-FS Reported
Total Qualified Placements
BTW Qualified Placement
WECARE Qualified Placement
SAP Qualified Placement
ESP Qualified Placement
All Vendor Placements
% Vendor Placements of Total
2010 75,000 56,030 19,403 75,433 8,577 1,697 10,274 14%2009 75,000 55,837 19,561 75,398 7,828 1,753 9,581 13%2008 75,000 56,504 24,055 80,559 8,319 1,709 10,028 12%2007 80,000 53,011 24,557 77,568 7,590 1,365 8,955 12%2006 85,000 55,563 21,919 77,482 6,596 6,344 12,940 17%2005 90,000 67,088 17,641 84,729 5,893 4,210 10,103 12%2004 90,000 69,850 16,302 86,152 7,907 6,706 14,613 17%2003 120,000 57,400 13,010 70,410 7,727 2,390 10,117 14%2002 160,000 64,715 36,496 14,089 115,300 6,553 4,945 11,498 10%2001 150,000 68,012 46,408 21,159 135,579 6,125 5,000 11,125 8%
0%2%4%6%8%10%12%14%16%18%
2010200920082007200620052004200320022001
As the focus on vendor participation and full engagement increased, more people found a job on their own without seeking an employment vendors’ help. Had there been no focus on full engagement and mandated vendor participation, fewer employable clients would have searched for jobs on their own as shown by placements prior to 1998. This is an indirect benefit of the performance-based employment contracts. Those who were imminently employable were able to find a job and leave welfare. But often without the “stick” of participation in vendor activities and the Work Experience Program, these clients would not have had the incentive to seek self-sufficiency. Also a number of researchers 16 argue that contractors, in order to make money, quickly “cream” those who are easy to place. This data suggest that the “cream” of the client base found jobs on their own leaving the vendor with the group that probably needed the benefits of the vendor’s help and guidance.
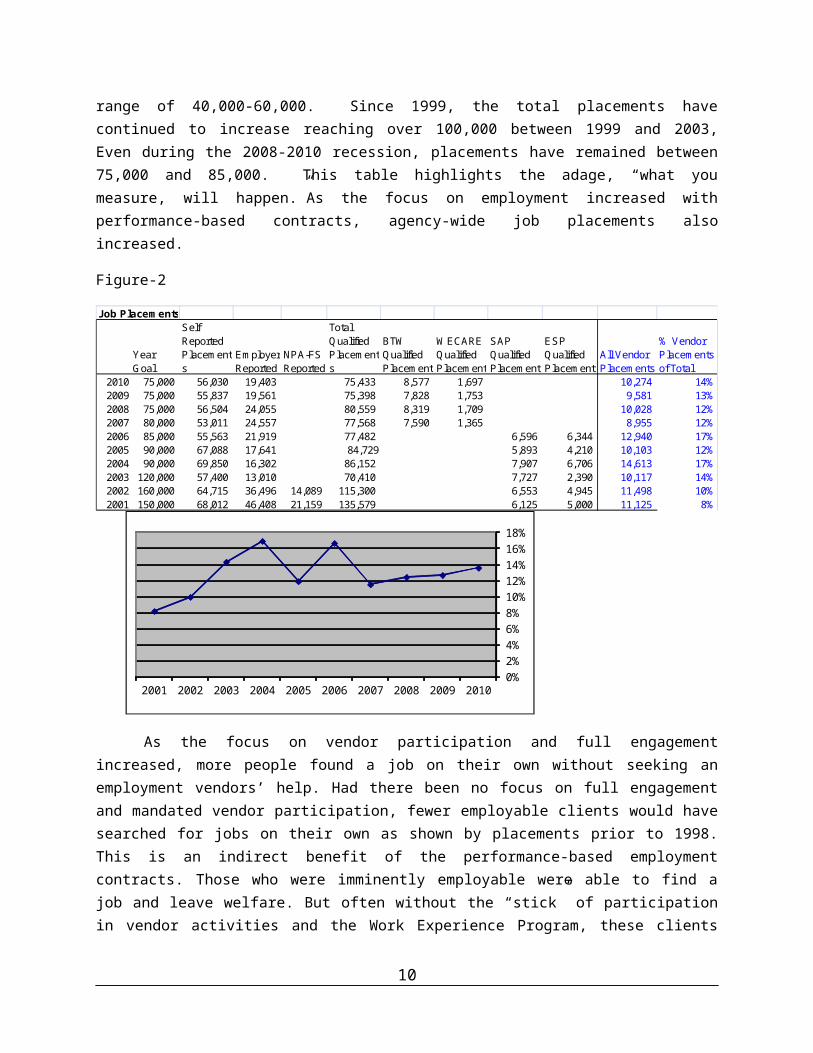
2) Both 90 day and 180 day retention went up and remained stable.
The focus on retention resulted in a significant increase in retention milestones. The Percentage of the 90 day retention more than doubled and the 180 day retention increased more than five times. This shows the impact of performance milestones. Vendors improved their performance by implementing different retention strategies from giving clients transportation vouchers, to providing an access to business clothing, to giving them a financial bonus for staying in a job.
Figure 3
7
20%
34%40%
44%47% 47% 45%
49%45%
52%54%
0%
10%
20%
30%
40%
50%
60%
2000 2001 2002 2003 2004 2005 2006 2007 2008 2009 2010
90 day Rate
7%
17%
25%
31%
37% 38%
32%35%
33%
40%
0%
5%
10%
15%
20%
25%
30%
35%
40%
45%
2000 2001 2002 2003 2004 2005 2006 2007 2008 2009
180 day rate
What Lessons were learned?
The next section focuses on lessons learned by HRA and how they could be applied to public agencies regarding the structure and management of performance-based contracts: The lessons are categorized in 4 groups: 1) Milestones, 2) Management information system, 3) World of service providers, and 4) Learn from your experience.
Milestones:
1) Using a contract renewal to shift performance milestones
One needs to be aware that if contracts give more weights to a specific milestone that is what vendor will focus on. Other milestones will get less attention from the vendor. The payment structure of the performance milestones under the SAP and ESP contracts embodied the philosophy of welfare reform and reflected Commissioner Turner and his team’s philosophy of Job First. Thus, the milestone structure for both SAP’s and ESP’s initial contracts placed the majority of the financial emphasis on achieving placements and a somewhat lower emphasize on retention. The SAP retention milestone for 90 days was 10% (a mere $250) assuming that applicants served by SAP had recent labor marker attachment and thus were easy to serve, not requiring a large investment of resources by the contractor. The ESP retention milestones for both 90 days and 180 days were higher than SAP but lower than the ESP placement milestones. The charts in the result section show that the 90 day retention rate (combined SAP and ESP) was 20%, but the 180 day retention rate was only 7%. This suggests that due to higher payments on immediate placements, vendors focused more on immediate placement not focusing on retention. These results made the Agency concerned. Their worry was that, in the long run, these clients might end up back on assistance defeating all the efforts to create financial self-reliance.
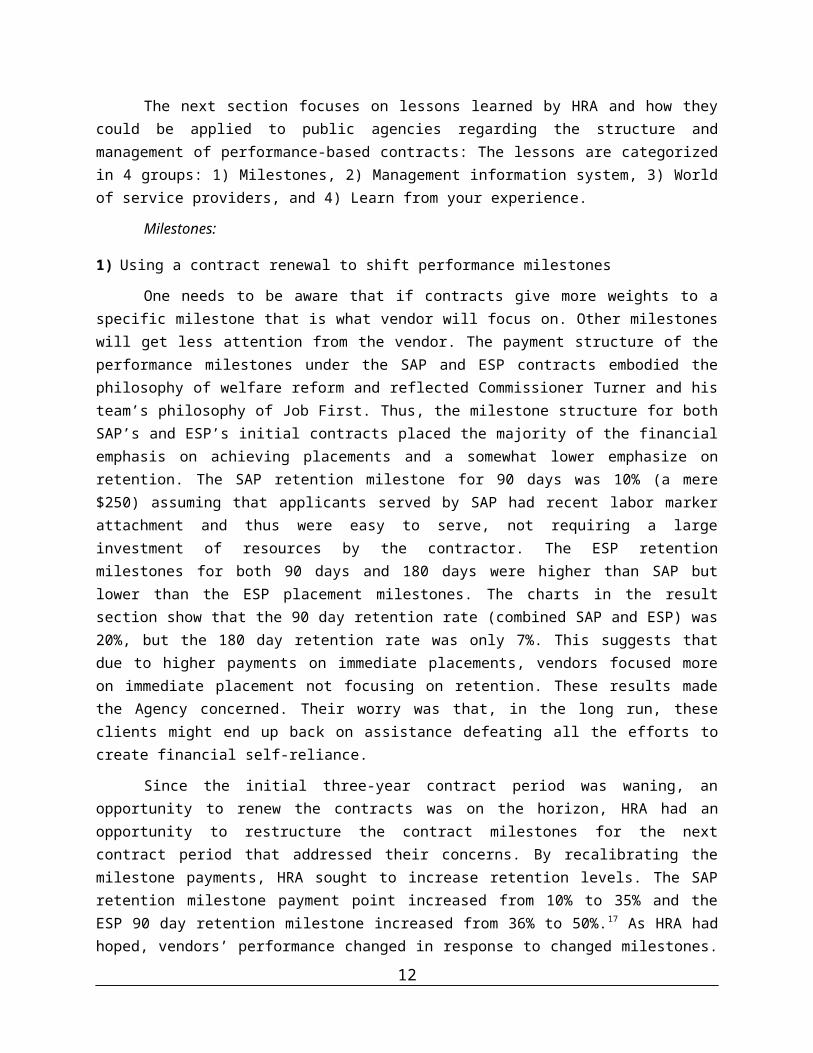
Since the initial three-year contract period was waning, an opportunity to renew the contracts was on the horizon, HRA had an opportunity to restructure the contract milestones for the next contract period that addressed their concerns. By recalibrating the milestone payments, HRA sought to increase retention levels. The SAP retention milestone payment point increased from 10% to 35% and the ESP 90 day retention milestone increased from 36% to 50%.17 As HRA had hoped, vendors’ performance changed in
8
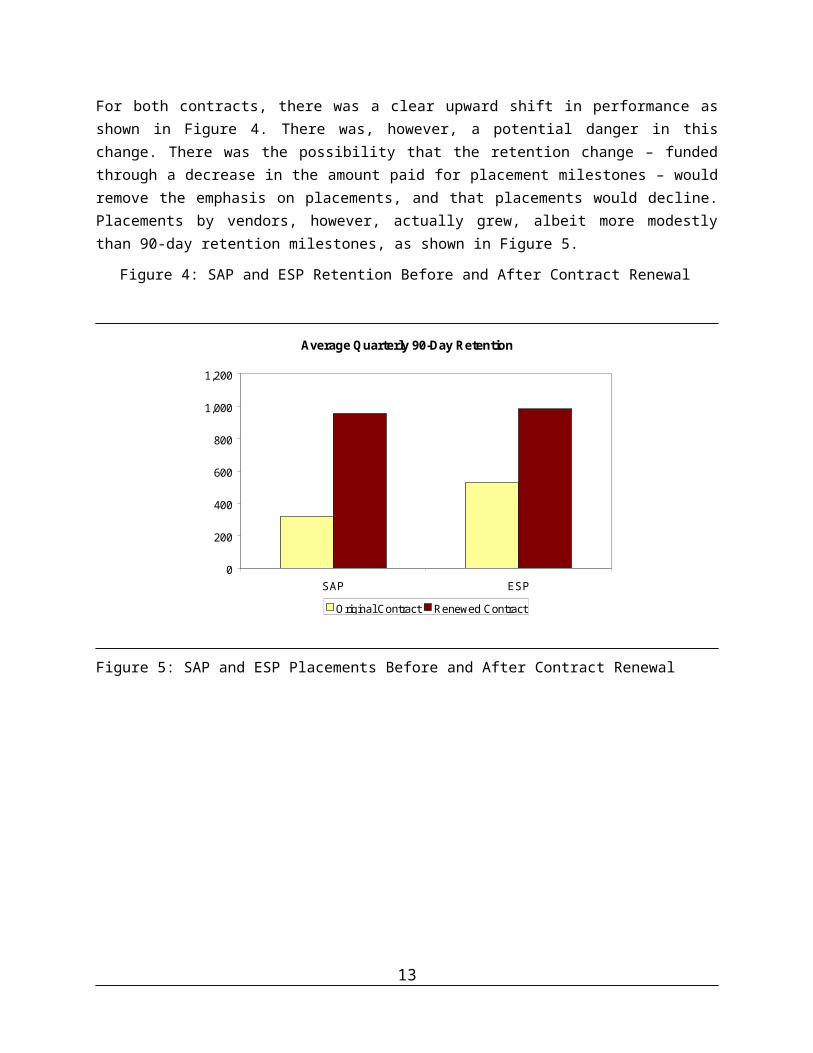
response to changed milestones. For both contracts, there was a clear upward shift in performance as shown in Figure 4. There was, however, a potential danger in this change. There was the possibility that the retention change – funded through a decrease in the amount paid for placement milestones – would remove the emphasis on placements, and that placements would decline. Placements by vendors, however, actually grew, albeit more modestly than 90-day retention milestones, as shown in Figure 5.
Figure 4: SAP and ESP Retention Before and After Contract Renewal
Average Quarterly 90-Day Retention
0
200
400
600
800
1,000
1,200
SAP ESP
Original Contract Renewed Contract
198% Increase 85% Increase
Figure 5: SAP and ESP Placements Before and After Contract Renewal
Average Quarterly Placements
0
200
400
600
800
1,000
1,200
1,400
1,600
1,800
2,000
SAP ESP
Original Contract Renewed Contract
80% Increase
30% Increase
2) Incentive Bonuses may not work
9
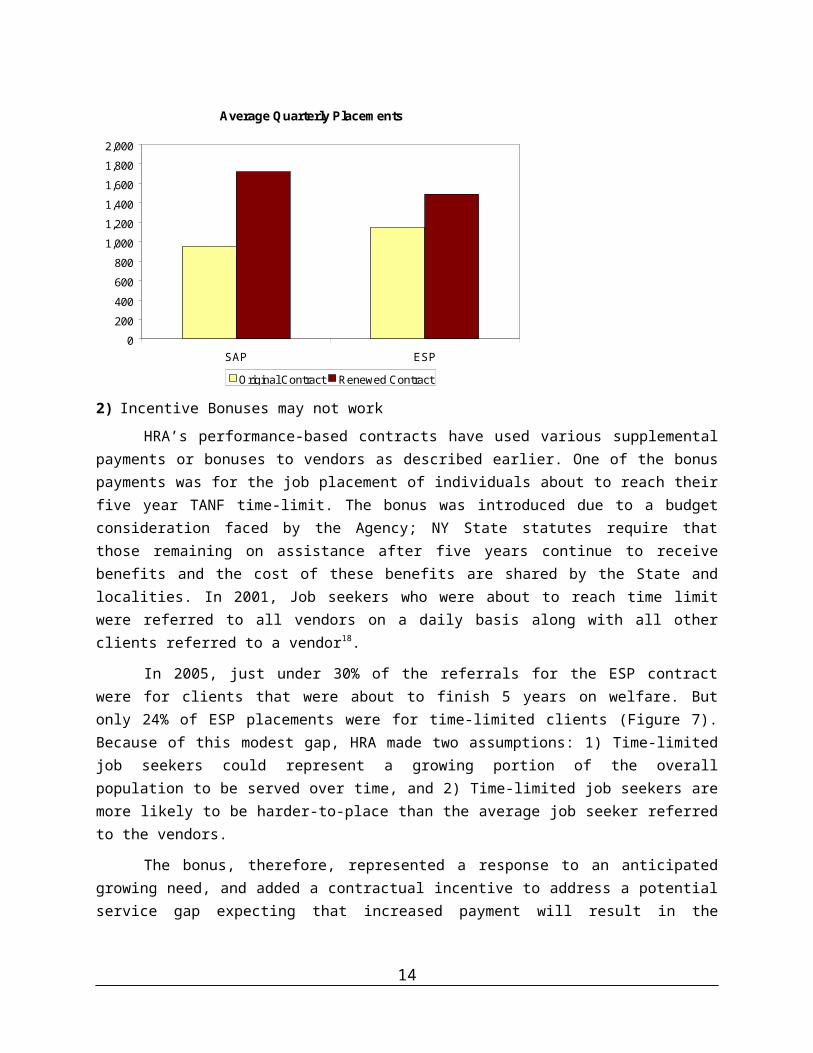
HRA’s performance-based contracts have used various supplemental payments or bonuses to vendors as described earlier. One of the bonus payments was for the job placement of individuals about to reach their five year TANF time-limit. The bonus was introduced due to a budget consideration faced by the Agency; NY State statutes require that those remaining on assistance after five years continue to receive benefits and the cost of these benefits are shared by the State and localities. In 2001, Job seekers who were about to reach time limit were referred to all vendors on a daily basis along with all other clients referred to a vendor18.
In 2005, just under 30% of the referrals for the ESP contract were for clients that were about to finish 5 years on welfare. But only 24% of ESP placements were for time-limited clients (Figure 7). Because of this modest gap, HRA made two assumptions: 1) Time-limited job seekers could represent a growing portion of the overall population to be served over time, and 2) Time-limited job seekers are more likely to be harder-to-place than the average job seeker referred to the vendors.
The bonus, therefore, represented a response to an anticipated growing need, and added a contractual incentive to address a potential service gap expecting that increased payment will result in the placement of clients about to reach 5 year time limit. .
But as shown below in figure 6, there was no evidence of an upward change in performance with the implementation of the bonus. Over time, placements were dropping for this group of job seekers. This prompts the question, why was this not successful? Several possible answers may lie in the design of the milestone. The one that seems most plausible is as follows: it is important to consider whether the incentive is properly matched to the additional amount of work required. On average, BTW vendors are contracted for a placement payment rate of $1,030 per placement. The placement bonus, at an average of $330, represents an increase of around 30% on top of this placement amount. The average time-limited job seeker, however, may take more effort and may cost more than the $330 bonus payment. From an economic standpoint, it may not make sense for a vendor to invest additional resources if the time-limited clients are more resource intensive.
Figure 619 Referrals and Placements for Time limited Job Seekers
0
200
400
600
800
1,000
1,200
1,400
1,600
2007 2008 2009 2010
Num
ber o
f Tim
e Li
mite
d R
efer
rals
0
10
20
30
40
50
60
70
80
90
Num
ber o
f Tim
e Li
mite
d Pl
acem
ents
Number of Time Limited Referrals Number of Time Limited Placements
3) Beware of hidden assumptions
10
Financial modeling performed by the agency prior to contracting made certain assumptions about contractors’ and job seekers’ behavior in determining milestone payments. Similarly, contractor’s own financial models were based on their service delivery models and on the expected number of referrals. Contractors can have difficulty meeting their financial projections if referrals go down (due to a decline in the caseload). But if referrals increase (due to an increase in the caseload, dropping out of fellow contractors, change in the referral policy etc.), vendors will need to expand their capacity to accommodate the increased volume. And yet enlarged volume may or may not increase the placement. And even if placements increase, the proportion of placements to referral may not increase jeopardizing the contractors’ cash flow and perhaps their ability to continue with their contracts. Thus, assumptions used by both the contracting agency and contractors are based on the scenario at the time of contracting, but overtime the situation can change and vendors need to be prepared.
The data for the BTW contracts in Figure 7 indicate that referrals continued to increase, but placements did not keep pace with the referrals to the program. This could be due to many different factors. In 2008, the economy was deteriorating leading to an increase in applicants and increased referrals. At the same time, vendors might not be ready to serve applicants who might be more employable with more education and more years of labor market experience and might expect higher paying jobs than regular cash assistance recipients who are less educated with less work experience. Thus, a change in the economy and changing characteristics of the client body could have resulted in decreased placement. Retooling the program in a short period of time is difficult, especially in human services.
This section shows that milestones hold the power to drive performance. There is a delicate balance in designing the right payment points which provide the correct incentives to achieve desired performance.
Figure 720: Back-To-Work Contract Referrals and Vendor Placements
11
0
2,000
4,000
6,000
8,000
10,000
12,000
14,000
16,000
18,000
2007 2008 2009 2010
Mon
thly
Ref
erra
ls
0
100
200
300
400
500
600
700
800
900
1,000
Mon
thly
Pai
d Pl
acem
ents
Referrals Paid Placements
Management Information System:
For the performance-based contracts to be successful, a close monitoring is essential with the use of management information system and smart monitoring tools
1) NYCWAY
As the SAP and ESP contracts were unfolding, HRA realized that to manage the contracts, information flow between the Agency and contractors should be seamless. In order to track clients’ activities and to achieve “full engagement”, in 1996 and 1997 NYC implemented a new employment subsystem: New York City Work, Accountability and You, (NYCWAY). This system was enhanced and connected with the NYS’s Eligibility system, (WMS) to be able to refer both applicants and recipients to employment contractors. This was a UNIX –based, somewhat primitive and not a case management system. But the system allowed the workers and managers in the Agency to track clients’ progress with the contractor. This system allowed both HRA and contractors to be on the same page; how many clients were referred in a given time, how many showed up, how many stayed with the vendor and for how long, and how many got jobs. This system was also connected to the payment system described below. Without the management information system utilized by both parties, according to Barnow and Trutko, “HRA would have very difficult-if not impossible- time in implementing performance-based contracts.”21
2) Payment and Claiming System (PACS)
In 1998, performance-based contracts were new phenomena in NYC and most contracting agencies needed capital to start the program. So HRA advanced some funds upfront to start the program under the agreement that money will be recouped once the milestones were achieved. But performance-based contracts are only successful if cash flow to the contractors for their milestone achievement is smooth and quick. To make this process more efficient, HRA developed a new computerized Payment and Claiming System (PACS).This system was linked to NYCWAY synchronizing milestones and verification information and with quick approval and payments. The whole process was automated and hardly required any human intervention and payments are made quickly creating a steady cash flow to vendors as they achieved milestones. The same system was used to claim funding from different sources reducing a labor intensive claiming process.
3) VendorStat
Along with other automated systems, HRA created a new monitoring system, VendorStat, in 2000 using timely data reporting of vendors’ performances that helped HRA to monitor the efficiency of vendors’ processes. VendorStat consisted of two components: 1) monthly reports that compared milestones and other indicators for each vendor site, vendors as a whole, and other vendors for a current period and over time; (Appendix II) 2) weekly meeting held between HRA’ senior executives and the staff and vendor executives and their staff during which performance data and individual cases were reviewed. The report also ranked sites and vendors by their performance creating an implicit competition among vendors The meetings gave vendors an opportunity to raise operational or systems issues that affect their performance to HRA’s upper-level executives. Vendors found that issues were resolved more quickly due to face-to-face interaction. According to one of the senior executive of one of the contractors, “We find it to be a good management tool for us. It allows for full transparency of the information. At the end of year/contract there are “no surprises.”22 At the same time agency executives were able to
12
distinguish between the performance of weak vendors and strong vendors and made a low performing vendor aware of declining cash flow due to low outcome and required them to take corrective actions in a timely manner.
According to Seth Diamond then Executive Deputy Commissioner in charge of employment services, “VendorStat is a statement of agency priorities. The items contained on the tool should be the most important to the agency and should tell the contractors in which areas should be their heaviest focus.”
Uses of VendorStat over time made vendors more efficient in delivering services and made them change their service delivery models based on the changing need of the client population. VendorStat reminded vendor executives of the focus of HRA and thus made them pay attention to details and improve their practices over time. HRA has been committed to managing with data and VendorStat is a prime example of it.
The world of service providers:
The performance-based contracting model assumes that financial calculus drives the contractor’s organizational decisions, but everyday reality in the human services sphere is more complex than that calculus.
There is no denying that HRA’s performance-based employment contracts represent a massive scale of social service contracting at a local level. To date, around three-quarters of a million referrals have been made to the system. The annualized value of these contracts is well over $50 million. With the second generation of contracts, the number of contractors consolidated from 15 contractors during the SAP/ESP contracts to seven under the BTW23. As mentioned earlier, there was a great diversity among these vendors, not only in size and the type of organizations but also in their unique approaches to the service delivery, institutional resources, and strengths. Some of them focused on the immediate job placement and others encouraged short term job training before job placement. Some focused on the self-directed quick placement approach while others used the case management approach24.
From the point of view of HRA, the performance-based contract allowed vendors discretion in how they deliver services within some guidelines. The service delivery models were the product of each vendor’s unique viewpoint and how their employment service fit into the larger mission of their agencies. HRA felt that diversity among the vendors was important to serve different type of clients. Different approaches taken by vendors showed the agency which approaches worked for different types of clients and thus helped in the continuous improvement of the contracting process.
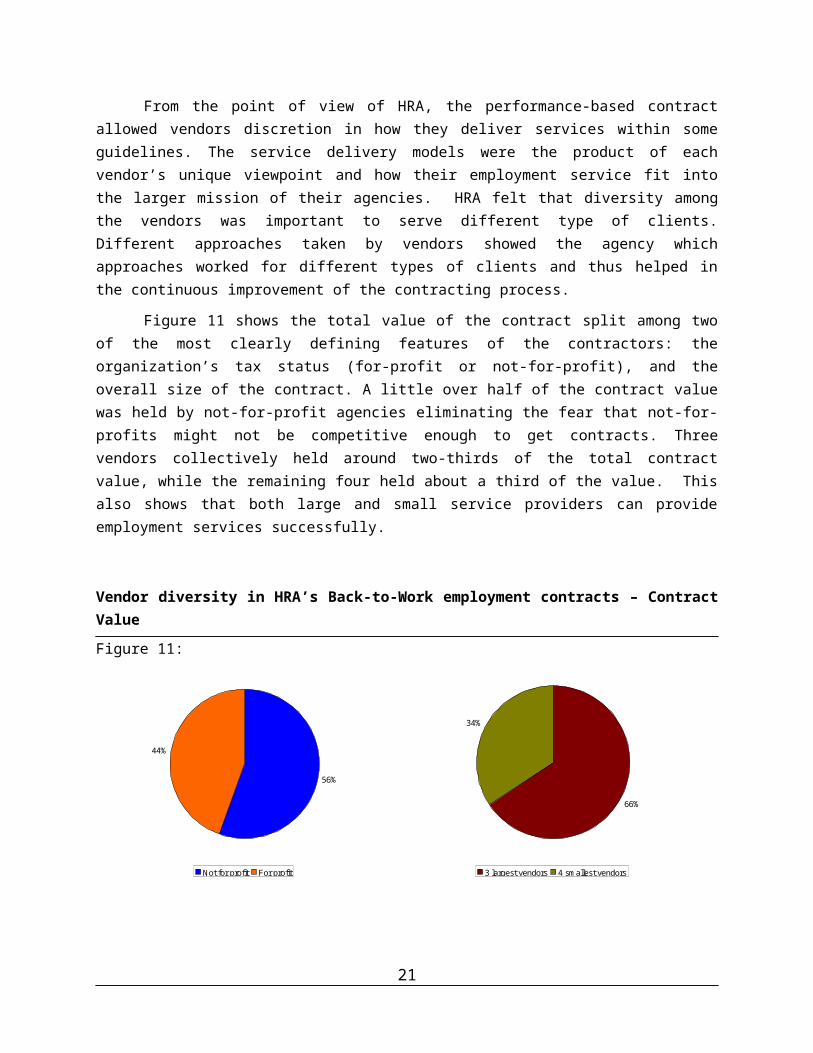
Figure 11 shows the total value of the contract split among two of the most clearly defining features of the contractors: the organization’s tax status (for-profit or not-for-profit), and the overall size of the contract. A little over half of the contract value was held by not-for-profit agencies eliminating the fear that not-for-profits might not be competitive enough to get contracts. Three vendors collectively held around two-thirds of the total contract value, while the remaining four held about a third of the value. This also shows that both large and small service providers can provide employment services successfully.
13
Vendor diversity in HRA’s Back-to-Work employment contracts – Contract Value
Figure 11:
56%
44%
Not for profit For profit
66%
34%
3 largest vendors 4 smallest vendors
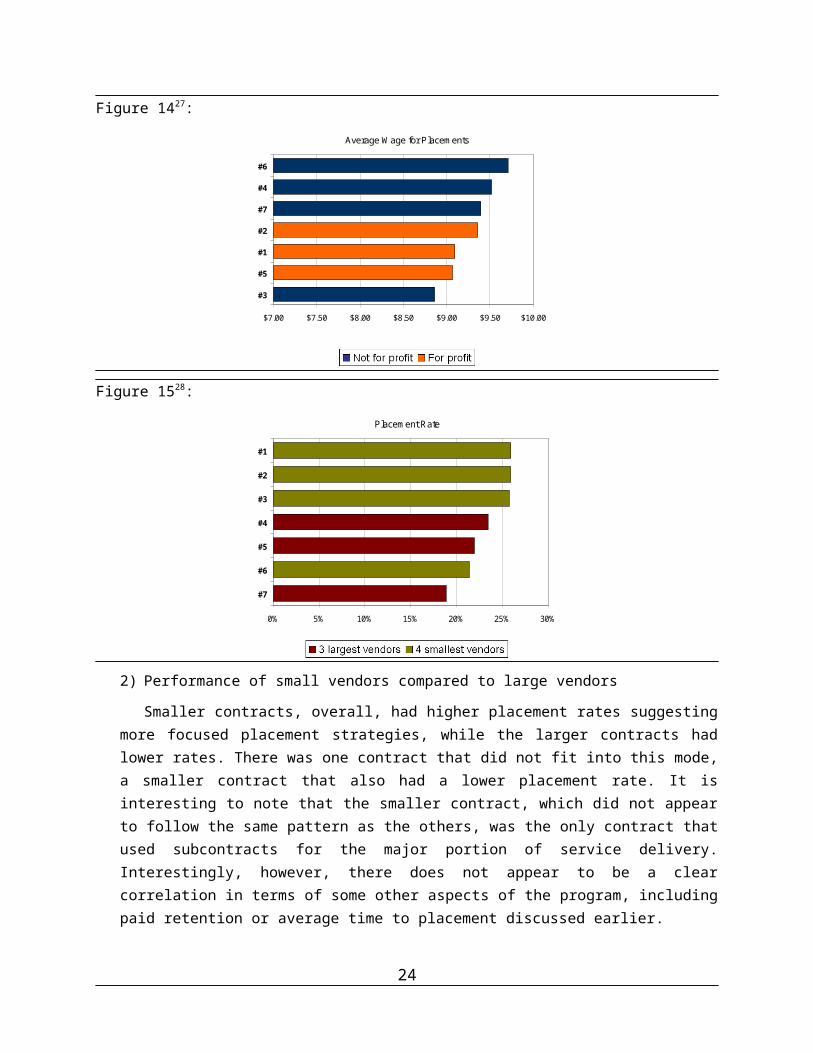
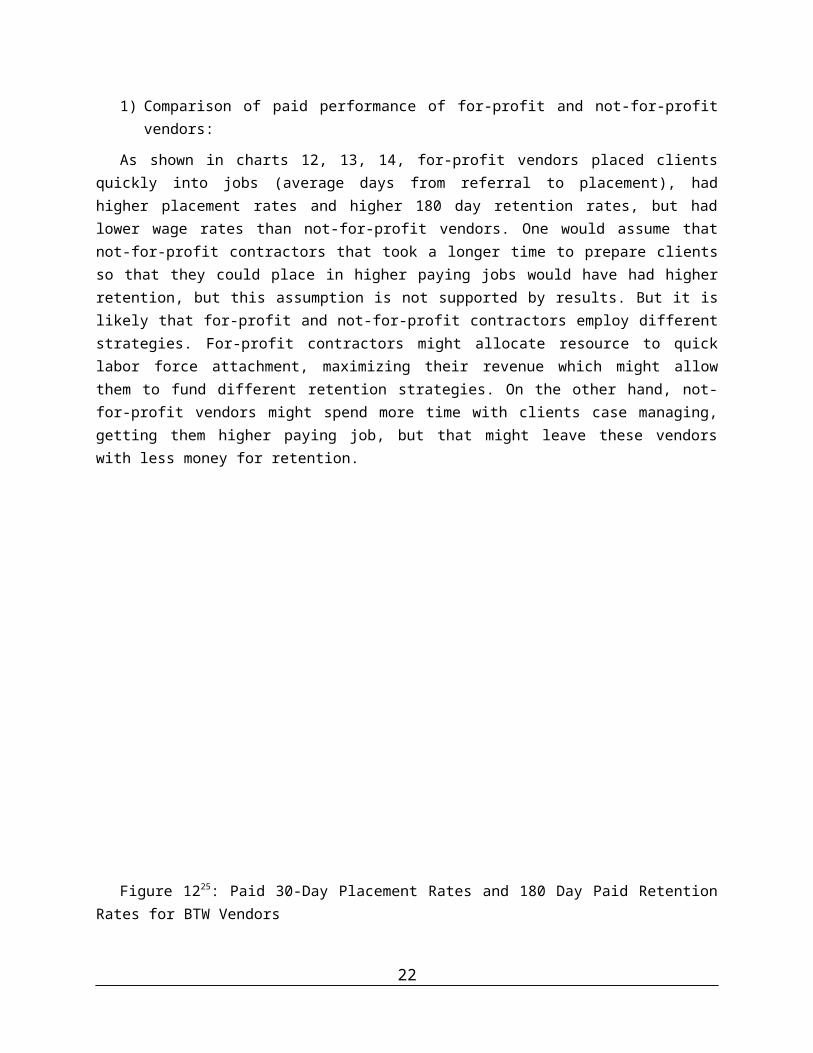
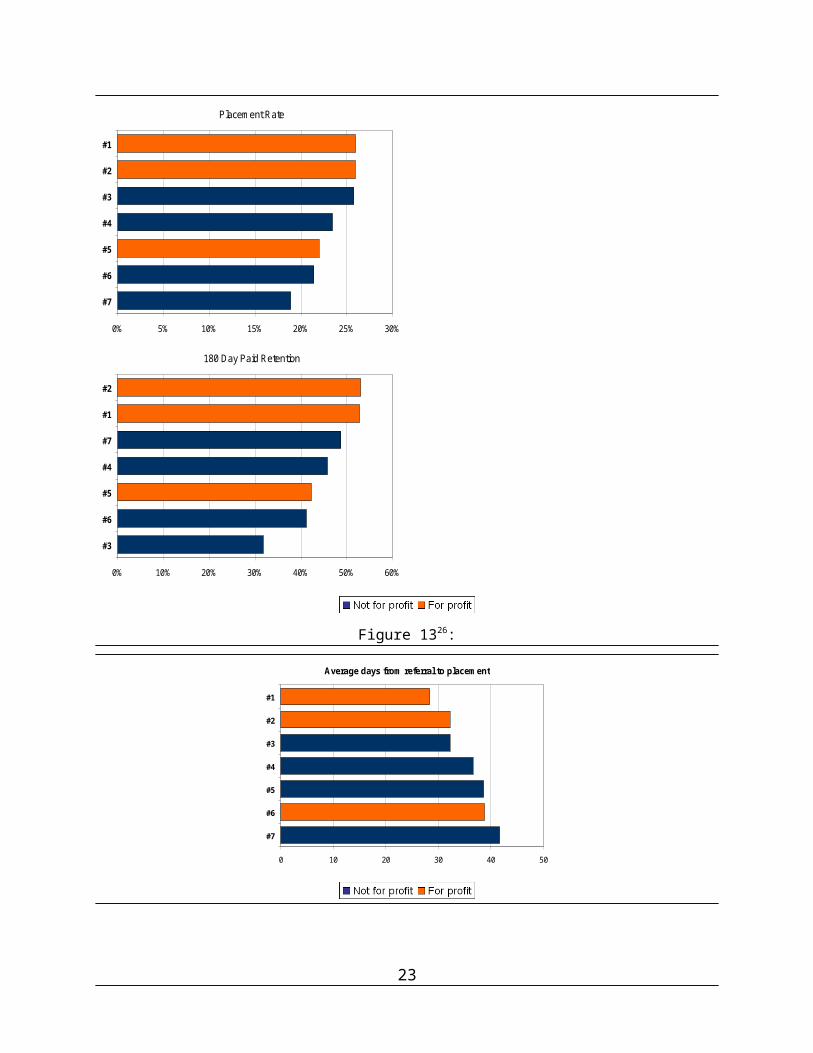
1) Comparison of paid performance of for-profit and not-for-profit vendors:
As shown in charts 12, 13, 14, for-profit vendors placed clients quickly into jobs (average days from referral to placement), had higher placement rates and higher 180 day retention rates, but had lower wage rates than not-for-profit vendors. One would assume that not-for-profit contractors that took a longer time to prepare clients so that they could place in higher paying jobs would have had higher retention, but this assumption is not supported by results. But it is likely that for-profit and not-for-profit contractors employ different strategies. For-profit contractors might allocate resource to quick labor force attachment, maximizing their revenue which might allow them to fund different retention strategies. On the other hand, not-for-profit vendors might spend more time with clients case managing, getting them higher paying job, but that might leave these vendors with less money for retention.
14
Figure 1225: Paid 30-Day Placement Rates and 180 Day Paid Retention Rates for BTW Vendors
Placement Rate
0% 5% 10% 15% 20% 25% 30%
#7
#6
#5
#4
#3
#2
#1
180 Day Paid Retention
0% 10% 20% 30% 40% 50% 60%
#3
#6
#5
#4
#7
#1
#2
Figure 1326:
Average days from referral to placement
0 10 20 30 40 50
#7
#6
#5
#4
#3
#2
#1
15
Figure 1427:
Average Wage for Placements
$7.00 $7.50 $8.00 $8.50 $9.00 $9.50 $10.00
#3
#5
#1
#2
#7
#4
#6
Figure 1528:
Placement Rate
0% 5% 10% 15% 20% 25% 30%
#7
#6
#5
#4
#3
#2
#1
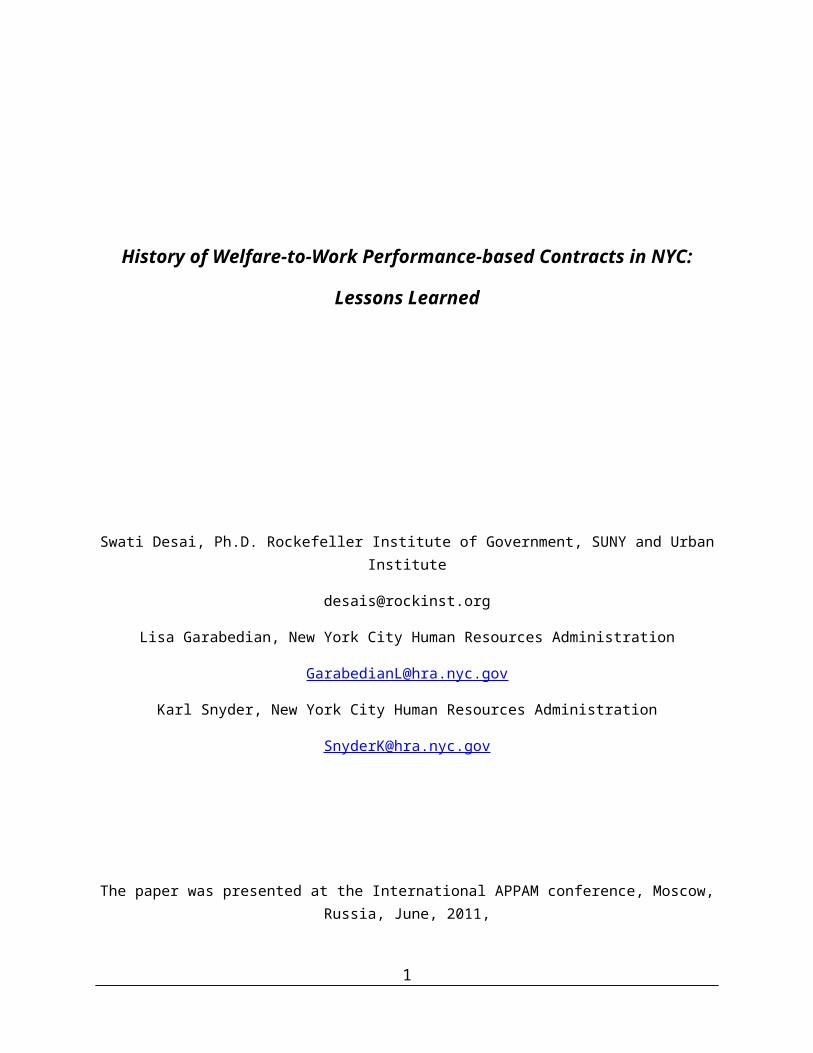
2) Performance of small vendors compared to large vendors
Smaller contracts, overall, had higher placement rates suggesting more focused placement strategies, while the larger contracts had lower rates. There was one contract that did not fit into this mode, a smaller contract that also had a lower placement rate. It is interesting to note that the smaller contract, which did not appear to follow the same pattern as the others, was the only contract that used subcontracts for the major portion of service delivery. Interestingly, however, there does not appear to be a clear correlation in terms of some other aspects of the program, including paid retention or average time to placement discussed earlier.
Learn from your experience
Over time internal (characteristics of welfare population) and external contexts (economy, policy) change. For contracts to stay relevant, the agency needs to learn from its experience with contracts.
16
1) Change in the program model
Thus, it is important for the Agency to be aware of these changes and able to update and modify the milestone structure and monitoring systems. In moving from the first to second round of contracts, HRA changed the relationship between vendors and HRA’s job centers in order to facilitate the continuum of services from applicants to recipients. As discussed earlier, HRA’s first generation of performance-based employment contracts involved two distinct contracts– one focused on applicants for cash assistance, and the other focused on cash assistance recipients. With the second generation of contracting, the program design required the contractors to serve both sets of job seekers. This decision was aimed at improving the relationship between job centers and contracted vendors and clients and vendors. A lack of this relationship was reflected in high no- show rate when the clients were referred to employment contractors. Under ESP contracts, if clients chose not to report to the assigned vendor they were ultimately assigned to a different vendor, allowing them to “shop” among different vendors. It also created less accountability between vendors and job centers.
Figure 16 shows that this change did lead to the desired result and had the effect of improving the overall front-end efficiency of the employment system. Between 2001 and 2006, the first generation of contracts had no-show (FTR) rates of between 25% and 30%. Starting with the new BTW contract at the end of 2006, the FTR rates dropped dramatically from 30% to around 15% and remained stable at that level. This could be attributed to the Job Centers’ close monitoring of client referrals and perhaps to the new contracting structure which did not allow clients to “shop”.
Figure 1629: Failure to Report Rates for Contracted Vendors
2) Redefine placements milestones
Under the SAP and ESP contracts, vendors were paid for milestones based on client placements. The contract structures encouraged vendors to build their volume of placements as a way to earn money needed to fund their programs. In this structure, placements were defined as day 1 placements. Thus, the milestone structure under the contract paid the same for all jobs in terms of duration. The incentives for keeping an individual employed were shifted to the retention milestones. But retention did not receive enough attention from the vendors because the retention milestones were not large enough.
Under the new contracts, the payment milestones were altered to collectively address some of these issues. First, the contract shifted to only paying for placements when the client remained employed for at least 30 days. One part of the calculus of shifting which placements the contract would pay for involved
17
0%
5%
10%
15%
20%
25%
30%
35%
2001 2002 2003 2004 2005 2006 2007 2008 2009 2010
an assumption that the number of paid placements might decline because vendors did not get paid for clients in jobs for less than 30 days. This also might have diminished the incentive for a vendor to make a placement if it was unlikely that the client would remain for at least a month. Thus, the payment rate for the placement milestone increased to continue to incentivize vendors to find jobs for clients where preferable clients would stay for longer than 30 days. The same average cost per milestone combined with a lower number, meant that the revenue to the vendor could go down but there might be cost savings for HRA for the overall contract.
These savings were redirected towards creating a bridge to help vendor better achieve the new 30 day definition, as well as ensuring service delivery that could help improve job retention overall. To this end, HRA created a Job Retention and Career Plan milestone (JRCP). This milestone involved a one-on-one service delivered to the client that discussed individualized financial planning, eligibility for non-cash public benefits, and longer-term career and life goals that could be met through job retention. The contract paid vendors for each newly placed individual that received this service. Vendors could provide and get paid for this service immediately with a reported placement, without waiting the 30 days specified in the new placement milestone. This focused on increasing the number of newly placed individuals who would stay for at least 30 days.
Figure 1730: Average Annual Employment Contract Spending for Placements
$0
$2,000
$4,000
$6,000
$8,000
$10,000
$12,000
$14,000
$16,000
SAP/ESP (Renewed) BTW
Ann
ual S
pend
ing
for M
ilest
ones
(in
thou
sand
s)
Placement JRCP
Conclusion
The lessons articulated here have emerged over time, as HRA has used performance based contracts as a tool to improve the delivery of employment services for tens of thousands of job seekers each year. HRA has used data based management and continuous monitoring to improve the performance of the employment system that allowed contractors to respond quickly to changes in policy and labor market environments, and meet the needs of job seekers referred by HRA. These data-driven illustrations describe some of the strategies that HRA used to harness the power of performance based contracts. The lessons explored here show the concrete ways management choices can drive contractor’s performance. What HRA has learned from these experiences will no doubt help the agency drive contracted employment services into the next decade with increased efficiency.
18
1
2Notes
1 Sanger (2003), Cha. 1.32 Sanger (2003), p. 124 All subsequent figures – Source: NYC Human Resources Administration. For all time-series figures, yellow shading is for the original SAP and ESP contracts. The time-period of the renewed SAP and ESP contracts is shaded pink. The period of the BTW contract is shaded green.5 In WEP, clients were required to participate in work with City agencies for no more than 3 days in return for the receipt of cash assistance and food stamps6 Commissioner Turner’s comments on earlier draft of the paper (2011).7 HRA did provide start up funding to the contractors. This funding was recouped from the performance-based payments.8 Of the original 17 contracts, one contract was cancelled due to technicalities and one vendor had both SAP and ESP contracts.9 Importantly, NPAC was formed to become an intermediary, where NPAC contracted with small CBOs to provide services to recipients, NPAC contract with CBOs were a part performance-based and a part line item. NPAC became a risk taker and provided technical assistance to CBOs to achieve required results and minimize the financial risk.10 Sanger (2003), p. 53.11 Interview with Linda Scarce-Turner, Sr. Vice President, Goodwill Industries, by Swati Desai, May, 201112 Barnow and Trutko in Savas (2005), p 244.13Interviews with Lee Bowes of America Works and Susan Melocarro by Swati Desai, May 2011.14 The placements reported by contractors also include clients placed by WeCARE contractors.15 New Hire database was created for the Child Support System to identify fathers who might be working and have not been paying child support. It allows the agency to identify clients who are working but have not reported their jobs either to the contractors or their case workers. 16 See Koning and Heinrich (2009) for additional references.17 Under the contract term, the overall amounts that could be earned per client, $2,500 for SAP and $5,300 for ESP – could not be changed. Thus, for both contracts, HRA increased the amount paid for retention while decreasing the amount paid for placements. See Appendix I.
18 There is also a placement bonus under the BTW contract for job seekers that are sanctioned. The engagement of these job seekers is primarily referred to one vendor. This analysis does not evaluate this bonus for placing sanctioned job seekers.19 Based on 3 month rolling averages.20 Based on 3 month rolling averages. Placement count is for vendor-initiated placements only.21 Barnow and Trutko in Savas (2005) p.235.22 Virgina Cruckshank, Senior Vice President, F.E.G.S.23 In BTW there are seven contractors and eight contracts, since one vendor holds two contracts for different service areas.24 Feldman (2011), P. 11, 12.25 Performance from September 2006 through August 201026 Performance from September 2006 through August 201027 Performance from September 2006 through August 201028 Performance from contract inception through August 201029 Based on 3 month averages. 30 Spending data in thousands. SAP/ESP Data for renewed contract, 2003-2005. BTW data for 2007-2009.
References
Armstrong, D., Byrne, Y., Patton, L., & Horack, S. (2009). Welfare to Work in the United States: New York’s experience of the prime provider model, Research Report No.614, prepared by the PricewaterhouseCoopers on behalf of the Department of Work and Pensions, UK.
Barnow, B, & Trutko, J. (2005), Placing Welfare Applicants and Recipients in Jobs through Performance-based Contracting. In E.S. Savas (Ed.) Managing Welfare Reform in New York City (pp 223-257). Oxford, UK. Rowman and Littlefield Publishers, Inc..
Barnow, B. & Smith, J. (2004). Performance Management of U.S. Job Training Programs. In C. J. O’leary, R. Straits, S. Wadner (eds.) Job Training Policy in the United States, W.E. Upjohn Institute for Employment Research, pp 21-55.
Behn, R. & Kant, P. Strategies for Avoiding the Pitfalls of Performance Contracting. Public Productivity and Management Review. June 1999.
Dias, J. J. & Maynard-Moody, S. (2006). For-Profit Welfare: Contracts, Conflicts, and the Performance Paradox. Journal of Public Administration Research and Theory 17, 189-211.
Feldman, A., (2011). What works in Work-First Welfare: Designing and Managing Employment Programs in New York City? Kalamazoo, Michigan: W.E.Upjohn Institute for Employment research.
Finn D. (2008). The British ‘welfare market’, Lessons from contracting out welfare to work programmes in Australia and the Netherland, Joseph Rowntree Foundation, York, UK
Finn, D. (2007). Contracting out Welfare to Work in the USA: delivery lessons, Research Report No. 466, prepared by the Center for Economic and Social Inclusion, University of Portsmouth on behalf of the Department of Work and Pensions, UK.
Heckman, J., Heinrich, C., &Smith, J. (2002). The performance of performance standards. Journal of Human Resources, 38,778-811.
Heinrich, C. & Choi, Y. (2007). Performance-based Contracting in Social Welfare Programs. American Review of Public Administration, 37, 409-435.
Kettl, D. (1993). Sharing power: Public Governance and private markets.Washington, DC: Brookings Institution.
Koning, P. & Heinrich, C. (2009). Cream-skimming, Parking and other Intended and Unintended Effects of Performance-based Contracting in Social Welfare Services, CPB Discussion Paper no. 134, The Hague, Netherlands.
Krauskopf, J. (2007). Performance Measurement in Human Services Contracts: Utilization, Operational feasibility and Value in New York City., New York, Baruch College, City University of New York.
Moynihan, D. (2005). Goal-based learning and the future of performance management. Public Administration Review, 65, 203-216.
Nightingale, D., Pindus, N., Kramer, F., Trutko, J., Mikelson, K., and Egner, M. (2002). Work and Welfare Reform in New York City during the Giuliani administration: A study of program Implementation Washington D.C.: The Urban Institute Labor and Social Policy Center..
Martin, L. (2007) Approaches to Performance-based Contracting (PBC) for Social Services,(Monograph) Quality Improvement Center on the Privatization of Child Welfare Services, University of Kentucky
Rom M. C. (2000). From Welfare State to Opportunity, Inc. Public – Private Partnership in Welfare Reform. In Rosenau (ed.) Public – Private Policy Partnership, MIT Press, Boston, MA.
Sanger, M. B. (2003). The Welfare Marketplace: Privatization and Welfare Reform. Brookings Institution Press. Washington D.C.
Savas, E. (ed.) (2005). Managing welfare reform in New York City. Maryland, Rowman and Littlefield Publishers, Inc.
Smith, D. & Grinker, W. (2004). The Promise and Pitfalls of Performance-based Contracting. Seedco, NY.
Winston, P., Burwick, A., McConnell, S., Roper, R. (2002). Privatization of Welfare Services: A Review of Literature, Mathematica Policy Research, Inc. Washington, DC.
Appendix -I
Appendix -II
Ten Years of Performance-Based Employment Contracts in NYC
* Percentages based on weighted averages. Distribution does not include aggregate milestones. Payment point distribution includes associated bonus payments. May not add to 100% due to ro
Skill Assessment & Placement
Contracts (SAP) Employment Services & Placement
Contracts (ESP) Back-To-Work
Contracts (BTW)
Original Renewed
Original Renewed
Dates
1999-2002 2003-2006
1999-2002 2003-2006
2006-Present (will expire in 2012) Annual value
$29,900,000 $42,000,000
$78,500,000 $45,700,000
$53,200,000 Acquisition
Negotiated acquisition Negotiated acquisition
Competitive RFP process Number of prime contractors
5 4
12 10
7
Primary target population
Cash assistance applicants Cash assistance recipients
(Also included WIA eligible populations through 2002) Cash assistance applicants &
recipients
Vendor Assignment Each center is served by one vendor
Random assignment of participants based on geography Each center is served by one
vendor
Service duration Up to six weeks
Up to six months with a single vendor Vendor works with participant as long as the Agency assigns them to
job search Max payment per participant
$2,500 $5,350 average (varied by contract)
$3,800 average (varied by contract)
Contract structure
Individual milestones: Assessment Engagement Full-time job placement
-or- Part-time job placement
90-day job retention Bonus milestones: Case closure due to earnings (at 90 days)
Individual milestones: Job placement 90-day job retention 180-day job retention Bonus milestones: High wage (at 90 days) Case closure due to earnings (at 180 days)
Aggregate population milestones: Engagement Participation (discontinued) Individual milestones: Assessment 30-day job placement Job retention & career plan 90-day job retention 180-day job retention Bonus milestones: Job placement for sanctioned or
time-limited participants Case closure (at 90 days) Wage gain (at 180 days)
Distribution *
Assessment 10%
10% -
- 5%
Engagement 20%
20% -
- -
Placement 60%
35% 37%
23% 35%
Job retention plan -
- -
- 5%
90 day retention 10%
35% 36%
50% 29%
180 day retention -
- 27%
27% 25%