Embed Size (px)
Citation preview
1
An Economic and Social Review on Indonesian Direct Cash Transfer
Program to Poor Families Year 20051
Muliadi Widjaja [email protected]
Department of Economics, University of Indonesia
Institute of Economic and Social Research, University of Indonesia
Abstract
This paper is to elaborate the result of surveys regarding the Indonesian Year 2005 Direct
Cash Transfers (Bantuan Langsung Tunai ) implementation. The survey name Susenas
(National Census and Survey) was held across Indonesia in the aftermath of the program
in 2006. The economic purpose of this government’s welfare program is to dampen the
increasing rate of poverty incidence in Indonesia due to the increase of gas prices.
Several issues featured in this paper are the achievement of the program in distributing
the cash transfer, how the recipients use the fund they received, the impact of cash
transfer on the recipient’s working behavior, the socialization method of the program, and
finally the problems that happened during the program implementation. The findings are
that, besides the facts that the program was not properly prepared and was not properly
organized; it achieves the goal in resisting the increase of poverty rate due to gas price
increases.
JEL Classification: I38
Keywords: Cash Transfers, Welfare, Poverty 1 Author would like to thank participants at the Association for Public Policy Analysis and Management International Conference, “Asian Social Protection in Comparative Perspective”, Singapore, January 7-9, 2009, for valuable comments and suggestions. Special thanks to Talitha Chairunissa for her excellent assistance.
2
Introduction
Bantuan Langsung Tunai (BLT- Direct Cash Transfers) is the program of Indonesian
central government to subsidize poor families. The economic goal is to encounter the
impact of increasing poverty incidence as a result of the increase of gasoline prices. The
political goal is to prevent large mass demonstration, demanding for gas price decline. In
Indonesia, gas prices are set at fixed prices by the central government.
The BLT program itself is first introduced under the administration of President
Bambang Yudhoyono, and implemented for the first time in October 2005- the same
month the government increased the gas price by 87.5 percent. BLT program was
institutionalized by the Presidential Instruction No. 12/2005. The second BLT program is
held on May 2008, the same month when the President increased the gas price again for
the third time, this time by 33.3 percent, currently under operation. Since there is no
result is available yet, the discussion in this paper will focus on the first BLT program,
the one held in year 2005 and 2006.
BLT program is unique because for the first time since the independence of
Indonesia in 1945, there is a cash transfer program to help the poor families in order to
cope up with poverty due to the increase of gas prices. The fund is taken from the partial
cut of gasoline subsidy, transferred into household subsidy. The Indonesian BLT program
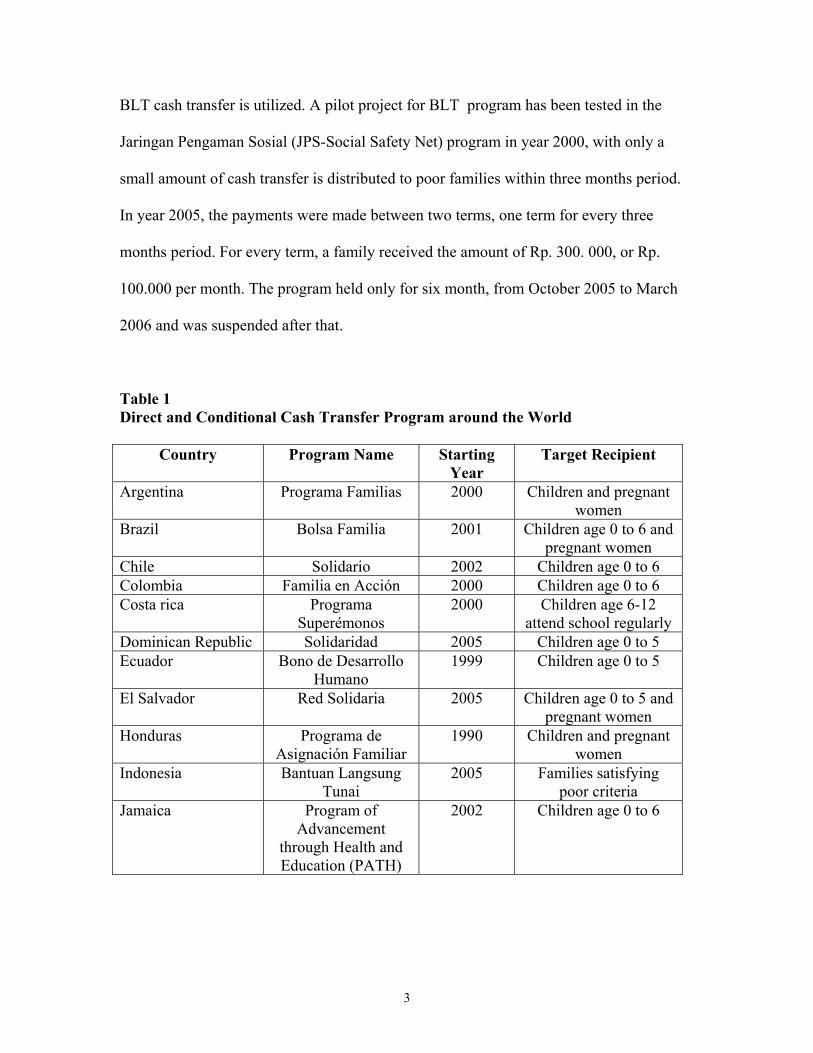
follows other conditional cash transfer programs (Table 1) like the one held in Mexico,
called Progresa (Programa de. Educación, Salud y Alimentación). However, while the
purpose of Progresa and most other cash transfer in South America is conditional for
education, health support and nutrition improvement of the poor, BLT is only to
encounter poverty increases due to gas price increases. There is no restriction on how the
3
BLT cash transfer is utilized. A pilot project for BLT program has been tested in the
Jaringan Pengaman Sosial (JPS-Social Safety Net) program in year 2000, with only a
small amount of cash transfer is distributed to poor families within three months period.
In year 2005, the payments were made between two terms, one term for every three
months period. For every term, a family received the amount of Rp. 300. 000, or Rp.
100.000 per month. The program held only for six month, from October 2005 to March
2006 and was suspended after that.
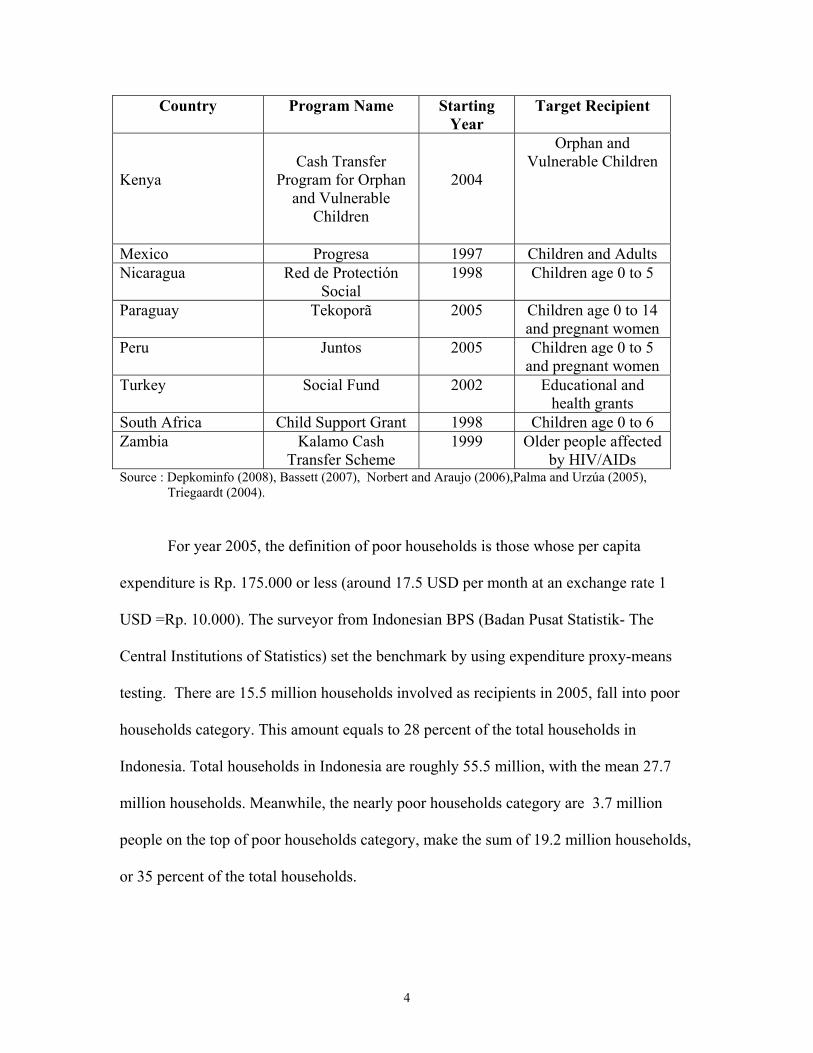
Table 1 Direct and Conditional Cash Transfer Program around the World
Country Program Name Starting Year
Target Recipient
Argentina Programa Familias 2000 Children and pregnant women
Brazil Bolsa Familia 2001 Children age 0 to 6 and pregnant women
Chile Solidario 2002 Children age 0 to 6 Colombia Familia en Acción 2000 Children age 0 to 6 Costa rica Programa
Superémonos 2000 Children age 6-12
attend school regularly Dominican Republic Solidaridad 2005 Children age 0 to 5 Ecuador Bono de Desarrollo
Humano 1999 Children age 0 to 5
El Salvador Red Solidaria 2005 Children age 0 to 5 and pregnant women
Honduras Programa de Asignación Familiar
1990 Children and pregnant women
Indonesia Bantuan Langsung Tunai
2005 Families satisfying poor criteria
Jamaica Program of Advancement
through Health and Education (PATH)
2002 Children age 0 to 6
4
Country Program Name Starting Year
Target Recipient
Kenya
Cash Transfer
Program for Orphan and Vulnerable
Children
2004
Orphan and Vulnerable Children
Mexico Progresa 1997 Children and Adults Nicaragua Red de Protectión
Social 1998 Children age 0 to 5
Paraguay Tekoporã 2005 Children age 0 to 14 and pregnant women
Peru Juntos 2005 Children age 0 to 5 and pregnant women
Turkey Social Fund 2002 Educational and health grants
South Africa Child Support Grant 1998 Children age 0 to 6 Zambia Kalamo Cash
Transfer Scheme 1999 Older people affected
by HIV/AIDs Source : Depkominfo (2008), Bassett (2007), Norbert and Araujo (2006),Palma and Urzúa (2005),
Triegaardt (2004).
For year 2005, the definition of poor households is those whose per capita
expenditure is Rp. 175.000 or less (around 17.5 USD per month at an exchange rate 1
USD =Rp. 10.000). The surveyor from Indonesian BPS (Badan Pusat Statistik- The
Central Institutions of Statistics) set the benchmark by using expenditure proxy-means
testing. There are 15.5 million households involved as recipients in 2005, fall into poor
households category. This amount equals to 28 percent of the total households in
Indonesia. Total households in Indonesia are roughly 55.5 million, with the mean 27.7
million households. Meanwhile, the nearly poor households category are 3.7 million
people on the top of poor households category, make the sum of 19.2 million households,
or 35 percent of the total households.
5
There are three institutions officially involved in the implementation of the BLT
program. The first is the Indonesian central government, as they are the fund holder of
the program. The second institution is the Central Board of Statistics (Badan Pusat
Statistik-BPS), responsible for recording of the number of targeted poor families. BPS is
also responsible for the distribution of Energy Compensation Card (Kartu Kompensasi
BBM-KKB). Without the card, a family cannot get the transfer. The third institution is
the post office. Local post office is responsible as a station for the poor families to come
and get the transfer. However, during the implementation, there are a lot more parties get
involved, such as local government, the head of village, local elites, local police, etc.
These additional parties get involved without any initial coordination with the three
institutions.
The purpose of this paper is to share the social and economic impact from the
implementation of cash transfers program in Indonesia. The findings are interesting as
Indonesia, as other developing countries, does not have infrastructures to support such a
program; e.g. computerized lists of individuals and or households which fall into poor
category. Achievement and problems arise here. Since the targets of the program are poor
families, the Indonesian central and local government does not have the exact data
regarding which household is included in the category of the poor. In order to gather such
data, in 2005 the central government, helped by BPS, held a census called Pendataan
Sosial Ekonomi Penduduk 2005 (PSE05). The purpose of the census is the mapping of
the poor families in rural and urban area. According to the guidance, there are 14 criteria
to map households into the government category of poor families. Having been recorded,
6
each household that fall into the poor category receive KKB card. This card is the
identification for individuals to get the distributed cash at the local post office.
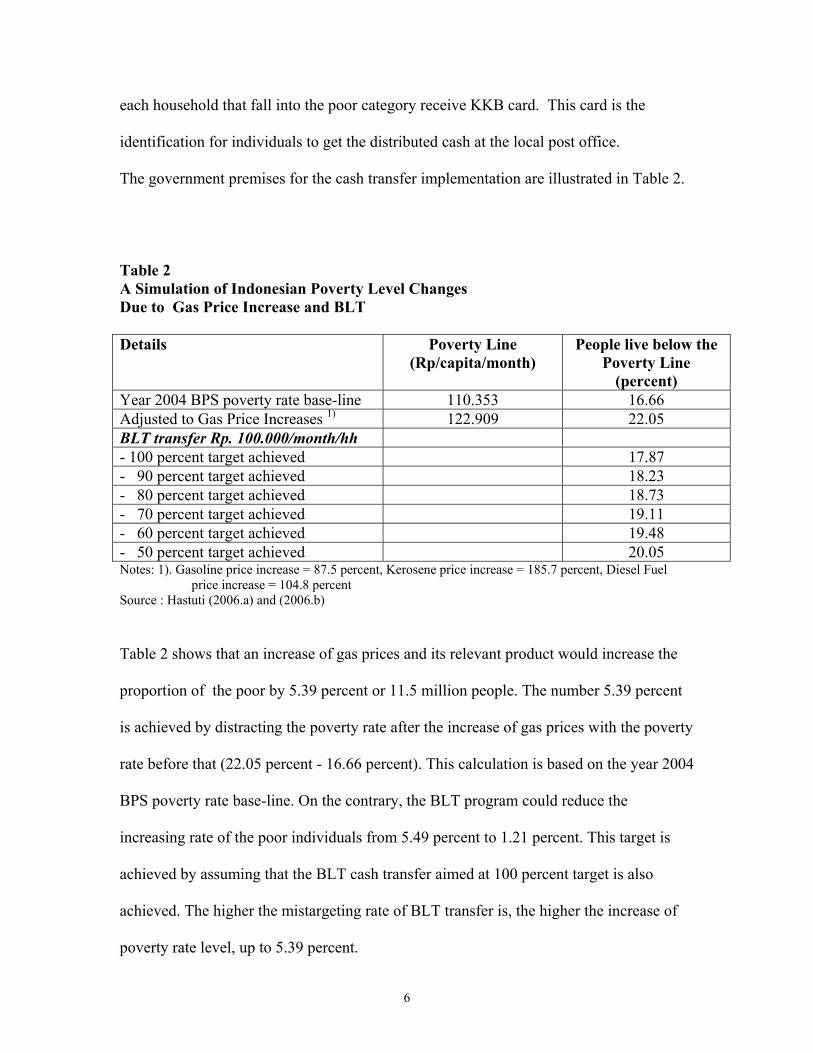
The government premises for the cash transfer implementation are illustrated in Table 2.
Table 2 A Simulation of Indonesian Poverty Level Changes Due to Gas Price Increase and BLT Details Poverty Line
(Rp/capita/month) People live below the
Poverty Line (percent)
Year 2004 BPS poverty rate base-line 110.353 16.66 Adjusted to Gas Price Increases 1) 122.909 22.05 BLT transfer Rp. 100.000/month/hh - 100 percent target achieved 17.87 - 90 percent target achieved 18.23 - 80 percent target achieved 18.73 - 70 percent target achieved 19.11 - 60 percent target achieved 19.48 - 50 percent target achieved 20.05 Notes: 1). Gasoline price increase = 87.5 percent, Kerosene price increase = 185.7 percent, Diesel Fuel
price increase = 104.8 percent Source : Hastuti (2006.a) and (2006.b)
Table 2 shows that an increase of gas prices and its relevant product would increase the
proportion of the poor by 5.39 percent or 11.5 million people. The number 5.39 percent
is achieved by distracting the poverty rate after the increase of gas prices with the poverty
rate before that (22.05 percent - 16.66 percent). This calculation is based on the year 2004
BPS poverty rate base-line. On the contrary, the BLT program could reduce the
increasing rate of the poor individuals from 5.49 percent to 1.21 percent. This target is
achieved by assuming that the BLT cash transfer aimed at 100 percent target is also
achieved. The higher the mistargeting rate of BLT transfer is, the higher the increase of
poverty rate level, up to 5.39 percent.
7
The Determination of Recipients
There are 14 main indicators to be used in determining whether a family deserves
to be included as cash transfer recipients. Those 14 indicators are: the area of the house,
the type of floor in the house, the sanitation facilities used in the house, the source of
drinking water, light facilities, type of cooking fuels, weekly frequency of purchasing
meat, poultry and milk; daily frequency of having meal, the amount of cloths purchased
annually, access to puskesmas (center of social health) and polyclinic, jobs, the education
of the breadwinner, and asset ownership. In addition to the 14 main indicators, there are
also additional 4 supporting indicators: the existence of children below 5 years old, the
existence of children at school age, the participation in KB (family planning program)
and whether the target candidate is a debitor of investment credit.
From the list of questions, actually there is a small probability that respondents do
not reply accordingly to their own actual conditions; that way they replied underestimated
of own actual condition in order to be “feasible” of cash transfer classification. In
addition to that, there are some reports that BPS surveyor did not ask all of the questions,
that they asked only 3-4 questions out of the 18 questions due to time constraint. This
survey was held only for 1 month before the action and targeting 15.5 million
households. Not to mention the type I statistical error (choosing families not feasible as
recipients as cash transfer recipients) and the type II statistical error (not choosing the
feasible poor families as cash transfer recipients) that the surveyor did made the survey
have a lot of flawed information.
8
Next are the presentations of the result of the field survey on BLT
implementation. This survey is called Susenas (National Survey and Census) 2006 and
were held by BPS staff all over Indonesia.
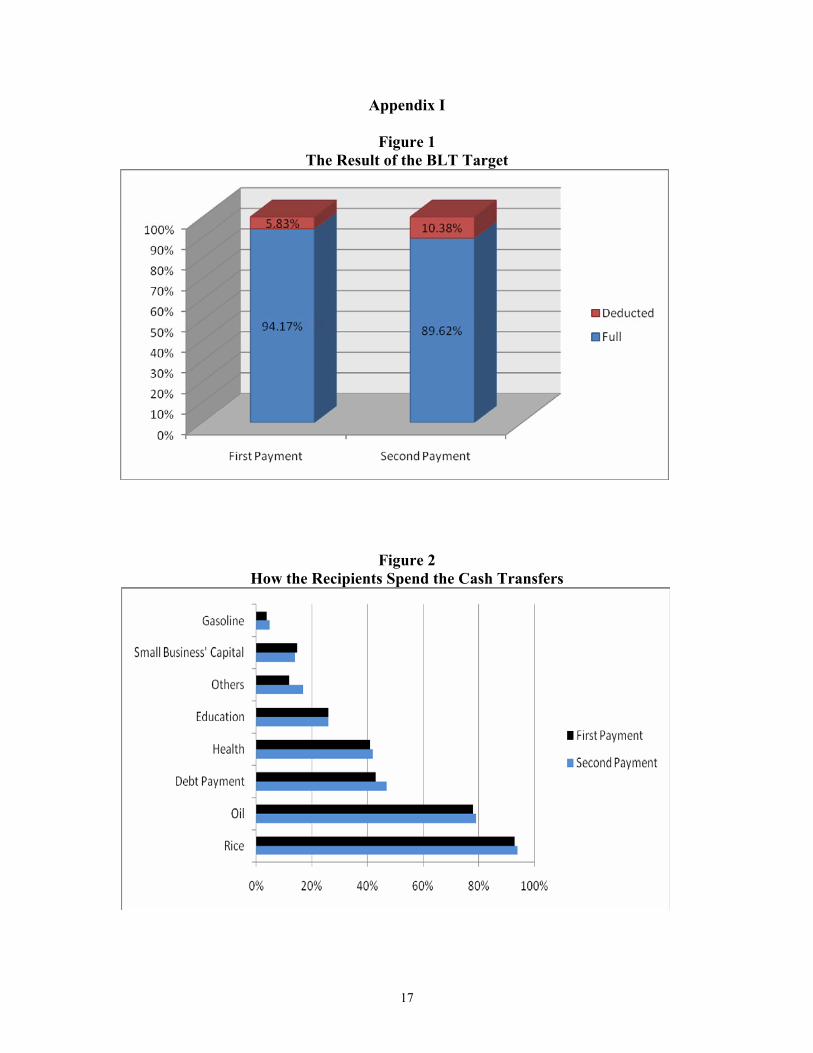
The final result of the BLT target
From Figure 1, reader may see that from the first round of BLT payment in
October 2005, 94.17 percent of recipients claimed that they received 100 percent of the
transfer, while 5.83 percent stated that they received less than the promised amount.
Meanwhile from the second round payment in January 2006, roughly 89.62 percent stated
they received full payment, while 10. 38 percent did not. If the claim is true, it means that
the increase of poverty rate could be resisted into roughly 18.2 percent to 18.7 percent
due to the increase of gas prices (Table 2). Without the direct cash transfer program, the
poverty incidence would increase up to 22 percent. The BPS itself announced in March
2006 that the amount of people living below the poverty line reached 17.75 percent in
March 2006 and 16.58 percent in March 2007 (Badan Pusat Statistik, 2006 and 2007).
However, one cannot tell whether there is a decrease since the standard error of
calculation and the methodology of calculation was not published.
Even though so, this prediction of poverty incidence still depends on how the
family spend the cash they received. As will be discussed in the next session, many
families receiving the transfer use the fund to service their private debt or other spending
not related to their welfare. These spending activities actually did not increase their
welfare at all, affecting the rate of poverty incidence.
9
The usage of BLT cash transfer by the recipients
How recipients spend the cash transfers are shown in Figure 2. More than 90
percent of recipients claimed that rice dominated most of the spending. Kerosene
expenditure stood on number two in the list of expenditure. Number three is private debt
service. Next on the list is health expenditure, while education expenditure is listed on
number five. Interesting things are that some of the BLT received is also used for capital
and other production cost, like gasoline, for household with motorcycle. The data
gathered is more or less the same for the two rounds of transfers. Meanwhile, there are
also other consumption activities, like cloth purchasing. These activities are relatively
significant, only roughly 12 percent of respondents in the first round and 18 percent of
respondents in the second round of payment. Other activities not related to welfare
increase, like alcohol drinking and gambling, are not reported.
The information against the opinion that BLT cash transfer is not a good program
because the government cannot control the way the recipients spend the money. The
critics of this program stated that there is a high probability of moral hazards in the way
the recipients spend the money.
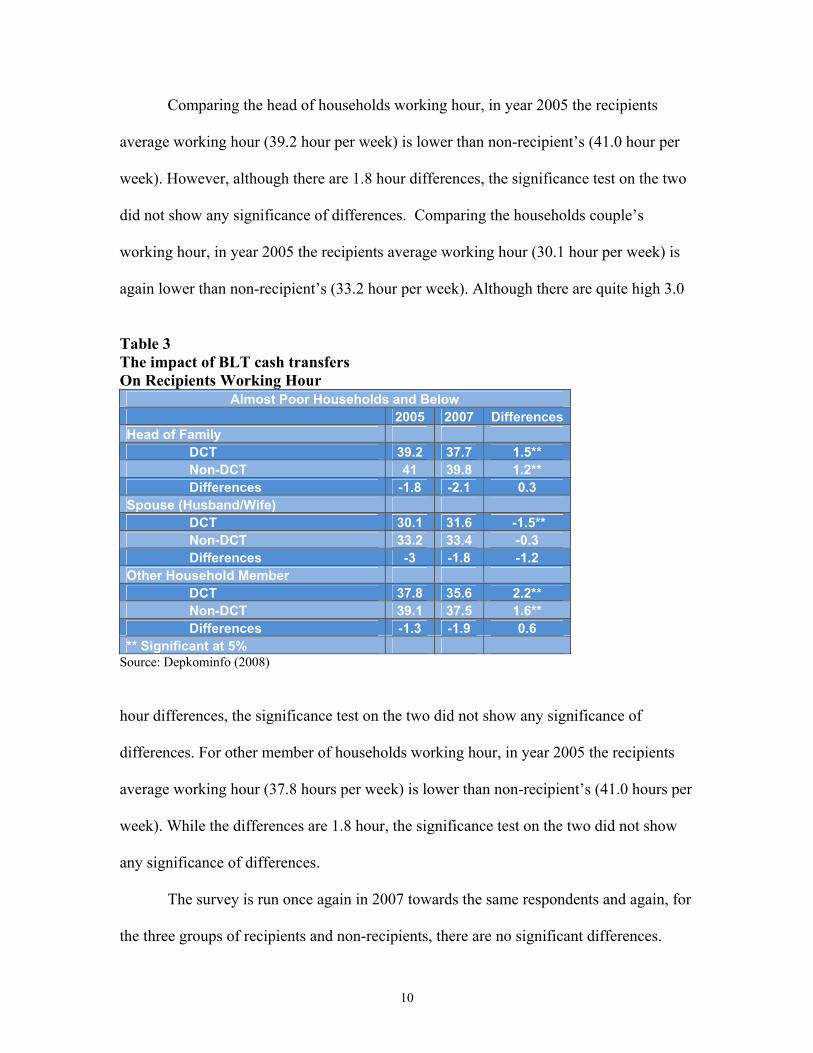
The impact of BLT cash transfer towards the recipients’ working hour
Table 3 illustrates the impact of cash transfer on working hour of the recipient
households and non-recipient. There are three groups of household member are being
surveyed: The head of household, the couple in the household and the other member in
the household.
10
Comparing the head of households working hour, in year 2005 the recipients
average working hour (39.2 hour per week) is lower than non-recipient’s (41.0 hour per
week). However, although there are 1.8 hour differences, the significance test on the two
did not show any significance of differences. Comparing the households couple’s
working hour, in year 2005 the recipients average working hour (30.1 hour per week) is
again lower than non-recipient’s (33.2 hour per week). Although there are quite high 3.0
Table 3 The impact of BLT cash transfers On Recipients Working Hour
Almost Poor Households and Below 2005 2007 DifferencesHead of Family DCT 39.2 37.7 1.5** Non-DCT 41 39.8 1.2** Differences -1.8 -2.1 0.3 Spouse (Husband/Wife) DCT 30.1 31.6 -1.5** Non-DCT 33.2 33.4 -0.3 Differences -3 -1.8 -1.2 Other Household Member DCT 37.8 35.6 2.2** Non-DCT 39.1 37.5 1.6** Differences -1.3 -1.9 0.6 ** Significant at 5%
Source: Depkominfo (2008)
hour differences, the significance test on the two did not show any significance of
differences. For other member of households working hour, in year 2005 the recipients
average working hour (37.8 hours per week) is lower than non-recipient’s (41.0 hours per
week). While the differences are 1.8 hour, the significance test on the two did not show
any significance of differences.
The survey is run once again in 2007 towards the same respondents and again, for
the three groups of recipients and non-recipients, there are no significant differences.
11
Meanwhile, the significance test on the time series data year 2005 and 2007 of the three
groups of recipients and non-recipients shows that the increase of gas prices in year 2005
really forced the poor family to work longer hour in order to maintain their welfare. Five
out of six data tests show significance of differences at 5 percent significance level.
The information gathered regarding the recipient’s working hour also challenge
the critics of BLT program, that BLT program would make the recipients sloth after
receiving the cash transfer.
The effectiveness of BLT source of information and media socialization
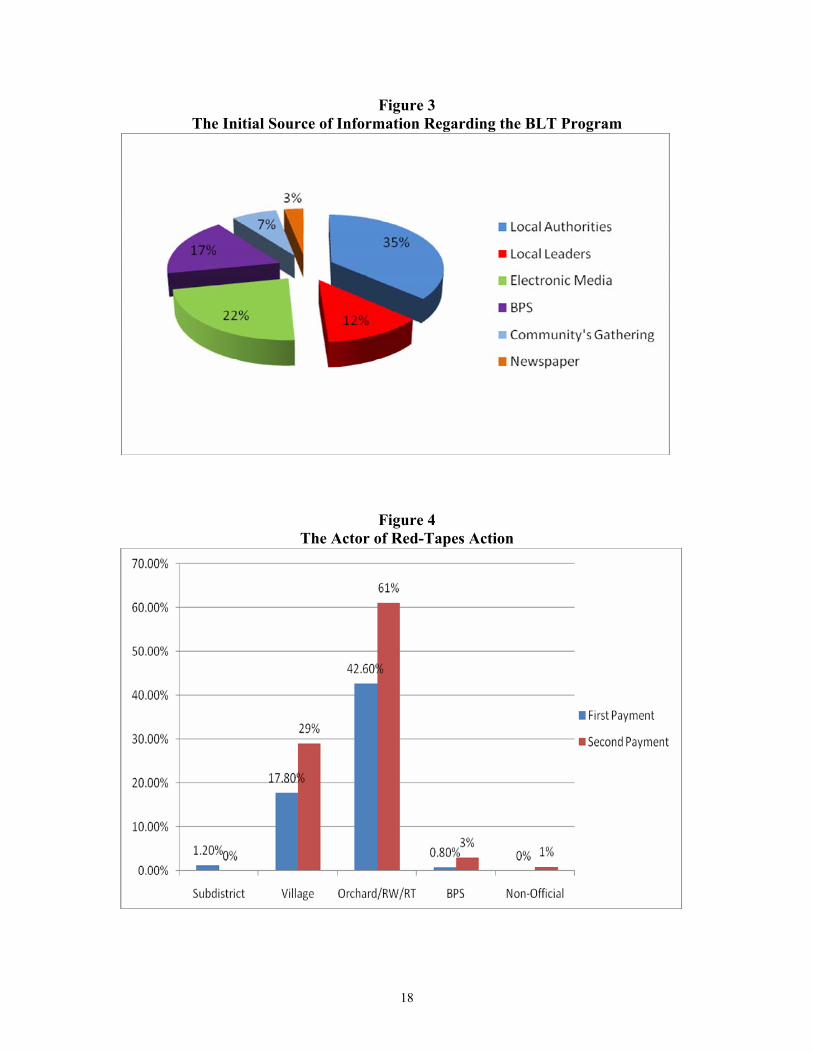
The recipient’s sources of information about the BLT program vary (Figure 3).
The initial source of information regarding the program is local civil servant and
policemen (39 percent), electronic media/television (22 percent), BPS officer (17
percent), society and religious leaders (12 percent), social gathering (7 percent) and
newspaper (3 percent). Roughly 88 percent of BLT recipient admitted that they knew
how much amount of money they would receive, while the rest 12 percent admitted they
did not know. The information confirms that two most effective media of information
are local civil servant and television. Most recipient do not subscribe to newspaper that
information from newspaper do not reach them.
Red-tapes problem and its actor
Since the transfer involved some amount of money, red-tape problem is a problem that
one must expect. From Figure 4, the unofficial fund slash is administered through the
following reasons: first, that the fund is equally distributed to other poor but not
12
registered by the BPS surveyor (stated by 57 percent of the first term recipient respondent
and 77 percent of the second term recipient respondent). The second reason is for the
transportation cost of the BLT administer ( 27 percent and 27 percent). Third reason is
administration cost (15 percent and 0 percent). The next reason is for the maintenance of
the public facilities (4 percent and 14 percent). The rest are for the honorarium of BLT
administer (2 percent and 4 percent) and for security fund (5 percent and 6 percent).
There are still some unclassified other reasons (6 percent and 6 percent).
The next question is, who are the actors of these unofficial fund slash? In Figure
6, most of respondents stated that it is the head Dusun (orchard) or RW (Rukun Warga, a
unit of households consists of around 150 - 200 households) or the head of RT (Rukun
Tetangga, a unit of households consists of around 40 - 50 households), both in urban and
rural area. There are 42.6 percent statement of first term recipient respondent and
61percent statement of second term recipient respondent. Other actors are the head of
villages or the head of or Kelurahan (unit of households consists of around 1000
households), stated by 17.8 percent of first term recipient respondent and 29 percent of
second term respondent. Small other percentage stated that the actor are head of
Kecamatan (unit of households consists of a few Kelurahan), BPS staff, and other person
not involved in BLT distribution.
The information regarding the red-tape problems indicates that face-to-face BLT
distribution method would induce the problem. In developing countries like Indonesia,
many populations are not well-registered either by local government or central
government. Many people do not have an ID card, do not have a bank account and do
not have a good address. As a result, the only choice of distribution method for cash
13
transfer program like BLT is face-to face method. If only people have a good address,
have a bank account and have an ID card, a bank transfer or a post delivery method
would eliminate the red-tape problem.
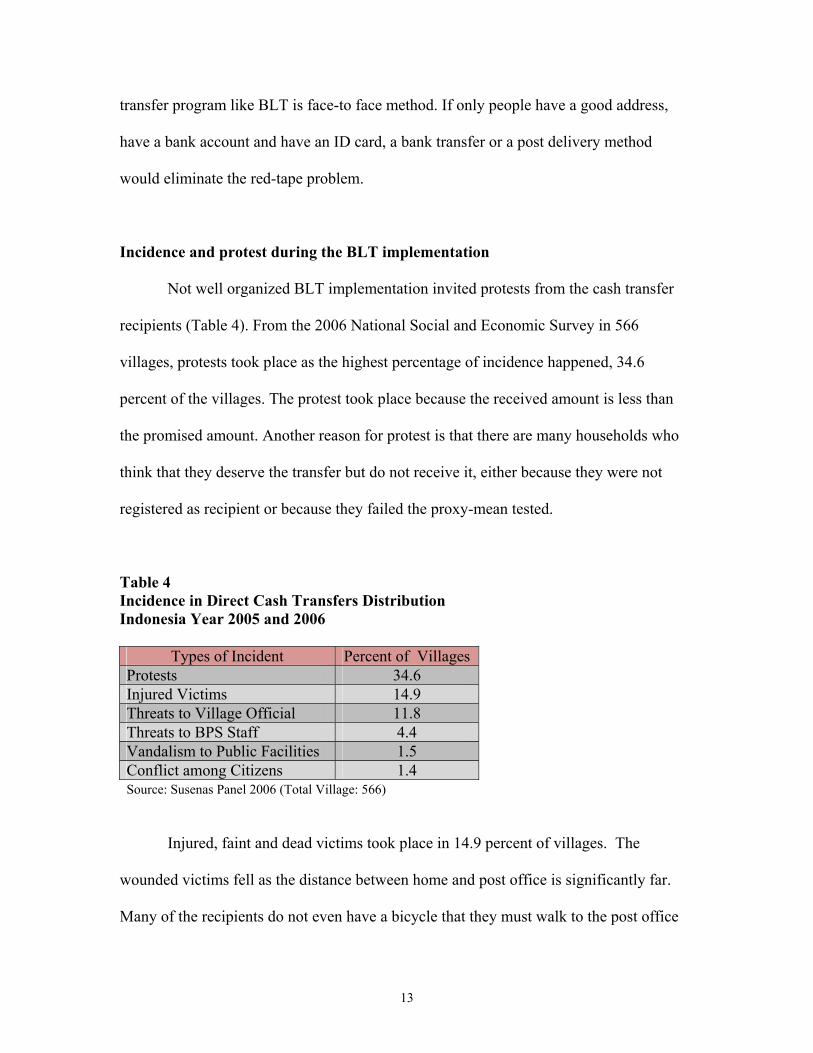
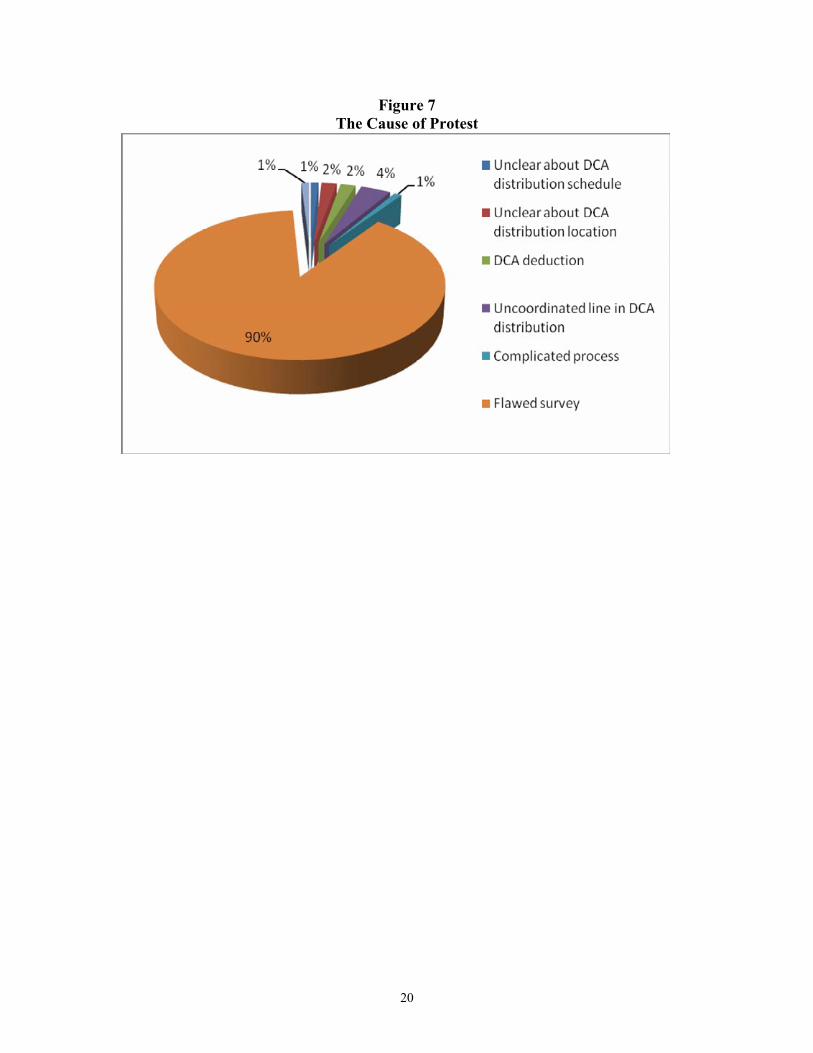
Incidence and protest during the BLT implementation
Not well organized BLT implementation invited protests from the cash transfer
recipients (Table 4). From the 2006 National Social and Economic Survey in 566
villages, protests took place as the highest percentage of incidence happened, 34.6
percent of the villages. The protest took place because the received amount is less than
the promised amount. Another reason for protest is that there are many households who
think that they deserve the transfer but do not receive it, either because they were not
registered as recipient or because they failed the proxy-mean tested.
Table 4 Incidence in Direct Cash Transfers Distribution Indonesia Year 2005 and 2006
Types of Incident Percent of Villages Protests 34.6 Injured Victims 14.9 Threats to Village Official 11.8 Threats to BPS Staff 4.4 Vandalism to Public Facilities 1.5 Conflict among Citizens 1.4 Source: Susenas Panel 2006 (Total Village: 566)
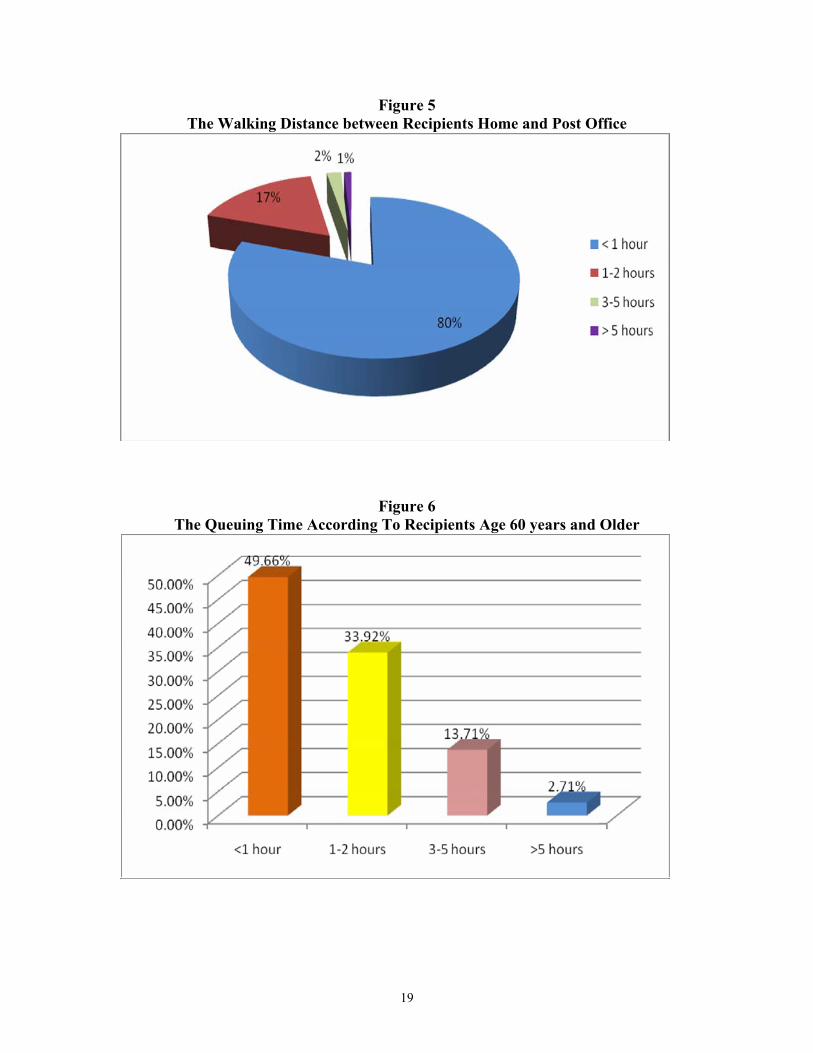
Injured, faint and dead victims took place in 14.9 percent of villages. The
wounded victims fell as the distance between home and post office is significantly far.
Many of the recipients do not even have a bicycle that they must walk to the post office
14
to get the transfer. In Figure 5, roughly 80 percent of the respondent stated that the post
office is reached within one hour or less by walking. Meanwhile, 17 percent of the
respondent admitted that they reached the post office within 1 to 2 hours. Two percent
respondents stated that the post office is reached within 3 to 5 hours and one percent of
respondents admitted that it took more than 5 hours to reach the post office.
The amount of faint victims is not recorded, even though the case is not rare.
There are three dead victims in the whole program in 2005. The cause of the two cases is
the same: The queuing person is too exhausted. Many of them are old men and women,
60 years old and older. In Figure 6, from the respondents of older men and women 60
years old and older, 49.7 percent claimed that they queued for 1 hour or less. Roughly
33.9 percent claimed that queuing time is 1 to 2 hours. Queuing time for 3 to 5 hours is
claimed by 13.7 percent of respondents, while more than five hours queuing time is
claimed by 2.7 percent of respondents.
Other incidences are threats to local civil servants and to BPS staff, took place in
11.8 percent and 4.4 percent of villages under investigation, respectively. The two threats
came from unsatisfied people because they are not registered as recipients. Anarchies
incidence like vandalism of government facilities and conflict among village member
took place in 1.5 percent and 1.4 percent of villages under investigation, respectively.
The cause is again, satisfaction differences between recipients and non-recipients who
think that they also deserve the transfer (Figure 7).
15
Conclusion
While the program implementation was not properly prepared, the Year 2005
Indonesian Direct Cash Transfers was actually able to withstand the increase of poverty
incidence due to the increase of administered gasoline prices. From the initial 16.66
percent poverty rate, the poverty rate increase could be resisted up to 18.7 percent
compare to the predicted 22 percent without any welfare assistance program.
From the author of this paper point of view, since the government BLT program
was not intended to reduce poverty, but to dampen the impact of gas price increase on the
welfare of the poor household (economic purpose), and to prevent large mass
demonstration due to the gas price increase (political purpose), the program has already
achieved its purpose. The socialization of this program was helpful to reach this purpose,
although the socialization was done within short time. In addition, there is no sign that
the BLT program increase sloth among the recipients, meaning that the side-effect of the
program was avoidable.
The problems in the implementation are household registration failure, red-tapes,
distance from home to the post office where the fund is distributed, and queuing. With
the current condition and infrastructure, queuing problem is the most probably to fix.
The post office might divide the schedule of the recipients. Meanwhile, even though not
difficult to fix, fixing household registration failure would cost additional significant
government budget.
16
Reference
Basset, L. (2007). Can conditional cash transfers play a greater role in reducing child
malnutrition? Presentation at the World Bank, Washington D.C..
Badan Pusat Statistik. (2007). Statistik Indonesia. Jakarta, BPS.
Badan Pusat Statistik. (2006). Statistik Indonesia. Jakarta, BPS.
Department of Communication and Information (2008). Melindungi hak rakyat miskin.
Republic of Indonesia: Jakarta.
Hastuti (2006.a). Kajian cepat pelaksanaan subsidi langsung tunai tahun 2005 di
Indonesia: Studi kasus di lima kabupaten/kota. SMERU Research Report.
Hastuti (2006.b). Kajian cepat pelaksanaan subsidi langsung tunai tahun 2005 di
Indonesia: Studi kasus di provinsi DKI Jakarta. SMERU Research Report.
Palma, J. and Urzúa, R. (2005). Anti-poverty policies and citizenry: The “Chile
Solidario” experience. Management of Social Transformation Policy Papers, No.
12. United Nations Educational, Scientific, and Cultural Organization. France.
Schady, N. and Araujo, M.C.(2006). Cash transfers, conditions, school enrollment, and
child work. World Bank Policy Research Working Paper, No. 3930.
Triegaardt, J. D. (2004). The Child Support Grant in South Africa: A social policy for
poverty alleviation? International Journal of Social Welfare, 14(4), 249-255.
17
Appendix I
Figure 1 The Result of the BLT Target
Figure 2 How the Recipients Spend the Cash Transfers
18
Figure 3 The Initial Source of Information Regarding the BLT Program
Figure 4 The Actor of Red-Tapes Action
19
Figure 5 The Walking Distance between Recipients Home and Post Office
Figure 6 The Queuing Time According To Recipients Age 60 years and Older
20
Figure 7 The Cause of Protest