Embed Size (px)
Citation preview
1
HISTORICAL TRADITIONS OF CIVICNESS AND LOCAL ECONOMIC DEVELOPMENT
by Guido de Blasio* and Giorgio Nuzzo**
Abstract
The paper investigates the importance of history for local economic performance in Italy by studying the role of social capital, which refers to trust, reciprocity and habits of co-operation that are shared among member of a local community. The paper presents a test based on worker productivity, entrepreneurship, and female labor market participation. Using as instruments regional differences in civic involvement in the late nineteenth century and local systems of government in the middle ages, it shows that social capital does have economic effects.
JEL Classification Numbers:Z10,O10, D10
Keywords: Social Capital, Economic Development
Contents
1. Introduction ........................................................................................................................2 2. The Effect of Social Capital: OLS and LPM Estimates ......................................................8
2.1 Dependent Variables ..................................................................................................8 2.2 Data and Descriptive Statistics .................................................................................10 2.3 Ordinary Least Squares and Linear Probability Model Regressions ........................12
3. The Effect of Social Capital: IV Results ...........................................................................14 3.1 The Historical Origins of Social Capital.....................................................................14 3.2 2SLS Results with Nineteenth-Century Instruments.................................................16 3.3 2SLS Results with Contemporary Instruments .........................................................18 3.4 2SLS Results with Fourteenth-Century Instruments.................................................20
4. Concluding Remarks........................................................................................................22
* Corresponding author. Bank of Italy, Structural Economic Analysis Department. Via Nazionale
91(00184) Rome Italy. Tel +390647924173. Email [email protected] ** Bank of Italy, Banking Supervision Department.
2
1. Introduction1
One of the most fascinating topics in contemporary economics concerns the role of
history. Is history important for the economic performance of countries and regions? Will the
effects of history ultimately fade out or will they constrain economies in the long run?
The new institutionalism view suggests that history is important because it shapes
institutions and institutions shape the economy. For instance, La Porta et al. (1999) argue
that being colonized by the British Empire rather than by other countries had a profound
effect on the legal system and through that on the economies concerned. Acemoglu et al.
(2001 and 2002) show that mortality rates among early European colonialists explain the
types of institutions adopted, which have persisted to the present. Thus, current differences
in development can be traced back to the colonial origins of the institutions. Banerjee and
Iyer (2005) show that differences in the institutions set up by the British to collect land
revenue in India lead to sustained differences in economic performance.
Although the economists’ emphasis has been so far on formal rules (see: La Porta et
al., 2008) the concept of institutions is wider. Institutions include both formal rules, such as
constitutions, laws, and property rights, and informal constraints, such as sanctions, taboos,
customs, traditions, and codes of conduct. For instance, North (1991: 97) defines
1 We are grateful to Luigi Cannari, Salvatore Chiri, Michela Dini, Alessio D’Ignazio, Gilles Duranton,
Stefano Iezzi, Marco Manacorda, Enzo Mingione, Massimo Omiccioli, Barbara Petrongolo, Steve Redding, Federico Signorini, Christine Stone, Renata Targetti Lenti, Nikolaus Wolf, two anonymous referees, and the Editor for suggestions and discussions. We also benefited from the comments of participants at the CEPR Conference “Integration and Technological Change: Challenges for European Regions”, Paris 2004, the Bank of Italy “Seminario di analisi economica territoriale”, Rome 2004, the EEA Conference, Madrid 2004, and the AIEL Conference, Modena 2004. We are deeply indebted to Luigi Guiso, Giordano Mion and Robert Putnam for kindly sharing with us their data. Previous versions of this paper circulated with the title “Putnam’s Social Capital and the Italian Regions: An Empirical Investigation” and “The Legacy of History for Economic Development: The case of Putnam’s Social Capital”. The views expressed herein are those of the authors and not necessarily those of the Bank of Italy.
3
institutions as “the humanly devised constraints that structure political, economic and social
interaction” and argues that informal constraints matter: “We need to know much more
about culturally derived norms of behavior and how they interact with formal rules to get
better answers (...). We are just beginning the serious study of institutions” (North, 1990:
140). Similarly, Glaeser et al. (2004) underscore that countries differ in their stocks of
human and social capital and institutional outcomes depend to a large extent on these
endowments.
In this paper, we attempt to investigate the importance of history for economic
performance by studying the role of informal constraints. We focus on one of the most
widely quoted instances of informal rules, namely the concept of social capital proposed by
Putnam (1993). This concept refers to trust, reciprocity, and habits of co-operation that are
shared among members of a local community. In Putnam’s words, it can be defined as the
cluster of “trust, norms and networks that can improve the efficiency of society” (Putnam,
1993: 167).2 Putnam’s theory can be summarized by two propositions. First, central and
northern Italy has developed faster than southern Italy because it was better endowed with
social capital. Second, the endowments of social capital across Italian regions have been
highly persistent over the centuries.3,4 In particular, it was the local political regimes in place
in the middle ages that shaped the degree of local civic commitment that persisted through
the centuries. By studying the importance of social capital for economic performance in the
context of the Italian regions, our study thus provides an empirical investigation of Putnam’s
2 Clearly, this is not the only possible meaning of the word, as the literature on the definitions of
social capital is voluminous. See, for a survey, Durlauf and Fafchamps (2006). 3 Note, however, that there is a contradiction between Putnam’s work on Italy and his later analysis
(“Bowling Alone: The Collapse and Revival of American Community,” 2000), as the first study suggests that social capital endowments are persistent over centuries, whereas the latter describes a major decline in social capital in the U.S. since 1950. 4 On very long run persistence see also Davis and Weinstein (2002).
4
theory.5
Besides its historical importance, focusing on the case of Italy also has additional
advantages. First, studying the variation of informal institutions within the same country,
under the same set of formal institutions, it enables us to assess the relative importance of
informal constraints versus formal rules (Diankov et al., 2003). Moreover, focusing on
within-country variations helps to avoid some of the omitted variable problems associated
with cross-countries studies (see, for instance, Temple, 2002). Finally, since we estimate
the effect of social capital by using a microeconomic unit of observation as the dependent
variable, the potential problem of reverse causality, which is prevalent in the empirical
literature on institutions and development, is minimized (see: Isham and Kaufman, 1999).
To evaluate the relevance of social capital, we start by regressing current economic
performance on current social capital. The latter is proxied by Putnam’s (1993) measure of
political participation, which refers to voter turnout in referenda. Our test is based on three
individual outcomes that are key for the underdevelopment of the south of Italy: labour
productivity, entrepreneurship, and female labour market participation. These activities
represent aspects of economic performance for which there are clear-cut theoretical
predictions as to the positive impact of social capital. For instance, low levels of labour
productivity in the south could depend on social norms that encourage shirking (Ichino and
Maggi, 2000). They could also reflect the impact of low social capital on the credit market
(Guiso et al., 2004), local government performance (Putnam, 1993), and the functioning of
the judiciary (World Bank, 2005). Similarly, low rates of entrepreneurship could be the result
5 The importance of informal constraints for the development of Italy was also underlined by Banfield
(1958) in The Moral Basis of a Backward Society. Supported by the results of in-the-field research on the residents of a small village near Potenza (fictionally called Montegrano), Banfield concludes that “extreme poverty and backwardness is to be explained largely … by the inability of the villagers to act together for their common good or, indeed, for any end transcending the immediate material interest of the nuclear family” (Banfield, 1958: 38).
5
of a culture that discourages risk-taking (Alesina et al., 2001). Linear regressions show that
there is some supportive evidence of a positive correlation between the endowments of
social capital at the local level and the three outcomes after controlling for individual and
local characteristics. However, there are a number of reasons for not interpreting linear
regression results as causal. There could be a substantial measurement error since the
social capital measure could correspond poorly with the social capital that matters in
practice. This would create attenuation bias. Moreover, there could be omitted geographical
characteristics along with endogeneity problems.
To solve these problems, we exploit Putnam’s conjecture on the origins of social
capital to derive a possible source of exogenous variation for current social capital.
We start by using the regional data on social capital collected by Putnam (1993) for
the period following the unification of Italy in 1870. These indicators refer to two aspects of
civic traditions, namely the turnout in the few relatively open elections before Fascism
brought authoritarian rule to Italy and the density of local associations. There is a strong
(first-stage) relationship between nineteenth-century variables and current social capital.
Our two-stage least squares estimates show that the component of social capital explained
by history is positively correlated with the three individual outcomes. The exclusion
restriction implied by our approach is that, conditional on the controls included in the
regression, the measures of social capital a hundred years ago have no effect on individual
economic outcomes today, other than through the persistence of social capital. We use
over-identification tests to detect whether this exclusion restriction is reasonable and find no
evidence for a direct effect of nineteenth-century social capital endowments on the three
individual outcomes. As to the economic magnitude, the role of social capital is large but not
implausible. Our estimates imply that moving from the average southern province to the
average province in the centre and north would increase labor productivity by 7 per cent,
6
the likelihood of becoming an entrepreneur by 3 per cent, and the probability of a woman of
participating in the labor market by 10 per cent. We also find that two-stage least squares
estimates are larger than those from linear regression. By using an alternative
contemporary measure of social capital as instrument we check whether the measurement
error in social capital is of the right order of magnitude to explain the difference between
linear and two-stage least squares results. We find that this is indeed the case.
Next, we use data on the local systems of government in early medieval Italy. This
amounts to pushing Putnam’s conjecture as far as it can go. Putnam (1993) argues that the
differences in social capital endowments today are plainly traceable from the systems of
government prevailing at the beginning of the fourteenth century.6 Local communities that
featured a higher degree of republicanism in middle ages turn out, at the end of the
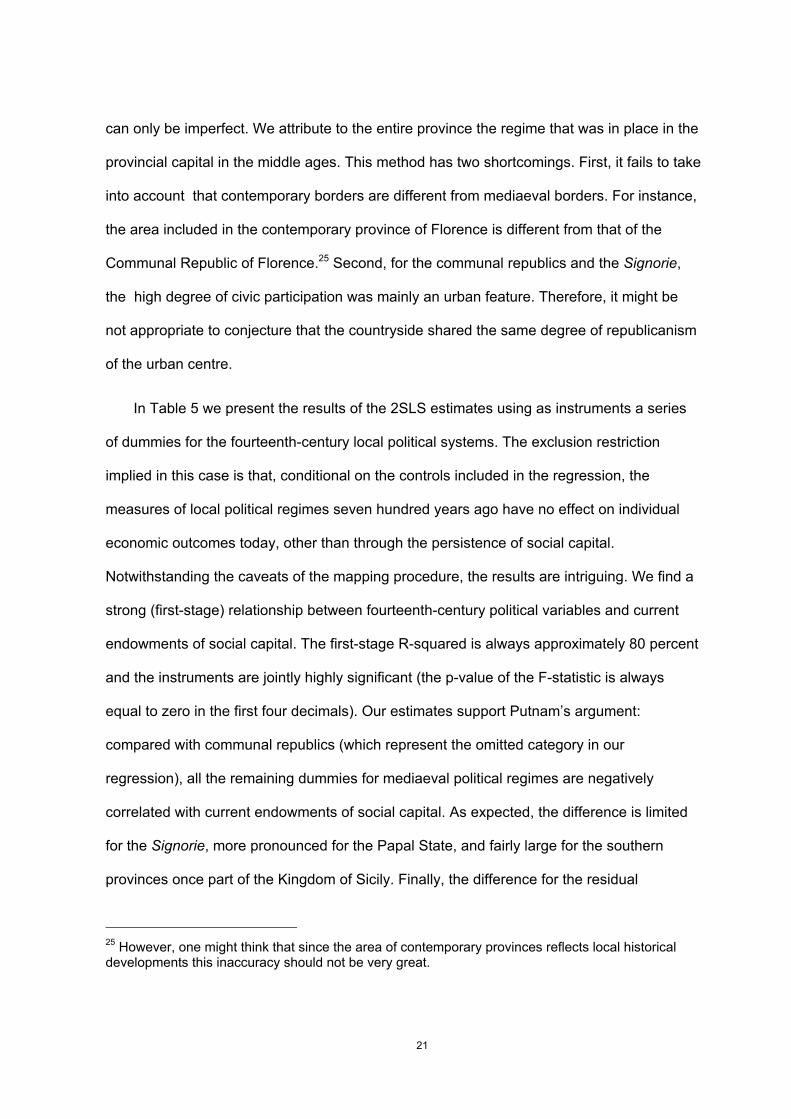
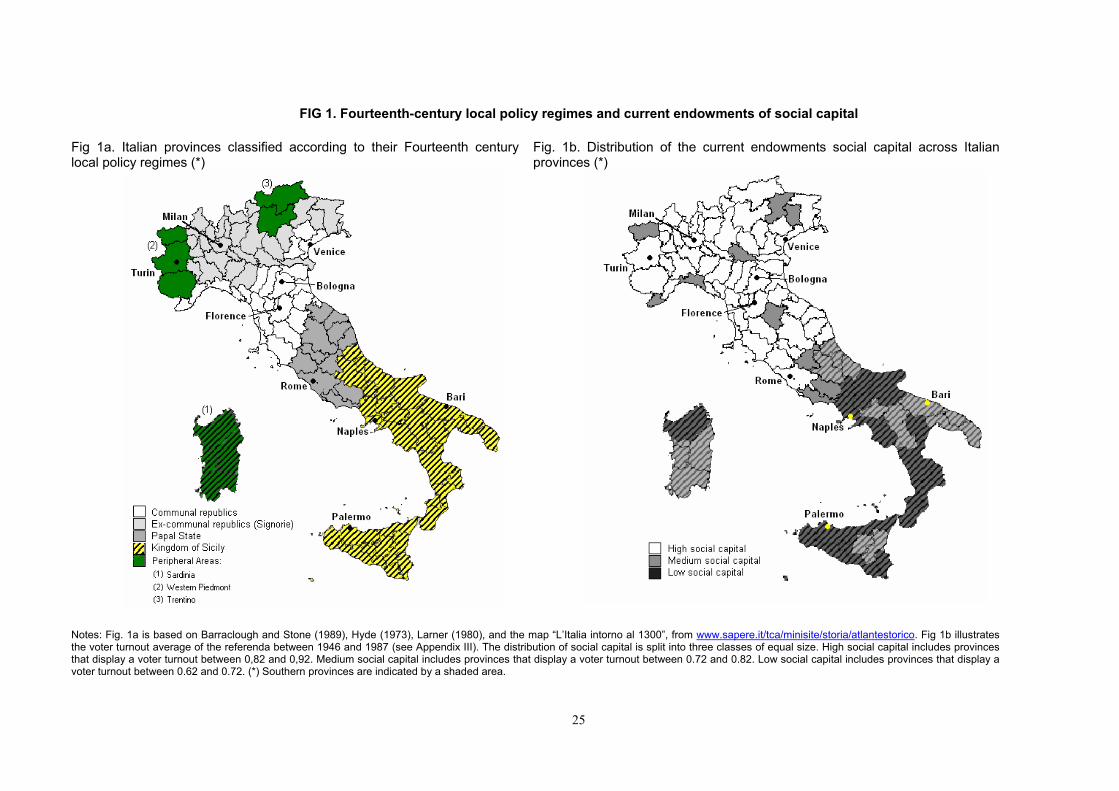
twentieth century, to be those most endowed with social capital. Figure 1 shows the
geography of the local political regimes in the fourteenth-century (Fig. 1a) and that of the
current endowments of social capital (Fig. 1b). We rely on historical sources to classify
today’s Italian provinces according to the political regimes prevailing at the beginning of the
fourteenth century (see, also, Appendix II). We identify four regimes, corresponding to
differing degrees of republicanism and autocracy: the communes, the heartland of
republicanism; the signorie, former communal republics fallen prey to signorial rule by the
beginning of the fourteenth century; the Papal State, characterized by a mixture of
feudalism, tyranny, and republicanism; and the Kingdom of Sicily, marked by the highest
degree of autocracy. In this case, the exclusion restriction implied by our approach is that,
conditional on the controls included in the regression, the measures of local political
regimes seven hundred years (!) ago have no effect on individual economic outcomes
6 This idea is echoed in the recent work of Acemoglu et al. (2008), which shows that current
disparities in development can be traced back to the fact that societies embarked on divergent development paths at certain critical junctures during the past centuries.

7
today, other than through social capital persistence. While the results of this experiment
should be viewed with caution because the mapping of contemporary Italian provinces into
mediaeval areas can only be imperfect, the results are encouraging. We find a strong (first-
stage) relationship between fourteenth-century political variables and current endowments
of social capital. Our two-stage least squares estimates show that the component of social
capital explained by mediaeval local political systems is positively correlated with
entrepreneurship and female labor market participation. However, as to the effect on worker
productivity, the over-identification test does not allow us to reach a conclusion.
Empirically, our work is linked to a number of other attempts to uncover the economic
relevance of social capital for local development in Italy. Putnam himself, jointly with
Helliwell, provided a first empirical investigation in 1995. Using cross-region growth
regressions, they show that income convergence is faster for regions with relatively high
levels of social capital. However, aggregate data might suffer from substantial
shortcomings: the extent of trust may be correlated with other aspects of the regions that
are omitted from the growth regressions (see also Durlauf and Fafchamps, 2006). In an
attempt to provide more informative empirical work, recent papers have shifted to micro
data. Ichino and Maggi (2000) use individual data on absenteeism and misconduct
episodes for a single Italian bank and conclude that workers born in the south are more
likely to behave dishonestly. Even though they do not use any measure of social capital,
they explicitly refer to Putnam’s thesis to justify their results. Guiso et al. (2004) use
household micro data to show that measures of civic engagement help explain the variation
in financial practices across Italian regions. Similarly to Ichino and Maggi (2000) and Guiso
et al. (2004), this paper studies the impact of social capital by using micro data. However, in
contrast with Ichino and Maggi (2000), we use data that are representative of the Italian
population at large; and unlike Guiso et al. (2004) we look at the real and not the financial
effects of social capital. Crucially, in contrast with all previous studies we refer to historical

8
traditions of civicness to identify a source of exogenous variation in social capital.
The paper is structured as follows. Section 2 motivates the use of our dependent
variable, describes the data, and presents linear regression estimates of individual
economic outcomes on social capital. Section 3 explains the two-stage least squares
results. Section 4 concludes.
2. The Effect of Social Capital: OLS and LPM Estimates
2.1 Dependent Variables
Our aim is to understand whether social capital makes a difference in explaining the
varying prosperity of areas of Italy. At the same time, we hope to shed some light on the
mechanisms through which social capital affects economic performance. We focus on three
main aspects (the dependent variables in our investigation): worker productivity,
entrepreneurship, and female participation in the labor market. These aspects provide a
natural and attractive territory to analyze the effects of social capital on economic activity.
First, for each of them there are clear-cut theoretical predictions as to the positive impact of
social capital.7 Second, they represent some of the key features of Italy’s dual development
process.
In Italy, geographical divergences in workers’ productivity are pronounced. While
nation-wide labour productivity is not far from the OECD average (see, for example, IMF,
2002), the gap in the south is about 20 per cent (see: Mauro et al., 1999).8 We estimate the
7 As recognized by Arrow (1972: 357): “Virtually every commercial transaction has within itself an
element of trust, certainly any transaction conducted over a period of time. It can be plausibly argued that much of the economic backwardness in the world can be explained by the lack of mutual confidence”. 8 See also Castronuovo (1992). According to Chiades et al. (2000) and Aiello and Scoppa (2001) this

9
effect of social capital on individual productivity by exploiting a Mincerian wage-equation
augmented with a local social capital term. Our specification accommodates a number of
potential explanations. In this vein, a reduced labour productivity could be due to social
norms that encourage shirking (Ichino and Maggi, 2000). Moreover, it could reflect the
impact of low social capital on the credit market (Guiso et al., 2004), the performance of
local government (Putnam, 1993), and the functioning of the judiciary (World Bank, 2005).
Additionally, the higher reliance on personal networking in job search in low-trust areas may
help to damp down wages (see: Pistaferri, 1999).
The Italian economy relies more than those of other OECD countries on small
business activity.9 The distribution of firms across regions is far from uniform: Italian firms
are concentrated in the centre and north of Italy. Again, a lack of trust can adversely affect
entrepreneurship through a number of channels. While it is not easy to overstate the role of
the credit market, local government and the judiciary, there may be also additional
channels. To the extent that social capital promotes a better protection of property rights
and deters crime, it stimulates business initiatives (Mauro, 1995 and Hall and Jones, 1999).
According to Alesina et al. (2001), the south of Italy is an area where the prevailing “culture”
discourages private activity and entrepreneurship.
Female non-participation is essentially a southern issue: the participation rate for
southern women is 35 per cent, more than 15 percentage points below the average for the
north and less than half that for men in the south. Low-trust communities have social norms
against working women. According to Putnam (1993: 175), in the south of Italy the
pervasiveness of strong family ties comes at the expense of the networks of civic
engagement that feature in the northern regions. In these traditional families, the concept of
figure could well be on the conservative side. 9 According to Eurostat, in 2000 the average firm size in Italy was equal to 3.6 employees,

10
a male breadwinner prevails. This echoes Banfield’s amoral familism archetype: in daily life
in Montegrano there was little room for women to entertain professional aspirations beyond
housekeeping, child-care, and, if necessary, making a heavy contribution to the family farm.
The importance of cultural factors in explaining the gender gap in labour force participation
has recently been highlighted by Antecol (2000); while Algan and Cahuc (2003) study the
impact of religion, perhaps a peculiar type of informal norm, on female participation.
2.2 Data and Descriptive Statistics
Our main data source is the Survey of Household Income and Wealth (SHIW). This
survey is conducted every two years by the Bank of Italy on a representative sample of
about 8,000 households (see Brandolini and Cannari, 1994, for details). The SHIW collects
individual data on demographics and economic behavior, such as age, sex, marital status,
number of children, wages, work status, schooling, work experience, branch of activity,
household net wealth. The confidential version of the SHIW we use makes available data
on the province of residence. This information allows us to augment our individual-data
regressions with the variables defined at local level, such as social capital. Since 1993 the
survey has maintained the same structure; to obtain a sizable dataset we pool data from
four waves (1993, 1995, 1998, 2000).
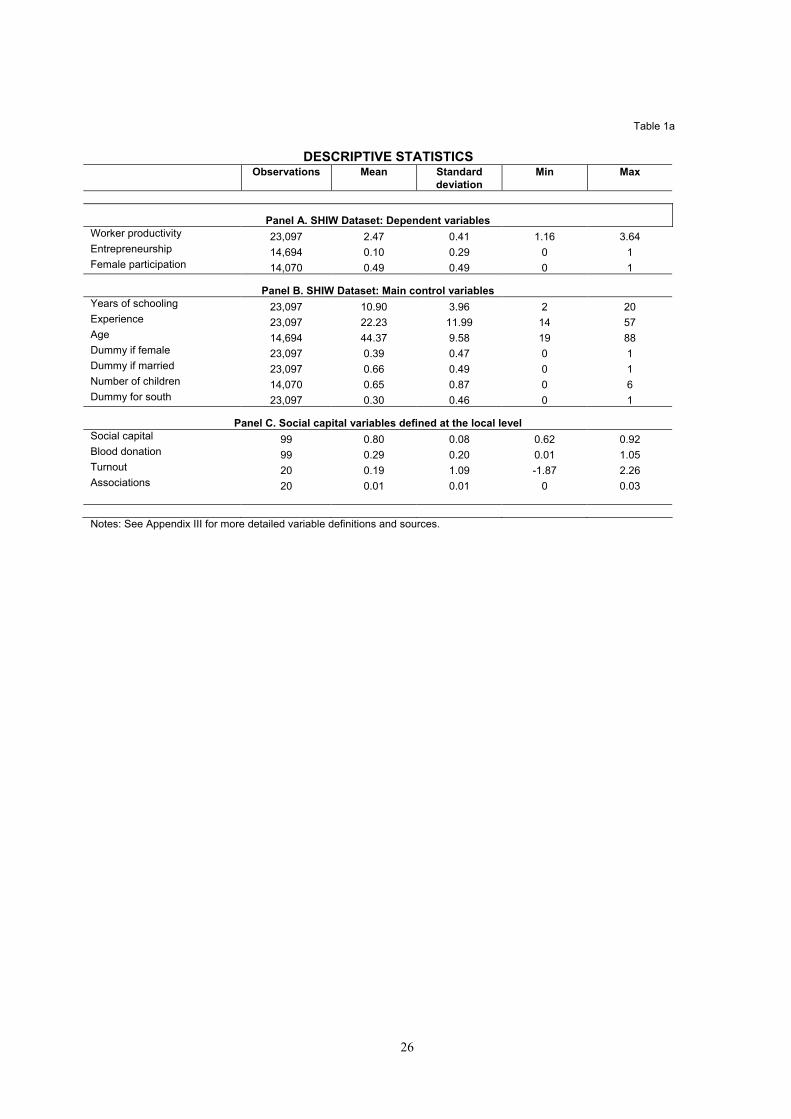
Table 1a reports summary statistics for the variables used throughout the paper.
Panel A in Table 1a describes the three individual economic outcomes that are the
dependent variables in our regressions. Worker productivity is measured by the log of
hourly wages for a sample of 23,097 employees. Entrepreneurship is an indicator variable
equal to one if the individual is the sole proprietor of a business, member of a family
business, or active shareholder/partner, for a sample of 14,694 household heads. Female
representing the smallest size among European countries.
11
participation is an indicator variable for working-age women employed or actively looking for
work (the female sample includes 14,070 observations). Appendix III provides a detailed
description of each variable. Panel B in Table 1a provides descriptive statistics for the main
SHIW control variables used in the paper.
Panel C in Table 1a describes the measures of social capital, which are defined at the
local level. Table 1b presents their correlation matrix. Our (main) measure of social capital
is the average provincial electoral referenda turnout for the six referenda held before the
1990s. Each referendum invited citizens to express their views on a controversial issue: the
choice between republic and monarchy (1946); the legalization of divorce (1974) and
abortion (1981), hunting (1987); the use of nuclear power (1987); the scope of public
security regulations (1978, 1981). As explained by Putnam (1993: 93-94), referendum
turnout captures well civic engagement: “the primary motivation of the referendum voter is
concern for public issues” (Putnam, 1993: 93). In particular, there are two reasons to prefer
referendum turnout to general election turnout. First, in Italy until recent years it was a legal
duty to participate in general elections but not in referenda. Thus, very likely many Italians
went to the polls irrespective of their sense of civic duty. Second, voting in general elections
can lead to personal patronage benefits. It might be an opportunity to obtain immediate
personal benefits; that is, an “exchange” and not a measure of civic involvement. In this
paper, we use the measure of referenda turnout calculated at the provincial level by Guiso
et al. (2004). Referendum turnout captures well north-south differences: the average
referendum turnout amounts to 85.5 per cent in the 59 central and northern provinces and
72.7 per cent in the 40 southern provinces.10
10
Because of data availability (see Appendix III), our sample includes 99 of the 103 provinces that span the national territory.

12
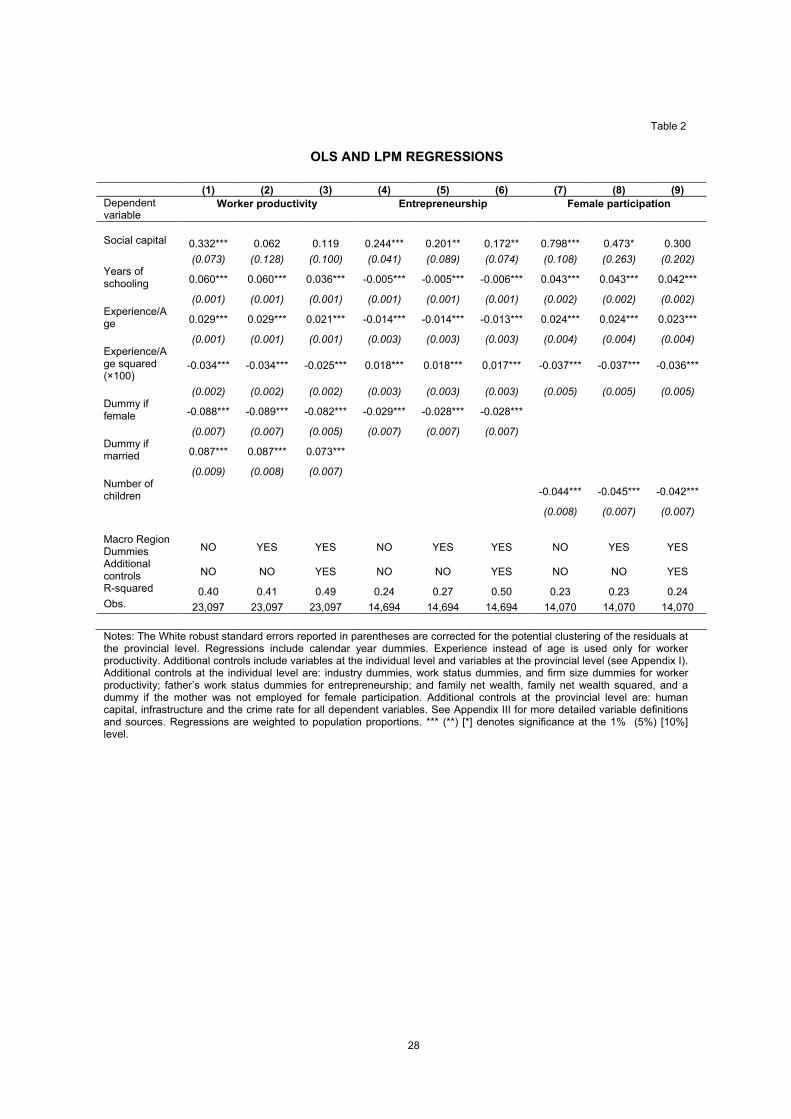
2.3 Ordinary Least Squares and Linear Probability Model Regressions
Table 2 reports ordinary least squares (OLS) and linear probability model (LPM)
regressions for the three individual economic activities. We will investigate the role of social
capital by running regressions of the form:
(1) yipt = constant + αt + β SCp + Xit γ + Zp δ + εipt
where yipt is our outcome of interest for individual i in province p and year t, αt is a year fixed
effect, SCp is the measure of social capital in province p, Xit are control variables defined at
the individual level, and Zp are control variables defined at the local level. The coefficient of
interest throughout the paper is β, the effect of social capital on economic outcomes. Note
that we do not include province fixed effects, since SCp is fixed for province p over time.
However, we do adjust our standard errors for within-province correlation (see: Moulton,
1990).
For each dependent variable, the first column shows the results obtained by regressing
it on social capital, a minimal set of individual controls (age or experience, years of
schooling, sex, marital status, number of children), and the year fixed effects. Social capital
enters significantly and with the expected positive sign for all the three economic
activities.11
Clearly, these results are hardly convincing. While high-trust areas are almost
exclusively located in the centre and north of the country, this area differs from the less-
developed south in many respects, such as geography, infrastructure, access to markets,
etc. Moreover, there can be differences also across the more-developed areas. For
11 As for the individual controls, they enter with a similar sign and statistical significance to that found
in the previous literature. See, for instance, Dalmazzo and de Blasio (2006) and Colussi (1997) on worker productivity; Barca and Cannari (1997) and Alesina et al. (2001) on entrepreneurship; del Boca et al. (2000) on female participation.

13
instance, the north-west is featured by large-size manufacturing, while in the centre and the
north-east industrial clusters of medium and small enterprises predominates. Thus, social
capital can pick up differences among areas that just happen to be correlated with it. To
correct for this, we introduce in the second column for each dependent variable a series of
dummies to control for individuals residing in the 5 macro regions of the country. The
consequences of this inclusion are noticeable. The role of social capital is now reduced not
statistically different from zero for worker productivity, while the effect on entrepreneurship
and female participation is reduced by 20 and 40 percent, respectively.
Next, we control our results with respect to the inclusion of additional variables
measured both at the individual level and the local level (third column for each dependent
variable). The variables at they individual level are also from the SHIW dataset. Regarding
the controls to be included, we basically follow the previous literature.12 At the local level,
we include controls for human capital, infrastructures, and crime. Point estimates and
standard errors for the additional controls are reported in Appendix I.13 The inclusion of the
additional controls reduces the effect of social capital for both entrepreneurship and female
participation while increases that for worker productivity.
There are, however, a number of important reasons for not interpreting the results in
Table 2 as causal. First, the social capital variable could be measured with error and, more
12 For worker productivity, we include the branch of activity and the size of the firm for which the
individual works as well as the employee’s work status. These controls are intended to take care of industry, status and firm-size differentials, which are substantial in the case of Italy (see, for instance, Mauro et al., 1999, Cannari and D’Alessio, 1995, and Colussi, 1997). Controls for the father’s work status are included in the equation for entrepreneurship, as in Alesina et al. (2001). This captures the strong intergenerational links that characterize occupational choices in Italy (see also Checchi et al., 1999). Following Altonji and Blank (1999), we introduce the familiar net wealth (and its square) along with a dummy that takes on the value of one if the mother is not employed in the specification for female participation (see also Algan and Cahuc, 2003). See Appendix I and Appendix III for details. 13
For the sake of brevity, we report only a selection of the robustness tests performed. For instance, we included the local female unemployment rate in the equation for female participation and a measure of local financial development in the equation for entrepreneurship. Our results were suitably confirmed.

14
importantly, it could correspond poorly with the true social capital that matters in practice.
This creates attenuation and may bias the linear estimates downwards. Second, rich areas
may be able to afford or prefer greater sense of civic duty. This reverse causality problem
introduces positive bias in the linear estimates.14 Third, there are many omitted
determinants of individual outcomes that will naturally be correlated with social capital. The
omitted variable inconsistency also generates an upward bias. All of these problems could
be solved if we had an instrument for social capital. Such an instrument must be an
important factor in accounting for the variation in social capital that we observe, but have no
direct effect on individual economic performance.
3. The Effect of Social Capital: IV Results
3.1 The Historical Origins of Social Capital
Putnam traces the roots of civic community from the middle ages. At that time, the
Italian peninsula had four different systems of government, corresponding to differing
degrees of republicanism and autocracy. First, in northern and central Italy there was a form
of self-government, known as communal republicanism, based on horizontal collaboration
among citizens. As Hyde (1973: 57) puts it, “communes …were primarily concerned with
the protection of their members and their common interests”. Political participation was high:
“men were able to take part in determining, largely by persuasion, the laws and decisions
governing their lives” (Lane, 1966: 535). Second, farther north there were the erstwhile
republican areas that by 1300 were ruled by the Signori and in which mediaeval republican
14 As underscored by Isham and Kaufman (1999), by using a microeconomic unit of observation as
dependent variable, the scope for endogeneity is minimized. However, even with micro data, if higher-ability people and entrepreneurs are self-sorting to live in the regions with greater social capital, we might be overstating social capital’s positive effects.
15
tradition had proved somewhat weaker. Third, the regions surrounding Rome were part of
the Papal State, characterized by a mixture of feudalism, tyranny and republicanism.
Finally, the southern territory belonged to the Kingdom of Sicily, the most autocratic regime.
Of course, the Norman regime in the south was exceptionally advanced, both economically
and administratively,15 but the social and political arrangements were those of an despotic
government: barons had full feudal rights, ruler’s decision could not be questioned, and a
network of central and local officials answering only to the king was in power in the towns.16
In Putnam’s view, the local political regimes in place in the middle ages shaped the
degree of local civic commitment that persisted throughout the centuries.17 In Section 3.4,
we illustrate an experiment that exploits mediaeval local political regimes as a source of
exogenous variation for social capital. In Section 3.2 we focus on the period at the end of
the nineteenth century. The time after the unification of Italy was one of great ferment in
community life. Stimulated by similar trends in the rest of Europe, there was a surge in
social solidarity that promoted the “principle of association”. Associations and mutual aid
societies developed, which provided on a voluntary basis a wide range of social benefits to
their members (unemployment benefits, medical and life insurance, school financing etc.).
The period also saw the birth of mass political movements, socialist or catholic. We rely on
two regional measures of civic traditions collected by Putnam (1993: 148-151): the turnout
15 For instance, the first codification of administrative law (1231) and the foundation of the first state
university (1224) in Europe took place under Frederick II. It should also mentioned that the kingdom of Frederick II was characterized by great religious tolerance, as Roman catholic, Jews and Arabs lived and worked together in a reasonably peaceful way. 16
See also the De Long and Shleifer (1993) classification of western government, according to which Frederick II’s regime falls into the absolutist category, while the Venetian and Florentine republics are the best examples of city-state based non-absolutist government. 17
According to Putnam, despotism survived until Frederick’s death: “Although southern Italy in the next seven centuries was to be the subject of much bitter contention between various foreign dynasties (especially Spain and France), [the] hierarchic structure would endure essentially unchanged” (Putnam, 1993: 124). On the other hand, “despite the eclipse of communal republicanism … after the fourteenth century, in the nineteenth century … [one] could detect the continuing regional differences of culture and social structure that had appeared in the medieval era
16
in the few relatively open elections before Fascism brought authoritarian rule to Italy and the
density of local associations. These variables are the measures we use to find a source of
exogenous variation for social capital. As for the persistence of social capital, two features
of these variables should be noted. First, the measures are correlated with the local system
of government in place in the middle ages (see Section 3.4). Second, they represent
significant determinants of the average provincial electoral referendum turnout, which is our
measure of current social capital. This last relationship will represent the first stage in our
instrumental variable approach.
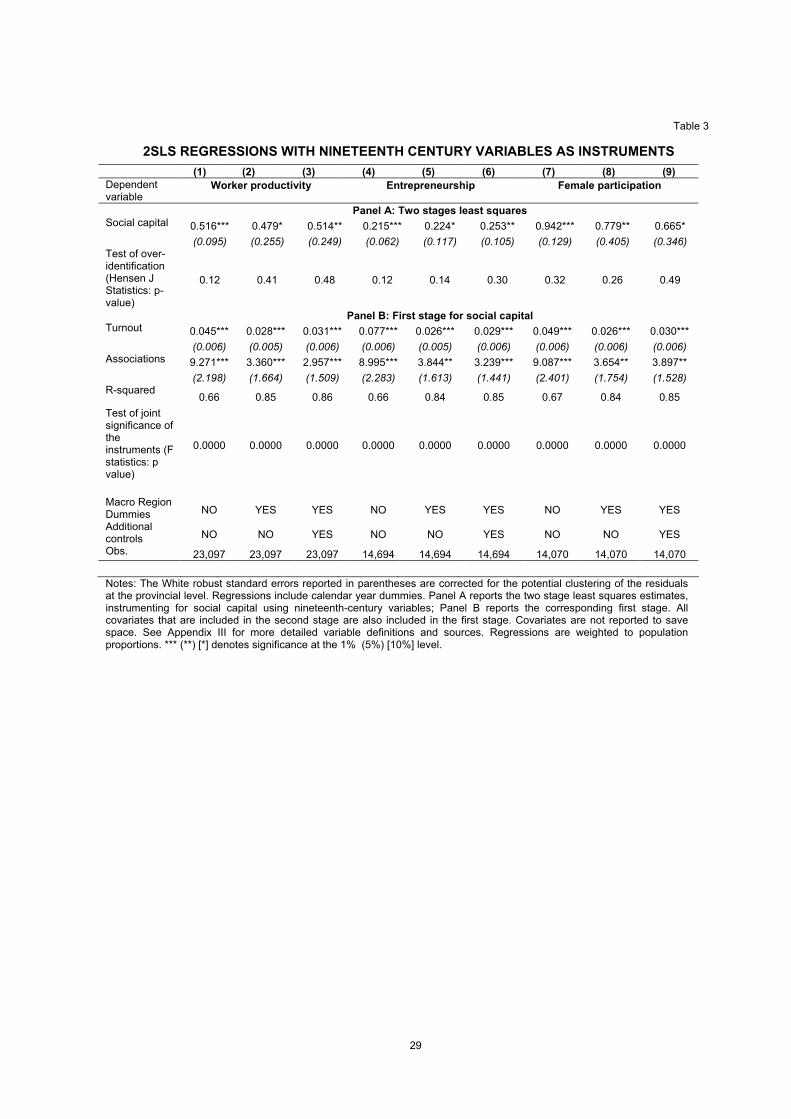
3.2 2SLS Results with Nineteenth-Century Instruments
Two-stage least squares (2SLS) estimates of equation (1) are presented in Table 3.
Social capital, SCp, is treated as endogenous, and instrumented by the nineteenth-century
variables. The identification assumption implied by our approach is that, conditional on the
controls included in the regression, the measures of social capital a hundred years ago
have no effect on individual economic outcomes today, other than through the persistence
of social capital. Panel A of Table 3 reports 2SLS estimates of the coefficient of interest, β
from equation (1), and Panel B gives the corresponding first stages.
For each dependent variable, the specifications used in Table 3 replicate those
illustrated in Table 2.18 All covariates that are included in the second stage (age or
experience, years of schooling, sex, marital status, number of children, macro region
dummies, and additional controls) are also included in the first stage. Covariates, however,
seven centuries earlier” (Putnam, 1993: 136). 18
Again, standard errors are clustered at the province level. However, since the nineteenth-century measures of social capital are available at the regional level, we also computed standard error corrected for within-region correlation with no modification of our results.

17
are not reported to save space.19 For any of the three individual economic outcomes, there
is a strong first-stage relationship between nineteenth-century variables and social capital.
The first-stage R-squared is between 66 and 86 per cent and the instruments are jointly
highly significant (the p-value of the F-statistic is always equal to zero in the first four
decimals).20 Turning to the 2SLS estimates, with the exception of entrepreneurship, all the
IV coefficients are considerably larger than their OLS and LPM counterparts. This suggests
that measurement error in the social capital variable that creates attenuation bias is likely to
be more important than reverse causality and omitted variable biases. The standard errors
for the IV estimates are also larger than the Table 2 counterparts, but social capital still
enters at a reasonable levels of statistical significance.
We also investigate the validity of our exclusion restriction by using over-identification
tests (see Wooldridge, 2002, for general reference and Acemoglu et al., 2001, for the use of
this test in a context very similar to ours). The over-identification test presumes that one of
the instruments, say turnout, is truly exogenous, and tests for the exogeneity of the other,
associations in our case. The over-identification test will reject the validity of our approach if
at least one of the instruments has a direct effect on the dependent variable (i.e. one of the
instruments is correlated with the error term in equation 1).21 However, since this test may
19 In a specification similar to those in Columns (3), (6) and (9), Tabellini (2008) included also nineteenth-century population density to proxy for the economic development of the local area at about the same point in time as the historical instrument for social capital (see also Acemoglu et al., 2002). According to Tabellini (2008), this inclusion helps to minimize the risk that the component of social capital explained by history is indeed capturing standard neoclassical convergence. We controlled the robustness of our results with regard to the inclusion of this variable in both Table 3 and Table 5. Results (available upon request) are very similar to those reported in the text. 20
To check for the potential bias caused by many weakly correlated instruments we also estimate the same equations using a single instrument, the first principal component from the two nineteenth-century variables. The results are very similar to the IV estimates using the two instruments together (but slightly less precise since they use less variation). 21
Another cause for rejection could be that the coefficient for social capital in equation (1) is not constant. Indeed, In the general case of heterogeneous effects (see: Angrist, Imbens and Rubin,
1996), the β estimated by IV represents the effect on the sub-population of compliers; that is those individuals for the which the specific instrument used affects their economic outcomes. This
18
not lead to a rejection if all instruments are invalid but still highly correlated with each other,
the results have to be interpreted with caution.22 As can be seen from the reported Hensen
J-statistic p-values in Table 3, the data support the over-identifying restriction implied by our
approach. There is no evidence that nineteenth-century variables have a direct effect – or
an effect working through a variable other than social capital – on the three individual
economic activities.
Do the 2SLS estimates imply that social capital can explain a significant fraction of the
variability of the individual outcomes? Our estimates of Table 3 imply that social capital has
a large but not implausible effect. According to our results, moving from the average
southern province to the average northern province would have large effects on economic
activity. It would increase labor productivity by 7 percentage points, increase the probability
of being an entrepreneur by 3 percentage points, and increase the probability for a woman
of participating in the labor market by 10 percentage points23.
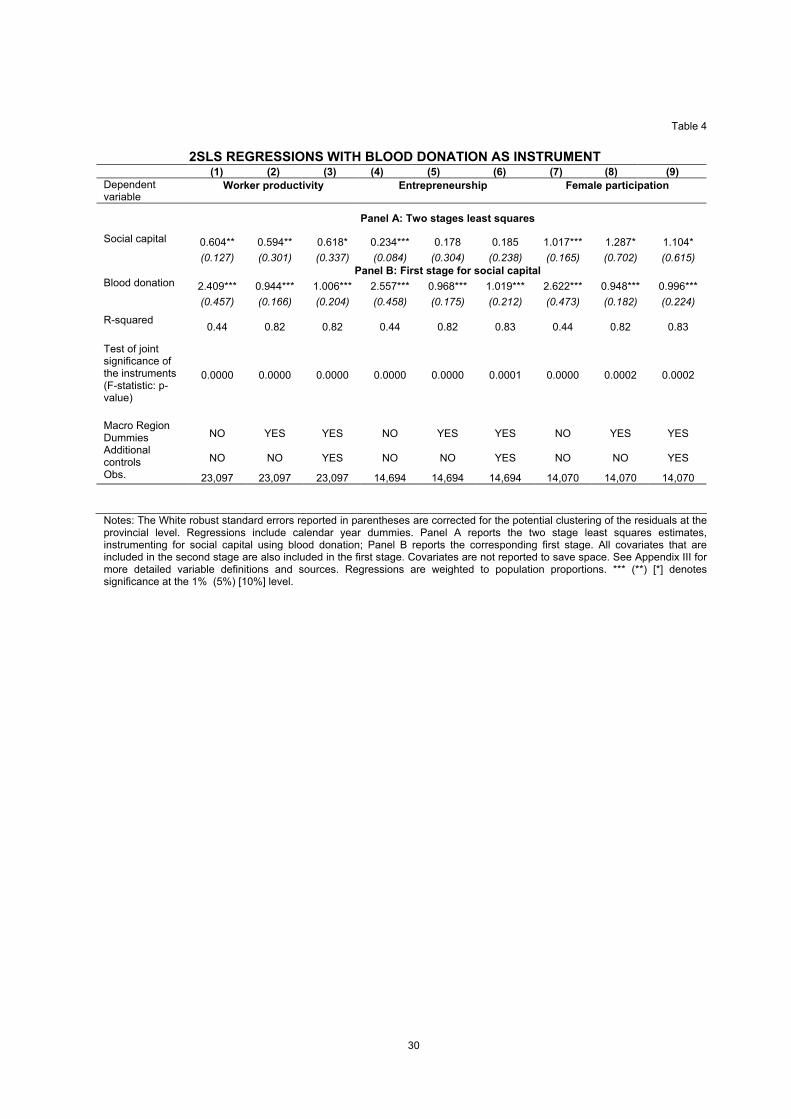
3.3 2SLS Results with Contemporary Instruments
We can check whether the difference between the OLS/LPM results and the 2SLS is
due to measurement error in the social capital variable by making use of alternative
contemporary measures of social capital. As explained by Wooldridge (2002), using these
measures as instruments for the referendum turnout would resolve the measurement error,
might explain also the instability of the IV estimates across instruments. 22
It could also be that the test has low power to detect endogeneity of some of the instruments (Wooldridge, 2002). 23
On the size of the coefficient for female participation, it should be noted that in Italy there exists an important unofficial/illegal economy. Therefore, it might be the case that some SHIW respondents, who answered that they have no job and are not looking for one, do actually hold an unofficial job. Since unofficial jobs are overrepresented in the South, this might imply that the coefficient on social capital is upwardly biased. It should also be noted, however, that the SHIW preserves confidentiality and cannot be used for any legal purpose. As respondents are aware of the privacy policy, it seems unlikely that underreporting represents a major issue.
19
but not the endogeneity/omitted variable problem. Our previous results for worker
productivity and female participation suggest that the difference between OLS/LPM and
2SLS results is driven by the attenuation bias. If this is the case, then the 2SLS results
obtained by using contemporary instruments should be higher than those obtained by using
the nineteenth-century instruments. On the other hand, 2SLS estimates for
entrepreneurship are roughly in line with those from linear regression, suggesting that the
net bias from omitted variable, endogeneity and measurement is of limited magnitude. So
we would expect that instrumenting with contemporary alternative measures of social
capital will deliver estimates that are once again in the same range.24
To carry out this exercise we make use of an additional measure of social capital: blood
donation. The variable denotes the number of (16 oz) blood bags collected (per 1,000
inhabitants) in 1995 by AVIS, the Italian association of voluntary blood donors. Blood
donation, which aims to capture solidarity and altruism, also comes from Guiso et al. (2004).
As they explain, blood collection by AVIS is very representative of the whole of blood
donations in the country and it is not affected by the geographical differences in the quality
of medical infrastructures.
Table 4 shows the results of the 2SLS estimates using blood donation as instrument for
social capital. As expected, this alternative measure of social capital is highly correlated
with referendum turnout. The first-stage R-squared ranges between 44 and 83 per cent.
For both worker productivity and female participation, the estimates of social capital are
always of the right order of magnitude to explain the difference between the OLS/LPM
estimates of Table 2 and the 2SLS estimates of Table 3. They are higher than the estimates
obtained by using the nineteenth-century instruments. This supports the idea that OLS/LPM
24 In principle it is also possible that a large endogeneity bias is offset by a large measurement error.
We show that this is not the case, as it would result in contemporary instruments 2SLS estimates

20
estimates are downward biased because of measurement error, while endogeneity/omitted
variable positive biases play a minor role. In contrast, the estimates for entrepreneurship
are not higher than those from linear regression and nineteenth-century instrument 2SLS.
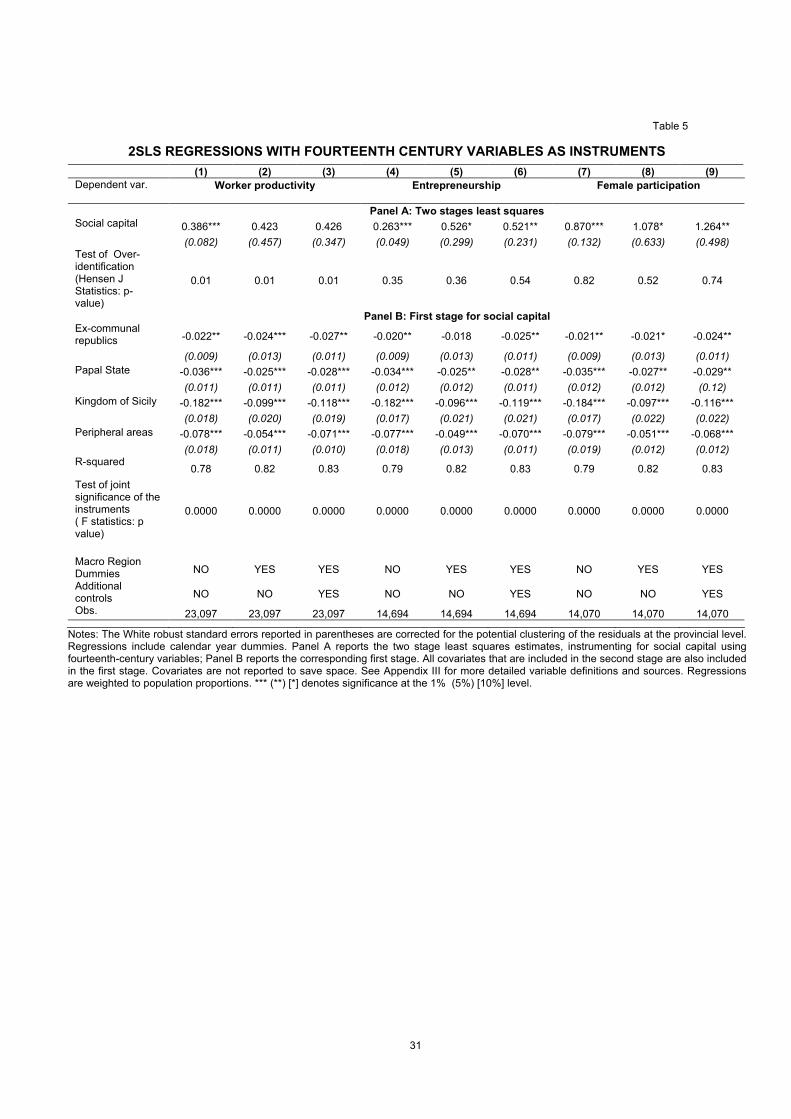
3.4 2SLS Results with Fourteenth-Century Instruments
In this section we use data on the local systems of government in early mediaeval Italy
This amounts to pushing Putnam’s conjecture as far as it can go. We rely on historical
sources to classify today’s Italian provinces according to the political regimes prevailing at
the beginning of the fourteenth century. We use the historical sources quoted by Putnam
(1993: 134): Barraclough and Stone (1989), Hyde (1973), and Larner (1980). In addition, we
use the map “L’Italia intorno al 1300” made available by an online provider of historical
maps (www.sapere.it/tca/minisite/storia/atlantestorico).
We are able to classify contemporary Italian provinces in 5 groups: (1) the communal
republics, the heartland of republicanism; (2) the Signorie, former communal republics fallen
prey to signorial rule by the beginning of the fourteenth century; (3) the Papal State,
characterized by a mixture of feudalism, tyranny and republicanism; and (4) the Kingdom of
Sicily, which had the highest degree of autocracy. We also add a residual category for the
current areas of Italy that were peripheral areas and, at the beginning of the fourteenth
century, politically closer to foreign nations than to Italian local states. In this vein, the
residual category includes Sardinia, Western Piedmont and Trentino, which at that time
were closer to Spain, France and Germany, respectively (see Figure 1). Appendix II lists the
current Italian provinces classified according their fourteenth century political regime.
We note that the mapping of contemporary Italian provinces into mediaeval territories
being higher than those from nineteenth-century instrument 2SLS.
21
can only be imperfect. We attribute to the entire province the regime that was in place in the
provincial capital in the middle ages. This method has two shortcomings. First, it fails to take
into account that contemporary borders are different from mediaeval borders. For instance,
the area included in the contemporary province of Florence is different from that of the
Communal Republic of Florence.25 Second, for the communal republics and the Signorie,
the high degree of civic participation was mainly an urban feature. Therefore, it might be
not appropriate to conjecture that the countryside shared the same degree of republicanism
of the urban centre.
In Table 5 we present the results of the 2SLS estimates using as instruments a series
of dummies for the fourteenth-century local political systems. The exclusion restriction
implied in this case is that, conditional on the controls included in the regression, the
measures of local political regimes seven hundred years ago have no effect on individual
economic outcomes today, other than through the persistence of social capital.
Notwithstanding the caveats of the mapping procedure, the results are intriguing. We find a
strong (first-stage) relationship between fourteenth-century political variables and current
endowments of social capital. The first-stage R-squared is always approximately 80 percent
and the instruments are jointly highly significant (the p-value of the F-statistic is always
equal to zero in the first four decimals). Our estimates support Putnam’s argument:
compared with communal republics (which represent the omitted category in our
regression), all the remaining dummies for mediaeval political regimes are negatively
correlated with current endowments of social capital. As expected, the difference is limited
for the Signorie, more pronounced for the Papal State, and fairly large for the southern
provinces once part of the Kingdom of Sicily. Finally, the difference for the residual
25 However, one might think that since the area of contemporary provinces reflects local historical
developments this inaccuracy should not be very great.

22
peripheral areas is at an intermediate level. Our 2SLS estimates show that the component
of social capital explained by mediaeval local political systems is positively correlated with
entrepreneurship and female participation. Compared with the 2SLS results with nineteenth-
century variable as instruments, the point estimates are somewhat higher for both
dependent variables; while the over-identification tests support the validity of our exclusion
restriction. As to the effect on worker productivity, our results are inconclusive. The over-
identification tests do not allow us to find any support for causality running from the local
endowments of social capital to wages.
4. Concluding Remarks
When Robert Putnam published “Making Democracy Work” in 1993, scholars and
observers immediately ranked the book as a major step forward. According to The
Economist, the book was a “great work of social science…alongside de Tocqueville, Pareto
and Weber”.26 After more than ten years, one can safely say that the assessment by The
Economist was by no means overstated. A stream of research has originated from
Putnam’s book: social capital now represents one of the most popular metaphors in current
social science research. Beyond making the case for social capital, “Making Democracy
Work” provides also a more subtle contribution. As Durlauf and Fafchamps (2006)
recognize, the task of estimating the effect of social capital on economic performance relies
critically on the possibility of isolating exogenous sources of variation in social capital. In
other words, because the problem of endogeneity is endemic, it is very difficult to make the
point that social capital is relevant if no explanation is offered for what determines social
capital. From this perspective, Putnam’s book made a seminal contribution because, in
addition to popularizing the concept of informal norms, it provided a theory of the

23
determinants of social capital.
In this paper we exploit Putnam’s theory on the historical origins of social capital to
identify a source of exogenous differences in social capital. It is useful to point out that
these results do not imply that informal norms today are predetermined by the mediaeval
political experience and cannot be changed. Indeed, for our empirical approach to work, we
do not need past social capital to be the only, or even the main, cause of variation in social
capital. All we need is for it to be a source of exogenous variation.
We estimate large effects of social capital on individual economic performances using
the historical data on the origin of social capital as the source of variation. We also
document that this relationship is robust to a number of econometric checks and controls for
environmental and individual variables that might be correlated with social capital. Our
exclusion restriction implies that, conditional on the controls included in the regression, the
historical variables have no effect on individual economic outcomes today, other than
through social capital persistence. The plausibility of our identification strategy is open to
debate. Our exclusion restriction would be weakened if historical social capital depended in
a systematic way on other characteristics of the local area. Putnam (1993) argues that this
does not seem to be the case, since civic differences between Italian regions have been far
more stable than economic differences over almost a millennium. In the paper, we show
that econometric tests do not enable us to reject the exclusion restriction.
Still, questions remain. It remains to be uncovered why social capital impacts on
development in some periods but not in others. For instance, the north-south economic gap
reversed its direction in several periods. The Norman kingdom was almost as advanced as
the north but then the development of communal republicanism stimulated the northern
26 This is reported on the cover of Putnam’s book.
24
economy; then, because of external shocks, the supremacy of the north disappeared again
in the fifteenth century. For the period after unification to which our data refers, there was no
correlation between social capital and the economic well-being of the regions. Then, in the
second half of the twentieth century social capital became a powerful source of economic
prosperity. On these matters, North (1990) suggests that as a market economy develops
the scope for social capital to reduce transaction cost increases, since greater specialization
increases the number of transitions between strangers both over time and across space. On
related grounds, differences in social capital endowments could matter more when new
technologies that require investments from a broad cross-section of the society become
available, along the lines proposed by Acemoglu et al. (2002).
As pointed out by North (1991), the question of the respective roles of informal
constraints and formal rules remains crucial to uncover the role of history in economic
performance: “What is it about informal constraints that gives (the institutions) such a
pervasive influence upon the long-run character of the economy? What is the relationship
between formal and informal constraints? How does an economy develop the informal
constraints that make individuals constrain their behavior so that they make political and
judicial systems effective forces to third party enforcement?” (North, 1991: 111). From this
perspective, our results provide evidence that informal constraints matter: differences in
trust, reciprocity, and habits of co-operation lead to large differences in economic outcomes
across areas characterized by identical formal institutions. Moreover, the econometric
strength of our results is comparable with that of the literature on the relevance of formal
institutions, which relies on similar assumptions and similar tests. Still, we believe there is a
long way to go before a final answer to North’s question can be attempted. The extent to
which informal norms are being shaped by past institutions or the latter have adapted to
pre-existent endowments of social capital remains a challenging topic for further research.
25
FIG 1. Fourteenth-century local policy regimes and current endowments of social capital
Fig 1a. Italian provinces classified according to their Fourteenth century local policy regimes (*)
Fig. 1b. Distribution of the current endowments social capital across Italian provinces (*)
Notes: Fig. 1a is based on Barraclough and Stone (1989), Hyde (1973), Larner (1980), and the map “L’Italia intorno al 1300”, from www.sapere.it/tca/minisite/storia/atlantestorico. Fig 1b illustrates the voter turnout average of the referenda between 1946 and 1987 (see Appendix III). The distribution of social capital is split into three classes of equal size. High social capital includes provinces that display a voter turnout between 0,82 and 0,92. Medium social capital includes provinces that display a voter turnout between 0.72 and 0.82. Low social capital includes provinces that display a voter turnout between 0.62 and 0.72. (*) Southern provinces are indicated by a shaded area.
26
Table 1a
DESCRIPTIVE STATISTICS Observations Mean Standard
deviation
Min Max
Panel A. SHIW Dataset: Dependent variables
Worker productivity 23,097 2.47 0.41 1.16 3.64 Entrepreneurship 14,694 0.10 0.29 0 1 Female participation 14,070 0.49 0.49 0 1
Panel B. SHIW Dataset: Main control variables
Years of schooling 23,097 10.90 3.96 2 20 Experience 23,097 22.23 11.99 14 57 Age 14,694 44.37 9.58 19 88 Dummy if female 23,097 0.39 0.47 0 1 Dummy if married 23,097 0.66 0.49 0 1 Number of children 14,070 0.65 0.87 0 6 Dummy for south 23,097 0.30 0.46 0 1
Panel C. Social capital variables defined at the local level
Social capital 99 0.80 0.08 0.62 0.92 Blood donation 99 0.29 0.20 0.01 1.05 Turnout 20 0.19 1.09 -1.87 2.26 Associations 20 0.01 0.01 0 0.03
Notes: See Appendix III for more detailed variable definitions and sources.

27
Table 1b
CORRELATION MATRIX FOR THE SOCIAL CAPITAL VARIABLES Social
capital
Blood
donation
Human
capital
Population
density
Turnout Associations
Social capital 1 0.70 0.77 0.07 0.67 0.76 Blood donation 1 0.63 -0.14 0.57 0.38 Turnout 1 0.21 Associations 1
Notes: Correlation coefficients are calculated at the regional level. For the variables defined at the provincial level (Social capital and Blood donation) we use their regional average. See Appendix III for more detailed variable definitions and sources.
28
Table 2
OLS AND LPM REGRESSIONS
(1) (2) (3) (4) (5) (6) (7) (8) (9)
Dependent variable
Worker productivity Entrepreneurship Female participation
Social capital 0.332*** 0.062 0.119 0.244*** 0.201** 0.172** 0.798*** 0.473* 0.300 (0.073) (0.128) (0.100) (0.041) (0.089) (0.074) (0.108) (0.263) (0.202) Years of schooling 0.060*** 0.060*** 0.036*** -0.005*** -0.005*** -0.006*** 0.043*** 0.043*** 0.042***
(0.001) (0.001) (0.001) (0.001) (0.001) (0.001) (0.002) (0.002) (0.002) Experience/Age 0.029*** 0.029*** 0.021*** -0.014*** -0.014*** -0.013*** 0.024*** 0.024*** 0.023***
(0.001) (0.001) (0.001) (0.003) (0.003) (0.003) (0.004) (0.004) (0.004) Experience/Age squared (×100)
-0.034*** -0.034*** -0.025*** 0.018*** 0.018*** 0.017*** -0.037*** -0.037*** -0.036***
(0.002) (0.002) (0.002) (0.003) (0.003) (0.003) (0.005) (0.005) (0.005) Dummy if female -0.088*** -0.089*** -0.082*** -0.029*** -0.028*** -0.028***
(0.007) (0.007) (0.005) (0.007) (0.007) (0.007) Dummy if married 0.087*** 0.087*** 0.073***
(0.009) (0.008) (0.007) Number of children -0.044*** -0.045*** -0.042***
(0.008) (0.007) (0.007) Macro Region Dummies NO YES YES NO YES YES NO YES YES
Additional controls NO NO YES NO NO YES NO NO YES
R-squared 0.40 0.41 0.49 0.24 0.27 0.50 0.23 0.23 0.24 Obs. 23,097 23,097 23,097 14,694 14,694 14,694 14,070 14,070 14,070
Notes: The White robust standard errors reported in parentheses are corrected for the potential clustering of the residuals at the provincial level. Regressions include calendar year dummies. Experience instead of age is used only for worker productivity. Additional controls include variables at the individual level and variables at the provincial level (see Appendix I). Additional controls at the individual level are: industry dummies, work status dummies, and firm size dummies for worker productivity; father’s work status dummies for entrepreneurship; and family net wealth, family net wealth squared, and a dummy if the mother was not employed for female participation. Additional controls at the provincial level are: human capital, infrastructure and the crime rate for all dependent variables. See Appendix III for more detailed variable definitions and sources. Regressions are weighted to population proportions. *** (**) [*] denotes significance at the 1% (5%) [10%] level.
29
Table 3
2SLS REGRESSIONS WITH NINETEENTH CENTURY VARIABLES AS INSTRUMENTS
(1) (2) (3) (4) (5) (6) (7) (8) (9)
Dependent variable
Worker productivity Entrepreneurship Female participation
Panel A: Two stages least squares
Social capital 0.516*** 0.479* 0.514** 0.215*** 0.224* 0.253** 0.942*** 0.779** 0.665* (0.095) (0.255) (0.249) (0.062) (0.117) (0.105) (0.129) (0.405) (0.346) Test of over-identification (Hensen J Statistics: p-value)
0.12 0.41 0.48 0.12 0.14 0.30 0.32 0.26 0.49
Panel B: First stage for social capital
Turnout 0.045*** 0.028*** 0.031*** 0.077*** 0.026*** 0.029*** 0.049*** 0.026*** 0.030*** (0.006) (0.005) (0.006) (0.006) (0.005) (0.006) (0.006) (0.006) (0.006) Associations 9.271*** 3.360*** 2.957*** 8.995*** 3.844** 3.239*** 9.087*** 3.654** 3.897** (2.198) (1.664) (1.509) (2.283) (1.613) (1.441) (2.401) (1.754) (1.528) R-squared
0.66 0.85 0.86 0.66 0.84 0.85 0.67 0.84 0.85
Test of joint significance of the instruments (F statistics: p value)
0.0000 0.0000 0.0000 0.0000 0.0000 0.0000 0.0000 0.0000 0.0000
Macro Region Dummies NO YES YES NO YES YES NO YES YES
Additional controls NO NO YES NO NO YES NO NO YES
Obs. 23,097 23,097 23,097 14,694 14,694 14,694 14,070 14,070 14,070
Notes: The White robust standard errors reported in parentheses are corrected for the potential clustering of the residuals at the provincial level. Regressions include calendar year dummies. Panel A reports the two stage least squares estimates, instrumenting for social capital using nineteenth-century variables; Panel B reports the corresponding first stage. All covariates that are included in the second stage are also included in the first stage. Covariates are not reported to save space. See Appendix III for more detailed variable definitions and sources. Regressions are weighted to population proportions. *** (**) [*] denotes significance at the 1% (5%) [10%] level.
30
Table 4
2SLS REGRESSIONS WITH BLOOD DONATION AS INSTRUMENT (1) (2) (3) (4) (5) (6) (7) (8) (9)
Dependent variable
Worker productivity Entrepreneurship Female participation
Panel A: Two stages least squares
Social capital 0.604** 0.594** 0.618* 0.234*** 0.178 0.185 1.017*** 1.287* 1.104* (0.127) (0.301) (0.337) (0.084) (0.304) (0.238) (0.165) (0.702) (0.615) Panel B: First stage for social capital Blood donation 2.409*** 0.944*** 1.006*** 2.557*** 0.968*** 1.019*** 2.622*** 0.948*** 0.996*** (0.457) (0.166) (0.204) (0.458) (0.175) (0.212) (0.473) (0.182) (0.224)
R-squared
0.44 0.82 0.82 0.44 0.82 0.83 0.44 0.82 0.83
Test of joint significance of the instruments (F-statistic: p-value)
0.0000 0.0000 0.0000 0.0000 0.0000 0.0001 0.0000 0.0002 0.0002
Macro Region Dummies NO YES YES NO YES YES NO YES YES
Additional controls NO NO YES NO NO YES NO NO YES
Obs. 23,097 23,097 23,097 14,694 14,694 14,694 14,070 14,070 14,070
Notes: The White robust standard errors reported in parentheses are corrected for the potential clustering of the residuals at the provincial level. Regressions include calendar year dummies. Panel A reports the two stage least squares estimates, instrumenting for social capital using blood donation; Panel B reports the corresponding first stage. All covariates that are included in the second stage are also included in the first stage. Covariates are not reported to save space. See Appendix III for more detailed variable definitions and sources. Regressions are weighted to population proportions. *** (**) [*] denotes significance at the 1% (5%) [10%] level.
31
Table 5
2SLS REGRESSIONS WITH FOURTEENTH CENTURY VARIABLES AS INSTRUMENTS
(1) (2) (3) (4) (5) (6) (7) (8) (9)
Dependent var.
Worker productivity Entrepreneurship Female participation
Panel A: Two stages least squares Social capital 0.386*** 0.423 0.426 0.263*** 0.526* 0.521** 0.870*** 1.078* 1.264** (0.082) (0.457) (0.347) (0.049) (0.299) (0.231) (0.132) (0.633) (0.498) Test of Over-identification (Hensen J Statistics: p-value)
0.01 0.01 0.01 0.35 0.36 0.54 0.82 0.52 0.74
Panel B: First stage for social capital Ex-communal republics -0.022** -0.024*** -0.027** -0.020** -0.018 -0.025** -0.021** -0.021* -0.024**
(0.009) (0.013) (0.011) (0.009) (0.013) (0.011) (0.009) (0.013) (0.011)
Papal State -0.036*** -0.025*** -0.028*** -0.034*** -0.025** -0.028** -0.035*** -0.027** -0.029**
(0.011) (0.011) (0.011) (0.012) (0.012) (0.011) (0.012) (0.012) (0.12)
Kingdom of Sicily -0.182*** -0.099*** -0.118*** -0.182*** -0.096*** -0.119*** -0.184*** -0.097*** -0.116***
(0.018) (0.020) (0.019) (0.017) (0.021) (0.021) (0.017) (0.022) (0.022)
Peripheral areas -0.078*** -0.054*** -0.071*** -0.077*** -0.049*** -0.070*** -0.079*** -0.051*** -0.068*** (0.018) (0.011) (0.010) (0.018) (0.013) (0.011) (0.019) (0.012) (0.012) R-squared
0.78 0.82 0.83 0.79 0.82 0.83 0.79 0.82 0.83
Test of joint significance of the instruments ( F statistics: p value)
0.0000 0.0000 0.0000 0.0000 0.0000 0.0000 0.0000 0.0000 0.0000
Macro Region Dummies NO YES YES NO YES YES NO YES YES
Additional controls NO NO YES NO NO YES NO NO YES
Obs. 23,097 23,097 23,097 14,694 14,694 14,694 14,070 14,070 14,070
Notes: The White robust standard errors reported in parentheses are corrected for the potential clustering of the residuals at the provincial level. Regressions include calendar year dummies. Panel A reports the two stage least squares estimates, instrumenting for social capital using fourteenth-century variables; Panel B reports the corresponding first stage. All covariates that are included in the second stage are also included in the first stage. Covariates are not reported to save space. See Appendix III for more detailed variable definitions and sources. Regressions are weighted to population proportions. *** (**) [*] denotes significance at the 1% (5%) [10%] level.

32
Appendix I
ESTMATES OF THE ADDITIONAL CONTROLS INCLUDED IN THE OLS E LPM REGRESSIONS OF TABLE 2
(1) (2) (3)
Dependent variable Worker
productivity Entrepre-
neurship Female
participation
Additional controls at the individual level
Industry dummies (agriculture omitted dummy): i. manufacturing 0.027 (0.017) ii. building and construction 0.040** (0.017) iii. wholesale, retail trade, lodging and catering services 0.021 (0.018) iv. transport and communications 0.071*** (0.018) v. credit and insurance 0.177*** (0.019) vi. real estate and other professional and business activities 0.008 (0.023) vii. government and other private and public services 0.032* (0.016) Work status dummies (blue collar worker omitted dummy): i. office worker or teacher 0.111*** (0.006) ii. junior manager, official 0.166*** (0.014) iii. senior manager 0.318*** (0.020) iv. member of professions 0.111 (0.078) v. employer, own-account worker 0.017 (0.050) vi. not employed 0.058*** (0.021) Firms size dummies ( up to 4 omitted dummy) i. from 5 to 19 0.087*** (0.009) ii. from 20 to 49 0.159*** (0.012) iii. from 50 to 99 0.211*** (0.147) iv. from 100 to 499 0.220*** (0.014) v. 500 or more 0.275*** (0.017) vi. not applicable, public sestor employee 0.290*** (0.014)
33
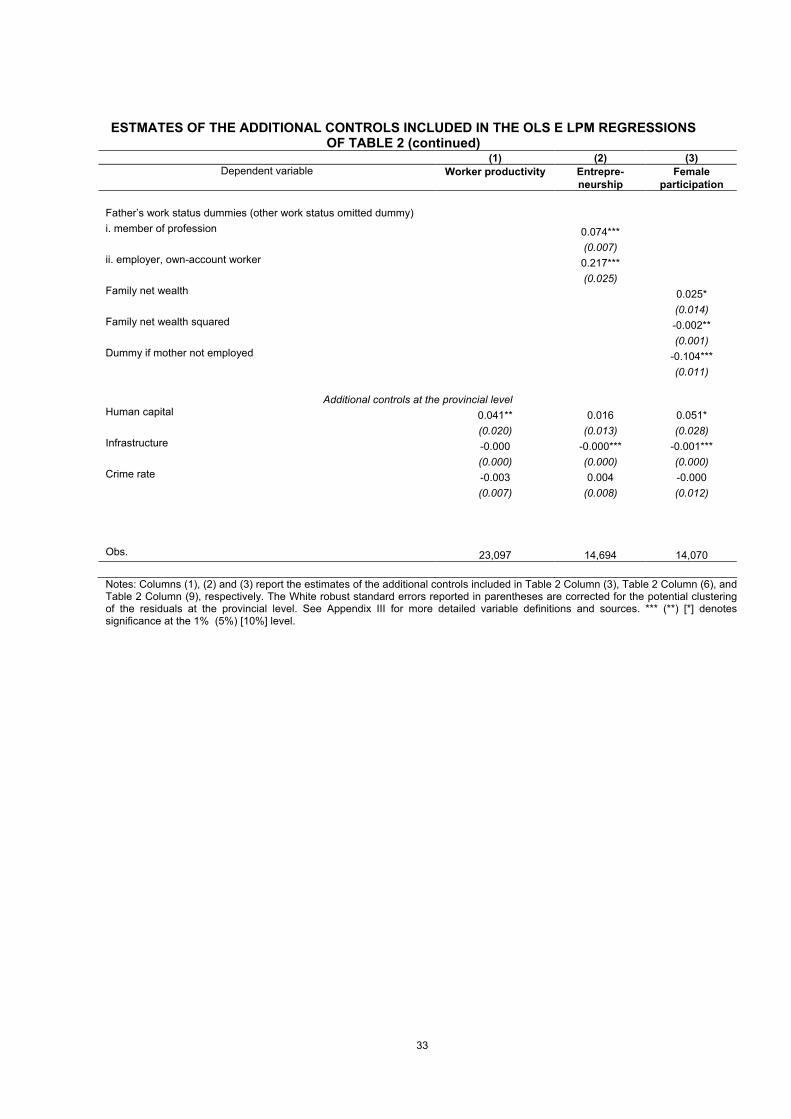
ESTMATES OF THE ADDITIONAL CONTROLS INCLUDED IN THE OLS E LPM REGRESSIONS OF TABLE 2 (continued)
(1) (2) (3)
Dependent variable Worker productivity
Entrepre-
neurship Female
participation
Father’s work status dummies (other work status omitted dummy) i. member of profession 0.074*** (0.007) ii. employer, own-account worker 0.217*** (0.025) Family net wealth 0.025* (0.014) Family net wealth squared -0.002** (0.001) Dummy if mother not employed -0.104*** (0.011)
Additional controls at the provincial level
Human capital 0.041** 0.016 0.051* (0.020) (0.013) (0.028) Infrastructure -0.000 -0.000*** -0.001*** (0.000) (0.000) (0.000) Crime rate -0.003 0.004 -0.000 (0.007) (0.008) (0.012) Obs. 23,097 14,694 14,070
Notes: Columns (1), (2) and (3) report the estimates of the additional controls included in Table 2 Column (3), Table 2 Column (6), and Table 2 Column (9), respectively. The White robust standard errors reported in parentheses are corrected for the potential clustering of the residuals at the provincial level. See Appendix III for more detailed variable definitions and sources. *** (**) [*] denotes significance at the 1% (5%) [10%] level.

34
Appendix II Italian provinces classified by fourteenth-century local political regimes
Communal republics
Arezzo, Bologna, Ferrara, Firenze, Forlì, Grosseto, Imperia, La Spezia, Livorno, Lucca, Massa Carrara , Modena, Padova, Pisa, Pistoia, Prato, Ravenna, Reggio Emilia, Rimini, Savona, Siena, Treviso, Venezia
Ex-communal republics (Signorie)
Alessandria, Asti, Belluno, Bergamo, Biella, Brescia, Como, Cremona, Gorizia, Lecco, Lodi, Mantova, Milano, Novara, Parma, Pavia, Piacenza, Pordenone, Rovigo, Sondrio, Trieste, Udine, Varese, Verbania-Cusio-Ossola, Vercelli, Verona, Vicenza
Papal State
Ancona, Ascoli Piceno, Frosinone, Latina, Macerata, Perugia, Pesaro e Urbino, Rieti, Roma, Terni, Viterbo
Kingdom of Sicily
Agrigento, Bari, Benevento, Brindisi, Campobasso, Catania, Catanzaro, Chieti, Cosenza, Crotone, Enna, Foggia, Isernia, L'Aquila, Lecce, Matera, Messina, Napoli, Palermo, Pescara, Potenza, Ragusa, Reggio Calabria, Salerno, Siracusa, Taranto, Teramo, Trapani, Vibo Valentia
Peripheral areas
Aosta, Bolzano, Cagliari, Cuneo, Nuoro, Oristano, Sassari, Torino, Trento.
Notes: Based on Barraclough and Stone (1989), Hyde (1973), Larner (1980), and the map “L’Italia intorno al 1300” from www.sapere.it/tca/minisite/storia/atlantestorico.
35
Appendix III List of Variables and Sample Details
Social capital and other variables defined at the local level
SOCIAL CAPITAL. This variable is the voter turnout average of the referenda held between 1946 and 1987 on provincial basis. The referenda questioned about the following matters: choice between republic and monarchy in 1946; divorce legislation in 1974; public financing of parties in 1978; public security and anti-terrorism in 1981; abortion legislation in 1981; wage escalator clauses in 1985; nuclear power and hunting regulation in 1987. Source: Guiso et al. (2004) on data from the Ministry of Interior. Figures for the provinces created after 1995 (Biella, Verbania-Cusio-Ossola, Lodi, Lecco, Rimini, Prato, Crotone and Vibo Valenzia) are single out from those to which they belonged previously: respectively Vercelli, Novara, Milan, Como-Bergamo, Forlì, Florence and Catanzaro. Lecco province was made by municipalities which belonged partly to Como and partly to Bergamo. Thus, we imputed to Lecco a simple arithmetic average of the values of the Bergamo and Como provinces. Out of the 103 Italian provinces, 4 provinces (Genova, Caserta, Avellino, Caltanissetta) were excluded because the lack of data on blood donation (see below).
TURNOUT. A factor score summarising turnout in the national elections of 1919 and 1921, as well as turnout in the local and provincial election of 1920; these were the only elections under universal manhood suffrage before the advent of Fascism. Source: Putnam (1993). Three regions present missing values (most of the territories that later became Friuli Venezia Giulia and Trentino Alto Adige were annexed to Italy only at the end of World War I and Valle d’Aosta was in this period part of Piemonte). We imputed to them the values of the region that is socio-geographically closer. We imputed Veneto’s figures to Friuli Venezia Giulia and to Trentino Alto Adige, and Piemonte’s figures to Valle d’Aosta.
ASSOCIATIONS. Proportion of all local cultural and recreational organizations in the 1982 associational census that had been founded before 1860 (this measure excludes active in the earlier period that did not survive). Source: Putnam (1993). Three regions present missing values (most of the territories that later became Friuli Venezia Giulia and Trentino Alto Adige were annexed to Italy only at the end of World War I and Valle d’Aosta was in this period part of Piemonte). We imputed to them the values of the region that is socio-geographically closer. We imputed Veneto’s figures to Friuli Venezia Giulia and to Trentino Alto Adige, and Piemonte’s figures to Valle d’Aosta.
BLOOD DONATION. The number of blood bags per 1,000 inhabitants in the province collected by Avis, the Italian association of blood donation. In Italy, Avis collects over 90% of the whole blood donation. There is no Avis local branch in four provinces (Genova, Caserta, Avellino, Caltanissetta). Therefore, in all regressions the observations of these provinces are excluded. Source Guiso et al. (2004) on data from Avis.
HUMAN CAPITAL. Average number of schooling years calculated at the province level. Source: ISTAT Census 1991.
CRIME RATE. Average number of crimes (officially reported) over residing population at the province level. Source: ISTAT Statistiche Giudiziarie 1990.
INFRASTRUCTURES. Index of local infrastructure endowments calculated by Istituto Tagliacarne at the province level. It refers to 1998.
Individual variables. Source: SHIW
WORKER PRODUCTIVITY. Our measure of worker productivity is given by log hourly wages. Hourly wages are calculated by dividing the annual earnings (from any activity as employee, including fringe benefits, net of taxes and social security contributions) by the total amount of hours worked in a year (Average Hours Worked per Week × Months Worked × 4.3333). We trim the sample at the 1
st and 99
th and percentile of the distribution of earnings.
ENTREPRENEURSHIP. The SHIW identifies five categories of self-employment: (1) member of the arts or professions; (2) sole proprietor; (3) free-lance; (4) owner or member of a family business; (5) active shareholder/partner. Our measure for entrepreneurship is a dummy variable that equals one if the individual (only household heads) is the sole proprietor; or owner of a business or member of a family business; or an active shareholder/partner. We thus exclude professionals and free-lance. The former category includes lawyers and tax consultants, whose weight over the population may be interpreted as consequence of a lack of social capital. Moreover, the latter group takes in (legal or illegal) payroll employment, recorded as self-employment for social security avoidance purposes.
FEMALE PARTICIPATION. The dependent variable takes on the value of one for a woman that is employed (as declared by herself) or is actively looking for a job (that is, she answered “yes” to the question: “In [year of the interview] did you do anything to find employment (temporary or otherwise) or to change your employment?”). We exclude from the sample, women that cannot participate to the labor market: pensioners, students, and women aged less than 15 or more than 65 years. We also restrict the analysis to female spouses/wives, for which the male breadwinner conception applies.
AGE. Individual’s age at the survey date.
YEARS OF SCHOOLING. This variable is the number of years of studies required to achieve the highest qualification earned by the individual. We derived the length of education by assigning: 2 years to no qualification; 5 years to elementary school; 8 years to middle school; 11 years to professional secondary school diploma; 13 years to high school; 16 years to an

36
associate degree or other short course university degree; 18 years to a bachelor’s degree; and 20 years to a postgraduate qualification.
EXPERIENCE. It is calculated as the difference between worker’s age at the survey date and the age at first job held, which is a data available from the SHIW.
DUMMY IF FEMALE. Dummy variable that equals one if the individual is a female.
DUMMY IF MARRIED. Dummy variable that equals one if the individual is married.
NUMBER OF CHILDREN. Number of sons living in a household aged under 13 years.
DUMMY FOR SOUTH. Dummy variable that takes on the value of one for the following regions: Abruzzi, Molise, Campania, Puglia, Basilicata, Calabria, Sicilia, and Sardegna.
JOB QUALIFICATION. Set of dummies for the seven main employment work status collected by the SHIW: 1) blue collar worker or similar; 2) office worker or school teacher 3) junior manager, official 4) senior manager; 5) member of arts or professions; 6) employer, own-account worker; 7) not employed. The work status reported by the interviewed refers to the main employment.
INDUSTRIES. Series of dummies for the sector of activity of the firm in which the individual works: agriculture; manufacturing; building and construction; wholesale, retail trade, lodging and catering services; transport and communications; credit and insurance; real estate and other professional and business activities; government and other private and public services.
FIRM SIZE. Set of dummies for the size of the firm in which the individual works: up to 4 regular employees; from 5 to 19 employees; from 20 to 49 employees, from 50 to 99 employees, from 100 to 499 employees, 500 employees or more; not applicable, public sector employees).
FATHER’S OCCUPATION. Set of dummies for the following father’s work status: 1) member of arts or professions; 2) employer, own-account worker; 3) other work status (includes the categories form 1) to 4) and category 7) of the variable JOB QUALIFICATION).
FAMILIAR NET WEALTH. Sum of family real assets (property, companies, and valuables), financial assets (deposits, government securities, equity, etc.), net of financial liabilities (mortgages and other debts).
DUMMY FOR MOTHER NOT EMPLOYED. Dummy that takes on the value of one if the mother of the respondent was not employed.
37
References
Angrist, J., G. Imbens and D. Rubin (1996), “Identification of causal effects using Instrumental Variables (with discussion),” Journal of the American Statistical Association, Vol. 91, pp. 444-472.
Acemoglu, D., S. Johnson, and J. A. Robinson (2001), “The Colonial Origins of Comparative Development: An Empirical Investigation”, American Economic Review, Vol. 91, pp. 1369-1401.
_____ (2002), “Reversal of Fortune: Geography and Institutions in the Making of the Modern World”, Quarterly Journal of Economics, Vol. 117, pp. 1231-1294.
Acemoglu, D., S. Johnson, J. A. Robinson, and P. Yared (2008), “Income and Democracy,” American Economic Review, Vol. 98, pp. 808-842.
Aiello, F. and V. Scoppa (2001), “Uneven Regional Development in Italy: Explaining Differences in Productivity Levels”, Giornale degli Economisti e Annali di Economia, Volume 60, pp.270-98.
Altonji, J., and R. Blank (1999), "Gender and Race in the Labor Market”, in Ashenfelter O. C. and Card D. (eds), Handbook of Labor Economics (Volume 3C), Elsevier Science Press. New York.
Alesina, A., S. Danninger, and M. Rostagno M. (2001), “Redistribution Through Public employment: The case of Italy”, IMF Staff Papers, Vol. 48, pp 447-473.
Algan, Y., and P. Cahuc (2003), “Job Protection and Family Policies: the Macho Hypothesis”, Unpublished. University Paris 1 Panthéon-Sorbonne.
Antecol, H. (2000), “An Examination of Cross-Country Differences in the Gender Gap in Labour Force Participation Rates”, Labour Economics, Vol. 7, pp.409-26.
Arrow, K. (1972), “Gifts and Exchanges”, Philosophy and Public Affairs, Vol.1, pp. 343-62.
Banerjee, A., and L. Iyer (2002), “Institutions and Economic Performance: the legacy of Colonial Legal Tenure Systems in India”, American Economic Review, Vol. 95, 4, pp. 1190-1213.
Banfield, E. G. (1958), The Moral Basis of a Backward Society. Free Press. New York.
Barca, F., and L. Cannari (1997) “Imprenditori e investitori: il ruolo dell’istruzione”, in Rossi N. (eds), L’istruzione in Italia: solo un pezzo di carta?, Il Mulino. Bologna
Barraclough, G., and N. Stone (1989), (eds) The Times Atlas of World History, 3rd edition, London: Times Books.
Brandolini, A. and L. Cannari (1994), “Methodological Appendix: The Bank of Italy‘s Survey of Household Income and Wealth”, in Ando, A., L. Guiso, and I. Visco (eds) Saving and the Accumulation Wealth. Cambridge University Press. Cambridge.
Cannari, L., and G. D’Alessio (1995), “Il rendimento dell’istruzione: alcuni problemi di stima”, Banca d’Italia, Temi di Discussione n. 253.
Castronuovo, S. (1992), “Mezzogiorno: The Theory of Growth and the Labor Market”, Journal of Regional Policy, Vol. 12, pp.333-65.
38
Checchi, D., A. Ichino, and A. Rustichini (1999), “More equal but less mobile? Education financing and intergenerational mobility in Italy and in the US”, Journal of Public Economics, Vol. 74, pp. 351-93.
Chiades, P., G. de Blasio and M. Gallo (2000), “I divari regionali di produttività nell’industria italiana”, in Ciciotti E. and A. Spaziante (eds), Economia Territorio, Istituzioni: I nuovi fattori delle politiche di sviluppo locale, Franco Angeli, Milano.
Colussi, A. (1997), “ Il tasso di rendimento dell’istruzione in Italia”, in Rossi N. (ed.), L’istruzione in Italia: solo un pezzo di carta?, Bologna, Il Mulino.
Davis, D.R., and D.E. Weinstein (2002), “Bones, Bombs, and Break Points: The Geography of Economic Activity,” American Economic Review, Vol.92, n.5, pp.1269-1289.
De Long, J. B., and A. Shleifer (1993), “Princes and Merchants: City Growth Before The Industrial Revolution”, Journal of Law and Economics, Vol. 36, pp. 671-702.
del Boca, D., M. Locatelli Biey, and S. Pasqua S. (2000), “Employment Decisions of Married Women: Evidence from Italy”, Labour, Vol.14, pp.35-52.
Dalmazzo, A. and G. de Blasio (2006), “Production and Consumption Externalities of Human Capital: An Empirical Study for Italy”, Journal of Population Economics, forthcoming.
Diankov, S., R. La Porta, F. Lopez-de-Silanes and A. Shleifer (2003), “The New Comparative Economics”, Journal of Comparative Economics, Vol. 31, n.4, 595-619.
Durlauf, S. N., and M. Fafchamps (2006), “Social Capital”, in Durlauf S.and Aghion P. (eds.) Handbook of Economic Growth. Elsevier Science Press. New York. forthcoming.
Glaeser, E. L., R. La Porta, F. Lopez-de-Silanes and A. Shleifer (2004), “Do Institutions Cause Growth?”, NBER Working Paper 10568.
Guiso, L, P. Sapienza and L. Zingales (2004), “The Role of Social Capital in Financial Development”, American Economic Review, Vol.94, n.3, pp.526-556.
Hall R. E., and C. I. Jones (1999), “Why Do Some Countries Produce So Much More Output Per Worker Than Others?”, Quarterly Journal of Economics, Vol. 114, pp.83-116.
Hyde, J. K. (1973), Society and Politics in medieval Italy: The Evolution of Civil Life, 1000-1350. Macmillan. London.
Ichino, A., and G. Maggi (2000), “Work Environment and Individual Background: Explaining Regional Shirking Differentials in a Large Italian Firm”, Quarterly Journal of Economics, Vol. 115, pp. 1057-1090.
IMF, (2002), Italy: 2002 Article IV Consultation, Staff Report; Staff Supplement; Public Information Notice on Executive Board Discussion; and Statement by the Executive Board Director for Italy, October 25, 2002
Isham, J., and D. Kaufman (1999), “The Forgotten Rationale for Policy Reform: The Productivity of Investment Projects”, Quarterly Journal of Economics, Vol.114, pp.149-84.
Lane, F. C. (1966), Venice and History. Johns Hopkins University Press. Baltimore.
La Porta, R., F. Lopez-de-Silanes, A. Shleifer, and R. Vishny (1999), “The Quality of
39
Government”, Journal of Law, Economics, and Organization, Vol. 15, pp. 222-279.
La Porta, R., F. Lopez-de-Silanes, A. Shleifer (2008), “The Economic Consequences of Legal Origins,” Journal of Economic Literature, Vol. 46, pp.285-332.
Larner, J. (1980), Italy in The Age of Dante and Petrarca: 1261-1380. New York: Longman.
Mauro, P. (1995), “Corruption and Growth”, Quarterly Journal of Economics, Vol.110, pp. 681-712.
Mauro, P., E. Prasad, and A. Spilimbergo (1999), “Perspectives on Regional Unemployment in Europe”, International Monetary Fund. Occasional Paper No.177.
Moulton, B. (1990) “An Illustration of a Pitfall in Estimating the Effects of Aggregate Variables on Micro Unit”, Review of Economics and Statistics, 72, 219-256.
North, D. (1990), Institutions, Institutional Change and Economic Performance. Cambridge University Press. Cambridge.
North, D. (1991), “Institutions”, Journal of Economic Perspectives, Vol. 5, pp. 97-112.
Pistaferri, L. (1999), “Informal Networks in the Italian Labour Market”, Giornale degli Economisti e Annali di Economia, Vol. 58, pp. 355-75.
Putnam, R. (1993), Making Democracy Work: Civic Tradition in Modern Italy. Princeton University Press. Princeton.
Putnam, R., and J.F. Helliwell (1995), “Social Capital and Economic Growth in Italy”, Eastern Economic Journal, Vol. 21, pp. 295-307.
Putnam, R. (2000), Bowling Alone: The Collapse and Revival of American Community. New York: Simon & Schuster
Tabellini, G. (2008), “Culture and Institutions: Economic Development in the Regions of Europe”, CESifo Working Paper No. 1492.
Temple, J. (2002), “Growth Effects of Education and Social Capital in the OECD Countries”, OECD Economic Studies, Vol. 33, pp. 57-101.
World Bank, (2005), Doing business in 2006. Washington D.C.
Wooldridge, J. M. (2002), Econometric Analysis of Cross Section and Panel Data. MIT Press.Cambridge.


![HISTORY OF LINGUISTICS 2015-16 (prof. Giorgio Graffi) · Traditional grammar almost totally ignored diachrony; nineteenth-century historical-comparative grammar […] subordinated](https://img.pdfslide.us/doc/110x75/5e117cf5bb47801a69536602/history-of-linguistics-2015-16-prof-giorgio-graffi-traditional-grammar-almost.jpg)