Embed Size (px)
Citation preview
u.s. Department of Justice
Bureau of Justice Statistics
Prisoners 1978 in State and Federal Institutions on December 31
. I
If you have issues viewing or accessing this file, please contact us at NCJRS.gov.
Bureau of Justice StCitistlcs Reports
Single copies are available at no charge from the National Criminal Justice Reference Service, Box 6000, Rockville, Md. 20850. Muillple copies are for sale by the Superintendent of Documents, U.S. Government Printing Office, Washington, D.C. 20402.
National Crime Survey: Criminal Vltllmlzallon In the United Slates (annual):
Summary Findings of 1977-78 Changes in Crime and of Trends Since 1973, NCJ-61368
A Description 01 Trends from 1973 to 1977. NCJ-59898
1978 (final report), NCJ-66480 1977, NCJ-58725 1976, NCJ-49543 1975, NCJ-44593 1974, NCJ-39467 1973, NCJ-34732
The Cost of Negligence: Losses from Preventable Household Burglaries, NCJ-53527
Intlmale VIctims: A Study of Violence Among Friends and Relatives, NCJ-62319
Crime and Seasonality, NCJ-64818 Criminal VIctimization of New York State
Residents, 1974-77, NCJ-Elf''!81 Criminal Victimization Surveys In 13
American cities (summary report, 1 voL), NCJ-18471 Boston, NCJ-34818 Buffalo, NCJ-34820 Cincinnati, NCJ-34819 Houston, NCJ-34821 Miami, NCJ-34822 Milwaukee, NCJ-34823 Minneapolis, NCJ-34824 New Orleans, NCJ-34825 Oakland, NCJ-34826 Pittsburgh, NCJ-34827 San Diego, NCJ-34828 San Francisco, NCJ-34829 Washington, D.C., NCJ-34830
Public Attitudes About Crime (13vols.): Boston, NCJ-46235 Buffalo, NCJ-46236 Cincinnati, NCJ-46237 Houston, NCJ-46238 Miami, NCJ-46239 Milwaukee, NCJ-46240 Minneapolis, NCJ-46241, NeW Orleans, NCJ-46242 Qakland, NCJ-46243 Pittsburgh, NCJ-46244 San Diego, NCJ-46245 San Francisco, NCJ-46246 Washington, D.C., NCJ-46247
Criminal Victimization Surveys In Chicago, Detroit, Lol Angeles, New York, and Philadelphia: A COmparison of 1972 and 1974 Findings, NCJ-36360
Criminal. VIctimization Surveys In the Nation's Five Largest CIties: National Crime Panel Surveys in Chicago, Detroit, Los Angeles, New York, and Philadelphia, 1972, NCJ-16909
Criminal VIctimization Surveys In Eight American Cities: A Comparison of 1971172 and 1974175 Findings-National Crime Surveys in Atlanta, Baltimore, Cleveland, Dallas, Denver, Newark, Portland, and St. Louis. NCJ-36361
Crimes and VIctims: A Report on the Dayton! San Jose Pilot Survey of Victimization, NCJ-013314
Indicators of Crime and Criminal Justice: Quantitative Studies, NCJ-62349
Applications of the Natlonal Crime SUrvey Victimization and Attitude Data:
Public Opinion About Crime: The Attitudes of Victims and Nonvlctlms In S~lected CIties, NCJ-41336 .
Local Victim Surveys: A Review of the Issues, NCJ-39973
The Police and Public Opinion: An Analysis of Victimization and Attitude Data from 13 American Cities, NCJ-42018
An Introduction to the National Crime Survey, NCJ-43732
Compensating Victims of Violent Crime: Potential Costs and Coverage of a National Program. /I,ICJ-43387
Crime Agalnlll Persona In Urban, Suburban, and Rural Areas: A Comparative Analysis of Victimization Rates. NCJ-53551
Rape Victimization In 26 American ClUes, NCJ-55878
Criminal VIctimization In Urban Schools, NCJ-56396
National Prisoner Statistics: Capital Punishment (annual):
1978, NCJ-59897 1979 advance report. NCJ-
Prisoners In State and Federallnstltutlons on December 31: 1978, NCJ-64671 1979 advance report, NCJ-66522
Census of State Correctional Facilities, 1974 advance report, NCJ-25642
Profile of State Prison Inmates: Sociodemographic Findings from the 1974 Survey of Inmates of State Correctional Facilities, NCJ-58257
Census of Prisoners In State Correctional . Facilities, 1973, NCJ-34729
Census 01 Jails and Survey of Jail Inmates, 1978, preliminary report, NCJ-55172
Profile of Inmates of Local Jails: Sociodemographic Findings from the 1978 Survey of Inmates of Local Jails, NCJ-65412
The Nation's Jails: A report on the census of jails from the 1972 Survey of Inmates of Local Jails, NCJ-19067
Survey 01 Inmates 01 Local Jails, 1972, advance report, NCJ-13313
Uniform Parole Reports: I'arole In Ihe United Stales (annual):
1978, NCJ-587.22 1976 and 1977, NCJ-49702
CharacterIstics of the Parole Population, 1978, NCJ-66479
A National Survey of Parole-Related Legislation Enacte·d During the 1979 Legislative Session, NCJ-64218
Children In Custody: Juvenile Deteotion and Correctional Facility census 1977 advance report:
Census of Public Juvenile Facilities, NCJ-60967
Census of Private Juvenile Facilities, NCJ-60968
19.75 (final report), NCJ-58139 1974, NCJ-57946 1973, NCJ-44777 1971, NCJ-13403
Myths and Realities About Crime: A Nontechnical Presentation of Selected Information from the National Prisoner Statistics Program and the National Crime Survey, NCJ-46249
State and Local Probation and Parole Systems, NCJ-41335
Sfate and Local Prosecution and Civil Attorney Systems, NCJ-41334
National Survey 01 Court Organization: 1977 Supplement to State Judicial Systems,
NCJ-40022 1975 Supplement to State Judicial Systems,
NCJ-29433 1971 (full report), NCJ-11427
State Court Model Statistical Dictionary, NCJ-62320
Steta Court cas.,loed Statistic.: The State of the Art, NCJ-46934 Annual Report, 1975, NQJ-51885 Annual Report, 1976, NCJ-56599
A Croll-City Comparllon of Felony Cal., Procelilng, NCJ-5517'1-
Trends In Expenditure and Employment Data lor the Criminal Justice System, 1971-17 (annual), NCJ-57463
Expenditure and Employment Data for the Criminal Justice System (annual) 1978 Summary Report. NCJ-66483 1978 final report, NCJ-66482 1977 final report, NCJ-53206
DIctionary of Criminal Justice Dafa Terminology: Terms and Definitions Proposed for interstate and National Data Collection and Exchange, NCJ-36747
Criminal Justice Agencies in the U.S.: Summary Report of the National Criminal Justice Agency List, NCJ-65560
Criminal Justice Agencies In Region 1: Conn., Maine, Mass., N.H., R.I., Vt., NCJ-17930
2: N.J., N.Y .• NCJ-17931 3: Del., D.C., Md., Pa., Va., W.Va., NCJ-17932 4: Ala •• Ga., Fla., Ky., Miss" N.C., S.C., Tenn., NCJ-17933
5: III., Ind., Mich., Minn., Ohio, Wis., NCJ-17934
6: Ark., La., N.Mex., Okla .• Tex., NCJ-17935 7: Iowa, Kans., Mo., Nebr., NCJ-17936 8: Colo., Mont., N.Dak., S.Dak" Utah, Wyo., NCJ-17937
9: Ariz., Calif., Hawaii, Nev., NCJ-151S1 10: Alaska, Idaho, Oreg., Wash., NCJ-17938
Utilization of Criminal Justice Statistics Project:
Sourcebook of Criminal Justice Statistics 1979 (annual), NCJ-59679
Public Opinion Regarding Crime, Criminal Justice, and Related Topics. NCJ-17419
New Directions In Processing of Juvenile Offenders: The Denver Model, NCJ-17420
Who Gets Detained? An Empirical Analysis of the Pre-Adjudicatory Detention of Juveniles in Denver, NCJ-17417
Juvenile Dispositions: Social and Legal Factors Related to the Processing of Denver Delinquency Cases, NCJ-17418
Offender-Based Transaction Statistics: New Directions in Data Colleclion and Reporting, NCJ-29645
Sentencing of California Felony Offenders, NCJ-29646
The Judicial Processing of Assault and Burglary Offenders in Selected California Counties, NCJ-29644
Pre-Adjudicatory Detention In Three Juvenile Courts, NCJ-34730
Delinquency Dispositions: An Empirical Analysis of ProceSSing Decisions in Three Juvenile Courts, NCJ-34734
The Pallerns and Distribution of Assault Incident Characteristics Among Social Areas, NCJ-40025
Patterns of Robbery Characteristics and Their Occurrence Among Social Areas, NCJ-40026
Crime-Specific Analysis: The Characteristics of Burglary Incidents,
NCJ-42093 An Empirical Examination of Burglary
Offender Characteristics, NCJ-43131 An Empirical Examination of Burglary
Offenders and Offense Characteristics, NCJ-42476
Sources of National Criminal Justice Statistics: An Annotated Bibliography, NCJ-45006
Fedl!ral Criminal Sentencing: Perspectives of Analysis and a Design for Research, NCJ-33683
Variations In Federal CrimInal Sentences: A Statistical Assessment at the National Level, NCJ-33684
Federal SentenCing Pattl1.rns: A Study of Geographical Variations, NCJ-33685
Predicting Sentences in Federal Court.: The Feasibility of a National Sentencing Policy, NCJ-33686
4'\ .. ', ~
u.s. Deputment or Juftice Bureau eX Justice Statistics
Prisoners in State and Federal Institutions on December 31
1978 National Prisoner Statistics Bulletin SD-NPS-PSF-6 NCJ-64671 May 1980
o
'p.S.DEPARTMENTOFiUSTICE
'BQreau of Justice Statistjcs . , . .
{l ·BenjaminH. Renshaw.,UI . " Acting Director' '.
AckllDwltd,inc!Ilts. In lhfi Bureau of Justice Statistica. Carol B. ',Kalish directs the National Prisoner Statistics program. under the general supervision of Charles· R. Kindermann.
This report was written by Mimi Cantwell. Crime Statistici Analysi. Staff. Bureau of the Census. under the direction of John
'F .Wallerstedtand general supervision of Adolfo L. Pacz. The main responsibility for production support activities was shared by Mil· lie Bald~ and Gla~ys'Davis. who also !frafted the charts.
Data.'collcction and processing were conducted in 'the .Demo-' graphic Surveys Division. Bureau of the Census. under the leneral Sllpcrvi!lion of Evan H. Da:vey;, Chester E. Bowie. Chief of the
'''National Prisoner StatistiC$) Branch; directed those activities. assisted by Thomas W.'Petersik. Arlene. J. Rasmussen. Ellen Baker. HerbcrtC. Unger. Joel S~ Gordon. and Evelyil S. Wolfson.
The report was made possible only through the generous and ' unstinting assistance of St~te and Federal corrections officials. Thcirpatience and Cooperation in providing the data contained herein )nowledged. '
Library of Congrcss'!=atalog.ing in Publ~cation Data
United States. National CriminaiJustice Information and Sta· tistics Service. .' " Prisoners in state and federal institutions on December 31.1978.
"National prisoner statistics bulletin No. SD·NPS·PSF-6." ,l.Prisoners-Unitcd States-Statistics. 'I. Title. II. Series
HV724S.A42 36S',6'0973 7S-6191S1
For B~le by the Superintendent of Documents, U.S . .Government Printing Olllee, Wuhington, D.C. 20402
, ii
•
Preface
Featured in this rieport on the number and move:;" " ' ment of prisoners injlthe United States during 1978 is
an assessment of factors that have contributed to the recent slowdown in prison population growth and of developments that couid alter the pattern of growth in the 1980's. In addition, information on race, Hispanic origin, and prison deaths is provided for the first time, and refinements have been made in certain prisoner movement categories. As in iprevious reports in the series, changes in geographic distribution of prisoners and in the proportions of various types of prisone~ movements are examined. '
Prior to '1978, reports in this series focused on the major group of inmates, those sentenced to serve a maximum term of more than 1 year{broadly referred to as the "sentenced" popUlation). In this report, however, emphasis isplaced'oP'thetotal population, which includes, in addition to lhe major group of prisoners, those with a sentence of a year or less and those unsentenced. Admission and release data are still restricted to "sentenced" inmates.
Consistent with past efforts under the National Prisoner Statistics (NPS) program to improve ,and standardize correctional statisti(;s,tespondents for 1978 were requested to differentiate between prisoners subject to confinement under the jurisdiction of each correctional system (irrespective of where the inmates were physically held) and those actually in the custody of correctional authorities. The impact of this distinction is assessed in Appe:ndix III, "Technical note on custody vs. jurisdiction." In order to provide
. policy-makers and planner:; with information covering all prisoners in Fede:ral and State systems, this report is based on the jurisdictional population. A special table showing the number of persons under custody of State and Federal f;orrectional authorities as ofDece~ber 31,1978, is provided in Appendix III.
The narrative and most cl~arts in this report are based on the tables in Appendix I. Appendix II consists of a statement em the data collection methodology and on the proportion of respondents able to provide data on the variables addressed for. the first time in 1978; this appendix also contains a facsimile of the questionnaire. Explanatory notes ' relating to each jurisdiction's degree of conformity with the criteria and definitions of the NPS program are found in Appendix IV.
Prisoners in State and Federal Institutions is an
annual publication, 9ne i~ severa! senes' of'reports ,~ prepared ,under the NPS program.' Based on voluntary reporting, the p~;ogram, was instityted to: collect and interpret data 011 inmates in State and Federal correctional institutibns. Initiated by the Bureau of the Census in 1926, the program was transferred to
"the Bureau of Prisons in 1950, to the Law Enforcement Assistance Administration (LEAA) "in 1971, and to the ne;wly created Bureau of Justice Statistics (BJS) in 1980. Since 1972, the Bureau of the Census has had the (csponsibility for gathering and processing the statist~cal data required for the NPS program. . "
IMPORTANT
We have pro-,Ided an evaluation "' ... at the end of thl. publication; "willa .. lat UI In ImprovlnSi future reporilif you complete and re,'lum It at your convenience. It I. pOitage.,iald and need. no Ita",!p. •
! I !
"iii
'\ \ \ '\
\
. iv
COI,tents
Page Preface................................................... iii Introduction............................................ 1
Ov,ercrowding and other factors stem growth I 'Factors portending growth in the 1980's .. :. I
The prison population at yearend................ 2 Thl~ past half century............................. 2 300,000 mark topped for second year........ 2 Four States account for bulk of increase.... 3 Declines in 17 States.............................. 3 Near record ratio of inmates to population 3 Fewer inmates housed in local jails........... 4
Pelrcent increase for women slows............. 4
. Sho.t sentences/no sentences more prevalent in Federal prisons ... :........................... 5
Data on race available for first time......... 5 Partial data Qri Hispanic origin................ 5
Admissions and releases 5 Admission/release ratio falls.................... 6
Most new arrival~ came directly from court 6 New laws affect violator returns............... 6 Escapees/ A WOLs account for 1 in 20 mO,ve-
ments ............................................... '7 More conditional releases from Federal in-
stitutions........................................... '7 Parole use up nationwide but down in some
States ............................................... 7 Expiration of sentence common in States
with low parole rates .......................... 7 Fourteen States used supervised mandatory
release.............................................. 8 'Probation used frequently in some States... 8 Deaths of 632 prisoners reported .: ....... : 9
Appendix I Data tables .......................................... 11
Appendix II Data collection method and questionnaire.. 33
Appendix III Technical note on custody vs. jurisdiction.. :41
Appendix IV Explanatory notes.................................. 43'
r ,l
Figures
I. Percent increase in total number of State and Federal prisoners, 1975-78 ............. .
2. Number of sentenced State and Federal prisoners at yearend, 1925-78 ............... .
3. Percent change in State and Federal prison population, by sentence length, 1978 ...... .
4. Prison population change and rank of top 10 States, 1977 and 1978 ..................... .
5. Number of sentenced State and Federal prisoners per 100,000 U.S. civilian popula-tion, 1940-78 ..................................... .
6. Number of sentenced State and Federal prisoners per 100,000 U.S. civilian popula-tion, by State, 1978 ............................ .
7. Ratio of admissions to releases, J.974-1978
8. Releases from Federal institutions, by type, 1977 and 1978 .................................. ..
9. Major types of release from State institu-tions:, !i974-11978) .................................. .
Data tables
I. Prisoners under jurisdiction of State and Federal correctional authorities on December 31, 1977, and December 31, 1978, by sentence length ................... ..
2. Male prisoners under jurisdiction of State and Federal correctional authorities on December 31, 1977, and December 31, 1978, by sentence length ................... ..
3. Female prisoners under jurisdiction of State and Federal correctional authorities on December 31, 1977, and December 31, 1978, by sentence length ................... ..
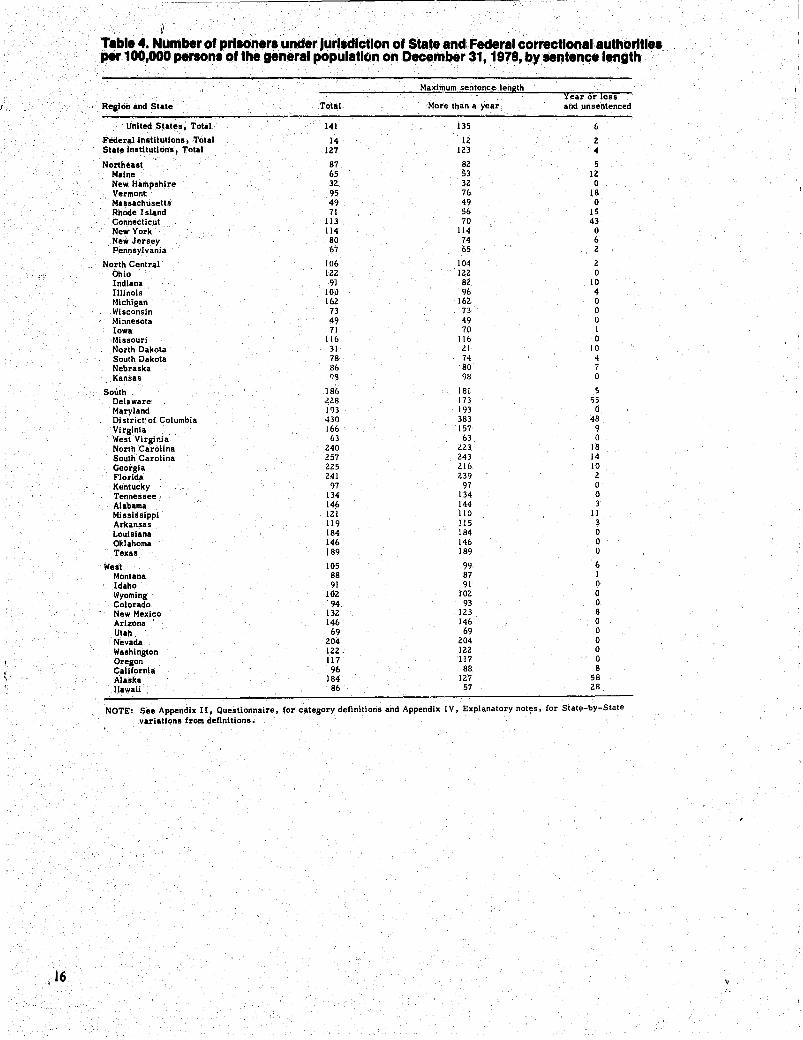
4. Number of prisoners under jurisdiction of State and Federal correctional authorities per 100,000 persons of the general population on December 31, 1978, by sentence length ............................................. .
5. Prisoners housed in local jails because of overcrowding in State and Federal facilities on December 31, 1977, and December 31, 1978, by sex ............................... .
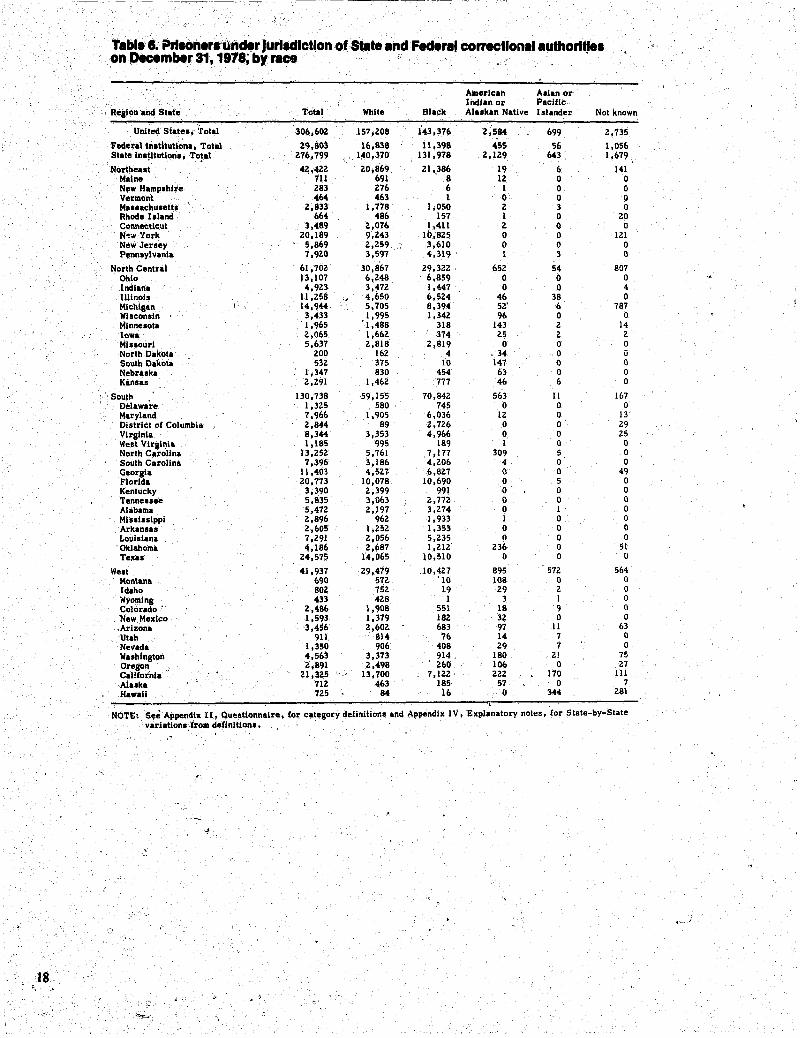
6. Prisoner's under jurisdiction of State and Federal correctional authorities on December 31, 1978, by race ....... ; .........
2
3
3
4 6
8
13
14
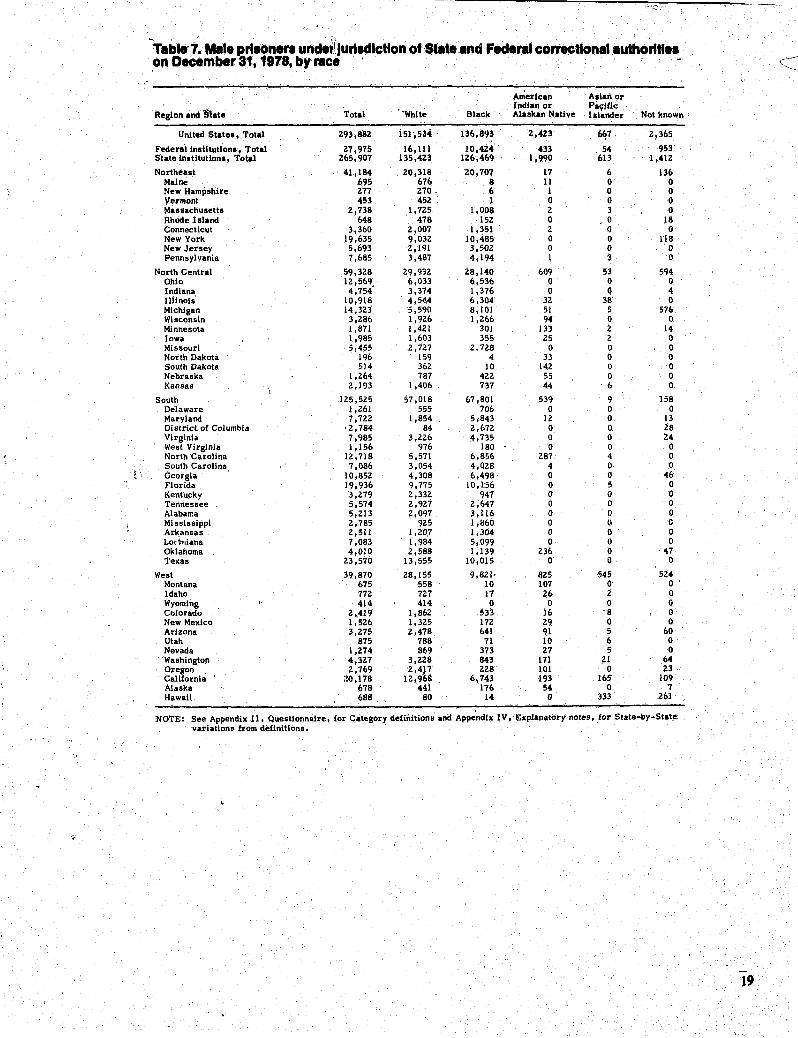
7. Male prisoners under jurisdiction of State and Federal correctional authorities on December 31, 1978, by race ........... : .... ..
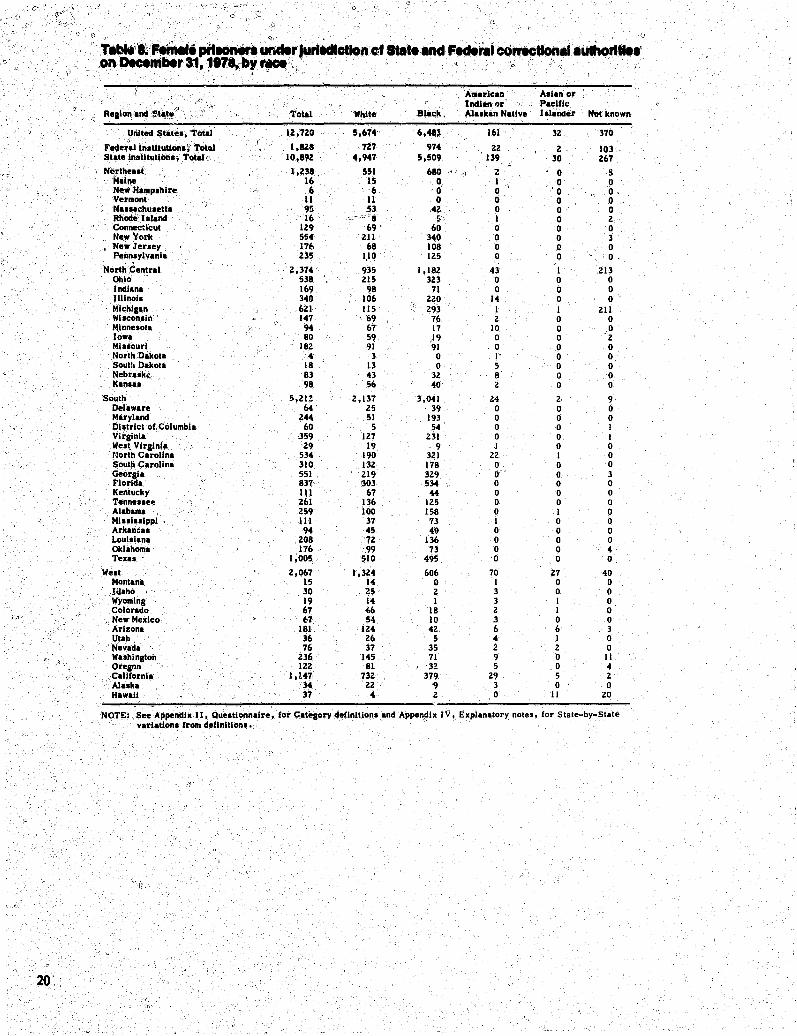
8. Female prisoners under jurisdiction of State and Federal correctional authorities 011 December 31, 1978, by race ........... .
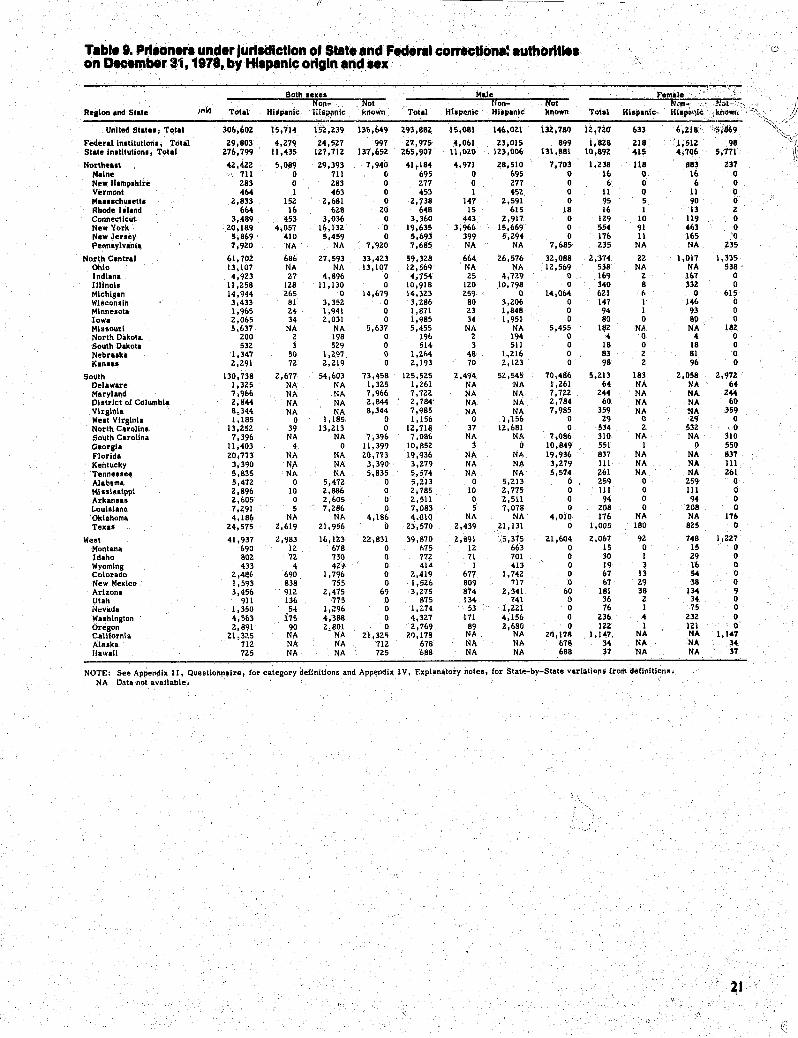
9. Prisoners under jurisdiction of State and Federal correctional authorities on December 31, 1978, by Hispanic origin and·sex .............................. : ............ .
10. Sentenced prisoners admitted to and released from the jurisdiction of State and Federal correctio'nal authorities, by type of admission and release, 1978 ... : ........ .
II. Sentenced male prisoners admitted to and released from the jurisdiction of State and Federal correctional authorities, by type of admission and release, 1978 ............ .
12. Sentenced female prisoners admitted to and released from the jurisdiction of State and Federal correctional authorities, by type of admission and release, 1978 .......
13. Sentenced prisoners released conditionally or unconditionally from the jurisdiction of State and Federal correctional authorities, by detailed type of release, 1978
14. Sentenced male prisoners released conditionally or unconditionally from the jurisdiction of State and Federal correctional authorities, by detailed type of release, 1978 ............................................... .
15. Sentenced female prisoners released conditionally or unconditionally from the jurisdiction of State and Federal correctional authorities, by detailed type of re-lease, 1978 ....................................... .
15" 16. Sentenced prisoners admitted to the-jurisdiction of State and Federal correctional authorities for violation of parole or other conditional release, by whether new sen-
16
17
18
tence imposed and sex, 1978 .............. ..
17. Death among sentenced .prisoners under the jurisdiction of State and Federal correctional authorities, by cause of death and sex, 1978 ................................... .
Special Table Prisoners in :custody' of State and Federal correctional authorities on December 31, 1977, and December 31, 1978, by sentence length ...
19 '
20
21
22
24
28
29
30
31
32
42
v
Introduction
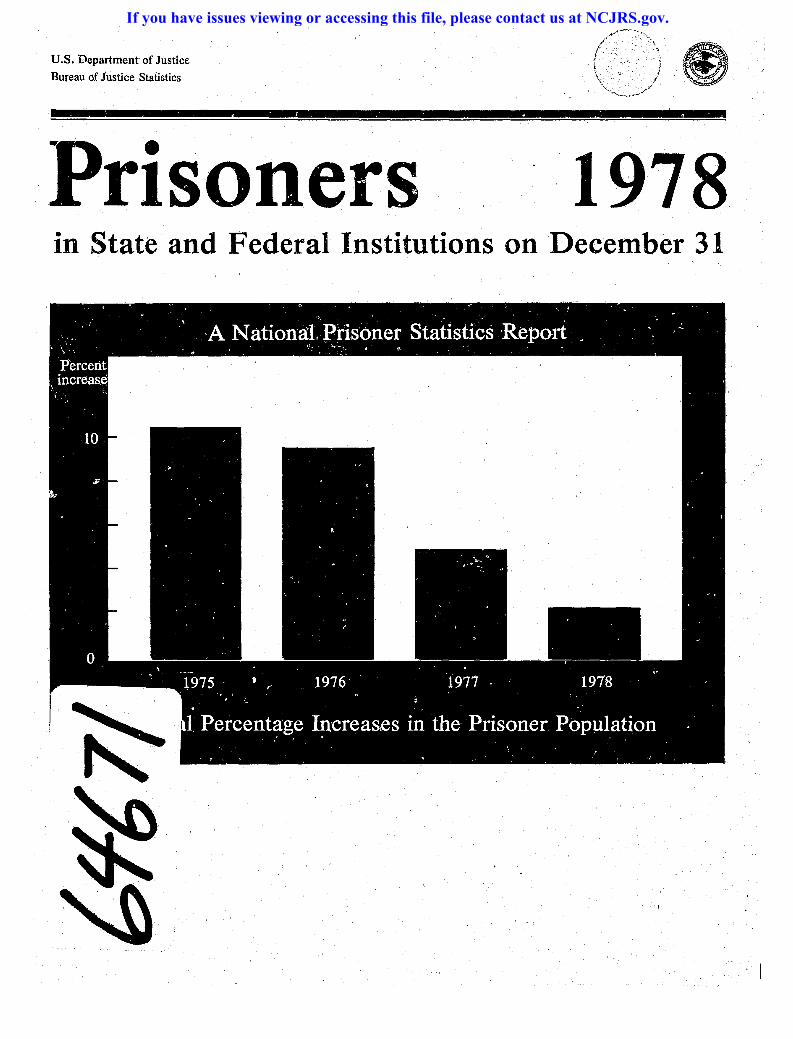
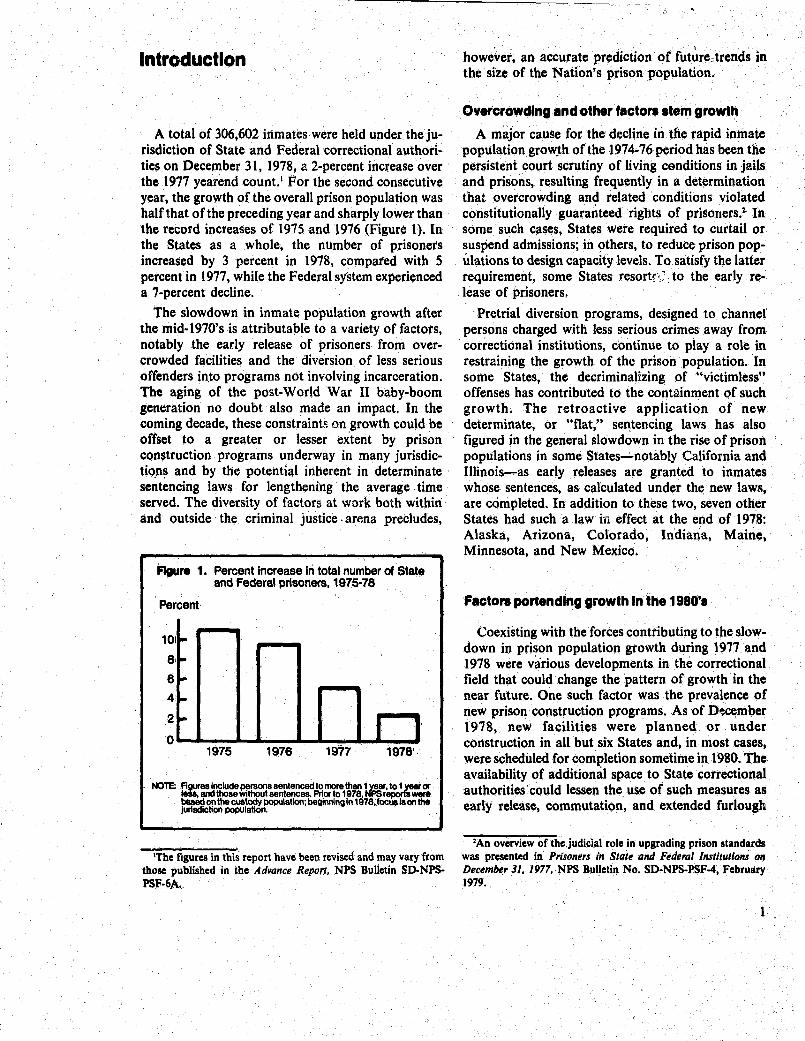
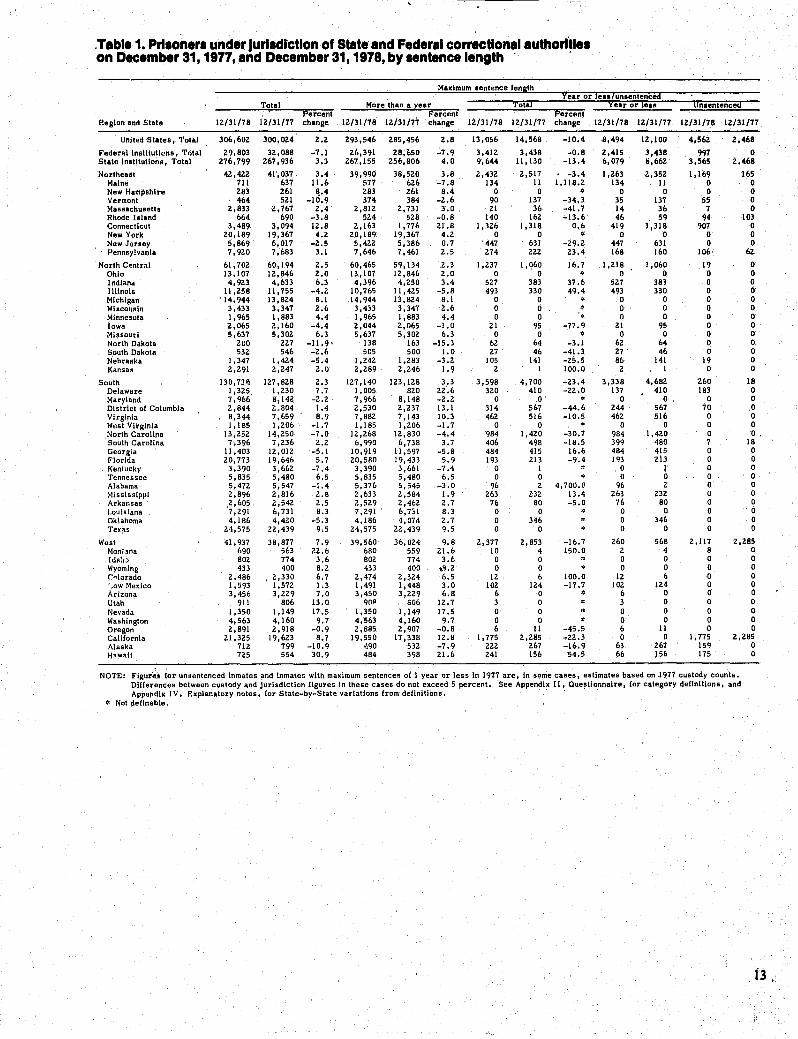
A total of 306,602 inmates were held under the jurisdiction of State and Federal correctional authorities on December 31, 1978, a 2-percent increase over the 1977 yearend count. I For the second consecutive year, the growth of the overall prison population was half that ofthe preceding year and sharply lower than the record increases of 1975 and 1976 (Figure 1). In the States as a whole, the number of prisoners increased by 3 percent in 1978, compal'ed with 5 percent in 1977, while the Federal system experienced a 7-percent decline.
The slowdown in inmate popUlation growth after the mid-1970's is attributaple to a variety of factors, notably the eady release of prisoners from overcrowded facilities and the diversion of less serious offenders in.to programs not involving incarceration. The aging of the post-World War II baby-hoom generation no doubt also made an impact. In the coming decade, these constraints on growth could be offset to a greater or lesser extent by prison con~truction programs underway in many jurisdictio.n~ and by the potential inherent in determinate sentencing laws for lengthening the average time served. The diversity of factors at work both within and outside' the criminal justice. arp,na precludes,
figure 1. Percent increase in total number of State and Federal prisoners, 1975·78
Percent·
10
8
6
4
2
o
I,,"
I~
'"' ',,"
'"' 1975
I J --
1976 1977 1978'
NOTE: Flgureslnclude P!If1Ions sentenced to more than 1 Y9llI. to 1 yeat es leSs. and those Without sentences. Pries to 1978. NPS repona __ besad on the custody population; beginning In 1978, focus is on the jurisdiction population.
IThe figures in this report have been revised and may vary from those published in the Advance Report, NPS Bulletin SD·Nps· PSJ1·6A ..
howe~er, an accurate prediction of fut~re-,trends in the size of the Nation's prison population. .
Overcrowding and other factors .tem growth
A major cause for the decline in the rapid inmate population grow.\h of the 1974-76 period has been the persistent court scrutiny of living canditions in jails and prisons, resulting frequently in a determination that overcrowding and related conditions violated constitutionally guaranteed rights of prisoners.1 In some such cases, States were required to curtail or suspend admissions; in others, to reduce prison populations to design capacity levels. To satisfy the latter requirement, some States resort{·,; -to the early release of prisoners.
Pretrial diversion programs, designed to cbannel' persons charged with less serious crimes away from correctional institutions, continue to play a role in restraining the growth of the prison population. In some States, the decriminalizing of "victimless" offenses has contributed to the containment of such growth. The retroactive application of new determinate, or "flat," se~tencing laws has also figured in the general slowdown in the rise of prison popUlations in some States-notably California and Illinois-as early releases are granted to inmates whose sentences, as calculated under the new law$, are completed. In addition to these two, seven other States had such a law in effect at the end of 1978: Alaska, Arizona, Colorado, Indiana, Maine, Minnesota, and New Mexico.
Factors ponendlng growth In the 1980' •.
Coexisting with the forces contributing to the slowdown in prison population growth during 1977 and 1978 were various developments in the correctional field that could change the pattern of growth in the near future. One such factor was the prevalence of new prison construction programs. As of D~cember 1978, new facilities were planned or under construction in all but six States and, in most cases, were scheduled for completion sometime in 1980. The availability of additioOlll space to State correctional authorities ·could lessen the use of such measures as early release, commutation, and extended furlough
2An overview of the.judicial role in upgrading prison standards was prcscn~ in Prisoners in State and Federal 1nstitutions on December 31. 1977. NPS Bulletin No. SD·NPS·PSF-4, February 1979.
Q
"and could help solve the space problem iii jurisdictions wh~re local jails have "been unable to accept additional St~teprisoners. , During 1978, .restrictions that had been imposed by th~~6i!!rtsupon correctional system.s· were rela~ed ill some c.ases. Authorities in, Maryland, for example, wer~ given. (10 exten§ion, of 22 months on an earlie,r order, to remove' 1';000 inmates from" two overcrowded' prisons. Indicatipns that' determinate sentenCing will result in longer average sentences also point to a greater accumulation of prisoners. Moreover, some flat-sentencing laws preclude the possibility of a suspended sentence or of probation, thus increasing the proportion of convicted criminals actually sent to' prison.
The prison popula_lon atvearend'
,By yearend 1978, the U.S. prison population had l¢~eled off ,slightly above the 300,000 mark .. In individual States, neither the total prisoner count nOlr the percentage change from 1977 was necessarily related to the size of the general population. Consistent with traditional patterns of distribution, the South held a proportion of the total-47 percent-that was markedly higher, than its shart~ of the overall U.S. population, whereas each of the other regions had lower proportions. There, were somewhat fewer State inmates housed in local jails at. the end of 1978 than a year earlier, and only 441 m.ore women inmates in, U.S. prisons. .
The past half century
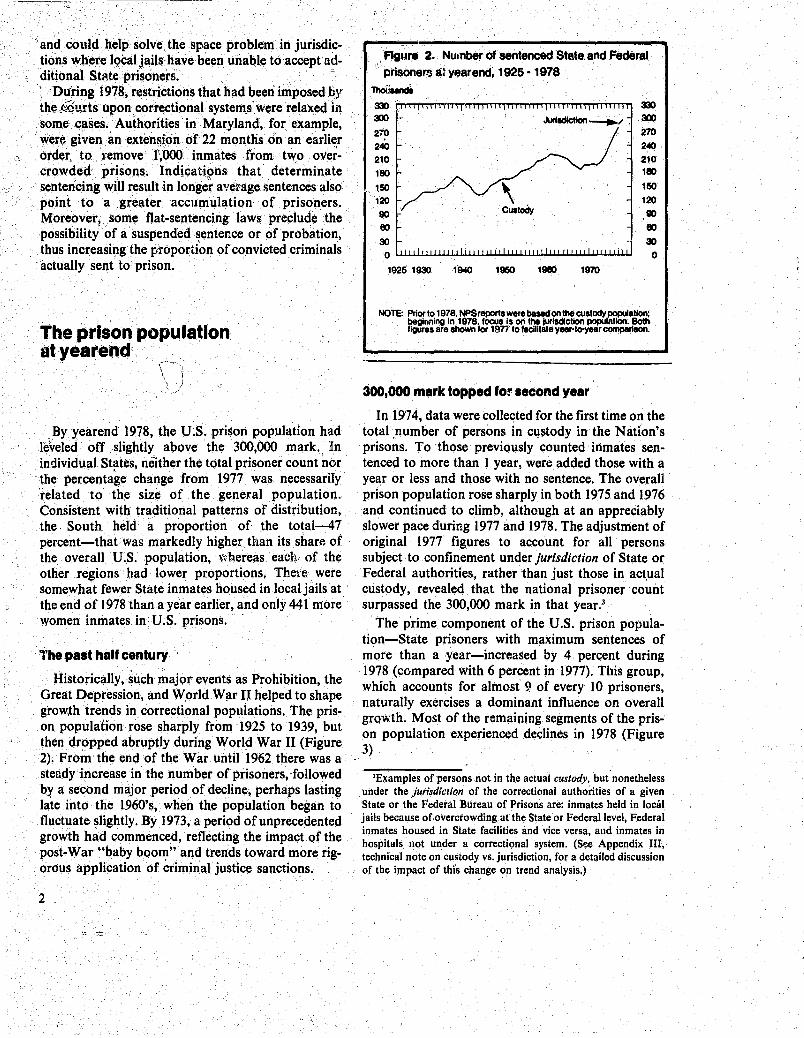
Historically, such'major events as Prohibition, the Great Depression, and World War II helped to shape grow,th trends in correctional populations. The prison population rose sharply from 1925 to 1939, but then dropped abruptly during World War II (Figure 2). From the end of the War until 1962 there was a steady increase in the number of prisoners, followed by a second major period of decline, perhaps lasting late into the 1960's, when the popUlation began to fluctuate slightly. By 1973, a period of unprecedented growth had commenced, reflecting the impact of the post-War "baby boom" and trends toward more rigorous ,application of criminal justice sanctions.
2
figure 2. Number of sentenced 'State and Federal
prisone~ at yearend, 1925 -1978
llIoi!.nda ~ .~' ~~n~~~~~~~~~~Nn~~ ~
300
270
240
210
180
Jurilldlctlon --. .... , " 300
120
90 80
30 o UU~~~~~~llU~~llU~llU~U~U 1925 1930 1940 19150 1980 1970
270
240 210 . 180
1150 120
ao 80
30 o
NOTE: Prior to 1978. NPSreportswere based on the c:ustodypopulatlon; l;legllinlng In 1978. focus is on the jurisdiction popuIotlon. Both figures are shown for 1877 to facilitate year-to-year cornparIeon. .
300.000 mark topped fo!" second year
In 1974, data were collected for the first time on the total.number of persons in c~~tody in the Nation's prisons. To those previously counted inmates sentenced to more than 1 year, were added those with a year or less and those with no sentence. The overall prison population rose sharply in both 1975 and 1976 and continued to climb, although at an appreciably slower pace during 1977 and 1978. The adjustment of original 1977 figures to account for all persons subject to confinement under jurisdiction of State or Federal authorities, rather than just those in act.ual custody, revealed that the national prisoner count surpassed the 300,000 mark in that year.)
The prime component of the U.S. prison population-State prisoners with maximum sentences of more than a year-increased by 4 percent during 1978 (compared with 6 percent in 1977). This group, which accounts for almost 9 of every 10 prisoners, naturally exercises a dominant influence on overall growth. Most of the remaining segments of the prison population experienced declines in 1978 (Figure 3)
'Examples of persons not in the actual custody, but nonetheless under the jurisdiction of the correctional authorities of a given State or the Federal Bureau of Prisons are: inmates held in local jails because of overcrowding at the State or Federal level, Federal inmates housed in State facilities and vice versa, and inmates in hospitals not under a correctional system. (See Appendix III, technical note on custody vs. jurisdiction, for a detailed discussion of the impact of this change on trend analysis.)
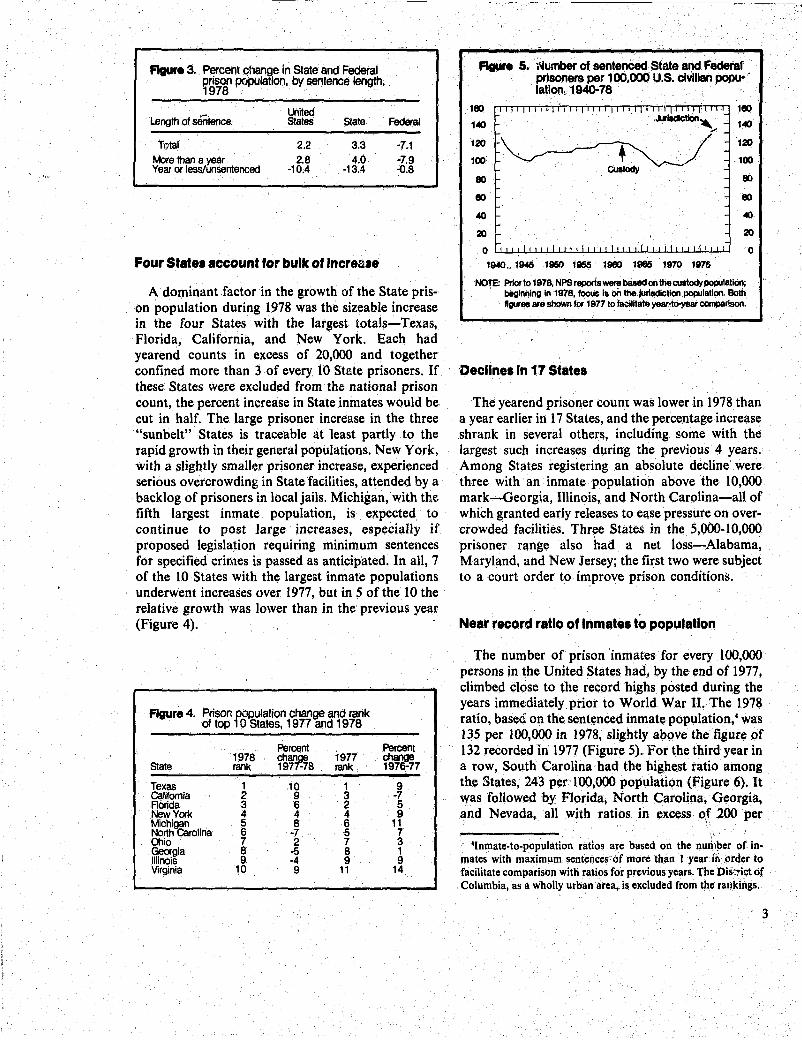
figure 3. Percent change in State and Federal prison P<"Jf)Ulation, by sentence length, 1978 i
Length of sentence United States Stale
Tptal 2.2 3.3 More than a year 2.8 4.0 Year or less/unsentenced -10.4 -13.4
Four State. account for bulk of Incres.e
Federal
-7.1 -7.9 -{l.S
A dominant factor in the growth of the State prison population during 1978 was the sizeable increase in the four States with the largest totals-Texas, Florida, California, and New York. Each had yearend counts in excess of 20,000 and together confined more than 3 of every 10 State prisoners. If these States were excluded from the national prison count, the percent increase in State inmates would be cut in half. The large prisoner increase in the three "sun belt" States is traceable at least partly to the rapid growth in their general populations. New York, with a slightly smaller prisoner increase, experienced serious overcrowding in State facilities, attended by a backlog of prisoners in local jails. Michigan, with the fifth largest inmate population, is expected to continue to post large increases, especially if proposed legislation requiring minimum sentences for specified crimes is passed as anticipated. In all, 7 of the 10·States with the largest inmate populations underwent increases over 1977, but in 5 of the 10 the relative growth was lower than in the previous year (Figure 4).
figure 4. Prison f8Rulation change and rank of top 0 States, 1977 and 1978
Percent 1977
Percent 1978 chanf-¥ ~7 State rank 197 -78 rank
Texas 1 10 1 9 california 2 9 3 -7 ROOda 3 6 2 5 New York 4 4 4 9 Michigan 5 8 6 11 North Carolina 6 -7 5 7 Ohio 7 2 7 3 Georgia 8 -5 8 1 Illinois 9 -4 9 9 Virginia 10 9 11 14
figure 5. 'l'\jumber of sentenCed. State and Federal pri8()fler8 per 100,000 U.S. civilian popu- . lation, 1940-78
1eo 1<10
120
100
eo eo .eo 20
o ~~~ww~~~~ww~~~~~~ 1940 .. :1945 1950 1955 1980 1986 1970 1975
120
,100
eo eo <10
20
o
NOTE: PrIor 10 1978. NPS reports wer8 based on theCUltodyJ)Ol)Ulatlon; beginning In 1978. focus lIS on the jurisdiction J)OI)Ulatlon. Both fllll'es are s/!()Wn for 197710 facilltale year-to-year oomparlson.
Declines In 17 States
The yearend prisoner count was lower in 1978 than a year earlier in 17 States, and the percentage increase shrank in several others, including. some with the largest such increases during the previous 4 years. Among States registering .an absolute decline were three with an inmate population above the 10,000 mark-Georgia, Illinois, and North Carolina-all of which granted early releases to ease pressure on over~ crowded facilities. Three States in the 5,000-10,000 prisoner range also had a net loss-Alabama, Maryland, and New Jersey; the first two were subject to a court order to improve prison conditions.
Near record ratio of Inmates to population
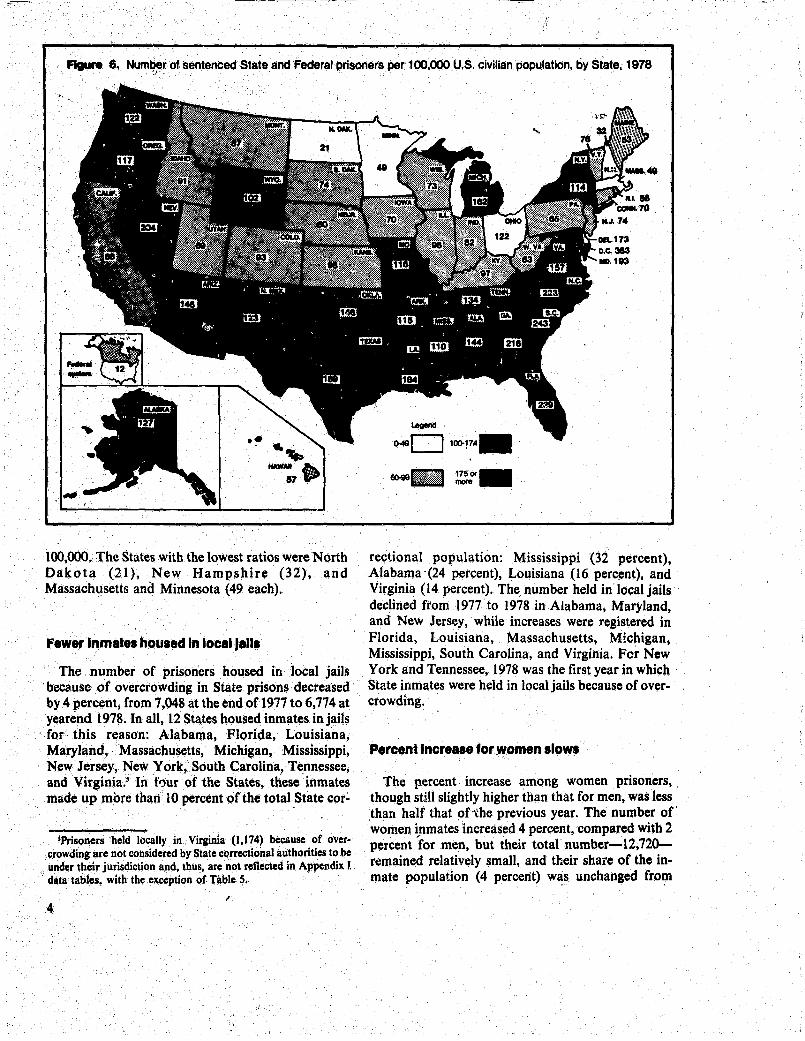
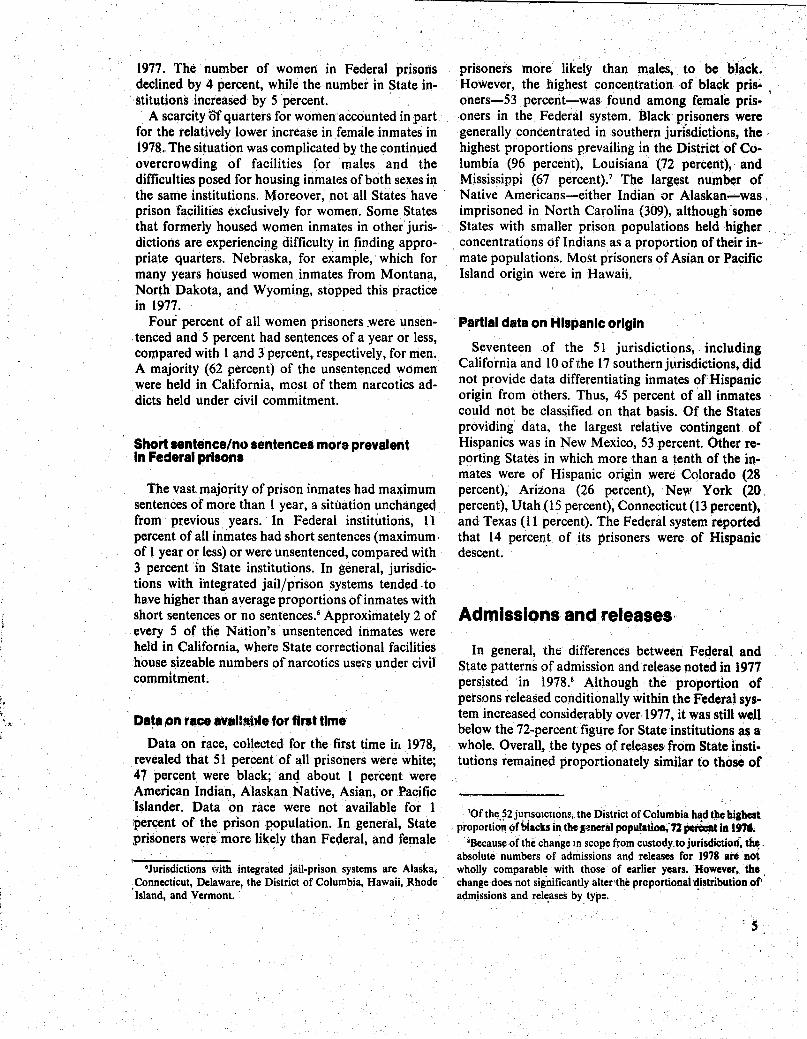
The number of prison inmates for every 100,000 persons in the United States had, by the end of 1977, climbed close to the record highs posted during the years immediately prior to World War II. The 1978 ratio, baseQ! on the sentenced inmate popUlation: was 135 per 100,000 in 1978, slightly above the figure of 132 recorded in 1977 (Figure 5) .. For the third year in a row, South Carolina had the highest ratio among the States, 243 per 100,000 population (Figure 6). It was followed by Florida; North Carolina, Georgia, and Nevada, all with ratios. in excess o;f 200 per
4Inmate-to-population ratios are based on the nulilper of inmates with maximum sentences:of more than I year ir.",order to facilitate comparison with ratios for previous years. The Dis,;ct of Columbia, as a wholly urban area, is excluded from the ratikings.
3
.-,.---.
" ('
figure 6~. Num~r of sent~nced State and Federal prisonerS per 100.000 U.S. c"ivilian population. by State. 1978 . ,_f,
.-. .~ IMWAII ...
57P
100,000. The States with the lowest ratios were North Dakota (21), New Hampshire (32), and Massachusetts and Minnesota (49 each).
Fewer Inmates housed In local Jails
The number of prisoners housed in local jails . beca.use of overcrowding in State prisons decreased by 4 percent, from 7,048 at the end of 1977 to 6,774 at yearend 1978. In all, 12 States housed inm~tes in jails for this reason: Alabama, Florida, Louisiana, Maryland •.. ' Massachusetts, Michigan, Mississippi, New Jersey, NeW-York, South Carolina, Tennessee, and Virginia;' In four of the States, these' inmates made up more than'.lO percent of the total.State cor-
'Prisoners held locally in .Virginia(l,174) because of overcrowding are not considered by State cQ!fectional authorities to be under their jurisdiction and, thus, arc not reflected in Appendix 1.
.J datatablcs, with the exception of. Table S.
;
4
rectional population: Mississippi (32 percent), Alabama '(24 percent), Louisiana (16 percent), and Virginia (14 percent). The number held in local jails declined from 1977 to 1978 in Alabama, Maryland, and New Jersey, while increases were registered in Florida, Louisiana, Massachusetts, Michigan, Mississippi, South Carolina, and Virginia. For New York and Tennessee, 1978 was the first year in which State inmates were held in local jails because of overcrowding.
Percent Increase for)Yomen siowl
The percent increase among women prisoners, though stm slightly higher than that for men, was less than half that ~hhe previous year. The number of' women ~nmates increased 4 percent, compared with 2 Percent for men, but their total number-l 2,720-remained relatively small, and their share of the inmate population (4 percent) was unchanged from
1977. The number of women in Federal prisons declined by 4 percent, while the number in State institutions increased by 5 percent.
A scarcity Of quarters for women accounted in part for the relatively lower increase in female inmates in 1978. The situation was complicated by the continued overcrowding of facilities for males and the difficulties posed for housing inmates of both sexes in the same institutions. Moreover, not all States have' prison facilities exclusively for women. Some States that formerly housed women inmates in other jurisdictions are experiencing difficulty in finding appropriate quarters. Nebraska, for example, which for many years housed women inmates from Montana, North Dakota, and Wyoming, stopped this practice in 1977.
Four percent of all women prisoners ,were unsen,tenced and 5 percent had sentences of a year or less, compared with I and 3 percent, respectively, for men. A majority (62 percent) of the unsentenced women were held in California, most of them narcotics addicts held under civil commitment.
Short Hntence/m) sentences more prevalent In Federal prisons
The vast majority of prison inmates had maximum sentences of more than I year, a situation unchanged from previous years. In Federal institutions, II percent of an inmates had short sentences (maximumof I year or less) or were unsentenced, compared with 3 percent in State institutions. In general, jurisdictions with integrated jail/prison systems tended ,to have higher than average proportions of inmates with short sentences or no sentences.6 Approximately 2 of every 5 of the Nation's unsentenced inmates were held in California, where State correctional facilities house sizeable numbers of narcotics use,s under civil commitment.
Data pn race avan~hle for first time
Data on race, collected for the first time in 1978, revealed that 51 percent of all prisoners were white; 47 percent were black; an4 about I percent were American Indian, Alaskan Native, Asian, or Pacific 'Islander. Data on race were not available for I percent of the prison population. In general, State prisoners were more lik~ly than Federal, and female
'Jurisdictions with integrated jail-prison systems are Alaska, Connecticut, Delaware, the District of Columbia, Hawaii, Rhode 'Island, and Vermont. '
prisoners more likely than males, to be black. However, the highest concel)ttation of black pris- I
oners-53 percent-was found among female pris,oners in the Federal system. Black prisoners were generally concentrated in southern juri'sdictions, the, highest proportions prevailing in the District of Columbia (96 percent), Louisiana (72 percent), and Mississippi (67 percent).' The largest number of Native Americans-either Indian or Alaskan-was, imprisoned in North Carolina (309), although 'some States with smaller prjson popUlations held higher , concentrations of Indians as a proportion of their inmate popUlations. Most prisoners of Asian or Pacific Island origin were in Hawaii.
Partial data on Hispanic origin
Seventeen of the 51 jurisdictions, including California and 10 of the 17 southern jurisdictions, did not provide data differentiating inmates of Hispanic origin from others. Thus, 45 percent of all inmates could not be classified on that basis. Of the States providing data, the largest relative contingent of Hispanics was in New Mexico, 53 percent. Other reporting States in which more than a tenth of the inmates were of Hispanic origin were C()lorado (28 percent), Arizona (26 percent), New York (20 percent), Utah (15 percent), Connecticut (13 percent), and Texas (11 percent). The Federal system reported that 14 percent of its prisoners were of Hispanic descent.
Admissions and releases·
In general, the differences between Federal and State patterns of admission and release noted in 1977 persisted in 1978.8 Although the proportion of persons released conditionally within the Federal system increased considerably over 1977, it was still well below the 72-percent figure for State institutions as a whole. Overall, the types of releases from State institutions remained proportionately similar to those of
'Of the.?2 j~r~SQlctlOns, the District of Columbia hll:d the highest proportio,! Qr blacks in the l~neraJ populatio .. ;n petO::at ill 197 ••
"Because of the change 1ft scope from custody.to jurisdiction: th~, absolute numbers of admissions and releases for 1978 arc not wholly comparable with those of earlier years. 'HQwevcr, the . change does not sig'nificantly alter 'the proportional 'distribution of' admissions and relc:ases by type. .
'5
: FIgLn 7. Ratio of admissions to releases, 197..4-78 -- (Stale and Feden!J institutions)
.1974" 1975" 1976 1977 1978
IlIA Not availlible.
Admis.';ions per 10 releases
11.1 11.6 11.5 11.0 10.5
*Adiusted to eKclude authaized temporary absences to conform v.;" lilter years.
the previous year. Within. certain States, however, important changes took place in the pattern of releases during 1978.
Adml •• lon/r ...... r.tlo f.ns
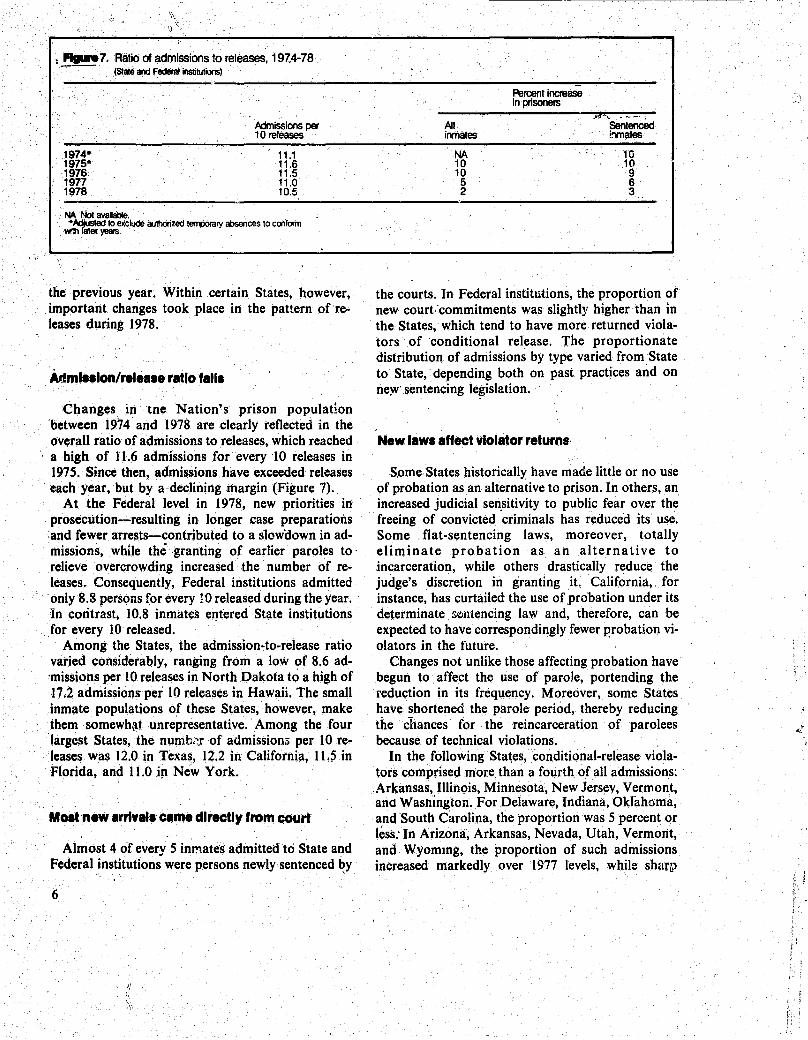
Changes in tne Nation'.s prison population 'between 1974 and 1978 are clearly reflected in the overall ratio of admissions to releases, which reached a high of 11.6 admissions for every 10 releases in 1975. Since then, admissions have exceeded releases each year, but by a declining margin (Figure 7).
At the Federal level in 1978, new priorities in prosecution-resulting in longer case preparations :and fewer arrests-contributed to a slowaown in admissions, while the . granting of earlier paroles to' .relieve overcrowding increased the number of releases. Consequently, Federal institutions admitted only 8.8 persons for every 10 released during the year .. -In coritrast, 10.8 inmates entered State institutions for every 10 released.
Among the States, the admission-to-release ratio varied considerably, ranging from a low of 8.6 ad'missions per 10 releases in North Dakota to a high of 17.2 admissions per 10 releases in Hawaii. The small inmate populations of these States,.however, make them somewh(lt unrepresentative. Among the four largest States, the numb,~r of' admission5 per 10 releases was 12.0 in Texa~, 12.2 in California, 1l.5in Florida, and 11.0 in New York.
Most new .rrlvals cam. directly from court
Almost 4 of every 5 inmates admitted to State and Federal institutions were persons newly sentenced ~y
6
II
All inmates
NA 10 10 5 2
Percent inaease in prisoners
w .... w_" -.
Sentenced imlates
10 10· 9' 6 3
the courts. In Federal institutions, the proportion of new court 'commitments was slightly higher than in the States, which tend to have more returned violators of conditional release. The proportionate distribution of admissions by type varied from State to State, depending both on past· practices and on ne~' sentencing legislation.
N.w I.ws .ffect vlol.tor returns·
Some States historically have made little or no use of probation as an alternative to prison. In others, an increased judicial sen,sitivity to public fear over the freeing of convicted criminals has reduced its use. Some flat-sentencing laws, moreover, totally eliminate probation as an alternative to incarceration, while others drastically reduce the judge's discretion in granting it. California" for instance, has curtailed the use of probation under its determinate se:ntencing law and, therefore, can be expected to have correspondingly fewer p'robation violators in the future.
Changes not unlike those affecting probation have begun to affect the use of parole, portending the reduction in its frequency. Moreover, some States have shortened the parole period, thereby reducing the c11ances for the reincarceration of parolees because of technical violations.
In the following Sta~es, conditional-release violators comprised more than a fourth of all admissions: .Arkansas, Illinois, Minnesota, New Jersey, Vermont, and Wasnington. For Delaware, Indiana,Okfahoma, and South Carolina, the proportion was 5 percent or less: In Arizona, Arkansas, Nevada, Utah, Vermont, and Wyommg, the proportion of such admissions increased markedly over 1977 levels, while sh~lrp
decreases occurred in Alabama, Delaware, Ha'waii, Maine; Oklahoma, and South Carolina.
In general, increases in the proportion of conditionally released violators returned to prison were attributable-:to increased numbers of parolees in the years prior to 1978, to decision-making changes in the parole process, and to the greater staffing of parole boards. Decreases occurred for the mosi part in States where there were fewer conditional releases in the years immediately prior to 1978 or where overcrowding prevented the return of less serious violators.
Elcap .. I/AWOLI account for 11n 20 mov.m.ntl
Nationwide, returned escapees or absentees without leave (A WOLs) comprised 5 percent of all admissions. Not surprisingly, the proportion of inmates admitted as returned escapees or A WOLs was higher than average in those States that reported a relatively high number of unauthorized departures.
With respect to releases, escapes and A WOLs accounted for 5 percent of all departures from State; prisons, down slightly from previous years. Extreme variations in the data reported suggest that administrative regulations and/or practices concerning such unauthorized departures differ radically and that the figures reported do not necessarily represent accurate measures of security in particular correctional systems. In some States almost any unaccounted-for absence warrants one or the other designation, while in others each is predicated on the lapse of specific time periods. States that reported a relatively high incidence of ';i1~pes or A WOLs (more than a tenth of all releases) included Utah (23 percent), Michigan (15 percent), Arizona (15 percent), WashiQgton (14 percent), Tennessee (14 percent), Vermont (13 p:rcent), Massachusetts (12. percent), and Delaware and Hawaii (11 percent each).
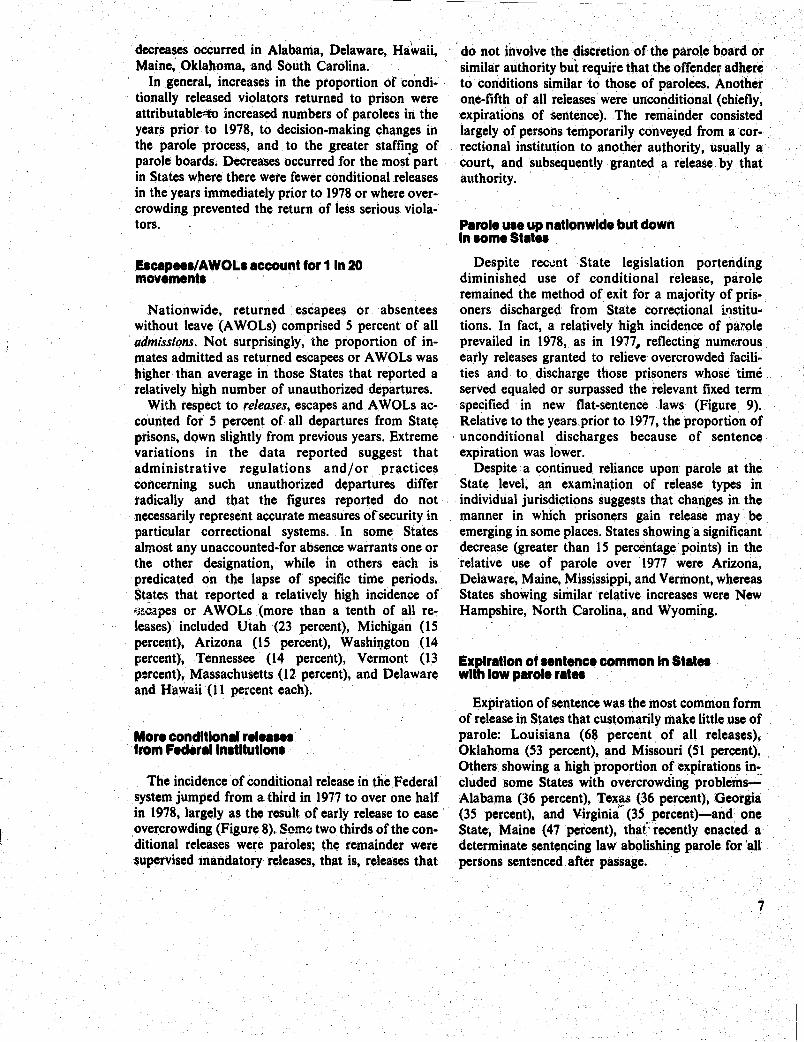
Mor. condition" r.I ..... from F.d.rallnltltutlonl
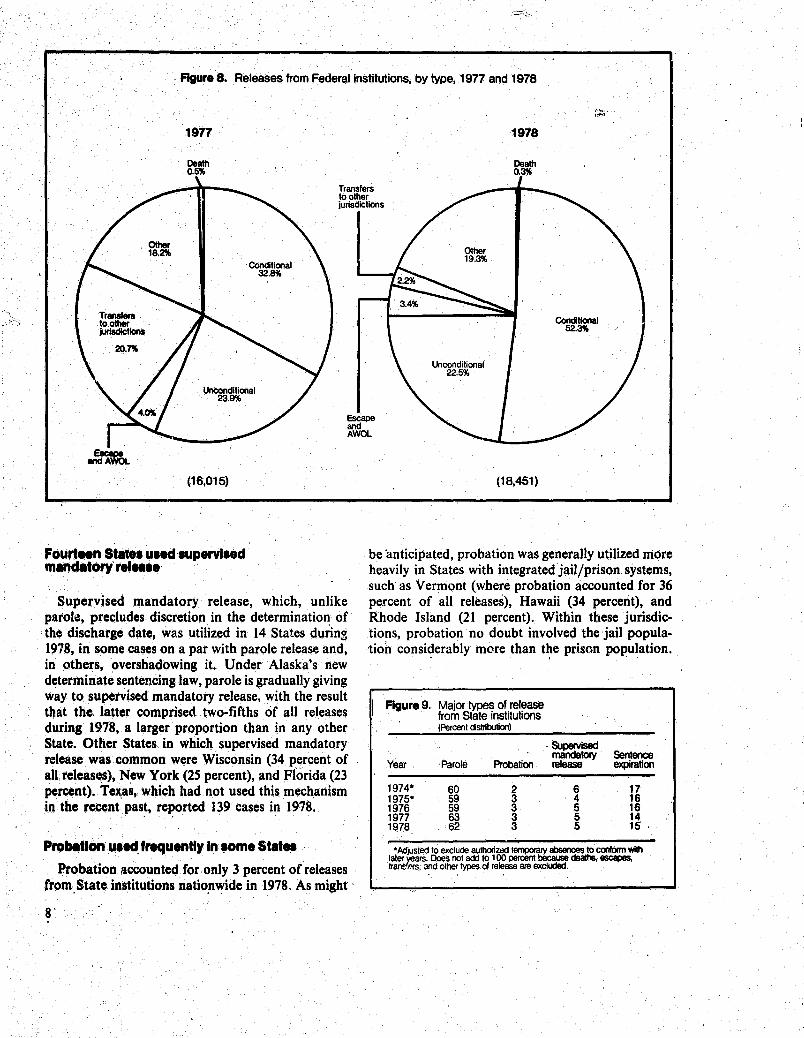
The incidence of conditional release in the .Federal system jumped from a third in 1977 to over one half in 1978, largely as the result of early release to ease overcrowding (Figure 8). Som~ two thirds of the conditional rCileases were paroles; the remainder were supervised mandatory releases, that is, releases that
do not involve the discretion of the parole board or similar authority but require that the offender adhere to conditions similar to those of parolees. Another one-fifth of all releases were unconditional (chiefly, expirations of sentence). The remainder consisted largely of persons temporarily conveyed from a cor- .rectional institution to another authority, usually a court, anq subsequently granted a release by that authority.
Parol. UI. up nationwide but down In 10m. Statel
Despite rec~nt State legislation portending diminished use of conditional release, parole remained the method of exit for a majority of prisoners discharged from State correctional in.stitutions. In fact, a relatively high incidence of patole prevailed in 1978, as in 1977, reflecting numt;rous early releases granted to relieve overcrowded facilities and to discharge those prisoners whose time served equaled or .surpassed the relevant fixed term specified in new flat-sentence laws (Figure 9). Relative to the years prior to 1977, the proportion of unconditional discharges because of sentence expiration was lower.
Despite a continued reliance upon parole at the State level, an examina~ion of release . types in individual jurisdictions suggests that changes in the manner in which prisoners gain release may be emerging in some places. States showing a significant decrease (greater than 15 percentage points) in the relative use of parole over 1977 were Arizona, Delaware, Maine, Mississippi, and Vermont, whereas States showing similar relative increases were New Hampshire, North Carolina, and Wyoming.
Expiration of I.ntence common In Stat .. with low parol. rat ..
Expiration of sentence was the most common form of release in States that customarily make little use of parole: Louisiana (68 percent of all releases), Oklahoma (53 percent), and Missouri (51 percent). Others showing a high proportion of expirations included some States with overcrowding problems~ Alabama (36 percent), Texas (36 percent), Georgia (35 percent), and Virginia·' (35percent)-and one State, Maine (47 percent), thai-recently enacted a determinate sentencing law abolishing parole for 'all persons sentenced after passage.
7
>=---
figure 8. Releases from Federal institutions, by type. 1977 and 1978
•. , ...... .-1977 1978
Death Death 0.5% 0.3%
Transfers to other jurisdictions
Other
Conditional 19.3%
32.8%
CondItional 52.3%
Unconditional 22.5%
Escape and AWa.
~ (16.015)
Fourteen St •••• U.ed'.up.rvl.ed m.nd.tory r.I ....
Supervised mandatory release, which, unlike parole, precludes discretion in the determination of the discharge date, was utilized in 14 States during 1978, in some cases on a par with parole release and; in others, overshadowing it. Under Alaska's new d~terminate sentencing law, parole is gradually giving way to supervised mandatory release, with the result that the latter comprised two-fifths of all releases during 1978, a larger proportion than in any other State. Other States in which supervised mandatory release was common were Wisconsin (34 percent of all releases), New York (25 percent), and Florida (23 percent). Texas, which bad not used this mechanism in the recent past, reported 139 cases in 1978.
, .
Probation u.td. frequently In 10m. St.t ..
Probation accounted for only 3 percent of releases from,State institutions natio.nwide in 1978, As might·
(18.451)
be 'anticipated, probation was generally utilized more heavily in States with integrated jail/prison systems, such as Vermont (where probation accounted for 36 percent of all releases), Hawaii (34 percent), and Rhode Island (21 percent). Within these jurisdictions, probation no doubt involved the jail population considerably more than the prison population.
. ."
figure 9, Major types of release , from State institutions
(Percenl distribution)
Su 'sed ~tory Sentence
Year Parole Probation release expiration
1974* 60 2 6 17 1975* 59 3 4 16 1976 59 3 5 16 1977 63 3 5 14 1978 62 3 5 15 '
• Adjusted to exclude authorizecl temporary absences to conl6nn with later years. Does not add to 1 00 percent because deaths. escapes, lrans!I1rS, and other types of release are excluded. . .
Probation was relatively common also in States that . made use of "shock" probation, a sentence consisting
of a brief period in prison followed by probation: Idaho (43 percent), Indiana (10 percent), Kansas (26 percent), Kentucky (12 percent), Maine (15 percent), and Ohio (18 percent),9 In addition, South Carolina reported 15 percent of its releases as probationary.
D •• "hI of 832 prl.oner. repoi1~
In all, 632 deaths, 19 of them women, were reported by State and Federal correctional institutions to have occurred during 1978. Six of the 45 jurisdictions reporting deaths did not distinguish thelr cause. Of the 456 deaths that were classified, some 63 percent were attributed to illness or natural causes, while I in 5 were reported as caused by another person. Fourteen percent of all classified deaths, 62 men and 1 woman. were suicides. The remaining 4 percent were the result of accidental self-injury. J'here were no executions during 1978.
O·verall, the death rate per 100,000 inmates in State and Federal prisons was 206, far higher than the death rate among persons of a comparable age composition in the U .S. gen~ral population. The rate was considerably higher in State than in Federal facilities-209 compared with 178 deaths per 100,000. The highest death rate was among the States in the North Central region (227), followed by the West (224), the South (211), and lastly, the Northeast (163).
'Delaware, lhe District of Columbia, Georgia, New Mexico, North Carolina, and Oklahoma showed I_wer usage of probation than actually occurred because they excluded from their NPS counts those persons who received, as part of a sentence split between prison and probation, a confinement period of less than 1 year.

,
,Table 1. PrI.oner. under Jurl.dletlon of State and Federal eorreetlonalauthorltle. on December 31,1977, and December 31, 1978, by lenteneelength . .
Maximum lentence 1ensth Vear or lel17unlentence<l
Total More than a ~e.r Total Year or lei. Dnlentenced Percent F~rcent Percent
Region and State IZ/31/78 IZ/31/77 change IZ/31/78 IZ/31/77 change IZ/31/78 IZ/31/77 change IZ/31/78 IZ/31/77 IZ/31/78 IZ/31/77
United States, Total 306,602 300,024 2.2 293,546 285,456 2.8 13,056 14,568 -10.4 8,494 12,100 4,56Z 2,468
Federal Institutions, Total 29,803 32,088 -7.1 26,391 28,lI50 -7.9 3,412 3,438 -0.8 2,415 3,438 997 0 State Institutions, Total 276,799 267,936 3.3 267,155 256,806 4.0 9,644 11,130 -13.4 6,079 8,662 3,565 2,468
Northeast 42,422 41',037 3.4 39,990 38,520 3.8 2,432 2,517 -3.4 1,263 2,352 1,169 165 Maine 711 637 11.6 577 626 -7.8 134 II 1,118.2 134 II 0 0 New Hampshire 283 261 ".4 283 261 8.4 0 0 ~ 0 0 0 0 Vermont 464 521 -10.9 374 384 -2.6 90 137 -34.3 35 137 55 0 Massachusetts 2,833 2,767 2.4 2,812 2,731 3.0 21 36 -41.7 14 36 7 0 Rhode Island 664 690 -3.8 524 528 -0.8 140 162 -13.6 46 59 94 103 Connecticut 3,489 3,094 12.8 2,163 1,776 21.8 1,326 1,318 0.6 419 1,318 907 0 New York 20,189 19,367 4.2 20,189 19,367 4.2 0 0 ~ 0 0 0 0 New Jersey 5,869 6,017 -2.5 5,422 5,386 0.7 447 631 -29.2 447 631 0 0 Pennsy!vanla 7,920 7,683 3.1 7,646 7,461 2.5 274 222 23.4 168 160 106 62
North Central 61('02 60,194 2.5 60,465 59,134 2.3 1,237 1,060 16.7 1,218 1,060 19 0 Ohio 13,107 12,846 Z.O 13.,107 12,846 2.0 0 0 ~ 0 0 0 0 Indiana 4,923 4,633 6.3 4,396 4,250 3.4 527 383 37.6 527 383 0 0 IllInol. II ,258 11,755 -4.2 10,765 11,425 -5.8 493 330 49.4 493 330 0 0 Michigan 14,944 13,824 8.1 14,944 13,824 8.1 0 0 * 0 0 0 0 Wisconsin 3,433 3,347 2.6 3,433 3,347 2.6 0 0 ~ 0 0 0 0 Minnesota 1,965 1,883 4.4 1,965 1,883 4.4 0 0 * 0 0 0 0 Iowa 2,065 2,160 -4.4 2,044 2,065 -1.0 21 95 -77.9 21 95 0 0 Missouri 5,637 5,302 6.3 5,637 5,302 6.3 0 0 * 0 0 0 0 North Dakota 200 Z27 -11.9 ' 138 163 -15.3 62 64 -3.1 62 64 0 0 South Dakota 532 546 -2.6 505 500 1.0 27 46 -41.3 27 46 0 0 Nebraska 1,347 1,424 -5.4 1,242 1,283 -3.2 105 141 -25.5 86 141 19 0 Kansas 2,291 2,247 2.0 2,289 . 2,246 1.9 2 1 100.0 2 1 0 O·
South 130,7J!'t 127,828 2.3 127,140 123,128 3.3 3,598 4,700 -23.4 3,338 4,682 260 18 Delaware 1,325 1,230 7:' 1,005 820 22.6 320 410 -22.0 137 410 183 0 Maryland 7,966 8,14e -2.2 7,966 8,148 -2.2 0 0 • 0 0 0 0 01 strict of Columbia 2,844 ~.,a04 1.4 2,530 2,237 13.1 314 567 -44.6 244 567 70 0 Virginia 8,344 7,659 8.9 7,882 7,143 10.3 462 516 -10.5 462 516 0 0 \~e.t Virginia 1,185 1,206 -1.7 1,185 1,206 -1.7 0 0 * 0 0 0 0 North Carolina 13,252 14,250 -7.0 12,268 12,830 -4.4 984 1,420 -30.7 984 1,420 0 0 South Carolina 7,396 7,236 2.2 6,990 6,738 3.7 406 498 -18.5 399 480 7 18 Georgia 11,403 12,012 -5.1 10,919 11,597 -5.8 484 415 16.6 484 415 0 0 Florida 20,773 19,646 5.7 20,580 19,433 5.9 193 213 -9.4 193 213 0 0 Kentucky 3,390 3,662 -7.4 3,390 3,661 -7.4 0 1 * 0 1 0 0 Tennessee 5,835 5,480 6.5 5,835 5,480 6.5 0 0 * 0 0 0 0 Alabama 5,472 5,547 -1.4 5,376 5,545 -3.0 96 2 4,700.0 96 2 0 0 ~llsslsslppl 2,896 2,816 2.8 2,633 2,584 1.9 263 i;32 13.4 263 232 0 0 Arkansas 2,605 2,542 2.5 2,529 2,462 2.7 76 80 -5.0 76 80 0 0 Louisiana 7,291 6,731 8.3 7,291 6,7:1I 8.3 0 0 • 0 0 0 0 Oillahoma 4,186 4,420 -5.3 4,186 4,074 2.7 0 346 • 0 346 0 0 Tc).'<\s 24,575 22,439 9.5 24,575 22,439 9.5 0 0 • 0 0 0 0
West 41. 937 38,877 7.9 39,560 36,024 9.8 2,377 2,853 -16.7 260 568 2,117 2,285 ~fon~,lna 690 563 22.6 680 559 21.6 10 4 150.0 2 4 8 0 IdaltJ 802 774 3.6 802 774 3.6 0 0 · 0 0 0 0 Wyoming 433 400 8.2 433 400 ,,~.2 0 0 • 0 0 0 0 C"lorado 2,486 2,330 6,7 2,474 2,324 6.5 12 6 100.0 12 6 0 0 ~.cw Mexico 1,593 1,572 1.3 1,491 1,448 3.0 102 124 -17.7 102 124 0 0 Arizona 3,456 3,229 7.0 3,450 3,229 6.8 6 0 * 6 0 0 0 Utah 911 806 13.0 qO~ BG6 12.7 3 0 * 3 0 0 0 Nevada 1,350 1,149 17.5 1,350 1,149 17.5 0 0 " 0 0 0 0 Washington 4,563 4,160 9.7 4,563 4,160 9.7 0 0 • 0 0 0 0 Oregon 2,891 2,918 -0.9 2,885 2,907 -0.8 6 11 -45.5 6 11 0 0 California 21,325 19,623 8.7 19,550 17,338 12.8 1,775 2,285 -22.3 0 a 1,775 2,285 Alaska 712 799 -10.9 ,\90 532 -7.9 222 267 -16.9 63 267 159 0 How,1I 725 554 30.9 484 398 21.6 241 156 54.5 66 156 175 0
NOTE: Figur~8 for unsentenced inmates and inmates with maximum sentences of 1 year or less in 1977 are, in some cases, estimates based on 1977 custody counts. DiUerences between custody and jurisdiction figures in these cases do not exceed 5 percent. See Appendi~ II ~ Que~ti~nnaire, (or category definitions, and Appendix I V. Explanatory notes t for State-by-State variations (rom definitions.
* Not dellnab1e.
13
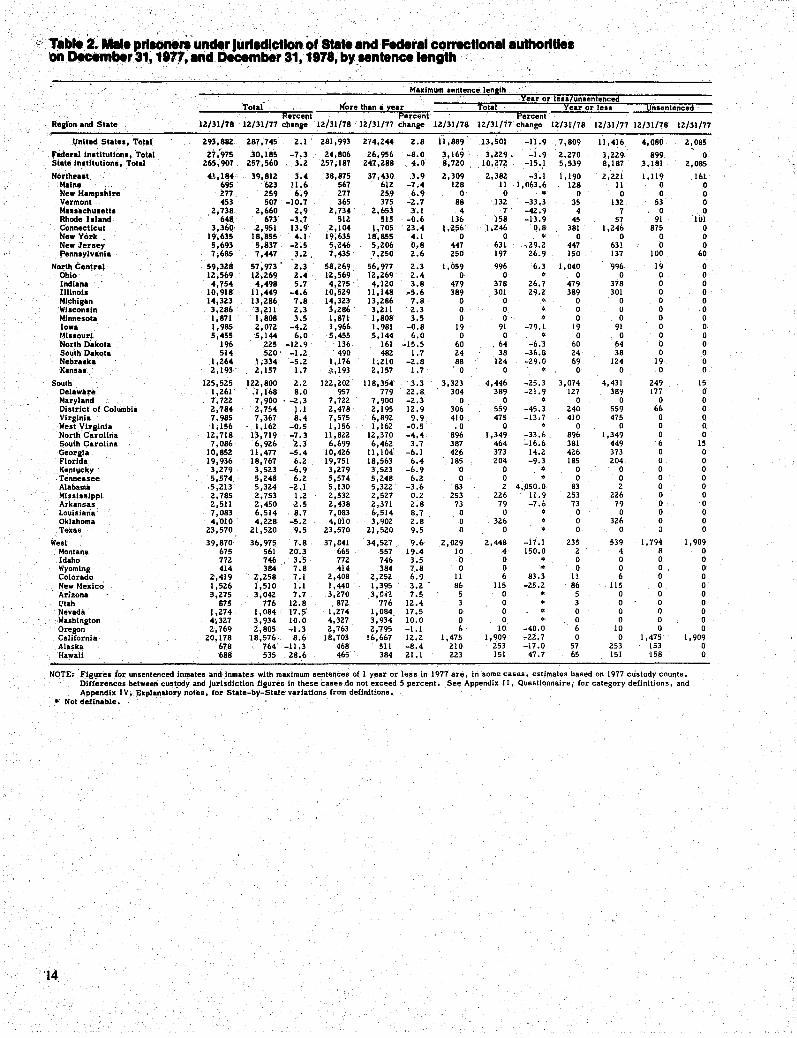
t:' Table 2. Male prlloneri' un.r JurllCllctlono,'State and Fecleral correctlonalauthorltle. 'On December 31, 1971, and December 31, 1978, by .. ntenee length '
Maximum lentence len th
Total ear or e •• unsentenced
;,(ore than a lear 'fatal. 'i'ear or Ie •• Unlentenced Percent Percent Percent
Re&!on and State 12/31/78 12/31/77 change 12/31/78 12/31/77 change IZ/31/78 IZ/31/77 chonge 12/31/78 12/31177 12/31/78 12/31/77
,United States, Total 293,88Z 287,745 2.1 281,993 274,244 2.8 11,889 ,13,501 -11.9 7,809 11,416 4,080 2,085
Federal Institutions, Total 27:975 30,185 -7.3 24,806 26,956 -8.0 3,169 3,229. -1.9 2,270 3,229 899 0 State Institution., Total 265,907 257,560 3.2 257,187 247,288 4.0 8,120 ,10,212 -15',1 5,539 8,187 3,181 2,085
Northeut 41,184 39,812 3.4 '38,875 37,430 .3.9 2,309 2,38Z -3.1 1,190 2,221 1,119 161 Maine 695 623 !l.6 567 612 -7.4 128 II 1,063.6 128 II 0 0 New Hampshire i,77 259 6;9 277 259 6.9 0 0 * 0 0 0 0 Vermont 453 507 -10.7 365 375 -2.7 88 132 -33.3 35 132 53 0 M •••• chu.ett. 2,738 2;660 2.9 2,734 2,653 3.1 4 7 -42.9 4 7 0 0 Rhode Island 648, 673 -3.7 512 SIS -0.6 136 158 -13.9 45 57 91 101 Connecticut 3,360 2,951 13.9 2,104 1,705 23.4 1,256 1,246 0.8 381 1,246 875 0 New York. 19,635 18,855 4.1 19,635 18,855 4.1 0 0 * 0 0 0 0 New Jersey 5,693 5,837 -2.5 5,246 5,206 0,.8 447 631 .. 29.2 447 631 0 0 Pennlylvania 7,685 7,447 3.2. 7,435 ,7,250 2.6 250 197 26.9 150 137 100 60
North Central 59,328 57,973 . 2.3 58,269 56,977 2.3 1,059 996 6.3 1,040 996 19 0 Ohio 12,569 12,269 2.4 12,569 12,269 2.4 0 0 ~ 0 0 0 0 Indiana 4,754 4,498 5.7 4,275 4,120 3.8 479 378 26.7 479 378 0 0 Illinois 10,918 11,449 -4.6 10,529 11,148 -5.6 389 301 29.2 389 301 0 0 Michigan 14,323 13,286 7.8 14,323 13,286 7.8 0 0 .' 0 0 0 0 Wisconiin 3,286 3,211 2.3 3,286 3,211 2.3 0 0 0 0 0 0 Minnesota 1,871 1,808 3.5 1,871 1,808 3.5 0 0 * 0 0 0 0 Iowa 1,985 2,012 -4.2 1,966 1,981 -0.8 19 91 -79.1 19 91 0 0 Miliouri 5,455 5,144 6.0 5,455 5,144 6.0 0 0 * 0 0 0 0 North Dakota 196 225 -12.9 136 161 -15.5 60 .64 -6.3 60 64 0 0 South Dakota 514 520 . -1.2 . 490 482 1.7 24 38 -36.8 24 38 0 0 Nebr .. ka 1,264 1,334 -5.2 1,.176 1,210 -2.8 88 124 -29.0 69 124 19 0 Kans ••. 2,193 2,157 1.7 ;;,193 2,157 1.7 0 0 * 0 0 0 0
South 125,525 122,800 2.2 122,202 118,354 3.3 3,323 4,446 -25.3 3,074 4,431 249 15 Delaware 1,261 .1,168 8.0 957 779 22.8 304 389 -21.9 127 389 177 0 Maryland 7,122 7,900 ' -2.3 7,722 7,900 -2.3 0 0 * 0 0 0 0 District of Columbia 2,784 2,754 ! .1 2,478 2,195 12.9 306 559 -45.3 240 559 66 0 Virginia 7,985 7,367 8.4 7,575 6,892 9.9 410 475 . -13.7 410 475 0 0 West Virginia 1,156 1,162 -0.5 1,156 1,162 -0.5 ,0 0 * 0 0 0 0 North Carolina IZ,718 13,719 -7.3 lI,8Z2 12,370 -4.4 896 1,349 -33.6 896 1,349 0 0 South Carolina 7,086 6,926 '2.3 6,699 6,462 3.7 387 464 -16.6 381 449 6 15 Georgia 10,852 11,477 -5.4 10,426 11,104' -6.1 426 373 14.2 4Z6 373 0 0 Florida 19,936 18,767 6.Z 19,751 18,563 6.4 185 204 -9.3 185 Z04 0 0 Kentucky 3,279 3,523 -6.9 3,279 3,523 -6.9 0 0 * 0 0 0 0
-Tennessee 5,574. 5,248 6.2 5,574 5,248 6.2 0 0 * 0 0 0 0 Alabama .5,213 5,324 -2.1 5,130 5,322 -3.6 83 2 4,p50.0 83 2 0 0 Mississippi 2,785 2,753 1.2 2,532 2,527 0.2 253 226 11.9 253 226 0 0 Arkansas 2,511 2,450 2.5 2,438 2,371 2.8 73 79 -7.6 73 79 0 0 Louisiana 7,083 6,514 8.7 7,083 6,514 8.7 0 0 0 0 0 0 Oklahoma 4,010 4,228 -5.2 4,010 3,902 2.8 0 326 0 326 0 0 Texas 23,570 21,520 9.5 23,570 21,520 9.5 0 0 * 0 0 0 0
West 39,870 36,975 7.8 37,841 34,527 9.6 2,029 2,448 -17.1 235 539 1,794 1,909 Montana 675 561 20.3 665 557 19.4 10 4 150.0 2 4 8 0 Idaho 712 746 3.5 772 746 3.5 0 0 * 0 0 0 0 Wyoming 414 384 7.8 414 384 7.8 0 0 * 0 0 0 0 Colorado 2,419 Z,258 7.1 2,408 2,252 6.9 II 6 83.3 11 6 0 0 New Mexico 1,526 1,510 1.1 1,440 1,395 3.2 . 86 115 -25.2 86 115 0 0 Arizona 3,275 3,042 7.7 3,270 3,IHZ 7.5 5 0 * 5 0 0 0 Utah 875 776 12.8 872 '176 12.4 3 0 * 3 0 0 0 Nevada 1,274 1,084 17.5 1,274 1,084 17.5 0 0 0 0 Q 0 'Washington 4',327 3,934 10.0 4,327 3,934 10.0 0 0 * 0 0 0 0 Oregon 2,769 2,805 -1.3 2,763 2,795 -1.1 6 10 -40.0 6 10 0 0 California 20,178 18,576 8.6 18,703 16,667 12.2 1,475 1,909 -22.7 0 0 1,475 1,909 Alaska 678 764 -11.3 468 511 -8.4 210 253 -17.0 57 253 153 0 Hawaii 688 535 28.6 465 384 21.1 Z23 lSI 47.7 65 151 158 0
NOTE: ."F.i8'}res lor unsentenced inmates and inmates with maximum sentences of 1 year or less in 1977 are, in some cases, estimates based on 1977 custody counts. Differences between cust.ody and Jurisdiction figures ~n these cases do not exceed 5 percent. See Appendix II, Questionnaire j for category definitions, and Appendix IV, Explanatol'Y notes, (or State-by-State'variations from definitions.
• Not definable.
'14,
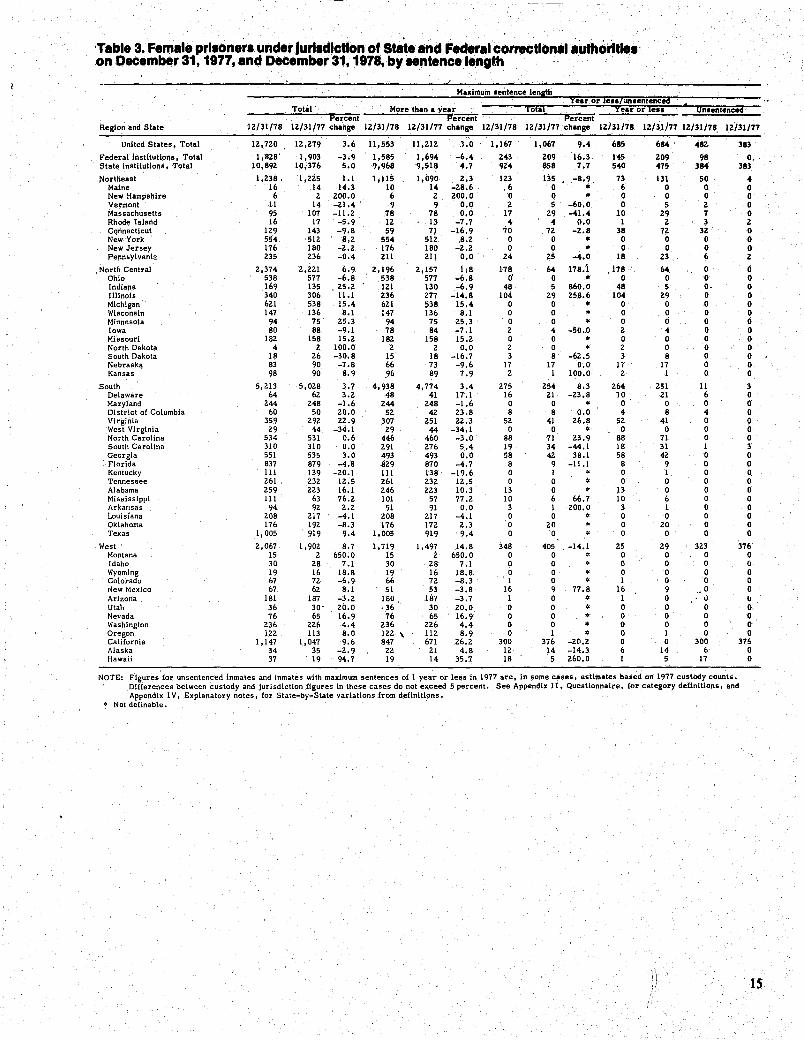
'Table 3. Female prllOnerl under Jurlldlctlon of State and Federal correctlonalallthoFl"'1 on December 31, 1977, and December 31,1978, by .. ntence length
Maximum lentence lena!!! rear or le •• 7unleniencia
Total' More than a year roial Year or Ie •• Onlentencecl Percent Percent Percent
Region and st.te 1Z/31/78 IZ/31/77 change IZ/31/78 1Z/31/77 change 1Z/31/78 1Z/31/77 change IZ/31/78 12./31/77 1Z/31/78, IZ/31/77
United States, Total 12,7Z0 • IZ,Z79 3.6 11,553 l1,ZIZ 3.0 1,167 1,067 9.4 685 684 48Z 383
Federal Institutions, Total 1,8Z8' 1,903 -3.9 1,585 1,694 -6.4 Z43 Z09 16.3 145 Z09 98 O. State Institutions, Total IO,89Z 10,376 5.0 9,968 9,518 4.7 924 858 7.7 540 475 384 383
Northeast I,Z38. I,Z25 1.1 1,115 1,090 Z.3 1Z3 135 ,-8.9 73 131 50 4 Maine 16 14 14.3 10 14 -Z8.6 .6 0 * 6 0 0 0 New Hampshire 6 2 200.0 6 Z ZOO.O 0 0 • 0 0 0 0 Vermont 11 14 -21.4 9 9 0.0 Z 5 ..,60.0 0 5 Z 0 Massachusetts 95 107 -11.2 78 78 0.0 17 Z9 -41.4 10 Z9 7 0 Rhode Island 16 17 -5.9 12 13 -7.7 4 4 0.0 I 2 3 2 Connecticut IZ9 143 -9.8 59 71 -16.9 70 7Z -2.8 38 7Z 32 0 New York 554 51Z 8,2 554 512 8.Z 0 0 • 0 0 0 0 New Jersey 176 180 -Z.2 17" 180 -Z.Z 0 0 • 0 0 0 0 Pennsyl van!!!. 235 Z36 -0.4 Zl1 Zl1 0.0 Z4 25 -4.0 18 Z3 6 Z
North Central Z,374 Z,2Z1 6.9 2,196 2,157 1,8 178 64 178.1 178 64 0 0 Ohio 538 577 -6.8 538 577 -6.8 0' 0 • 0 0 0 0 Indiana 169 135 . 25.2 121 130 -6.9 48 5 860.0 48 5 O· 0 mlnols 340 306 11.1 236 277 -14.8 104 29 258.6 104 29 0 0 MIChigan 621 538 15.4 6Z1 ~38 15.4 0 0 • 0 0 0 0 Wisconsin 147 136 8.1 147 136 8.1 0 0 " 0 0 0 0 Minnesota 94 75 25.3 94 75 25.3 0 0 " 0 Ii 0 0 Iowa 80 88 -9.1 78 84 -7.1 2 4 -50.,0 2 4 0 0 Missouri 182 158 15.2 182 158 15.2 0 0 " 0 0 0 0 North Dakot~ 4 2 100.0 2 2 0.0 2 0 " Z 0 0 0 South Dakota 18 26 -30.8 15 18 -16.7 3 8 -62.5 3 8 0 0 Nebraska 83 90 -7.8 66 73 -9.6 17 17 0.0 17 17 0 0 Kansas 98 90 8.9 ,96 89 7.9 2 1 100.0 2 1 0 0
South 5,213 5,028 3.7 4,938 4,774 3.4 275 254 8.3 264 Z51 11 3 Delaware 64 62 3.2 48 41 17.1 16 21 -23.8 10 21 6 0 Maryland 244 248 -1.6 Z44 248 -1.6 0 0 " 0 0 0 0 District of Columbia 60 50 20.0 52 4Z 23.8 8 8 0.0 4 8 4 0 Virginia 359 ,291. 22.9 307 251 22.3 52 41 26.8 52 41 0 0 West Virginia 29 44 -34.1 29 44 -34.1 0 0 " 0 0 0 0 North Carolina 534 531 0.6 446 460 -3.0 88 71 23.9 88 71 0 0 South CarolIna 310 310 0.0 291 276 5.4 19 34 -44.1 18 31 1 3 Georgia 551 535 3.0 493 493 0.0 58 42 38.1 58 42 0 0 Florida 837 879 -4.8 829 870 -4.7 8 9 -11.1 8 9 0 0 Kentucky III 139 -20.1 III 138· -19.6 0 1 " 0 1 0 0 Tennessee 261 23Z 12.5 261 232 12.5 0 0 " 0 0 0 0 Alabama 259 223 16.1 246 223 10.3 13 0 " 13 0 0 0 Mississippi 111 63 76.2 101 57 77.2 10 6 66.7 10 6 0 0 Arkansas 94 92 2.2 91 91 0.0 3 1 200.0 3 1 0 0 Louisiana 208 217 -4.1 208 217 -4.1 0 0 0 0 0 0 Oklahoma 176 191. -8.3 176 17Z 2.3 0 20 " 0 20 0 0 Texas 1,005 919 9.4 1,005 919 9.4 0 0 " 0 0 0 0
West 2,067 1,902 8.7 1,719 1,497 14.8 348 405 -14.1 25 29 323 376 Montana 15 2 650.0 15 2 650.0 0 0 " 0 0 0 0 Idaho 30 28 7.1 30 28 7.1 0 0 " (l 0 0 0 Wyoming 19 16 18.8 19 16 18.8 0 0 " 0 0 0 0 Colorado 67 72 -6.9 66 7Z -8.3 1 0 " 1 0 0 0 I~ew Mexico 67 62 8.1 51 53 -3.8 16 9 77.8 16 9 .. 0 0 Arizona 181 167 -3.2 180 IS"I -3.7 1 0 " 1 0 U 1/ Utah 36 3~' ZO.O ,36 30 20.0 0 0 * 0 0 0 0 Nevada 76 65 16.9 76 65 16.9 0 0 " 0 0 0 0 Washington 236 226 4.4 236 226 4.4 0 0 • 0 0 0 0 Oregon 122 113 8.0 122 \ 112 8.9 0 1 * 0 I 0 0 California 1,147 1,047 9.6 847 671 26.2 300 376 -20.2 0 0 300 376 Alaska 34 35 -2.9 22 21 4.8 12 14 -14.3 6 14 6 0 Hawaii 37 19 94.7 19 14 35.7 18 5 260.0 1 5 17 0
NOTE: Fig,ures for unsentenc'ed inmates and inmates with maximum sentences of 1 year or less in 1977 are, in some cases, estimates based on 1977 custody counts. ~ Differences between custody and jurisdiction figures in these cases do not exceed 5 percent. See Appendix II, Questionnaire, for category definitions, and
Appendix I V, Explanatory notes, for State-by-State variations from definitions. * Not definable.
IS
, 16
)) . '. . .. . Table 4. Number of prllonerlunder Jurll~lcllon of State and,.Federal correctional authorltlel per 100,000 perlonl of the general population on December 31~ 1978, by .. .,te~ce length
Maximum sentence length Year or less
Realon and State Total 'More than a year and unsentenced
United States ,Total 141 135 6
Federal institutions, Total 14 12 2 State Institutions, Total 127 123 4
Northeast 87 82 5 Maine 65 53 12 New Hampshire 32 3Z 0 Vermont 95 76 18 Massachusetts 49 49 0 Rhode Island 71 56 15 Connecticut 113 70 43 New York 114 114 0 New Jersey 80 74 6 Pennsylvania 67 65 2
North Central 106 104 2 Ohio 122 122 a Indiana 91 82 10 Illinois lOll 96 4 ~lichigan 162 162 a Wisconsin 73 73 a Minnesota 49 49 0 Iowa 71 70 I Missouri 116 116 0 North Dakota 31 II 10 South Dakota 78 74 4 Nebraska 86 80 7 Kansas f)~ 98 a
South 186 181 5 Delaware 228 173 ';5 Maryland 193 193 b District: of Columbia 430 383 48 Vlralnia 166 157 9 West Virginia 63 63 0 North Carolina 240 l23 18 South Carolina 257 243 14 Georgia 225 ll6 10 Florid .. 241 239 2 Kentucky 97 97 a Tennessee 134 134 0 Alabama 146 144 3 Mississippi 1z'1 110 11 Arkansas 119 115 3 Louisiana 184 184 0 Oklahoma 146 146 0 Texas 189 189 0
West lOS 99 6 Montana 88 87 I Idaho 91 91 a \~yomlng 102 102 a Colorado '94 93 a New Mexico 132 123 8 Arizona 146 146 a Utah, 69 69 a Nevada 204 204 0
Washington 122, 122 a Oregon 117 117 a Callfort)la 96 88 8 Alaska 184 127 58 lIawali 86 57 28
NOTE: See Appendix II, Questionnaire, for category definitions and Appendix IV. Explanatory notes. {or State-by-State variations from definitions.
I
1
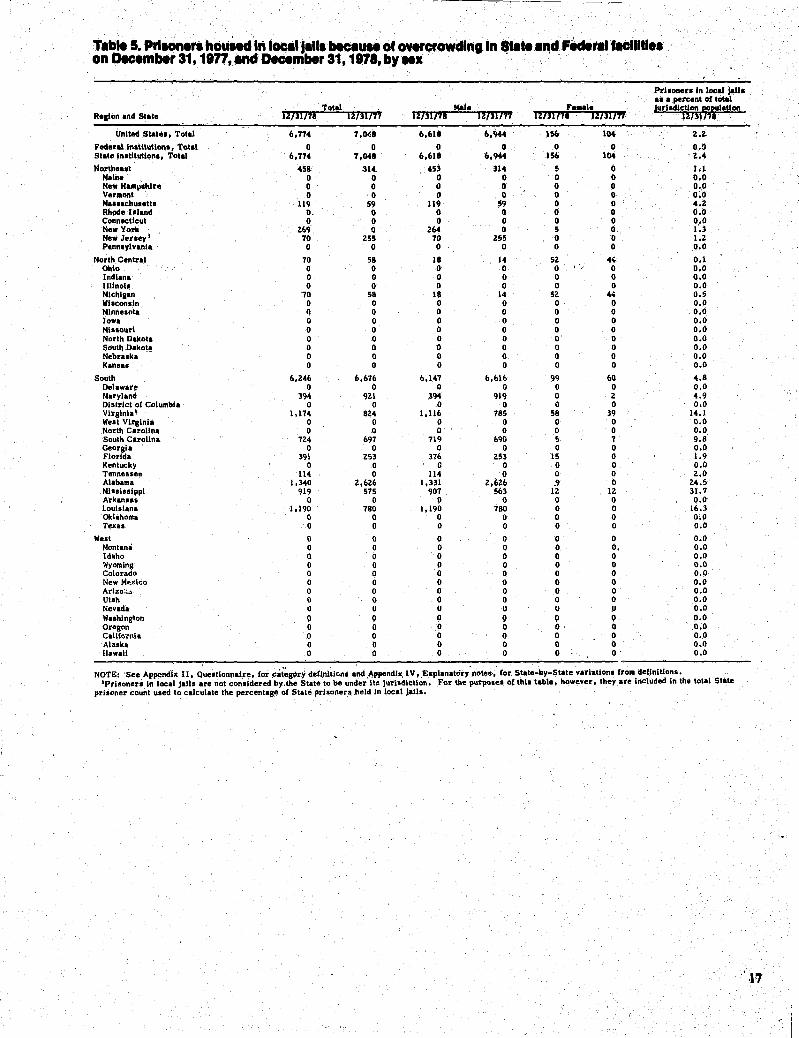
Tlble 5. Plleon .... houied 'In I~I .1". beelltA of overcrowding In S .. II Ind .F ..... lflClIIlI •• on December 31,1877, Ind December 31,1878, by N. '. . .
Pd.onero In local jallI ••• percent of .total
Male mum Total Fell&le jurlacllction ~tion
Re.lon .nd St.t. mn777 1!7J[771 [~7!17"" mm71 mm'l'f. nm-United Statea, Tot.1 6,774 1,IMB 6,61' 6,9-t4 156 104 2.2
Feder.l blatltullon., Total 0 0 0 0 0 0 0.0 St.t. In.tltutlon., Total 6,114 1,048 6,618 6,9-t4 156 104 . 2..4
North ... t 458 ll4 453 314 5 0 1.1 Maine 0 0 0 0 0 0 0.0 New K •• plhl.e 0 0 0 0 0 0 0.0 Ver.ont 0 0 0 0 0 0 0;0 M .... chu.eU. ·119 59 119 59 0 0 4.2 Rhode IIland O. 0 0 0 0 0 0.0 Connecticut 0 0 0 0 0 0 0.0 New York WI 0 264 0 5 0 I ~3 New Jereey' 70 Z55 70 255 0 0 I.Ol Penn.ylv.nl. 0 0 0 0 0 0 0.0
North Central 70 58 18 14 5Z « 0.1 Ohio 0 0 0 0 0
, 0 0.0
Indl.n. 0 0 0 0 0 0 0.0 I11lnol. 0 0 0 0 0 0 0.0 Mlchlll·n 70 58 Iii 14 52 44 0.5 WI.con.ln 0 0 0 0 0 0 0.0 Mlnn •• ot. 0 0 0 0 0 0 0.0 Iowa 0 0 0 0 0 0 0.0 MI .. ouri 0 0 0 0 0 0 0.0 North Dakot. 0 0 0 0 0 0 0.0 South D.kot. 0 0 0 0 0 0 0.0 Nebra.k. 0 0 0 0 0 0 0.0 Kin ••• 0 0 0 0 0 0 0.0
South 6,246 6,676 6,147 6,616 99 60 4.8 Dell •• re 0 0 0 0 0 0 0.0 M.ryl.nd 394 921 39-t 919 0 Z 4.9 District of Columbl. 0 0 0 0 0 0 0.0 Vlrglnl.' 1,174 824 1,116 785 58 39 14.1 Well Virginia 0 0 0 0 0 0 0.0 North C.rollna 0 0 0 0 0 0 0.0 South C.rollna 724 697 719 690 5 7 9.8 Georgi. 0 0 0 0 0 0 0.0 Florida ]91 ZS] 376 253 IS 0 1.9 Kentucky 0 0 G 0 0 0 0.0 Tennessee !l4 0 114 0 0 0 2.0 AI.bama 1,340 2,626 1,331 Z,626 ,9 0 24.5 Misala.lppi 919 575 907 563 12 12 31.7 Ark.n •• s 0 0 0 0 0 0 0.0 Loulsl.n. 1,190 780 1,190 780 0 0 16.3 Oklahoma 0 0 0 0 0 0 0.0 Texas 0 0 0 0 0 0 0.0
West 0 0 0 0 0 0 0.0 Montana 0 0 0 0 0 o. 0.0 Idaho 0 0 0 0 0 0 0.0 Wyoming 0 0 0 0 0 0 0.0 Colorado 0 0 0 0 0 0 0.0 New Mvlco 0 0 0 0 0 0 0.0 Arlzo',,~ 0 0 0 0 0 0 0.0 Utah 0 0 0 0 0 0 0.0 Nevada 0 0 0 U 0 II 0.0 W.ahlngton (I 0 9 9 II () 0.0 Oregon 0 0 0 0 0 0 0.0 Camci.nl. 0 0 0 0 0 0 0.0 Alaska 0 0 0 0 0 0 0.0 HawaU 0 0 0 0 0 0 0.0
NOTE: See. Appendix I I. Que.tionnai.re. for ".i~IQr.y defiJIltlc.n. and .APpend: ... IV, . Explanatory ',notes., for St.te-by-Si.te variation. frolll definitions. . 'Prisoners In local j.ils .re not considered by .. the State to be under It. juri.dlctlon. .Fo~ the p".po .... of thl. table. howeve~, they are included in the total State
prisoner count u.ed to c.lculate the percentage of State prisoner." .held In local jaU ••
" ·17
--- ------
~\< ",
Tlble 8. Prlaon .... 'under ,lIrledlctlon of Stat. Ind Fed.rl' correctloniliuthoritle. on peeembar 31, 1978; by rice ,f, ,,' " '" •
American A.i.n or Indl.n or Pacific
Reg{!in.nd St.te Total White BI.ck Aluk.n Native Islandex Not known
United Si.te.; Total 306,602 ,157,208 143,376 2,584 699 2,135
Federal tn.mutlon., Total 2.9,803 16,838 11,398 455 56 1,056 State in.tttutlon •• To!aI 2.76,799 140,370 131,978 2.,129 643 1,679
Northe •• t 42,422 20,869 21,386 19 6 141 Maine 711 691 8 12 0 0 New H.mp.hlre 283 276 6 I 0 0 Vermont 464 463 1 0 0 0 M .... chu.ett. 2,833 1,778 1,050 2 3 0 Rhode IsI.nd 664 486 157 I 0 20 ConnecticfJt 3,489 2,076 1,411 2 0 0 N' .... York 20,189 9,243 111,825 0 0 121 New Jersey 5,869 2,259 3,610 0 0 0 Penn.ylv.nl. 7,920 3,597 4,319 I 3 0
North Centr.1 61,702 30,867 29,322 652 54 807 Ohio 13,107 6,248 6,859 0 0 0 Indi.na 4,923 3,472 1,447 0 0 4 Illinois 11,258 4,650 6,524 46 38 0 Michigan 14,944 5,705 8,394 52' 6 787 Wisconsin 3,433 1,995 1,342 96 0 0 Minnesota 1,965 '1,488 318 143 2 14 low. 2,065 1,662 374 25 2 2 Mlsaourl 5,637 2,818 2,819 0 0 0 North Dakota 200 162 4 . 34 0 ij
South Dakota 532 375 10 147 0 0 Nebruka 1,347 830 454 6~ 0 0 Kansa. 2,2i}! 1,462 777 46 6 0
South 130,738 59,155 70,842 563 11 167 Delaw.re 1,325 580 745 0 0 0 M.ryland 7,966 1,905 6,036 12 0 13 Di.trlct of Columbia 2,844 8~ 2,726 0 0 29 Virglnl. 8,344 3,353 4,966 0 0 25 West Vlrgil)i. 1,185 995 189 1 0 0 North Cuolin. 13,252 5,761 7,177 309 5 0 South Carolina 7,396 3,186 4,206 4 0 0 Georgia 11,403 4,527 6,827 0 0 49 Florid. 20,773 10,078, 10,690 ,0 5 0 Kentucky 3,390 2,399 'I'll 0 0 0 Tennessee 5,835 3,063 2,7n 0 0 0 Alab.ma 5,472 2,197 3,274 0 I 0 Mlnl.slppi 2,896 962 1,933 I 0 0 Arkan ... 2,605 1,252 1,353 0 0 0 Loulsl.na 7,291 2,056 5,235 0 0 0
'Oklahom. 4,186 2,687 1,212' 236 0 51 Tex •• 24,575 14,065 10,510 0 0 U
We.t 41,937 29,479 ,10,427 895 572 564 Montana 690 572 '10 108 0 0 Id.ho 802 752 19 29 2 0 Wyoming 433 428 I 3 I 0 Colorado 2,486 1,908 551 18 9 0 New Mexico 1,593 1,379 182 32 0 0
.Arizon. 3,456 2,602 683 97 11 63 'Utah 911 814 76 14 7 0 Nev.da 1,350 906 408 29 7 0 Washington 4,563 3,373 914 180 21 75
Oregon, / 'Z,891 2,498 260 106 0 27 Cal!forrua 21,325 13,700 7,122 222 170 III
,Ala.k. 112 463 185 57 0 7 HawaII 725 84 16 0, 344 281
NOTE: See Appendix lIt Questionnaire, forc.tegory definitions and A"pendix IV. Explanatory notes, {or State-by-State varl.tions, frOID definition ••
..
"
18 '.
-'::':'
~ Table' 7. MaI • .,rI.on .... unde~{lurlacllction of ,Stat. and Federal correcllonalauthorltl •• on Dec.mber 31, 1978, by rac. ' ',.', - c::
American A.lan or
Region and '!it.le ' Indian or Pacific
Total 'White Black Alaskan Native Islander Not known
United States, Total 1.93,881. 151',534 ' 136,893 1.,41.3 ~7 1.,365
Federal institution., Total 1.7,975 16,111 10,41.4 433 54 953 State institutions, Total 1.65,907 135,41.3 11.6,469 1,990 613 1,411.
Northeast 41,184 1.0,318 1.0,707 17 6 136 Maine 695 676 8 11 0 0 New Hampshire 1.77 1.70. 6 1 0 0 Vermont 453 452 1 0 0 0 Massachusetts 1.,738 .1,71.5 1,008 Z 3 0 Rhode Island 648 478 151. 0 0 18 Connecticut 3,360 1.,007 1,351 2. 0 0 New York 19,635 9,On 10,485 0 0 rI8 New Jersey 5,693 2,191 3,502 0 0 0 Pennsylvania 7,685 3,487 4,194 1 3 0
North Central 59,la8 29,'?3Z 28,140 609 53 594 Ohio 11.,56'1. 6,033 6,536 0 0 0 Indiana 4,754 3,374 1,376 0 0 " Illinois 10,918 4,5~4 6,304' 32 38 0 Michigan 14,323 5,590 8,101 51 5 576 Wisconsin 3,286 1,926 1,266 94 0 0 Minnesota 1,871 1,421 301 133 2. 14 Iowa 1,985 1,603 355 25 2 0 Missouri 5,455 Z,727 2.728 0 0 0 North Dakota 196 159 4 33 0 0 South Dakota 514 3E>2 10 141. 0 0 Nebraska 1,264 787 422 55 0 0 Kansas 2,193 1,406 737 44 6 0
South 125,51.5 57,018 67,801 539 9 158 Delaware 1,261 555 706 0 0 0 Maryland 7,722 1,854 5;843 11. 0 13 District of Columbia '2,784 84 2,672 0 0 28 Virginia 7,985 3,1.26 4,735 0 0 24 West Virginia 1,156 976 180 0 0 0 North Carolina 12,718 5,571 6,856 287 4 0
'\", South Carolina 7,086 3,054 4,028 4 0 0,
, ' Georgia 10,851. 4,308 6,498 0 0 46 Florida 19,936 9,775 10,156 0 5 0 Kentucky 3,279 2,332 947 0 0 0 Tennessee 5,574 2,927 2,647 0 0 0 Alabama 5,213 2,097 3,116 0 0 0 Mississippi 2,785 925 1 ,860 0 t\ 0 Arkansas 2,511 1,201 1,304 0 0 0 Lo\,\tliana 7,083 1,984 5,099 0 0 0 Oklahoma 4,010 2,588 1,139 236 0 47 Texas 23,570 13,555 10,015 0 0 0
West 39,870 28,155 9,821, 825 545 524 Montana 675 558 10 107 0 0 Idaho 772 727 17 26 Z 0 Wyoming 414 414 0 0 0 0 Colorado 2,419 1,862 533 16 '8 0 New Mexico 1,526 1,325 172 1.9 0 0 Arizona 3,275 2,478 641 91 5 60 Utah 875 788 71 10 6 0 Nevada 1,274 3(,9 373 27 5 0 Washington 4,327 3,228 843 171 21 64 Oregon 1.,769 '2,417 1.28 101 0 Z3 California ;lO,178 12,968 6,743 193 165 109 Alaska 678 441 176 54 0 7 Hawaii. 688 80 14 0 333 261
NOTE: See Appendix II. Questionnaire, for Cat"gory definitions and Appendix IV ,Explanatory nOles, for Stale~by-Slale variation~ from definitions.
"
19
I)
; ....
20' ,
......
'0
T.";'I~"""'i' pil1011iriunderJurliclectlon of 8t&I' •• ncI ,,,r.i,col'I"eCtion •• iI..thOrl .... ' iOI'l December 31, 1178f by ~ , " "', .,;" . ;'" ' ',,' .• " '
Unltitd Statea; 'Tot.1
Fe4e;~lln'UtuUon. i' Total St.t. lnstltuUiIri., Total,·,
Northe .. t Maine N •• H.mp.hlre Vermont ' M .... chu •• tt. Rhode!' I .I.nd .connecllcut New York
'. N •• J.r.ey Penn.ylv.nl.
North ,Centr.1 Ohio Indlllnl 11IIn'ol. Mlchla·n WI.con.bl Mlnnesot. low. M1.iourl North Dakot. 'South D.kot. Nebr •• k~ K.n ...
South, Del.war. Maryl.nd DI.trlct of,Columbl. Vlralni. W.lt Vlralnl. North Carolln. South Carolln. Gearal• ' Florid •. Kentucky T.nnenee AI.b.m. Millilllppi Ark.n: .. Loul.l.n. Okl.hom. Tex ••.
We.t Montan.
)a.ho , Wyoming Color.do
, ' New Mexico .' Arlzon. '
Ut.h 'Nev.d. W.shinat°n Oreaon C.lifornl., Al .. k. ' H.w.U
. Total
,12,720
1,8U 10,892
1,238" 16 6
11 'IS 16
129 554 176 235 ,
2,314 538 169 340 621 147 94 80
182 4
18 83 98
5,ZIl 64
244 60
359 29
534 310 551 837 III 261 259 III 94,
208 176
1,005
2,061 15 30 19 61 67
181 36 76
236. 122
1,141 l4 31
WIIlt.
5,674'
>121 4,941
551 15 6,
11 53,
~""~'li 69 '
211 68
1,10
935 215
98 lIi6 115
, 69 67 59 'Ii
3 13 43 56
2,137 25 51
5 127 19
190 132 219 303
67 136 100 31
,45 12 99
510
1,324 14 Z5 i4 4\6 54
124 26 37
145 81
732 22
4
BI.ck.
6,4tI~
914 5,509
680 0, o o
4~ S.:,
60 340 108 125
1,182 323
11 2~0 293 76 17
,19 'II o o
32 40
3,041 39
193 54
231 9
321 178 329 534 44
125 158 13 49
136 73
495
606 o 2 I
18 10 42
5 35 71 32
319 9 2
Amerlc.n Indian or Ai .. k.n N.tlve
161
22 139
2 I o o o I o o o o
43 o o
14 1 2
10 o o I' S 8 2
l4 o o o o I
2Z o o o o o o I o o o o
70 I 3 3 2 3 6 4 l 9 5
29 3 o
AII.n or P.clflc hl.nd.r
3Z
2 30
o O'
'0 o o o o o o o I o o o I o o o o o o o o Z o o o o o I o C o o o I o o o o o
27 o o I I o 6 I 2 o o 5 o
11
Not known
310
103 267
5 o O. o o 2 o 3 o 0,
,213 o o o
211 o o 2 o o o o o 9 o o I, I o o o 3 o o o o o o o 4 o
40 o o o o o 3 o o
11 4 2 o
20
NOTE,: S.e APpendix II, Que.tI"",n.lre,' for c.teaory definition •• nd Appen,dlx IV, Explanatory notes, for State-by-State v.ri.tlon. from definition ••
6
T.bl. 8. Priloner. under Jurilltiction of State and Federal correction.: .uthorltle. (::,\
on December ~1, 1878, by Hllp.nlc origin and Ie. "
"
80th lexes M.le Fem.le '~!;'l~';'>: Nop- " Not lio~- Not N~:m'"!
Re810n and SI.te ,,,ill Tot.l HI.p.nle IIlsp,anlc 'known " To!~1 Hl.pl!.~lc HI.panlc known Total Hispanic., Hi'~'llc knl1.,t -------United St.tel, Tot.1 306,602 15,714 15ll,239 13&,M9 293,882 15,081 146,021 IU,7SI) 12, no 633 6,218;''. :'3,869 Federalln.tltutlon. , Total 29,803 4,279 24,527 997 27,975 4,061 23,015 899 1,828 218 ."1;512 98 St.te In.tltutlon., Tot.1 276,799 II ,435 127,712 137,b52 265,907 11,()20 123,006 131,881 10,892 415 4,706 5,771
Northe.'1 42,422 5,089 29,393 7,940 41,184 4,971 28,510 7,703 1,238 118 883 237 M.lne '. 711 0 711 0 695 0 695 0 16 0 1(, 0 New H.mp.hlre 283 0 283 0 277 0 277 0 6 0 6 0 Vermont 464 I 463 0 453 I 452 0 II 0 II 0 M .... chu.ell. 2,833 152 2,681 0 2,738 141 2,591 0 95 5 90 0 Rhode hland 664 16 628 20 648 15 615 18 16 1 13 2 Connecticut 3,489 453 3,036 0 3,360 443 2,917 0 IZ9 10 119 0 New York 20,189 4,057 16,132 0 19,635 3,966 15,669 0 554 91 463 0 New Jersey 5,869 410 5,459 0 5,693 399 5,294 0 17E. 11 165 '0 Pennsylyanla 7,920 NA NA 7,920 7,685 NA NA 7,685 235 NA NA 235
North Centr.1 61,702 686 27,593 33,423 59,328 664 26,576 32,088 2,314 22 1,011 1,335 Ohio 13,107 NA NA 13,101 12,569 NA NA 12,569 538 NA NA 538 Indl.n. 4,923 2,7 4,896 0 4,754 25 4,7?9 0 169 2 l6'1 0 Illinois 11,258 128 11,130 a 10,918 120 10,798 0 340 8 332 0 Mlchlg.n 14,344 265 0 14,619 14,323 259 0 14,064 621 6 0 615 Wisconlin 3,433 81 3,352 0 3,286 80 3,206 0 147 I 146 0 Mlnnesot. 1,965 24 1,941 0 1,871 23 1,848 0 94 1 93 0 low. 2,065 34 2,031 0 1,985 34 1,951 0 80 0 80 0 Missouri 5,637 NA NA 5,637 5,455 NA NA 5,455 182 NA, NA' 182 North Dakol. 200 2 198 0 196 2 194 0 4 0 4 0 South D.kot. 532 3 529 0 514 3 511 0 18 0 18 0 Nebruk. 1,347 50 1,297 0 1,2M 48 1,216 0 83 2 81 0 Kanl •• 2,291 72 2,219 0 2,193 70 2,123 0 98 2 96 0
South 130,138 2,677 54,603 13,458 125,525 2,494 52,545 70,486 5,213 183 2,058 2,972 Del.w.re 1,325 NA NA 1,325 1,261 riA NA 1,261 64 NA NA 64 Maryland 7,966 riA NA 7,966 7,122 riA NA 7,12.2 244 NA NA 244 Dlatrlet 01 Columbl. 2,844 NA NA 2,844 2,184' NA NA 2,784 60 NA NA 60 Virginia 8,344 riA NA 8,344 7,985 NA NA 7,985 359 NA NA 359 Weat Virginia 1,185 0 1,1'85 0 1,156 0 1,156 0 2'1 0 29 0 North Carolina 13,252 39 13,213 0 12,718 37 12,681 0 534 2 532 ,0 South C.rollna 7,396 NA riA 1,396 7,086 NA NA 7,086 310 NA NA 310 Georgi. 11,403 4 0 11,399 10,852 3 0 10,849 551 1 0 550 Florid. 20,773 riA riA 20,773 19,936 riA riA 19,936 837 NA NA 837 Kentucky 3,390 NA NA 3,390 3,279 NA NA 3,279 III riA NA 111 Tennessee 5,835 NA NA 5,835 5,574 NA NA 5,574 261 NA NA 261 AI.b.,m. 5,472 0 5,472 0 5,213 0 5,213 0 25'1 0 259 0 MI •• I .. lppl 2,896 10 2,886 0 2,785 10 2,775 a III 0 111 0 Arkan •• s 2,605 0 2,605 0 2,511 0 2,511 0 94 0 94 0 Loul.lana 7,291 5 7,286 0 7,083 5 1,078 0 Z08 0 208 0 'Okl.homa 4,186 NA riA 4,186 4.010 riA NA 4,010 176 NA NA 116 Tex •• 24,575 Z,619 21,956 0 2),570 2,439 21,131 0 1,005 180 825 0
West 41,937 2,983 16,123 22,831 39,870 2,891 ',,5,375 21,604 2,067 92 748 1,227' Montana 690 12 678 0 M75 12 663 0 15 0 15 0 Idaho 802 7Z 730 0 772 71 701 0 30 1 29 0 Wyoming 433 4 42~ 0 414 1 413 0 19 3 16 0 Colorado 2,4t!b 690 1,796 0 7.,419 617 1,742 0 67 13 54 0 New Mexico 1,5~3 838 755 a 1,526 809 711 0 61 29 38 0 Arizona 3,456 912 2,475 69 3,275 874 2,341 60 181 38 134 9 Utah 911 136 775 0 875 134 741 0 36 2 34 0 N't:Ylild. 1,350 54 1,~96 a I,Z74 53 1,221 0 76 1 75 0 WashIngton 4,563 i75 4,388 0 4,327 171 4,156 0 236 4 232 0 Oregon 2,891 90 2,801 0 2,769 89 2,680 0 122 1 121 0 California 21,325 NA NA 21,32~ 7,1),178 NA NA 211,1711 1,11,7, NA NA 1,1.7 A1a.ka 712 NA NA 712 678 NA riA 678 34 NA NA 34 HawaII 725 NA NA 725 688 riA NA 688 37 NA riA 37
NOTE: See Appendix 11, Questionnaire, lor category dellnitlons and Appendix IV, Explanatory note., lor State-by-State yarl~tion. Irom delinltl~n •• NA Data not available.
21
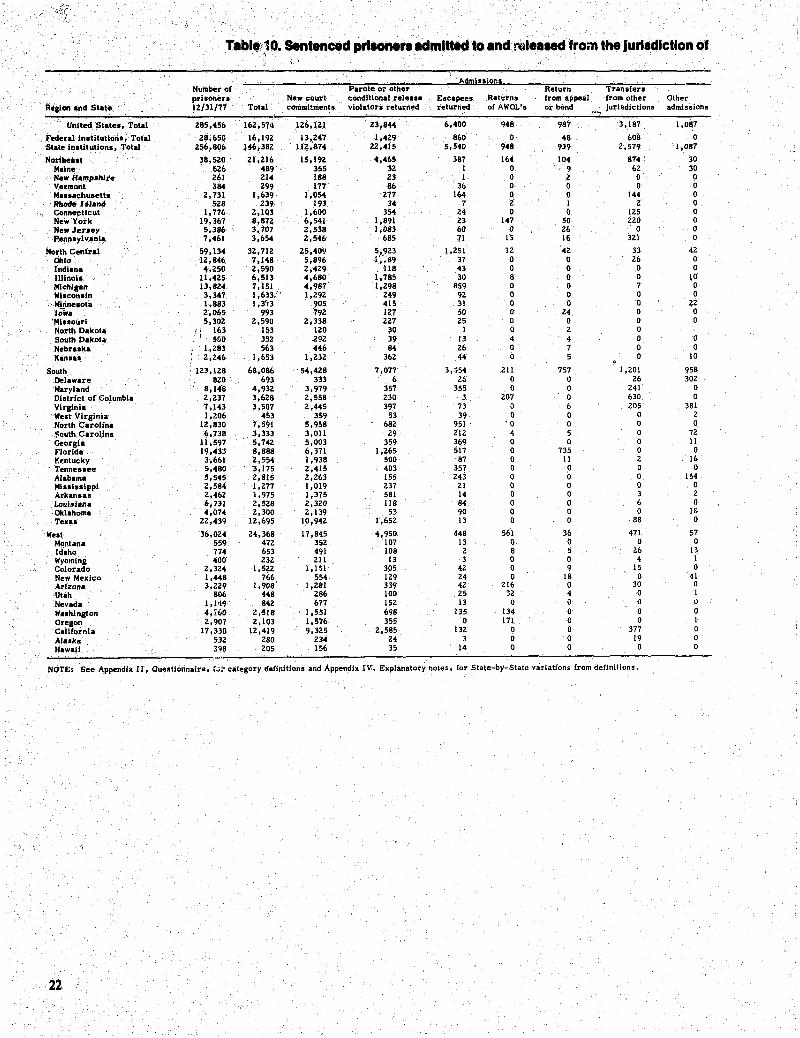
--------------------
.(.,
Tabltp'?O. Sentenced prleonerl8dtnlttH to and!'tile.18d from the Jurlldlctlon of
·651mis liS!cl Number of Parole Of other Return Transfers prisoners New court condltlon.1 release Escapees Returns from appeal from other Other
Region and St.te 12/31/77 Total commitments violatora returned returned of AWOL'. or bond jurisdictions admissions
" United St.te., Tot.1 28!f,456 162,574 i26,I2I 23,844 6,400 948 987 3,187 _ 1,087
Federalln.litullon.;-Total 28,650 16,192 13,247 1,429 860 0 48 608 0 St.le In.t1tutlon., Total 256,806 146,38Z J12.874 22,415 5,540 948 939 2,579 l,a87
Northe •• t 38,520 21,216 15,192 4,465 387 164 la4 874 30 Malne 626 489 355 32 I 0 9 62 30 New HariJpshlr" 261 214 188 23 I 0 2 0 0 Vermont 384 299 177 86 36 a 0 0 0 M .... chu.ett. 2,731 1,639' 1,054 277 164 0 0 144 0 Rhode hland 528 219 193 34 7 i I 2 0 Connecticut 1,776 2,103 1,600 354 24 0 0 125 0 New York 19,367 8,872 6,541 1,891 23 147 50 220 0 Neio Jeroey 5,386 3,707 2,538 1,083 60 0 26 0 0 ~enn.ylv.nla 7,461 3,654 2,546 685 71 13 16 321 0
North Central 59,134 32,712 25,40~ 5,923 1,251 12 42 33 42 Ohio 12,846 7,1"8 5,896 1':::89 37 0 0 26 0 Indl.na 4,250 2,590 2,429 118 43 0 0 0 0 IIIlnol. 11,425 6,513 4,680 1,785 30 8 0 0 10 Mlchl,.n 13,824 1,151 , 4,987 1,298 859 0 0 7 0 Wilcen.ln 3,347 1,633: . 1,292 249 92 0 0 0 0
·,M!!>nelota 1,883 1,3'(3 905 415 31 0 0 0 22 10wa 2,065 993 792 127 50 0 24 0 0
'MI .. ourl 5,302 2,590 2,338 227 25 0 0 0 0 North Dakota 163 153 120 30 I 0 2 0 Soulh Dakola 500 352 292 39 13 4 .. 0 0 Nebr.ska 1,283 563 446 84 26 0 7 0 0 Kana •• 2,246 1,653 1,232 362 44 0 5 0 10
South _ 123,128 68,086 54,428 7,077 3,·154 211 757 1,201 958 Del.ware 820 693 333 6 2b 0 0 26 302 M.ryland 8,14'8 4,932 3,979 357 355 0 0 241 0 Dhtrlct of Co!umbla 2,237 3,62.8 2,558 230 3 207 0 630 0 Vlrglnl. 7,143 3,507 2,445 397 73 0 6 205 381 We.t Vlr,lnla 1,206 453 359 53 39 0 0 0 2 North Carolina 12,830 7,591 5,958 682 951 '0 0 0 0 $auth C.rolina 6,738 3,333 3,011 29 212 .. 5 0 7Z Georgi. II ,597 5,742 5,003 359 369 0 0 0 II Florid. 19,433 8,888 6,371 1,265 517 0 735 0 0 Y.~ntucky 3,661 2,554 1,938 500 87 0 1! 2 16 Tenne •• ee 5,480 3,175 2,415 403 357 0 0 0 0 AI.b.ma 5,545 2,815 Z,263 155 Z43 0 0 0 154 MIs.lsslppi 2,584 1,277 1,019 237 21 0 0 0 0 Arkan.as 2,46Z i ,975 1,375 581 14 0 0 3 2 Louisiana 6,731 2,528 2,320 118 84 0 0 6 0
Okl.homa 4,074 2,300 2,139 53 90 0 0 0 18 Texa. 22,439 12,695 10,942 1,652 13 0 0 88 0
Welt 36,024 24,368 17 ,845 4,950 448 561 36 471 57 Montana 559 472 352 107 13 0 0 0 0 Idaho 774 653 491 108 2 8 5 26 13 Wyoming 400 232 211 13 3 0 0 4 1 Colorado 2,324 1,522 1,1 ~1 3P5 42 0 9 15 0 New Mexico 1,448 766 554 129 24 0 18 0 41 Arizona 3,229 1,908 1,281 339 42 216 0 30 0 Ut.h 806 448 286 100 25 32 4 0 1 Nev.da 1,1'19 842 677 152 13 0 0 Il Il
Washington 4,1GO 2,518 J ,551 698 135 134 0 0 0 Oregon 2,907 2,103 1,576 355 0 171 0 0 1 C.1lfornla 17,336 12,419 9,325 2,585 132 0 0 377 0
Aluka 532 280 234 24 3 0 0 19 0
Haw.,1i 3~8 205 156 35 14 0 0 0 0 _. NOTE: See Appendix II, Questionnaire, i.;;: category definitions and Appendix IV, Explanatory notes, (or State-by-State variations (rom definitions.
22
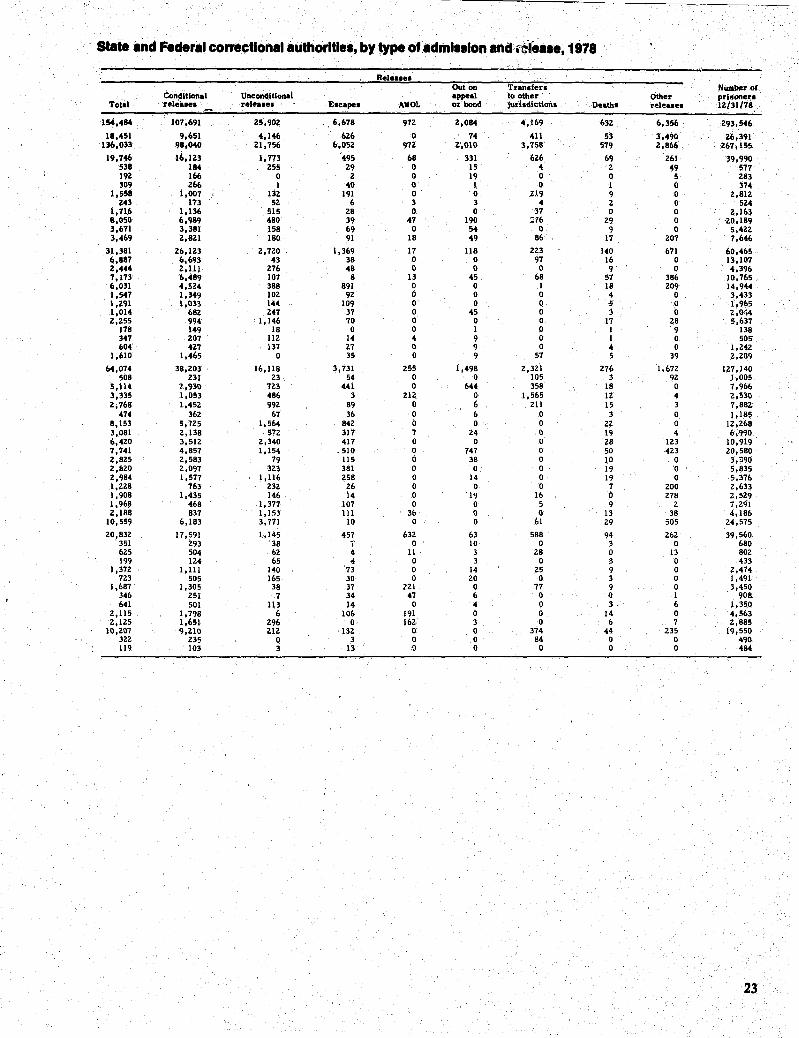
Stete .nd Feder.i correctlon.l.uthoritle'~ by type of .• dR .... lon .na.~ ••• e, 1978
Rele.lel Out on Tranlferl NiuIIbI!r of
ConcUtlonal Unconditional appeal to other Other prhone~1 Total rete.ae. rele •• el Elcapel AWOL or bond jllrlsdlctions Deatha releuea 12/31/78 '.
154,484 107,691 25,902 .6,678 972 2,084 4,169 632 6,356 293,546
18,451 9,651 4,146 626 0 74 411 53 3,490 26,391 136,033 98,040 21,756 6,052 972 7:,010 3,758 579 2,866 267,155,
19,146 16,123 1,773 495 68 331 626 69 261 39,990 538 184 255 29 0 15 4 2 49 577 192 166 0 2 0 19 0 0 5 283 309 266 I 40 0 1 0 1 0 374
1,558 1,007 112 I'll 0 0 ZA9 9 0 2,81Z 243 173 52 6 3 3 4 2 0 524
1,716 1,136 515 28 0 0 37 0 0 2,163 8,050 6,989 480 39 47 190 :16 29 0 '20,189 3,671 3,381 158 69 0 54 0 9 0 5,422 3,469 2,8Z1 180 91 18 49 86 17 207 7,646
31,381 26,1Z3 Z,720 1,369 17 118 ZZ3 140 671 60,465 6,887 6.693 43 38 0 0 97 16 0 13,107 2,444 2,111 Z76 48 0 0 0 9 0 4,396 7,173 6,489 107 8 13 45 68 57 386 10,765 6,031 4,524 388, 891 0 0 1 18 209 14,944 1,547 1,349 10Z 9Z 0 0 0 .. 0 3,433 1,291 1,033 144 109 0 0 0 ~ 0 1,965 1,014 68Z 247 37 0 45 0 3 0 2,0<'.4 2,255 994 1,146 70 0 0 0 17 28 5,637
178 149 18 0 0 1 9 1 9 138 347 207 112 14 4 9 0 1 0 505 604 427 137 27 0 9 0 " 0 1,24Z
1,610 1,465 0 35 0 9 57 5 39 2,289
64,074 38,Z03 16,118 3,731 255 1,498 Z,3Z1 276 1,672 127,140 508 231 23 54 0 0 105 3 9Z 1,005
5,114 "-,930 7Z3 441 0 644 358 18 0 7,966 3,335 1,053 486 3 Z1Z 0 1,565 12 4 Z,530 2;1611 1,45Z 992 89 0 6 211 15 3 7,88Z
474 362 67 36 0 6 0 3 0 1,185 8,153 5.725 1,564 84Z 0 0 0 22 0 12,268 3,081 2,138 572 317 7 24 0 19 4 6,990 6,420 3,512 2,340 417 0 0 0 28 123 10,919 7,741 4,857 1,154 .510 0 747 0 50 423 20,580 2,8Z5 2,583 79 115 0 38 0 10 0 3,~90 2,820 2,097 323 381 0 0 0 19 '0 5,835 2,984 1,577 1,116 Z58 0 14 0 19 0 5,371'. 1,228 763 232 Z6 0 0 0 7 200 2,633 1,'108 1,435 146 14 0 19 16 0 278 2,529 1,968 468 1,377 107 0 0 5 9 Z 7,291 2,188 837 1,153 III 36 0 0' 13 38 4,186
10,559 6,183 3,771 10 0 0 61 Z9 505 Z4,575
ZO,83Z 17,591 1,145 457 63Z 63 588 94 Z6Z 39,560 351 Z93 38 j 0 10 0 3 0 680 6Z5 504 62 4 11 3 28 0 13 802 199 lZ4 65 .. 0 3 0 3 0 433
1,372 1,111 1~0 73 0 14 25 9 0 2,474 723 50S 165 30 0 20 0 3 0 1,491
1,687 1,305 38 37 Z21 0 77 9 0 3,450 346 251 7 34 47 6 0 0 1 908 641 501 113 14 0 4 9 3 6 1,35.0
2,115 1,798 6 106 I'll 0 0 14 0 4,563 2,125 1,651 296 0 162 3 0 6 7 2,885
10,207 9,210 212 132 0 0 374 44 235 19,550 322 235 0 3 0 0 84 0 0 490 119 103 3 13 {) 0 0 0 0 484
23
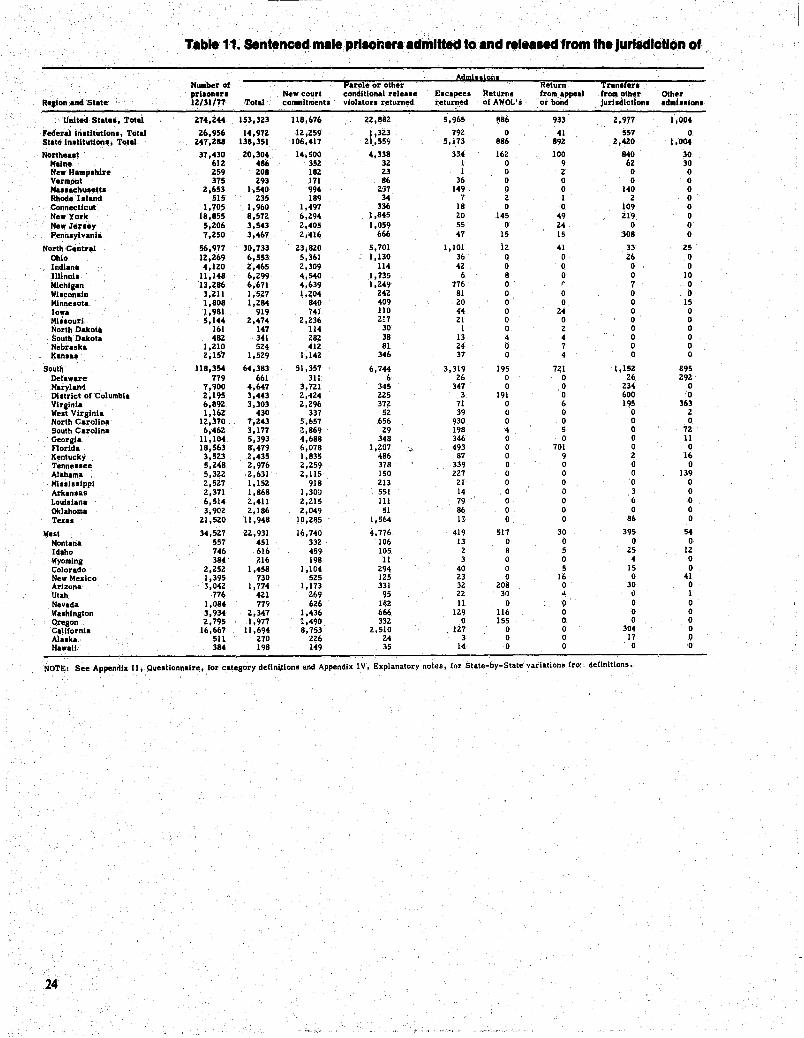
Table 11. Sentencect male prilOner.'adlitlttedtoand ,.I.a.edfrom the Jurlldlctlo.n of.
N ...... rof Parole or other &imLiliRll.
Return Tran.lerl prlaonen New court conditional releale Eacapeel Returns from appeal fro .. other Other
'Rellon and Slale 12/31/77 TOlal conunltmentl violatorl returned returned of AWOL's or bond Jurildlctlona admlulonl
United Sialeo, Total 274,244 153,323 118,676 22,882 5,965 "l86 933 2,977 1,004
Federallnltltutlonl, Total 26,956 14,972 12;259 1,3Z3 192 0 41 557 0 State Inltllutlonl, TOlal 247,288 138,351 106,417 21.,559 5,113 886 892 2,420 1,004
Northeall 37,430 20,304 14,500 4,338 334 162 100 840 30 Malne 612 486 352 32 I 0 9 62 30 New Halllplhlre 259 208 182 23 I 0 2 0 0 Vermonl 375 293 171 86 36 0 0 0 0 Ma .. achulelll 2,653 1,540 994 Z37 149 0 0 140 0 Rhode bland 515 235 189 34 7 2 I 2 0 Connectlcul 1,705 1,960 1,497 336 18 0 0 109 0 New York 18,855 8,572 6,294 1,845 20 145 49 219 0 New Jeney 5,206 3,543 2,405 1,059 55 0 24 0 0 Pennlyl vania 7,250 3,467 2,416 666 47 15 15 308 0
Nol'lh Cenlral 56,977 30,733 23,820 5,701 1,10r 12 41 33 25 Ohio 12,269 6,553 5,361 1,130 36 0 0 26 0 Indiana 4,120 2,465 2,309 114 42 0 0 0 0 IIl1noll ll,148 6,299 4,540 1,735 6 8 0 0 10 Mlchlaan 13,286 6,671 4,639 1,249 776 0 r 7 0 Wilconlln 3,2ll 1,527 1,204 242 81 0 0 0 0 Minnesota 1,808 1,284 840 409 20 0 0 0 15 Iowa 1,981 919 741 110 44 0 24 0 0 MI.lourl 5,144 2,474 2,236 217 21 0 0 0 0 North Dakota 161 ' 147 ll4 30 I 0 2 0 0 South Dakola 482 341 282 38 13 4 4 0 0 Nebraska 1,210 524 412 81 24 0 7 0 0 K.nl.~ 2,157 1,529 1,142 346 37 0 4 0 0
Sout~ 118,354 64,383 51,357 6,744 3,319 195 721 1,152 &95 Delaware 779 661 311 6 26 0 0 26 292 Maryland 7,900 4,647 3,721 345 341 0 0 234 0 Dhtrlcl of Columbia 2,195 3,443 2,424 225 3 191 0 600 0 Vlralnla 6,892 3,303 2,296 372 71 0 6 195 363 Weat Virginia 1,162 430 331 52 39 0 0 0 2 North Carolina 12,370 7,243 5,657 656 930 0 0 0 0 South Carolina 6,462 3,177 i!,869 29 198 4 5 0 7Z Georgia ll,104 5,393 4,688 348 346 0 0 0 II Florida 18,563 8,479 6,078 1,207 :,;. 493 0 701 0 0 Kentucky 3,523 2,435 1,835 486 87 0 9 2 16 Tenne.lee 5,248 2,976 2,259 378 339 0 0 0 0 Alabama 5,322 2,631 2,115 150 227 0 0 0 139 MllSloslppl 2,527 1,152 918 213 21 0 0 0 0 Arkanaas 2,371 1,868 1,300 551 14 0 0 3 0 Loulalanl 6,514 2,411 2,215 111 19 0 0 6 0 Oklahoma 3,902 2,186 2,049 51 86 0 0 0 0 Tex •• 21,520 11,948 10,285 1,564 13 0 0 86 0
Welt 34,527 22,931 16,740 4,776 419 517 30 395 54 Montana 557 451 332 106 13 0 0 0 0 Idaho 746 616 459 105 2 8 5 25 12 Wyoming 384 7.16 198 II 3 0 0 4 0 Colorado 2,252 1,458 1,104 294 40 0 5 IS 0 Ne. Mexico 1,395 730 525 125 23 0 16 0 41 Arizona 3,042 1,774 1,173 331 32 208 0 30 0 Utah ·776 421 269 95 22 30 oj. 0) I Nevada 1,084 779 626 loe2 II 0 0 0 0 Waohlngton 3,934 2,347 1,436 666 129 116 0 0 0 Ore80n 2,795 1,'177 ~,490 332 0 155 0 0 0 California 16,667 11,694 8,753 2,510 .127 0 0 304 0 Alaaka. 511 270 226 24 3 0 0 17 0 Ha.aU 384 198 149 35 14 0 0 0 0
NOTE: See Appendix II, Questionnaire, for category ddlnl,tlona and Appendix IV, Explanatory notes, for State-by-State variations froi definitions.
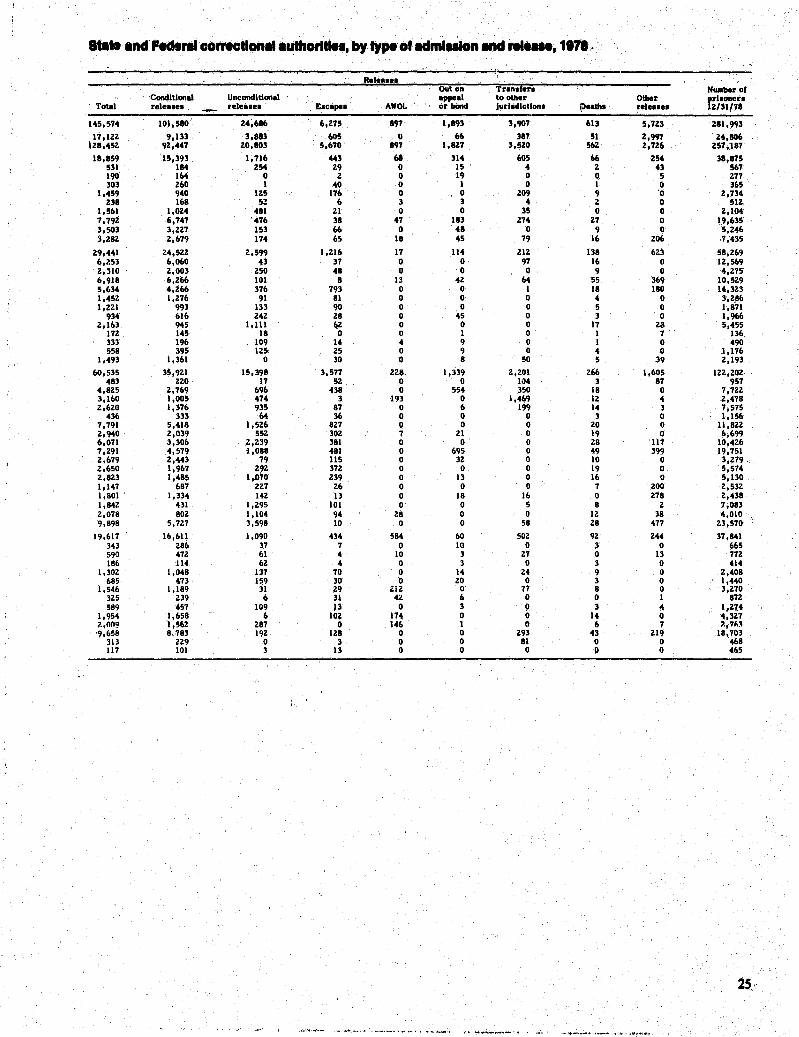
.. ~ .nd , .. ,.1 COnwctlon.l.uthOrl .... , by type of adml_lon and ........ , 1171,.,
R.I ..... OUt on Tr.n.l.ro N ... ber of
Condillonal Unconditional appeal to other Other ,d.oner. Total rel •••• 1 rele •••• E.ca,.. AWOL or bond Jurlidlctlon. /Dea"'. r.le •••• 12/31/78
145,514 101,580 24,616 6,215 891 1,893 3,901 613 5,123 281,~3
11,122 9,133 3,883 605 0 66 381 51 2,991 24,106 128,45Z 9Z,441 ZO,803 5,610 891 1,8Z1 3,5Z0 56Z 2,126 Z51,\81
18,859 15,393 1,116 443 68 314 605 66 Z54 38,815 531 184 Z54 Z9 0 15 4 Z 43 561 190 164 0 Z 0 19 0 0 5 Z11 303 Z60 I 40 0 I 0 I 0 365
1,459 940 IZ5 176 0 , 0 209 9 '0 Z,734 Z38 168 5Z 6 3 3 4 2 0 51Z
1,561 I,OZ4 481 ZI 0 0 35 0 0 Z,I04 7,192 6,141 '416 31 41 183 214 Z1 0 19,635 3,503 3,ZZ1 153 66 0 48 0 9 0 5,Z46 3,ZIZ Z,619 114 65 18 45 19 16 Z06 ,1;435
29,441 Z4,5ZZ 2,599 I,ZI6 11 114 21Z 138 6Z3 58,Z69 6,1.53 6,060 43 31 0 0 97 16 0 12,569 Z,310 2,003 250 411 0 0 0 9 0 4,Z75 6,918 6,Z66 101 8 13 4Z 64 '55 369 10,529 5,634 4,Z66 376 793 0 0 I 18 180 14,3Z3 1,45Z 1,276 91 81 0 0 0 4 0 3,Z,86 I,Z21 993 133 90 0 0 0 5 0 1,871
934 616 242 Z8 0 45 0 3 0 1,966 Z,163 945 1,111 6Z 0 0 0 17 za 5,455
172 145 18 0 0 1 0 1 1 136 333 196 109 14 4 9 0 I 0 490 558 3.95 lZS 25 0 9 0 4 0 1,176
1,493 1,361 0 30 0 8 50 5 39 Z,I93 .
bO,535 35,9Z1 15,398 3,511 2Z8 1,339 Z,ZOI 266 1,605 lZZ,ZOZ 483 ZZO 11 5Z 0 0 104 3 81 951
4,8Z5 Z,169 696 438 0 554 350 18 0 1,72Z 3,160 1,005 474 3 193 0 1,469 lZ 4 Z,418 Z,620 1,316 935 87 0 6 199 14 3 1,575
436 333 64 36 0 0 0 3 0 1,156 7,191 5,418 1,5Z6 821 0 0 0 ZO 0 lI,8ZZ 2,940 Z,039 55Z 30Z 1 21 0 19 0 6,699 6,011 3,306 2,Z39 381 0 0 0 Z8 111 10,4Z6 1,291 4,519 1,088 481 0 695 0 49 399 19,751 Z,679 Z,443 79 115 0 3Z 0 10 0 3,Z79 Z,650 1,967 Z9Z 312 0 0 0 19 0 5,574 Z,8Z3 1,485 1.070 Z39 0 13 0 16 0 5,130 1,147 687 ZZ1 Z6 0 0 0 7 ZOO 2,53Z 1,801 . 1,334 14Z 13 0 18 16 0 Z78 Z,438 1,84Z 431 I,Z95 101 0 0 5 8 Z 7,083 Z,078 80Z 1,104 94 Z8 0 0 lZ 38 4,010 9,898 5,727 3,598 10 0 0 58 Z8 477 Z3,570
19,617 16,611 1,090 434 584 60 50Z 9Z Z44 37,841 343 Z86 37 7 0 10 0 3 0 665 59Q 47Z 61 4 10 3 27 0 13 112 186 114 62 4 0 3 0 3 0 414
1,30Z 1,048 137 70 0 14 Z4 9 0 Z,408 685 473 . 159 30 0 ZO 0 3 0 1,440
1,546 1,189 31 29 ZIZ 0 77 8 0 3,Z70 3Z5 Z39 6 31 4~ I> 0 0 1 812 589 457 109 )3 0 3 P 3 4 1.2~4
1,954 1,658 6 102 174 0 0 14 0 4,327 ?"nn~ 1,562 Z87 0 146 1 0 6 1 1.,71o~ '9,658 8.783 192 128 0 0 293 43 Z19 18,703
313 ZZ9 0 3 0 0 81 0 0 468 117 101 3 13 0 0 0 0 0 465
25,
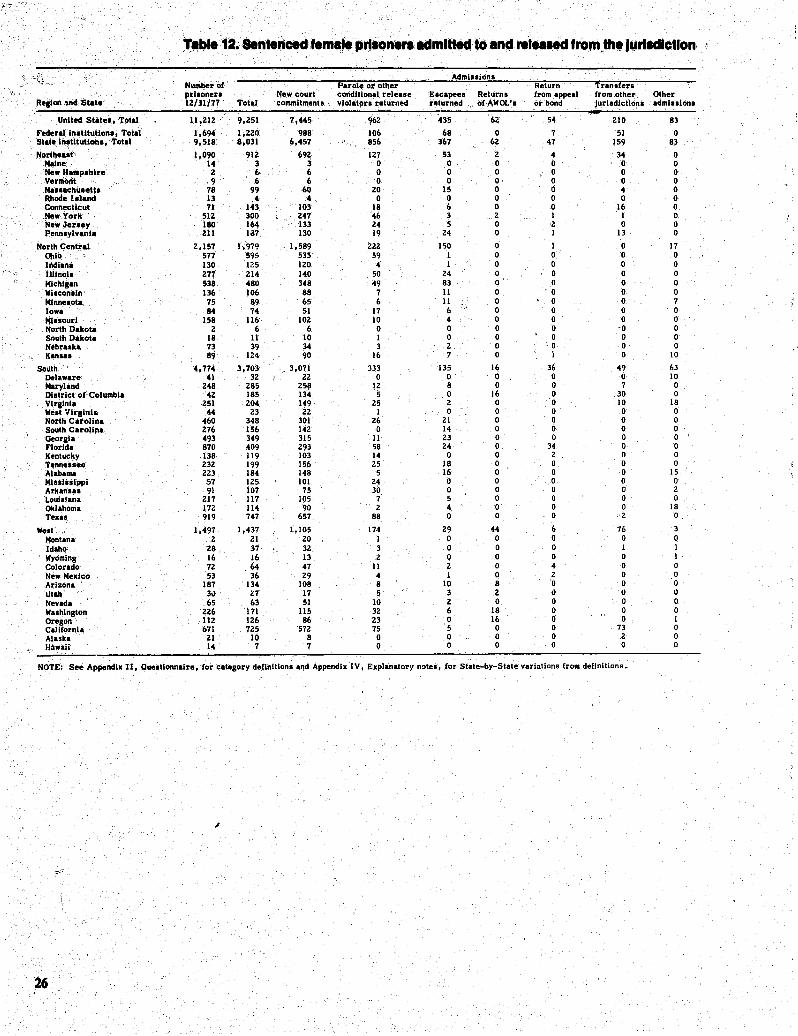
;, ...... ,.---
'.,
rable '1a~ SentencecUem.'e prilOn .... admltteci to and rel",ed trom,the ,"rlldlctlon
Admlllions Number of Parole or olher Relurn Tran.fer.
\'. prloonerl New court condlllonal relea.e Elcapee. Relurn. from appeal from olher Olher Rellon and 'State 1Z/31/77 Tolar commlt",enls vlolal!>r •. relurned r .. lurned of AWOL'I or bond jurlsdlctlo~1 admlnlonl
Unlied Stiltel, Total 11,212 9,251· 7,445 962 '435 -62 54 210 83
Federal InlUtutionl, Tolal 1,694 1,220 988 106 68 0 7 51 0 Stale In;"lItutionl, Total 9,518' 8,031 6,457 856 367 62 47 159 83
Northe'II" 1,090 912 692 127 53 2 4 34 0 Maine 14 3 3 0 0 0 0 0 0 New Hamplhlre 2 6· 6 0 0 0 0 0 0 Ve .. iont ·9 6 6 0 0 0 0 0 0 MilnachuaeUI 78 99 60 20 IS 0 0 4 0 Rhode !eland 13 ,4 4 0 0 0 0 0 0 Connecticut 71 143 103 18 6 0 0 16 0 New York 512 300 247 46 3 2 I I 0 New Jeuey 180 164 133 24 5 0 2 0 0 Pennlylvanla 211 la7 130 19 24 0 I 13 0
North Central 2,157 1-,979 1,589 222 150 0 I 0 17 Ohl~ 577 595 535 59 1 0 0 '0 0 Indiana 130 12.5 120 4 I 0 0 0 0
-",;:- Il11no.11 277 214 140 50 24 0 0 0 0 Mlchlilan 538 480 348 49 83 0 0 0 0 Whconsln 136 106 88 7 11 0 0 0 0 Mlnnelota. 75 89 65 6 11 0 0 0 7 Iowa 84 74 51 17 6 0 0 0 0 Iflllourl 158 116' 102 10 4 0 0 0 0 North Dakota 2 6 6 0 0 0 0 '0 0 South Dakota 18 11 10 I 0 0 0 0 0 H~bra.ka 73 39 34 3 2 0 0 0 0 Kan ... 89 124 90 16 7 0 0 10
Soulh 4,774 3,703 • 3,071 333 135 16 36 49 63 Delaware 41 32 22 0 0 0 0 0 10 Maryland 248 285 258 12 8 0 0 7 0 District of'Columbla 42 185 134 5 0 16 0 30 0 Virginia 251 204 149 25 2 0 0 10 18 welt Virginia 44 23 22 I 0 0 0 0 0 Nortli Carolina 460 348 301 26 21 0 0 0 0 South Carolina 276 156 142 0 14 0 0 0 0 Georgia 493 349 315 11 23 0 0 0 0 Florida 870 409 293 58 24 0 34 0 0 Kenlueky 138 119 103 14 0 0 2 0 0 Tennessee 232 199 156 25 18 0 0 0 0 Alabama 223 184 148 5 16 0 0 0 15 Mluil.lppi 57 125 101 24 0 0 0 0 0 Arka"." 91 107 75 30 0 0 0 0 2 Lowalana 217 117 105 7 5 0 0 0 0 Oklahoma 172 114 90 2 4 0 0 0 18 TexII. 919 747 657 88 0 0 0 2 0
Well .. : 1,497 1,437 1,105 17·. 29 44 6 76 Monlana 2 21 20 I 0 0 0 0 0 Idaho 28 37 32 3 0 0 0 1 I Wyoming 16 16 13 2 0 0 0 0 I Colorado 72 64 47 11 2 0 4 0 0 Hew Mexico 53 36 29 4 1 0 2 0 0 Arizona 187 134 108 8 10 8 0 0 0 Ulah 3~ 27 17 5 3 2 II " " Nevada 65 63 51 10 2 0 0 ·0 0 Walhlnglon 226 171 115 32 6 18 0 0 0 Oregon' 112 126 86 23 0 16 0 0 I California 671 725 '572 75 5 0 0 73 0 Alaska 21 10 8 0 0 0 0 2 0 HawaII 14 7 7 0 0 0 0 0 0
NOTE. See Appendix n, Queilionnalre, for category definlllon. and Appendix IV, Explanalory noles, for State-by-Slale variations {rom dennilions.
26
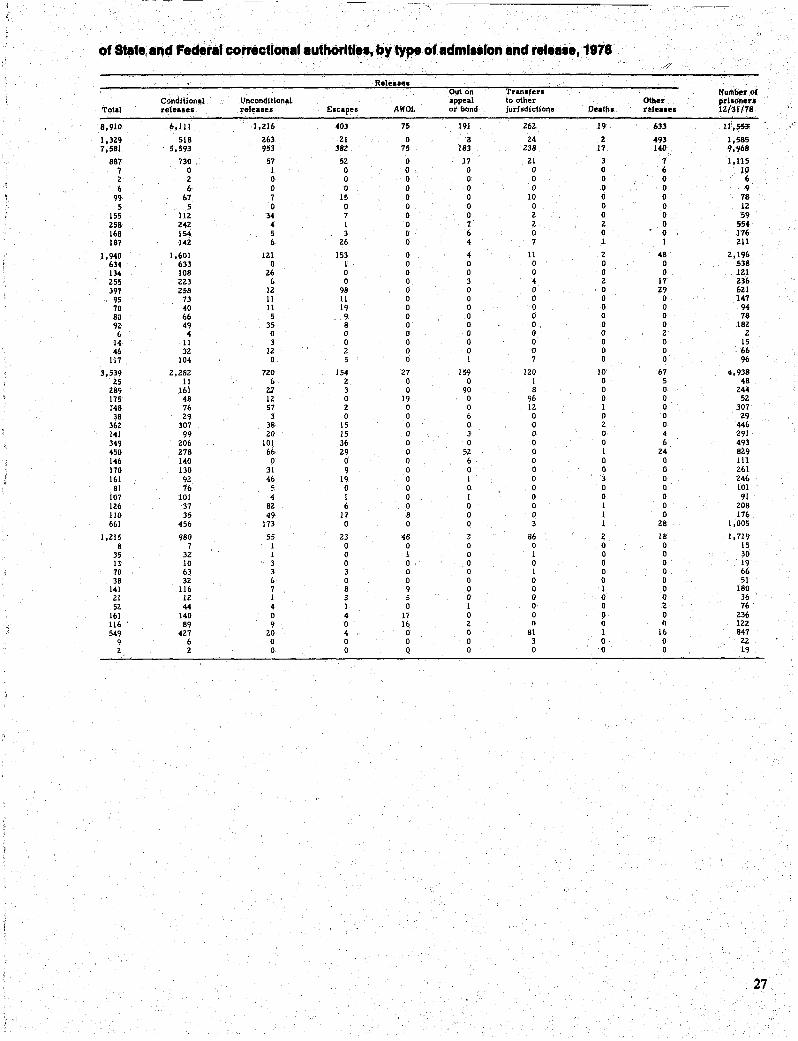
'-:.'
of Sta'e,.nd Feder.' co ..... c.ion.,.uihorf.I •• , by type of .dml.llon .nd rele ... , 1978 ,:f'
Rele •• e. Out On Transfers Nulilber,of
ConditIonal Vncondltlonal appeal to other Other prilonen Totll releasea rel~.le8 Elclpes AWOL or bond jurisdictions Death. rele.lel 12/31/78
8,910 6,111 1,216 403 75 191 262 19 633 1I,55-:!'
1,329 518 263 21 0 8 24 2 493 1,585 7,581 5,593 953 382 75 183 238 17 140, 9,968
887 730 57 52 0 l7 21 3 7 1,115 7 0 1 0 0 0 0 0 6 10 2 2 0 0 0 0 0 0 0 6 6 6 0 0 0 0 0 0 0 9
99 67 7 15 0 0 10 0 0 78 5 5 0 0 0 0 0 0 0 12
155 112 34 7 0 0 2 0 0 59 258 242 4 I 0 7 Z 2 0 554 168 154 5 3 0 6 0 0 0 H6 187 142 6 26 0 4 7 I I 211
1,940 1,601 121 153 0 4 11 2 48 2,196 634 633 0 I 0 0 0 0 0 538 134 108 26 0 0 0 0 0 0 121 255 223 6 0 0 3 4 2 17 236 397 258 12 98 0 0 0 0 29 621
95 73 11 11 0 0 0 0 0 147 70 40 11 19 0 0 0 0 0 94 80 66 5 9 0 0 0 0 0 78 9Z 49 35 8 0 0 0 0 0 182
6 4 0 0 0 0 0 a 2 2 11 11 3 0 0 0 0 0 0 IS 46 32 12 2 0 0 0 0 a 66
117 104 0 5 0 I 7 0 0 96
3,539 2,282 no 154 27 159 120 10 67 4,938 ~5 II 6 2 0 0 I 0 5 48
289 161 Z'1 3 0 90 8 0 0 244 175 48 12 a 19 a 96 a 0 52 148 76 57 2 0 0 12 I 0 307 38 29 3 0 0 6 0 0 0 29
362 307 38 15 0 0 0 2 0 446 141 99 20 15 0 3 0 0 .. 291 349 206 101 36 0 0 0 0 6 493 450 278 66 29 0 52 0 I 24 829 146 140 0 0 0 6 0 0 0 III 170 130 31 9 0 0 0 0 0 261 161 92- 46 19 0 I 0 3 0 246
81 76 0 0 0 0 0 0 101 107 101 4 I 0 I 0 0 0 91 126 37 82 6 0 0 0 1 0 208 110 35 49 17 8 0 0 I 0 176 661 456 173 0 0 0 3 1 28 1,005
1,215 980 55 23 48 86 2. 18 1,719 8 7 1 0 0 0 0 0 0 15
35 32 J 0 J 0 I 0 0 30 13 10 3 0 0 0 0 0 0 19 70 63 3 3 0 0 I 0 0 66 38 32 6 0 0 0 0 0 0 51
141 116 7 8 9 0 0 1 0 180 21 12 I 3 5 0 0 0 0 36 52 44 4 1 0 1 0 0 2 76
J61 J40 0 4 J1 0 0 9 0 236 116 89 9 0 16 2 n 0 0 122 549 427 20 4 0 0 81 I i6 847
9 6 0 0 0 0 3 0 0 ;';' 22 2 2 0 0 0 0 0 0 0 19
27
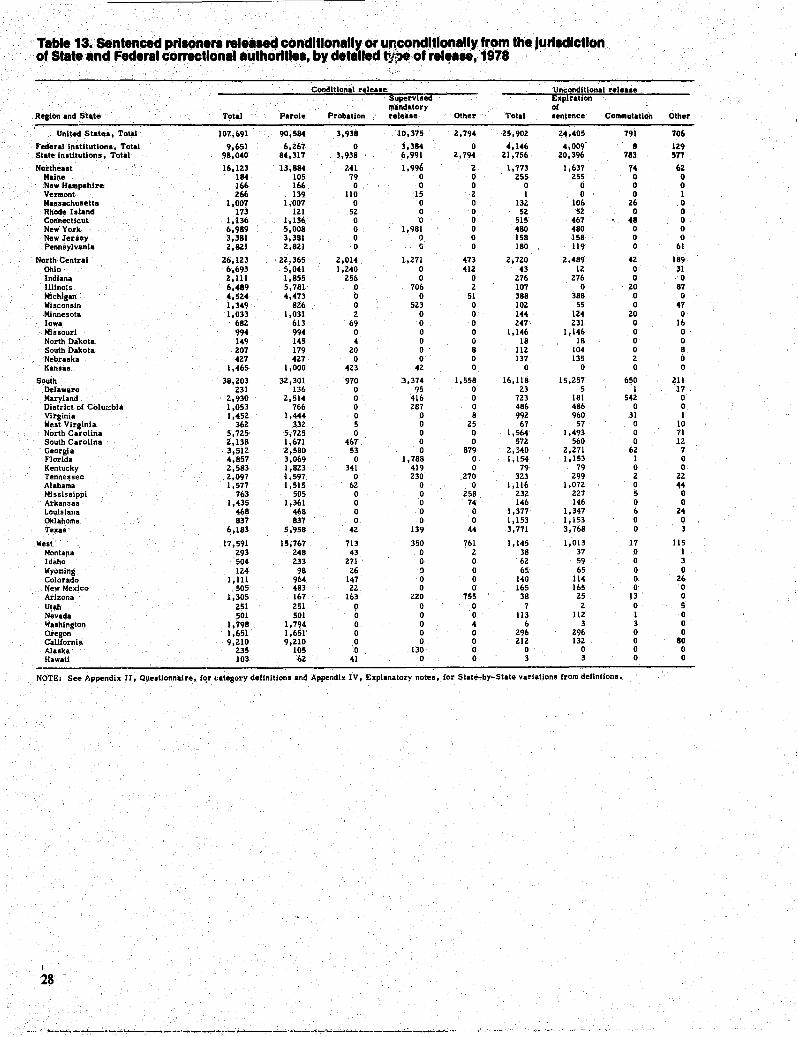
Tilble13. Sentenced prilOne,. relea'e4 conditionally or uJ\cqndltlonaIlYcfr.~m the Jurlldlctlon of State and Federal correctlonalauthorltle •• by detailed typ.,of rel~a ... 1978 '
''.c'
Conditional release Unconditional releale Supervilea Expiration mandatory o(
, Re810n and State' Total Parole Probation rele •• e Other ,'otal lentence Commutation Other
United Statea, Total 107,691 90,584 3,938 10,375 2,794 25,902 24,405 791 706
Federal inltitutionl, Total 9,651 6,267 0 3,384 0 4,146 4,009 II 129 State inlUtutionl, Total 98,040 84,317 3,938 6,991 2,794 'U,756 20,396 7113 577
Northealt 16,123 13,884 241 1,996 2 1,773 1,637 74 6Z Maine 184 105 79 0 0 255 255 0 0 New Hamplhire 166 166 0 0 0 0 0 0 0 Vermont 266 139 110 15 Z 1 0 0 I Mas.achuletts 1,007 1,007 0 0 0 132 106 26 0 Rhode Island 173 121 52 0 0 52 52 0 0 Connecticut 1,136 1,136 0 0 0 515 467 48 0 New York 6,989 5,008 0 1,981 0 480 480 0 0 New Jersey 3,381 3,381 0 0 0 158 158 0 0 Pennsylvania 2,8Z1 2,821 0 G 0 180 119 0 61
North Central 26,123 22,365 2,014 1,271 473 2,720 2,489 42 189 Ohio 6,693 5,041 1,240 0 412 43 12 0 3\. Indiana 2,111 1,855 256 0 0 276 276 0 0 Illinois 6;489 5,781 0 706 2 107 0 20 87 Michigan 4,524 4,473 0 0 51 388 388 0 0 Wisconsin 1,349 826 0 523 0 102 55 0 47 Minnesota 1,033 1,031 Z 0 0 144 124 20 0 Iowa 682 613 69 0 0 247 231 0 16 Missouri 994 994 0 0 0 1,146 1,146 0 0 North Dakota 149 145 4 0 0 18 18 0 0 South Dakota 207 179 20 0 8 112 104 0 8 Nebraska 427 427 0 0 0 137 135 2 0 Kansas 1,465 1,000 423 42 0 0 0 0 0
South 38,203 32,301 970 3,374 1,558 16,118 15.257 650 211 Delaware 231 136 0 95 0 23 5 I 17 Maryland 2,930 2,514 0 416 0 723 181 542 0 District of Colu:;:bia 1,053 766 0 287 0 486 486 0 0 Virginia 1,452 1,444 0 0 8 992 960 31 I West Virginia 362 332 5 0 25 67 57 0 10 North Carolina 5,725 5,725 0 0 0 1,564 1,493 0 11 South Carollna 2,138 1,671 467 0 0 572 560 0 12 Georgia 3,512 2,580 53 0 879 2,340 2,271 62 7 Florida 4,857 3,069 0 1,788 0 1,15'1 1,153 I 0 Kentucky 2,583 1,823 341 419 0 79 79 0 0 Tennessee 2,097 '1,597 0 230 270 323 299 2 22 Alabama 1,577 1,515 62 0 0 1,116 I,on 0 44 Mississippi 763 505 0 0 258 232 227 5 0 Arkanaas 1,435 1,361 0 0 74 146 146 0 0 Louisiana 468 468 0 0 0 i,377' 1,347 6 24 Oklahoma 837 837 0 0 0 1,153 1,153 0 0 Texas 6,183 5,958 42 139 44 3,771 3,768 0 3
West 17,591 15,767 713 350 761 1,145 1,013 17 115 Montana 293 248 43 0 2 38 37 0 I Idaho 504 233 271 0 0 62 59 0 3 Wyoming 124 98 26 !) 0 M, 65 0 0 Colorado 1,111 964 147 0 0 140 114 0 26
,New Mexico 50S 483 22 0 0 165 165 0 0 Arizona 1,305 167 163 ZZO 155 38 25 13 0 Utah 251 251 9 0 0 7 2 0 ~ Nevada 501 501 0 0 0 113 112 1 0 'Iashington 1,798 1,794 0 0 4 6 3 3 0 Oregon 1,651 1,651 0 0 0 296 296 0 0 Caurornil 9,210 9,210 0 0 0 212 132 0 80 Alaska 235 105 0 130 0 0 0 0 0 Hawali 103 62 41 0 0 3 3 0 0
NOTE: See Appendix II, Quellionnalre, f,!r category definitions and Appendix IV, Explanatory notes, (or State-by-State variations (rom defintlons.
I
28
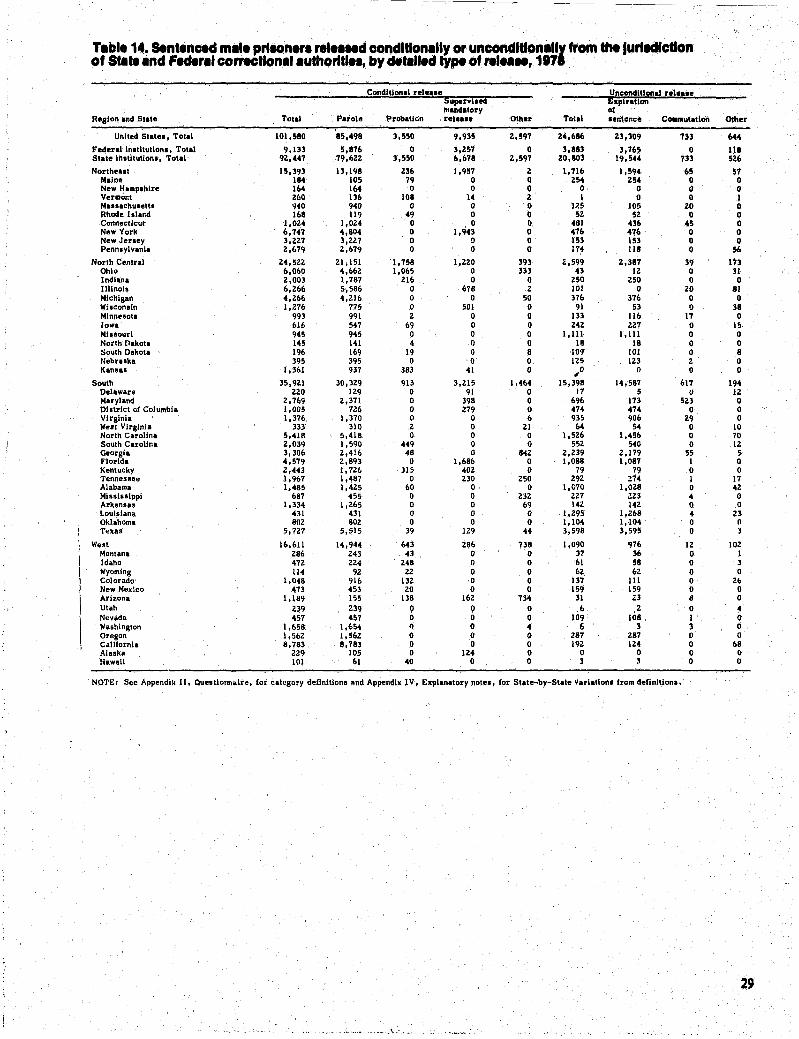
------,---------------~--------
T.ble 14. Sent.nced m.l. prtlOn.r. rel .... d condltlon.lly or unCOndltlOn.1I1 'rom the lurtlCllction of Stllte .nd Feder.1 correctloniliuthorttl •• , by detln.d typepf rei ... , 117 .
Condillonil rel.lle UncondUlonal r.l.lle Supervllea Expiration .. Indalory of
Region Ind Siale TOIII Parole ProblUCiII releaae Other Tolil lentem;e C_ .. ulilion Other
United Sllle., TOlal 101,580 15,498 3,550 9,935 2,597 24,6116 23,309 133 644
Federal Inllliulion., Totll 9,133 5,876 0 3,257 0 3,883 3,765 0 118 Siale Inllliullon., Tolal '12,447. 79,622 3,550 6,671 Z,597 ZO,I03 1'1,544 733 5Z6
Norlhe"l 15,393 13,198 Z36 1,'157 Z 1,716 1,5'14 65 57 Maine 184 lOS 7'1 0 0 Z54 Z54 0 0 New Ha"plhlre 164 164 0 0 0 0 0 0 0 Vermont Z60 136 108 14 Z I 0 0 1 Mal •• chulett. 940 '140 0 0 0 17.5 105 ZO 0 Rhode bland 168 11'1 49 0 0 5Z 5Z 0 0 ConnecUeut I,OZ4 I,OZ4 0 0 0 481 436 45 0 New York 6,747 4,804 0 l,ci43 0 476 476 0 0 New Jerl.y 3,Z27 3,2Z7 0 0 0 153 153 0 0 Pennlylvanla Z,679 2,679 0 0 0 174 118 0 56
Norlh Central 24,52Z ZI;151 1,758 1,220 3'13 Z,599 Z,387 3? 173 Ohio 6,060 4,66Z 1,065 0 333 43 IZ 0 31 Indiana 2,003 1,787 216 0 0 Z50 Z50 0 0 Illlnola 6,Z66 5,586 0 678 2 101 0 20 81 Michigan 4,266 4,216 0 0 50 376 376 0 0 Wilconsin I,Z76 775 0 501 0 91 53 0 38 Minnesota 993 991 2 0 0 133 116 17 0 Iowa 616 547 69 0 0 24Z Z27 0 IS Millourl 945 945 0 0 0 1,111 1,111 0 0 North nakotl 145 141 4 0 0 18 18 0 0 Soulh Dakota 196 169 1'1 0 8 109 101 0 8 Nebruka 395 395 0 0 0 IZ5 123 2 0 Kanaa. 1,361 937 383 41 0 ,0 0 0 0
South 35,'1ZI 30,32'1 913 3,ll5 1,464 15,3'1~ 14,587 617 1'14 Dellware 2Z0 129 0 9i 0 17 5 IJ lZ Mlryllnd Z,769 Z,371 0 398 0 696 173 5Z3 0 Dllirict oC Columbia 1,005 726 0 279 0 474 474 0 0 Vlrglnll 1,376 1,370 0 0 6 935 906 Z'I 0 We.1 Virginia 333 310 2 0 21 64 54 0 10 North Carolina 5,41ft 5,418 0 0 0 1,526 1,456 0 70 South Clrollna 2,039 1,590 449 0 0 552 540 0 12 Georgia 3,306 2,416 48 0 84Z 2,l39 2,179 55 5 Florldl 4,579 2,893 0 1,686 0 1,088 1,087 I 0 Kenlucky 2,443 1,726 315 402 0 79 79 0 0 Tennesllt!e 1,967 1,487 0 230 250 29Z 274 I 17 Alabama 1,485 1,425 60 0 0 l,e-70 1,028 0 42 Mls.iulppl 687 455 0 0 Z32 2Z7 ZZ3 4 0 Arkan ... 1,334 1,265 0 0 6'1 14Z 142 0 0 Lou.lsiana 431 431 0 0 0 1,295 1,268 4 23 Oklahoma 802 802 0 0 0 1,104 1,104 0 n Texas 5,727 5,515 39 J29 44 3,598 3,595 0 3
Weol 16,611 14,944 643 286 138 1,090 976 12 tOZ Montana Z86 243 "3 0 0 31 36 0 1 Idaho 47Z 2Z4 248 0 0 61 58 0 3 Wyoming 114 92 Z2 0 0 62 62 0 0 Colorado· 1,048 916 132 ·0 0 137 111 0 2b New Mex1co 473 453 20 0 0 159 159 0 0 Arizona 1,189 155 138 162 734 31 23 " 0 Ulah 23'1 239 \I \I (I .6 .2 0 ~ Nevada 457 457 0 0 0 10'1 108 I 0 Washinglon 1,658 1,654 I) 0 " 6 3 3 0 Oregon 1,562 1,562 0 0 0 281 287 0 0 California 8,783 8,783 0 0 0 192 124 0 68 Alaska 229 105 0 124 0 0 0 0 0 HawaII 101 61 40 0 0 3 3 0 0
NOTE: See AppendiU II, QuesUonnaire, (or calegory deflnillon. and Appendix IV, Explanalory nolel, (or Slale~by-State var11110n. Irom dellnlllon ••
29
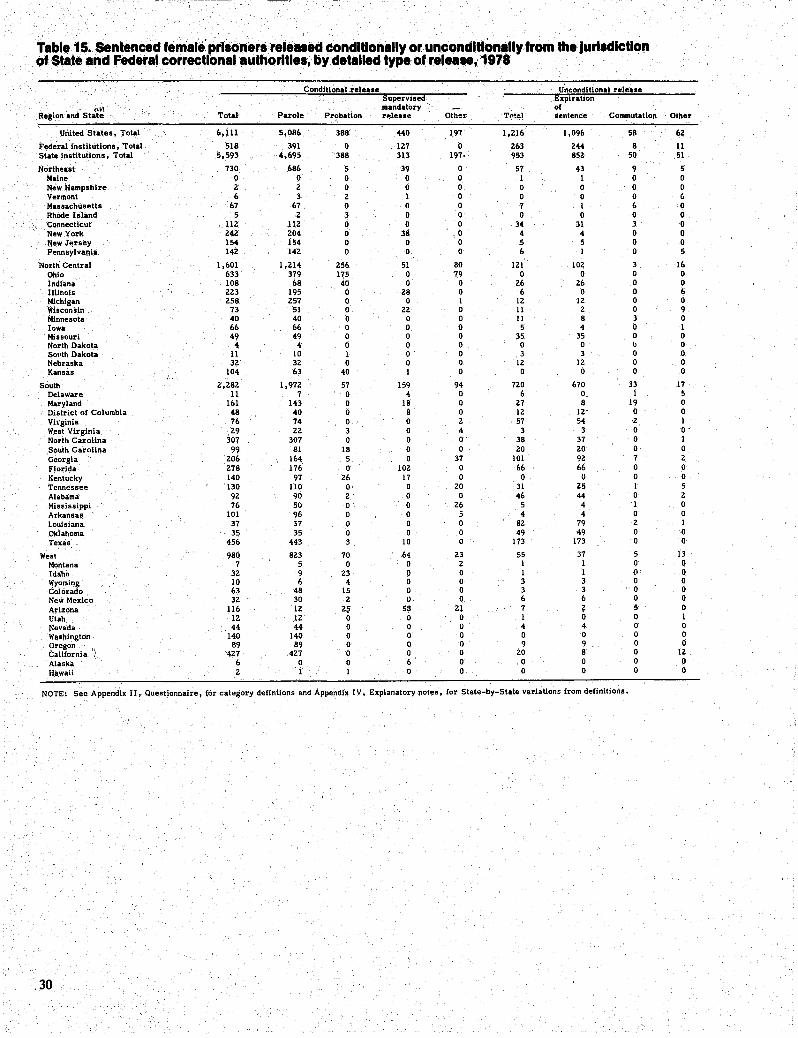
------ .------
Table 15. Sentenced female' prl.onerarelea.ed condltlonallyor.uneondltlonally.from the Jurisdiction of State and Federal correctlonal4'uthOritle., by detililed type of relea .. ,1978
Condltlonal.releale Unconditional relea't!: Supervlsea Expiration
vIA mandatory of Region and State Total Parole Probation ff!lea.e Other TotAl sentence Commuiatlon Other
United States, Total 6,111 5,086 388 440 197 1,216 1,096 58 6Z
Federal institutions, Total 518 391 0 127 0 Z63 Z44 8 11 State Institutions, Total 5,593 4,695 388 313 197. 953 85Z 50 51
Northeast 730 686 5 39 0 57 43 9 5 Maine 0 0 0 0 0 I I 0 0 New Hampshire 2 Z 0 0 0 0 0 0 0 Vermont 6 3 Z I 0 0 0 0 & Massachusetts 67 67 0 0 0 7 I 6 0 Rhode Island 5 Z 3 0 0 0 0 0 0
<~ Connecticut 11Z liZ 0 0 0 34 31 3 0 New York Z4Z Z04 0 38 0 4 4 0 0 New Jers"ey 154 154 0 0 0 5 5 0 0 Pennsylvania 14Z 14Z 0 0 0 6 I 0 5
North Central 1,601 I,ZI4 Z56 51 80 lZI 10Z 3 16 Ohio 633 379 175 0 79 0 0 0 0 Indiana 108 68 40 0 0 Z6 Z6 0 0 Illinois ZZ3 195 0 Z8 0 6 0 0 6 Michigan Z58 Z57 0 0 1 IZ lZ 0 0 Wisconsin 73 51 0 ZZ 0 11 Z 0 9 Minnesota 40 40 0 0 0 11 8 3 0 Iowa 66 66 0 0 0 5 4 0 I Missouri 49 49 0 0 0 35 35 0 0 North Dakota 4 4 0 0 0 0 0 Il 0 SOl'th Dakota 11 10 1 0 0 3 3 0 0 Nebraska 3Z 3Z 0 0 0 lZ lZ 0 0 Kansas 104 63 40 1 0 0 0 0 0
South Z,Z8Z 1,912 57 159 94 120 670 33 17 Delaware 11 7 0 4 0 6 O. 1 5 Maryland 161 143 0 18 0 Z7 8 19 0 District of Columbia 48 40 0 8 0 lZ lZ' 0 0 Virginia 76 74 0 0 Z 57 54 Z I West Virginia Z9 ZZ 3 0 4 3 3 0 O' North Carolina 307 307 0 0 0 38 37 0 1 South Carolina 99 81 18 0 0 ZO ZO 0 0 Georgia Z06 164 5 0 37 101 9Z 7 Z Florida Z78 176 0 10Z 0 66 66 0 0 Kentucky 140 97 Z6 17 0 0 0 0 0 Tennessee 130 110 0 0 ZO 31 Z5 1 5 Alabama 9Z 90 Z 0 0 46 44 0 Z Mississippi 76 50 0 0 Z6 5 4 1 0 Arkansas 101 96 0 0 5 4 4 0 0 Louisiana 37 37 0 0 0 8Z 79 Z 1 Oklahoma 35 35 0 0 0 49 49 0 0 Texas 456 443 3 10 0 173 173 0 0
West 980 8Z3 70 64 Z3 55 37 5 13 Montana 7 5 0 0 Z 1 1 0 0 Idaho 3Z 9 Z3 0 0 1 1 {l 0 Wyoming 10 6 4 0 0 3 3 0 0 Colorado 63 48 15 0 0 3 3 0 0 New Mexico 3Z 30 Z \) 0 6 6 0 0
Arizona 116 IZ Z~ 5? Z! 7 ? 5 0 Utah 12 12 0 0 0 1 0 0 1 Nevada 44 44 0 0 0 4 4 0 0 Washington 140 140 0 0 0 0 0 0 0
Oregon \ 89 89 0 0 0 9 9 0 0 California .) 427 4Z7 0 0 0 ZO 8 0 lZ
Alaska 6 0 0 6 0 0 0 0 0
Hawaii 2 1 1 0 0 0 0 0 0
NOTE: See App~ndix II, Questionnaire, for category defintions and Appendix IV, Explanatory not~s. for State-by-State variations from definitions.
.. 30
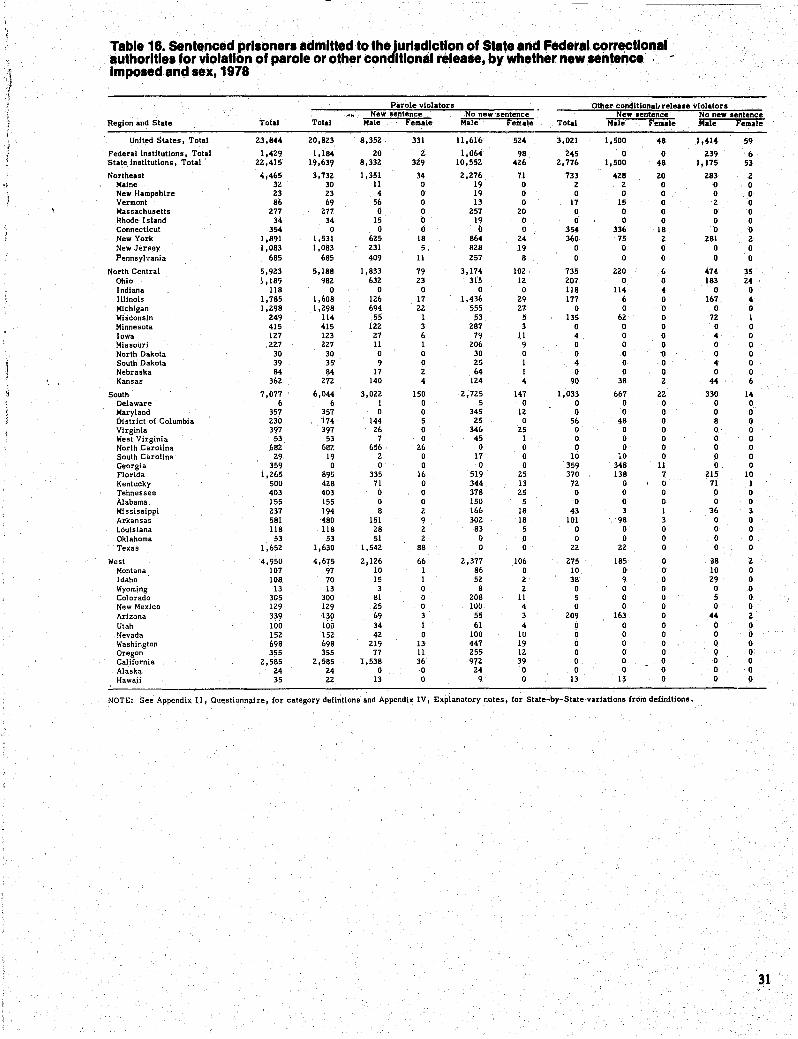
Table 16. Sentenced prllonerl admitted to th-jUrlldlctlon of State and Federal correctlonlill
) authorltlel for violation of parole or other con lIIonal release, by whether new sentence· ~' Impoled and lex, 1978
l Parole violators Other condltlon.ltrelea.e violators
New lentence No new "sentence New aentenct! No new lentence Region and State Total Total Male Female Male rem.le Total Male rt!!male Male' remale
United States, Total 23,844 20,823 8,352 331 11,616 524 3,021 1,500 48 1,414 59
Federal Institutions; Total 1,429 1,184 20 2 1,064 98 245 0 0 239 6 State Institutions, Total 22,415 19,639 8,332 329 10,552 426 2,776 1,500 48 1,175 53
Northeast 4,465 3,732 1,351 34 2,276 71 733 428 20 283 2 ., Maine 32 30 11 0 19 0 2 2 0 0 0 New Hampshire 23 23 4 0 19 0 0 0 0 0 0 Vermont 86 69 56 0 13 0 17 15 0 Z 0 Massachusetts 277 277 0 0 257 20 0 0 0 0 0 Rhode Island 34 34 15 0 19 0 0 0 0 0 0 Connecticut 354 0 0 0 0 0 354 336 18 0 0 New York 1,891 1,531 625 18 864 24 360 75 2 281 2 New Jersey 1,083 1,083 231 5 828 19 0 0 0 0 0 Pennsylvania 685 685 409 11 257 8 0 0 0 0 0
North Central 5,923 5,188 1,833 79 3,174 102 735 220 6 474 35 Ohio J ,189 982 632 23 315 12 207 0 0 183 24 Indiana 118 0 0 0 0 0 118 114 4 0 0 Illinois 1,785 1,608 126 17 1,436 29 177 6 0 167 4 Michigan 1,298 1,298 694 22 555 27 0 0 0 0 0 WiSconsin 249 114 55 1 53 5 135 62 0 n I Minnesota 415 415 122 3 287 3 0 0 0 0 0 Iowa 127 123 27 6 79 l.l 4 0 0 4 0 Missouri 2Z7 227 11 1 206 9 0 0 0 0 0 North Dakota 30 30 0 0 30 0 0 0 ~ 0 0 South Dakota 39 35' 9 0 25 I 4 0 0 4 0 Nebraska 84 84 17 2 64 1 0 0 0 0 0 Kansas 362 272 140 4 124 4 90 38 2 44 6
South 7,077 6,044 3,022 150 2,725 147 1,033 667 22 330 14 Delaware 6 6 1 0 5 0 0 0 0 0 0 Maryland 357 357 0 0 345 12 0 0 0 0 0 District of Columbia 230 174 144 5 25 0 56 48 0 8 0 Virginia 397 397 26 0 346 25 0 0 0 0 0 Wesl Virginia 53 53 7 0 45 1 0 0 0 0 0 North Carolina 682 be? 656 26 0 0 0 0 0 0 0 South Carollna 29 19 2 0 17 0 10 to 0 0 0 Georgia 359 0 0 0 0 0 359 348 11 0 0 Florida 1,265 &95 335 16 519 25 370 138 7 215 10 Kentucky 500 428 71 0 344 13 72 0 0 71 1 Tennessee 403 403 0 0 378 25 0 0 0 0 0 Alabama 155 155 0 0 150 5 0 0 0 0 0 Mississippi 237 194 8 2 166 18 43 3 1 36 3 Arkansas 581 480 151 9 302 18 101 98 3 0 0 Louisiana 118 U8 28 2 83 5 0 0 0 0 0 Oklahoma 53 53 51 2 0 0 0 0 0 0 0 Texas 1,652 1,630 1,542 88 0 0 22 22 0 0 0
West 4,950 4,675 2,126 66 2,377 106 275 185 0 -a8 2 Montana 107 97 10 1 86 0 10 0 0 10 0 Idaho 108 70 15 1 52 2 38 9 0 29 0 Wyoming 13 13 3 0 8 2 0 0 0 0 0 Colorado 305 300 81 0 208 11 5 0 0 5 0 New Mexico 129 129 25 0 100 4 0 0 0 0 0 Arizona 3~? 130 69 3 55 3 209 163 0 44 2 Utah 100 100 34 1 61 4 9 Q 0 9 9 Nevada 152 152 42 0 100 10 0 0 0 0 0 Washington 698 698 219 13 447 19 0 0 0 0 0 Oregon 355 355 77 11 255 12 0 0 0 0 0 California 2,585 2,585 1,538 36 972 39 0 0 0 0 0 Alaska 24 24 0 0 24 0 0 0 0 0 0 Hawaii 35 22 13 0 9 0 13 13 0 0 0
NOTE: See Appendix II, Questionn~iret for category defintions and Appendix IV, Explanatory notes, for State-by-State variations from definitions.
31
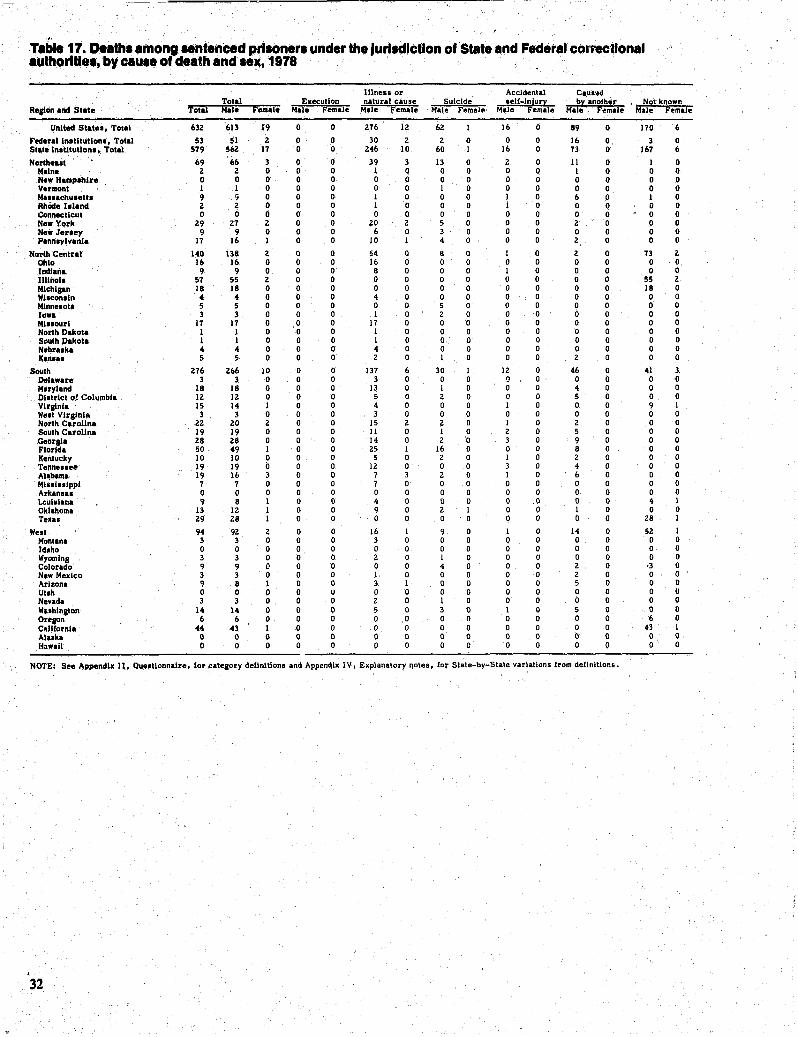
Table 17. Death. all10ng .. ntenced prl.oner. under the Jurlldlctlon of'State and Federal correctional a.,thorta •• , by cau.e of death and .ex, 1978 '.
IlIne .. or Accidental Cau.~ Tolal Execution natural cause Suicide lelf-Injurl bl anolher Not known
Re,ton ,and State 'fotal Rale female Male Female M.le Female Male Female M.le Female Male F'emale Male Female
United State., Total 63Z 613 19 0 0 Z76 lZ 62 16 0 89 0 170 6
Federal In.titutlon., Total 53 51 2 0 0 30 2 2 0 0 0 16 0 3 0 St.te In.Utution., Tot.1 579 562 17 0 0 246 10 60 I 16 0 73 0 167 6
North ••• t 69 66 3 0 0 39 3 13 0 2 0 11 0 I 0 M.lna 2 2 0 0 0 I 0 0 0 0 0 I 0 0 0 New H.mp.hlre 0 0 0 0 0 0 0 0 0 0 0 0 0 0 0 Vel'llont I I 0 0 0 0 0 I 0 0 0 0 0 0 0 M •••• chu •• II. 9 :; 0 0 0 I 0 0 0 I 0 6 0 I 0 RhOd. III.nd 2 2 0 0 0 I 0 0 0 I 0 0 0 0 0 Connecticut 0 0 0 0 0 0 0 0 0 0 0 0 0 0 0 New York 29 27 Z 0 0 20 2 5 0 0 0 2 0 0 0 New Jer.ey 9 9 0 0 0 6 0 3 0 0 0 0 0 0 0 Pann.ylvanla 17 16 I 0 0 10 I 4 0 0 0 2 0 0 0
North Central 140 138 2 0 0 54 0 8 0 I 0 2 0 n 2 Ohio 16 16 0 0 0 16 0 0 0 0 0 0 0 0 0 Indiana 9 9 0 0 0 8 0 0 0 I 0 0 0 0 0 IIIlnoll 57 55 Z 0 0 0 0 0 0 0 0 0 0 55 2 Mlchlaan 18 18 0 0 0 0 0 0 0 0 0 0 0 18 0 WI.con.ln .. 4 0 0 0 4 0 0 0 0 0 0 0 0 0 Mlnn.lola 5 5 0 0 0 0 0 5 0 0 0 0 0 0 0 low. 3 3 0 0 0 I 0 2 0 0 0 0 0 0 0 Mlnourl 17 17 0 0 0 17 0 0 0 0 0 0 0 0 0 North Dakota I 1 0 0 0 I 0 0 0 0 0 0 0 0 0 South Dakota 1 1 0 0 0 I 0 0 0 0 0 0 0 0 0 Nebra.ka 4 4 0 0 0 4 0 0 0 0 0 0 0 0 0 Kan ... 5 5 0 0 0 2 0 I 0 0 0 2 0 0 0
South 276 266 10 0 0 137 6 30 1 12 0 46 0 41 3, Delaware 3 3 0 0 0 3 0 0 0 0 0 0 0 0 0 Maryl.nd 18 18 0 0 0 13 0 I 0 0 0 4 0 0 0 Ol.trlct of Columbl. 12 12 0 0 0 5 0 2 0 0 0 5 0 0 0 Virginia IS 14 I 0 0 4 0 0 0 I 0 0 0 9 I We.t Vlr,lnla 3 3 0 0 0 3 0 0 0 0 0 0 0 0 0 North Carolina 22 20 2 0 0 15 2 2 0 I 0 2 0 0 0 South Carolina 19 19 0 0 0 11 0 I 0 2 0 5 0 0 0 Geor,la 28 28 0 0 0 14 0 2 0 3 0 9 0 0 0 Florid. 50 49 I 0 0 25 I 16 0 0 0 8 0 0 0 Kentucky 10 10 0 0 0 5 0 2 0 I 0 2 0 0 0 Tenne •• ee 19 19 b 0 0 12 0 0 0 3 0 4 0 0 0 Alabam. 19 16 3 0 0 7 3 2 0 I 0 6 0 0 0 Mli.llllppi 7 7 0 0 0 7 0 0 0 0 0 0 0 0 0 Arkan ... 0 0 0 0 0 0 0 0 0 0 0 0 0 0 0 Loui.lana 9 8 1 0 0 4 0 0 0 0 ,0 0 0 4 1 Oklahoma 13 12 1 0 0 9 0 2 I 0 0 I 0 0 0 Texaa 29 28 1 0 0 0 0 0 0 0 0 0 0 28 I
We.t 94 92 2 0 0 16 1 9 0 I 0 14 0 52 1 Monlana 3 3 0 0 0 3 0 0 0 0 0 0 0 0 0 Idaho 0 0 0 0 0 0 0 0 0 0 0 0 0 0 0 Wyoming 3 3 0 0 0 2 0 I 0 0 0 0 0 0 0 Color.do 9 9 0 0 0 0 0 4 0 0 0 2 0 -3 0 New Mexico 3 3 0 0 0 1 0 0 0 0 0 2 0 0 0 Arizona 9 8 1 0 0 3 1 0 0 0 0 5 0 0 0 Utah 0 0 0 0 u 0 0 0 0 0 0 0 0 0 0 Nev.da 3 3 0 0 0 2 0 I 0 0 0 0 0 0 0 Wuhlnston 14 14 0 0 I> 5 0 3 0 1 0 5 0 0 0 Oreson 6 6 0 0 0 0 0 0 0 0 0 0 0 6 0 Cftllfornla 44 43 1 0 0 0 0 0 0 0 0 0 0 43 1 Maaka 0 0 0 0 0 0 0 0 0 0 0 0 0 0 0 HawaII 0 0 0 0 0 0 0 0 0 0 0 0 0 0 0
NOTE: See Appendix II, Queatlonn.lre, for category definition. and Appendix IV. Explanatory notes. for Siale-by-State variation. from definitions_
32
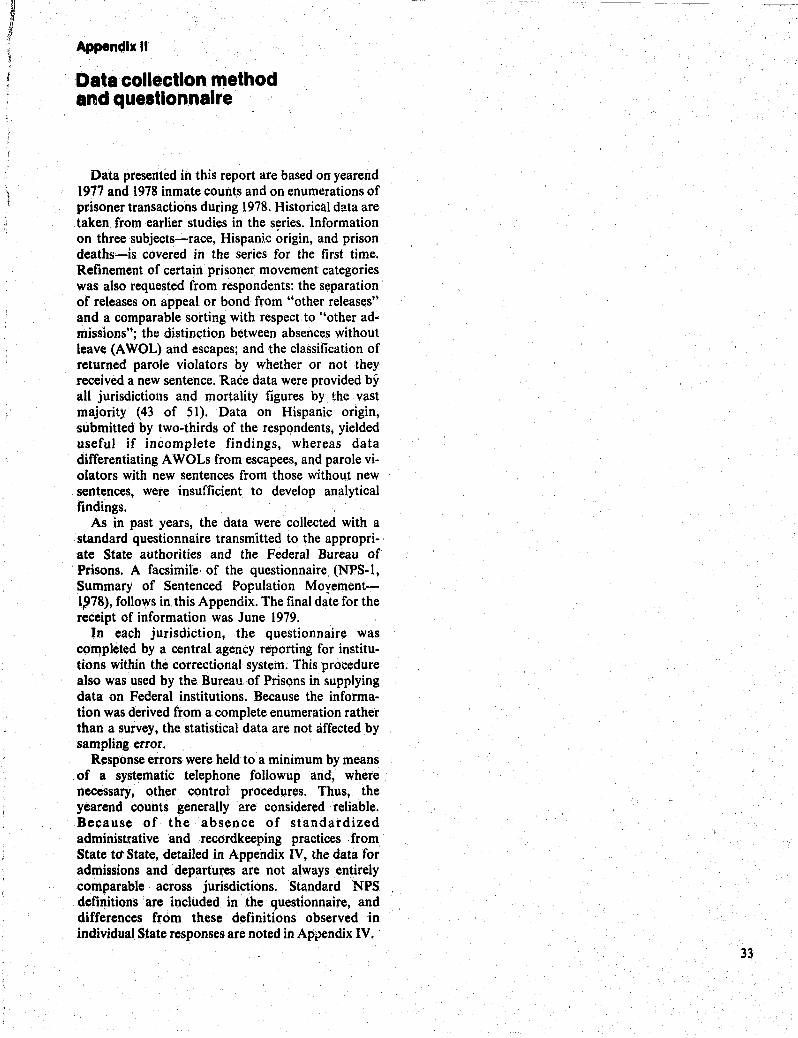
J (I
!
Appendix II
Data collection method and questionnaire
Data presented in this report are based on yearend 1977 and 1978 inmate counts and on enumerations of prisoner transactions during 1978. Historical data are taken from earlier studies in the series. Information on three subjects-race, Hispanic origin, and prison deaths-is covered in the series for the first time. Refinement of certain prisoner movement categories was also requested from respondents: the separation of releases on appeal or bond from "other releases" and a comparable sorting with respect to "other admissions"; the distinction between absences without leave (AWOL) and escapes; and the classification of returned parole violators by whether or not they received a new sentence. Race data were provided by all jurisdictiollS and mortality figures by the vast majority (43 of 51). Data on Hispanic origin, submitted by two-thirds of the respondents, yielded useful if incomplete findings, whereas data differentiating A WOLs from escapees, and parole violators with new sentences from those without new sentences, were insufficient to develop analytical findings.
As in past years, the data were collected with a ,standard questionnaire transmitted to the appropriate State authorities and the Federal Bureau of Prisons. A facsimile of the questionnaire (NPS-I, Summary of Sentenced Population Moyementt978), follows in this Appendix. The final date for the receipt of information was June 1979.
In each jurisdiction, the questionnaire was completed by a central agency reporting for institutions within the correctional system. This procedure also was used by the Bureau of Prisons in supplying data on Federal institutions. Because the information was derived from a complete enumeration rather than a survey, the statistical data are not affected by sampling error.
Response errors were held to a minimum by means ,of a systematic telephone follow up and, where necessary, other control procedures. Thus, the yearend counts generally ere considered reliable. Because of the absence of standardized administtative 'and recordkeeping practices . from State t<1' State, detailed in Appendix IV, the data for admissions and departures are not always entirely comparable across jurisdictions. Standard NPS defi~itions are included in the questionnaire, and differences from these definitions observed in individual, State responses are noted in Apl'endix IV. '
33
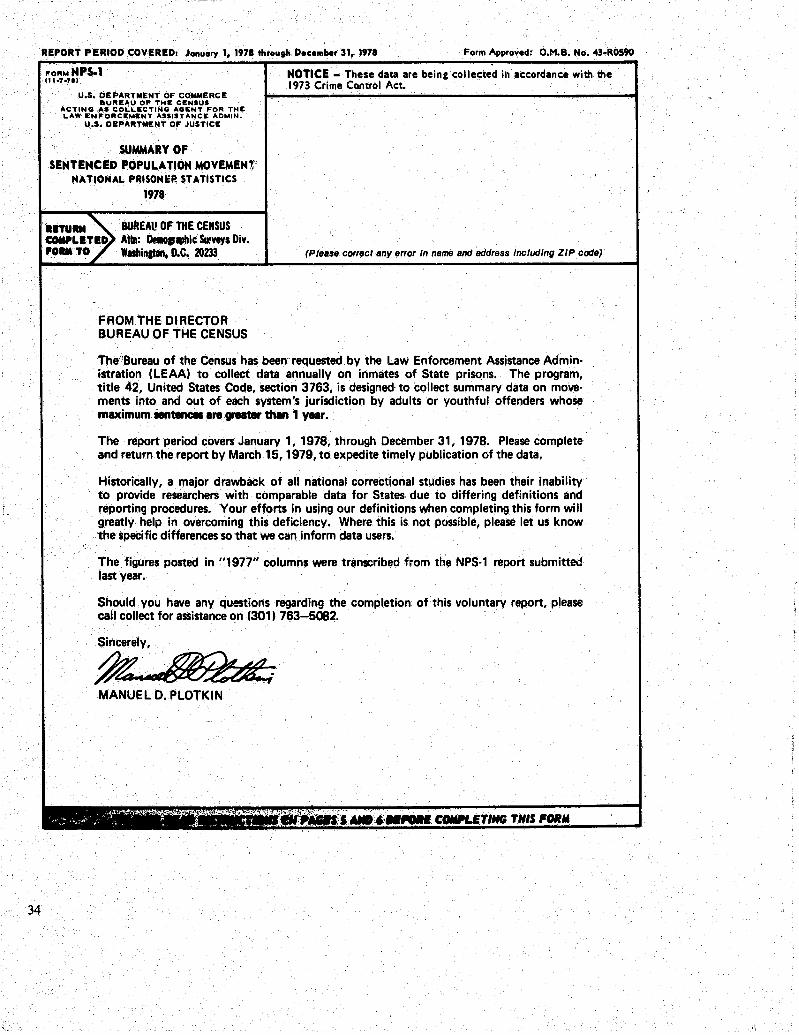
34
REPORT PERIOD COVERED: January " 1971 thraugh December 31, 1971 Form Approved: C.M.B. No. 43·ROS90
U.S. DEPARTMENT OF COMMERCE BUREAU OF THE CENSUS
ACTING"_ COLLECTING AGENT FOR THE LAW ENFORCEMENT ASSISTANCE ADMIN.
U.S. DEPARTMENT OF JUSTICE
SUMMARY OF SENTENCED POPULATION MOVEMENl,'
NATIONAL PRISONER STATISTICS
1978
BUREAl! OF THE CENSUS Attn: DtInIo"lIPhic Seneys Div. 'lSIIinaton. D.C. 10233
FROM THE DIRECTOR BUREAU OF THE CENSUS
NOTICE -These data are being collected in accordance with the 1.973 Crime Cantrol Act.
(Please correct any error In name and address IncllJdlng ZIP code)
The"Bureau of the Census has been requested by the Law Enforcement Assistance Administration (LEAA) to collect data annually on inmates of State prisons. The program, title 42, United States Code, section 3763, is designed- to collect summary data on movements into and out of each system's jurisdiction by adults or youthful offenders whose maximum sentences Ire greater than 1 YII'.
The report period covers January 1, 1978, through December 31, 1978. Please complete and return the report by March 15, 1979, to expedite timely publication of the data.
Historically, a major drawback of all national correctional studies has been their inability to provide researchers with comparable data for States due to differing definitions and reporting procedures. Your efforts in using our definitions when completing this form will greatly help in overcoming this deficiency. Where this is not pOSSible, please let us know the specific differences so that we can inform data users.
The figures posted in "1977" columns were transcribed from the NPS-l report submitted last year.
Should you have any questions regarding the completion of this voluntary report, please call collect for assistance on (301) 763-5082.
MANUEL D. PLOTKIN
'., ..... >~,..~ . ':,,....~.,~~ - ~ ~ ( • , •• , ~ ,. ...0( ... ' __ •• 4..t-... ..-
II
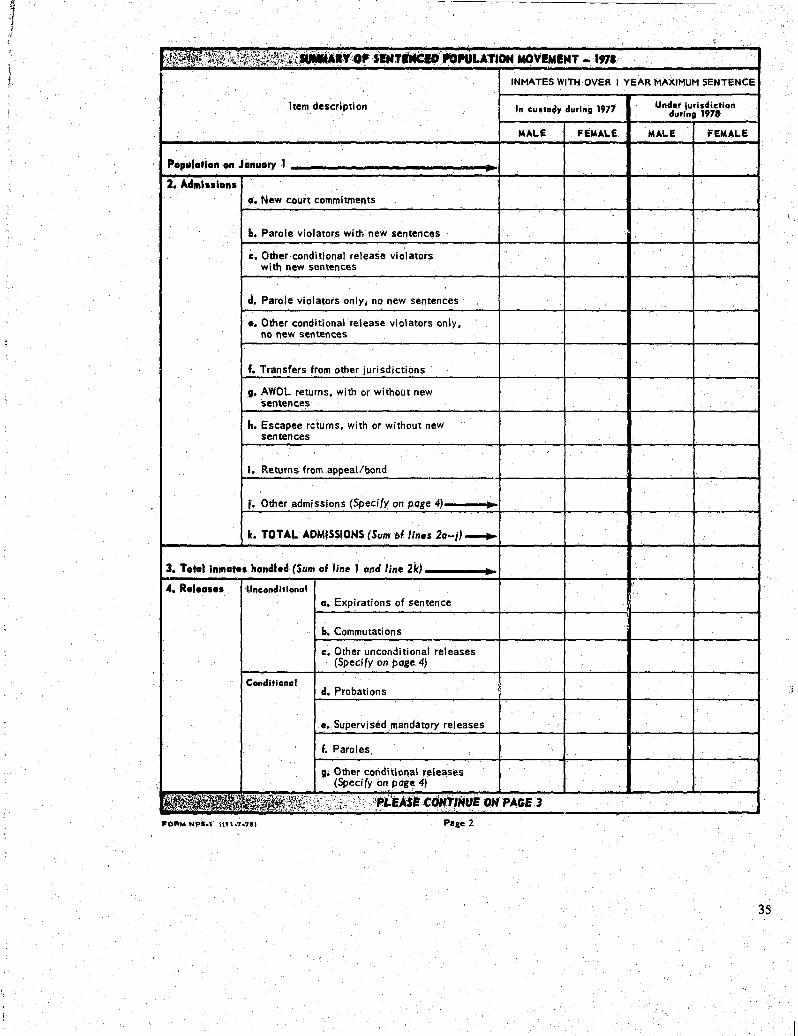
.',' • " ,,\;;:;;;!,;y,,~~' ," ,. , .ATlON.~.·:", .. " • 197. ' :~.\",~!;:>;.,,:!fW~.1~, , "c;r-;,.,,', ,,·v.- ... K: .......... .,. ,-INMATES WITH OVER I YEAR MAXIMUM SENTENCE
Item description In cUltody during 1977 Under jurisdiction during 1978
MALE FEMALE "'ALE FEMALE
Population on January 1
2. ~"._t, .t. ~_m' •• '''''.
a. New court commitments
b. Parole violators with new sentences
c. Other conditional release violators with new sentences
d. Parole violators only, no new sentences
o. Other conditional release violators only, no new sentences
f. Transfers from other jurisdictions
g. AWOL returns, with or without new sentences
h. Escapee returns, with or without new sentences
. I. Returns from appeal/bond
,. Other admiSSions (Specify on page 4) • k. TOTAL ADMISSIONS (Sum Mlinn 20-;)---'"
3. Totallnmato. handlod (Sum of line J anelline tic) .. ... Roloa.o. UnconditionClI
a. Expirations of sentence
b. Commutations :
c. Other unconditional releases (SpeCify on page 4)
CondltionClI d. Probations
e. Supervised mandatory releases
f. Paroles
g. Other conditional releases (Specify on page 4)
:;'·'/:.h:.; 'i"Pi:~.U:. ,_,.r~""UI:'OHPAGE3 Pale 2
35
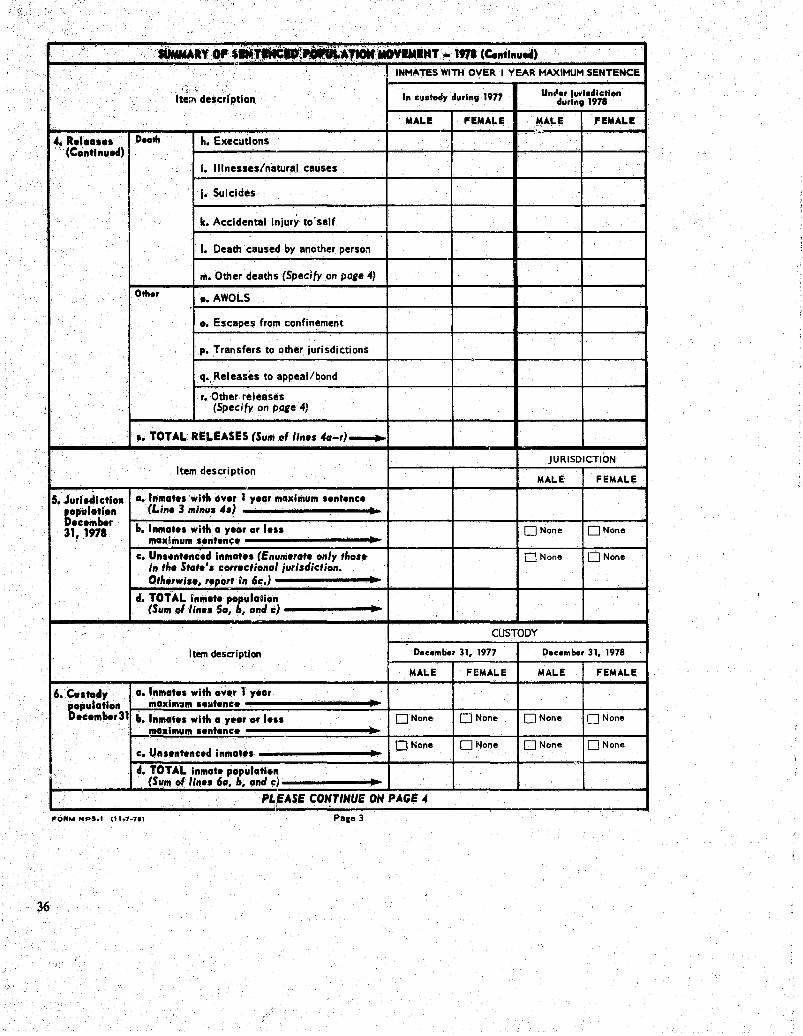
" ~.y~,; -i_.1~i_MOvIMI"T·- 1911 (Celt,"U"')' '"
INMATES WITH OVER I YEAR MAXIMUM .SENTENCE
I~~: ....
In cuatocl, clurlng 1977 Un""r luwlscllctlon Item description clurlng 197.
MALE FEMALE ,MALE FEMALE .
.t. R.I ••••• Do.th h. Executi ons (Colltillued)
I. Illnesses/natural causes
I. Suicides
k. Accidental injury to'self
I. Death caused by another person
m. Other deaths (Spedfy on poge 4)
Oth~r n. AWOLS
o. Escapes from confinement
p. Transfers to other jurisdictions
q., Releases to appeal/bond
r. Other releases (Specify on poge 4)
•• TOTAL RELEASES (Sum ,,1 lin •• 4a-r)---...
JURISDICTION Item description
MALE FEMALE
5. Jurl.ell ctlon a. Inm.t •• with ov.r 1 y.ar maximum I.ntonco Lopul.tlon (Lin. 3 m/nu. 4.) ,.
.c.",bor b.lnmato. with. yoar or 10" o None o None 31, 1978
max!!ftum .onton~o .. c. Un.llntonc.eI Inmato. (Enumorato only tho.o
In tho Stato'. corr.ctional iurl.diction. o None o None
Othorw/.o, r.port in 6c.) • eI. TOTAL inmato popula110n
(Sum 01 lin .. 50, b, and c) .. .' CUSTODY
Item description December 31, 1977 December 31, 1978
MALE FEMALE MALE FEMALE
6. Cu.toely a. Inmato. with ovor 1 yoar Lopulatloll maxlmllm 'oeltonco ..
.co",bor31 b. Inmato. with a yoar or 10" o None o None o None o None
maximum .ont.nc. • c. Unlontoncod Inmatol • o None o None o None DNone
"
'1' eI. TOTAL inmato population
(Sum 01 Iino. 60, ,b, ~nd c) .. PLEASE COHTIHUE ON PAGE 4
,i •
1"0lilM NPS.I 11101.1'1 Pace 3
36
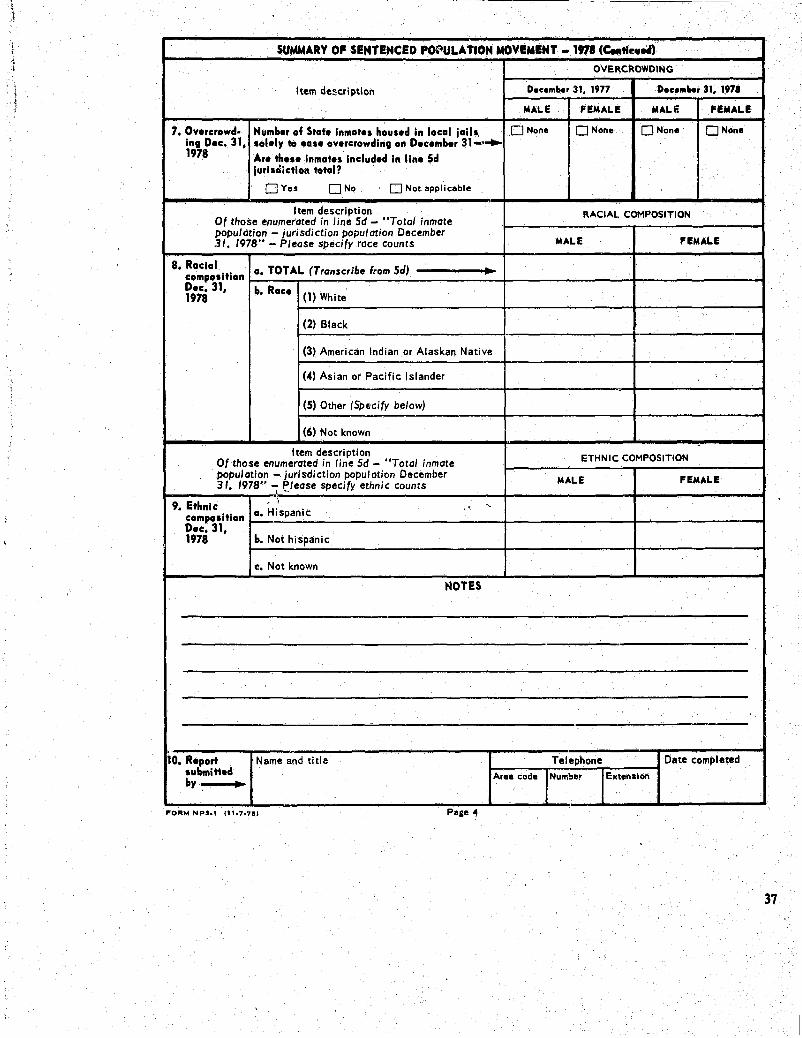
\ I
SUMMARY OF SENTENCED PO~ULATION MOVEMENT - 1971 (c:...tllI.Hl
OVERCROWDING
Item description Decembe, 31. 1977 Dece",", 31, 1971
MALE FEMALE MALE FEMALE
7. Overcrowd. Number of State Inmate. housed In local jail •. o None o None o None ONone Ing Dec. 31, lolely to ease overcrowding on December 31~ 1978 Are these inmates Included In line 5d
lurls&lction total?
DYes ONo o Not applicable
Item description RACIAL. COMPOSITION Of those enumerated in line Sd - "Total inmate population - jurisdiction population December
MALE FEMALE 31. 1975" - Please specify race counts
8. Roclal a. TOTAL (Transcribe from SJ) ... composition Dec. 31, b. Race
(1) White 1978
(2) Black . (3) American Indian or Alaskan Native
(4) Asian or Pacific Islander ,
(5) Other (Specify below)
(6) Not known .
Item description Of those enumerated in line Sd - "Total inmate ETHNIC COMPOSITION
population - jurisdiction j)oj)ulation December MALE FEMALE 3 I. 1978" I e./ease specify ethnic counts
9. EthniC . \ ,
composition a. Hispanic
Dec. 31, b. Not hispanic 1978
~. Not known
NOTES
i
10. Report Name and title Telephone Date completed lubmit1ed A,ea code ·/Numbllir /Extanslon by •
FORM NPS., 111.7.78l
37
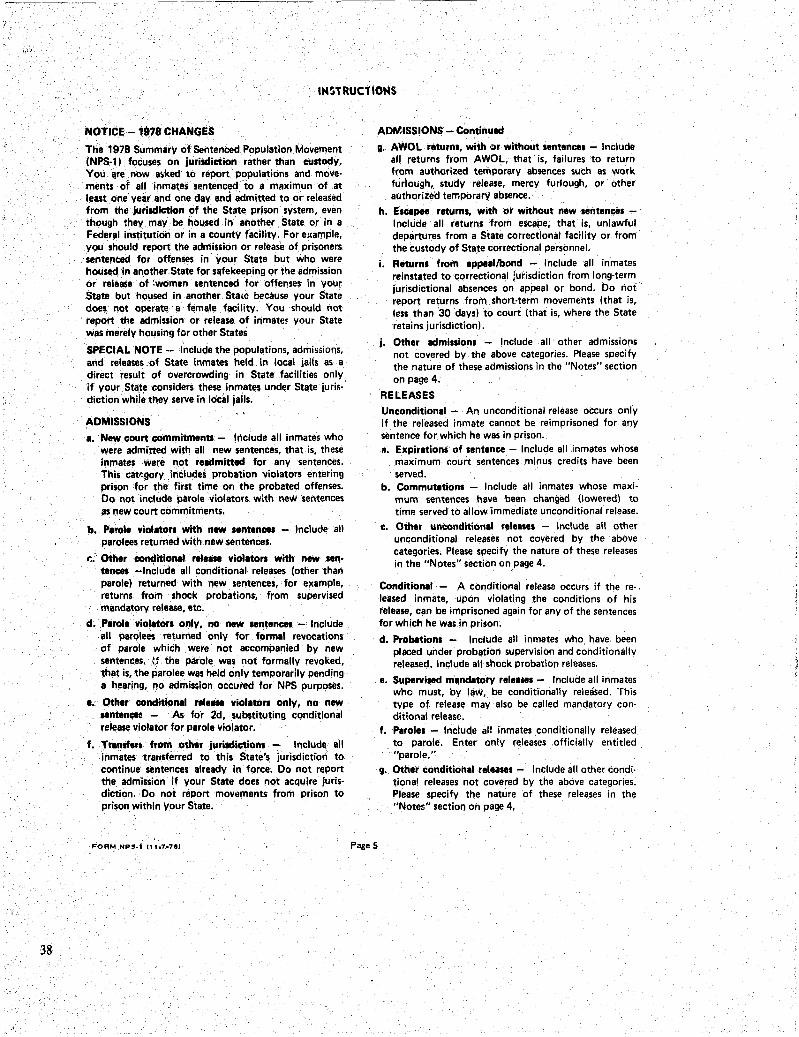
i"U
38
~----- --~-.----------.
IHnRUCTIOHS
NOTICE - 1918 CHANGES
The 1978 Summary of Sentenced Population Movement (NPS-1) focuses on jurilCliction rather than custody. You are. now a$ked to report populations and mOl/ements of all inmates sf!ntenced 'to a mllximun of at least one year and one day and admitted to or released from the ju,ilCliction of the State prison system, ellen though they. may be housed in another State or In a Federal institution or in a county facility. For e)(ample, you should report the admission or release of prisoners
~ Sentenced for offenses in your State but who were housed in another State for safekeeping or the admission or release of :women sentenced for offenses in your State but housed in another Stale because your State does not operate a female facility. You should not report the admission or release of irimates your State was merely housing for other States
SPECIAL NOTE - Include the populations, admissions, and releases of State inmates held in local jails as a direct result of overcrowding in State facilities only if your St",te considers these inmates under State jurisdiction while they serve in local jails.
ADMISSIONS
a. New court commitments - Include all inmates who were admitted with all new sentences, that is, these inmates were not relClmitted for any sentences. This catro.gory . includes probation violators entering prison for the first time on the probated offenses. 00 not include parole violators with new sentences as new court commitments.
b. Parole violaton with new .. ntences - Include all parolees returned with.new sentences.
r;: Other conditional r...... violatorl with new sen· tences -Include all conditional releases (other than parole) returned with new sentences, for example, returns from shock probations, from supervised mandatory release, etc.
d~ .Parole violator. only. no new sentences - Include all parolees returned only for formll revocations of parole which were not accompanied by new sentences. M the parole was not formally rel/oked, that is, the parolee was held only temporarily pending a hearing, no admission occured for NPS purposes.
e. Other conditional rile... violaton only, no new aentenCet!- As for 2d, substituting conditional release violator for parole violator.
f. Trlndl" from other jurilCliction. - Include all inmates' tnil1sferred to this State's jurisdiction to continue sentences already in force. 00 not report the admission if your State does not acquire jurisdiction. 00 not report movements from prison to prison within your State.
AOMISS!ONS- Continued
II. AWOL return., with or without sentence. - Include all returns from AWOL, that is, failures to return from authorized temporary absences such as work furlough" study release, mercy furlough, or other authorized temporarY absence.
h. Escapee return., with or without new sentencel -Include all returns from escape, that is, unlawful departures from a State correctional facility or from the custody of State correctional personnel,
i. Return. from appeal/bond - Include all inmates reinstated to correctional jurisdiction from long-term jurisdictional absences on appeal or bond. 00 not report returns from short·term movements (that is, less than 30 days) to court (that is, where the State retains jurisdiction).
j. Other admissions - Include all other admissions not covered by the above categories. Please specify the nature of these admissions in the "Notes" section on page 4.
RELEASES Unconditional - An unconditional release occurs only if the released inmate cannot be reimprisoned for any sentence for which he was in prison. II. Expirations of sentlnce - Include all inmates whose
maximum court sentences minus credits have been served.
PageS
b, Commutations - Include all inmates whose maximum sentences have been changed (lowered) to time served to allow immediate unconditional release.
c. Other unconditionll releeses - Include all other unconditional releases not covered by the above categories. Please specify the nature of these releases in the "Notes" section on page 4.
Conditional - A conditional release occurs if the released inmate, upon violating the conditions of his release; can be imprisoned again for any of the sentences for which he was .in prison.
d. Probation. - Include all inmates who have been placed under probation supervision and conditionally released. Include all shock probation releases,
e. Supervised mendatory relee •• - Include all inmates who must, by law, be conditionally released. This type of release may also be called mandatory con· ditional release.
f. Parole. - Include all inmates conditionally released to parole. Enter only releases officially entitled "parole,"
g. Other conditionel releases - Include all other condi· tiona! releases not covered by the above categories. Please specify the nature of these rllieases in the "Notes" section on page 4.
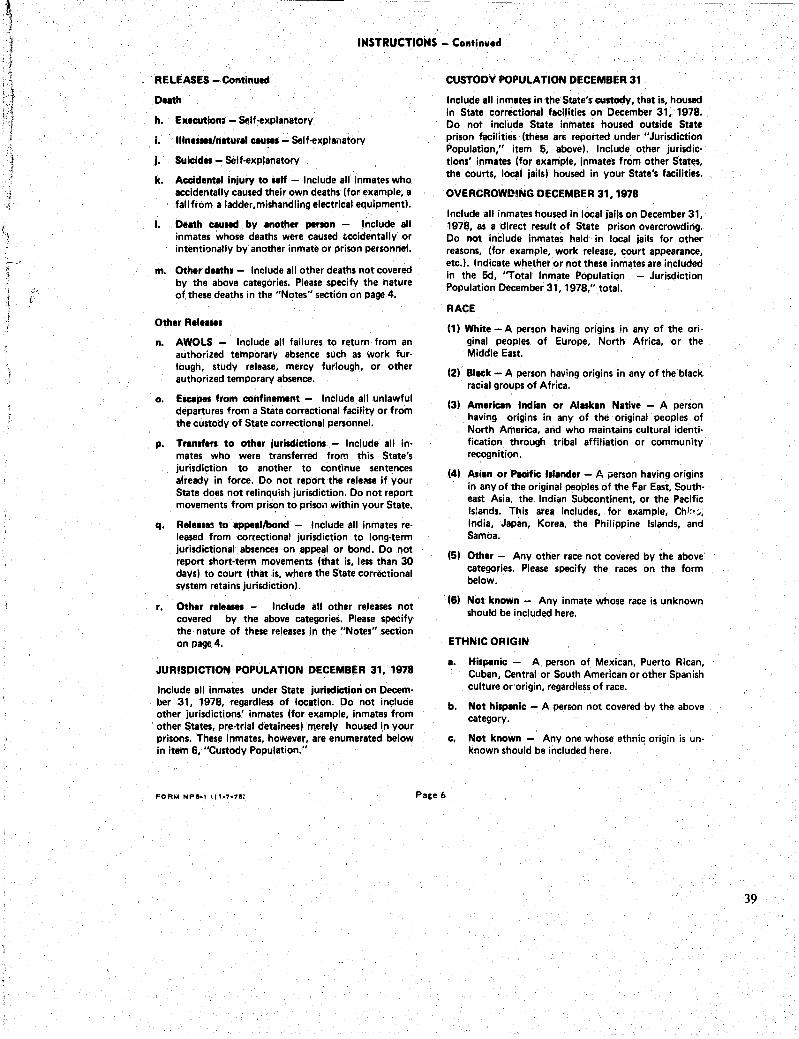
(, , ,
. ,' C
INSTRUCTIONS - Continued
RELEASES - Continued
D.eth
h. Execution; - Self~explanatory
i. IIIn .... /neturel ceu ... - Self·explanatory
j. Suicid .. - Self·explanatory
k. Accid.ntal injury to .. If - Include all inmates who accidentally caused their own deaths (for example, a fall from a ladder,mishandling electrical equipment).
I. D.eth ceulld by enother penon - Include all inmates whose deaths were caused r;ccidentally or intentionally by another inmate or prison personnel.
m. Other d.eths - Include all other deaths not covered by the above categories, Please .specify the nature of these deaths in the "Notes" section on page 4.
Oth.r R.I .....
n. AWOLS - Include all failures to return from an authorized temporary absence such as work fur· lough, study release, mercy furlough, or other authorized temporary absence.
o. EICIPII from confinement - Include all unlawful departures from a State correctional facility or from the custody of State correctional personnel.
p. Trenlf.r. to oth.r jurildiction. - Include all in· mates who were transferred from this State's jurisdiction to another to continue sentences already in force. Do not report the release if your State does not relinquish jurisdiction. Do not report movements from pris~," to prisoi'! within your State.
q. R.I .. ~ to eppe.I/bond - Include all inmates released from correctional jurisdiction to long-term jurisdictional absences on appeal or bond. Do not report short-term movements (that is, less than 30 days) to court (that is, where the State correctional system retains jurisdiction).
r. Other rel._. - Include all other releases not covered by the above categories. Please specify the nature of these releases in the "Notes" section on page 4.
.JURISDICTION POPULATION DECEMBER 31, 1978
Include all inmates under State jurildiction on December 31, 1978, regardless of location. Do not include other jurisdictions' inmates (for example, inmates from other States, pre-trial detainees) merely housed in your prisons. These inmates, however, are enumerated below in item 6, "Custody Population."
FORM NPS .. t It 1-7-78:
CUSTODY POPULATION DECEMBER 31
Include all inmates in the State's cultody, that is, housed in State correctional facilities on December 31, 1978. Do not include State inmates housed outside State prison facilities (these are reported under "Jurisdiction Population," item 5, above'. Include other jurisdictions' inmates (for example, inmates from other States, the courts, local jails) housed in your State's facilities.
OVERCROWDING DECEMBER 31,1978
Include all inmates housed in local jails on December 31, 1978, as a direct result of State prison overcrowding. Do not include inmates held in local jails for other reasons, (for example, work release, court appearance, etc.). Indicate whether or not these inmates are included in the Sd, ''Total Inmate Population - Jurisdiction Population December 31,1978," total .
RACE
(1) White - A person having origins in any of the original peoples of Europe, North Africa, or the Middle East.
(2) Bleck - A person having origins in any of the black racial groups of Africa.
(3) Am.ricen Indian or Alaskan Netive - A person having origins in any of the original peoples of North America, and who maintains cultural identification through tribal affiliation or community recognition.
(4) A.ien or Pacific blend.r - A person having origins in any of the original peoples of the Far East, Southeast Asia, the Indian Subcontinent, or the Pacific Islands. This area includes, for example, Chi:;:., India, Japan, Korea, the Philippine Islands, and Samoa.
(5) Oth.r - Any other race not covered by the above categories. Please specify the races on the form below.
(6) Not known - Any inmate whose race is unknown should be included here.
ETHNIC ORIGIN
a. Hi'lMInic - A person of Mexican, Puerto Rican, Cuban, Central or South American or other Spanish culture or origin, regardless of race.
b. Not hi.penic - A person not covered by the above category.
c. Not known - Anyone whose ethnic origin is unknown should be included here.
39
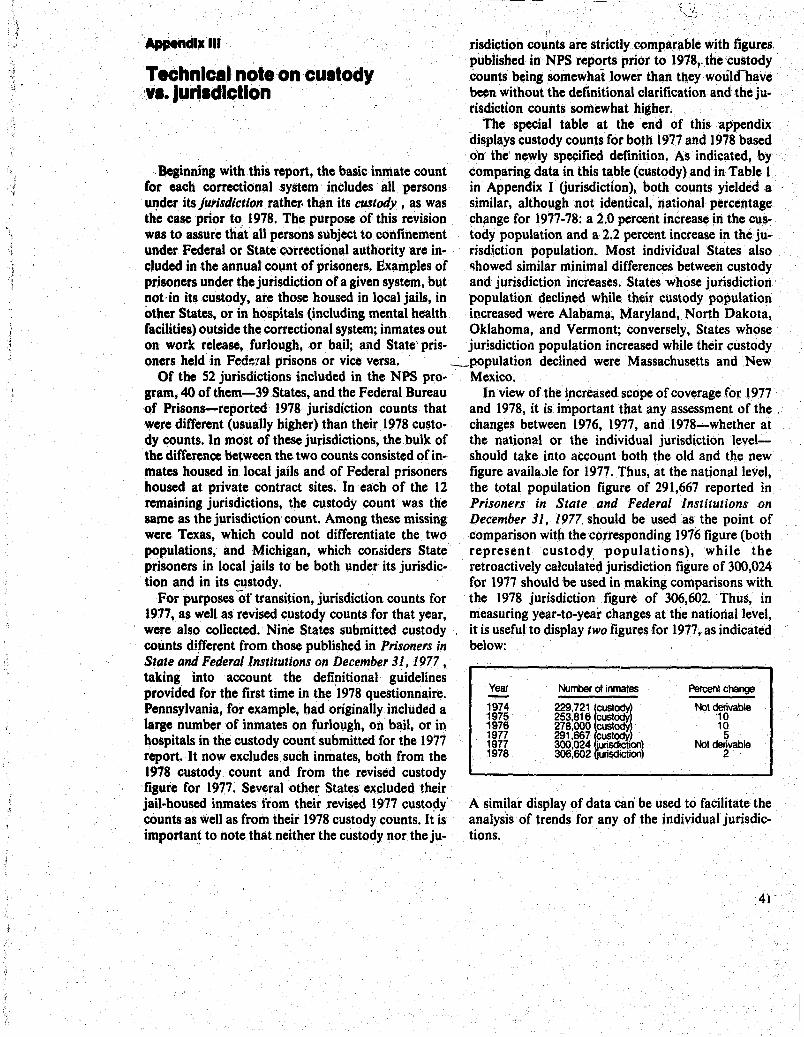
J "
Appendix III
Technical note· on cUltody 'VI. Jurlldlctlon .
" risdiction counts are strictly comparable with figures, published in NPS reports prior to 1978,. the custody counts being somewhat lower than they would have . been without the definitional clarification and the jurisdiction counts somewhat higher.
The special table at the end of this appendix displays custody counts for both 1977 and 1978 based on the newly specified definition. As indicated, by
Beginning with this report, the basic inmate count comparing data in this table (custody) and in Table 1 for each correctional system includes all persons in Appendix I (jurisdiction), both counts yielded a u~der its jurisdiction rather. than its custody, as was similar, although not identical, national· percentage the case prior to 1978. The purpose of this revision change for 1977-78: a 2.0 percent increase iii thecus-was to assure that aU persons subject to confinement tody population and a 2.2 percent increase in the ju..; . under Federal or State correctional authority are in- . risdiction population. Most individual States also cluded in the annual count of prisoners. Examples of !!howed similar minimal differences between custody prisoners under the jurisdiction of a given system, but· and jurisdiction increases. States whose jurisdiction not'in its custody, are those housed in local jails, in population declined while tbeir custody population other States, or in hospitals (including mental health increased were Alabama, Maryland, North Dakota, facilities) outside the correctionalsystcm; inmates out Oklahoma, and Vermont; conversely, States whose on work release, furlough, or bail; and State" pris- jurisdiction popUlation increased whjle their custody oners held in Federal prisons or vice versa. _'_population declined were Massachusetts and New
Of the 52 jurisdictions included in the NPS pro- Mexico. gram, 40 of them-39 States, and the Federal Bureau In view of the i,ncreased scope of coverage for 1977 of Prisons-reported 1978 jurisdiction counts that and 1978, it is important that any assessment of the were different (usually higher) than their 1978 custo- changes between 1976, 1977, and 1978-whether at dy counts. In most of these jurisdictions, the bulk of the national or the individual jurisdiction level-the difference between the two counts consisted of in- should take into account both the old and the new mates housed in local jails and of Federal prisoners figure availaJle for 1977. Thus, at the national level, housed at private contract sites. In each of the 12 the total population figure of 291,667 reported in remaining jurisdictions, the custody count was the Prisoners in State and Federal Institutions on same as the jurisdiction count. Among these missing December 31, 1977, should be used as the point of were Texas, which could not differentiate the two comparison with the corresponding 1976 figure (both populations, and Michigan, which considers State represent custody populations), while the prisoners in local jails to be both under its jurisdic- retroactively calculated jurisdiction figure of 300,024 tion and in its custody. for 1977 should be used in making comparisons with
For purposes 'Of transition, jurisdiction counts for the 1978 jurisdiction figure of 306,602. Thus, in 1977, as well as revised custody counts for that year, measuring year-to-year changes at the national level, were also collected. Nine Staies submitted custody it is useful to display two figures for 1977, as indicated counts different from those published in Prisoners in below: State and Federal Institutions on December 31,1977 , taking into account the definitional guidelines provided for the first time in the 1978 questionnaire. Pennsylvania, for example, had originally included a large number of inmates on furlough, on bail, or in hospitals in the custody count submitted for the 1977 report. It now excludes such inmates, both from the 1978 custody count and from the revised custody figure for 1977. Sev(;ral other States excluded their jail-housed inmates from their revised 1977 custo~y' counts as well as from their 1978 custody counts. It is important to note that neither the custody nor the ju-
Year
1974 1975 1976 1977 1977 1978
Number of inmates
229.721 lcust~! 253,816 custodY 278,000 custodY . 291 ,667 cust~ 300,024 'urisdictlOO 306,602 urisdictioni
Percent change
Not derivable '10 10 5
Not derivable 2
A similar display of data can be used to facilitate the analysis of trends for any of the individual jurisdictions.
41
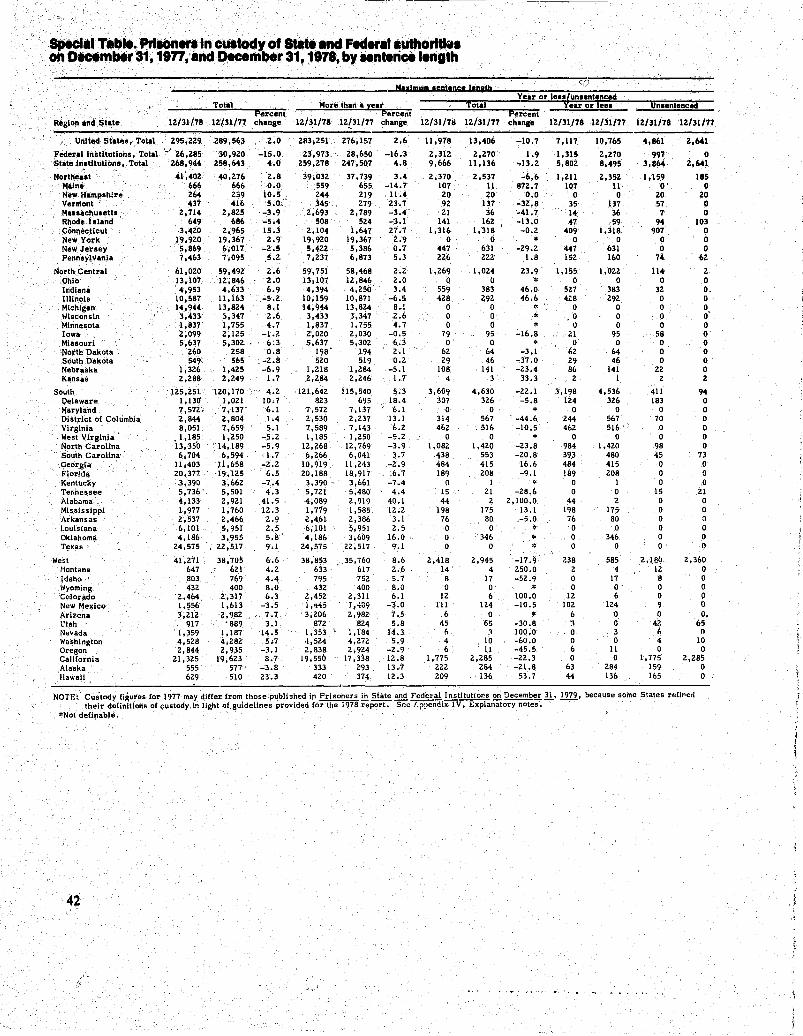
·speda. T8bie. "'lOn ..... n cultody of State .ncI Fecler.'.uthorltkla on December 31, 1877,'and December 31, ~878, by .. nlerice 'ength
H.I.laUIII IS:DlIDSiI 1101&11 .:(j
Year or Ie •• una.nt.need Total More than .. ;tear ota ear or ea. nlentanc
~eglon arid St'!te Percent Percent Percent
12/31/78 12/31/77 change IZ/31/78 12/31/77 change IZ/31/78 12/31/77 change 12/31/78 12/31/77 12/31/78 12/31/77
Urilted States, Total 295,229 289,563 2,.0 283,251 Z76,157 2.6 11,978 13,406 -10.7 7,117 10,765 4,861 2,641
Federal Institutions, Total '-" 26,285 30,920 -15.0 23,973, . 28,650 -16.3 2,312 Z,270 1.9 ',1,315 2,270 997 0 State Inatltution., Total 268,944 258,643 4.0 259,278 247,507 4.8 9,666 11,136 ~13.2 5,802 8,495 3,864 2,641,
Northeia! 41,402 40,276 Z.8 39,032 37,739 3.4 2,370 2,537 -6.6 1,2ll 2,352 1,15,9 185 Maine 666 666 0.0 559 655, -14.7 107 11 87Z.7 10.7 II o· 0 New Hampshire 264 239 10.5 2,,4 219 1l.4 26 20 0.0 0 0 20 20 Vermont 437 416 '5.0" ,345. 279 23.7 9Z 137 -32.8 35 137 57 0 MIII.chuletts 2,714 2,825 -3.9 2,693 2,789 -3.4 21 36 -41.7 14 36 7 0 Rhode Island 649 686 -5.4 508 524 -3.1 141 162 -13.0 47 ,59 94 103
, Connecticut 3,420 2,965 15.3 2,104 1,647 27.7 1,316 1,318 -0.2 409 1,318 907 0 New York 19,920 19,367 2.9 19,920 19,367 2.9 0 6 • 0 0 0 0 New'Jersey 5,869 6i017 -2.5 5,~22 5,386 0.7 447 631 -29.2 447 631 0 0 Pennsylvania 7,463 7,095 5.2 7;237 6,873 5.3 226 222 1.8 152 160 74 62
North Central 61,020 59,492: 2.6 59,751 58,468 2.2 1,269 1,024 23.9 1,155 1,022 ll4 2 Ohio 13,107 12,846 2.0 13.107 12,846 2.0 Q 0 * 0 0 0 0 Indiana 4,953 4,633 6.9 4,394 4,250 3.4 559 383 46.0 527 383 32 O. illinois 10,587 11,163 -5.Z 10,159 10,871 -6.5 428 292 46.6 4Z8 292 0 0 M!=higan 14,944 13,824 8.1 14,944 13,824 8.1 0 0 * 0 0 0 0 Wisconsin 3,433 3,347 2.6 3,433 3,347 '2.6 0 0 * '0 0 0 0 Minnesota 1,837 1,755 4.7 1,837 1,755 4.7 0 0 * Il 0 0 0 Iowa 2,099 2,125 -I.l- 2',020 2,030 -0.5 79 95 -16.8 ,21 95 58 0 Miasouri 5,631 5,302, 6.3 5,637 5,302 6.3 0 0 * 0 0 0 0
"North Dakota 260 258 0.8 198' 194 2.1 62 64 -3.1 62 64 0 0 South Dakota 549' ' 565 :,-2.8 520 519 0.2 29 46 -37.0 29 46 0 0 Nebraska 1,326, 1,425 -6.9 1,218 1,284 -5.1 108 141 -23.4 86 141 22 0 Kansas 2,288 2,249 1.7 2,284 2,246 1,.7 4 3 33.3 2 1 2 2
South '125,251 120,170 4.2 121,642 115,540 5;3 3,609 4,630 -22.1 3,198 4,536 411 94 !;lelaware 1,13!f 1,021 10.7 823 695 18.4 307 326 -5.8 124 326 183 0 Maryland 7,572'; 7,137' '6.1 7,572 7,137 6.1 0 0 .. 0 0 0 0 District of Columbia 2,844 2,804 1.4 2,530 2,237 13.1 314 567 -44.6 244 567 70 0 Virginia 8,051 7,659 5.1 7,589 7.143 6.2 462 ' .516 -10.5 462 516 ' 0 0 West Virginia .. 1,185 1,250 -5.2 1,185 1,250 -5.2 0 0 .. 0 0 0 0 Nor.th Carolina 13,35'0 14,189 -5.9 12,268 12,769 -3.9 1,082 1,420 -23.8 984 1,420 98 0 South Carolina- 6,704 6,594, 1.7 6,266 6,041 3.7 438 553 -20.8 39,3 480 45 73 Georgia 11,403 U,658 -2.2 10,919 ll,243 -2.9 484 415 16.6 484 415 0 0 FlorIda 20,377 19,125 6.5 20,188 18,917 6.7 18? 208 -9.1 189 20R 0 0 Kentucky 3,390 3,662 -7.4 3,390 ' 3,661 -7.4 0 I * 0 I 0 0 TeY,nessee 5,736 5,501 4.3 5,721 5,480 4.4 15 21 -28.6 0 0 15 21 Alabama 4,133 2,921 41.5 4,089 2,919 40.1 44 2 2,IUO.0 44 2 0 0 MISSissippi 1,977 1,760 12.3 1,779 1,585 12.2 198 175 13.1 198 175 0 0 Arkansas 2;537 2,466 2.9 2,4.6l 2,366 3.1 76 80 .-5.0 76 80 0 0 Louisiana 6,101 5,951 2.5 6,101 5,951 2.5 0 0 .. ' 0 0 0 0 Oklahoma 4,186 3,955' 5.8 4,186 3,609 16.0 0 346 .. 0 346, 0 0 T~xas 24,575 22,5.l7 9.1 24,575 22,517 9.1 0 0 .. 0 0 0 0
Wept 41,271 38,705 6.6 38,853 35,760 8.6 2,418 2,945 -17.9 238 585 2,J89 2,360 Hantana 647 621 4.2 633 ' 617 2.6 14 . 4 250.0 2 4 12 0 Idaho ,I 803 769 4.4 795 752 5.7 8 17 -52.9 0 17 8 0 \~yoming 432 400 8.0 432 400 8.0 0 0 * 0 0 0 0 Colorado 2,464, ,2,317 6.3 2,452 2,311 6.1 12 6 100.0 12 6 0 P New Mexico I ,~56 1,613 -3.5 1,445 1,1-t;}9 -'3.0 III 124 -10.5 ' 102 124 9 Il Arizcna 3,212 :2,982 7.7 3,206 2,982 7.5 ,6 0 * 6 0 0 O. l'tah 917 '889 3.1 872 824 5.8 45 65 -30.8 ~ 0 42 65 Nevada 1,359 1,187 14.5 1,353 1,184 14.3 6, ~ 100;0 O. 3 6 n
~ Washington 4,528 4,282 5,7 ·i,524 4,272 5.9 4 10 -60.0 0 0 4 10 I'
Oregon 2,844 2,935 -3.1 2,838 2,924 -2.9 . 6 11 -45.5 6 II 0 0 1 California 21,325 19,623 8.7 19,550 17,338 12.8 1,775 2,285 -22.3 0 0 1,775 2,285 Alaska 555 577 -3.8 333 293 13.7 222 284 -21.8 63 284 159 0 Hawaii 629 510 23.3 420 374 12.3 7.09 136 53.7 44 136 165 0
NOTE: Cus-tody figures fcir 1977 may differ (rom those published in~!!l State and ~!.!l!.~2!l~!!:!!.' 1979, because some States refined their deHnitions of custody in light of guidelines provided for the 1978 report. Sec I.ppendix IV, Explana.tory notes.
*Not definable.
42
Appendix .IV
Explanatory notes
The notes that follow identify deviations from the category definitions used in the 1978 questionnaire, provide details on the content of ~'other" admission and release categories, and specify any revisions to 1977 yearend or movement data that should betaken into account when comparing 1977 and 1978 figures. Standard NPS definitions of the various categories of admissions and releases are included in the questionnaire, a facsimile of which is provided in Appendix II. Generally, State inmates housed in local jails because of overcrowding are considered to be under State jurisdiction, and only exceptions to this rule are noted. States retaining jurisdiction over inmates housed in local jails are shown in Appendix Table 5. Some States included ari adjustment residual in their admission or release figure in order to balance the yearend 1977 count with the yearend 1978 count.
Alabama New court commitments: Includes some split sen
tence violators and some parole violators with new sentences.
Other admissions: Adjustment residual. Other conditional releases: Unconditional releases
from county jails.
Alaska All data include both jail and prison inmates, as
prisons and jails form an integrated system. Admission and release figures are estimates based on 1977 data.
Parole violators, no' new sentence: Includes parole violators with new sentences and other conditional release violators with and without new sentences ..
Escapee returns: May include A W.OL returns. Supervised mandatory releases: Includes some
(fewer than 5 percent) expirations of sentence and releases to probation of inmates serving a split sentence.
Escapes: May include A WOLs.
Arizona No distinction is made between jurisdiction and
custody counts, but the difference is not consider~d to be significant. Jurisdiction figures are estimates based on custody counts.
Other: conditional releases: Includes special
administrative releeases, discretionary releases, and extended work furloughs.
Atkansas New court commitments: Includes some {fewer than
2 percent) parole violators with new sentences. Escapee returns: May include A WQL .returns. Other admissions: Adjustment resid~i;i~l. Other conditional releases: Relf~ases under
provisions of the Youthful Offender Act. Escapes: May include A WOLs. Other releases: Adjustment residual. Inmates with over 1 year maximum sentence: In
cludes some (fewer than 1 percent) inmates with sentences of exactly 1 year.
California Escapee ;eturns: May include AWOL returns. Other unconditional releases: Court-ordered re
leases. Escapes: May include A WOLs. Other releases: Includes the net difference between
~\.dmissions from. and releases to authorized tempora.\'y absence, types of movement that are outside the NPS scope.
Colorado Other unconditional releases: Court-ordered re
leases. Race: Estimates based on a February 1979 com- .
puter survey. Hispanic origin: Estimates based on a February
1979 computer sutvey.
Connecticut All data include both jail and prison inmates, as
prisons and jails form an integrated system. New court commitments: Includes some parole vi
olators and escapees returned with new sentences; I
Expiration of sentence: In<::ludes some releases to probation.
Delaware All data include both jail and· prison inmates, as
prisons and jails form an integrated system. Data exclude approximately six youthful offenders~· Persons receiving a "split" sentence of more than 1 year, part' to be served in prison and the remainder on probation, are excluded fr9m the data unless the prison portion of the sentence exceeded 1 year, a practice resulting in an understating of movement transactions and the yearend population.
New court commitments: Includes probation violators.
4l
Other admissions: Includes 35 returns from ext~nded furlough. The remainder constitute ap adjustment residual.
.other unconditional releases: Type not specified. Supervised mandatory releases: Includes releases to
probation. . ' .other releases: Incl,l,ldes 85 extended furloughs and
7 releases to the Drug Rehabilitatio~ Center.
DI.trtctot Columbia The District of Columbia has an integrated jail and
prison system'. Data include unsentenced inmates and those with sentences of 1 year or less, with the exception of those housed in the D.C. Jail or Detention Center. Persons receiving a split sentence of more than 1 year, part to be served in prison and the remainder on probation, were excluded unless the prison portion of the sentence exceeded 1 year, an omission resulting in an understating of movement transactions and the yearend population.
.other releases: Type .nq.t specified.
Florida All yearend data' are estimates based on June 30,
1977, figures; all admission and release data are based on figures for fiscal year 1977. Some unsentenced persons (fewer than 1 percent) are included in data for over 1 year maximum sentence.
Escapee returns: May include A WOLreturns. Escapes: May include A WOLs. .other releases: Court-ordered releases, paroles to
reinstatement, and pardons. '
Georgia Persons receiving ;a partially suspended sentence of
more than 1 year, P~lrt to be served in prison and the remainder on probation, are excluded from -the data unless the prison portion of the sentence exceeded 1 year, an omission resulting in an understating of movement transactions and the yearend population.
New court commitments: Incl!ldes some conditional release violators. with new sentences.
.other admissions: Type not specified. .other conditional release violators with new sen
tences: Includes parole violators with, and without new sentences ..
Hispanic origin: Figures represent only a portion of inmates in this category; for the vast bulk of'the prison population, data differentiating the Hispanic from the non-Hispanic weie not available.
.other 'unconditional releases: Inmates who paid fines.
Superiised'mandatory releases: See "other conditional releases."
44
.other conditional releases: Youthful offender conditional releases. In 19.77, 414 ml!les ·and 11 females who should have been reported as "other conditional releases" were shown as "supervised niandatorY releases."
Transfers to other jurisdictionsiIn 1977,91 males and' 3 females recorde~das' transfers were actually released on, parole .
.other releases: Court-ordered releases.
HawaII· Data include both jail and prison inmates, as pris
ons and jails form an integrated system. Probation: Inmates whose sentences were
reevaluated withi~ 60 days of commitment· and modified to probation.
Inmates with 1 year or less maximum sentence: Includes persons convicted of felony offenses and sentenced to 5 years probation, up to 6 months of which may be spent in jail.
Race: Racial data ar~nO.t av~ilable for unsentenced inmates and those with sentcnc~~ of 1 year or Jess; these are included in the "not known" category. '''Other'' includes American Indians and Alaskan Natives.
Idaho· Other admissions: Returns from agreement' OD
detainers. .other unconditional releases: Releases because· of
acquittal or dismissal of sentence. .other releases: Releases to agreement on detainers. Unsentenced inmates (custody count): Presentence
evaluation cases or Department of Health, Education, and Welfare clients held only for testin,.
IIIlnol. .other admissions: Includes returns from cou,rt. .other unconditional releases: Includes court
ordered releases, status discharges, and technical discharges.
Paroles: In 1977, a number of paroles from work release were excluded from this cate,ory; in 1978, such paroles are correctly included.
Transfers to other jurisdictions: Includes some paroles and conditional releases to other jurisdictions.
.other releases: Adjustment residual.
Indiana Data on admissions, releases, race, and Hispanic
origin are estimates. .other conditional release violators with new sen
tences: Includes parole, probation as part of a split
sentence, and probation vio.lators with or without new. sentences.
Escapee returns: May include AWOL returns. Escapes: May include A WOLs.
Iowa Other conditional releases: Court-ordered releases.
In 1977, 17 males and I female in this category were incorrectly reported as commutations.
Kan.a. Escapee returns: May include AWOL returns., Other admissions: Adjustment residual. Other conditional releases: In 1977, a large number
of persons serving split sentences (part to be served in prison and part on probation) were incorrectly reported in this category.
Escapes: May include A WOLs. Other releases: Includes 34 releases to court and 5
unspecified releases.
Kentucky Escapee returns: May include AWOL returns. Other admissions: Adjustment residual. . Escapes: May include A WOLs.
Loul.lana Other unconditional releases: Includes pardons (2
males), court-ordered releases (19 males and I female), and conviction reversals (2 males).
Other releases: Type not specified.
Maine Movement data for 1977 incorrectly included in
mates (approximately 10 percent of total) sentenced to a maximum of I year or less.
Other admissions: Adjustment residual. Other releases: Adjustment residual.
Maryland All data include inmates (approximately 6 percent
of total) sentenced to a max.imum of I year or less. New court commitments: Includes parole and other
conditional-release violators with new sentences and returns from appeal or bond.
Escapee returns: May include A WOL returns~ Supervised mandatory release: Figures are
estimates, inasmuch as expiration and supervised mandatory release are considered one category.
Expiration of sentence: Figures are' estimates, inasmuch as expiration and supervised mandatory release are considered one category.
Escapes: May include A WOLs. Race; Figures are estimates.
M"'achu.ettl None.
Michigan Both custody and jurisdiction figures include 18
males and 52 females held in county jails to ease overcrowding, because such. persons are considered to be under State custody as well as jurisdi~ion.
Other conditional releases: Pre-parole furloughs. Otlier releases: Adjustment residual. Hispanic origin.: Only persons of Mexican descent
are included; all other Hispanic inmates are included in "not known", along with persons whose origin is not kno~n.
Minnesota Other admissions: Includes returns from medical
. paroles (14 males and I female) and an adjustment residual.
. Mlllllllppi The breakdown of prisoners between those with a
sentence of more than I year and those with 1 year or less is estimated, based on 1977 figures.
Other conditional releases: Work releascs, supervised earned releases, releases to court, and emergency releases.
Other releases: Adjustment residual. Hispanic origin: Figures are broad estimates.
Missouri Parole violators with new sentences: Figures are
estimates. Transfers from and to other jurisdictions: Inc
orrectly includes approximately 15 intrajurisdictional transfers..
Escapee returns: May include AWOL returns. Escapes: May include A WOLs. Other releases: Court-ordered releases.
Montana Other conditional' releases: Releases' to extended .
furlough.
Nebraska As of December 31, 1977, female inmates were no
longer held for other States.
Nevada Other releases: Court-ordered releases.
'New Hampshire . Other releases: Adjustment residual.
New Jer.ey . Jurisdiction figures incorrectly exclude 70 male. in-
45
mates heltiin co!lnty jails t,?ease overcrowding. Escapee .returns: May include AWOL return,S" Escapes: May include A WOLs.
" New M.xlco ..... , In 19Ti:p~ .. sons r~lving, a split senten¢e of more
than lyear,pli.rt to be .served in prison anti the remainder on ,probation, were excluded unless, the
.~. prison portion' of the sentence exceeded 1 year, an .: omissio.n resulting, in an understating of 19'77 move
ment transaction~ and the 1977 yearend population. Such persons are correctly included in 1978 figures.
Other "dmissions: Adjustment residual:
'HewYork Parole 'and other conditional-release violators with
and without new sentences: Figures are estimates. Race: "Other" comprises American Indians and
Orientals. -Hispanic origin: Only Pu~rto Rican inmates are in
chided; all other Hispanic inmates are iqcluded in the category of non"Hispanic.
North Carolina Persons receiving a partially suspended sentence of
more than 1 year, part to be served in prison and the remainder on probation, were excluded from the data unless the prison portion of the sentence exceeded 1 yeat, an omission resulting in an understating of
.', movement transactions and the yearend population. Releases of inmates with partially suspended sentences are counted under "expiration of sentence" rather than "probation."
Parole violators with new sentences: Includes paroie violators without new sentences.
Escapee returns: lncl.udes AWOL returns (estimated 52 percent). _
Expiration of sentence: Includes some commutations (fewer than 10 percent).
Other unconditional releases: Unconditional courtordered. releases.
Escapes: Includes A WOLs (estimated 52 percent). . :-, ,
NClrth Dakota Other releases: Releases to court. Inmates with 1 year or less maximum sentence: Data
for 1978 includes State farm inmates with sentences of 1 year or less, previously excluded.
Ohio New court commitments:' Includes some "other
conditional-release violators with new sentenCes." Transfers fromother)urlsdictions: Transfers from
mental hospitals. Escapee returns: May include AWOL 'returns.
46
Other unconditional releases: Sentences vacated by court.
Other conditional releases: Extended medical furloughs and pre-parole furloughs.
Deaths: Deaths classified as, dUe to "illness or natural causes'" include a sniall number of deaths attributable to'unknown caus~s.
Escapes: May include A WOLs.
Oklahoma Persons receiving a split sentence of more than 1
year, part to be served in prison and the remainder on probation, are incorrectly omitted from the data, resulting in an understating of movement transactions and the yearend population.
Other ildmissions: Adjustment residual. Qther releases: Adjustment residual.
Oregon , A WOL returns: May include some escapee returns (no more than 5 percent).
Returns from appeal or bond: Term not used in Oregon; the approximately two or three persons with this type of admission are included in another but unspecified category.
Other admissions: Adjustment residual. A WOLs: May include some escapes (no more than
5 percent). Other releases: Adjustment residual.
Pennsylvania Other unconditional releases: Court-ordered re
leases. Other releflses: Adjustment residual.
Rhode Island All data include both jail and prison inmates, as
prisons and jails form an integrated system. PersoJ:ls receiving a partially suspended sentence of more than 1 year, part to be served in prison and the remainder on probation, were excluded from the data, unless the prison portion of the sentence exceeded 1 year, an o~ission resulting' in an -understating of movement .. .transactions and the yearerid population.
SOuth Carolina' 'New court commitments: Includes' a large number
of parole violators returned with new sentences. Other admissions: Adjustment residual. Other unconditional rekases: Court-ordered re
leases.:' Other releases: Adjustment residual.
South Dakota Other unconditional releases: Unconditional court
ordered releases.
\
( .
Other conditional fe/eases: Conditional courtordered releases.
T.nn ..... · . \. .
Parole violators without new sentences: Includes parole. violators with new sentences.
Escapee returns: May include AWOL returns. Other unconditional releases: Court-ordered re
leases. Other conditional releases: Extended furloughs. Escapes: May include A WOLs.
Texa.; All data are custody figures, as jurisdiction counts
. were not provided. Parole and other conditional-release violators with
new sentences: Includes parole and other conditional-release violators without new sentences.
Other unconditional releases: Type not specified. Other conditional releases: Type not specified. Other releases: Includes 461 males and 28 females
as an adjustment residual and 16 Mexican nationals returned to Mexico under treaty.
Hispanic origin: Figures are estimates.
'Utah Other admissions: Type not specified. Other unconditional releases: Terminations of sen
tence by Board of Pardons. Other releases: Court-ordered releases.
Vermont Data include both jail inmates (except those held in
local lockups) and prison inmates, as prisons andjaHs form an integrated system. In 1977, persons receiving partially suspended sentences of more than 1 year, part to be served in prison and the remainder on probation, were excluded from the data unless the prison portion of the sentence exceeded 1 year, an omission resulting in an understating. of 1977 movement transactions and the 1977 yearend population; such persons are correctly included in 1978 figures.
Other unconditional releases: Unconditional courtordered releases.
Other conditional releases: Mandatory conditional releases.
Virginia Both custody and jurisdiction figures exclude 1,116
male and 58 female inmates held in county jails to ease overcrowding because correctional authorities. do not consider these prisoners to be under State jurisdiction. Each inmate had at least 6 months r~maining on their sentence.
. Parole violator, without new sentenc,,: 'May. in-clude. some parole violators with new sentences.
Escape returns: May include AWOL returns. Other admissiom: Type not specified. Other unconditional releases: Absolute pardon •• Other conditional releaSes: Conditional pardons. Escapes: May include A WOLI. Other releases: Work releases.
Wa.hlngton O~her conditional releases: Conditional pardons
and paroles to reinstatement. Race: "Other" includes unspecified numbers of
Vietnamese and Thai nationals •
W •• t VIrginia' Youthful offenders are excluded from both 1977
and 1978 figures. Other admissions: Court-ordered releases voided
by Supreme Court. Other unconditional releases: Court-Qrdered re
leases. Other conditional reletlSes: Conditional court
ordered releases (23) and medical respites (2).
WllCon.ln· As of July 1, 1978, Wisconsin began to include
youthful offenders in its counts. New court commitments: Includes fewer than six
transfers. Parole violators with new sentences: In 1977, these
inmates were incorrectly reported as new court commitments; in 1978, ,they are reported correctly.
Hispanic origin: Figure for "non-Hispanic" includes 1,342 blacks for whom Hispanic origin data were not available.
.Wyomlng. Oiker admissions: Court-ordered transferS.
Fecieral Bureau of PrilOn. Other unconditioMI releases: Includes 128 uncon
ditional court-ordered releases and 1 pardon. Other deaths: Includes three accidents. Other releases: Consists for the most part of
persons granted a release after having been transferred on a temporary basis from a correctional institution to another authority.
.47
Dear Reader:
u.s. DEPARTMENT OF JUSTICE BUREAU OF JUSTICE STATISTICS
USER EVALUATION Prisoners in State and Federal
Institutions on December 31, 1978 NCJ-64871, SD·NPS·PSF·8
The Bureau of Justice Statistics is interested in your comments and suggestions about this report. We have provided this form for whatever opinions you wish to express abo~lt it. Please cut out both of the:;;" pages, staple them together on one corner, and fold so that the address appears on the outside. After folding, use tape to seal closed. No postage stamp is necessary.
Thank you for your help.
1. For what purpose did you use this report?
2. For that purpose, the report- 0 Met m~5t of my needs 0 Met some of my needs 0 Met none of my needs
3. How will this report be useful to you?
tJ Data source o Other (please specifyJ ____________ _
o Teaching material
o Reference for article or report o Will !!!!! be useful to me (please explain; ______ _
o General information
o Criminll justice program planning
4. Which parts of the report, if any, were difficult to understand or use? How could they be improved?
5. Can you point out specific parts of the text or table notes that are not clear or terms that need to be defined?
Plge'
" ':.\
e. Ar,. thlf. Wayl thil repOrt ,could be improvtcl thlt y.' hIVe not m.ntioned?:::';'
C~ . '
'k
()
\\
7. Pleaio',suggest other topics you would like to see addressed in future analytic reports using data from this series .
. .
~ \
,
8. In whit ca.,.ity did you use this report?
Ort....,., , o Edu_tor
o StucIInt
o CrlmiM' jUitice atJII'ICY'lIItplov"
o 04' ......... 0 ..... titan ,criminl' judice, :;p.cify
O~ .... Spcify
9. If you uHd thil report .1 • gov.rnmental. employ .. , pl .... indiCite the level of government.
D Federll DCity
D Statl D Other· SpllCify_ -o County
10. If yCM.I uHd thil report .1 • crimin.1 justice agency employ .. , pi .... indicate the sector in which 'i~u work.
D Law enforcement Cpolicl) D .Corractions
D Lapl Ml'vica Ind proMCution D Plroll
D Public or privati defln .... rvicas D Criminll justici pllnni~ Iglncy
D Courts or court Idministrltion D Oth,r criminll justic, 1gency • SplICify type
D Probation
~
11. If you used thil report.s I criminal justice employet, please indicate the type of position you hold. Mark all that apply.
D Agency or institution administrltor o Progrlm or project nllnllger •
D Gen.,.1 progrlm pllnn,r/,vllultor/lnllyst D Stltisticiln
D Bud .... pllnn,r/,vllultor{lnIIlyst D Other· SplICify
D Operltions or mlnlllllment planner/evllultor/.nelyst
12. Additional commentl
, ••• 3
OPTIONAL ---Narne
Hum"r and str .. t
City Stat.
(Fold here)
T.lephon.
( )
.. ZIP Cod.
~CJ·8487' SD·Nps·PSF·8
••••••••••••••••••••••••••••..........................••..........•..•••..•..••.•......•..............•............................... ; , U.s. DEPARTMENT OF JUSTICE Bur.au of JUstice Statistics Washington, D.C. 20531
POSTAGE AND FEES PAID U.S_ DEPARTMENT OF JUSTICE
. JUS·438
BUREAUOFJu.nCESTAnsnca U.S. DEPARTMENT OF JUSTICE WASHINGTON, D.C. 20131
U.S.MAIL
••••••••••••••••••••••••••••••••••••••••••••••••••••••••••••••••••••••••••••••••••••• & •••••••••••••••••••••• •••••••••••••••••••••••• ~
(Fold her.)
C •• i ,
.'
NCJRS REGISTRATION
The National Criminal Justice Reference Service (NCJRS) abstracts documentl publiahed in the criminaljUitice ficld; Persons who are reaiatered with the Reference Service receive aMouncementi of documentl in their stated fields of interest and order forms for free ""Pies of Bureau of Justice Statistics publi!!ations.,lfyou are not repstered ~ith the R,r,ference Service, and wish to be, please provide your name and mailing address below .IIld check the appropriate box.
N.me
Numbe, ."d I'r .. t
Cit,
U.S. DEPARTMENT OF JUSTICE lu,e'AI of Jude. Stetlltica Waftlngton, D.C. 20131
- Telephone ( )
State ZIP Code
--- (Foldher.)---
0 PIe ... aend me. NCJRS reell.,.11on form.
0 PIe ... aentJ 1M .he reportllllt'" below.
~ ~.S.M"'L
POSTAGE AND FEES PAID U.S. DEPARTMENT OF JUSnCE
User Services Department 2 National Criminal Justice Reference Service Bureau of Justice Statistics U.S. Department of Justice Box 8000 Rockville. Maryland 20860
- - -(Fold hlre)---
JUS ....
If you wish to receive copies of any of the Bureau of Justice Statistics Reports listed on the revene . side, please list them below.
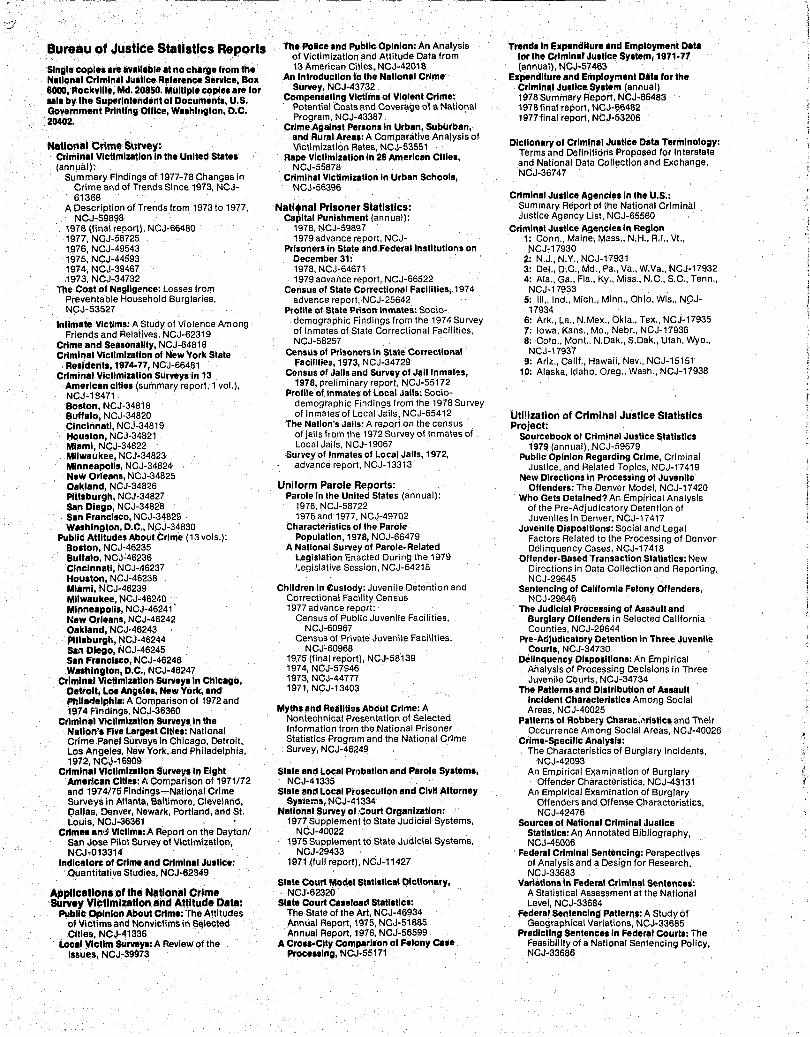
j'---
Bureau of Justice Statistics Reports
Single copies Ire iivlillble It no chlrge from the Nillonil Criminal JUIllce Reference Service, Box 6000, Rockville, Md. 20850. Muillple copl .. Ire for lila by the Superintendent of Documents, U.S. Government PrlnllngOfflce, Wllhlngton, D.C. 20402.
National Crime Survey: Criminal Victlinizillion In the Unlled States (annual):
Summary Findings of 1977-78 Changes in Cri.me and of Trends Since 1973, NCJ-61368
A Description of Trends from 1973 to 1977, NCJ-59898
1976 (final reporl), NCJ-66460 1977. NCJ-58725 1976, NCJ-49543 1975. NCJ-44593 1974, NCJ-39467 .1973, NCJ-34732
The Cost of Negligence: Losses from Preventable Household Burglaries, NCJ-53527
Inllmate Victims: A Study of Violence Among Friends and Relatives, NCJ-62319
Crime and Seasonality, NCJ-64818 Criminal Victimization of New York State
Residents, 1974-77, NCJ-66481 Criminal Vlctlmlzallon Surveys In 13
American cities (summary report, 1 vol,), NCJ-18471 Boston, NCJ-34818 Buffalo, NCJ-34820 Cincinnati, NCJ-34819 Houston, NCJ-34821 Miami, NCJ-34822 Milwaukee, NCJ-34823 Minneapolis, NCJ-34824 New Orleans, NCJ-34825 Oakland, NCJ-34826 Pittsburgh, NCJ-34827 SIn Diego, NCJ-34828 San Francisco, NCJ-34829 Wlshlngton, D.C., NCJ-34830
Public Attlludes About Crime (13 vols.): Boston, NCJ-46235 Bullalo, NCJ-46236 CinCinnati, NCJ-46237 Houston, NCJ-46238 Miami, NCJ-46239 Milwaukee, NCJ-46240 Minneapolis, NCJ-46241, New Orleans, NCJ-46242 Oakland, NCJ-46243 Pllliburgh, NCJ-46244 SIn Diego, NCJ-46245 San FranCiSCO, NC,J-46246 Washington, D.C., NCJ-46247
Crimina' Victimization SUrveYlln Chicago, Detroll, Lol Ange.I .. , New York,and Phllidelphla: A Comparison of 1972 and 1974 Findings, NCJ-36360
Crimina' Victimization SUrveYI in the Natlon'a Five Largelt Cillel: National Crime Panel Surveys in Chicago, Detroit, Los Angeles, New York, and Philadelphia, 1972, NCJ-16909
Crlminll Victimization SurveYlin Eight American CIII .. : A Comparison of 1971172 and 1974175 Findings-National Crime Surveys in Allanta, Baltimore, Cleveland, Dallas, Denver, Newark, Portland, and SI. L.ouis, NCJ-36361
Crlmel ani:l Vicllml: A Report on the Day tonI San Jose Pilot Survey of Victimization, NCJ-013314
IndlclltoK of Crime and Criminal JUlllce: Quantitative Studies, /IICJ-62349
Applications of the National Crime Survey Victimization and Attitude Date:
Public OpinIon About Crime: The Attitudes of Victims and Nonvictims in SEjlected Cities, NCJ-41336 .
Locll Vlcllm SurveYI: A Review of the Issues, NCJ-39973
The Police and Public Opinion: An Analysis of. Victimization and Attitude Data from 13 American Cities, NCJ-42018
An Introduction to the National Crime Survey, NCJ-43732
Compensating Victims of Violent Crime: Potential Costs lind Coverage of a National Program, NCJ-43387
Crime Agalnst·Perlonsln Urban, Suburban, and Rural Areal: A Comparative. Analysis of Victimization Rates, NCJ-53551
Rape Victimization In 26 American Cit lei, NCJ-55878
Criminal Victimization In Urban Schools, NCJ-56396
Natl.nal Prisoner Statistics: Capital Punishment (annual):
1978, NCJ-59897 1979 advance report, NCJ-
Prisoners In State and Federallnstllutlons on December 31: 1978, NCJ-64671 1979advance report, NCJ-66522
Census of State Correctional Facilities, 1974 advance report, NCJ-25642
Profile of State Prison Inmates: Sociodemographic Findings from the 1974 Survey of Inmates of State Correctional Facilities, NCJ-58257
Census of Prisoners in Stale Correctional FaCilities, 1973, NCJ-34729
Census of Jails and Survey of Jallinmatlls, 1978, preliminary report, NCJ-55172
Profile of Inmates 01 Local Jails: Sociodemographic Findings from the 1978 Survey of Inmates of Local Jails, NCJ-65412
The Nation's Jails: A report on the census of jails from the 1972 Survey of Inmales of Local Jails, NCJ-19067
Survey of Inmates 01 Local Jails, 1972, advance report, NCJ-13313
Uniform Parole Reports: Parole In the United States (annual):
1978, NCJ-587.22 1976and 1977, NCJ-49702
Charactf1rlstics of the Parole Population, 1978, NCJ-66479
A National Survey of Parole-Related l.eglslatlon Enacted During the 1979 !_egislative Session, NCJ-64218
Children In €ustody: Juvenile Detention and Correctional Facilily Census 1977 advance report:
Census of Public Juvenile Facilities, NCJ-60967
Census of Private Juvenile Facilities, NCJ-60968
19.75 (final report), NCJ-58139 1974, NCJ-57946 1973, NCJ-44777 1971, NCJ-13403
Myths and Relliities About Crime: A Nontechnical P;esentation of Selected Information from the National Prisoner Statistics Program and the National Crime Survey, NCJ-46249
State and Local Pmbatlon and Parole Systems, NCJ-41335
State I!nll Local Prtlsecutlon and Civil Attorney Systems, NCJ-41334
National Survey of 1::0Urt Organlzallon: 1977 Supplement to State Judicial Systems,
NCJ-40022 1975 Supplement to State Judicial Systems,
NCJ-29433 1971 {full report),I'JCJ-11427
State Court Model Statistical Dictionary, NCJ-62320·
State Court CalelOlcl Stalllllcl: The State of the Art, NCJ-46934 Annual Report, 1975, NCJ-S1885 Annual Report, 1976, NCJ-565S9
A Cro.I-Clty Comparllon of Felony Clle Procelilng, NCJ-55171
Trendl In Expenditure Ind Employment Dltl for the Criminal JUIllce SYltem, 1971-77 (annual), NCJ-57463
Expenditure and Employment D.ta for the Criminal JUltice SYltem (annual) 1978 Summary Report, NCJ-66483 1976final report, NCJ-66482 1977 final report, NCJ-53206
Dictionary of Criminal JUltice Data Terminology: Terms and Definitions Proposed for Interstate and National Data Collection and Exchange, NCJ-36747
Criminal Jusllce Agenclelln the U.S.: Summary Report oflhe National Criminal Justice Agency List, NCJ-65560
Crimi nat Justice Agencies in Region 1: Conn., Maine, Mass., N.H" R.I" VI., NCJ-17930
2: N.J., N,Y., NCJ-17931 3: Del., D.C., Md., Pa., Va., W.Va., NCJ-17932 4: Ala., Ga., Fla., Ky., Miss., N.C., S,C., Tenn., NCJ-17933
5: III., Ind .. Mich., Minn., Ohio, Wis., N9J-17934
6: Ark., La., N.Mex., Okla., Tex" NCJ-17935 7: Iowa, Kans., Mo., Nebr., NCJ-17936 8: Colo., Mont .. N.Dak., S.Dak., Utah, Wyo., NCJ-17937
9: Ariz., Calif., Hawaii, Nev., NCJ-15151 10: Alaska, Idaho, Oreg., Wash., NCJ-17938
Utilization of Criminal Justice Statistics Project:
SOurcebook 01 Criminal Justice Statistics 1979 (annual), NCJ-59679
Public Opinion Regarding Crime, Criminal Justice, and Related Topics, NCJ-17419
New Directions in Processing 01 Juvenile Offenders: The Denver Model, NCJ-17420
Who Gets Detained? An Empirical Analysis of the Pre-Adjudicatory Detention of Juveniles in Denver, NCJ-17417
Juvenile Dispositions: Social and Legal Factors Related to the Processing of Denver Delinquency Cases, NCJ-17418
Offender-Based Transaclion Statistics: New Directions in Data Collection and Reporting, NCJ-29645
SentenCing of California Felony Offenders, NCJ-29646
The Judicial Processing of Assaull and Burglary Offenders in Selected California Counties, NCJ-29644
Pre-Adjudicatory Detention in Three Juvenile Courts, NCJ-34730
Delinquency Dispositions: An Empirical Analysis of Processing Decisions in Three Juvenile Courts, NCJ-34734
The Palterns and Distribution of Assault Incident Characteristics Among Social Areas, NCJ-40025
Pallems of Robbery Charllc."flstlcs and Their Occurrence Among Social Areas, NCJ-40026
Crime-Specific AnalySis: The Characteristics of Burglary Incidents,
NCJ-42093 An Empirical Examination of Burglary
Offender Characteristics, NCJ-43131 An Empirical Examination of Burglary
Offenders and Offense Characteristics, NCJ-42476
Sources of National Criminal Justice Statistics: An Annotated Bibliography, NCJ-4S006
Federal Criminal Sentencing: Perspectives of Analysis and a Design for ResearCh, NCJ-33683
Variations In Federal Criminal Sentenc .. : A Statistical Assessment at the National Level, NCJ-33684
Federal SentenCing Palterns: A Study of Geographical Variations, NCJ-33665
Predicting Sentencelln Federa' Courtl: The Feasibility of a National SentenCing Policy, NCJ-33686
U.S. Department of Justice Bureau of Justice Statistics
Official .Business Penalty for Private Use $300
Postage and Fees Paid U.S. Department of Justice Jus 436
THIRD CLASS
.-:.:
Washington, D. C. 20531 ;
i
~ "". fIJ 0
= ('D ~ fIJ
S· 00 S-~ (I)
~
= ~ "%j (I)
~ (I) ., ~ -Et r.n 0: a-~ .... 0
= r.n 0
= t:J (I) (")
f' (I)
S 0'" (I) ., CI:> )-L
....... c.o ....:]
00

f j ~ . , '
I' , I . ! ~ ~
\\ i I ! i ! : q n ~I :Ie
I ! ~ I II L j; , ! ~
II
;, , .. .
.-
;.