Embed Size (px)
Citation preview
UNLV Theses, Dissertations, Professional Papers, and Capstones
8-2011
Historical diversification of montane herpetofauna within and Historical diversification of montane herpetofauna within and
between the sierras of Mexico between the sierras of Mexico
Robert William Bryson Jr. University of Nevada, Las Vegas
Follow this and additional works at: https://digitalscholarship.unlv.edu/thesesdissertations
Part of the Biodiversity Commons, Climate Commons, Evolution Commons, and the Population
Biology Commons
Repository Citation Repository Citation Bryson, Robert William Jr., "Historical diversification of montane herpetofauna within and between the sierras of Mexico" (2011). UNLV Theses, Dissertations, Professional Papers, and Capstones. 1233. http://dx.doi.org/10.34917/2817915
This Dissertation is protected by copyright and/or related rights. It has been brought to you by Digital Scholarship@UNLV with permission from the rights-holder(s). You are free to use this Dissertation in any way that is permitted by the copyright and related rights legislation that applies to your use. For other uses you need to obtain permission from the rights-holder(s) directly, unless additional rights are indicated by a Creative Commons license in the record and/or on the work itself. This Dissertation has been accepted for inclusion in UNLV Theses, Dissertations, Professional Papers, and Capstones by an authorized administrator of Digital Scholarship@UNLV. For more information, please contact [email protected].
HISTORICAL DIVERSIFICATION OF MONTANE HERPETOFAUNA WITHIN
AND BETWEEN THE SIERRAS OF MEXICO
By
Robert William Bryson, Jr.
A dissertation submitted in partial fulfillment of the requirements for the
Doctor of Philosophy in Biological Sciences
School of Life Sciences College of Sciences
The Graduate College
University of Nevada, Las Vegas
August 2011

Copyright by Robert W. Bryson, Jr. 2011 All Rights Reserved
THE GRADUATE COLLEGE We recommend the dissertation prepared under our supervision by Robert William Bryson, Jr. entitled Historical Diversification of Montane Herpetofauna Within and Between the Sierras of Mexico be accepted in partial fulfillment of the requirements for the degree of Doctorate of Philosophy in Biological Sciences School of Life Sciences Brett R. Riddle, Committee Chair John Klicka, Committee Member Brian Hedlund, Committee Member Stephen M. Roland, Graduate College Representative Ronald Smith, Ph. D., Vice President for Research and Graduate Studies and Dean of the Graduate College August 2011
ii
ABSTRACT
Historical Diversification of Montane Herpetofauna Within and Between the Sierras of Mexico
by
Robert W. Bryson, Jr.
Dr. Brett R. Riddle, Examination Committee Chair Professor of Biological Sciences University of Nevada, Las Vegas
The Mexican highlands consist of four major mountain ranges spanning most of
mainland Mexico. The evolutionary history of the Mexican highlands has been shaped by
various geological and climatic events over the past several million years. The relative
impacts of these historical events on diversification in montane taxa, however, remains
uncertain. I used mitochondrial DNA data from three widely distributed species
complexes of lizards as a model system to exemplify the potential roles of Neogene
mountain formation and Quaternary climate change on timing and tempo of
diversification across the Mexican highlands. My results suggested strong geographic
partitioning of genetic variation across Mexico in all three lizard groups. There appeared
to be a generalizable anchor of diversification across taxa centered around the
development of the Transvolcanic Belt. Diversification across the rest of the Mexican
highlands was largely idiosyncratic, but filter barriers such as river drainages likely
subdivided lineages differentially through time. Diversification patterns observed in my
three focal groups of lizards provide additional insight into the mechanisms that impacted
differentiation of highland taxa across the complex Mexican highlands.
iii

ACKNOWLEDGMENTS
I am greatly indebted to my dissertation committee for their support, advice, and
encouragement throughout my tenure as a graduate student at UNLV: Drs. Brett Riddle,
John Klicka, Brian Hedlund, Jonathan Campbell, and Steve Rowland. Brett gave me a
second chance in the School of Life Sciences, and I am grateful for the opportunity he
presented to me. Research in Mexico would not have been possible without the support
of numerous friends and colleagues in Mexico, including Dr. David Lazcano, Dr. Adrian
Nieto, Uri Garcia, Dr. Javier Alvarado, Dr. Gustavo Quintero, Paulino Ponce, Jason
Jones, Chris Grunwald, and especially the late Fernando Mendoza. Without Fernando's
support and enthusiasm, none of this would have been possible. Many, many people
contributed their time and help in the field, and I hope that I have acknowledged them
properly in my publications. I would like to thank the UNLV Systematics Group, Brian
Smith, Tereza Jezkova, Dr. Jef Jaeger, Derek Houston, Stacy Mantooth, Sean
Neiswenter, Matt Graham, Viki Hemmings, Dr. Lois Alexander, and Mallory Eckstut for
their contributions to my intellectual growth. Last, and of course not least, I thank my
amazing family. They nervously awaited for my safe return back to the US after my
many expeditions to Mexico, and always supported me. To my wife, Meg, words can
never express my gratitude for the overwhelming support and love you have given to me
throughout the years.
My research was largely supported through funds made available by UNLV
(Barrick Fellowship, Graduate and Professional Student Association grants, Graduate
ACCESS grants, and International Studies scholarships). I received additional important
funding from T&E Inc. (Conservation Biology Research Grant), the American Museum
iv
of Natural History (Theodore Roosevelt Fund), and the Southwestern Association of
Naturalists (Howard McCarley Student Research Award). Several institutions provided
important tissue samples, including the American Museum of Natural History, Louisiana
State University, Museum of Vertebrate Zoology, Texas Museum of Natural History,
Universidad Nacional Autónoma de México, Universidad Autónoma de Nuevo León, and
University of Texas at Arlington.
v
TABLE OF CONTENTS
ABSTRACT....................................................................................................................... iii
ACKNOWLEDGMENTS ................................................................................................. iv
LIST OF TABLES............................................................................................................ vii
LIST OF FIGURES .........................................................................................................viii
CHAPTER 1 INTRODUCTION .................................................................................... 1 CHAPTER 2 DIVERSIFICATION IN THE MEXICAN HORNED LIZARD PHRYNOSOMA ORBICULARE ............................................................... 4 Introduction.................................................................................................................... 4 Methods.......................................................................................................................... 6 Results.......................................................................................................................... 11 Discussion .................................................................................................................... 13 CHAPTER 3 TESTING THE ROLES OF NEOGENE VICARIANCE AND QUATERNARY CLIMATE CHANGE ON THE HISTORICAL DIVERSIFICATION OF BUNCHGRASS LIZARDS (SCELOPORUS SCALARIS GROUP)................................................... 30 Introduction.................................................................................................................. 30 Methods........................................................................................................................ 33 Results.......................................................................................................................... 40 Discussion .................................................................................................................... 43 CHAPTER 4 HISTORICAL BIOGEOGRAPHY AND DIVERSIFICATION OF THE MEXICAN ALLIGATOR LIZARD GENUS BARISIA............... 63 Introduction.................................................................................................................. 63 Methods........................................................................................................................ 65 Results.......................................................................................................................... 69 Discussion .................................................................................................................... 72 BIBLIOGRAPHY............................................................................................................. 88 VITA............................................................................................................................... 105
vi
LIST OF TABLES
Table 2.1 Collection and voucher data for Phrynosoma samples ........................... 19 Table 2.2 Estimated divergence dates ..................................................................... 22 Table 2.3 Comparison of divergence dates ............................................................. 23 Table 3.1 Comparison of divergence dates across the Transvolcanic Belt ............. 48 Table 3.2 Collection and voucher data for Sceloporus scalaris group samples ...... 49 Table 3.3 Outgroup samples ................................................................................... 54 Table 3.4 Results of diversification rate analyses ................................................... 55 Table 4.1 Collection and voucher data for Barisia samples ................................... 77 Table 4.2 Estimated divergence dates and ancestral area reconstructions .............. 80
vii

LIST OF FIGURES
Figure 1.1 Major mountains of Mexico ...................................................................... 3 Figure 2.1 Sampling localities of Phrynosoma orbiculare ...................................... 24 Figure 2.2 Maternal genealogy ................................................................................. 25 Figure 2.3 Geographic distribution of mitochondrial lineages ................................. 26 Figure 2.4 Chronogram with estimated divergence times ........................................ 27 Figure 2.5 Examples of shared biogeographic barriers ............................................ 28 Figure 2.6 Distributions of lineages confined to the Central Mexican Plateau ........ 29 Figure 3.1 Two major volcanic episodes across the Transvolcanic Belt ................. 56 Figure 3.2 Distribution of the Sceloporus scalaris group ........................................ 57 Figure 3.3 Sampling localities of the Sceloporus scalaris group............................... 58 Figure 3.4 Maternal genealogy ................................................................................. 59 Figure 3.5 Geographic distribution of mitochondrial lineages ................................. 60 Figure 3.6 Diversification shifts and estimated divergence dates ............................ 61 Figure 4.1 Biogeographic areas and area adjacency matrix ...................................... 82 Figure 4.2 Sampling localities of Barisia ................................................................. 83 Figure 4.3 Maternal genealogy ................................................................................. 84 Figure 4.4 Geographic distribution of mitochondrial lineages ................................. 85 Figure 4.5 Chronogram and reconstruction of geographic range evolution ............. 86 Figure 4.6 Lineage through time plot ....................................................................... 87
viii
CHAPTER 1
INTRODUCTION
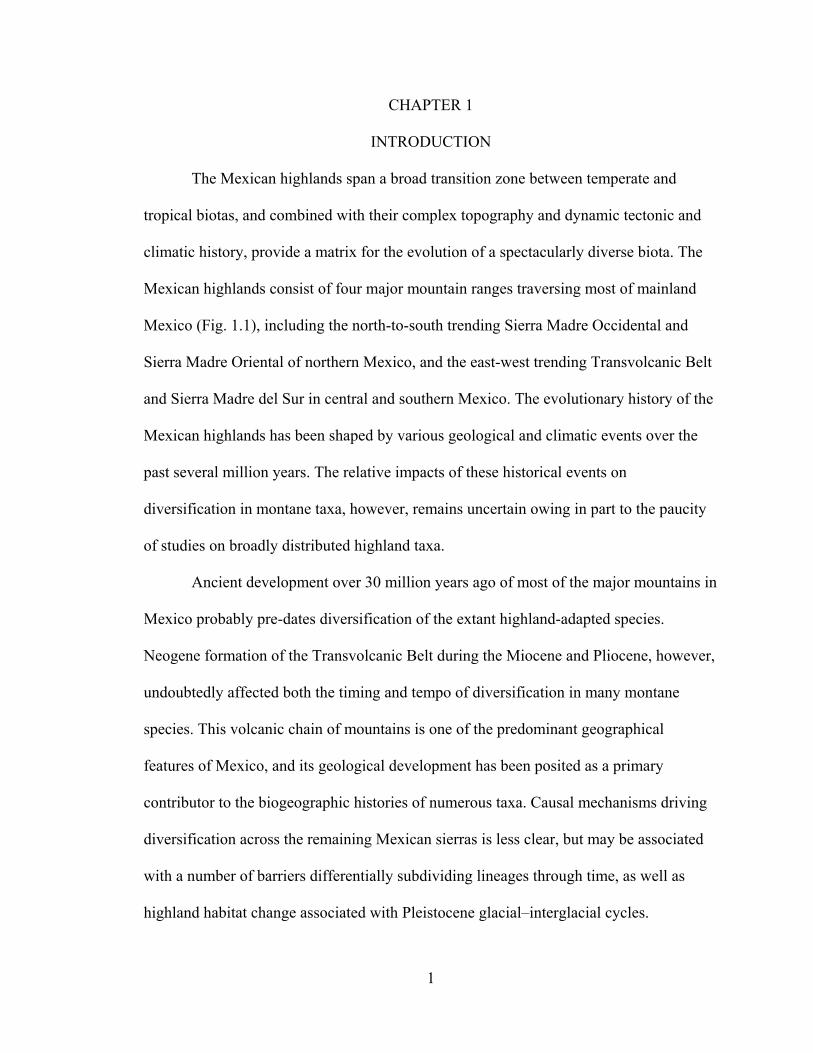
The Mexican highlands span a broad transition zone between temperate and
tropical biotas, and combined with their complex topography and dynamic tectonic and
climatic history, provide a matrix for the evolution of a spectacularly diverse biota. The
Mexican highlands consist of four major mountain ranges traversing most of mainland
Mexico (Fig. 1.1), including the north-to-south trending Sierra Madre Occidental and
Sierra Madre Oriental of northern Mexico, and the east-west trending Transvolcanic Belt
and Sierra Madre del Sur in central and southern Mexico. The evolutionary history of the
Mexican highlands has been shaped by various geological and climatic events over the
past several million years. The relative impacts of these historical events on
diversification in montane taxa, however, remains uncertain owing in part to the paucity
of studies on broadly distributed highland taxa.
Ancient development over 30 million years ago of most of the major mountains in
Mexico probably pre-dates diversification of the extant highland-adapted species.
Neogene formation of the Transvolcanic Belt during the Miocene and Pliocene, however,
undoubtedly affected both the timing and tempo of diversification in many montane
species. This volcanic chain of mountains is one of the predominant geographical
features of Mexico, and its geological development has been posited as a primary
contributor to the biogeographic histories of numerous taxa. Causal mechanisms driving
diversification across the remaining Mexican sierras is less clear, but may be associated
with a number of barriers differentially subdividing lineages through time, as well as
highland habitat change associated with Pleistocene glacial–interglacial cycles.
1

For my dissertation research, I examined the genetic structuring of three co-
distributed species groups of lizards with wide distributions across the highlands of
Mexico. I reconstructed maternal history and estimated dates of lineage divergences
using mitochondrial DNA data. In my second chapter, I explored lineage diversification
in the mountain horned lizard (Phrynosoma orbiculare), and compared results to patterns
of diversification observed in co-distributed taxa. In my third chapter, I tested the
hypothesis of diversification rate shifts in bunchgrass lizards (Sceloporus scalaris group)
in response to periods of development of the Transvolcanic Belt and Pleistocene glacial–
interglacial cycles. In my final chapter, I investigated the tempo and mode of
diversification in alligator lizards in the genus Barisia. Insight gained from my
dissertation research provides additional insight into the mechanisms that impacted
differentiation of highland taxa across the complex Mexican highlands.
2
Figure 1.1. Major mountains of Mexico. 1) Sierra Madre Occidental, 2) Sierra Madre
Oriental, 3) Transvolcanic Belt, and 4) Sierra Madre del Sur. Adapted from Campbell and
Lamar (2004).
3

CHAPTER 2
DIVERSIFICATION IN THE MEXICAN HORNED LIZARD PHRYNOSOMA
ORBICULARE
Introduction
The Mexican highlands harbor a significant amount of the world's biodiversity
(Ramamoorthy et al., 1993; Mittermeier et al., 2005) and a high level of biotic endemicity
(Peterson et al., 1993). Despite considerable attention and decades of biogeographic
study, a general model describing the historical processes that generated this diversity
continues to remain elusive. Geological history, dynamic climate change, and complex
topography have synergistically driven what appears to be an array of either taxon-
specific or general shared responses (Sullivan et al., 2000; Bryson et al., 2011a). Neogene
vicariance in the Miocene and Pliocene and Quaternary climate change have each shaped
the geographic distribution of genetic variation in co-distributed highland taxa, yet the
relative impacts of these historical processes on lineage diversification appear to differ
between lineages (Bryson et al., 2011a; Bryson et al., 2011b; Bryson et al., in press).
Deciphering the events that have shaped present-day biological diversity in the
Mexican highland system requires an accounting for considerable historical complexity.
Formation over 30 million years ago (Ma) of three of the four major mountain ranges in
Mexico (Sierra Madre Occidental, Sierra Madre Oriental, and Sierra Madre del Sur;
Ferrusquía-Villafranca and González-Guzman, 2005) probably predates diversification in
extant highland-adapted lineages. Estimated Neogene divergences in highland taxa within
these ranges (Zaldivar-Riverón et al., 2005; Weir et al., 2008; Bryson et al., 2011b)
suggest then that events other than mountain uplifting drove pre-Quaternary
4
diversification. A number of studies have identified filter barriers such as river drainages
within the major sierras (reviewed in Bryson et al., 2011a). It remains unclear, however,
how effective these barriers were in dividing lineages through history, and when these
barriers were relevant in splitting lineages. Diversification associated with the Neogene
uplift of the Transvolcanic Belt appears more tractable. Unfortunately, the complex
history of this volcanic mountain range (Gómez-Tuena et al., 2007) makes accurate
dating of vicariant events presumably responsible for divergences among co-distributed
taxa difficult.
Quaternary climate change has been posited as a major driver of biological
diversification in North America (Hewitt, 2004). In Mexico, montane vegetation may
have expanded downward at least 1000 m during Pleistocene glacial periods (McDonald,
1993), and linked previously isolated highland biotas (McDonald, 1993; Marshall and
Liebherr, 2000). Subsequently, during interglacial episodes, highland woodlands
retracted and their associated biota became isolated (Anducho-Reyes et al., 2008).
Repeated throughout the Pleistocene, these habitat shifts triggered range-wide
divergences in many highland taxa across Mexico (León-Paniagua et al., 2007; Anducho-
Reyes et al., 2008; Kerhoulas and Arbogast, 2010; Bryson et al., in press).
The widespread horned lizard Phrynosoma orbiculare represents an ideal species
to investigate the relative impacts of Neogene vicariance and Quaternary climate change
on lineage diversification across the Mexican highlands. It is endemic to Mexico, and
broadly associated with mixed pine-oak woodlands in the Sierra Madre Occidental, Sierra
Madre Oriental, and Transvolcanic Belt, and semiarid shrubland on the Central Mexican
Plateau (Sherbrooke, 2003) (Fig. 1). Further, it is thought to be one of the oldest extant
5
species of Phrynosoma, dating back to the Miocene (Presch, 1969; Montanucci, 1987).
Thus, P. orbiculare has had a long history in Mexico.
Here I used mixed-model phylogenetic analyses of mitochondrial DNA (mtDNA)
to examine the maternal history of P. orbiculare. Mitochondrial DNA, despite potential
limitations (e.g. Edwards and Bensch, 2009), appears useful for detecting recent
geographic patterns (Moore, 1995; Hudson and Coyne, 2002; Zink and Barrowclough,
2008; Barrowclough and Zink, 2009). This marker can also lead to significant
biogeographic discoveries (e.g. Upton and Murphy, 1997; Riddle et al., 2000a), and is an
important tool for exploring the genetic consequences of ecological history (e.g. Wiens et
al., 2007; Burney and Brumfield, 2009; Pyron and Burbrink, 2009). I formulated a robust
hypothesis of matrilineal relationships based on range-wide sampling of P. orbiculare,
and estimated dates of lineage divergences from a relaxed molecular clock to provide a
probabilistic temporal calibration for the phylogeny. I compared the phylogeographic
signal evident in P. orbiculare to other co-distributed highland taxa to aid in the
interpretation of historical biogeographic events that may have broadly impacted taxa
across the Mexican highlands.
Methods
Taxon sampling and DNA sequencing
I obtained tissues from 36 P. orbiculare (Table 1) from across its distribution
(Fig. 1). The number and distribution of subspecies of P. orbiculare has varied
historically (Horowitz, 1955; McDiarmid, 1963; Montanucci, 1979). Because of the
6
uncertainty regarding delimitation of subspecies (McDiarmid, 1963) and to frame my
results in terms of geography rather than taxonomy, I simply referred to specimens as P.
orbiculare, consistent with usage in field guides (e.g., Lemos-Espinal and Smith, 2007a,
2007b; Dixon and Lemos-Espinal, 2011). I used P. modestum and P. douglasii as
outgroups (Leaché and McGuire, 2006; Weins et al., 2010).
I sequenced two mtDNA gene regions, including NADH dehydrogenase subunit 4
and flanking tRNAs (ND4) and ATPase subunits 8 and 6 (ATPase 8, ATPase 6). These
gene regions have previously been shown to be informative at different levels of
divergence within lizards (Leaché and Mulcahy, 2007; Lindell et al. 2008). Total
genomic DNA was extracted from liver or tail clips using the QIAGEN DNeasy Blood
and Tissue Kit (Qiagen, Valencia, CA) following manufacturer’s recommendations. All
gene regions were amplified via PCR in a mix containing 6.25 µl Takara ExTaq
Polymerase Premix (Takara Mirus Bio Inc., Madison, WI, USA), 4.25 µl double-distilled
water, 0.5 µl each primer (10 µl), and 1.0 µl of template DNA. Primer sequences for ND4
are given in Arévalo et al. (1994), and for ATPase were specifically designed for this
project (C2LF, 5’– ATCTGCGGGTCAAACCACAG–3’; C3LR, 5’–
GCGTGTGYTTGGTGGGTCAT–3’). DNA was denatured initially at 95 °C for 2.5 min;
35–40 cycles of amplification were then performed under the following conditions:
denaturation at 95 °C for 1 min, annealing at 56 °C for 1 min, and extension at 72 °C for
1 min; this was followed by a final 10 min elongation at 72 °C. Double-stranded PCR
amplified products were checked by electrophoresis on a 1% agarose gel, purified using
exonuclease and shrimp phosphatase, and directly sequenced in both directions with the
amplification primers using a Big Dye Terminator v. 3.1 cycle sequencing kit (Applied
7

Biosystems, Foster City, CA, USA). The completed sequencing reactions were cleaned of
excess dyes using CentriSep spin columns (Princeton Separations, Inc., Adelphia, NJ),
and sequences were visualized on an ABI Prism 3130 capillary autosequencer. Forward
and reverse sequences for each individual were edited and manually aligned using
Sequencher 4.2 (Gene Codes Corporation, Ann Arbor, MI).
Phylogenetic inference
I analyzed my sequence data using Bayesian inference (BI) and maximum
likelihood (ML) phylogenetic methods. Bayesian inference analyses were conducted
using MrBayes 3.1 (Ronquist and Huelsenbeck, 2003) on the combined mtDNA dataset,
implementing separate models for each gene region (ND4, tRNAs, ATPase 8, ATPase 6).
MrModeltest 2.1 (Nylander, 2004) was used to select a best-fit model of evolution, based
on Akaike Information Criteria (AIC), for each partition. Bayesian settings included
random starting trees, a variable rate prior, a mean branch length exponential prior of 50,
and heating temperature of 0.06. Analyses consisted of four runs (nruns=4) conducted
each with three heated and one cold Markov chain sampling every 100 generations for 4
million generations. Output parameters were visualized using the program TRACER v1.4
(Rambaut and Drummond, 2007) to ascertain stationarity and whether the duplicated runs
had converged on the same mean likelihood. Convergence was further assessed using
AWTY (Nylander et al., 2008). All samples obtained during the first one million (25%)
generations were discarded as burn-in. A 50% majority-rule consensus phylogram with
nodal posterior probability support was estimated from the combination of the four runs
post-burn-in. Maximum likelihood analyses were conducted using RAXML 7.0.3
(Stamatakis, 2006) with the same partitioning scheme used for the BI analyses. The
8
GTRGAMMA model was used, and 1000 nonparametric bootstrap replicates were
performed to assess nodal support. I considered those nodes with ≥ 95% Bayesian
posterior probability and ≥ 70% bootstrap support as strongly supported (Hillis and Bull,
1993; Felsenstein, 2004).
Divergence time estimation
Divergence dates were estimated using a relaxed Bayesian molecular clock
framework implemented in BEAST v1.6.1 (Drummond and Rambaut, 2007). To reduce
potential problems associated with model parameter variance across heterogeneous
datasets (Ho, 2005; Guiher and Burbrink, 2008), divergence estimates were inferred for a
reduced dataset, which included one individual from each geographically structured
lineage of P. orbiculare inferred from BI analyses. Two different clock-calibration
methods were used to obtain estimates. The first method utilized a relaxed uncorrelated
lognormal clock and node constraints obtained from the fossil and geological record. To
calibrate the tree, I included sequences from several outgroups (Table 1). The second
method employed a substitution rate calibration and relaxed uncorrelated lognormal
clock. I used a rate calibration for mtDNA previously calculated for a similar sized lizard
(Macey et al., 1999). This substitution rate, here corrected to 8.05 x 10⁻³
substitutions/site/million year using a more complex GTR + G model, has been used in a
number of studies to date divergences in lizards (e.g., Morando et al., 2004; Tennesson
and Zamudio, 2008; Luxbacher and Knouft, 2009). Both datasets were partitioned by
gene, and best-fit models of evolution were estimated using MrModeltest and unlinked
across partitions.
9
For each clock-calibration method, analyses consisted of two independent runs
each of 40 million generations, with samples retained every 1000 generations, and with a
Yule tree prior. Results were displayed in TRACER to confirm acceptable mixing and
likelihood stationarity, appropriate burn-in, and adequate effective sample sizes. After
discarding the first 4 million generations (10%) as burn-in, the trees and parameter
estimates from the two runs were combined using LogCombiner v1.6.1 (Drummond and
Rambaut, 2007). The parameter values of the samples from the posterior distribution
were summarized on the maximum clade credibility tree using TreeAnnotator v1.6.1
(Drummond and Rambaut, 2007), with the posterior probability limit set to zero and
mean node heights summarized.
For calibrated analyses, I placed two calibration points with lognormal
distributions on the tree as follows:
(a) At the stem of a short-horned lizard clade (P. douglasii, P. hernandesi, and P.
ditmarsi), I placed the oldest known fossils referable to P. douglasii from the Early
Miocene (Hemingfordian North American Land Mammal Age; Robinson and Van
Devender, 1973; Van Devender and Eshelman, 1979; Estes, 1983). The stem was
constrained with a zero offset (hard upper bound) of 16 Ma, a lognormal mean of 0.7, and
a lognormal standard deviation of 0.5. This produced a median age of 18 Ma and a 95%
prior credible interval (PCI) extending to the beginning of the Hemingfordian 20.6 Ma.
(b) At the stem of a desert horned lizard clade containing P. platyrhinos, P.
goodei, and a related Phrynosoma from Yuma Proving Grounds, Arizona (P. "Yuma";
Mulcahy et al., 2006), I placed a calibration based on the Pliocene marine incursion of the
Sea of Cortés and development of the Bouse Embayment. This geological event is
10
thought to have driven divergences in several co-distributed taxa (Lamb et al., 1989;
Riddle et al., 2000b; Pellmyr and Segraves, 2003; Murphy et al. 2006; Castoe et al.,
2007), including P. platyrhinos (Jones, 1995), and has been used as a calibration point for
divergence dating in other studies (Castoe et al., 2009; Bryson et al., 2011a; Daza et al.,
2010). The stem was given a lognormal mean of 1.1 and a lognormal standard deviation
of 0.37, resulting in a median age centered at the climax of the formation of the Sea of
Cortés and development of the Bouse embayment at 3 Ma, and a 95% PCI extending to
the beginning of the development of the Sea of Cortés at 5.5 Ma (Carreño and Helenes,
2002, and references therein). No zero offset was used.
Results
Phylogenetic inference
The final dataset consisted of 1675 aligned nucleotide positions. Models of
sequence evolution selected for the partitions were GTR + I + G (ND4), GTR + I
(ATPase 8), GTR + G (ATPase 6), and HKY + I (tRNA). All sequences were deposited
in GenBank.
From my phylogenetic analyses, I inferred 11 geographically structured, well
supported mitochondrial lineages within P. orbiculare (Figs. 2–3). Samples from the
Sierra Madre Occidental formed five geographically distinct lineages (I–V) contained in
a larger 'northern clade'. Samples from the rest of the distribution formed my 'southern
clade'. Distributions of lineages in the southern clade are as follows: southernmost
extension of the Sierra Madre Oriental that overlaps parts of the eastern Transvolcanic
11
Belt (VI), central Transvolcanic Belt and adjacent sections of the Central Mexican
Plateau (VII, VIII), southern Sierra Madre Oriental in eastern Hidalgo (IX), the western
and southern portions of the Central Mexican Plateau (X), and northern Sierra Madre
Oriental and adjacent foothills on the Central Mexican Plateau (XI).
Relationships among lineages were well supported, with the exception of one
poorly supported node (73% posterior probability, 46% bootstrap) subtending the
lineages from Chihuahua and the rest of the Sierra Madre Occidental (Fig. 2). However,
in BEAST analyses on a reduced dataset (see below), this node received 100% posterior
probability. Combined, I cautiously infer this to be a supported relationship. Within the
southern clade, divergences followed a stepwise pattern (Fig. 3) from the southern end of
the Sierra Madre Oriental (lineage VI), across the Transvolcanic Belt (sister lineages
VII–VIII), up the Sierra Madre Oriental (lineage IX), across the Central Mexican Plateau
(lineage X), and up to the northern Sierra Madre Oriental (lineage XI).
Divergence time estimation
The selected models of sequence evolution for the fossil-calibrated and rate-
calibrated datasets were GTR + I + G (ND4, ATPase 8, ATPase 6, fossil-calibrated),
GTR + I (ATPase 8, rate-calibrated), GTR + G (ATPase 6, rate-calibrated), HKY + I + G
(tRNA, fossil-calibrated), and HKY + I (tRNA, rate-calibrated). Posterior probability
support for inferred divergences within P. orbiculare were high; 100% between the
northern and southern clades, 100% within the northern clade, and 94–100% within the
southern clade. Dating estimates suggested that diversification in P. orbiculare probably
began in the Late Miocene (Table 2, Fig. 4) with a basal divergence between the northern
and southern clades. Several divergences appear to have followed in the Neogene,
12

including three sequential splits in the southern clade and two splits in the northern clade.
My estimates place the remaining divergences, two in the southern clade and two in the
northern clade, within a Pliocene–Pleistocene timeframe.
Discussion
Diversification patterns across the Transvolcanic Belt
Inferred spatial and temporal patterns of matrilineal diversification in P.
orbiculare provide additional insight into the mechanisms that impacted differentiation of
highland taxa across the Mexican highlands. Neogene vicariance had a relatively strong
role in driving diversification within P. orbiculare. Six of the ten inferred lineage spitting
events probably occurred during this time period (Fig. 4). The two oldest divergences
within the southern clade, and perhaps initial diversification of P. orbiculare, are likely
associated with major volcanic episodes along the Transvolcanic Belt. A recent revision
summarizing the past two decades of research on the origin of the Transvolcanic Belt
(Gómez-Tuena et al. 2007) suggested that the first major range-wide volcanic episode
occurred about 10–19 Ma. Early diversification in P. orbiculare roughly 7.5 Ma might
have followed this period of uplift. A subsequent period of marked widespread volcanism
across the Transvolcanic Belt ensued around 7.5–3 Ma (Gómez-Tuena et al. 2007), and
this second episode of volcanism likely caused the two oldest divergences within the
southern clade of P. orbiculare, estimated to have occurred about 6 Ma and 5 Ma. These
estimated dates are remarkably consistent with mean divergences around 5–7 Ma inferred
for a suite of taxa distributed across the Transvolcanic Belt (toads, Mulcahy and
13

Mendelson, 2000; cichlids, Hulsey et al., 2004; Mexican jays, McCormack et al., 2008,
2011; montane rattlesnakes, Bryson et al., 2011a, Bryson et al., in press; gophersnakes,
Bryson et al., 2011b). These shared temporal divergences suggest uplifting of the
Transvolcanic Belt around 7.5–3 Ma broadly impacted a variety of taxa.
Diversification patterns within the northern sierras
Several mtDNA lineages of P. orbiculare are embedded within the Sierra Madre
Occidental and Sierra Madre Oriental (Fig. 3). This finding is consistent with
diversification patterns observed in several co-distributed taxa (Bryson et al., 2011a;
Gugger et al., 2011; Bryson et al., in press). The fragmented topography and
environmental heterogeneity within the Sierra Madre Occidental in concert with
Quaternary climate change are likely driving diversification across this range (Salinas-
Moreno et al., 2004). Deep river drainages may be acting as filter barriers to highland
taxa. Previous studies (Salinas-Moreno et al., 2004; Anducho-Reyes et al., 2008; Bryson
et al., 2011a) found the Rio Mezquital basin across southern Durango (Fig. 5) to be an
isolating barrier. Two lineages of P. orbiculare also appear to be separated by this
drainage. One lineage of P. orbiculare appears isolated in northern Nayarit. Interestingly,
a geographically identical lineage was also found in montane rattlesnakes (Bryson et al.,
2011a). In this region, the Rio Mezquital basin and headwater tributaries of the Rio
Santiago basin (Fig. 5) may have carved an island of montane habitat isolated from the
remainder of the southern Sierra Madre Occidental. In the Sierra Madre Occidental to the
north, the combination of the Rio Culiacán basin across the Pacific slopes and the
tributaries of the Rio Nazas basin across the interior slopes may be forming a disrupting
barrier (Fig. 5) to some highland taxa. I observed a deep basal divergence within the
14

northern lineage of P. orbiculare across this region in northern Durango. A spatially
congruent genetic break was also observed here in twin-spotted rattlesnakes (Bryson et
al., in press). The inferred times of divergences, however, appear different (Table 3),
suggesting this Rio Culiacán-Rio Nazas barrier may be differentially affecting lineage
splitting through time. Similar incongruence was observed between other co-distributed
taxa subdivided across breaks in the Sierra Madre Occidental (Table 3).
The Sierra Madre Oriental appears to be divisible into at least two unique sections
(Luna-Vega et al., 1999; Salinas-Moreno et al., 2004). Several co-distributed highland
taxa display distinct genetic breaks across central San Luis Potosí (Bryson et al., 2007;
McCormack et al., 2008; Bryson et al., 2011a), including P. orbiculare (Fig. 3). There is
a distinct absence of pines in this region (Farjon and Styles, 1997; Fig. 1), and the
lowlands that cut across the Sierra Madre Oriental form the Cerritos-Arista and Saladan
filter barriers (Morafka, 1977; Fig. 5). A probable Pleistocene divergence between
lineages of P. orbiculare isolated north and south of this combined barrier is temporally
consistent with most lineage splits observed in co-distributed taxa (Table 3). An older
divergence in Middle American gophersnakes (Table 3) suggests this barrier may have
been influential in driving divergences earlier in time as well. The Sierra Madre Oriental
may also include a distinct southern segment in Puebla and Veracruz. This region has a
complex geological history, and contains geological and biotic elements of both the
Sierra Madre Oriental and Transvolcanic Belt (Marshall and Liebherr, 2000; Salinas-
Moreno et al., 2004; Corona et al., 2007; Paniagua and Morrone, 2009). The Sierra
Madre Oriental may have once been continuous from Hidalgo south into northern
Oaxaca, and later divided by the formation of the Transvolcanic Belt (Corona et al.,
15
2007; Paniagua and Morrone, 2009). The inferred basal split in my southern clade of P.
orbiculare around 5.5 Ma (Fig. 3) is consistent with this scenario.
Diversification patterns across the Central Mexican Plateau
Expansions of pine-oak woodlands across the Central Mexican Plateau during
Pleistocene glacial periods (Gugger et al., 2011; Bryson et al., in press) may have
promoted dispersal between highlands, resulting in contact between previously isolated
taxa. Periodic bouts of gene flow during these periods could have erased or obscured
previously acquired signals of historical isolation. Despite this potential, the distribution
of the maternal lineage of P. orbiculare confined to the Central Mexican Plateau is
largely congruent with regional genetic groups seen in other highland taxa (Fig. 6). These
geographically overlapping lineages suggest similar responses to barriers across this
region. However, the distributions of sister lineages to these Central Mexican Plateau
lineages vary (Fig. 6), suggesting the Central Mexican Plateau is accumulating lineages
from geographically different sources in different taxa. Potential shared barriers between
Central Mexican Plateau lineages include the combined Cerritos-Arista/Saladan barriers
to the northeast, the extensive Rio Pánuco basin to the east and the Rio Lerma basin to
the south, and pine-oak habitat disjunctions to the west (Fig. 5). Given non-identical
lineage ranges, however, soft allopatry through ecological vicariance may also explain
these distributions (Pyron and Burbrink, 2010). Under this scenario, geological barriers
limiting lineage distributions may not be evident. While an attractive alternative, a recent
study on co-distributed Mexican jays (McCormack et al., 2010) found little evidence for
ecological niche divergence between lineages of Mexican jays in the highlands of the
northern Sierra Madre Oriental, Central Mexican Plateau, and Sierra Madre Occidental.
16

Additional phylogeographic studies on highland taxa with wide distributions across
Mexico and subsequent analyses within a comparative framework are needed to better
elucidate idiosyncratic versus general processes promoting lineage diversification across
the Central Mexican Plateau and Mexican highlands.
Systematic and conservation implications
Although beyond the scope of this paper, my results based on mtDNA are largely
in agreement with historical studies on morphology (Horowitz, 1955; Montanucci, 1979)
and warrant some discussion. Congruence suggests several distinct lineages are
embedded within P. orbiculare. Nearly precise overlapping distributions of my inferred
lineages with morphologically distinct subspecies are as follows: (a) Lineages I-II from
Chihuahua with P. o. bradti (sensu Horowitz, 1955); (b) Lineages III-V from the
southern half of the Sierra Madre Occidental with P. o. durangoensis (Horowitz, 1955);
(c) Lineages VII-VIII with P. o. orbiculare; and (d) Lineage XI with P. o. oriental. My
remaining three mtDNA lineages represent P. o. cortezii (Lineages VI and IX) and P. o.
cortezii and P. o. dugesi (Lineage X). Numerous intergrade zones between the various
subspecies appear to exist (Horowitz, 1955; Montanucci, 1979) and to such a degree that
P. orbiculare was considered one variable monotypic species (McDiarmid, 1963).
Because mtDNA alone might not adequately measure gene flow in lizards (e.g. Godinho
et al., 2008; Lindell et al., 2008), future studies should incorporate multilocus data to
further delimit distributions of P. orbiculare lineages.
The International Union for Conservation of Nature (IUCN) considers P.
orbiculare to be a species of least concern because of its wide distribution across Mexico
and large population size (Mendoza-Quijano et al., 2007). The Mexican government
17

classifies this species as threatened (SEMARNAT, 2010). Treated as a single wide-
ranging species, P. orbiculare is presumably buffered against anthropogenic
disturbances. However, my findings suggest that P. orbiculare is in fact probably
comprised of multiple distinct lineages. Some of these lineages, such as the one occurring
in Veracruz and Puebla and the one in northern Nayarit (lineages III and VI, Fig. 3),
appear to have small distributions and long independent evolutionary histories. Given the
amount and rate of habitat destruction across the Mexican highlands (Challenger, 1998;
Brower et al., 2002; Galicia and García-Romero, 2007), these range-restricted lineages
merit additional consideration for protection.
18
Table 2.1. Collection and voucher data for genetic samples of Phrynosoma used in this
study. All samples deposited in the Las Vegas Tissue Collection (LVT) or Texas Natural
History Collection (TNHC). Asterisks denote outgroup samples used in fossil-calibrated
divergence dating.
Taxon Locality Sample ID (MX)
Voucher Number
P. orbiculare Mexico: Aguascalientes: Sierra Fría 1 LVT 10782
P. orbiculare Mexico: Chihuahua: Colonia García TZ LVT 10794
P. orbiculare Mexico: Chihuahua: El Pima, Mpo. Temosachic
27 LVT 10759
P. orbiculare Mexico: Chihuahua: Mesa de Agostadero
161 LVT 10761
P. orbiculare Mexico: Chihuahua: Ejido Zorillo 335 LVT 10760
P. orbiculare Mexico: Chihuahua: Guachochi 398 LVT 10762
P. orbiculare Mexico: Coahuila: Santa Rita 4 LVT 10791
P. orbiculare Mexico: Coahuila: Ejido La Casita 165 LVT 10787
P. orbiculare Mexico: Distrito Federal: San Pablo Oztotepec
400 LVT 10773
P. orbiculare Mexico: Distrito Federal: Sierra Ajusco 447 LVT 10774
P. orbiculare Mexico: Durango: Rancho Santa Barbara
5 LVT 10767
P. orbiculare Mexico: Durango: E Topia 397 LVT 10766
P. orbiculare Mexico: Durango: Otinapa 457 LVT 10768
P. orbiculare Mexico: Durango: Rancho Las Margaritas
458 LVT 10765
P. orbiculare Mexico: Estado de Mexico: Jocotitlán 168 LVT 10777
19

Table 2.1. Collection and voucher data continued.
Taxon Locality Sample ID (MX)
Voucher Number
P. orbiculare Mexico: Estado de Mexico: Huixquilucan
401 LVT 10778
P. orbiculare Mexico: Estado de Mexico: Villa de Carbon
446 LVT 10772
P. orbiculare Mexico: Estado de Mexico: Santa Rosa de Lima
449 LVT 10776
P. orbiculare Mexico: Estado de Mexico: Toluca 451 LVT 10775
P. orbiculare Mexico: Hidalgo: Mineral del Monte 17 LVT 10780
P. orbiculare Mexico: Hidalgo: Tulancingo de Bravo 166 LVT 10781
P. orbiculare Mexico: Hidalgo: Alfajayucan 450 LVT 10783
P. orbiculare Mexico: Hidalgo: Tenango de Doria 452 LVT 10779
P. orbiculare Mexico: Jalisco: Vaquerías 162 LVT 10784
P. orbiculare Mexico: Nayarit: Santa Teresa 336 LVT 10763
P. orbiculare Mexico: Nuevo León: Pablillo 30 LVT 10790
P. orbiculare Mexico: Puebla: Tlatlauquitepec 23 LVT 10771
P. orbiculare Mexico: Queretáro: Amealco 399 LVT 10785
P. orbiculare Mexico: Queretáro: Amealco 445 LVT 10786
P. orbiculare Mexico: San Luis Potosí: Guadalcalzar 163 LVT 10788
P. orbiculare Mexico: San Luis Potosí: Real de Catorce
456 LVT 10793
P. orbiculare Mexico: Tamaulipas: W Bustamante 204 LVT 10792
P. orbiculare Mexico: Tamaulipas: SE Bustamante 337 LVT 10789
P. orbiculare Mexico: Veracruz: Atzompa 20 LVT 10770
P. orbiculare Mexico: Veracruz: Las Vigas 169 LVT 10769
P. orbiculare Mexico: Zacatecas: Valparaíso 14 LVT 10764
20

Table 2.1. Collection and voucher data continued.
Taxon Locality Sample ID (MX)
Voucher Number
P. modestum* USA: New Mexico: Jornada -- LVT uncat.
P. douglasii (short-horned clade)*
USA: Idaho: Butte Co. -- LVT uncat.
P. hernandesi (short-horned clade)*
USA: Nevada: Elko Co. -- LVT uncat.
P. ditmarsi (short-horned clade)*
Mexico: Sonora 462 TNHC-GDC 8420
P. asio* Mexico 460 TNHC-GDC 8305
P. taurus* Mexico 461 TNHC-GDC 8540
P. cornutum* USA: New Mexico: Doña Ana Co. 463 LVT 374
P. coronatum* Mexico: Baja Sur: La Paz -- LVT 8384
P. solare* USA -- LVT 981
P. mcalli* USA: -- LVT 0971
P. platyrhinos (desert clade)*
USA: Nevada: Nye Co. -- LVT 9466
P. goodei (desert clade)*
USA: --
P. "Yuma" (desert clade)*
USA: Arizona: Yuma Proving Grounds -- LVT 9951
21
Table 2.2. Estimated divergence dates within Phrynosoma orbiculare based on two
molecular clock calibration methods implemented in BEAST. Lineage designations
follow Fig. 2. Posterior mean ages followed by 95% highest posterior density intervals in
parentheses, provided in millions of years ago.
Divergence event Fossil-calibrated clock
Rate-calibrated clock
Northern clade / Southern clade 7.7 (5.8–9.7) 7.2 (5.9–8.6)
Northern clade:
I + II / III + IV + V 6 (4.2–7.8) 5.1 (3.9–6.4)
I / II 3.5 (2–5.1) 3 (2–4)
III / IV + V 2.8 (1.7–3.9) 2.5 (1.8–3.2)
IV / V 1.8 (1–2.6) 1.6 (1.1–2.2)
Southern clade:
VI / VII + VIII + IX + X + XI 5.4 (3.9–6.9) 5.6 (4.5–6.9)
VII + VIII / IX + X + XI 4.8 (3.5–6.2) 5 (4–6.1)
VII / VIII 2 (1.2–2.8) 2 (1.4–2.7)
IX / X + XI 3.9 (2.6–5.3) 3.8 (2.8–4.9)
X / XI 1.9 (1–2.8) 1.8 (1.1–2.5)
22
Table 2.3. Comparison of mean estimated divergence dates in Phrynosoma orbiculare
with co-distributed highland taxa across selected shared barriers within the Mexican
highlands. Barriers are shown in Fig. 5. Dates were estimated from mitochondrial gene
trees, so for consistency, I did not include slightly younger re-estimates of divergence
times in Mexican jays based on a species-tree approach (McCormack et al., 2011).
Barrier Taxon / Mean divergence date
Rio Mezquital basin Mexican horned lizards1 / 1.5 Ma
Twin-spotted rattlesnakes2 / 1.2 Ma
Rock rattlesnakes3 / 2.4 Ma
Rio Mezquital-Rio Santiago basins Mexican horned lizards1 / 2.5 Ma
Rock rattlesnakes3 / 1.4 Ma
Rio Culiacán-Rio Nazas basins Mexican horned lizards1 / 5.5 Ma
Twin-spotted rattlesnakes2 / 2.6 Ma
Cerritos-Arista / Saladan barrier Mexican horned lizards1 / 2 Ma
Rock rattlesnakes3 / 2.1 Ma
Mexican jays4 / 2.4 Ma
Middle American gophersnakes5 / 4.5 Ma 1this study; 2Bryson et al., in press; 3Bryson et al., 2011a; 4McCormack et al., 2008;
5Bryson et al., 2011b
23
Figure 2.1. Sampling localities for genetic samples of Phrynosoma orbiculare overlaid
on mixed pine-oak woodlands above 1900 m. Dashed line delineates approximate
distribution of P. orbiculare (Mendoza-Quijano et al., 2007). Several important mountain
ranges in Mexico mentioned in the text include the Sierra Madre Occidental (SMOc),
northern (N) and southern (S) Sierra Madre Oriental (SMOr), and Transvolcanic Belt
(TVB). The Central Mexican Plateau (CMP) is also noted.
24
Figure 2.2. Maternal genealogy of Phrynosoma orbiculare based on mixed-model
Bayesian inference (tree shown) and maximum likelihood analyses of mitochondrial
DNA sequence data. Names of two major clades and 11 inferred lineages (denoted with
roman numerals) are indicated, and bars show corresponding mountain ranges drawn in
Fig. 2.1. Numbers at nodes indicate support values (Bayesian posterior probability
followed by maximum likelihood bootstrap). Nodes that received ≥ 95% Bayesian
posterior probability and ≥ 70% bootstrap support are depicted with black dots.
25
Figure 2.3. Geographic distribution of Phrynosoma orbiculare mitochondrial lineages.
Roman numerals refer to lineages shown in Fig. 2.2. Numbers at nodes on phylogenetic
tree specify approximate estimated divergence times (mean dates derived from fossil-
calibrated dataset, see Table 2.2 for credibility intervals and alternative dates based on
rate-calibrated analyses)..
26
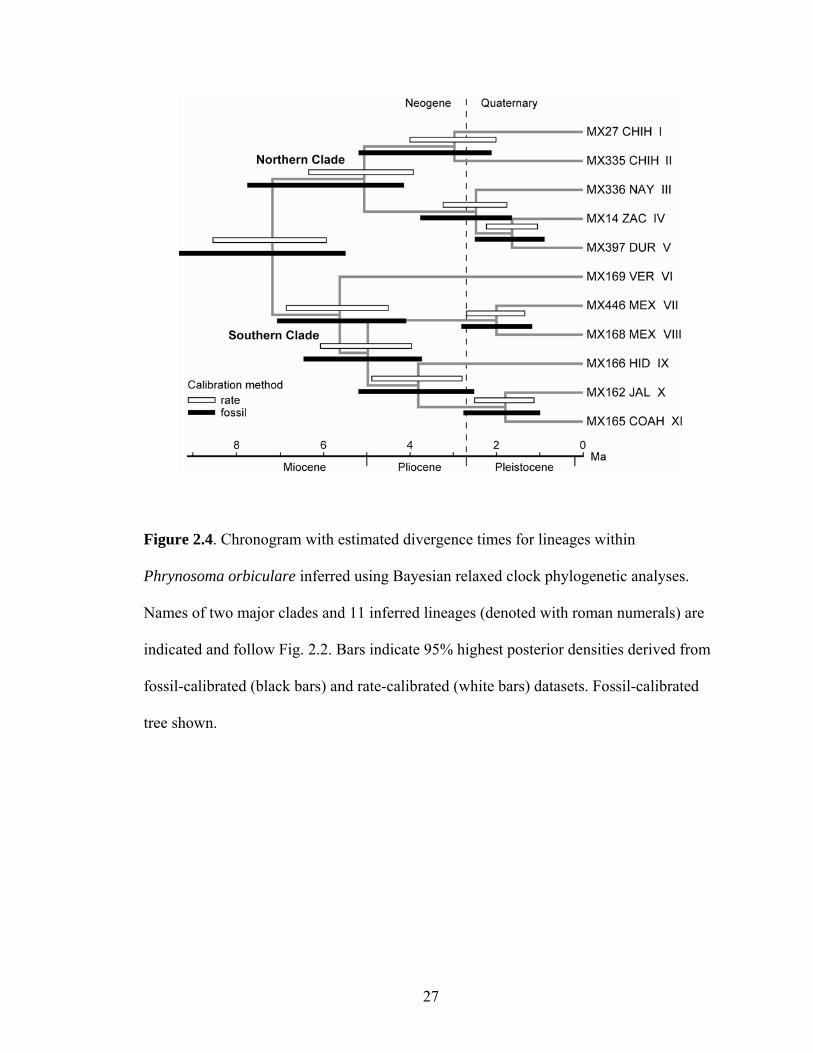
Figure 2.4. Chronogram with estimated divergence times for lineages within
Phrynosoma orbiculare inferred using Bayesian relaxed clock phylogenetic analyses.
Names of two major clades and 11 inferred lineages (denoted with roman numerals) are
indicated and follow Fig. 2.2. Bars indicate 95% highest posterior densities derived from
fossil-calibrated (black bars) and rate-calibrated (white bars) datasets. Fossil-calibrated
tree shown.
27
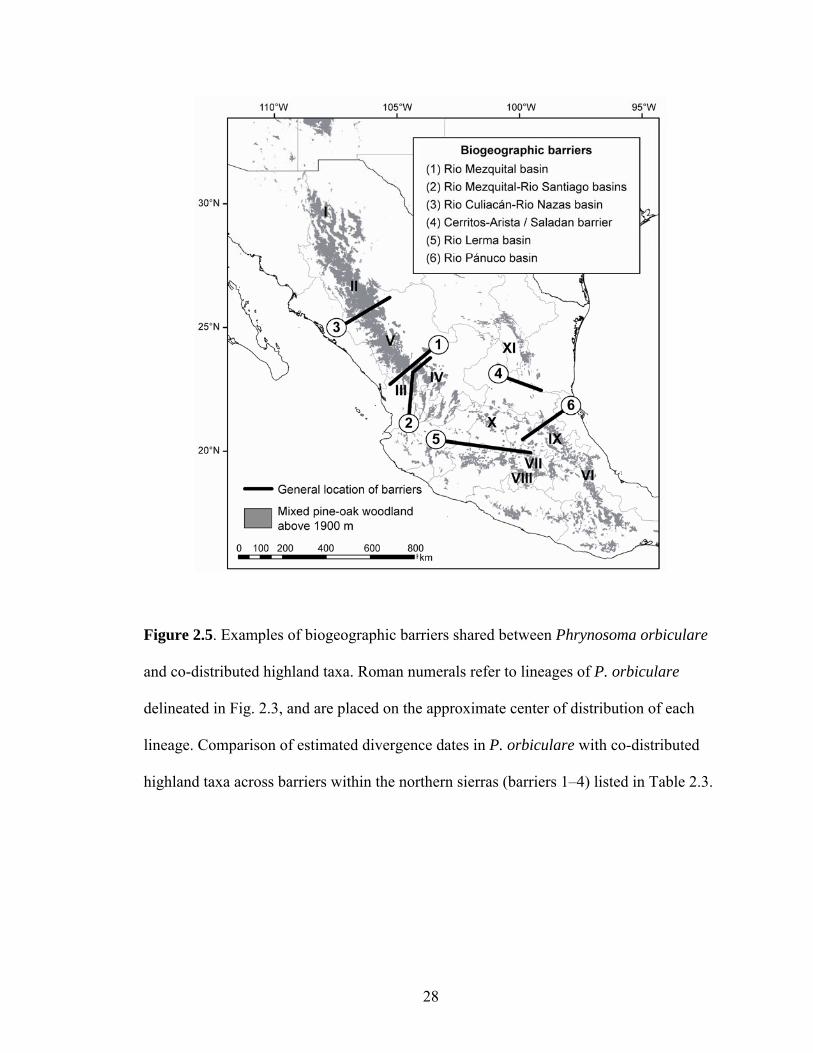
Figure 2.5. Examples of biogeographic barriers shared between Phrynosoma orbiculare
and co-distributed highland taxa. Roman numerals refer to lineages of P. orbiculare
delineated in Fig. 2.3, and are placed on the approximate center of distribution of each
lineage. Comparison of estimated divergence dates in P. orbiculare with co-distributed
highland taxa across barriers within the northern sierras (barriers 1–4) listed in Table 2.3.
28

Figure 2.6. Generalized distributions of mitochondrial lineages of highland taxa confined
to the Central Mexican Plateau (CMP): Mexican horned lizards (this study), Middle
American gophersnakes (Bryson et al., 2011b), Queretaran dusky rattlesnakes (Bryson et
al., 2011a), and Mexican jays (McCormack et al., 2008). The approximate distributions
of sister lineages are also shown for each taxon to illustrate that the Central Mexican
Plateau is accumulating lineages from geographically different sources.
29
CHAPTER 3
TESTING THE ROLES OF NEOGENE VICARIANCE AND QUATERNARY
CLIMATE CHANGE ON THE HISTORICAL DIVERSIFICATION OF
BUNCHGRASS LIZARDS (SCELOPORUS SCALARIS GROUP)
Introduction
Emerging patterns of historical diversification in the Mexican highlands suggest
mixed responses in co-distributed taxa to past geological and climatic events despite a
presumed shared history in the same region (Sullivan et al., 2000; Paniagua and Morrone,
2009; Bryson et al., 2011b). Vicariance in the Miocene and Pliocene heavily influenced
lineage divergences in some taxa (e.g., Castoe et al., 2009), while Quaternary climate
change triggered increased diversification in others (e.g., Bryson et al., in press). The
synergistic effects of Earth history and glacial-interglacial cycles, coupled with the
complex topography of Mexico, appear to have produced a myriad of species-specific
responses. Reconciling a common pattern of lineage diversification in Mexican highland
taxa has proven difficult (Flores-Villela and Martínez-Salazar, 2009)
Ancient development over 30 million years ago (Ma) of most of the major
mountains in Mexico (Ferrusquía-Villafranca and González-Guzmán, 2005) probably
pre-dates diversification of the extant highland-adapted species. Neogene formation of
the Transvolcanic Belt (TVB), however, undoubtedly affected both the timing and tempo
of diversification in many montane species. This volcanic chain of mountains is one of
the predominant geographical features of Mexico, and its geological development has
been posited as a primary contributor to the biogeographic histories of numerous taxa
(Mulcahy et al., 2006; Bryson et al., 2011a). Uplift of the TVB created new geographical
30
barriers and montane habitats, but also linked previously isolated highland biotas
(Anducho-Reyes et al., 2008). The complex geological history of this mountain range
(Ferrusquía-Villafranca, 1993; Gómez-Tuena et al., 2007) unfortunately makes accurate
dating of vicariant events presumably responsible for divergences among co-distributed
taxa difficult. A recent revision of the past two decades of research on the origin of the
TVB (Gómez-Tuena et al., 2007) suggests four major volcanic episodes during the
Neogene formed most of the range. Two of these episodes (Fig. 1), one at around 10–19
Ma and one about 3–7.5 Ma, resulted in major mountain formations that almost
completely subdivided Mexico. Estimated mean divergence dates in several taxa
distributed on or near this region are largely congruent with these two periods (Table 1).
In particular, numerous divergences are remarkably similar at around 4–7 Ma. These
dates suggest that the marked period of uplift around 3–7.5 Ma may have had a
comparatively stronger effect on lineage diversification than other periods of uplift.
In addition to Neogene vicariant events, Pleistocene climate change is expected to
have an effect on biotic diversification across the Mexican highlands. Highland biotas
were repeatedly fragmented during warm interglacial periods as pine-oak woodlands
retracted to higher, cooler elevations (McDonald, 1993; Metcalfe et al., 2000; Gugger et
al., 2011). Diversification in several highland taxa appears linked to Pleistocene climate
change (León-Panigua et al., 2007; Ruiz et al., 2010; Bryson et al., in press). The signal
of Pleistocene divergence is likely to be particularly evident as amplitude and duration of
glacial cycles increased during the mid-Pleistocene pluvial–interpluvial period beginning
0.9 Ma (Webb and Bartlein, 1992; Hewitt, 2000). Globally, these glacial processes
impacted diversification in a number of organisms (Hewitt, 1996, 2000).
31
Bunchgrass lizards in the Sceloporus scalaris group provide an attractive study
system to test influences of Neogene vicariance and Pleistocene climate change on the
timing and tempo of lineage diversification across the Mexican highlands. Members of
the S. scalaris group are widely distributed across montane grasslands associated with
mixed pine-oak forests along the Sierra Madre Occidental, Sierra Madre Oriental, and
TVB (Smith et al., 1993; Smith et al., 1996; Watkins-Colwell et al., 2006; Figs. 2–3).
They occur on all sides of the TVB, so a diversification hypothesis invoking the uplift of
this range can be tested. The S. scalaris group includes six monotypic species, S. slevini,
S. samcolemani, S. chaneyi, S. goldmani, and S. bicanthalis, and two polytypic species, S.
scalaris (S. s. scalaris, S. s. unicanthalis, S. s. brownorum) and S. aeneus (S. a. aeneus, S.
a. subniger) (Smith et al. 1993; Watkins-Colwell et al., 2006).
In this study, I investigated the relative roles of Neogene vicariance and
Quaternary climate change on lineage diversification in the S. scalaris group. I combined
extensive range-wide sampling and mixed-model phylogenetic analyses of mitochondrial
DNA (mtDNA) to formulate a robust hypothesis of matrilineal relationships. Concerns
regarding the use of mtDNA gene estimates in analyses have been raised (e.g., Edwards
and Bensch, 2009), yet this marker appears useful for detecting recent geographic
patterns (Moore, 1995; Hudson and Coyne, 2002; Zink and Barrowclough, 2008;
Barrowclough and Zink, 2009) and can lead to significant biogeographic discoveries
(e.g., Upton and Murphy, 1997; Riddle et al., 2000a). Molecular dating using mtDNA
gene trees is also of concern since gene trees may overestimate divergence times
(Jennings and Edwards, 2005; Burbrink and Pyron, 2011; Kubatko et al., 2011).
However, overestimation may become less of an issue at deeper time scales (Edwards
32

and Beerli, 2000), and some gene splits may better reflect the history of initial
divergences (McCormack et al., 2008). To provide a temporal component to my
matrilineal phylogeny of the S. scalaris group, I estimated dates of lineage divergences
based on a relaxed molecular clock. I then tested the hypothesis of a diversification rate
shift in response to a period of TVB uplifting 3–7.5 Ma against the null hypothesis of no
diversification rate shift. I also investigated the impact of mid-Pleistocene climate
oscillations on diversification within the S. scalaris group. Results provided insight into
the emerging evolution of Mexican highland biota and the impacts of Neogene vicariance
and climate change on lineage diversification.
Methods
Taxon sampling and laboratory methods
I obtained tissues from 72 S. scalaris group species (Table 2) from across their
distributions (Figs. 2–3). Taxonomic designations were made on the basis of male
coloration, parity mode, and distribution maps (Smith et al., 1993; Smith et al., 1996;
Watkins-Colwell et al., 2006). Sceloporus a. aeneus and S. a. subniger have recently
been considered subspecies (Smith et al., 1993), full species (i.e., S. aeneus and S.
subniger) (Wiens and Reeder, 1997; Wiens et al., 2010), or a single species (S. aeneus)
(Benabib et al., 1997). I conservatively treated each as subspecies. I sampled three known
localities of S. goldmani in Coahuila (Lemos-Espinal and Smith, 2007), but failed to find
this species. At two localities (Sierra La Concordia and west of San Antonio de las
Alazanas), I found only S. samcolemani. The third site near Goméz Farías was severely
33
degraded desert grassland, and no S. scalaris group lizards were seen. Sceloporus
goldmani may be extinct at lower elevations (Sinervo et al., 2010). I also failed to find S.
a. subniger in northwestern Guanajuato. It has been suggested that this species has been
locally extirpated in this region (Mendoza-Quijano et al., 2001). I added partial gene
sequences for 3 samples from GenBank to fill in sampling gaps (Table 2). I used S.
graciosus and S. undulatus as outgroups based on previous phylogenetic studies (Wiens
and Reeder, 1997; Wiens et al., 2010).
I sequenced two mtDNA gene regions, including NADH dehydrogenase subunit 4
and flanking tRNAs (ND4) and ATPase subunits 8 and 6 (ATPase 8, ATPase 6). These
gene regions have been previously shown to be informative at different levels of
divergence within lizards (Leaché and Mulcahy, 2007; Lindell et al., 2008). Total
genomic DNA was extracted from liver or tail clips using the QIAGEN DNeasy Blood
and Tissue Kit (Qiagen, Valencia, CA) following manufacturer’s recommendations. All
gene regions were amplified via PCR in a mix containing 6.25 µl Takara ExTaq
Polymerase Premix (Takara Mirus Bio Inc., Madison, WI, USA), 4.25 µl double-distilled
water, 0.5 µl each primer (10 µl), and 1.0 µl of template DNA. Primer sequences for ND4
are given in Arévalo et al. (1994), and for ATPase were specifically designed for this
project (C2LF, 5’– ATCTGCGGGTCAAACCACAG–3’; C3LR, 5’–
GCGTGTGYTTGGTGGGTCAT–3’). DNA was denatured initially at 95 °C for 2.5 min;
35–40 cycles of amplification were then performed under the following conditions:
denaturation at 95 °C for 1 min, annealing at 56 °C for 1 min, and extension at 72 °C for
1 min; this was followed by a final 10 min elongation at 72 °C. Double-stranded PCR
amplified products were checked by electrophoresis on a 1% agarose gel, purified using
34
exonuclease and shrimp phosphatase, and directly sequenced in both directions with the
amplification primers using a Big Dye Terminator v. 3.1 cycle sequencing kit (Applied
Biosystems, Foster City, CA, USA). The completed sequencing reactions were cleaned of
excess dyes using CentriSep spin columns (Princeton Separations, Inc., Adelphia, NJ),
and sequences were visualized on an ABI Prism 3130 capillary autosequencer. Forward
and reverse sequences for each individual were edited and manually aligned using
Sequencher 4.2 (Gene Codes Corporation, Ann Arbor, MI).
Phylogenetic analyses
I analyzed my sequence data using Bayesian inference (BI) and maximum
likelihood (ML) phylogenetic methods. Bayesian inference analyses were conducted
using MrBayes 3.1 (Ronquist and Huelsenbeck, 2003) on the combined mtDNA dataset,
implementing separate models for each gene region (ND4, tRNAs, ATPase 8, ATPase 6).
For the three GenBank samples (Table 2), only available ND4 and associated tRNAs
sequence data were included in analyses. MrModeltest 2.1 (Nylander, 2004) was used to
select a best-fit model of evolution, based on Akaike Information Criteria (AIC), for each
partition. Bayesian settings included random starting trees, a variable rate prior, a mean
branch length exponential prior of 100, and heating temperature of 0.04. Analyses
consisted of four runs (nruns=4) conducted each with three heated and one cold Markov
chain sampling every 100 generations for 4 million generations. Output parameters were
visualized using the program TRACER v1.4 (Rambaut and Drummond, 2007) to
ascertain stationarity and whether the duplicated runs had converged on the same mean
likelihood. Convergence was further assessed using AWTY (Nylander et al., 2008). After
determining chain convergence, which occurred during the first 500,000 generations of
35
each run, I conservatively discarded all samples obtained during the first one million
(25%) generations as burn-in. A 50% majority-rule consensus phylogram with nodal
posterior probability support was estimated from the combination of the four runs post-
burn-in. Maximum likelihood analyses were conducted using RAXML 7.0.3 (Stamatakis,
2006) with the same partitioning scheme used for the BI analyses. The GTRGAMMA
model was used, and 1000 nonparametric bootstrap replicates were performed to assess
nodal support. I considered those nodes with ≥ 95% Bayesian posterior probability and ≥
70% bootstrap support as strongly supported (Hillis and Bull, 1993; Felsenstein, 2004).
Divergence dating
Divergence dates were estimated using a Bayesian molecular clock framework
implemented in the program BEAST v1.6.1 (Drummond and Rambaut, 2007). Two
different methods for estimating divergence times were used. Divergence estimates were
inferred for a reduced dataset, which included one individual from each geographically
structured lineage. The first method utilized a relaxed uncorrelated lognormal clock and
node constraints obtained from the fossil record. To calibrate the tree, I included
sequences from several outgroups (Table 3). The second method employed a substitution
rate calibration and relaxed uncorrelated lognormal clock. I used a mtDNA rate
calibration previously calculated from a similar sized lizard (Macey et al., 1999). This
substitution rate, here corrected to 8.05 x 10⁻³ substitutions/site/million year using a more
complex GTR + G model, has been used in a number of studies to date divergences in
lizards (e.g., Morando et al., 2004; Tennesson and Zamudio, 2008; Luxbacher and
Knouft, 2009). For both datasets, best-fit models of evolution were re-estimated using
MrModeltest, and unlinked across partitions.
36
For each method, analyses consisted of two independent runs each of 40 million
generations, with samples retained every 1000 generations, and with a Yule tree prior.
Results were displayed in TRACER to confirm acceptable mixing and likelihood
stationarity, appropriate burn-in, and adequate effective sample sizes. After discarding
the first 4 million generations (10%) as burn-in, the trees and parameter estimates from
the two runs were combined using LogCombiner v1.6.1 (Drummond and Rambaut,
2007). The parameter values of the samples from the posterior distribution were
summarized on the maximum clade credibility tree using TreeAnnotator v1.6.1
(Drummond and Rambaut, 2007), with the posterior probability limit set to zero and
mean node heights summarized.
For calibrated analyses, three fossil constraints taken from the paleoherpetological
literature were used: (1) the oldest known fossils referable to Sceloporus from the Early
Miocene (Arikareean North American Land Mammal Age (NALMA); Robinson and Van
Devender, 1973; Yatkola, 1976; Holman, 1970, 1995), (2) the oldest known fossils
referable to S. jarrovii from the Middle Miocene (Hemingfordian NALMA; Yatkola,
1976; Estes, 1983), and (3) the oldest known fossil of S. undulatus from the Pliocene
(Blancan NALMA; Rogers, 1976; Estes, 1983). The stem of Sceloporus was constrained
with a zero offset (hard upper bound) of 20 Ma, a lognormal mean of 0.7, and a
lognormal standard deviation of 1.0. This produced a median age of 22 Ma and a 95%
prior credible interval (PCI) extending to the end of the Arikareean 30 Ma. The stem of
the S. jarrovii clade (Table 3) was constrained with a zero offset of 16 Ma representing
the end of the Hemingfordian, a lognormal mean of 0.7, and a lognormal standard
deviation of 0.5. This produced a median age of 18 Ma and a 95% PCI extending to the
37
end of the Hemingfordian 20 Ma. The node representing the most recent common
ancestor (MRCA) of the S. undulatus clade (Table 3) was constrained with a zero offset
of 1.8 Ma (the end of the Blancan), a lognormal mean of 0.1, and a lognormal standard
deviation of 0.65. This produced a median age of 3 Ma and a 95% prior credible interval
(PCI) extending to the end of the Blancan 5 Ma. These lognormal distributions with hard
lower bounds best reflect the prediction, based on the high likelihood of fossil non-
preservation, that any true divergence date will probably be older than the oldest known
fossil, rather than younger (Ho and Phillips, 2009; Kelly et al., 2009).
Tests of differential diversification rates
I employed two methodological approaches to test for differential diversification
rates across the S. scalaris group mtDNA phylogeny in response to uplifting of the TVB
and climate oscillations beginning with the mid-Pleistocene shift in duration of glacial –
interglacial cycles. The first method compared inferred topological distribution to a
random distribution to determine if diversification rate shifted across the tree. My second
approach compared the temporal distribution of inferred divergence events to a randomly
created distribution to test when and where shifts in diversification took place along my
phylogeny. If Neogene uplifting of the TVB affected diversification rates in the S.
scalaris group, then diversification rates should shift near the root of the clade or clades
containing TVB species (S. aeneus, S. bicanthalis). If rate shifts are associated with one
of the major volcanic episodes that occurred 3–7.5 Ma, then most divergences should
have happened during this time period. Likewise, if mid-Pleistocene climate change
affected diversification rates, then rates should shift near the tips of the phylogeny during
the start of extreme glacial periods 0.9 Ma.
38
The program SYMMETREE v1.1 (Chan and Moore, 2005) and was used to test the
general hypothesis of variation in diversification rates across the S. scalaris group
mtDNA phylogeny. The batch processing option was applied using the posterior
probability distribution of 1000 post burn-in trees generated from the rate-calibrated
BEAST analyses. Trees from the posterior distribution of my fossil-calibrated BEAST
analyses were not selected since I lacked complete sampling of the entire Sceloporus
species tree (Wiens et al., 2010), which could bias results (Moore and Chan, 2007).
Removing the outgroups would require manually pruning 1000 post burn-in trees. I used
a taxon-size sensitive (TSS) equal-rates Markov (ERM) branching model to resolve
polytomies. Equal-rates Markov models assume that each terminal in an expanding tree
has an equal and independent probability of splitting and uses a random taxon-addition
approach to resolve polytomies. The number of random resolutions was set to 10 000
whole trees. To calculate P-values for the tree statistics implemented in SYMMETREE, I
generated a null distribution of 1 million simulated trees with the same number of species
as the observed trees under the ERM model. Likelihood ratio-based delta statistics were
estimated to locate diversification rate shifts in certain areas of the phylogeny, if present.
SYMMETREE does not provide a batch-summary block for the shift statistics, so P-value
ranges were visually inspected in output blocks.
I analyzed temporal shifts in diversification rates using ML-based diversification-
rate analysis (Rabosky, 2006a). Divergence dates estimated from both calibration
methods in BEAST were used. The fit of different birth–death models implementing two
constant rates (pure-birth, and birth–death) and four variable rates (exponential and
logistic density-dependent, and two-rate and three-rate pure-birth) was computed with
39

LASER 2.3 (Rabosky, 2006b). Model fit was measured using AIC scores. Significance of
the change in AIC scores (∆AICrc) between the best rate-constant and best rate-variable
model was determined by creating a null distribution for ∆AICrc. This was done by
simulating 1000 trees using yuleSim in LASER with the same number of nodes and the
same speciation rate as that estimated under the pure-birth model. I additionally
generated a lineage-through-time (LTT) plot using the plotLtt function in LASER to
visualize the pattern of accumulation of log-lineages over time.
Results
Sequence characteristics and phylogenetic estimate
The final dataset consisted of 1698 aligned nucleotide positions. Models of
sequence evolution selected for the partitions were GTR + I + G (ND4, ATPase 8,
ATPase 6), and HKY + I + G (tRNA). All sequences were deposited in GenBank.
Within the S. scalaris group, I identified two major mtDNA clades that contained
13 strongly supported lineages (Figs. 5–6). One clade contained samples from the two
major sierras of northern Mexico ('northern clade'). Samples geographically proximate to
the TVB grouped together with samples from the Central Mexican Plateau in a 'southern
clade'. Four lineages within these clades corresponded to the species S. chaneyi, S.
samcolemani, S. slevini, and S. bicanthalis. Three lineages represented the subspecies S.
s. scalaris, S. s. unicanthalis, and S. s. brownorum. The species S. aeneus appeared to be
a composite of four distinct lineages, none of which uniquely encompassed the two
subspecies S. a. aeneus and S. a. subniger. These four lineages were geographically
40
structured, and labeled 'aeneus West', 'aeneus Central', 'aeneus East', and 'aeneus South'.
Two lineages represented undescribed taxa, one previously assigned to S. s. brownorum
from Aguascalientes (Smith et al., 1997), and one previously considered S. s. scalaris
from Tapalpa, Jalisco (Watkins-Colwell et al., 1996). Additional geographic structure
was present within S. slevini, S. samcolemani, and S. bicanthalis (Fig. 4).
Relationships among lineages within the southern clade were in general difficult
to infer. Collapsing the weakly supported S. bicanthalis + aeneus West sister relationship
formed a large basal polytomy of four lineages and two smaller clades (aeneus South +
aeneus Central / S. s. scalaris, and Aguascalientes + S. s. unicanthalis). In the northern
clade, the two Sierra Madre Oriental lineages S. chaneyi and S. samcolemani were sister,
and the two Sierra Madre Occidental lineages S. slevini and S. s. brownorum were sister.
Together these two mountains formed a strongly supported sister relationship.
Divergence dating
The selected models of sequence evolution for the fossil-calibrated and rate-
calibrated datasets in the BEAST analyses were GTR + I + G (ND4, ATP8, ATP6), HKY
+ I + G (tRNA, fossil-calibrated), and HKY + I (tRNA, rate-calibrated). Estimated dates
of divergences using both methods of clock calibration differed (Fig. 6). Based on the
fossil-calibrated analyses, mean substitution rate within the S. scalaris group more
closely approached 1.2 x 10⁻² substitutions/site/million year (2.4% between lineages per
million years), which is much faster than the rate I used for rate-calibrated analyses
(1.61% between lineages per million years). Additionally, the branching order in each
maximum clade credibility tree (Fig. 6) differed as a result of rearrangements of several
weakly supported nodes. Despite these differences, the majority of divergences estimated
41
by both methods appear to predate the pluvial-interpluvial period of the mid-Pleistocene
(Fig. 6). In the southern clade, mean divergence dates fell largely within an episode of
TVB volcanism 3–7.5 Ma.
Tests of differential diversification rates
Results from batch analyses in SYMMETREE indicate no significant variation in
diversification rate in the S. scalaris group topology. Examination of delta statistics for
individual trees, however, reveal numerous significant (P=0.05) diversification rate shifts
along the branch leading to the southern clade of the S. scalaris group. This clade
contains all lineages associated with the TVB.
Birth–death likelihood analyses rejected the null hypothesis of rate-constancy for
both datasets (P=0.001 fossil-calibrated, P=0.005 rate-calibrated). The rate-variable
model that best fit each dataset differed (Table 4). For the fossil-calibrated dataset, the
logistic density-dependent (DDL) model provided a better fit. Under this model,
diversification rate in the S. scalaris group has gradually decreased through time, with
diversification rate estimated at 0.73 divergences per million years. The three-rate birth-
death (Yule3) model provided the best fit to the rate-calibrated dataset. According to the
scenario suggested by this model (Fig. 6), net diversification rate in the S. scalaris group
increased dramatically at 6.8 Ma from 0.1 to 0.42 divergences per million years, then
decreased at 4 Ma to 0.03. These shifts correspond well with predicted diversification
rate changes associated with uplifting of the TVB 3–7.5 Ma.
It is worth noting that alternative rate-variable models may also be a good fit to
the data (Table 4). For the fossil-calibrated dataset, the best-fit DDL model differs in AIC
from the next best-fit rate-variable model, Yule3, by a value of only 0.98. Here, net
42

diversification rate increased at about 5.5 Ma and decreased at 2.8 Ma (Fig. 6). Much of
this period falls within the predicted range of TVB uplifting. Diversification rate was
initially 0.08 divergences per million years, increased to 0.5, then declined to 0.04. For
the rate-calibrated dataset, a Yule2 rate-variable model differs in AIC score from the
best-fit Yule3 model by 0.65. This Yule2 model predicts a single decrease in
diversification rate at 4 Ma (Fig. 6), from an initial rate of 0.28 divergences per million
years to 0.03.
Discussion
The Transvolcanic Belt as an emerging driver of lineage diversification
Neogene vicariance appears to be the primary driver of lineage diversification in
the S. scalaris group. Divergences were temporally and geographically congruent with
distinct periods of uplift across the TVB. The earliest divergence between the northern
and southern clades around the Middle to Late Miocene (Fig. 6) coincide with the first
major TVB volcanic episode 10–19 Ma (Gómez-Tuena et al., 2007). Diversification rate
appears to have then shifted around 4–7 Ma. This time period is largely coincidental with
a second marked period of volcanism along the TVB 3–7.5 Ma (Rosas-Elguera et al.,
2003; Gómez-Tuena et al., 2007; Fig. 1). Diversification rate changes may have been
driven by rapid divergences between lineages along the TVB, as indicated by my
topological analyses.
Accumulating evidence posits uplifting of the TVB as an emergent and testable
driver of diversification in highland taxa. Despite the complex nature of orogenesis
43
(Ferrusquía-Villafranca, 1993; Gómez-Tuena et al., 2007), most mean lineage divergence
dates in the S. scalaris group and co-distributed taxa associated with the TVB fall within
4–7 Ma. Exceptions among lowland taxa at the western edge of the TVB that split around
8–16 Ma (Mateos et al., 2002), 9.6 Ma (Devitt, 2006), and 13 Ma (Bryson et al., 2010)
paired with my estimated basal split in the S. scalaris group during this same time frame
suggest the initial volcanic episode across the TVB approximately 10–19 Ma may also be
an important driver of lineage diversification. Future studies of highland Mexican taxa
with distributions spanning the TVB should test for a causative link between
diversification and uplift of the TVB. Two main episodes of volcanic uplift, in particular
one that occurred about 3–7.5 Ma, appear to have strong roles in driving lineage
diversification across the TVB.
Neogene diversification in northern Mexico
While diversification in the S. scalaris group was centered around the TVB,
several other Neogene divergences appeared to have occurred in northern Mexico. Most
notable is an inferred Middle to Late Miocene divergence between Sierra Madre
Occidental and Sierra Madre Oriental lineages (Fig. 6). While a close biotic relationship
has been inferred between these two mountain ranges (Marshall and Liebherr, 2000), my
estimated dates of divergence far predate the Pleistocene when the highland biota of the
Sierra Madre Occidental and Sierra Madre Oriental were probably connected by a
continuous corridor of montane vegetation (Gugger et al., 2010; Bryson et al., in press).
Rather, my estimated divergence dates more closely approximate inferred Neogene splits
in other taxa (Mexican jays, McCormack et al., 2008, 2011; alligator lizards, Zaldivar-
Riverón et al., 2005).
44

Several geographically structured maternal groups are embedded within the Sierra
Madre Occidental and northern Sierra Madre Oriental (Fig. 5). Interestingly, several co-
distributed highland species show similar fine-scale geographic subdivisions within these
mountain ranges (Gugger et al., 2010; Bryson et al., 2011a; Bryson et al., in review).
However, estimated dates of divergences between embedded lineages in these studies
vary, and range from Miocene to Pleistocene. This suggests that deep canyons that bisect
these mountains and low elevation xeric habitats (Fig. 3) may be acting as overlooked
filter barriers that promote diversification through time (Wiens, 2004).
Quaternary impacts on lineage diversification
Quaternary climate change appears to have had little effect on lineage
diversification in the S. scalaris group. Nearly all divergences within the group predate
the major pluvial-interpluvial cycles beginning around 0.9 Ma in the mid-Pleistocene
(Fig. 6). Depending on the method of molecular clock calibration I used, few mean
estimated divergences fell within the Pleistocene (Fig. 6). This finding suggests most
lineages in the S. scalaris group might be the products of pre-Quaternary fragmentation.
Diversification may have occurred in concert with Neogene orogeny and the expansion of
C4 grasslands (Neiswenter and Riddle, 2010), and Pleistocene connectivity of previously
fragmented highland biotas (Gugger et al., 2010; Bryson et al., in press) did not erase
Neogene genetic footprints. The S. scalaris group may thus be unique among similar co-
distributed highland taxa with widespread distributions in Mexico that show varying
degrees of Pleistocene diversification (Zaldivar-Riverón et al., 2005; Moreno-Letelier
and Pinero, 2009; Gugger et al., 2010; Bryson et al., 2011a; Bryson et al., 2011b;
McCormack et al., 2011; Bryson et al., in press).
45
Recent studies (Burbrink and Pyron, 2011; Kubatko et al., 2011; McCormack et
al., 2011) have provided evidence that divergence times can be significantly
overestimated using gene-tree based approaches such as ours that do not correct for
genetic divergences that predate speciation. Multilocus species-tree approaches that
incorporate coalescent stochasticity generally estimate more recent times of divergences.
If this is true, then many of the relatively ancient inferred divergences in the S. scalaris
group may actually be much younger, placing more divergences within the Pleistocene.
However, mtDNA might better reflect the history of initial divergence, especially if
nuclear gene flow across lineage boundaries erases or obscures nuclear gene divergences
(McCormack et al., 2011). Future studies should incorporate multilocus data and
coalescent species-tree models to re-evaluate my divergence estimates. Comparisons of
divergence dates in co-distributed taxa across shared biogeographic barriers should then
be made based on species tree estimates rather than gene tree estimates.
Conclusions
The S. scalaris group has proven useful for studying the impacts of Neogene
vicariance and Quaternary climate change on diversification in a wide-ranging highland
organism. My results have broad implications for understanding impacts of shared
historical events on co-distributed species. Uplift of the Transvolcanic Belt is an
emergent and testable driver of lineage diversification. At least one episode of
widespread volcanism in the Late Miocene and Pliocene heavily impacted highland taxa.
Extreme climatic oscillations in the Pleistocene, a key driver of lineage diversification in
some taxa (León-Paniagua et al., 2007; Ruiz et al., 2010; Bryson et al., in press), did not
substantially affect diversification rates in all Mexican highland species.
46

The Mexican highlands are considered one of the world's great biodiversity
hotspots (Mittermeier et al., 2005), yet our understanding of the evolutionary drivers
generating this diversity remains fragmentary (McCormack et al., 2008; Bryson et al.,
2011a). Diversification in the S. scalaris group is a good example of how the complex
dynamics between past geological and climatic events work together to shape
biodiversity. The addition of future studies linking genetic diversity of Mexican highland
taxa with their paleohistories will provide further insight into the historical processes
responsible for diversification in this complex system.
47

Table 3.1. Mean estimated divergence dates in several taxa distributed across the
Transvolcanic Belt. Posterior mean ages followed by 95% confidence or highest posterior
density intervals in parentheses, provided in millions of years ago. Dates were estimated
from mitochondrial gene trees, so for consistency, I did not include slightly younger re-
estimates of divergence times in Mexican jays based on a species-tree approach
(McCormack et al., 2011).
Taxon Estimated divergence dates (Ma)
Source
Canyon treefrog (Hyla arenicolor) 13.5 (6.2–21.7) Bryson et al., 2010
Western lyresnakes (Trimorphodon biscutatus)
9.6 (7.2–13.1) Devitt, 2006
Topminnows (Poeciliopsis subgenus) 8–16 Mateos et al., 2002
Heroine cichlids (Herichthys + multiple other species)
6.7 (4.7–8.7) Hulsey et al., 2004
Middle American gophersnakes (Pituophis)
6.7 (5–8.6) Bryson et al., 2011b
Dusky rattlesnakes (Crotalus triseriatus group)
6.3 (5–7.9), 5.4 (4.3–6.8), 4.9 (3.8–6.1)
Bryson et al., 2011a
Mexican jays (Aphelocoma ultramarina)
5.6 (4.4–9.4) McCormack et al., 2008
Gulf Coast toads (Ollotis valliceps species group)
5.4 (4.2–7.6) Mulcahy and Mendelson, 2000
Small-headed rattlesnakes (Crotalus intermedius group)
5.2 (3.7–6.9) Bryson et al., in press
Topminnows (Poeciliopsis subclades) 5.1 (4.4–5.8), 3.8 (3.3–4.5)
Mateos, 2005
Molly (Poecilia butleri) 4.4 (2.44–6.36) Mateos, 2005
48
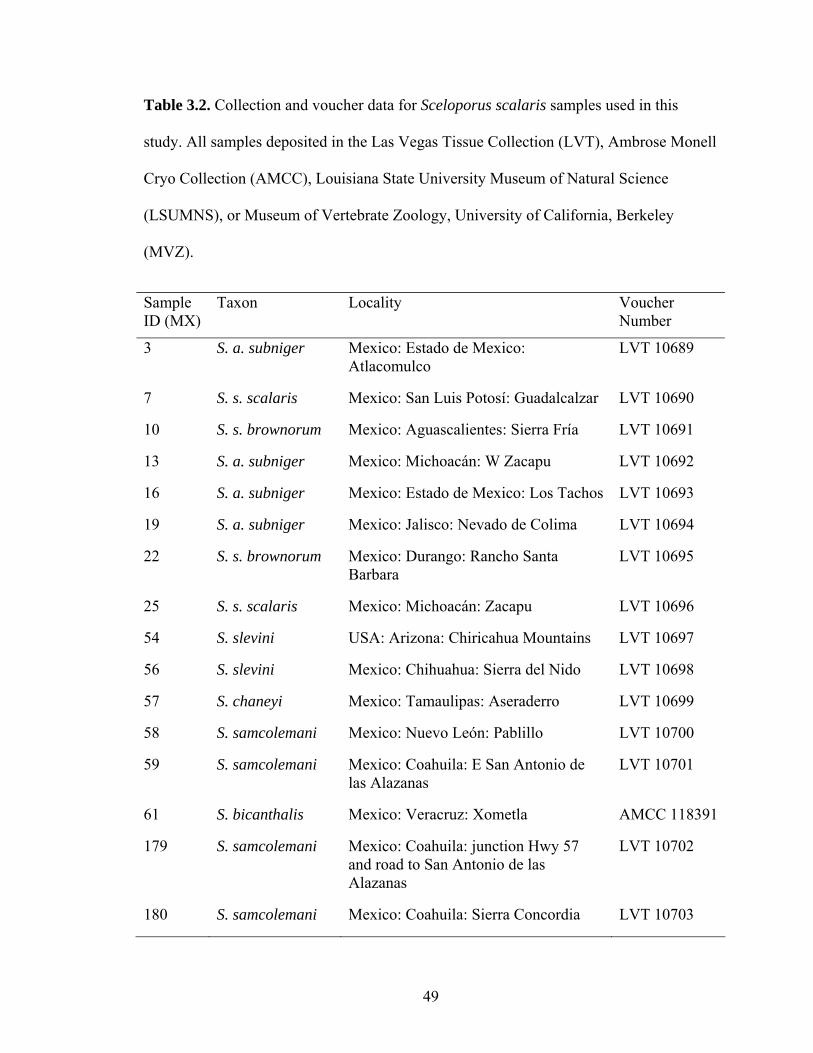
Table 3.2. Collection and voucher data for Sceloporus scalaris samples used in this
study. All samples deposited in the Las Vegas Tissue Collection (LVT), Ambrose Monell
Cryo Collection (AMCC), Louisiana State University Museum of Natural Science
(LSUMNS), or Museum of Vertebrate Zoology, University of California, Berkeley
(MVZ).
Sample ID (MX)
Taxon Locality Voucher Number
3 S. a. subniger Mexico: Estado de Mexico: Atlacomulco
LVT 10689
7 S. s. scalaris Mexico: San Luis Potosí: Guadalcalzar LVT 10690
10 S. s. brownorum Mexico: Aguascalientes: Sierra Fría LVT 10691
13 S. a. subniger Mexico: Michoacán: W Zacapu LVT 10692
16 S. a. subniger Mexico: Estado de Mexico: Los Tachos LVT 10693
19 S. a. subniger Mexico: Jalisco: Nevado de Colima LVT 10694
22 S. s. brownorum Mexico: Durango: Rancho Santa Barbara
LVT 10695
25 S. s. scalaris Mexico: Michoacán: Zacapu LVT 10696
54 S. slevini USA: Arizona: Chiricahua Mountains LVT 10697
56 S. slevini Mexico: Chihuahua: Sierra del Nido LVT 10698
57 S. chaneyi Mexico: Tamaulipas: Aseraderro LVT 10699
58 S. samcolemani Mexico: Nuevo León: Pablillo LVT 10700
59 S. samcolemani Mexico: Coahuila: E San Antonio de las Alazanas
LVT 10701
61 S. bicanthalis Mexico: Veracruz: Xometla AMCC 118391
179 S. samcolemani Mexico: Coahuila: junction Hwy 57 and road to San Antonio de las Alazanas
LVT 10702
180 S. samcolemani Mexico: Coahuila: Sierra Concordia LVT 10703
49
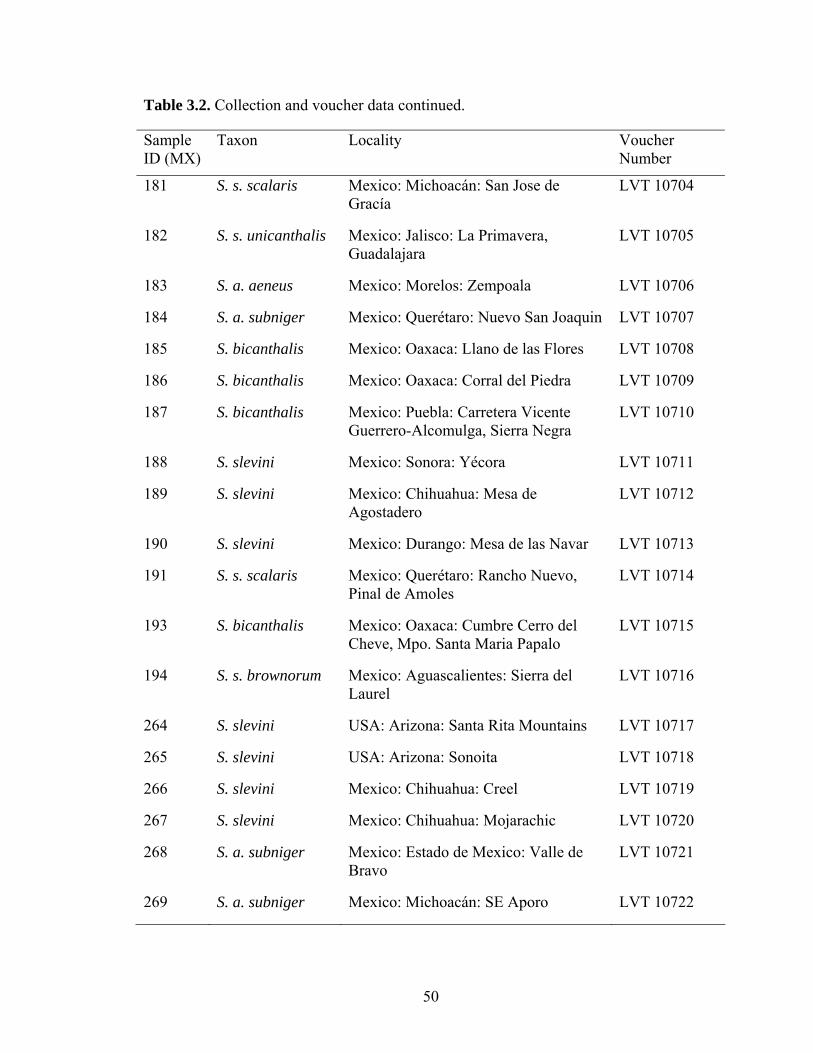
Table 3.2. Collection and voucher data continued.
Sample ID (MX)
Taxon Locality Voucher Number
181 S. s. scalaris Mexico: Michoacán: San Jose de Gracía
LVT 10704
182 S. s. unicanthalis Mexico: Jalisco: La Primavera, Guadalajara
LVT 10705
183 S. a. aeneus Mexico: Morelos: Zempoala LVT 10706
184 S. a. subniger Mexico: Querétaro: Nuevo San Joaquin LVT 10707
185 S. bicanthalis Mexico: Oaxaca: Llano de las Flores LVT 10708
186 S. bicanthalis Mexico: Oaxaca: Corral del Piedra LVT 10709
187 S. bicanthalis Mexico: Puebla: Carretera Vicente Guerrero-Alcomulga, Sierra Negra
LVT 10710
188 S. slevini Mexico: Sonora: Yécora LVT 10711
189 S. slevini Mexico: Chihuahua: Mesa de Agostadero
LVT 10712
190 S. slevini Mexico: Durango: Mesa de las Navar LVT 10713
191 S. s. scalaris Mexico: Querétaro: Rancho Nuevo, Pinal de Amoles
LVT 10714
193 S. bicanthalis Mexico: Oaxaca: Cumbre Cerro del Cheve, Mpo. Santa Maria Papalo
LVT 10715
194 S. s. brownorum Mexico: Aguascalientes: Sierra del Laurel
LVT 10716
264 S. slevini USA: Arizona: Santa Rita Mountains LVT 10717
265 S. slevini USA: Arizona: Sonoita LVT 10718
266 S. slevini Mexico: Chihuahua: Creel LVT 10719
267 S. slevini Mexico: Chihuahua: Mojarachic LVT 10720
268 S. a. subniger Mexico: Estado de Mexico: Valle de Bravo
LVT 10721
269 S. a. subniger Mexico: Michoacán: SE Aporo LVT 10722
50

Table 3.2. Collection and voucher data continued.
Sample ID (MX)
Taxon Locality Voucher Number
270 S. a. subniger Mexico: Michoacán: Los Azufres LVT 10723
271 S. a. subniger Mexico: Michoacán: Parque Laguna Larga
LVT 10724
272 S. a. subniger Mexico: Michoacán: Mil Cumbres LVT 10725
273 S. s. scalaris Mexico: Jalisco: Tapalpa LVT 10726
274 S. a. subniger Mexico: Michoacán: N Uruapan LVT 10727
275 S. a. subniger Mexico: Michoacán: San Gregario LVT 10728
276 S. a. subniger Mexico: Hidalgo: Palo Gacho LVT 10729
277 S. a. subniger Mexico: Hidalgo: Autodromo del Angel
LVT 10730
278 S. a. subniger Mexico: Querétaro: El Derramadero, Mpo. Toliman
LVT 10731
279 S. a. subniger Mexico: Querétaro: Rancho Los Velázquez, Pinal de Amoles
LVT 10732
280 S. a. subniger Mexico: Estado de Mexico: Villa de Carbon
LVT 10733
281 S. s. brownorum Mexico: Aguascalientes: Sierra del Laurel
LVT 10734
282 S. s. scalaris Mexico: San Luis Potosí: Alvarez LVT 10735
283 S. bicanthalis Mexico: Hidalgo: Tianguistengo LVT 10736
284 S. bicanthalis Mexico: Hidalgo: Calicanto LVT 10737
285 S. bicanthalis Mexico: Veracruz: Las Vigas LVT 10738
286 S. bicanthalis Mexico: Puebla: Volcán Iztaccihuatl LVT 10739
287 S. samcolemani Mexico: Nuevo León: Cerro Potosí MVZ 144153
288 S. samcolemani Mexico: Coahuila: El Taray LVT 10740
51
Table 3.2. Collection and voucher data continued.
Sample ID (MX)
Taxon Locality Voucher Number
289 S. samcolemani Mexico: Coahuila: Sierra Concordia LVT 10741
295 S. s. brownorum Mexico: Durango: Rancho Santa Barbara
LVT 10742
296 S. slevini Mexico: Durango: Mesa de las Navar LVT 10743
297 S. s. scalaris Mexico: Jalisco: Tapalpa LVT 10744
333 S. s. unicanthalis Mexico: Jalisco: Sierra Manantlán LVT 10745
334 S. s. scalaris Mexico: Zacatecas: east side of state LVT 10746
352 S. s. scalaris Mexico: Puebla: Flor de Bosque LVT 10747
392 S. bicanthalis Mexico: Veracruz: Potrero Nuevo, Pico de Orizaba
LVT 10748
393 S. bicanthalis Mexico: Estado de Mexico: Nevado de Toluca
LVT 10749
422 S. s. scalaris Mexico: Querétaro: Rancho Nuevo, Pinal de Amoles
LVT 10750
423 S. a. subniger Mexico: Puebla: Carretera "Pue 108" Jicolapa y Xochicuautla
LVT 10751
441 S. a. subniger Mexico: Edo de Mexico: Chalma LVT 10752
442 S. a. subniger Mexico: Edo de Mexico: Valle de Bravo
LVT 10753
443 S. s. brownorum Mexico: Aguascalientes: Sierra Fría LVT 10754
453 S. s. brownorum Mexico: Durango: Coyotes LVT 10755
454 S. s. brownorum Mexico: Durango: Otinapa LVT 10756
455 S. s. scalaris Mexico: Guanajuato: Sierra Cualtraba LVT 10757
464 S. slevini USA: New Mexico: Cloverdale LVT 10758
52

Table 3.2. Collection and voucher data continued.
Sample ID (MX)
Taxon Locality Voucher Number
--- S. chaneyi Mexico: Nuevo León: 18 km NE San Antonio Peña Nevada
GenBank U88291 (MZFC 05473)
--- S. a. subniger Mexico: Tlaxcala: junction Hwy 136 with rd to Españita
GenBank U88276 (MZFC 05686)
--- S. a. aeneus Mexico: Distrito Federal: El Ajusco Hwy
GenBank U88274 (BYU 45309)
53
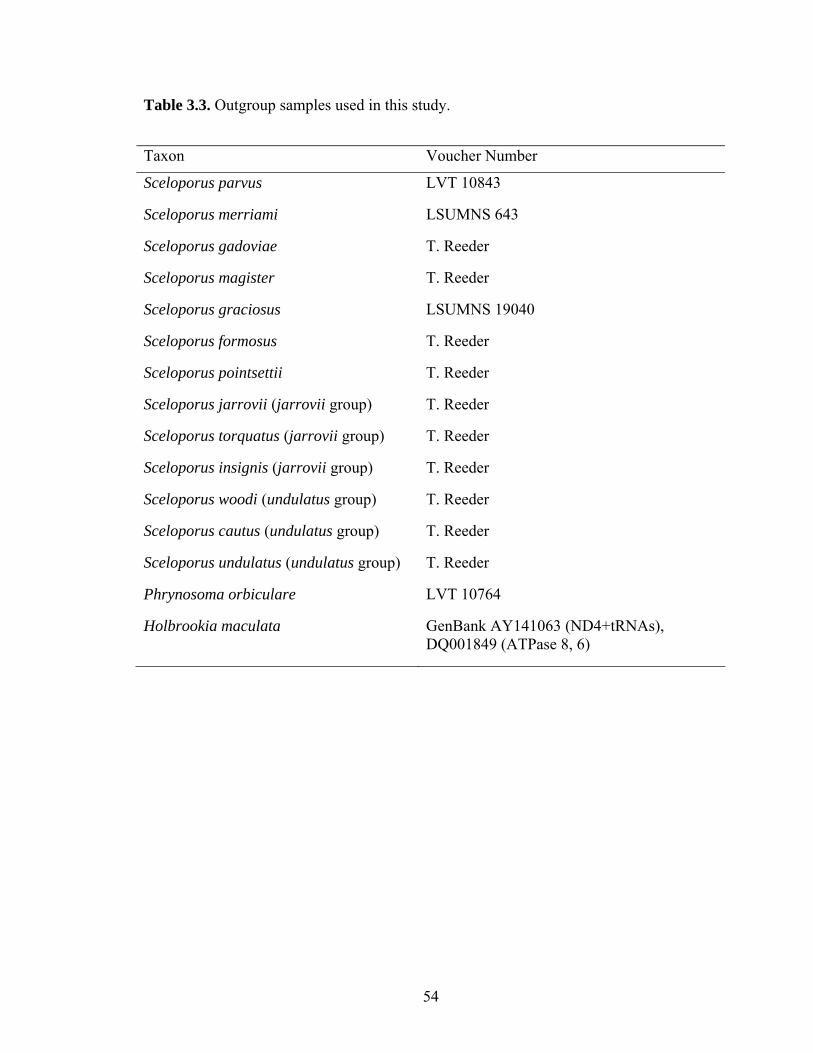
Table 3.3. Outgroup samples used in this study.
Taxon Voucher Number
Sceloporus parvus LVT 10843
Sceloporus merriami LSUMNS 643
Sceloporus gadoviae T. Reeder
Sceloporus magister T. Reeder
Sceloporus graciosus LSUMNS 19040
Sceloporus formosus T. Reeder
Sceloporus pointsettii T. Reeder
Sceloporus jarrovii (jarrovii group) T. Reeder
Sceloporus torquatus (jarrovii group) T. Reeder
Sceloporus insignis (jarrovii group) T. Reeder
Sceloporus woodi (undulatus group) T. Reeder
Sceloporus cautus (undulatus group) T. Reeder
Sceloporus undulatus (undulatus group) T. Reeder
Phrynosoma orbiculare LVT 10764
Holbrookia maculata GenBank AY141063 (ND4+tRNAs), DQ001849 (ATPase 8, 6)
54
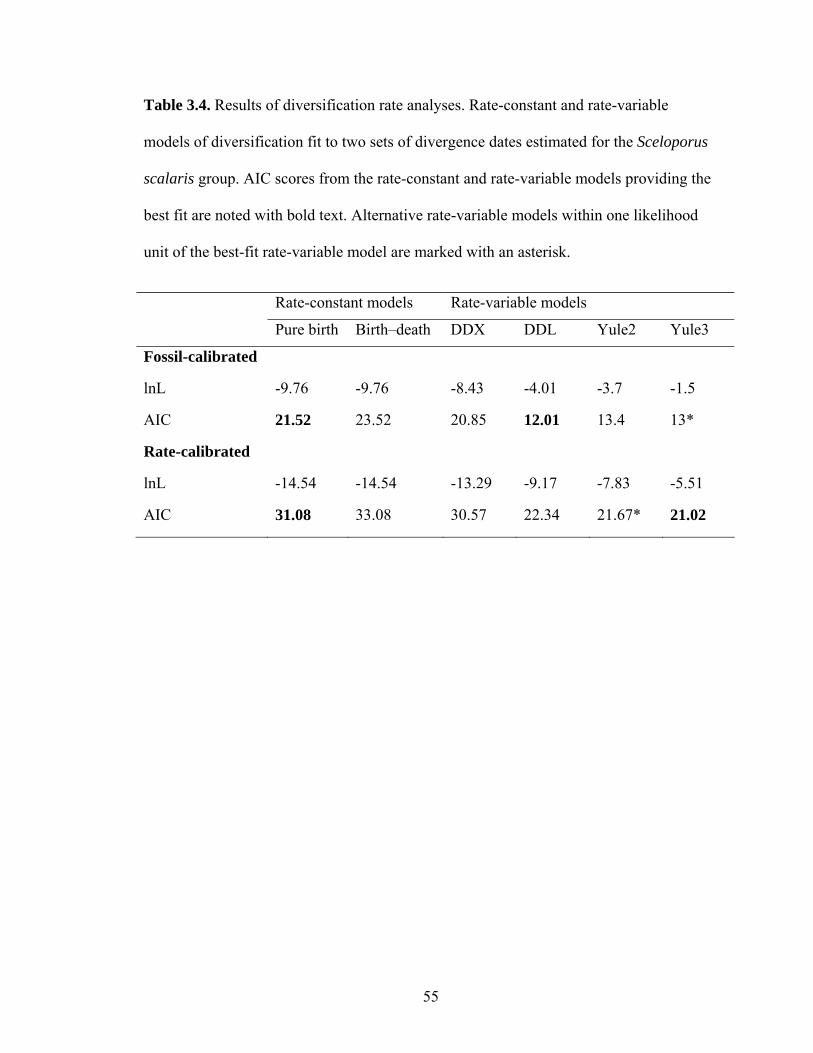
Table 3.4. Results of diversification rate analyses. Rate-constant and rate-variable
models of diversification fit to two sets of divergence dates estimated for the Sceloporus
scalaris group. AIC scores from the rate-constant and rate-variable models providing the
best fit are noted with bold text. Alternative rate-variable models within one likelihood
unit of the best-fit rate-variable model are marked with an asterisk.
Rate-constant models Rate-variable models
Pure birth Birth–death DDX DDL Yule2 Yule3
Fossil-calibrated
lnL -9.76 -9.76 -8.43 -4.01 -3.7 -1.5
AIC 21.52 23.52 20.85 12.01 13.4 13*
Rate-calibrated
lnL -14.54 -14.54 -13.29 -9.17 -7.83 -5.51
AIC 31.08 33.08 30.57 22.34 21.67* 21.02
55
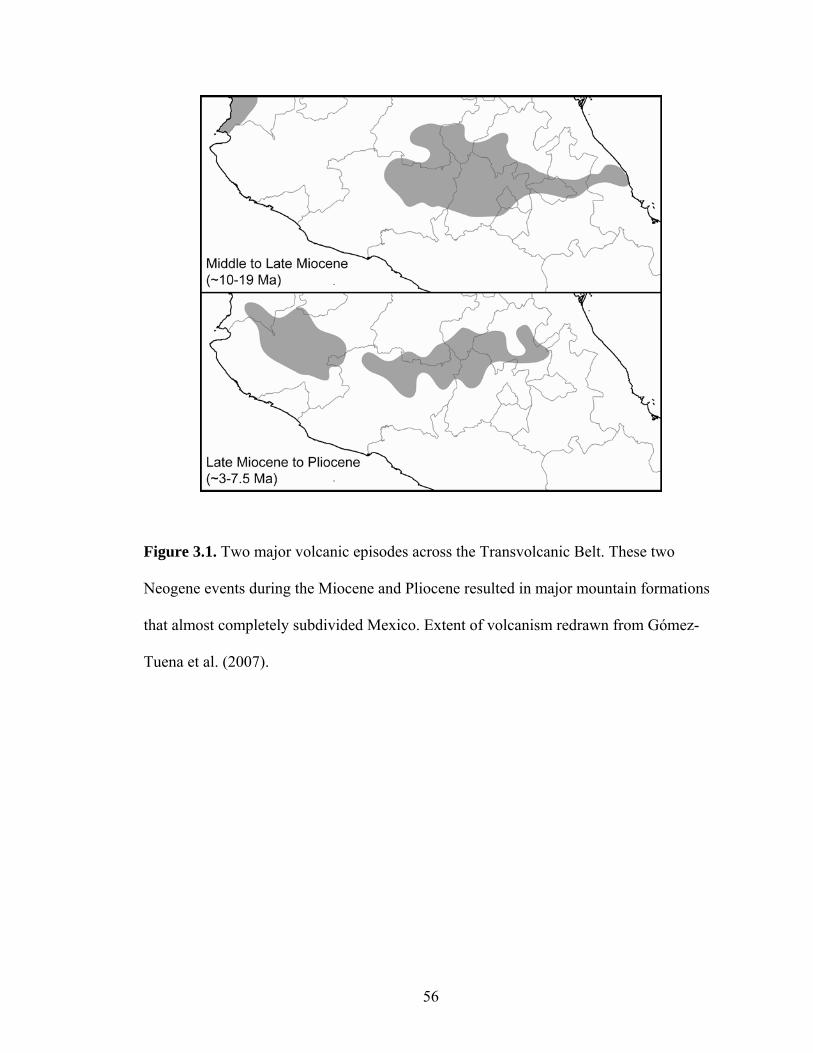
Figure 3.1. Two major volcanic episodes across the Transvolcanic Belt. These two
Neogene events during the Miocene and Pliocene resulted in major mountain formations
that almost completely subdivided Mexico. Extent of volcanism redrawn from Gómez-
Tuena et al. (2007).
56
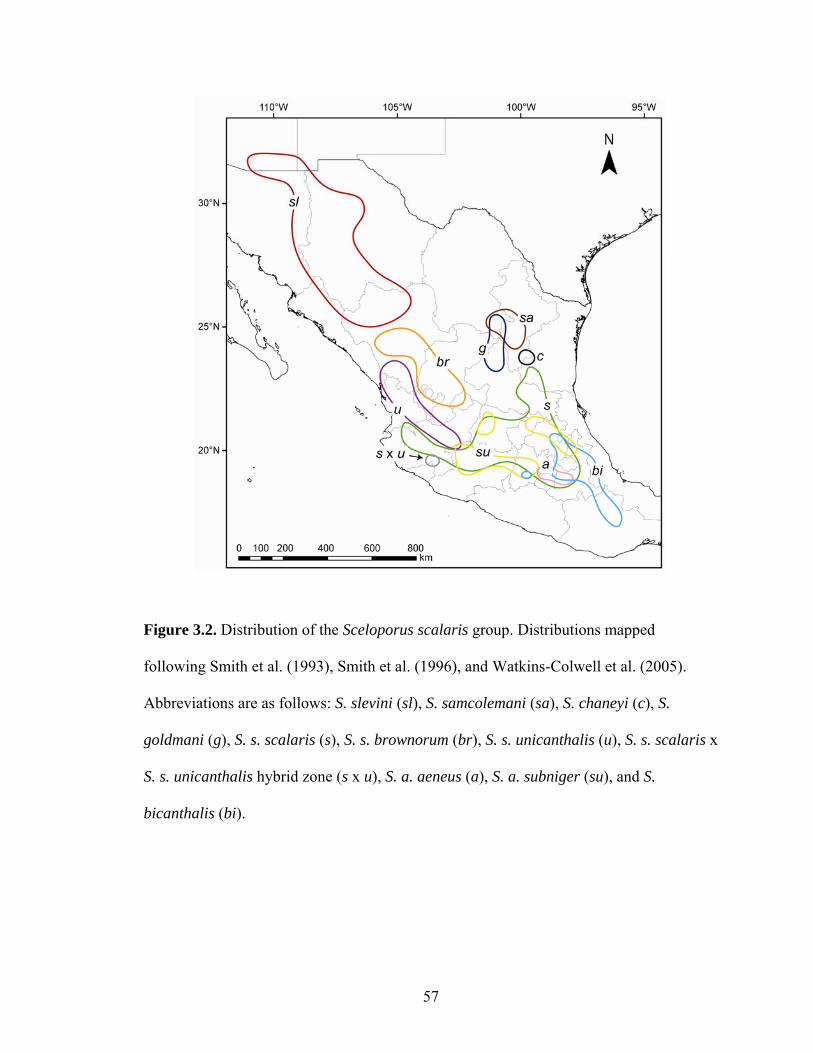
Figure 3.2. Distribution of the Sceloporus scalaris group. Distributions mapped
following Smith et al. (1993), Smith et al. (1996), and Watkins-Colwell et al. (2005).
Abbreviations are as follows: S. slevini (sl), S. samcolemani (sa), S. chaneyi (c), S.
goldmani (g), S. s. scalaris (s), S. s. brownorum (br), S. s. unicanthalis (u), S. s. scalaris x
S. s. unicanthalis hybrid zone (s x u), S. a. aeneus (a), S. a. subniger (su), and S.
bicanthalis (bi).
57
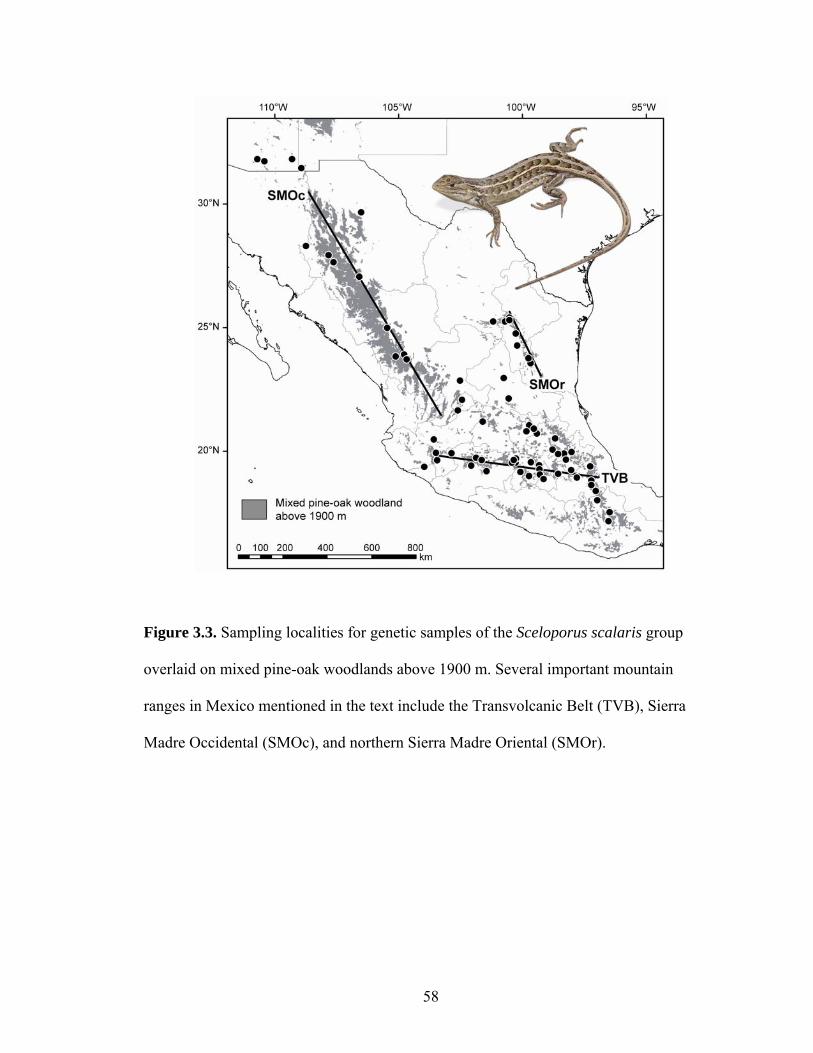
Figure 3.3. Sampling localities for genetic samples of the Sceloporus scalaris group
overlaid on mixed pine-oak woodlands above 1900 m. Several important mountain
ranges in Mexico mentioned in the text include the Transvolcanic Belt (TVB), Sierra
Madre Occidental (SMOc), and northern Sierra Madre Oriental (SMOr).
58

Figure 3.4. Maternal genealogy of the Sceloporus scalaris group based on mixed-model
Bayesian inference (tree shown) and maximum likelihood analyses of mitochondrial
DNA sequence data. Names of two major clades and 13 inferred lineages are indicated.
Additional geographic groups nested within lineages are marked with thin black vertical
lines. Numbers at nodes indicate support values (Bayesian posterior probability followed
by maximum likelihood bootstrap). All major nodes that received ≥ 95% Bayesian
posterior probability and ≥ 70% bootstrap support are depicted with black dots. Asterisks
denote samples used in divergence dating.
59
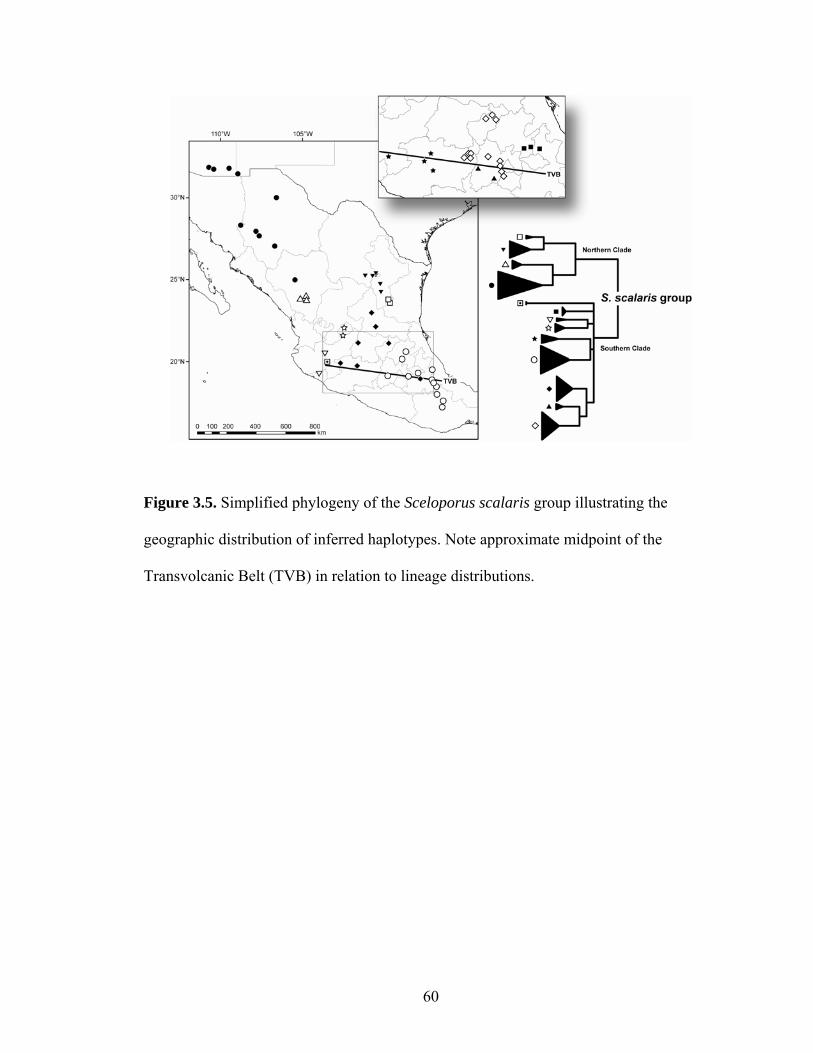
Figure 3.5. Simplified phylogeny of the Sceloporus scalaris group illustrating the
geographic distribution of inferred haplotypes. Note approximate midpoint of the
Transvolcanic Belt (TVB) in relation to lineage distributions.
60
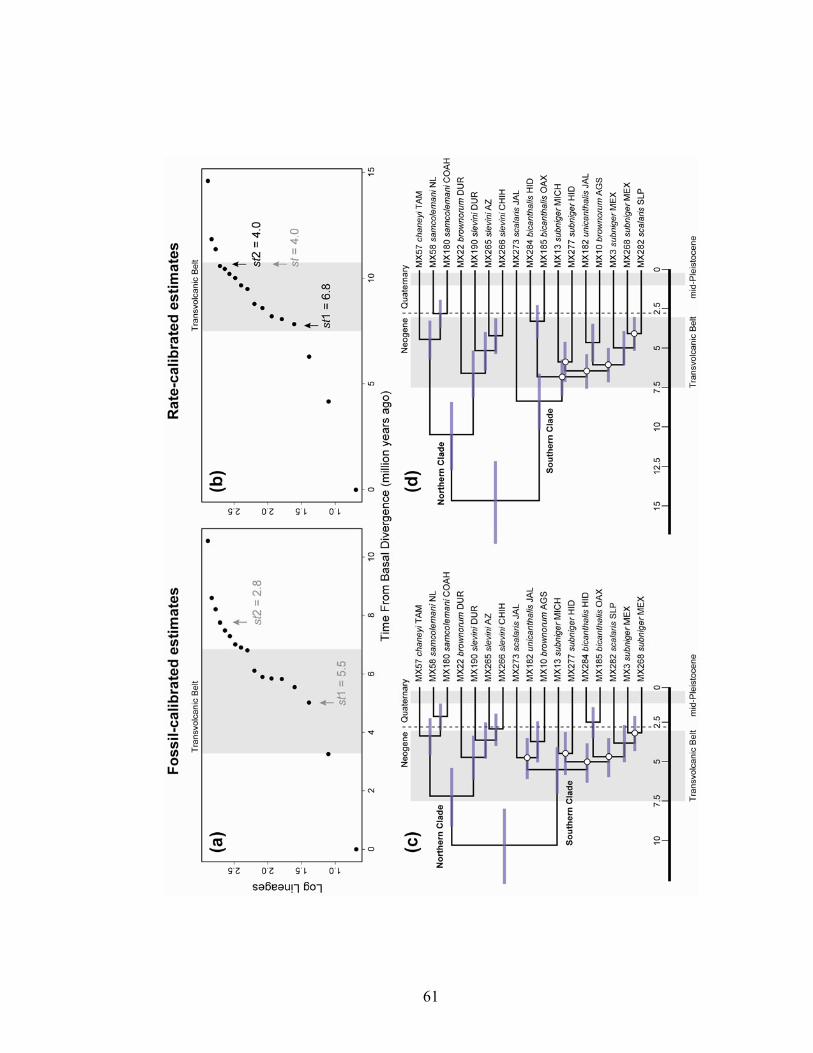
61
Figure 3.6. Diversification shifts and estimated divergence dates. Lineage through time
(LTT) plots derived from Bayesian relaxed clock estimates of divergence dates within the
Sceloporus scalaris group. Dating estimates from a fossil-calibrated dataset were used to
derive LTT plots in (a) and the chronogram in (c). Estimates from a rate-calibrated
dataset were used to construct (b) and (d). Birth–death likelihood analyses rejected the
null hypothesis of rate-constancy for both datasets. For the fossil-calibrated dataset (a),
the best-fit rate-variable model was the logistic density-dependent model. An alternative
rate-variable model that closely fit the dataset was the three-rate birth-death model.
Estimated shifts based on this model are labeled on the plot in grey. For the rate-
calibrated dataset (b), the best-fit rate-variable model was the three-rate birth-death
model, with estimated rate shifts in black. An alternative rate-variable model was the
two-rate birth-death model, labeled in grey. Time frames spanning a distinct volcanic
episode across the Transvolcanic Belt 3–7.5 million years ago and the mid-Pleistocene
pluvial-interpluvial period are depicted by grey bars. White circles denote nodes that
received <90 posterior probability support. st = time of diversification rate shift.
62
CHAPTER 4
HISTORICAL BIOGEOGRAPHY AND DIVERSIFICATION OF THE MEXICAN
ALLIGATOR LIZARD GENUS BARISIA
Introduction
Central to our understanding of diversification is recognition of the mechanisms
that impact differentiation of species across a landscape. Many questions remain about
the processes of diversification, particularly in understudied regions of high biodiversity.
One such region, the Mexican highlands, is a globally important biodiversity hotspot
(Mittermeier et al., 2005), yet a fundamental understanding of processes driving the
origins of diversity in this region lags behind that of temperate counterparts in North
America (e.g. Soltis et al., 2006; Shafer et al., 2010).
The Mexican highlands consist of four major mountain ranges spanning most of
mainland Mexico (Fig. 4.1). These include the north-to-south trending Sierra Madre
Occidental and Sierra Madre Oriental of northern Mexico, the east-west trending
Transvolcanic Belt and Sierra Madre del Sur in central and southern Mexico, and an
elevated Central Mexican Plateau. The evolutionary history of the Mexican highlands has
been shaped by various geological and climatic events over the past several million years
(reviewed in Bryson et al., 2011a). The relative impact of these historical events on the
diversification of co-distributed montane taxa remains uncertain. Only recently have
studies begun to thoroughly examine diversification in widespread Mexican montane taxa
(McCormack et al., 2010; Bryson et al., 2011a; Bryson et al., in press; Bryson et al., in
review). An emerging picture reveals evolutionary complexity characterized by strong
geographic structuring. The relatively recent Neogene formation of the Transvolcanic
63

Belt in the Miocene and Pliocene appears to be a strong driver of diversification in
several taxa associated with this volcanic mountain range (Bryson et al., in review).
Causal mechanisms driving diversification across the remaining Mexican sierras is less
clear, but may be associated with a number of filter barriers differentially subdividing
lineages through time (Bryson et al., 2011a).
Alligator lizards in the genus Barisia are widespread across the Mexican
highlands (Figs. 4.1–4.2), and inhabit mixed pine-oak woodlands from Chihuahua south
to Oaxaca (Guillette and Smith, 1982; Zaldívar-Riverón and Nieto-Montes de Oca,
2002). Previous phylogenetic work (Zaldívar-Riverón et al., 2005) postulated this genus
to be composed of at least five distinct species (B. levicollis, B. planifrons, B. rudicollis,
B. herrerae, and B. imbricata) that likely diverged from one another during the Pliocene.
Further, several deep lineages are embedded within the two subspecies of B. imbricata,
B. i. imbricata and B. i. ciliaris. Investigating the tempo and mode of diversification in
Barisia will add considerably to a fuller understanding of the complex processes
structuring biological diversity in the Mexican highlands.
During the past decade, an increasingly integrative biogeography has developed
tools allowing researchers to gain new insight into historical diversification processes
across a landscape (see Riddle et al., 2008). Here I take advantage of a new
methodological toolbox to reconstruct the evolutionary history of Barisia. I estimated
lineage divergence dates and diversification rate from mitochondrial DNA (mtDNA)
sequences, and combined divergence dates with reconstructions of ancestral geographic
ranges to track lineage diversification across geography through time. Although it has
been shown that single locus genetic studies have some limitations (e.g. Edwards and
64

Bensch, 2009), mtDNA nonetheless remains useful in exploring geographical
relationships among closely-related species (e.g. Pyron and Burbrink, 2009; Daza et al.,
2010; Kuriyama et al., 2011).
Methods
Taxonomic sampling and DNA sequencing
I obtained tissues from 50 Barisia (Table 4.1) spanning the distributions of all
putative taxa within the genus (Fig. 4.2). Sequences from an additional two samples were
obtained from GenBank (Table 4.1) to fill in small sampling gaps. I used Elgaria kingii
and Abronia graminea as outgroups (Macey et al., 1999; Conroy et al., 2005).
I sequenced two mtDNA gene regions, including NADH dehydrogenase subunit 4
and flanking tRNAs (ND4) and a continuous region encompassing ATPase subunits 8
and 6 (ATPase 8, ATPase 6), following methods specified in Bryson et al. (2011b). These
gene regions have been previously shown to be informative at different levels of
divergence within lizards (Leaché and Mulcahy, 2007; Lindell et al. 2008). Primer
sequences for ATPase were specifically designed for this project (C2LF4, 5’–
CAATGCTCAGARATYTGYGG–3’; C3LR, 5’– GCGTGTGYTTGGTGGGTCAT–3’),
and required an annealing temperature of 50 °C. Forward and reverse sequences for each
individual were edited and manually aligned using Sequencher 4.2 (Gene Codes
Corporation, Ann Arbor, MI).
65
Phylogenetic inference
Phylogenies for the mtDNA data were reconstructed using Bayesian inference
(BI) and maximum likelihood (ML) methods. MrModeltest 2.1 (Nylander, 2004) was
used to select a best-fit model of evolution, based on Akaike Information Criteria (AIC),
for each gene region (ND4, tRNAs, ATPase 8, ATPase 6). Bayesian inference analyses
were conducted on a partitioned-by-gene dataset using MrBayes 3.1 (Ronquist and
Huelsenbeck, 2003). Bayesian settings included a variable rate prior, a mean branch
length exponential prior of 75, and heating temperature of 0.05. All parameters except
branch length and topology were unlinked between partitions. Analyses consisted of four
runs (using the nruns=4 command) for 4 x 10⁶ generations using three heated and one
cold Markov chain sampling every 100 generations. Output parameters were visualized
using TRACER v1.4 (Rambaut and Drummond, 2007) to ascertain stationarity and
convergence. All samples obtained during the first one million (25%) generations were
discarded as burn-in. A 50% majority-rule consensus phylogram with nodal posterior
probability support was estimated from the combination of the four runs post-burn-in.
Maximum likelihood analyses were conducted using RAXML 7.0.3 (Stamatakis, 2006)
with the same partitioning scheme used for the BI analyses. The GTRGAMMA model
was used, and 1000 nonparametric bootstrap replicates were performed to assess nodal
support. I considered those nodes with ≥ 95% Bayesian posterior probability and ≥ 70%
bootstrap support as strongly supported (Hillis and Bull, 1993; Felsenstein, 2004).
66
Timing and tempo of diversification
Divergence dates were estimated from a partitioned-by-gene dataset of ingroup
samples using BEAST v1.6.1 (Drummond and Rambaut, 2007). To calibrate my tree, I
used rate calibrations for mtDNA employed previously to estimate divergences in anguid
lizards (0.65–0.69% change/lineage/million years; Macey et al., 1999) and within Barisia
(0.85% change/lineage/million years; Zaldívar-Riverón et al., 2005). I unlinked best-fit
models of sequence evolution across partitions, implemented an uncorrelated lognormal
clock with a Yule tree prior, and gave the ulcd.mean parameter a uniform distribution
with the lower bound set to 6.5 x 10⁻³ substitutions/site/million years, and the upper
bound set to 8.5 x 10⁻³ substitutions/site/million years. Analyses consisted of two
independent runs each of 4 x 10⁷ million generations, with samples retained every 1000
generations. A Yule tree prior does not include a model of coalescence to account for
intra-specific data represented in my heterogeneous dataset with both inter- and intra-
specific diversity, so I ran additional analyses on a reduced dataset with only one
representative from each lineage for comparison. Results were displayed in TRACER to
confirm acceptable mixing and likelihood stationarity, appropriate burn-in, and adequate
effective sample sizes. After discarding the first 4 million generations (10%) as burn-in,
the trees and parameter estimates from the two runs were combined using LogCombiner
v1.6.1 (Drummond and Rambaut, 2007). The parameter values of the samples from the
posterior distribution were summarized on the maximum clade credibility tree using
TreeAnnotator v1.6.1 (Drummond and Rambaut, 2007), with the posterior probability
limit set to zero and mean node heights summarized.
67

I analyzed temporal shifts in diversification rates using ML-based diversification-
rate analysis (Rabosky, 2006a) and divergence dates estimated in BEAST. The fit of
different birth–death models implementing two constant rates (pure-birth, and birth–
death) and four variable rates (exponential and logistic density-dependent, and two-rate
and three-rate pure-birth) was computed with LASER 2.3 (Rabosky, 2006b). Model fit was
measured using AIC scores. Significance of the change in AIC scores (∆AICrc) between
the best rate-constant and best rate-variable model was determined by creating a null
distribution for ∆AICrc. This was done by simulating 1000 trees using yuleSim in LASER
with the same number of nodes and the same speciation rate as that estimated under the
pure-birth model. I additionally generated a lineage-through-time (LTT) plot using the
plotLtt function in LASER to visualize the pattern of accumulation of log-lineages over
time.
Ancestral area reconstruction
Ancestral areas for Barisia were reconstructed using a stochastic model of
geographic range evolution (dispersal-extinction-cladogenesis, DEC) implemented in
LAGRANGE 2.0.1 (Ree and Smith, 2008). Although the DEC model is unable to account
for phylogenetic uncertainty, it can uniquely incorporate temporal and spatial constraints
on range evolution that may result in more plausible area range histories (Clark et al.,
2008; Ree and Smith, 2008). The maximum clade-credibility tree from BEAST analyses
was used in DEC analyses, and each taxon in the genealogy was coded as present or
absent in one of eight biogeographic areas based on distribution (Fig. 4.1): northern
Sierra Madre Occidental, southern Sierra Madre Occidental, northern Sierra Madre
Oriental, southern Sierra Madre Oriental, Transvolcanic Belt, western Sierra Madre del
68
Sur, and eastern Sierra Madre del Sur. The region south of the Transvolcanic Belt in
Puebla, Veracruz, and northern Oaxaca has a complex geological history, and contains
geological and biotic elements of both the Sierra Madre Oriental, Transvolcanic Belt, and
Sierra Madre del Sur (Marshall and Liebherr, 2000; Salinas-Moreno et al., 2004; Corona
et al., 2007; Paniagua and Morrone, 2009). For my analyses I considered this region as
part of the Sierra Madre Oriental based on faunal affinities (Paniagua and Morrone,
2009). Range sizes were constrained to the maximum number of biogeographic regions
presently inhabited by any single lineage. I additionally constrained widespread ancestors
to spatially adjacent areas (Fig. 1) to exclude unlikely ranges (e.g. northern Sierra Madre
Occidental + Sierra Madre del Sur).
Results
Sequence characteristics and phylogenetic estimate
The final dataset consisted of 1714 aligned nucleotide positions. Models of
sequence evolution selected for partitions in both BI and BEAST analyses were GTR + I
+ G (ND4, ATPase 8, ATPase 6), and GTR + I (tRNA). All sequences were deposited in
GenBank.
From my phylogenetic analyses I inferred 10 strongly supported lineages within
three geographical clades of Barisia (Figs. 4.3–4.4). Four lineages corresponded to the
species B. levicollis, B. planifrons, B. rudicollis, and B. herrerae. Two subspecies of B.
imbricata, B. i. ciliaris and B. i. imbricata, appeared to each be a composite of three
69

distinct lineages. My sample of B. i. jonesi was similar to geographically adjacent
samples of B. i. imbricata. Composition of clades are as follows:
(1) Northern clade: One lineage, B. levicollis, from the northern Sierra Madre
Occidental.
(2) Central clade: Comprised of four lineages. Samples from the southern Sierra
Madre Occidental and one sample from southern Chihuahua formed a lineage,
here termed 'B. i. ciliaris West'. A second lineage was distributed from the
northern Sierra Madre Oriental across the Central Mexican Plateau ('B. i. ciliaris
East'). This lineage also contained one sample from the southern Sierra Madre
Oriental and one sample of B. i. imbricata from the Transvolcanic Belt. I referred
to a single divergent sample from Pinal de Amoles, Querétaro as 'B. i. ciliaris
Pinal', the third lineage. Samples from the western half of Transvolcanic Belt,
including the sample of B. i. jonesi, formed the fourth lineage 'B. i. imbricata
West'.
(3) Southern clade: Comprised of five lineages. Samples from western Michoacán
east to Distrito Federal formed a 'B. i. imbricata Central' lineage. The second
lineage, 'B. i. imbricata East', was comprised of samples distributed from Hidalgo
south through Tlaxcala, Puebla, Veracruz, and northern Oaxaca, spanning the
southern Sierra Madre Oriental and eastern portion of the Transvolcanic Belt. The
remaining three lineages represent B. planifrons from the eastern Sierra Madre del
Sur, and B. rudicollis and B. herrerae from the central portion of the
Transvolcanic Belt.
70

Relationships between lineages were generally well supported with three
exceptions (Fig. 4.3). The node subtending B. i. ciliaris West and B. i. imbricata West
received low support (61% posterior probability and 60% bootstrap). Weak support was
also inferred for the basal divergence of B. planifrons from B. rudicollis, B. herrerae, B.
i. imbricata Central, and B. i. imbricata East (87% posterior probability and 58%
bootstrap), and the divergence of B. rudicollis from B. herrerae, B. i. imbricata Central,
and B. i. imbricata East (51% posterior probability and 44% bootstrap).
Divergence times and tempo of diversification
Results from analyses on the full and reduced datasets were nearly identical.
Dating estimates based on analyses of the full dataset suggested that diversification in
Barisia probably began in the Late Miocene (Table 4.2, Fig. 4.5) with an initial split
between B. levicollis and the remaining lineages of Barisia. Divergences between the
nine remaining lineages appeared to have followed in the Neogene. Diversification
within lineages likely began near the Pliocene–Pleistocene boundary and into the
Pleistocene.
Birth–death likelihood analyses rejected the null hypothesis of rate-constancy
(P=0.01). The rate-variable model that best fit the dataset was the logistic density-
dependent (DDL) model. Under this model, diversification rate in Barisia has gradually
decreased through time, with diversification rate estimated at 0.8 divergences per million
years (Fig. 4.6).
71
Ancestral area reconstruction
The maximum number of biogeographic regions inhabited within an extant
lineage was four in B. i. ciliaris East. Optimal ancestral areas with the highest likelihood
scores and probabilities were identified at each node (Fig. 4.5). Alternative ancestral
areas within 2 log-likelihood units were summarized in Table 4.2. One node with
alternative ancestral areas (node 6) appeared unresolved; probabilities between
alternative reconstructions differed by less than 10%. Initial diversification within Barisia
(node 1) probably occurred between the northern Sierra Madre Occidental and a
widespread common ancestor distributed across the Sierra Madre Occidental, southern
Sierra Madre Oriental, and Transvolcanic Belt. This widespread ancestor was later
fragmented within the Transvolcanic Belt (node 2), and the ancestor within the
Transvolcanic Belt subsequently split four times across this mountain range (nodes 6–9)
and dispersed into the eastern Sierra Madre del Sur. The remaining ancestor distributed
across the Sierra Madre Occidental, southern Sierra Madre Oriental, and Transvolcanic
Belt later diverged within the southern Sierra Madre Oriental (node 3) before splitting
apart (nodes 4 and 5). Colonization of the western isolate of the Sierra Madre del Sur
occurred relatively recently from the Transvolcanic Belt (node not shown).
Discussion
Based on my results, alligator lizards in the genus Barisia have had a long history
in the Mexican highlands. Diversification likely began in the Late Miocene in a wide-
ranging ancestor distributed across the Sierra Madre Occidental, Transvolcanic Belt, and
72
southern Sierra Madre Oriental (Fig. 4.5). Following this initial split at about 11 Ma, a
second divergence occurred within this wide-ranging ancestor at around 9 Ma, and two
geographical clades subsequently emerged. Divergences within these regional clades
appear to have happened during distinctly different temporal periods. A southern clade
distributed across the Transvolcanic Belt and into the eastern Sierra Madre del Sur split
rapidly between 6–8 Ma into five lineages (B. planifrons, B. herrerae, and B. i. imbricata
Central and East). Afterwards, diversification across a broader landscape between 3–5
Ma led to the formation of the four lineages within the northern clade (B. i. ciliaris Pinal,
B. i. ciliaris East and West, and B. i. imbricata West).
Lineage diversification in Barisia during the Neogene appears linked with the
development of the Transvolcanic Belt (Fig. 4.5). The formation of this mountain range
across south-central Mexico impacted diversification in a range of highland and lowland
taxa (Bryson et al., 2011b). Uplift of the Transvolcanic Belt created new geographical
barriers and united previously isolated highland biotas. Five lineages of Barisia are
broadly distributed across the Transvolcanic Belt (Fig. 4.4). Mean estimated divergence
dates between all five of these lineages (Table 4.2) fall near or within a second major
episode of widespread volcanism along the Transvolcanic Belt in the Neogene (Fig. 4.5)
(Gómez-Tuena et al., 2007). Because of the relatively young geological age of this
second episode, the extensive uplifting likely left a large evolutionary imprint on the
genetic structures of extant lineages that has not yet eroded through time. Indeed, a
variety of co-distributed taxa associated with the Transvolcanic Belt demonstrate genetic
divergences temporally congruent with this second period of Transvolcanic Belt
formation, including fish (Hulsey et al., 2004), amphibians (Mulcahy and Mendelson,
73

2000), reptiles (Bryson et al., 2011a; Bryson et al., 2011b; Bryson et al., in press; Bryson
et al., in review), and birds (McCormack et al., 2008, 2010).
The diversification rate within Barisia appears to be slowly declining (Fig. 4.6). A
period of initial widespread uplifting of the Transvolcanic Belt between about 10–19 Ma
(Gómez-Tuena et al., 2007) may have created a highland corridor that promoted dispersal
between the montane biotas of the Sierra Madre Occidental and Sierra Madre Oriental.
This Late Miocene linkage could explain my reconstruction of initial fragmentation
around 11 Ma of a widespread common ancestor distributed across the Sierra Madre
Occidental, Transvolcanic Belt, and southern Sierra Madre Oriental. Similar patterns of
deep divergences between largely northern and southern highland clades (Bryson et al., in
review) might also be attributed to an early connection of highland biotas across the
Transvolcanic Belt. A second episode of widespread uplifting across the Miocene–
Pliocene boundary may have subsequently divided Barisia distributed along the
Transvolcanic Belt. Barisia to the north were later likely fragmented during the Pliocene,
perhaps as filter barriers such as major river drainages (Bryson et al., 2011a) formed and
subdivided lineages.
Diversification within several widespread lineages of Barisia such as B. i. ciliaris
West and East and B. i. imbricata East appear to date to near the Pliocene–Pleistocene
boundary. However, an overall lack of clear geographic partitioning of genetic diversity
within these and other lineages (Figs. 4.3–4.4) makes inferences on the historical
processes responsible for within-lineage diversification difficult. Expansions of pine-oak
woodlands during Pleistocene glacial cycles (Gugger et al., 2010; Bryson et al., in press)
may have promoted dispersal and periodic bouts of gene flow that could have erased or
74
obscured previously acquired signals of historical isolation in Barisia. Future studies
utilizing multilocus data within a coalescent framework should better delineate major
lineages of Barisia.
Results from my study are broadly congruent with results from a previous study
(Zaldívar-Riverón et al., 2005) with few notable exceptions. My range-wide sampling not
only helped further delineate distributions of mtDNA lineages, but also elucidated the
discovery of a deeply divergent lineage, B. levicollis. Zaldívar-Riverón et al. (2005),
lacking molecular data for B. levicollis and relying on morphology, suggested a close
relationship between this species and northern populations of B. i. ciliaris (Zaldívar-
Riverón et al., 2005). My data suggests B. levicollis might instead be a paleoendemic
restricted to the northern Sierra Madre Occidental, sister to all other Barisia. Further,
based on my results, localities of two samples used previously appear to be reversed ("B.
i. imbricata2" and "B. i. imbricata8"). This is additionally confirmed by my comparison
of ND4 sequences from identical (Mil Cumbres, Michoacán) and nearby (Pico de
Orizaba and Xometla, Veracruz) localities. Reversing OTUs in the combined
phylogenetic analyses of Zaldívar-Riverón et al. (2005) might change their results on the
evolution of dorsal pattern in these lizards.
As with other taxa restricted to the highlands of Mexico, Barisia are threatened by
an ever-expanding human population and habitat destruction. At least two species (B.
rudicollis and B. herrerae) are confined to a relatively small region adjacent to one of the
world's most populated areas, and both species may already be in decline (Zaldívar-
Riverón and Nieto-Montes de Oca, 2002 ). Barisia rudicollis and B. herrerae are
considered endangered by the International Union for Conservation of Nature (Flores-
75

Villela and Canseco-Márquez, 2007). Another distinct lineage inferred in my study from
near Pinal de Amoles, Querétaro may also have a small range. Future studies should
focus on further delineating evolutionary distinct taxa within Barisia. These findings
viewed in concert with previous phylogeographic studies may fuel new interest in
elucidating potentially hidden yet critically threatened components of a unique Mexican
highland biota.
76
Table 4.1. Collection and voucher data for genetic samples of Barisia used in this study.
All samples deposited in the Las Vegas Tissue Collection (LVT), Ambrose Monell Cryo
Collection (AMCC), or Museum of Vertebrate Zoology, University of California,
Berkeley (MVZ).
Sample ID (MX)
Taxon Locality Voucher Number
2 B. i. ciliaris Mexico: Nuevo León: Pablillo LVT 10795
6 B. i. ciliaris Mexico: Coahuila: Santa Rita LVT 10796
9 B. i. imbricata Mexico: Jalisco: Volcán Tequila LVT 10797
15 B. i. ciliaris Mexico: Durango: Rancho Santa Barbara
LVT 10798
21 B. i. ciliaris Mexico: Tamaulipas: Aserradero LVT 10799
24 B. planifrons Mexico: Oaxaca: Sierra Monte Flor LVT 10800
36 B. levicollis Mexico: Chihuahua: Sierra del Nido LVT 10801
55 B. i. ciliaris Mexico: Aguascalientes: Sierra Fría LVT 10802
60 B. i. imbricata Mexico: Veracruz: Xometla AMCC 118392
62 B. i. imbricata Mexico: Puebla: Sierra Negra AMCC 118355
63 B. planifrons Mexico: Oaxaca: Cerro San Felipe AMCC 117877
69 B. i. imbricata Mexico: Jalisco: Volcán del Fuego LVT 10803
72 B. i. imbricata Mexico: Estado de México: Chapa de Mota
LVT 10804
195 B. i. ciliaris Mexico: Guanajuato: Sierra Santa Rosa
LVT 10805
196 B. i. imbricata Mexico: Michoacán: Cerro Tancítaro LVT 10806
197 B. i. imbricata Mexico: Veracruz: Las Vigas LVT 10807
198 B. i. imbricata Mexico: Puebla: Volcán Iztaccihuatl LVT 10808
199 B. i. ciliaris Mexico: Querétaro: Nuevo San Joaquin
LVT 10809
77

Table 4.1. Collection and voucher data continued.
Sample ID (MX)
Taxon Locality Voucher Number
200 B. i. imbricata Mexico: Estado de México: Atlacomulco
LVT 10810
201 B. i. imbricata Mexico: Michoacán: Parque José María Morelos
LVT 10811
202 B. levicollis Mexico: Chihuahua: Sierra del Nido LVT 10812
203 B. i. ciliaris Mexico: Chihuahua: Mesa de Agostadero
LVT 10813
302 B. i. imbricata Mexico: Michoacán: Tacambaro LVT 10814
303 B. i. imbricata Mexico: Michoacán: Mil Cumbres LVT 10815
304 B. i. imbricata Mexico: Michoacán: SE Aporo LVT 10816
305 B. i. imbricata Mexico: Hidalgo: Calicanto LVT 10817
306 B. i. jonesi Mexico: Michoacán: Dos Aguas LVT 10818
307 B. i. imbricata Mexico: Tlaxcala: Apizaco LVT 10819
308 B. i. imbricata Mexico: Morelos: Zempoala LVT 10820
309 B. i. ciliaris Mexico: Querétaro: Cerro Zamorano LVT 10821
310 B. rudicollis Mexico: Estado de México: Valle de Bravo
LVT 10822
311 B. herrerae Mexico: Estado de México: Ocuilan LVT 10823
312 B. i. imbricata Mexico: Jalisco: Tapalpa LVT 10824
313 B. i. ciliaris Mexico: Durango: Mesa de las Navar LVT 10825
314 B. i. ciliaris Mexico: San Luis Potosí: Alvarez LVT 10826
315 B. i. ciliaris Mexico: Querétaro: Rancho Los Velázquez, Pinal de Amoles
LVT 10827
316 B. i. imbricata Mexico: Estado de México: Llano Grande
LVT 10828
317 B. i. imbricata Mexico: Distrito Federal: Sierra Ajusco
LVT 10829
78

Table 4.1. Collection and voucher data continued.
Sample ID (MX)
Taxon Locality Voucher Number
318 B. planifrons Mexico: Oaxaca: Ixtlán de Juárez LVT 10830
319 B. planifrons Mexico: Oaxaca: Yuvila LVT 10831
320 B. i. imbricata Mexico: Oaxaca: Peña Verde LVT 10832
321 B. i. imbricata Mexico: Estado de México: Rio Frio MVZ 191048
322 B. i. imbricata Mexico: Hidalgo: Eloxochitlán LVT 10833
338 B. levicollis Mexico: Chihuahua: Creel LVT 10834
339 B. levicollis Mexico: Chihuahua: Ejido Zorillo LVT 10835
402 B. i. imbricata Mexico: Michoacán: Cerro Angahuan LVT 10836
437 B. i. imbricata Mexico: Guerrero: Sierra Taxco LVT 10837
438 B. i. ciliaris Mexico: San Luis Potosí: Real de Catorce
LVT 10838
439 B. i. ciliaris Mexico: Jalisco: Sierra Huichol LVT 10839
440 B. herrerae Mexico: Estado de México: Ocuilan LVT 10840
-- B. i. imbricata Mexico: Jalisco: Manantlán GenBank AY605116
-- B. rudicollis Mexico: Michoacán: El Pinal, Mpo. Tuxpan
GenBank AY605121
-- Elgaria kingii Mexico: Chihuahua: Sierra del Nido LVT 10841
-- Abronia graminea Mexico: Veracruz: Puerto del Aire LVT 10842
79
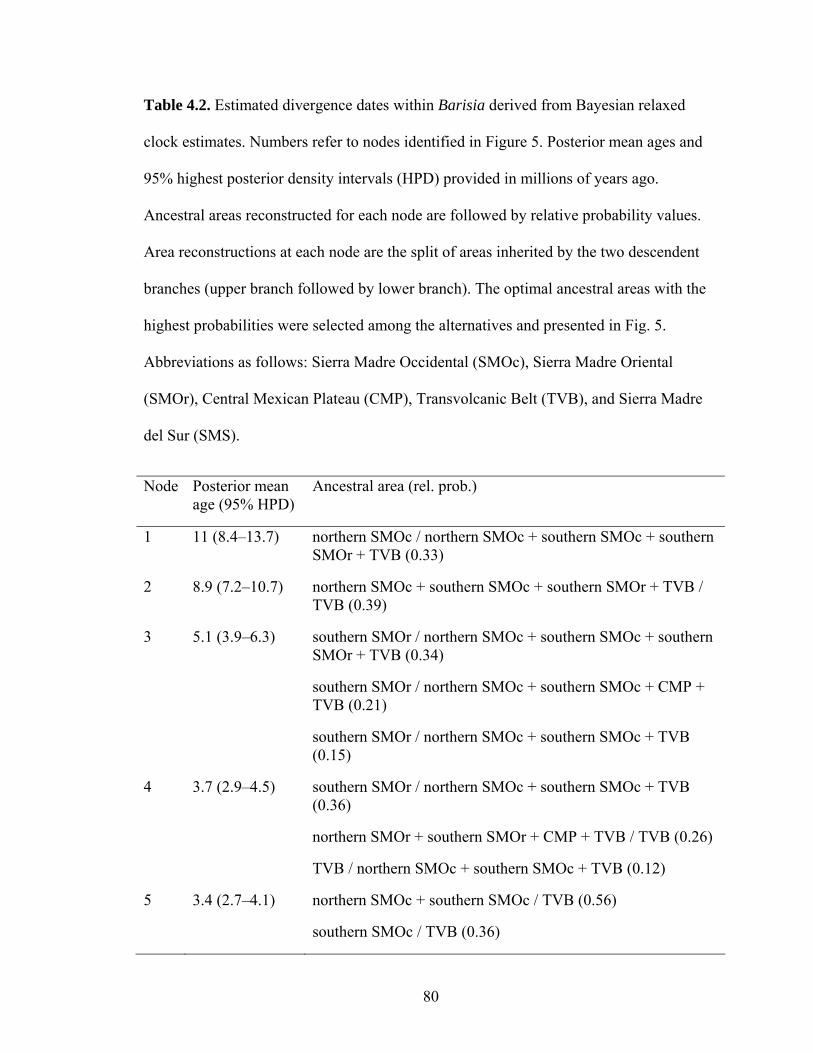
Table 4.2. Estimated divergence dates within Barisia derived from Bayesian relaxed
clock estimates. Numbers refer to nodes identified in Figure 5. Posterior mean ages and
95% highest posterior density intervals (HPD) provided in millions of years ago.
Ancestral areas reconstructed for each node are followed by relative probability values.
Area reconstructions at each node are the split of areas inherited by the two descendent
branches (upper branch followed by lower branch). The optimal ancestral areas with the
highest probabilities were selected among the alternatives and presented in Fig. 5.
Abbreviations as follows: Sierra Madre Occidental (SMOc), Sierra Madre Oriental
(SMOr), Central Mexican Plateau (CMP), Transvolcanic Belt (TVB), and Sierra Madre
del Sur (SMS).
Node Posterior mean age (95% HPD)
Ancestral area (rel. prob.)
1 11 (8.4–13.7) northern SMOc / northern SMOc + southern SMOc + southern SMOr + TVB (0.33)
2 8.9 (7.2–10.7) northern SMOc + southern SMOc + southern SMOr + TVB / TVB (0.39)
3 5.1 (3.9–6.3) southern SMOr / northern SMOc + southern SMOc + southern SMOr + TVB (0.34)
southern SMOr / northern SMOc + southern SMOc + CMP + TVB (0.21)
southern SMOr / northern SMOc + southern SMOc + TVB (0.15)
4 3.7 (2.9–4.5) southern SMOr / northern SMOc + southern SMOc + TVB (0.36)
northern SMOr + southern SMOr + CMP + TVB / TVB (0.26)
TVB / northern SMOc + southern SMOc + TVB (0.12)
5 3.4 (2.7–4.1) northern SMOc + southern SMOc / TVB (0.56)
southern SMOc / TVB (0.36)
80

Table 4.2. Estimated divergence dates and ancestral area reconstructions continued.
Node Posterior mean age (95% HPD)
Ancestral area (rel. prob.)
6 8 (6.4–9.7) TVB / TVB (0.50)
eastern SMS / TVB (0.47)
7 7.7 (6.2–9.4) TVB / TVB (0.99)
8 6.7 (5.4–8.2) TVB / TVB (0.97)
9 6.1 (4.8–7.4) TVB / TVB (0.88)
81
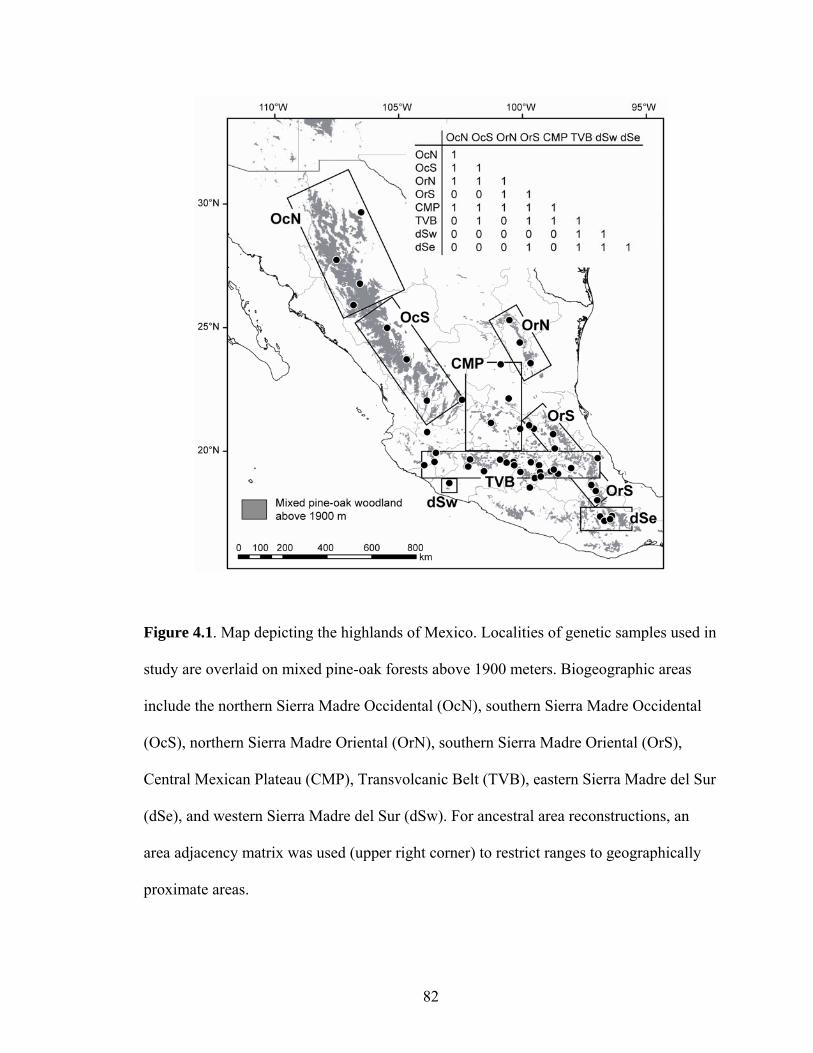
Figure 4.1. Map depicting the highlands of Mexico. Localities of genetic samples used in
study are overlaid on mixed pine-oak forests above 1900 meters. Biogeographic areas
include the northern Sierra Madre Occidental (OcN), southern Sierra Madre Occidental
(OcS), northern Sierra Madre Oriental (OrN), southern Sierra Madre Oriental (OrS),
Central Mexican Plateau (CMP), Transvolcanic Belt (TVB), eastern Sierra Madre del Sur
(dSe), and western Sierra Madre del Sur (dSw). For ancestral area reconstructions, an
area adjacency matrix was used (upper right corner) to restrict ranges to geographically
proximate areas.
82
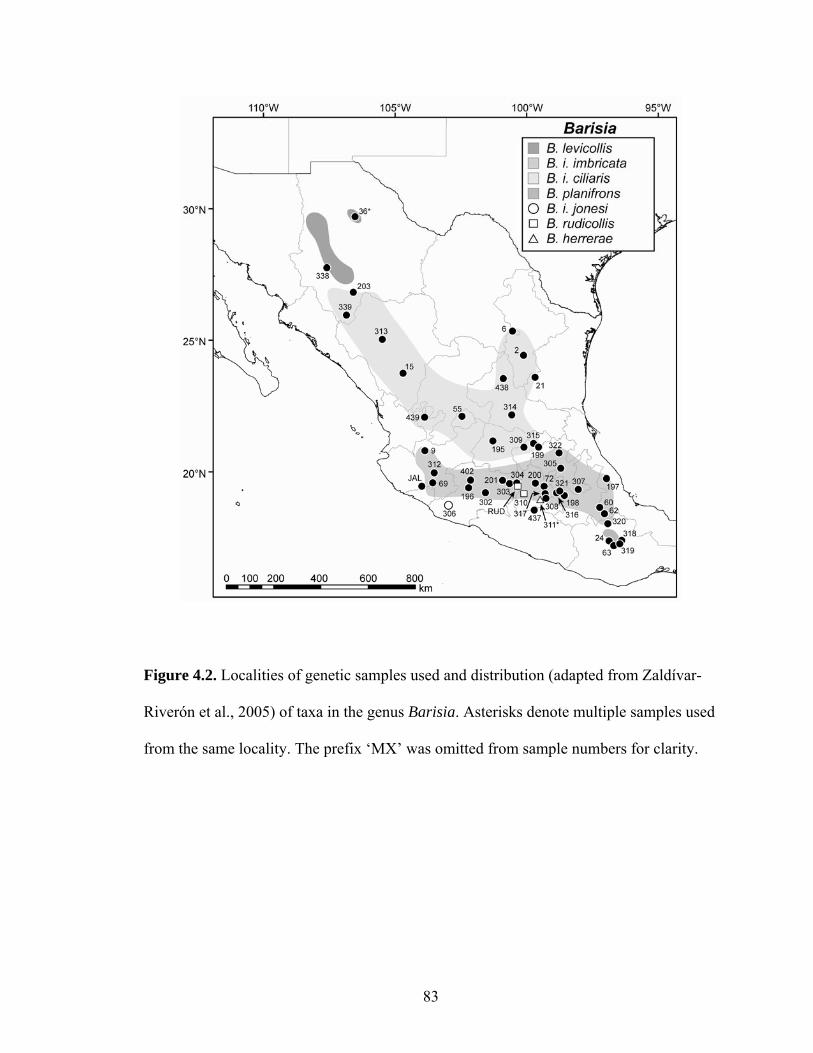
Figure 4.2. Localities of genetic samples used and distribution (adapted from Zaldívar-
Riverón et al., 2005) of taxa in the genus Barisia. Asterisks denote multiple samples used
from the same locality. The prefix ‘MX’ was omitted from sample numbers for clarity.
83

Figure 4.3. Maternal genealogy of Barisia based on mixed-model Bayesian inference
(tree shown) and maximum likelihood analyses of mitochondrial DNA sequence data.
Numbers at nodes indicate support values (Bayesian posterior probability followed by
maximum likelihood bootstrap). Nodes that received ≥ 95% Bayesian posterior
probability and ≥ 70% bootstrap support are depicted with black dots.
84
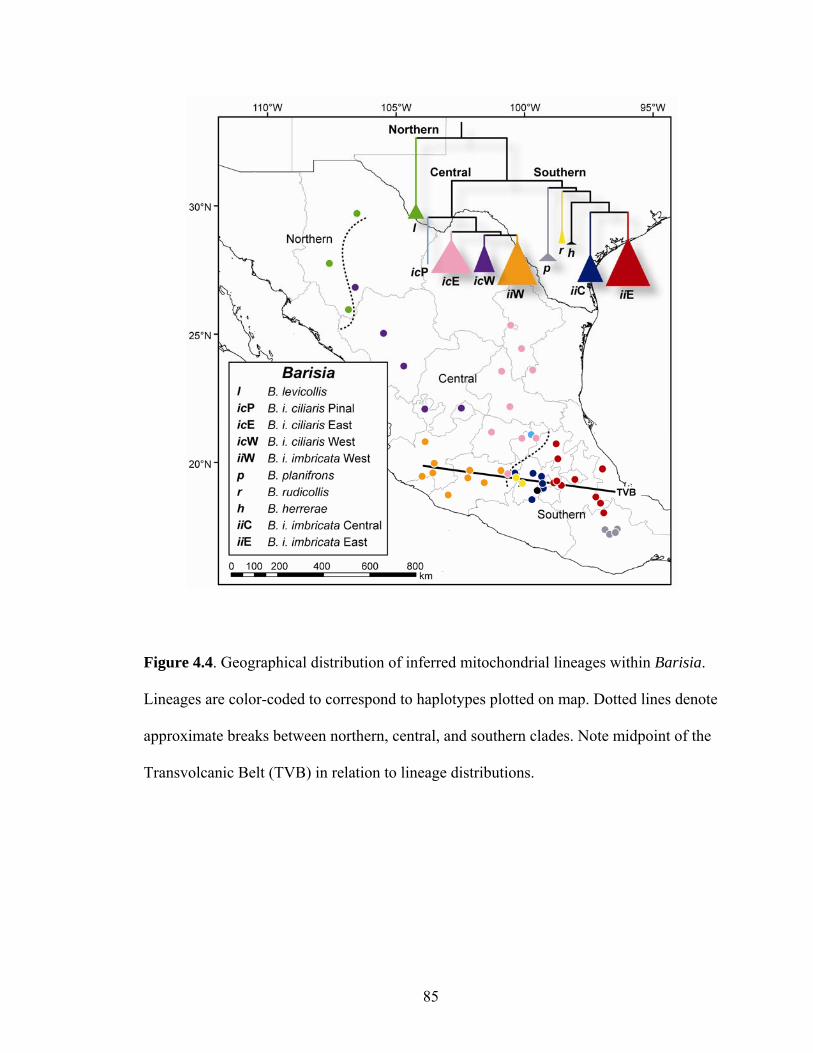
Figure 4.4. Geographical distribution of inferred mitochondrial lineages within Barisia.
Lineages are color-coded to correspond to haplotypes plotted on map. Dotted lines denote
approximate breaks between northern, central, and southern clades. Note midpoint of the
Transvolcanic Belt (TVB) in relation to lineage distributions.
85
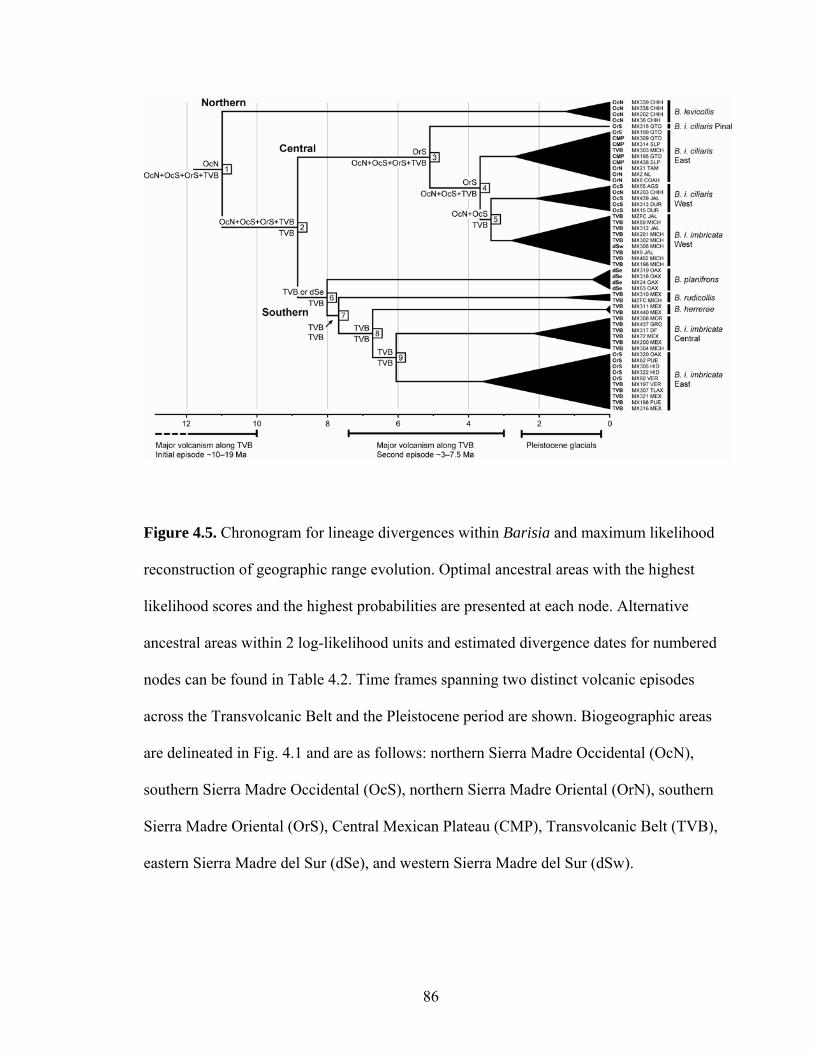
Figure 4.5. Chronogram for lineage divergences within Barisia and maximum likelihood
reconstruction of geographic range evolution. Optimal ancestral areas with the highest
likelihood scores and the highest probabilities are presented at each node. Alternative
ancestral areas within 2 log-likelihood units and estimated divergence dates for numbered
nodes can be found in Table 4.2. Time frames spanning two distinct volcanic episodes
across the Transvolcanic Belt and the Pleistocene period are shown. Biogeographic areas
are delineated in Fig. 4.1 and are as follows: northern Sierra Madre Occidental (OcN),
southern Sierra Madre Occidental (OcS), northern Sierra Madre Oriental (OrN), southern
Sierra Madre Oriental (OrS), Central Mexican Plateau (CMP), Transvolcanic Belt (TVB),
eastern Sierra Madre del Sur (dSe), and western Sierra Madre del Sur (dSw).
86

Figure 4.6. Lineage through time plot derived from Bayesian relaxed clock estimates of
divergence dates within Barisia. Birth–death likelihood analyses suggest a gradual
decrease in diversification rate though time, with diversification rate (r) estimated at 0.8
divergences per million years.
87
BIBLIOGRAPHY
Anducho-Reyes, M.A., Cognato, A.I., Hayes, J.L., Zuniga, G., 2008. Phylogeography of
the bark beetle Dendroctonus mexicanus Hopkins (Coleoptera: Curculionidae:
Scolytinae). Mol. Phylgenet. Evol. 49, 930–940.
Arévalo, E., Davis, S.K., Sites, Jr. J., 1994. Mitochondrial DNA sequence divergence and
phylogenetic relationships among eight chromosome races of the Sceloporus
grammicus complex (Phrynosomatidae) in Central Mexico. Syst. Biol. 43, 387–
418.
Barrowclough, G.F., Zink, R.M., 2009. Funds enough, and time: mtDNA, nuDNA and
the discovery of divergence. Mol. Ecol. 18, 2934–2936.
Benabib, M., Kjer, K.M., Sites, Jr. J.W., 1997. Mitochondrial DNA sequence-based
phylogeny and the evolution of viviparity in the Sceloporus scalaris group
(Reptilia, Squamata). Evolution 51, 1262-75.
Brower, L.P., Castilleja, G., Peralta, A., Lopez-Garcia, J., Bojorquez-Tapia, L., Diaz, S.,
Melgarejo, D., Missrie, M., 2002. Quantitative changes in forest quality in a
principal overwintering area of the monarch butterfly in Mexico, 1971–1999.
Conserv. Biol. 16, 346–359.
Bryson, R.W., Pastorini, J., Burbrink, F.T., Forstner, M.R.J., 2007. A phylogeny of the
Lampropeltis mexicana complex (Serpentes: Colubridae) based on mitochondrial
DNA sequences suggests evidence for species-level polyphyly within
Lampropeltis. Mol. Phylogenet. Evol. 43, 674–684.
88
Bryson, R.W., Nieto-Montes de Oca, A., Jaeger, J.R., Riddle, B.R., 2010. Elucidation of
cryptic diversity in a widespread Nearctic treefrog reveals episodes of
mitochondrial gene capture as frogs diversified across a dynamic landscape.
Evolution 64, 2315-2330.
Bryson, R.W., Murphy, R.W., Lathrop, A., Lazcano-Villareal, D., 2011a. Evolutionary
drivers of phylogeographical diversity in the highlands of Mexico: a case study of
the Crotalus triseriatus species group of montane rattlesnakes. J. Biogeogr. 38,
697–710.
Bryson, R.W., García-Vázquez, U.O., Riddle, B.R., 2011b. Phylogeography of Middle
American gophersnakes: Mixed responses to biogeographical barriers across the
Mexican Transition Zone. J. Biogeogr. DOI: 10.1111/j.1365-2699.2011.02508.x
Bryson, R.W., Murphy, R.W., Graham, M.R., Lathrop, A., Lazcano-Villareal, D., In
press. Historical diversification of the Crotalus intermedius group and Pleistocene
pine-oak woodland connections between Mexico’s Sierra Madre Occidental and
Sierra Madre Oriental. J. Biogeogr.
Bryson, R.W., García-Vázquez, U.O., Riddle, B.R., In review. Testing the roles of
Neogene vicariance and Quaternary climate change on the historical
diversification of bunchgrass lizards (Sceloporus scalaris group) in Mexico. Mol.
Phylogen. Evol.
Burney, C.W., Brumfield, R.T., 2009. Ecology predicts levels of genetic differentiation in
Neotropical birds. Am. Nat. 174, 358–368.
Campbell, J.A., Lamar, W.W., 2004. Venomous Reptiles of the Western Hemisphere.
Cornell University Press, Ithaca, New York.
89

Carreño, A.L., Helenes, J., 2002. Geology and ages of the islands. In: Case, T.J., Cody,
M.L., Ezcurra, E. (Eds.) A New Island Biogeography of the Sea of Cortés.
Oxford University Press, New York, pp. 14–40.
Castoe, T.A., Spencer, C.L., Parkinson, C.L., 2007. Phylogeographic structure and
historical demography of the western diamondback rattlesnake (Crotalus atrox):
a perspective on North American desert biogeography. Mol. Phylogenet. Evol.
42, 193–212.
Castoe, T.A., Daza, J.M., Smith, E.N., Sasa, M.M., Kuch, U., Campbell, J.A.,
Chippindale, P.T., Parkinson, C.L., 2009. Comparative phylogeography of
pitvipers suggests a consensus of ancient Middle American highland
biogeography. J. Biogeogr. 36, 88–103.
Challenger, A., 1998. Utilización y Conservación de los Ecosistemas Terrestres de
México. Pasado, Presenté y Yuturo. CONABIO, México, D.F.
Chan, K.M.A., Moore, B.R., 2005. SymmeTREE: Whole-tree analysis of differential
diversification rates. Bioinformatics 21, 1709–1710.
Clark, J.R., Ree, R.H., Alfaro, M.E., King, M.G., Wagner, W.L., Roalson, E.H., 2008. A
comparative study in ancestral range reconstruction methods: retracing the
uncertain histories of insular lineages. Sys. Biol. 57, 693–707.
Conroy, C.J., Bryson, R.W., Lazcano, D., Knight, A., 2005. Phylogenetic position of the
pygmy alligator lizard based on mitochondrial DNA. J. Herpetol. 39, 142–147.
Corona, A.M., Toledo, V.H., Morrone, J.J., 2007. Does the Trans-Mexican Volcanic Belt
represent a natural biogeographic unit? An analysis of the distributional patterns
of Coleoptera. J. Biogeogr. 34, 1008–1015.
90
Daza, J.M., Castoe, T.A., Parkinson, C.L., 2010. Using regional comparative
phylogeographic data from snake lineages to infer historical processess in Middle
America. Ecography 33, 343–354.
Devitt, T.J., 2006. Phylogeography of the Western Lyresnake (Trimorphodon biscutatus):
testing aridland biogeographical hypotheses across the Nearctic–Neotropical
transition. Mol. Ecol. 15, 4387–4407.
Dixon, J.R., Lemos-Espinal, J.A., 2010. Anfibios y Reptiles del Estado de Querétaro,
México. Amphibians and Reptiles of the State of Querétaro, México. México.
CONABIO, México, D.F.
Drummond, A.J., Rambaut, A., 2007. BEAST: Bayesian evolutionary analysis by
sampling trees. BMC Evol. Biol. 7, 214.
Edwards, S., Bensch, S., 2009. Looking forwards or looking backwards in avian
phylogeography? A comment on Zink and Barrowclough 2008. Mol. Ecol. 18,
2930–2933.
Estes, R., 1983. Sauria terrestria, Amphisbaenia. In: Handbuch der Paläoherpetologie, pp.
1–249. Edited by: Wellnhofer, P. Stuttgart, NY: Gustav Fischer Verlag.
Farjon, A., Styles, B.T., 1997. Flora Neotropica: Pinus (Pinaceae). New York Botanical
Garden, New York, NY.
Felsenstein, J., 2004. Inferring Phylogenies. Sinauer Associates, Sunderland, MA.
Ferrusquía-Villafranca, I., 1993. Geology of Mexico: a synopsis. In: Biological Diversity
of Mexico: Origins and Distribution, pp. 3–107. Edited by: Ramamoorthy, T.P.,
Bye, R.A., Lot, A., Fa, J. Oxford, NY: Oxford University Press.
91
Ferrusquía-Villafranca, I., González-Guzmán, L.I., 2005. Northern Mexico’s landscape,
part II: the biotic setting across time. In: Biodiversity, Ecosystems, and
Conservation in Northern Mexico, pp. 39–51. Edited by: Cartron, J.-L.E.,
Ceballos, G., Felger, R.S. Oxford, NY: Oxford University Press.
Flores-Villela, O., Canseco-Márquez, L., 2007. Barisia herrerae. In: IUCN 2010. IUCN
Red List of Threatened Species. Version 2010.4. <www.iucnredlist.org>.
Downloaded on 04 April 2011.
Flores-Villela, O., Martínez-Salazar, E.A., 2009. Historical explanation of the origin of
the herpetofauna of Mexico. Rev. Mex. Biodivers. 80, 817–833.
Galicia, L., García-Romero, A., 2007. Land use and land cover change in highland
temperate forests in the Izta-Popo National Park, Central Mexico. Mountain Res.
Development 27, 48–57.
Godinho, R., Crespo, E.G., Ferrand, N., 2008. The limits of mtDNA phylogeography:
complex patterns of population history in a highly structured Iberian lizard are
only revealed by the use of nuclear markers. Mol. Ecol. 17, 4670-4683.
Gómez-Tuena, A., Orozco-Esquivel, Ma.T., Ferrari, L., 2007. Igneous petrogenesis of the
Trans-Mexican Volcanic Belt. Geol. Soc. Am. Special Paper 422, 129–181.
Gugger, P.F., Gonzalez-Rodriguez, A., Rodriguez-Correa, H., Sugita, S., Cavender-
Bares, J., 2011. Southward pleistocene migration of Douglas-fir into Mexico:
phylogeography, ecological niche modeling, and conservation of 'rear edge'
populations. New Phytol. 189, 1185–1199.
92

Guiher, T.J., Burbrink, F.T., 2008. Demographic and phylogeographic histories of two
venomous North American snakes of the genus Agkistrodon. Mol. Phylogenet.
Evol. 48, 543–553.
Guillette, L.J., Smith, H.M., 1982. A review of the Mexican lizard Barisia imbricata, and
the description of a new subspecies. Trans. Kansas Acad. Sciences 85, 13–33.
Hewitt, G.M., 1996. Some genetic consequences of ice ages, and their role in divergence
and speciation. Biol. J. Linn. Soc. 58, 247–276.
Hewitt, G.M., 2000. The genetic legacy of the Quaternary ice ages. Nature 405, 907–913.
Hewitt, G.M., 2004, Genetic consequences of climatic oscillations in the Quaternary.
Philos. Trans. R. Soc. London B, 359, 183-195.
Hillis, D.M., Bull, J.J., 1993. An empirical test of bootstrapping as a method for assessing
confidence in phylogenetic analysis. Syst. Biol. 42, 182–192.
Ho, S.Y.W., 2005. Time dependency of molecular rate estimates and systematic
overestimation of recent divergence times. Mol. Biol. Evol. 22, 1561–1568.
Ho, S.Y.W., Phillips, M.J., 2009. Accounting for calibration uncertainty in phylogenetic
estimation of evolutionary divergence times. Syst. Biol. 58, 367–380.
Holman, J.A., 1970. A Pleistocene herpetofauna from Eddy County, New Mexico. Texas
J. Sci. 22, 29–39.
Holman, J.A., 1995. Pleistocene Amphibians and Reptiles of North America. Oxford,
NY: Oxford University Press.
Horowitz, S.B., 1955. An arrangement of the subspecies of the horned toad, Phrynosoma
orbiculare (Iguanidae). Am. Mid. Nat. 54, 204–218.
93

Hudson, R.R., Coyne, J.A., 2002. Mathematical consequences of the genealogical species
concept. Evolution 56, 1557–1565.
Hulsey, C.D., García de León, F.J., Johnson, Y.S., Hendrickson, D.A., Near, T.J., 2004.
Temporal diversification of Mesoamerican cichlid fishes across a major
biogeographic boundary. Mol. Phylgenet. Evol. 31, 754–764.
Jones, K.B., 1995. Phylogeography of the desert horned lizard (Phrynosoma platyrhinos)
and the short-horned lizard (Phrynosoma douglassi): Patterns of divergence and
diversity. PhD Thesis, University of Nevada, Las Vegas.
Kelly, C.M.R., Barker, N.P., Villet, M.H., Broadley, D.G., 2009. Phylogeny,
biogeography and classification of the snake superfamily Elapoidea: a rapid
radiation in the late Eocene. Cladistics 25, 38–63.
Kerhoulas, N.J., Arbogast, B.S., 2010. Molecular systematics and Pleistocene
biogeography of Mesoamerican flying squirrels. J. Mammal. 91, 654-667.
Kuriyama, T., Brandley, M.C., Katayama, A., Mori, A., Honda, M., Hasegawa, M., 2011.
A time-calibrated phylogenetic approach to assessing the phylogeography and
colonization history of snakes in the Japanese Izu Islands. J. Biogeogr. 38, 259–
271.
Lamb, T., Avise, J.C., Gibbons, J.W., 1989. Phylogeographic patterns in mitochondrial
DNA of the desert tortoise (Xerobates agassizi), and evolutionary relationships
among the North American desert tortoises, Evolution 43, 76–87.
Leaché, A.D., McGuire, J.A., 2006. Phylogenetic relationships of horned lizards
(Phrynosoma) based on nuclear and mitochondrial data: evidence for a
misleading mitochondrial gene tree. Mol. Phylogenet. Evol. 39, 628–644.
94
Leaché, A.D., Mulcahy, D.G., 2007. Phylogeny, divergence times, and species limits of
spiny lizards (Sceloporus magister species group) in western North American
deserts and Baja California. Mol. Ecol. 16, 5216–5233.
Lemos-Espinal, J.A., Smith, H.M., 2007a. Anfibios y Reptiles del Estado de Chihuahua,
México/Amphibians and Reptiles of the State of Chihuahua, México.
CONABIO, México, D.F.
Lemos-Espinal, J.A., Smith, H.M., 2007b. Anfibios y Reptiles del Estado de Coahuila,
México/Amphibians and Reptiles of the State of Coahuila, México. CONABIO,
México, D.F.
León-Paniagua, L., Navarro-Sigüenza, A.G., Hernández-Baños, B.E., Morales, J.C.,
2007. Diversification of the arboreal mice of the genus Habromys (Rodentia:
Cricetidae: Neotominae) in the Mesoamerican highlands. Mol. Phylgenet. Evol.
42, 653–664.
Lindell, J., Méndez-de la Cruz, F.R., Murphy, R.W., 2008. Deep biogeographical history
and cytonuclear discordance in the black-tailed brush lizard (Urosaurus
nigricaudus) of Baja California. Biol. J. Linnaean Soc. 94, 89–104.
Luna-Vega, I., Alcántara-Ayala, O., Espinosa-Organista, D., Morrone, J.J., 1999.
Historical relationships of the Mexican cloud forests: a preliminary vicariance
model applying Parsimony Analysis of Endemicity to vascular plant taxa, J.
Biogeogr. 26, 1299–1305.
Luxbacher, A.M., Knouft, J.H., 2009. Assessing concurrent patterns of environmental
niche and morphological evolution among species of horned lizards
(Phrynosoma). J. Evol. Biol. 22, 1669–1678.
95

Macey, J.R., Wang, Y., Ananjeva, N.B., Larson, A., Papenfuss, T.J., 1999. Vicariant
patterns of fragmentation among gekkonid lizards of the genus Teratoscincus
produced by the Indian Collision: a molecular phylogenetic perspective and an
area cladogram for Central Asia. Mol. Phylogenet. Evol. 12, 320–332.
Marshall, C.J., Liebherr, J.K., 2000. Cladistic biogeography of the Mexican Transition
Zone. J. Biogeogr. 27, 203–216.
Mateos, M., 2005. Comparative phylogeography of the genera Poecilia and Poeciliopsis
in Central Mexico. J. Biogeography 32, 775–780.
Mateos, M., Sanjur, O.I., Vrijenhoek, R.C., 2002. Historical biogeography of the fish
genus Poeciliopsis (Cyprinodontiformes). Evolution 56, 972–984.
McCormack, J.E., Peterson, A.T., Bonaccorso, E., Smith, T.B., 2008. Speciation in the
highlands of Mexico: genetic and phenotypic divergence in the Mexican jay
(Aphelocoma ultramarina). Mol. Ecol. 17, 2505–2521.
McCormack, J.E., Zellmer, A.J., Knowles, L.L., 2010. Does niche divergence accompany
allopatric divergence in Aphelocoma jays as predicted under ecological
speciation?: Insights from tests with niche models. Evolution 64, 1231–1244.
McCormack, J.E., Heled, J., Delaney, K.S., Peterson, A.T., Knowles, L.L., 2011.
Calibrating divergence times on species trees versus gene trees: implications for
speciation history of Aphelocoma jays. Evolution 65, 184–202.
McDiarmid, R.W., 1963. A collection of reptiles and amphibians from the highland
faunal assemblage of western Mexico. Contrib. Sci. Los Angeles Co. Mus. 68, 1–
15.
96

McDonald, J.A., 1993. Phytogeography and history of the alpine–subalpine flora of
northeastern Mexico. In: Biological Diversity of Mexico: Origins and
Distribution, pp. 681–703. Edited by: Ramamoorthy, T.P., Bye, R.A., Lot, A., Fa,
J. Oxford, NY: Oxford University Press.
Mendoza-Quijano, F., Mejenes, A.S.M.L., Reynoso-Rosales, V.H., Estrada, M.A.H.,
Rodríguez, M.B., 2001. Anfibios y reptiles de la sierra de Santa Rosa,
Guanajuato: cien años después. Anales del Instituto de Biología Universidad
Nacional Autónoma de México, Serie Zoología 72, 233–243.
Mendoza-Quijano, F., Vázquez Díaz, J., Quintero Díaz, G.E., 2007. Phrynosoma
orbiculare. In: IUCN 2010. IUCN Red List of Threatened Species. Version
2010.4.
Metcalfe, S.E., O'Hara, S.L., Caballero, M., Davies, S.J., 2000. Records of Late
Pleistocene-Holocene climatic change in Mexico—a review. Quaternary Sci.
Rev. 19, 699–721.
Mittermeier, R.A., Gil, P.R., Hoffman, M., Pilgrim, J., Brooks, T., Mittermeier, C.G.,
Lamoreux, J., da Fonseca, G.A.B., 2005. Hotspots Revisited: Earth's Biologically
Richest and Most Endangered Terrestrial Ecoregions. Conservation International,
Washington, D.C.
Montanucci, R.R., 1979. Notes on systematics of homed lizards allied to Phrynosoma
orbiculare (Lacertilia: Iguanidae). Herpetologica 35, 116–124.
Montanucci, R.R., 1987. A phylogenetic study of the horned lizards, genus Phrynosoma,
based on skeletal and external morphology. Contrib. Sci. Nat. Hist. Mus. Los
Angeles Co. 390, 1–36.
97
Moore, B.R., Chan, K.M.A., 2007. SymmeTREE: An application for performing whole-
tree tests of diversification, version 1.1. User manual.
http://www.phylodiversity.net/brian/software_symmetree.html.
Moore, W.S., 1995. Inferring phylogenies from mtDNA variation: mitochondrial gene
trees versus nuclear gene trees. Evolution 49, 718–726.
Morafka, D.J., 1977. A biogeographical analysis of the Chihuahuan Desert through its
herpetofauna. Biogeographica 9, 1–313.
Morando, M., Avila, L.J., Baker, J., Sites, Jr. J.W., 2004. Phylogeny and phylogeography
of the Liolaemus darwinii complex (Squamata: Liolaemidae): evidence for
introgression and incomplete lineage sorting. Evolution 58, 842–876.
Moreno-Letelier, A., Piñero, D., 2009. Phylogeographic structure of Pinus strombiformis
Engelm. across the Chihuahuan Desert filter-barrier. J. Biogeogr. 36, 121–131.
Mulcahy, D.G., Mendelson, J.R. III, 2000. Phylogeography and speciation of the
morphologically variable, widespread species Bufo valliceps, based on molecular
evidence from mtDNA. Mol. Phylgenet. Evol. 17, 173–189.
Mulcahy, D.G., Morrill, B.H., Mendelson, J.R. III, 2006. Historical biogeography of
lowland species of toads (Bufo) across the Trans-Mexican Neovolcanic Belt and
the Isthmus of Tehuantepec. J. Biogeogr. 33, 1889–1904.
Mulcahy, D.G., Spaulding, A., Mendelson, J.R., Brodie Jr., E.D., 2006. Phylogeography
of the Flat-tailed Horned lizard (Phrynosoma mcallii) and systematics of the P.
mcallii–platyrhinos mtDNA complex. Mol. Ecol. 15, 1807–1826.
98
Murphy, R.W., Trepanier, T.L., Morafka, D.J., 2006. Conservation genetics, evolution
and distinct population segments of the Mojave fringe-toed lizard, Uma scoparia.
J. Arid Environ. 67, 226–247.
Neiswenter, S.A., Riddle, B.R., 2010. Diversification of the Perognathus flavus species
group in emerging arid grasslands of western North America. J. Mammal. 91,
348–362.
Nylander, J.A.A., 2004. MRMODELTEST v2. Program distributed by the author.
Evolutionary Biology Centre, Uppsala University, Uppsala.
Nylander, J.A.A., Wilgenbusch, J.C., Warren, D.L., Swofford, D.L., 2008. AWTY (are
we there yet?): a system for graphical exploration of MCMC convergence in
Bayesian phylogenetic inference. Bioinformatics 24, 581–583.
Paniagua, L.L., Morrone, J.J., 2009. Do the Oaxacan Highlands represent a natural biotic
unit? A cladistic biogeographical test based on vertebrate taxa. J. Biogeogr. 36,
1939–1944.
Pellmyr, O., Segraves, K.A., 2003. Pollinator divergence within an obligate mutualism:
two yucca moth species (Lepidoptera; Prodoxidae: Tegeticula) on the Joshua tree
(Yucca brevifolia; Agavaceae). Annals Entomol. Soc. America 96, 716–722.
Peterson, A.T., Flores-Villela, O.A., León-Paniagua, L.S., Llorente- Bousquets, J.E.,
Luis-Martinez, M.A., Navarro-Siguenza, A.G., Torres-Chavez, M.G., Vargas-
Fernandez, I., 1993. Conservation priorities in northern Middle America: moving
up in the world. Biodiversity Letters 1, 33–38.
Presch, W., 1969. Evolutionary osteology and relationships of the horned lizard genus
Phrynosoma (Family Iguanidae). Copeia 1969, 250–275.
99

Pyron, R.A., Burbrink, F.T., 2009. Lineage diversification in a widespread species: roles
for niche divergence and conservatism in the common kingsnake, Lampropeltis
getula. Mol. Ecol. 18, 3443–3457.
Pyron, R.A., Burbrink, F.T., 2010. Hard and soft allopatry: physically and ecologically
mediated modes of geographic speciation. J. Biogeogr. 37, 2005–2015.
Rabosky, D.L., 2006a. Likelihood methods for inferring temporal shifts in diversification
rates. Evolution 60, 1152–1164.
Rabosky, D.L., 2006b. LASER: a maximum likelihood toolkit for detecting temporal
shifts in diversification rates from molecular phylogenies. Evol. Bioinformatics
Online 2, 257–260.
Ramamoorthy, T., Bye, R., Lot, A., Fa, J., 1993. Biological Diversity of Mexico: Origins
and Distribution. Oxford University Press, Oxford.
Rambaut, A., Drummond, A.J., 2007. TRACER v1.4. Available at:
http://beast.bio.ed.ac.uk/Tracer
Ree, R.H., Smith, S.A., 2008. Maximum-likelihood inference of geographic range
evolution by dispersal, local extinction, and cladogenesis. Sys. Biol. 57, 4–14.
Riddle, B.R., Hafner, D.J., Alexander, L.F., Jaeger, J.R., 2000a. Cryptic vicariance in the
historical assembly of a Baja California peninsular desert biota. Proc Natl Acad
Sci USA 97, 14438–14443.
Riddle, B.R., Hafner, D.J., Alexander, L.F., 2000b. Phylogeography and systematics of
the Peromyscus eremicus species group and the historical biogeography of North
American warm regional deserts. Mol. Phylogenet. Evol. 17, 145–160.
100

Riddle, B.R., Dawson, M.N., Hadly, E.A., Hafner, D.J., Hickerson, M.J., Mantooth, S.J.,
Yoder, A.D., 2008. The role of molecular genetics in sculpting the future of
integrative biogeography. Progress Phys. Geogr. 32, 173–202.
Robinson, M.D., Van Devender, T.R., 1973. Miocene lizards from Wyoming and
Nebraska. Copeia 1973, 698–704.
Rogers, K.L., 1976. Herpetofauna of the Beck Ranch local fauna (upper Pliocene:
Blancan) of Texas. Publ. Mus. Michigan State Univ. Paleontological Ser. 1, 167–
200.
Ronquist, F., Huelsenbeck, J.P., 2003. MRBAYES 3: Bayesian phylogenetic inference
under mixed models. Bioinformatics 19, 1572–1574.
Rosas-Elguera, J., Alva-Valdivia, L., Goguitchaichvili, A., et al., 2003. Counterclockwise
rotation of the Michoacan Block: implications for the tectonics of western
Mexico. Int. Geol. Rev. 45, 814–826.
Ruiz, E.A., Rinehart, J.E., Hayes, J.L., Zuñiga, G., 2010. Historical demography and
phylogeography of a specialist bark beetle, Dendroctonus pseudotsugae Hopkins
(Curculionidae: Scolytinae). Environ. Entomol. 39, 1685–1697.
Salinas-Moreno, Y., Mendoza-Correa, G., Barrios, M.A., Cisneros, R., Macías-Sámano,
J., Zúñiga, G., 2004. Areography of the genus Dendroctonus (Coleoptera:
Curculionidae: Scolytinae) in México. J. Biogeogr. 31, 1163–1177.
SEMARNAT, 2010. Norma Oficial Mexicana NOM-059-SEMARNAT-2010, Protección
ambiental-Especies nativas de México de flora y fauna silvestres-Categorías de
riesgo y especificaciones para su inclusión, exclusión o cambio-Lista de especies
en riesgo. México. Jueves 30 de diciembre de 2010.
101

Shafer, A.B.A., Cullingham, C.I., Côté, S.D., Coltman, D.W., 2010. Of glaciers and
refugia: A decade of study sheds new light on the phylogeography of
northwestern North America. Mol. Ecol. 19, 4589–4621.
Sherbrooke, W.C., 2003. Introduction to Horned Lizards of North America. University of
California Press, CA.
Sinervo, B., Méndez de la Cruz, F., Miles, D.B., et al., 2010. Erosion of lizard diversity
by climate change and altered thermal niches. Science 328, 894–899.
Smith, H.M., Camarillo, J.L.R., Chiszar, D., 1993. The status of the members of the
Sceloporus aeneus complex (Reptilia: Sauria) of Mexico. Bull. Maryland
Herpetol. Soc. 29, 130–139.
Smith, H.M., Watkins-Colwell, G.J., Liner, E.A., Chiszar, D., 1996. Sceloporus scalaris
auctorum a superspecies (Reptilia: Sauria). Bull. Maryland. Herpetol. Soc. 32,
70–74.
Smith, H.M., Watkins-Colwell, G.J., Lemos-Espinal, J.A., Chiszar, D., 1997. A new
subspecies of the lizard Sceloporus scalaris (Reptilia: Sauria: Phrynosomatidae)
from the Sierra Madre Occidental of Mexico. Southwest. Nat. 42, 290–301.
Soltis, D.E., Morris, A., McLachlan, J.S., Manos, P.S., Soltis, P.S., 2006. Comparative
phylogeography of unglaciated eastern North America. Mol. Ecol. 15, 4261–
4293.
Stamatakis, A., 2006. RAxML-VI-HPC: Maximum likelihood-based phylogenetic
analyses with thousands of taxa and mixed models. Bioinformatics 22, 2688–
2690.
102
Sullivan, J., Arellano, E., Rogers, D.S., 2000. Comparative phylogeography of
Mesoamerican highland rodents: concerted versus independent response to past
climatic fluctuations. Am. Nat. 155, 755–768.
Tennessen, J.A., Zamudio, K.R., 2008. Genetic differentiation among mountain island
populations of the striped plateau lizard, Sceloporus virgatus (Squamata:
Phrynosomatidae). Copeia 2008, 558–564.
Upton, D.E., Murphy, R.W., 1997. Phylogeny of the side-blotched lizards
(Phrynosomatidae: Uta) based on mtDNA sequences: support for a
midpeninsular seaway in Baja California. Mol. Phylgenet. Evol. 8, 104–113.
Van Devender, T.R., Eshelman, R.E., 1979. Referral of the fossil lizard Sceloporus
holmani (late Pliocene of north-central Kansas) to the genus Phrynosoma.
Herpetologica 35, 380–382.
Watkins-Colwell, G.J., Smith, H.M., Chiszar, D., 1996. Geographic distribution.
Sceloporus scalaris scalaris. Herpetol. Rev. 27, 153.
Watkins-Colwell, G.J., Smith, H.M., Chiszar, D., 2005. Sceloporus scalaris. Cat. Am.
Amphibians Reptiles 814, 1–10.
Webb, T. III, Bartlein, P.J., 1992. Global changes during the last 3 million years, climatic
controls and biotic responses. Annu. Rev. Ecol. Syst. 23, 141–173.
Weir, J.T., Bermingham, E., Miller, M.J., Klicka, J., González, M.A., 2008.
Phylogeography of a morphologically diverse Neotropical montane species, the
common bush-tanager (Chlorospingus ophthalmicus). Mol. Phylogenet. Evol. 47,
650–664.
103
Wiens, J.J., 2004. Speciation and ecology revisited: phylogenetic niche conservatism and
the origin of species. Evolution 58, 193–197.
Wiens, J.J., Reeder, T.W., 1997. Phylogeny of the spiny lizards (Sceloporus) based on
molecular and morphological evidence. Herpetol. Monog. 11, 1–101.
Wiens, J.J., Parra-Olea, G., García-París, M., Wake, D.B., 2007. Phylogenetic history
underlies elevational patterns of biodiversity in tropical salamanders. Proc. R.
Soc. London 274, 919–928.
Wiens, J.J., Kuczynski, C.A., Arif, S., Reeder, T.W., 2010. Phylogenetic relationships of
phrynosomatid lizards based on nuclear and mitochondrial data, and a revised
phylogeny for Sceloporus. Mol. Phylgenet. Evol. 54, 150–161.
Yatkola, D.A., 1976. Mid-Miocene lizards from Western Nebraska. Copeia 1976, 645–
654.
Zaldivar-Riverón, A., Nieto-Montes de Oca, A., 2002. Variation in the rare lizard Barisia
rudicollis (Anguidae) (Wiegmann) with the description of a new species from
Central Mexico. Herpetologica 58, 313–326.
Zaldivar-Riverón, A., Nieto-Montes de Oca, A., Laclette, J.P., 2005. Phylogeny and
evolution of dorsal pattern in the Mexican endemic lizard genus Barisia
(Anguidae: Gerrhonotinae). J. Zoo. Syst. Evol. Res. 43, 243–257.
Zink, R.M., Barrowclough, G.F., 2008. Mitochondrial DNA under siege in avian
phylogeography. Mol. Ecol. 17, 2107–2121.
104
VITA
Graduate College University of Nevada Las Vegas
Robert W. Bryson, Jr.
Degrees: Bachelor of Science, 1998 Sul Ross State University, Alpine, TX Master of Science, 2002 Sul Ross State University, Alpine, TX Select First-authored Publications: Bryson R. W., R. W. Murphy, M. R. Graham, A. Lathrop, and D. Lazcano-Villareal.
In press. Historical diversification of the Crotalus intermedius group and Pleistocene pine-oak woodland connections between Mexico’s Sierra Madre Occidental and Sierra Madre Oriental. Journal of Biogeography.
Bryson, R. W., U. O. García-Vázquez, and B. R. Riddle. 2011. Phylogeography of Middle American gophersnakes: mixed responses to biogeographical barriers across the Mexican Transition Zone. Journal of Biogeography 38: 1570-1584.
Bryson, R. W., R. W. Murphy, A. Lathrop, and D. Lazcano-Villareal. 2011. Evolutionary drivers of phylogeographical diversity in the highlands of Mexico: a case study of the Crotalus triseriatus species group of montane rattlesnakes. Journal of Biogeography 38: 697-710.
Bryson, R. W., A. Nieto-Montes de Oca, J. R. Jaeger, and B. R. Riddle. 2010. Elucidation of cryptic diversity in a widespread Nearctic treefrog reveals episodes of mitochondrial gene capture as frogs diversified across a dynamic landscape. Evolution 64: 2315-2330.
Bryson, R. W., and M. R. Graham. 2010. A new alligator lizard from northeastern Mexico. Herpetologica 66: 92-98.
Bryson, R. W., J. M. Mueller, and D. Lazcano. 2008. Observations on the thermal ecology of montane Mexican rattlesnakes, p. 287–290. In: The Biology of the Rattlesnakes. W. K. Hayes, K. R. Beaman, M. D. Cardwell, and S. P. Bush (eds.).
Bryson, R. W., A. Nieto-Montes, and J. Reyes-Velasco. 2008. Phylogenetic position of Porthidium hespere (Viperidae: Crotalinae) and phylogeography of arid- adapted hognosed pitvipers based on mitochondrial DNA. Copeia 2008: 170-176.
Bryson, R. W., and F. Mendoza-Quijano. 2007. Cantils of Hidalgo and Veracruz, Mexico, with comments on the validity of Agkistrodon bilineatus lemosespinali. Journal of Herpetology 41: 536-539.
105
Bryson, R. W., J. Pastorini, F. T. Burbrink, and M. R. J. Forstner. 2007. A phylogeny of the Lampropeltis mexicana complex (Serpentes: Colubridae) based on mitochondrial DNA sequences suggests evidence for species-level polyphyly within Lampropeltis. Molecular Phylogenetics and Evolution 43: 674-684.
Bryson, R. W., H. M. Smith, and J. Lemos-Espinal. 2005. Taxonomic status of the Madrean alligator lizard of the Sierra del Nido, Chihuahua, México (Lacertilia: Anguidae). Southwestern Naturalist 50: 497-498.
Bryson, R. W., J. R. Dixon, and D. Lazcano. 2005. New species of Lampropeltis (Serpentes: Colubridae) from the Sierra Madre Occidental, México. Journal of Herpetology 39: 207-214.
Bryson, R. W., G. Ulises, and D. Lazcano. 2003. Observations on a population of Mexican lance-headed rattlesnake (Crotalus polystictus) from an agricultural area in the Mexican state of México. Herpetological Review 34: 313-314.
Bryson, R. W., and D. Lazcano. 2002. Reproduction and mating behavior in the Del Nido ridgenose rattlesnake, Crotalus willardi amabilis. Southwestern Naturalist 47: 310-311.
Dissertation Title: Historical Diversification of Montane Herpetofauna Within and
Between the Sierras of Mexico Dissertation Examination Committee: Chair, Dr. Brett R. Riddle Committee Member, Dr. John Klicka Committee Member, Dr. Brian Hedlund Outside Committee Member, Dr. Jonathan A. Campbell Graduate Faculty Representative, Dr. Steve Rowland
106