Embed Size (px)
Citation preview
Date 22.04.2009
faculty of arts
Historical changes in long-distance movement constructions
A Multinomial Logistic Regression Analysis
Ankelien Schippers
Date 22.04.2009
faculty of arts
Outline
1. Multinomial logistic regression2. Long-distance movement3. The data4. Analysis5. Results
Date 22.04.2009
faculty of arts
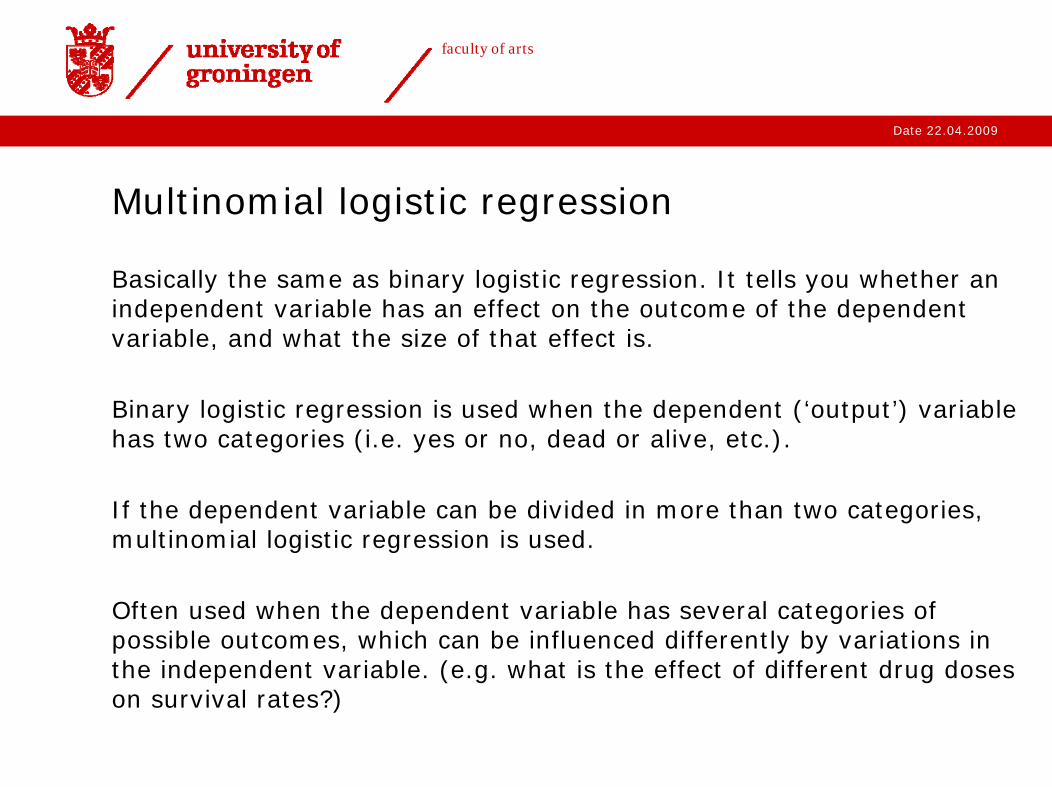
Multinomial logistic regression
Basically the same as binary logistic regression. It tells you whether an independent variable has an effect on the outcome of the dependent variable, and what the size of that effect is.
Binary logistic regression is used when the dependent (‘output’) variable has two categories (i.e. yes or no, dead or alive, etc.).
If the dependent variable can be divided in more than two categories, multinomial logistic regression is used.
Often used when the dependent variable has several categories ofpossible outcomes, which can be influenced differently by variations in the independent variable. (e.g. what is the effect of different drug doses on survival rates?)

Date 22.04.2009
faculty of arts
Assumptions
The independent variable may either be numerical or categorical
The dependent variable has to be categorical, i.e. it must be possible to divide the responses into different categories.
The data do not need to have a normal distribution, no linear relationship and no equality of variances.
Date 22.04.2009
faculty of arts
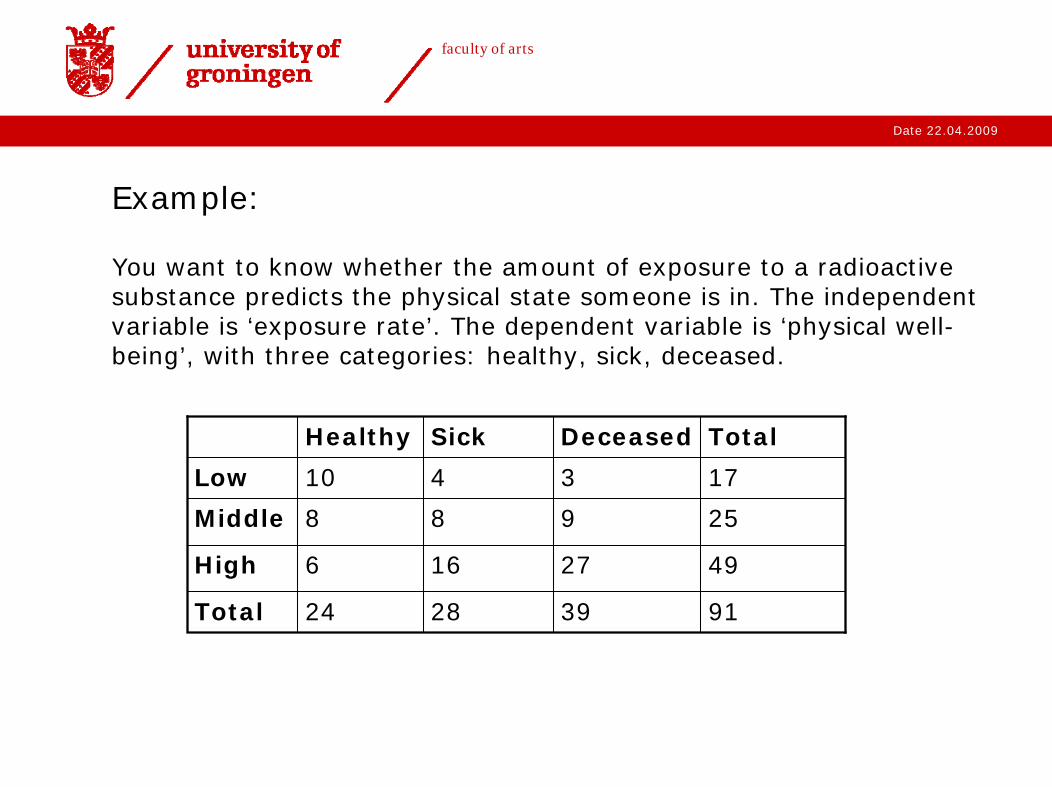
Example:
You want to know whether the amount of exposure to a radioactivesubstance predicts the physical state someone is in. The independent variable is ‘exposure rate’. The dependent variable is ‘physical well-being’, with three categories: healthy, sick, deceased.
Healthy Sick Deceased Total
Low 10 4 3
9
27
39
Middle 8 8
17
25
49High 6 16
Total 24 28 91
Date 22.04.2009
faculty of arts
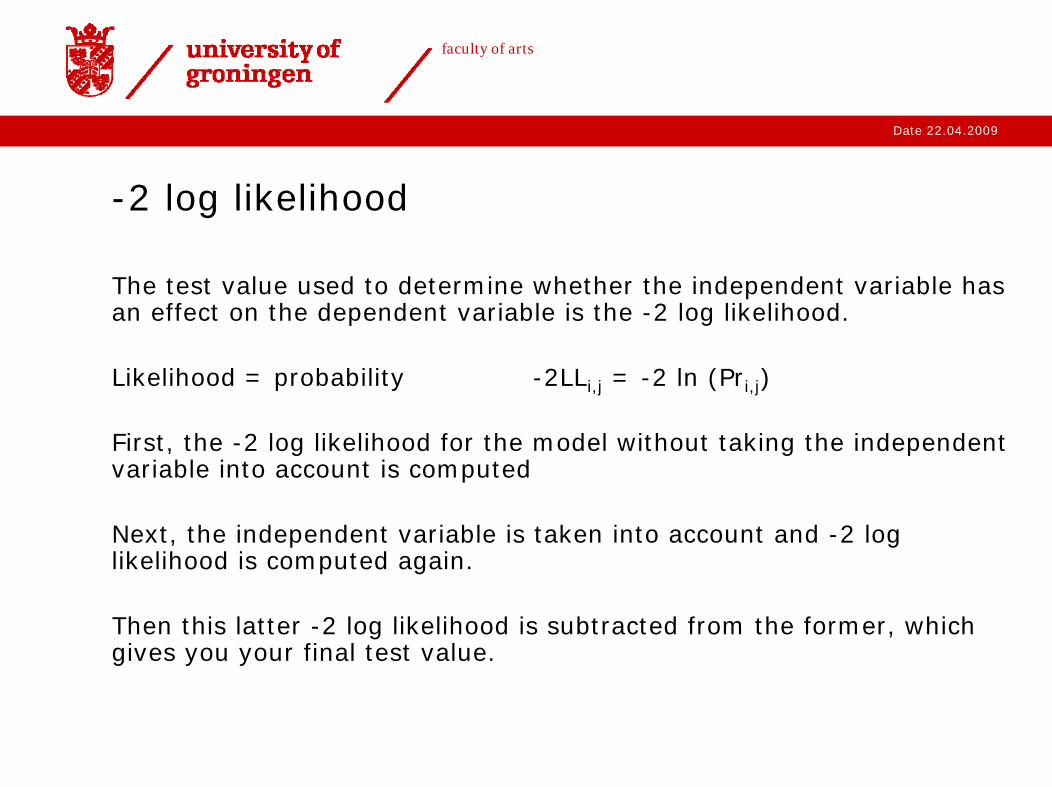
-2 log likelihood
The test value used to determine whether the independent variable has an effect on the dependent variable is the -2 log likelihood.
Likelihood = probability -2LLi,j = -2 ln (Pri,j)
First, the -2 log likelihood for the model without taking the independent variable into account is computed
Next, the independent variable is taken into account and -2 log likelihood is computed again.
Then this latter -2 log likelihood is subtracted from the former, which gives you your final test value.
Date 22.04.2009
faculty of arts
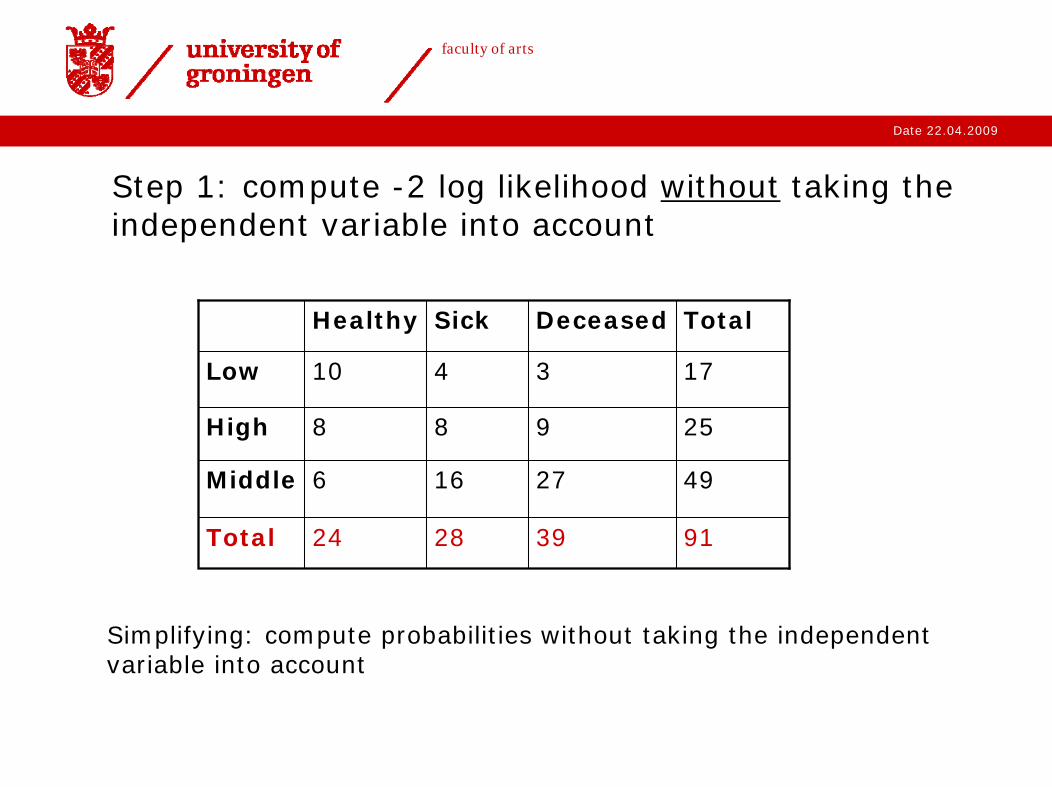
Step 1: compute -2 log likelihood without taking the independent variable into account
Healthy Sick Deceased Total
Low 10 4 3
9
27
39
High 8 8
17
25
49Middle 6 16
Total 24 28 91
Simplifying: compute probabilities without taking the independent variable into account
Date 22.04.2009
faculty of arts
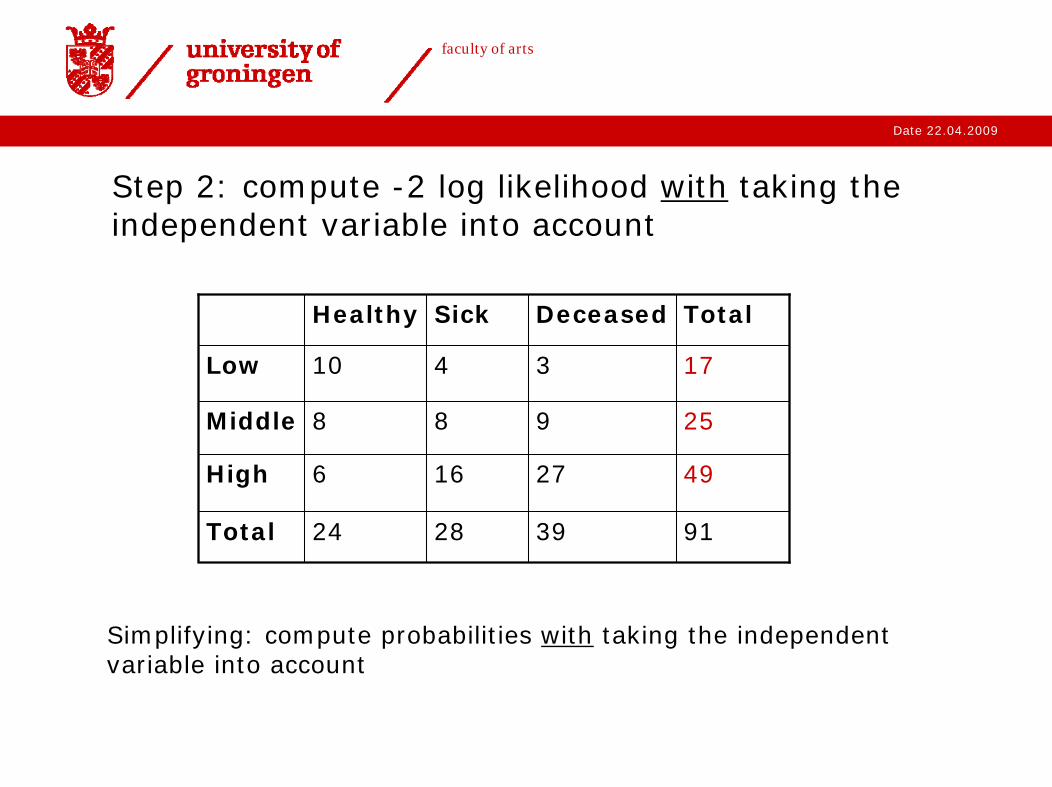
Step 2: compute -2 log likelihood with taking the independent variable into account
Healthy Sick Deceased Total
Low 10 4 3
9
27
39
Middle 8 8
17
25
49High 6 16
Total 24 28 91
Simplifying: compute probabilities with taking the independent variable into account
Date 22.04.2009
faculty of arts
Interpretation
The -2 log likelihood has a chi-square distribution, which can be used to determine whether the outcome of the test is significant.
If the two -2 log likelihoods are the same, subtracting them amounts to 0 and the result is not significant
Hence, if the -2 log likelihood (“probabilities”) for the model that takes de independent variable into account is the same as the one in which that variable wasn’t taking into account, the independent variable had no effect on the outcome of the dependent variable.
If the two -2 log likelihoods are different, subtractions them gives you a value < 0 >

Date 22.04.2009
faculty of arts
SPSS procedure
Date 22.04.2009
faculty of arts
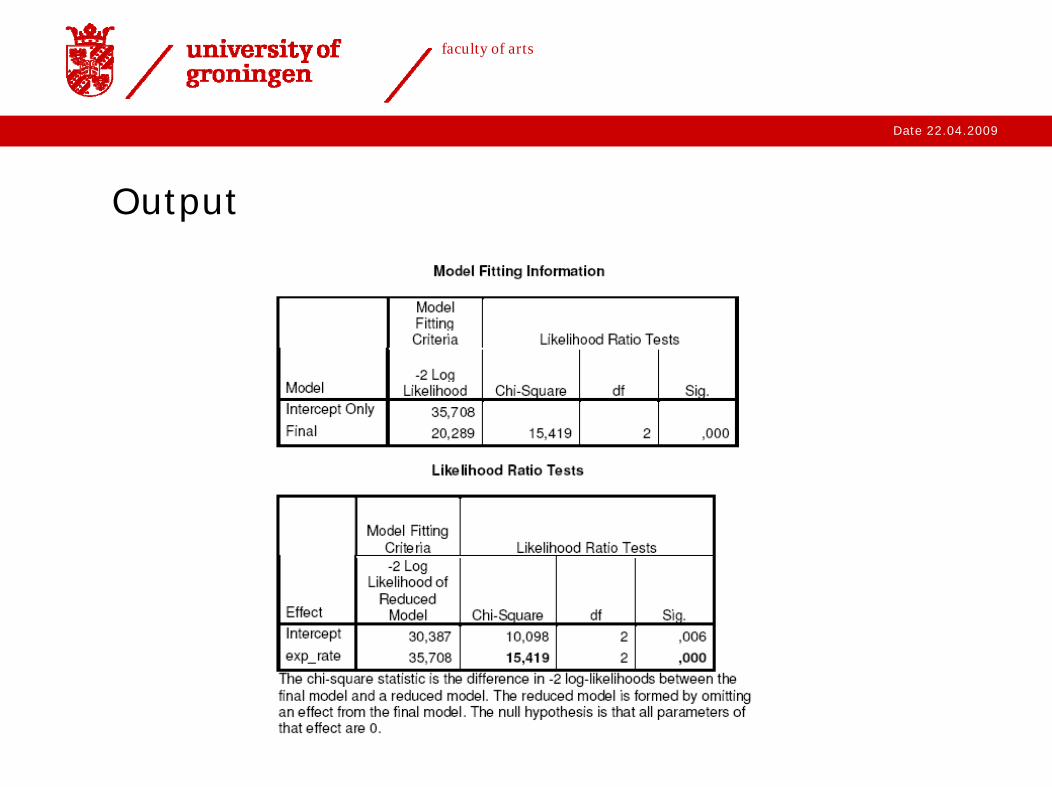
Output
Date 22.04.2009
faculty of arts
Post-hoc
The -2 LL showed that the independent variable has an effect on the dependent variable. Now we want to know whether that effect is the same or not for each of the categories of the dependent variable. That is: does exposure rate have the same effect of being healthy/sick/alive?
In order to determine that, we make a series of comparisons between two categories of the dependent variable (e.g. healthy vs. sick, healthy vs. dead, etc).
SPSS gives the option of choosing a reference category for thesecomparisons. I chose category 1 (= healthy).
To compare two categories, the ODDS ratio’s are computed, which SPSS gives in terms of a β1 value.
Date 22.04.2009
faculty of arts
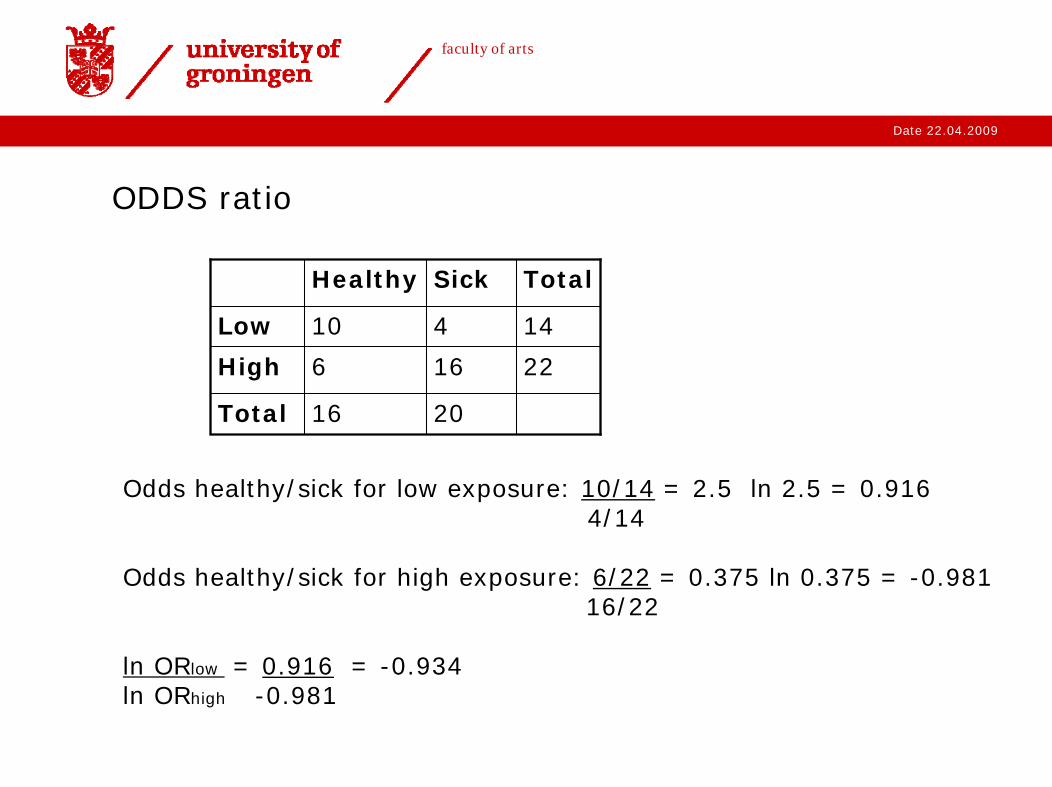
ODDS ratio
Healthy Sick Total
Low 10 4 14
22High 6 16
Total 16 20
Odds healthy/sick for low exposure: 10/14 = 2.5 ln 2.5 = 0.9164/14
Odds healthy/sick for high exposure: 6/22 = 0.375 ln 0.375 = -0.98116/22
ln ORlow = 0.916 = -0.934ln ORhigh -0.981
Date 22.04.2009
faculty of arts
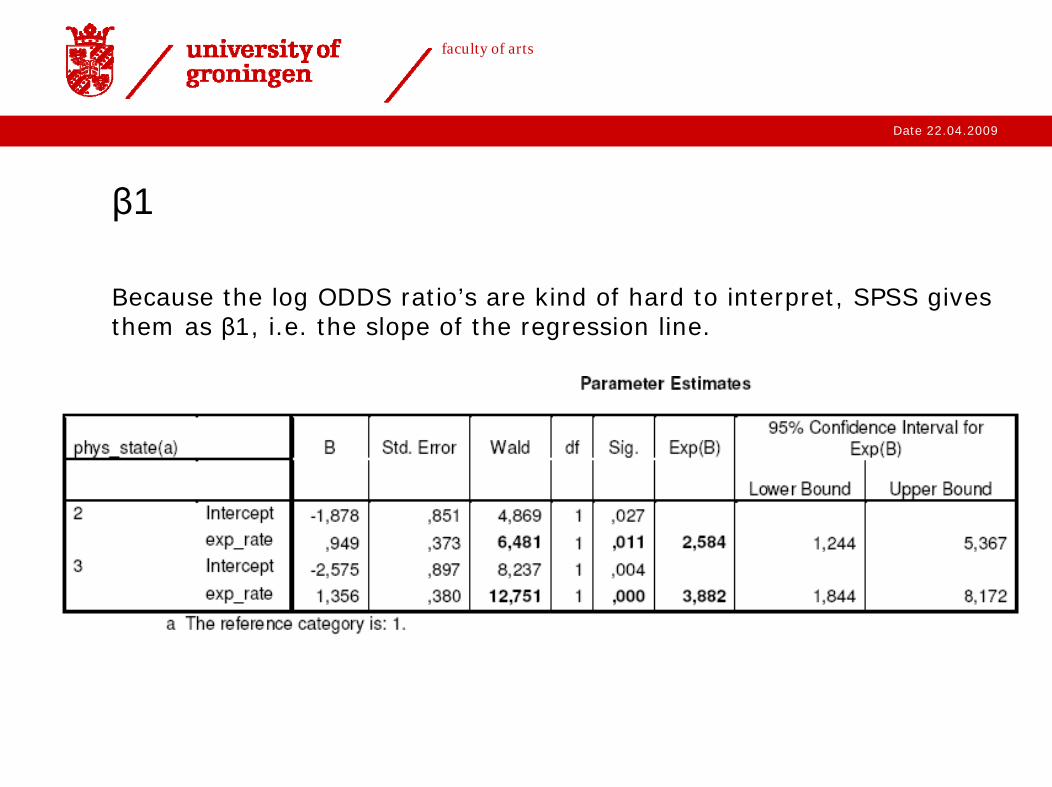
β1
Because the log ODDS ratio’s are kind of hard to interpret, SPSS gives them as β1, i.e. the slope of the regression line.
Date 22.04.2009
faculty of arts
Interpretation of β1
β1 represent the probability of a change in the reference group versus a change in the comparison group as the independent variable changes.
category 1(healthy) vs 2(sick) β1 = 2.584.
‘the chance of being healthy versus the chance of being sick increases with 1:2.584 as the independent variable increases’.
So if the exposure rate increases, the probability of getting sick is greater than the probability of staying healthy.
Date 22.04.2009
faculty of arts
Why use logistic regression instead of normal regression?
Most important reason: if your dependent variable has two or more categories, the probability of falling in one of these categories should be >0 and <1. Transforming your data into odds ratio’s expresses this fact naturally, while the untransformed data does not.
Another reasons to use logistic regression may be that your dataviolates certain requirements to do normal regression: for example, if the data do not form a linear pattern.
Date 22.04.2009
faculty of arts
Long-distance movement
Generative grammar: dependency relations are analyzed as involving movement
Canonical example: wh-movement
Declarative:John kissed Mary
Wh-question:Who did Mary kiss twho? Who = John
We speak of long-distance movement if the dependency relation spans more than one clause: e.g. a wh-word moves from a suborindate clause into a matrix clause:
[CP Who do you think [CP twho kissed Mary]] (CP = clause)
Date 22.04.2009
faculty of arts
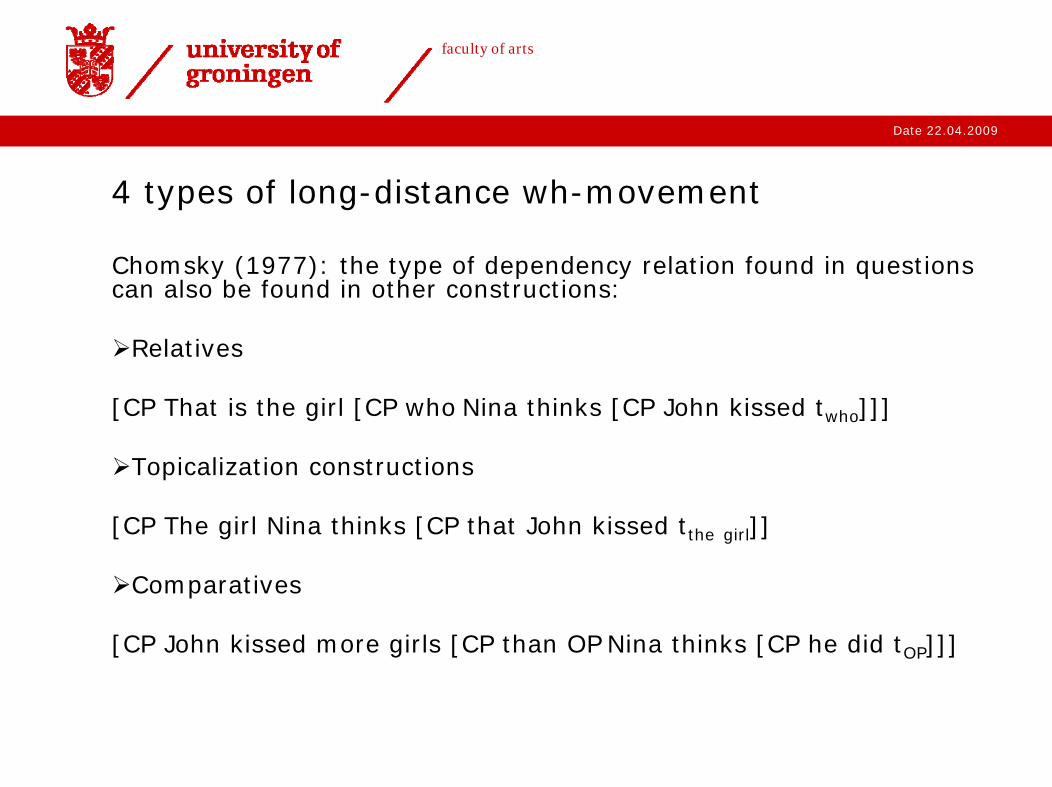
4 types of long-distance wh-movement
Chomsky (1977): the type of dependency relation found in questions can also be found in other constructions:
Relatives
[CP That is the girl [CP who Nina thinks [CP John kissed twho]]]
Topicalization constructions
[CP The girl Nina thinks [CP that John kissed tthe girl]]
Comparatives
[CP John kissed more girls [CP than OP Nina thinks [CP he did tOP]]]
Date 22.04.2009
faculty of arts
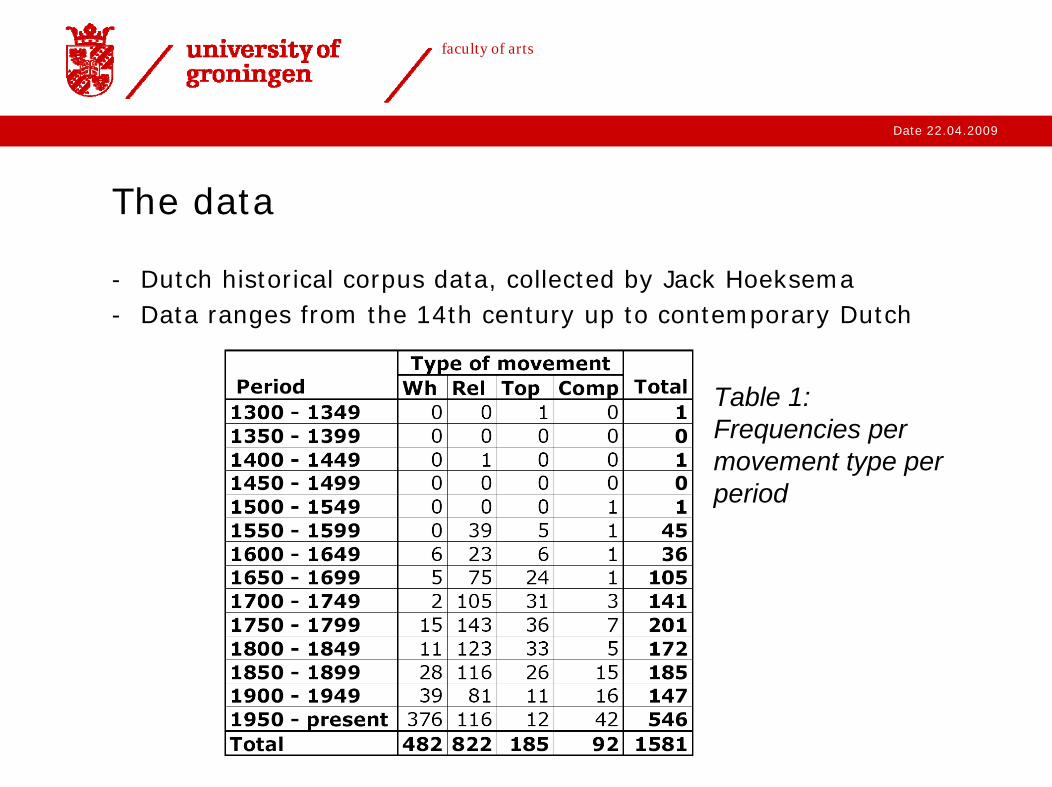
The data
- Dutch historical corpus data, collected by Jack Hoeksema- Data ranges from the 14th century up to contemporary Dutch
Table 1: Frequencies per movement type per period
Date 22.04.2009
faculty of arts
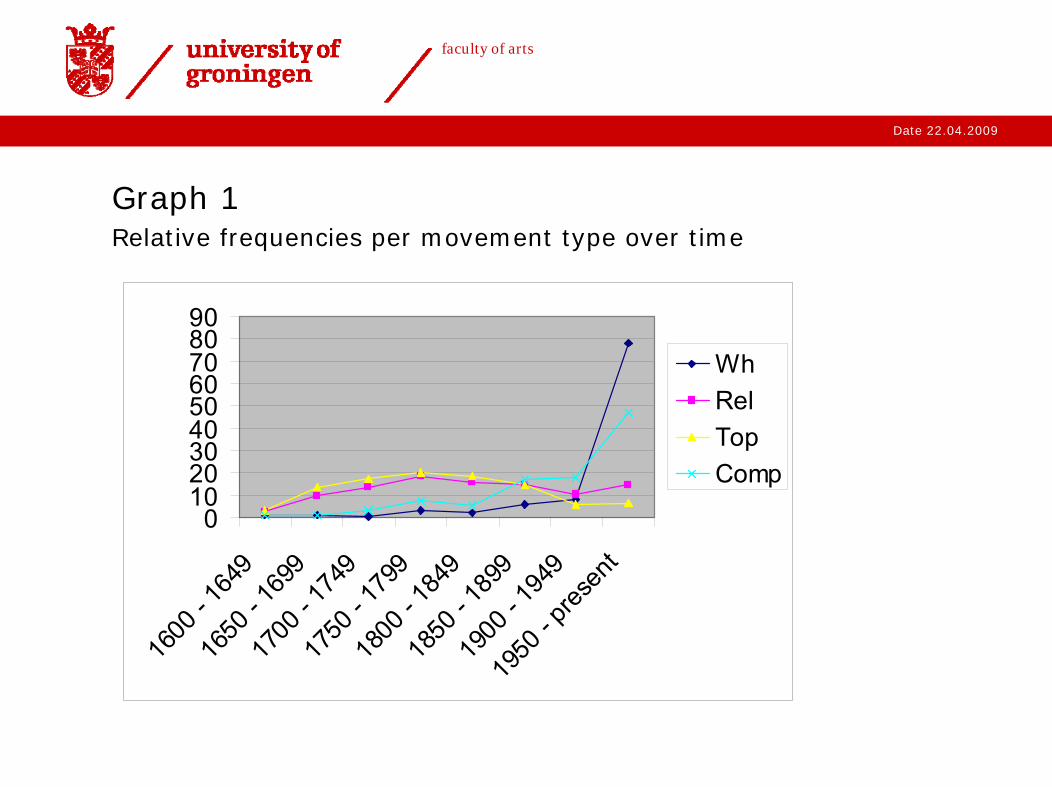
Graph 1Relative frequencies per movement type over time
0102030405060708090
1600
- 164
916
50 - 1
699
1700
- 174
917
50 - 1
799
1800
- 184
918
50 - 1
899
1900
- 194
9
1950
- pres
ent
WhRelTopComp
Date 22.04.2009
faculty of arts
Research question
Do the four types of long-distance movement constructions develop the same over type?
Rephrasing it: does the independent variable [PERIOD] have the same effect on the frequencies of the four types of LD movement?
Date 22.04.2009
faculty of arts
Points of caution
>Very little data before 1600, so these were omitted.>type of text genre that was investigated is not the same for each period.>data were collected manually, which means the data might be distorted due to human error.>some types of long-distance movement simply occur more frequently, e.g. questions are normally used more often than comparatives.
the last issue can be overcome by performing a regression analysis, which compares changes in two or more variables, and not absolute values
Date 22.04.2009
faculty of arts
why use logistic regression in this case?
the data did not comply with the requirements to perform a normal regression analysis (residuals showed a pattern)
chi-square only tells you whether one variable has an effect on the other, but not what the strength or the direction of that effect is.
Logistic regression does.
SPSS multinomial logistic regression procedure:LD movement type = dependent variablePeriod = the independent variable, entered as a covariate.
Date 22.04.2009
faculty of arts
Results
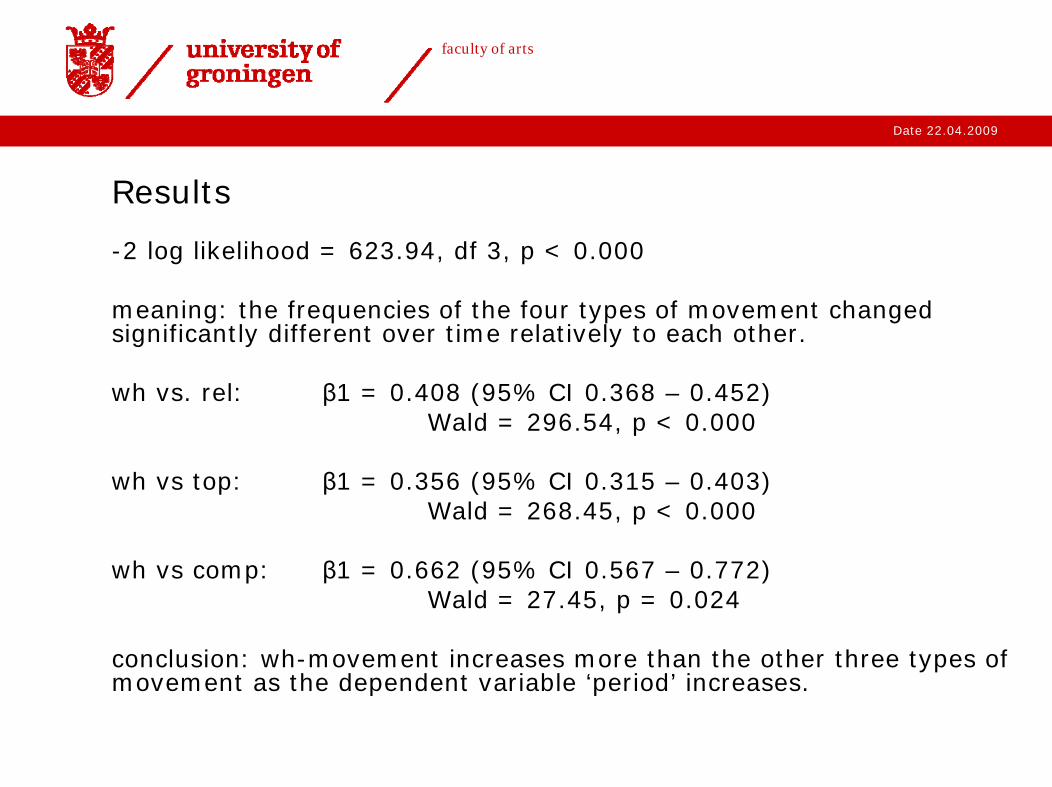
-2 log likelihood = 623.94, df 3, p < 0.000
meaning: the frequencies of the four types of movement changed significantly different over time relatively to each other.
wh vs. rel: β1 = 0.408 (95% CI 0.368 – 0.452)Wald = 296.54, p < 0.000
wh vs top: β1 = 0.356 (95% CI 0.315 – 0.403)Wald = 268.45, p < 0.000
wh vs comp: β1 = 0.662 (95% CI 0.567 – 0.772)Wald = 27.45, p = 0.024
conclusion: wh-movement increases more than the other three types of movement as the dependent variable ‘period’ increases.
Date 22.04.2009
faculty of arts
Results (continued)
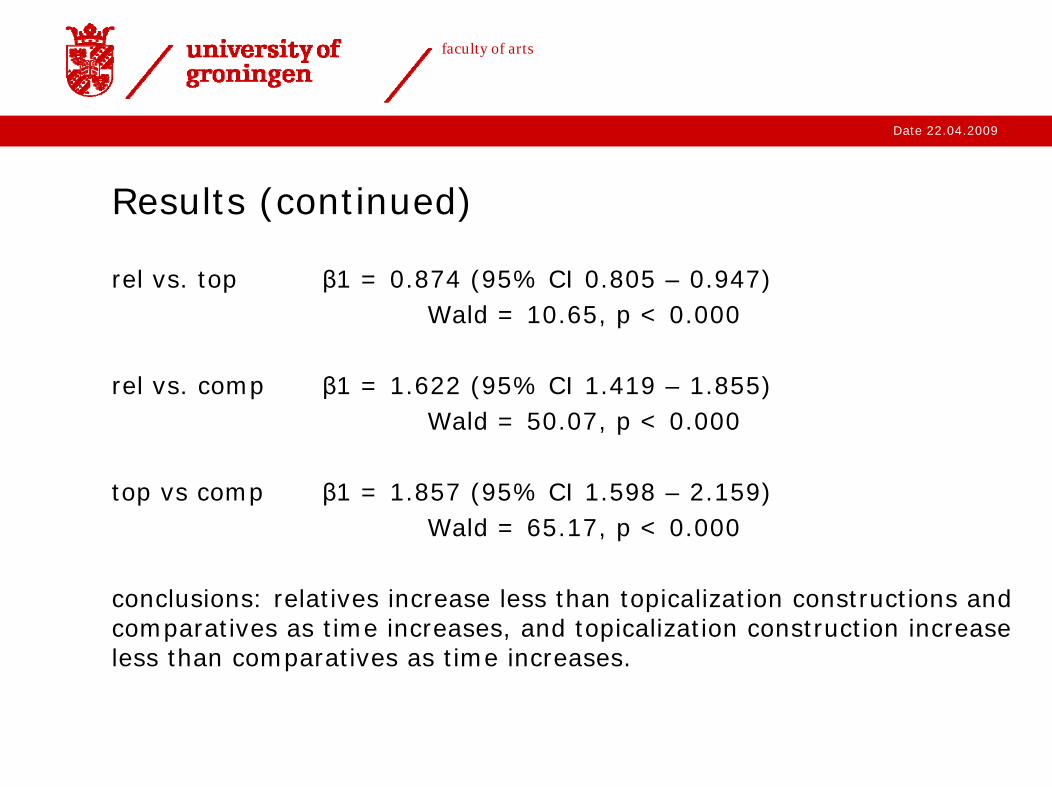
rel vs. top β1 = 0.874 (95% CI 0.805 – 0.947)Wald = 10.65, p < 0.000
rel vs. comp β1 = 1.622 (95% CI 1.419 – 1.855)Wald = 50.07, p < 0.000
top vs comp β1 = 1.857 (95% CI 1.598 – 2.159)Wald = 65.17, p < 0.000
conclusions: relatives increase less than topicalization constructions and comparatives as time increases, and topicalization construction increase less than comparatives as time increases.
Date 22.04.2009
faculty of arts
Back to graph 1
0102030405060708090
1600
- 164
916
50 - 1
699
1700
- 174
917
50 - 1
799
1800
- 184
918
50 - 1
899
1900
- 194
9
1950
- pres
ent
WhRelTopComp
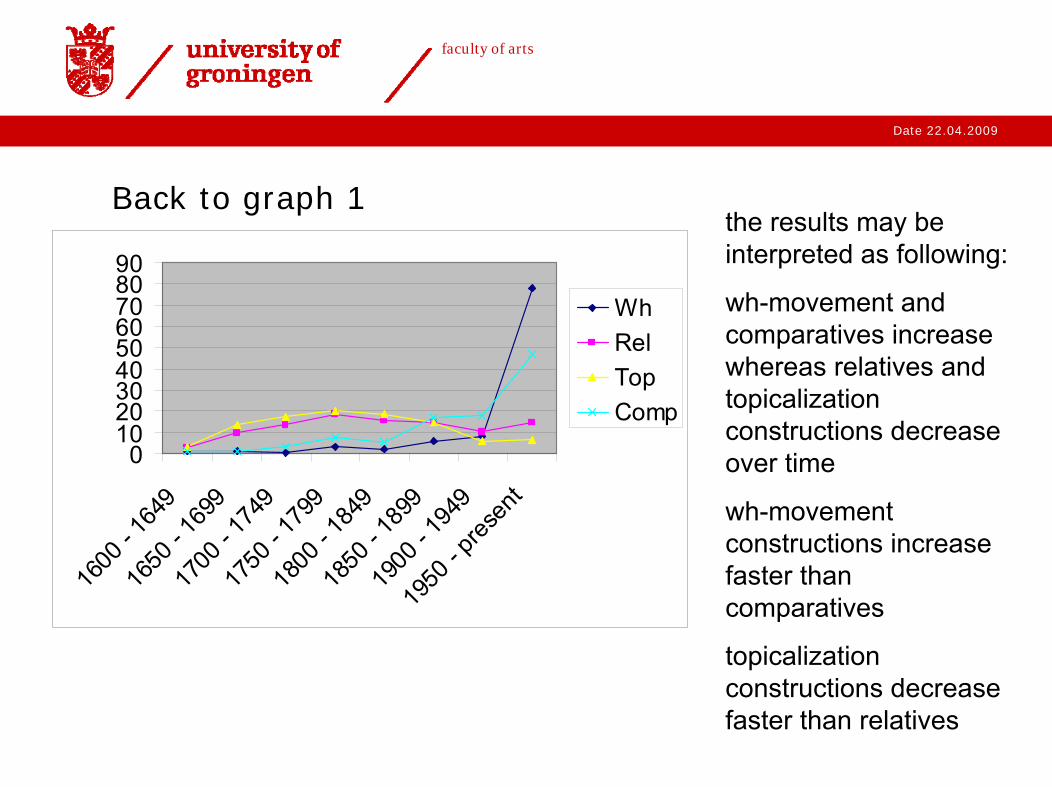
the results may be interpreted as following:
wh-movement and comparatives increase whereas relatives and topicalization constructions decrease over time
wh-movement constructions increase faster than comparatives
topicalization constructions decrease faster than relatives
Date 22.04.2009
faculty of arts
Further reading
Field, A. (2009). Discovering statistics using SPSS. (third edition has a section on multinomial logistic regression)