Embed Size (px)
Citation preview
Hiring, Compensation and Benefits
Report 2021
IntroductionScope and methodology Section 1: Market expectations and hiring planSection 2: Recent hiring and candidate attractionSection 3: Pay adjustment forecast in 2021
Industry snapshotBy job function:
AccountingClerical / Secretarial / OperationExecutive / General ManagementHuman Resources & AdministrationInformation TechnologyDigital Marketing, E-Commerce & Social MediaMarketing & BrandingCorporate Sales & Business DevelopmentMedia/ Advertising DesignFinanceEngineering Hospitality / Tourism Food & BeverageTransportation & LogisticsMerchandisingRetail SalesBeauty Care / Health EducationCustomer ServicesLegal / ComplianceAnalytics
Section 4: BonusesSection 5: BenefitsSection 6: Work-from-home and related policies
Table of Contents
33
To assist HR professionals in devising their human resource planning for the coming year, JobsDB conducted a Hiring, Compensation & Benefits Survey in Q3 2020, in conjunction with Acorn Marketing & Research Consultants (International) Limited. This survey captures the most updated information from 436 corporations across different industries in Hong Kong.
This report provides an up-to-date overview of the industry practices in different dimensions :
• Hiring intentions and strategies regarding full-time employees and part-time / temporary employees
• Hiring strategies regarding fresh graduates, Mainland Chinese and expatriates
• Pay rates and predicted adjustments in the coming year
• Bonus payout quantum
• Various types of fringe benefits and arrangement including key work-life benefits, family-friendly benefits, accommodation benefits and career development opportunities and COVID-19 staff policy
Introduction
Disclaimer
The information provided in this report is for reference only. Whilst JobsDB endeavors to ensure the accuracy of the information in this report, no express or implied warranty
is given by JobsDB as to the accuracy of the information. JobsDB shall not be liable for any damages (including, without limitation, damages for loss of business or loss of
profits) arising in contract, tort or otherwise from the use of or inability to use this report, or any material contained in it, or from any action or decision taken as a result of
using this report or any such material.
44
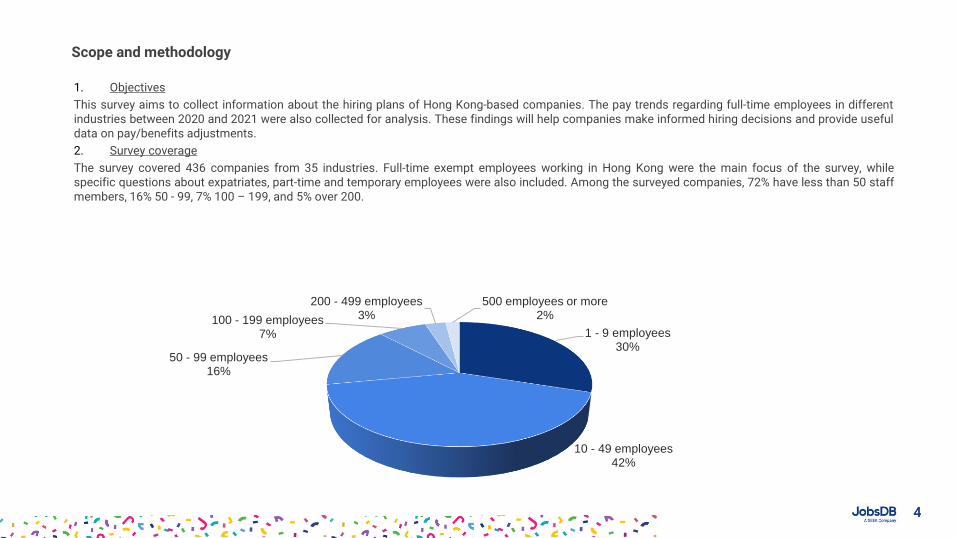
1. Objectives
This survey aims to collect information about the hiring plans of Hong Kong-based companies. The pay trends regarding full-time employees in differentindustries between 2020 and 2021 were also collected for analysis. These findings will help companies make informed hiring decisions and provide usefuldata on pay/benefits adjustments.
2. Survey coverage
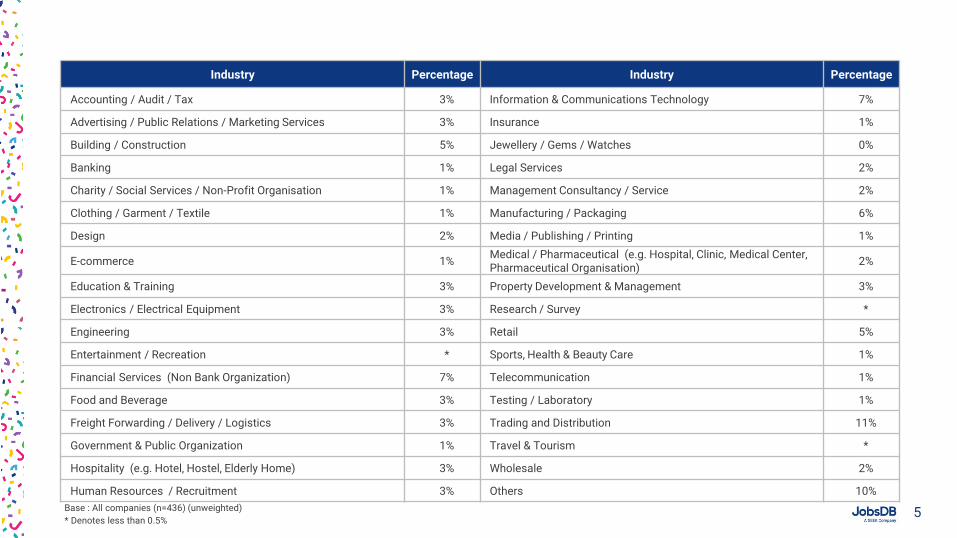
The survey covered 436 companies from 35 industries. Full-time exempt employees working in Hong Kong were the main focus of the survey, whilespecific questions about expatriates, part-time and temporary employees were also included. Among the surveyed companies, 72% have less than 50 staffmembers, 16% 50 - 99, 7% 100 – 199, and 5% over 200.
Scope and methodology
1 - 9 employees30%
10 - 49 employees42%
50 - 99 employees16%
100 - 199 employees7%
200 - 499 employees 3%
500 employees or more2%
5
Company Profile
Base : All companies (n=436) (unweighted)
* Denotes less than 0.5%
Industry Percentage Industry Percentage
Accounting / Audit / Tax 3% Information & Communications Technology 7%
Advertising / Public Relations / Marketing Services 3% Insurance 1%
Building / Construction 5% Jewellery / Gems / Watches 0%
Banking 1% Legal Services 2%
Charity / Social Services / Non-Profit Organisation 1% Management Consultancy / Service 2%
Clothing / Garment / Textile 1% Manufacturing / Packaging 6%
Design 2% Media / Publishing / Printing 1%
E-commerce 1%Medical / Pharmaceutical (e.g. Hospital, Clinic, Medical Center, Pharmaceutical Organisation)
2%
Education & Training 3% Property Development & Management 3%
Electronics / Electrical Equipment 3% Research / Survey *
Engineering 3% Retail 5%
Entertainment / Recreation * Sports, Health & Beauty Care 1%
Financial Services (Non Bank Organization) 7% Telecommunication 1%
Food and Beverage 3% Testing / Laboratory 1%
Freight Forwarding / Delivery / Logistics 3% Trading and Distribution 11%
Government & Public Organization 1% Travel & Tourism *
Hospitality (e.g. Hotel, Hostel, Elderly Home) 3% Wholesale 2%
Human Resources / Recruitment 3% Others 10%
6
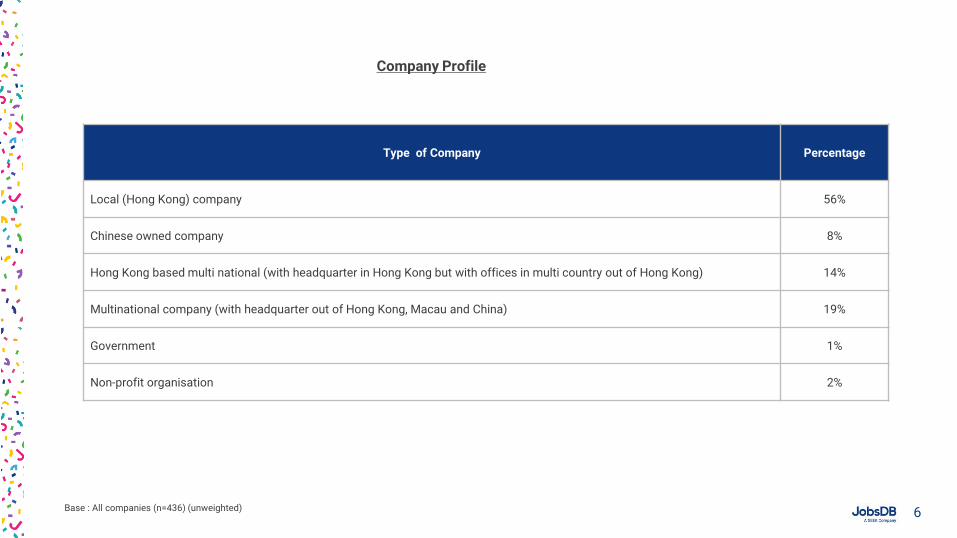
Company Profile
Type of Company Percentage
Local (Hong Kong) company 56%
Chinese owned company 8%
Hong Kong based multi national (with headquarter in Hong Kong but with offices in multi country out of Hong Kong) 14%
Multinational company (with headquarter out of Hong Kong, Macau and China) 19%
Government 1%
Non-profit organisation 2%
Base : All companies (n=436) (unweighted)
77
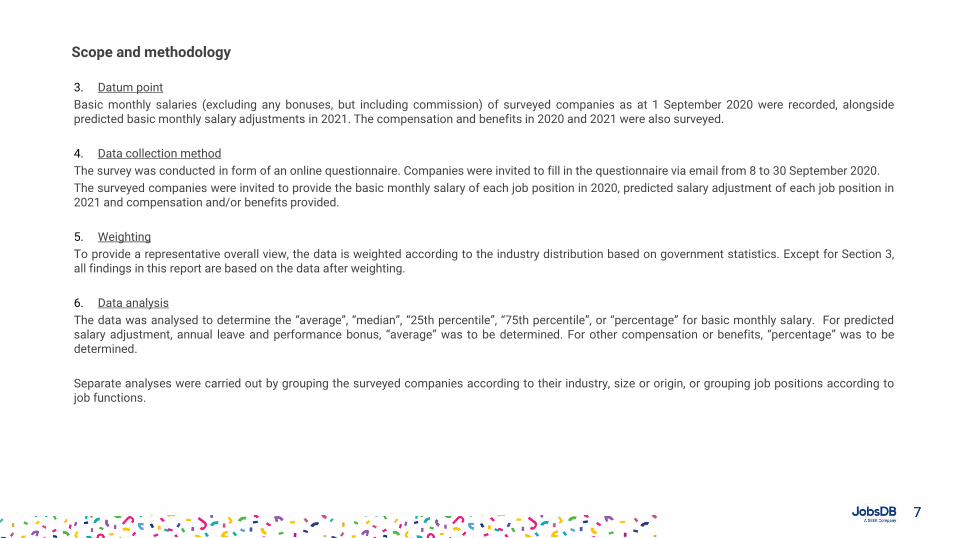
3. Datum point
Basic monthly salaries (excluding any bonuses, but including commission) of surveyed companies as at 1 September 2020 were recorded, alongsidepredicted basic monthly salary adjustments in 2021. The compensation and benefits in 2020 and 2021 were also surveyed.
4. Data collection method
The survey was conducted in form of an online questionnaire. Companies were invited to fill in the questionnaire via email from 8 to 30 September 2020.
The surveyed companies were invited to provide the basic monthly salary of each job position in 2020, predicted salary adjustment of each job position in2021 and compensation and/or benefits provided.
5. Weighting
To provide a representative overall view, the data is weighted according to the industry distribution based on government statistics. Except for Section 3,all findings in this report are based on the data after weighting.
6. Data analysis
The data was analysed to determine the “average”, “median”, “25th percentile”, “75th percentile”, or “percentage” for basic monthly salary. For predictedsalary adjustment, annual leave and performance bonus, “average” was to be determined. For other compensation or benefits, “percentage” was to bedetermined.
Separate analyses were carried out by grouping the surveyed companies according to their industry, size or origin, or grouping job positions according tojob functions.
Scope and methodology
88
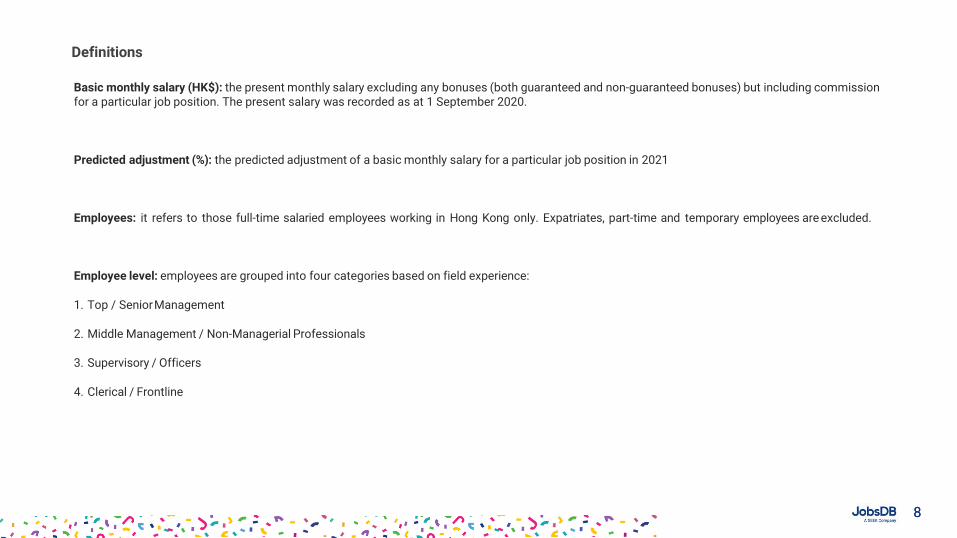
Basic monthly salary (HK$): the present monthly salary excluding any bonuses (both guaranteed and non-guaranteed bonuses) but including commission for a particular job position. The present salary was recorded as at 1 September 2020.
Predicted adjustment (%): the predicted adjustment of a basic monthly salary for a particular job position in 2021
Employees: it refers to those full-time salaried employees working in Hong Kong only. Expatriates, part-time and temporary employees are excluded.
Employee level: employees are grouped into four categories based on field experience:
1. Top / SeniorManagement
2. Middle Management / Non-Managerial Professionals
3. Supervisory / Officers
4. Clerical / Frontline
Definitions
99
Average: a mathematical average of a set of data values (basic monthly salaries, percentage adjustments, number of annual leave, and performancebonus).
Median*: a middle number of a set of data values (basic monthly salaries and percentage adjustments) which divides the whole set by half.
25th percentile (1st quartile)*: it is the number of a set data values (basic monthly salaries) which cuts off the lowest 25% ofdata.
75th percentile (3rd quartile)*: it is the number of a set data values (basic monthly salaries) which cuts off the highest 25% of data.
Inter-quartile Range (Q-range)*: the difference between the data values at the 25th and 75th percentiles and is a measure of statistical dispersion.
*For basic monthly salary, any positions with less than 3 companies or 5 employees are excluded from the calculation of the average, median and Q-range.
*For annual leaves and bonus, industries with less than 3 companies will not be shown.
Definitions

Section 1Market expectations and hiring plans

Market outlook
1212
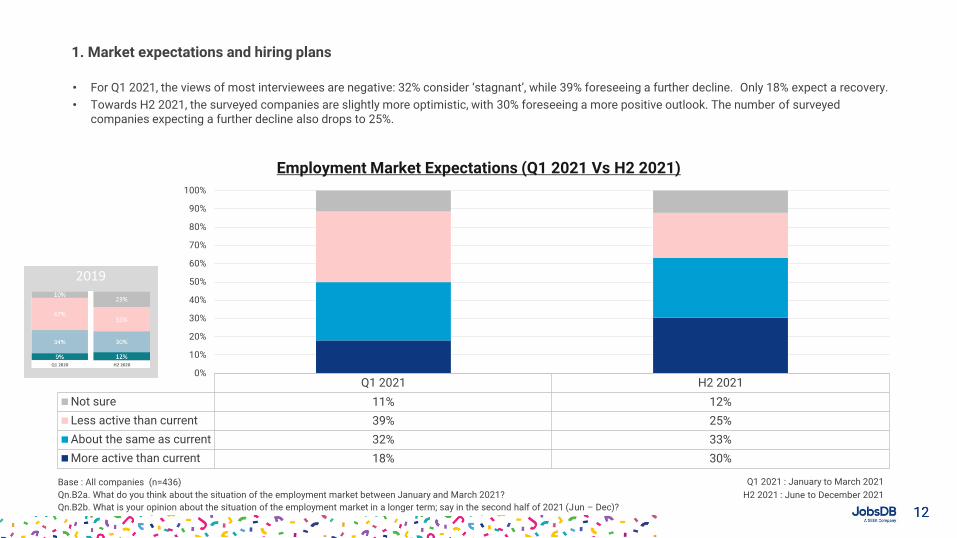
• For Q1 2021, the views of most interviewees are negative: 32% consider ‘stagnant’, while 39% foreseeing a further decline. Only 18% expect a recovery.
• Towards H2 2021, the surveyed companies are slightly more optimistic, with 30% foreseeing a more positive outlook. The number of surveyed companies expecting a further decline also drops to 25%.
1. Market expectations and hiring plans
Q1 2021 H2 2021
Not sure 11% 12%
Less active than current 39% 25%
About the same as current 32% 33%
More active than current 18% 30%
0%
10%
20%
30%
40%
50%
60%
70%
80%
90%
100%
Employment Market Expectations (Q1 2021 Vs H2 2021)
Base : All companies (n=436)
Qn.B2a. What do you think about the situation of the employment market between January and March 2021?
Qn.B2b. What is your opinion about the situation of the employment market in a longer term; say in the second half of 2021 (Jun – Dec)?
Q1 2021 : January to March 2021
H2 2021 : June to December 2021
2019
1313
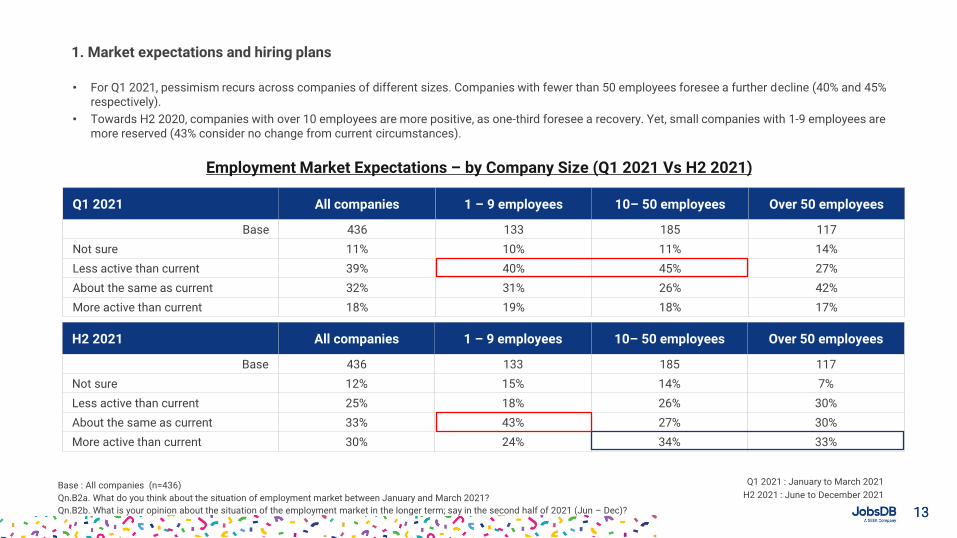
• For Q1 2021, pessimism recurs across companies of different sizes. Companies with fewer than 50 employees foresee a further decline (40% and 45% respectively).
• Towards H2 2020, companies with over 10 employees are more positive, as one-third foresee a recovery. Yet, small companies with 1-9 employees are more reserved (43% consider no change from current circumstances).
Employment Market Expectations – by Company Size (Q1 2021 Vs H2 2021)
Base : All companies (n=436)
Qn.B2a. What do you think about the situation of employment market between January and March 2021?
Qn.B2b. What is your opinion about the situation of the employment market in the longer term; say in the second half of 2021 (Jun – Dec)?
Q1 2021 : January to March 2021
H2 2021 : June to December 2021
Q1 2021 All companies 1 – 9 employees 10– 50 employees Over 50 employees
Base 436 133 185 117
Not sure 11% 10% 11% 14%
Less active than current 39% 40% 45% 27%
About the same as current 32% 31% 26% 42%
More active than current 18% 19% 18% 17%
H2 2021 All companies 1 – 9 employees 10– 50 employees Over 50 employees
Base 436 133 185 117
Not sure 12% 15% 14% 7%
Less active than current 25% 18% 26% 30%
About the same as current 33% 43% 27% 30%
More active than current 30% 24% 34% 33%
1. Market expectations and hiring plans
1414
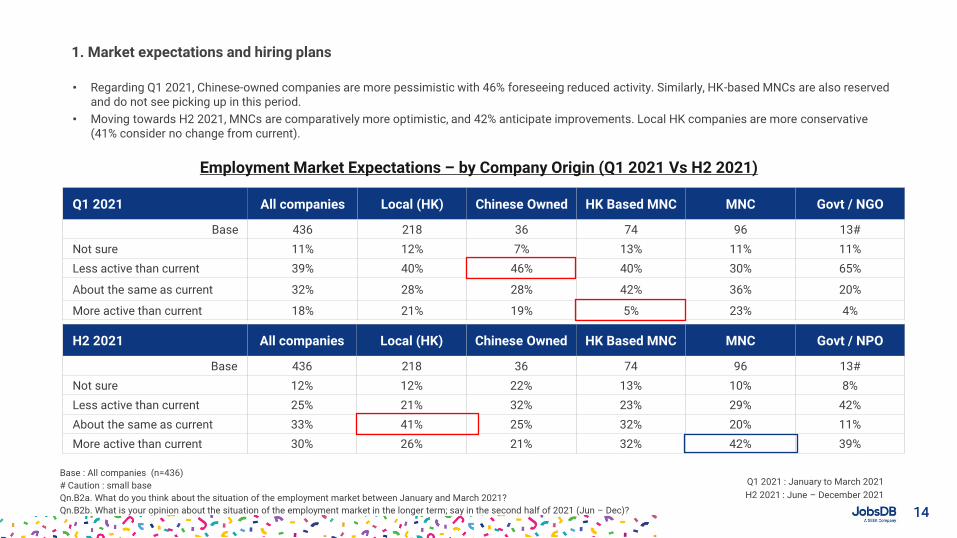
• Regarding Q1 2021, Chinese-owned companies are more pessimistic with 46% foreseeing reduced activity. Similarly, HK-based MNCs are also reserved and do not see picking up in this period.
• Moving towards H2 2021, MNCs are comparatively more optimistic, and 42% anticipate improvements. Local HK companies are more conservative (41% consider no change from current).
1. Market expectations and hiring plans
Employment Market Expectations – by Company Origin (Q1 2021 Vs H2 2021)
Base : All companies (n=436)
# Caution : small base
Qn.B2a. What do you think about the situation of the employment market between January and March 2021?
Qn.B2b. What is your opinion about the situation of the employment market in the longer term; say in the second half of 2021 (Jun – Dec)?
Q1 2021 : January to March 2021
H2 2021 : June – December 2021
Q1 2021 All companies Local (HK) Chinese Owned HK Based MNC MNC Govt / NGO
Base 436 218 36 74 96 13#
Not sure 11% 12% 7% 13% 11% 11%
Less active than current 39% 40% 46% 40% 30% 65%
About the same as current 32% 28% 28% 42% 36% 20%
More active than current 18% 21% 19% 5% 23% 4%
H2 2021 All companies Local (HK) Chinese Owned HK Based MNC MNC Govt / NPO
Base 436 218 36 74 96 13#
Not sure 12% 12% 22% 13% 10% 8%
Less active than current 25% 21% 32% 23% 29% 42%
About the same as current 33% 41% 25% 32% 20% 11%
More active than current 30% 26% 21% 32% 42% 39%
1515
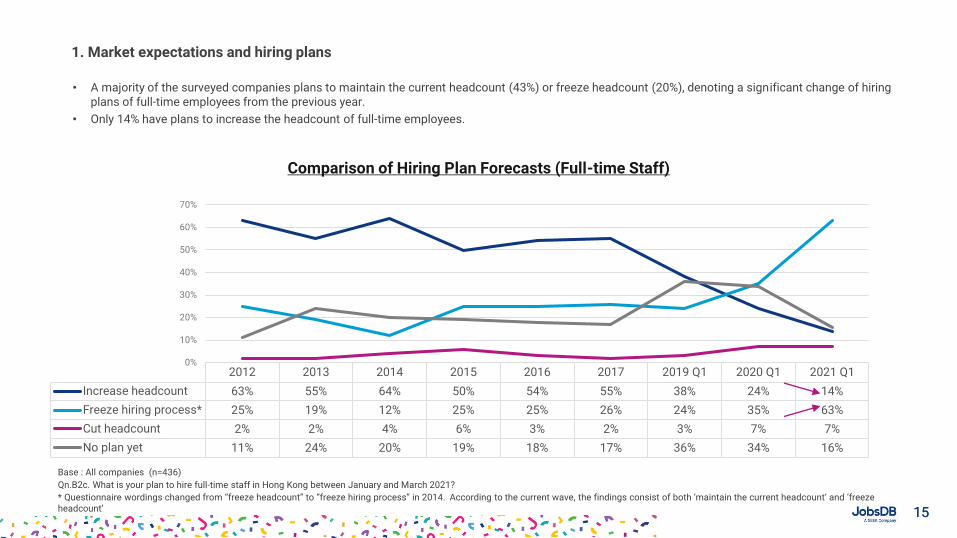
• A majority of the surveyed companies plans to maintain the current headcount (43%) or freeze headcount (20%), denoting a significant change of hiring plans of full-time employees from the previous year.
• Only 14% have plans to increase the headcount of full-time employees.
1. Market expectations and hiring plans
Comparison of Hiring Plan Forecasts (Full-time Staff)
Base : All companies (n=436)
Qn.B2c. What is your plan to hire full-time staff in Hong Kong between January and March 2021?
* Questionnaire wordings changed from “freeze headcount” to “freeze hiring process” in 2014. According to the current wave, the findings consist of both ‘maintain the current headcount’ and ‘freeze headcount’
2012 2013 2014 2015 2016 2017 2019 Q1 2020 Q1 2021 Q1
Increase headcount 63% 55% 64% 50% 54% 55% 38% 24% 14%
Freeze hiring process* 25% 19% 12% 25% 25% 26% 24% 35% 63%
Cut headcount 2% 2% 4% 6% 3% 2% 3% 7% 7%
No plan yet 11% 24% 20% 19% 18% 17% 36% 34% 16%
0%
10%
20%
30%
40%
50%
60%
70%
1616
All companies (n=436) 1 - 9 employees (n=133) 10 - 50 employees (n=185) Over 50 employees (n=117)
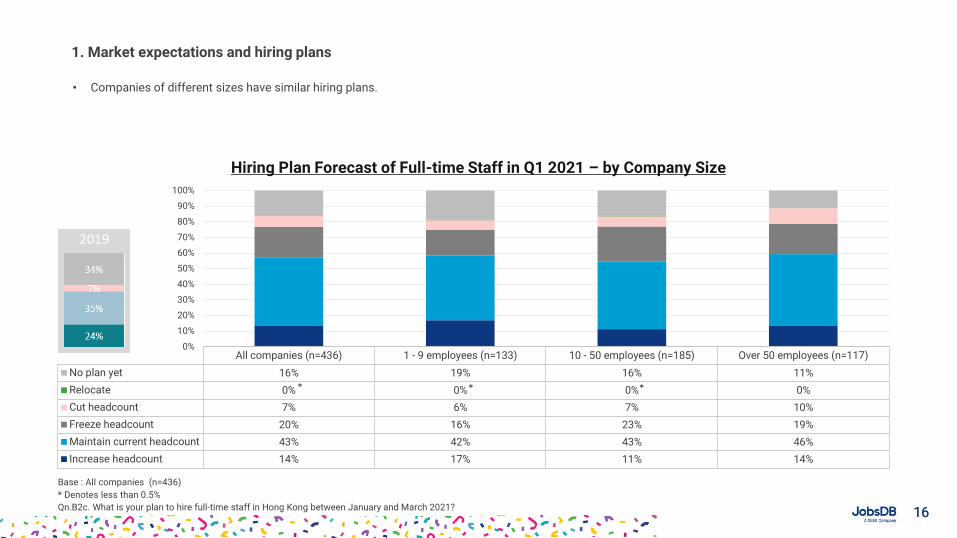
No plan yet 16% 19% 16% 11%
Relocate 0% 0% 0% 0%
Cut headcount 7% 6% 7% 10%
Freeze headcount 20% 16% 23% 19%
Maintain current headcount 43% 42% 43% 46%
Increase headcount 14% 17% 11% 14%
0%
10%
20%
30%
40%
50%
60%
70%
80%
90%
100%
2019
• Companies of different sizes have similar hiring plans.
1. Market expectations and hiring plans
Hiring Plan Forecast of Full-time Staff in Q1 2021 – by Company Size
Base : All companies (n=436)
* Denotes less than 0.5%
Qn.B2c. What is your plan to hire full-time staff in Hong Kong between January and March 2021?
***
1717
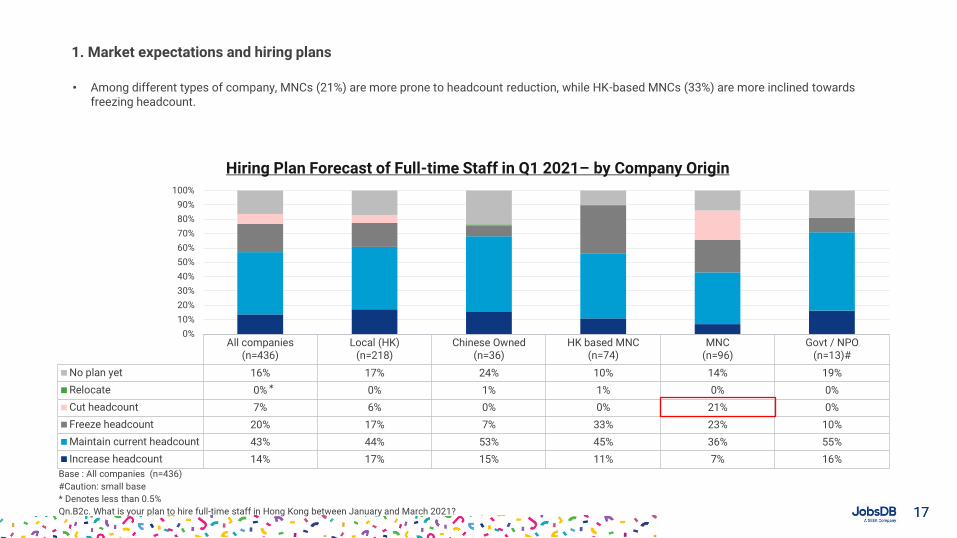
• Among different types of company, MNCs (21%) are more prone to headcount reduction, while HK-based MNCs (33%) are more inclined towards freezing headcount.
1. Market expectations and hiring plans
All companies(n=436)
Local (HK)(n=218)
Chinese Owned(n=36)
HK based MNC(n=74)
MNC(n=96)
Govt / NPO(n=13)#
No plan yet 16% 17% 24% 10% 14% 19%
Relocate 0% 0% 1% 1% 0% 0%
Cut headcount 7% 6% 0% 0% 21% 0%
Freeze headcount 20% 17% 7% 33% 23% 10%
Maintain current headcount 43% 44% 53% 45% 36% 55%
Increase headcount 14% 17% 15% 11% 7% 16%
0%
10%
20%
30%
40%
50%
60%
70%
80%
90%
100%
Hiring Plan Forecast of Full-time Staff in Q1 2021– by Company Origin
Base : All companies (n=436)
#Caution: small base
* Denotes less than 0.5%
Qn.B2c. What is your plan to hire full-time staff in Hong Kong between January and March 2021?
*
1818
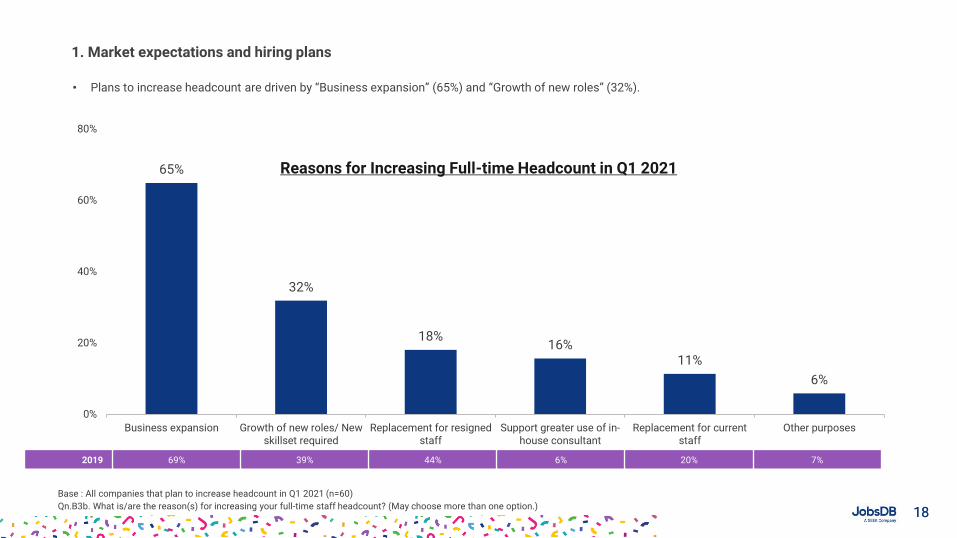
• Plans to increase headcount are driven by “Business expansion” (65%) and “Growth of new roles” (32%).
1. Market expectations and hiring plans
Reasons for Increasing Full-time Headcount in Q1 2021
Base : All companies that plan to increase headcount in Q1 2021 (n=60)
Qn.B3b. What is/are the reason(s) for increasing your full-time staff headcount? (May choose more than one option.)
65%
32%
18%16%
11%
6%
0%
20%
40%
60%
80%
Business expansion Growth of new roles/ Newskillset required
Replacement for resignedstaff
Support greater use of in-house consultant
Replacement for currentstaff
Other purposes
2019 69% 39% 44% 6% 20% 7%
1919
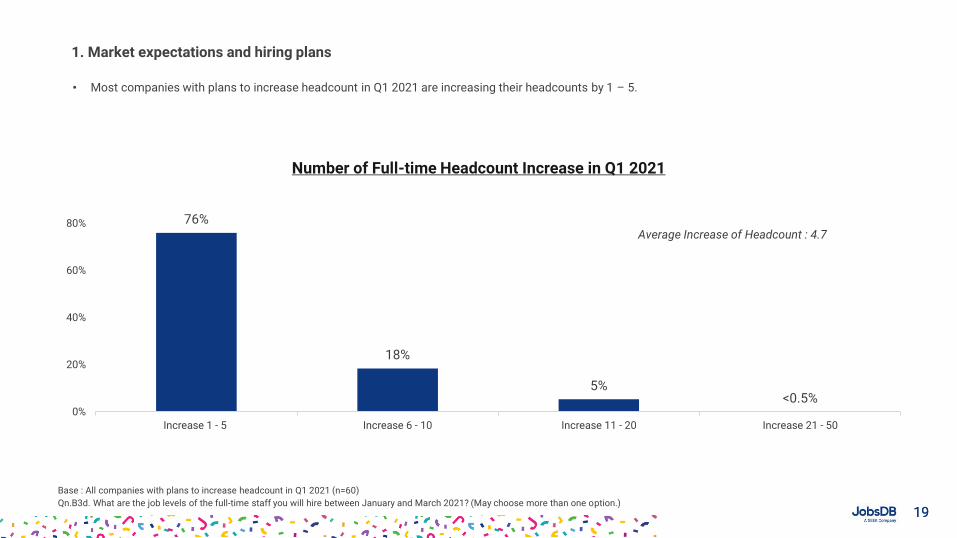
• Most companies with plans to increase headcount in Q1 2021 are increasing their headcounts by 1 – 5.
1. Market expectations and hiring plans
Number of Full-time Headcount Increase in Q1 2021
Base : All companies with plans to increase headcount in Q1 2021 (n=60)
Qn.B3d. What are the job levels of the full-time staff you will hire between January and March 2021? (May choose more than one option.)
76%
18%
5%<0.5%
0%
20%
40%
60%
80%
Increase 1 - 5 Increase 6 - 10 Increase 11 - 20 Increase 21 - 50
Average Increase of Headcount : 4.7
2020
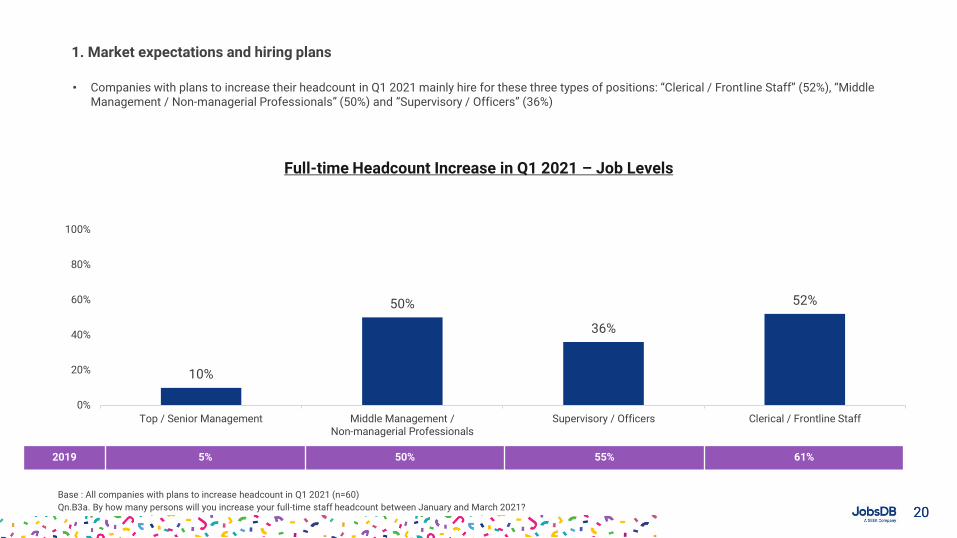
• Companies with plans to increase their headcount in Q1 2021 mainly hire for these three types of positions: “Clerical / Frontline Staff” (52%), “Middle Management / Non-managerial Professionals” (50%) and “Supervisory / Officers” (36%)
1. Market expectations and hiring plans
Full-time Headcount Increase in Q1 2021 – Job Levels
Base : All companies with plans to increase headcount in Q1 2021 (n=60)
Qn.B3a. By how many persons will you increase your full-time staff headcount between January and March 2021?
10%
50%
36%
52%
0%
20%
40%
60%
80%
100%
Top / Senior Management Middle Management /Non-managerial Professionals
Supervisory / Officers Clerical / Frontline Staff
2019 5% 50% 55% 61%
2121
29%
23%
3% 2%
16%
9%
3%
10% 9%5%
12% 12%
3% 2% 2%
14%
4%1% 2%
8%
1% 1%
7%
0% 0%
13%
3% 1%
10%
5%
0%
20%
40%
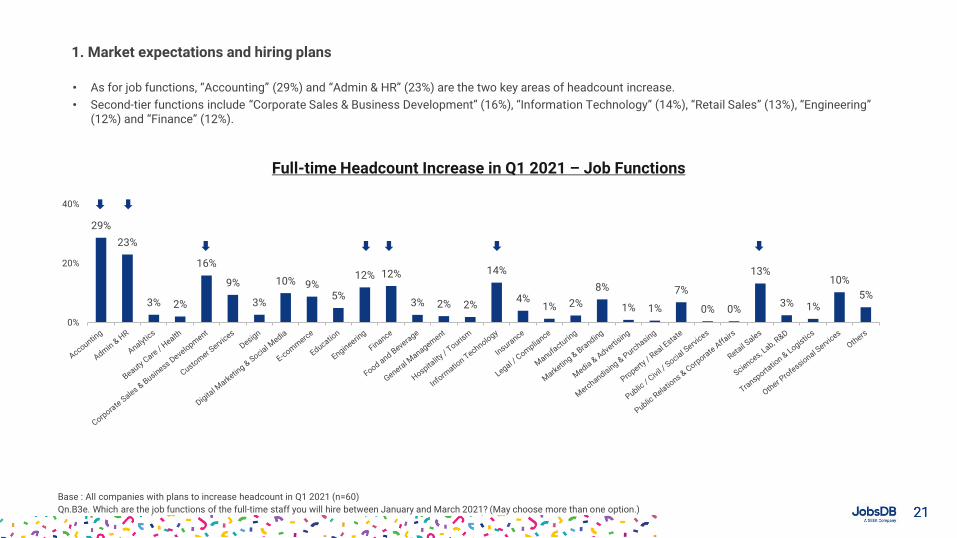
• As for job functions, “Accounting” (29%) and “Admin & HR” (23%) are the two key areas of headcount increase.
• Second-tier functions include “Corporate Sales & Business Development” (16%), “Information Technology” (14%), “Retail Sales” (13%), “Engineering” (12%) and “Finance” (12%).
1. Market expectations and hiring plans
Full-time Headcount Increase in Q1 2021 – Job Functions
Base : All companies with plans to increase headcount in Q1 2021 (n=60)
Qn.B3e. Which are the job functions of the full-time staff you will hire between January and March 2021? (May choose more than one option.)
2222
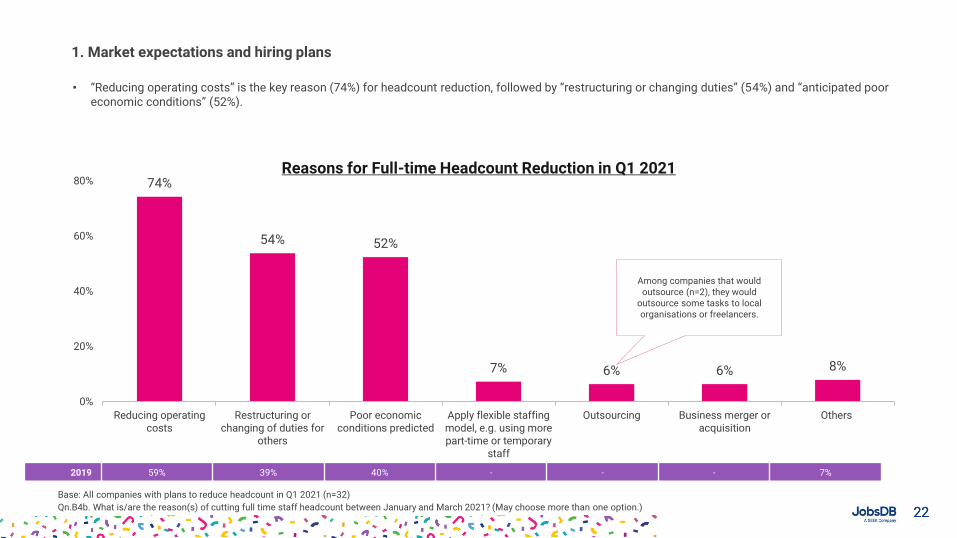
• “Reducing operating costs” is the key reason (74%) for headcount reduction, followed by “restructuring or changing duties” (54%) and “anticipated poor economic conditions” (52%).
1. Market expectations and hiring plans
Reasons for Full-time Headcount Reduction in Q1 2021
Base: All companies with plans to reduce headcount in Q1 2021 (n=32)
Qn.B4b. What is/are the reason(s) of cutting full time staff headcount between January and March 2021? (May choose more than one option.)
74%
54% 52%
7% 6% 6% 8%
0%
20%
40%
60%
80%
Reducing operatingcosts
Restructuring orchanging of duties for
others
Poor economicconditions predicted
Apply flexible staffingmodel, e.g. using morepart-time or temporary
staff
Outsourcing Business merger oracquisition
Others
Among companies that would outsource (n=2), they would
outsource some tasks to local organisations or freelancers.
2019 59% 39% 40% - - - 7%
2323
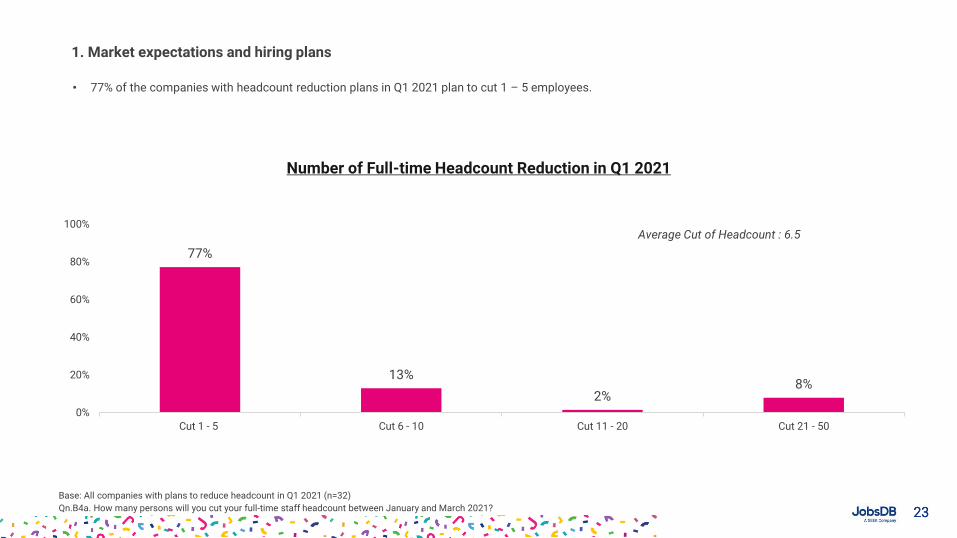
• 77% of the companies with headcount reduction plans in Q1 2021 plan to cut 1 – 5 employees.
1. Market expectations and hiring plans
Number of Full-time Headcount Reduction in Q1 2021
Base: All companies with plans to reduce headcount in Q1 2021 (n=32)
Qn.B4a. How many persons will you cut your full-time staff headcount between January and March 2021?
77%
13%
2%8%
0%
20%
40%
60%
80%
100%
Cut 1 - 5 Cut 6 - 10 Cut 11 - 20 Cut 21 - 50
Average Cut of Headcount : 6.5
2424
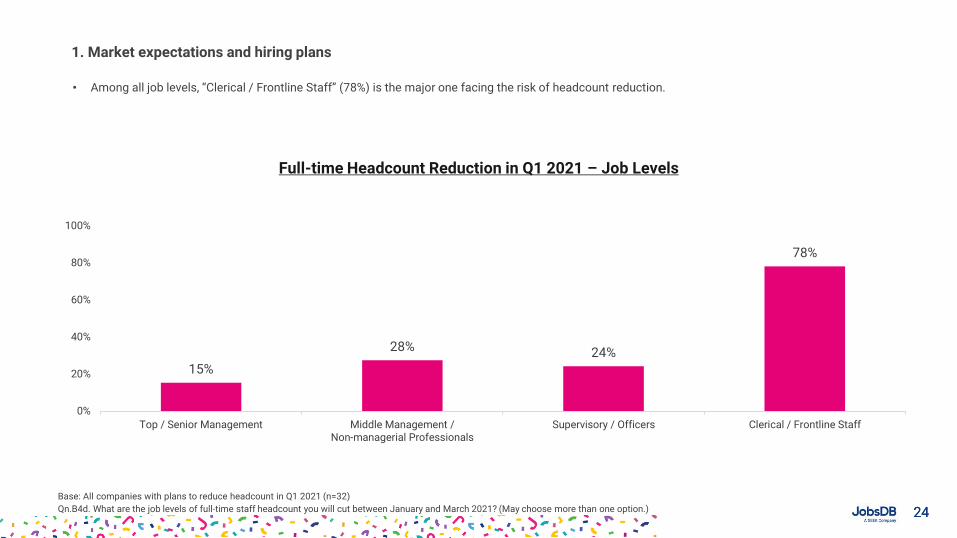
• Among all job levels, “Clerical / Frontline Staff” (78%) is the major one facing the risk of headcount reduction.
1. Market expectations and hiring plans
Full-time Headcount Reduction in Q1 2021 – Job Levels
Base: All companies with plans to reduce headcount in Q1 2021 (n=32)
Qn.B4d. What are the job levels of full-time staff headcount you will cut between January and March 2021? (May choose more than one option.)
15%
28% 24%
78%
0%
20%
40%
60%
80%
100%
Top / Senior Management Middle Management /Non-managerial Professionals
Supervisory / Officers Clerical / Frontline Staff
2525
15%12%
3%
22%
3%1%
13%
6%
11%
3%
17%
6%
1%
26%
3%
23%
31%
2%
12%
0%
20%
40%
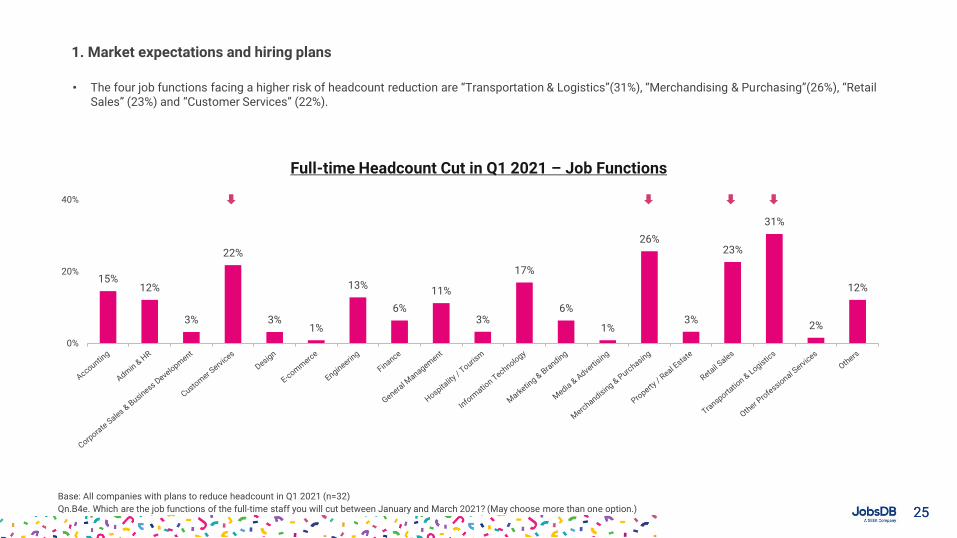
• The four job functions facing a higher risk of headcount reduction are “Transportation & Logistics”(31%), “Merchandising & Purchasing”(26%), “Retail Sales” (23%) and “Customer Services” (22%).
1. Market expectations and hiring plans
Full-time Headcount Cut in Q1 2021 – Job Functions
Base: All companies with plans to reduce headcount in Q1 2021 (n=32)
Qn.B4e. Which are the job functions of the full-time staff you will cut between January and March 2021? (May choose more than one option.)
2626
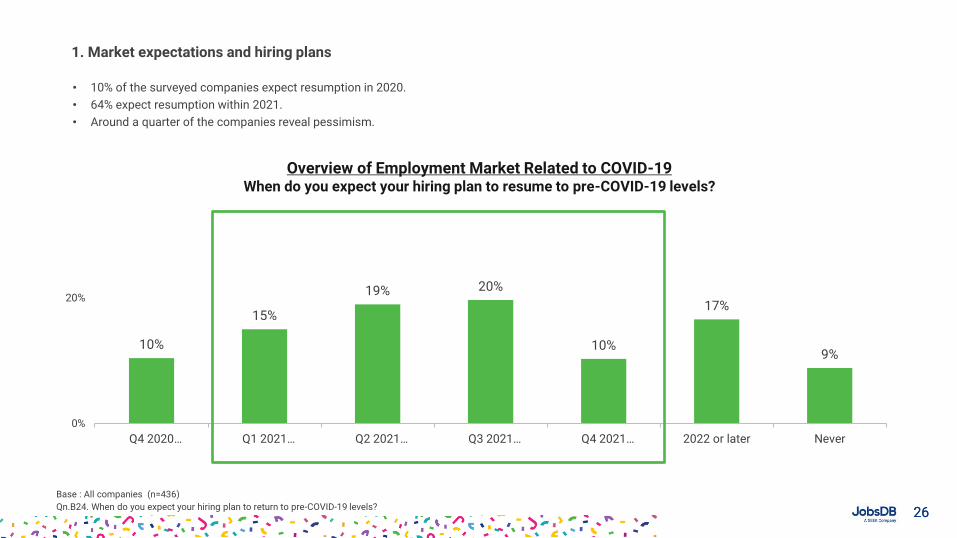
• 10% of the surveyed companies expect resumption in 2020.
• 64% expect resumption within 2021.
• Around a quarter of the companies reveal pessimism.
1. Market expectations and hiring plans
Overview of Employment Market Related to COVID-19When do you expect your hiring plan to resume to pre-COVID-19 levels?
Base : All companies (n=436)
Qn.B24. When do you expect your hiring plan to return to pre-COVID-19 levels?
10%
15%
19% 20%
10%
17%
9%
0%
20%
Q4 2020 … Q1 2021 … Q2 2021 … Q3 2021 … Q4 2021 … 2022 or later Never
2727
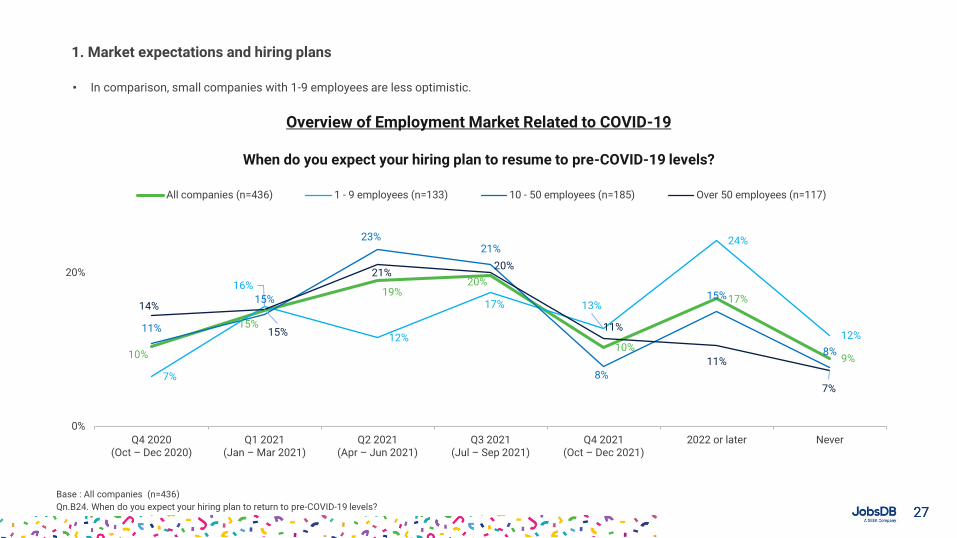
• In comparison, small companies with 1-9 employees are less optimistic.
1. Market expectations and hiring plans
Base : All companies (n=436)
Qn.B24. When do you expect your hiring plan to return to pre-COVID-19 levels?
10%
15%
19%20%
10%
17%
9%
7%
16%
12%
17% 13%
24%
12%11%
15%
23%21%
8%
15%
8%
14%
15%
21%20%
11%
11%
7%
0%
20%
Q4 2020 (Oct – Dec 2020)
Q1 2021 (Jan – Mar 2021)
Q2 2021 (Apr – Jun 2021)
Q3 2021 (Jul – Sep 2021)
Q4 2021 (Oct – Dec 2021)
2022 or later Never
All companies (n=436) 1 - 9 employees (n=133) 10 - 50 employees (n=185) Over 50 employees (n=117)
Overview of Employment Market Related to COVID-19
When do you expect your hiring plan to resume to pre-COVID-19 levels?
2828
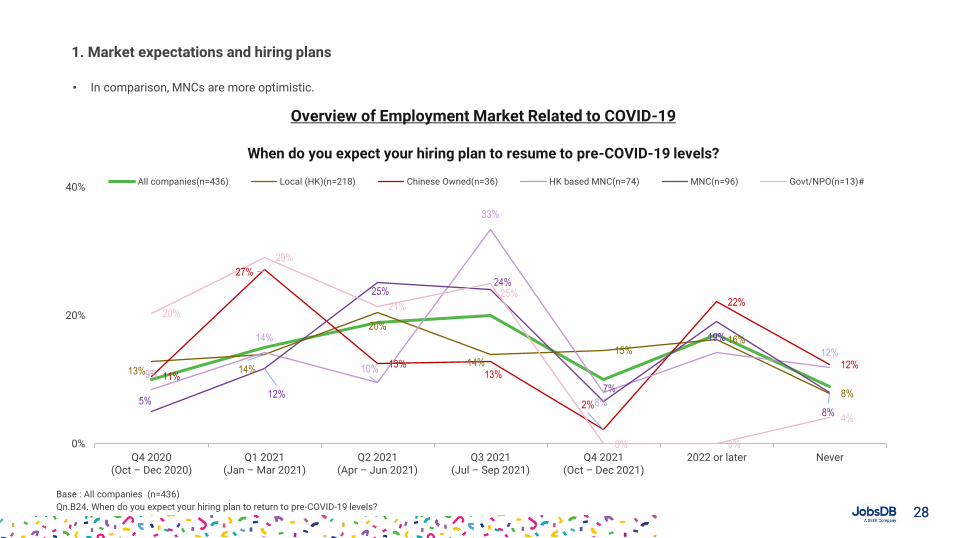
• In comparison, MNCs are more optimistic.
1. Market expectations and hiring plans
Base : All companies (n=436)
Qn.B24. When do you expect your hiring plan to return to pre-COVID-19 levels?
13% 14%
20%
14%15%
16%
8%
11%
27%
13%13%
2%
22%
12%9%
14%
10%
33%
8%
14%
12%
5%12%
25%24%
7%
19%
8%
20%
29%
21%
25%
0% 0%
4%
0%
20%
40%
Q4 2020 (Oct – Dec 2020)
Q1 2021 (Jan – Mar 2021)
Q2 2021 (Apr – Jun 2021)
Q3 2021 (Jul – Sep 2021)
Q4 2021 (Oct – Dec 2021)
2022 or later Never
All companies(n=436) Local (HK)(n=218) Chinese Owned(n=36) HK based MNC(n=74) MNC(n=96) Govt/NPO(n=13)#
Overview of Employment Market Related to COVID-19
When do you expect your hiring plan to resume to pre-COVID-19 levels?
2929
Past 6 Months
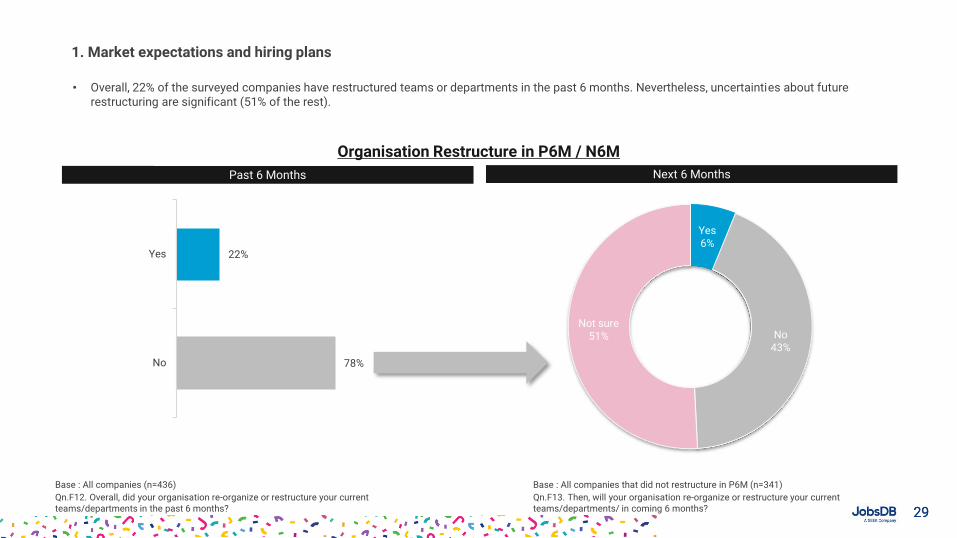
• Overall, 22% of the surveyed companies have restructured teams or departments in the past 6 months. Nevertheless, uncertainties about future restructuring are significant (51% of the rest).
1. Market expectations and hiring plans
Organisation Restructure in P6M / N6M
Base : All companies (n=436)
Qn.F12. Overall, did your organisation re-organize or restructure your current teams/departments in the past 6 months?
78%
22%
No
Yes
Yes6%
No43%
Not sure 51%
Base : All companies that did not restructure in P6M (n=341)
Qn.F13. Then, will your organisation re-organize or restructure your current teams/departments/ in coming 6 months?
Next 6 Months
3030
Past 6 Months
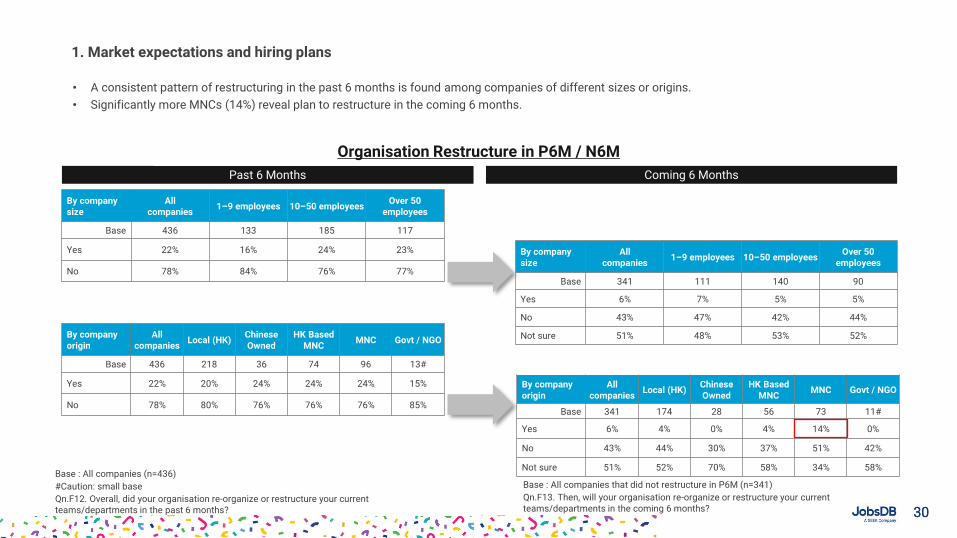
• A consistent pattern of restructuring in the past 6 months is found among companies of different sizes or origins.
• Significantly more MNCs (14%) reveal plan to restructure in the coming 6 months.
1. Market expectations and hiring plans
Organisation Restructure in P6M / N6M
Base : All companies (n=436)
#Caution: small base
Qn.F12. Overall, did your organisation re-organize or restructure your current teams/departments in the past 6 months?
Base : All companies that did not restructure in P6M (n=341)
Qn.F13. Then, will your organisation re-organize or restructure your current teams/departments in the coming 6 months?
Coming 6 Months
By company size
All companies
1–9 employees 10–50 employees Over 50
employees
Base 341 111 140 90
Yes 6% 7% 5% 5%
No 43% 47% 42% 44%
Not sure 51% 48% 53% 52%
By company size
All companies
1–9 employees 10–50 employees Over 50
employees
Base 436 133 185 117
Yes 22% 16% 24% 23%
No 78% 84% 76% 77%
By company origin
All companies
Local (HK) Chinese Owned
HK Based MNC
MNC Govt / NGO
Base 341 174 28 56 73 11#
Yes 6% 4% 0% 4% 14% 0%
No 43% 44% 30% 37% 51% 42%
Not sure 51% 52% 70% 58% 34% 58%
By company origin
All companies
Local (HK) Chinese Owned
HK Based MNC
MNC Govt / NGO
Base 436 218 36 74 96 13#
Yes 22% 20% 24% 24% 24% 15%
No 78% 80% 76% 76% 76% 85%
3131
Yes6%
No64%
Not sure 30%
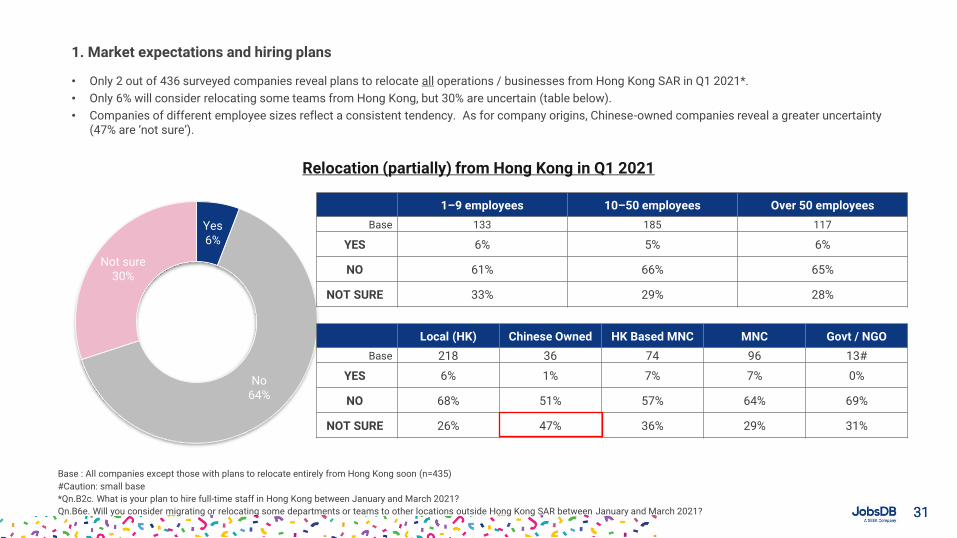
• Only 2 out of 436 surveyed companies reveal plans to relocate all operations / businesses from Hong Kong SAR in Q1 2021*.
• Only 6% will consider relocating some teams from Hong Kong, but 30% are uncertain (table below).
• Companies of different employee sizes reflect a consistent tendency. As for company origins, Chinese-owned companies reveal a greater uncertainty (47% are ‘not sure’).
1. Market expectations and hiring plans
Relocation (partially) from Hong Kong in Q1 2021
Base : All companies except those with plans to relocate entirely from Hong Kong soon (n=435)
#Caution: small base
*Qn.B2c. What is your plan to hire full-time staff in Hong Kong between January and March 2021?
Qn.B6e. Will you consider migrating or relocating some departments or teams to other locations outside Hong Kong SAR between January and March 2021?
1–9 employees 10–50 employees Over 50 employees
Base 133 185 117
YES 6% 5% 6%
NO 61% 66% 65%
NOT SURE 33% 29% 28%
Local (HK) Chinese Owned HK Based MNC MNC Govt / NGO
Base 218 36 74 96 13#
YES 6% 1% 7% 7% 0%
NO 68% 51% 57% 64% 69%
NOT SURE 26% 47% 36% 29% 31%
3232
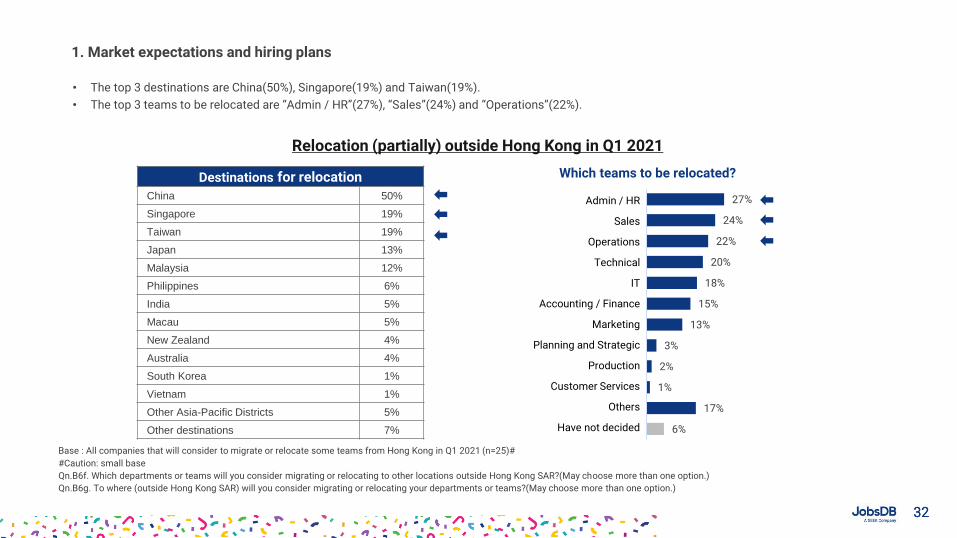
• The top 3 destinations are China(50%), Singapore(19%) and Taiwan(19%).
• The top 3 teams to be relocated are “Admin / HR”(27%), “Sales”(24%) and “Operations”(22%).
1. Market expectations and hiring plans
Relocation (partially) outside Hong Kong in Q1 2021
Base : All companies that will consider to migrate or relocate some teams from Hong Kong in Q1 2021 (n=25)#
#Caution: small base
Qn.B6f. Which departments or teams will you consider migrating or relocating to other locations outside Hong Kong SAR?(May choose more than one option.)
Qn.B6g. To where (outside Hong Kong SAR) will you consider migrating or relocating your departments or teams?(May choose more than one option.)
Which teams to be relocated?
27%
24%
22%
20%
18%
15%
13%
3%
2%
1%
17%
6%
Admin / HR
Sales
Operations
Technical
IT
Accounting / Finance
Marketing
Planning and Strategic
Production
Customer Services
Others
Have not decided
Destinations for relocation
China 50%
Singapore 19%
Taiwan 19%
Japan 13%
Malaysia 12%
Philippines 6%
India 5%
Macau 5%
New Zealand 4%
Australia 4%
South Korea 1%
Vietnam 1%
Other Asia-Pacific Districts 5%
Other destinations 7%
Hiring plans for Part-time / Contract / Temporary/ Non-HK based Staff
3434
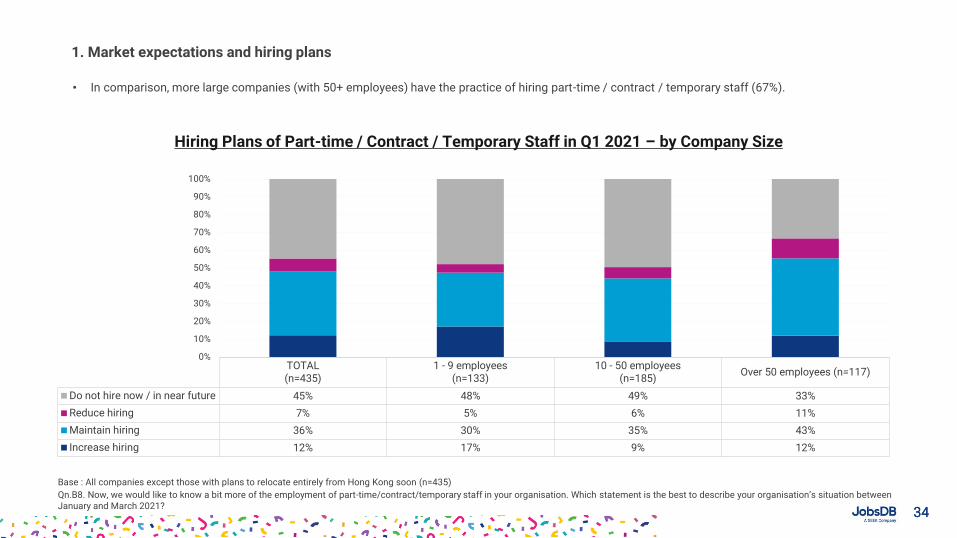
• In comparison, more large companies (with 50+ employees) have the practice of hiring part-time / contract / temporary staff (67%).
1. Market expectations and hiring plans
TOTAL(n=435)
1 - 9 employees(n=133)
10 - 50 employees(n=185)
Over 50 employees (n=117)
Do not hire now / in near future 45% 48% 49% 33%
Reduce hiring 7% 5% 6% 11%
Maintain hiring 36% 30% 35% 43%
Increase hiring 12% 17% 9% 12%
0%
10%
20%
30%
40%
50%
60%
70%
80%
90%
100%
Hiring Plans of Part-time / Contract / Temporary Staff in Q1 2021 – by Company Size
Base : All companies except those with plans to relocate entirely from Hong Kong soon (n=435)
Qn.B8. Now, we would like to know a bit more of the employment of part-time/contract/temporary staff in your organisation. Which statement is the best to describe your organisation’s situation between January and March 2021?
3535
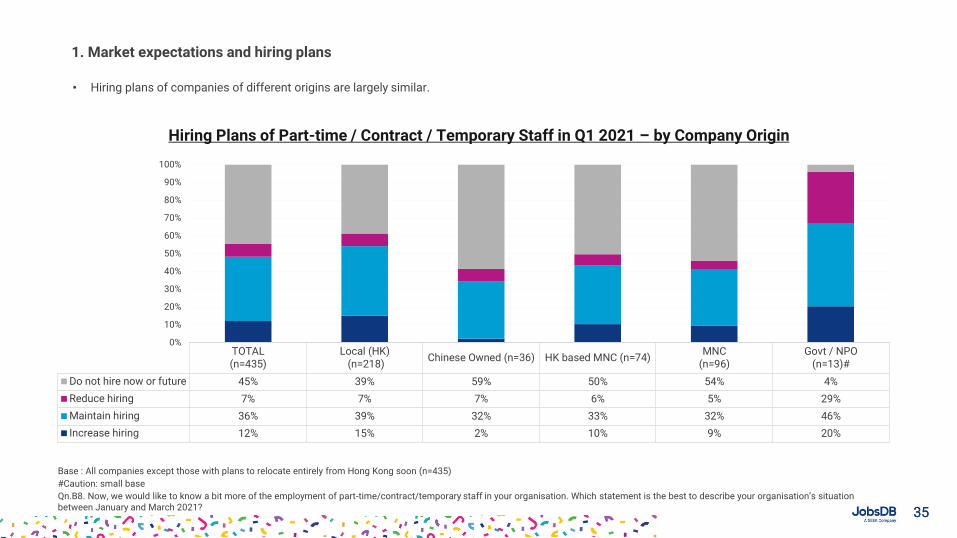
• Hiring plans of companies of different origins are largely similar.
1. Market expectations and hiring plans
TOTAL(n=435)
Local (HK) (n=218)
Chinese Owned (n=36) HK based MNC (n=74)MNC
(n=96)Govt / NPO
(n=13)#
Do not hire now or future 45% 39% 59% 50% 54% 4%
Reduce hiring 7% 7% 7% 6% 5% 29%
Maintain hiring 36% 39% 32% 33% 32% 46%
Increase hiring 12% 15% 2% 10% 9% 20%
0%
10%
20%
30%
40%
50%
60%
70%
80%
90%
100%
Hiring Plans of Part-time / Contract / Temporary Staff in Q1 2021 – by Company Origin
Base : All companies except those with plans to relocate entirely from Hong Kong soon (n=435)
#Caution: small base
Qn.B8. Now, we would like to know a bit more of the employment of part-time/contract/temporary staff in your organisation. Which statement is the best to describe your organisation’s situation between January and March 2021?
3636
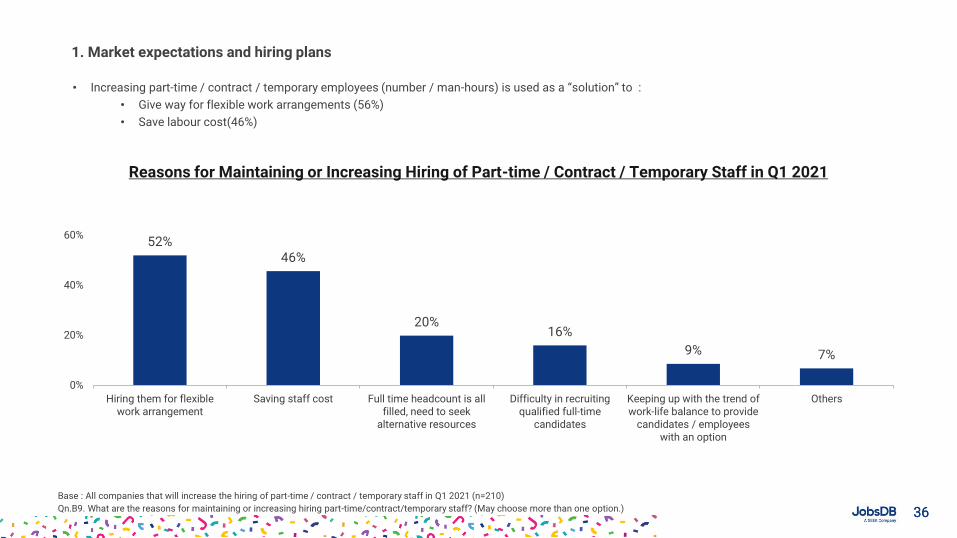
• Increasing part-time / contract / temporary employees (number / man-hours) is used as a “solution” to :
• Give way for flexible work arrangements (56%)
• Save labour cost(46%)
1. Market expectations and hiring plans
Reasons for Maintaining or Increasing Hiring of Part-time / Contract / Temporary Staff in Q1 2021
Base : All companies that will increase the hiring of part-time / contract / temporary staff in Q1 2021 (n=210)
Qn.B9. What are the reasons for maintaining or increasing hiring part-time/contract/temporary staff? (May choose more than one option.)
52%46%
20%16%
9% 7%
0%
20%
40%
60%
Hiring them for flexiblework arrangement
Saving staff cost Full time headcount is allfilled, need to seek
alternative resources
Difficulty in recruitingqualified full-time
candidates
Keeping up with the trend ofwork-life balance to provide
candidates / employeeswith an option
Others
3737
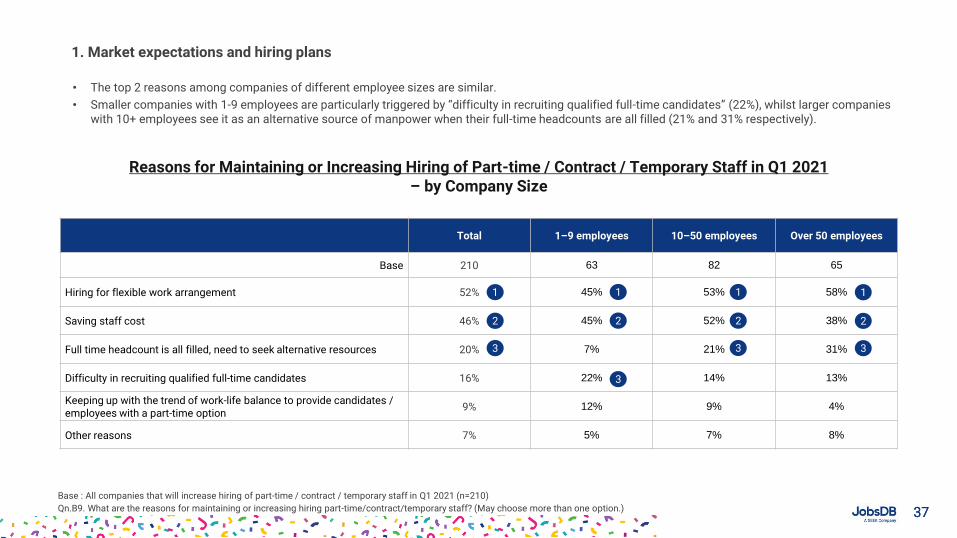
• The top 2 reasons among companies of different employee sizes are similar.
• Smaller companies with 1-9 employees are particularly triggered by “difficulty in recruiting qualified full-time candidates” (22%), whilst larger companies with 10+ employees see it as an alternative source of manpower when their full-time headcounts are all filled (21% and 31% respectively).
1. Market expectations and hiring plans
Reasons for Maintaining or Increasing Hiring of Part-time / Contract / Temporary Staff in Q1 2021– by Company Size
Base : All companies that will increase hiring of part-time / contract / temporary staff in Q1 2021 (n=210)
Qn.B9. What are the reasons for maintaining or increasing hiring part-time/contract/temporary staff? (May choose more than one option.)
Total 1–9 employees 10–50 employees Over 50 employees
Base 210 63 82 65
Hiring for flexible work arrangement 52% 45% 53% 58%
Saving staff cost 46% 45% 52% 38%
Full time headcount is all filled, need to seek alternative resources 20% 7% 21% 31%
Difficulty in recruiting qualified full-time candidates 16% 22% 14% 13%
Keeping up with the trend of work-life balance to provide candidates / employees with a part-time option
9% 12% 9% 4%
Other reasons 7% 5% 7% 8%
1
2
3
1
2
3
1
2
3
1
2
3
3838
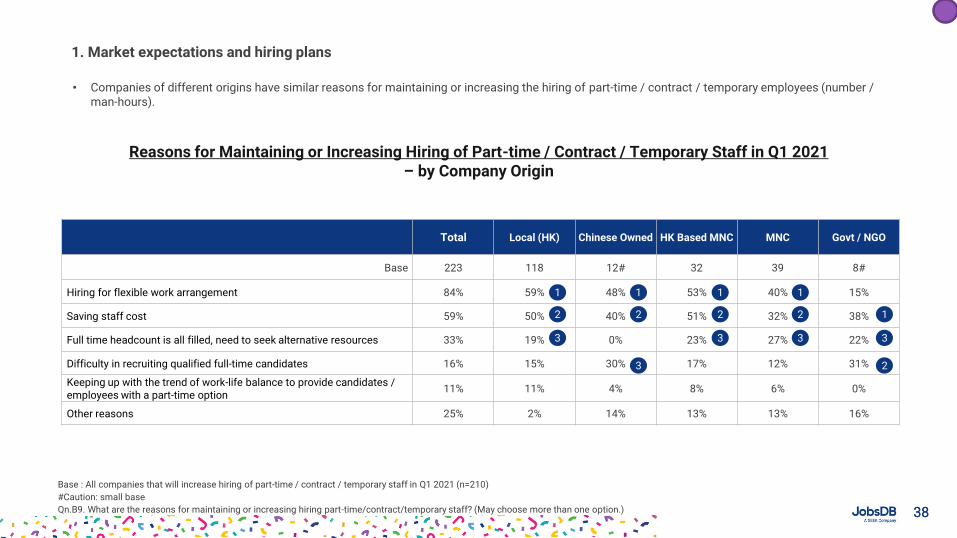
• Companies of different origins have similar reasons for maintaining or increasing the hiring of part-time / contract / temporary employees (number / man-hours).
1. Market expectations and hiring plans
Total Local (HK) Chinese Owned HK Based MNC MNC Govt / NGO
Base 223 118 12# 32 39 8#
Hiring for flexible work arrangement 84% 59% 48% 53% 40% 15%
Saving staff cost 59% 50% 40% 51% 32% 38%
Full time headcount is all filled, need to seek alternative resources 33% 19% 0% 23% 27% 22%
Difficulty in recruiting qualified full-time candidates 16% 15% 30% 17% 12% 31%
Keeping up with the trend of work-life balance to provide candidates / employees with a part-time option
11% 11% 4% 8% 6% 0%
Other reasons 25% 2% 14% 13% 13% 16%
1
2
3
1
2
3
1
2
3
1
2
3 3
1
2
Reasons for Maintaining or Increasing Hiring of Part-time / Contract / Temporary Staff in Q1 2021– by Company Origin
Base : All companies that will increase hiring of part-time / contract / temporary staff in Q1 2021 (n=210)
#Caution: small base
Qn.B9. What are the reasons for maintaining or increasing hiring part-time/contract/temporary staff? (May choose more than one option.)
3939
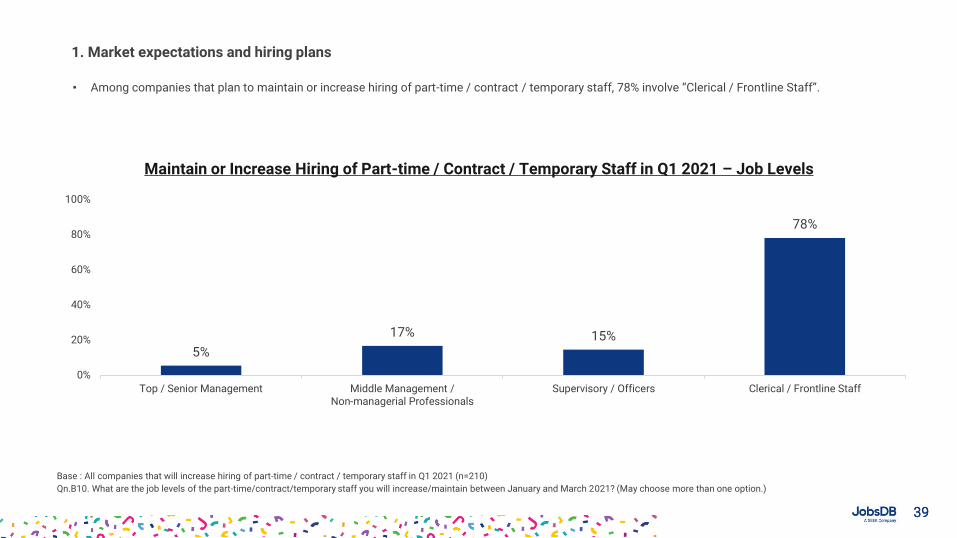
• Among companies that plan to maintain or increase hiring of part-time / contract / temporary staff, 78% involve “Clerical / Frontline Staff”.
1. Market expectations and hiring plans
Maintain or Increase Hiring of Part-time / Contract / Temporary Staff in Q1 2021 – Job Levels
5%
17% 15%
78%
0%
20%
40%
60%
80%
100%
Top / Senior Management Middle Management /Non-managerial Professionals
Supervisory / Officers Clerical / Frontline Staff
Base : All companies that will increase hiring of part-time / contract / temporary staff in Q1 2021 (n=210)
Qn.B10. What are the job levels of the part-time/contract/temporary staff you will increase/maintain between January and March 2021? (May choose more than one option.)
4040
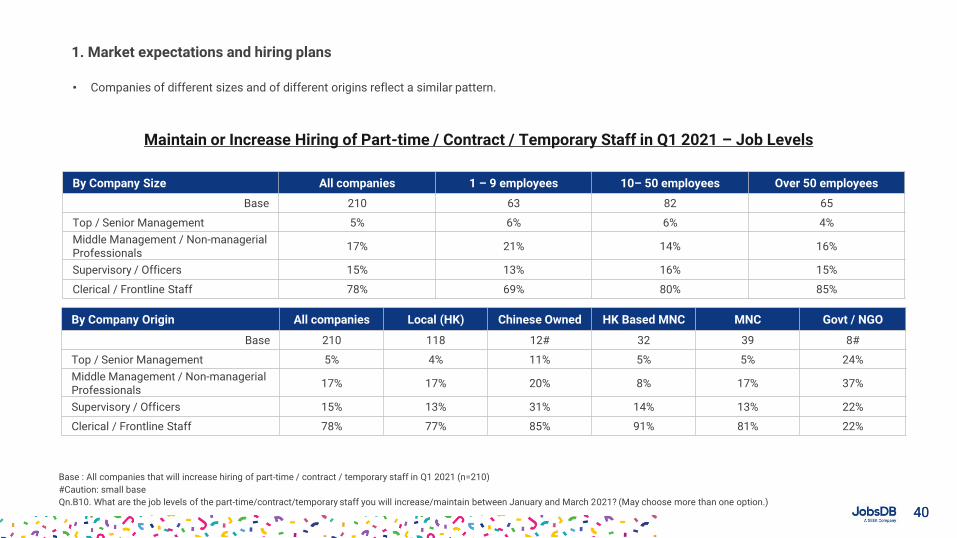
• Companies of different sizes and of different origins reflect a similar pattern.
1. Market expectations and hiring plans
By Company Size All companies 1 – 9 employees 10– 50 employees Over 50 employees
Base 210 63 82 65
Top / Senior Management 5% 6% 6% 4%
Middle Management / Non-managerial Professionals
17% 21% 14% 16%
Supervisory / Officers 15% 13% 16% 15%
Clerical / Frontline Staff 78% 69% 80% 85%
Maintain or Increase Hiring of Part-time / Contract / Temporary Staff in Q1 2021 – Job Levels
By Company Origin All companies Local (HK) Chinese Owned HK Based MNC MNC Govt / NGO
Base 210 118 12# 32 39 8#
Top / Senior Management 5% 4% 11% 5% 5% 24%
Middle Management / Non-managerial Professionals
17% 17% 20% 8% 17% 37%
Supervisory / Officers 15% 13% 31% 14% 13% 22%
Clerical / Frontline Staff 78% 77% 85% 91% 81% 22%
Base : All companies that will increase hiring of part-time / contract / temporary staff in Q1 2021 (n=210)
#Caution: small base
Qn.B10. What are the job levels of the part-time/contract/temporary staff you will increase/maintain between January and March 2021? (May choose more than one option.)
4141
22% 21%
0% 0%4%
0%3%
10%
3% 3% 4% 5% 4% 4% 6%3%
1%
8%
2% 2% 2%
11%
1% 2% 1% 2% 0% 1%
18%
1%
6%4%
9%
0%
20%
40%
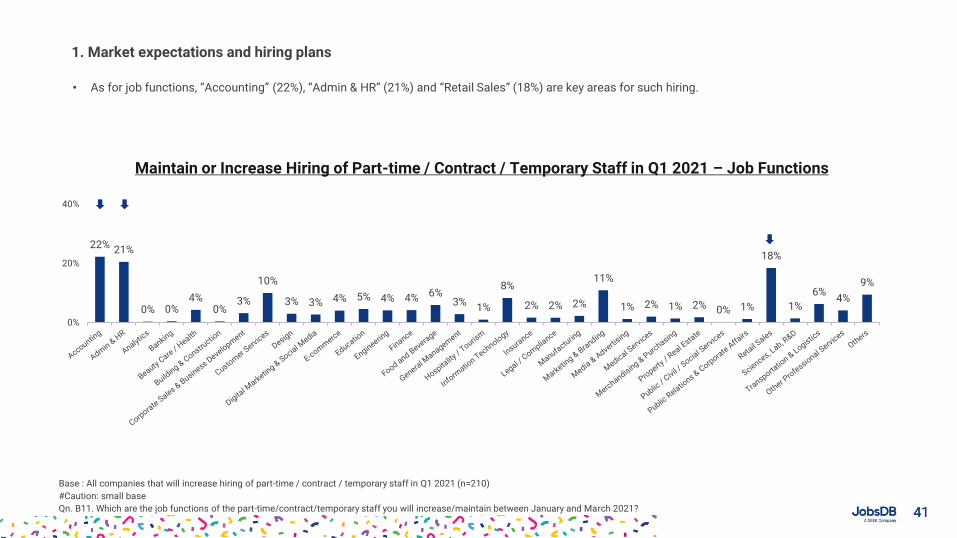
• As for job functions, “Accounting” (22%), “Admin & HR” (21%) and “Retail Sales” (18%) are key areas for such hiring.
1. Market expectations and hiring plans
Maintain or Increase Hiring of Part-time / Contract / Temporary Staff in Q1 2021 – Job Functions
Base : All companies that will increase hiring of part-time / contract / temporary staff in Q1 2021 (n=210)
#Caution: small base
Qn. B11. Which are the job functions of the part-time/contract/temporary staff you will increase/maintain between January and March 2021?
4242
27%
14%
0% 0%5%
0%
10%13%
4% 4% 5% 6%2%
5%0% 0% 0%
8% 6%2% 3%
13%
1% 0% 0% 0% 0% 0%4% 2%
4%10% 8%
0%
20%
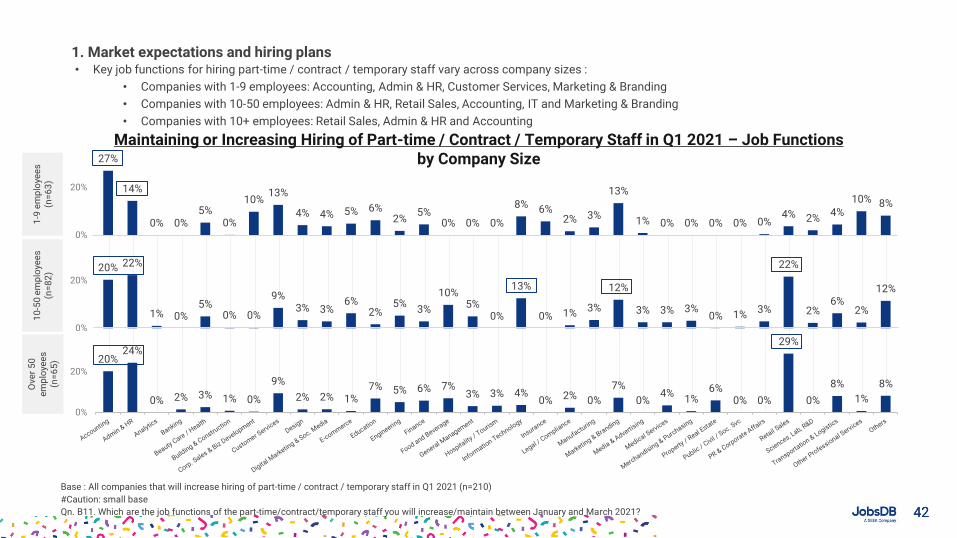
• Key job functions for hiring part-time / contract / temporary staff vary across company sizes :
• Companies with 1-9 employees: Accounting, Admin & HR, Customer Services, Marketing & Branding
• Companies with 10-50 employees: Admin & HR, Retail Sales, Accounting, IT and Marketing & Branding
• Companies with 10+ employees: Retail Sales, Admin & HR and Accounting
1. Market expectations and hiring plans
Maintaining or Increasing Hiring of Part-time / Contract / Temporary Staff in Q1 2021 – Job Functionsby Company Size
Base : All companies that will increase hiring of part-time / contract / temporary staff in Q1 2021 (n=210)
#Caution: small base
Qn. B11. Which are the job functions of the part-time/contract/temporary staff you will increase/maintain between January and March 2021?
20% 22%
1% 0%5%
0% 0%
9%3% 3%
6%2%
5%3%
10%5%
0%
13%
0% 1% 3%
12%
3% 3% 3%0% 1% 3%
22%
2%6%
2%
12%
0%
20%
20%24%
0% 2% 3% 1% 0%
9%
2% 2% 1%7% 5% 6% 7%
3% 3% 4%0% 2% 0%
7%
0%4%
1%6%
0% 0%
29%
0%
8%
1%
8%
0%
20%
1-9
em
plo
yee
s(n
=6
3)
10
-50
em
plo
yee
s(n
=8
2)
Ove
r 5
0
em
plo
yee
s(n
=6
5)
4343
21%
15%
0% 0%5%
0%3%
14%
5% 4% 6%2% 2% 2%
9%
2% 1%
10%
3% 3% 2%
10%
2% 4% 2% 2%0% 2%
20%
2%4% 6%
9%
0%
20%
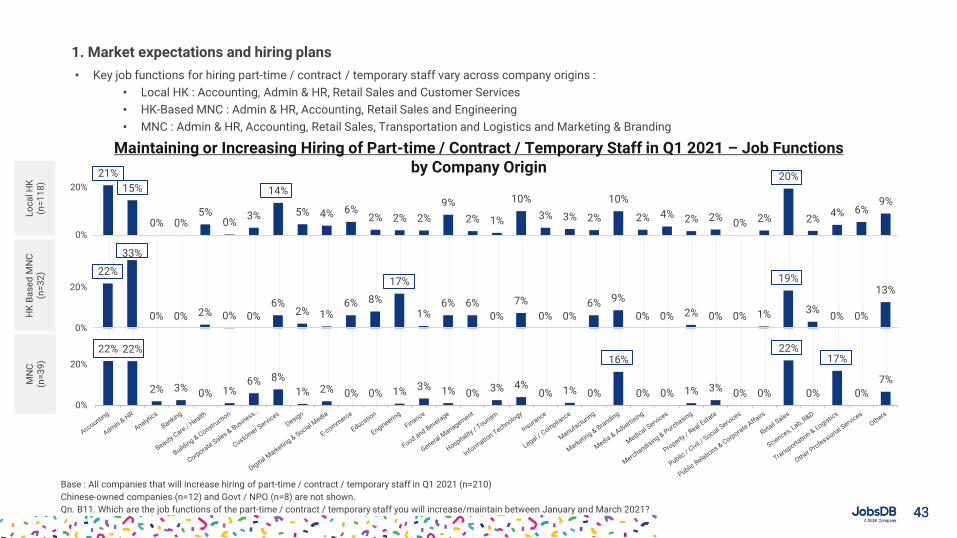
• Key job functions for hiring part-time / contract / temporary staff vary across company origins :
• Local HK : Accounting, Admin & HR, Retail Sales and Customer Services
• HK-Based MNC : Admin & HR, Accounting, Retail Sales and Engineering
• MNC : Admin & HR, Accounting, Retail Sales, Transportation and Logistics and Marketing & Branding
1. Market expectations and hiring plans
Maintaining or Increasing Hiring of Part-time / Contract / Temporary Staff in Q1 2021 – Job Functionsby Company Origin
Base : All companies that will increase hiring of part-time / contract / temporary staff in Q1 2021 (n=210)
Chinese-owned companies (n=12) and Govt / NPO (n=8) are not shown.
Qn. B11. Which are the job functions of the part-time / contract / temporary staff you will increase/maintain between January and March 2021?
22%
33%
0% 0% 2% 0% 0%6%
2% 1%6% 8%
17%
1%6% 6%
0%
7%
0% 0%6% 9%
0% 0% 2% 0% 0% 1%
19%
3%0% 0%
13%
0%
20%
22% 22%
2% 3% 0% 1%6% 8%
1% 2% 0% 0% 1% 3% 1% 0% 3% 4%0% 1% 0%
16%
0% 0% 1% 3% 0% 0%
22%
0%
17%
0%
7%
0%
20%
Lo
ca
l HK
(n
=1
18
)H
K B
as
ed
MN
C(n
=3
2)
MN
C(n
=3
9)
4444
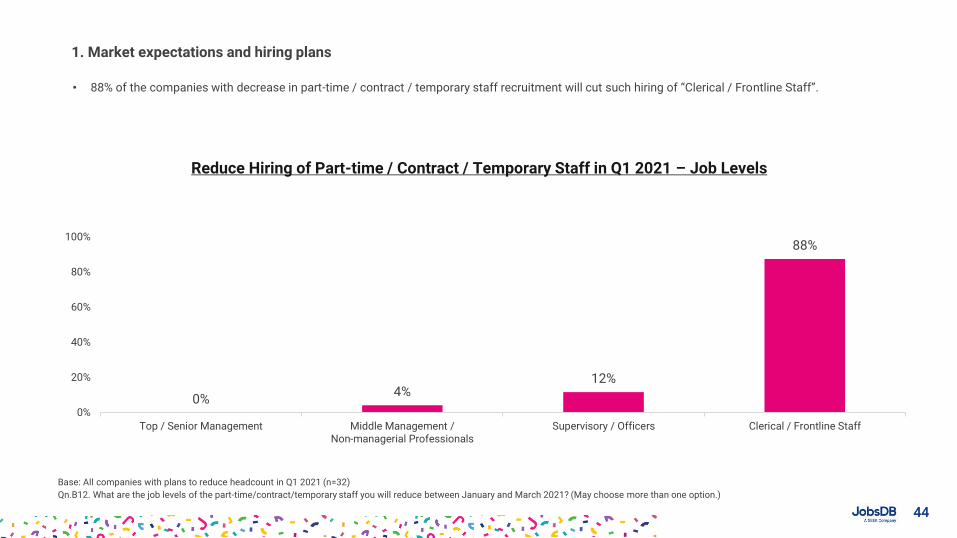
• 88% of the companies with decrease in part-time / contract / temporary staff recruitment will cut such hiring of “Clerical / Frontline Staff”.
1. Market expectations and hiring plans
Reduce Hiring of Part-time / Contract / Temporary Staff in Q1 2021 – Job Levels
Base: All companies with plans to reduce headcount in Q1 2021 (n=32)
Qn.B12. What are the job levels of the part-time/contract/temporary staff you will reduce between January and March 2021? (May choose more than one option.)
0%4%
12%
88%
0%
20%
40%
60%
80%
100%
Top / Senior Management Middle Management /Non-managerial Professionals
Supervisory / Officers Clerical / Frontline Staff
4545
13% 12%
2%4%
17%
3% 4%
8% 8%
3%
8%
4%
13%
4%
20%
4%3%
13%
0%
20%
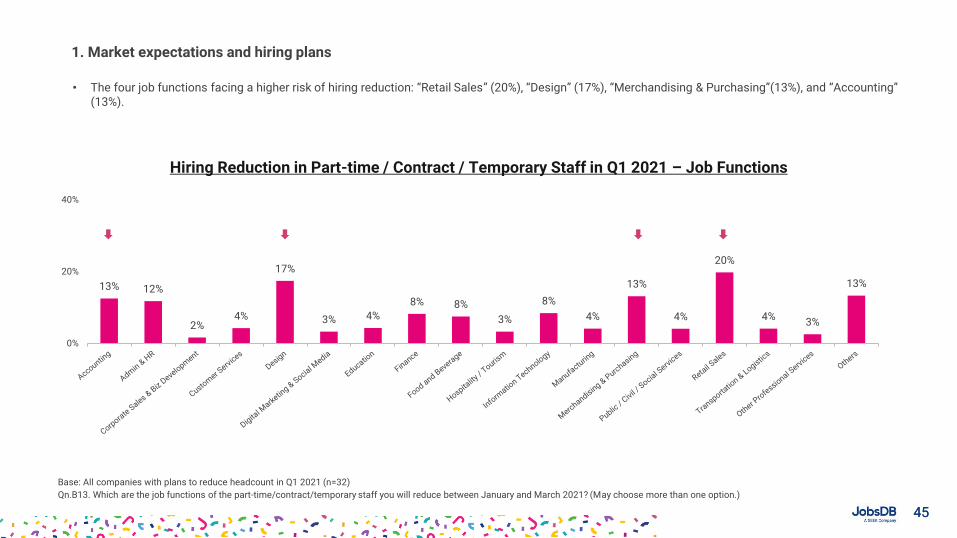
40%
• The four job functions facing a higher risk of hiring reduction: “Retail Sales” (20%), “Design” (17%), “Merchandising & Purchasing”(13%), and “Accounting” (13%).
1. Market expectations and hiring plans
Hiring Reduction in Part-time / Contract / Temporary Staff in Q1 2021 – Job Functions
Base: All companies with plans to reduce headcount in Q1 2021 (n=32)
Qn.B13. Which are the job functions of the part-time/contract/temporary staff you will reduce between January and March 2021? (May choose more than one option.)
4646
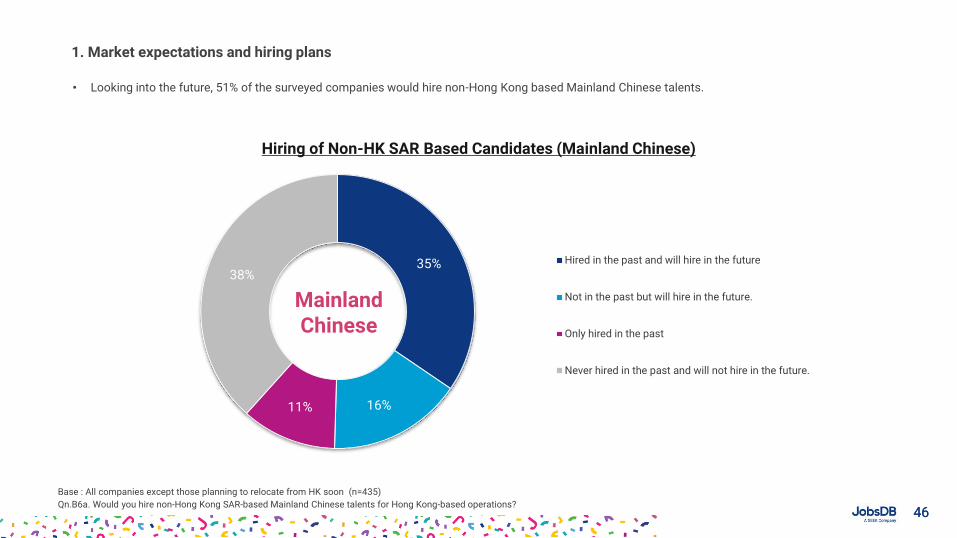
35%
16%11%
38%Hired in the past and will hire in the future
Not in the past but will hire in the future.
Only hired in the past
Never hired in the past and will not hire in the future.
• Looking into the future, 51% of the surveyed companies would hire non-Hong Kong based Mainland Chinese talents.
1. Market expectations and hiring plans
Hiring of Non-HK SAR Based Candidates (Mainland Chinese)
Base : All companies except those planning to relocate from HK soon (n=435)
Qn.B6a. Would you hire non-Hong Kong SAR-based Mainland Chinese talents for Hong Kong-based operations?
Mainland Chinese
4747
79%
5%
11%6%
37%
14%15%
34%29%
19%
8%
45%
28%
16%
14%
41%
32%
15%13%
40%
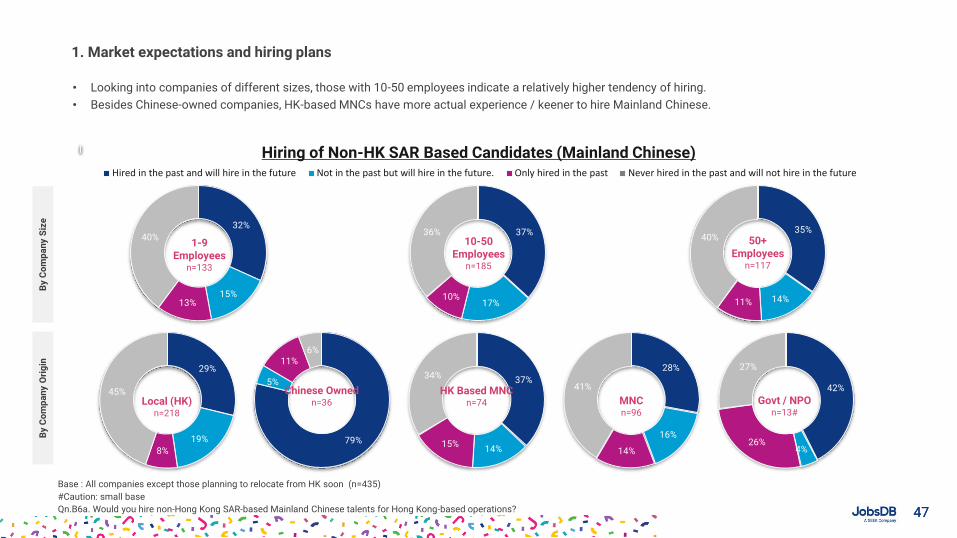
• Looking into companies of different sizes, those with 10-50 employees indicate a relatively higher tendency of hiring.
• Besides Chinese-owned companies, HK-based MNCs have more actual experience / keener to hire Mainland Chinese.
1. Market expectations and hiring plans
Hiring of Non-HK SAR Based Candidates (Mainland Chinese)
Base : All companies except those planning to relocate from HK soon (n=435)
#Caution: small base
Qn.B6a. Would you hire non-Hong Kong SAR-based Mainland Chinese talents for Hong Kong-based operations?
1-9 Employees
n=133
37%
17%10%
36% 35%
14%11%
40%10-50 Employees
n=185
50+ Employees
n=117
Local (HK)n=218
42%
4%26%
27%
Chinese Ownedn=36
HK Based MNCn=74 MNC
n=96
Govt / NPOn=13#
By
Co
mp
an
y S
ize
B
y C
om
pa
ny
Ori
gin
Hired in the past and will hire in the future Not in the past but will hire in the future. Only hired in the past Never hired in the past and will not hire in the future
4848
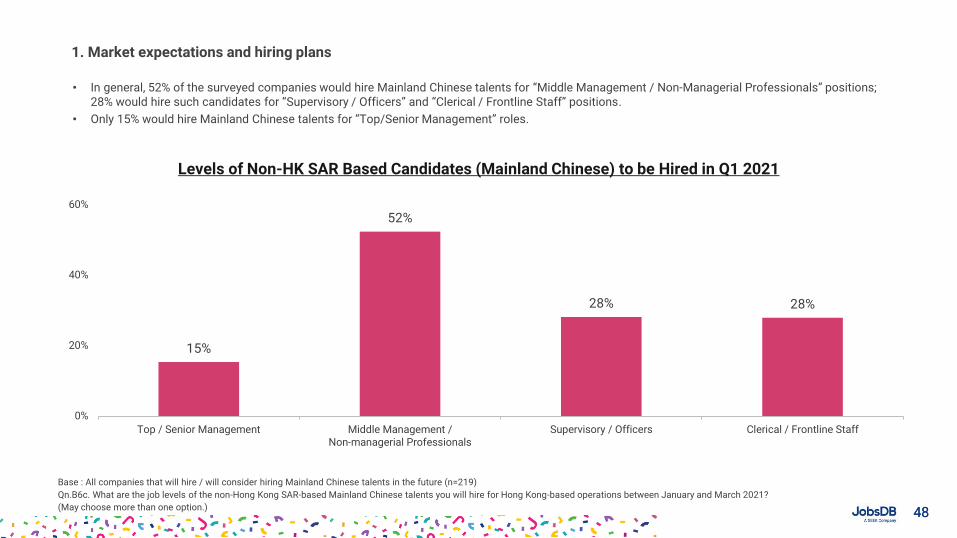
• In general, 52% of the surveyed companies would hire Mainland Chinese talents for “Middle Management / Non-Managerial Professionals” positions; 28% would hire such candidates for “Supervisory / Officers” and “Clerical / Frontline Staff” positions.
• Only 15% would hire Mainland Chinese talents for “Top/Senior Management” roles.
1. Market expectations and hiring plans
Levels of Non-HK SAR Based Candidates (Mainland Chinese) to be Hired in Q1 2021
Base : All companies that will hire / will consider hiring Mainland Chinese talents in the future (n=219)
Qn.B6c. What are the job levels of the non-Hong Kong SAR-based Mainland Chinese talents you will hire for Hong Kong-based operations between January and March 2021?
(May choose more than one option.)
15%
52%
28% 28%
0%
20%
40%
60%
Top / Senior Management Middle Management /Non-managerial Professionals
Supervisory / Officers Clerical / Frontline Staff
4949
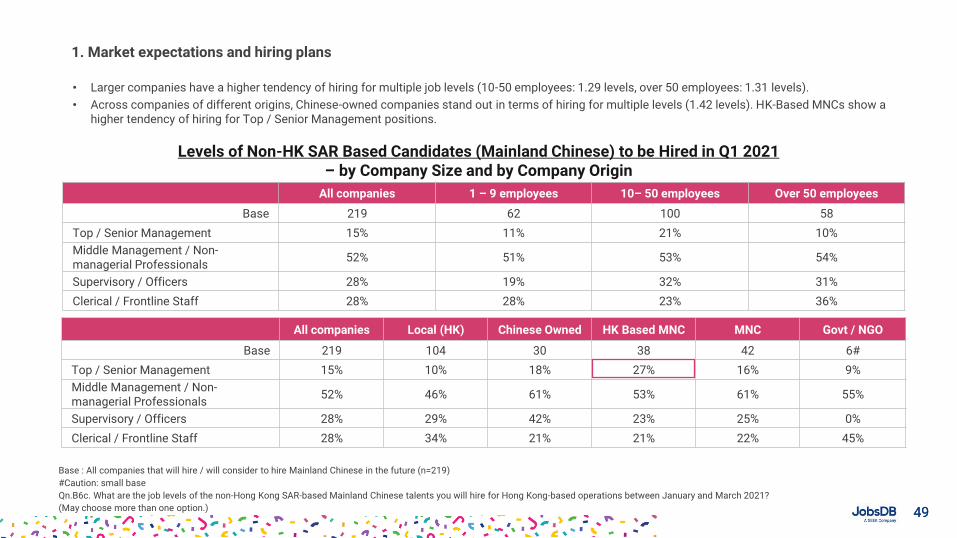
• Larger companies have a higher tendency of hiring for multiple job levels (10-50 employees: 1.29 levels, over 50 employees: 1.31 levels).
• Across companies of different origins, Chinese-owned companies stand out in terms of hiring for multiple levels (1.42 levels). HK-Based MNCs show a higher tendency of hiring for Top / Senior Management positions.
1. Market expectations and hiring plans
Base : All companies that will hire / will consider to hire Mainland Chinese in the future (n=219)
#Caution: small base
Qn.B6c. What are the job levels of the non-Hong Kong SAR-based Mainland Chinese talents you will hire for Hong Kong-based operations between January and March 2021?
(May choose more than one option.)
All companies 1 – 9 employees 10– 50 employees Over 50 employees
Base 219 62 100 58
Top / Senior Management 15% 11% 21% 10%
Middle Management / Non-managerial Professionals
52% 51% 53% 54%
Supervisory / Officers 28% 19% 32% 31%
Clerical / Frontline Staff 28% 28% 23% 36%
Levels of Non-HK SAR Based Candidates (Mainland Chinese) to be Hired in Q1 2021 – by Company Size and by Company Origin
All companies Local (HK) Chinese Owned HK Based MNC MNC Govt / NGO
Base 219 104 30 38 42 6#
Top / Senior Management 15% 10% 18% 27% 16% 9%
Middle Management / Non-managerial Professionals
52% 46% 61% 53% 61% 55%
Supervisory / Officers 28% 29% 42% 23% 25% 0%
Clerical / Frontline Staff 28% 34% 21% 21% 22% 45%
5050
36%
14%11%
39%Hired in the past and will hire in the future
Not in the past but will hire in the future.
Only hired in the past
Never hired in the past and will not hire in the future.
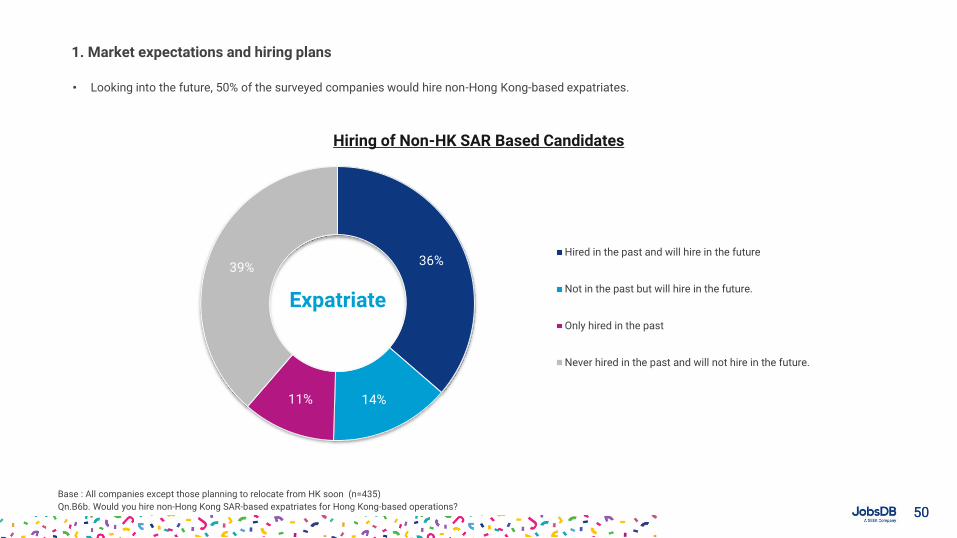
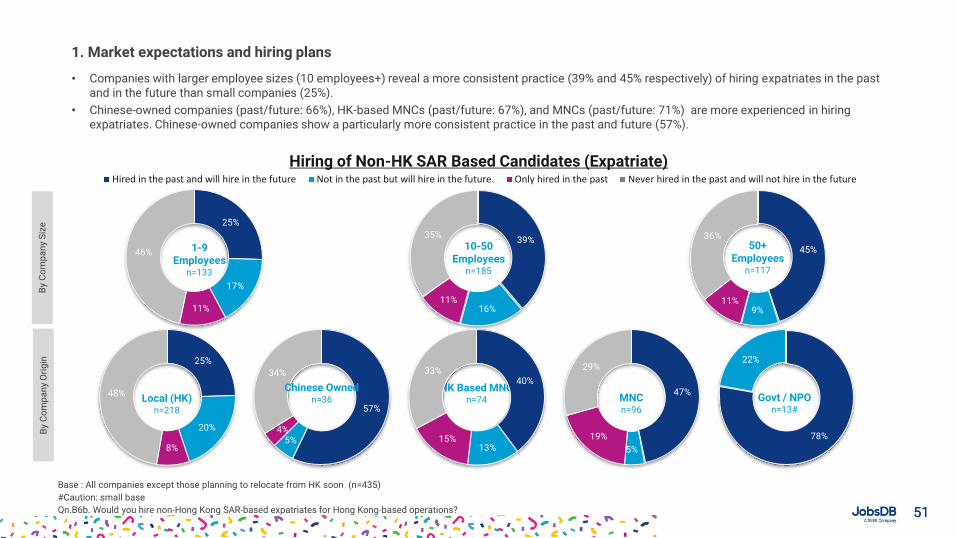
• Looking into the future, 50% of the surveyed companies would hire non-Hong Kong-based expatriates.
1. Market expectations and hiring plans
Hiring of Non-HK SAR Based Candidates
Base : All companies except those planning to relocate from HK soon (n=435)
Qn.B6b. Would you hire non-Hong Kong SAR-based expatriates for Hong Kong-based operations?
Expatriate
5151
25%
20%
8%
48%
• Companies with larger employee sizes (10 employees+) reveal a more consistent practice (39% and 45% respectively) of hiring expatriates in the past and in the future than small companies (25%).
• Chinese-owned companies (past/future: 66%), HK-based MNCs (past/future: 67%), and MNCs (past/future: 71%) are more experienced in hiring expatriates. Chinese-owned companies show a particularly more consistent practice in the past and future (57%).
57%
5%4%
34%
Hired in the past and will hire in the future Not in the past but will hire in the future. Only hired in the past Never hired in the past and will not hire in the future
47%
5%
19%
29%
25%
17%
11%
46%
1. Market expectations and hiring plans
Hiring of Non-HK SAR Based Candidates (Expatriate)
Base : All companies except those planning to relocate from HK soon (n=435)
#Caution: small base
Qn.B6b. Would you hire non-Hong Kong SAR-based expatriates for Hong Kong-based operations?
1-9 Employees
n=133
39%
16%11%
35%
45%
9%11%
36%10-50
Employeesn=185
50+ Employees
n=117
Local (HK)n=218
78%
22%
Chinese Ownedn=36
HK Based MNCn=74 MNC
n=96
Govt / NPOn=13#
By
Co
mp
an
y S
ize
B
y C
om
pa
ny
Ori
gin
40%
13%15%
33%
5252
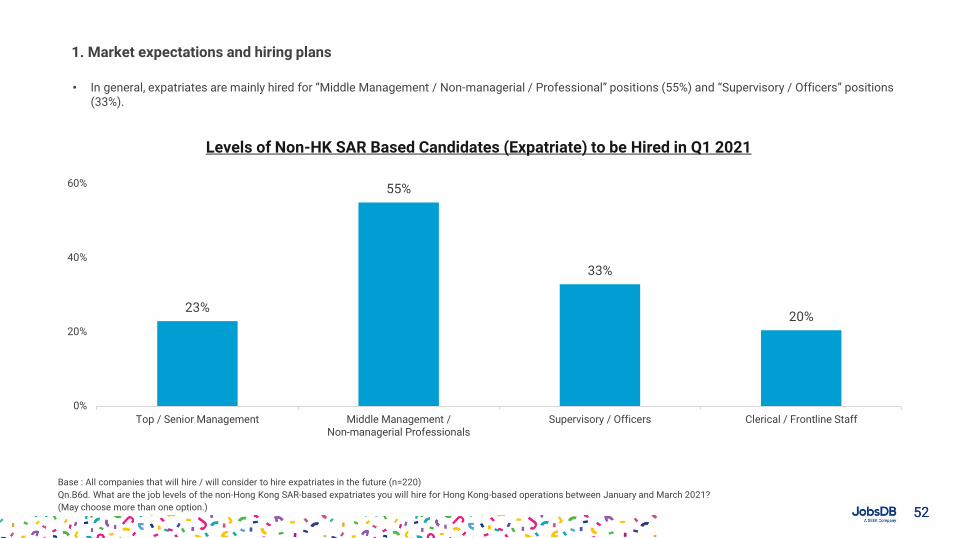
• In general, expatriates are mainly hired for “Middle Management / Non-managerial / Professional” positions (55%) and “Supervisory / Officers” positions (33%).
1. Market expectations and hiring plans
Base : All companies that will hire / will consider to hire expatriates in the future (n=220)
Qn.B6d. What are the job levels of the non-Hong Kong SAR-based expatriates you will hire for Hong Kong-based operations between January and March 2021?
(May choose more than one option.)
23%
55%
33%
20%
0%
20%
40%
60%
Top / Senior Management Middle Management /Non-managerial Professionals
Supervisory / Officers Clerical / Frontline Staff
Levels of Non-HK SAR Based Candidates (Expatriate) to be Hired in Q1 2021
5353
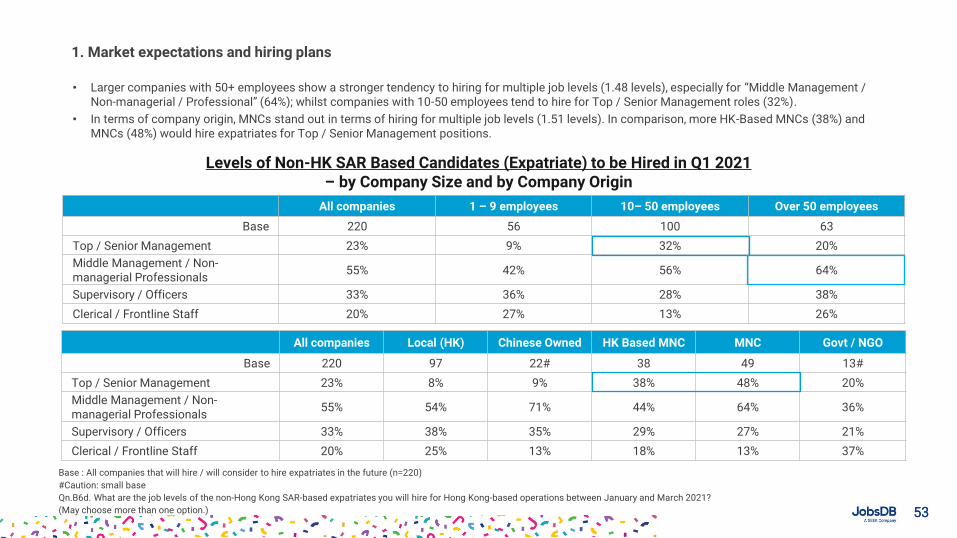
All companies 1 – 9 employees 10– 50 employees Over 50 employees
Base 220 56 100 63
Top / Senior Management 23% 9% 32% 20%
Middle Management / Non-managerial Professionals
55% 42% 56% 64%
Supervisory / Officers 33% 36% 28% 38%
Clerical / Frontline Staff 20% 27% 13% 26%
• Larger companies with 50+ employees show a stronger tendency to hiring for multiple job levels (1.48 levels), especially for “Middle Management / Non-managerial / Professional” (64%); whilst companies with 10-50 employees tend to hire for Top / Senior Management roles (32%).
• In terms of company origin, MNCs stand out in terms of hiring for multiple job levels (1.51 levels). In comparison, more HK-Based MNCs (38%) and MNCs (48%) would hire expatriates for Top / Senior Management positions.
1. Market expectations and hiring plans
Base : All companies that will hire / will consider to hire expatriates in the future (n=220)
#Caution: small base
Qn.B6d. What are the job levels of the non-Hong Kong SAR-based expatriates you will hire for Hong Kong-based operations between January and March 2021?
(May choose more than one option.)
All companies Local (HK) Chinese Owned HK Based MNC MNC Govt / NGO
Base 220 97 22# 38 49 13#
Top / Senior Management 23% 8% 9% 38% 48% 20%
Middle Management / Non-managerial Professionals
55% 54% 71% 44% 64% 36%
Supervisory / Officers 33% 38% 35% 29% 27% 21%
Clerical / Frontline Staff 20% 25% 13% 18% 13% 37%
Levels of Non-HK SAR Based Candidates (Expatriate) to be Hired in Q1 2021– by Company Size and by Company Origin

Job functions in demand
5555
18%
12%
2% 1% 3% 3%
10%
5% 6% 6%4%
9%12%
6% 6%3%
10%
2%4%
7%10%
1% 2%
12%
6%
1% 1%
12%
24%
3%
9%6%
8%
0%
20%
40%
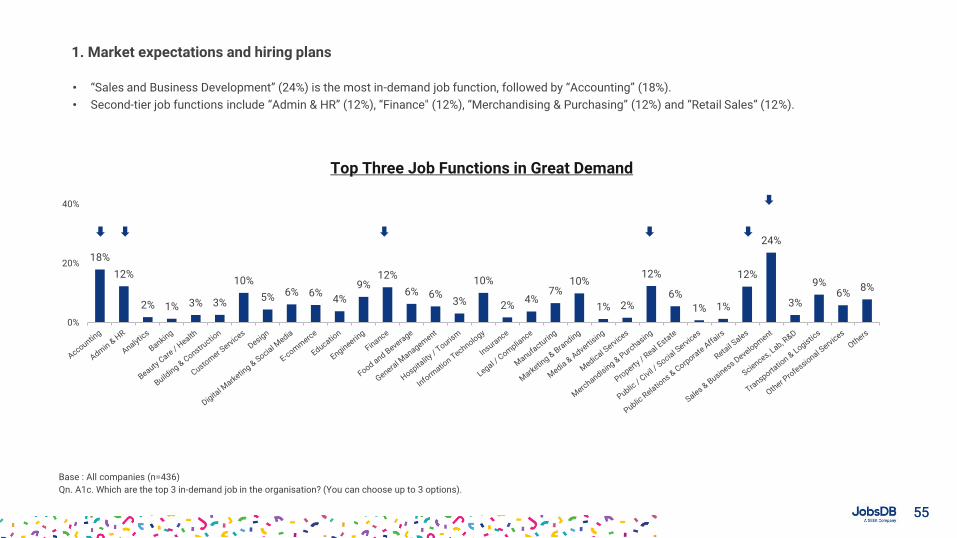
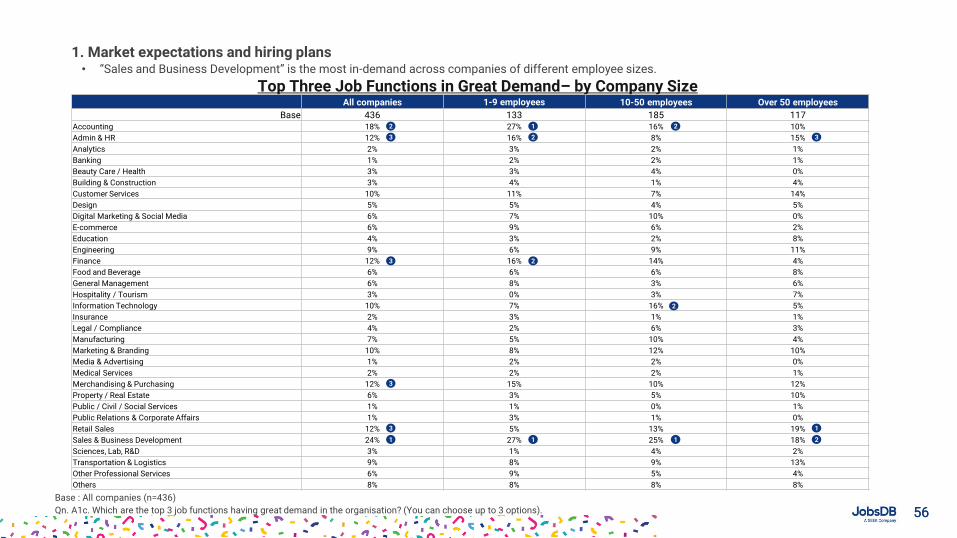
• “Sales and Business Development” (24%) is the most in-demand job function, followed by “Accounting” (18%).
• Second-tier job functions include “Admin & HR” (12%), “Finance" (12%), “Merchandising & Purchasing” (12%) and “Retail Sales” (12%).
1. Market expectations and hiring plans
Top Three Job Functions in Great Demand
Base : All companies (n=436)
Qn. A1c. Which are the top 3 in-demand job in the organisation? (You can choose up to 3 options).
5656
• “Sales and Business Development” is the most in-demand across companies of different employee sizes.
1. Market expectations and hiring plans
Top Three Job Functions in Great Demand– by Company Size
Base : All companies (n=436)
Qn. A1c. Which are the top 3 job functions having great demand in the organisation? (You can choose up to 3 options).
All companies 1-9 employees 10-50 employees Over 50 employees
Base 436 133 185 117Accounting 18% 27% 16% 10%
Admin & HR 12% 16% 8% 15%
Analytics 2% 3% 2% 1%
Banking 1% 2% 2% 1%
Beauty Care / Health 3% 3% 4% 0%
Building & Construction 3% 4% 1% 4%
Customer Services 10% 11% 7% 14%
Design 5% 5% 4% 5%
Digital Marketing & Social Media 6% 7% 10% 0%
E-commerce 6% 9% 6% 2%
Education 4% 3% 2% 8%
Engineering 9% 6% 9% 11%
Finance 12% 16% 14% 4%
Food and Beverage 6% 6% 6% 8%
General Management 6% 8% 3% 6%
Hospitality / Tourism 3% 0% 3% 7%
Information Technology 10% 7% 16% 5%
Insurance 2% 3% 1% 1%
Legal / Compliance 4% 2% 6% 3%
Manufacturing 7% 5% 10% 4%
Marketing & Branding 10% 8% 12% 10%
Media & Advertising 1% 2% 2% 0%
Medical Services 2% 2% 2% 1%
Merchandising & Purchasing 12% 15% 10% 12%
Property / Real Estate 6% 3% 5% 10%
Public / Civil / Social Services 1% 1% 0% 1%
Public Relations & Corporate Affairs 1% 3% 1% 0%
Retail Sales 12% 5% 13% 19%
Sales & Business Development 24% 27% 25% 18%
Sciences, Lab, R&D 3% 1% 4% 2%
Transportation & Logistics 9% 8% 9% 13%
Other Professional Services 6% 9% 5% 4%
Others 8% 8% 8% 8%
1
2
3
3
3
3
1
1
2
2
1
2
2
1
2
3
5757
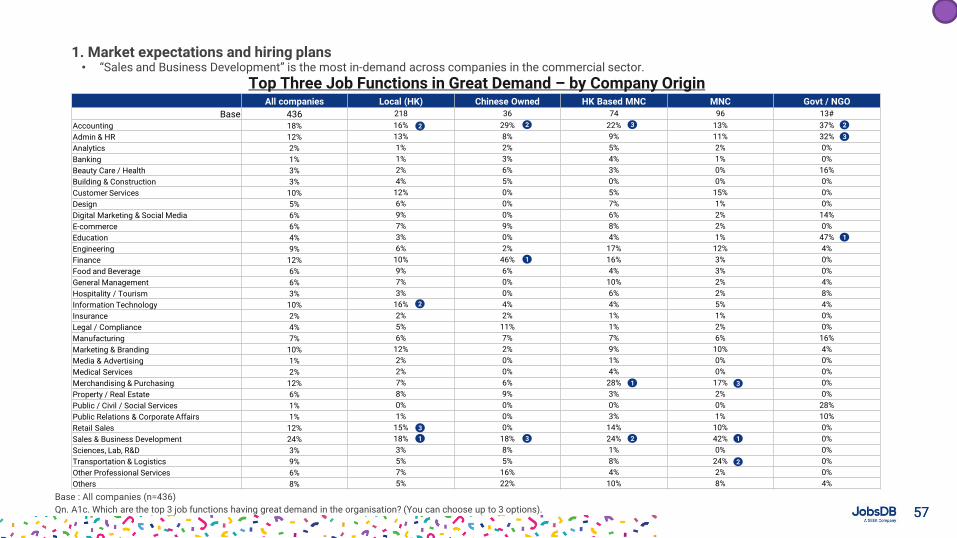
• “Sales and Business Development” is the most in-demand across companies in the commercial sector. 1. Market expectations and hiring plans
Base : All companies (n=436)
Qn. A1c. Which are the top 3 job functions having great demand in the organisation? (You can choose up to 3 options).
All companies Local (HK) Chinese Owned HK Based MNC MNC Govt / NGO
Base 436 218 36 74 96 13#
Accounting 18% 16% 29% 22% 13% 37%
Admin & HR 12% 13% 8% 9% 11% 32%
Analytics 2% 1% 2% 5% 2% 0%
Banking 1% 1% 3% 4% 1% 0%
Beauty Care / Health 3% 2% 6% 3% 0% 16%
Building & Construction 3% 4% 5% 0% 0% 0%
Customer Services 10% 12% 0% 5% 15% 0%
Design 5% 6% 0% 7% 1% 0%
Digital Marketing & Social Media 6% 9% 0% 6% 2% 14%
E-commerce 6% 7% 9% 8% 2% 0%
Education 4% 3% 0% 4% 1% 47%
Engineering 9% 6% 2% 17% 12% 4%
Finance 12% 10% 46% 16% 3% 0%
Food and Beverage 6% 9% 6% 4% 3% 0%
General Management 6% 7% 0% 10% 2% 4%
Hospitality / Tourism 3% 3% 0% 6% 2% 8%
Information Technology 10% 16% 4% 4% 5% 4%
Insurance 2% 2% 2% 1% 1% 0%
Legal / Compliance 4% 5% 11% 1% 2% 0%
Manufacturing 7% 6% 7% 7% 6% 16%
Marketing & Branding 10% 12% 2% 9% 10% 4%
Media & Advertising 1% 2% 0% 1% 0% 0%
Medical Services 2% 2% 0% 4% 0% 0%
Merchandising & Purchasing 12% 7% 6% 28% 17% 0%
Property / Real Estate 6% 8% 9% 3% 2% 0%
Public / Civil / Social Services 1% 0% 0% 0% 0% 28%
Public Relations & Corporate Affairs 1% 1% 0% 3% 1% 10%
Retail Sales 12% 15% 0% 14% 10% 0%
Sales & Business Development 24% 18% 18% 24% 42% 0%
Sciences, Lab, R&D 3% 3% 8% 1% 0% 0%
Transportation & Logistics 9% 5% 5% 8% 24% 0%
Other Professional Services 6% 7% 16% 4% 2% 0%
Others 8% 5% 22% 10% 8% 4%
1
2
3
3
2
1
2
3
1
2
3
1
2
3
1
Top Three Job Functions in Great Demand – by Company Origin
2
Section 2Recent hiring and candidate attraction
5959
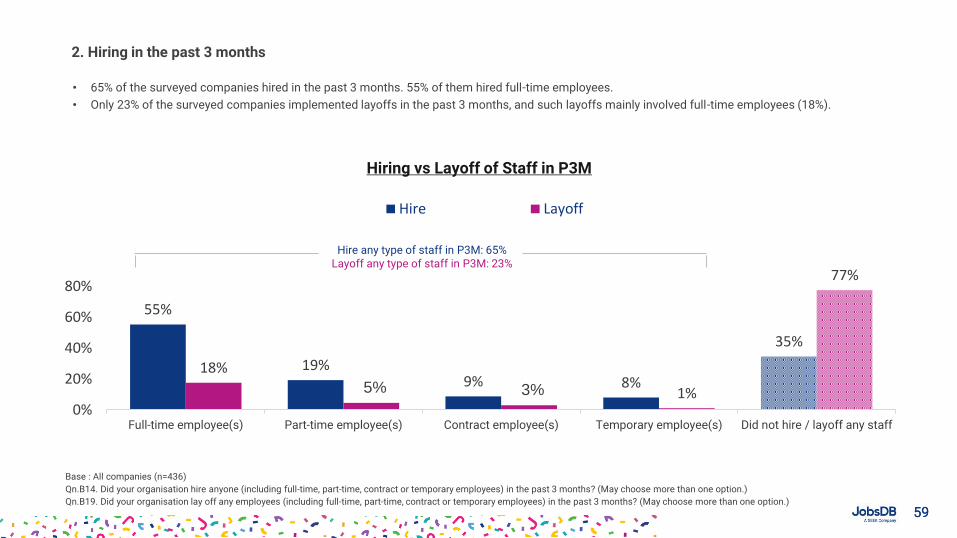
• 65% of the surveyed companies hired in the past 3 months. 55% of them hired full-time employees.
• Only 23% of the surveyed companies implemented layoffs in the past 3 months, and such layoffs mainly involved full-time employees (18%).
2. Hiring in the past 3 months
Hiring vs Layoff of Staff in P3M
55%
19%9% 8%
35%
18%
5% 3% 1%
77%
0%
20%
40%
60%
80%
Full-time employee(s) Part-time employee(s) Contract employee(s) Temporary employee(s) Did not hire / layoff any staff
Hire Layoff
Hire any type of staff in P3M: 65%Layoff any type of staff in P3M: 23%
Base : All companies (n=436)
Qn.B14. Did your organisation hire anyone (including full-time, part-time, contract or temporary employees) in the past 3 months? (May choose more than one option.)
Qn.B19. Did your organisation lay off any employees (including full-time, part-time, contract or temporary employees) in the past 3 months? (May choose more than one option.)
6060
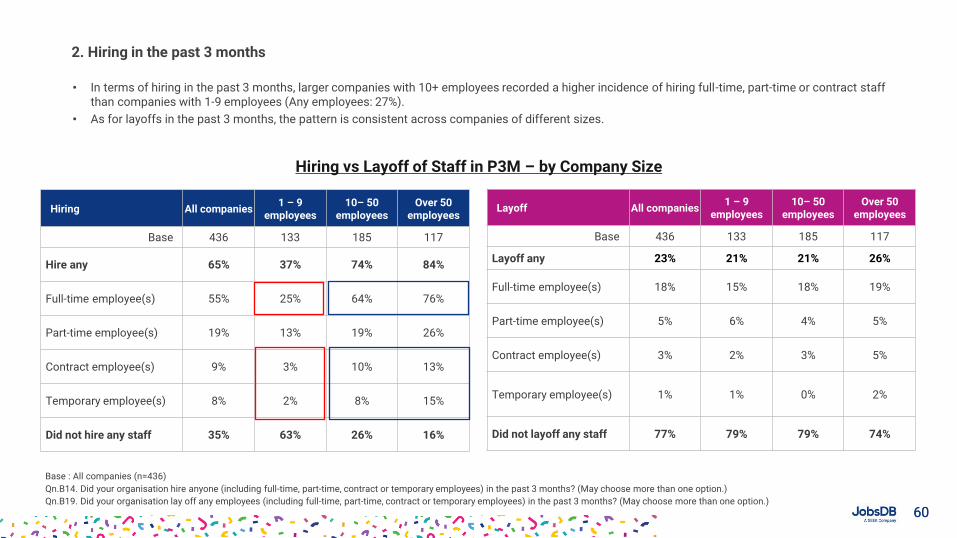
• In terms of hiring in the past 3 months, larger companies with 10+ employees recorded a higher incidence of hiring full-time, part-time or contract staff than companies with 1-9 employees (Any employees: 27%).
• As for layoffs in the past 3 months, the pattern is consistent across companies of different sizes.
2. Hiring in the past 3 months
Hiring vs Layoff of Staff in P3M – by Company Size
Hiring All companies1 – 9
employees 10– 50
employees Over 50
employees
Base 436 133 185 117
Hire any 65% 37% 74% 84%
Full-time employee(s) 55% 25% 64% 76%
Part-time employee(s) 19% 13% 19% 26%
Contract employee(s) 9% 3% 10% 13%
Temporary employee(s) 8% 2% 8% 15%
Did not hire any staff 35% 63% 26% 16%
Base : All companies (n=436)
Qn.B14. Did your organisation hire anyone (including full-time, part-time, contract or temporary employees) in the past 3 months? (May choose more than one option.)
Qn.B19. Did your organisation lay off any employees (including full-time, part-time, contract or temporary employees) in the past 3 months? (May choose more than one option.)
Layoff All companies1 – 9
employees 10– 50
employees Over 50
employees
Base 436 133 185 117
Layoff any 23% 21% 21% 26%
Full-time employee(s) 18% 15% 18% 19%
Part-time employee(s) 5% 6% 4% 5%
Contract employee(s) 3% 2% 3% 5%
Temporary employee(s) 1% 1% 0% 2%
Did not layoff any staff 77% 79% 79% 74%
6161
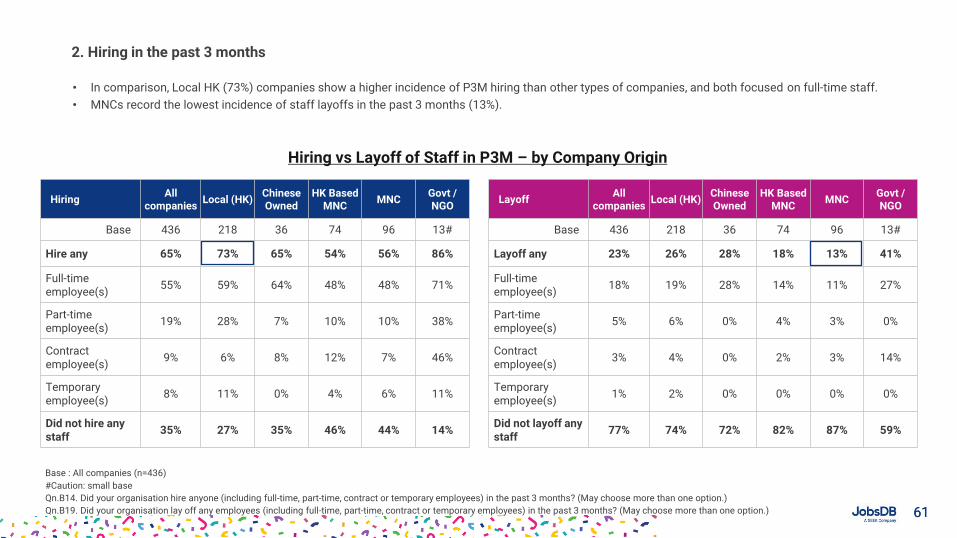
• In comparison, Local HK (73%) companies show a higher incidence of P3M hiring than other types of companies, and both focused on full-time staff.
• MNCs record the lowest incidence of staff layoffs in the past 3 months (13%).
2. Hiring in the past 3 months
Hiring vs Layoff of Staff in P3M – by Company Origin
Hiring All
companiesLocal (HK)
Chinese Owned
HK BasedMNC
MNCGovt / NGO
Base 436 218 36 74 96 13#
Hire any 65% 73% 65% 54% 56% 86%
Full-time employee(s)
55% 59% 64% 48% 48% 71%
Part-time employee(s)
19% 28% 7% 10% 10% 38%
Contract employee(s)
9% 6% 8% 12% 7% 46%
Temporary employee(s)
8% 11% 0% 4% 6% 11%
Did not hire any staff
35% 27% 35% 46% 44% 14%
Base : All companies (n=436)
#Caution: small base
Qn.B14. Did your organisation hire anyone (including full-time, part-time, contract or temporary employees) in the past 3 months? (May choose more than one option.)
Qn.B19. Did your organisation lay off any employees (including full-time, part-time, contract or temporary employees) in the past 3 months? (May choose more than one option.)
LayoffAll
companiesLocal (HK)
Chinese Owned
HK BasedMNC
MNCGovt / NGO
Base 436 218 36 74 96 13#
Layoff any 23% 26% 28% 18% 13% 41%
Full-time employee(s)
18% 19% 28% 14% 11% 27%
Part-time employee(s)
5% 6% 0% 4% 3% 0%
Contract employee(s)
3% 4% 0% 2% 3% 14%
Temporary employee(s)
1% 2% 0% 0% 0% 0%
Did not layoff any staff
77% 74% 72% 82% 87% 59%
6262
38%
37%
30%
29%
28%
27%
21%
15%
13%
13%
11%
8%
6%
2%
29%
25%
21%
21%
17%
19%
15%
10%
8%
10%
8%
4%
4%
1%
20%
14%
12%
8%
8%
9%
8%
6%
3%
6%
3%
2%
1%
*
Attractive salary / compensation
Good working environment / facilities
Location of the job
Harmonious relationship among colleagues
Promotion of work-life balance
Positive culture of the organisation
Ensuring job security
Promising career / development opportunities
Provide additional benefits
The management / management quality is good
Established or large organisation size / strong market position
Efficient recruitment process
Renowned organisation reputation
Organisation promotes corporate social responsibility
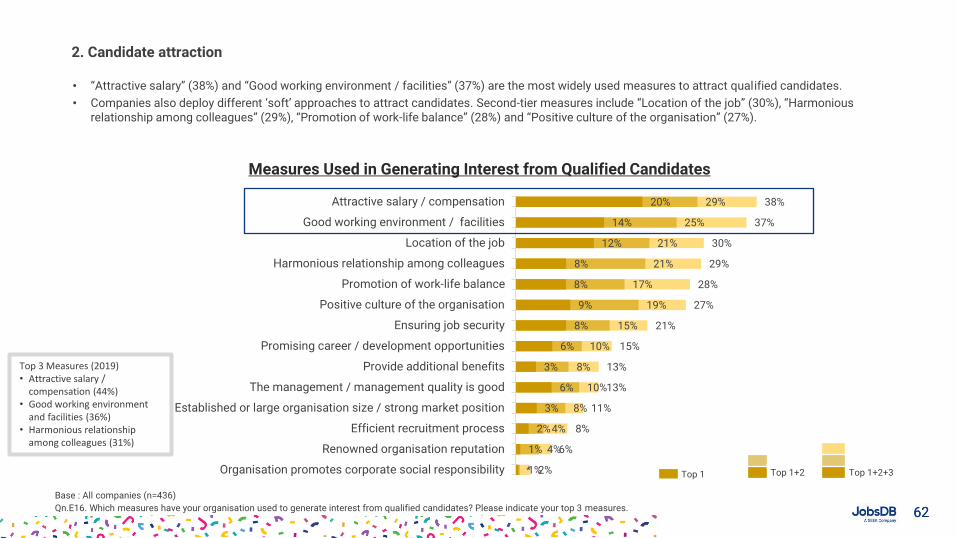
• “Attractive salary” (38%) and “Good working environment / facilities” (37%) are the most widely used measures to attract qualified candidates.
• Companies also deploy different ‘soft’ approaches to attract candidates. Second-tier measures include “Location of the job” (30%), “Harmonious relationship among colleagues” (29%), “Promotion of work-life balance” (28%) and “Positive culture of the organisation” (27%).
2. Candidate attraction
Measures Used in Generating Interest from Qualified Candidates
Base : All companies (n=436)
Qn.E16. Which measures have your organisation used to generate interest from qualified candidates? Please indicate your top 3 measures.
Top 1 Top 1+2 Top 1+2+3
Top 3 Measures (2019)• Attractive salary /
compensation (44%)• Good working environment
and facilities (36%)• Harmonious relationship
among colleagues (31%)
6363
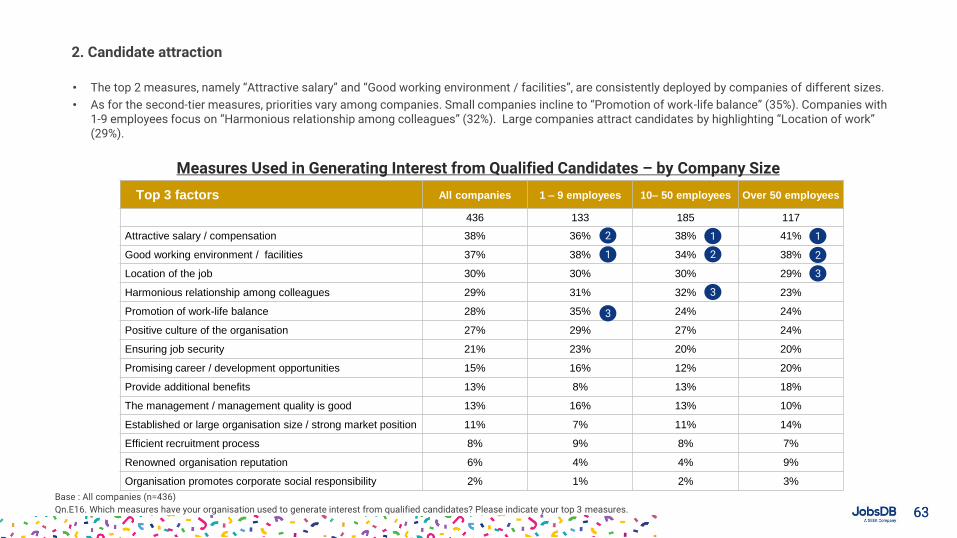
• The top 2 measures, namely “Attractive salary” and “Good working environment / facilities”, are consistently deployed by companies of different sizes.
• As for the second-tier measures, priorities vary among companies. Small companies incline to “Promotion of work-life balance” (35%). Companies with 1-9 employees focus on “Harmonious relationship among colleagues” (32%). Large companies attract candidates by highlighting “Location of work” (29%).
2. Candidate attraction
Measures Used in Generating Interest from Qualified Candidates – by Company Size
Base : All companies (n=436)
Qn.E16. Which measures have your organisation used to generate interest from qualified candidates? Please indicate your top 3 measures.
Top 3 factors All companies 1 – 9 employees 10– 50 employees Over 50 employees
436 133 185 117
Attractive salary / compensation 38% 36% 38% 41%
Good working environment / facilities 37% 38% 34% 38%
Location of the job 30% 30% 30% 29%
Harmonious relationship among colleagues 29% 31% 32% 23%
Promotion of work-life balance 28% 35% 24% 24%
Positive culture of the organisation 27% 29% 27% 24%
Ensuring job security 21% 23% 20% 20%
Promising career / development opportunities 15% 16% 12% 20%
Provide additional benefits 13% 8% 13% 18%
The management / management quality is good 13% 16% 13% 10%
Established or large organisation size / strong market position 11% 7% 11% 14%
Efficient recruitment process 8% 9% 8% 7%
Renowned organisation reputation 6% 4% 4% 9%
Organisation promotes corporate social responsibility 2% 1% 2% 3%
1
2
3
1
2
3
1
2
3
6464
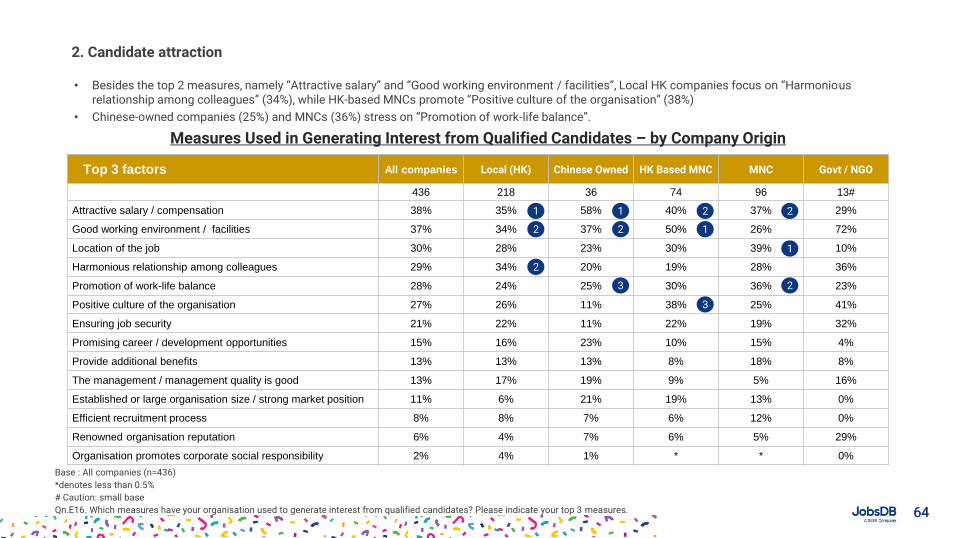
• Besides the top 2 measures, namely “Attractive salary” and “Good working environment / facilities”, Local HK companies focus on “Harmoniousrelationship among colleagues” (34%), while HK-based MNCs promote “Positive culture of the organisation” (38%)
• Chinese-owned companies (25%) and MNCs (36%) stress on “Promotion of work-life balance”.
2. Candidate attraction
Base : All companies (n=436)
*denotes less than 0.5%
# Caution: small base
Qn.E16. Which measures have your organisation used to generate interest from qualified candidates? Please indicate your top 3 measures.
Top 3 factors All companies Local (HK) Chinese Owned HK Based MNC MNC Govt / NGO
436 218 36 74 96 13#
Attractive salary / compensation 38% 35% 58% 40% 37% 29%
Good working environment / facilities 37% 34% 37% 50% 26% 72%
Location of the job 30% 28% 23% 30% 39% 10%
Harmonious relationship among colleagues 29% 34% 20% 19% 28% 36%
Promotion of work-life balance 28% 24% 25% 30% 36% 23%
Positive culture of the organisation 27% 26% 11% 38% 25% 41%
Ensuring job security 21% 22% 11% 22% 19% 32%
Promising career / development opportunities 15% 16% 23% 10% 15% 4%
Provide additional benefits 13% 13% 13% 8% 18% 8%
The management / management quality is good 13% 17% 19% 9% 5% 16%
Established or large organisation size / strong market position 11% 6% 21% 19% 13% 0%
Efficient recruitment process 8% 8% 7% 6% 12% 0%
Renowned organisation reputation 6% 4% 7% 6% 5% 29%
Organisation promotes corporate social responsibility 2% 4% 1% * * 0%
1
2
2
1
2
3
2
1
3
2
1
2
Measures Used in Generating Interest from Qualified Candidates – by Company Origin
6565
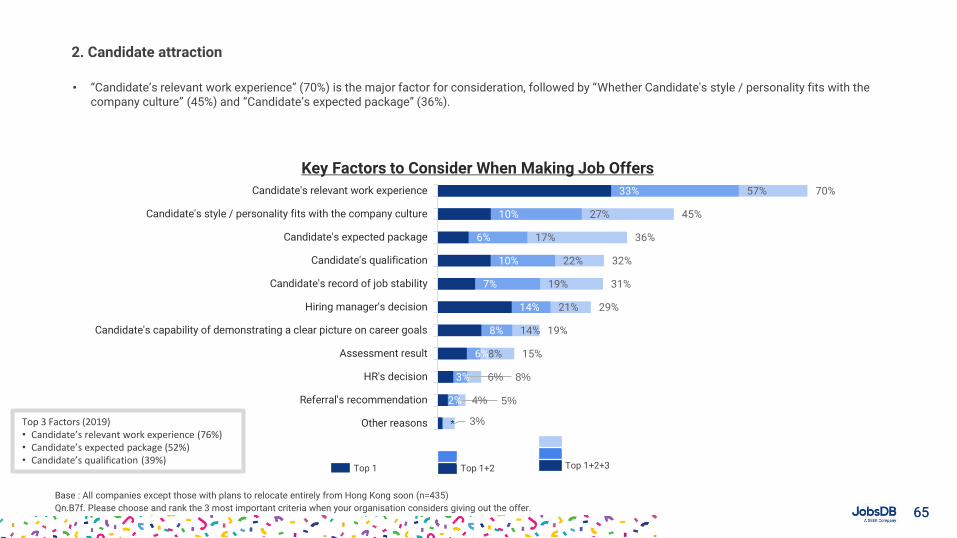
• “Candidate’s relevant work experience” (70%) is the major factor for consideration, followed by “Whether Candidate's style / personality fits with the company culture” (45%) and “Candidate’s expected package” (36%).
2. Candidate attraction
Key Factors to Consider When Making Job Offers
Base : All companies except those with plans to relocate entirely from Hong Kong soon (n=435)
Qn.B7f. Please choose and rank the 3 most important criteria when your organisation considers giving out the offer.
70%
45%
36%
32%
31%
29%
19%
15%
8%
5%
3%
57%
27%
17%
22%
19%
21%
14%
8%
6%
4%
33%
10%
6%
10%
7%
14%
8%
6%
3%
2%
*
Candidate's relevant work experience
Candidate's style / personality fits with the company culture
Candidate's expected package
Candidate's qualification
Candidate's record of job stability
Hiring manager's decision
Candidate's capability of demonstrating a clear picture on career goals
Assessment result
HR's decision
Referral's recommendation
Other reasons
Top 1 Top 1+2 Top 1+2+3
Top 3 Factors (2019)• Candidate’s relevant work experience (76%)• Candidate’s expected package (52%)• Candidate’s qualification (39%)
6666
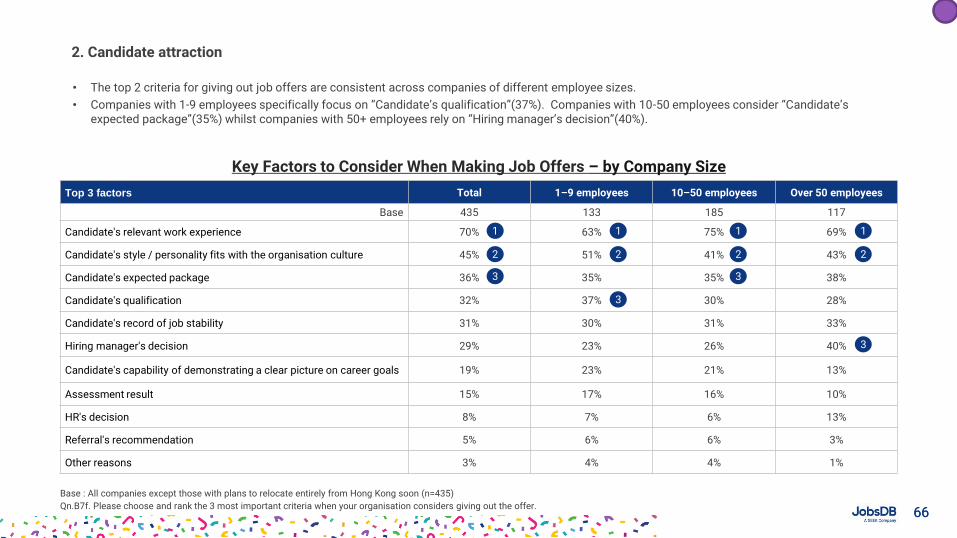
• The top 2 criteria for giving out job offers are consistent across companies of different employee sizes.
• Companies with 1-9 employees specifically focus on “Candidate’s qualification”(37%). Companies with 10-50 employees consider “Candidate’s expected package”(35%) whilst companies with 50+ employees rely on “Hiring manager’s decision”(40%).
2. Candidate attraction
Key Factors to Consider When Making Job Offers – by Company Size
Base : All companies except those with plans to relocate entirely from Hong Kong soon (n=435)
Qn.B7f. Please choose and rank the 3 most important criteria when your organisation considers giving out the offer.
Top 3 factors Total 1–9 employees 10–50 employees Over 50 employees
Base 435 133 185 117
Candidate's relevant work experience 70% 63% 75% 69%
Candidate's style / personality fits with the organisation culture 45% 51% 41% 43%
Candidate's expected package 36% 35% 35% 38%
Candidate's qualification 32% 37% 30% 28%
Candidate's record of job stability 31% 30% 31% 33%
Hiring manager's decision 29% 23% 26% 40%
Candidate's capability of demonstrating a clear picture on career goals 19% 23% 21% 13%
Assessment result 15% 17% 16% 10%
HR's decision 8% 7% 6% 13%
Referral's recommendation 5% 6% 6% 3%
Other reasons 3% 4% 4% 1%
1
2
3
1
2
3
1
2
3
1
2
3
6767
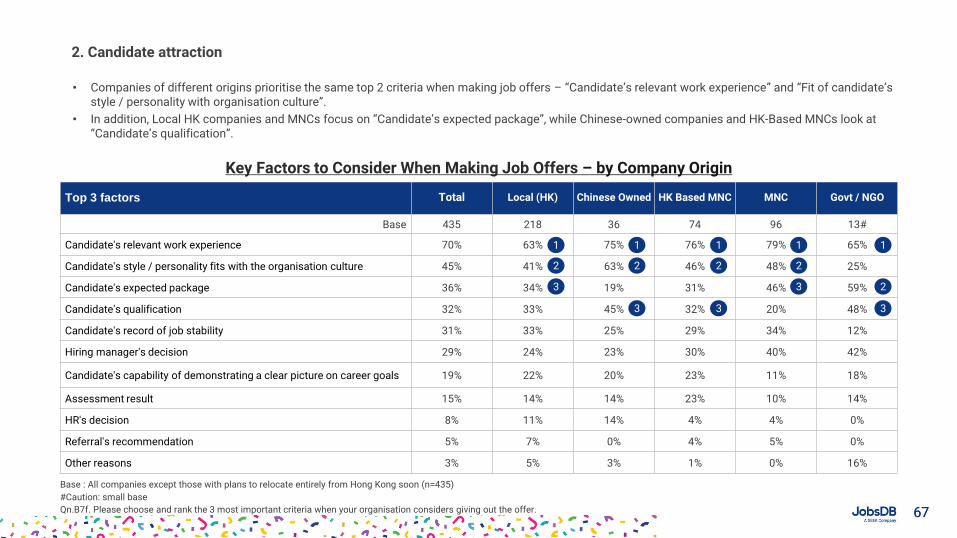
• Companies of different origins prioritise the same top 2 criteria when making job offers – “Candidate’s relevant work experience” and “Fit of candidate’s style / personality with organisation culture”.
• In addition, Local HK companies and MNCs focus on “Candidate’s expected package”, while Chinese-owned companies and HK-Based MNCs look at “Candidate’s qualification”.
2. Candidate attraction
Top 3 factors Total Local (HK) Chinese Owned HK Based MNC MNC Govt / NGO
Base 435 218 36 74 96 13#
Candidate's relevant work experience 70% 63% 75% 76% 79% 65%
Candidate's style / personality fits with the organisation culture 45% 41% 63% 46% 48% 25%
Candidate's expected package 36% 34% 19% 31% 46% 59%
Candidate's qualification 32% 33% 45% 32% 20% 48%
Candidate's record of job stability 31% 33% 25% 29% 34% 12%
Hiring manager's decision 29% 24% 23% 30% 40% 42%
Candidate's capability of demonstrating a clear picture on career goals 19% 22% 20% 23% 11% 18%
Assessment result 15% 14% 14% 23% 10% 14%
HR's decision 8% 11% 14% 4% 4% 0%
Referral's recommendation 5% 7% 0% 4% 5% 0%
Other reasons 3% 5% 3% 1% 0% 16%
1
2
3
1
2
3
1
2
3
1
2
3
1
3
2
Key Factors to Consider When Making Job Offers – by Company Origin
Base : All companies except those with plans to relocate entirely from Hong Kong soon (n=435)
#Caution: small base
Qn.B7f. Please choose and rank the 3 most important criteria when your organisation considers giving out the offer.
6868
Yes51%
No49%
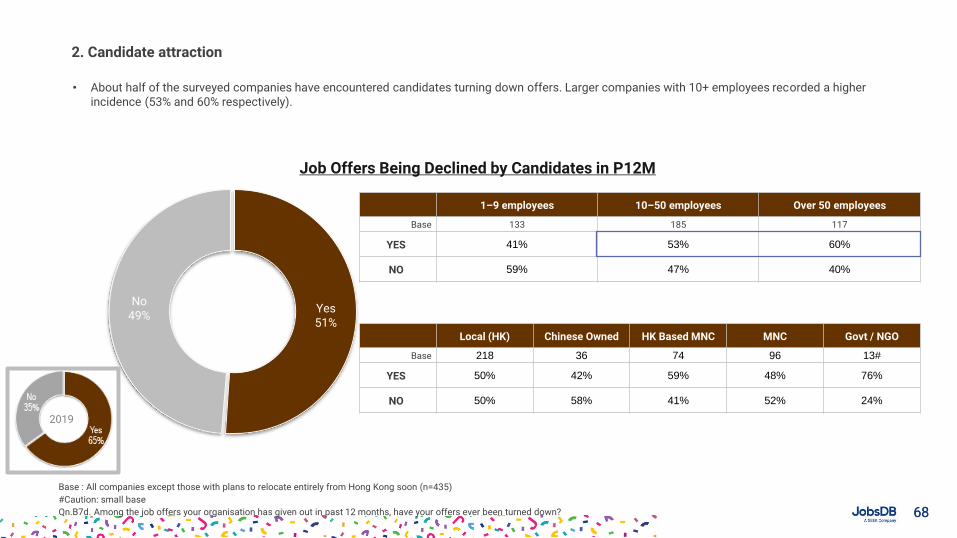
• About half of the surveyed companies have encountered candidates turning down offers. Larger companies with 10+ employees recorded a higher incidence (53% and 60% respectively).
2. Candidate attraction
Job Offers Being Declined by Candidates in P12M
Base : All companies except those with plans to relocate entirely from Hong Kong soon (n=435)
#Caution: small base
Qn.B7d. Among the job offers your organisation has given out in past 12 months, have your offers ever been turned down?
1–9 employees 10–50 employees Over 50 employees
Base 133 185 117
YES 41% 53% 60%
NO 59% 47% 40%
Local (HK) Chinese Owned HK Based MNC MNC Govt / NGO
Base 218 36 74 96 13#
YES 50% 42% 59% 48% 76%
NO 50% 58% 41% 52% 24%
2019
6969
84%
59%
33%
16%
11%
9%
8%
5%
25%
76%
49%
25%
11%
5%
5%
4%
3%
9%
55%
17%
11%
5%
2%
3%
3%
*
3%
Have accepted another job offer
The terms of the offer are unsatisfactory
Prefer to stay at the current company
The corporate culture doesn’t feel right
The commute to work is too long
The work itself is too difficult or too easy
There is too much travel required in the job
Being worried about not getting along with the new supervisor
Other reasons
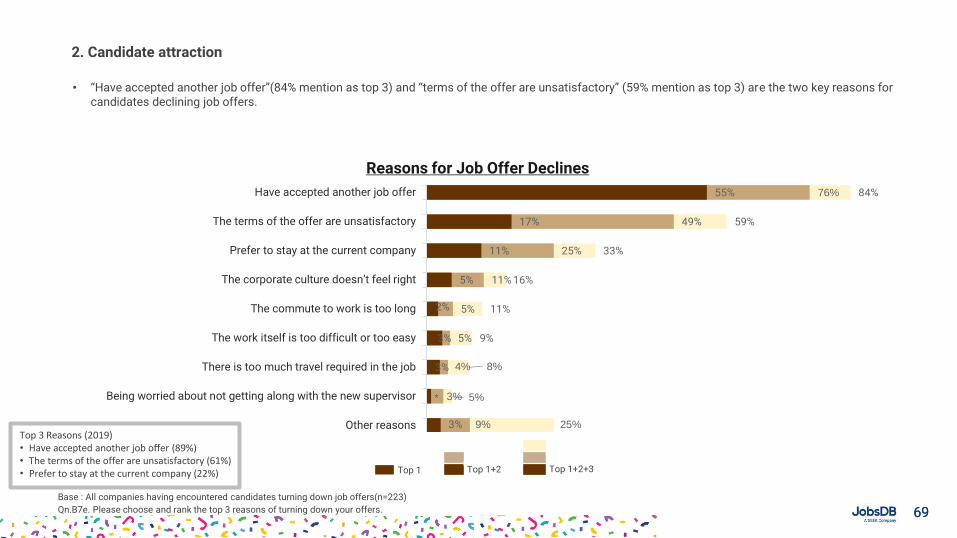
• “Have accepted another job offer”(84% mention as top 3) and “terms of the offer are unsatisfactory” (59% mention as top 3) are the two key reasons for candidates declining job offers.
2. Candidate attraction
Reasons for Job Offer Declines
Base : All companies having encountered candidates turning down job offers(n=223)
Qn.B7e. Please choose and rank the top 3 reasons of turning down your offers.
Top 1 Top 1+2 Top 1+2+3
Top 3 Reasons (2019)• Have accepted another job offer (89%) • The terms of the offer are unsatisfactory (61%) • Prefer to stay at the current company (22%)
7070
Yes42%
No58%
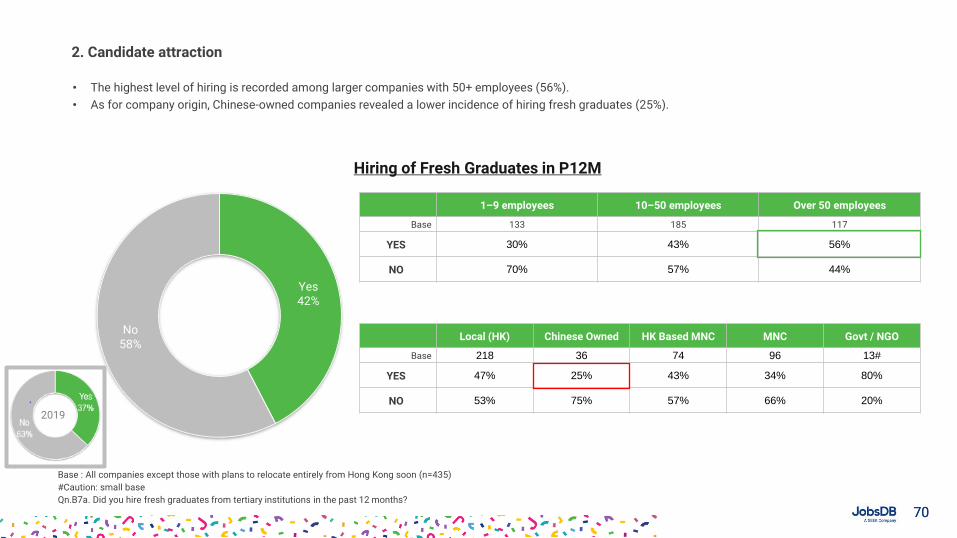
• The highest level of hiring is recorded among larger companies with 50+ employees (56%).
• As for company origin, Chinese-owned companies revealed a lower incidence of hiring fresh graduates (25%).
2. Candidate attraction
Hiring of Fresh Graduates in P12M
Base : All companies except those with plans to relocate entirely from Hong Kong soon (n=435)
#Caution: small base
Qn.B7a. Did you hire fresh graduates from tertiary institutions in the past 12 months?
1–9 employees 10–50 employees Over 50 employees
Base 133 185 117
YES 30% 43% 56%
NO 70% 57% 44%
Local (HK) Chinese Owned HK Based MNC MNC Govt / NGO
Base 218 36 74 96 13#
YES 47% 25% 43% 34% 80%
NO 53% 75% 57% 66% 20%
2019
7171
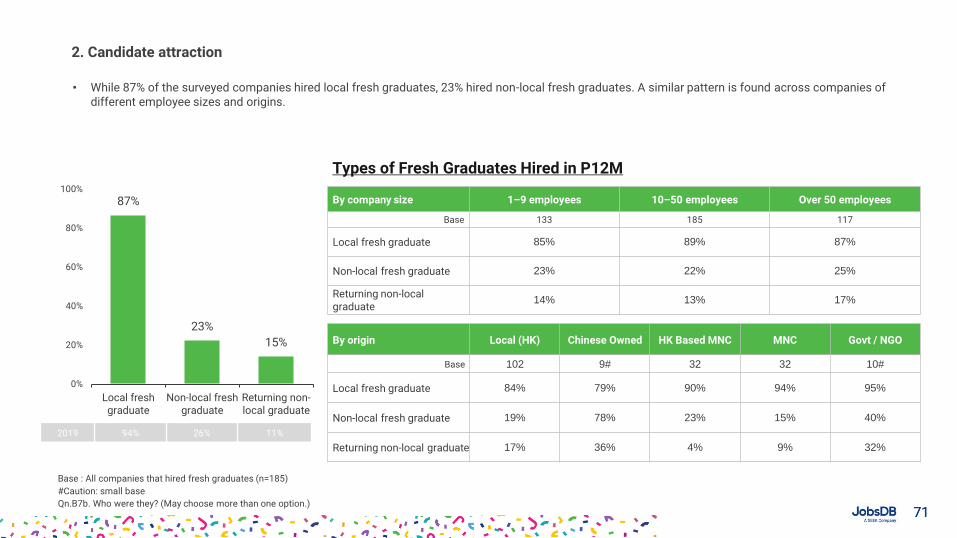
• While 87% of the surveyed companies hired local fresh graduates, 23% hired non-local fresh graduates. A similar pattern is found across companies of different employee sizes and origins.
2. Candidate attraction
Types of Fresh Graduates Hired in P12M
Base : All companies that hired fresh graduates (n=185)
#Caution: small base
Qn.B7b. Who were they? (May choose more than one option.)
By company size 1–9 employees 10–50 employees Over 50 employees
Base 133 185 117
Local fresh graduate 85% 89% 87%
Non-local fresh graduate 23% 22% 25%
Returning non-local graduate
14% 13% 17%
By origin Local (HK) Chinese Owned HK Based MNC MNC Govt / NGO
Base 102 9# 32 32 10#
Local fresh graduate 84% 79% 90% 94% 95%
Non-local fresh graduate 19% 78% 23% 15% 40%
Returning non-local graduate 17% 36% 4% 9% 32%
87%
23%
15%
0%
20%
40%
60%
80%
100%
Local freshgraduate
Non-local freshgraduate
Returning non-local graduate
2019 94% 26% 11%
7272
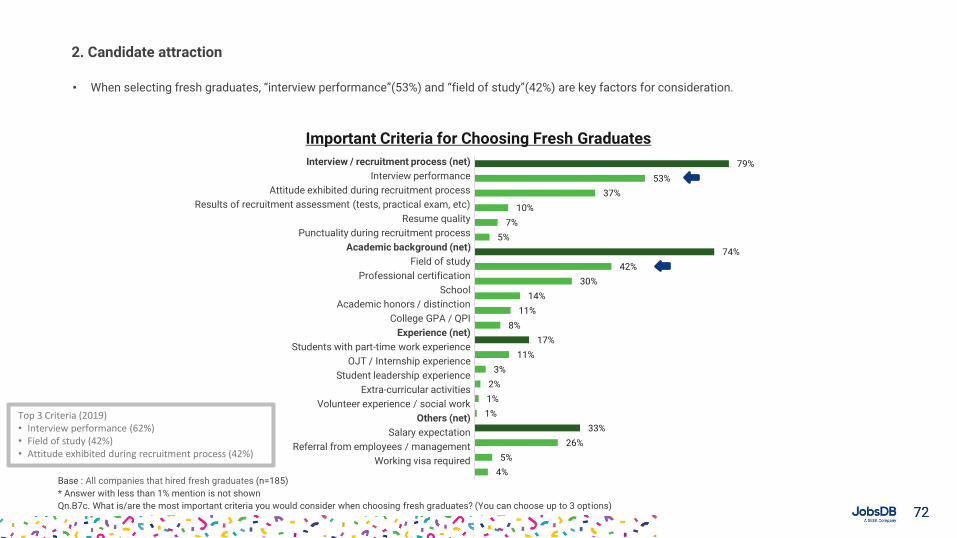
• When selecting fresh graduates, “interview performance”(53%) and “field of study”(42%) are key factors for consideration.
2. Candidate attraction
Important Criteria for Choosing Fresh Graduates
Base : All companies that hired fresh graduates (n=185)
* Answer with less than 1% mention is not shown
Qn.B7c. What is/are the most important criteria you would consider when choosing fresh graduates? (You can choose up to 3 options)
79%
53%
37%
10%
7%
5%
74%
42%
30%
14%
11%
8%
17%
11%
3%
2%
1%
1%
33%
26%
5%
4%
Interview / recruitment process (net)
Interview performance
Attitude exhibited during recruitment process
Results of recruitment assessment (tests, practical exam, etc)
Resume quality
Punctuality during recruitment process
Academic background (net)
Field of study
Professional certification
School
Academic honors / distinction
College GPA / QPI
Experience (net)
Students with part-time work experience
OJT / Internship experience
Student leadership experience
Extra-curricular activities
Volunteer experience / social work
Others (net)
Salary expectation
Referral from employees / management
Working visa required
Top 3 Criteria (2019)• Interview performance (62%) • Field of study (42%)• Attitude exhibited during recruitment process (42%)
Section 3Pay Adjustment Forecast in 2021
7474
2.0%
1.0%
0.1%
1.2%
-1.5%
0.2%
1.9%
0.9% 1.0% 1.0%0.7%
1.2%1.4%
-1.0%
1.0%
0.3%
2.5%
3.8%
*
-0.1%
0.2% 0.0% 0.1%
1.5%
0.5%
1.7%
0.1%
2.1%
0.7%
0.1%
0.6%
-2.0%
-1.0%
0.0%
1.0%
2.0%
3.0%
4.0%
5.0%
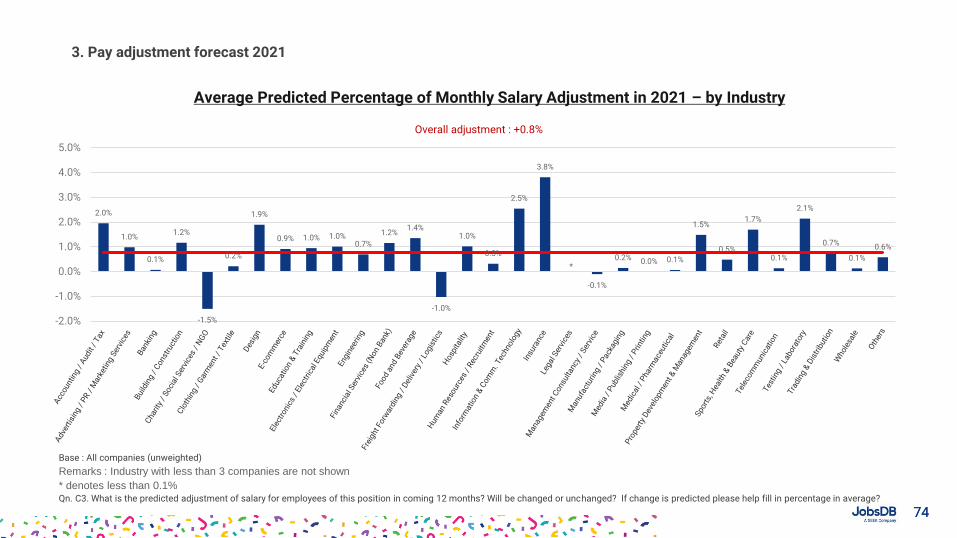
3. Pay adjustment forecast 2021
Average Predicted Percentage of Monthly Salary Adjustment in 2021 – by Industry
Base : All companies (unweighted)
Remarks : Industry with less than 3 companies are not shown
* denotes less than 0.1%Qn. C3. What is the predicted adjustment of salary for employees of this position in coming 12 months? Will be changed or unchanged? If change is predicted please help fill in percentage in average?
Overall adjustment : +0.8%
7575
0.7%
0.5% 0.4%
0.7%
1.5%
0.6%0.8%
2.4%
0.4%
1.4%
0.2% 0.5%
1.0%0.8%
2.1%
1.1%
0.1%
-0.7%
2.1%
1.3%
*
3.8%
-1.0%
-0.5%
0.0%
0.5%
1.0%
1.5%
2.0%
2.5%
3.0%
3.5%
4.0%
4.5%
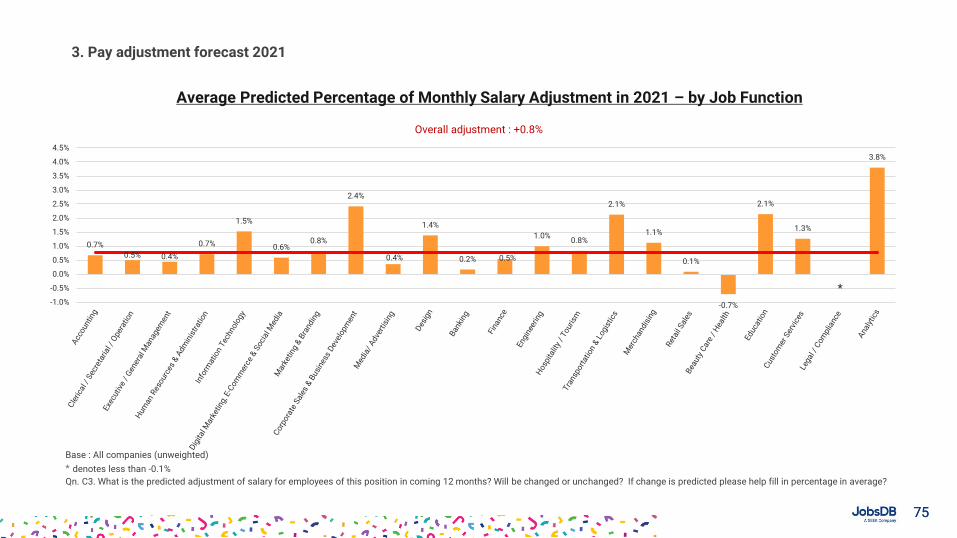
3. Pay adjustment forecast 2021
Average Predicted Percentage of Monthly Salary Adjustment in 2021 – by Job Function
Base : All companies (unweighted)
* denotes less than -0.1%
Qn. C3. What is the predicted adjustment of salary for employees of this position in coming 12 months? Will be changed or unchanged? If change is predicted please help fill in percentage in average?
Overall adjustment : +0.8%
7676
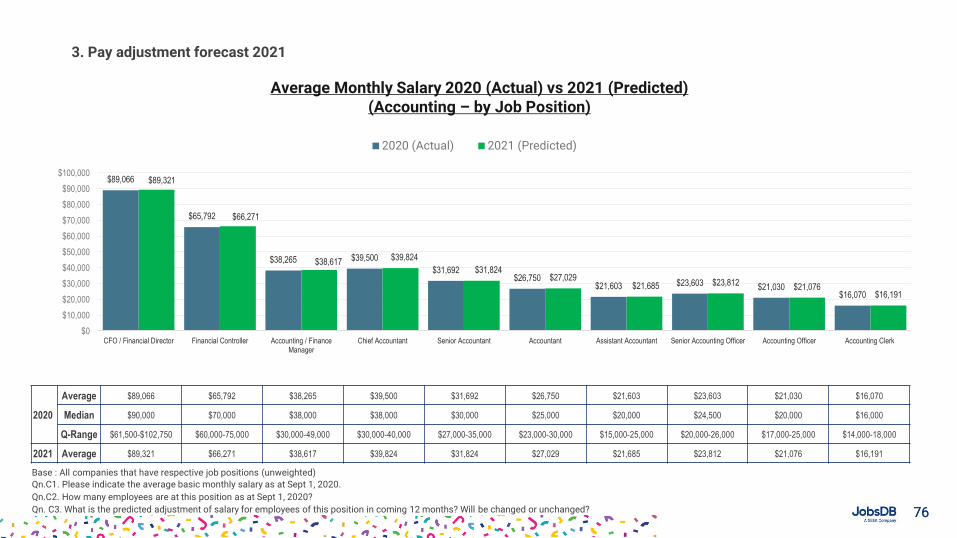
3. Pay adjustment forecast 2021
Average Monthly Salary 2020 (Actual) vs 2021 (Predicted)(Accounting – by Job Position)
Base : All companies that have respective job positions (unweighted)
Qn.C1. Please indicate the average basic monthly salary as at Sept 1, 2020.
Qn.C2. How many employees are at this position as at Sept 1, 2020?
Qn. C3. What is the predicted adjustment of salary for employees of this position in coming 12 months? Will be changed or unchanged?
$89,066
$65,792
$38,265 $39,500
$31,692$26,750
$21,603 $23,603 $21,030$16,070
$89,321
$66,271
$38,617$39,824
$31,824$27,029
$21,685 $23,812 $21,076$16,191
$0
$10,000
$20,000
$30,000
$40,000
$50,000
$60,000
$70,000
$80,000
$90,000
$100,000
CFO / Financial Director Financial Controller Accounting / FinanceManager
Chief Accountant Senior Accountant Accountant Assistant Accountant Senior Accounting Officer Accounting Officer Accounting Clerk
2020 (Actual) 2021 (Predicted)
2020
Average $89,066 $65,792 $38,265 $39,500 $31,692 $26,750 $21,603 $23,603 $21,030 $16,070
Median $90,000 $70,000 $38,000 $38,000 $30,000 $25,000 $20,000 $24,500 $20,000 $16,000
Q-Range $61,500-$102,750 $60,000-75,000 $30,000-49,000 $30,000-40,000 $27,000-35,000 $23,000-30,000 $15,000-25,000 $20,000-26,000 $17,000-25,000 $14,000-18,000
2021 Average $89,321 $66,271 $38,617 $39,824 $31,824 $27,029 $21,685 $23,812 $21,076 $16,191
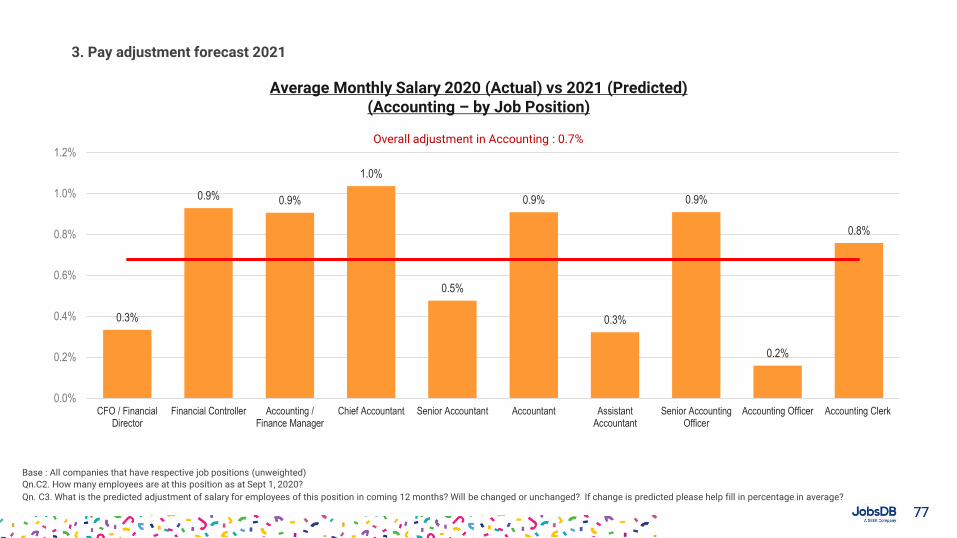
7777
3. Pay adjustment forecast 2021
Average Monthly Salary 2020 (Actual) vs 2021 (Predicted)(Accounting – by Job Position)
Base : All companies that have respective job positions (unweighted)
Qn.C2. How many employees are at this position as at Sept 1, 2020?
Qn. C3. What is the predicted adjustment of salary for employees of this position in coming 12 months? Will be changed or unchanged? If change is predicted please help fill in percentage in average?
0.3%
0.9% 0.9%
1.0%
0.5%
0.9%
0.3%
0.9%
0.2%
0.8%
0.0%
0.2%
0.4%
0.6%
0.8%
1.0%
1.2%
CFO / FinancialDirector
Financial Controller Accounting /Finance Manager
Chief Accountant Senior Accountant Accountant AssistantAccountant
Senior AccountingOfficer
Accounting Officer Accounting Clerk
Overall adjustment in Accounting : 0.7%
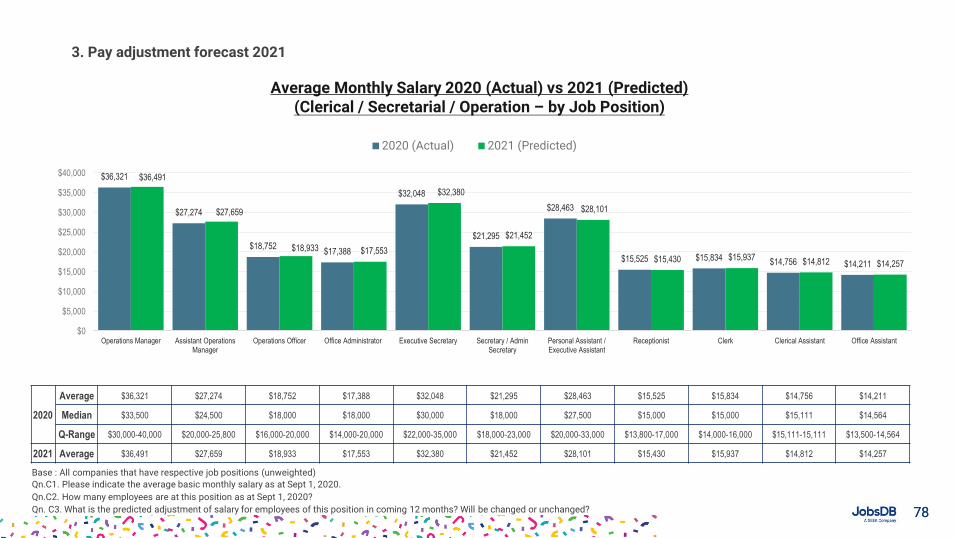
7878
3. Pay adjustment forecast 2021
Average Monthly Salary 2020 (Actual) vs 2021 (Predicted)(Clerical / Secretarial / Operation – by Job Position)
Base : All companies that have respective job positions (unweighted)
Qn.C1. Please indicate the average basic monthly salary as at Sept 1, 2020.
Qn.C2. How many employees are at this position as at Sept 1, 2020?
Qn. C3. What is the predicted adjustment of salary for employees of this position in coming 12 months? Will be changed or unchanged?
$36,321
$27,274
$18,752$17,388
$32,048
$21,295
$28,463
$15,525 $15,834 $14,756 $14,211
$36,491
$27,659
$18,933 $17,553
$32,380
$21,452
$28,101
$15,430 $15,937$14,812 $14,257
$0
$5,000
$10,000
$15,000
$20,000
$25,000
$30,000
$35,000
$40,000
Operations Manager Assistant OperationsManager
Operations Officer Office Administrator Executive Secretary Secretary / AdminSecretary
Personal Assistant /Executive Assistant
Receptionist Clerk Clerical Assistant Office Assistant
2020 (Actual) 2021 (Predicted)
2020
Average $36,321 $27,274 $18,752 $17,388 $32,048 $21,295 $28,463 $15,525 $15,834 $14,756 $14,211
Median $33,500 $24,500 $18,000 $18,000 $30,000 $18,000 $27,500 $15,000 $15,000 $15,111 $14,564
Q-Range $30,000-40,000 $20,000-25,800 $16,000-20,000 $14,000-20,000 $22,000-35,000 $18,000-23,000 $20,000-33,000 $13,800-17,000 $14,000-16,000 $15,111-15,111 $13,500-14,564
2021 Average $36,491 $27,659 $18,933 $17,553 $32,380 $21,452 $28,101 $15,430 $15,937 $14,812 $14,257
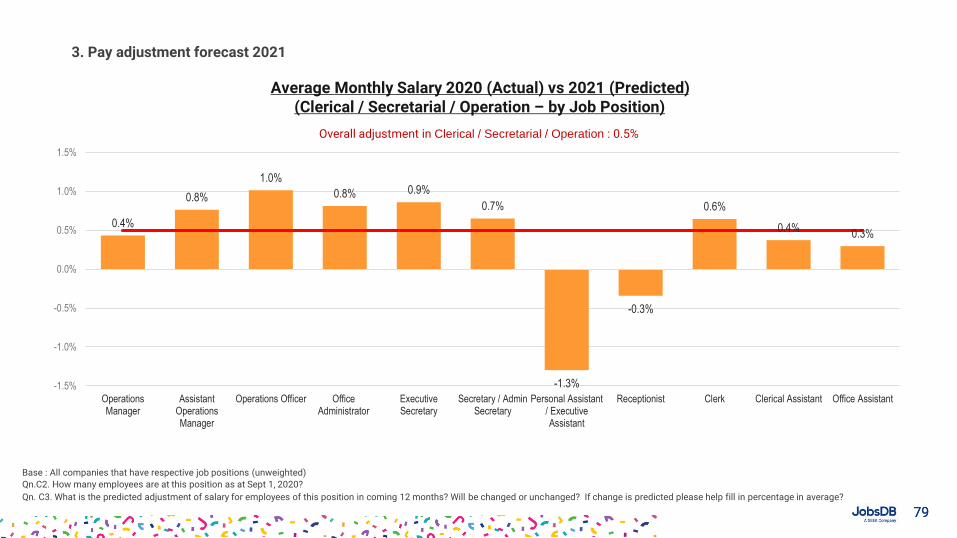
7979
3. Pay adjustment forecast 2021
Average Monthly Salary 2020 (Actual) vs 2021 (Predicted)(Clerical / Secretarial / Operation – by Job Position)
Base : All companies that have respective job positions (unweighted)
Qn.C2. How many employees are at this position as at Sept 1, 2020?
Qn. C3. What is the predicted adjustment of salary for employees of this position in coming 12 months? Will be changed or unchanged? If change is predicted please help fill in percentage in average?
0.4%
0.8%
1.0%
0.8% 0.9%
0.7%
-1.3%
-0.3%
0.6%
0.4%0.3%
-1.5%
-1.0%
-0.5%
0.0%
0.5%
1.0%
1.5%
OperationsManager
AssistantOperationsManager
Operations Officer OfficeAdministrator
ExecutiveSecretary
Secretary / AdminSecretary
Personal Assistant/ ExecutiveAssistant
Receptionist Clerk Clerical Assistant Office Assistant
Overall adjustment in Clerical / Secretarial / Operation : 0.5%
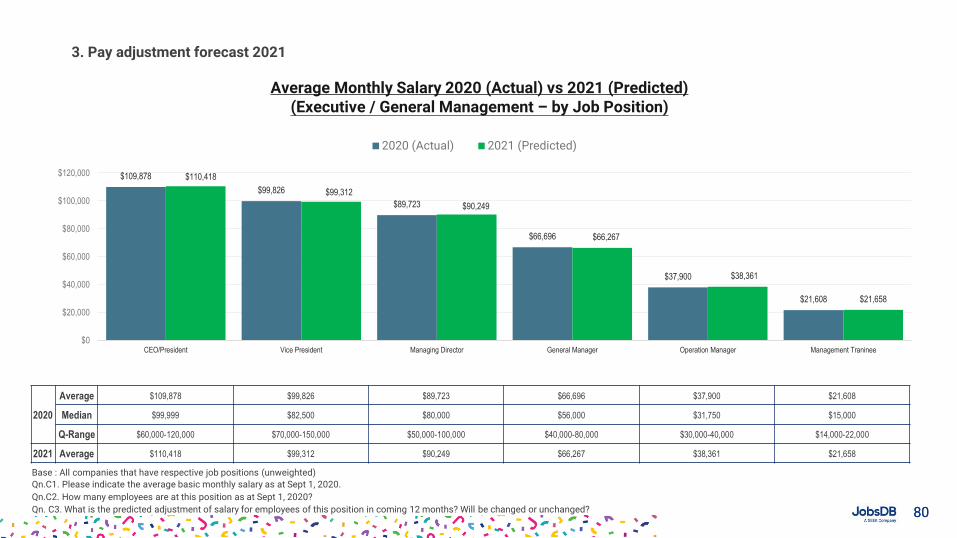
8080
3. Pay adjustment forecast 2021
Average Monthly Salary 2020 (Actual) vs 2021 (Predicted)(Executive / General Management – by Job Position)
Base : All companies that have respective job positions (unweighted)
Qn.C1. Please indicate the average basic monthly salary as at Sept 1, 2020.
Qn.C2. How many employees are at this position as at Sept 1, 2020?
Qn. C3. What is the predicted adjustment of salary for employees of this position in coming 12 months? Will be changed or unchanged?
$109,878
$99,826
$89,723
$66,696
$37,900
$21,608
$110,418
$99,312
$90,249
$66,267
$38,361
$21,658
$0
$20,000
$40,000
$60,000
$80,000
$100,000
$120,000
CEO/President Vice President Managing Director General Manager Operation Manager Management Traninee
2020 (Actual) 2021 (Predicted)
2020
Average $109,878 $99,826 $89,723 $66,696 $37,900 $21,608
Median $99,999 $82,500 $80,000 $56,000 $31,750 $15,000
Q-Range $60,000-120,000 $70,000-150,000 $50,000-100,000 $40,000-80,000 $30,000-40,000 $14,000-22,000
2021 Average $110,418 $99,312 $90,249 $66,267 $38,361 $21,658
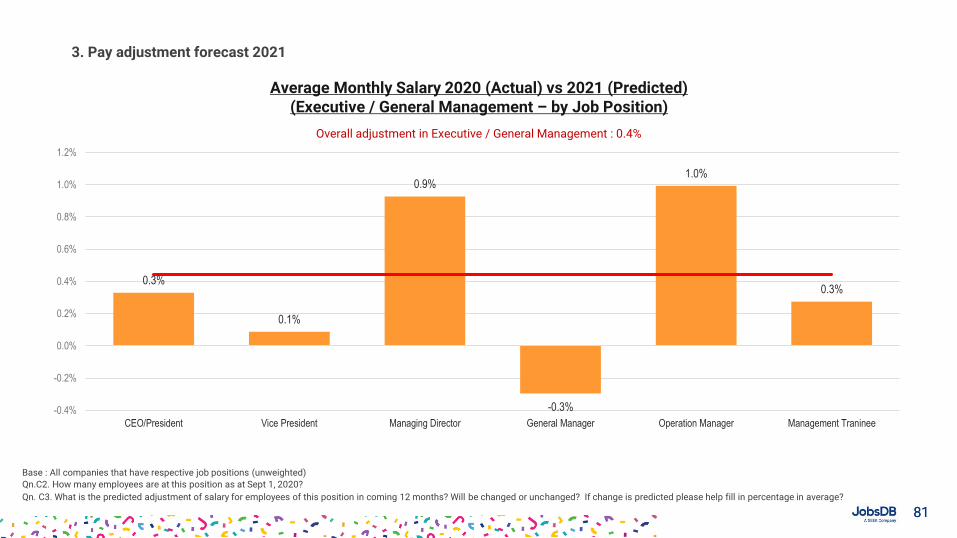
8181
3. Pay adjustment forecast 2021
Average Monthly Salary 2020 (Actual) vs 2021 (Predicted)(Executive / General Management – by Job Position)
Base : All companies that have respective job positions (unweighted)
Qn.C2. How many employees are at this position as at Sept 1, 2020?
Qn. C3. What is the predicted adjustment of salary for employees of this position in coming 12 months? Will be changed or unchanged? If change is predicted please help fill in percentage in average?
0.3%
0.1%
0.9%
-0.3%
1.0%
0.3%
-0.4%
-0.2%
0.0%
0.2%
0.4%
0.6%
0.8%
1.0%
1.2%
CEO/President Vice President Managing Director General Manager Operation Manager Management Traninee
Overall adjustment in Executive / General Management : 0.4%
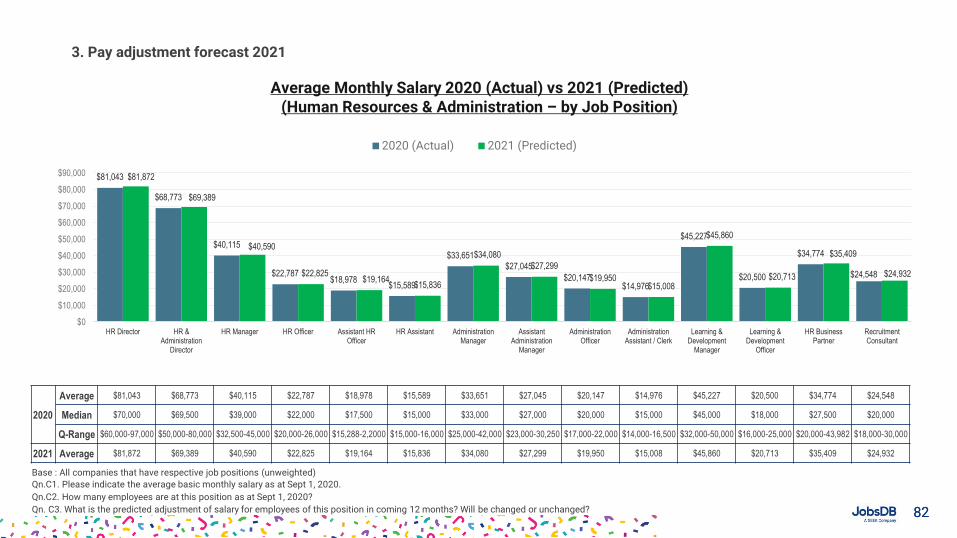
8282
3. Pay adjustment forecast 2021
Average Monthly Salary 2020 (Actual) vs 2021 (Predicted)(Human Resources & Administration – by Job Position)
Base : All companies that have respective job positions (unweighted)
Qn.C1. Please indicate the average basic monthly salary as at Sept 1, 2020.
Qn.C2. How many employees are at this position as at Sept 1, 2020?
Qn. C3. What is the predicted adjustment of salary for employees of this position in coming 12 months? Will be changed or unchanged?
$81,043
$68,773
$40,115
$22,787$18,978
$15,589
$33,651
$27,045
$20,147$14,976
$45,227
$20,500
$34,774
$24,548
$81,872
$69,389
$40,590
$22,825$19,164
$15,836
$34,080
$27,299
$19,950$15,008
$45,860
$20,713
$35,409
$24,932
$0
$10,000
$20,000
$30,000
$40,000
$50,000
$60,000
$70,000
$80,000
$90,000
HR Director HR &Administration
Director
HR Manager HR Officer Assistant HROfficer
HR Assistant AdministrationManager
AssistantAdministration
Manager
AdministrationOfficer
AdministrationAssistant / Clerk
Learning &Development
Manager
Learning &Development
Officer
HR BusinessPartner
RecruitmentConsultant
2020 (Actual) 2021 (Predicted)
2020
Average $81,043 $68,773 $40,115 $22,787 $18,978 $15,589 $33,651 $27,045 $20,147 $14,976 $45,227 $20,500 $34,774 $24,548
Median $70,000 $69,500 $39,000 $22,000 $17,500 $15,000 $33,000 $27,000 $20,000 $15,000 $45,000 $18,000 $27,500 $20,000
Q-Range $60,000-97,000 $50,000-80,000 $32,500-45,000 $20,000-26,000 $15,288-2,2000 $15,000-16,000 $25,000-42,000 $23,000-30,250 $17,000-22,000 $14,000-16,500 $32,000-50,000 $16,000-25,000 $20,000-43,982 $18,000-30,000
2021 Average $81,872 $69,389 $40,590 $22,825 $19,164 $15,836 $34,080 $27,299 $19,950 $15,008 $45,860 $20,713 $35,409 $24,932
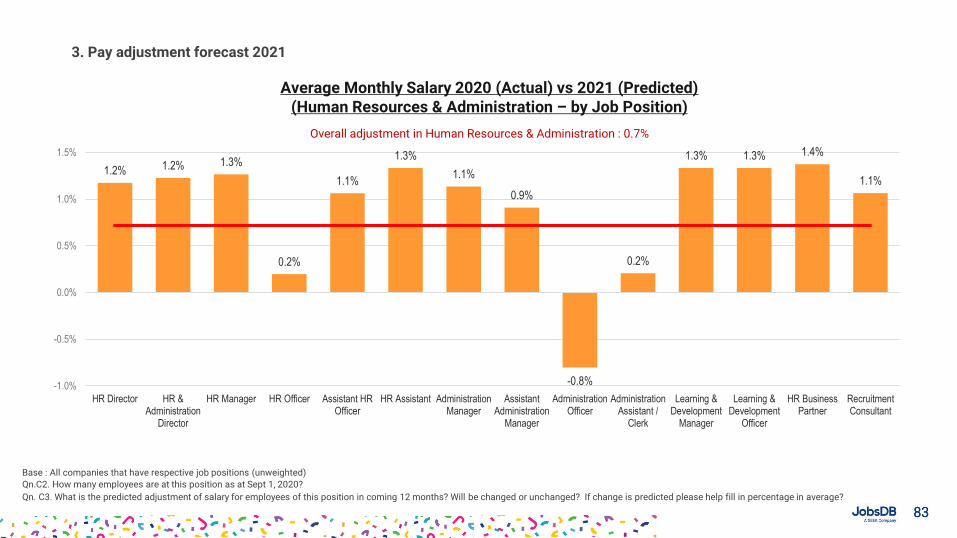
8383
3. Pay adjustment forecast 2021
Average Monthly Salary 2020 (Actual) vs 2021 (Predicted)(Human Resources & Administration – by Job Position)
Base : All companies that have respective job positions (unweighted)
Qn.C2. How many employees are at this position as at Sept 1, 2020?
Qn. C3. What is the predicted adjustment of salary for employees of this position in coming 12 months? Will be changed or unchanged? If change is predicted please help fill in percentage in average?
1.2% 1.2% 1.3%
0.2%
1.1%
1.3%
1.1%
0.9%
-0.8%
0.2%
1.3% 1.3% 1.4%
1.1%
-1.0%
-0.5%
0.0%
0.5%
1.0%
1.5%
HR Director HR &Administration
Director
HR Manager HR Officer Assistant HROfficer
HR Assistant AdministrationManager
AssistantAdministration
Manager
AdministrationOfficer
AdministrationAssistant /
Clerk
Learning &Development
Manager
Learning &Development
Officer
HR BusinessPartner
RecruitmentConsultant
Overall adjustment in Human Resources & Administration : 0.7%
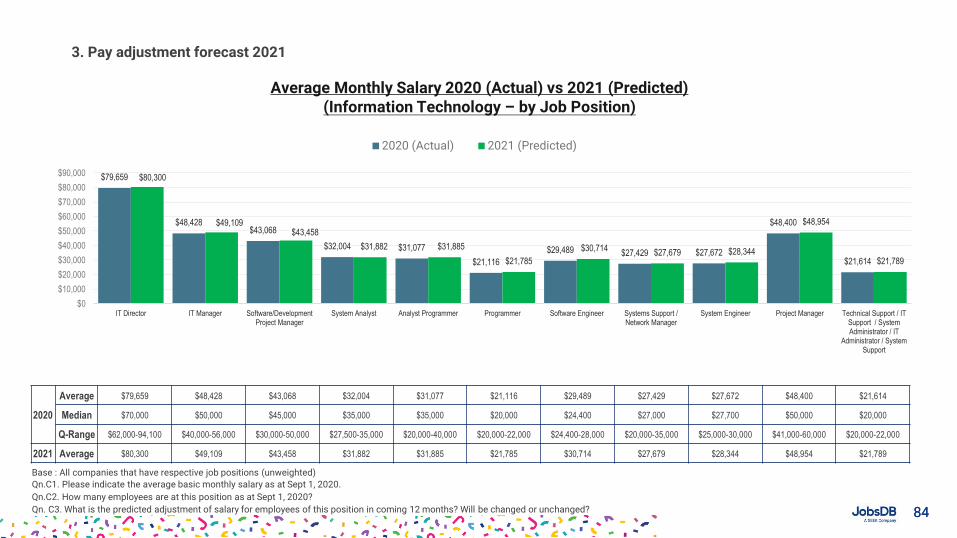
8484
3. Pay adjustment forecast 2021
Average Monthly Salary 2020 (Actual) vs 2021 (Predicted)(Information Technology – by Job Position)
Base : All companies that have respective job positions (unweighted)
Qn.C1. Please indicate the average basic monthly salary as at Sept 1, 2020.
Qn.C2. How many employees are at this position as at Sept 1, 2020?
Qn. C3. What is the predicted adjustment of salary for employees of this position in coming 12 months? Will be changed or unchanged?
$79,659
$48,428$43,068
$32,004 $31,077
$21,116
$29,489 $27,429 $27,672
$48,400
$21,614
$80,300
$49,109$43,458
$31,882 $31,885
$21,785
$30,714$27,679 $28,344
$48,954
$21,789
$0
$10,000
$20,000
$30,000
$40,000
$50,000
$60,000
$70,000
$80,000
$90,000
IT Director IT Manager Software/DevelopmentProject Manager
System Analyst Analyst Programmer Programmer Software Engineer Systems Support /Network Manager
System Engineer Project Manager Technical Support / ITSupport / SystemAdministrator / IT
Administrator / SystemSupport
2020 (Actual) 2021 (Predicted)
2020
Average $79,659 $48,428 $43,068 $32,004 $31,077 $21,116 $29,489 $27,429 $27,672 $48,400 $21,614
Median $70,000 $50,000 $45,000 $35,000 $35,000 $20,000 $24,400 $27,000 $27,700 $50,000 $20,000
Q-Range $62,000-94,100 $40,000-56,000 $30,000-50,000 $27,500-35,000 $20,000-40,000 $20,000-22,000 $24,400-28,000 $20,000-35,000 $25,000-30,000 $41,000-60,000 $20,000-22,000
2021 Average $80,300 $49,109 $43,458 $31,882 $31,885 $21,785 $30,714 $27,679 $28,344 $48,954 $21,789
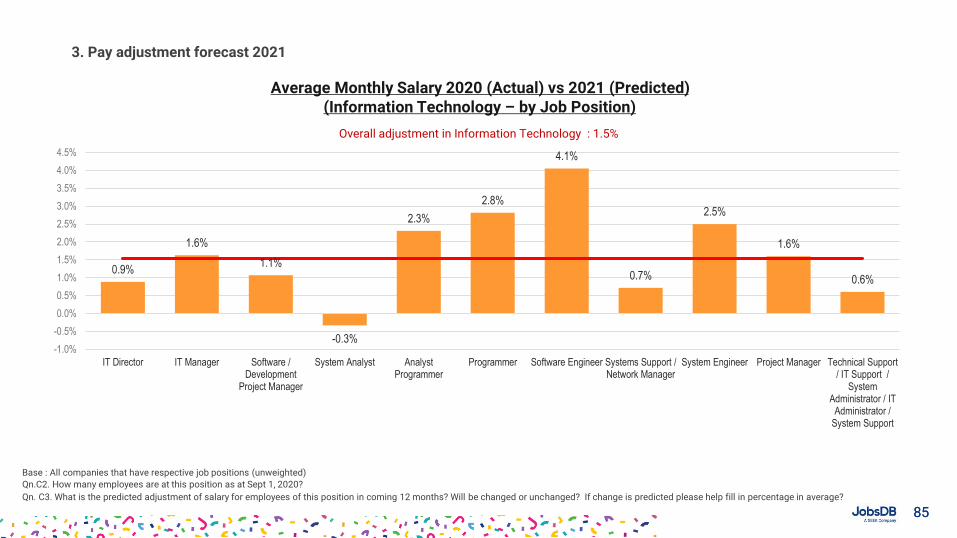
8585
3. Pay adjustment forecast 2021
Average Monthly Salary 2020 (Actual) vs 2021 (Predicted)(Information Technology – by Job Position)
Base : All companies that have respective job positions (unweighted)
Qn.C2. How many employees are at this position as at Sept 1, 2020?
Qn. C3. What is the predicted adjustment of salary for employees of this position in coming 12 months? Will be changed or unchanged? If change is predicted please help fill in percentage in average?
0.9%
1.6%
1.1%
-0.3%
2.3%
2.8%
4.1%
0.7%
2.5%
1.6%
0.6%
-1.0%
-0.5%
0.0%
0.5%
1.0%
1.5%
2.0%
2.5%
3.0%
3.5%
4.0%
4.5%
IT Director IT Manager Software /Development
Project Manager
System Analyst AnalystProgrammer
Programmer Software Engineer Systems Support /Network Manager
System Engineer Project Manager Technical Support/ IT Support /
SystemAdministrator / IT
Administrator /System Support
Overall adjustment in Information Technology : 1.5%
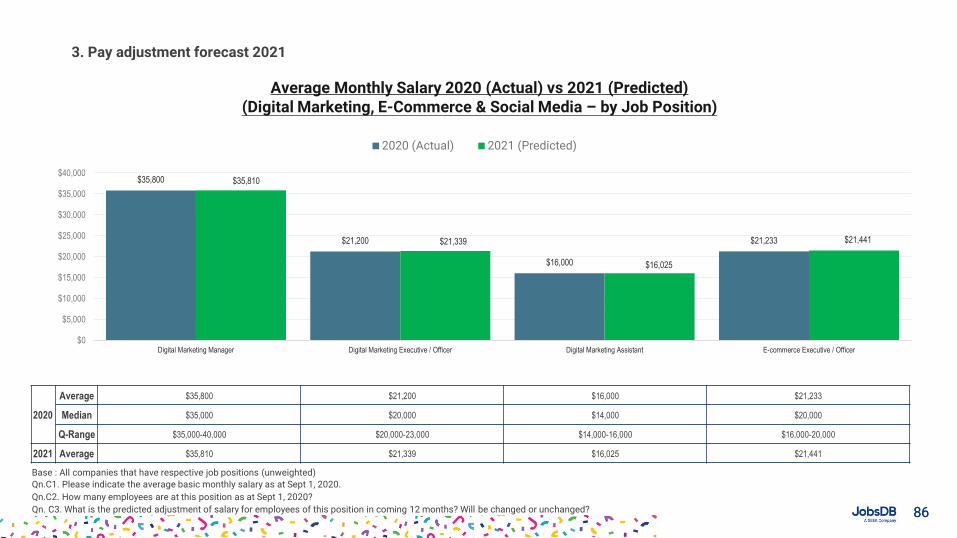
8686
3. Pay adjustment forecast 2021
Average Monthly Salary 2020 (Actual) vs 2021 (Predicted)(Digital Marketing, E-Commerce & Social Media – by Job Position)
Base : All companies that have respective job positions (unweighted)
Qn.C1. Please indicate the average basic monthly salary as at Sept 1, 2020.
Qn.C2. How many employees are at this position as at Sept 1, 2020?
Qn. C3. What is the predicted adjustment of salary for employees of this position in coming 12 months? Will be changed or unchanged?
$35,800
$21,200
$16,000
$21,233
$35,810
$21,339
$16,025
$21,441
$0
$5,000
$10,000
$15,000
$20,000
$25,000
$30,000
$35,000
$40,000
Digital Marketing Manager Digital Marketing Executive / Officer Digital Marketing Assistant E-commerce Executive / Officer
2020 (Actual) 2021 (Predicted)
2020
Average $35,800 $21,200 $16,000 $21,233
Median $35,000 $20,000 $14,000 $20,000
Q-Range $35,000-40,000 $20,000-23,000 $14,000-16,000 $16,000-20,000
2021 Average $35,810 $21,339 $16,025 $21,441
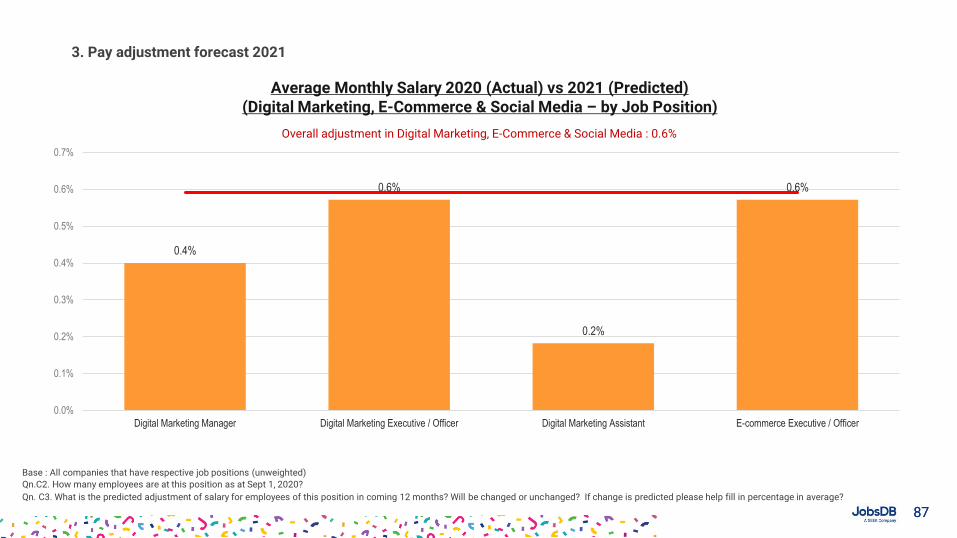
8787
3. Pay adjustment forecast 2021
Average Monthly Salary 2020 (Actual) vs 2021 (Predicted)(Digital Marketing, E-Commerce & Social Media – by Job Position)
Base : All companies that have respective job positions (unweighted)
Qn.C2. How many employees are at this position as at Sept 1, 2020?
Qn. C3. What is the predicted adjustment of salary for employees of this position in coming 12 months? Will be changed or unchanged? If change is predicted please help fill in percentage in average?
0.4%
0.6%
0.2%
0.6%
0.0%
0.1%
0.2%
0.3%
0.4%
0.5%
0.6%
0.7%
Digital Marketing Manager Digital Marketing Executive / Officer Digital Marketing Assistant E-commerce Executive / Officer
Overall adjustment in Digital Marketing, E-Commerce & Social Media : 0.6%
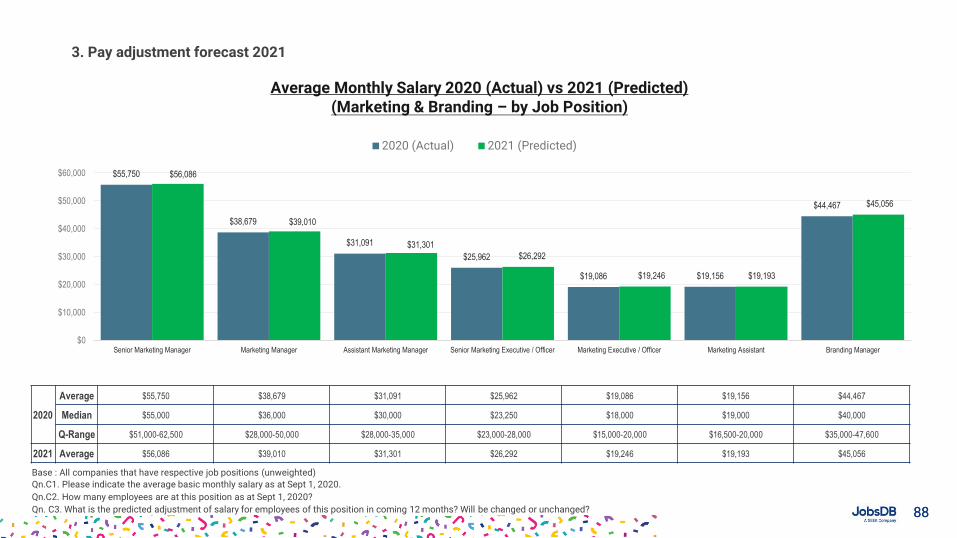
8888
3. Pay adjustment forecast 2021
Average Monthly Salary 2020 (Actual) vs 2021 (Predicted)(Marketing & Branding – by Job Position)
Base : All companies that have respective job positions (unweighted)
Qn.C1. Please indicate the average basic monthly salary as at Sept 1, 2020.
Qn.C2. How many employees are at this position as at Sept 1, 2020?
Qn. C3. What is the predicted adjustment of salary for employees of this position in coming 12 months? Will be changed or unchanged?
$55,750
$38,679
$31,091
$25,962
$19,086 $19,156
$44,467
$56,086
$39,010
$31,301
$26,292
$19,246 $19,193
$45,056
$0
$10,000
$20,000
$30,000
$40,000
$50,000
$60,000
Senior Marketing Manager Marketing Manager Assistant Marketing Manager Senior Marketing Executive / Officer Marketing Executive / Officer Marketing Assistant Branding Manager
2020 (Actual) 2021 (Predicted)
2020
Average $55,750 $38,679 $31,091 $25,962 $19,086 $19,156 $44,467
Median $55,000 $36,000 $30,000 $23,250 $18,000 $19,000 $40,000
Q-Range $51,000-62,500 $28,000-50,000 $28,000-35,000 $23,000-28,000 $15,000-20,000 $16,500-20,000 $35,000-47,600
2021 Average $56,086 $39,010 $31,301 $26,292 $19,246 $19,193 $45,056
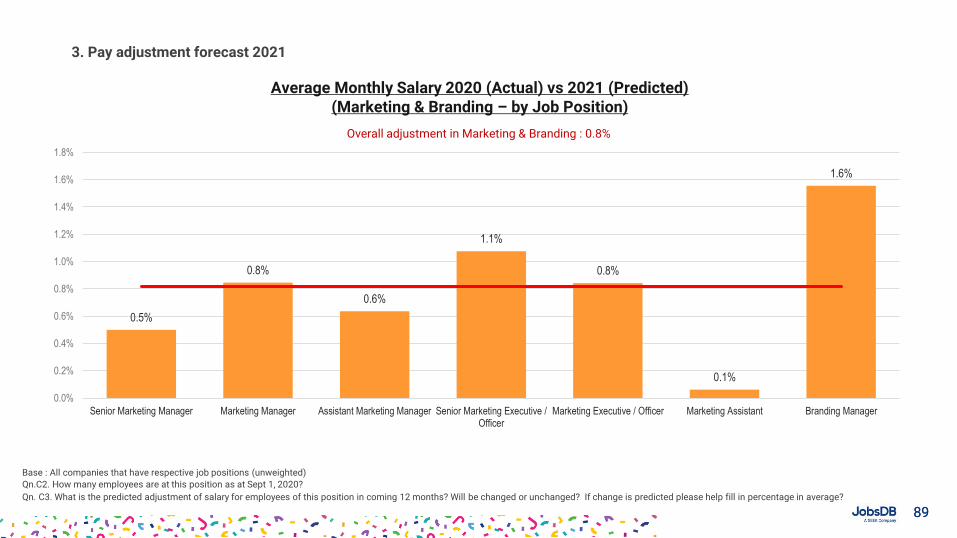
8989
3. Pay adjustment forecast 2021
Average Monthly Salary 2020 (Actual) vs 2021 (Predicted)(Marketing & Branding – by Job Position)
Base : All companies that have respective job positions (unweighted)
Qn.C2. How many employees are at this position as at Sept 1, 2020?
Qn. C3. What is the predicted adjustment of salary for employees of this position in coming 12 months? Will be changed or unchanged? If change is predicted please help fill in percentage in average?
0.5%
0.8%
0.6%
1.1%
0.8%
0.1%
1.6%
0.0%
0.2%
0.4%
0.6%
0.8%
1.0%
1.2%
1.4%
1.6%
1.8%
Senior Marketing Manager Marketing Manager Assistant Marketing Manager Senior Marketing Executive /Officer
Marketing Executive / Officer Marketing Assistant Branding Manager
Overall adjustment in Marketing & Branding : 0.8%
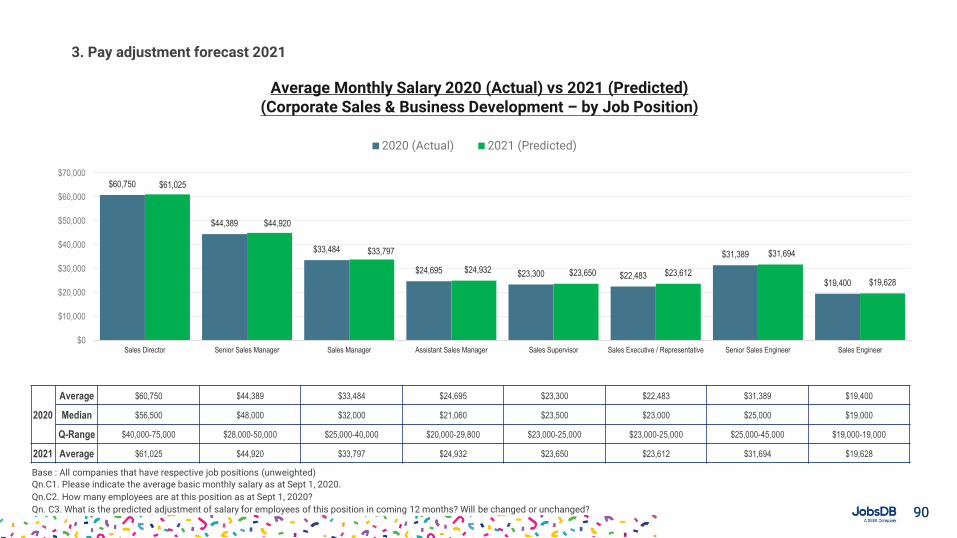
9090
3. Pay adjustment forecast 2021
Average Monthly Salary 2020 (Actual) vs 2021 (Predicted)(Corporate Sales & Business Development – by Job Position)
Base : All companies that have respective job positions (unweighted)
Qn.C1. Please indicate the average basic monthly salary as at Sept 1, 2020.
Qn.C2. How many employees are at this position as at Sept 1, 2020?
Qn. C3. What is the predicted adjustment of salary for employees of this position in coming 12 months? Will be changed or unchanged?
$60,750
$44,389
$33,484
$24,695 $23,300 $22,483
$31,389
$19,400
$61,025
$44,920
$33,797
$24,932 $23,650 $23,612
$31,694
$19,628
$0
$10,000
$20,000
$30,000
$40,000
$50,000
$60,000
$70,000
Sales Director Senior Sales Manager Sales Manager Assistant Sales Manager Sales Supervisor Sales Executive / Representative Senior Sales Engineer Sales Engineer
2020 (Actual) 2021 (Predicted)
2020
Average $60,750 $44,389 $33,484 $24,695 $23,300 $22,483 $31,389 $19,400
Median $56,500 $48,000 $32,000 $21,060 $23,500 $23,000 $25,000 $19,000
Q-Range $40,000-75,000 $28,000-50,000 $25,000-40,000 $20,000-29,800 $23,000-25,000 $23,000-25,000 $25,000-45,000 $19,000-19,000
2021 Average $61,025 $44,920 $33,797 $24,932 $23,650 $23,612 $31,694 $19,628
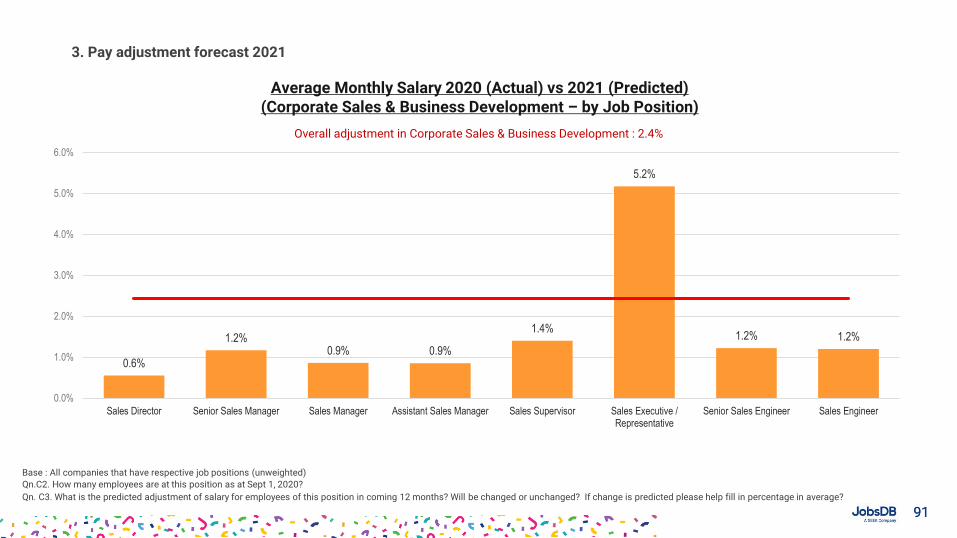
9191
3. Pay adjustment forecast 2021
Average Monthly Salary 2020 (Actual) vs 2021 (Predicted)(Corporate Sales & Business Development – by Job Position)
Base : All companies that have respective job positions (unweighted)
Qn.C2. How many employees are at this position as at Sept 1, 2020?
Qn. C3. What is the predicted adjustment of salary for employees of this position in coming 12 months? Will be changed or unchanged? If change is predicted please help fill in percentage in average?
0.6%
1.2%0.9% 0.9%
1.4%
5.2%
1.2% 1.2%
0.0%
1.0%
2.0%
3.0%
4.0%
5.0%
6.0%
Sales Director Senior Sales Manager Sales Manager Assistant Sales Manager Sales Supervisor Sales Executive /Representative
Senior Sales Engineer Sales Engineer
Overall adjustment in Corporate Sales & Business Development : 2.4%
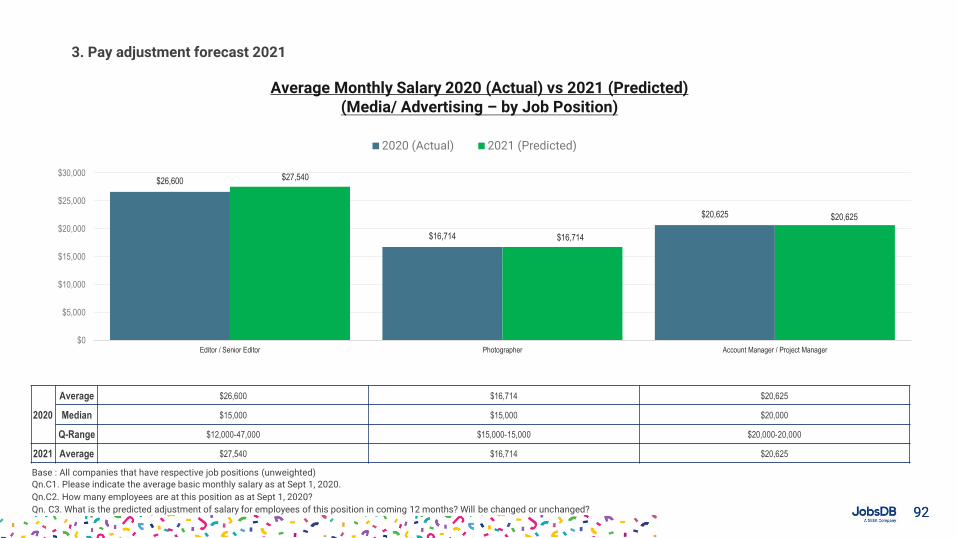
9292
3. Pay adjustment forecast 2021
Average Monthly Salary 2020 (Actual) vs 2021 (Predicted)(Media/ Advertising – by Job Position)
Base : All companies that have respective job positions (unweighted)
Qn.C1. Please indicate the average basic monthly salary as at Sept 1, 2020.
Qn.C2. How many employees are at this position as at Sept 1, 2020?
Qn. C3. What is the predicted adjustment of salary for employees of this position in coming 12 months? Will be changed or unchanged?
$26,600
$16,714
$20,625
$27,540
$16,714
$20,625
$0
$5,000
$10,000
$15,000
$20,000
$25,000
$30,000
Editor / Senior Editor Photographer Account Manager / Project Manager
2020 (Actual) 2021 (Predicted)
2020
Average $26,600 $16,714 $20,625
Median $15,000 $15,000 $20,000
Q-Range $12,000-47,000 $15,000-15,000 $20,000-20,000
2021 Average $27,540 $16,714 $20,625
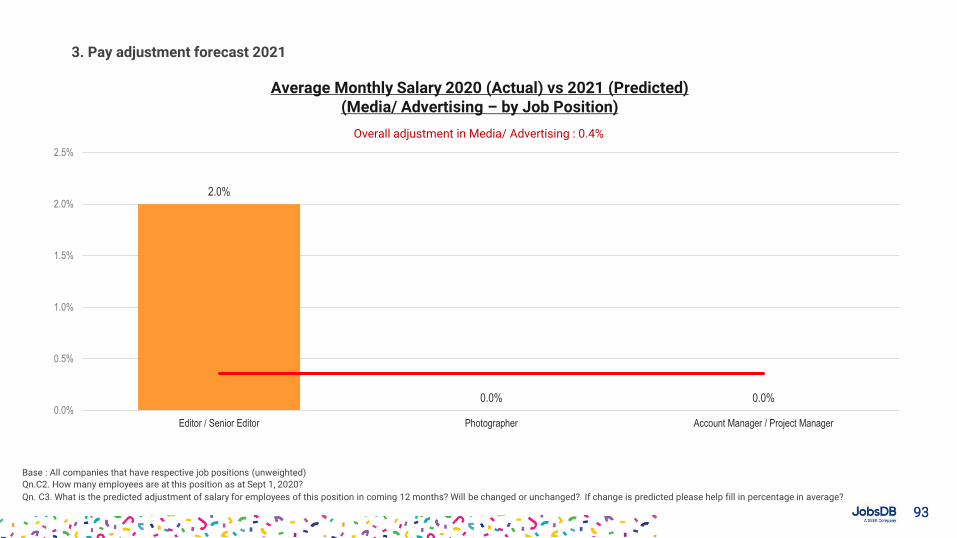
9393
3. Pay adjustment forecast 2021
Average Monthly Salary 2020 (Actual) vs 2021 (Predicted)(Media/ Advertising – by Job Position)
Base : All companies that have respective job positions (unweighted)
Qn.C2. How many employees are at this position as at Sept 1, 2020?
Qn. C3. What is the predicted adjustment of salary for employees of this position in coming 12 months? Will be changed or unchanged? If change is predicted please help fill in percentage in average?
2.0%
0.0% 0.0%0.0%
0.5%
1.0%
1.5%
2.0%
2.5%
Editor / Senior Editor Photographer Account Manager / Project Manager
Overall adjustment in Media/ Advertising : 0.4%
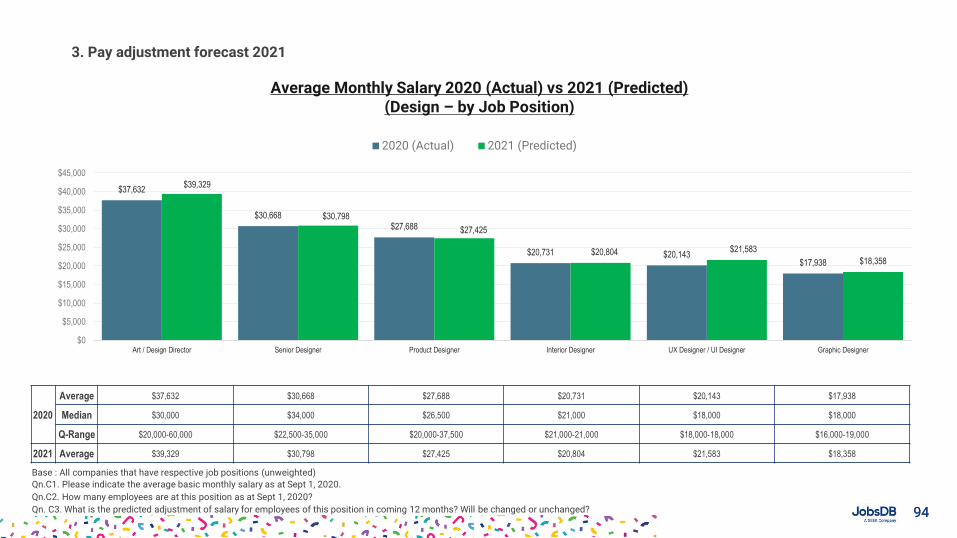
9494
3. Pay adjustment forecast 2021
Average Monthly Salary 2020 (Actual) vs 2021 (Predicted)(Design – by Job Position)
Base : All companies that have respective job positions (unweighted)
Qn.C1. Please indicate the average basic monthly salary as at Sept 1, 2020.
Qn.C2. How many employees are at this position as at Sept 1, 2020?
Qn. C3. What is the predicted adjustment of salary for employees of this position in coming 12 months? Will be changed or unchanged?
$37,632
$30,668
$27,688
$20,731 $20,143$17,938
$39,329
$30,798
$27,425
$20,804 $21,583
$18,358
$0
$5,000
$10,000
$15,000
$20,000
$25,000
$30,000
$35,000
$40,000
$45,000
Art / Design Director Senior Designer Product Designer Interior Designer UX Designer / UI Designer Graphic Designer
2020 (Actual) 2021 (Predicted)
2020
Average $37,632 $30,668 $27,688 $20,731 $20,143 $17,938
Median $30,000 $34,000 $26,500 $21,000 $18,000 $18,000
Q-Range $20,000-60,000 $22,500-35,000 $20,000-37,500 $21,000-21,000 $18,000-18,000 $16,000-19,000
2021 Average $39,329 $30,798 $27,425 $20,804 $21,583 $18,358
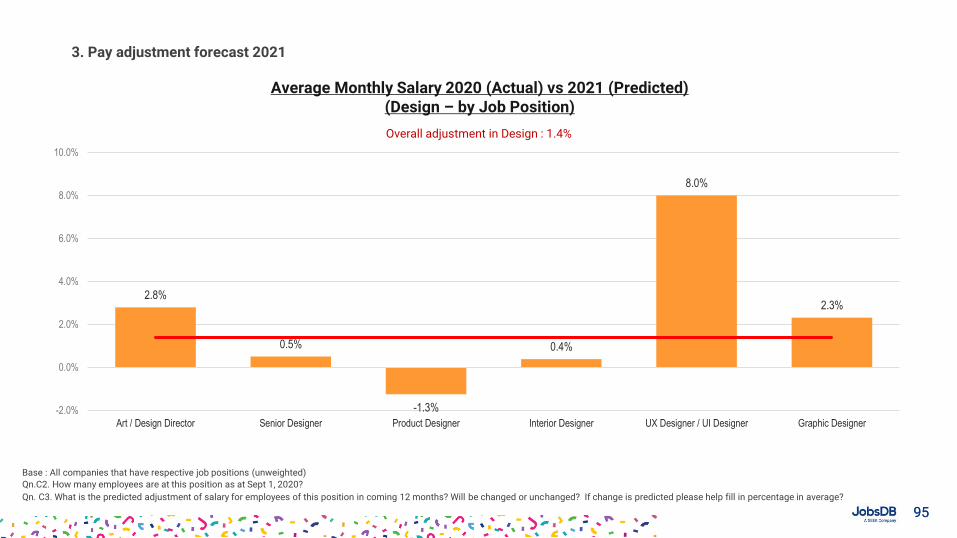
9595
Average Monthly Salary 2020 (Actual) vs 2021 (Predicted)(Design – by Job Position)
Base : All companies that have respective job positions (unweighted)
Qn.C2. How many employees are at this position as at Sept 1, 2020?
Qn. C3. What is the predicted adjustment of salary for employees of this position in coming 12 months? Will be changed or unchanged? If change is predicted please help fill in percentage in average?
2.8%
0.5%
-1.3%
0.4%
8.0%
2.3%
-2.0%
0.0%
2.0%
4.0%
6.0%
8.0%
10.0%
Art / Design Director Senior Designer Product Designer Interior Designer UX Designer / UI Designer Graphic Designer
Overall adjustment in Design : 1.4%
3. Pay adjustment forecast 2021
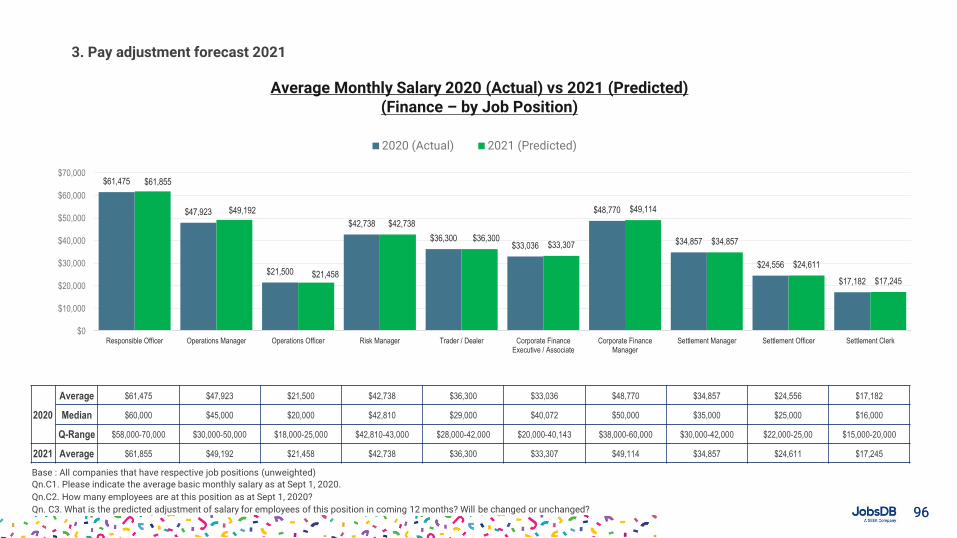
9696
3. Pay adjustment forecast 2021
Average Monthly Salary 2020 (Actual) vs 2021 (Predicted)(Finance – by Job Position)
Base : All companies that have respective job positions (unweighted)
Qn.C1. Please indicate the average basic monthly salary as at Sept 1, 2020.
Qn.C2. How many employees are at this position as at Sept 1, 2020?
Qn. C3. What is the predicted adjustment of salary for employees of this position in coming 12 months? Will be changed or unchanged?
$61,475
$47,923
$21,500
$42,738
$36,300$33,036
$48,770
$34,857
$24,556
$17,182
$61,855
$49,192
$21,458
$42,738
$36,300$33,307
$49,114
$34,857
$24,611
$17,245
$0
$10,000
$20,000
$30,000
$40,000
$50,000
$60,000
$70,000
Responsible Officer Operations Manager Operations Officer Risk Manager Trader / Dealer Corporate FinanceExecutive / Associate
Corporate FinanceManager
Settlement Manager Settlement Officer Settlement Clerk
2020 (Actual) 2021 (Predicted)
2020
Average $61,475 $47,923 $21,500 $42,738 $36,300 $33,036 $48,770 $34,857 $24,556 $17,182
Median $60,000 $45,000 $20,000 $42,810 $29,000 $40,072 $50,000 $35,000 $25,000 $16,000
Q-Range $58,000-70,000 $30,000-50,000 $18,000-25,000 $42,810-43,000 $28,000-42,000 $20,000-40,143 $38,000-60,000 $30,000-42,000 $22,000-25,00 $15,000-20,000
2021 Average $61,855 $49,192 $21,458 $42,738 $36,300 $33,307 $49,114 $34,857 $24,611 $17,245
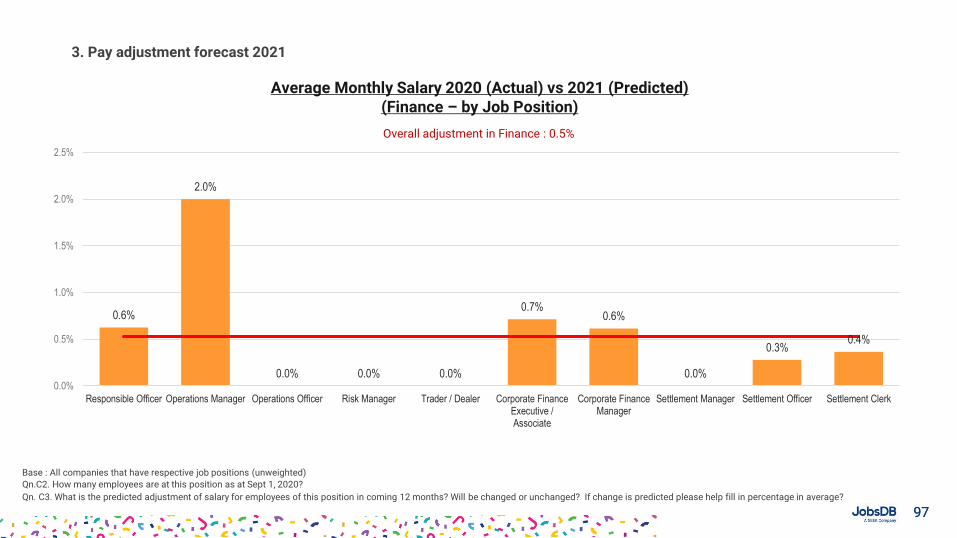
9797
3. Pay adjustment forecast 2021
Average Monthly Salary 2020 (Actual) vs 2021 (Predicted)(Finance – by Job Position)
Base : All companies that have respective job positions (unweighted)
Qn.C2. How many employees are at this position as at Sept 1, 2020?
Qn. C3. What is the predicted adjustment of salary for employees of this position in coming 12 months? Will be changed or unchanged? If change is predicted please help fill in percentage in average?
0.6%
2.0%
0.0% 0.0% 0.0%
0.7%0.6%
0.0%
0.3%0.4%
0.0%
0.5%
1.0%
1.5%
2.0%
2.5%
Responsible Officer Operations Manager Operations Officer Risk Manager Trader / Dealer Corporate FinanceExecutive /Associate
Corporate FinanceManager
Settlement Manager Settlement Officer Settlement Clerk
Overall adjustment in Finance : 0.5%
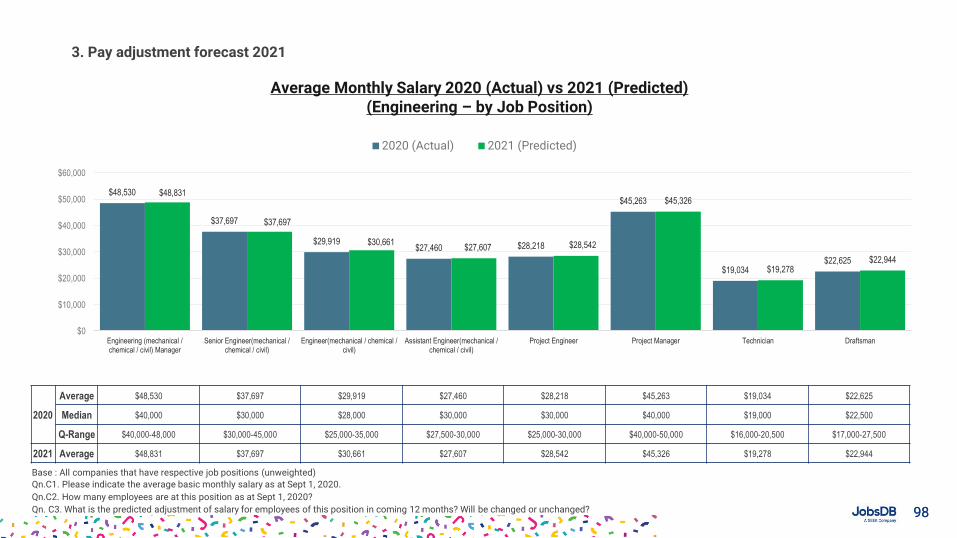
9898
3. Pay adjustment forecast 2021
Average Monthly Salary 2020 (Actual) vs 2021 (Predicted)(Engineering – by Job Position)
Base : All companies that have respective job positions (unweighted)
Qn.C1. Please indicate the average basic monthly salary as at Sept 1, 2020.
Qn.C2. How many employees are at this position as at Sept 1, 2020?
Qn. C3. What is the predicted adjustment of salary for employees of this position in coming 12 months? Will be changed or unchanged?
$48,530
$37,697
$29,919$27,460 $28,218
$45,263
$19,034$22,625
$48,831
$37,697
$30,661$27,607 $28,542
$45,326
$19,278$22,944
$0
$10,000
$20,000
$30,000
$40,000
$50,000
$60,000
Engineering (mechanical /chemical / civil) Manager
Senior Engineer(mechanical /chemical / civil)
Engineer(mechanical / chemical /civil)
Assistant Engineer(mechanical /chemical / civil)
Project Engineer Project Manager Technician Draftsman
2020 (Actual) 2021 (Predicted)
2020
Average $48,530 $37,697 $29,919 $27,460 $28,218 $45,263 $19,034 $22,625
Median $40,000 $30,000 $28,000 $30,000 $30,000 $40,000 $19,000 $22,500
Q-Range $40,000-48,000 $30,000-45,000 $25,000-35,000 $27,500-30,000 $25,000-30,000 $40,000-50,000 $16,000-20,500 $17,000-27,500
2021 Average $48,831 $37,697 $30,661 $27,607 $28,542 $45,326 $19,278 $22,944
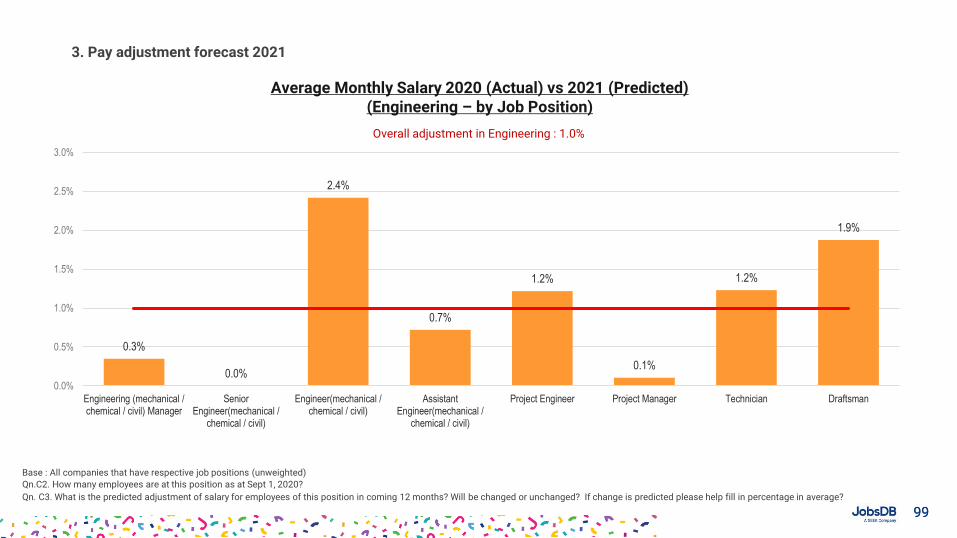
9999
3. Pay adjustment forecast 2021
Average Monthly Salary 2020 (Actual) vs 2021 (Predicted)(Engineering – by Job Position)
Base : All companies that have respective job positions (unweighted)
Qn.C2. How many employees are at this position as at Sept 1, 2020?
Qn. C3. What is the predicted adjustment of salary for employees of this position in coming 12 months? Will be changed or unchanged? If change is predicted please help fill in percentage in average?
0.3%
0.0%
2.4%
0.7%
1.2%
0.1%
1.2%
1.9%
0.0%
0.5%
1.0%
1.5%
2.0%
2.5%
3.0%
Engineering (mechanical /chemical / civil) Manager
SeniorEngineer(mechanical /
chemical / civil)
Engineer(mechanical /chemical / civil)
AssistantEngineer(mechanical /
chemical / civil)
Project Engineer Project Manager Technician Draftsman
Overall adjustment in Engineering : 1.0%
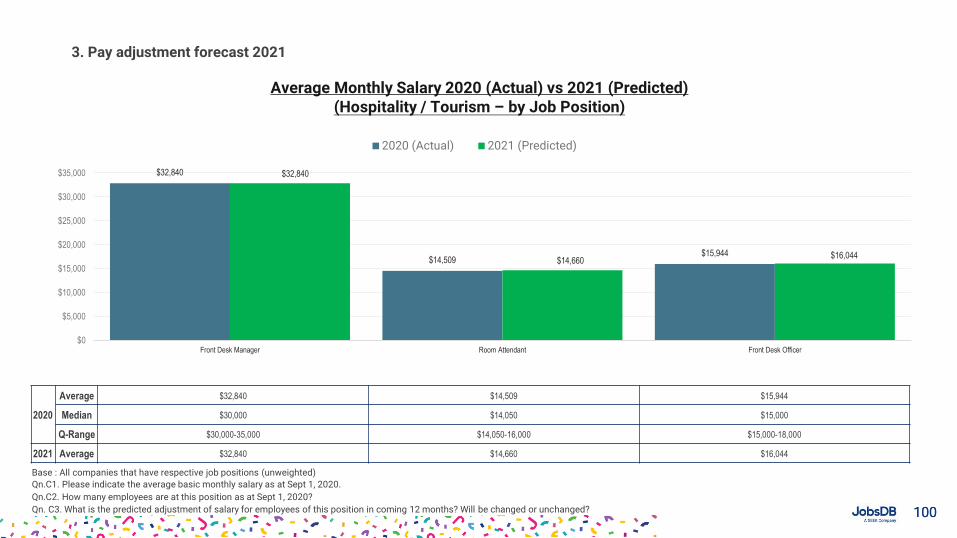
100100
3. Pay adjustment forecast 2021
Average Monthly Salary 2020 (Actual) vs 2021 (Predicted)(Hospitality / Tourism – by Job Position)
Base : All companies that have respective job positions (unweighted)
Qn.C1. Please indicate the average basic monthly salary as at Sept 1, 2020.
Qn.C2. How many employees are at this position as at Sept 1, 2020?
Qn. C3. What is the predicted adjustment of salary for employees of this position in coming 12 months? Will be changed or unchanged?
$32,840
$14,509$15,944
$32,840
$14,660$16,044
$0
$5,000
$10,000
$15,000
$20,000
$25,000
$30,000
$35,000
Front Desk Manager Room Attendant Front Desk Officer
2020 (Actual) 2021 (Predicted)
2020
Average $32,840 $14,509 $15,944
Median $30,000 $14,050 $15,000
Q-Range $30,000-35,000 $14,050-16,000 $15,000-18,000
2021 Average $32,840 $14,660 $16,044
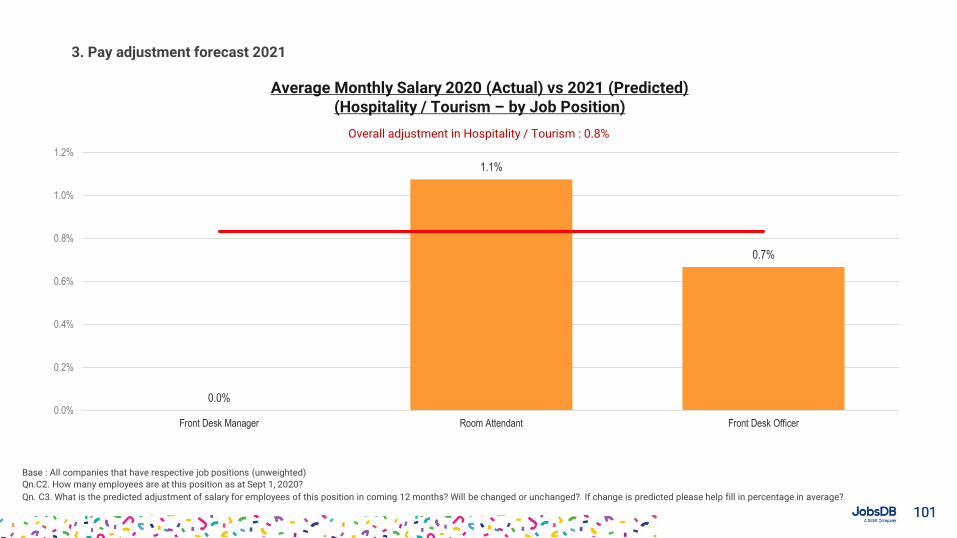
101101
3. Pay adjustment forecast 2021
Average Monthly Salary 2020 (Actual) vs 2021 (Predicted)(Hospitality / Tourism – by Job Position)
Base : All companies that have respective job positions (unweighted)
Qn.C2. How many employees are at this position as at Sept 1, 2020?
Qn. C3. What is the predicted adjustment of salary for employees of this position in coming 12 months? Will be changed or unchanged? If change is predicted please help fill in percentage in average?
0.0%
1.1%
0.7%
0.0%
0.2%
0.4%
0.6%
0.8%
1.0%
1.2%
Front Desk Manager Room Attendant Front Desk Officer
Overall adjustment in Hospitality / Tourism : 0.8%
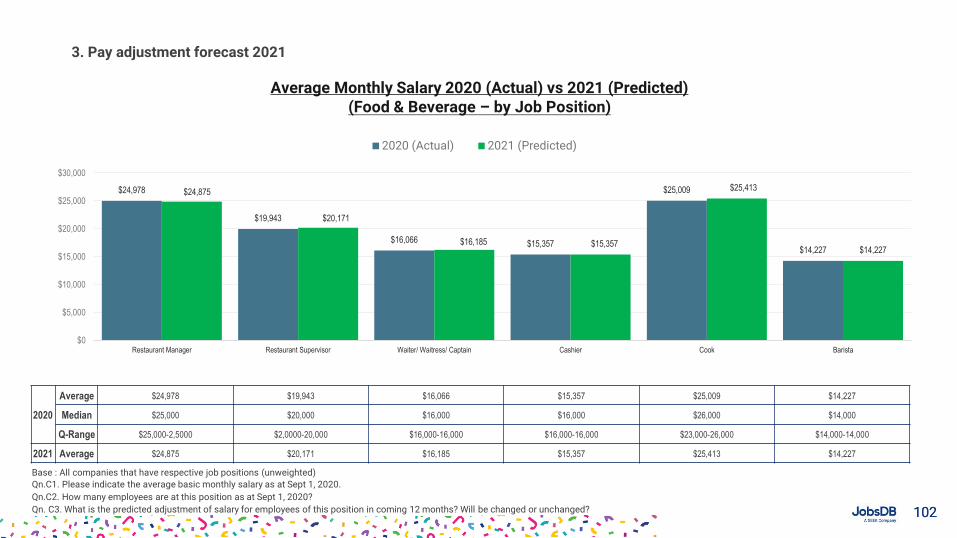
102102
3. Pay adjustment forecast 2021
Average Monthly Salary 2020 (Actual) vs 2021 (Predicted)(Food & Beverage – by Job Position)
Base : All companies that have respective job positions (unweighted)
Qn.C1. Please indicate the average basic monthly salary as at Sept 1, 2020.
Qn.C2. How many employees are at this position as at Sept 1, 2020?
Qn. C3. What is the predicted adjustment of salary for employees of this position in coming 12 months? Will be changed or unchanged?
$24,978
$19,943
$16,066 $15,357
$25,009
$14,227
$24,875
$20,171
$16,185 $15,357
$25,413
$14,227
$0
$5,000
$10,000
$15,000
$20,000
$25,000
$30,000
Restaurant Manager Restaurant Supervisor Waiter/ Waitress/ Captain Cashier Cook Barista
2020 (Actual) 2021 (Predicted)
2020
Average $24,978 $19,943 $16,066 $15,357 $25,009 $14,227
Median $25,000 $20,000 $16,000 $16,000 $26,000 $14,000
Q-Range $25,000-2,5000 $2,0000-20,000 $16,000-16,000 $16,000-16,000 $23,000-26,000 $14,000-14,000
2021 Average $24,875 $20,171 $16,185 $15,357 $25,413 $14,227
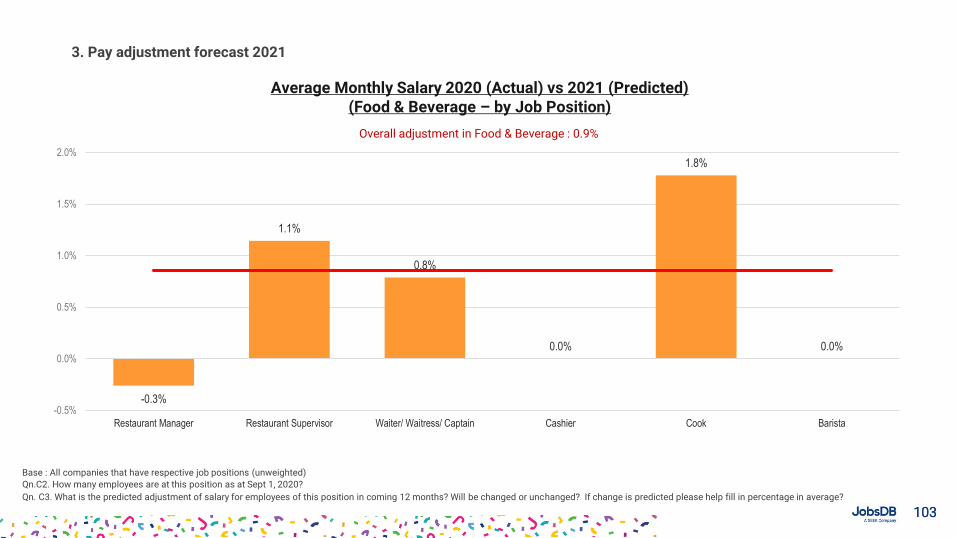
103103
3. Pay adjustment forecast 2021
Average Monthly Salary 2020 (Actual) vs 2021 (Predicted)(Food & Beverage – by Job Position)
Base : All companies that have respective job positions (unweighted)
Qn.C2. How many employees are at this position as at Sept 1, 2020?
Qn. C3. What is the predicted adjustment of salary for employees of this position in coming 12 months? Will be changed or unchanged? If change is predicted please help fill in percentage in average?
-0.3%
1.1%
0.8%
0.0%
1.8%
0.0%
-0.5%
0.0%
0.5%
1.0%
1.5%
2.0%
Restaurant Manager Restaurant Supervisor Waiter/ Waitress/ Captain Cashier Cook Barista
Overall adjustment in Food & Beverage : 0.9%
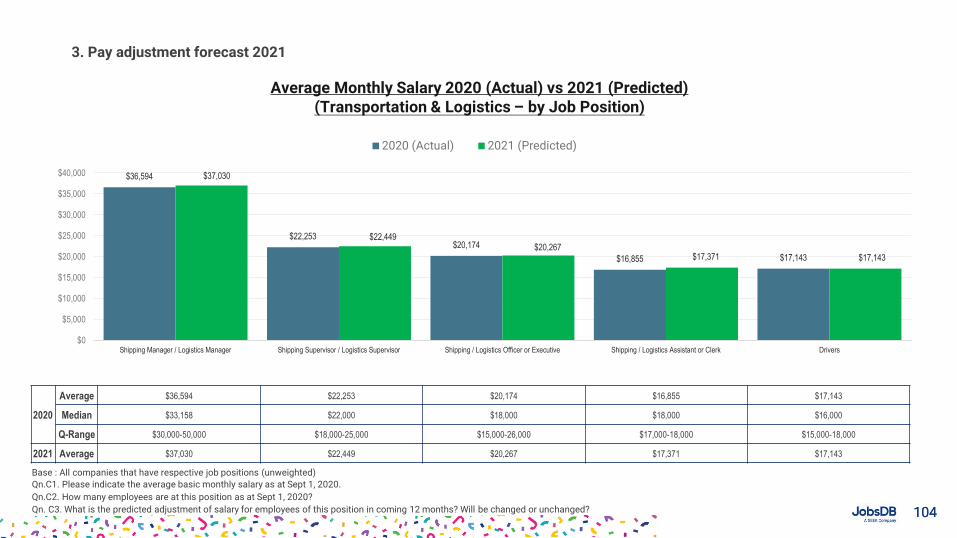
104104
3. Pay adjustment forecast 2021
Average Monthly Salary 2020 (Actual) vs 2021 (Predicted)(Transportation & Logistics – by Job Position)
Base : All companies that have respective job positions (unweighted)
Qn.C1. Please indicate the average basic monthly salary as at Sept 1, 2020.
Qn.C2. How many employees are at this position as at Sept 1, 2020?
Qn. C3. What is the predicted adjustment of salary for employees of this position in coming 12 months? Will be changed or unchanged?
$36,594
$22,253$20,174
$16,855 $17,143
$37,030
$22,449$20,267
$17,371 $17,143
$0
$5,000
$10,000
$15,000
$20,000
$25,000
$30,000
$35,000
$40,000
Shipping Manager / Logistics Manager Shipping Supervisor / Logistics Supervisor Shipping / Logistics Officer or Executive Shipping / Logistics Assistant or Clerk Drivers
2020 (Actual) 2021 (Predicted)
2020
Average $36,594 $22,253 $20,174 $16,855 $17,143
Median $33,158 $22,000 $18,000 $18,000 $16,000
Q-Range $30,000-50,000 $18,000-25,000 $15,000-26,000 $17,000-18,000 $15,000-18,000
2021 Average $37,030 $22,449 $20,267 $17,371 $17,143
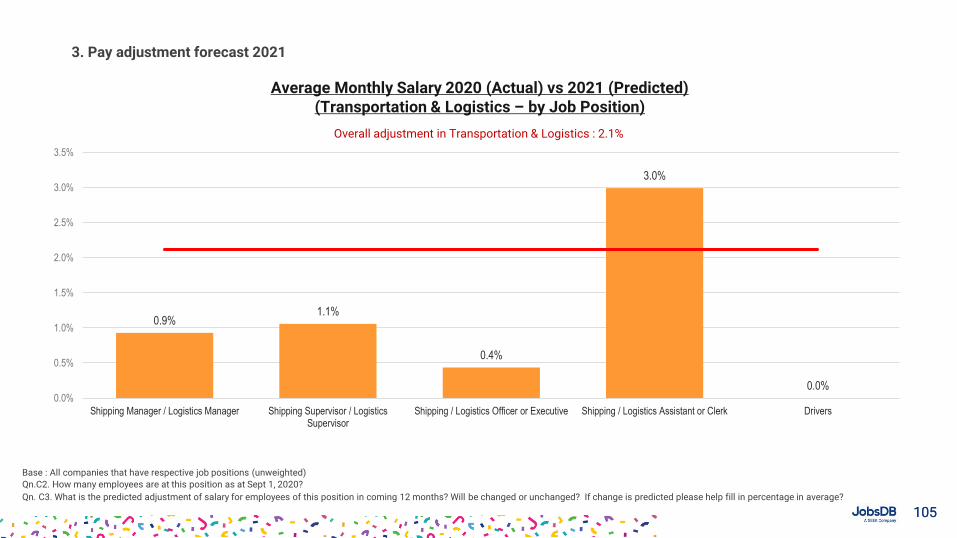
105105
3. Pay adjustment forecast 2021
Average Monthly Salary 2020 (Actual) vs 2021 (Predicted)(Transportation & Logistics – by Job Position)
Base : All companies that have respective job positions (unweighted)
Qn.C2. How many employees are at this position as at Sept 1, 2020?
Qn. C3. What is the predicted adjustment of salary for employees of this position in coming 12 months? Will be changed or unchanged? If change is predicted please help fill in percentage in average?
0.9%1.1%
0.4%
3.0%
0.0%0.0%
0.5%
1.0%
1.5%
2.0%
2.5%
3.0%
3.5%
Shipping Manager / Logistics Manager Shipping Supervisor / LogisticsSupervisor
Shipping / Logistics Officer or Executive Shipping / Logistics Assistant or Clerk Drivers
Overall adjustment in Transportation & Logistics : 2.1%
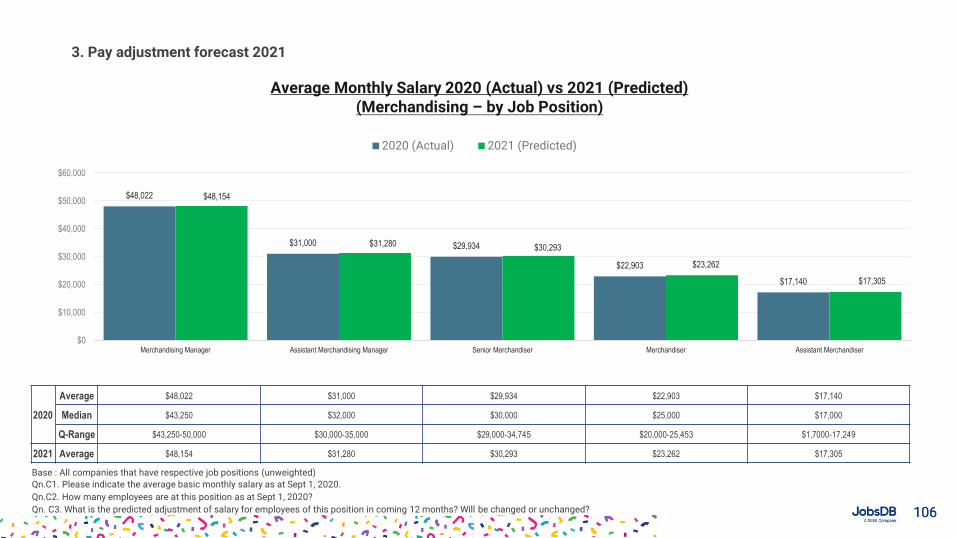
106106
3. Pay adjustment forecast 2021
Average Monthly Salary 2020 (Actual) vs 2021 (Predicted)(Merchandising – by Job Position)
Base : All companies that have respective job positions (unweighted)
Qn.C1. Please indicate the average basic monthly salary as at Sept 1, 2020.
Qn.C2. How many employees are at this position as at Sept 1, 2020?
Qn. C3. What is the predicted adjustment of salary for employees of this position in coming 12 months? Will be changed or unchanged?
$48,022
$31,000 $29,934
$22,903
$17,140
$48,154
$31,280 $30,293
$23,262
$17,305
$0
$10,000
$20,000
$30,000
$40,000
$50,000
$60,000
Merchandising Manager Assistant Merchandising Manager Senior Merchandiser Merchandiser Assistant Merchandiser
2020 (Actual) 2021 (Predicted)
2020
Average $48,022 $31,000 $29,934 $22,903 $17,140
Median $43,250 $32,000 $30,000 $25,000 $17,000
Q-Range $43,250-50,000 $30,000-35,000 $29,000-34,745 $20,000-25,453 $1,7000-17,249
2021 Average $48,154 $31,280 $30,293 $23,262 $17,305
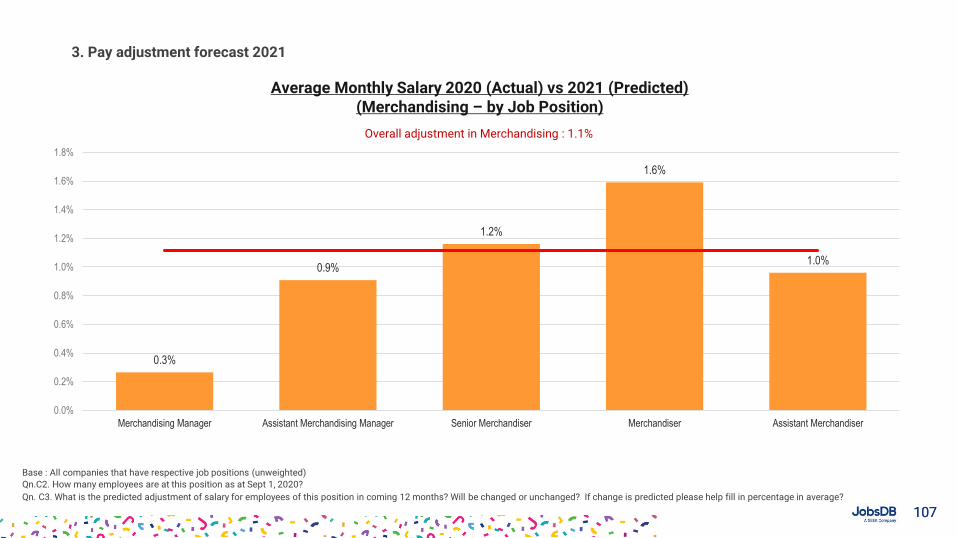
107107
3. Pay adjustment forecast 2021
Average Monthly Salary 2020 (Actual) vs 2021 (Predicted)(Merchandising – by Job Position)
Base : All companies that have respective job positions (unweighted)
Qn.C2. How many employees are at this position as at Sept 1, 2020?
Qn. C3. What is the predicted adjustment of salary for employees of this position in coming 12 months? Will be changed or unchanged? If change is predicted please help fill in percentage in average?
0.3%
0.9%
1.2%
1.6%
1.0%
0.0%
0.2%
0.4%
0.6%
0.8%
1.0%
1.2%
1.4%
1.6%
1.8%
Merchandising Manager Assistant Merchandising Manager Senior Merchandiser Merchandiser Assistant Merchandiser
Overall adjustment in Merchandising : 1.1%
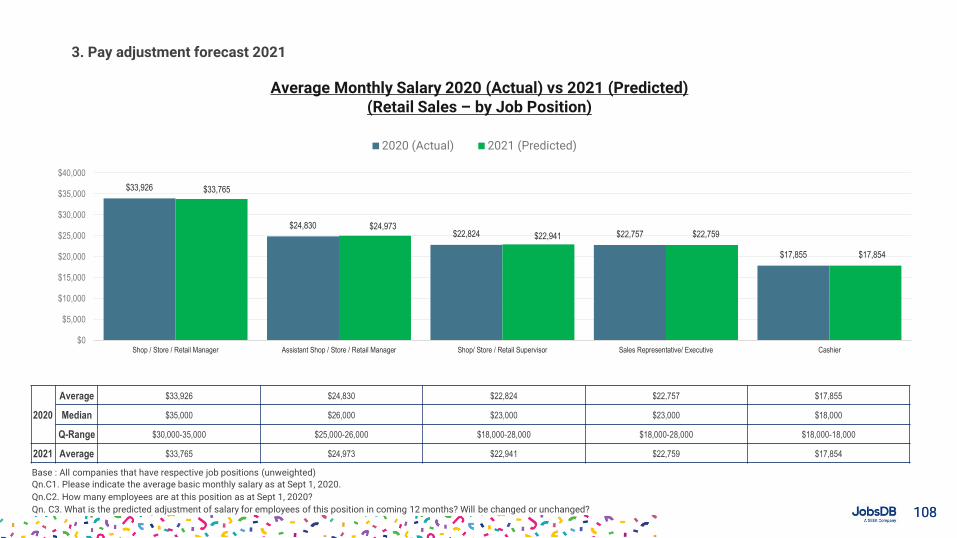
108108
3. Pay adjustment forecast 2021
Average Monthly Salary 2020 (Actual) vs 2021 (Predicted)(Retail Sales – by Job Position)
Base : All companies that have respective job positions (unweighted)
Qn.C1. Please indicate the average basic monthly salary as at Sept 1, 2020.
Qn.C2. How many employees are at this position as at Sept 1, 2020?
Qn. C3. What is the predicted adjustment of salary for employees of this position in coming 12 months? Will be changed or unchanged?
$33,926
$24,830$22,824 $22,757
$17,855
$33,765
$24,973$22,941 $22,759
$17,854
$0
$5,000
$10,000
$15,000
$20,000
$25,000
$30,000
$35,000
$40,000
Shop / Store / Retail Manager Assistant Shop / Store / Retail Manager Shop/ Store / Retail Supervisor Sales Representative/ Executive Cashier
2020 (Actual) 2021 (Predicted)
2020
Average $33,926 $24,830 $22,824 $22,757 $17,855
Median $35,000 $26,000 $23,000 $23,000 $18,000
Q-Range $30,000-35,000 $25,000-26,000 $18,000-28,000 $18,000-28,000 $18,000-18,000
2021 Average $33,765 $24,973 $22,941 $22,759 $17,854
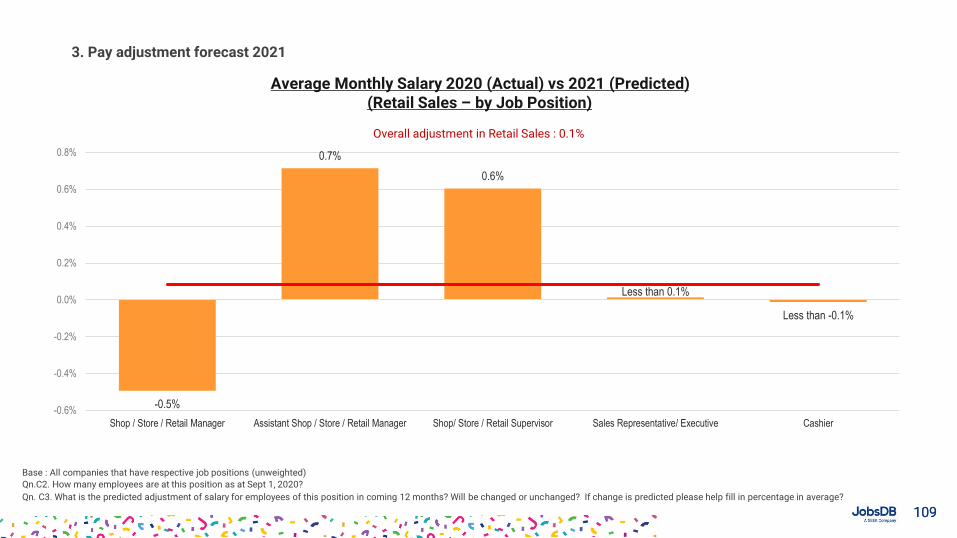
109109
3. Pay adjustment forecast 2021
Average Monthly Salary 2020 (Actual) vs 2021 (Predicted)(Retail Sales – by Job Position)
Base : All companies that have respective job positions (unweighted)
Qn.C2. How many employees are at this position as at Sept 1, 2020?
Qn. C3. What is the predicted adjustment of salary for employees of this position in coming 12 months? Will be changed or unchanged? If change is predicted please help fill in percentage in average?
-0.5%
0.7%
0.6%
Less than 0.1%
Less than -0.1%
-0.6%
-0.4%
-0.2%
0.0%
0.2%
0.4%
0.6%
0.8%
Shop / Store / Retail Manager Assistant Shop / Store / Retail Manager Shop/ Store / Retail Supervisor Sales Representative/ Executive Cashier
Overall adjustment in Retail Sales : 0.1%
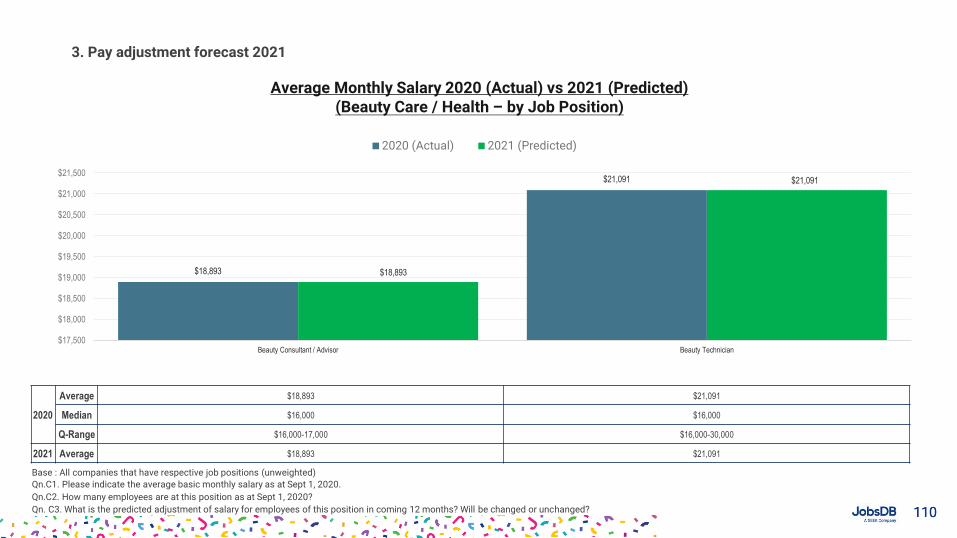
110110
3. Pay adjustment forecast 2021
Average Monthly Salary 2020 (Actual) vs 2021 (Predicted)(Beauty Care / Health – by Job Position)
Base : All companies that have respective job positions (unweighted)
Qn.C1. Please indicate the average basic monthly salary as at Sept 1, 2020.
Qn.C2. How many employees are at this position as at Sept 1, 2020?
Qn. C3. What is the predicted adjustment of salary for employees of this position in coming 12 months? Will be changed or unchanged?
$18,893
$21,091
$18,893
$21,091
$17,500
$18,000
$18,500
$19,000
$19,500
$20,000
$20,500
$21,000
$21,500
Beauty Consultant / Advisor Beauty Technician
2020 (Actual) 2021 (Predicted)
2020
Average $18,893 $21,091
Median $16,000 $16,000
Q-Range $16,000-17,000 $16,000-30,000
2021 Average $18,893 $21,091
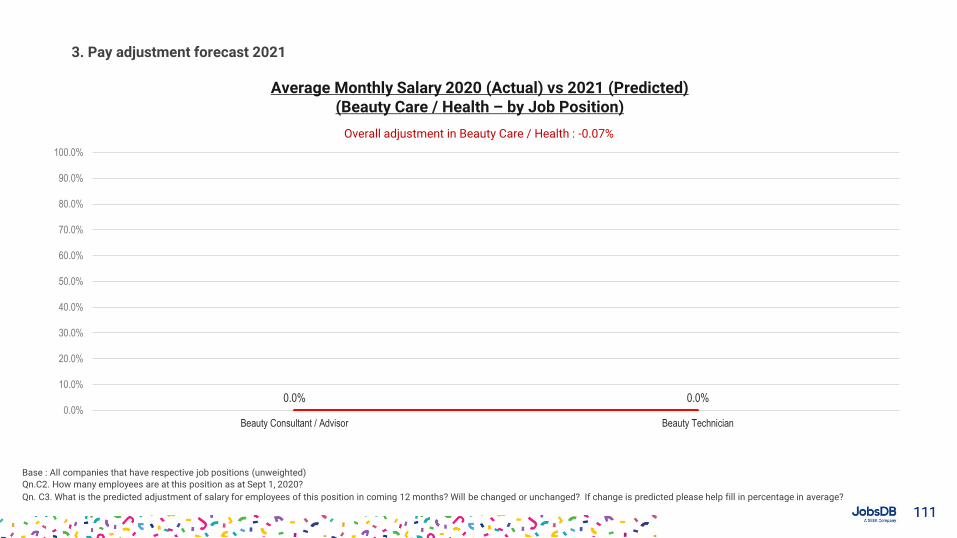
111111
3. Pay adjustment forecast 2021
Average Monthly Salary 2020 (Actual) vs 2021 (Predicted)(Beauty Care / Health – by Job Position)
Base : All companies that have respective job positions (unweighted)
Qn.C2. How many employees are at this position as at Sept 1, 2020?
Qn. C3. What is the predicted adjustment of salary for employees of this position in coming 12 months? Will be changed or unchanged? If change is predicted please help fill in percentage in average?
0.0% 0.0%0.0%
10.0%
20.0%
30.0%
40.0%
50.0%
60.0%
70.0%
80.0%
90.0%
100.0%
Beauty Consultant / Advisor Beauty Technician
Overall adjustment in Beauty Care / Health : -0.07%
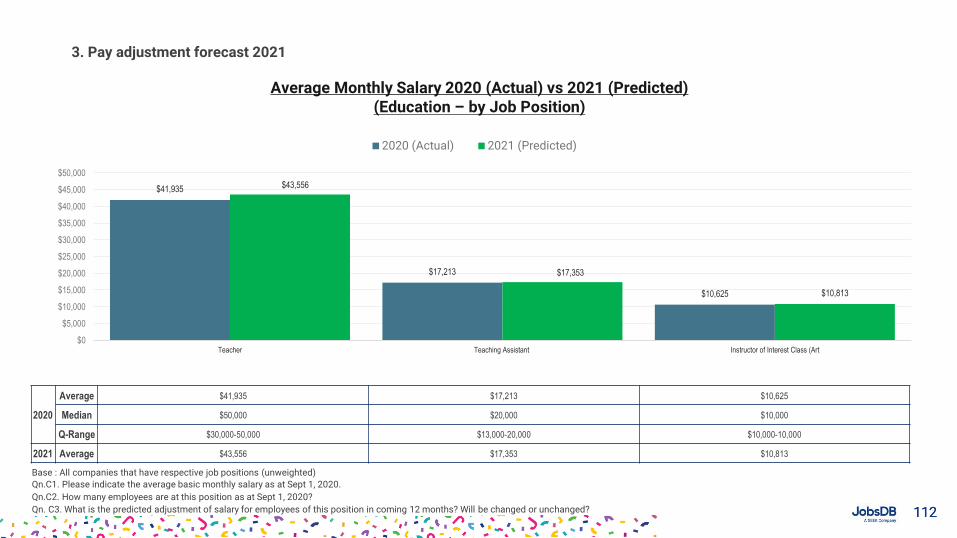
112112
3. Pay adjustment forecast 2021
Average Monthly Salary 2020 (Actual) vs 2021 (Predicted)(Education – by Job Position)
Base : All companies that have respective job positions (unweighted)
Qn.C1. Please indicate the average basic monthly salary as at Sept 1, 2020.
Qn.C2. How many employees are at this position as at Sept 1, 2020?
Qn. C3. What is the predicted adjustment of salary for employees of this position in coming 12 months? Will be changed or unchanged?
$41,935
$17,213
$10,625
$43,556
$17,353
$10,813
$0
$5,000
$10,000
$15,000
$20,000
$25,000
$30,000
$35,000
$40,000
$45,000
$50,000
Teacher Teaching Assistant Instructor of Interest Class (Art
2020 (Actual) 2021 (Predicted)
2020
Average $41,935 $17,213 $10,625
Median $50,000 $20,000 $10,000
Q-Range $30,000-50,000 $13,000-20,000 $10,000-10,000
2021 Average $43,556 $17,353 $10,813
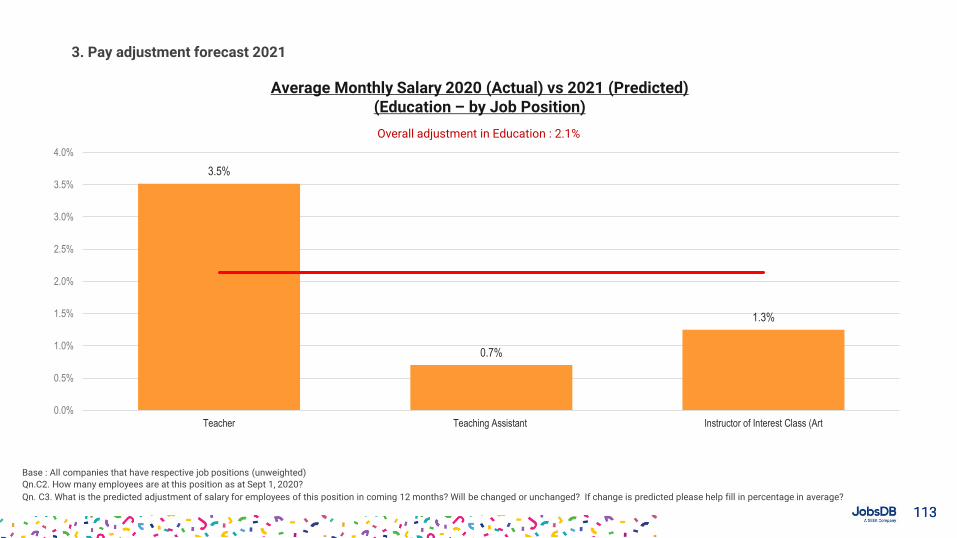
113113
3. Pay adjustment forecast 2021
Average Monthly Salary 2020 (Actual) vs 2021 (Predicted)(Education – by Job Position)
Base : All companies that have respective job positions (unweighted)
Qn.C2. How many employees are at this position as at Sept 1, 2020?
Qn. C3. What is the predicted adjustment of salary for employees of this position in coming 12 months? Will be changed or unchanged? If change is predicted please help fill in percentage in average?
3.5%
0.7%
1.3%
0.0%
0.5%
1.0%
1.5%
2.0%
2.5%
3.0%
3.5%
4.0%
Teacher Teaching Assistant Instructor of Interest Class (Art
Overall adjustment in Education : 2.1%
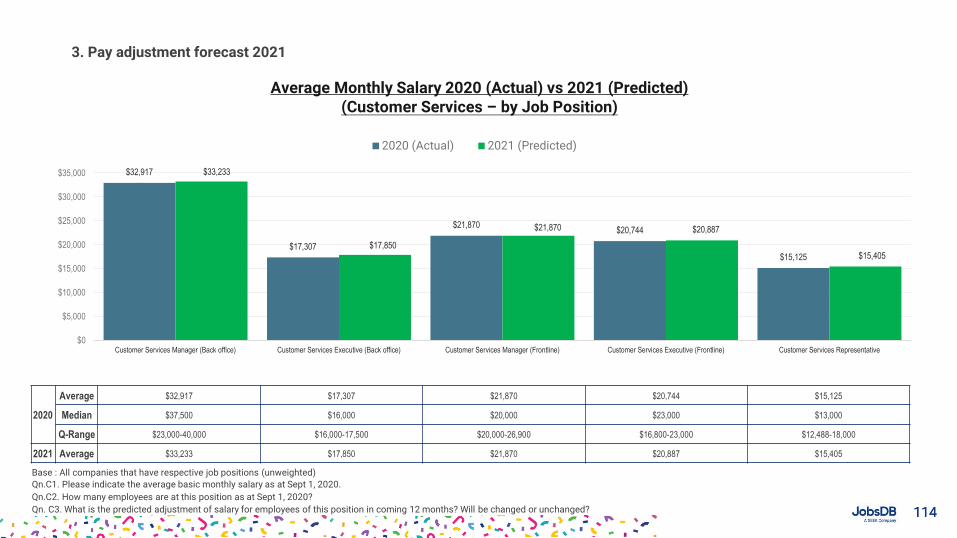
114114
3. Pay adjustment forecast 2021
Average Monthly Salary 2020 (Actual) vs 2021 (Predicted)(Customer Services – by Job Position)
Base : All companies that have respective job positions (unweighted)
Qn.C1. Please indicate the average basic monthly salary as at Sept 1, 2020.
Qn.C2. How many employees are at this position as at Sept 1, 2020?
Qn. C3. What is the predicted adjustment of salary for employees of this position in coming 12 months? Will be changed or unchanged?
$32,917
$17,307
$21,870$20,744
$15,125
$33,233
$17,850
$21,870 $20,887
$15,405
$0
$5,000
$10,000
$15,000
$20,000
$25,000
$30,000
$35,000
Customer Services Manager (Back office) Customer Services Executive (Back office) Customer Services Manager (Frontline) Customer Services Executive (Frontline) Customer Services Representative
2020 (Actual) 2021 (Predicted)
2020
Average $32,917 $17,307 $21,870 $20,744 $15,125
Median $37,500 $16,000 $20,000 $23,000 $13,000
Q-Range $23,000-40,000 $16,000-17,500 $20,000-26,900 $16,800-23,000 $12,488-18,000
2021 Average $33,233 $17,850 $21,870 $20,887 $15,405
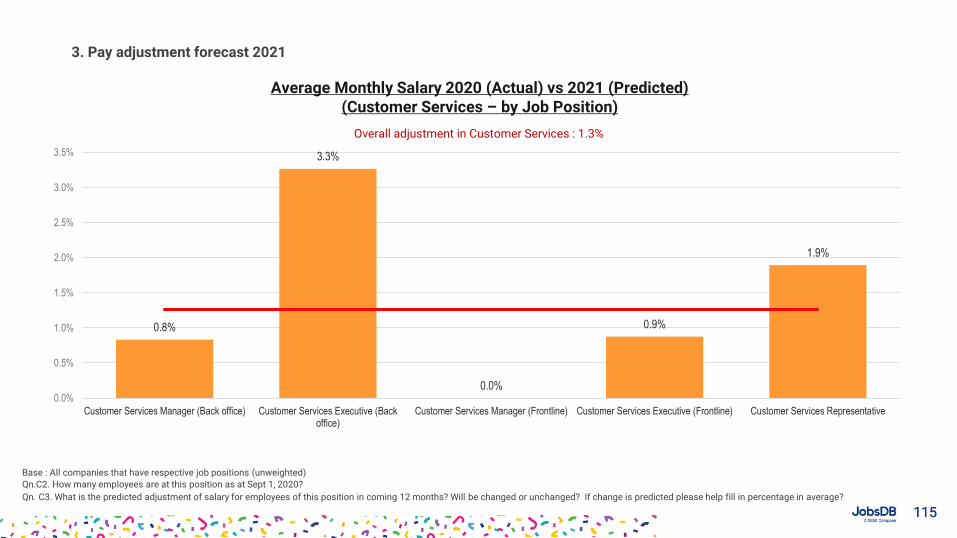
115115
3. Pay adjustment forecast 2021
Average Monthly Salary 2020 (Actual) vs 2021 (Predicted)(Customer Services – by Job Position)
Base : All companies that have respective job positions (unweighted)
Qn.C2. How many employees are at this position as at Sept 1, 2020?
Qn. C3. What is the predicted adjustment of salary for employees of this position in coming 12 months? Will be changed or unchanged? If change is predicted please help fill in percentage in average?
0.8%
3.3%
0.0%
0.9%
1.9%
0.0%
0.5%
1.0%
1.5%
2.0%
2.5%
3.0%
3.5%
Customer Services Manager (Back office) Customer Services Executive (Backoffice)
Customer Services Manager (Frontline) Customer Services Executive (Frontline) Customer Services Representative
Overall adjustment in Customer Services : 1.3%
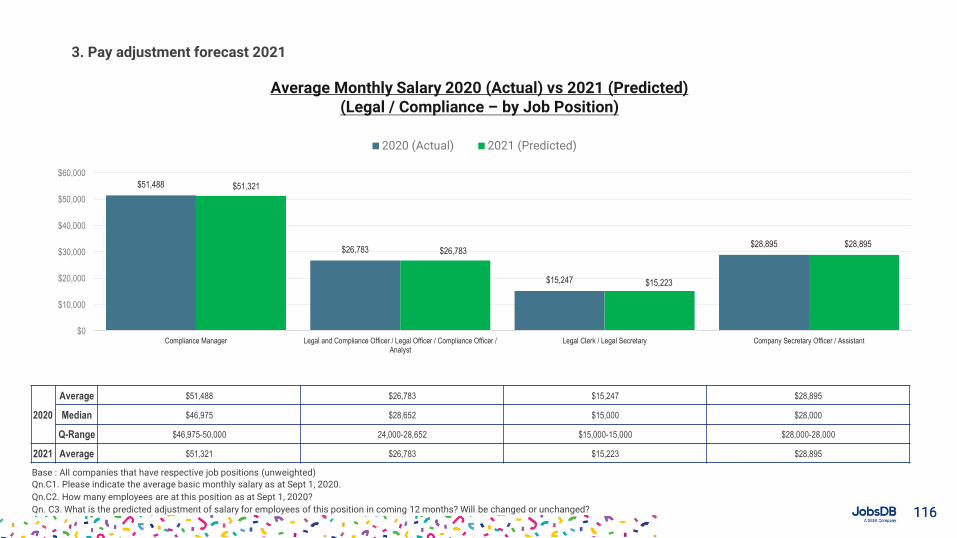
116116
3. Pay adjustment forecast 2021
Average Monthly Salary 2020 (Actual) vs 2021 (Predicted)(Legal / Compliance – by Job Position)
Base : All companies that have respective job positions (unweighted)
Qn.C1. Please indicate the average basic monthly salary as at Sept 1, 2020.
Qn.C2. How many employees are at this position as at Sept 1, 2020?
Qn. C3. What is the predicted adjustment of salary for employees of this position in coming 12 months? Will be changed or unchanged?
$51,488
$26,783
$15,247
$28,895
$51,321
$26,783
$15,223
$28,895
$0
$10,000
$20,000
$30,000
$40,000
$50,000
$60,000
Compliance Manager Legal and Compliance Officer / Legal Officer / Compliance Officer /Analyst
Legal Clerk / Legal Secretary Company Secretary Officer / Assistant
2020 (Actual) 2021 (Predicted)
2020
Average $51,488 $26,783 $15,247 $28,895
Median $46,975 $28,652 $15,000 $28,000
Q-Range $46,975-50,000 24,000-28,652 $15,000-15,000 $28,000-28,000
2021 Average $51,321 $26,783 $15,223 $28,895
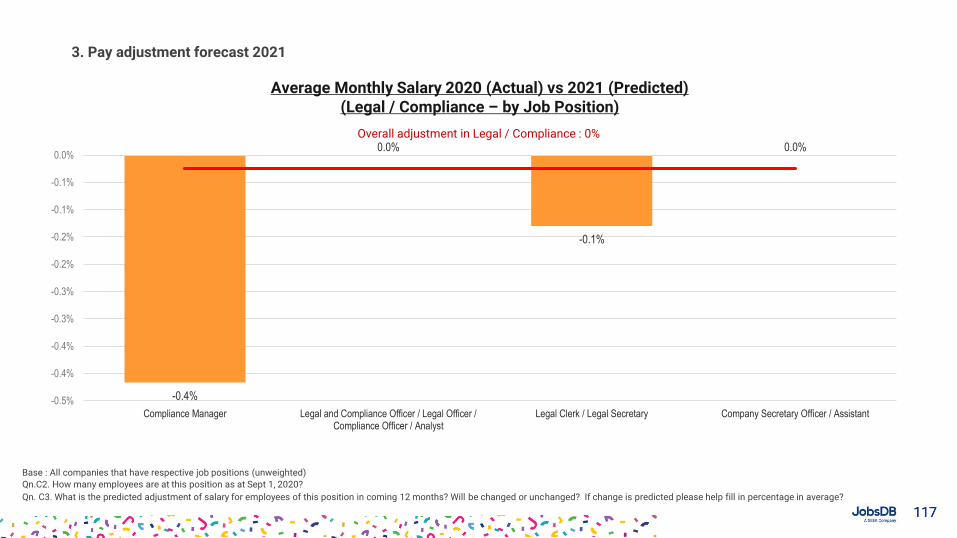
117117
3. Pay adjustment forecast 2021
Average Monthly Salary 2020 (Actual) vs 2021 (Predicted)(Legal / Compliance – by Job Position)
Base : All companies that have respective job positions (unweighted)
Qn.C2. How many employees are at this position as at Sept 1, 2020?
Qn. C3. What is the predicted adjustment of salary for employees of this position in coming 12 months? Will be changed or unchanged? If change is predicted please help fill in percentage in average?
-0.4%
0.0%
-0.1%
0.0%
-0.5%
-0.4%
-0.4%
-0.3%
-0.3%
-0.2%
-0.2%
-0.1%
-0.1%
0.0%
Compliance Manager Legal and Compliance Officer / Legal Officer /Compliance Officer / Analyst
Legal Clerk / Legal Secretary Company Secretary Officer / Assistant
Overall adjustment in Legal / Compliance : 0%
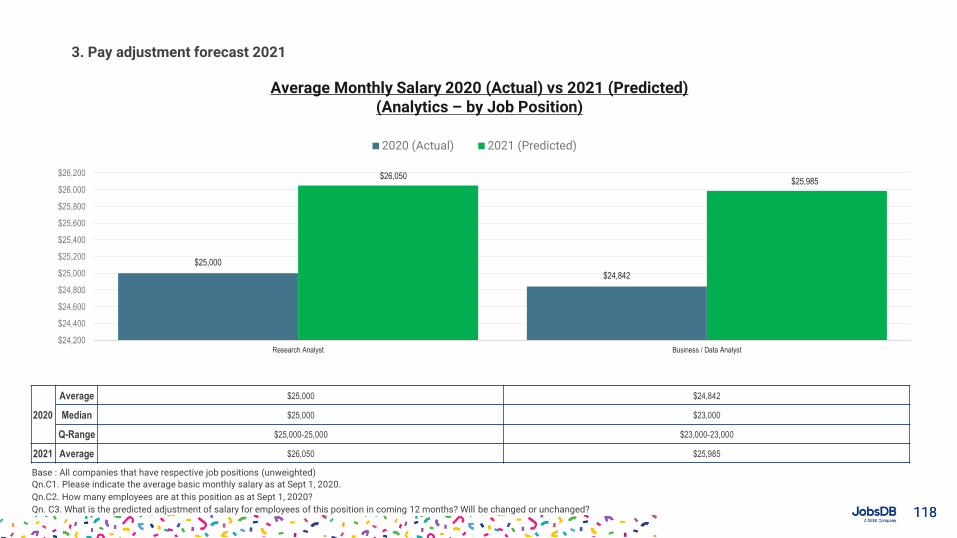
118118
3. Pay adjustment forecast 2021
Average Monthly Salary 2020 (Actual) vs 2021 (Predicted)(Analytics – by Job Position)
Base : All companies that have respective job positions (unweighted)
Qn.C1. Please indicate the average basic monthly salary as at Sept 1, 2020.
Qn.C2. How many employees are at this position as at Sept 1, 2020?
Qn. C3. What is the predicted adjustment of salary for employees of this position in coming 12 months? Will be changed or unchanged?
$25,000
$24,842
$26,050$25,985
$24,200
$24,400
$24,600
$24,800
$25,000
$25,200
$25,400
$25,600
$25,800
$26,000
$26,200
Research Analyst Business / Data Analyst
2020 (Actual) 2021 (Predicted)
2020
Average $25,000 $24,842
Median $25,000 $23,000
Q-Range $25,000-25,000 $23,000-23,000
2021 Average $26,050 $25,985
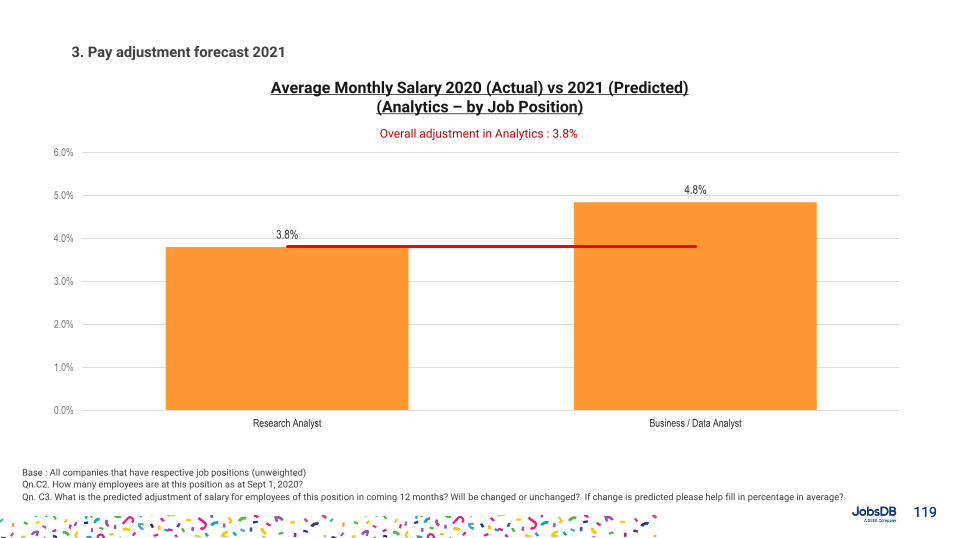
119119
3. Pay adjustment forecast 2021
Average Monthly Salary 2020 (Actual) vs 2021 (Predicted)(Analytics – by Job Position)
Base : All companies that have respective job positions (unweighted)
Qn.C2. How many employees are at this position as at Sept 1, 2020?
Qn. C3. What is the predicted adjustment of salary for employees of this position in coming 12 months? Will be changed or unchanged? If change is predicted please help fill in percentage in average?
3.8%
4.8%
0.0%
1.0%
2.0%
3.0%
4.0%
5.0%
6.0%
Research Analyst Business / Data Analyst
Overall adjustment in Analytics : 3.8%
Section 4Bonuses
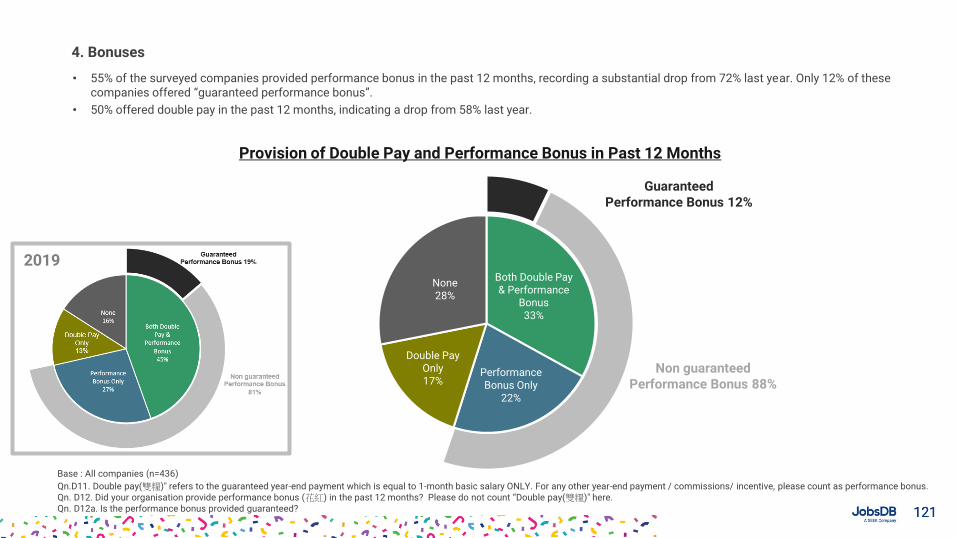
121121
Guaranteed Performance Bonus 12%
Non guaranteed Performance Bonus 88%
• 55% of the surveyed companies provided performance bonus in the past 12 months, recording a substantial drop from 72% last year. Only 12% of these companies offered “guaranteed performance bonus”.
• 50% offered double pay in the past 12 months, indicating a drop from 58% last year.
4. Bonuses
Provision of Double Pay and Performance Bonus in Past 12 Months
Base : All companies (n=436)
Qn.D11. Double pay(雙糧)" refers to the guaranteed year-end payment which is equal to 1-month basic salary ONLY. For any other year-end payment / commissions/ incentive, please count as performance bonus.Qn. D12. Did your organisation provide performance bonus (花紅) in the past 12 months? Please do not count “Double pay(雙糧)" here. Qn. D12a. Is the performance bonus provided guaranteed?
Both Double Pay & Performance
Bonus 33%
Performance Bonus Only
22%
Double Pay Only17%
None 28%
2019
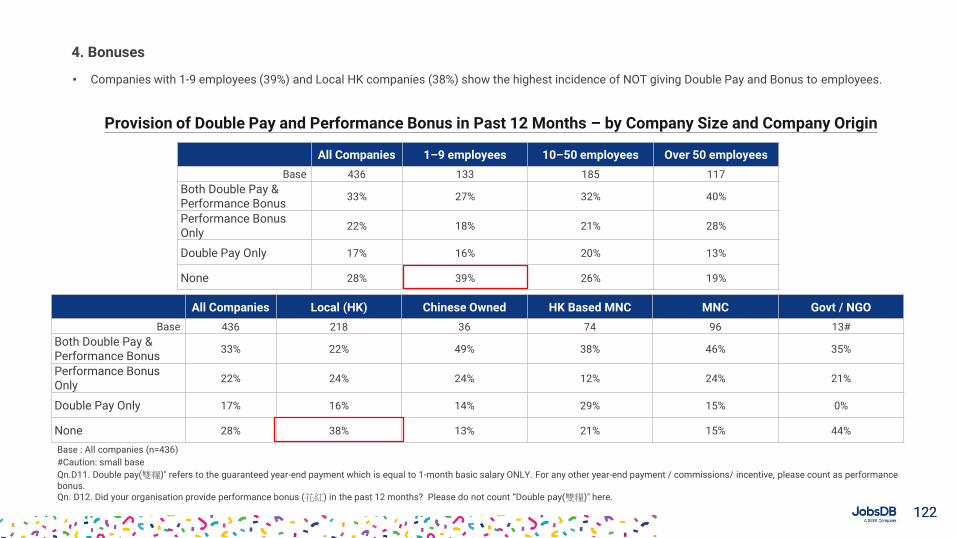
122122
All Companies 1–9 employees 10–50 employees Over 50 employees
Base 436 133 185 117
Both Double Pay & Performance Bonus
33% 27% 32% 40%
Performance Bonus Only
22% 18% 21% 28%
Double Pay Only 17% 16% 20% 13%
None 28% 39% 26% 19%
• Companies with 1-9 employees (39%) and Local HK companies (38%) show the highest incidence of NOT giving Double Pay and Bonus to employees.
4. Bonuses
Provision of Double Pay and Performance Bonus in Past 12 Months – by Company Size and Company Origin
Base : All companies (n=436)
#Caution: small base
Qn.D11. Double pay(雙糧)" refers to the guaranteed year-end payment which is equal to 1-month basic salary ONLY. For any other year-end payment / commissions/ incentive, please count as performance bonus.Qn. D12. Did your organisation provide performance bonus (花紅) in the past 12 months? Please do not count “Double pay(雙糧)" here.
All Companies Local (HK) Chinese Owned HK Based MNC MNC Govt / NGO
Base 436 218 36 74 96 13#
Both Double Pay & Performance Bonus
33% 22% 49% 38% 46% 35%
Performance Bonus Only
22% 24% 24% 12% 24% 21%
Double Pay Only 17% 16% 14% 29% 15% 0%
None 28% 38% 13% 21% 15% 44%
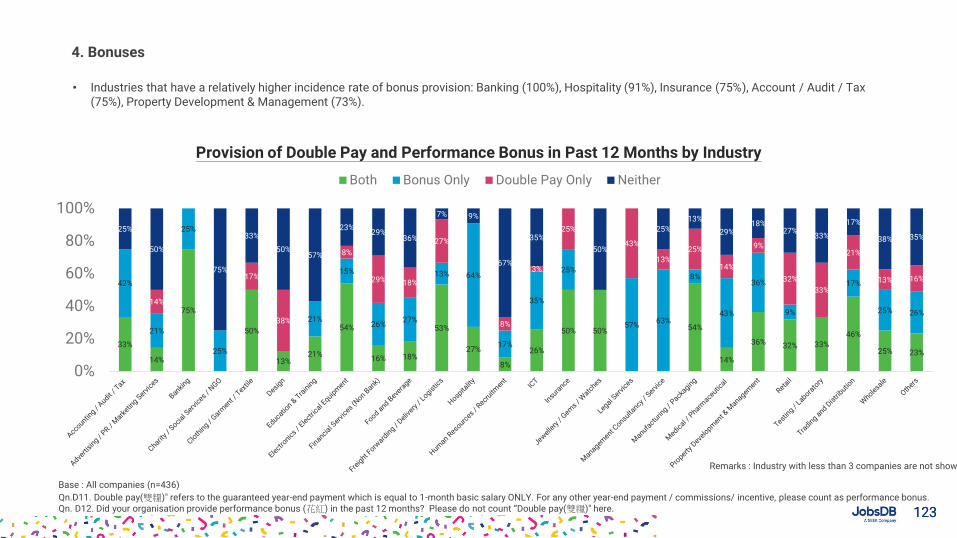
123123
• Industries that have a relatively higher incidence rate of bonus provision: Banking (100%), Hospitality (91%), Insurance (75%), Account / Audit / Tax (75%), Property Development & Management (73%).
4. Bonuses
Provision of Double Pay and Performance Bonus in Past 12 Months by Industry
33%
14%
75%
50%
13%21%
54%
16% 18%
53%
27%
8%
26%
50% 50% 54%
14%
36% 32% 33%
46%
25% 23%
42%
21%
25%
25%
21%
15%
26%27%
13% 64%
17%
35%
25%
57%63%
8%
43%
36%
9%
17%
25% 26%
14%
17%
38%
8%
29% 18%
27%
8%
3%
25%
43%
13%
25%
14%
9%
32%
33%
21%
13% 16%
25%
50%
75%
33%
50%57%
23%29%
36%
7% 9%
67%
35%
50%
25%
13%
29%18%
27%33%
17%
38% 35%
0%
20%
40%
60%
80%
100%
Both Bonus Only Double Pay Only Neither
Base : All companies (n=436)
Qn.D11. Double pay(雙糧)" refers to the guaranteed year-end payment which is equal to 1-month basic salary ONLY. For any other year-end payment / commissions/ incentive, please count as performance bonus.Qn. D12. Did your organisation provide performance bonus (花紅) in the past 12 months? Please do not count “Double pay(雙糧)" here.
Remarks : Industry with less than 3 companies are not shown
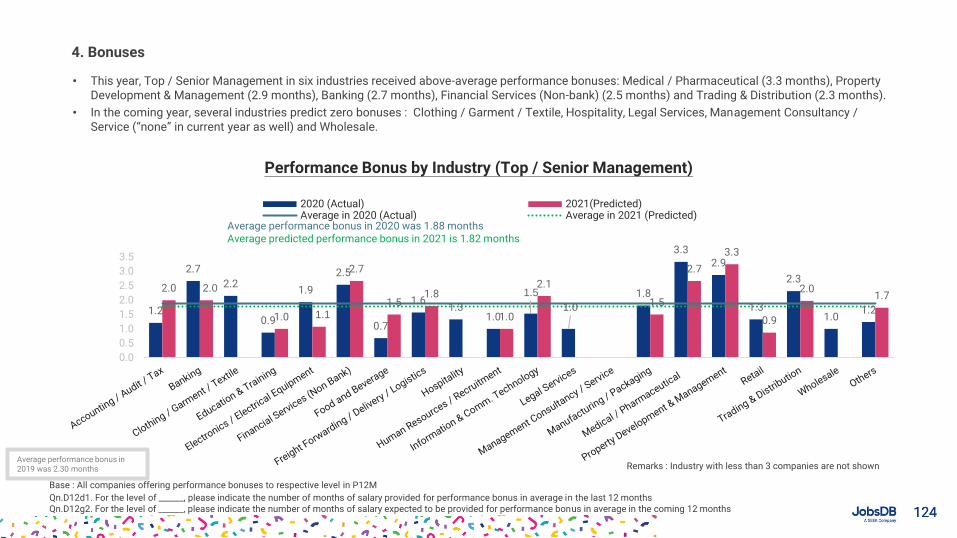
124124
• This year, Top / Senior Management in six industries received above-average performance bonuses: Medical / Pharmaceutical (3.3 months), Property Development & Management (2.9 months), Banking (2.7 months), Financial Services (Non-bank) (2.5 months) and Trading & Distribution (2.3 months).
• In the coming year, several industries predict zero bonuses : Clothing / Garment / Textile, Hospitality, Legal Services, Management Consultancy / Service (“none” in current year as well) and Wholesale.
4. Bonuses
Performance Bonus by Industry (Top / Senior Management)
Base : All companies offering performance bonuses to respective level in P12M
Qn.D12d1. For the level of ______, please indicate the number of months of salary provided for performance bonus in average in the last 12 monthsQn.D12g2. For the level of ______, please indicate the number of months of salary expected to be provided for performance bonus in average in the coming 12 months
1.2
2.7
2.2
0.9
1.9
2.5
0.7
1.61.3
1.0
1.5
1.0
1.8
3.32.9
1.3
2.3
1.01.2
2.0 2.0
1.0 1.1
2.7
1.51.8
1.0
2.1
1.5
2.7
3.3
0.9
2.01.7
0.0
0.5
1.0
1.5
2.0
2.5
3.0
3.5
2020 (Actual) 2021(Predicted)Average in 2020 (Actual) Average in 2021 (Predicted)
Average performance bonus in 2020 was 1.88 monthsAverage predicted performance bonus in 2021 is 1.82 months
Remarks : Industry with less than 3 companies are not shownAverage performance bonus in 2019 was 2.30 months
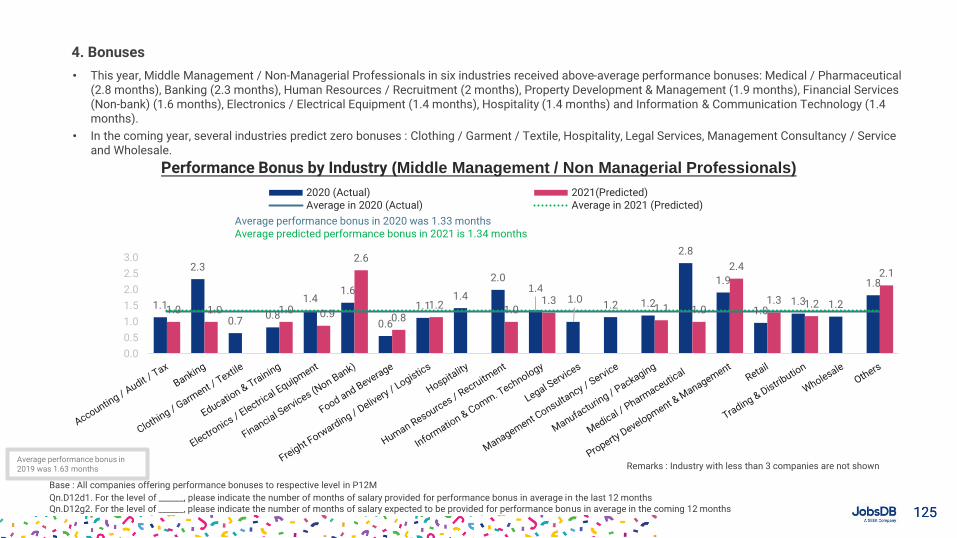
125125
• This year, Middle Management / Non-Managerial Professionals in six industries received above-average performance bonuses: Medical / Pharmaceutical (2.8 months), Banking (2.3 months), Human Resources / Recruitment (2 months), Property Development & Management (1.9 months), Financial Services (Non-bank) (1.6 months), Electronics / Electrical Equipment (1.4 months), Hospitality (1.4 months) and Information & Communication Technology (1.4 months).
• In the coming year, several industries predict zero bonuses : Clothing / Garment / Textile, Hospitality, Legal Services, Management Consultancy / Service and Wholesale.
4. Bonuses
Performance Bonus by Industry (Middle Management / Non Managerial Professionals)
Base : All companies offering performance bonuses to respective level in P12M
Qn.D12d1. For the level of ______, please indicate the number of months of salary provided for performance bonus in average in the last 12 monthsQn.D12g2. For the level of ______, please indicate the number of months of salary expected to be provided for performance bonus in average in the coming 12 months
1.1
2.3
0.70.8
1.41.6
0.6
1.11.4
2.01.4
1.01.2 1.2
2.8
1.9
1.01.3 1.2
1.8
1.0 1.0 1.0 0.9
2.6
0.81.2 1.0
1.31.1 1.0
2.4
1.3 1.2
2.1
0.0
0.5
1.0
1.5
2.0
2.5
3.0
2020 (Actual) 2021(Predicted)Average in 2020 (Actual) Average in 2021 (Predicted)
Average performance bonus in 2020 was 1.33 monthsAverage predicted performance bonus in 2021 is 1.34 months
Remarks : Industry with less than 3 companies are not shownAverage performance bonus in 2019 was 1.63 months
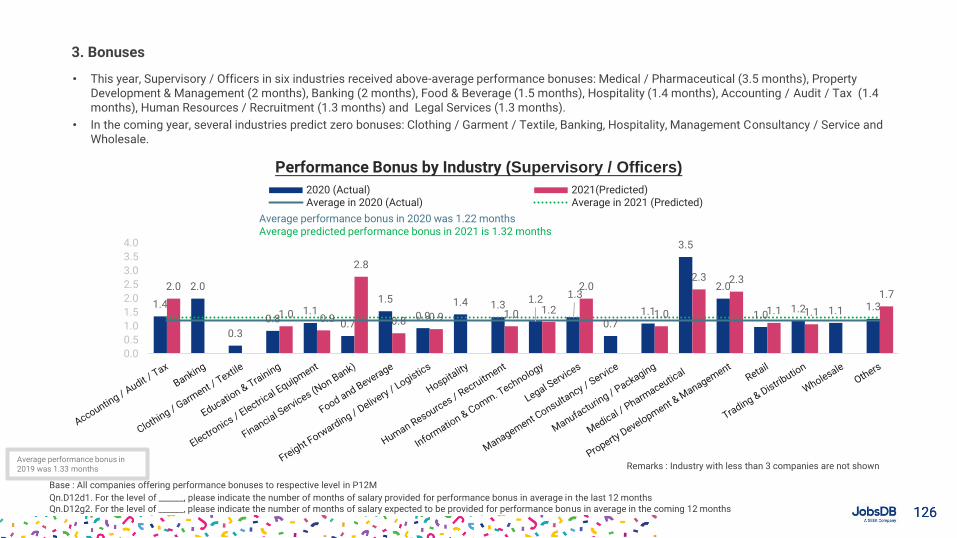
126126
• This year, Supervisory / Officers in six industries received above-average performance bonuses: Medical / Pharmaceutical (3.5 months), Property Development & Management (2 months), Banking (2 months), Food & Beverage (1.5 months), Hospitality (1.4 months), Accounting / Audit / Tax (1.4 months), Human Resources / Recruitment (1.3 months) and Legal Services (1.3 months).
• In the coming year, several industries predict zero bonuses: Clothing / Garment / Textile, Banking, Hospitality, Management Consultancy / Service and Wholesale.
3. Bonuses
Performance Bonus by Industry (Supervisory / Officers)
Base : All companies offering performance bonuses to respective level in P12M
Qn.D12d1. For the level of ______, please indicate the number of months of salary provided for performance bonus in average in the last 12 monthsQn.D12g2. For the level of ______, please indicate the number of months of salary expected to be provided for performance bonus in average in the coming 12 months
1.4
2.0
0.3
0.81.1
0.7
1.5
0.9
1.4 1.31.2 1.3
0.71.1
3.5
2.0
1.01.2 1.1 1.3
2.0
1.0 0.9
2.8
0.8 0.9 1.0 1.2
2.0
1.0
2.3 2.3
1.1 1.1
1.7
0.0
0.5
1.0
1.5
2.0
2.5
3.0
3.5
4.0
2020 (Actual) 2021(Predicted)Average in 2020 (Actual) Average in 2021 (Predicted)
Average performance bonus in 2020 was 1.22 monthsAverage predicted performance bonus in 2021 is 1.32 months
Remarks : Industry with less than 3 companies are not shownAverage performance bonus in 2019 was 1.33 months
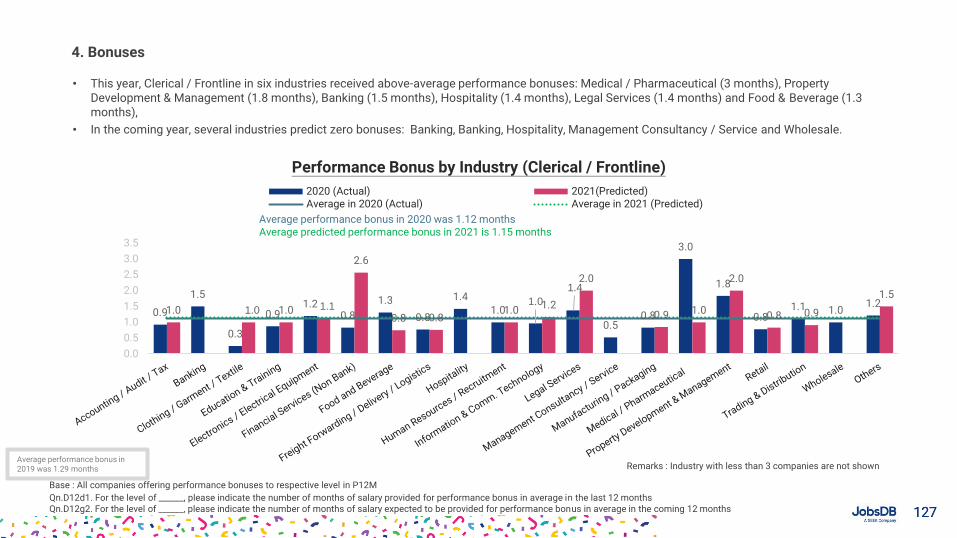
127127
• This year, Clerical / Frontline in six industries received above-average performance bonuses: Medical / Pharmaceutical (3 months), Property Development & Management (1.8 months), Banking (1.5 months), Hospitality (1.4 months), Legal Services (1.4 months) and Food & Beverage (1.3 months),
• In the coming year, several industries predict zero bonuses: Banking, Banking, Hospitality, Management Consultancy / Service and Wholesale.
4. Bonuses
Performance Bonus by Industry (Clerical / Frontline)
Base : All companies offering performance bonuses to respective level in P12M
Qn.D12d1. For the level of ______, please indicate the number of months of salary provided for performance bonus in average in the last 12 monthsQn.D12g2. For the level of ______, please indicate the number of months of salary expected to be provided for performance bonus in average in the coming 12 months
0.9
1.5
0.3
0.91.2
0.8
1.3
0.8
1.4
1.01.0
1.4
0.50.8
3.0
1.8
0.81.1 1.0
1.21.0 1.0 1.0 1.1
2.6
0.8 0.81.0 1.2
2.0
0.9 1.0
2.0
0.8 0.9
1.5
0.0
0.5
1.0
1.5
2.0
2.5
3.0
3.5
2020 (Actual) 2021(Predicted)Average in 2020 (Actual) Average in 2021 (Predicted)
Average performance bonus in 2020 was 1.12 monthsAverage predicted performance bonus in 2021 is 1.15 months
Remarks : Industry with less than 3 companies are not shownAverage performance bonus in 2019 was 1.29 months
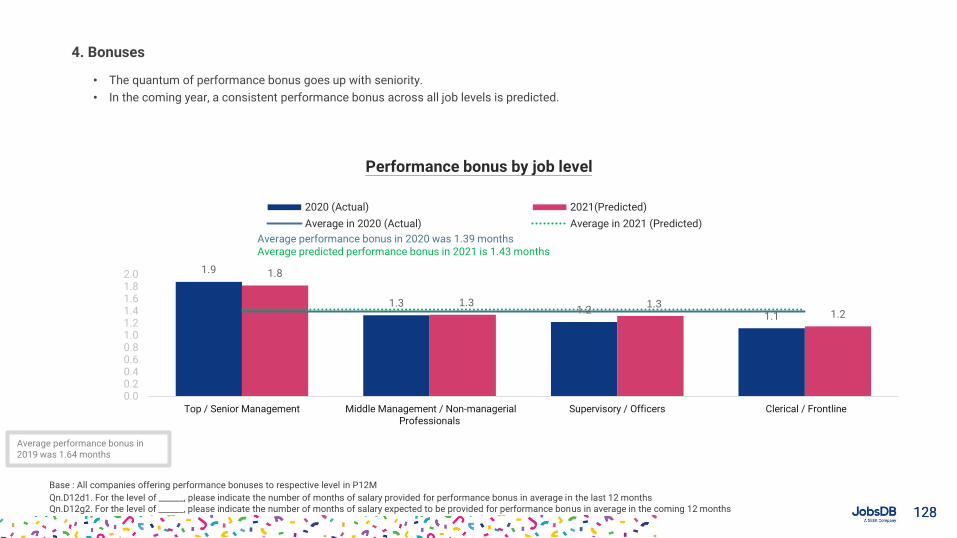
128128
• The quantum of performance bonus goes up with seniority.
• In the coming year, a consistent performance bonus across all job levels is predicted.
4. Bonuses
Base : All companies offering performance bonuses to respective level in P12M
Qn.D12d1. For the level of ______, please indicate the number of months of salary provided for performance bonus in average in the last 12 monthsQn.D12g2. For the level of ______, please indicate the number of months of salary expected to be provided for performance bonus in average in the coming 12 months
Performance bonus by job level
1.9
1.31.2
1.1
1.8
1.3 1.31.2
0.00.20.40.60.81.01.21.41.61.82.0
Top / Senior Management Middle Management / Non-managerialProfessionals
Supervisory / Officers Clerical / Frontline
2020 (Actual) 2021(Predicted)
Average in 2020 (Actual) Average in 2021 (Predicted)
Average performance bonus in 2020 was 1.39 monthsAverage predicted performance bonus in 2021 is 1.43 months
Average performance bonus in 2019 was 1.64 months

Section 5Benefits
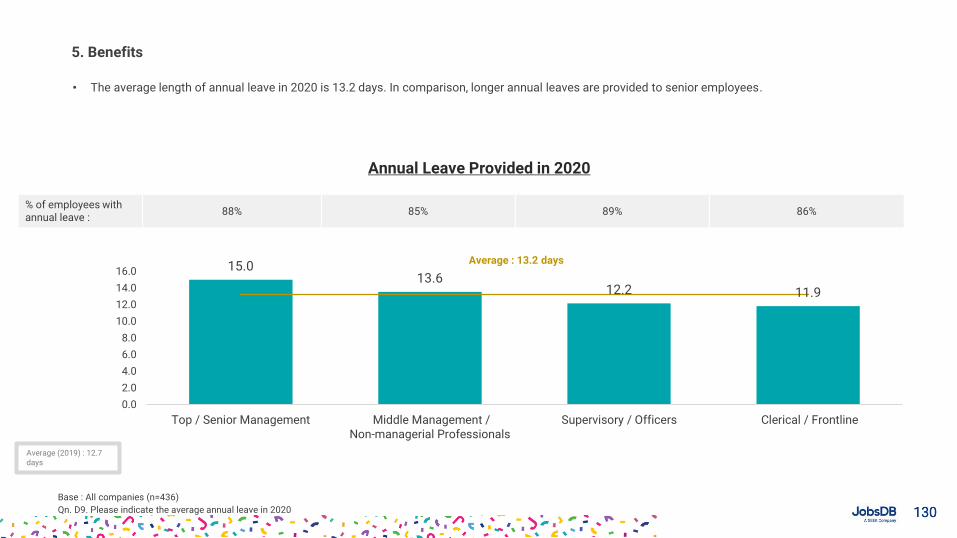
130130
• The average length of annual leave in 2020 is 13.2 days. In comparison, longer annual leaves are provided to senior employees.
5. Benefits
Annual Leave Provided in 2020
Base : All companies (n=436)
Qn. D9. Please indicate the average annual leave in 2020
15.013.6
12.2 11.9
0.0
2.0
4.0
6.0
8.0
10.0
12.0
14.0
16.0
Top / Senior Management Middle Management /Non-managerial Professionals
Supervisory / Officers Clerical / Frontline
% of employees with annual leave :
88% 85% 89% 86%
Average : 13.2 days
Average (2019) : 12.7 days
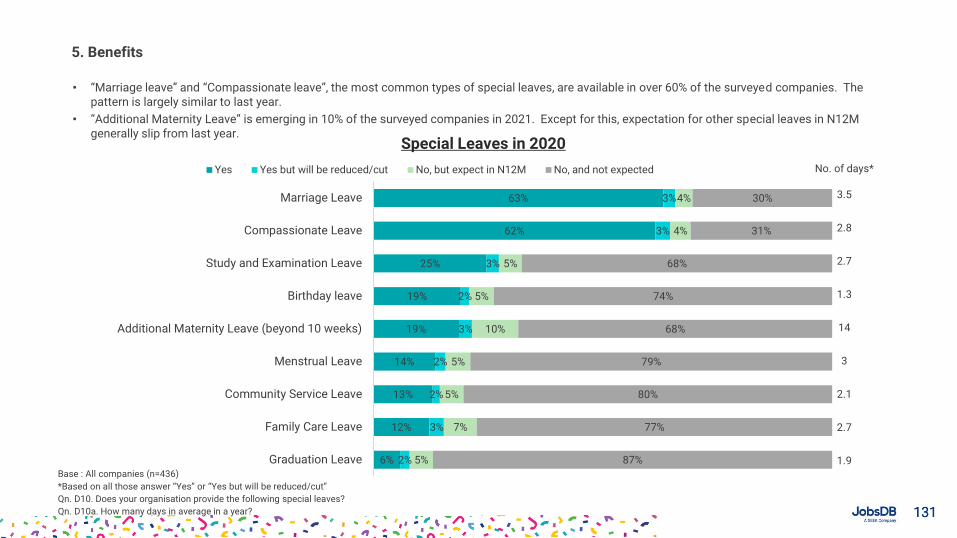
131131
• “Marriage leave” and “Compassionate leave”, the most common types of special leaves, are available in over 60% of the surveyed companies. The pattern is largely similar to last year.
• “Additional Maternity Leave” is emerging in 10% of the surveyed companies in 2021. Except for this, expectation for other special leaves in N12M generally slip from last year.
5. Benefits
Special Leaves in 2020
Base : All companies (n=436)
*Based on all those answer “Yes” or “Yes but will be reduced/cut”
Qn. D10. Does your organisation provide the following special leaves?
Qn. D10a. How many days in average in a year?
63%
62%
25%
19%
19%
14%
13%
12%
6%
3%
3%
3%
2%
3%
2%
2%
3%
2%
4%
4%
5%
5%
10%
5%
5%
7%
5%
30%
31%
68%
74%
68%
79%
80%
77%
87%
Marriage Leave
Compassionate Leave
Study and Examination Leave
Birthday leave
Additional Maternity Leave (beyond 10 weeks)
Menstrual Leave
Community Service Leave
Family Care Leave
Graduation Leave
Yes Yes but will be reduced/cut No, but expect in N12M No, and not expected No. of days*
3.5
2.8
2.7
1.3
14
3
2.1
2.7
1.9
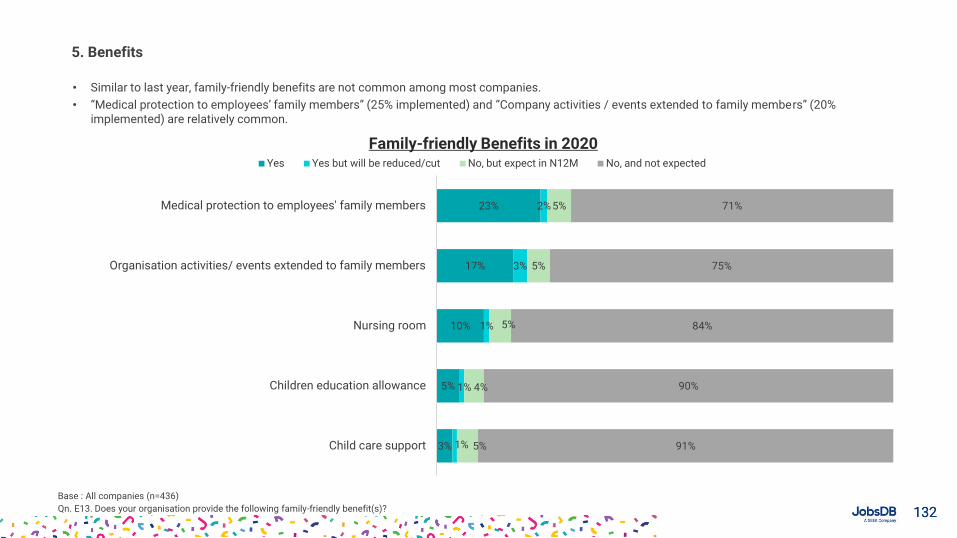
132132
• Similar to last year, family-friendly benefits are not common among most companies.
• “Medical protection to employees’ family members” (25% implemented) and “Company activities / events extended to family members” (20% implemented) are relatively common.
5. Benefits
Family-friendly Benefits in 2020
Base : All companies (n=436)
Qn. E13. Does your organisation provide the following family-friendly benefit(s)?
23%
17%
10%
5%
3%
2%
3%
1%
1%
1%
5%
5%
5%
4%
5%
71%
75%
84%
90%
91%
Medical protection to employees' family members
Organisation activities/ events extended to family members
Nursing room
Children education allowance
Child care support
Yes Yes but will be reduced/cut No, but expect in N12M No, and not expected
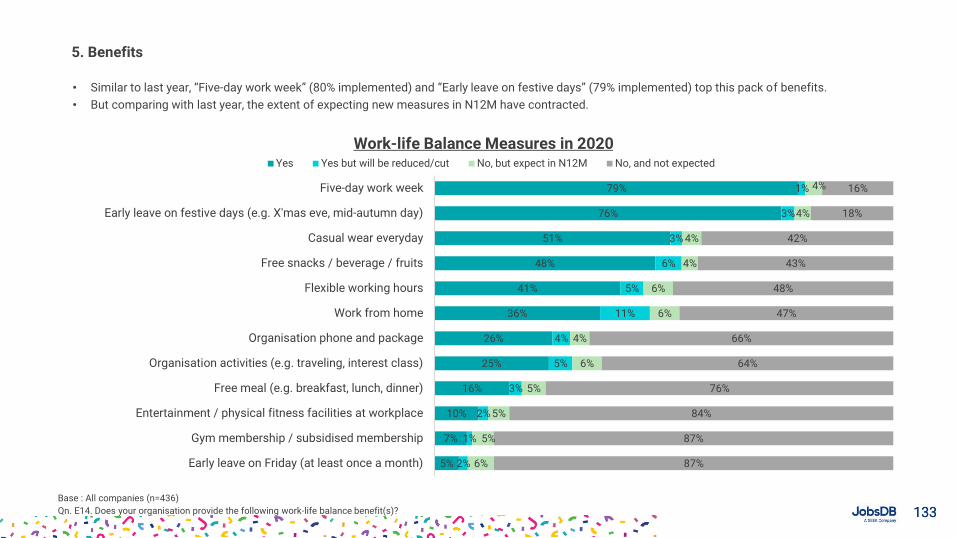
133133
• Similar to last year, “Five-day work week” (80% implemented) and “Early leave on festive days” (79% implemented) top this pack of benefits.
• But comparing with last year, the extent of expecting new measures in N12M have contracted.
5. Benefits
Work-life Balance Measures in 2020
79%
76%
51%
48%
41%
36%
26%
25%
16%
10%
7%
5%
1%
3%
3%
6%
5%
11%
4%
5%
3%
2%
1%
2%
4%
4%
4%
4%
6%
6%
4%
6%
5%
5%
5%
6%
16%
18%
42%
43%
48%
47%
66%
64%
76%
84%
87%
87%
Five-day work week
Early leave on festive days (e.g. X'mas eve, mid-autumn day)
Casual wear everyday
Free snacks / beverage / fruits
Flexible working hours
Work from home
Organisation phone and package
Organisation activities (e.g. traveling, interest class)
Free meal (e.g. breakfast, lunch, dinner)
Entertainment / physical fitness facilities at workplace
Gym membership / subsidised membership
Early leave on Friday (at least once a month)
Yes Yes but will be reduced/cut No, but expect in N12M No, and not expected
Base : All companies (n=436)
Qn. E14. Does your organisation provide the following work-life balance benefit(s)?
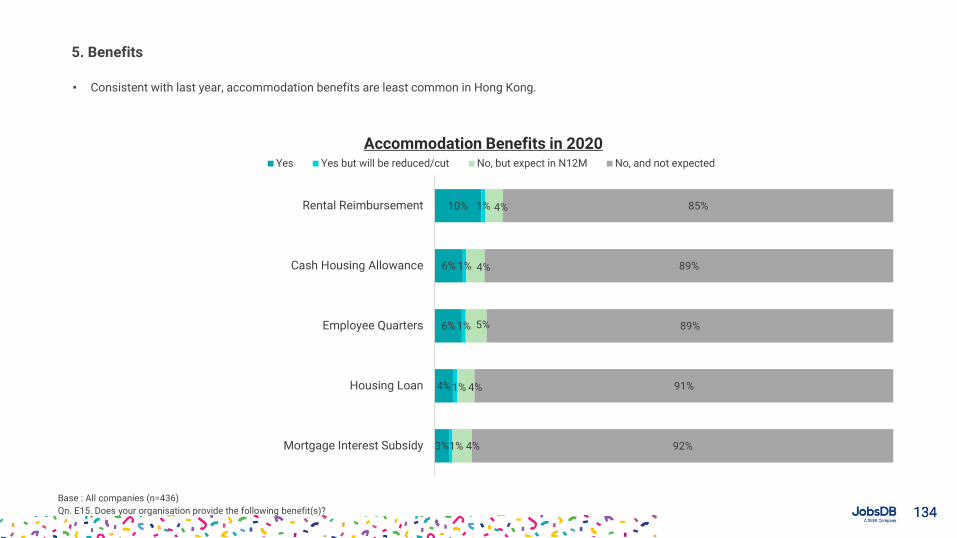
134134
• Consistent with last year, accommodation benefits are least common in Hong Kong.
5. Benefits
Accommodation Benefits in 2020
Base : All companies (n=436)
Qn. E15. Does your organisation provide the following benefit(s)?
10%
6%
6%
4%
3%
1%
1%
1%
1%
1%
4%
4%
5%
4%
4%
85%
89%
89%
91%
92%
Rental Reimbursement
Cash Housing Allowance
Employee Quarters
Housing Loan
Mortgage Interest Subsidy
Yes Yes but will be reduced/cut No, but expect in N12M No, and not expected
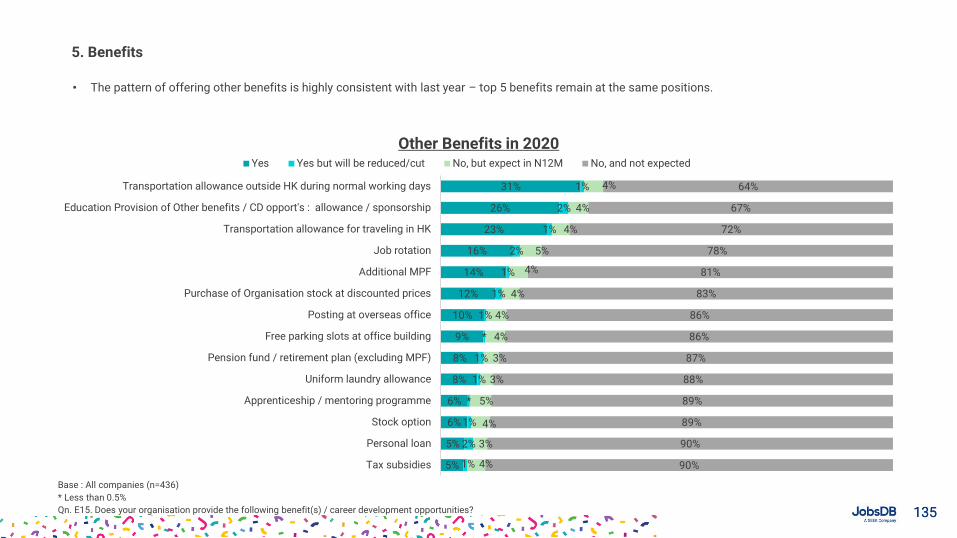
135135
• The pattern of offering other benefits is highly consistent with last year – top 5 benefits remain at the same positions.
5. Benefits
Other Benefits in 2020
31%
26%
23%
16%
14%
12%
10%
9%
8%
8%
6%
6%
5%
5%
1%
2%
1%
2%
1%
1%
1%
*
1%
1%
*
1%
2%
1%
4%
4%
4%
5%
4%
4%
4%
4%
3%
3%
5%
4%
3%
4%
64%
67%
72%
78%
81%
83%
86%
86%
87%
88%
89%
89%
90%
90%
Transportation allowance outside HK during normal working days
Education Provision of Other benefits / CD opport's : allowance / sponsorship
Transportation allowance for traveling in HK
Job rotation
Additional MPF
Purchase of Organisation stock at discounted prices
Posting at overseas office
Free parking slots at office building
Pension fund / retirement plan (excluding MPF)
Uniform laundry allowance
Apprenticeship / mentoring programme
Stock option
Personal loan
Tax subsidies
Yes Yes but will be reduced/cut No, but expect in N12M No, and not expected
Base : All companies (n=436)
* Less than 0.5%
Qn. E15. Does your organisation provide the following benefit(s) / career development opportunities?
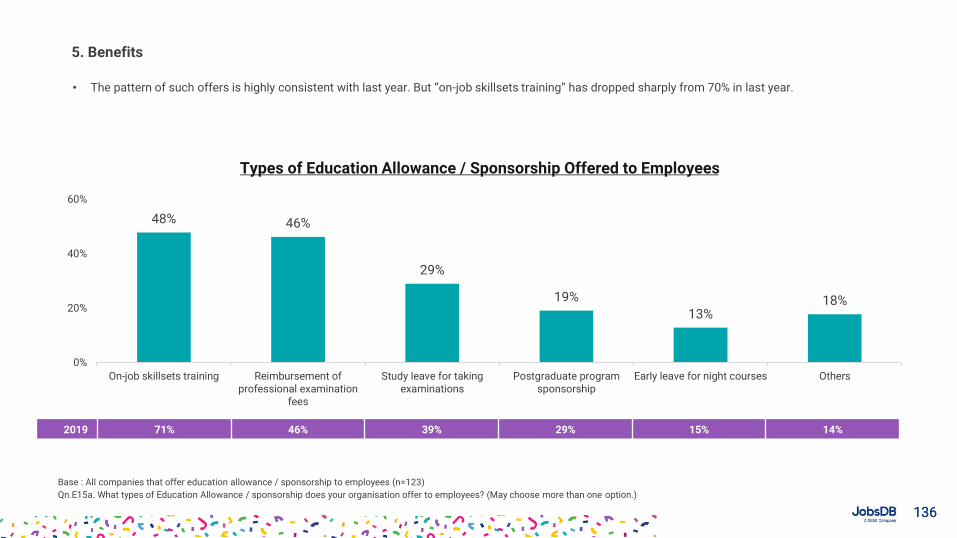
136136
• The pattern of such offers is highly consistent with last year. But “on-job skillsets training” has dropped sharply from 70% in last year.
5. Benefits
Types of Education Allowance / Sponsorship Offered to Employees
Base : All companies that offer education allowance / sponsorship to employees (n=123)
Qn.E15a. What types of Education Allowance / sponsorship does your organisation offer to employees? (May choose more than one option.)
48% 46%
29%
19%
13%18%
0%
20%
40%
60%
On-job skillsets training Reimbursement ofprofessional examination
fees
Study leave for takingexaminations
Postgraduate programsponsorship
Early leave for night courses Others
2019 71% 46% 39% 29% 15% 14%
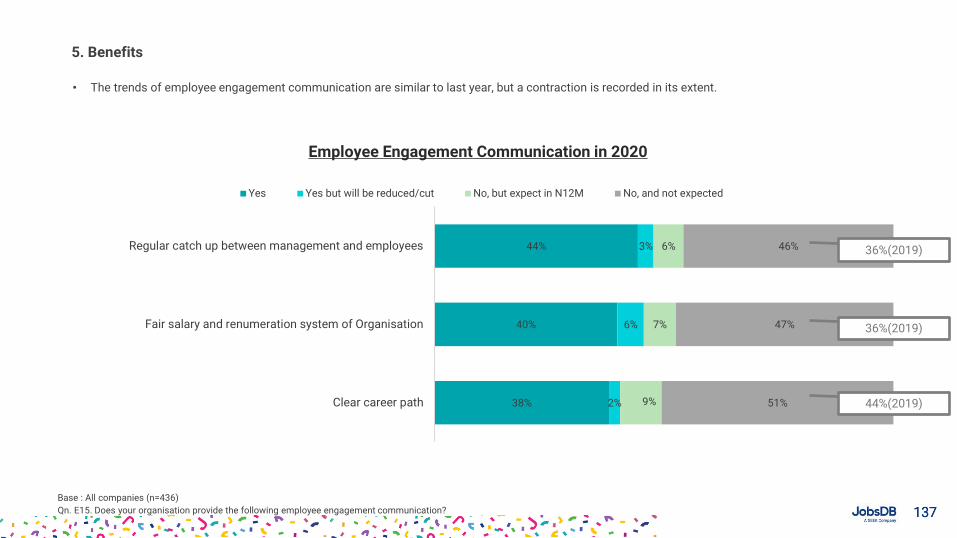
137137
• The trends of employee engagement communication are similar to last year, but a contraction is recorded in its extent.
5. Benefits
Employee Engagement Communication in 2020
Base : All companies (n=436)
Qn. E15. Does your organisation provide the following employee engagement communication?
44%
40%
38%
3%
6%
2%
6%
7%
9%
46%
47%
51%
Regular catch up between management and employees
Fair salary and renumeration system of Organisation
Clear career path
Yes Yes but will be reduced/cut No, but expect in N12M No, and not expected
36%(2019)
36%(2019)
44%(2019)
Section 6Work-from-Home and Related Policies
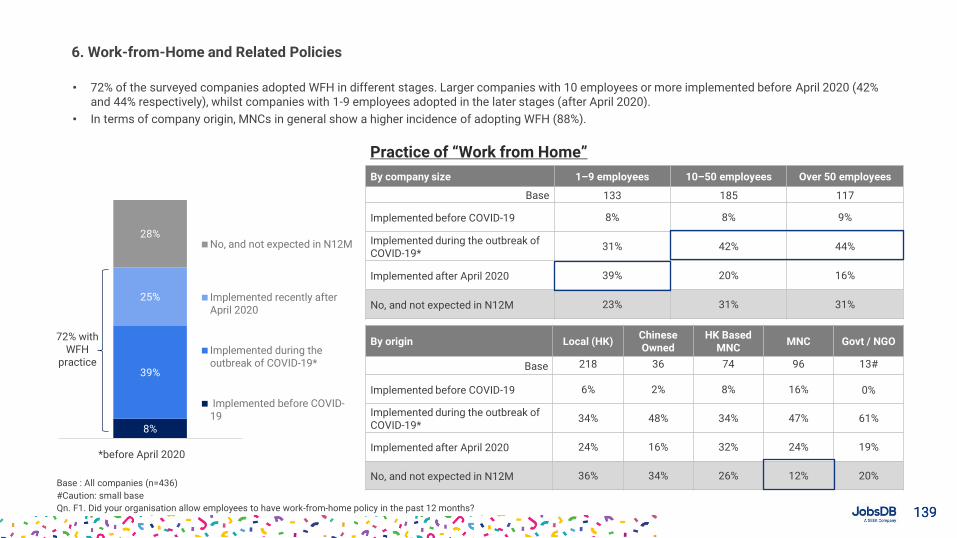
139139
• 72% of the surveyed companies adopted WFH in different stages. Larger companies with 10 employees or more implemented before April 2020 (42% and 44% respectively), whilst companies with 1-9 employees adopted in the later stages (after April 2020).
• In terms of company origin, MNCs in general show a higher incidence of adopting WFH (88%).
6. Work-from-Home and Related Policies
Employee Engagement Communication in 2020
Base : All companies (n=436)
#Caution: small base
Qn. F1. Did your organisation allow employees to have work-from-home policy in the past 12 months?
8%
39%
25%
28%No, and not expected in N12M
Implemented recently afterApril 2020
Implemented during theoutbreak of COVID-19*
Implemented before COVID-19
Practice of “Work from Home”
By company size 1–9 employees 10–50 employees Over 50 employees
Base 133 185 117
Implemented before COVID-19 8% 8% 9%
Implemented during the outbreak of COVID-19*
31% 42% 44%
Implemented after April 2020 39% 20% 16%
No, and not expected in N12M 23% 31% 31%
By origin Local (HK) Chinese Owned
HK BasedMNC
MNC Govt / NGO
Base 218 36 74 96 13#
Implemented before COVID-19 6% 2% 8% 16% 0%
Implemented during the outbreak of COVID-19*
34% 48% 34% 47% 61%
Implemented after April 2020 24% 16% 32% 24% 19%
No, and not expected in N12M 36% 34% 26% 12% 20%
*before April 2020
72% with WFH
practice
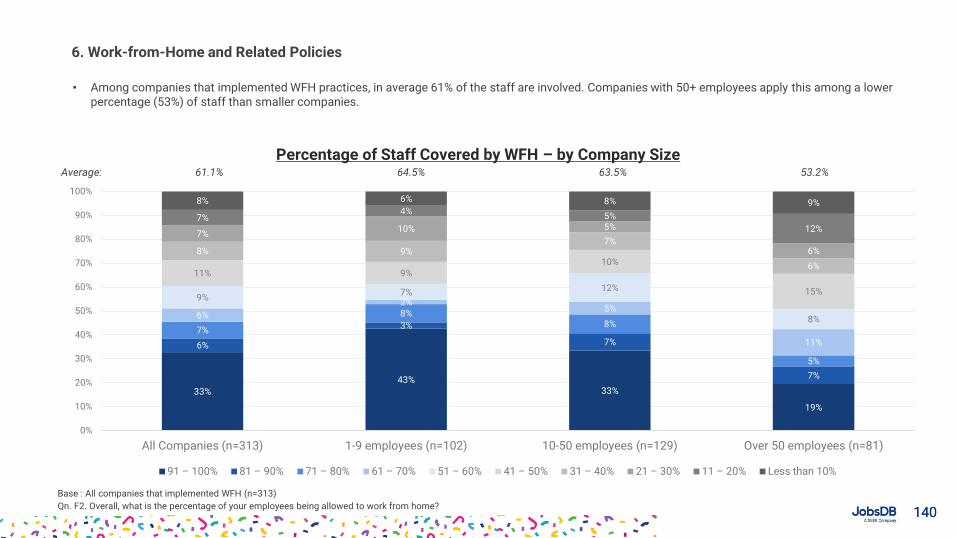
140140
• Among companies that implemented WFH practices, in average 61% of the staff are involved. Companies with 50+ employees apply this among a lower percentage (53%) of staff than smaller companies.
6. Work-from-Home and Related Policies
Percentage of Staff Covered by WFH – by Company Size
33%
43%33%
19%
6%
3%
7%
7%
7%
8%8%
5%
6%
2%5%
11%
9%7% 12%
8%
11% 9%10%
15%
8% 9%7%
6%
7%10% 5%
6%
7%4%
5%
12%
8% 6% 8% 9%
0%
10%
20%
30%
40%
50%
60%
70%
80%
90%
100%
All Companies (n=313) 1-9 employees (n=102) 10-50 employees (n=129) Over 50 employees (n=81)
91 – 100% 81 – 90% 71 – 80% 61 – 70% 51 – 60% 41 – 50% 31 – 40% 21 – 30% 11 – 20% Less than 10%
Base : All companies that implemented WFH (n=313)
Qn. F2. Overall, what is the percentage of your employees being allowed to work from home?
Average: 61.1% 64.5% 63.5% 53.2%
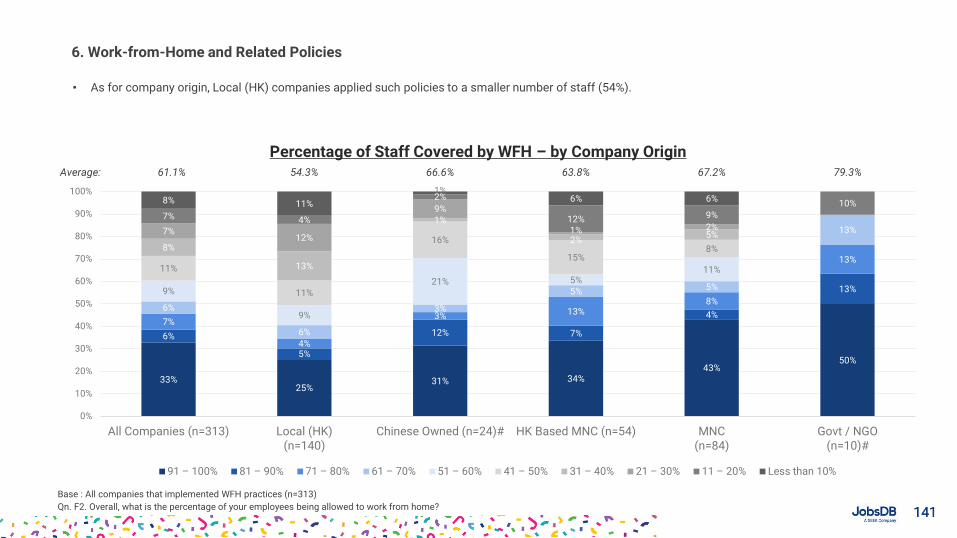
141141
• As for company origin, Local (HK) companies applied such policies to a smaller number of staff (54%).
6. Work-from-Home and Related Policies
Percentage of Staff Covered by WFH – by Company Origin
33%25%
31% 34%43%
50%
6%
5%
12% 7%
4%
13%
7%
4%
3% 13%8%
13%
6%
6%
3%
5% 5%
13%
9%
9%
21% 5%11%11%
11%
16%
15%8%8%
13%
1%
2%5%7%
12%
9%
1% 2%7% 4%
2%
12% 9%
10%8% 11%
1%6% 6%
0%
10%
20%
30%
40%
50%
60%
70%
80%
90%
100%
All Companies (n=313) Local (HK)(n=140)
Chinese Owned (n=24)# HK Based MNC (n=54) MNC(n=84)
Govt / NGO(n=10)#
91 – 100% 81 – 90% 71 – 80% 61 – 70% 51 – 60% 41 – 50% 31 – 40% 21 – 30% 11 – 20% Less than 10%
Base : All companies that implemented WFH practices (n=313)
Qn. F2. Overall, what is the percentage of your employees being allowed to work from home?
Average: 61.1% 54.3% 66.6% 63.8% 67.2% 79.3%
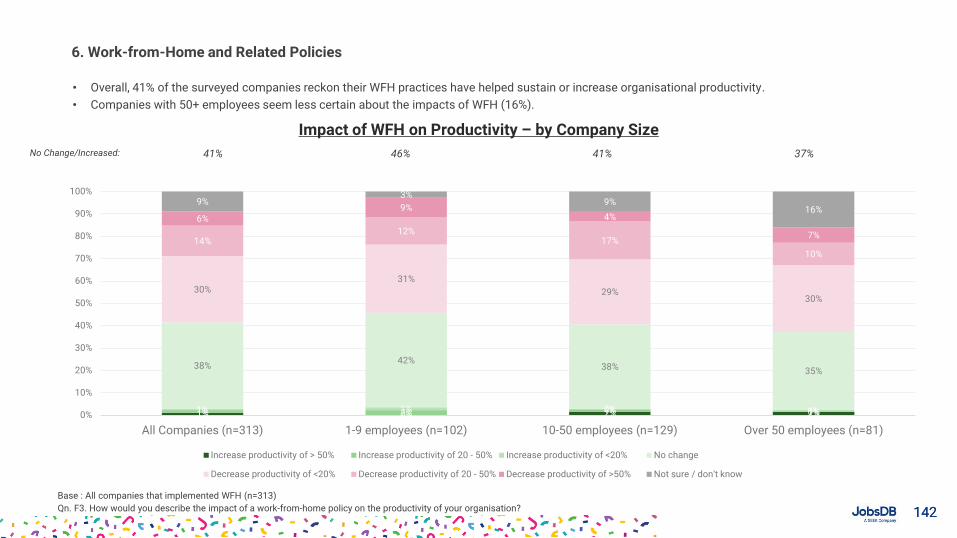
142142
• Overall, 41% of the surveyed companies reckon their WFH practices have helped sustain or increase organisational productivity.
• Companies with 50+ employees seem less certain about the impacts of WFH (16%).
6. Work-from-Home and Related Policies
Impact of WFH on Productivity – by Company Size
1% 0% 2% 2%1% 2% 1% 0%1% 1% 0% 1%
38%42%
38% 35%
30%31%
29%30%
14%12%
17%
10%
6%9%
4%
7%
9%3%
9%16%
0%
10%
20%
30%
40%
50%
60%
70%
80%
90%
100%
All Companies (n=313) 1-9 employees (n=102) 10-50 employees (n=129) Over 50 employees (n=81)
Increase productivity of > 50% Increase productivity of 20 - 50% Increase productivity of <20% No change
Decrease productivity of <20% Decrease productivity of 20 - 50% Decrease productivity of >50% Not sure / don't know
Base : All companies that implemented WFH (n=313)
Qn. F3. How would you describe the impact of a work-from-home policy on the productivity of your organisation?
No Change/Increased: 41% 46% 41% 37%
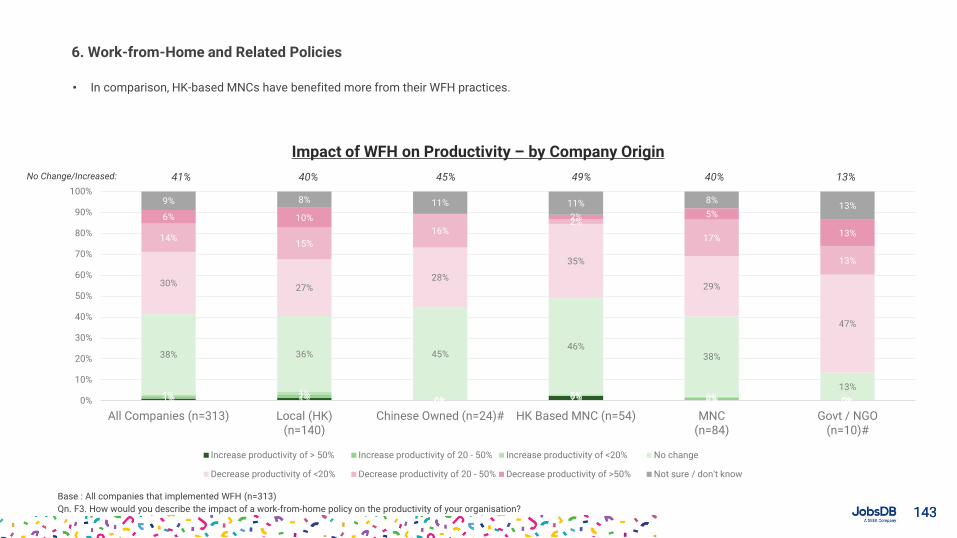
143143
• In comparison, HK-based MNCs have benefited more from their WFH practices.
6. Work-from-Home and Related Policies
Impact of WFH on Productivity – by Company Origin
1% 1% 0% 2% 0% 0%1% 2%0%
0% 2% 0%1% 1%
0%1% 0% 0%
38% 36% 45%46%
38%
13%
30%27%
28%
35%
29%
47%
14%15%
16%2%
17%
13%
6% 10% 2% 5%
13%
9% 8% 11% 11% 8%13%
0%
10%
20%
30%
40%
50%
60%
70%
80%
90%
100%
All Companies (n=313) Local (HK)(n=140)
Chinese Owned (n=24)# HK Based MNC (n=54) MNC(n=84)
Govt / NGO(n=10)#
Increase productivity of > 50% Increase productivity of 20 - 50% Increase productivity of <20% No change
Decrease productivity of <20% Decrease productivity of 20 - 50% Decrease productivity of >50% Not sure / don't know
Base : All companies that implemented WFH (n=313)
Qn. F3. How would you describe the impact of a work-from-home policy on the productivity of your organisation?
No Change/Increased: 41% 40% 45% 49% 40% 13%
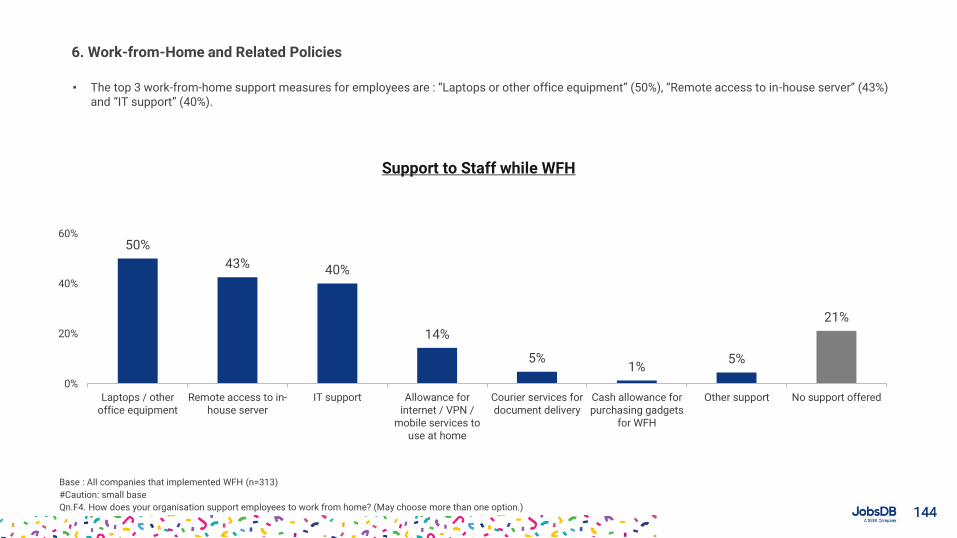
144144
• The top 3 work-from-home support measures for employees are : “Laptops or other office equipment” (50%), “Remote access to in-house server” (43%) and “IT support” (40%).
6. Work-from-Home and Related Policies
Support to Staff while WFH
Base : All companies that implemented WFH (n=313)
#Caution: small base
Qn.F4. How does your organisation support employees to work from home? (May choose more than one option.)
50%
43% 40%
14%
5%1%
5%
21%
0%
20%
40%
60%
Laptops / otheroffice equipment
Remote access to in-house server
IT support Allowance forinternet / VPN /
mobile services touse at home
Courier services fordocument delivery
Cash allowance forpurchasing gadgets
for WFH
Other support No support offered
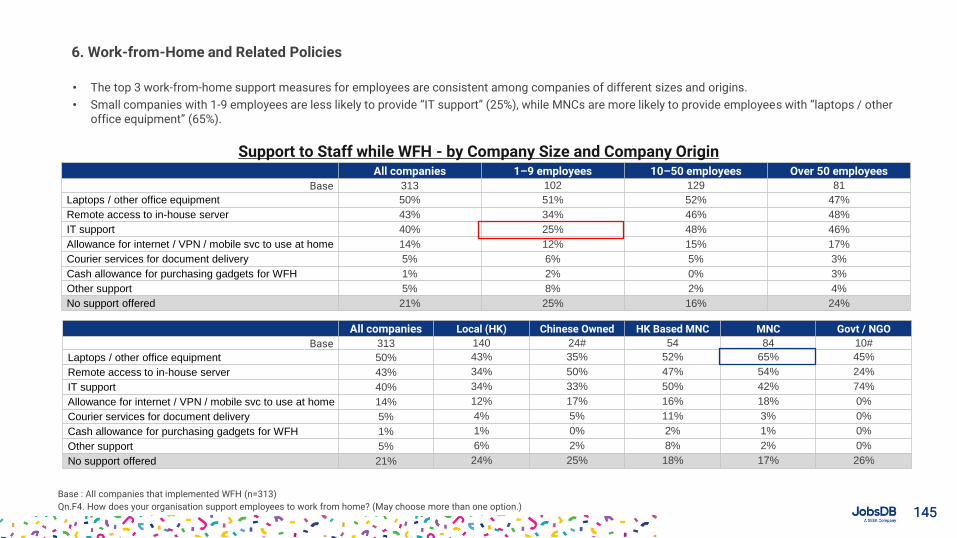
145145
• The top 3 work-from-home support measures for employees are consistent among companies of different sizes and origins.
• Small companies with 1-9 employees are less likely to provide “IT support” (25%), while MNCs are more likely to provide employees with “laptops / other office equipment” (65%).
6. Work-from-Home and Related Policies
Support to Staff while WFH - by Company Size and Company Origin
Base : All companies that implemented WFH (n=313)
Qn.F4. How does your organisation support employees to work from home? (May choose more than one option.)
All companies 1–9 employees 10–50 employees Over 50 employees
Base 313 102 129 81
Laptops / other office equipment 50% 51% 52% 47%
Remote access to in-house server 43% 34% 46% 48%
IT support 40% 25% 48% 46%
Allowance for internet / VPN / mobile svc to use at home 14% 12% 15% 17%
Courier services for document delivery 5% 6% 5% 3%
Cash allowance for purchasing gadgets for WFH 1% 2% 0% 3%
Other support 5% 8% 2% 4%
No support offered 21% 25% 16% 24%
All companies Local (HK) Chinese Owned HK Based MNC MNC Govt / NGO
Base 313 140 24# 54 84 10#
Laptops / other office equipment 50% 43% 35% 52% 65% 45%
Remote access to in-house server 43% 34% 50% 47% 54% 24%
IT support 40% 34% 33% 50% 42% 74%
Allowance for internet / VPN / mobile svc to use at home 14% 12% 17% 16% 18% 0%
Courier services for document delivery 5% 4% 5% 11% 3% 0%
Cash allowance for purchasing gadgets for WFH 1% 1% 0% 2% 1% 0%
Other support 5% 6% 2% 8% 2% 0%
No support offered 21% 24% 25% 18% 17% 26%
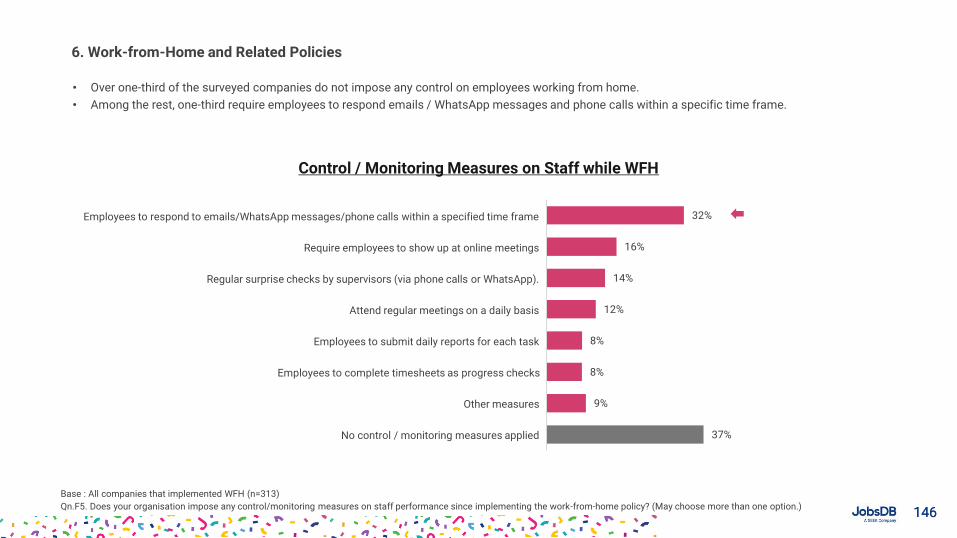
146146
• Over one-third of the surveyed companies do not impose any control on employees working from home.
• Among the rest, one-third require employees to respond emails / WhatsApp messages and phone calls within a specific time frame.
6. Work-from-Home and Related Policies
Control / Monitoring Measures on Staff while WFH
Base : All companies that implemented WFH (n=313)
Qn.F5. Does your organisation impose any control/monitoring measures on staff performance since implementing the work-from-home policy? (May choose more than one option.)
32%
16%
14%
12%
8%
8%
9%
37%
Employees to respond to emails/WhatsApp messages/phone calls within a specified time frame
Require employees to show up at online meetings
Regular surprise checks by supervisors (via phone calls or WhatsApp).
Attend regular meetings on a daily basis
Employees to submit daily reports for each task
Employees to complete timesheets as progress checks
Other measures
No control / monitoring measures applied
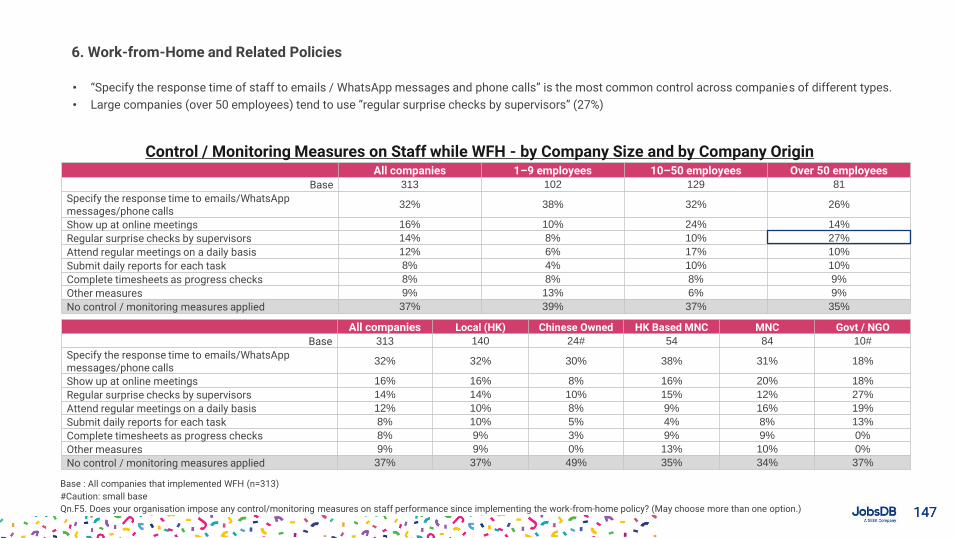
147147
All companies Local (HK) Chinese Owned HK Based MNC MNC Govt / NGO
Base 313 140 24# 54 84 10#
Specify the response time to emails/WhatsApp messages/phone calls
32% 32% 30% 38% 31% 18%
Show up at online meetings 16% 16% 8% 16% 20% 18%
Regular surprise checks by supervisors 14% 14% 10% 15% 12% 27%
Attend regular meetings on a daily basis 12% 10% 8% 9% 16% 19%
Submit daily reports for each task 8% 10% 5% 4% 8% 13%
Complete timesheets as progress checks 8% 9% 3% 9% 9% 0%
Other measures 9% 9% 0% 13% 10% 0%
No control / monitoring measures applied 37% 37% 49% 35% 34% 37%
• “Specify the response time of staff to emails / WhatsApp messages and phone calls” is the most common control across companies of different types.
• Large companies (over 50 employees) tend to use “regular surprise checks by supervisors” (27%)
6. Work-from-Home and Related Policies
Control / Monitoring Measures on Staff while WFH - by Company Size and by Company Origin All companies 1–9 employees 10–50 employees Over 50 employees
Base 313 102 129 81
Specify the response time to emails/WhatsApp messages/phone calls
32% 38% 32% 26%
Show up at online meetings 16% 10% 24% 14%
Regular surprise checks by supervisors 14% 8% 10% 27%
Attend regular meetings on a daily basis 12% 6% 17% 10%
Submit daily reports for each task 8% 4% 10% 10%
Complete timesheets as progress checks 8% 8% 8% 9%
Other measures 9% 13% 6% 9%
No control / monitoring measures applied 37% 39% 37% 35%
Base : All companies that implemented WFH (n=313)
#Caution: small base
Qn.F5. Does your organisation impose any control/monitoring measures on staff performance since implementing the work-from-home policy? (May choose more than one option.)
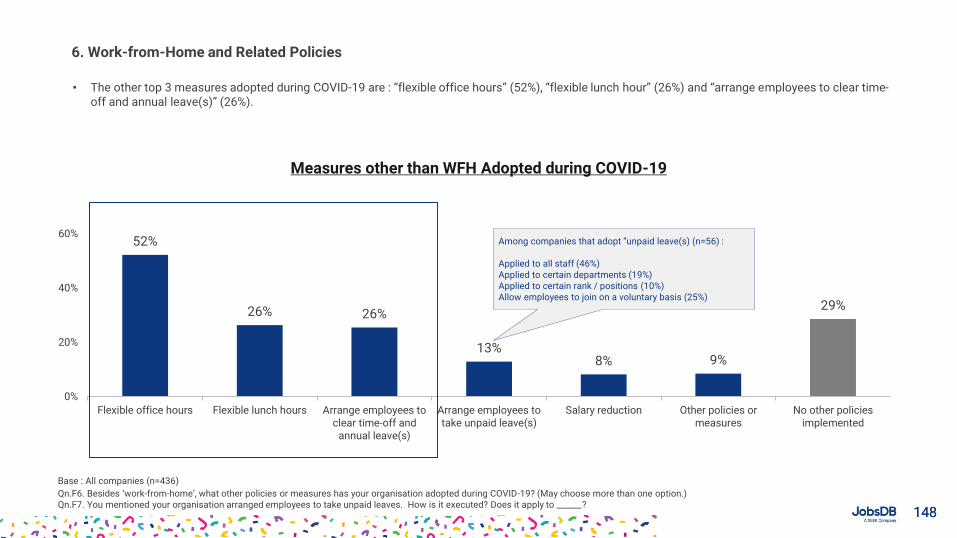
148148
• The other top 3 measures adopted during COVID-19 are : “flexible office hours” (52%), “flexible lunch hour” (26%) and “arrange employees to clear time-off and annual leave(s)” (26%).
6. Work-from-Home and Related Policies
Measures other than WFH Adopted during COVID-19
Base : All companies (n=436)
Qn.F6. Besides ‘work-from-home’, what other policies or measures has your organisation adopted during COVID-19? (May choose more than one option.)Qn.F7. You mentioned your organisation arranged employees to take unpaid leaves. How is it executed? Does it apply to ______?
52%
26% 26%
13%8% 9%
29%
0%
20%
40%
60%
Flexible office hours Flexible lunch hours Arrange employees toclear time-off and
annual leave(s)
Arrange employees totake unpaid leave(s)
Salary reduction Other policies ormeasures
No other policiesimplemented
Among companies that adopt “unpaid leave(s) (n=56) :
Applied to all staff (46%)Applied to certain departments (19%)Applied to certain rank / positions (10%)Allow employees to join on a voluntary basis (25%)
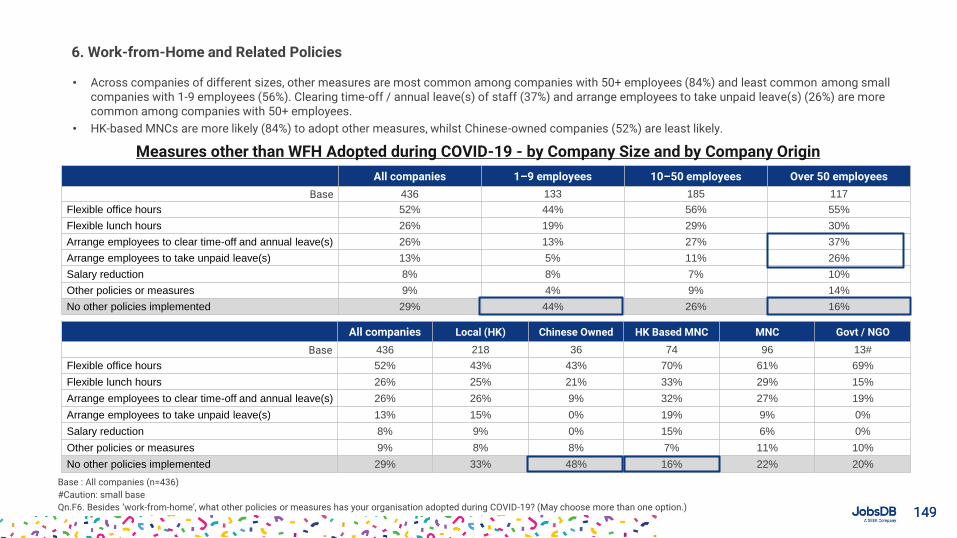
149149
All companies Local (HK) Chinese Owned HK Based MNC MNC Govt / NGO
Base 436 218 36 74 96 13#
Flexible office hours 52% 43% 43% 70% 61% 69%
Flexible lunch hours 26% 25% 21% 33% 29% 15%
Arrange employees to clear time-off and annual leave(s) 26% 26% 9% 32% 27% 19%
Arrange employees to take unpaid leave(s) 13% 15% 0% 19% 9% 0%
Salary reduction 8% 9% 0% 15% 6% 0%
Other policies or measures 9% 8% 8% 7% 11% 10%
No other policies implemented 29% 33% 48% 16% 22% 20%
• Across companies of different sizes, other measures are most common among companies with 50+ employees (84%) and least common among small companies with 1-9 employees (56%). Clearing time-off / annual leave(s) of staff (37%) and arrange employees to take unpaid leave(s) (26%) are more common among companies with 50+ employees.
• HK-based MNCs are more likely (84%) to adopt other measures, whilst Chinese-owned companies (52%) are least likely.
6. Work-from-Home and Related Policies
Measures other than WFH Adopted during COVID-19 - by Company Size and by Company Origin
All companies 1–9 employees 10–50 employees Over 50 employees
Base 436 133 185 117
Flexible office hours 52% 44% 56% 55%
Flexible lunch hours 26% 19% 29% 30%
Arrange employees to clear time-off and annual leave(s) 26% 13% 27% 37%
Arrange employees to take unpaid leave(s) 13% 5% 11% 26%
Salary reduction 8% 8% 7% 10%
Other policies or measures 9% 4% 9% 14%
No other policies implemented 29% 44% 26% 16%
Base : All companies (n=436)
#Caution: small base
Qn.F6. Besides ‘work-from-home’, what other policies or measures has your organisation adopted during COVID-19? (May choose more than one option.)
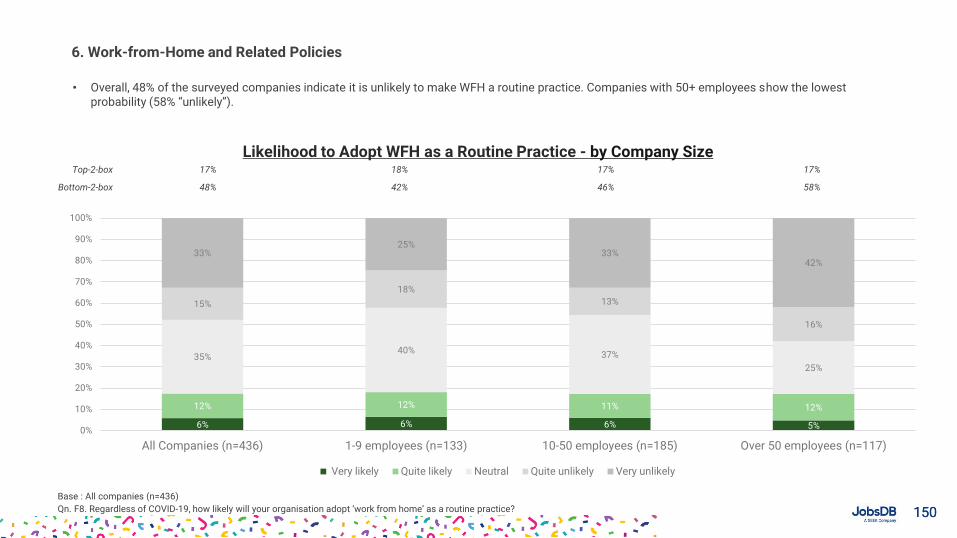
150150
• Overall, 48% of the surveyed companies indicate it is unlikely to make WFH a routine practice. Companies with 50+ employees show the lowest probability (58% “unlikely”).
6. Work-from-Home and Related Policies
Likelihood to Adopt WFH as a Routine Practice - by Company Size
6% 6% 6% 5%
12% 12% 11% 12%
35%40% 37%
25%
15%
18%
13%
16%
33%25%
33%42%
0%
10%
20%
30%
40%
50%
60%
70%
80%
90%
100%
All Companies (n=436) 1-9 employees (n=133) 10-50 employees (n=185) Over 50 employees (n=117)
Very likely Quite likely Neutral Quite unlikely Very unlikely
Base : All companies (n=436)
Qn. F8. Regardless of COVID-19, how likely will your organisation adopt ‘work from home’ as a routine practice?
Top-2-box 17% 18% 17% 17%
Bottom-2-box 48% 42% 46% 58%
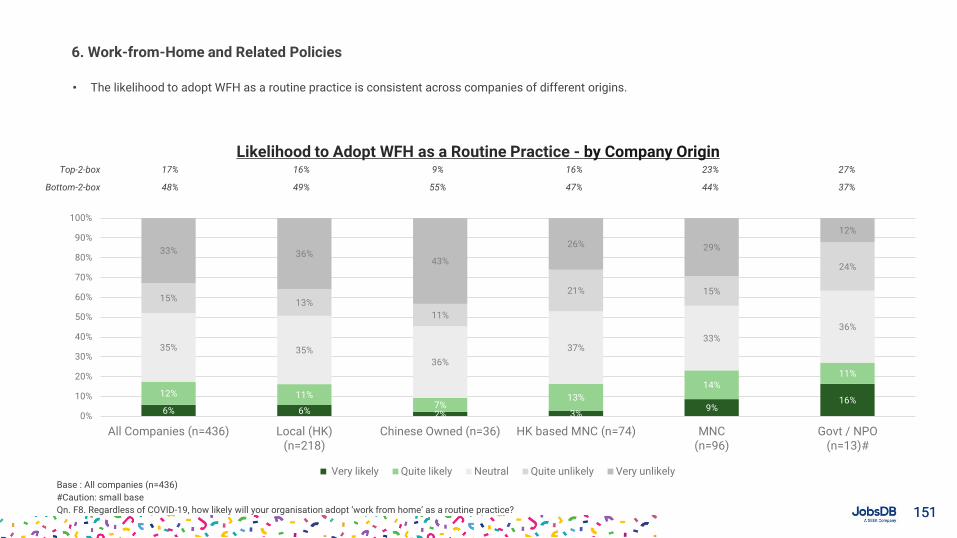
151151
• The likelihood to adopt WFH as a routine practice is consistent across companies of different origins.
6. Work-from-Home and Related Policies
Likelihood to Adopt WFH as a Routine Practice - by Company Origin
6% 6% 2% 3%9%
16%12% 11%
7%13%
14%11%
35% 35%
36%
37%33%
36%
15% 13%
11%
21% 15%
24%
33% 36%43%
26% 29%
12%
0%
10%
20%
30%
40%
50%
60%
70%
80%
90%
100%
All Companies (n=436) Local (HK)(n=218)
Chinese Owned (n=36) HK based MNC (n=74) MNC(n=96)
Govt / NPO(n=13)#
Very likely Quite likely Neutral Quite unlikely Very unlikelyBase : All companies (n=436)
#Caution: small base
Qn. F8. Regardless of COVID-19, how likely will your organisation adopt ‘work from home’ as a routine practice?
Top-2-box 17% 16% 9% 16% 23% 27%
Bottom-2-box 48% 49% 55% 47% 44% 37%
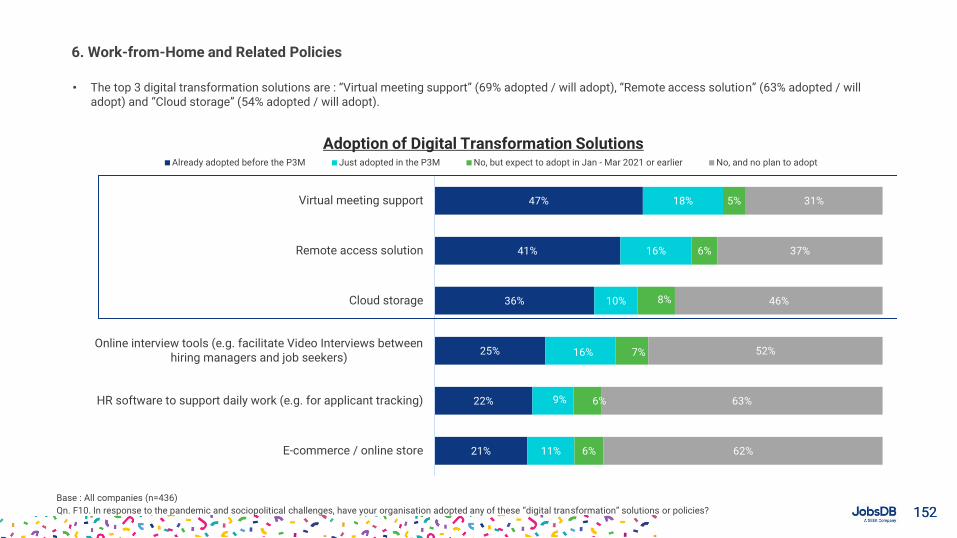
152152
• The top 3 digital transformation solutions are : “Virtual meeting support” (69% adopted / will adopt), “Remote access solution” (63% adopted / will adopt) and “Cloud storage” (54% adopted / will adopt).
6. Work-from-Home and Related Policies
Adoption of Digital Transformation Solutions
Base : All companies (n=436)
Qn. F10. In response to the pandemic and sociopolitical challenges, have your organisation adopted any of these “digital transformation” solutions or policies?
47%
41%
36%
25%
22%
21%
18%
16%
10%
16%
9%
11%
5%
6%
8%
7%
6%
6%
31%
37%
46%
52%
63%
62%
Virtual meeting support
Remote access solution
Cloud storage
Online interview tools (e.g. facilitate Video Interviews betweenhiring managers and job seekers)
HR software to support daily work (e.g. for applicant tracking)
E-commerce / online store
Already adopted before the P3M Just adopted in the P3M No, but expect to adopt in Jan - Mar 2021 or earlier No, and no plan to adopt
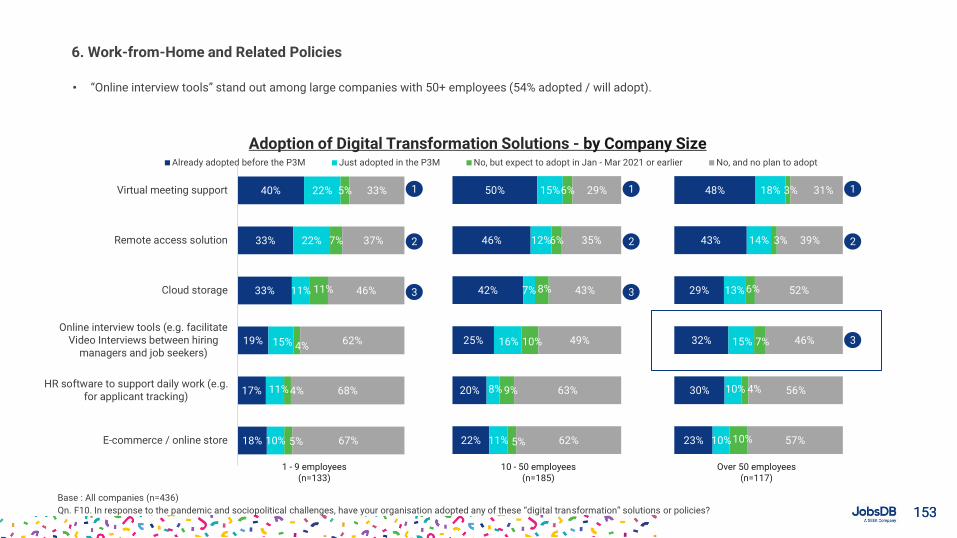
153153
0%0%0%0%
Already adopted before the P3M Just adopted in the P3M No, but expect to adopt in Jan - Mar 2021 or earlier No, and no plan to adopt
• “Online interview tools” stand out among large companies with 50+ employees (54% adopted / will adopt).
6. Work-from-Home and Related Policies
Base : All companies (n=436)
Qn. F10. In response to the pandemic and sociopolitical challenges, have your organisation adopted any of these “digital transformation” solutions or policies?
50%
46%
42%
25%
20%
22%
15%
12%
7%
16%
8%
11%
6%
6%
8%
10%
9%
5%
29%
35%
43%
49%
63%
62%
40%
33%
33%
19%
17%
18%
22%
22%
11%
15%
11%
10%
5%
7%
11%
4%
4%
5%
33%
37%
46%
62%
68%
67%
Virtual meeting support
Remote access solution
Cloud storage
Online interview tools (e.g. facilitateVideo Interviews between hiring
managers and job seekers)
HR software to support daily work (e.g.for applicant tracking)
E-commerce / online store
48%
43%
29%
32%
30%
23%
18%
14%
13%
15%
10%
10%
3%
3%
6%
7%
4%
10%
31%
39%
52%
46%
56%
57%
1 - 9 employees (n=133)
10 - 50 employees (n=185)
Over 50 employees (n=117)
1
2
3
1
2
3
1
2
3
Adoption of Digital Transformation Solutions - by Company Size
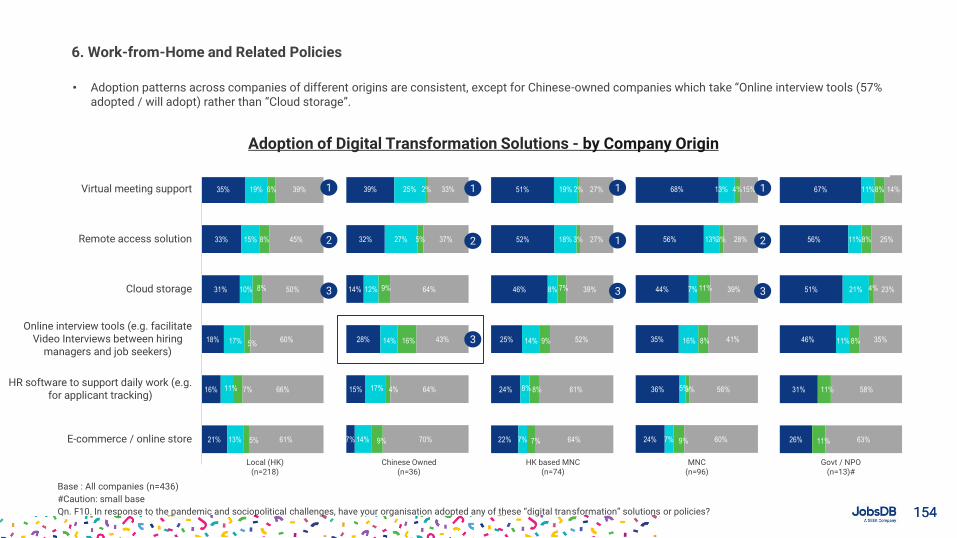
154154
67%
56%
51%
46%
31%
26%
11%
11%
21%
11%
8%
8%
4%
8%
11%
11%
14%
25%
23%
35%
58%
63%
0%0%0%0%
Already adopted before the P3M Just adopted in the P3M No, but expect to adopt in Jan - Mar 2021 or earlier No, and no plan to adopt
35%
33%
31%
18%
16%
21%
19%
15%
10%
17%
11%
13%
6%
8%
8%
5%
7%
5%
39%
45%
50%
60%
66%
61%
Virtual meeting support
Remote access solution
Cloud storage
Online interview tools (e.g. facilitateVideo Interviews between hiring
managers and job seekers)
HR software to support daily work (e.g.for applicant tracking)
E-commerce / online store
• Adoption patterns across companies of different origins are consistent, except for Chinese-owned companies which take “Online interview tools (57% adopted / will adopt) rather than “Cloud storage”.
6. Work-from-Home and Related Policies
Base : All companies (n=436)
#Caution: small base
Qn. F10. In response to the pandemic and sociopolitical challenges, have your organisation adopted any of these “digital transformation” solutions or policies?
39%
32%
14%
28%
15%
7%
25%
27%
12%
14%
17%
14%
2%
5%
9%
16%
4%
9%
33%
37%
64%
43%
64%
70%
51%
52%
46%
25%
24%
22%
19%
18%
8%
14%
8%
7%
2%
3%
7%
9%
8%
7%
27%
27%
39%
52%
61%
64%
68%
56%
44%
35%
36%
24%
13%
13%
7%
16%
5%
7%
4%
3%
11%
8%
3%
9%
15%
28%
39%
41%
56%
60%
Local (HK) (n=218)
Chinese Owned (n=36)
HK based MNC (n=74)
MNC (n=96)
Govt / NPO (n=13)#
1
2
3
1
2
3
1
1
3
1
2
3
Adoption of Digital Transformation Solutions - by Company Origin
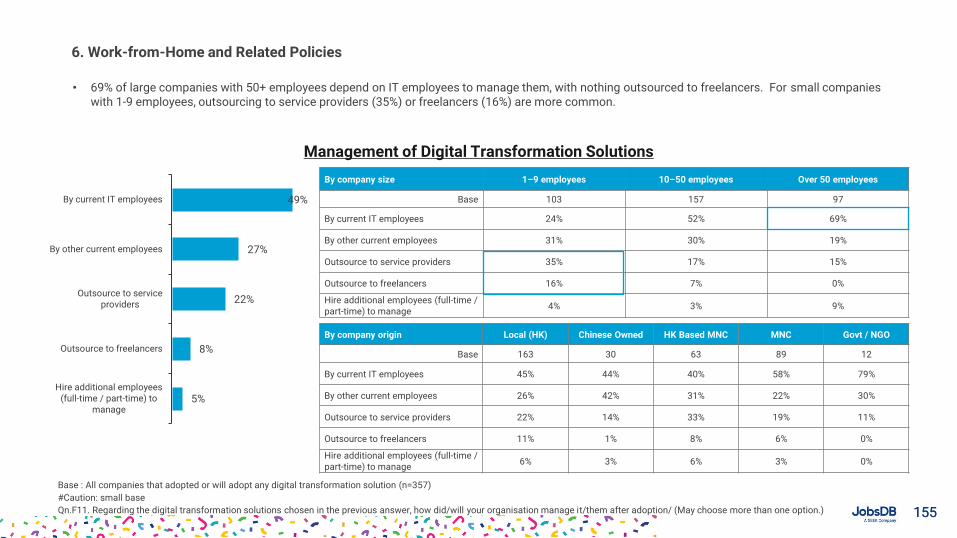
155155
• 69% of large companies with 50+ employees depend on IT employees to manage them, with nothing outsourced to freelancers. For small companies with 1-9 employees, outsourcing to service providers (35%) or freelancers (16%) are more common.
6. Work-from-Home and Related Policies
Management of Digital Transformation Solutions
Base : All companies that adopted or will adopt any digital transformation solution (n=357)
#Caution: small base
Qn.F11. Regarding the digital transformation solutions chosen in the previous answer, how did/will your organisation manage it/them after adoption/ (May choose more than one option.)
By company size 1–9 employees 10–50 employees Over 50 employees
Base 103 157 97
By current IT employees 24% 52% 69%
By other current employees 31% 30% 19%
Outsource to service providers 35% 17% 15%
Outsource to freelancers 16% 7% 0%
Hire additional employees (full-time / part-time) to manage
4% 3% 9%
5%
8%
22%
27%
49%
Hire additional employees(full-time / part-time) to
manage
Outsource to freelancers
Outsource to serviceproviders
By other current employees
By current IT employees
By company origin Local (HK) Chinese Owned HK Based MNC MNC Govt / NGO
Base 163 30 63 89 12
By current IT employees 45% 44% 40% 58% 79%
By other current employees 26% 42% 31% 22% 30%
Outsource to service providers 22% 14% 33% 19% 11%
Outsource to freelancers 11% 1% 8% 6% 0%
Hire additional employees (full-time / part-time) to manage
6% 3% 6% 3% 0%
If you have any questions, please don’t hesitate to get in touch with us at [email protected]


![Compensation & Benefits[1]](https://img.pdfslide.us/doc/110x75/577d369f1a28ab3a6b938bc4/compensation-benefits1.jpg)