Embed Size (px)
Citation preview

HIRDLS Validation Status(v2.04.09)
B. Nardi, J. Gille & HIRDLS Team
AURA, Science MeetingPasadena, Oct 1-5, 2007

Overview
Temperature validation
Ozone validation
Nitric Acid validation
Cloud counting/height validation
Summary

Temperature

MLO[19.5oN, 156oW]
TMF[34.5oN, 118oW]
Temperature Lidar Profile Comparisons
1 km 1 km

Temperature Lidar comparisons – Statistical Differences
Mauna Loa Observatory [19.5oN, 156oW] Table Mountain Facility [34.5oN, 118oW]
Coincidence = 560 km, 12 hrs

Mean difference, HIRDLS-COSMIC, for the Double COSMIC+HIRDLS coincidences. The solid line gives the difference, the outer dashed lines give the difference +/- the standard deviation of comparisons about the mean, and the inner dashed lines give the 1 standard deviation error bars of the mean.
Mean DifferencesTemperature comparison with COSMIC/GPS, on small vertical distance scales.
COINCIDENCE: Profiles were required to be within 0.75º great circle and 500 sec of each other, giving 888 pairs.HIRDLS and COSMIC profiles were separately smoothed using a cosine bell filter of 2.8 km full width at half height (high pass filtered). The deviations from these profiles were then intercorrelated over the range 2.0 to 4.75 pressure scale height.
J.J. BarnettThe FORMOSAT-3/COSMIC constellation of six satellites, launched 14 April 2006, carries GPS receivers. Resolution = 1 km.

Individual Profiles
Gille et al, 2007
Sonde Temperature Comparisons
Statistical Differences
-2 2 -2 2
Pre
ssur
e (h
Pa)
Pre
ssur
e (h
Pa)
Temperature (K) Temperature (K)-2 2-2 2

Cora Randall
Temperature Comparison with ACE-FTS
Average temperature differences (solid, HIRDLS-ACE) and standard deviation (dashed).
Gille et al, 2007
Predicted: L2 retrieved parameter, f(radiance error, a priori error, Jacobians)Observed: Standard Deviation of differences at orbit-crossover.
Temperature: Estimated Precision
Empirically determined precision for HIRDLS determined from differences of paired profiles (dashed line) at latitude cross-over points at 80°N for 2 days in March and 2 days in September, compared total precision calculated by the retrieval code (solid line). The total variation of the GMAO and HIRDLS data for those situations are also shown.

Ozone

1 km
MLO[19.5oN, 156oW]
TMF[34.5oN, 118oW]
OZONE Lidar Profile Comparisons
1 km

1 km
1 km
1 km
OZONESONDE Profile Comparisons

OZONE Lidar comparisons – Statistical Differences
Mauna Loa Observatory [19.5oN, 156oW] Table Mountain Facility [34.5oN, 118oW]

OZONESONDE Comparisons – Statistical Differences

Ozone: INTEX-B AROTAL Lidar

V. Lynn Harvey
Anticycloneborder
HIRDLSv2.04.09
MLSv2.2
Polar Vortexborder
Ozone
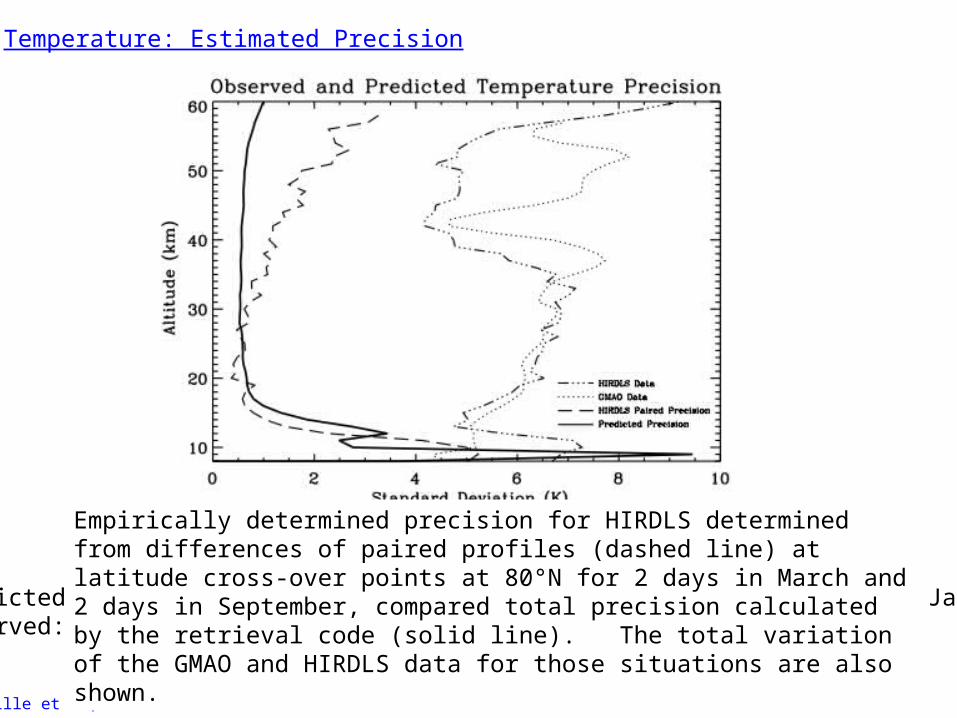
Shown is the ozone standard deviation in different equivalent latitude and potential temperature bins, an estimate of HIRDLS ozone precision. Results are given, in terms of percentage of mean, VMR for two days: 2006 June 20 (LEFT) and 2006 December 22 (RIGHT). In the bottom plots, the black lines highlight the 10% contour and the white lines highlight the 100% contour.
Cora Randall
Ozone Estimated Precision
DecemberJune
~50 km, ~1 hPa --
~15 km, ~120hPa --

Nitric Acid

HNO3: ACE-FTS comparisons
Cora Randall
NH
SH
ΔVMR %Difference

Percent Difference [10o zonal mean]MLS v2.2: Mean Percent Difference
Cora Randall
Solid = Mean differenceDashed = Std Dev of Difference
ST23 only = current Scan Table (since May 2006)
Over 278,000 coincidences within 1 latitude and 4 longitude. Theoretical precision criteria of 30% used.

Kinnison et al, 2007
Airborne profile comparisons - Houston AVE [June 2005]
HIRDLS (red) NOAA CIMS (blue)
For this flight, HIRDLS HNO3 is broadly consistent with the NOAA CIMS instrument in the 100 hPa - 75 hPa region. Below this region, HNO3 filaments as measured by CIMS are not captured. The reason for this is currently not understood.
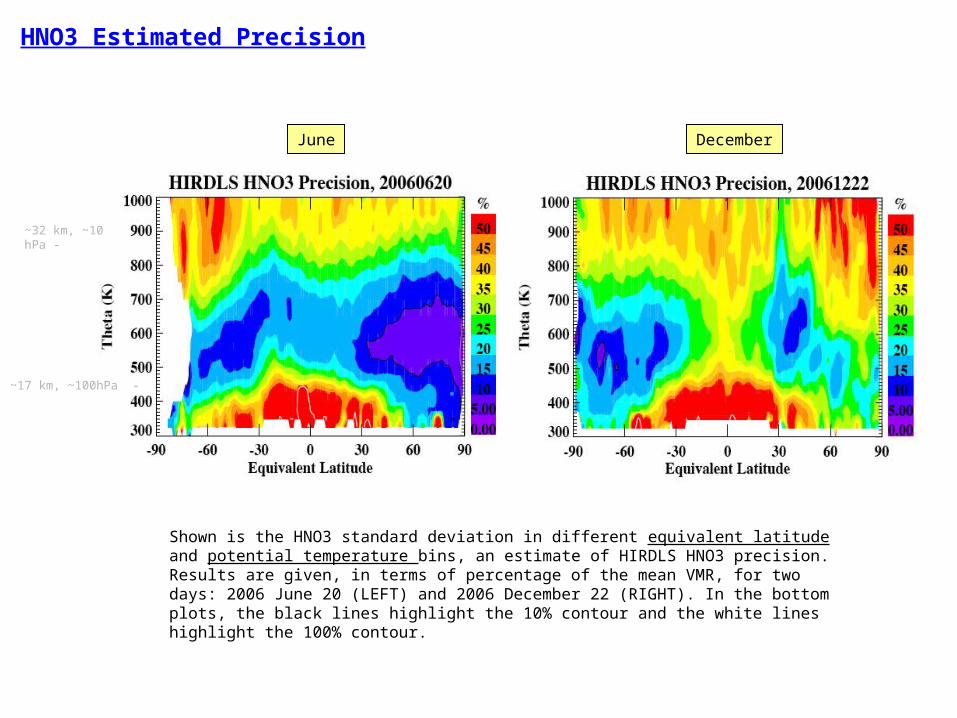
Shown is the HNO3 standard deviation in different equivalent latitude and potential temperature bins, an estimate of HIRDLS HNO3 precision. Results are given, in terms of percentage of the mean VMR, for two days: 2006 June 20 (LEFT) and 2006 December 22 (RIGHT). In the bottom plots, the black lines highlight the 10% contour and the white lines highlight the 100% contour.
DecemberJune
HNO3 Estimated Precision
~32 km, ~10 hPa -
~17 km, ~100hPa -
Clouds

Cirrus Layer Extinction Profile
S. Massie
Tropical Cirrus Layer
700 %Radiance
Perturbation
Detection of Sub-Visual Cirrus Layer (12 µm, channel #6)

Cloud Top Pressure Determinations
0
5
10
15
20
25
30
35
50 100 150 200 250 300 350
Tropics
HIRDLS HALOE
No
rmal
ized
Dis
trib
uti
on
Cloud Top Pressure (hPa)
a
0
5
10
15
20
25
30
50 100 150 200 250 300 350
Mid-latitudes
HIRDLS HALOE
No
rmal
ized
Dis
trib
uti
on
Cloud Top Pressure (hPa)
b
10
100
1000
10000
100000
50 100 150 200 250 300 350
Tropics
HIRDLS HALOE
Nu
mb
er o
f O
bse
rvat
ion
s
Cloud Top Pressure (hPa)
c1
10
100
1000
10000
100000
50 100 150 200 250 300 350
MId-latitudes
HIRDLS HALOE
Nu
mb
er o
f O
bse
rvat
ion
s
Cloud Top Pressure (hPa)
d
S. Massie
Compare the cloud counting capability of the HIRDLS with HALOE.

Cirrus Frequency of Occurrence
S. Massie
Derived from Multi-spectral Extinction (all clouds)
Derived from Radiance-based cloud detectionalgorithm. (types 1,2)
Longitude
Latit
ude
Latit
ude

Seasonal Variations of Cirrus Layers
S. Massie
CALIPSO HIRDLS
WinterNH
SpringNH
SummerNH
FallNH

Summary of quality of validation products
Temperature:P-Range: 1-300 hPaPrecision: 0.5K at 10-100 hPa; 1K @ 1 hPa (v2.02.07)Accuracy: ±2K at 1-100 hPa
Ozone:Range: 1-100+ hPa (mid-high Lat), 1-50 hPa (tropics) Precision: 5-10% Accuracy: 2-10% at 1-10 hPa; biased generally low
5% high bias ~10-30 hPa0-20% low bias, ~30-100+ hPa (mid & high latitudes)
Nitric Acid:Range: 10-100 hPa, 10-50 hPa (tropics) Precision: 10-35% at 100-10hPaAccuracy: ~10% (at 10hPa) to 30% (at 100hPa); biased low [ACE-FTS]
Clouds/Aerosol:Range: 400 hPa- 10 hPaCorrelation with other instruments:
SAGE & HALOE (cloud-top pressure): 0.85 - .93CALIPSO horizontal cloud scale: 0.99
Extinction retrieval successful at rate 70%: needs improvement
Vertical Resolution: 1-2 km (See posters, Wednesday)

Status of HIRDLS data products
1. Temperature, Ozone, HNO3, clouds – Released [v2.04.09]
2. H2O, CFC-11, CFC-12 – Not ready to release; now most promising for future releases
3. CH4, NO2, N2O, ClONO2, N2O5 – Not ready to release.

List of Validation & related publications
• Alexander et al, Global Gravity Wave Momentum Flux, JGR, In Review. • Coffey et al, Ozone observations during the Polar Aura Validation Experiment (PAVE)
in support of EOS Aura validation, JGR, In Review. • Coffey et al, Airborne Fourier transform spectrometer (FTS) observations
in support of EOS Aura validation, JGR, In Review.• Gille et al, The High Resolution Dynamics Limb Sounder (HIRDLS): Experiment Overview,
Results and Validation Of Initial Temperature Data, JGR, In Review. • Kinnison et al, Global Observations of HNO3 from the High Resolution Dynamics Limb
Sounder (HIRDLS) – First results, JGR, In Review.• Massie et al, HIRDLS Observations of Clouds, JGR, Accepted. • Nardi et al, Validation of HIRDLS Ozone Measurements, JGR, In Review.
Other relevant HIRDLS publicationsKhosravi et. al. (2007) Retrieval Algorithm and Characterization for the High Resolution Dynamics Limb Sounder
(HIRDLS), in preparation for submission to IEEE Trans. Geosci. Remote Sens.Eden, T., J.J. Barnett, J.C. Gille, C.L. Hepplewhite, C.W.P. Palmer, J.G. Whitney (2007), Spectral
Characterization of the HIRDLS Flight Instrument from Pre-launch Calibration Data, in preparation.Barnett, J.J., J.N. Bracken, K. Djotni, C.L. Hepplewhite, J.L. Moorhouse, O.O. Oduleye, C.W.P. Palmer, D.M.
Peters, L.A. Rokke, T.W. Walton, R.E.J. Watkins, J.G. Whitney, J.C. Gille, P.I. Arter, T.D. Eden, B. Nardi (2003), Pre-launch calibration of the NASA AURA HIRDLS instrument, Proc. SPIE 5152, 172-180.
Gille, J.C., J.J. Barnett, J.C. Whitney, M.A. Dials, D.M. Woodard, W. Rudolf, A. Lambert, W. Mankin (2003), The High Resolution Dynamics Limb Sounder (HIRDLS) Experiment on Aura, Proc. SPIE 5152, 162-171.
Hepplewhite, C.L., J.J. Barnett, J.C. Whitney, C.W.P. Palmer, O.O. Oduleye, T. Walton, M.A. Dials, J.C. Gille, T. Eden, B. Nardi (2005), HIRDLS Functional Performance in Orbit – A summary, Proc. SPIE 5883, J1-10.
Moorhouse, J.L., J.J. Barnett, K. Djotni, C.L. Hepplewhite, C.W. P. Palmer, O.O. Oduleye, T. Walton, R.E.J. Waktins, J.G. Whitney, J.C. Gille, P. Arter, B. Nardi (2003), HIRDLS field of view calibration techniques and results, Proc. SPIE, 5152, 193-203.


Cora Randall
Ozone Comparison with ACE-FTS
NH
SH
ΔVMR %Difference

V. Lynn Harvey
Comparisons with MLS v2.2 Ozone on pressure surfaces [Mercator]
1 hPa 3 hPa
51 hPa 100 hPa
O3 Percent Diff (%) O3 Percent Diff (%)
31 hPa10 hPa
Comparisons with MLS v2.2 Ozone [Zonal Mean]
2006Jul 2006Oct
2006Feb 2006May
O3 Percent Diff (%)O3 Percent Diff (%)
Ozone


![HIRDLS Ozone [ v2.04.19 ] - Accuracy As A Function Of Latitude](https://img.pdfslide.us/doc/110x75/5681572a550346895dc4c3cd/hirdls-ozone-v20419-accuracy-as-a-function-of-latitude.jpg)