Embed Size (px)
Citation preview
Hin
od
e /
EIS
Hin
od
e /
EIS
Solar 24, Dec 2008Solar 24, Dec 2008 Dr Peter Young, NRL/GMUDr Peter Young, NRL/GMU
Active Region Diagnostics with EISActive Region Diagnostics with EIS
Dr Peter YoungDr Peter YoungNaval Research LaboratoryNaval Research Laboratory
George Mason UniversityGeorge Mason University
Hin
od
e /
EIS
Hin
od
e /
EIS
Solar 24, Dec 2008Solar 24, Dec 2008 Dr Peter Young, NRL/GMUDr Peter Young, NRL/GMU
OutlineOutline
• VelocityVelocity• Line widthsLine widths• TemperatureTemperature• DensityDensity• Fe XII photometryFe XII photometry
Hin
od
e /
EIS
Hin
od
e /
EIS
Solar 24, Dec 2008Solar 24, Dec 2008 Dr Peter Young, NRL/GMUDr Peter Young, NRL/GMU
Gaussian fittingGaussian fitting
• Single Gaussians can be fit to EIS emission lines using routine Single Gaussians can be fit to EIS emission lines using routine eis_auto_fit.proeis_auto_fit.pro
• Check out tutorial at:Check out tutorial at:
• A multiple-Gaussian fitting is also available: eis_auto_fit_gen.proA multiple-Gaussian fitting is also available: eis_auto_fit_gen.pro
http://solar.bnsc.rl.ac.uk/~young/solarb_eis/paris_tutorial/
Hin
od
e /
EIS
Hin
od
e /
EIS
Solar 24, Dec 2008Solar 24, Dec 2008 Dr Peter Young, NRL/GMUDr Peter Young, NRL/GMU
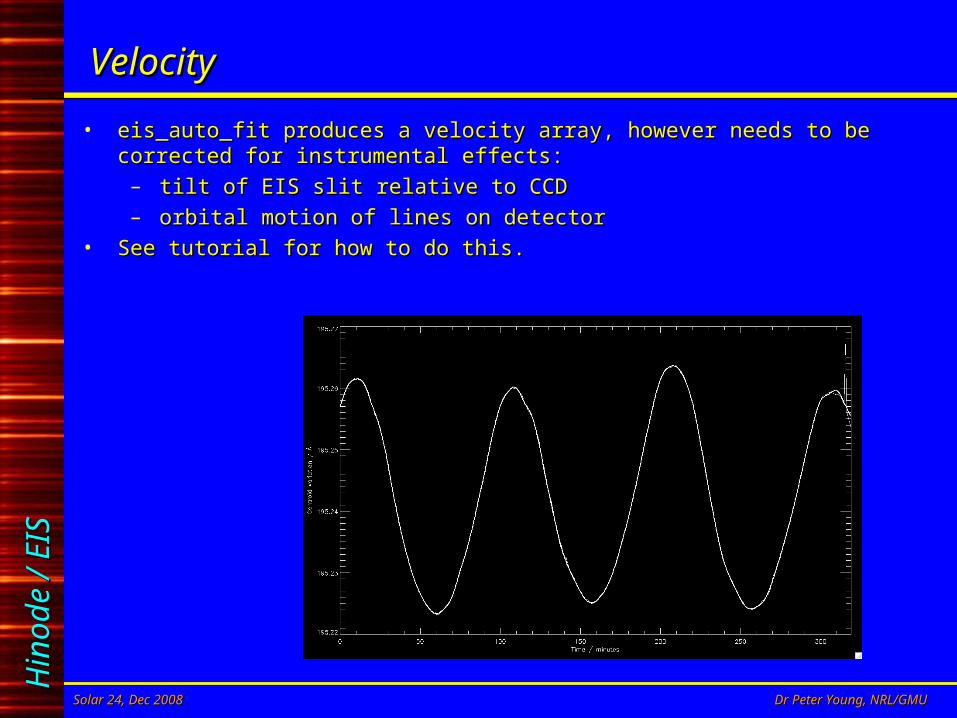
VelocityVelocity
• eis_auto_fit produces a velocity array, however needs to be corrected eis_auto_fit produces a velocity array, however needs to be corrected for instrumental effects:for instrumental effects:– tilt of EIS slit relative to CCDtilt of EIS slit relative to CCD– orbital motion of lines on detectororbital motion of lines on detector
• See tutorial for how to do this.See tutorial for how to do this.
Hin
od
e /
EIS
Hin
od
e /
EIS
Solar 24, Dec 2008Solar 24, Dec 2008 Dr Peter Young, NRL/GMUDr Peter Young, NRL/GMU
Line widthLine width
• eis_auto_fit produces line width array, but includes instrumental widtheis_auto_fit produces line width array, but includes instrumental width• Instrumental width:Instrumental width:
– around 55 mÅaround 55 mÅ– varies along slit by 2-3 mÅvaries along slit by 2-3 mÅ
• No software exists for correcting instrumental widthNo software exists for correcting instrumental width
Hin
od
e /
EIS
Hin
od
e /
EIS
Solar 24, Dec 2008Solar 24, Dec 2008 Dr Peter Young, NRL/GMUDr Peter Young, NRL/GMU
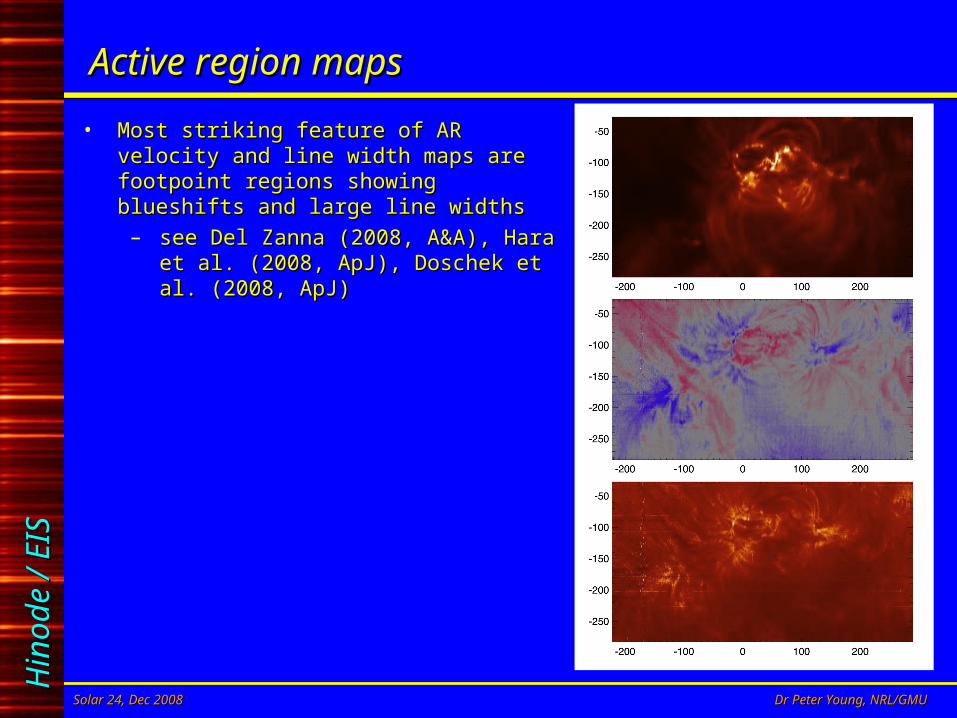
Active region mapsActive region maps
• Most striking feature of AR velocity and Most striking feature of AR velocity and line width maps are footpoint regions line width maps are footpoint regions showing blueshifts and large line widthsshowing blueshifts and large line widths– see Del Zanna (2008, A&A), Hara et see Del Zanna (2008, A&A), Hara et
al. (2008, ApJ), Doschek et al. (2008, al. (2008, ApJ), Doschek et al. (2008, ApJ)ApJ)
Hin
od
e /
EIS
Hin
od
e /
EIS
Solar 24, Dec 2008Solar 24, Dec 2008 Dr Peter Young, NRL/GMUDr Peter Young, NRL/GMU
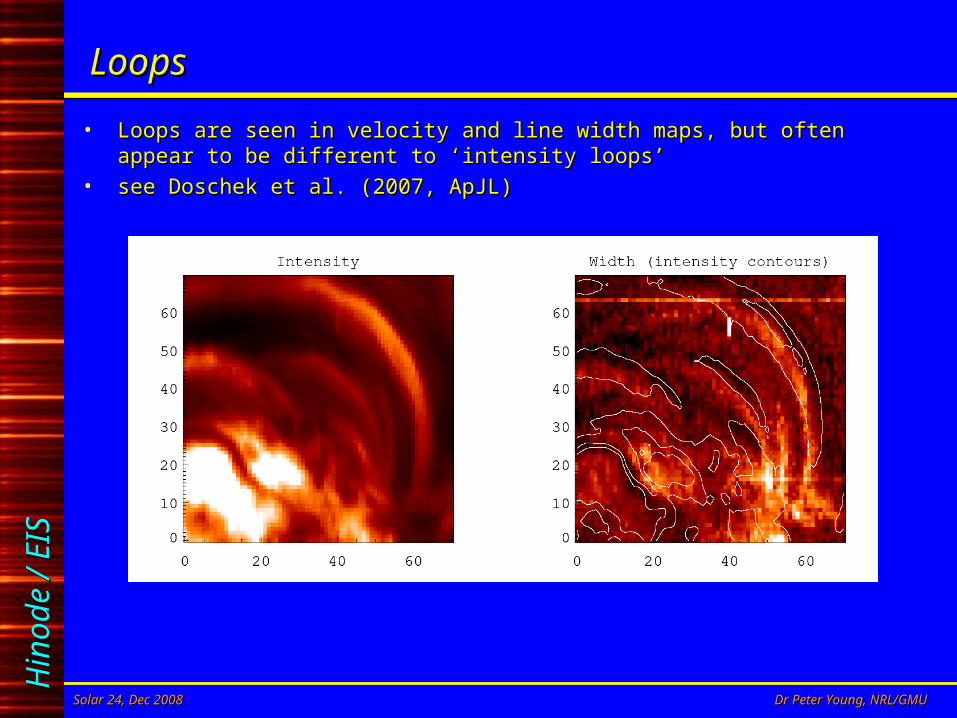
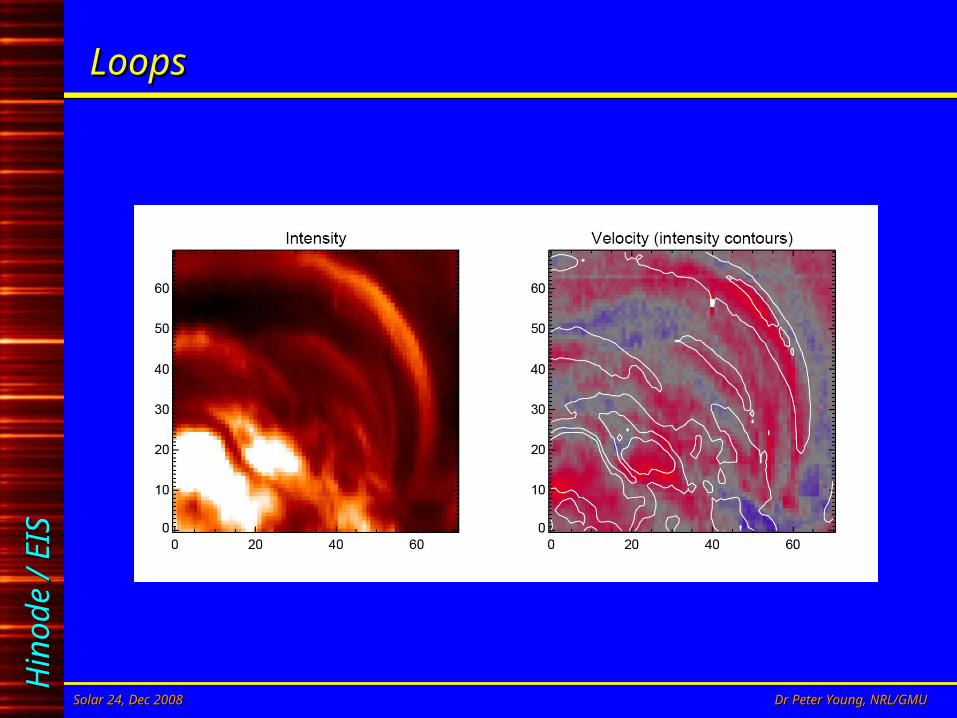
LoopsLoops
• Loops are seen in velocity and line width maps, but often appear to be Loops are seen in velocity and line width maps, but often appear to be different to ‘intensity loops’different to ‘intensity loops’
• see Doschek et al. (2007, ApJL)see Doschek et al. (2007, ApJL)
Hin
od
e /
EIS
Hin
od
e /
EIS
Solar 24, Dec 2008Solar 24, Dec 2008 Dr Peter Young, NRL/GMUDr Peter Young, NRL/GMU
LoopsLoops
Hin
od
e /
EIS
Hin
od
e /
EIS
Solar 24, Dec 2008Solar 24, Dec 2008 Dr Peter Young, NRL/GMUDr Peter Young, NRL/GMU
Temperature diagnosticsTemperature diagnostics
• Temperature is diagnosed through observing different ionization Temperature is diagnosed through observing different ionization stages on an elementstages on an element
• Most useful element is ironMost useful element is iron• For coronal loop work, we have complete range from stage VII (log For coronal loop work, we have complete range from stage VII (log
TT=5.6) to stage XVII (log =5.6) to stage XVII (log TT=6.5)=6.5)
Hin
od
e /
EIS
Hin
od
e /
EIS
Solar 24, Dec 2008Solar 24, Dec 2008 Dr Peter Young, NRL/GMUDr Peter Young, NRL/GMU
New Fe IX linesNew Fe IX lines
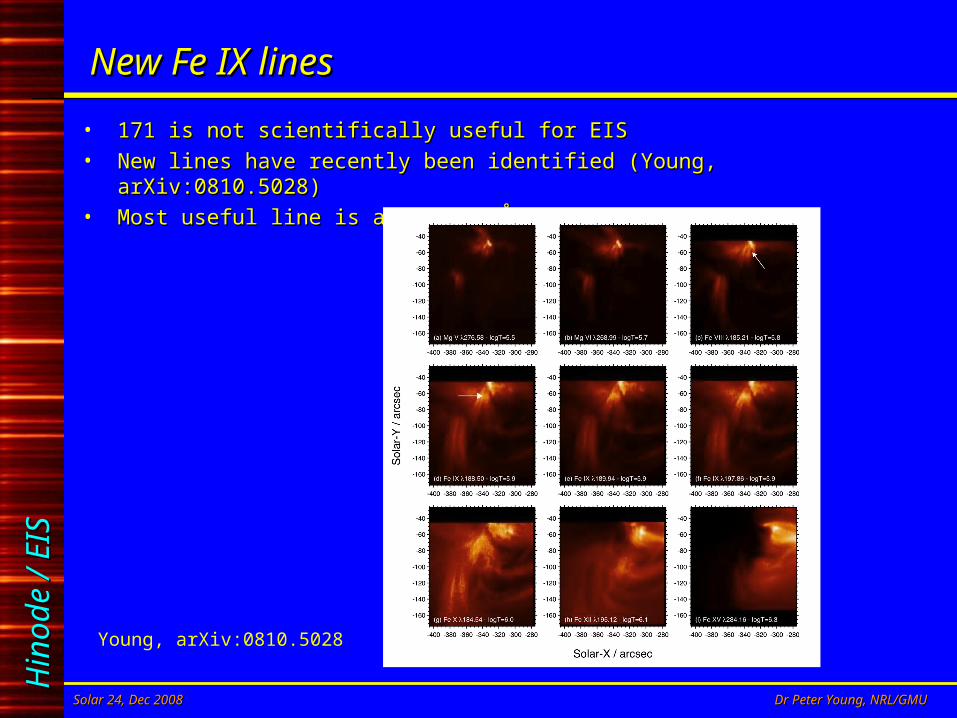
• 171 is not scientifically useful for EIS171 is not scientifically useful for EIS• New lines have recently been identified (Young, arXiv:0810.5028)New lines have recently been identified (Young, arXiv:0810.5028)• Most useful line is at 197.86 Å (unblended)Most useful line is at 197.86 Å (unblended)
Young, arXiv:0810.5028
Hin
od
e /
EIS
Hin
od
e /
EIS
Solar 24, Dec 2008Solar 24, Dec 2008 Dr Peter Young, NRL/GMUDr Peter Young, NRL/GMU
Fe VII – a ‘new’ ion for EISFe VII – a ‘new’ ion for EIS
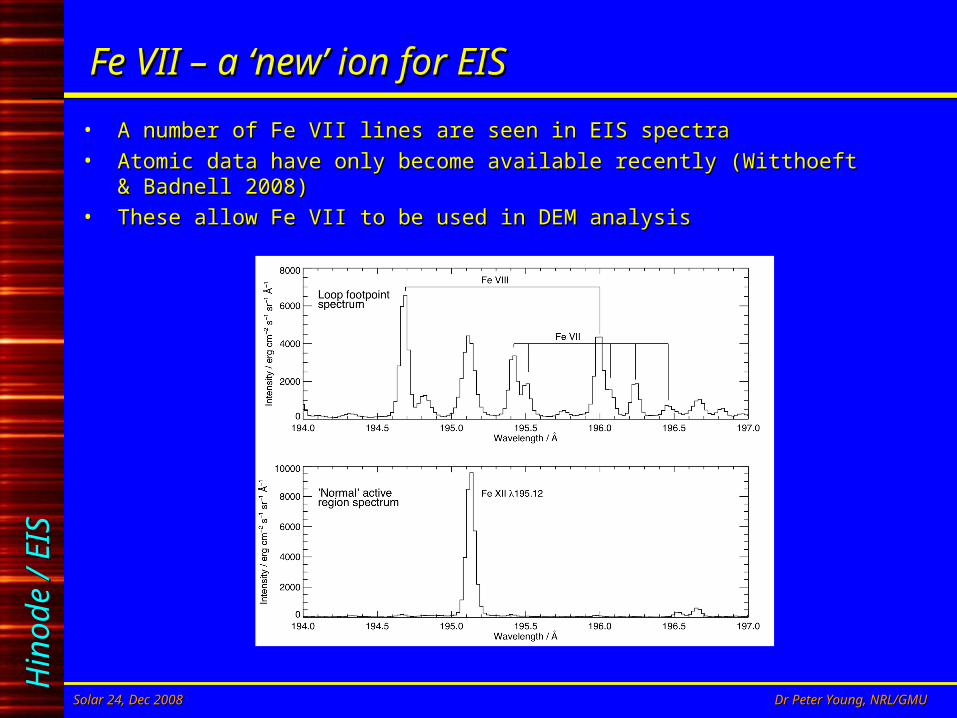
• A number of Fe VII lines are seen in EIS spectraA number of Fe VII lines are seen in EIS spectra• Atomic data have only become available recently (Witthoeft & Badnell Atomic data have only become available recently (Witthoeft & Badnell
2008)2008)• These allow Fe VII to be used in DEM analysisThese allow Fe VII to be used in DEM analysis
Hin
od
e /
EIS
Hin
od
e /
EIS
Solar 24, Dec 2008Solar 24, Dec 2008 Dr Peter Young, NRL/GMUDr Peter Young, NRL/GMU
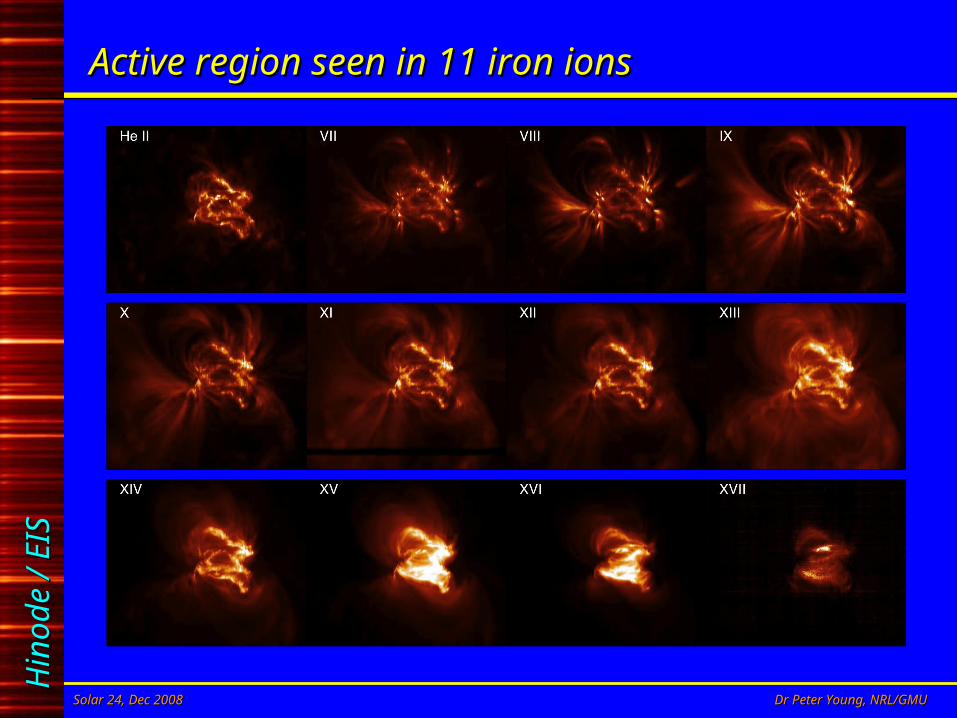
Active region seen in 11 iron ionsActive region seen in 11 iron ions
Hin
od
e /
EIS
Hin
od
e /
EIS
Solar 24, Dec 2008Solar 24, Dec 2008 Dr Peter Young, NRL/GMUDr Peter Young, NRL/GMU
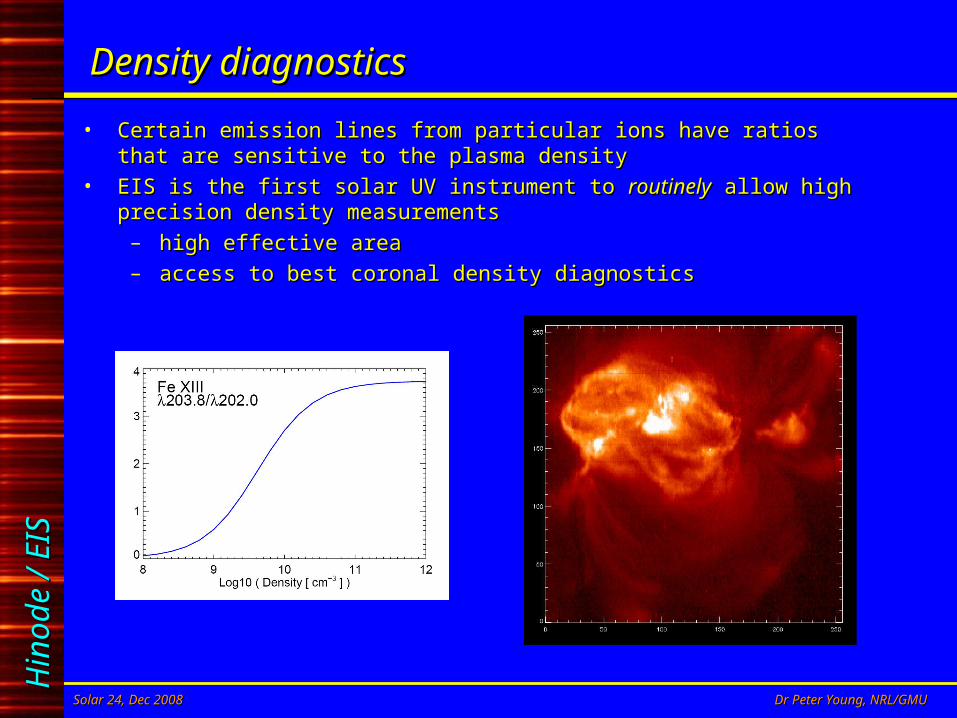
Density diagnosticsDensity diagnostics
• Certain emission lines from particular ions have ratios that are Certain emission lines from particular ions have ratios that are sensitive to the plasma densitysensitive to the plasma density
• EIS is the first solar UV instrument to EIS is the first solar UV instrument to routinelyroutinely allow high precision allow high precision density measurements density measurements – high effective areahigh effective area– access to best coronal density diagnosticsaccess to best coronal density diagnostics
Hin
od
e /
EIS
Hin
od
e /
EIS
Solar 24, Dec 2008Solar 24, Dec 2008 Dr Peter Young, NRL/GMUDr Peter Young, NRL/GMU
Most useful EIS density diagnosticsMost useful EIS density diagnostics
• Fe XII & Fe XIIIFe XII & Fe XIII– column depths and filling factorscolumn depths and filling factors
• Mg VII – a cool loop diagnosticMg VII – a cool loop diagnostic
Hin
od
e /
EIS
Hin
od
e /
EIS
Solar 24, Dec 2008Solar 24, Dec 2008 Dr Peter Young, NRL/GMUDr Peter Young, NRL/GMU
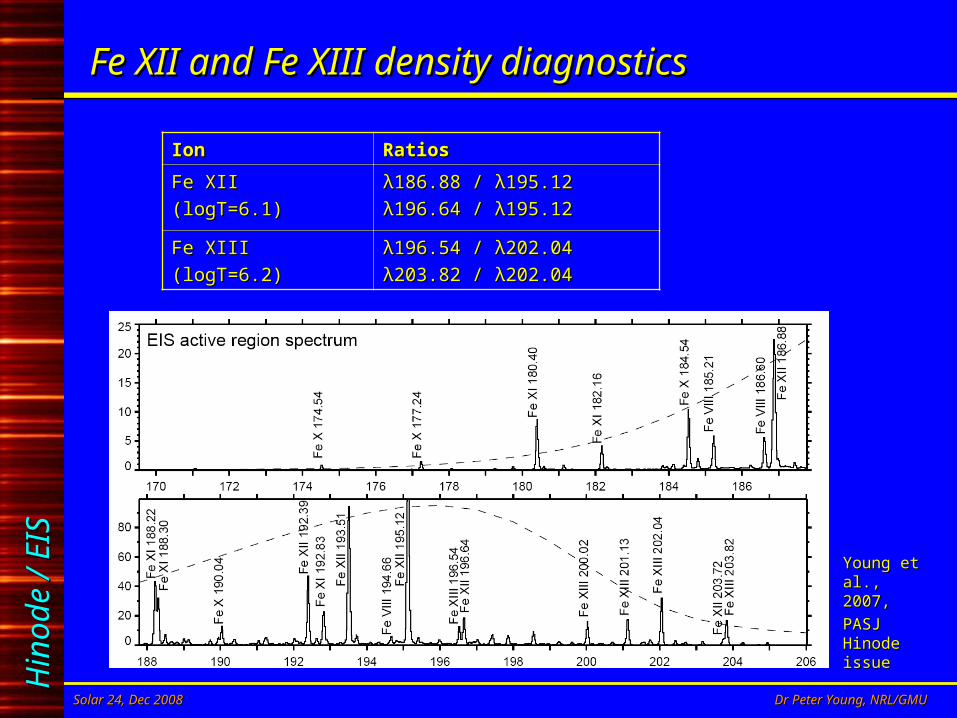
Fe XII and Fe XIII density diagnosticsFe XII and Fe XIII density diagnostics
IonIon RatiosRatios
Fe XIIFe XII
(logT=6.1)(logT=6.1)λλ186.88 / 186.88 / λλ195.12195.12
λ196λ196.64 / .64 / λλ195.12195.12
Fe XIIIFe XIII
(logT=6.2)(logT=6.2)λ196λ196.54 / .54 / λλ202.04202.04
λ203λ203.82 / .82 / λλ202.04202.04
Young et Young et al., 2007, al., 2007,
PASJ PASJ Hinode Hinode issueissue
Hin
od
e /
EIS
Hin
od
e /
EIS
Solar 24, Dec 2008Solar 24, Dec 2008 Dr Peter Young, NRL/GMUDr Peter Young, NRL/GMU
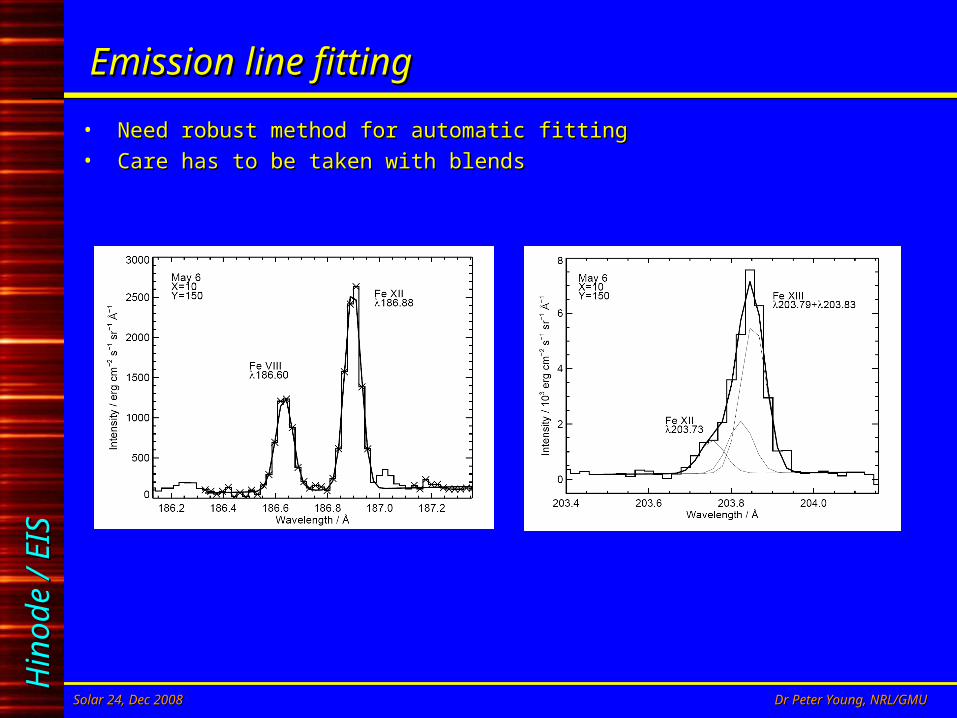
Emission line fittingEmission line fitting
• Need robust method for automatic fittingNeed robust method for automatic fitting• Care has to be taken with blendsCare has to be taken with blends
Hin
od
e /
EIS
Hin
od
e /
EIS
Solar 24, Dec 2008Solar 24, Dec 2008 Dr Peter Young, NRL/GMUDr Peter Young, NRL/GMU
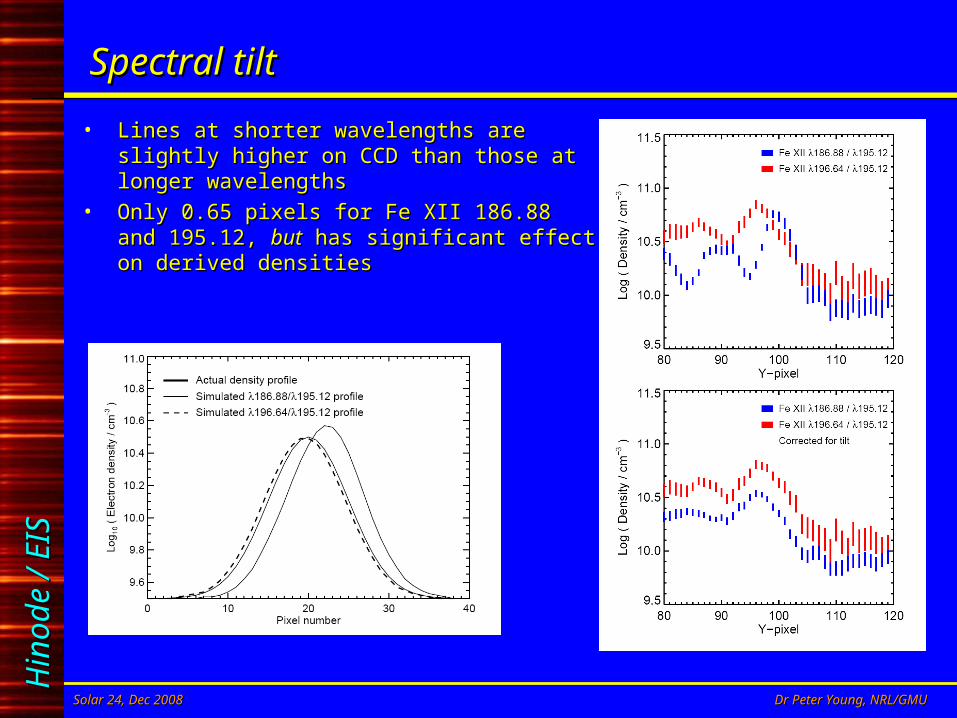
Spectral tiltSpectral tilt
• Lines at shorter wavelengths are slightly Lines at shorter wavelengths are slightly higher on CCD than those at longer higher on CCD than those at longer wavelengthswavelengths
• Only 0.65 pixels for Fe XII 186.88 and Only 0.65 pixels for Fe XII 186.88 and 195.12, 195.12, butbut has significant effect on derived has significant effect on derived densitiesdensities
Hin
od
e /
EIS
Hin
od
e /
EIS
Solar 24, Dec 2008Solar 24, Dec 2008 Dr Peter Young, NRL/GMUDr Peter Young, NRL/GMU
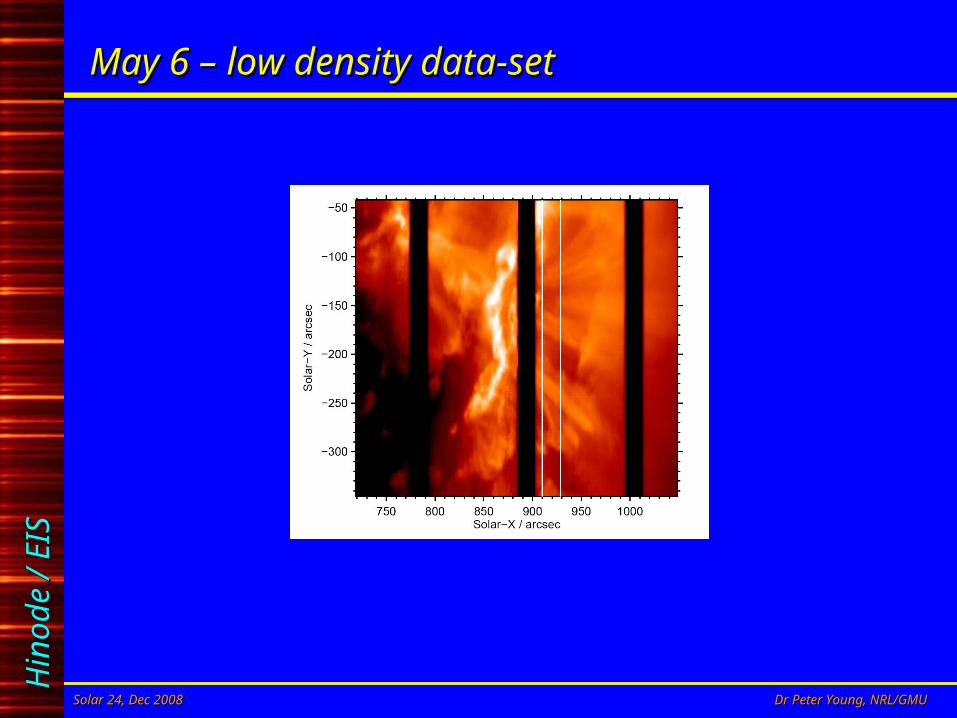
May 6 – low density data-setMay 6 – low density data-set
Hin
od
e /
EIS
Hin
od
e /
EIS
Solar 24, Dec 2008Solar 24, Dec 2008 Dr Peter Young, NRL/GMUDr Peter Young, NRL/GMU
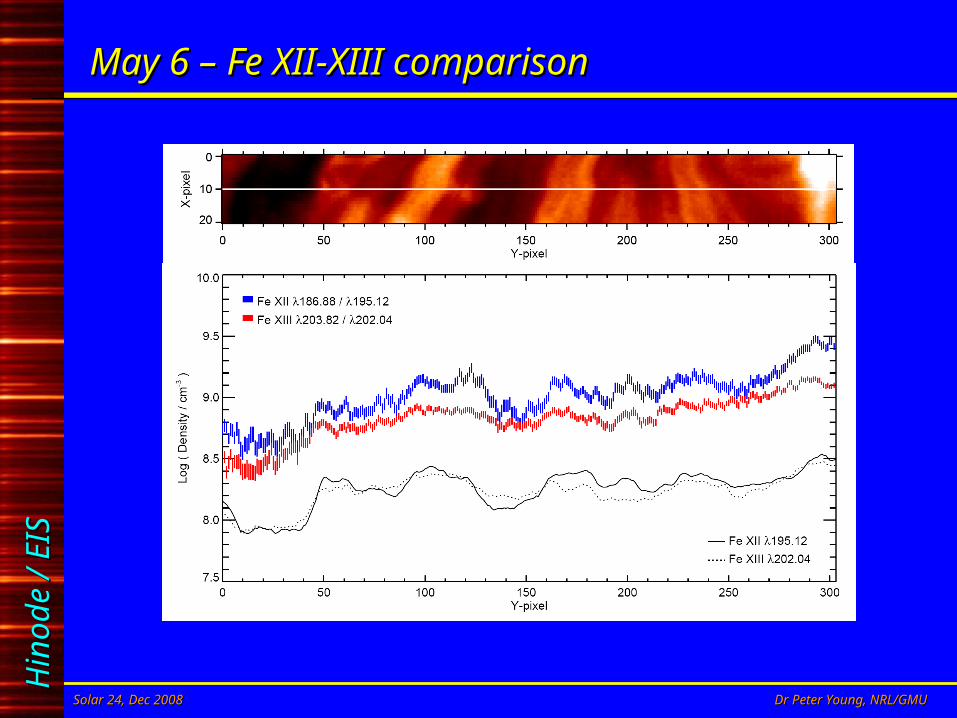
May 6 – Fe XII-XIII comparisonMay 6 – Fe XII-XIII comparison
Hin
od
e /
EIS
Hin
od
e /
EIS
Solar 24, Dec 2008Solar 24, Dec 2008 Dr Peter Young, NRL/GMUDr Peter Young, NRL/GMU
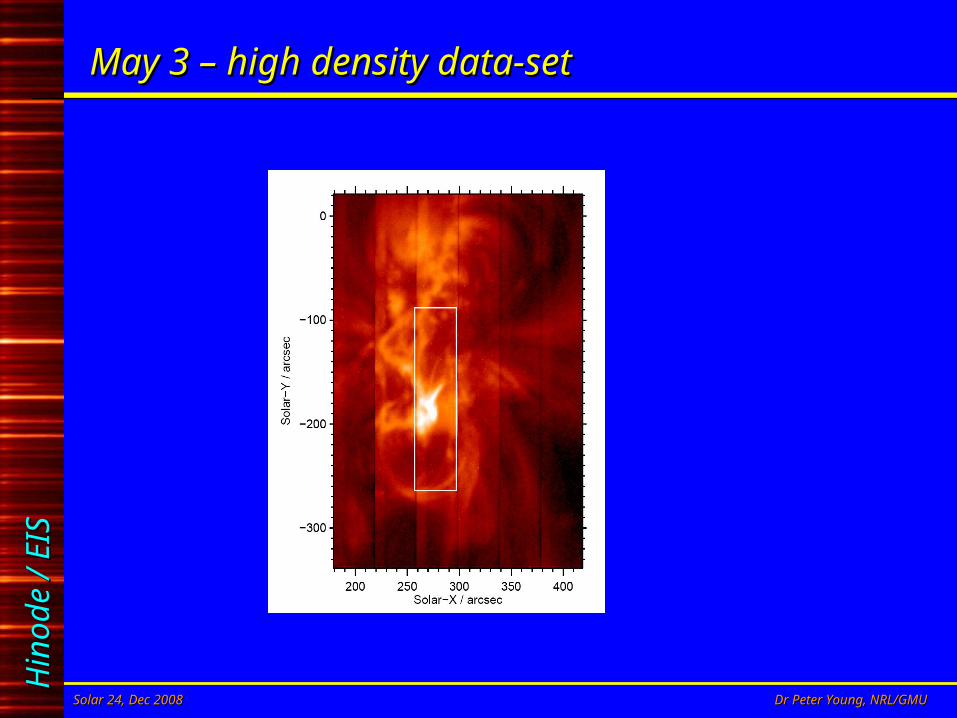
May 3 – high density data-setMay 3 – high density data-set
Hin
od
e /
EIS
Hin
od
e /
EIS
Solar 24, Dec 2008Solar 24, Dec 2008 Dr Peter Young, NRL/GMUDr Peter Young, NRL/GMU
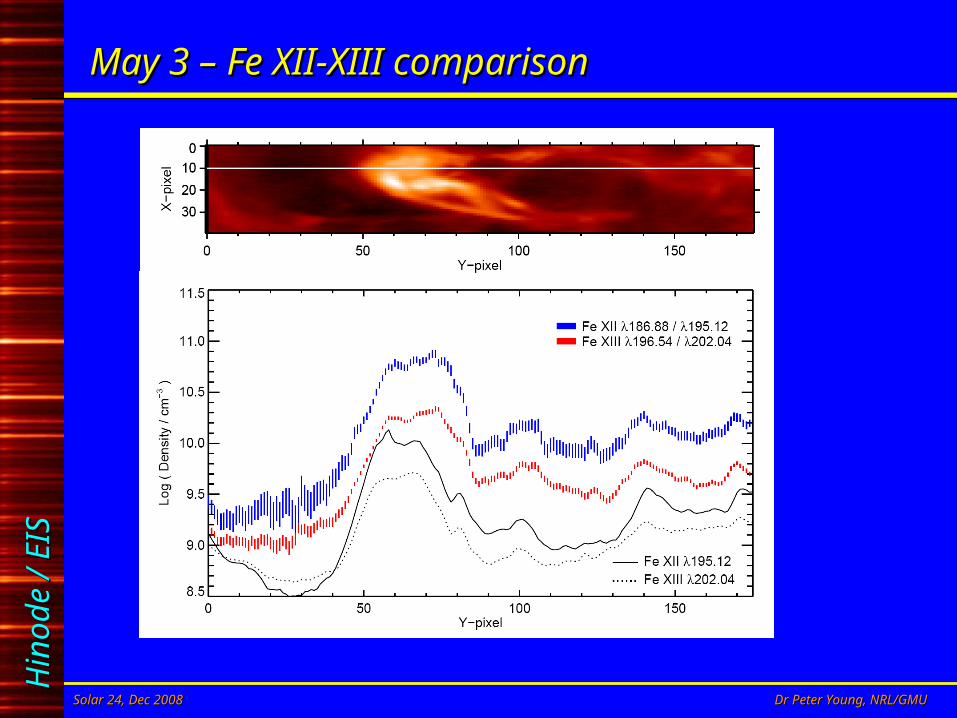
May 3 – Fe XII-XIII comparisonMay 3 – Fe XII-XIII comparison
Hin
od
e /
EIS
Hin
od
e /
EIS
Solar 24, Dec 2008Solar 24, Dec 2008 Dr Peter Young, NRL/GMUDr Peter Young, NRL/GMU
Sources of discrepanciesSources of discrepancies
• Fe XII, Fe XIII differences could be due toFe XII, Fe XIII differences could be due to– atomic data errorsatomic data errors– ions formed at different temperaturesions formed at different temperatures– multiple density components along of sightmultiple density components along of sight
Hin
od
e /
EIS
Hin
od
e /
EIS
Solar 24, Dec 2008Solar 24, Dec 2008 Dr Peter Young, NRL/GMUDr Peter Young, NRL/GMU
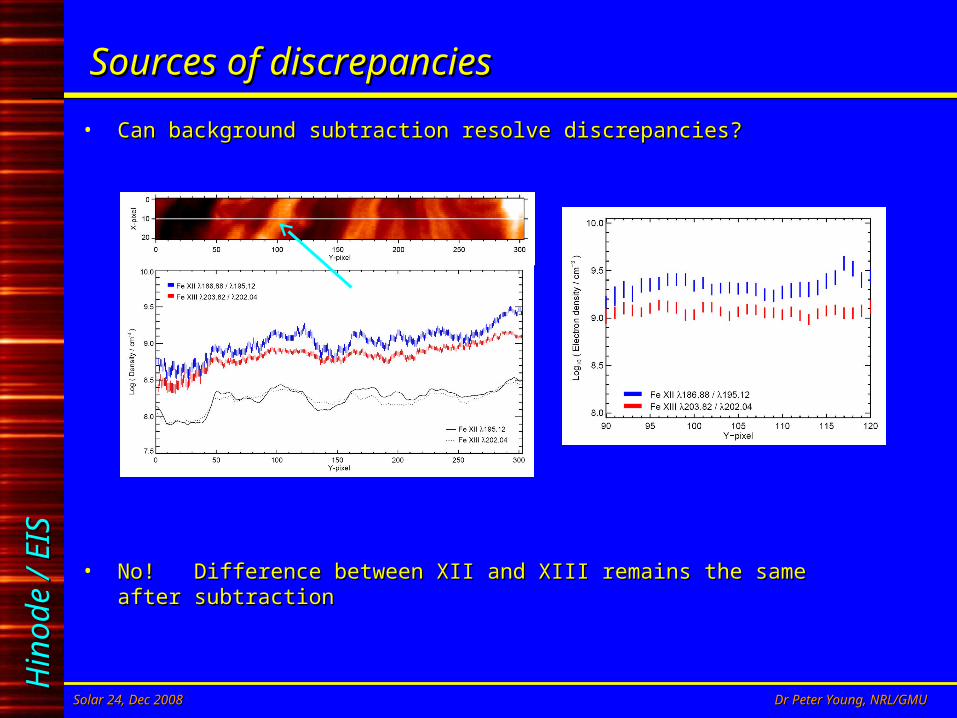
Sources of discrepanciesSources of discrepancies
• Can background subtraction resolve discrepancies?Can background subtraction resolve discrepancies?
• No! Difference between XII and XIII remains the same after No! Difference between XII and XIII remains the same after subtractionsubtraction
Hin
od
e /
EIS
Hin
od
e /
EIS
Solar 24, Dec 2008Solar 24, Dec 2008 Dr Peter Young, NRL/GMUDr Peter Young, NRL/GMU
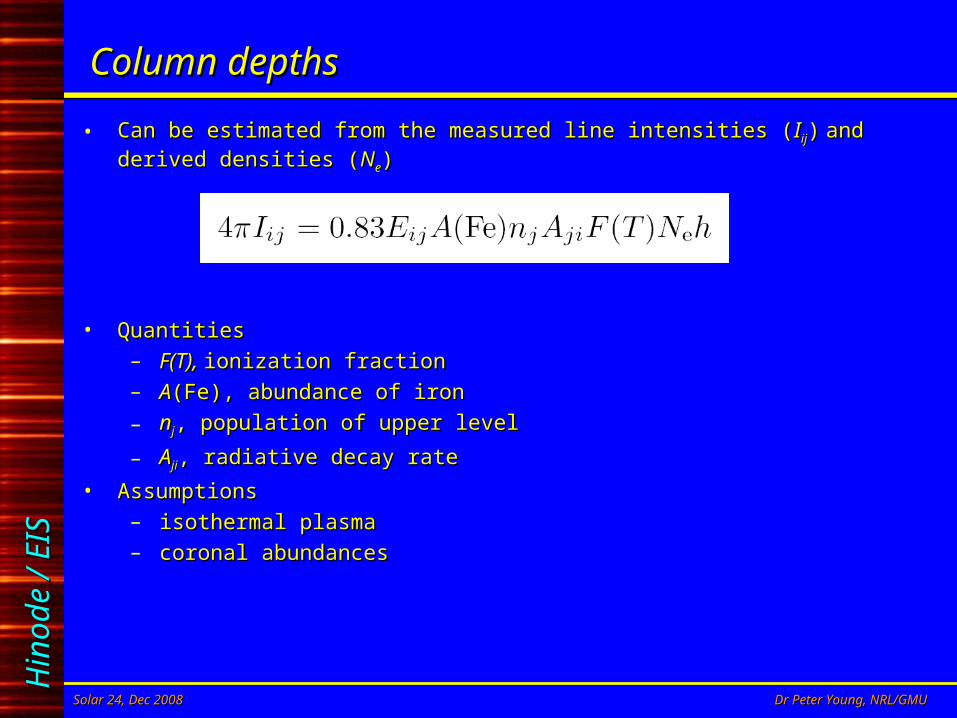
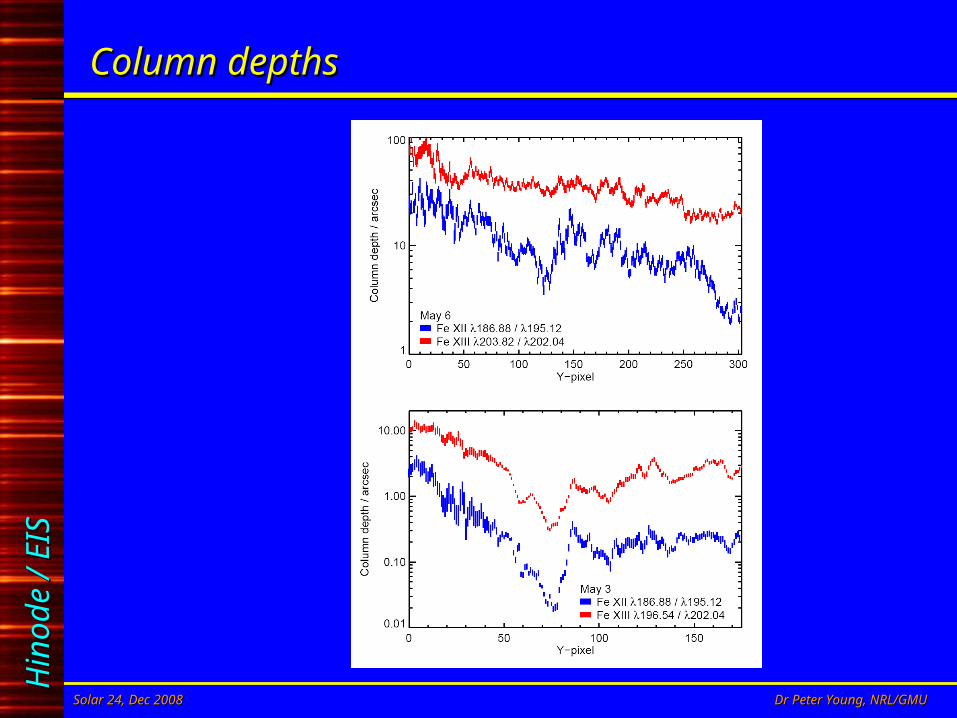
Column depthsColumn depths
• Can be estimated from the measured line intensities (Can be estimated from the measured line intensities (IIijij)) and derived and derived densities (densities (NNee))
• QuantitiesQuantities– F(T), F(T), ionization fractionionization fraction– AA(Fe), abundance of iron(Fe), abundance of iron
– nnjj, population of upper level, population of upper level
– AAjiji, radiative decay rate, radiative decay rate
• AssumptionsAssumptions– isothermal plasmaisothermal plasma– coronal abundancescoronal abundances
Hin
od
e /
EIS
Hin
od
e /
EIS
Solar 24, Dec 2008Solar 24, Dec 2008 Dr Peter Young, NRL/GMUDr Peter Young, NRL/GMU
Column depthsColumn depths
Hin
od
e /
EIS
Hin
od
e /
EIS
Solar 24, Dec 2008Solar 24, Dec 2008 Dr Peter Young, NRL/GMUDr Peter Young, NRL/GMU
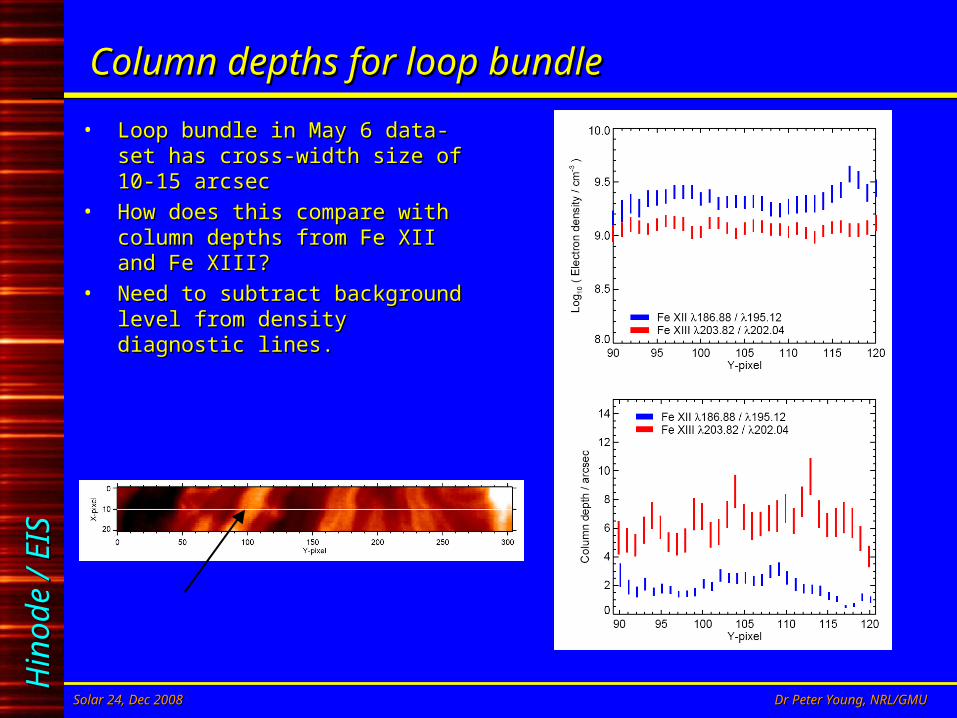
Column depths for loop bundleColumn depths for loop bundle
• Loop bundle in May 6 data-set Loop bundle in May 6 data-set has cross-width size of 10-15 has cross-width size of 10-15 arcsecarcsec
• How does this compare with How does this compare with column depths from Fe XII and Fe column depths from Fe XII and Fe XIII?XIII?
• Need to subtract background Need to subtract background level from density diagnostic level from density diagnostic lines.lines.
Hin
od
e /
EIS
Hin
od
e /
EIS
Solar 24, Dec 2008Solar 24, Dec 2008 Dr Peter Young, NRL/GMUDr Peter Young, NRL/GMU
Fe XII and Fe XIIIFe XII and Fe XIII
• High precision of EIS density measurements can not be exploited until High precision of EIS density measurements can not be exploited until discrepancies between Fe XII and Fe XIII are understooddiscrepancies between Fe XII and Fe XIII are understood
1.1. Atomic data in CHIANTI needs to be re-evaluatedAtomic data in CHIANTI needs to be re-evaluated
2.2. Comparisons with Si X (which also has a density diagnostic) in a range Comparisons with Si X (which also has a density diagnostic) in a range of conditionsof conditions
3.3. Study of column depths for different structuresStudy of column depths for different structures
Hin
od
e /
EIS
Hin
od
e /
EIS
Solar 24, Dec 2008Solar 24, Dec 2008 Dr Peter Young, NRL/GMUDr Peter Young, NRL/GMU
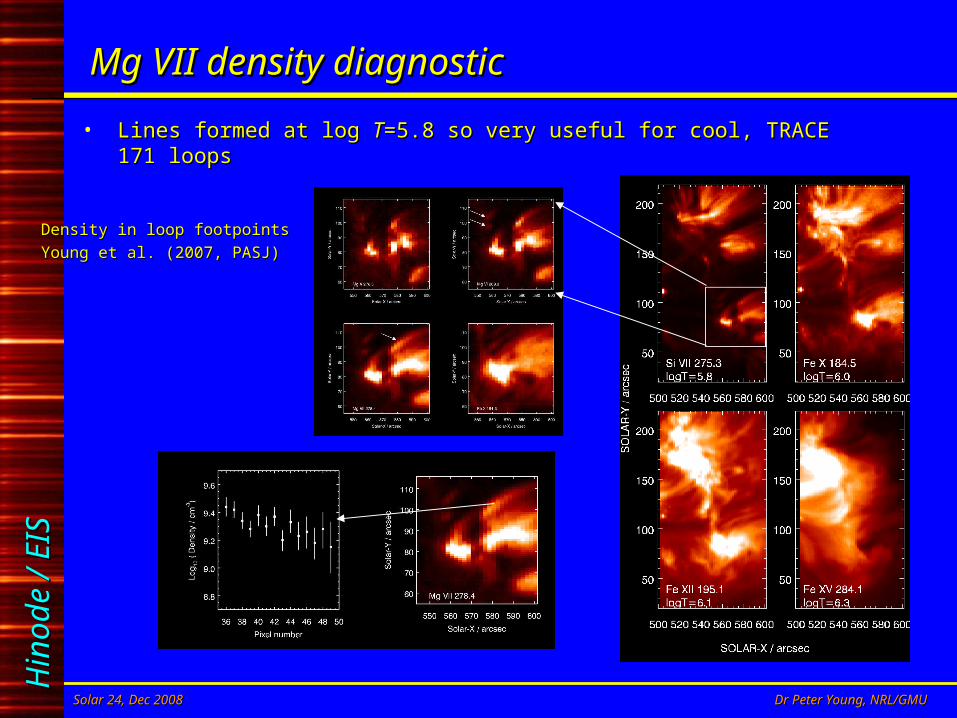
Mg VII density diagnosticMg VII density diagnostic
• Lines formed at log Lines formed at log TT=5.8 so very useful for cool, TRACE 171 loops=5.8 so very useful for cool, TRACE 171 loops
Density in loop footpointsDensity in loop footpoints
Young et al. (2007, PASJ)Young et al. (2007, PASJ)
Hin
od
e /
EIS
Hin
od
e /
EIS
Solar 24, Dec 2008Solar 24, Dec 2008 Dr Peter Young, NRL/GMUDr Peter Young, NRL/GMU
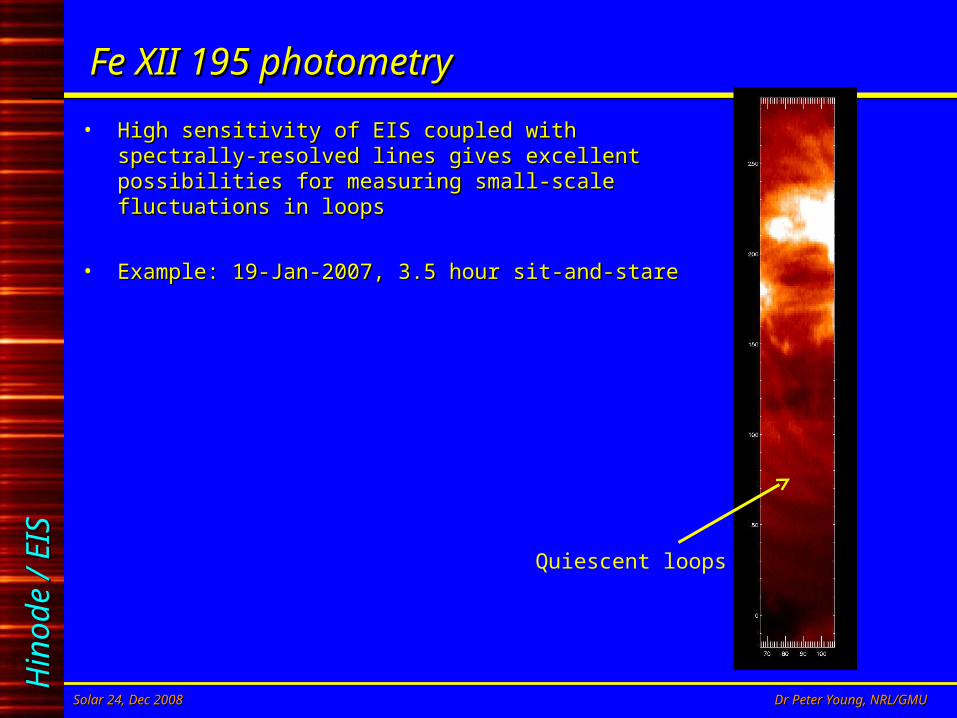
Fe XII 195 photometryFe XII 195 photometry
• High sensitivity of EIS coupled with spectrally-resolved High sensitivity of EIS coupled with spectrally-resolved lines gives excellent possibilities for measuring small-lines gives excellent possibilities for measuring small-scale fluctuations in loopsscale fluctuations in loops
• Example: 19-Jan-2007, 3.5 hour sit-and-stareExample: 19-Jan-2007, 3.5 hour sit-and-stare
Quiescent loops
Hin
od
e /
EIS
Hin
od
e /
EIS
Solar 24, Dec 2008Solar 24, Dec 2008 Dr Peter Young, NRL/GMUDr Peter Young, NRL/GMU
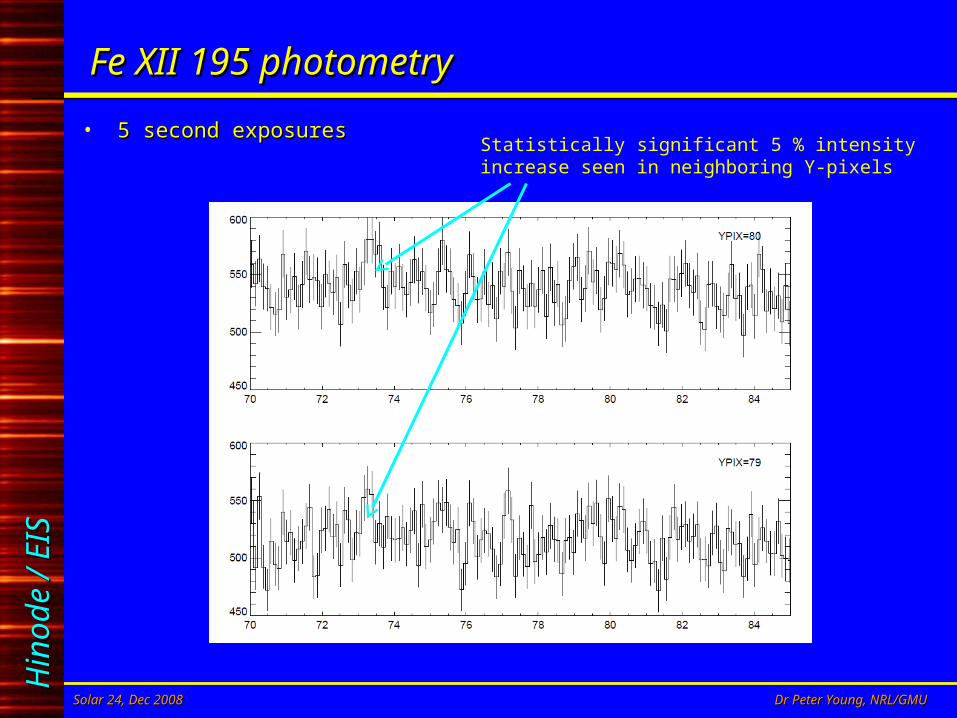
Fe XII 195 photometryFe XII 195 photometry
• 5 second exposures5 second exposuresStatistically significant 5 % intensity increase seen in neighboring Y-pixels
Hin
od
e /
EIS
Hin
od
e /
EIS
Solar 24, Dec 2008Solar 24, Dec 2008 Dr Peter Young, NRL/GMUDr Peter Young, NRL/GMU
List of EIS studies still to be doneList of EIS studies still to be done
• What is the relation of ‘intensity’, ‘velocity’ and ‘line width’ loops?What is the relation of ‘intensity’, ‘velocity’ and ‘line width’ loops?– dynamic loops seem to be darkdynamic loops seem to be dark
• Can EIS see oscillations in TRACE 171 loops?Can EIS see oscillations in TRACE 171 loops?– use slot to reproduce TRACE resultsuse slot to reproduce TRACE results– sit-and-stare to study velocity and densitysit-and-stare to study velocity and density
• How do temperature and density vary along loops?How do temperature and density vary along loops?
• Nanoflare distribution using Fe XII 195Nanoflare distribution using Fe XII 195