Embed Size (px)
Citation preview

Edelweiss Research is also available on www.edelresearch.com, Bloomberg EDEL <GO>, Thomson First Call, Reuters and Factset. Edelweiss Securities Limited
Hindustan Unilever’s (HUL) Q2FY16 numbers came in line with our estimates. Key positives: (i) adjusted 6.5% YoY domestic volume growth (reported growth was 7% YoY due to upstocking done in anticipation of transport strike); (ii) 9.5% YoY growth in personal products (PP) with 17.2% YoY growth in EBIT; (iii) 8 quarters of double‐digit YoY growth in packaged foods (PF); and (iv) 316bps YoY gross margin expansion led by cooling inflation in commodity basket (PFAD prices down 28% YoY) and cost saving program (~70bps). Key negatives: (i) softer EBITDA margin expansion given 24‐quarter high A&P spends (as a % of sales); (ii) 12‐quarter low EBIT margin in beverages (HUL is working on cost savings); and (iii) 9‐quarter low EBIT margin in soap and detergents (S&D) due to part passage of commodity benefits to counter intense competition and support innovations. Maintain ‘HOLD’.
Robust volumes make up for fiscal headwinds, price deflation
Fiscal headwinds impacted sales growth by 100bps and EBIT by 45bps. Price deflation
was seen in S&D, while the remaining portfolio saw modest price increase. In S&D,
premium brands performed better than mass brands. Wheel and Close‐up (struggling
earlier) witnessed improvement; actions are being taken in Pepsodent. Hair care saw
strong double‐digit volume led growth despite fiscal headwinds, price cut in shampoo.
Key takeaways from conference call
In rurban areas, the mix is very similar to Tier 2 and 3 cities. While rural growth was
~1.5x, urban growth came at par; rural outlook is uncertain given erratic monsoon, but
HUL believes rural growth has hit a bottom. The company is committed to modest
improvement in margins with volume‐led growth. Ayush is being re‐launched with
aggressive promotion in Ecommerce (exclusive one month tie‐up with Amazon, later to
be more widely available) to be followed by innovation pipeline.
Outlook and valuations: Long term positive; maintain ‘HOLD’
We remain positive on long‐term prospects of HUL, led by both margin and volume
recovery. Key risks—intense competition and moderation in rural demand—are
increasing. At CMP, the stock is trading at 38x FY16E and 33.2x FY17E EPS. We maintain
‘HOLD/SP’ on the stock with target price of INR865.
RESULT UPDATE
HINDUSTAN UNILEVERVolumes skirt deflationary pressures
EDELWEISS 4D RATINGS
Absolute Rating HOLD
Rating Relative to Sector Performer
Risk Rating Relative to Sector Low
Sector Relative to Market Underweight
MARKET DATA (R: HLL.BO, B: HUVR IN)
CMP : INR 797
Target Price : INR 865
52‐week range (INR) : 981 / 707
Share in issue (mn) : 2,163.9
M cap (INR bn/USD mn) : 1,725 / 27,039
Avg. Daily Vol.BSE/NSE(‘000) : 1,612.4 SHARE HOLDING PATTERN (%)
Current Q1FY16 Q4FY15
Promoters *
67.2 67.2 67.2
MF's, FI's & BK’s 4.8 4.2 3.8
FII's 13.9 14.6 15.0
Others 14.1 14.0 13.9
* Promoters pledged shares (% of share in issue)
: NIL
PRICE PERFORMANCE (%)
Stock Nifty
EW Consumer Goods Index
1 month 2.5 4.5 5.5
3 months (9.5) (2.6) 2.9
12 months 13.1 3.6 8.9
Abneesh Roy +91 22 6620 3141
Pooja Lath +91 22 6620 3075
Tanmay Sharma +91 22 4040 7586
India Equity Research| Consumer Goods
October 14, 2015
Financials (INR mn)
Year to March Q2FY16 Q2FY15 % change Q1FY16 % change FY15 FY16E FY17E
Net rev. 79,554 76,393 4.1 81,051 (1.8) 319,722 350,689 395,896
EBITDA 13,259 12,420 6.8 15,064 (12.0) 54,137 64,685 74,264
Adjusted profit 9,703 9,569 1.4 10,527 (100) 36,839 45,384 52,023
Dil. EPS (INR) 4.5 4.4 1.3 4.9 (7.8) 17.0 21.0 24.1
Diluted P/E (x) 46.8 38.0 33.2
EV/EBITDA (x) 30.9 25.7 22.3
ROAE (%) 97.2 106.2 108.6
* Quarterly nos. standalone; annual nos. consolidated

Consumer Goods
2 Edelweiss Securities Limited
Table 1: Performance trend across categories at a glance
Source: Company, Edelweiss research
Q2FY16 concall | Key takeaways
Environment: Overall growth was led by volumes amidst deflationary price environment. In
both rural and urban markets, it was similar environment and hence the company remains
focussed to drive profitable volume growth.
Overall volumes and growth: HUL reported underlying volume growth of 7% YoY. Volume
growth was higher by 50bps YoY due to increased volume in pipeline owing to the transport
strike. Adjusted for this, volume growth would have been close to 6.5% YoY. There exists
room for improvement in volume growth. Deflation has taken place in universally
penetrated categories. In 2008, amid benign commodity environment the company posted
negative volume growth (volumes fell 7‐8%) just because it was 6‐months slow in taking a
price correction. Over the long term, HUL expects the correlation in growth and GDP to be
1:1.
Rural and urban: Even in rural India the product mix has improved. In rurban areas, the mix
is very similar to Tier 2 and 3 cities. The tendency to migrate to premium brands is much
higher in a benign commodity environment. Rural growth needs to be watched with
monsoons being challenging. Rural growth, which was running at 1.5‐1.7x that of urban, has
come to similar levels now. The outlook for rural remains uncertain and the company
witnessed stress in rural areas in Q2FY16. It believes the decline in rural growth is now at the
bottom and appears to have bottomed out.
Cost savings: Out of the 320bps YoY gross margin expansion, ~70bps YoY expansion has
come from the cost saving program.
Elasticity: Elasticity of volume growth is lower in high penetrated categories.
Pricing: If the commodity prices remain constant, then once anniversarisation happens the
price decline will erase and with price growth in other portfolio will increase overall price
growth. Once commodity prices move up, HUL will be well poised to pass on the price
% sales growth (YoY) Q1FY13 Q2FY13 Q3FY13 Q4FY13 Q1FY14 Q2FY14 Q3FY14 Q4FY14 Q1FY15 Q2FY15 Q3FY15 Q4FY15 Q1FY16 Q2FY16
Soaps and detergents 23.7 22.3 19.8 12.6 7.7 6.4 7.1 9.6 12.9 11.1 6.0 5.0 0.2 1.6
Personal products 16.7 12.1 13.0 12.1 2.0 11.8 12.4 8.3 14.7 9.9 6.5 13.4 11.4 9.5
Beverages 7.4 10.0 18.2 18.3 15.8 16.1 7.2 7.5 10.5 7.5 8.2 12.3 9.4 6.1
Packaged Food 17.3 10.2 7.7 7.0 4.8 8.7 12.9 12.7 18.8 13.4 12.6 13.6 11.8 12.4
Overall volume
growth (% YoY)9.0 7.0 5.0 6.0 4.0 5.0 4.0 3.0 6.0 5.0 3.0 6.0 6.0 7.0
% EBIT growth (YoY) Q1FY13 Q2FY13 Q3FY13 Q4FY13 Q1FY14 Q2FY14 Q3FY14 Q4FY14 Q1FY15 Q2FY15 Q3FY15 Q4FY15 Q1FY16 Q2FY16
Soaps and detergents 63.2 41.2 10.6 19.7 14.0 4.5 14.5 10.1 21.1 7.9 11.4 15.8 12.4 (4.1)
Personal products 15.1 6.6 19.0 3.6 (1.6) 5.3 13.9 5.1 27.4 17.4 3.3 26.0 19.5 17.2
Beverages 25.9 17.5 33.5 38.4 46.1 37.5 (2.2) 19.7 (1.8) 9.9 2.7 11.4 5.3 (11.5)
EBIT margins (%) Q1FY13 Q2FY13 Q3FY13 Q4FY13 Q1FY14 Q2FY14 Q3FY14 Q4FY14 Q1FY15 Q2FY15 Q3FY15 Q4FY15 Q1FY16 Q2FY16
Soaps and detergents 12.2 14.3 12.4 12.0 12.9 14.0 13.3 12.1 13.8 13.6 14.0 13.3 15.5 12.8
Personal products 25.8 24.2 28.3 25.8 24.9 22.8 28.6 25.0 27.6 24.4 27.7 27.8 29.6 26.1
Beverages 14.5 14.3 17.7 16.9 18.3 17.0 16.2 18.8 16.3 17.3 15.3 18.6 15.7 14.5
Packaged Food 5.7 0.2 (0.8) 3.8 8.4 3.3 (3.6) 5.5 10.9 4.4 (5.1) 5.3 8.9 5.3
Hindustan Unilever
3 Edelweiss Securities Limited
increase which is helped by the benefits arising from the Winning in Many India strategy.
Benign pricing also helps premiumisation of the portfolio, which will lead to better mix and
hence better growth. Higher growth in PP will help better mix and margins. The company is
committed to modest improvement in margins in all scenarios. 50% of the portfolio (S&D)
has seen price deflation with the other half witnessing price increase.
Soaps and detergents (S&D): This segment witnessed growth of 1.6% YoY (3% YoY ex of
phasing off excise duty benefits), while EBIT declined by 4.1% YoY. Dove, Pears, Hamam and
Lifebuoy saw double digit volume growth. Growth in laundry segment was led by Surf (one
of the strongest growth momentum in Q2FY16) and Rin. Growth in this segment was
impacted by phasing out of excise duty and price deflation owing to soft commodity prices.
Wheel performance saw improvement. Premium brands fared better than mass market
brands. HUL has re‐launched Lux in a significant manner and whenever relaunch is done
pipeline correction takes place which temporarily impacts volume growth. Retention level of
Dove by the customer is very high. S&D has seen significant gross margin expansion so the
company has used the benefits for developing the market and brand investment.
Personal products (PP): The segment reported growth of 9.5% YoY (11% YoY ex phasing off
excise duty benefits), while EBIT growth came in at 17.2% YoY with 171bps margin
expansion. Fair and Lovely continued to do well, while performance of Pond’s was led by
premium skin lightening and Lakme by Perfect Radiance and CC cream. HUL’s hair care
segment saw strong double‐digit volume‐led growth (strong double‐digit growth despite
excise correction and price cuts in shampoos) across format with good performance by Dove
and TRESemme. Hair care has seen growth across formats. Oral care recovery is in progress.
Close Up saw double digit growth (helped by activations), while performance of Pepsodent
was subdued. However, the company is confident of turnaround happening in Pepsodent in
couple of quarters (HUL is aware of the area where improvement is required). Lakme
delivered double digit growth across core, Absolute and 9 to 5 ranges.
Shampoo: The company accounts for 50% of the hair care market. Shampoo witnessed
significant pick up in volumes.
Deodorant: Saw one of the largest innovations for the company and met with very good
response.
Beverages: Growth in this segment came in at 5.9% YoY with EBIT declining by 11.5% YoY.
Margins fell by 285bps YoY. Red Label continues to lead category performance, while Taaza
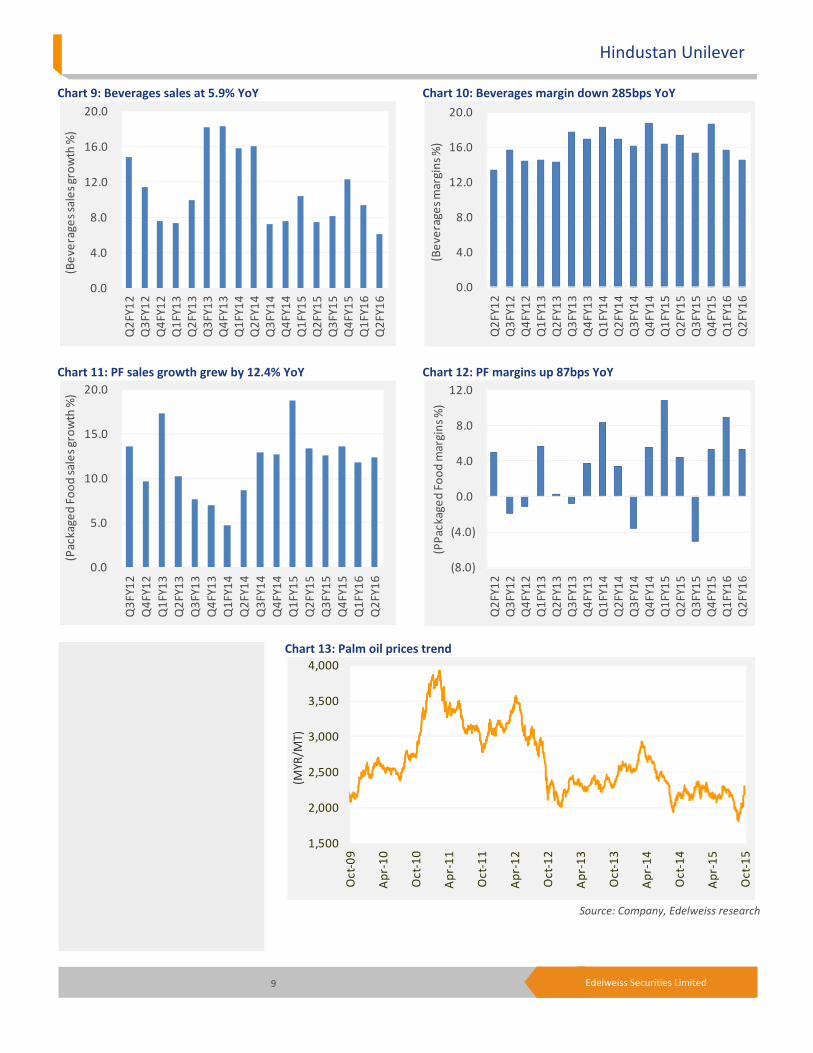
(taken price corrections) saw pick up. Growth in green tea continues. Growth in coffee was
led by Bru Gold. The impact on margins was due to: (i) tea has seen some inflation; and (ii)
A&P spends have increased in this segment. Tea growth has been 50‐50 in terms of volume
and price. With pipeline correction in Taj and alignment in costs, growth in tea will be back.
Packaged foods: This segment saw double digit growth (eighth successive quarter of double
digit growth) of 12.4% YoY with 34.5% YoY EBIT growth. Growth was driven by all the key
brands ‐ Kissan sustained robust activation‐led growth across both ketchups and jams, while
Knorr growth was led by strong performance by instant soups. HUL has a lot of new offerings
in the pipeline in this space.
Water: This business was helped by performance of the Ecommerce channel. Overall
performance was however, subdued.

Consumer Goods
4 Edelweiss Securities Limited
A&P: HUL has done substantial investment and recorded one of the highest A&P quarter.
A&P expenses increased by 225bps YoY moving up 23.8% YoY. Higher A&P signifies
commitment towards building the market and passing on benefits to consumers. A&P
increase was also due to the fact there was higher innovation in the S&D segment in
Q2FY16. The company has been investing for market development so that the mix
improvement continues. A&P spend will depend on competitive scenario and affordability.
TV spends, which used to be 90%, is now down to ~70% as digital spends have increased.
The increase was uniform in advertisement and promotion.
Competition: Competitive intensity continues to remain high. HUL is agile in responding to
market by making sure that it protects it share. The company is seized of the fact that the
commodity cycle changes at a faster pace these days.
Excise impact: Phasing off of the excise benefit impacted revenue growth by 100bps YoY (ex
this, underlying growth would have been 6% YoY). On EBIT, the impact was 45bps YoY. Tax
rate increased by 189bps YoY. The impact will continue till early part of Q4FY16, though the
impact will taper off. The impact in Q3FY16 can be 70‐80bps and 30‐40bps YoY in Q4FY16.
Toni and Guy: HUL is satisfied with performance of this brand till now.
Ayush: This brand was launched in 2000’s but that launch was ahead of time. Now is a
correct time to launch. Initially, HUL will only go for Ecommerce launch and has a lot of
innovation and new launches here. It is already launched in Amazon and will be extended to
other Ecommerce companies as well.
Commodity costs: Remains benign. PFAD has dipped to average price of INR31.9 per kg from
INR41.6 in Q1FY16. Commodity price collapse has happened and is now stabilising.
Taxation: Will remain in the region of 31.5%. From FY17, the increase in tax rate will
stabilise.
Debtor days: Have risen because of the change in the mix of the channel with higher growth
in modern trade and CSD. The increase is not because of the credit crunch in the rural
market.
Q1FY16 concall | Key takeaways
Market environment: Management believes the pace of market recovery will be largely
dependent on rural areas. Rural has witnessed some slowdown recently; rural and urban
growth rates are now at par. Rural growth should ideally outpace urban growth because
70% of the Indian population resides in rural areas, while it represent only one third of the
market.
Market data is showing some discrepancy as it is reflecting pricing growth in the S&D space
which is not true. HUL believes there is some lag in correct reflection of pricing action (price
cut which HUL took in December 2014 in S&D is likely to reflect with 9 months’ lag).
The rural share of income for the company is 40‐45% including indirect coverage and ~35%
for direct coverage.

Hindustan Unilever
5 Edelweiss Securities Limited
Phasing of fiscal benefits: The impact during Q1FY16 was 170bps YoY on top line and 65bps
on PBIT. Fiscal phasing impact will fade by 50bps every quarter each in Q2FY16 and Q3FY16;
from Q4FY16 it will come into base. The impact is predominantly soaps and personal
products category.
HUL will pass on the impact on phasing out of excise benefit in a phased manner at an
appropriate time.
Volume growth: HUL registered volume growth of 6% YoY ahead of the market.
Soaps and detergents (S&D): The S&D portfolio was flattish YoY (2% YoY ex‐fiscal headwind)
while margin in this segment expanded 169bps YoY. Volume growth is extremely healthy
across S&D.
Growth in the skin cleansing category was driven by premium soaps, double digit volume
growth in Dove and liquid handwash led by Lifebuoy. Mass soaps segment is facing some
slowdown pressure led by rural slowdown; HUL is taking actions to improve growth in this
segment. Though many small players have mushroomed in the soaps space with raw
material deflation, the company has not lost share to them. HUL’s effective price deflation
in S&D was 2% YoY in Q1FY16.
Surf saw volume led double digit growth while performance of Rin in bars and powder was
also strong. Wheel continues to remain soft aggravated by a slowing mass market, but the
company remains committed towards the brand which is INR25bn brand for the company.
Rural slowdown has had a significant bearing on Wheel’s performance, further aggravated
by price volatility due to reducing raw material prices. The core issue has been sorted out
and execution will reflect in 3‐6 months.
Personal Products (PP): PP portfolio registered strong growth of 11.4% YoY (15% YoY ex‐
fiscal headwind) while margins in this segment grew a robust 201bps YoY.
Skin care portfolio saw double digit growth in FAL, Ponds, Lakme, Vaseline. Growth in Pond’s
was led by premium skin lightening and talc. This category showed strong performance
despite phasing out of excise benefits.
Hair care also delivered double digit growth across brands and formats. This category
showed strong performance despite phasing out of excise benefits.
Close Up clocked double digit growth driven by activations and micromarketing while
growth in Pepsodent was driven by Gum care and Clove & Salt variants. Pepsodent continues
to perform below company expectations. HUL has taken corrective action, likely to bear fruit
in 3‐6 months.
Lakme sustained strong performance led by premium make up.
Margin improvement was led by reduction in packaging costs (constitutes significant cost in
PP) due to correction in crude oil prices and leverage coming into play on A&P costs which
are largely fixed in nature for PP category. Modest margin improvement should continue.
Beverages: Beverages revenue increased 9.4% YoY, while margins declined 60bps YoY. Tea
segment delivered double digit growth with healthy volumes. High growth momentum was

Consumer Goods
6 Edelweiss Securities Limited
sustained in Lipton Green Tea and Red Label. Coffee growth was led by more than 2x growth
in Bru Gold. Retail coffee sales have done well, though sales could have performed better.
Packaged foods: Packaged foods delivered seventh consecutive quarter of double digit
growth at 11.8% YoY. Kissan delivered one of the strongest quarters led by both ketchups
and jams. Kwality and Magnum delivered good growth. Knorr exhibited strong growth
despite Nestle issue.
Gross margins: Gross margins rose 376bps YoY.
A&P spends: A&P spends increased by 22% YoY to support innovation and to remain
competitive. A&P was especially high in the S&D space. Both ad and promotion grew and
the ratio was largely maintained YoY.
Other costs: Royalty increase (40bsp YoY) impact was largely offset by saving in supply
chain.
Outlook and valuations: Long term positive; maintain ‘HOLD’
We continue to remain positive on HUL's ability to grow ahead of the market and its pricing
power due to initiatives in distribution expansion (direct coverage increased from 0.9mn in
2009 to 3.2mn in 2013) and product innovations. Commodity price correction will continue
to aid gross margin expansion in FY16, though we expect partial benefit to be continued to
be passed on to customers via promotional offers/select price cuts to keep competition at
bay. Cost savings and mix improvement will help margins to improve structurally.
With likely urban recovery, the company (higher urban exposure at 55%) is well placed to
benefit. We expect higher investment in A&P to support brand equity, aid market
development for future categories and to counter pick up in competitive intensity. Key
monitorables: (i) rural growth which may moderate due to erratic rainfall, slowdown in rural
wage growth, muted hikes in support prices for crops; and (ii) increase in competitive
intensity due to softer commodity prices. However, with an anticipated recovery in urban
demand and commodity correction to aid EBITDA margin expansion, we expect HUL to
potentially benefit. We maintain target P/E of 36x FY17E EPS arriving at a target price of
INR865. We maintain 'HOLD/ Sector Performer'.
Hindustan Unilever
7 Edelweiss Securities Limited
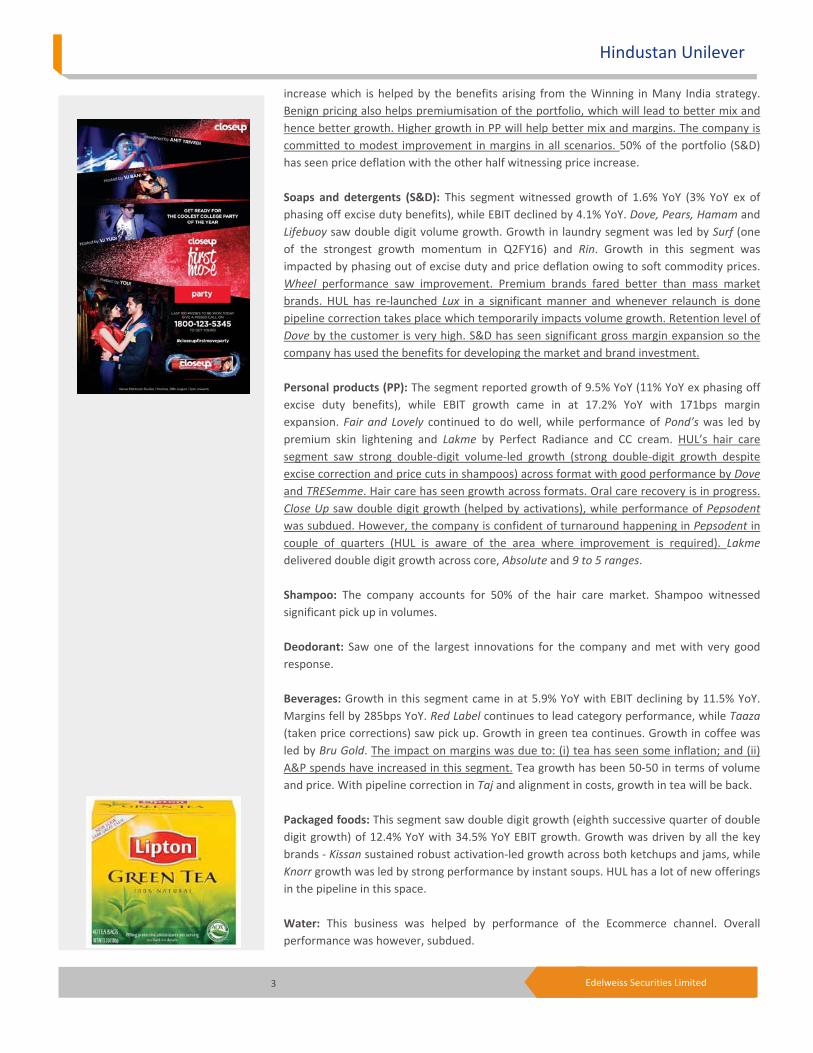
Chart 1: Overall volume growth at 7% YoY
Chart 2: A&P spends up 225bps YoY
Chart 3: Category‐wise contribution—Sales
Source: Company, Edelweiss research
0.0
3.4
6.8
10.2
13.6
17.0
Q2FY10
Q3FY10
Q4FY10
Q1FY11
Q2FY11
Q3FY11
Q4FY11
Q1FY12
Q2FY12
Q3FY12
Q4FY12
Q1FY13
Q2FY13
Q3FY13
Q4FY13
Q1FY14
Q2FY14
Q3FY14
Q4FY14
Q1FY15
Q2FY15
Q3FY15
Q4FY15
Q1FY16
Q2FY16
(%)
0.0
3.5
7.0
10.5
14.0
17.5
Q2F
Y10
Q3F
Y10
Q4F
Y10
Q1F
Y11
Q2F
Y11
Q3F
Y11
Q4F
Y11
Q1F
Y12
Q2F
Y12
Q3F
Y12
Q4F
Y12
Q1F
Y13
Q2F
Y13
Q3F
Y13
Q4F
Y13
Q1F
Y14
Q2F
Y14
Q3F
Y14
Q4F
Y14
Q1F
Y15
Q2F
Y15
Q3F
Y15
Q4F
Y15
Q1F
Y16
Q2F
Y16
(% o
f sal
es)
Soaps and Detergents
48%
Personal Products30%
Beverages12%
Packaged Food6%
Others (includes Chemicals, Water etc)
4%
Q2FY16 revenue split
Soaps and Detergents
49%
Personal Products28%
Beverages12%
Packaged Food6%
Others (includes Chemicals, Water etc)
5%
Q2FY15 revenue split

Consumer Goods
8 Edelweiss Securities Limited
Chart 4: Category‐wise contribution—EBIT
Chart 5: S&D YoY revenue up 1.6% YoY Chart 6: S&D margin down 77bps YoY
Chart 7: PP revenue growth at 9.5% YoY Chart 8: PP margin up 171bps YoY
Source: Company, Edelweiss research
Soaps and Detergents
38%
Personal Products48%
Beverages11%
Packaged Food2%
Others (includes Chemicals, Water etc)
1%
Q2FY16 ‐ EBIT contribution
0.0
6.0
12.0
18.0
24.0
30.0
Q2FY12
Q3FY12
Q4FY12
Q1FY13
Q2FY13
Q3FY13
Q4FY13
Q1FY14
Q2FY14
Q3FY14
Q4FY14
Q1FY15
Q2FY15
Q3FY15
Q4FY15
Q1FY16
Q2FY16
(S&D sales growth %)
0.0
4.0
8.0
12.0
16.0
20.0
Q2FY12
Q3FY12
Q4FY12
Q1FY13
Q2FY13
Q3FY13
Q4FY13
Q1FY14
Q2FY14
Q3FY14
Q4FY14
Q1FY15
Q2FY15
Q3FY15
Q4FY15
Q1FY16
Q2FY16
(PP sales growth %)
Soaps and Detergents
42%
Personal Products43%
Beverages13%
Packaged Food1%
Others (includes Chemicals, Water etc)
1%
Q2FY15 ‐ EBIT contribution
0.0
3.6
7.2
10.8
14.4
18.0
Q2FY12
Q3FY12
Q4FY12
Q1FY13
Q2FY13
Q3FY13
Q4FY13
Q1FY14
Q2FY14
Q3FY14
Q4FY14
Q1FY15
Q2FY15
Q3FY15
Q4FY15
Q1FY16
Q2FY16
(S&D margins %)
0.0
7.0
14.0
21.0
28.0
35.0
Q2FY12
Q3FY12
Q4FY12
Q1FY13
Q2FY13
Q3FY13
Q4FY13
Q1FY14
Q2FY14
Q3FY14
Q4FY14
Q1FY15
Q2FY15
Q3FY15
Q4FY15
Q1FY16
Q2FY16
(PP margins %)
Hindustan Unilever
9 Edelweiss Securities Limited
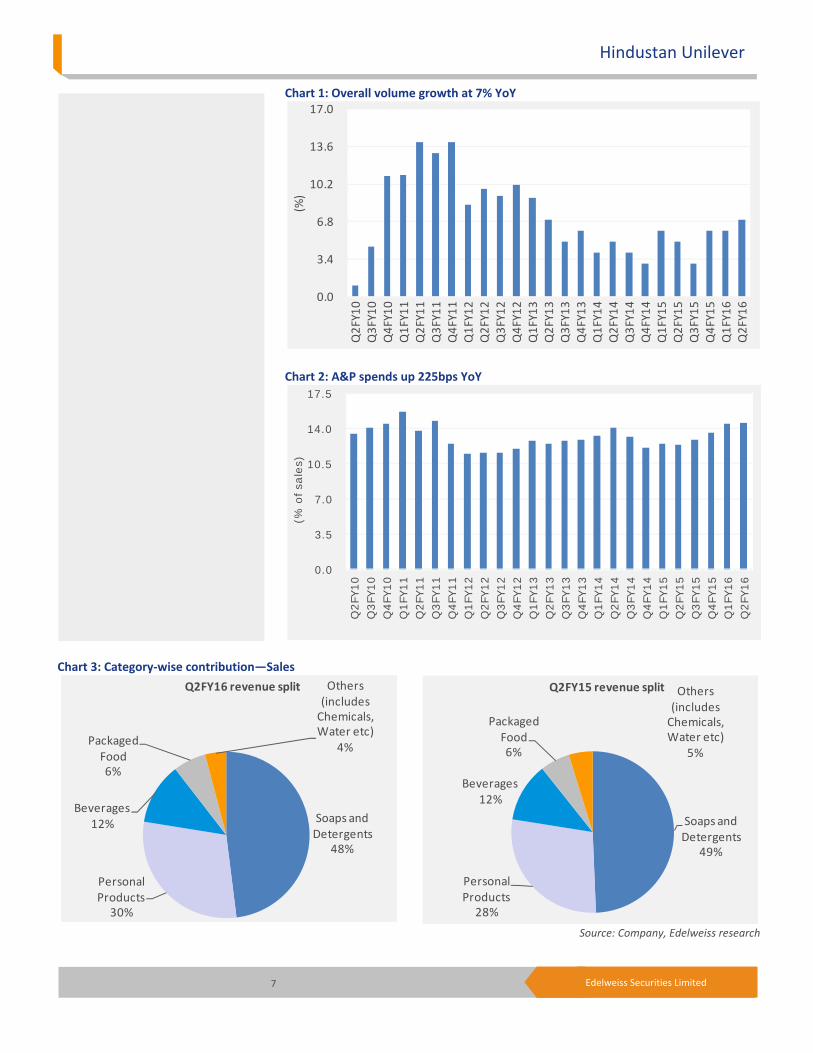
Chart 9: Beverages sales at 5.9% YoY Chart 10: Beverages margin down 285bps YoY
Chart 11: PF sales growth grew by 12.4% YoY Chart 12: PF margins up 87bps YoY
Chart 13: Palm oil prices trend
Source: Company, Edelweiss research
0.0
4.0
8.0
12.0
16.0
20.0
Q2FY12
Q3FY12
Q4FY12
Q1FY13
Q2FY13
Q3FY13
Q4FY13
Q1FY14
Q2FY14
Q3FY14
Q4FY14
Q1FY15
Q2FY15
Q3FY15
Q4FY15
Q1FY16
Q2FY16
(Beverages sales growth %)
0.0
5.0
10.0
15.0
20.0
Q3FY12
Q4FY12
Q1FY13
Q2FY13
Q3FY13
Q4FY13
Q1FY14
Q2FY14
Q3FY14
Q4FY14
Q1FY15
Q2FY15
Q3FY15
Q4FY15
Q1FY16
Q2FY16
(Packaged Food sales growth %)
1,500
2,000
2,500
3,000
3,500
4,000
Oct‐09
Apr‐10
Oct‐10
Apr‐11
Oct‐11
Apr‐12
Oct‐12
Apr‐13
Oct‐13
Apr‐14
Oct‐14
Apr‐15
Oct‐15
(MYR/M
T)
(8.0)
(4.0)
0.0
4.0
8.0
12.0
Q2FY12
Q3FY12
Q4FY12
Q1FY13
Q2FY13
Q3FY13
Q4FY13
Q1FY14
Q2FY14
Q3FY14
Q4FY14
Q1FY15
Q2FY15
Q3FY15
Q4FY15
Q1FY16
Q2FY16
(PPackaged Food margins %)
0.0
4.0
8.0
12.0
16.0
20.0
Q2FY12
Q3FY12
Q4FY12
Q1FY13
Q2FY13
Q3FY13
Q4FY13
Q1FY14
Q2FY14
Q3FY14
Q4FY14
Q1FY15
Q2FY15
Q3FY15
Q4FY15
Q1FY16
Q2FY16
(Beverages margins %)
Consumer Goods
10 Edelweiss Securities Limited
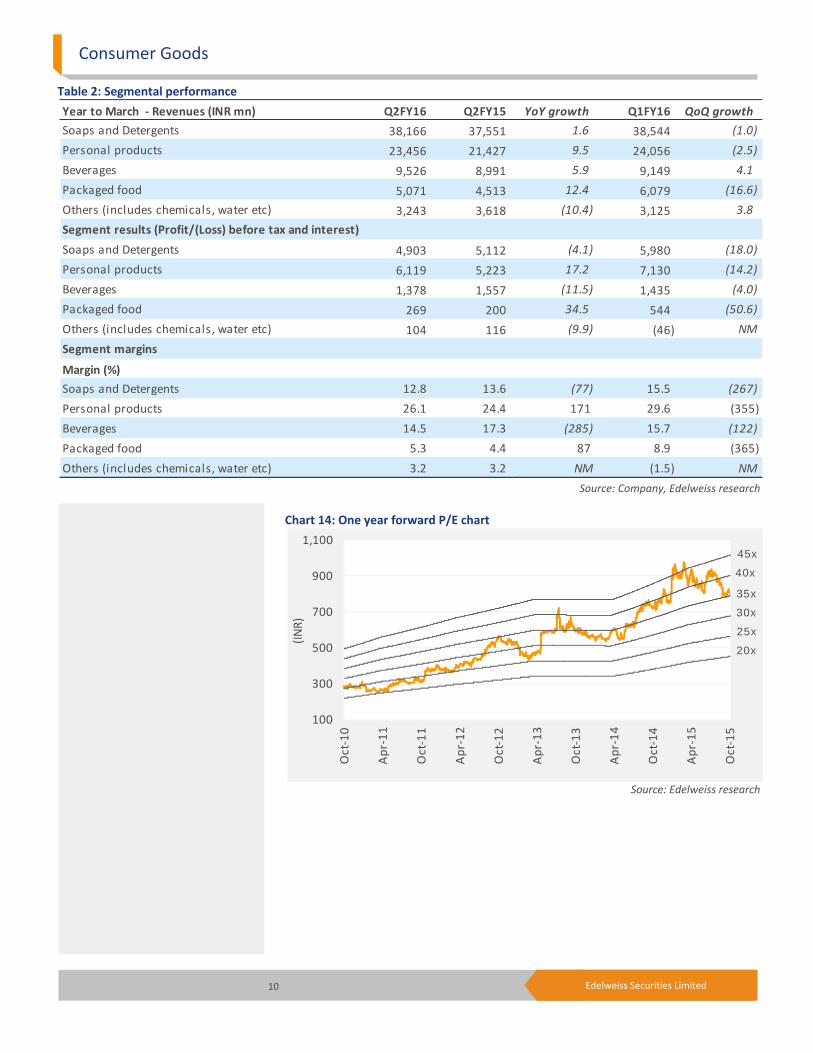
Table 2: Segmental performance
Source: Company, Edelweiss research
Chart 14: One year forward P/E chart
Source: Edelweiss research
Year to March ‐ Revenues (INR mn) Q2FY16 Q2FY15 YoY growth Q1FY16 QoQ growth
Soaps and Detergents 38,166 37,551 1.6 38,544 (1.0)
Personal products 23,456 21,427 9.5 24,056 (2.5)
Beverages 9,526 8,991 5.9 9,149 4.1
Packaged food 5,071 4,513 12.4 6,079 (16.6)
Others (includes chemicals, water etc) 3,243 3,618 (10.4) 3,125 3.8
Segment results (Profit/(Loss) before tax and interest)
Soaps and Detergents 4,903 5,112 (4.1) 5,980 (18.0)
Personal products 6,119 5,223 17.2 7,130 (14.2)
Beverages 1,378 1,557 (11.5) 1,435 (4.0)
Packaged food 269 200 34.5 544 (50.6)
Others (includes chemicals, water etc) 104 116 (9.9) (46) NM
Segment margins
Margin (%)
Soaps and Detergents 12.8 13.6 (77) 15.5 (267)
Personal products 26.1 24.4 171 29.6 (355)
Beverages 14.5 17.3 (285) 15.7 (122)
Packaged food 5.3 4.4 87 8.9 (365)
Others (includes chemicals, water etc) 3.2 3.2 NM (1.5) NM
100
300
500
700
900
1,100
Oct‐10
Apr‐11
Oct‐11
Apr‐12
Oct‐12
Apr‐13
Oct‐13
Apr‐14
Oct‐14
Apr‐15
Oct‐15
(INR)
20x
40x
45x
25x
30x
35x
Hindustan Unilever
11 Edelweiss Securities Limited
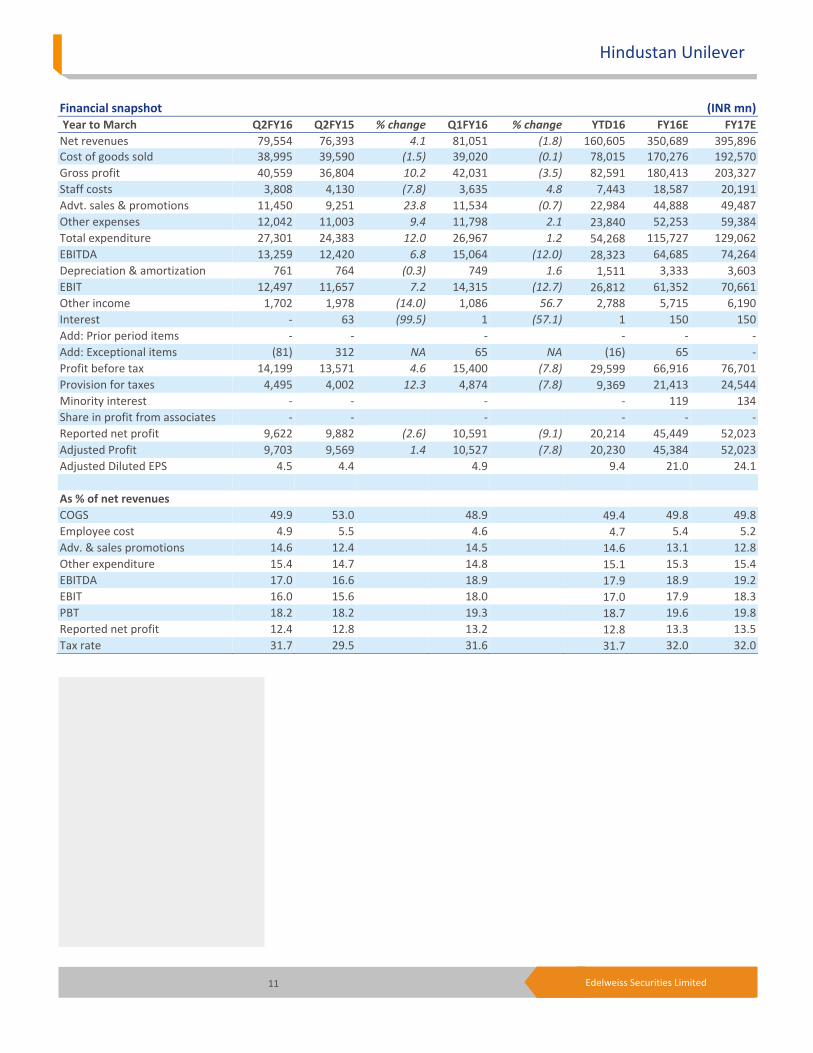
Financial snapshot (INR mn) Year to March Q2FY16 Q2FY15 % change Q1FY16 % change YTD16 FY16E FY17E
Net revenues 79,554 76,393 4.1 81,051 (1.8) 160,605 350,689 395,896 Cost of goods sold 38,995 39,590 (1.5) 39,020 (0.1) 78,015 170,276 192,570
Gross profit 40,559 36,804 10.2 42,031 (3.5) 82,591 180,413 203,327
Staff costs 3,808 4,130 (7.8) 3,635 4.8 7,443 18,587 20,191
Advt. sales & promotions 11,450 9,251 23.8 11,534 (0.7) 22,984 44,888 49,487
Other expenses 12,042 11,003 9.4 11,798 2.1 23,840 52,253 59,384
Total expenditure 27,301 24,383 12.0 26,967 1.2 54,268 115,727 129,062
EBITDA 13,259 12,420 6.8 15,064 (12.0) 28,323 64,685 74,264
Depreciation & amortization 761 764 (0.3) 749 1.6 1,511 3,333 3,603
EBIT 12,497 11,657 7.2 14,315 (12.7) 26,812 61,352 70,661
Other income 1,702 1,978 (14.0) 1,086 56.7 2,788 5,715 6,190
Interest ‐ 63 (99.5) 1 (57.1) 1 150 150
Add: Prior period items ‐ ‐ ‐ ‐ ‐ ‐
Add: Exceptional items (81) 312 NA 65 NA (16) 65 ‐
Profit before tax 14,199 13,571 4.6 15,400 (7.8) 29,599 66,916 76,701
Provision for taxes 4,495 4,002 12.3 4,874 (7.8) 9,369 21,413 24,544
Minority interest ‐ ‐ ‐ ‐ 119 134
Share in profit from associates ‐ ‐ ‐ ‐ ‐ ‐
Reported net profit 9,622 9,882 (2.6) 10,591 (9.1) 20,214 45,449 52,023
Adjusted Profit 9,703 9,569 1.4 10,527 (7.8) 20,230 45,384 52,023
Adjusted Diluted EPS 4.5 4.4 4.9 9.4 21.0 24.1
As % of net revenues
COGS 49.9 53.0 48.9 49.4 49.8 49.8
Employee cost 4.9 5.5 4.6 4.7 5.4 5.2
Adv. & sales promotions 14.6 12.4 14.5 14.6 13.1 12.8
Other expenditure 15.4 14.7 14.8 15.1 15.3 15.4
EBITDA 17.0 16.6 18.9 17.9 18.9 19.2
EBIT 16.0 15.6 18.0 17.0 17.9 18.3
PBT 18.2 18.2 19.3 18.7 19.6 19.8
Reported net profit 12.4 12.8 13.2 12.8 13.3 13.5
Tax rate 31.7 29.5 31.6 31.7 32.0 32.0

Consumer Goods
12 Edelweiss Securities Limited
Company Description
HUL, the largest FMCG Company in India, was formed by merging three subsidiaries of
Unilever in 1956. At present, Unilever Plc holds a 67.2% stake in the company. HUL’s
portfolio of products covers a wide spectrum including soaps, detergents, skin creams,
shampoos, toothpastes, tea, coffee, packaged foods and branded atta.
Powerful brands and an envious distribution network (direct coverage of 3.2mn outlets) are
HUL’s primary strengths. The company operates through segments—soaps & detergents,
personal products, beverages, foods, exports, and other operations. Investment Theme
HUL is a play on consumption growth in India. The company has displayed its ability to effect
price hikes and ability to grow ahead of market, which, combined with improved outlook for
S&D and personal care, and strong growth in processed foods and beverages, boosts our
positive outlook on the company. We like its revenue growth from a medium to long term
perspective. Commodity price correction will aid gross margin expansion though we expect
partial benefit to be passed on to customers through promotional offers/select price cuts.
We expect higher investment in A&P to support brand equity and counter pick up in
competitive intensity (especially from regional players). However with an anticipated
recovery in urban demand and commodity correction to aid EBITDA margin expansion, we
expect HUL to potentially benefit.
Key Risks
Depreciation in rupee impacts price of imported raw materials.
Ad spends likely to spike due to increased competition from regional players. Maintaining
market share will also be a challenge for HUL.
The price war in HUL’s popular segments with new entrants entering the fray could hit the
company hard.

13 Edelweiss Securities Limited
Hindustan Unilever
Financial Statements
Income statement (INR mn)
Year to March FY14 FY15 FY16E FY17E
Net revenue 285,394 311,997 342,192 386,549
Other Operating Income 6,943 7,725 8,497 9,347
Total operating income 292,337 319,722 350,689 395,896
Materials costs 148,700 161,761 170,276 192,570
Gross profit 143,637 157,961 180,413 203,327
Employee costs 15,727 17,239 18,587 20,191
Other Expenses 43,707 47,149 52,253 59,384
Advertisement & sales costs 36,747 39,436 44,888 49,487
EBITDA 47,457 54,137 64,685 74,264
Depreciation & Amortization 2,955 3,224 3,333 3,603
EBIT 44,501 50,913 61,352 70,661
Add: Other income 5,701 5,667 5,715 6,190
Less: Interest Expense 407 177 150 150
Add: Exceptional items 2,356 6,792 65 ‐
Profit Before Tax 49,796 56,403 66,916 76,701
Less: Provision for Tax 12,594 19,440 21,413 24,544
Less: Minority Interest 102 124 119 134
Reported Profit 39,456 43,631 45,449 52,023
Less: Exceptional Items (Net of 2,356 6,792 65 ‐
Adjusted Profit 37,100 36,839 45,384 52,023
No. of Shares outstanding (mn) 2,163 2,163 2,163 2,163
Adjusted Basic EPS 17.2 17.0 21.0 24.1
No. of Diluted shares outstanding 2,163 2,164 2,164 2,164
Adjusted Diluted EPS 17.2 17.0 21.0 24.0
Adjusted Cash EPS 18.5 18.5 22.5 25.7
Dividend per share (DPS) 13.0 15.0 15.8 18.0
Dividend Payout Ratio (%) 83.0 89.0 89.7 89.7
Common size metrics
Year to March FY14 FY15 FY16E FY17E
Materials costs 52.1 51.8 49.8 49.8
Staff costs 5.5 5.5 5.4 5.2
Advertising & sales costs 12.9 12.6 13.1 12.8
Interest Expense 0.1 0.1 ‐ ‐
EBITDA margins 16.6 17.4 18.9 19.2
Net Profit margins 13.0 11.8 13.3 13.5
Growth ratios (%)
Year to March FY14 FY15 FY16E FY17E
Revenues 8.4 9.3 9.7 13.0
EBITDA 12.8 14.1 19.5 14.8
Adjusted Profit 15.1 (0.7) 23.2 14.6
EPS 15.1 (0.8) 23.2 14.6
Key Assumptions
Year to March FY14 FY15 FY16E FY17E
Macro
GDP(Y‐o‐Y %) 6.9 7.4 8.0 8.7
Inflation (Avg) 9.5 5.9 5.0 5.0
Repo rate (exit rate) 8.0 7.5 6.8 6.5
USD/INR (Avg) 60.5 61.1 64.5 65.0
Company
Volume gr. (overall) 4.0 5.0 7.0 8.0
Pricing gr. (overall) 4.4 4.3 2.7 5.0
Growth in Soaps 6.2 7.8 5.0 10.0
Growth in Detergents 7.6 9.7 8.0 13.0
Growth in PP 8.9 11.1 14.0 15.0
Growth in beverages 11.3 9.6 12.0 13.0
Growth in packaged foods 9.5 14.8 13.0 18.0
EBITDA margin (%) 16.6 17.4 18.9 19.2
EBITDA margin assumptions
Oils, fats and resins as % of COGS 11.5 11.9 11.2 11.2
Chemicals and perfumes as % of COGS 32.9 31.4 31.0 30.9
Tea and Green leaf as % of COGS 9.0 9.1 7.0 6.8
Selling and distribution costs 15.0 14.7 14.9 15.0
A&P as % of sales 12.9 12.6 13.1 12.8
Employee cost as % of sales 5.5 5.5 5.4 5.2
Financial assumptions
Tax rate (%) 25.3 34.5 32.0 32.0
Capex (INR mn) 5,800 3,329 1,987 4,500
Debtor days 13 12 12 12
Inventory days 69 65 65 65
Payable days 137 128 128 128
Cash conversion cycle (days) (55) (51) (52) (52)
Depreciation as % of gross block 6.3 6.2 6.0 6.0
Yield on cash 10.6 9.9 10.0 9.5

14 Edelweiss Securities Limited
Consumer Goods
Peer comparison valuation
Market cap Diluted Price to Earnings Enterprise Value / EBITDA (X) Return on Average Equity
Name (USD mn) FY16E FY17E FY16E FY17E FY16E FY17E
Hindustan Unilever 27,039 38.0 33.2 25.7 22.3 106.2 108.6
Colgate 3,833 37.3 33.2 26.1 21.4 76.9 69.6
Dabur 7,318 37.1 30.9 29.9 24.8 34.7 34.6
Emami 3,816 55.5 41.1 30.6 23.5 32.0 35.4
GlaxoSmithKline Consumer Healthcare 3,911 35.2 29.7 25.3 20.6 31.4 31.6
Godrej Consumer 6,476 36.7 29.9 26.3 21.8 25.4 26.0
Marico 3,880 36.0 29.7 23.1 18.9 33.7 30.6
Nestle Ltd 9,118 85.7 45.3 39.7 24.5 23.2 37.5
AVERAGE ‐ 43.3 33.3 27.3 21.6 41.5 42.7
Source: Edelweiss research
Cash flow metrics
Year to March FY14 FY15 FY16E FY17E
Operating cash flow 38,182 31,238 50,854 58,334
Investing cash flow (4,750) 3,061 (1,987) (4,500)
Financing cash flow (29,603) (34,624) (40,851) (46,812)
Net cash Flow 3,829 (325) 8,016 7,021
Capex (5,800) (3,329) (1,987) (4,500)
Dividend paid (32,730) (38,812) (40,766) (46,662)
Profitability and efficiency ratios
Year to March FY14 FY15 FY16E FY17E
Return on Average Equity (ROAE) 115.4 97.2 106.2 108.6
Pre‐tax Return on Capital 154.1 147.1 154.9 158.6
Inventory Days 13 12 12 12
Debtors Days 69 65 65 65
Payable Days 137 128 128 128
Cash Conversion Cycle (55) (51) (52) (52)
Current Ratio 1.1 1.2 1.2 1.2
Gross Debt/EBITDA ‐ ‐ ‐ ‐
Net Debt/Equity (1.4) (1.3) (1.4) (1.3)
Interest Coverage Ratio 109.4 287.6 409.0 471.1
Operating ratios
Year to March FY14 FY15 FY16E FY17E
Total Asset Turnover 6.6 6.4 6.5 6.6
Fixed Asset Turnover 11.0 11.2 11.9 13.0
Equity Turnover 8.9 8.2 8.0 8.1
Valuation parameters
Year to March FY14 FY15 FY16E FY17E
Adjusted Diluted EPS (INR) 17.2 17.0 21.0 24.0
Y‐o‐Y growth (%) 15.1 (0.8) 23.2 14.6
Adjusted Cash EPS (INR) 18.5 18.5 22.5 25.7
Diluted Price to Earnings Ratio 46.5 46.8 38.0 33.2
Price to Book Ratio (P/B) (x) 48.7 42.9 38.4 34.3
Enterprise Value / Sales (x) 5.9 5.4 4.9 4.3
Enterprise Value / EBITDA (x) 35.3 30.9 25.7 22.3
Dividend Yield (%) 1.6 1.9 2.0 2.3
Balance sheet (INR mn)
As on 31st March FY14 FY15 FY16E FY17E
Share capital 2,163 2,164 2,164 2,164
Reserves & Surplus 33,210 38,053 42,736 48,097
Shareholders' funds 35,373 40,216 44,900 50,260
Minority Interest 223 248 367 501
Total Borrowings 456 430 430 430
Long Term Liabilities & Provisions 12,692 11,718 11,718 11,718
Deferred Tax Liability (net) (1,796) (1,994) (1,994) (1,994)
Sources of funds 46,948 50,619 55,421 60,915
Gross Block 49,977 53,306 57,806 62,306
Net Block 26,409 27,178 28,345 29,241
Capital work in progress 3,649 5,163 2,650 2,650
Intangible Assets 1,130 1,032 1,032 1,032
Total Fixed Assets 31,188 33,373 32,027 32,923
Non current investments 3,802 3,239 3,239 3,239
Cash and cash equivalents 49,740 53,907 61,923 68,944
Inventories 29,398 28,488 30,323 34,293
Sundry Debtors 10,168 10,112 11,049 12,473
Loans & Advances 10,513 12,340 12,340 12,340
Other Current Assets 934 851 851 851
Total Current Assets (ex cash) 51,013 51,791 54,564 59,958
Trade payable 58,249 55,073 59,713 67,531
Other Current Liabilities & Short 30,546 36,618 36,618 36,618
Total Current Liabilities & 88,795 91,692 96,332 104,150
Net Current Assets (ex cash) (37,782) (39,900) (41,768) (44,191)
Uses of funds 46,948 50,619 55,421 60,915
Book Value per share (INR) 16.4 18.6 20.7 23.2
Free cash flow (INR mn)
Year to March FY14 FY15 FY16E FY17E
Reported Profit 39,456 43,631 45,449 52,023
Add: Depreciation 2,955 3,224 3,333 3,603
Interest (Net of Tax) 304 116 102 102
Others (6,823) (13,524) 102 182
Less: Changes in WC (2,290) 2,209 (1,868) (2,424)
Operating cash flow 38,182 31,238 50,854 58,334
Less: Capex 5,800 3,329 1,987 4,500
Free Cash Flow 32,382 27,909 48,867 53,834

15 Edelweiss Securities Limited
Hindustan Unilever
Holding – Top10
Perc. Holding Perc. Holding
Life Insurance Corp Of India 1.1 Vanguard Group Inc 1.0
Aberdeen Asset Management Asia 0.9 Blackrock Fund Advisors 0.9
Virtus Investment Advisers Inc 0.7 Aberdeen Asset Management Plc 0.6
William Blair & Company Llc 0.5 Vontobel Asset Management Ag 0.4
Bajaj Allianz Life Insurance Co 0.3 Lyxor International Asset Mgmt 0.2
*as per last available data
Insider Trades Reporting Data Acquired / Seller B/S Qty Traded
No Data Available
*in last one year
Bulk Deals Data Acquired / Seller B/S Qty Traded Price
No Data Available
*in last one year
Additional Data
Directors Data Mr. Harish Manwani Chairman Mr. Sanjiv Mehta Managing Director and Chief Executive Officer
Mr. Sridhar Ramamurthy Executive Director, Finance & IT and Chief Financial Officer Mr. Pradeep Banerjee Executive Director, Supply Chain
Mr. A. Narayan Independent Director Mr. S. Ramadorai Independent Director
Mr. R. A. Mashelkar Independent Director Mr. O. P. Bhatt Independent Director
Dr. Sanjiv Misra Independent Director
Auditors ‐ M/s. Lovelock & Lewes
*as per last annual report

16 Edelweiss Securities Limited
Company Absolute
reco Relative
reco Relative
risk
Company Absolute
reco
Relative
reco
Relative
Risk
Asian Paints BUY SO M Bajaj Corp HOLD SP H
Colgate HOLD SP M Dabur BUY SO M
Emami BUY SO H GlaxoSmithKline Consumer
Healthcare
HOLD SP M
Godrej Consumer BUY SO H Hindustan Unilever HOLD SP L
ITC HOLD SU M Marico BUY SO M
Nestle Ltd REDUCE SU L Pidilite Industries BUY SO M
United Spirits BUY SO H
RATING & INTERPRETATION
ABSOLUTE RATING
Ratings Expected absolute returns over 12 months
Buy More than 15%
Hold Between 15% and - 5%
Reduce Less than -5%
RELATIVE RETURNS RATING
Ratings Criteria
Sector Outperformer (SO) Stock return > 1.25 x Sector return
Sector Performer (SP) Stock return > 0.75 x Sector return
Stock return < 1.25 x Sector return
Sector Underperformer (SU) Stock return < 0.75 x Sector return
Sector return is market cap weighted average return for the coverage universe within the sector
RELATIVE RISK RATING
Ratings Criteria
Low (L) Bottom 1/3rd percentile in the sector
Medium (M) Middle 1/3rd percentile in the sector
High (H) Top 1/3rd percentile in the sector
Risk ratings are based on Edelweiss risk model
SECTOR RATING
Ratings Criteria
Overweight (OW) Sector return > 1.25 x Nifty return
Equalweight (EW) Sector return > 0.75 x Nifty return
Sector return < 1.25 x Nifty return
Underweight (UW) Sector return < 0.75 x Nifty return

17 Edelweiss Securities Limited
Hindustan Unilever
Edelweiss Securities Limited, Edelweiss House, off C.S.T. Road, Kalina, Mumbai – 400 098.
Board: (91‐22) 4009 4400, Email: [email protected]
Nirav Sheth
Head Research
Coverage group(s) of stocks by primary analyst(s): Consumer Goods
Asian Paints, Bajaj Corp, Colgate, Dabur, Godrej Consumer , Emami, Hindustan Unilever, ITC, Marico, Nestle Ltd, Pidilite Industries, GlaxoSmithKline Consumer Healthcare, United Spirits
Distribution of Ratings / Market Cap
Edelweiss Research Coverage Universe
Rating Distribution* 155 45 8 208* stocks under review
Market Cap (INR) 151 54 3
Date Company Title Price (INR) Recos
Recent Research
08‐Oct‐15 Bajaj Corp Resilient margin boosts show; Result Update
440 Hold
06‐Oct‐15 Consumer Goods
Margin succour; Result preview
01‐Oct‐15 Colgate Palmolive
MD meeting: Sharpening bite; Visit Note
962 Hold
> 50bn Between 10bn and 50 bn < 10bn
Buy Hold Reduce Total
Rating Interpretation
Buy appreciate more than 15% over a 12‐month period
Hold appreciate up to 15% over a 12‐month period
Reduce depreciate more than 5% over a 12‐month period
Rating Expected to
One year price chart
573
693
813
932
1,052
1,172
Oct‐14
Nov‐14
Dec‐14
Jan‐15
Feb‐15
Mar‐15
Apr‐15
May‐15
Jun‐15
Jul‐15
Aug‐15
Sep‐15
Oct‐15
(INR)
Hindustan Unilever
18 Edelweiss Securities Limited
Consumer Goods
DISCLAIMER
Edelweiss Securities Limited (“ESL” or “Research Entity”) is regulated by the Securities and Exchange Board of India (“SEBI”) and is licensed to carry on the business of broking, depository services and related activities. The business of ESL and its Associates (list available on www.edelweissfin.com) are organized around five broad business groups – Credit including Housing and SME Finance, Commodities, Financial Markets, Asset Management and Life Insurance.
This Report has been prepared by Edelweiss Securities Limited in the capacity of a Research Analyst having SEBI Registration No.INH200000121 and distributed as per SEBI (Research Analysts) Regulations 2014. This report does not constitute an offer or solicitation for the purchase or sale of any financial instrument or as an official confirmation of any transaction. Securities as defined in clause (h) of section 2 of the Securities Contracts (Regulation) Act, 1956 includes Financial Instruments and Currency Derivatives. The information contained herein is from publicly available data or other sources believed to be reliable. This report is provided for assistance only and is not intended to be and must not alone be taken as the basis for an investment decision. The user assumes the entire risk of any use made of this information. Each recipient of this report should make such investigation as it deems necessary to arrive at an independent evaluation of an investment in Securities referred to in this document (including the merits and risks involved), and should consult his own advisors to determine the merits and risks of such investment. The investment discussed or views expressed may not be suitable for all investors.
This information is strictly confidential and is being furnished to you solely for your information. This information should not be reproduced or redistributed or passed on directly or indirectly in any form to any other person or published, copied, in whole or in part, for any purpose. This report is not directed or intended for distribution to, or use by, any person or entity who is a citizen or resident of or located in any locality, state, country or other jurisdiction, where such distribution, publication, availability or use would be contrary to law, regulation or which would subject ESL and associates / group companies to any registration or licensing requirements within such jurisdiction. The distribution of this report in certain jurisdictions may be restricted by law, and persons in whose possession this report comes, should observe, any such restrictions. The information given in this report is as of the date of this report and there can be no assurance that future results or events will be consistent with this information. This information is subject to change without any prior notice. ESL reserves the right to make modifications and alterations to this statement as may be required from time to time. ESL or any of its associates / group companies shall not be in any way responsible for any loss or damage that may arise to any person from any inadvertent error in the information contained in this report. ESL is committed to providing independent and transparent recommendation to its clients. Neither ESL nor any of its associates, group companies, directors, employees, agents or representatives shall be liable for any damages whether direct, indirect, special or consequential including loss of revenue or lost profits that may arise from or in connection with the use of the information. Our proprietary trading and investment businesses may make investment decisions that are inconsistent with the recommendations expressed herein. Past performance is not necessarily a guide to future performance .The disclosures of interest statements incorporated in this report are provided solely to enhance the transparency and should not be treated as endorsement of the views expressed in the report. The information provided in these reports remains, unless otherwise stated, the copyright of ESL. All layout, design, original artwork, concepts and other Intellectual Properties, remains the property and copyright of ESL and may not be used in any form or for any purpose whatsoever by any party without the express written permission of the copyright holders.
ESL shall not be liable for any delay or any other interruption which may occur in presenting the data due to any reason including network (Internet) reasons or snags in the system, break down of the system or any other equipment, server breakdown, maintenance shutdown, breakdown of communication services or inability of the ESL to present the data. In no event shall ESL be liable for any damages, including without limitation direct or indirect, special, incidental, or consequential damages, losses or expenses arising in connection with the data presented by the ESL through this report.
We offer our research services to clients as well as our prospects. Though this report is disseminated to all the customers simultaneously, not all customers may receive this report at the same time. We will not treat recipients as customers by virtue of their receiving this report.
ESL and its associates, officer, directors, and employees, research analyst (including relatives) worldwide may: (a) from time to time, have long or short positions in, and buy or sell the Securities, mentioned herein or (b) be engaged in any other transaction involving such Securities and earn brokerage or other compensation or act as a market maker in the financial instruments of the subject company/company(ies) discussed herein or act as advisor or lender/borrower to such company(ies) or have other potential/material conflict of interest with respect to any recommendation and related information and opinions at the time of publication of research report or at the time of public appearance. ESL may have proprietary long/short position in the above mentioned scrip(s) and therefore should be considered as interested. The views provided herein are general in nature and do not consider risk appetite or investment objective of any particular investor; readers are requested to take independent professional advice before investing. This should not be construed as invitation or solicitation to do business with ESL.

19 Edelweiss Securities Limited
Hindustan Unilever
ESL or its associates may have received compensation from the subject company in the past 12 months. ESL or its associates may have managed or co‐managed public offering of securities for the subject company in the past 12 months. ESL or its associates may have received compensation for investment banking or merchant banking or brokerage services from the subject company in the past 12 months. ESL or its associates may have received any compensation for products or services other than investment banking or merchant banking or brokerage services from the subject company in the past 12 months. ESL or its associates have not received any compensation or other benefits from the Subject Company or third party in connection with the research report. Research analyst or his/her relative or ESL’s associates may have financial interest in the subject company. ESL and/or its Group Companies, their Directors, affiliates and/or employees may have interests/ positions, financial or otherwise in the Securities/Currencies and other investment products mentioned in this report. ESL, its associates, research analyst and his/her relative may have other potential/material conflict of interest with respect to any recommendation and related information and opinions at the time of publication of research report or at the time of public appearance.
Participants in foreign exchange transactions may incur risks arising from several factors, including the following: ( i) exchange rates can be volatile and are subject to large fluctuations; ( ii) the value of currencies may be affected by numerous market factors, including world and national economic, political and regulatory events, events in equity and debt markets and changes in interest rates; and (iii) currencies may be subject to devaluation or government imposed exchange controls which could affect the value of the currency. Investors in securities such as ADRs and Currency Derivatives, whose values are affected by the currency of an underlying security, effectively assume currency risk.
Research analyst has served as an officer, director or employee of subject Company: No
ESL has financial interest in the subject companies: No
ESL’s Associates may have actual / beneficial ownership of 1% or more securities of the subject company at the end of the month immediately preceding the date of publication of research report.
Research analyst or his/her relative has actual/beneficial ownership of 1% or more securities of the subject company at the end of the month immediately preceding the date of publication of research report: No
ESL has actual/beneficial ownership of 1% or more securities of the subject company at the end of the month immediately preceding the date of publication of research report: No
Subject company may have been client during twelve months preceding the date of distribution of the research report.
There were no instances of non‐compliance by ESL on any matter related to the capital markets, resulting in significant and material disciplinary action during the last three years except that ESL had submitted an offer of settlement with Securities and Exchange commission, USA (SEC) and the same has been accepted by SEC without admitting or denying the findings in relation to their charges of non registration as a broker dealer.
A graph of daily closing prices of the securities is also available at www.nseindia.com
Analyst Certification:
The analyst for this report certifies that all of the views expressed in this report accurately reflect his or her personal views about the subject company or companies and its or their securities, and no part of his or her compensation was, is or will be, directly or indirectly related to specific recommendations or views expressed in this report.
Additional Disclaimers
Disclaimer for U.S. Persons
This research report is a product of Edelweiss Securities Limited, which is the employer of the research analyst(s) who has prepared the research report. The research analyst(s) preparing the research report is/are resident outside the United States (U.S.) and are not associated persons of any U.S. regulated broker‐dealer and therefore the analyst(s) is/are not subject to supervision by a U.S. broker‐dealer, and is/are not required to satisfy the regulatory licensing requirements of FINRA or required to otherwise comply with U.S. rules or regulations regarding, among other things, communications with a subject company, public appearances and trading securities held by a research analyst account.
This report is intended for distribution by Edelweiss Securities Limited only to "Major Institutional Investors" as defined by Rule 15a‐6(b)(4) of the U.S. Securities and Exchange Act, 1934 (the Exchange Act) and interpretations thereof by U.S. Securities and Exchange Commission (SEC) in reliance on Rule 15a 6(a)(2). If the recipient of this report is not a Major Institutional Investor as specified above, then it should not act upon this report and return the same to the sender. Further, this report may not be copied, duplicated and/or transmitted onward to any U.S. person, which is not the Major Institutional Investor.
20 Edelweiss Securities Limited
Consumer Goods
Access the entire repository of Edelweiss Research on www.edelresearch.com
In reliance on the exemption from registration provided by Rule 15a‐6 of the Exchange Act and interpretations thereof by the SEC in order to conduct certain business with Major Institutional Investors, Edelweiss Securities Limited has entered into an agreement with a U.S. registered broker‐dealer, Edelweiss Financial Services Inc. ("EFSI"). Transactions in securities discussed in this research report should be effected through Edelweiss Financial Services Inc. Disclaimer for U.K. Persons
The contents of this research report have not been approved by an authorised person within the meaning of the Financial Services and Markets Act 2000 ("FSMA"). In the United Kingdom, this research report is being distributed only to and is directed only at (a) persons who have professional experience in matters relating to investments falling within Article 19(5) of the FSMA (Financial Promotion) Order 2005 (the “Order”); (b) persons falling within Article 49(2)(a) to (d) of the Order (including high net worth companies and unincorporated associations); and (c) any other persons to whom it may otherwise lawfully be communicated (all such persons together being referred to as “relevant persons”). This research report must not be acted on or relied on by persons who are not relevant persons. Any investment or investment activity to which this research report relates is available only to relevant persons and will be engaged in only with relevant persons. Any person who is not a relevant person should not act or rely on this research report or any of its contents. This research report must not be distributed, published, reproduced or disclosed (in whole or in part) by recipients to any other person. Disclaimer for Canadian Persons
This research report is a product of Edelweiss Securities Limited ("ESL"), which is the employer of the research analysts who have prepared the research report. The research analysts preparing the research report are resident outside the Canada and are not associated persons of any Canadian registered adviser and/or dealer and, therefore, the analysts are not subject to supervision by a Canadian registered adviser and/or dealer, and are not required to satisfy the regulatory licensing requirements of the Ontario Securities Commission, other Canadian provincial securities regulators, the Investment Industry Regulatory Organization of Canada and are not required to otherwise comply with Canadian rules or regulations regarding, among other things, the research analysts' business or relationship with a subject company or trading of securities by a research analyst. This report is intended for distribution by ESL only to "Permitted Clients" (as defined in National Instrument 31‐103 ("NI 31‐103")) who are resident in the Province of Ontario, Canada (an "Ontario Permitted Client"). If the recipient of this report is not an Ontario Permitted Client, as specified above, then the recipient should not act upon this report and should return the report to the sender. Further, this report may not be copied, duplicated and/or transmitted onward to any Canadian person. ESL is relying on an exemption from the adviser and/or dealer registration requirements under NI 31‐103 available to certain international advisers and/or dealers. Please be advised that (i) ESL is not registered in the Province of Ontario to trade in securities nor is it registered in the Province of Ontario to provide advice with respect to securities; (ii) ESL's head office or principal place of business is located in India; (iii) all or substantially all of ESL's assets may be situated outside of Canada; (iv) there may be difficulty enforcing legal rights against ESL because of the above; and (v) the name and address of the ESL's agent for service of process in the Province of Ontario is: Bamac Services Inc., 181 Bay Street, Suite 2100, Toronto, Ontario M5J 2T3 Canada. Disclaimer for Singapore Persons
In Singapore, this report is being distributed by Edelweiss Investment Advisors Private Limited ("EIAPL") (Co. Reg. No. 201016306H) which is a holder of a capital markets services license and an exempt financial adviser in Singapore and (ii) solely to persons who qualify as "institutional investors" or "accredited investors" as defined in section 4A(1) of the Securities and Futures Act, Chapter 289 of Singapore ("the SFA"). Pursuant to regulations 33, 34, 35 and 36 of the Financial Advisers Regulations ("FAR"), sections 25, 27 and 36 of the Financial Advisers Act, Chapter 110 of Singapore shall not apply to EIAPL when providing any financial advisory services to an accredited investor (as defined in regulation 36 of the FAR. Persons in Singapore should contact EIAPL in respect of any matter arising from, or in connection with this publication/communication. This report is not suitable for private investors.
Copyright 2009 Edelweiss Research (Edelweiss Securities Ltd). All rights reserved