Embed Size (px)
Citation preview

Hindustan Unilever Limited
S SrinivasanVP Treasury M&A & Investor Relations
Hindustan Unilever Ltd.11th & 12th March, 2008
Investor PresentationCitigroup India Conference

2Safe harbour statementThis Release / Communication, except for the historical information, may contain statements, including the words or phrases such as ‘expects, anticipates, intends, will, would, undertakes, aims, estimates, contemplates, seeks to, objective, goal, projects, should’ and similar expressions or variations of these expressions or negatives of these terms indicating future performance or results, financial or otherwise, which are forward looking statements. These forward looking statements are based on certain expectations, assumptions, anticipated developments and other factors which are not limited to, risk and uncertainties regarding fluctuations in earnings, market growth, intense competition and the pricing environment in the market, consumption level, ability to maintain and manage key customer relationship and supply chain sources and those factors which may affect our ability to implement business strategies successfully, namely changes in regulatory environments, political instability, change in international oil prices and input costs and new or changed priorities of the trade. The Company, therefore, cannot guarantee that the forward looking statements made herein shall be realized. The Company, based on changes as stated above, may alter, amend, modify or make necessary corrective changes in any manner to any such forward looking statement contained herein or make written or oral forward looking statements as may be required from time to time on the basis of subsequent developments and events. The Company does not undertake any obligation to update forward looking statements that may be made from time to time by or on behalf of the Company to reflect the events or circumstances after the date hereof.

3Agenda
Financials & Summary
Overview
India Opportunity
HUL - Uniquely Placed

4Agenda
Financials & Summary
Overview
India Opportunity
HUL - Uniquely Placed

5
•
••
••
••
•
•
••
••
• ••
• •
•
•
• •••
•
••
••
••••
••
•••
•
•
* Source: (1) Statistics on India, Total Coverage : AC Nielsen, Census of India 2001 (2) Statistics on Market reach : MRUC, Hansa Research - Guide to Indian Markets 2006(3) P&G Turnover estimated turnover of PG HH, PG HP and Gillette(4) Turnover 2007 for all companies as per published accounts, where available
Hindustan Unilever – a 75year history
Population 1027 Mln5,545 Towns 2.5 Mln outlets
6,38,000 Villages 5.0 Mln outlets
~ 15,000 employees
~ 1,200 managers
~ 2,000 suppliers & associates
~ 75 Manufacturing Locations
~ 45 C&FAs, 4,000 Stockists
~ Total Coverage 6.3 Mln Outlets
~ Direct Coverage 1 Mln outlets
847 631 540 476 388 361 323 308 218
3473
HU
L
Nes
tle
Brita
nnia
PGC
ombi
ned
Dab
ur
Mar
ico
Col
gate
GSK
Tata
Tea
God
rej C
P
3.32.1 1.5 1.3 1.0 0.9 0.7 0.7 0.6
11.5
HUL Nestle Dabur Colgate Tata Tea Marico Britannia Godrej GSK P&G
Market Cap $ BlnTurnover $ Mln

6
Source : A.C Nielsen - Quarter Ended Dec 2007 Value shares
Leadership across Diverse FMCG Categories
67.5
3.4
44.0
22.7
59.7
47.854.557.354.3
37.5 39.1
20.814.5
23.7
7.48.79.713.6
FabricWash
PersonalWash
PacketTea
Skin Shampoo TalcumPowder
Dishwash Jams
28.129.5 30.3
48.8
Toothpaste Ketchups
Market Leader Strong No. 2
HUL – Market Share (%) Competition Market Share (%)
Coffee

7
* Figures based on FY 2007 Audited Results ++ Market Capitalization as per NSE as on 6th Feb 2008
Financial Overview 2007
Exports10%
PersonalProducts
26%
Icecreams1%
Processed Foods
4%
Breverages11%
Soaps and Detergents
46%
Others2%
Turnover 3473
EBIT 499
EBIT % 14.4%
PAT (bei) 448
Reported Profit 487
EPS 21c
Market Capitalisation ~11500
Operating Cash Flow 419
Mn $

8Agenda
Financials & Summary
Overview
India Opportunity
HUL - Uniquely Placed

9Opportunities & Challenges
India and its consuming class
Increasing per capita income drives FMCG growth
Opportunity to grow consumption and penetration
Large scale potential to grow Foods
Evolving trade structure

10India: Leading Emerging market Economy
10.0%
8.4%
6.5%
4.5% 4.20% 4.0%
3.0%
0.0%
1.0%
2.0%
3.0%
4.0%
5.0%
6.0%
7.0%
8.0%
9.0%
10.0%
China India Russia Thailand SouthAfrica
Brazil Mexico
Leading Economies in the WorldUSD Billion (PPP basis, 2006)
12,980
10,000
4,220 4,0422,585 1,723 1,616
USA China Japan India Germany Russia Brazil
5.43.9 4.5
6.97.9
9.09.7
8.9 8.4
0.0
2.0
4.0
6.0
8.0
10.0
12.0
2000 2001 2002 2003 2004 2005 2006 2007 20080
200
400
600
800
1000
1200
GDP Growth Per Capita Income
Per capita Disposable Income ($)* Source Euromonitor
424461
494 505551
599
2002 2003 2004 2005 2006 2007

11Favourable Demographics
15
25
35
45
55
Europe US China World India
2005 2020
Population below 25 years(%)
(26)
20
24
31
(10)
58
198
(50) 0 50 100 150 200 250
Europe 497
US 200
Brazil 123
Indonesia 147
Japan 85
China 934
India 691
Country People in 15-64 age group (m)
Additions to population in 15-64 age group during 2005-2020 (m)
10
15
20
25
30
35
40
45
1950 1960 1970 1980 1990 2000 2010 2020 2030
(% of total population)
Urban population as a % of total
Age-wise Population Distribution(2006)
* Family Budget Study

12India - 2013
2003181 mn hhlds
131
46
3
2013231 mn hhlds
124
11
96
Affluent
Aspirers
Strivers
Source : National Council of Agriculture & Economic Research
The shape of India is going to change…from a pyramid to a diamond
Rich ClassesTop End Business
Changing attitudes
Trebling
Credit Culture
B.O.P Opportunity
Aspiring Classes
Striving Classes
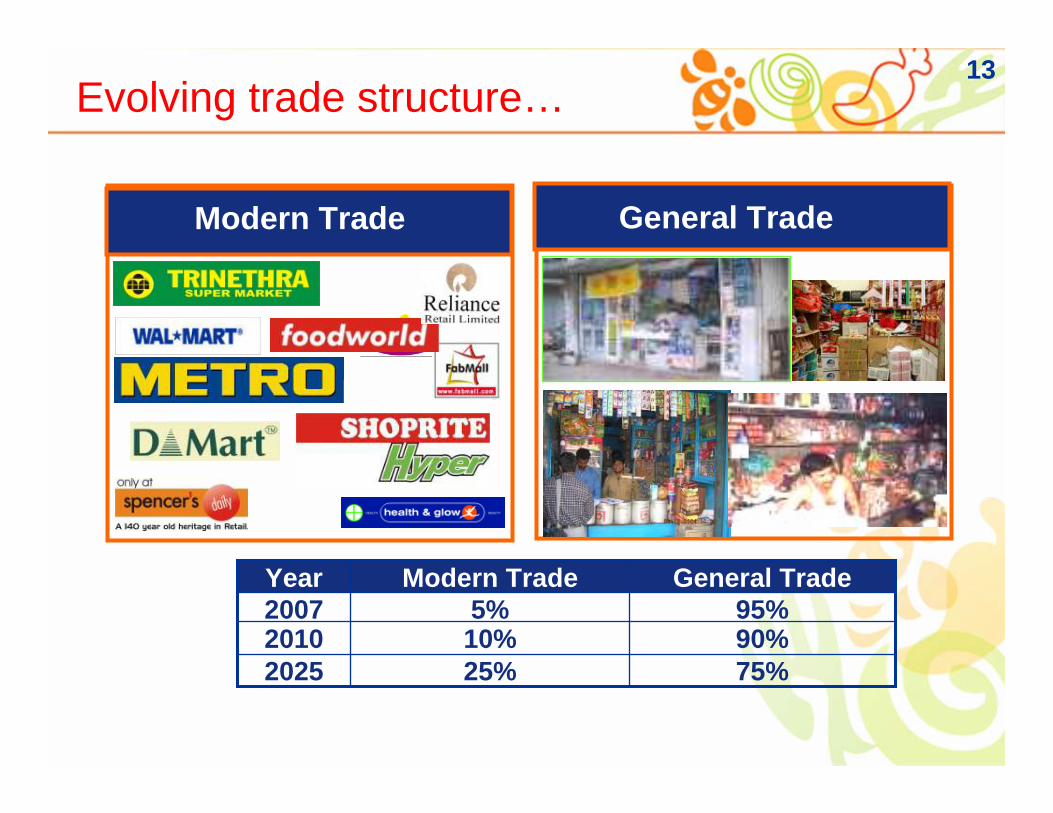
13Evolving trade structure…
General TradeModern Trade
90%10%201075%25%2025
95%5%2007General TradeModern TradeYear

14
Per Capita disposable Income (USD)
HPC
Spe
nd P
er C
apita
(USD
)
Source: Euromonitor, Morgan Stanley Research’ 2006
Per capita incomes drive consumption
Disposable income per capita vs HPC spend per capita
Increasing per capita income drives FMCG growth
R2 = 0.8627
0
100
200
300
400
500
0 5000 10000 15000 20000 25000 30000 35000
India

15
22.916.6
12.1
1.92.21.4India China Indonesia Brazil Germany USA
7.56.76.0
1.01.00.3
India China Indonesia Brazil USA Germany
Per Capita Consumption (US $ )
Source : Euromonitor, 2006
1.0 3.0 5.9
33.9
49.4
0.2
India Indonesia China Brazil Germany USA
3.2 0.8
12.2
26.9
36.6
0.3
India China Indonesia Brazil USA Germany
Opportunity to grow consumption
Detergents Shampoo
Ice Creams Skin care
India India
India India
Mkt Size Mln. $ 2247 Mkt Size Mln. $ 542
Mkt Size Mln. $ 698

16
Source : MRUC, Hansa Research - Guide to Indian Markets 2006
*Penetration numbers based on study conducted by Indian Readership Survey, on a sample size of ~250,000 based on usage in 6 months
Penetration %*
Category All India % Urban % Rural %
Deodorants 2.1 5.5 0.6
Toothpaste 48.6 74.9 37.6
Skin Cream 22.0 31.5 17.8
Shampoo 38.0 52.1 31.9
Utensil Cleaner 28.0 59.9 14.6
Instant Coffee 6.6 15.5 2.8
Washing Powder 86.1 90.7 84.1
Detergent Bar 88.6 91.4 87.4
Toilet Soap 91.5 97.4 88.9
Opportunity to grow penetration

17Foods Opportunity…
Packaged Food Market $14 Billion
Largely Urban (80%), rapid historical growth: 13%
Poised to accelerate: Income Elasticity of 1.33
Source: Euromonitor, Family Budget Study
196
2137
196
75
14
138
6.6
3.8
2.3
5.2
Eastern Europe Latin America Africa and WestAsia
India
HPC Market Size
Food Market
Ratio of Food Market to HPMC Market
Bln. $
Unpackaged 95%
Packaged 5%
But bulk of food is still consumed fresh….unpackaged
18Agenda
Financials & Summary
Overview
India Opportunity
HUL - Uniquely Placed

19HUL – Uniquely Positioned to Create Value
Our Strategy
Competitive Strengths
Innovation and R&D capabilities to straddle the pyramid
Versatile distribution network
Strong Corporate Responsibility and Governance
Strong Local talent base

20Our vision
To earn the love and respectof India, by making a real difference to every Indian.

21
Grow ahead of the market by leading market development activities
Leverage positive impact of growing Indian economy on consumer spending
Grow a profitable foods and Top end business
Grow the bottom-line ahead of top line
Strong commitment to sustainable development
Our Strategy

22An unmatched brand portfolio
6 MEGA BRANDS ~ $ 150 to 200 mn each, 53% FMCG portfolio

23Portfolio straddling the pyramid across categories
Affluent
Aspiring
Striving
CoffeeTeaToothpasteSkinShampooSoapsLaundryParticulars
177111369169854216582247Market Size - $ mln
13.6%
37.5%
39.1%20.8%48.8%7.4%23.7%9.7%Nearest Competitor
44.0%22.7%29.5%54.5%47.8%54.3%HUL Share

24
Laundry Market Shares
34.534.1 34.3 34.6
35.2
36.537.0
37.5
Q1-06 Q2-06 Q3-06 Q4-06 Q1-07 Q2-07 Q3-07 Q4-07
Category Leadership: Laundry
Affluent
Aspiring
Striving
25
PR
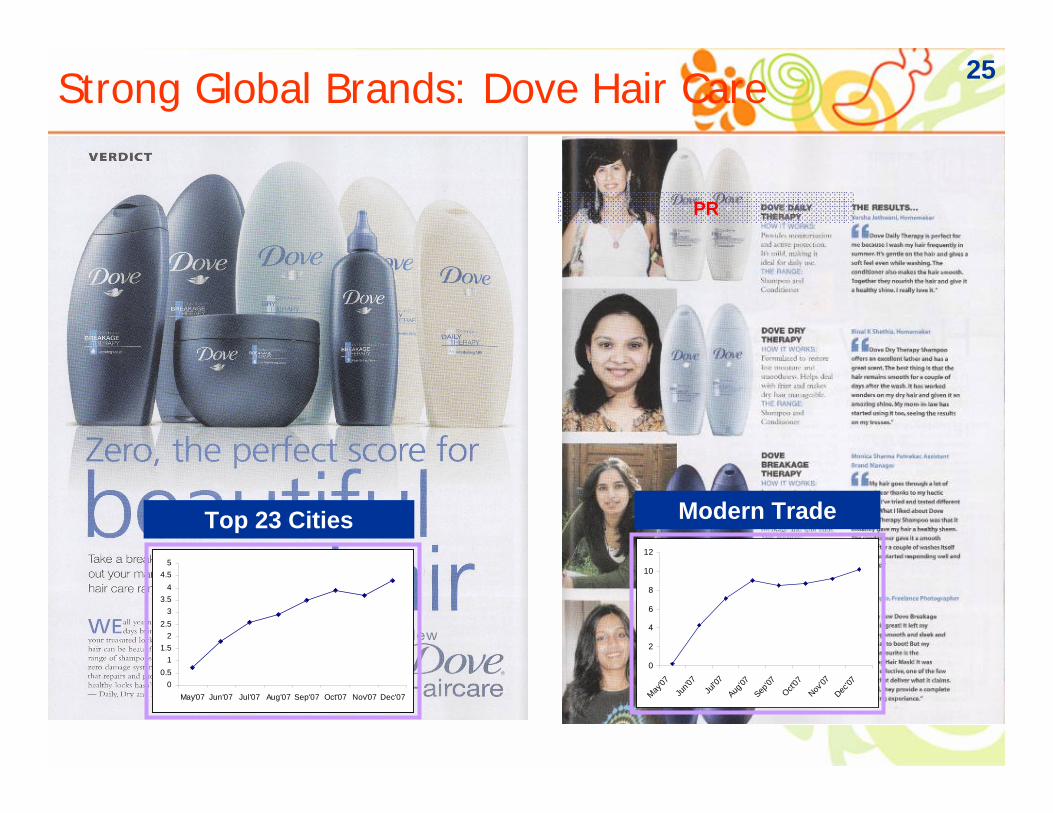
Strong Global Brands: Dove Hair Care
00.5
11.5
22.5
33.5
44.5
5
May'07 Jun'07 Jul'07 Aug'07 Sep'07 Oct'07 Nov'07 Dec'07
0
2
4
6
8
10
12
May'07
Jun'0
7
Jul'07
Aug'07
Sep'07
Oct'07
Nov'07
Dec'07
Top 23 Cities Modern Trade

26
• Superior Product- Well trained Beauty Advisors- Product Knowledge- Skin Analysis methodology- Creating Awareness among the target consumer
Building Category: Ponds Top End
•98+% feel Ponds Age Miracle has made a visible difference to them
•Gained ~1.5% market share in 6 months post launch

27Building category- Processed Foods
Hhld Panel PenetrationKetchup 17%
Large snacking moments
Snack % HHlds
Potato Chips 37Mixture 43Bhajiya 27
Muri (east) 27
Snacking incidence
… but low ketchup penetration
North 21%
Metros31%
East25%
South7%
West16%
Conversion Conversion from home from home
made dips in made dips in ethnic snacking ethnic snacking
occasions occasions
Launched in Q407
Chatakdaar
26.025.5
26.9
28.1
Jan - Mar 07 Apr - Jun 07 Jul - Sep 07 Oct - Dec 07

28Growing ‘Out of Home’ OpportunityGrowing incidence of Out of Home consumption Creating a Large &Growing Market
– 58% LSM 8+ consumers work between 9 a.m. to 6 p.m.– Market in Premium channel estimated at 1500 cr. Growing at 23% p.a.
HUL uniquely poised to unlock the opportunity– Dominant presence in both tea coffee & soup – Currently serve 1.7 bill cups per annum
Appropriate customer/ consumer solutions to unlock value
Leverage key relationships for accelerated growth:
Cardamom Tea, Bru Coffee,Tea Bag Tea
Penetration
Freshly brewed coffee, Ice Tea &
Cold coffee
Masstige
Connoisseur Tea Bags, Turbo Tea
Topend
ProductsSolutionSegment

29Amaze: Brain FoodAmaze: Brain Food
IronIodine
Omega-3
Protein
Vitamin A
Vitamin C
Vitamin B2
Zinc
Folate
Vitamin B6
Vitamin B12
• Why Amaze:Each serving provides the right type of brain nutrients, in the right combination, giving children 33% of the daily required dosage for their mental development.”
Iron = half Kg of spinachVitamin C = 1 orangeVitamin A = 2 mangoesCalcium = 4 boiled eggsVitamin B6 = 4 tomatoesFolate = 1 cup of cooked rice
Every product also includes Omega 3&6, which are building blocks of the brain.
• What Scientist say:– The school-going period is a critical
period for a child’s brain development – Functions like reasoning, problem
solving, planning, memory develop at this age.
31

30
COST220 liters of pure water for $ 1
Proposition: ‘as safe as boiled water’ without hassles of boiling
no harmful virus, bacteria, parasites, pesticides
Works without electricity & piped water
Business model based on sale of consumables
Water
~ 220 Mln Households, where safe drinking water in short supplyContext
Affordable price: Cost of Unit - ~$ 45; Cost of battery - $ 7
Being Rolled out across key towns and urban areas
Our Strategy
Build brand image leadership & strong consumer relationship through effective communication; secure ongoing sale of consumables

31Opportunity from increased penetration
2123
27
31
35
39 39 4042 42 42
15
20
25
30
35
40
45
MQ 04 JQ 04 SQ 04 DQ 04 MQ 05 JQ 05 SQ 05 DQ 05 MQ 06 JQ 06 SQ 06
Rollout of Rs 1 (2 cents) and Rs 0.50 (1 cent) sachets
SSK Black 8mRural plan
Rural shampoo penetration : % households bought once/quarter
Low price shampoo sachets have helped drive category penetration
Unique innovations & promotions to drive category penetration

32
HUL leads global research in Oral, Skin and Laundry
Some achievements:
• Single Shot Soap making process
• Skin Lightening Cream
• Non Soap Detergent Bars
• Poly coated Dish Wash Bar
• Drinking water purifier (Pure-It)
• Amaze
Innovation and R&D capabilities

33Winning with “Go to Market Approach”
67:33Urban : Rural Ratio
11FMCG Growth (Value %)
14.5Per Capita FMCG Spend (Annual,$)
16448FMCG Market (Annual, $ Mln)*
6.8Store Density (Stores Per 1000 People)
7.74Number of Retail Stores (Mlns)
1.1Total population (In Bln.)
HIGHEST STORE DENSITY IN THE WORLD !Source AC Nielsen
Direct coverage – 1milllion outlets Brands reach – 6.3 million outlets
Strong IT capability, end to end connectivity
Unique channel Initiatives to Win at “Point of Purchase”
Portfolio of category and Brands give unique reach in Modern Trade
Project Shakti, a competitive advantage in Rural India
Distribution Strength

34New Channel Initiatives
ChannelsHUL Programs
SVS/ FLO
Unicare
Beauty zone
K- LINE
Superstar & Shakti
Vijeta/ Sambandh
Family Grocers
Chemist
Fancy
Kiosk
Rural
Wholesale

35What sets us apart - Reaching Shoppers
DAIRY Ice creamMEAT
WINE
CHECKOUTS
BAK
ERY
DEL I
Jam
s, S
quas
hes
Soap
Cosm
etics
LAU
ND
RY
SOU
P
SEAS
ON
ING
S
DR
ESSI
NG
S
SNAC
KS
PAST
A S
AUC
E
SAU
CETe
a
OIL
Cus
tard
s an
d je
lly
Cof
fee
Hai
r
Skin
Toot
hpas
te
T
ooth
bru
sh
Dis
h W
ash
DEO
DIA
PER
S
Sani
tary
nap
kins
Pape
r pdt
s
36
0
10
20
30
40
50
60
70
80
90
ToiletSoaps
WashingPowders
DetergentCakes
HandDish
Wash
HairWash
ToothPaste
Skin Tea InstantCoffee
GT MT
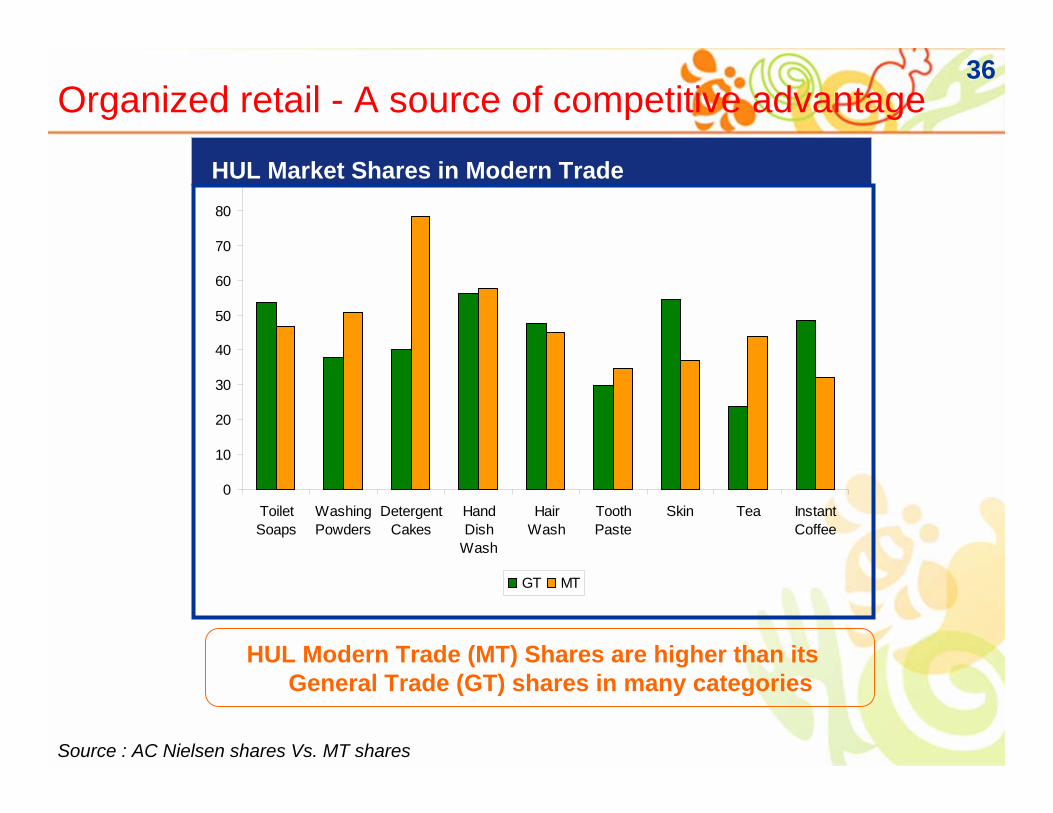
Source : AC Nielsen shares Vs. MT shares
Organized retail - A source of competitive advantage
HUL Market Shares in Modern Trade
HUL Modern Trade (MT) Shares are higher than its General Trade (GT) shares in many categories

37Project Shakti- Enabling direct rural reach
To Reach:Small, scattered settlements and poor infrastructure make distribution difficultOver 500,000 villages not reached directly by HUL
To Communicate:Low literacy hampers effectiveness of print mediaPoor media-reach: 500 million Indians lack TV and radio
To Influence:Low category penetration, consumption, brand awarenessPer capita consumption in Unilever categories is 33% of urban levels
Acc
essi
bilit
y
Turnover per market
Conventional business models
500,000 villages

38Shakti
Three Shakti initiativesShakti entrepreneur; currently ~ 44000 women cover 1,25,000 villages Shakti Vani: one-to-many communication for category growthiShakti: customized interaction with remote consumers
Impact on communityBusiness and social impact can go togetherPartnerships with diverse stakeholders

39Capabilities :Leveraging IT for Growth
Planning Hub
Kirana Distributor C & FA Factory
Supplier
Daily Daily DailyDaily
35 Brands, 1500 skus 45 Depots, 4000 stockist
- On shelf availability
- Stocks
- sales
- Sales
- Stocks
- Prices, Invoicing
- Prod. Plan – wkly
- Despatch - Daily
Hand – held terminal
Dist Mgmt System
Central Unify

40Corporate Responsibility – Aiding in the Development of the Country
Combining corporate responsibility and business strategies to aid development of rural India
Lifebouy Swasthya Chetana - Health & Hygiene
Shakti – Empowerment of women through micro-enterprise Opportunity
Yashodadham - Relief and Reconstruction in Gujarat's Kutch district
Asha Daan - Happy Home actively supported by HUL

41Agenda
Financials & Summary
Overview
India Opportunity
HUL - Uniquely Placed
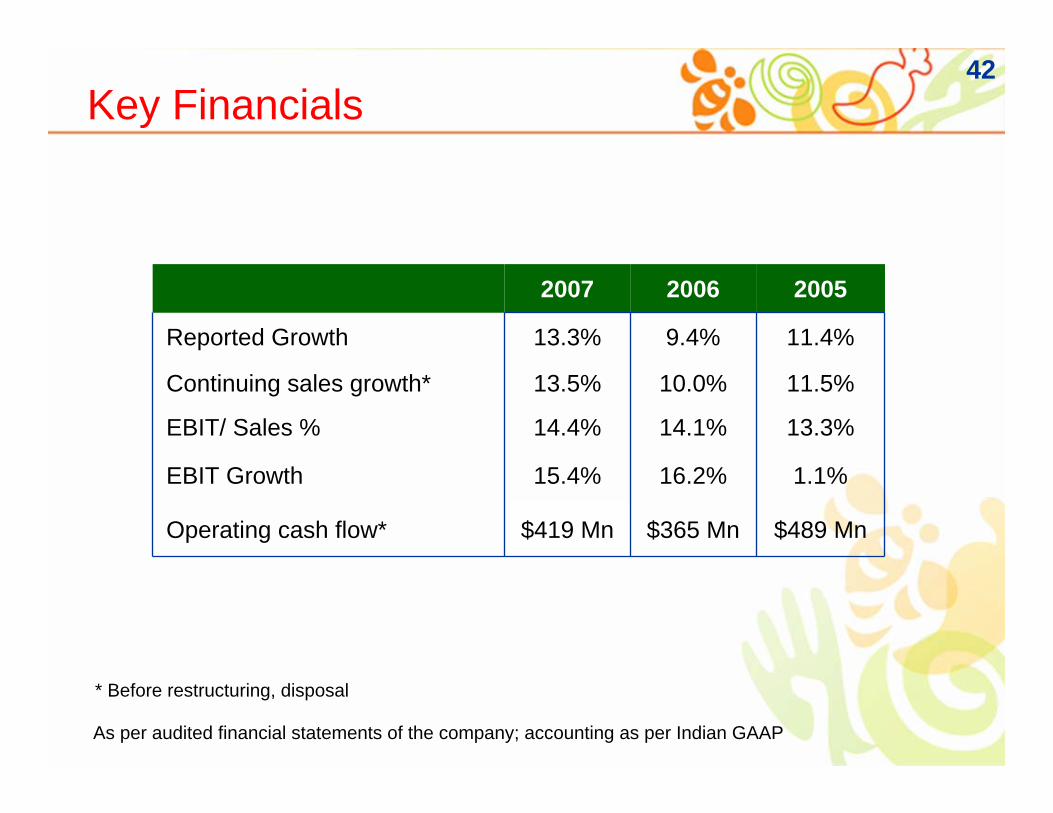
42Key Financials
$419 Mn
15.4%
14.4%
13.5%
13.3%
2007
11.4%9.4%Reported Growth
$365 Mn
16.2%
14.1%
10.0%
2006
$489 MnOperating cash flow*
1.1%EBIT Growth
13.3%EBIT/ Sales %
11.5%Continuing sales growth*
2005
* Before restructuring, disposal
As per audited financial statements of the company; accounting as per Indian GAAP

43Robust FMCG growth
3.74.8
-0.5
3.6
0.3
12.7 12.8 12.914.5
2000 2001 2002 2003 2004 2005 2006 FH 07 SH 07
HUL FMCG Sales growth %
As per audited financial statements of the company; accounting as per Indian GAAP; Sales growth is worked out on a continuing basis i.e. after adjusting the base for disposals etc.

44EBIT Margins
13.2%
15.5%
19.3% 20.1%
14.7%13.3% 14.1% 14.4%
2000 2001 2002 2003 2004 2005 2006 2007
EBIT Margins
As per audited financial statements of the company; accounting as per Indian GAAP. Sales for the above calculations is Net sales (Gross Sales- Excise Duty)
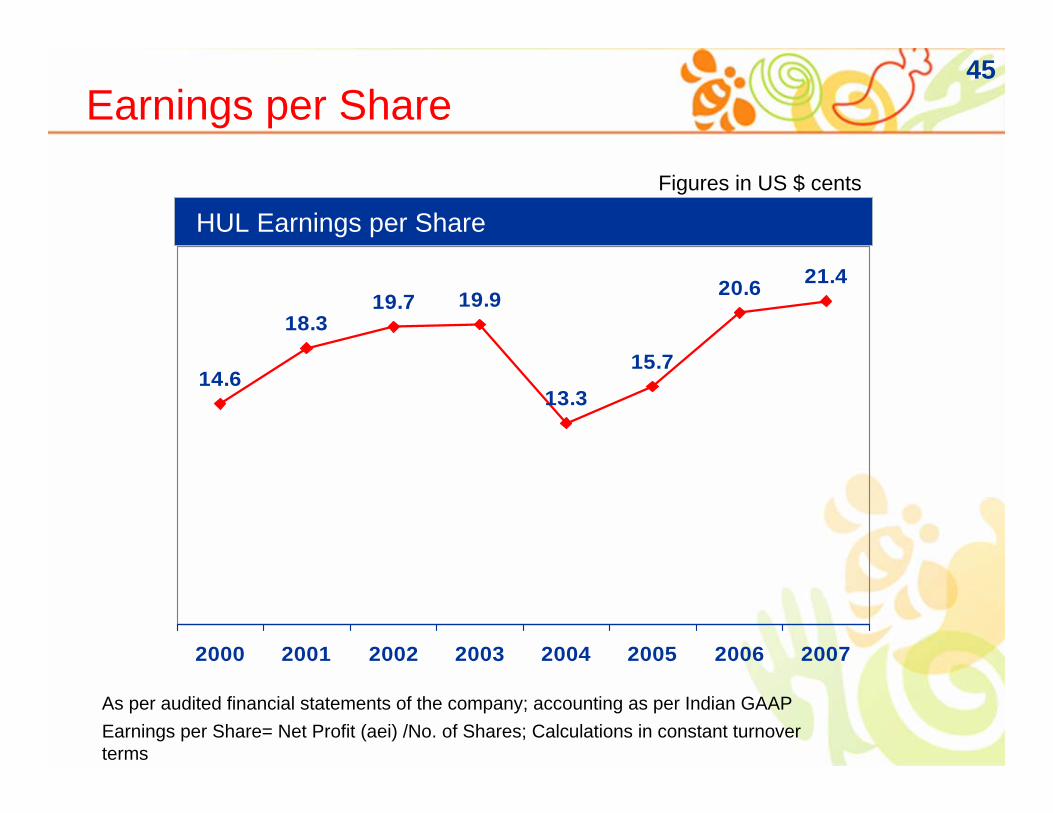
45Earnings per Share
14.6
18.319.7 19.9
13.3
15.7
20.6 21.4
2000 2001 2002 2003 2004 2005 2006 2007
Figures in US $ cents
HUL Earnings per Share
As per audited financial statements of the company; accounting as per Indian GAAPEarnings per Share= Net Profit (aei) /No. of Shares; Calculations in constant turnover terms

46Return On Capital Employed
79.4
60.259.462.464.6 67.068.7
45.9
2000 2001 2002 2003 2004 2005 2006 2007
As per audited financial statements of the company; accounting as per Indian GAAPROCE= PBIT/Closing Capital Employed2007 ROCE is calculated on Weighted Avg. Cap employed
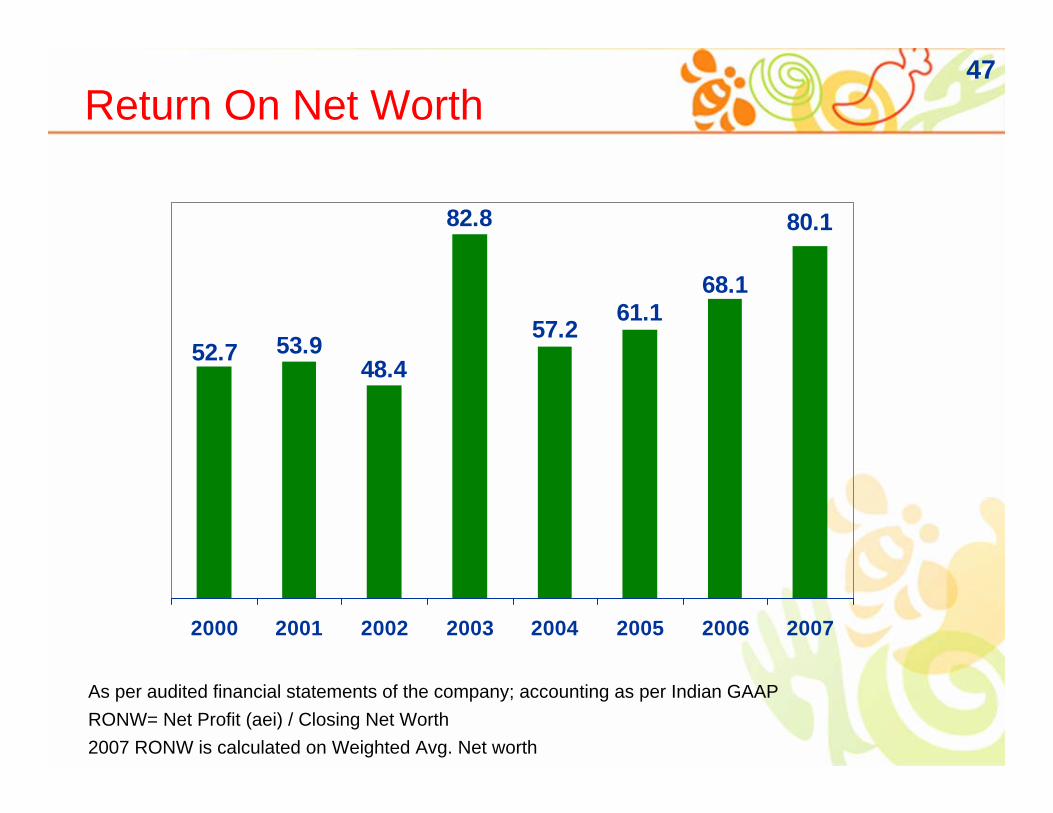
47Return On Net Worth
80.1
68.161.1
57.248.4
53.952.7
82.8
2000 2001 2002 2003 2004 2005 2006 2007
As per audited financial statements of the company; accounting as per Indian GAAPRONW= Net Profit (aei) / Closing Net Worth2007 RONW is calculated on Weighted Avg. Net worth
48
3rd consecutive year of accelerated growth in FMCG portfolio. Growth
broad based and across all categories
FMCG markets expected to maintain current growth levels
Successfully implement the Foods strategy
Build momentum to the Water Business
Build on competitive capabilities across business system
Manage Cost inflation effectively to improve margins through pricing, cost
savings and better mix
Strong commitment to governance and CSR
Summary

Thank you

Hindustan Unilever Limited
S SrinivasanVP Treasury M&A & Investor Relations
Hindustan Unilever Ltd.11th & 12th March, 2008
Investor PresentationCitigroup India Conference