Embed Size (px)
Citation preview
51
Hindon River:Gasping for Breath
A PAPER ON RIVER POLLUTION
JANHIT FOUNDATION
Heather Lewis
52
Janhit Foundation
Janhit Foundation is an independent, not-for-profit non-governmental organization, actively engagedin the promotion of human welfare through environmental protection since 1998.
Key areas of work include:
• Groundwater quality protection for human health
• Provision of safe drinking water to marginalized communities
• Protection of river water quality for aquatic ecosystems
• Enhancement of available water resources through water conservation measures
• Promotion of sustainable agriculture by organic farming methods
• Environmental education and empowerment of local communities
Janhit Foundation undertakes this work through scientific research, campaigns, advocacy and grass-root level community involvement.
As a public interest organisation, Janhit Foundation focuses on strengthening local communitiesthrough their active participation in decision making, to achieve sustainable development. We believethat environmental degradation can only be addressed adequately if local people are empowered indecision making at all levels and have control over resources.
To achieve our goals, we work in partnership with government, non-governmental, national andinternational organisations on environment and human rights issues.
Author: Heather Lewis
Study Project Team: Raman Tyagi, Neeraj Maheshwari, Pradeep Kumar, Devpal Singh, Lalit Tyagi,Deepak Kumar, Sandeep Singh.
© Janhit Foundation, January 2007
Published by:
Janhit FoundationD-80 Shastri NagarMeerut, Uttar Pradesh 250002Phone : + 91 121-2763418, 4004123Fax : + 91 121-2763418Email : [email protected] : www.janhitfoundation.org
Printed at : System Vision, New [email protected]
53
Contents
Summary iv
Foreword v
Preface vi
1. The Importance and Quality of Water in India 1
2. Hindon River, Western Uttar Pradesh – The Current Situation 5
3. Water Quality of Hindon River and its Tributaries 10
4. Groundwater Quality: Hindon River Catchment 20
5. Implications of Surface and GroundwaterContamination on Health of Riparian Communities 25
6. Recommendations 30
7. Consultation, Comments and Support 32
8. Appendices 33
54
Summary
A comprehensive scientific study has been undertaken by Janhit Foundation to evaluate the presenceand extent of toxic pollutants within surface and groundwater resources of the Hindon River
catchment. The devastating impacts of this contamination of water resources on the health of those livingwithin the catchment is highlighted.
Rising in Saharanpur district in the lower Himalayas, the Hindon River and it’s tributaries (includingthe Kali River (West), and the Krishni River) flow through six districts of Uttar Pradesh, before it’sconfluence with the Yamuna River. A highly populated and predominantly rural catchment, the HindonRiver is heavily utilized as a water resource for domestic, agricultural and industrial uses, while untreatedgroundwater is the primary source of drinking water.
This study has found that mismanagement of these vital water resources has lead to dangerously highpollution levels within both the Hindon River and groundwater throughout the catchment.
A wide range of highly acutely toxic organochlorine and organophosphorus pesticides and heavy metalshave been identified within rivers and groundwater throughout the catchment, at levels that exceednational and international standards for safe bathing and drinking water by several orders of magnitude.
A detailed health survey of the rural catchment population has identified alarming levels of seriousdebilitating illness and death which are directly attributable to the presence of dangerously high toxicpesticide and heavy metal contamination within the drinking water of these villagers.
Medical expenses incurred by villagers as a result of consuming contaminated drinking water are alsoshown to exert a heavy economic burden on a population already economically and socially marginalized.
Organochlorine and organophosphorus pesticides are shown to be entering water resources to toxic levelsas a result of over-application of agricultural chemicals. Heavy metals are shown to be present as a directresult of discharge of large volumes of untreated industrial effluents.
The Janhit Foundation has also found that the expected aquatic biodiversity of the Hindon River is entirelyabsent at almost all locations within the catchment due to a high loading of organic pollutants reducingoxygen levels and causing anoxic conditions in the river.
Untreated industrial effluents are also shown to be the primary source of river suffocation, with untreateddomestic sewage a large contributory factor.
Industries within the catchment are clearly shown to be in breach of required effluent treatment standards.
Janhit Foundation calls for immediate action to be taken by the government bodies responsible for theprotection of both the Hindon River and health of the population suffering toxic poisoning.
Action must be taken to reduce indiscriminate use of toxic pesticides within agriculture. Existinglegislation and guidelines must be enforced to stop the irresponsible dumping of untreated toxic industrialeffluents into the Hindon River.
Government bodies must take responsibility for the disease and deaths inflicted upon the poisonedvillagers due to their failure to protect these citizens rights to safe water in what is clearly a violationof International Human Rights Legislation.
55
Foreword
ANIL RANADirector, Janhit Foundation
F ormerly known as Harnandi, the Hindon River in the near past made Western Uttar Pradesha centre for agrarian fertility. Up until the 1980’s, the Hindon River breathed life and prosperity
amongst the rural population of Saharanpur, Muzaffarnagar, Meerut, Baghpat, Ghaziabad andGautambudh Nagar districts. Today Hindon is a trunk sewer of the urban towns and carries a heavyload of pesticides released from the agriculture runoff from the fields. Can Hindon revive its past gloryof carrying potable water? This is a million dollar question which may haunt anybody who will gothrough this book. For millennia Indians have worshipped the river. The river is also a source ofintegration since the rich and the poor all take a holy dip in it. The river soothes our pain. Finallyour cremation ashes are immersed in the river. Such is the strong relationship of our countrymen withrivers. Today the picture has turned upside down. As such, is it not the human beings who are bentupon suffocating the Hindon? The greed of the community is the major reason for changing the crystalclear Hindon to a black Hindon.
Janhit Foundation has been investigating the causes and extent of pollution in the Hindon River forthe past eighteen months. Grassroot level studies and scientific data has given strength towards findingsustainable solutions to this monstrous problem. The paper mills, sugar mills, distilleries, slaughterhouses, dyeing and the chemical industries need to adopt strict measures before discharging theireffluents directly to the Hindon River. The domestic sewage of towns and cities also need to be treatedif government agencies are really serious about putting a check to the growing pollution of this river.The ‘Polluter Pays’ principle need to be enforced in a stringent way. But above all it is the communitywhich can find long lasting solutions to give a new lease of life to this dying river. Let us all rememberthat the Hudson and Kayohog rivers were also subject to high pollution loading only a few decadesago, but community participation programs have been so successful that these rivers are now amongstthe cleanest rivers in America. Civil Society Organizations have a definite role to play. Unfortunately,none of them have shared the responsibility to save the Hindon River. Janhit Foundation has lightedthe lamp instead of cursing the darkness. With the strong background of compiling the data, conductinghealth study, shooting a documentary film to create awareness amongst the community and by bringingout this important work I think Janhit Foundation would be the instrumental force to see that Hindonflows with clean, clear freshwater and life for everyone. After all the Indian Sabhyata, Sanskriti andParampara are intermixed with its myriad rivers. I sincerely congratulate Heather Lewis, anenvironmentalist from U.K., presently working with Janhit Foundation for putting a lot of labourto document this important study. Finally Raman Tyagi and his team who travelled along the pollutedHindon for miles together and worked for long hours investigating the hazardous industries and villageswithin the Hindon River catchment during the course of this study.
56
This study of the Hindon River catchment by the Janhit Foundation has identifiedundeniable links between extreme toxic contamination of water resources and the
blighted health and early deaths of the villagers who have no choice but to endure thistoxicity.
As is so often the case, it is the poorest and most marginalized in society who are sufferingworst from this man-made environmental disaster. The sources of this toxic contaminationare well known, the mechanisms for damaged health well documented – yet still thegovernment bodies responsible for action do nothing. It is incredible that in the 21st
century, such gross levels of pollution are permitted to occur unchecked by governmentbodies.
The greatest tragedy is that this situation need never occur. Technology for effectiveindustrial pollution control is available. Natural and sustainable farming methods are wellestablished, yielding the desired results without the need for toxic chemicals. However,industrial pollution control technology is not being adequately installed, while sustainablefarming methods are not being widely promoted by the authorities. The weakness thatallows this situation to continue is therefore in the lack of imple-mentation, and legalenforcement, of effective pollution control.
The Government of India is clearly violating it’s citizens human rights to safe water.Unfortunately, the contamination of the Hindon River is not an isolated case. This is notthe first Janhit Foundation study to highlight the deplorable state of India’s rivers and itis unlikely to be the last.
However, the drive for change is finally starting to gain momentum and we must maintainthis drive for change until the government can no longer hide behind hollow words andinaction.
Mahatma Gandhi once said that ‘you must be the change you wish to see in the world’.It is no longer acceptable to passively tolerate this deadly contamination. It is time tospeak with one voice and demand government action towards the change we wish to see.
The Janhit Foundation wishes to thank the residents of the villages referenced in this study,for their time and co-operation. We also thank the scientists from the Centre for Scienceand Environment, New Delhi and Peoples’ Science Institute, Dehradun for the wateranalysis and their scientific inputs.
Finally, Janhit Foundation especially wish to thank Indo-Global Social Service Societyfor their financial support of this project and for enabling the publication of thisimportant report.
HEATHER LEWIS
Preface
1
1The Importance and Quality of Water in India
The right to safe water is a basic human right,legally defined by the UN Committee on
Economic, Social and Cultural Rights as follows;
‘The human right to water entitles everyone tosufficient, safe, acceptable, physically accessibleand affordable water for personal and domesticuses’.
The legal definition of this human right reflectsthe requirement for water to be of adequatequality and not threaten the health of those whouse it. Supply of adequate sanitation is inherentto prevent contamination of water with faecalbacteria and other associated contaminants. Ahealthy sustainable environment is also a basicrequirement for suitable water quality.
The right to water for every individual that issufficient for their needs and that will not causeillness is therefore a legal entitlement as well asa moral obligation. The responsibility for fulfillingthis human right falls to the State.
The Government of India has signed up to theInternational Covenant on Economic, Social andCultural Rights. Ratification of this Treaty meansthat India is obliged to implement the provisionof this Treaty to fulfill this human right.
Article 21 of the Indian Constitution alsoguarantees the right to life, defined by theSupreme Court of India to include the right toa pollution-free environment and safe drinkingwater.
The United Nations have set eight Millennium
Development Goals agreed to by all the countriesof the world and all the leading developmentinstitutions. The Goals aim to promoteunprecedented efforts to meet the needs of theworld’s poorest people. One of these Goals,‘Ensure environmental sustainability’ has thespecific aim to reduce by half the proportion ofpeople without sustainable access to safe drinkingwater by 2015. This Millennium DevelopmentGoal therefore sets targets for the achievement ofthis basic human right to water.
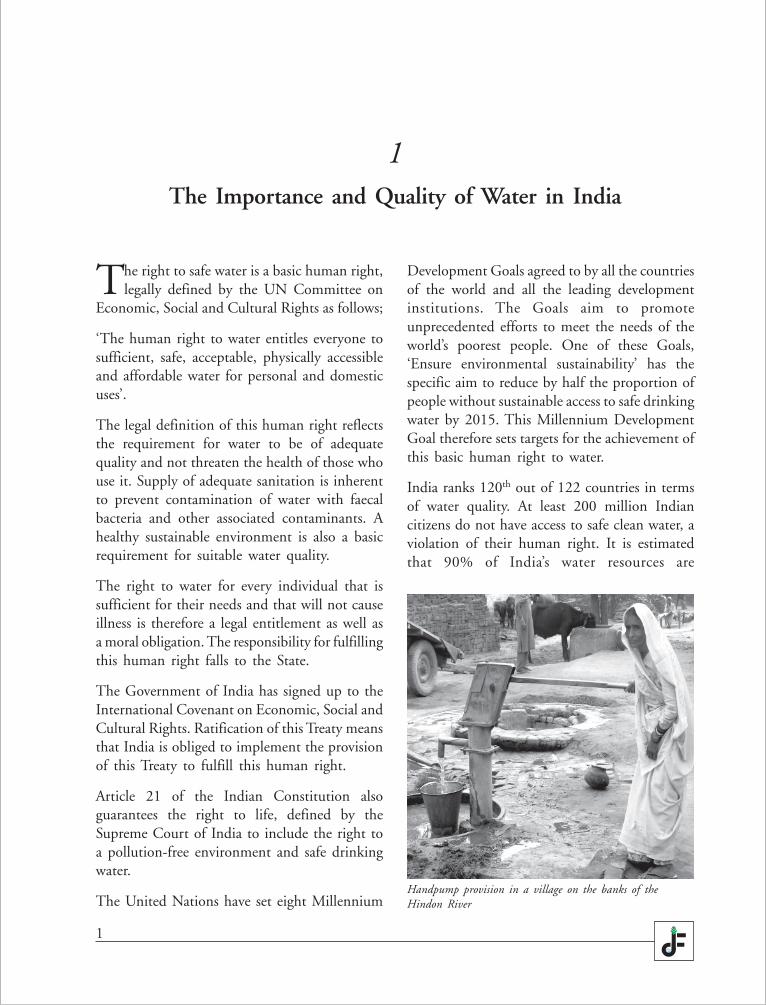
India ranks 120th out of 122 countries in termsof water quality. At least 200 million Indiancitizens do not have access to safe clean water, aviolation of their human right. It is estimatedthat 90% of India’s water resources are
Handpump provision in a village on the banks of theHindon River
2
contaminated with untreated industrial, domesticwaste, pesticides and fertilizers (Source; FIANInternational – ‘Investigating some allegedviolations of human right to water in India’).India therefore faces a substantial challenge tomeet the legal and moral obligations towards theprovision of safe water.
River ecosystems are of great environmentalsignificance. Healthy riverine habitats support aunique and diverse array of species, a biologicaldiversity that serves a number of social andeconomic functions, such as providing a sourceof food. Clean rivers are also essential for a rangeof non-domestic uses including crop irrigation,hydropower energy generation, navigation andindustrial uses. Clean rivers also provide anenhanced landscape in which to live for anincreased quality of life. A polluted river isseverely restricted in it’s ability to meet any of theabove functions.
The National Water Policy of India of April 2002states ‘Water is part of a larger ecologicalsystem..., it has to be treated as an essentialelement of environment for sustaining all lifeforms’.
Wherever water quality is permitted to deteriorate,the delicate balance of nature is disturbed.Species die and riverine ecosystem communitiesbreakdown. A river with it’s biodiversity reducedin this way is less able to assimilate contaminantsthrough natural process leading to further waterquality deterioration.
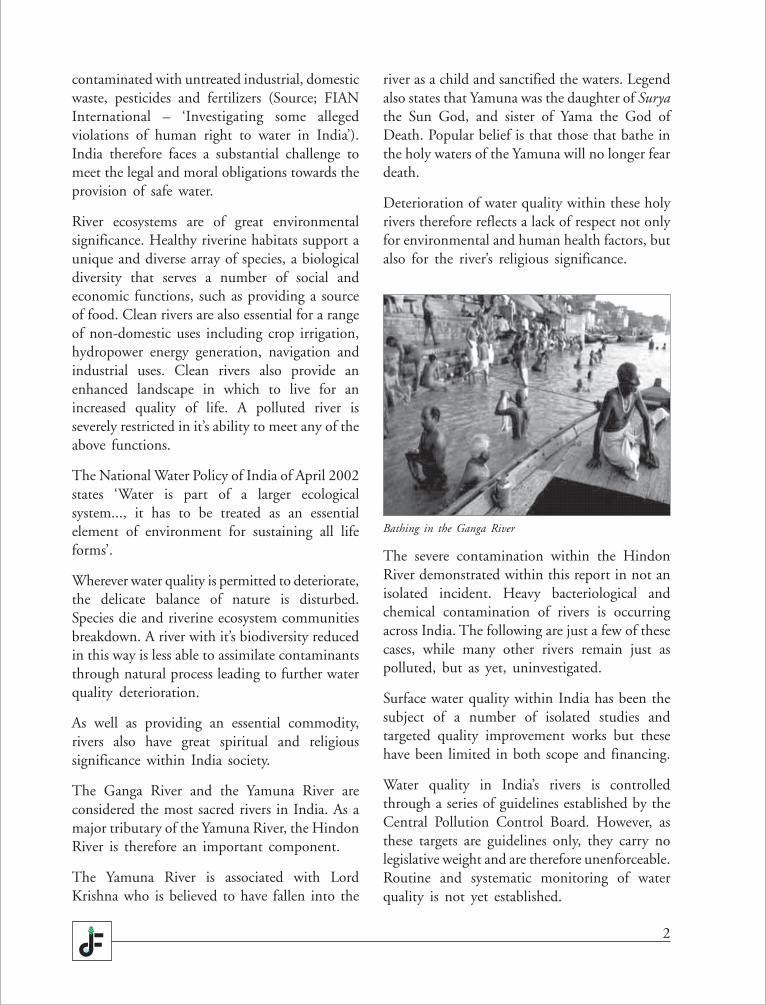
As well as providing an essential commodity,rivers also have great spiritual and religioussignificance within India society.
The Ganga River and the Yamuna River areconsidered the most sacred rivers in India. As amajor tributary of the Yamuna River, the HindonRiver is therefore an important component.
The Yamuna River is associated with LordKrishna who is believed to have fallen into the
river as a child and sanctified the waters. Legendalso states that Yamuna was the daughter of Suryathe Sun God, and sister of Yama the God ofDeath. Popular belief is that those that bathe inthe holy waters of the Yamuna will no longer feardeath.
Deterioration of water quality within these holyrivers therefore reflects a lack of respect not onlyfor environmental and human health factors, butalso for the river’s religious significance.
Bathing in the Ganga River
The severe contamination within the HindonRiver demonstrated within this report in not anisolated incident. Heavy bacteriological andchemical contamination of rivers is occurringacross India. The following are just a few of thesecases, while many other rivers remain just aspolluted, but as yet, uninvestigated.
Surface water quality within India has been thesubject of a number of isolated studies andtargeted quality improvement works but thesehave been limited in both scope and financing.
Water quality in India’s rivers is controlledthrough a series of guidelines established by theCentral Pollution Control Board. However, asthese targets are guidelines only, they carry nolegislative weight and are therefore unenforceable.Routine and systematic monitoring of waterquality is not yet established.
3
River pollution case study 1 – Khari River,Gujarat
Severe pollution was identified as having anadverse effect on local populations. Pressure frompublic resulted in government action to improvewater quality and compensate those adverselyaffected.
The Khari River, a tributary of the Sabarmati, isheavily used for discharge of chemicallycontaminated effluents from a large number ofindustries within the catchment. The mainindustry is dye manufacture associated withtextile mills. Key contaminants associated withdye manufacture effluent include oils, fibres andother suspended particulate matter, as well ascontaining a range of toxic heavy metals andbeing strongly alkaline.
Severe contamination of the Khari River hasresulted. Groundwater within the region is alsosubject to high levels of chemical contamination.Groundwater is contaminated as a result ofhydraulic continuity with the contaminatedriver, but also as a result of industries disposingoff effluents directly to groundwater throughboreholes. Groundwater contamination has beenidentified to a depth of 185 metres.
The local population have no choice but to usethese contaminated water resources for all theirdomestic purposes, including drinking. Illnessattributable to the consumption of contaminatedwater are widespread and include those illnessidentified within the Hindon River catchmentsuch as digestive, respiratory and skin disorders.
A number of local villagers successfully securedcompensation from the courts for thecontamination of their drinking water as a resultof effluents disposal.
Following a court order of the Gujarat HighCourt, major industrial estates within thecatchment were ordered to install CommonEffluent Treatment Plants, designed to treat
effluents to meet standards for a number ofphysical / chemical parameters and heavy metals.The cost of treatment plant installation fell toindustry to ensure that the polluter pays for theremediation of pollution caused. Industrial plantswere required to cease operation until adequatetreatment for effluent had been installed.
However, despite the above success, contaminationof the Khari River remains high due to theleakage of untreated effluents, the presence ofnumerous small industries with no effluenttreatment and the illegal disposal of untreatedeffluents to surface and groundwater.
Government control of effluent dischargestandards is seen to fall far short of that requiredto ensure compliance by polluting industrieswith the required standards, as no monitoringprogram has been established.
(Source: – Janhit Foundation National Conference onWater Pollution and Health: A Deadly Burden, 9 July2006 – Jaldhara. ‘Unclogging the Khari River: Stakeholderscome together to halt pollution’ Srinivas Mudrakartha,Jatin Sheth, J. Srinath, July 9 2006.)
River pollution case study 2 – Kali River(East), Uttar Pradesh
The increase in industrialization and chemicalbased agriculture within the catchment of theKali River (East) in Western U.P. is identified asbeing responsible for considerable pollution inthe river and underlying groundwater aquifer.
Groundwater contamination is identified asarising from the disposal of liquid wastes to theoverlying river system, and solid waste disposalto land.
Samples from handpumps in villages in closeproximity to the Kali River (East), identifiedheavy metal contaminants (cadmium, chromium,zinc and iron) within both river water andgroundwater. All metals were found to beexceeding, or close to exceeding, permissible
4
limits standards set for drinking water. Forexample levels of chromium within drinkingwater supplies at Kudhla Village, Meerut district,are found to be 140 times the maximumpermissible limit for drinking water set by theBureau of Indian Standards for this heavy metal.Groundwater available from handpumps sampleswas also heavily coloured with an unacceptableodour and taste.
(Source: ‘Pollution in Kali Nadi (East) and it’s environsin parts of Meerut and Ghaziabad districts, Uttar Pradesh’.Preliminary report of the Central Groundwater Board(Northern Region), M.M. Gaumat, Kali Charan, June1999.)
River pollution case study 3 – YamunaRiver, Uttar Pradesh and Haryana
Within this case study, the ineffective actions ofgovernment plans to tackle severe pollutionlevels, is highlighted.
In 1995 a National River Conservation Plan wasinitiated for the Yamuna River, with the aim ofintercepting, diverting and treating the largevolume of untreated municipal wastes enteringthe Nation’s rivers. The Yamuna Action Plan aimsto control untreated municipal drainage from anumber of towns within the Hindon Rivercatchment, including Saharanpur, Muzaffarnagar,Ghaziabad and Noida. As a major tributary ofthe Yamuna River, the water quality of theHindon River should be central to any attemptsto improve the Yamuna. However, remediationof the heavy contamination of the Hindon Riveris not included within the Yamuna Action Plan,
which further reduces the likelihood that thePlan will be successful in reducing overallpollution load. However, while substantial sumsof money have been spent, the results indicatethat the Action Plan has not achieved it’s aims.
In a major oversight, the Yamuna Action Plandoes not address either diffuse pollution fromagricultural run-off, including pesticides, orindustrial contamination from effluent disposal.While attempts to increase sewage treatmentprovision within the catchment is necessary, suchtreatment does not remove industrial or pesticidecontamination from drinking water. Thishighlights the need to control such discharges atsource, as post-discharge treatment is not a viableoption. The need for such treatment is known tothe Central Pollution Control Board. Their ownstudies on the Yamuna River have found levelsof toxic persistent organic pollutants in the formof organochlorine pesticides that exceed WorldHealth Organization guideline maximum levelsfor safe drinking water.
The Yamuna River supplies over 70% of allDelhi’s drinking water supplies, but such is thepoor quality of this water that the SupremeCourt of India felt obligated to state that ‘thegovernment and it’s functionaries had failed intheir public duties towards the citizens of theCapital of India’. This situation continues despitethe completion of Phase I of the Yamuna RiverAction Plan.
(Source: ‘Homicide by Pesticides, What pollution does toour bodies’. Centre for Science and Environment, Ed. AnilAgarwal. Feb 1997).
5
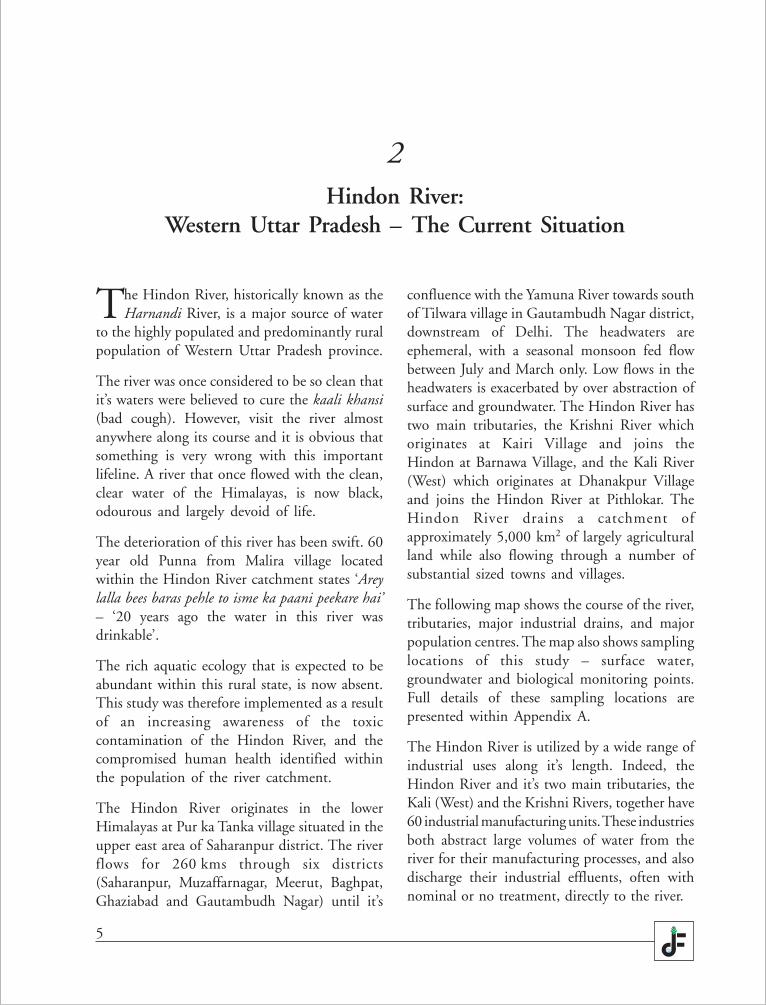
The Hindon River, historically known as theHarnandi River, is a major source of water
to the highly populated and predominantly ruralpopulation of Western Uttar Pradesh province.
The river was once considered to be so clean thatit’s waters were believed to cure the kaali khansi(bad cough). However, visit the river almostanywhere along its course and it is obvious thatsomething is very wrong with this importantlifeline. A river that once flowed with the clean,clear water of the Himalayas, is now black,odourous and largely devoid of life.
The deterioration of this river has been swift. 60year old Punna from Malira village locatedwithin the Hindon River catchment states ‘Areylalla bees baras pehle to isme ka paani peekare hai’– ‘20 years ago the water in this river wasdrinkable’.
The rich aquatic ecology that is expected to beabundant within this rural state, is now absent.This study was therefore implemented as a resultof an increasing awareness of the toxiccontamination of the Hindon River, and thecompromised human health identified withinthe population of the river catchment.
The Hindon River originates in the lowerHimalayas at Pur ka Tanka village situated in theupper east area of Saharanpur district. The riverflows for 260 kms through six districts(Saharanpur, Muzaffarnagar, Meerut, Baghpat,Ghaziabad and Gautambudh Nagar) until it’s
2Hindon River:
Western Uttar Pradesh – The Current Situation
confluence with the Yamuna River towards southof Tilwara village in Gautambudh Nagar district,downstream of Delhi. The headwaters areephemeral, with a seasonal monsoon fed flowbetween July and March only. Low flows in theheadwaters is exacerbated by over abstraction ofsurface and groundwater. The Hindon River hastwo main tributaries, the Krishni River whichoriginates at Kairi Village and joins theHindon at Barnawa Village, and the Kali River(West) which originates at Dhanakpur Villageand joins the Hindon River at Pithlokar. TheHindon River drains a catchment ofapproximately 5,000 km2 of largely agriculturalland while also flowing through a number ofsubstantial sized towns and villages.
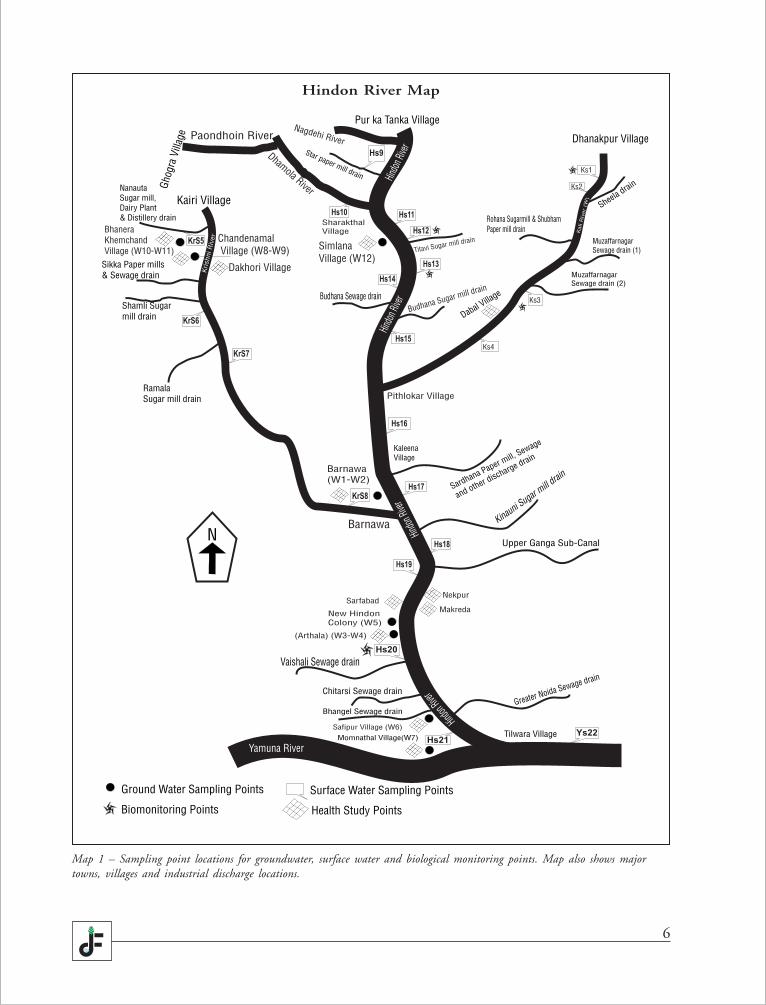
The following map shows the course of the river,tributaries, major industrial drains, and majorpopulation centres. The map also shows samplinglocations of this study – surface water,groundwater and biological monitoring points.Full details of these sampling locations arepresented within Appendix A.
The Hindon River is utilized by a wide range ofindustrial uses along it’s length. Indeed, theHindon River and it’s two main tributaries, theKali (West) and the Krishni Rivers, together have60 industrial manufacturing units. These industriesboth abstract large volumes of water from theriver for their manufacturing processes, and alsodischarge their industrial effluents, often withnominal or no treatment, directly to the river.
6
Map 1 – Sampling point locations for groundwater, surface water and biological monitoring points. Map also shows majortowns, villages and industrial discharge locations.
7
Dominant industries include 32 individual papermanufacturing units, of which 24 are located onthe Kali River (West), and 15 plants for themanufacture of sugar and distillation of alcohol.Other forms of industry include dairy units,textile manufacture and slaughter houses.
A full list of the major industries discharging tothe Hindon River and tributaries, is presented inAppendix I.
The first major industrial effluent discharge is atSaharanpur, where flow increases substantiallyand is almost entirely composed of the industrialeffluents from the Star paper mill. The industrialeffluents of the Co-operative Distillery also enterthe river in this stretch.
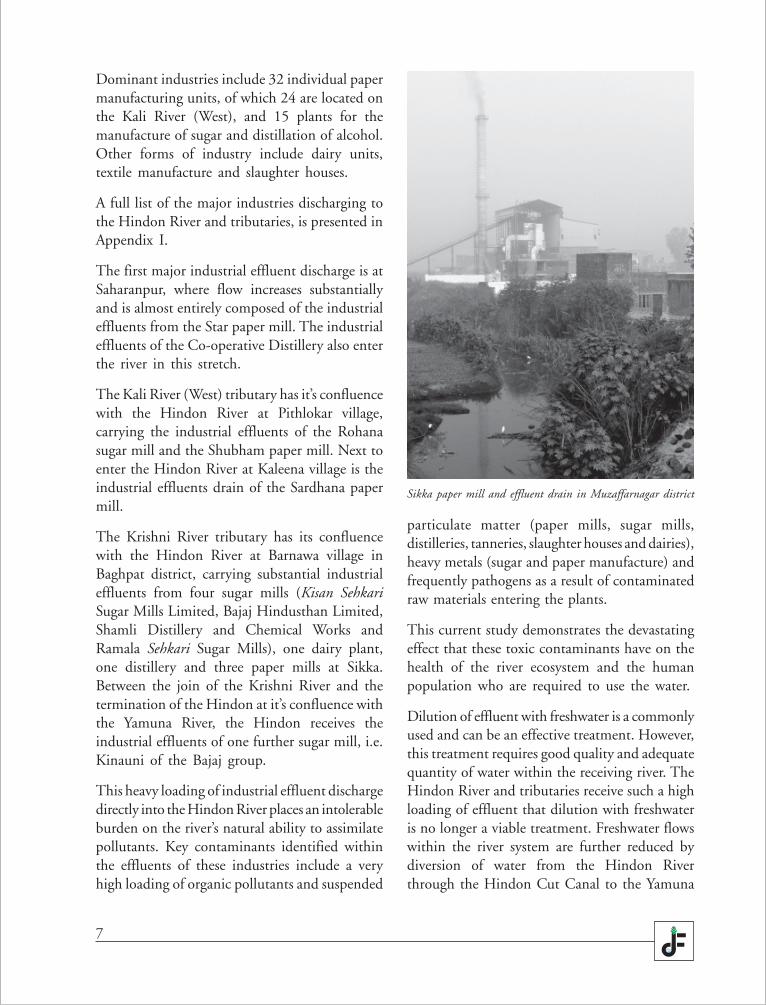
The Kali River (West) tributary has it’s confluencewith the Hindon River at Pithlokar village,carrying the industrial effluents of the Rohanasugar mill and the Shubham paper mill. Next toenter the Hindon River at Kaleena village is theindustrial effluents drain of the Sardhana papermill.
The Krishni River tributary has its confluencewith the Hindon River at Barnawa village inBaghpat district, carrying substantial industrialeffluents from four sugar mills (Kisan SehkariSugar Mills Limited, Bajaj Hindusthan Limited,Shamli Distillery and Chemical Works andRamala Sehkari Sugar Mills), one dairy plant,one distillery and three paper mills at Sikka.Between the join of the Krishni River and thetermination of the Hindon at it’s confluence withthe Yamuna River, the Hindon receives theindustrial effluents of one further sugar mill, i.e.Kinauni of the Bajaj group.
This heavy loading of industrial effluent dischargedirectly into the Hindon River places an intolerableburden on the river’s natural ability to assimilatepollutants. Key contaminants identified withinthe effluents of these industries include a veryhigh loading of organic pollutants and suspended
particulate matter (paper mills, sugar mills,distilleries, tanneries, slaughter houses and dairies),heavy metals (sugar and paper manufacture) andfrequently pathogens as a result of contaminatedraw materials entering the plants.
This current study demonstrates the devastatingeffect that these toxic contaminants have on thehealth of the river ecosystem and the humanpopulation who are required to use the water.
Dilution of effluent with freshwater is a commonlyused and can be an effective treatment. However,this treatment requires good quality and adequatequantity of water within the receiving river. TheHindon River and tributaries receive such a highloading of effluent that dilution with freshwateris no longer a viable treatment. Freshwater flowswithin the river system are further reduced bydiversion of water from the Hindon Riverthrough the Hindon Cut Canal to the Yamuna
Sikka paper mill and effluent drain in Muzaffarnagar district
8
reducing dilution potential of the river andconcentrating the effects of other pollutantsentering the river. Irrigation water also depositson land, the contaminants carried in the watercolumn which then leach through the soil profileto underlying groundwater aquifers.
Surface water run off from agriculture carrieswith it a number of suspended pollutantsparticularly elevated suspended sediments due tosoil erosion, and agricultural chemicals such aspesticides and fertilizers. Agricultural chemicalfertilizers have also been demonstrated to containheavy metals.
Historically, the water of the Hindon River hada central role in the provision of water for alldomestic purposes, including drinking andcooking. However, the primary source of water
for domestic usage is now the localgroundwater aquifers via a networkof handpumps. The Hindon Riverno longer serves human domesticuses as it is clearly too polluted.The river is now only used for thewatering and washing of livestock.
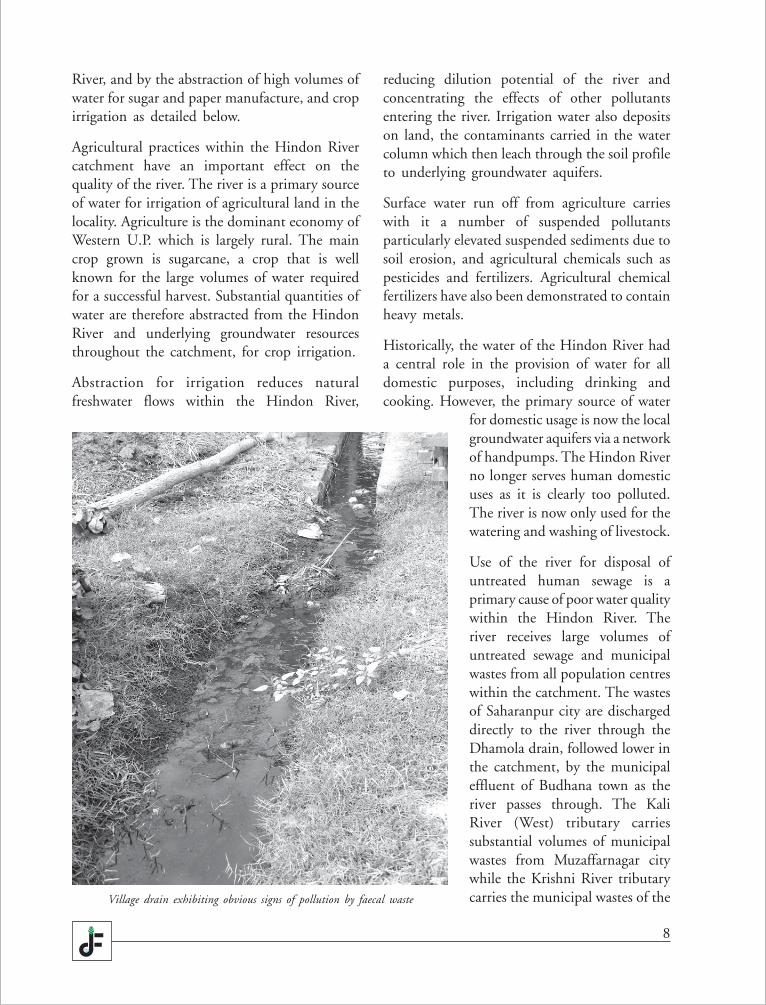
Use of the river for disposal ofuntreated human sewage is aprimary cause of poor water qualitywithin the Hindon River. Theriver receives large volumes ofuntreated sewage and municipalwastes from all population centreswithin the catchment. The wastesof Saharanpur city are dischargeddirectly to the river through theDhamola drain, followed lower inthe catchment, by the municipaleffluent of Budhana town as theriver passes through. The KaliRiver (West) tributary carriessubstantial volumes of municipalwastes from Muzaffarnagar citywhile the Krishni River tributarycarries the municipal wastes of theVillage drain exhibiting obvious signs of pollution by faecal waste
River, and by the abstraction of high volumes ofwater for sugar and paper manufacture, and cropirrigation as detailed below.
Agricultural practices within the Hindon Rivercatchment have an important effect on thequality of the river. The river is a primary sourceof water for irrigation of agricultural land in thelocality. Agriculture is the dominant economy ofWestern U.P. which is largely rural. The maincrop grown is sugarcane, a crop that is wellknown for the large volumes of water requiredfor a successful harvest. Substantial quantities ofwater are therefore abstracted from the HindonRiver and underlying groundwater resourcesthroughout the catchment, for crop irrigation.
Abstraction for irrigation reduces naturalfreshwater flows within the Hindon River,
9
The river also receives a high loading ofdegradable and non-degradable domesticgenerated litter.
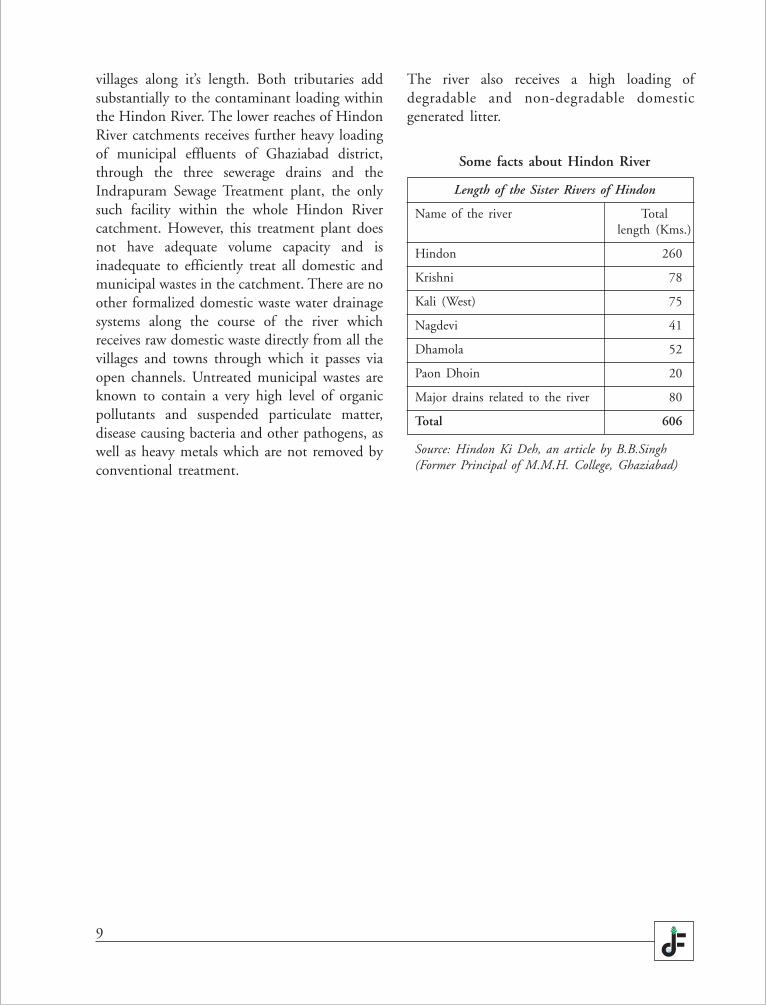
Some facts about Hindon River
Length of the Sister Rivers of Hindon
Name of the river Totallength (Kms.)
Hindon 260
Krishni 78
Kali (West) 75
Nagdevi 41
Dhamola 52
Paon Dhoin 20
Major drains related to the river 80
Total 606
Source: Hindon Ki Deh, an article by B.B.Singh(Former Principal of M.M.H. College, Ghaziabad)
villages along it’s length. Both tributaries addsubstantially to the contaminant loading withinthe Hindon River. The lower reaches of HindonRiver catchments receives further heavy loadingof municipal effluents of Ghaziabad district,through the three sewerage drains and theIndrapuram Sewage Treatment plant, the onlysuch facility within the whole Hindon Rivercatchment. However, this treatment plant doesnot have adequate volume capacity and isinadequate to efficiently treat all domestic andmunicipal wastes in the catchment. There are noother formalized domestic waste water drainagesystems along the course of the river whichreceives raw domestic waste directly from all thevillages and towns through which it passes viaopen channels. Untreated municipal wastes areknown to contain a very high level of organicpollutants and suspended particulate matter,disease causing bacteria and other pathogens, aswell as heavy metals which are not removed byconventional treatment.
10
Samples of river water were taken in 22locations along the full length of the Hindon
River. Map 1 shows sample point locations,indicated by number 1 to 22.
Sample analysis results for all water qualityparameters discussed below are available inAppendix B.
The river water was evaluated for physical andchemical characteristics, the presence of toxiccontaminants (heavy metals and pesticides) andfor biological diversity of river ecology.
Physical, chemical and biochemical parameterswhere chosen for analysis for each sample taken,including Dissolved Oxygen and BiochemicalOxygen Demand (BOD).
These parameters where chosen for assessment asthey give a good overview of general waterquality.
Measurements for Dissolved Oxygen wereundertaken in the field. All other parameterswere assessed in the laboratory according to thestandard methodologies prescribed in theHandbook of American Public Health Association(APHA), American Water Works Association(AWWA) and Water Environment Federation(WEF), 20th Edition 1998.
Biochemical Oxygen Demand and levels ofoxygen dissolved in the water column are goodindicators of organic pollution levels. Organicpollutants such as sewage and food wastes havea high nutrient loading. These nutrients attract
bacteria and other microbes. As these microbesdigest the nutrients and proliferate, they consumeoxygen within the water column. This reduceslevels of oxygen available for the other aquaticorganisms that form the populations of a healthyriver, such as macro-invertebrates and fish. Underconditions of high BOD, a river suffocates anddies. A high BOD generally corresponds to lowlevels of dissolved oxygen within the watercolumn.
The Central Pollution Control Board (CPCB)has set the standard for the levels of BODacceptable for bathing water at 3 mg/l. Levels ofBOD acceptable within a drinking water sourcewithout treatment is just 2 mg/l. A clean riverwith low organic pollution levels is also expectedto have a BOD level of around 2 mg/l.
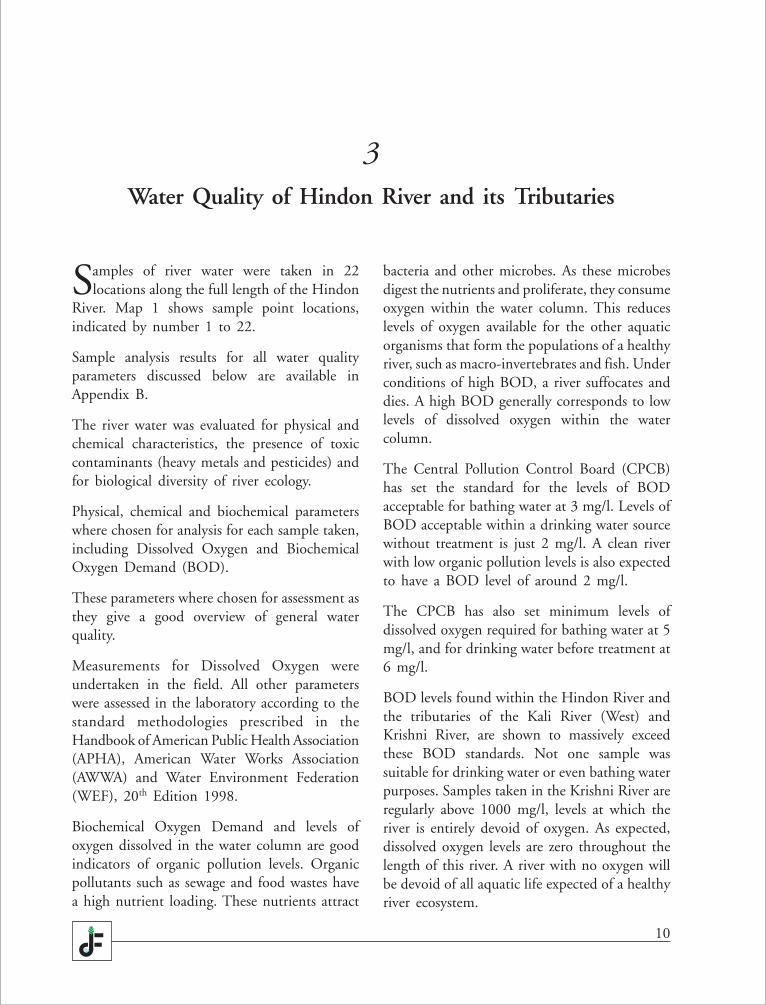
The CPCB has also set minimum levels ofdissolved oxygen required for bathing water at 5mg/l, and for drinking water before treatment at6 mg/l.
BOD levels found within the Hindon River andthe tributaries of the Kali River (West) andKrishni River, are shown to massively exceedthese BOD standards. Not one sample wassuitable for drinking water or even bathing waterpurposes. Samples taken in the Krishni River areregularly above 1000 mg/l, levels at which theriver is entirely devoid of oxygen. As expected,dissolved oxygen levels are zero throughout thelength of this river. A river with no oxygen willbe devoid of all aquatic life expected of a healthyriver ecosystem.
3Water Quality of Hindon River and its Tributaries
11
Oxygen Demand (BOD) in the range of 1,700to 6,600 mg/l.
It is due to such extraordinarily high organicpollutant loading, that the Central PollutionControl Board lists sugarcane processing withinthe top 17 most polluting industries in India.The Hindon River system also receives effluentfrom the distillation of ethanol from sugarcanemolasses. This corrosive effluent, known as‘vinasse’, also contains high levels of organicpollutants, and adds to the high BOD / lowoxygen level suffocation of the rivers.
Paper mill effluent is also notoriously high inorganic pollutants, and is again listed within thetop 17 most polluting industries in India. TheHindon River and it’s tributaries receives effluentfrom numerous sugar and paper mills which area primary contributor to the anaerobic conditionswithin the river.
Graph 1 – Dissolved Oxygen levels with the Kali (West), Krishni and Hindon Rivers compared against the CentralPollution Control Board specified required minimum standard for drinking water without treatment.
Dissolved Oxygen levels meeting the requiredstandard were found at only two locations, bothin the upper reaches of the Kali River (West). SeeGraph 1 below.
BOD levels within the effluent in the NanautaSugar Mill, Distillery and Dairy plant drain wereextraordinary at above 9600 mg/l. No riversystem is able to assimilate such a high nutrientloading.
High volume of untreated sewage and othermunicipal discharges also add considerably to thehigh levels of BOD and low levels of DissolvedOxygen found. Such wastes not only add organicpollutants but also dangerous levels of faecalbacteria and disease causing pathogens.
Effluents from the manufacture of sugar fromsugarcane, is characteristically very high inorganic pollutants. Untreated sugarcaneprocessing effluent is known to have a Biological
12
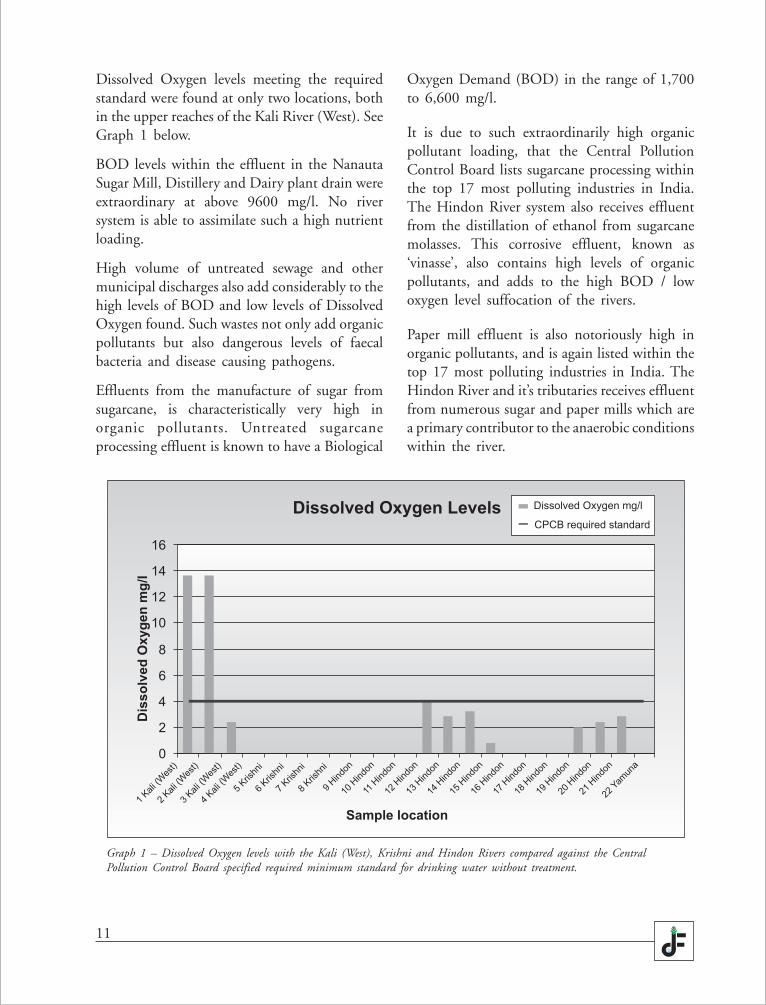
The World Bank Group ‘Pollution Preventionand Abatement Handbook’ specifies that effluentwith a BOD of 50 mg/l of less should be achievedbefore disposal of industrial effluent to a receivingsurface water course. It is immediately obviousthat extensive treatment of effluent needs to beundertaken at source before discharge in orderthat the requirements of the World Bank Groupare met.
Full results for the macro-invertebrate sampleanalysis are located in Appendix C.
Map 1 provides locations for biological moni-toring samples.
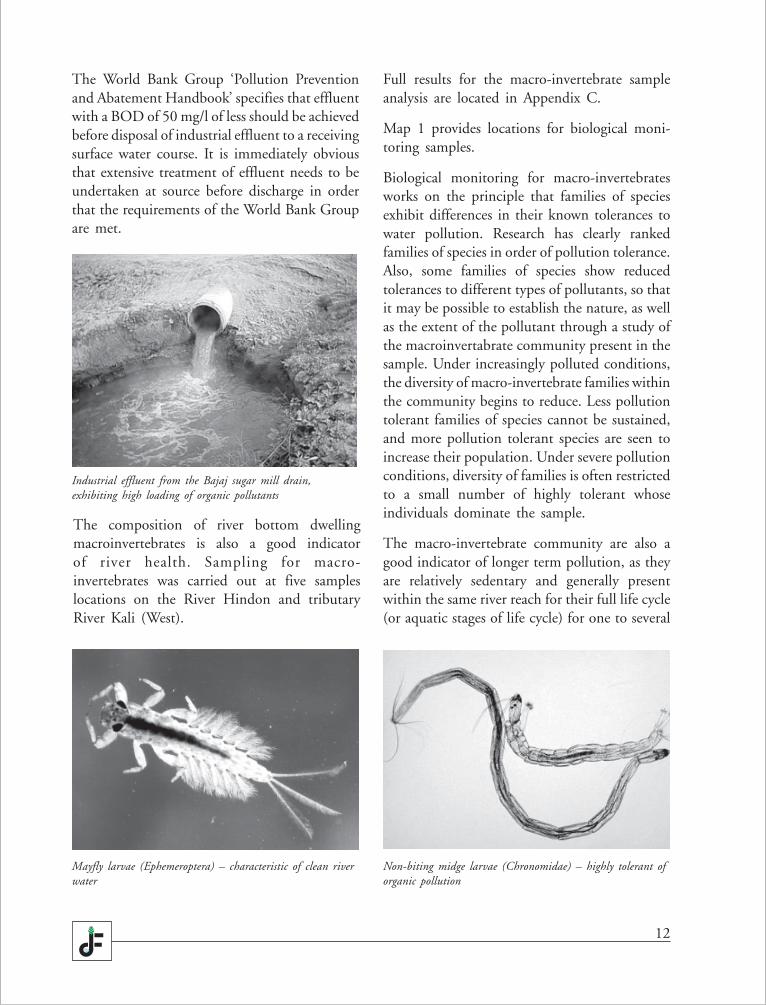
Biological monitoring for macro-invertebratesworks on the principle that families of speciesexhibit differences in their known tolerances towater pollution. Research has clearly rankedfamilies of species in order of pollution tolerance.Also, some families of species show reducedtolerances to different types of pollutants, so thatit may be possible to establish the nature, as wellas the extent of the pollutant through a study ofthe macroinvertabrate community present in thesample. Under increasingly polluted conditions,the diversity of macro-invertebrate families withinthe community begins to reduce. Less pollutiontolerant families of species cannot be sustained,and more pollution tolerant species are seen toincrease their population. Under severe pollutionconditions, diversity of families is often restrictedto a small number of highly tolerant whoseindividuals dominate the sample.
The macro-invertebrate community are also agood indicator of longer term pollution, as theyare relatively sedentary and generally presentwithin the same river reach for their full life cycle(or aquatic stages of life cycle) for one to several
The composition of river bottom dwellingmacroinvertebrates is also a good indicatorof river health. Sampling for macro-invertebrates was carried out at five sampleslocations on the River Hindon and tributaryRiver Kali (West).
Industrial effluent from the Bajaj sugar mill drain,exhibiting high loading of organic pollutants
Mayfly larvae (Ephemeroptera) – characteristic of clean riverwater
Non-biting midge larvae (Chronomidae) – highly tolerant oforganic pollution
13
years. Deterioration or improvements of waterquality can therefore be monitored over time byassessing changes in pollutant tolerant specieswithin the community.
Specimens taken for the present study wereidentified to family level, and the number ofindividual specimens of each taxon was recorded.
The results of the biological monitoring wasassessed using a scoring system devised by theBiological Monitoring Workers Party, a groupwithin the UK Government Department for theEnvironment – known as the BMWP scoringsystem. The BMWP scoring system provides astructured format within which to determine thequality of a river from the pollution tolerancesof the community sampled.
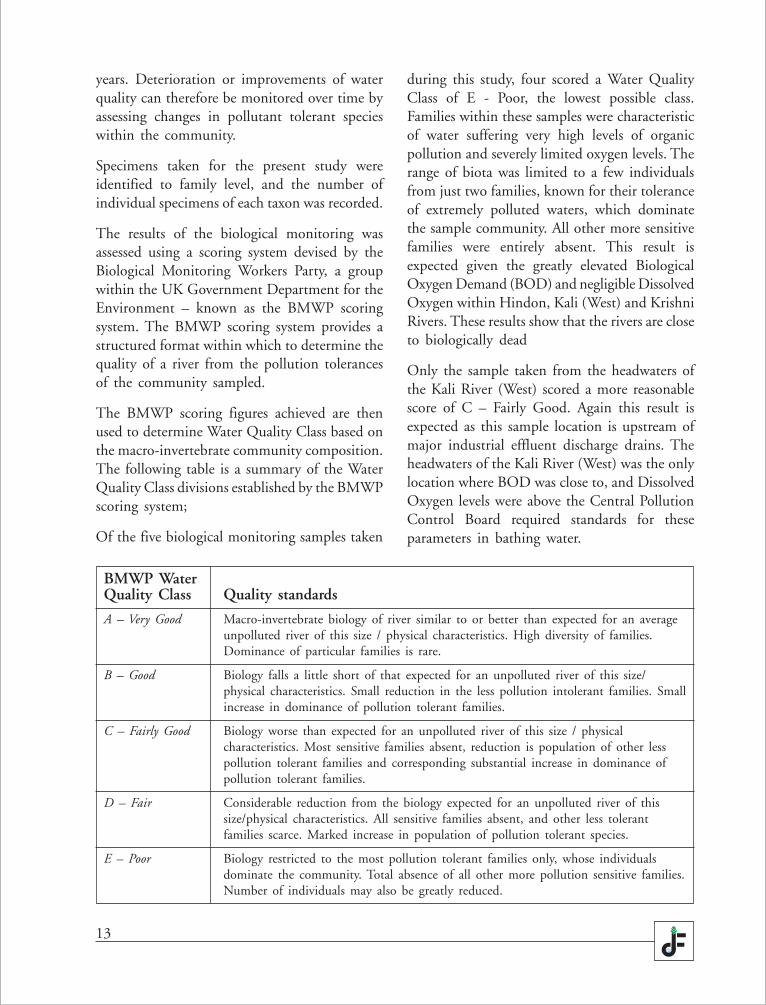
The BMWP scoring figures achieved are thenused to determine Water Quality Class based onthe macro-invertebrate community composition.The following table is a summary of the WaterQuality Class divisions established by the BMWPscoring system;
Of the five biological monitoring samples taken
during this study, four scored a Water QualityClass of E - Poor, the lowest possible class.Families within these samples were characteristicof water suffering very high levels of organicpollution and severely limited oxygen levels. Therange of biota was limited to a few individualsfrom just two families, known for their toleranceof extremely polluted waters, which dominatethe sample community. All other more sensitivefamilies were entirely absent. This result isexpected given the greatly elevated BiologicalOxygen Demand (BOD) and negligible DissolvedOxygen within Hindon, Kali (West) and KrishniRivers. These results show that the rivers are closeto biologically dead
Only the sample taken from the headwaters ofthe Kali River (West) scored a more reasonablescore of C – Fairly Good. Again this result isexpected as this sample location is upstream ofmajor industrial effluent discharge drains. Theheadwaters of the Kali River (West) was the onlylocation where BOD was close to, and DissolvedOxygen levels were above the Central PollutionControl Board required standards for theseparameters in bathing water.
BMWP WaterQuality Class Quality standards
A – Very Good Macro-invertebrate biology of river similar to or better than expected for an averageunpolluted river of this size / physical characteristics. High diversity of families.Dominance of particular families is rare.
B – Good Biology falls a little short of that expected for an unpolluted river of this size/physical characteristics. Small reduction in the less pollution intolerant families. Smallincrease in dominance of pollution tolerant families.
C – Fairly Good Biology worse than expected for an unpolluted river of this size / physicalcharacteristics. Most sensitive families absent, reduction is population of other lesspollution tolerant families and corresponding substantial increase in dominance ofpollution tolerant families.
D – Fair Considerable reduction from the biology expected for an unpolluted river of thissize/physical characteristics. All sensitive families absent, and other less tolerantfamilies scarce. Marked increase in population of pollution tolerant species.
E – Poor Biology restricted to the most pollution tolerant families only, whose individualsdominate the community. Total absence of all other more pollution sensitive families.Number of individuals may also be greatly reduced.
14
The quality of the biological community withina river is important for more than just aestheticreasons. A healthy river with a complexcommunity is more able to assimilate andmetabolise pollutants, so helping to reduce theirquantities within the water column. A restrictedcommunity, as seen here, cannot provide anysuch informal treatment of effluents, so allowingpollution levels to further increase. A riverexhibiting such poor aquatic community willhave no fish as a potential food source, is likelyto be odorous and a source of disease vectors,such as faecal pathogens and mosquitoes. This isindeed the case for the Hindon River.
The river water was also assessed for the presenceof heavy metals. Sampling methodology andlocations for heavy metals was the same asoutlined above for Biological Oxygen Demandand Dissolved Oxygen.
Laboratory analysis was also undertaken for thepresence of the following three heavy metals –Lead, Cadmium and Chromium.
Full analytical results for heavy metals in surfacewaters are presented within Appendix D.
Heavy metals are known to be discharged inthe effluents of a wide range of industriespresent within the Hindon River catchment,including sugarcane and paper manufacture.Research has also identified lead, chromium andcadmium within sewage effluent, both treatedand untreated since standard sewage treatmentplants are not able to remove metals. Agriculturalfertilizers are also known to contain thesethree heavy metals. It is therefore inevitablethat the samples taken from the Hindon, Kali(West) and Krishni Rivers contain these metalsat elevated levels.
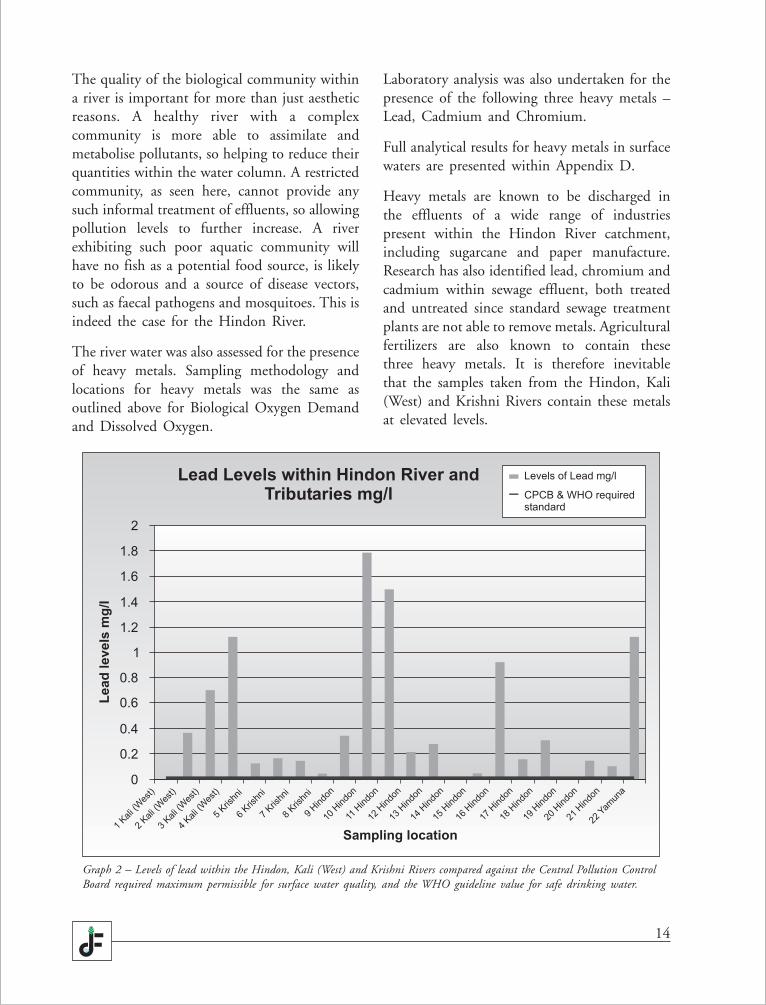
Graph 2 – Levels of lead within the Hindon, Kali (West) and Krishni Rivers compared against the Central Pollution ControlBoard required maximum permissible for surface water quality, and the WHO guideline value for safe drinking water.
15
Heavy metals accumulate in river sediments aswell as being found within the water column, andare highly persistent as they are not readilybroken down or destroyed. All three metals areknown to be highly acutely toxic to aquaticorganisms. These metals are also highly toxic tohuman health and the consequences for longterm ingestion of water with such elevatedconcentrations can be devastating.
The Central Pollution Control Board (CPCB)has set a number of maximum permissiblestandards for the protection of surface waters.
The CPCB standard for maximum permissiblelevels of lead in surface water is 0.01 mg/l. TheWorld Health Organisation guideline for safedrinking water also specifies maximum leadlevels as 0.01 mg/l. As can be seen from Graph2 above, levels of lead within samples are
exceeded at all but three sampling locations.Levels within the Hindon River were identifiedat up to 179 times the stated permissiblemaximum and up to 112 times stated maximumwithin the Kali River (West).
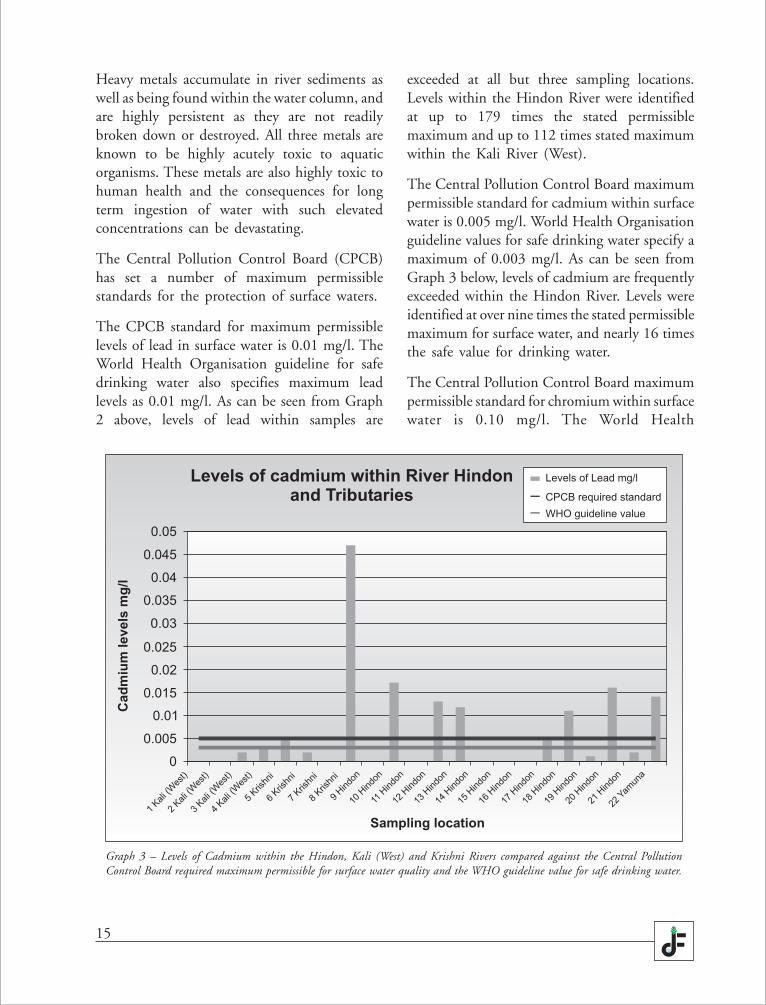
The Central Pollution Control Board maximumpermissible standard for cadmium within surfacewater is 0.005 mg/l. World Health Organisationguideline values for safe drinking water specify amaximum of 0.003 mg/l. As can be seen fromGraph 3 below, levels of cadmium are frequentlyexceeded within the Hindon River. Levels wereidentified at over nine times the stated permissiblemaximum for surface water, and nearly 16 timesthe safe value for drinking water.
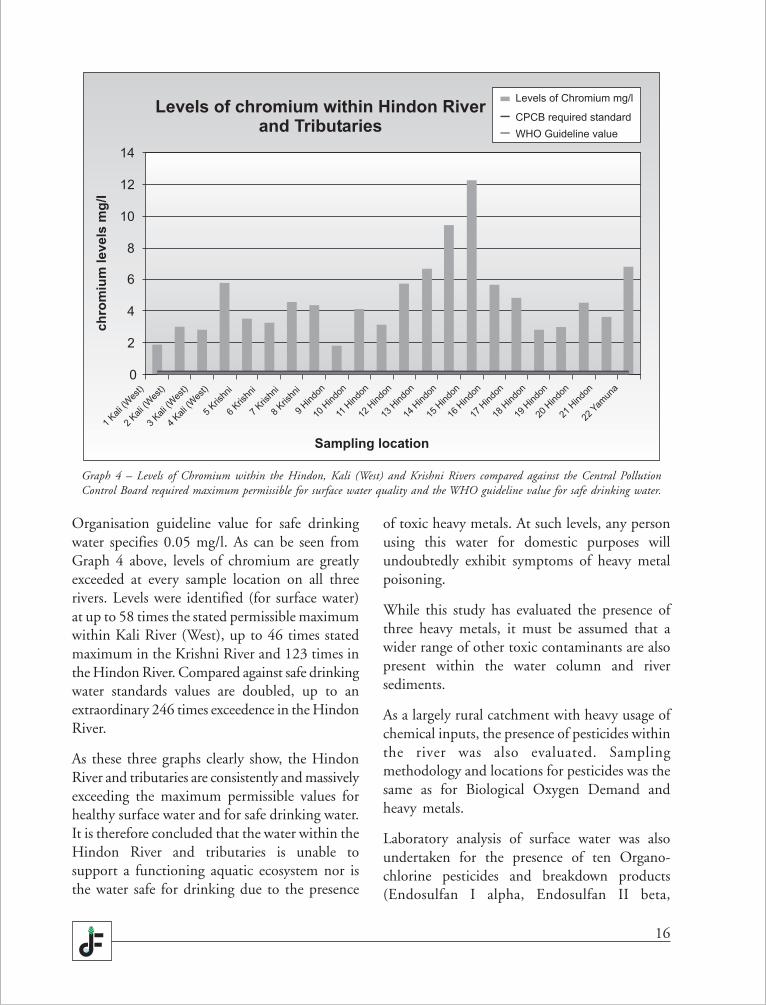
The Central Pollution Control Board maximumpermissible standard for chromium within surfacewater is 0.10 mg/l. The World Health
Graph 3 – Levels of Cadmium within the Hindon, Kali (West) and Krishni Rivers compared against the Central PollutionControl Board required maximum permissible for surface water quality and the WHO guideline value for safe drinking water.
16
Organisation guideline value for safe drinkingwater specifies 0.05 mg/l. As can be seen fromGraph 4 above, levels of chromium are greatlyexceeded at every sample location on all threerivers. Levels were identified (for surface water)at up to 58 times the stated permissible maximumwithin Kali River (West), up to 46 times statedmaximum in the Krishni River and 123 times inthe Hindon River. Compared against safe drinkingwater standards values are doubled, up to anextraordinary 246 times exceedence in the HindonRiver.
As these three graphs clearly show, the HindonRiver and tributaries are consistently and massivelyexceeding the maximum permissible values forhealthy surface water and for safe drinking water.It is therefore concluded that the water within theHindon River and tributaries is unable tosupport a functioning aquatic ecosystem nor isthe water safe for drinking due to the presence
of toxic heavy metals. At such levels, any personusing this water for domestic purposes willundoubtedly exhibit symptoms of heavy metalpoisoning.
While this study has evaluated the presence ofthree heavy metals, it must be assumed that awider range of other toxic contaminants are alsopresent within the water column and riversediments.
As a largely rural catchment with heavy usage ofchemical inputs, the presence of pesticides withinthe river was also evaluated. Samplingmethodology and locations for pesticides was thesame as for Biological Oxygen Demand andheavy metals.
Laboratory analysis of surface water was alsoundertaken for the presence of ten Organo-chlorine pesticides and breakdown products(Endosulfan I alpha, Endosulfan II beta,
Graph 4 – Levels of Chromium within the Hindon, Kali (West) and Krishni Rivers compared against the Central PollutionControl Board required maximum permissible for surface water quality and the WHO guideline value for safe drinking water.
17
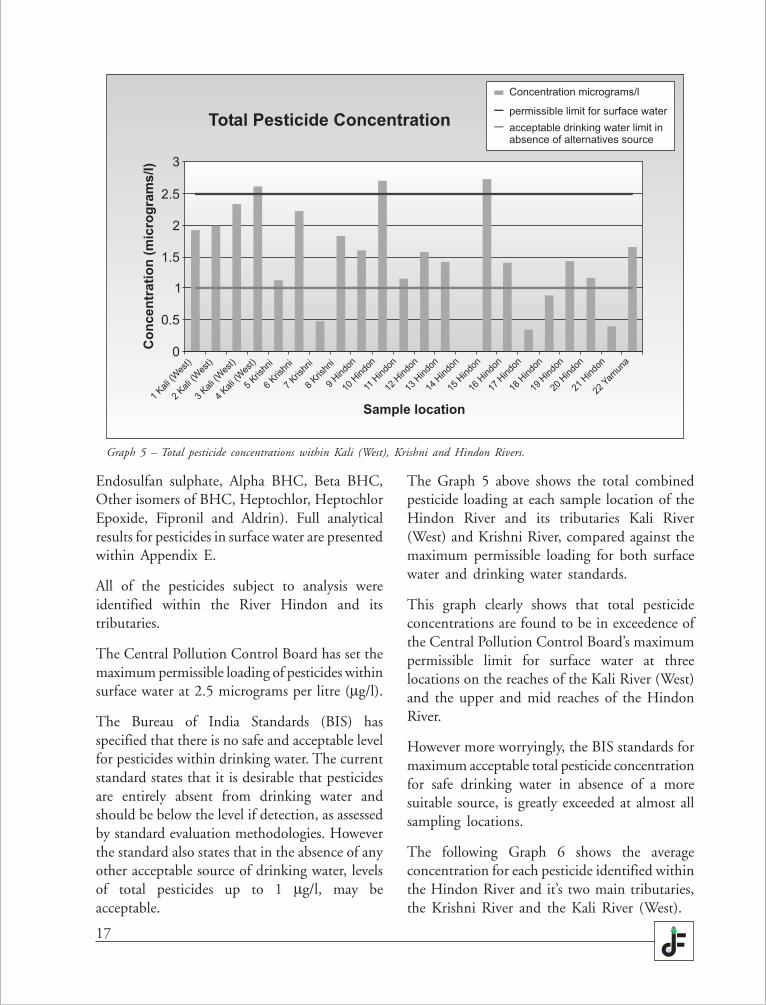
Endosulfan sulphate, Alpha BHC, Beta BHC,Other isomers of BHC, Heptochlor, HeptochlorEpoxide, Fipronil and Aldrin). Full analyticalresults for pesticides in surface water are presentedwithin Appendix E.
All of the pesticides subject to analysis wereidentified within the River Hindon and itstributaries.
The Central Pollution Control Board has set themaximum permissible loading of pesticides withinsurface water at 2.5 micrograms per litre (µg/l).
The Bureau of India Standards (BIS) hasspecified that there is no safe and acceptable levelfor pesticides within drinking water. The currentstandard states that it is desirable that pesticidesare entirely absent from drinking water andshould be below the level if detection, as assessedby standard evaluation methodologies. Howeverthe standard also states that in the absence of anyother acceptable source of drinking water, levelsof total pesticides up to 1 µg/l, may beacceptable.
The Graph 5 above shows the total combinedpesticide loading at each sample location of theHindon River and its tributaries Kali River(West) and Krishni River, compared against themaximum permissible loading for both surfacewater and drinking water standards.
This graph clearly shows that total pesticideconcentrations are found to be in exceedence ofthe Central Pollution Control Board’s maximumpermissible limit for surface water at threelocations on the reaches of the Kali River (West)and the upper and mid reaches of the HindonRiver.
However more worryingly, the BIS standards formaximum acceptable total pesticide concentrationfor safe drinking water in absence of a moresuitable source, is greatly exceeded at almost allsampling locations.
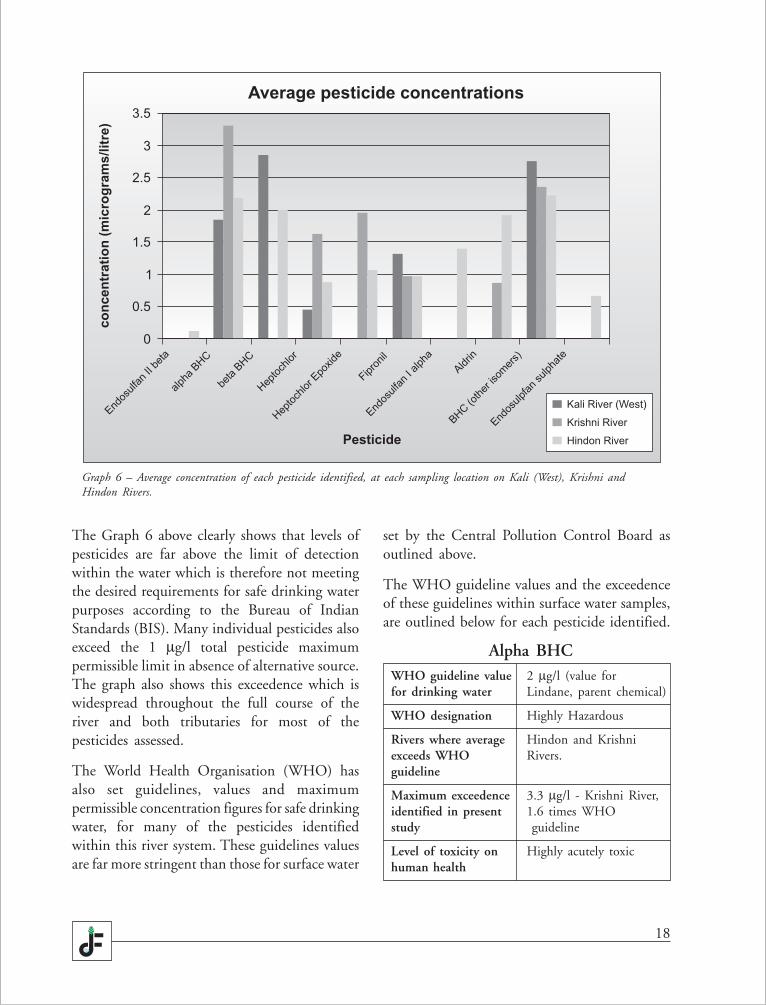
The following Graph 6 shows the averageconcentration for each pesticide identified withinthe Hindon River and it’s two main tributaries,the Krishni River and the Kali River (West).
Graph 5 – Total pesticide concentrations within Kali (West), Krishni and Hindon Rivers.
18
The Graph 6 above clearly shows that levels ofpesticides are far above the limit of detectionwithin the water which is therefore not meetingthe desired requirements for safe drinking waterpurposes according to the Bureau of IndianStandards (BIS). Many individual pesticides alsoexceed the 1 µg/l total pesticide maximumpermissible limit in absence of alternative source.The graph also shows this exceedence which iswidespread throughout the full course of theriver and both tributaries for most of thepesticides assessed.
The World Health Organisation (WHO) hasalso set guidelines, values and maximumpermissible concentration figures for safe drinkingwater, for many of the pesticides identifiedwithin this river system. These guidelines valuesare far more stringent than those for surface water
set by the Central Pollution Control Board asoutlined above.
The WHO guideline values and the exceedenceof these guidelines within surface water samples,are outlined below for each pesticide identified.
Graph 6 – Average concentration of each pesticide identified, at each sampling location on Kali (West), Krishni andHindon Rivers.
Alpha BHCWHO guideline value 2 µg/l (value forfor drinking water Lindane, parent chemical)
WHO designation Highly Hazardous
Rivers where average Hindon and Krishniexceeds WHO Rivers.guideline
Maximum exceedence 3.3 µg/l - Krishni River,identified in present 1.6 times WHOstudy guideline
Level of toxicity on Highly acutely toxichuman health
19
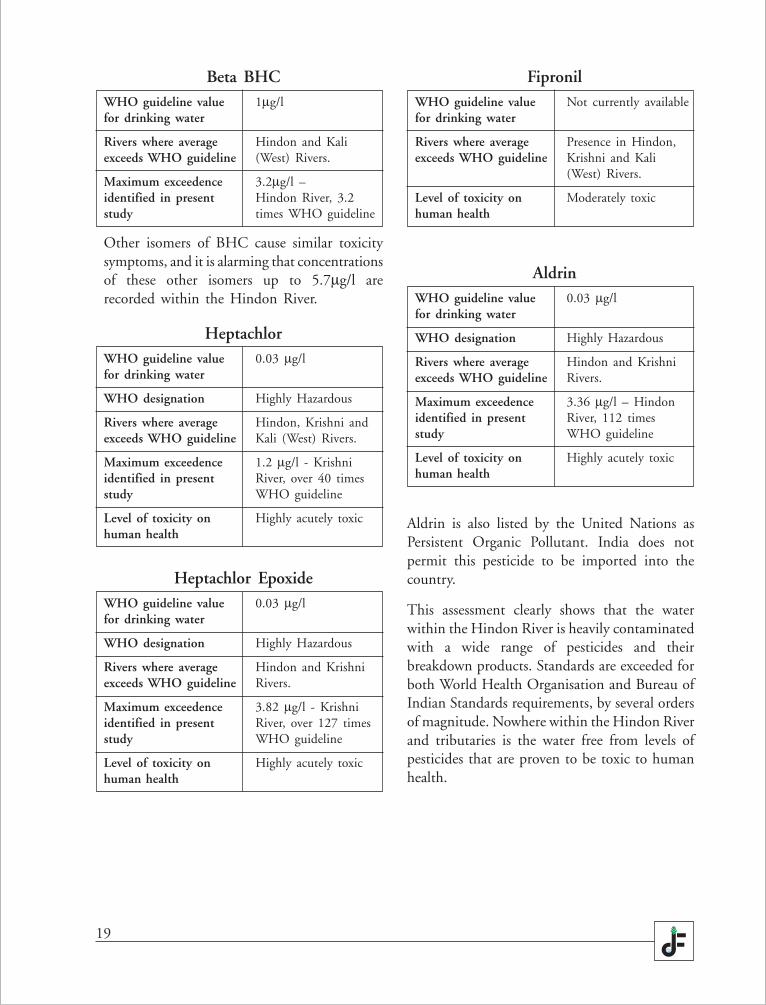
Aldrin is also listed by the United Nations asPersistent Organic Pollutant. India does notpermit this pesticide to be imported into thecountry.
This assessment clearly shows that the waterwithin the Hindon River is heavily contaminatedwith a wide range of pesticides and theirbreakdown products. Standards are exceeded forboth World Health Organisation and Bureau ofIndian Standards requirements, by several ordersof magnitude. Nowhere within the Hindon Riverand tributaries is the water free from levels ofpesticides that are proven to be toxic to humanhealth.
Beta BHCWHO guideline value 1µg/lfor drinking water
Rivers where average Hindon and Kaliexceeds WHO guideline (West) Rivers.
Maximum exceedence 3.2µg/l –identified in present Hindon River, 3.2study times WHO guideline
Other isomers of BHC cause similar toxicitysymptoms, and it is alarming that concentrationsof these other isomers up to 5.7µg/l arerecorded within the Hindon River.
HeptachlorWHO guideline value 0.03 µg/lfor drinking water
WHO designation Highly Hazardous
Rivers where average Hindon, Krishni andexceeds WHO guideline Kali (West) Rivers.
Maximum exceedence 1.2 µg/l - Krishniidentified in present River, over 40 timesstudy WHO guideline
Level of toxicity on Highly acutely toxichuman health
Heptachlor EpoxideWHO guideline value 0.03 µg/lfor drinking water
WHO designation Highly Hazardous
Rivers where average Hindon and Krishniexceeds WHO guideline Rivers.
Maximum exceedence 3.82 µg/l - Krishniidentified in present River, over 127 timesstudy WHO guideline
Level of toxicity on Highly acutely toxichuman health
FipronilWHO guideline value Not currently availablefor drinking water
Rivers where average Presence in Hindon,exceeds WHO guideline Krishni and Kali
(West) Rivers.
Level of toxicity on Moderately toxichuman health
AldrinWHO guideline value 0.03 µg/lfor drinking water
WHO designation Highly Hazardous
Rivers where average Hindon and Krishniexceeds WHO guideline Rivers.
Maximum exceedence 3.36 µg/l – Hindonidentified in present River, 112 timesstudy WHO guideline
Level of toxicity on Highly acutely toxichuman health
20
Alluvial sediments are the dominant geologywithin the Hindon River and tributary
catchment. Alluvial sediments are porous andcontaminants within an overlying surface waterbody will pass easily through the sediments tounderlying aquifers. River systems are commonlyin direct hydraulic continuity with the underlyinggroundwater aquifer. The likelihood is thereforehigh that contaminants within the Hindon Riversystem pass directly from surface water togroundwater. As has already been demonstrated,the Hindon River is widely used for agriculturalirrigation and is also heavily polluted with arange of toxic chemicals.
Contaminated river water for irrigation andheavy use of pesticides direct to cropland isanother major pathway by which contaminantsare transferred via percolation through soil tounderlying groundwater.
Groundwater is the dominant source of water fordomestic usage, including drinking water. Havingidentified exceedences of heavy metals andpesticides within the surface water, an assessmentwas undertaken of local groundwater samples.
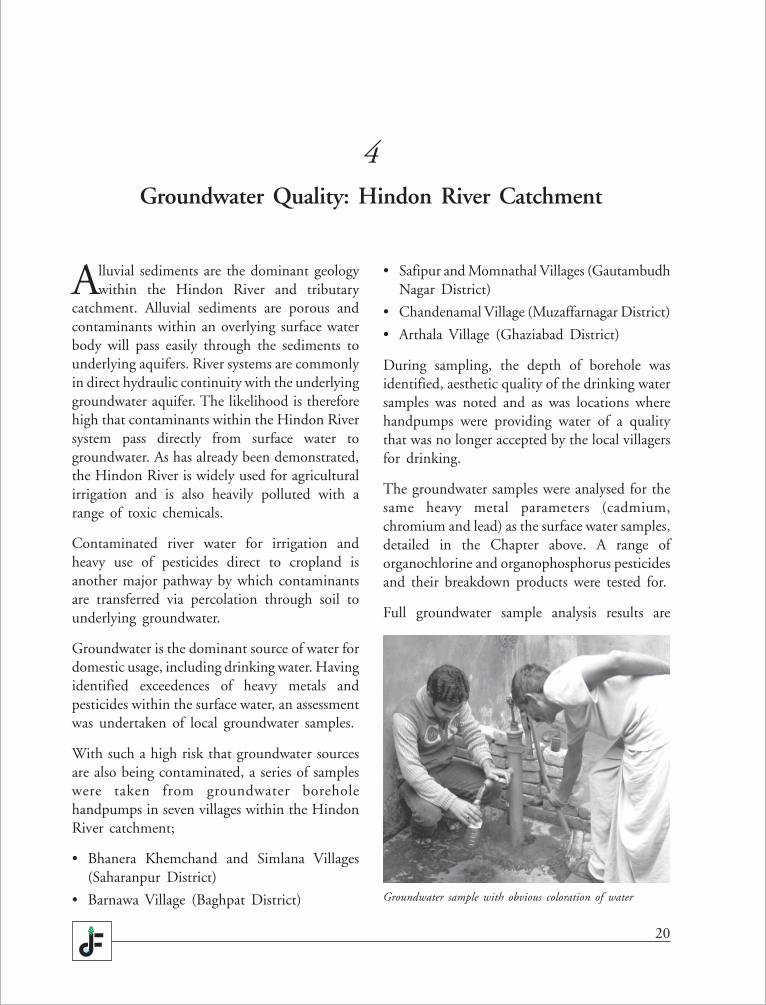
With such a high risk that groundwater sourcesare also being contaminated, a series of sampleswere taken from groundwater boreholehandpumps in seven villages within the HindonRiver catchment;
• Bhanera Khemchand and Simlana Villages(Saharanpur District)
• Barnawa Village (Baghpat District)
• Safipur and Momnathal Villages (GautambudhNagar District)
• Chandenamal Village (Muzaffarnagar District)
• Arthala Village (Ghaziabad District)
During sampling, the depth of borehole wasidentified, aesthetic quality of the drinking watersamples was noted and as was locations wherehandpumps were providing water of a qualitythat was no longer accepted by the local villagersfor drinking.
The groundwater samples were analysed for thesame heavy metal parameters (cadmium,chromium and lead) as the surface water samples,detailed in the Chapter above. A range oforganochlorine and organophosphorus pesticidesand their breakdown products were tested for.
Full groundwater sample analysis results are
4Groundwater Quality: Hindon River Catchment
Groundwater sample with obvious coloration of water
21
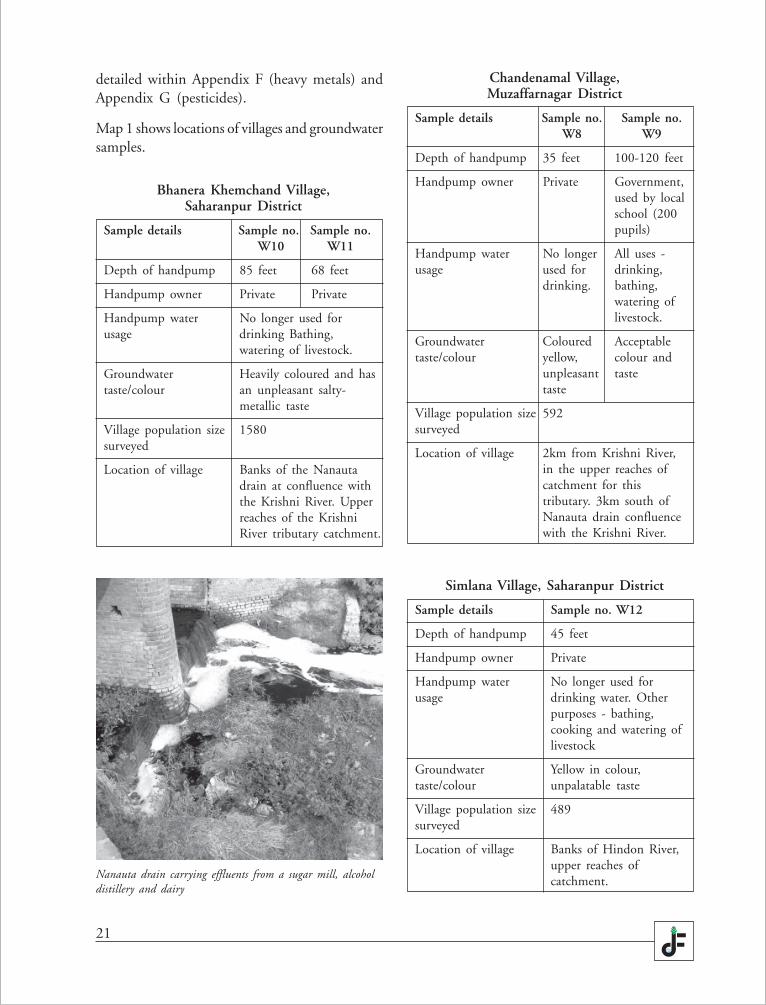
detailed within Appendix F (heavy metals) andAppendix G (pesticides).
Map 1 shows locations of villages and groundwatersamples.
Bhanera Khemchand Village,Saharanpur District
Sample details Sample no. Sample no. W10 W11
Depth of handpump 85 feet 68 feet
Handpump owner Private Private
Handpump water No longer used forusage drinking Bathing,
watering of livestock.
Groundwater Heavily coloured and hastaste/colour an unpleasant salty-
metallic taste
Village population size 1580surveyed
Location of village Banks of the Nanautadrain at confluence withthe Krishni River. Upperreaches of the KrishniRiver tributary catchment.
Nanauta drain carrying effluents from a sugar mill, alcoholdistillery and dairy
Chandenamal Village,Muzaffarnagar District
Sample details Sample no. Sample no.W8 W9
Depth of handpump 35 feet 100-120 feet
Handpump owner Private Government,used by localschool (200pupils)
Handpump water No longer All uses -usage used for drinking,
drinking. bathing,watering oflivestock.
Groundwater Coloured Acceptabletaste/colour yellow, colour and
unpleasant tastetaste
Village population size 592surveyed
Location of village 2km from Krishni River,in the upper reaches ofcatchment for thistributary. 3km south ofNanauta drain confluencewith the Krishni River.
Simlana Village, Saharanpur District
Sample details Sample no. W12
Depth of handpump 45 feet
Handpump owner Private
Handpump water No longer used forusage drinking water. Other
purposes - bathing,cooking and watering oflivestock
Groundwater Yellow in colour,taste/colour unpalatable taste
Village population size 489surveyed
Location of village Banks of Hindon River,upper reaches ofcatchment.
22
contaminants, including cadmium, lead andchromium. As specified above, BIS also requiresthat safe drinking water does not containpesticides above the level of detection, howevera maximum total pesticide concentration of 1µg/l may be acceptable where there is no alternativesource of clean drinking water. The CentralGroundwater Board has responsibility formonitoring of groundwater and enforcement ofthese standards.
Momnathal Village,Gautambudh Nagar District
Sample details Sample no. W7
Depth of handpump 35-40 feet
Handpump owner Private
Handpump water Used for drinking waterusage and all other purposes.
Village population size 370surveyed
Location of village This Village is alsolocated in the lowerreaches of the HindonRiver catchment, close tothe confluence with theYamuna River.
Barnawa Village, Baghpat District
Sample details Sample no. Sample no.W1 W2
Depth of handpump 35-40 feet 35-40 feet
Handpump owner Private Private
Handpump water Used for Used forusage drinking drinking
and all and allpurposes purposes
Village population size 341surveyed
Location of village Middle reaches of HindonRiver catchment,upstream of theconfluence with KrishniRiver and downstream ofthe confluence with theSardhana Paper Milleffluent drain.
Arthala Village, Ghaziabad District
Sample details Sample no. Sample no.W3 W4
Depth of handpump 35-40 feet 30-35 feet
Handpump owner Private Private
Handpump water All uses - drinking,usage bathing, watering of
livestock.
Village population size 592surveyed
Location of village Lower reaches of HindonRiver, downstream of theconfluence with theKrishni river, the Kinaunisugar mill drain, and theUpper Ganga subcanal.
Safipur Village, Gautambudh Nagar
Sample details Sample no. W6
Depth of handpump 35-40 feet
Handpump owner Private
Handpump water Used for drinking waterusage and all other purposes.
Village population size 329surveyed
Location of village Banks of Hindon River,downstream ofIndrapuram SewageTreatment Plant and4 major untreated sewageand municipal wastedrains.
The World Health Organisation (WHO) hasspecified Guideline Values for maximumpermissible levels of pesticides and heavy metalswithin safe drinking water.
Regulations have also been set by the Bureau ofIndia Standards (BIS) for a number of
23
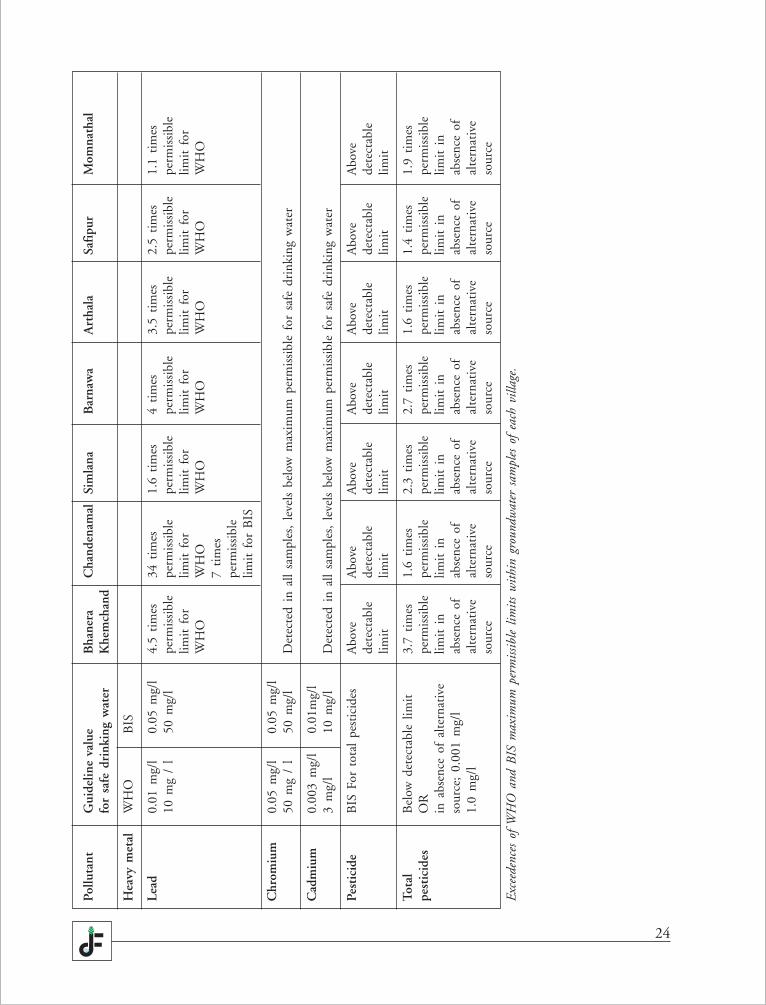
Exceedences were identified of WHO and BISmaximum permissible limits for heavy metalsand pesticides, within groundwater samplestaken at the survey villages.
Lead and chromium were detected in allgroundwater samples taken at all villages.Cadmium was detected in the samples of allvillages except Momnathal and Simlana.Chromium and cadmium levels were fortunatelyshown to be below the maxiumum permissiblelevels for both BIS and WHO.
However, lead levels were seen to grossly exceedWorld Health Organisation standards for safedrinking water at all villages, and to also exceedthe more lenient BIS limits at Chandenamalvillage. Indeed lead levels at Chandemamalvillage are almost 35 times the acceptable WHOlimit for safe drinking water.
As with surface water samples, the groundwaterdrinking water samples detected a range ofpesticides close in chemical composition to thosedetected in surface water samples. These pesticideswere predominantly organochlorine pesticidesand their breakdown products. The same rangeof pesticides are therefore present within the
surface water and groundwater resources of thesevillages. One organophosphorous pesticide wasalso identified within the groundwater samplesof Barnawa and Arthala villages. Organo-phosphorous insecticides are also acutely toxic tohuman health, with a similar range of toxicpoisoning symptoms as for organochlorinepesticides. Poisoning effects include endocrinedisruption, reproductive and developmentaldisruption and neurological disorders due todisruption of nervous system functioning.
Pesticides above detectable limit were identifiedin samples at all villages. The basic standards forsafe drinking water as set by BIS are therefore notmet at any village assessed for this study. The morelenient requirement for maximum total pesticideconcentration of 1µg/l being acceptable wherethere is no alternative source of clean drinkingwater, is also exceeded at all villages. The drinkingwater source for all villages surveyed, for whichthere are no alternative sources, therefore fail tomeet even lenient BIS standards.
The following table details exceedences of WHOand BIS maximum permissible limits withingroundwater samples of each village, for bothheavy metals and total pesticides.
24
Pollu
tant
Gui
delin
e va
lue
Bha
nera
Cha
nden
amal
Sim
lana
Bar
naw
aA
rtha
laSa
fipu
rM
omna
thal
for
safe
dri
nkin
g w
ater
Khe
mch
and
Hea
vy m
etal
WH
OB
IS
Lead
0.01
mg/
l0.
05 m
g/l
4.5
tim
es34
tim
es1.
6 ti
mes
4 ti
mes
3.5
tim
es2.
5 ti
mes
1.1
tim
es10
mg
/ l
50 m
g/l
perm
issi
ble
perm
issi
ble
perm
issi
ble
perm
issi
ble
perm
issi
ble
perm
issi
ble
perm
issi
ble
limit
for
limit
for
limit
for
limit
for
limit
for
limit
for
limit
for
WH
OW
HO
WH
OW
HO
WH
OW
HO
WH
O7
tim
espe
rmis
sibl
elim
it f
or B
IS
Chr
omiu
m0.
05 m
g/l
0.05
mg/
l50
mg
/ l
50 m
g/l
Det
ecte
d in
all
sam
ples
, le
vels
bel
ow m
axim
um p
erm
issi
ble
for
safe
dri
nkin
g w
ater
Cad
miu
m0.
003
mg/
l0.
01m
g/l
3 m
g/l
10 m
g/l
Det
ecte
d in
all
sam
ples
, le
vels
bel
ow m
axim
um p
erm
issi
ble
for
safe
dri
nkin
g w
ater
Pest
icid
eB
IS F
or t
otal
pes
tici
des
Abo
veA
bove
Abo
veA
bove
Abo
veA
bove
Abo
vede
tect
able
dete
ctab
lede
tect
able
dete
ctab
lede
tect
able
dete
ctab
lede
tect
able
limit
limit
limit
limit
limit
limit
limit
Tota
lB
elow
det
ecta
ble
limit
3.7
tim
es1.
6 ti
mes
2.3
tim
es2.
7 ti
mes
1.6
tim
es1.
4 ti
mes
1.9
tim
espe
stic
ides
OR
perm
issi
ble
perm
issi
ble
perm
issi
ble
perm
issi
ble
perm
issi
ble
perm
issi
ble
perm
issi
ble
in a
bsen
ce o
f al
tern
ativ
elim
it i
nlim
it i
nlim
it i
nlim
it i
nlim
it i
nlim
it i
nlim
it i
nso
urce
; 0.
001
mg/
lab
senc
e of
abse
nce
ofab
senc
e of
abse
nce
ofab
senc
e of
abse
nce
ofab
senc
e of
1.0
mg/
lal
tern
ativ
eal
tern
ativ
eal
tern
ativ
eal
tern
ativ
eal
tern
ativ
eal
tern
ativ
eal
tern
ativ
eso
urce
sour
ceso
urce
sour
ceso
urce
sour
ceso
urce
Exce
eden
ces
of W
HO
and
BIS
max
imum
per
miss
ible
lim
its
wit
hin
grou
ndw
ater
sam
ples
of
each
vill
age.
25
Chapter 3 identifies highly elevatedlevels of toxic pesticides and heavy metals in
river water throughout the Hindon Rivercatchment, levels far in exceedence of WorldHealth Organisation (WHO) and CentralPollution Control Board guidelines for safedrinking and bathing water. Chapter 4 showsthat elevated levels of toxic pesticides and lead arealso found within the groundwater resources thatis the only source of drinking water to a largepopulation in the Hindon River catchment.Cadmium and chromium were identified aspresent at lower levels. Pesticide and lead levelswithin this population’s drinking water areshown to greatly exceed WHO and Bureau ofIndian Standards maximum permissible levels forsafe drinking water.
An extensive body of existing scientific researchhas shown that such exceedences of toxicpesticides and heavy metals will undoubtedlycause toxic poisoning to villagers who are relianton these water sources for drinking and otherdomestic needs.
The pesticides identified within the surface andgroundwater samples of the Hindon Rivercatchment are organochlorine and organo-phosphorus pesticides. Organochlorine and orga-nophosphorus pesticides, and heavy metals areacutely toxic and cause a range of characteristicpoisoning symptoms. They bioaccumulate inhuman tissue. Both pesticides and heavy metalsare endocrine disruptors, interfering with
hormone production and functioning. Symptomsare seen such as growth, development andmaturation impairment, meaning children are atparticular risk from these range of toxins whenconsumed in drinking water. As knowncarcinogens these toxins are have been shown topromote a range of cancers. The toxins have alsobeen shown to act as immuno-suppressants,reducing resistance to disease and increasing ratesof secondary infections such as respiratoryinfections and skin dermatitis.
Organochlorine pesticides are potent stimulantsof the central nervous system interfering withneuro- transmitters and causing a range ofneurological and behavioural disorders. Some ofthe organochlorine pesticides found at elevatedlevels within the Hindon River catchment havebeen identified by the United Nations as beingPersistent Organic Pollutants (POPs). The UnitedNations is working to ban the production anduse of POPs worldwide because of their acutetoxicity and dangers to health.
The following table outlines the harm to humanhealth that has been shown to occur followingexposure to, or consumption of, watercontaminated with elevated levels of the heavymetals and pesticides identified with the drinkingwater of these villages.
All of the contaminants listed below have beenfound in surface and groundwater drinking watersamples at levels that exceed maximum permissible
5Implications of Groundwater Contamination
on Health of Riparian Communities
26
Contaminant in Toxic health effect Poisoning symptoms expected within localHindon River catchment mechanism populationexceeding safe drinkingwater standards
Lead Accumulates within human Within the skeleton, it affects the metabolismOrganochlorine tissues of calcium causing deformities and skeletalpesticides weakness.
Organophosphorus Within kidney, impairs kidney function,pesticides including kidney stones.
Within liver, impairment of liver function,cirrhosis, chronic hepatitis.
Lead Toxic to the central and Neurological and behavioural disorders.Organophosphorus peripheral nervous systemspesticides
Lead Carcinogenic Range of cancers, including kidney, breastOrganochlorine pesticides cancer, testicular, prostate.
Lead Endocrine disruptor Interferes with hormone levels and production,Organochlorine pesticides disrupting development and maturity.
Lead Transferred through the Children are therefore particularly at risk fromOrganophosphorus placenta from the mother to the ingestion of elevated lead levels, even beforepesticides unborn child birth.
Lead Interrupt reproductive cycle Infertility, reproductive disorders.Organochlorine pesticides
Organochlorine pesticides Suppression of immune system Increased susceptibility to other diseasesRespiratory disorders.
Organophosphorus Skin dermatitispesticides Gastric disorders.
guideline values for safe drinking water. All thetoxic poisoning symptoms refrenced in the abovetable are therefore expected to occur within theaffected population.
The local villages forced to rely on thiscontaminated water are therefore at a massiverisk of slow and deadly toxic poisoning.The expected health effects outlined in theabove table are already being reported byvillagers whose symptoms are obvious even to thecasual observer.
A detailed survey was therefore undertaken toevaluate the health of the populations within thecatchment and identify the extent of the toxic
poisoning. The health survey was conducted forthe seven villages also surveyed for groundwatercontamination in Chapter 4 and a further fivevillages within the Hindon River catchment.
The survey noted the numbers of villagers withinthe total village population that are currentlysuffering from serious illness and documents thenature of these illnesses. Monthly medicalexpenditure of each village incurred as a result oftheir various illnesses was documented. Numbersof deaths within the village in the previous fiveyears and cause of death was recorded.
Full details of the surveys for all 12 villages areavailable within Appendix H.
27
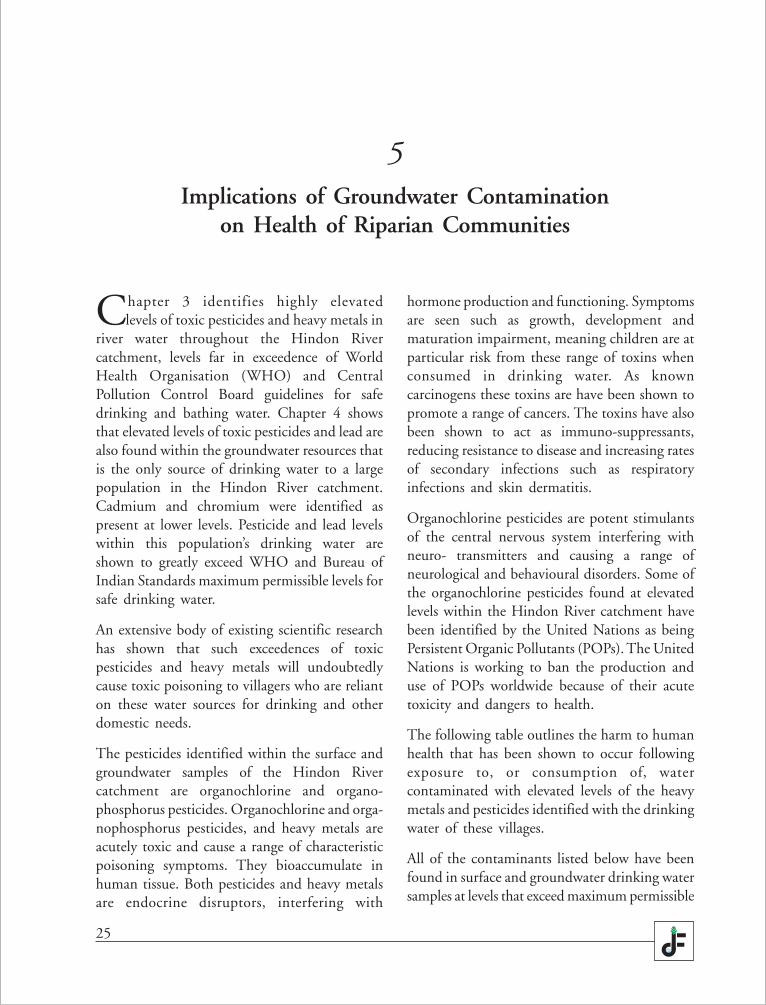
Suffering from serious skin dermatitis - Rajwati ofChandenamal village
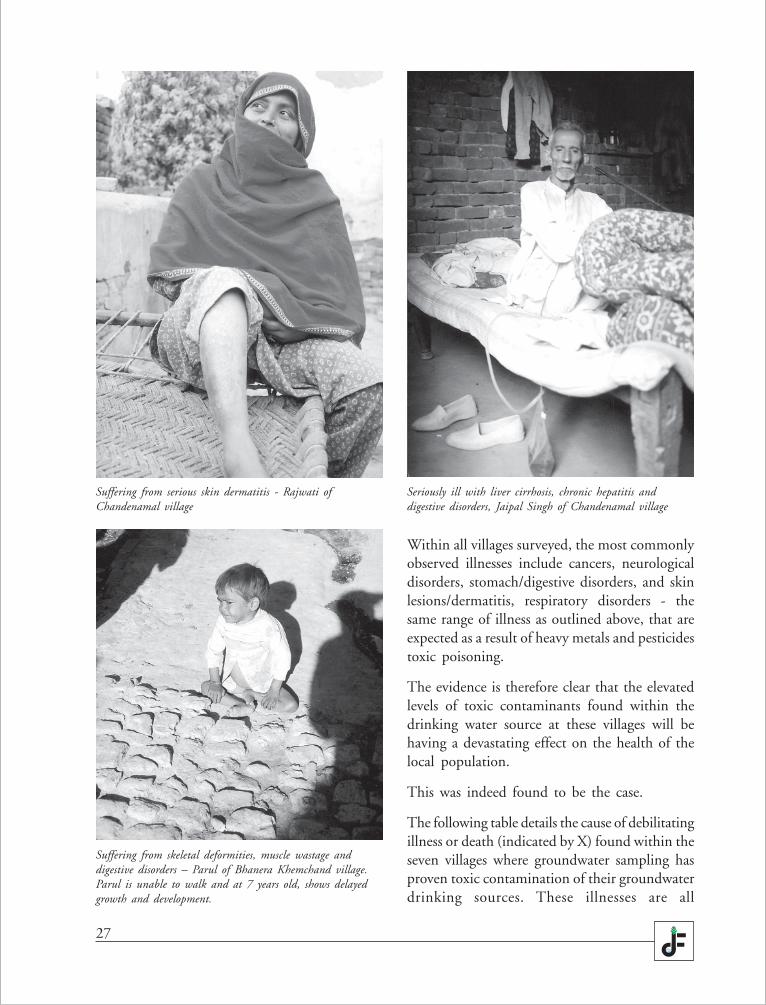
Suffering from skeletal deformities, muscle wastage anddigestive disorders – Parul of Bhanera Khemchand village.Parul is unable to walk and at 7 years old, shows delayedgrowth and development.
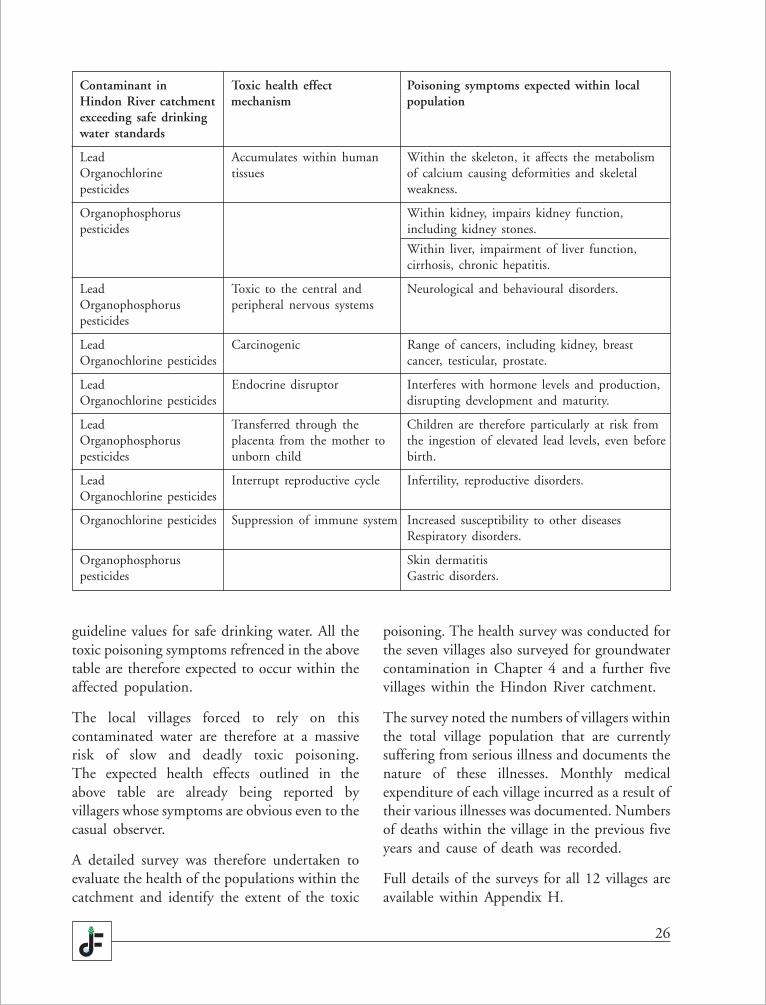
Seriously ill with liver cirrhosis, chronic hepatitis anddigestive disorders, Jaipal Singh of Chandenamal village
Within all villages surveyed, the most commonlyobserved illnesses include cancers, neurologicaldisorders, stomach/digestive disorders, and skinlesions/dermatitis, respiratory disorders - thesame range of illness as outlined above, that areexpected as a result of heavy metals and pesticidestoxic poisoning.
The evidence is therefore clear that the elevatedlevels of toxic contaminants found within thedrinking water source at these villages will behaving a devastating effect on the health of thelocal population.
This was indeed found to be the case.
The following table details the cause of debilitatingillness or death (indicated by X) found within theseven villages where groundwater sampling hasproven toxic contamination of their groundwaterdrinking sources. These illnesses are all
28
characteristic of toxic poisoning by contaminantsproven to exceed WHO and Bureau of IndianStandards maximum permissible guideline valuesfor safe drinking water in their groundwatersamples. The table also shows the percentage ofthe total village population that are sufferingfrom toxic poisoning symptoms.
Within the seven villages proven tohave toxic contamination ofdrinking water, 107 people havealso died in the last five years alonefrom the above diseasescharacteristic of toxic poisoning.
Indeed deaths are so frequent, thatRambeer of Chandenamal villagestates - ‘Iske paani ne to hum maardiye’ , ‘The water of the river haskilled us’, while Ram Niwas ofBhanera Khemchand village states‘Is gaon me to ji bahut log cancer semargey’, ‘In this village many peoplehave died of cancer’.
Of the five additional villages wheregroundwater samples were not
analysed, the results of the health survey showedthe same unacceptably high levels of illness anddeath. Again the causes were characteristic oftoxic poisoning by heavy metals and pesticides.Every village within the study was thereforeshown to be suffering from an unusually high
% of populationwithin villagecurrently
Village suffering fromserious or Illness symptom and / or Cause of Deathdebilitating Cancer Skin Neurological Heart Digestive Respiratoryillness dermatitis disorders disease disorders disorders
BhaneraKhemchand 42% X X X X X X
Chandenamal 22% X X X X X X
Simlana 14% X X X X X X
Barnawa 21% X X X X X X
Arthala 37% X X X X X
Safipur 19% X X X X
Momnathal 25% X X X X X X
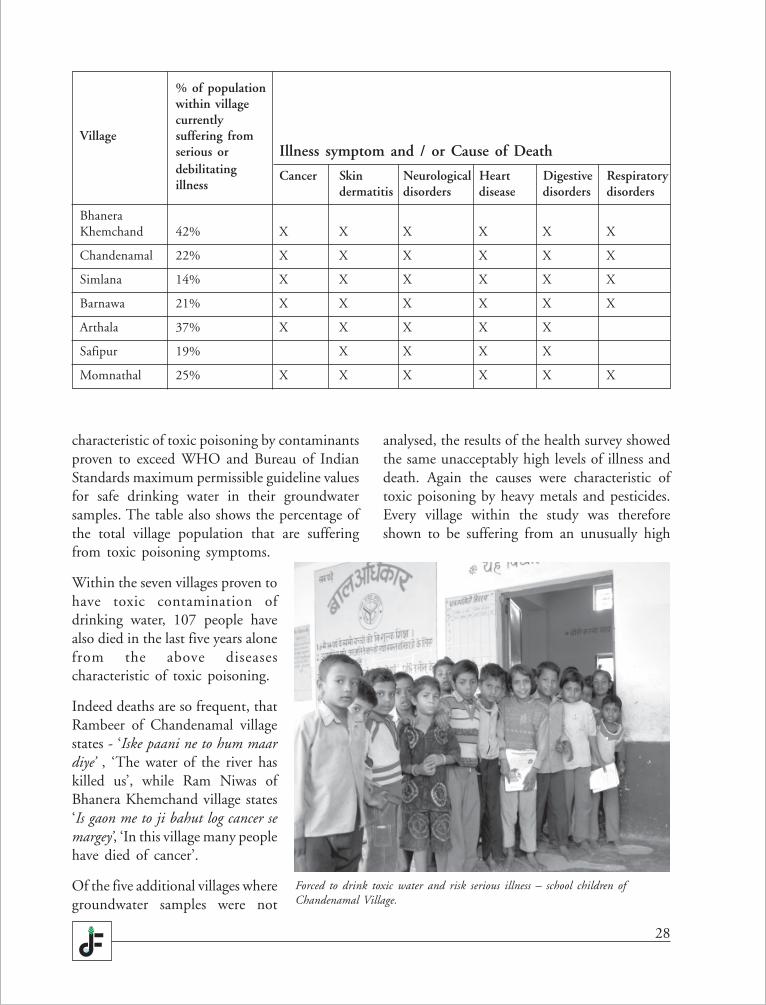
Forced to drink toxic water and risk serious illness – school children ofChandenamal Village.
29
rate of serious and debilitating illness as a resultof toxic poisoning. A further 22 people have diedin the last five years from illness characteristic oftoxic poisoning within these additional fivevillages studied.
It can therefore be extrapolated that illness dueto poisoned drinking water as a result ofgroundwater contamination, is widespread withinthe whole of the Hindon River catchment.
Although not subject to this current health study,diseases related to endocrine disruption andreproductive disorders are also likely to beprevalent within these villages, due to thepresence of guideline exceeding levels of heavymetals and pesticides within drinking water.These diseases are particularly devastating, asthey affect not only the current generation butalso the future, through damage to children whoare particularly vulnerable.
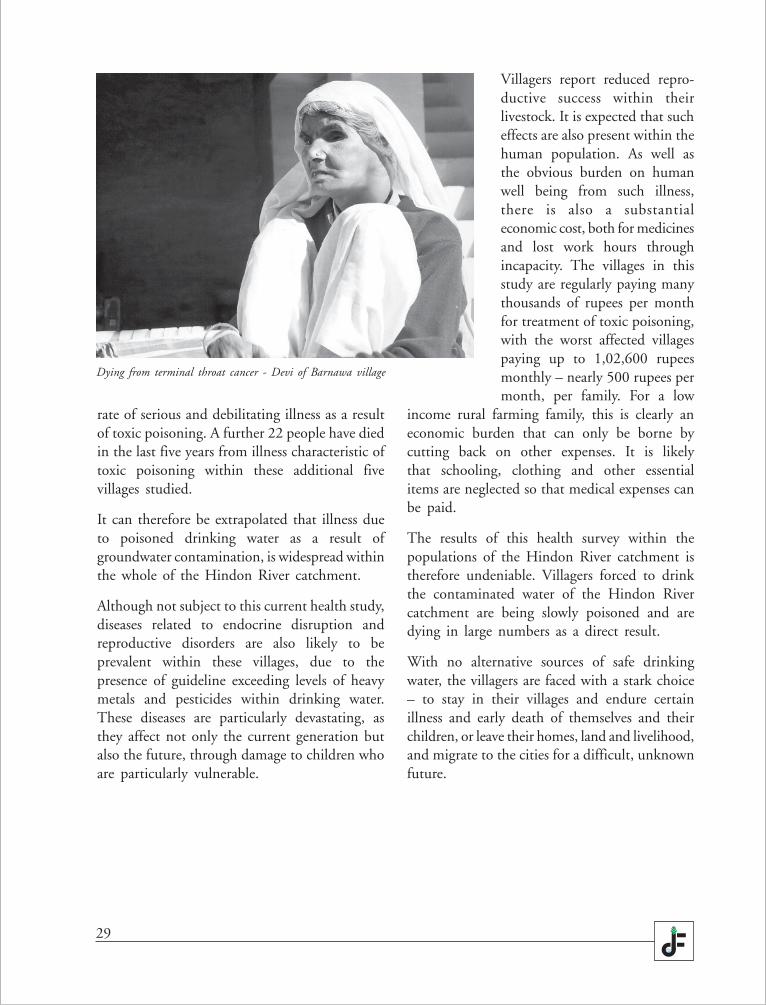
Villagers report reduced repro-ductive success within theirlivestock. It is expected that sucheffects are also present within thehuman population. As well asthe obvious burden on humanwell being from such illness,there is also a substantialeconomic cost, both for medicinesand lost work hours throughincapacity. The villages in thisstudy are regularly paying manythousands of rupees per monthfor treatment of toxic poisoning,with the worst affected villagespaying up to 1,02,600 rupeesmonthly – nearly 500 rupees permonth, per family. For a low
Dying from terminal throat cancer - Devi of Barnawa village
income rural farming family, this is clearly aneconomic burden that can only be borne bycutting back on other expenses. It is likelythat schooling, clothing and other essentialitems are neglected so that medical expenses canbe paid.
The results of this health survey within thepopulations of the Hindon River catchment istherefore undeniable. Villagers forced to drinkthe contaminated water of the Hindon Rivercatchment are being slowly poisoned and aredying in large numbers as a direct result.
With no alternative sources of safe drinkingwater, the villagers are faced with a stark choice– to stay in their villages and endure certainillness and early death of themselves and theirchildren, or leave their homes, land and livelihood,and migrate to the cities for a difficult, unknownfuture.
30
The Ministry of Agriculture and Co-operation,Ministry of Health and Family Welfare,
Ministry of Environment and Forests and theCentral Pollution Control Board, must takeresponsibility for controlling and reducing theindiscriminate use of highly acutely toxicpesticides. These government bodies must workto ensure the Bureau of Indian Standardsrequirement of no detectable pesticides withindrinking water, is met for all villages within theHindon River catchment.
As a signatory of the United Nations ‘InternationalCode of Conduct on the Distribution and use ofPesticides’, the Ministry of Fertilizers should seekto ban production and import of all WorldHealth Organisation designated extremelyhazardous and highly hazardous pesticides. Thisincludes pesticides discussed in this study.
The Ministry of Agriculture should promote theadoption of sustainable natural farming methods,and move policies away from the use of chemicalinputs.
The Central Pollution Control Board must endthe practice of untreated industrial effluentrelease direct to surface waters.
The Uttar Pradesh State Pollution Control Boardmust take action against all industries within theHindon River catchment that currently dischargeuntreated effluents. The Central Pollution ControlBoard and the Uttar Pradesh State PollutionControl Board must ensure that the industryspecific standards on industrial effluent discharge
6Recommendations
quality, as outlined within the EnvironmentProtection Rules 1986, are adhered to by allindustries within the Hindon River catchment.
Non-complying industrial plants must be closeduntil suitable effluent treatment plants areinstalled.
The Uttar Pradesh State Pollution Control Boardmust establish a monitoring programme toensure compliance with required effluenttreatment standards.
Enforcement action must be implemented forindustries failing effluent treatment standards.
The Central Groundwater Board must takeaction to remediate groundwater heavy metalscontaminant exceedences by enforcing the Bureauof Indian Standards criteria for safe drinkingwater.
The Uttar Pradesh State Pollution Control Boardshould prevent further hazardous industriesoperating and discharging within the HindonRiver catchment by ceasing to issue ‘No ObjectionCertificates’ to industry applicants, withimmediate effect.
The Uttar Pradesh State Health Departmentshould establish a public education programmeto raise awareness of basic water and sanitationpractices, including the health risks presented bycontaminated water.
The Uttar Pradesh Jal Nigam and HealthDepartments must also provide access to safe
31
drinking water and adequate medical assistancefor all villages within the Hindon River catchmentaffected by contaminated water supplies.
The State has violated Human Rights Legislationobligations to protect the rights of it’s citizens tosafe water, as the State has not prevented thirdparty polluting industries from destroying thoserights. By continuing to take no action againstthe polluters of water resources within theHindon River catchment, the Government ofIndia continues to violate internationally acceptedHuman Rights Legislation.
As a major tributary of the Yamuna River, it isessential that remediation of Hindon Rivercontamination is included as a priority withinthe existing Yamuna River Action Plan. Suchremediation needs to allocate sufficient fundsand be implemented within a clearly defined andappropriate timescale.
Remediation of contamination should also addressthe currently inadequate provision of sewagetreatment facilities within the Hindon Rivercatchment.
Immediate Efforts to be Initiated by Janhit Foundation1. It would be the endeavor of Janhit Foundation to widely circulate the study report
entitled ‘Hindon River: Gasping for Breath’ across the country and a few Internationalagencies like The Ford Foundation (U.S.A), Food First Information and Action Network(FIAN, Germany), Department For International Development (DFID), Water KeepersAlliance (U.S.A) and others to draw attention towards finding long lasting solutions tosave the river.
2. The documentary film produced by Janhit Foundation would be screened in variousschools, panchayats particularly in the villages situated on the banks of Hindon River,government departments like The Irrigation Department of U.P.; U.P. Jal Nigam; TheState Pollution Control Board, Lucknow and The Central Pollution Control Board, NewDelhi.
3. Powerpoint Presentations would be delivered in the major cities and towns that aredischarging their untreated effluents into the river. As a mass awareness campaign,extensive wall writing would be done to create an impact on the minds of the peopleabout the pollution of Hindon River. Important T.V. channels, print media and journalswould be contacted to see that the issue finds an important place with them. Sincethe media has a special role in creating awareness hence, the issue would be raisedextensively.
4. In case of a need, Janhit Foundation would knock the doors of the Hon’ble SupremeCourt to issue strict orders towards putting a check to the growing pollution of HindonRiver by the industries. An interim order would also be prayed in order to stop furtherinstallation of any industry on the banks of Hindon River.
32
The report sent by you is horrible. Pleasecontact the government departments
concerned and ask to take appropriate actionagainst those who are polluting the holy HindonRiver. The court will surely give you justice inthis holy work.
Sunil Dutta Trivedi, Maple Orgtech (India)Ltd, Dehradun
It looks most impressive. I do hope you are ableto bring pressure to bear on the concernedauthorities to improve the situation on theground.
Vasant Saberwal, Ford Foundation,New Delhi
The main pesticides concentration found in theHindon River - BHC, Heptachlor, HeptachlorEpoxide and Aldrin, have been banned for useby the Government of India for almost onedecade now. It is therefore not understood as tohow these quantums have been found in flowingriver when these products are no more in use. Wewould need to look at their water solubility aswell as used pattern in the neighbouring areas.
Salil Singhal, PI Industries Ltd,Gurgaon, India
It is a matter of great concern that the river hasbeen contaminated with heavy metals andpesticides, as your study has found.
Nidhi Jamwal, Centre for Science andEnvironment, New Delhi
The report is disturbing. File a PIL with the ApexCourt and pray for justice for lakhs of peopleresiding in the river catchment. This is a nobleservice rendered by your organisation towardsthe country.
Rakesh Sharma, Freelance Journalist,Mumbai
The findings of the study are alarming andunderline the need to take up correctionalmeasures by civil society organisations and otherconcerned groups and individuals. We are gladthat Janhit Foundation has taken up this job anddoing it competently.
Rakesh Kumar, Human Development Society,New Delhi
It is very unfortunate that these areas are beingpolluted to that extent. NGOs and otherorganizations should take serious steps in rectifyingthis, the industries near to it should be shut downthat are causing these hazards. Farmers nearbyshould follow natural farming methods in orderto solve these problems.
Manoj Teotia, Aques Water Technology,Meerut
It is indeed discouraging that various sources ofpollution are relentlessly discharging the discardedwastes into the river. It will be for the benefit ofthe society that people like you, bring awarenessof these anomalies through such evidences.
Nitin Kaushal, Environmentalist,Lucknow
7Consultation, Comments and Support
33
8Appendices
A Details of sampling locations on the River Hindon and tributaries
B Surface water quality assessment; Physical / chemical / biochemical parameters
C Surface water quality assessment; Macroinvertebrate biological monitoring
D Surface water quality assessment; Heavy metal concentrations
E Surface water quality assessment; Pesticide concentrations
F Groundwater quality assessment; Heavy metal concentrations
G Groundwater quality assessment; Pesticide concentrations
H Health Survey results
I List of major industries discharging to the Hindon River and tributaries.
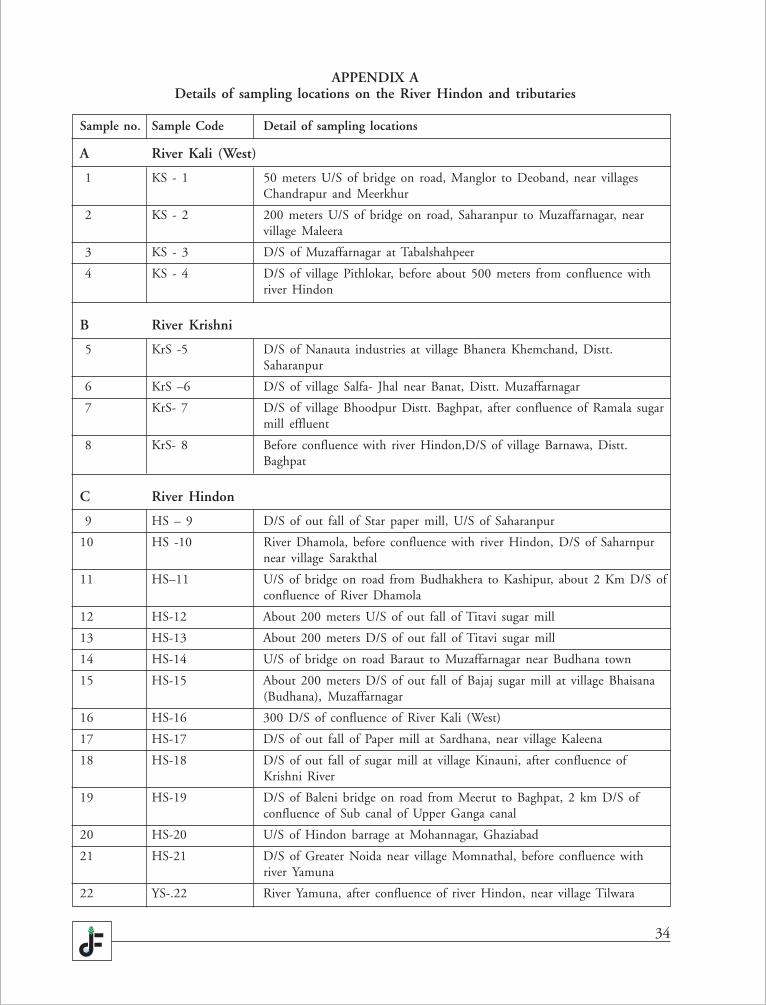
34
APPENDIX ADetails of sampling locations on the River Hindon and tributaries
Sample no. Sample Code Detail of sampling locations
A River Kali (West)
1 KS - 1 50 meters U/S of bridge on road, Manglor to Deoband, near villagesChandrapur and Meerkhur
2 KS - 2 200 meters U/S of bridge on road, Saharanpur to Muzaffarnagar, nearvillage Maleera
3 KS - 3 D/S of Muzaffarnagar at Tabalshahpeer
4 KS - 4 D/S of village Pithlokar, before about 500 meters from confluence withriver Hindon
B River Krishni
5 KrS -5 D/S of Nanauta industries at village Bhanera Khemchand, Distt.Saharanpur
6 KrS –6 D/S of village Salfa- Jhal near Banat, Distt. Muzaffarnagar
7 KrS- 7 D/S of village Bhoodpur Distt. Baghpat, after confluence of Ramala sugarmill effluent
8 KrS- 8 Before confluence with river Hindon,D/S of village Barnawa, Distt.Baghpat
C River Hindon
9 HS – 9 D/S of out fall of Star paper mill, U/S of Saharanpur
10 HS -10 River Dhamola, before confluence with river Hindon, D/S of Saharnpurnear village Sarakthal
11 HS–11 U/S of bridge on road from Budhakhera to Kashipur, about 2 Km D/S ofconfluence of River Dhamola
12 HS-12 About 200 meters U/S of out fall of Titavi sugar mill
13 HS-13 About 200 meters D/S of out fall of Titavi sugar mill
14 HS-14 U/S of bridge on road Baraut to Muzaffarnagar near Budhana town
15 HS-15 About 200 meters D/S of out fall of Bajaj sugar mill at village Bhaisana(Budhana), Muzaffarnagar
16 HS-16 300 D/S of confluence of River Kali (West)
17 HS-17 D/S of out fall of Paper mill at Sardhana, near village Kaleena
18 HS-18 D/S of out fall of sugar mill at village Kinauni, after confluence ofKrishni River
19 HS-19 D/S of Baleni bridge on road from Meerut to Baghpat, 2 km D/S ofconfluence of Sub canal of Upper Ganga canal
20 HS-20 U/S of Hindon barrage at Mohannagar, Ghaziabad
21 HS-21 D/S of Greater Noida near village Momnathal, before confluence withriver Yamuna
22 YS-.22 River Yamuna, after confluence of river Hindon, near village Tilwara
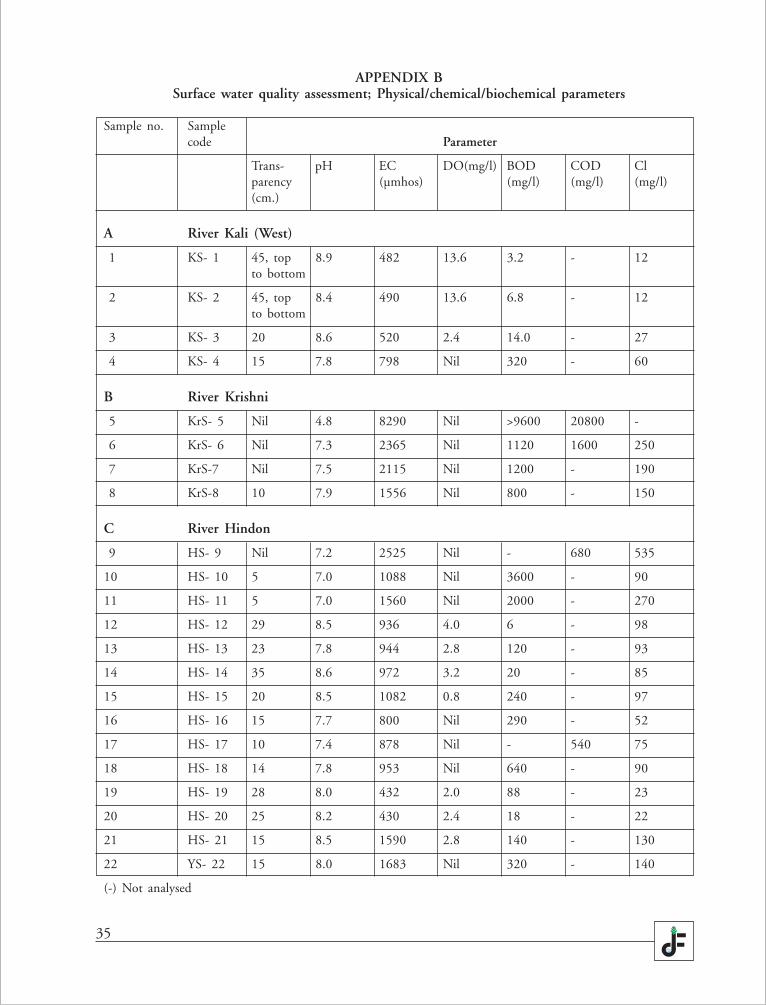
35
APPENDIX BSurface water quality assessment; Physical/chemical/biochemical parameters
Sample no. Samplecode Parameter
Trans- pH EC DO(mg/l) BOD COD Clparency (µmhos) (mg/l) (mg/l) (mg/l)(cm.)
A River Kali (West)
1 KS- 1 45, top 8.9 482 13.6 3.2 - 12to bottom
2 KS- 2 45, top 8.4 490 13.6 6.8 - 12to bottom
3 KS- 3 20 8.6 520 2.4 14.0 - 27
4 KS- 4 15 7.8 798 Nil 320 - 60
B River Krishni
5 KrS- 5 Nil 4.8 8290 Nil >9600 20800 -
6 KrS- 6 Nil 7.3 2365 Nil 1120 1600 250
7 KrS-7 Nil 7.5 2115 Nil 1200 - 190
8 KrS-8 10 7.9 1556 Nil 800 - 150
C River Hindon
9 HS- 9 Nil 7.2 2525 Nil - 680 535
10 HS- 10 5 7.0 1088 Nil 3600 - 90
11 HS- 11 5 7.0 1560 Nil 2000 - 270
12 HS- 12 29 8.5 936 4.0 6 - 98
13 HS- 13 23 7.8 944 2.8 120 - 93
14 HS- 14 35 8.6 972 3.2 20 - 85
15 HS- 15 20 8.5 1082 0.8 240 - 97
16 HS- 16 15 7.7 800 Nil 290 - 52
17 HS- 17 10 7.4 878 Nil - 540 75
18 HS- 18 14 7.8 953 Nil 640 - 90
19 HS- 19 28 8.0 432 2.0 88 - 23
20 HS- 20 25 8.2 430 2.4 18 - 22
21 HS- 21 15 8.5 1590 2.8 140 - 130
22 YS- 22 15 8.0 1683 Nil 320 - 140
(-) Not analysed
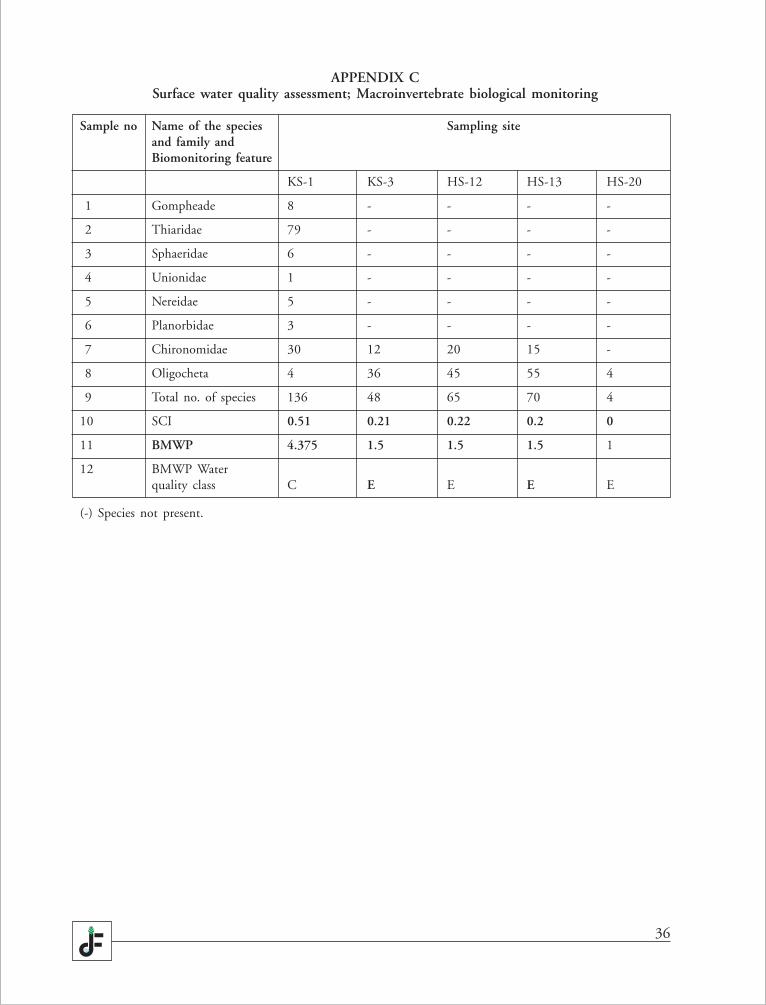
36
APPENDIX CSurface water quality assessment; Macroinvertebrate biological monitoring
Sample no Name of the species Sampling siteand family andBiomonitoring feature
KS-1 KS-3 HS-12 HS-13 HS-20
1 Gompheade 8 - - - -
2 Thiaridae 79 - - - -
3 Sphaeridae 6 - - - -
4 Unionidae 1 - - - -
5 Nereidae 5 - - - -
6 Planorbidae 3 - - - -
7 Chironomidae 30 12 20 15 -
8 Oligocheta 4 36 45 55 4
9 Total no. of species 136 48 65 70 4
10 SCI 0.51 0.21 0.22 0.2 0
11 BMWP 4.375 1.5 1.5 1.5 1
12 BMWP Waterquality class C E E E E
(-) Species not present.
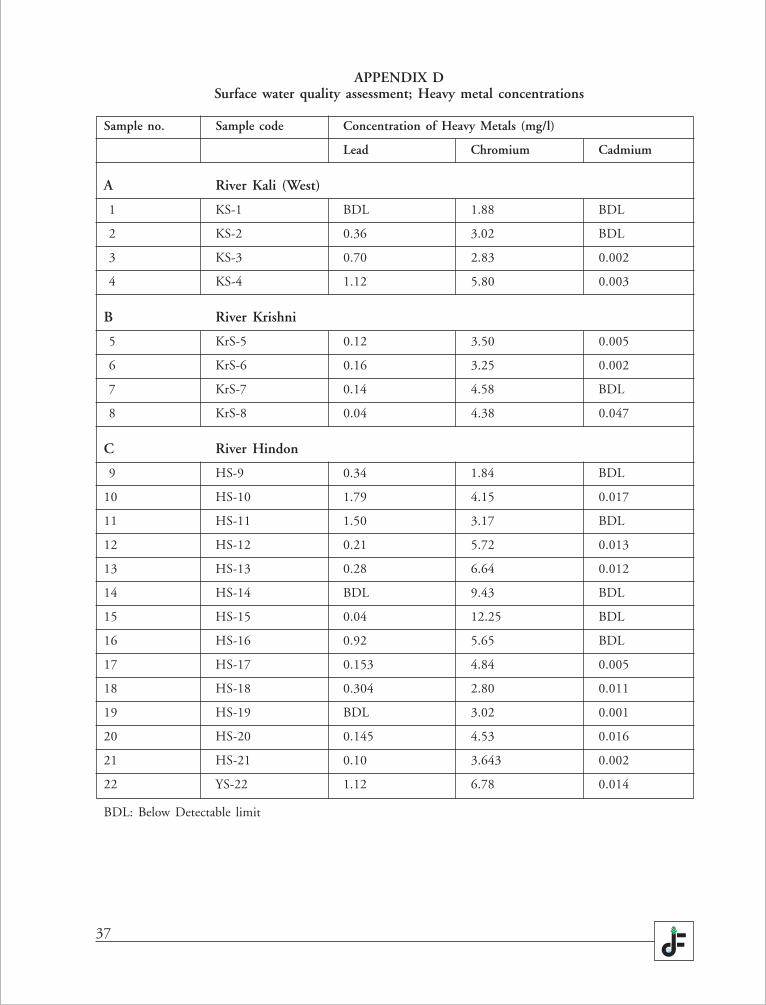
37
APPENDIX DSurface water quality assessment; Heavy metal concentrations
Sample no. Sample code Concentration of Heavy Metals (mg/l)
Lead Chromium Cadmium
A River Kali (West)
1 KS-1 BDL 1.88 BDL
2 KS-2 0.36 3.02 BDL
3 KS-3 0.70 2.83 0.002
4 KS-4 1.12 5.80 0.003
B River Krishni
5 KrS-5 0.12 3.50 0.005
6 KrS-6 0.16 3.25 0.002
7 KrS-7 0.14 4.58 BDL
8 KrS-8 0.04 4.38 0.047
C River Hindon
9 HS-9 0.34 1.84 BDL
10 HS-10 1.79 4.15 0.017
11 HS-11 1.50 3.17 BDL
12 HS-12 0.21 5.72 0.013
13 HS-13 0.28 6.64 0.012
14 HS-14 BDL 9.43 BDL
15 HS-15 0.04 12.25 BDL
16 HS-16 0.92 5.65 BDL
17 HS-17 0.153 4.84 0.005
18 HS-18 0.304 2.80 0.011
19 HS-19 BDL 3.02 0.001
20 HS-20 0.145 4.53 0.016
21 HS-21 0.10 3.643 0.002
22 YS-22 1.12 6.78 0.014
BDL: Below Detectable limit
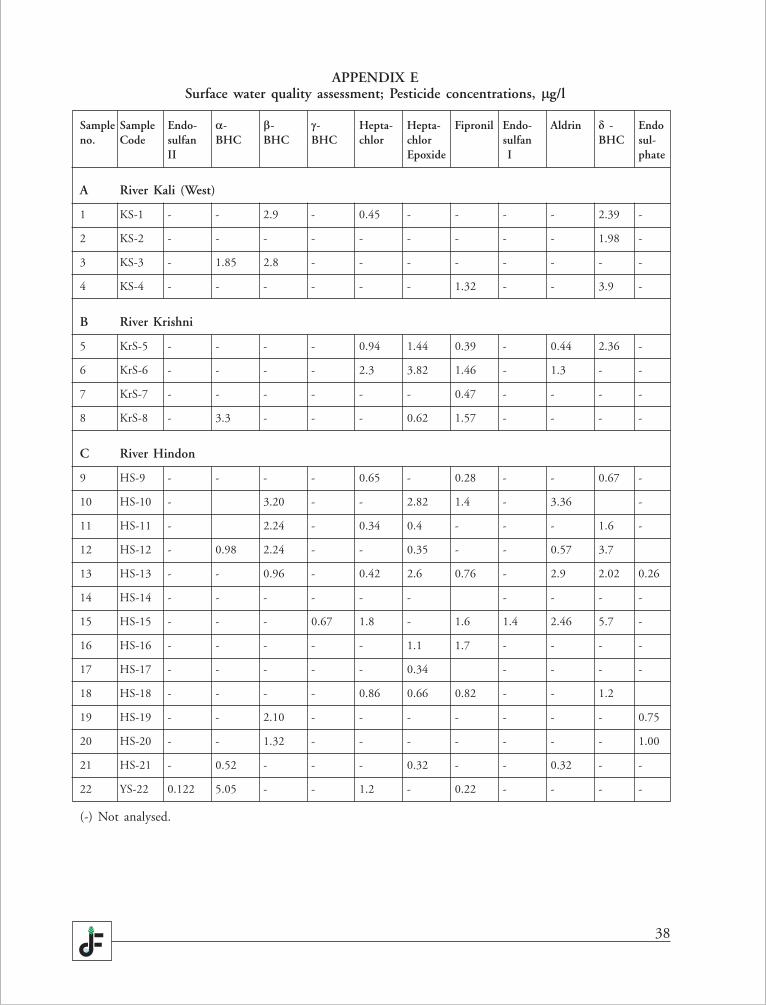
38
APPENDIX ESurface water quality assessment; Pesticide concentrations, �g/l
Sample Sample Endo- �- �- �- Hepta- Hepta- Fipronil Endo- Aldrin � - Endono. Code sulfan BHC BHC BHC chlor chlor sulfan BHC sul-
II Epoxide I phate
A River Kali (West)
1 KS-1 - - 2.9 - 0.45 - - - - 2.39 -
2 KS-2 - - - - - - - - - 1.98 -
3 KS-3 - 1.85 2.8 - - - - - - - -
4 KS-4 - - - - - - 1.32 - - 3.9 -
B River Krishni
5 KrS-5 - - - - 0.94 1.44 0.39 - 0.44 2.36 -
6 KrS-6 - - - - 2.3 3.82 1.46 - 1.3 - -
7 KrS-7 - - - - - - 0.47 - - - -
8 KrS-8 - 3.3 - - - 0.62 1.57 - - - -
C River Hindon
9 HS-9 - - - - 0.65 - 0.28 - - 0.67 -
10 HS-10 - 3.20 - - 2.82 1.4 - 3.36 -
11 HS-11 - 2.24 - 0.34 0.4 - - - 1.6 -
12 HS-12 - 0.98 2.24 - - 0.35 - - 0.57 3.7
13 HS-13 - - 0.96 - 0.42 2.6 0.76 - 2.9 2.02 0.26
14 HS-14 - - - - - - - - - -
15 HS-15 - - - 0.67 1.8 - 1.6 1.4 2.46 5.7 -
16 HS-16 - - - - - 1.1 1.7 - - - -
17 HS-17 - - - - - 0.34 - - - -
18 HS-18 - - - - 0.86 0.66 0.82 - - 1.2
19 HS-19 - - 2.10 - - - - - - - 0.75
20 HS-20 - - 1.32 - - - - - - - 1.00
21 HS-21 - 0.52 - - - 0.32 - - 0.32 - -
22 YS-22 0.122 5.05 - - 1.2 - 0.22 - - - -
(-) Not analysed.
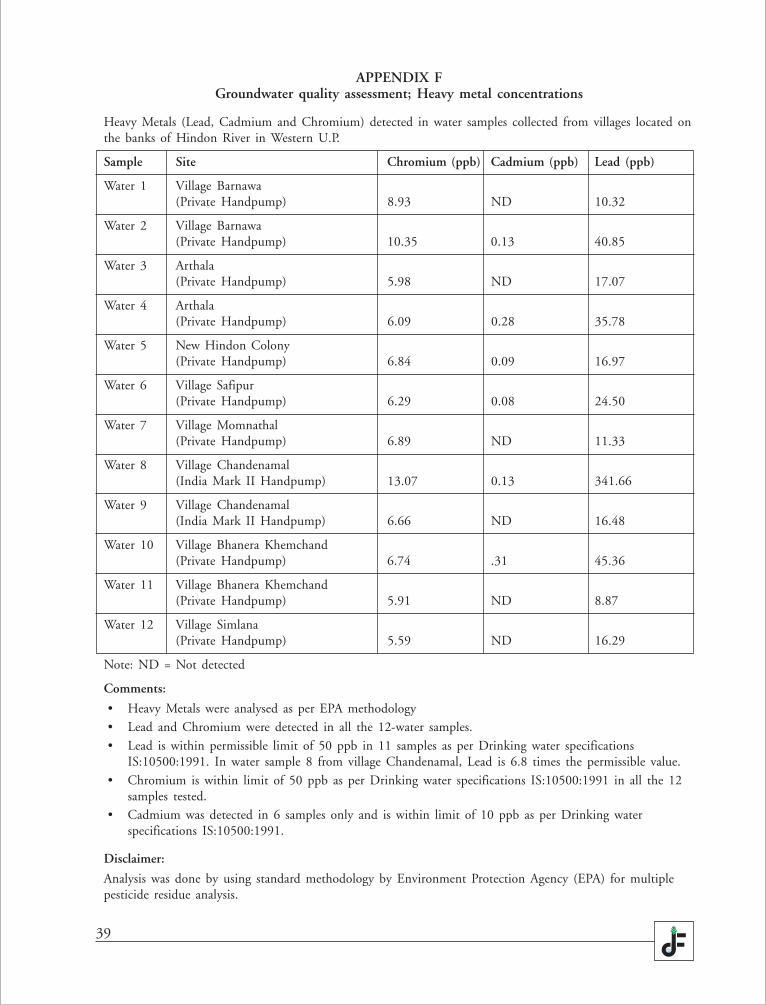
39
APPENDIX FGroundwater quality assessment; Heavy metal concentrations
Heavy Metals (Lead, Cadmium and Chromium) detected in water samples collected from villages located onthe banks of Hindon River in Western U.P.
Sample Site Chromium (ppb) Cadmium (ppb) Lead (ppb)
Water 1 Village Barnawa(Private Handpump) 8.93 ND 10.32
Water 2 Village Barnawa(Private Handpump) 10.35 0.13 40.85
Water 3 Arthala(Private Handpump) 5.98 ND 17.07
Water 4 Arthala(Private Handpump) 6.09 0.28 35.78
Water 5 New Hindon Colony(Private Handpump) 6.84 0.09 16.97
Water 6 Village Safipur(Private Handpump) 6.29 0.08 24.50
Water 7 Village Momnathal(Private Handpump) 6.89 ND 11.33
Water 8 Village Chandenamal(India Mark II Handpump) 13.07 0.13 341.66
Water 9 Village Chandenamal(India Mark II Handpump) 6.66 ND 16.48
Water 10 Village Bhanera Khemchand(Private Handpump) 6.74 .31 45.36
Water 11 Village Bhanera Khemchand(Private Handpump) 5.91 ND 8.87
Water 12 Village Simlana(Private Handpump) 5.59 ND 16.29
Note: ND = Not detected
Comments:
• Heavy Metals were analysed as per EPA methodology• Lead and Chromium were detected in all the 12-water samples.
• Lead is within permissible limit of 50 ppb in 11 samples as per Drinking water specificationsIS:10500:1991. In water sample 8 from village Chandenamal, Lead is 6.8 times the permissible value.
• Chromium is within limit of 50 ppb as per Drinking water specifications IS:10500:1991 in all the 12samples tested.
• Cadmium was detected in 6 samples only and is within limit of 10 ppb as per Drinking waterspecifications IS:10500:1991.
Disclaimer:
Analysis was done by using standard methodology by Environment Protection Agency (EPA) for multiplepesticide residue analysis.
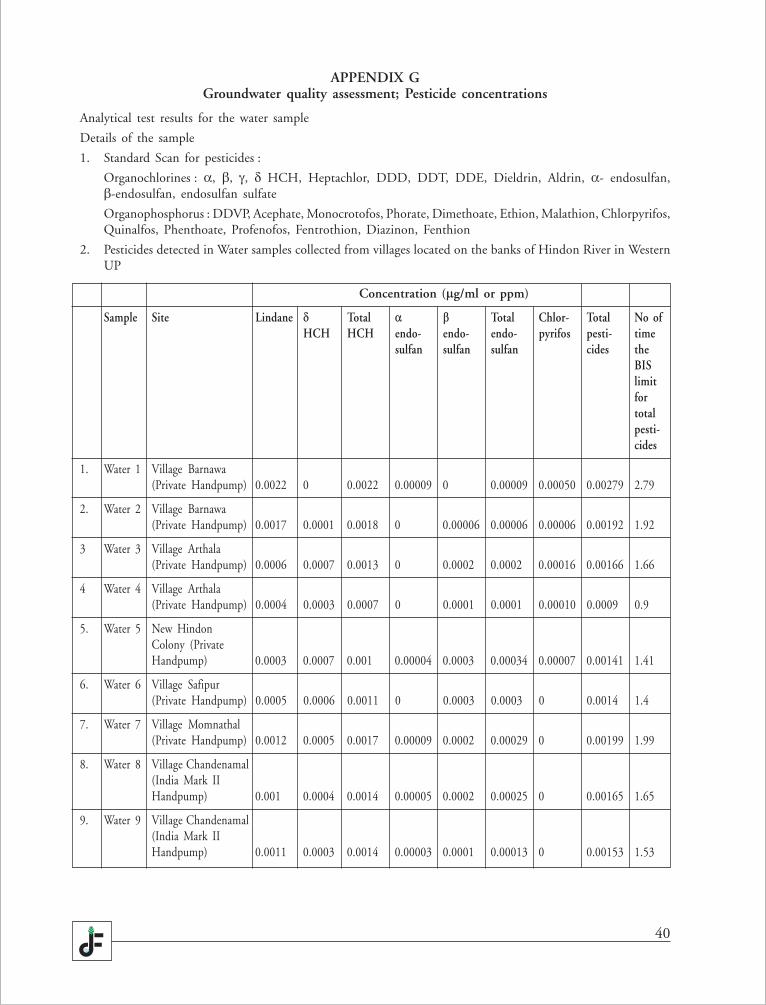
40
APPENDIX GGroundwater quality assessment; Pesticide concentrations
Analytical test results for the water sample
Details of the sample
1. Standard Scan for pesticides :
Organochlorines : α, β, γ, δ HCH, Heptachlor, DDD, DDT, DDE, Dieldrin, Aldrin, α- endosulfan,β-endosulfan, endosulfan sulfate
Organophosphorus : DDVP, Acephate, Monocrotofos, Phorate, Dimethoate, Ethion, Malathion, Chlorpyrifos,Quinalfos, Phenthoate, Profenofos, Fentrothion, Diazinon, Fenthion
2. Pesticides detected in Water samples collected from villages located on the banks of Hindon River in WesternUP
Concentration (�g/ml or ppm)
Sample Site Lindane � Total � � Total Chlor- Total No ofHCH HCH endo- endo- endo- pyrifos pesti- time
sulfan sulfan sulfan cides theBISlimitfortotalpesti-cides
1. Water 1 Village Barnawa(Private Handpump) 0.0022 0 0.0022 0.00009 0 0.00009 0.00050 0.00279 2.79
2. Water 2 Village Barnawa(Private Handpump) 0.0017 0.0001 0.0018 0 0.00006 0.00006 0.00006 0.00192 1.92
3 Water 3 Village Arthala(Private Handpump) 0.0006 0.0007 0.0013 0 0.0002 0.0002 0.00016 0.00166 1.66
4 Water 4 Village Arthala(Private Handpump) 0.0004 0.0003 0.0007 0 0.0001 0.0001 0.00010 0.0009 0.9
5. Water 5 New HindonColony (PrivateHandpump) 0.0003 0.0007 0.001 0.00004 0.0003 0.00034 0.00007 0.00141 1.41
6. Water 6 Village Safipur(Private Handpump) 0.0005 0.0006 0.0011 0 0.0003 0.0003 0 0.0014 1.4
7. Water 7 Village Momnathal(Private Handpump) 0.0012 0.0005 0.0017 0.00009 0.0002 0.00029 0 0.00199 1.99
8. Water 8 Village Chandenamal(India Mark IIHandpump) 0.001 0.0004 0.0014 0.00005 0.0002 0.00025 0 0.00165 1.65
9. Water 9 Village Chandenamal(India Mark IIHandpump) 0.0011 0.0003 0.0014 0.00003 0.0001 0.00013 0 0.00153 1.53
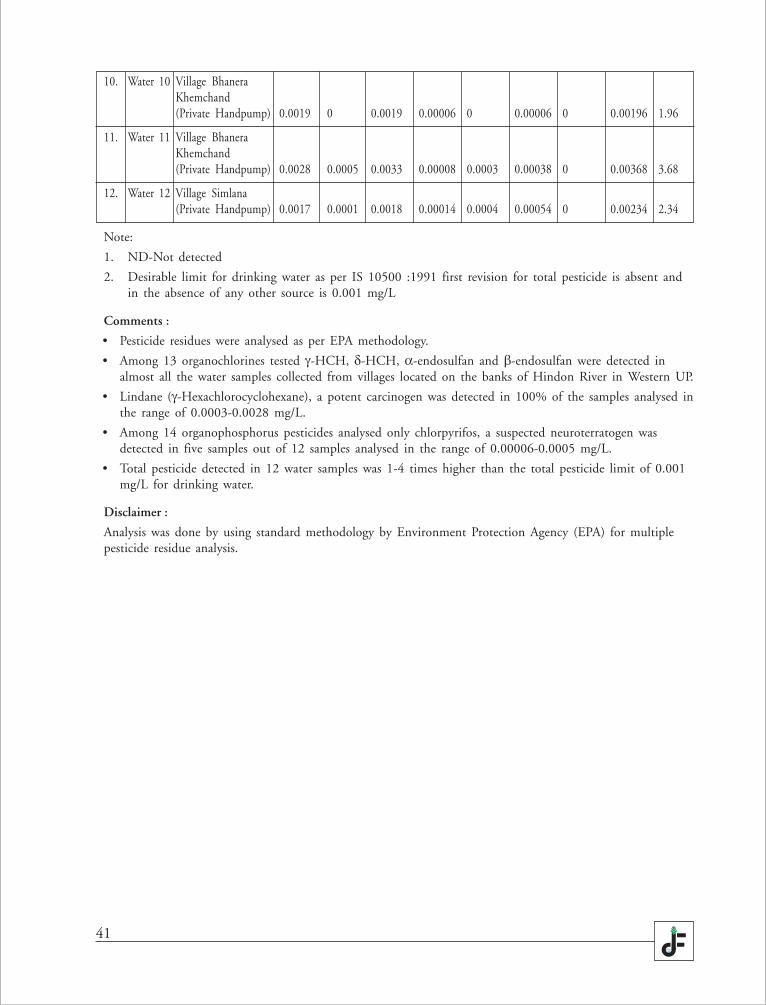
41
10. Water 10 Village BhaneraKhemchand(Private Handpump) 0.0019 0 0.0019 0.00006 0 0.00006 0 0.00196 1.96
11. Water 11 Village BhaneraKhemchand(Private Handpump) 0.0028 0.0005 0.0033 0.00008 0.0003 0.00038 0 0.00368 3.68
12. Water 12 Village Simlana(Private Handpump) 0.0017 0.0001 0.0018 0.00014 0.0004 0.00054 0 0.00234 2.34
Note:
1. ND-Not detected
2. Desirable limit for drinking water as per IS 10500 :1991 first revision for total pesticide is absent andin the absence of any other source is 0.001 mg/L
Comments :
• Pesticide residues were analysed as per EPA methodology.
• Among 13 organochlorines tested γ-HCH, δ-HCH, α-endosulfan and β-endosulfan were detected inalmost all the water samples collected from villages located on the banks of Hindon River in Western UP.
• Lindane (γ-Hexachlorocyclohexane), a potent carcinogen was detected in 100% of the samples analysed inthe range of 0.0003-0.0028 mg/L.
• Among 14 organophosphorus pesticides analysed only chlorpyrifos, a suspected neuroterratogen wasdetected in five samples out of 12 samples analysed in the range of 0.00006-0.0005 mg/L.
• Total pesticide detected in 12 water samples was 1-4 times higher than the total pesticide limit of 0.001mg/L for drinking water.
Disclaimer :
Analysis was done by using standard methodology by Environment Protection Agency (EPA) for multiplepesticide residue analysis.
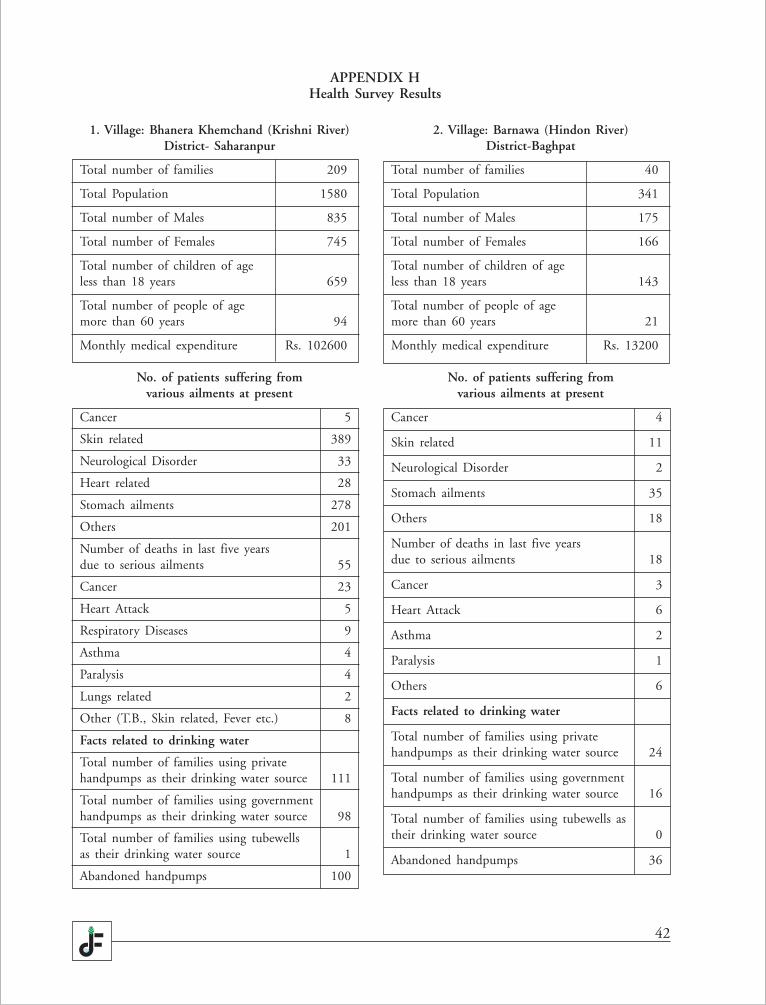
42
1. Village: Bhanera Khemchand (Krishni River)District- Saharanpur
Total number of families 209
Total Population 1580
Total number of Males 835
Total number of Females 745
Total number of children of ageless than 18 years 659
Total number of people of agemore than 60 years 94
Monthly medical expenditure Rs. 102600
No. of patients suffering fromvarious ailments at present
Cancer 5
Skin related 389
Neurological Disorder 33
Heart related 28
Stomach ailments 278
Others 201
Number of deaths in last five yearsdue to serious ailments 55
Cancer 23
Heart Attack 5
Respiratory Diseases 9
Asthma 4
Paralysis 4
Lungs related 2
Other (T.B., Skin related, Fever etc.) 8
Facts related to drinking water
Total number of families using privatehandpumps as their drinking water source 111
Total number of families using governmenthandpumps as their drinking water source 98
Total number of families using tubewellsas their drinking water source 1
Abandoned handpumps 100
2. Village: Barnawa (Hindon River)District-Baghpat
Total number of families 40
Total Population 341
Total number of Males 175
Total number of Females 166
Total number of children of ageless than 18 years 143
Total number of people of agemore than 60 years 21
Monthly medical expenditure Rs. 13200
No. of patients suffering fromvarious ailments at present
Cancer 4
Skin related 11
Neurological Disorder 2
Stomach ailments 35
Others 18
Number of deaths in last five yearsdue to serious ailments 18
Cancer 3
Heart Attack 6
Asthma 2
Paralysis 1
Others 6
Facts related to drinking water
Total number of families using privatehandpumps as their drinking water source 24
Total number of families using governmenthandpumps as their drinking water source 16
Total number of families using tubewells astheir drinking water source 0
Abandoned handpumps 36
APPENDIX HHealth Survey Results
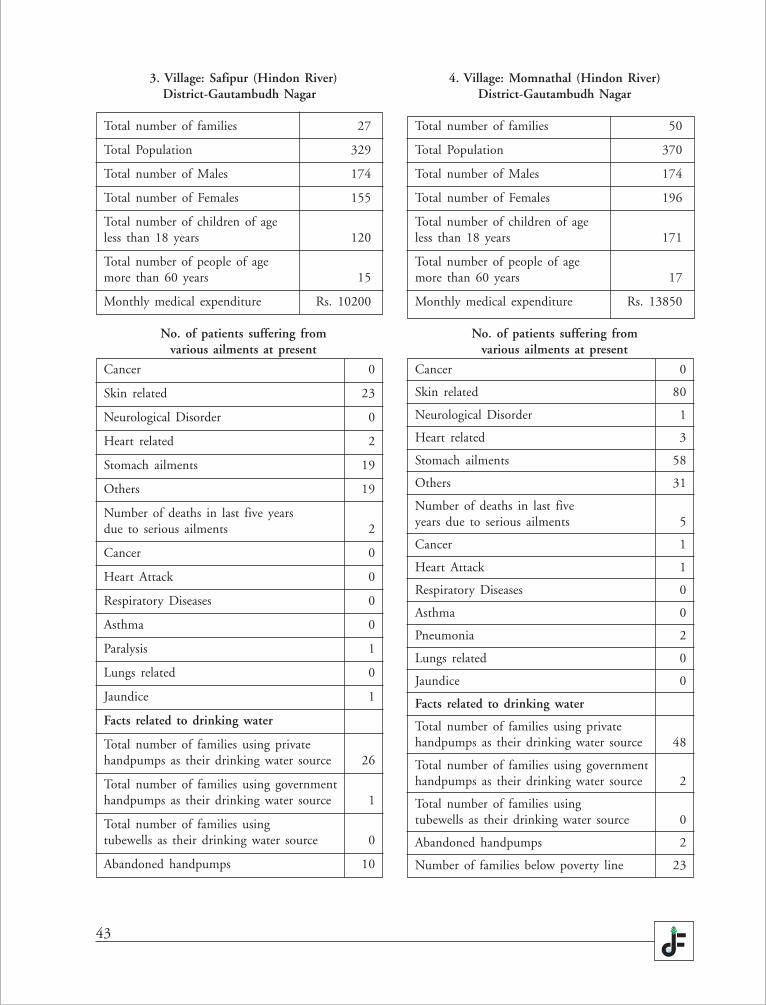
43
3. Village: Safipur (Hindon River)District-Gautambudh Nagar
Total number of families 27
Total Population 329
Total number of Males 174
Total number of Females 155
Total number of children of ageless than 18 years 120
Total number of people of agemore than 60 years 15
Monthly medical expenditure Rs. 10200
No. of patients suffering fromvarious ailments at present
Cancer 0
Skin related 23
Neurological Disorder 0
Heart related 2
Stomach ailments 19
Others 19
Number of deaths in last five yearsdue to serious ailments 2
Cancer 0
Heart Attack 0
Respiratory Diseases 0
Asthma 0
Paralysis 1
Lungs related 0
Jaundice 1
Facts related to drinking water
Total number of families using privatehandpumps as their drinking water source 26
Total number of families using governmenthandpumps as their drinking water source 1
Total number of families usingtubewells as their drinking water source 0
Abandoned handpumps 10
4. Village: Momnathal (Hindon River)District-Gautambudh Nagar
Total number of families 50
Total Population 370
Total number of Males 174
Total number of Females 196
Total number of children of ageless than 18 years 171
Total number of people of agemore than 60 years 17
Monthly medical expenditure Rs. 13850
No. of patients suffering fromvarious ailments at present
Cancer 0
Skin related 80
Neurological Disorder 1
Heart related 3
Stomach ailments 58
Others 31
Number of deaths in last fiveyears due to serious ailments 5
Cancer 1
Heart Attack 1
Respiratory Diseases 0
Asthma 0
Pneumonia 2
Lungs related 0
Jaundice 0
Facts related to drinking water
Total number of families using privatehandpumps as their drinking water source 48
Total number of families using governmenthandpumps as their drinking water source 2
Total number of families usingtubewells as their drinking water source 0
Abandoned handpumps 2
Number of families below poverty line 23
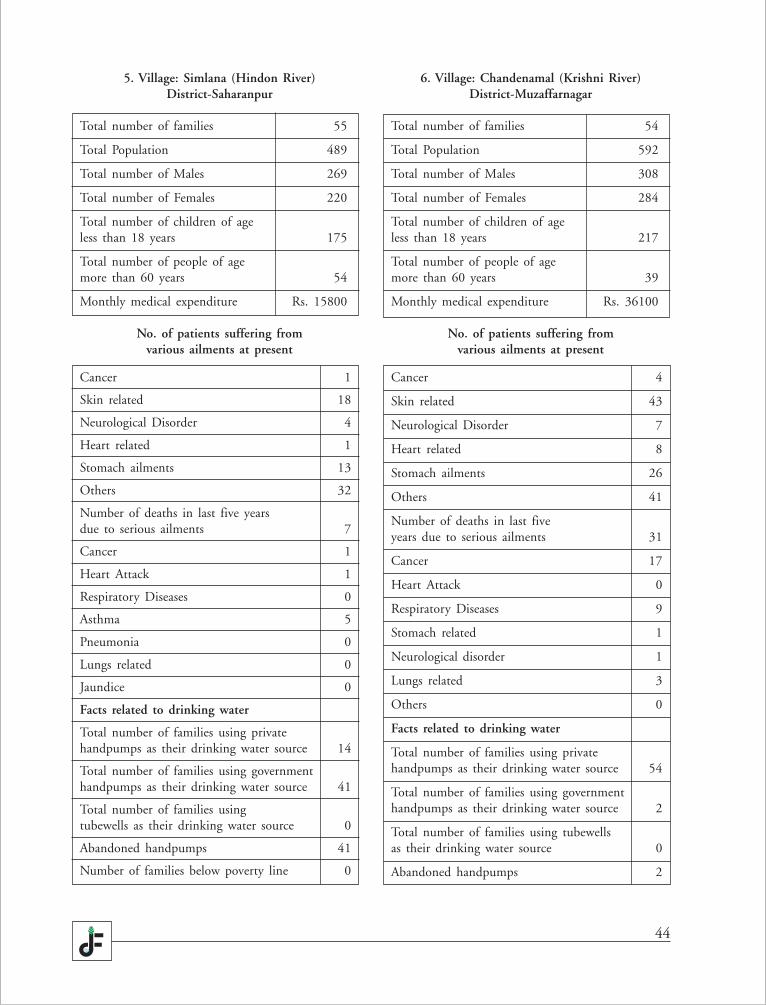
44
5. Village: Simlana (Hindon River)District-Saharanpur
Total number of families 55
Total Population 489
Total number of Males 269
Total number of Females 220
Total number of children of ageless than 18 years 175
Total number of people of agemore than 60 years 54
Monthly medical expenditure Rs. 15800
No. of patients suffering fromvarious ailments at present
Cancer 1
Skin related 18
Neurological Disorder 4
Heart related 1
Stomach ailments 13
Others 32
Number of deaths in last five yearsdue to serious ailments 7
Cancer 1
Heart Attack 1
Respiratory Diseases 0
Asthma 5
Pneumonia 0
Lungs related 0
Jaundice 0
Facts related to drinking water
Total number of families using privatehandpumps as their drinking water source 14
Total number of families using governmenthandpumps as their drinking water source 41
Total number of families usingtubewells as their drinking water source 0
Abandoned handpumps 41
Number of families below poverty line 0
6. Village: Chandenamal (Krishni River)District-Muzaffarnagar
Total number of families 54
Total Population 592
Total number of Males 308
Total number of Females 284
Total number of children of ageless than 18 years 217
Total number of people of agemore than 60 years 39
Monthly medical expenditure Rs. 36100
No. of patients suffering fromvarious ailments at present
Cancer 4
Skin related 43
Neurological Disorder 7
Heart related 8
Stomach ailments 26
Others 41
Number of deaths in last fiveyears due to serious ailments 31
Cancer 17
Heart Attack 0
Respiratory Diseases 9
Stomach related 1
Neurological disorder 1
Lungs related 3
Others 0
Facts related to drinking water
Total number of families using privatehandpumps as their drinking water source 54
Total number of families using governmenthandpumps as their drinking water source 2
Total number of families using tubewellsas their drinking water source 0
Abandoned handpumps 2
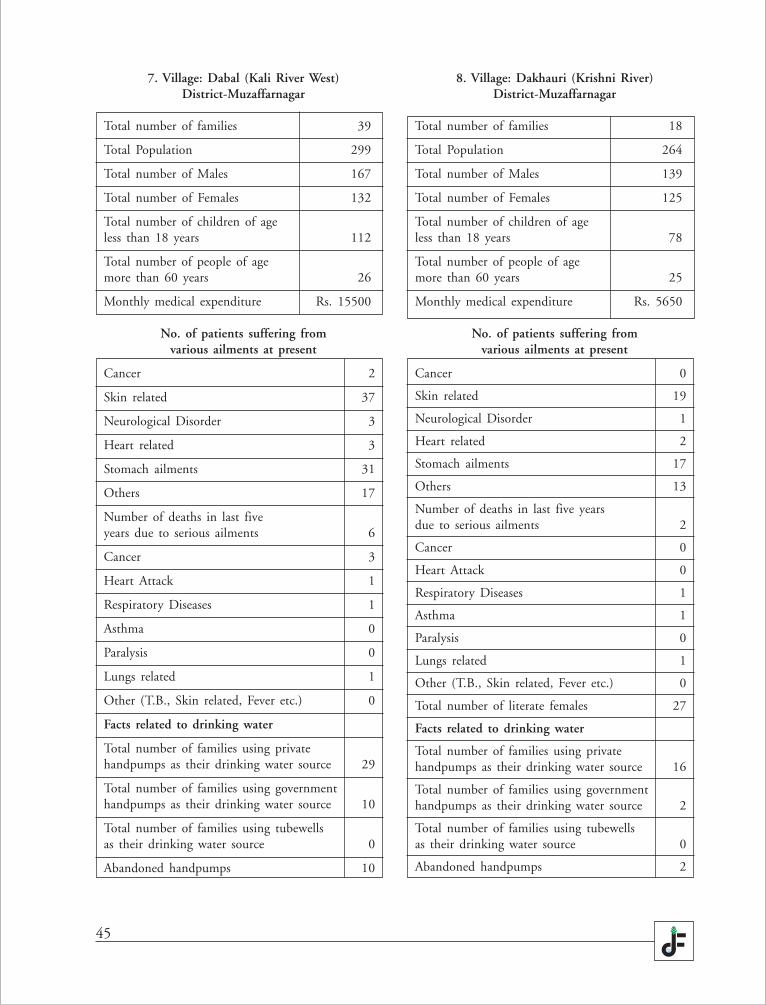
45
7. Village: Dabal (Kali River West)District-Muzaffarnagar
Total number of families 39
Total Population 299
Total number of Males 167
Total number of Females 132
Total number of children of ageless than 18 years 112
Total number of people of agemore than 60 years 26
Monthly medical expenditure Rs. 15500
No. of patients suffering fromvarious ailments at present
Cancer 2
Skin related 37
Neurological Disorder 3
Heart related 3
Stomach ailments 31
Others 17
Number of deaths in last fiveyears due to serious ailments 6
Cancer 3
Heart Attack 1
Respiratory Diseases 1
Asthma 0
Paralysis 0
Lungs related 1
Other (T.B., Skin related, Fever etc.) 0
Facts related to drinking water
Total number of families using privatehandpumps as their drinking water source 29
Total number of families using governmenthandpumps as their drinking water source 10
Total number of families using tubewellsas their drinking water source 0
Abandoned handpumps 10
8. Village: Dakhauri (Krishni River)District-Muzaffarnagar
Total number of families 18
Total Population 264
Total number of Males 139
Total number of Females 125
Total number of children of ageless than 18 years 78
Total number of people of agemore than 60 years 25
Monthly medical expenditure Rs. 5650
No. of patients suffering fromvarious ailments at present
Cancer 0
Skin related 19
Neurological Disorder 1
Heart related 2
Stomach ailments 17
Others 13
Number of deaths in last five yearsdue to serious ailments 2
Cancer 0
Heart Attack 0
Respiratory Diseases 1
Asthma 1
Paralysis 0
Lungs related 1
Other (T.B., Skin related, Fever etc.) 0
Total number of literate females 27
Facts related to drinking water
Total number of families using privatehandpumps as their drinking water source 16
Total number of families using governmenthandpumps as their drinking water source 2
Total number of families using tubewellsas their drinking water source 0
Abandoned handpumps 2
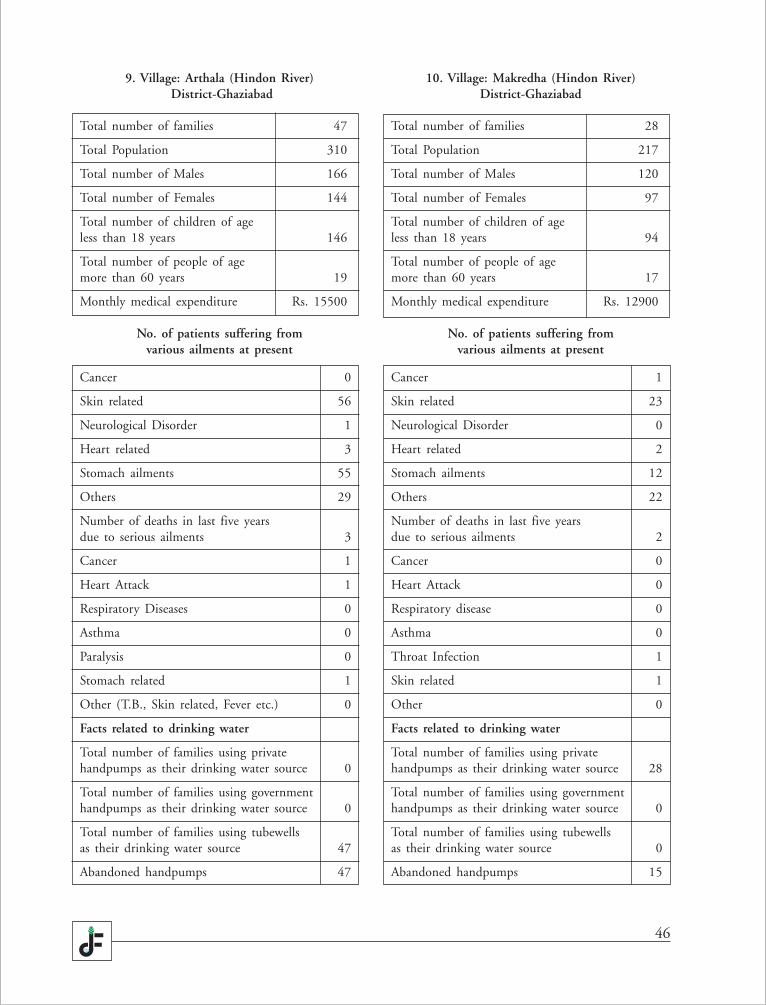
46
9. Village: Arthala (Hindon River) District-Ghaziabad
Total number of families 47
Total Population 310
Total number of Males 166
Total number of Females 144
Total number of children of ageless than 18 years 146
Total number of people of agemore than 60 years 19
Monthly medical expenditure Rs. 15500
No. of patients suffering fromvarious ailments at present
Cancer 0
Skin related 56
Neurological Disorder 1
Heart related 3
Stomach ailments 55
Others 29
Number of deaths in last five yearsdue to serious ailments 3
Cancer 1
Heart Attack 1
Respiratory Diseases 0
Asthma 0
Paralysis 0
Stomach related 1
Other (T.B., Skin related, Fever etc.) 0
Facts related to drinking water
Total number of families using privatehandpumps as their drinking water source 0
Total number of families using governmenthandpumps as their drinking water source 0
Total number of families using tubewellsas their drinking water source 47
Abandoned handpumps 47
10. Village: Makredha (Hindon River)District-Ghaziabad
Total number of families 28
Total Population 217
Total number of Males 120
Total number of Females 97
Total number of children of ageless than 18 years 94
Total number of people of agemore than 60 years 17
Monthly medical expenditure Rs. 12900
No. of patients suffering fromvarious ailments at present
Cancer 1
Skin related 23
Neurological Disorder 0
Heart related 2
Stomach ailments 12
Others 22
Number of deaths in last five yearsdue to serious ailments 2
Cancer 0
Heart Attack 0
Respiratory disease 0
Asthma 0
Throat Infection 1
Skin related 1
Other 0
Facts related to drinking water
Total number of families using privatehandpumps as their drinking water source 28
Total number of families using governmenthandpumps as their drinking water source 0
Total number of families using tubewellsas their drinking water source 0
Abandoned handpumps 15
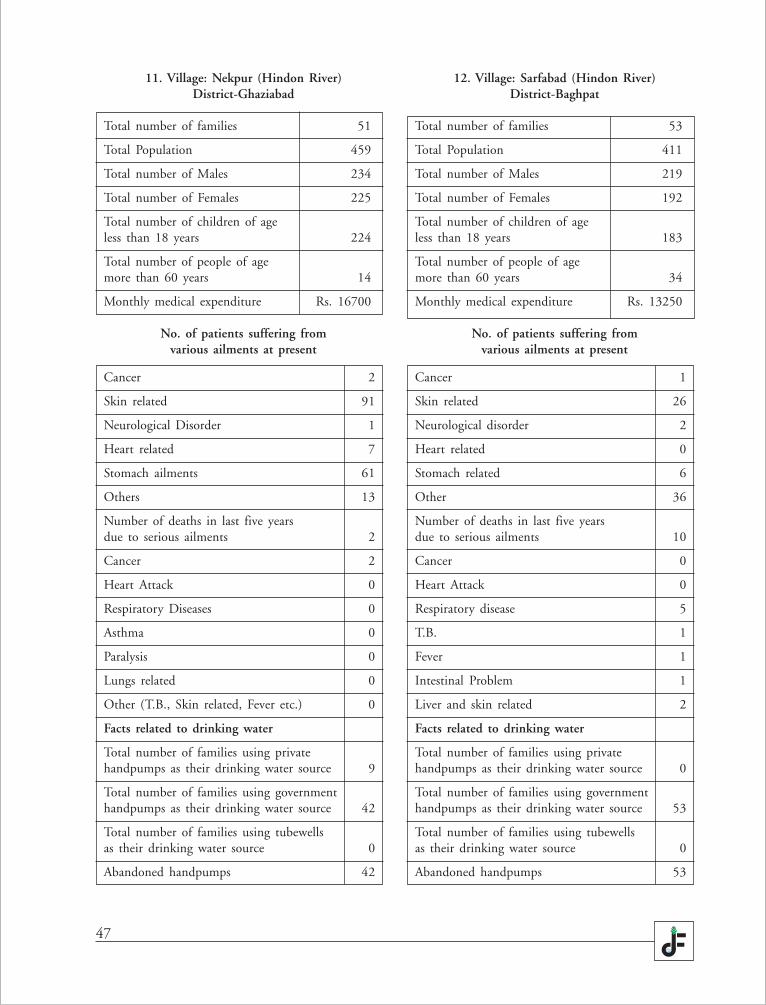
47
11. Village: Nekpur (Hindon River)District-Ghaziabad
Total number of families 51
Total Population 459
Total number of Males 234
Total number of Females 225
Total number of children of ageless than 18 years 224
Total number of people of agemore than 60 years 14
Monthly medical expenditure Rs. 16700
No. of patients suffering fromvarious ailments at present
Cancer 2
Skin related 91
Neurological Disorder 1
Heart related 7
Stomach ailments 61
Others 13
Number of deaths in last five yearsdue to serious ailments 2
Cancer 2
Heart Attack 0
Respiratory Diseases 0
Asthma 0
Paralysis 0
Lungs related 0
Other (T.B., Skin related, Fever etc.) 0
Facts related to drinking water
Total number of families using privatehandpumps as their drinking water source 9
Total number of families using governmenthandpumps as their drinking water source 42
Total number of families using tubewellsas their drinking water source 0
Abandoned handpumps 42
12. Village: Sarfabad (Hindon River)District-Baghpat
Total number of families 53
Total Population 411
Total number of Males 219
Total number of Females 192
Total number of children of ageless than 18 years 183
Total number of people of agemore than 60 years 34
Monthly medical expenditure Rs. 13250
No. of patients suffering fromvarious ailments at present
Cancer 1
Skin related 26
Neurological disorder 2
Heart related 0
Stomach related 6
Other 36
Number of deaths in last five yearsdue to serious ailments 10
Cancer 0
Heart Attack 0
Respiratory disease 5
T.B. 1
Fever 1
Intestinal Problem 1
Liver and skin related 2
Facts related to drinking water
Total number of families using privatehandpumps as their drinking water source 0
Total number of families using governmenthandpumps as their drinking water source 53
Total number of families using tubewellsas their drinking water source 0
Abandoned handpumps 53

48
Hindon River
District S.No. Industries Name
Saharanpur 1. Star Paper Mills Limited
2. Daya Sugar Works
3. Nagar Palika, Saharanpur
4. The CooperativeCompany Ltd., Tapri
Muzaffarnagar 5. Titavi Sugar Mill, Titavi
6. Bajaj HindusthanLimited, Budhana
7. Nagar Palika, Budhana
Meerut 8. Kinauni Sugar Mill andDistillery
9. Sardhana Paper Mill
10. Dollar Sales Corporation,Sardhana
11. Nagar Palika, Sardhana
Ghaziabad 12. Ganga Paper Mill,Masoori Road
13. Expliti Trading andMarketing, Masoori Road
14. Triyesh Enterprises,Masoori Road
15. Ved Pulp Tissues Pvt. Ltd.,Masoori Road
16. Vimal Organic,Bulandshahr Road
17. Nagar Nigam, Ghaziabad
GautambudhNagar 18. Sandeep Papers, Ph-I, Noida
19. Kwatra Paper Mill, Noida
20. Tristar Paper Mill, Noida
APPENDIX IList of major industries discharging to the Hindon River and tributaries.
Kali River (West)
District S.No. Industries Name
Saharanpur 1. Triveni Engineering andIndustries Ltd. Deoband
2. Nagar Palika, Deoband
Muzaffarnagar 3. Nagar Palika, Muzaffarnagar
4. U. P. State SugarCorporation Ltd.Rohana
5. Suyas Craft Pvt. Ltd.Behalna
6. Shakumbri Pulp andPaper Mills Pvt. Ltd.,Bhopa Road
7. Agarwal Duplex andPaper Mills Pvt. Ltd.Bhopa Road
8. Shri Sidhbali PaperMills Ltd. Bhopa Road
9. Silverton Papers Ltd.Bhopa Road
10. Garg Duplex andPaper Mills Pvt. Ltd.Bhopa Road
11. Meenu Paper MillsPvt. Ltd. Bhopa Road
12. Bhageshwari Papers Pvt.Ltd. Bhopa Road
13. Polymer Papers Ltd.Bhopa Road
14. Balaji Selulose ProductsLtd. Bhopa Road
15. Tihri Pulp and PapersLtd. Bhopa Road
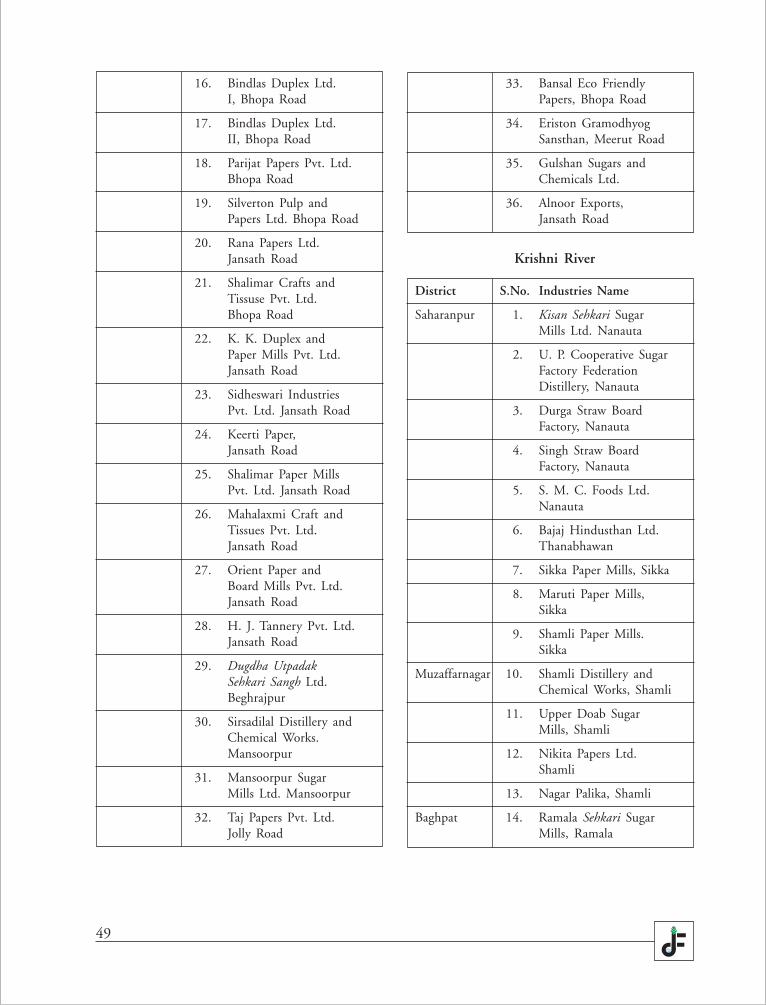
49
16. Bindlas Duplex Ltd.I, Bhopa Road
17. Bindlas Duplex Ltd.II, Bhopa Road
18. Parijat Papers Pvt. Ltd.Bhopa Road
19. Silverton Pulp andPapers Ltd. Bhopa Road
20. Rana Papers Ltd.Jansath Road
21. Shalimar Crafts andTissuse Pvt. Ltd.Bhopa Road
22. K. K. Duplex andPaper Mills Pvt. Ltd.Jansath Road
23. Sidheswari IndustriesPvt. Ltd. Jansath Road
24. Keerti Paper,Jansath Road
25. Shalimar Paper MillsPvt. Ltd. Jansath Road
26. Mahalaxmi Craft andTissues Pvt. Ltd.Jansath Road
27. Orient Paper andBoard Mills Pvt. Ltd.Jansath Road
28. H. J. Tannery Pvt. Ltd.Jansath Road
29. Dugdha UtpadakSehkari Sangh Ltd.Beghrajpur
30. Sirsadilal Distillery andChemical Works.Mansoorpur
31. Mansoorpur SugarMills Ltd. Mansoorpur
32. Taj Papers Pvt. Ltd.Jolly Road
33. Bansal Eco FriendlyPapers, Bhopa Road
34. Eriston GramodhyogSansthan, Meerut Road
35. Gulshan Sugars andChemicals Ltd.
36. Alnoor Exports,Jansath Road
Krishni River
District S.No. Industries Name
Saharanpur 1. Kisan Sehkari SugarMills Ltd. Nanauta
2. U. P. Cooperative SugarFactory FederationDistillery, Nanauta
3. Durga Straw BoardFactory, Nanauta
4. Singh Straw BoardFactory, Nanauta
5. S. M. C. Foods Ltd.Nanauta
6. Bajaj Hindusthan Ltd.Thanabhawan
7. Sikka Paper Mills, Sikka
8. Maruti Paper Mills,Sikka
9. Shamli Paper Mills.Sikka
Muzaffarnagar 10. Shamli Distillery andChemical Works, Shamli
11. Upper Doab SugarMills, Shamli
12. Nikita Papers Ltd.Shamli
13. Nagar Palika, Shamli
Baghpat 14. Ramala Sehkari SugarMills, Ramala