Embed Size (px)
DESCRIPTION
Hindcasting Water Levels for EDEN Gaging Stations, 2000-2006. Paul Conrads USGS South Carolina Water Science Center Ed Roehl Advanced Data Mining. GEER 2008 Naples, FL July 30, 2008. What’s on tap?. Methods development in WCA3a Application to EDEN Quiet desperation The fix - PowerPoint PPT Presentation
Citation preview
U.S. Department of the InteriorU.S. Geological Survey
Hindcasting Water Levels for EDEN Hindcasting Water Levels for EDEN Gaging Stations, 2000-2006Gaging Stations, 2000-2006
GEER 2008
Naples, FL
July 30, 2008
Paul ConradsPaul ConradsUSGS South Carolina Water Science CenterUSGS South Carolina Water Science Center
Ed RoehlEd Roehl
Advanced Data MiningAdvanced Data Mining
What’s on tap?What’s on tap?
Methods development in WCA3a Application to EDEN Quiet desperation The fix Results and discussion
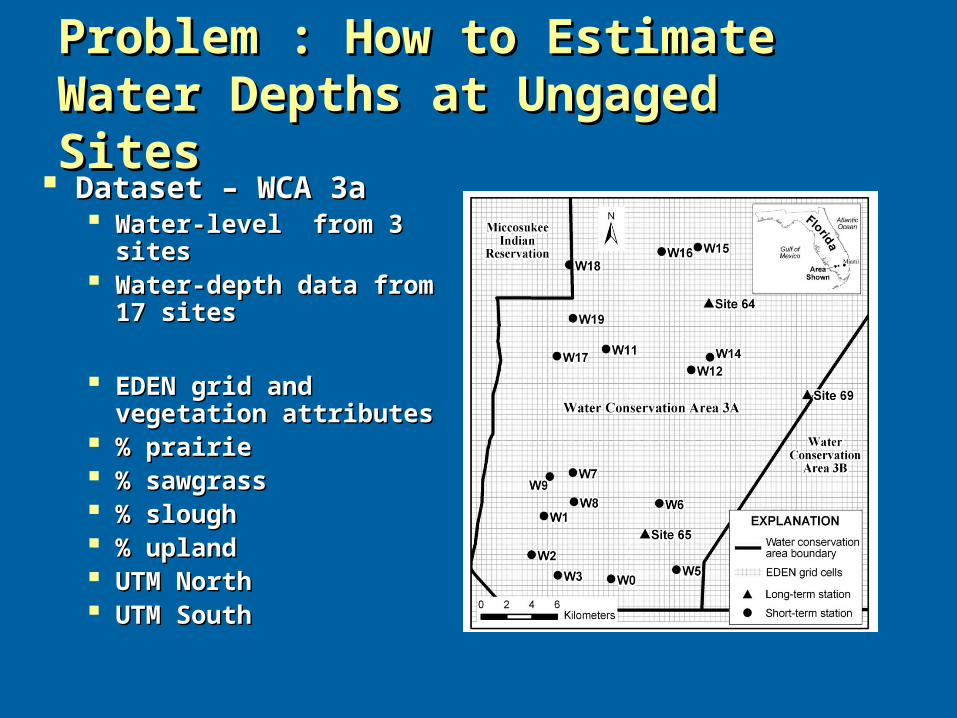
Problem : How to Estimate Water Problem : How to Estimate Water Depths at Ungaged SitesDepths at Ungaged Sites
Dataset – WCA 3aDataset – WCA 3a Water-level from 3 sitesWater-level from 3 sites Water-depth data from 17 Water-depth data from 17
sitessites
EDEN grid and EDEN grid and vegetation attributesvegetation attributes
% prairie% prairie % sawgrass% sawgrass % slough% slough % upland% upland UTM NorthUTM North UTM SouthUTM South

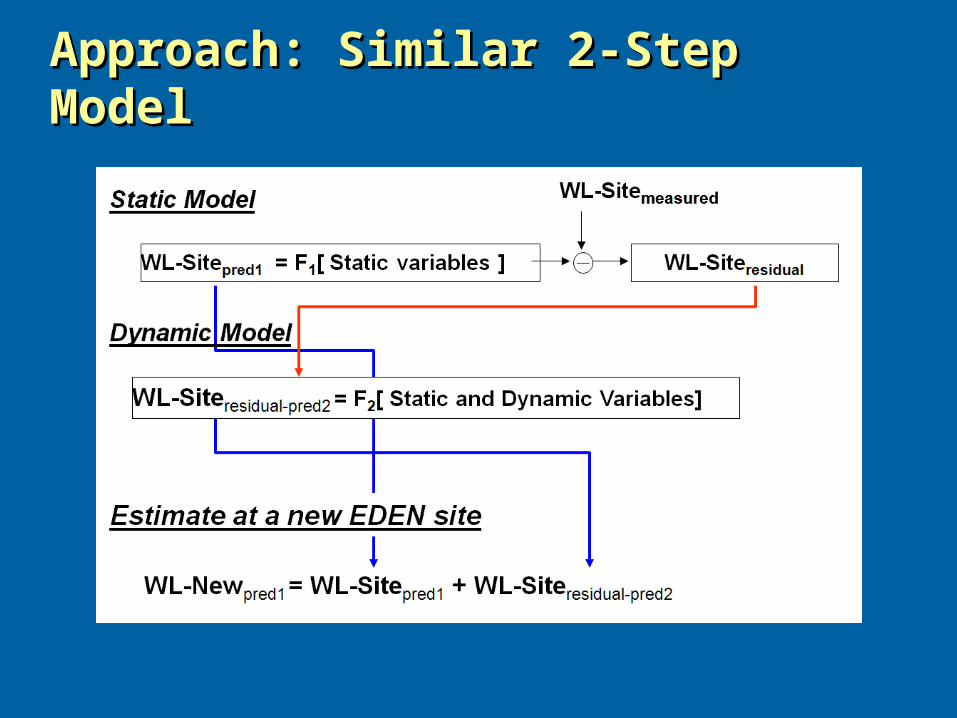
Approach Approach
Two step ANN model
First step: estimate mean water-depths using static model – “spatially interpolating” ANN scheme
Second step: estimate water-depths variability using dynamic variables
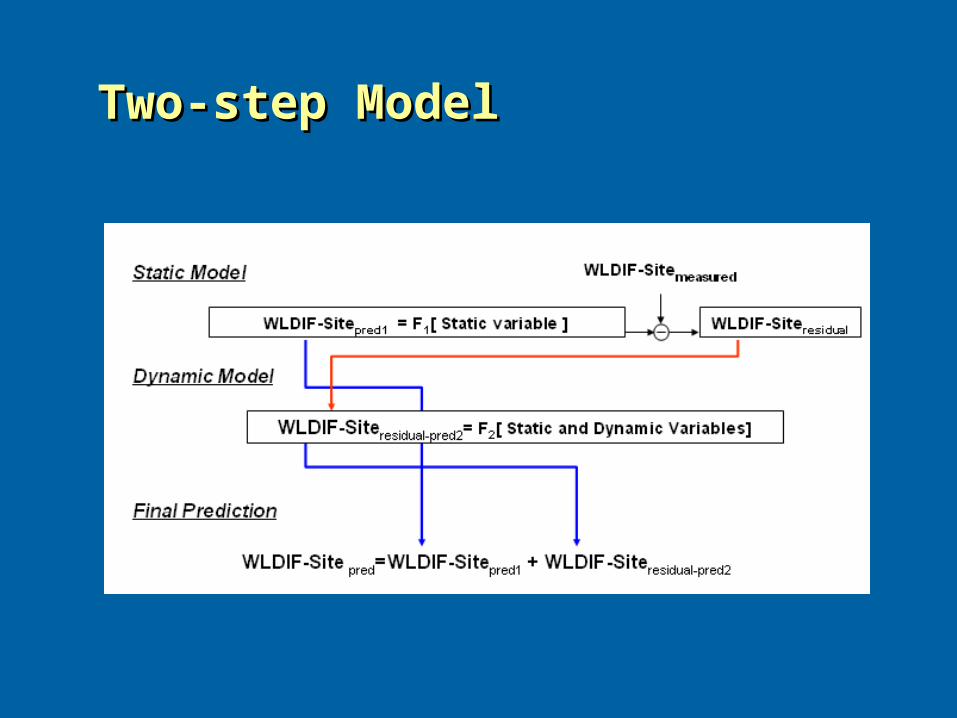
Two-step ModelTwo-step Model
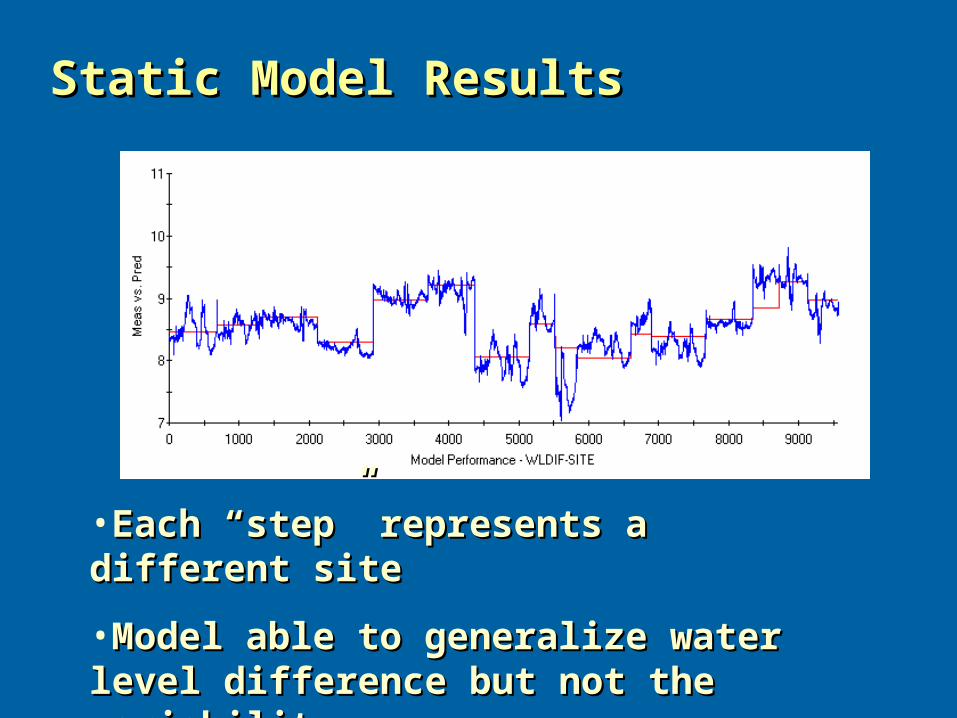
Static Model ResultsStatic Model Results
•Each “step” represents a different siteEach “step” represents a different site
•Model able to generalize water level Model able to generalize water level difference but not the variabilitydifference but not the variability
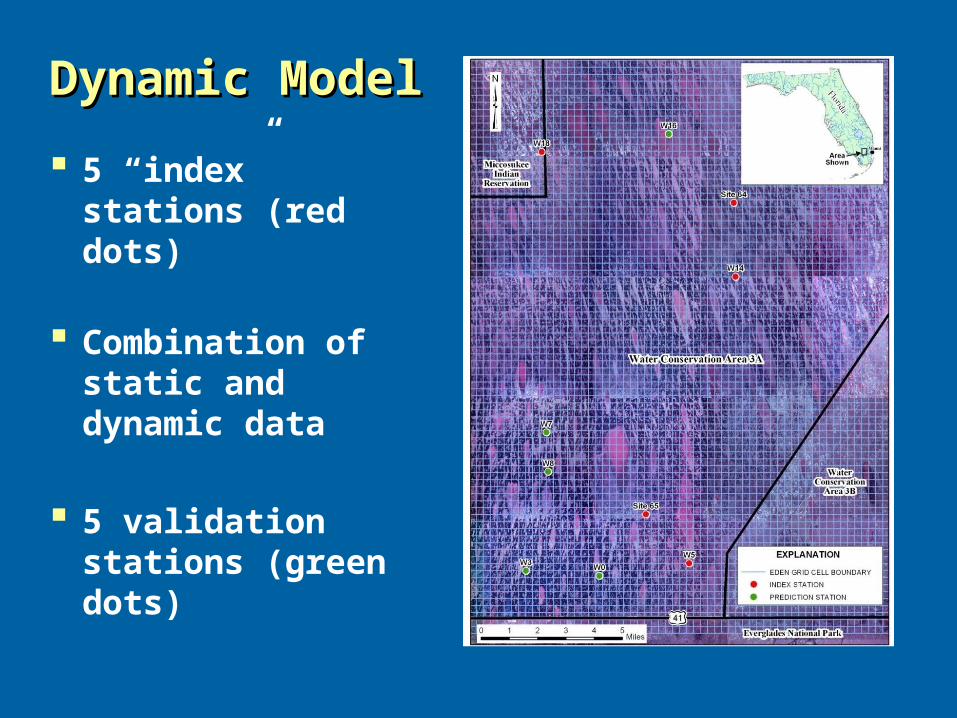
Dynamic ModelDynamic Model
5 “index” stations (red dots)
Combination of static and dynamic data
5 validation stations (green dots)
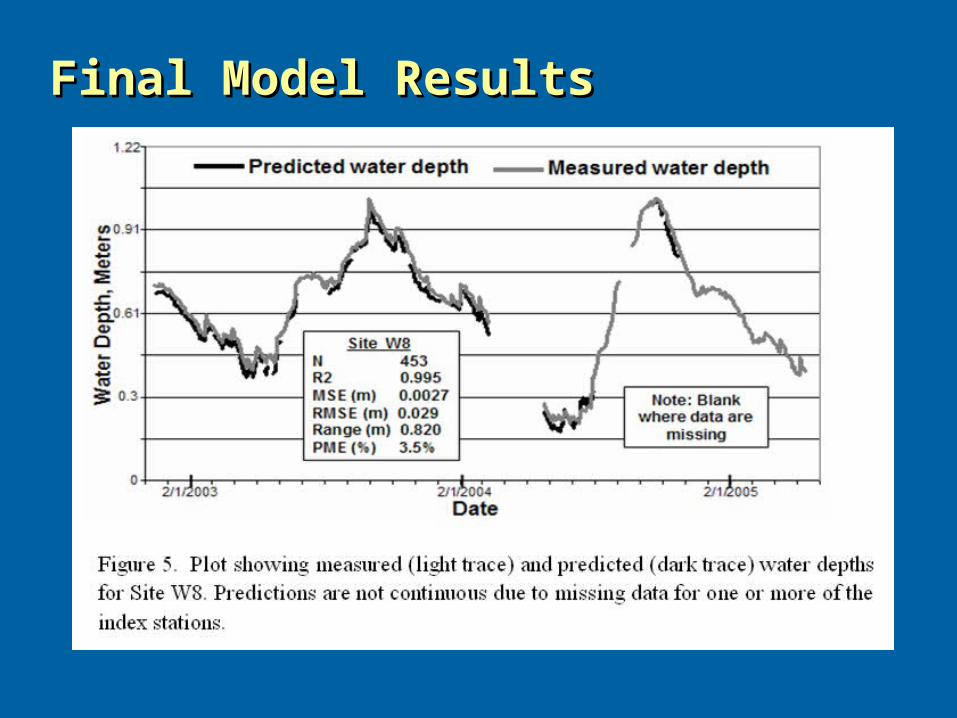
Final Model ResultsFinal Model Results
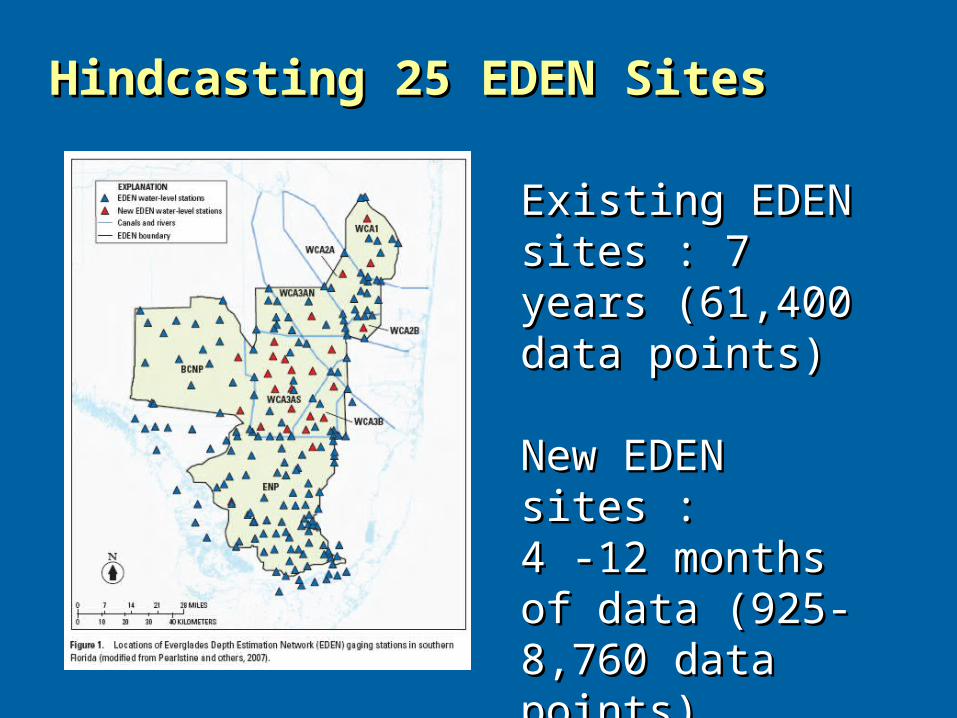
Hindcasting 25 EDEN SitesHindcasting 25 EDEN Sites
Existing EDEN Existing EDEN sites : 7 years sites : 7 years (61,400 data (61,400 data points)points)
New EDEN sites :New EDEN sites :4 -12 months of 4 -12 months of data (925- 8,760 data (925- 8,760 data points)data points)
Approach: Similar 2-Step ModelApproach: Similar 2-Step Model
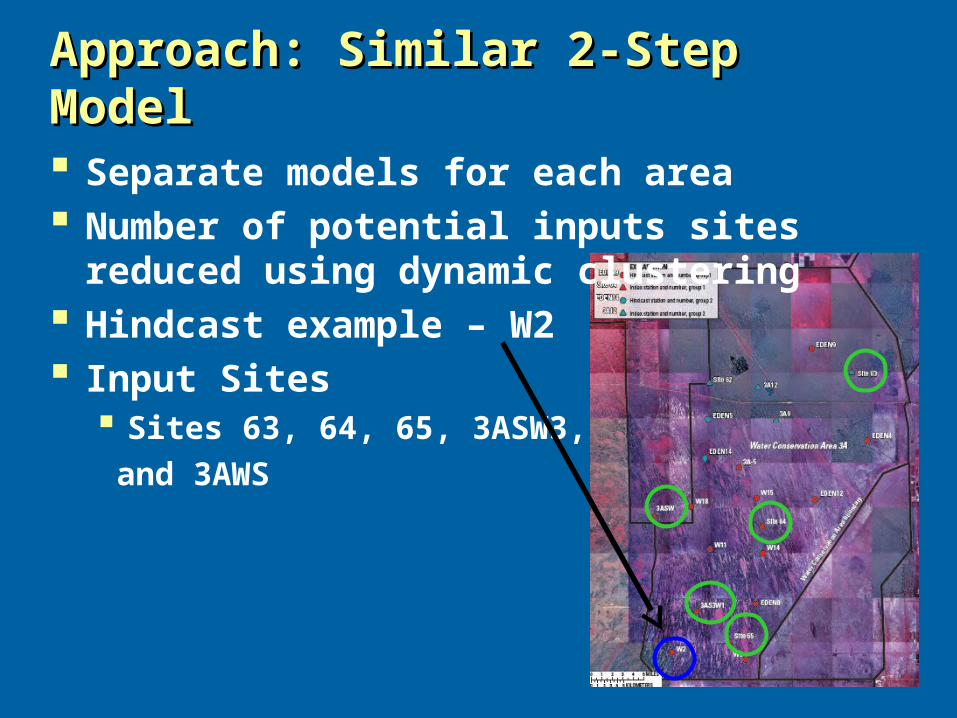
Separate models for each area Number of potential inputs sites reduced
using dynamic clustering Hindcast example – W2 Input Sites
Sites 63, 64, 65, 3ASW3,
and 3AWS
Approach: Similar 2-Step ModelApproach: Similar 2-Step Model
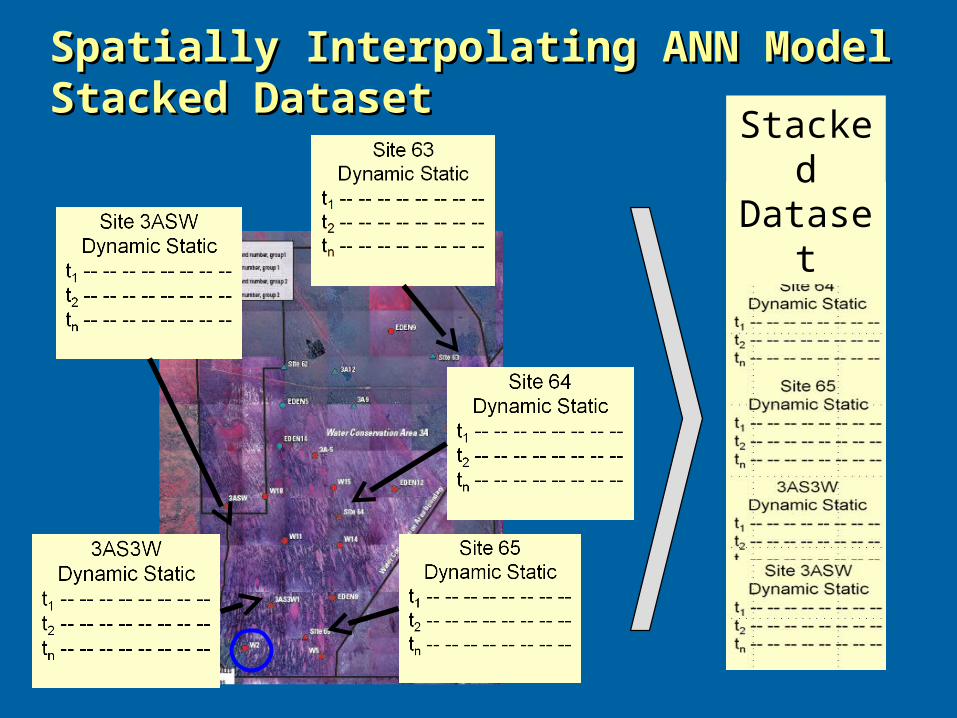
Spatially Interpolating ANN ModelSpatially Interpolating ANN ModelStacked DatasetStacked Dataset
Stacked Dataset
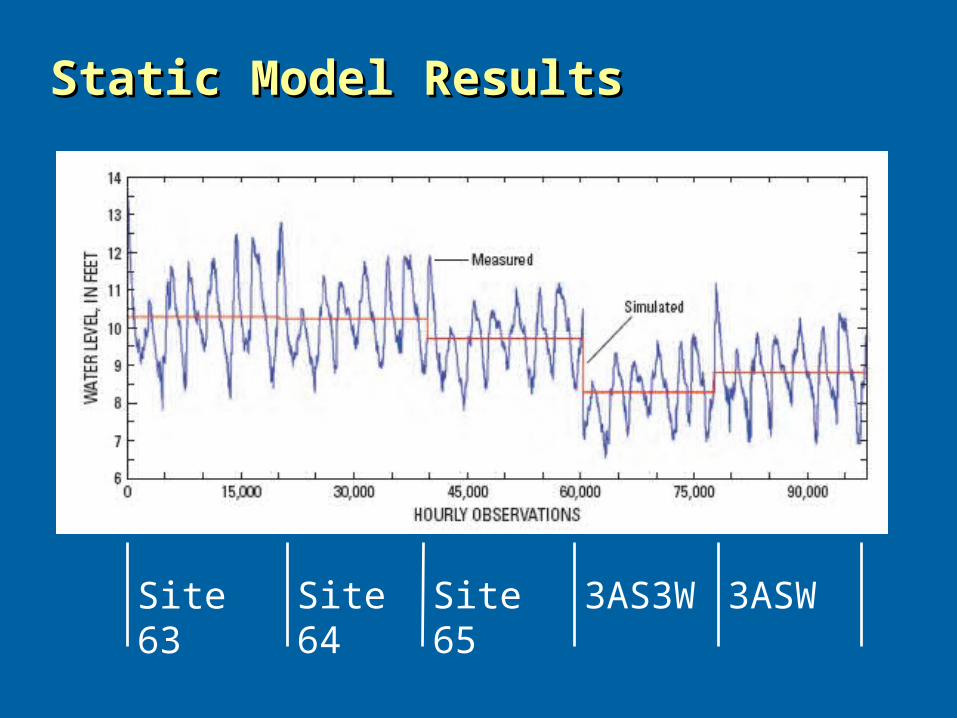
Static Model ResultsStatic Model Results
Site 63 Site 64 Site 65 3AS3W 3ASW
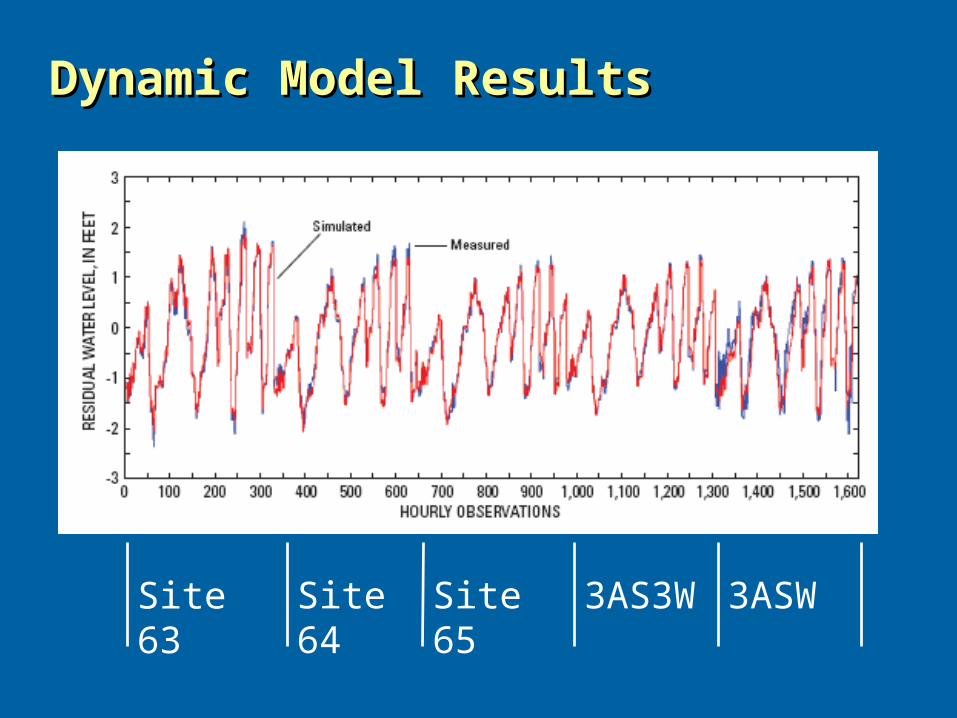
Dynamic Model ResultsDynamic Model Results
Site 63 Site 64 Site 65 3AS3W 3ASW
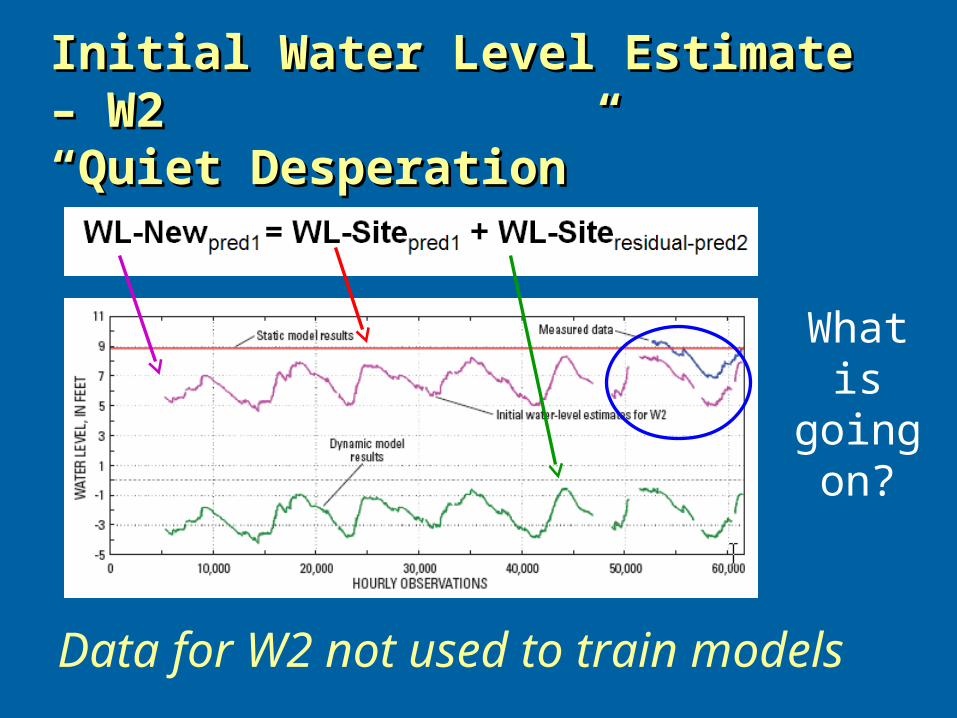
Initial Water Level Estimate – W2Initial Water Level Estimate – W2“Quiet Desperation”“Quiet Desperation”
What is going on?
Data for W2 not used to train models
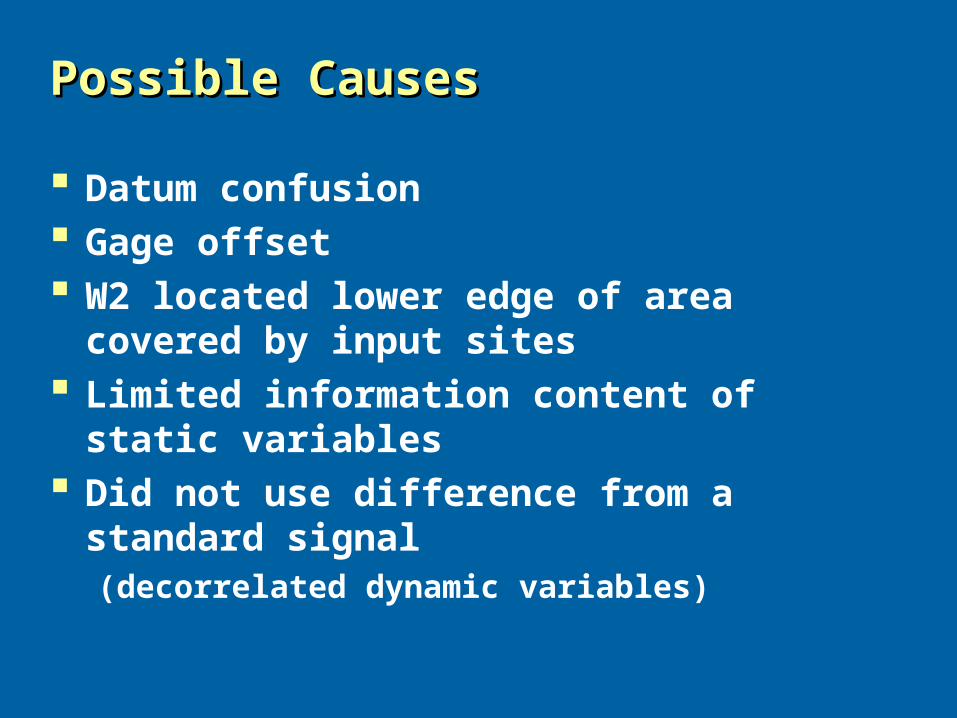
Possible CausesPossible Causes
Datum confusion Gage offset W2 located lower edge of area covered by
input sites Limited information content of static
variables Did not use difference from a standard signal
(decorrelated dynamic variables)
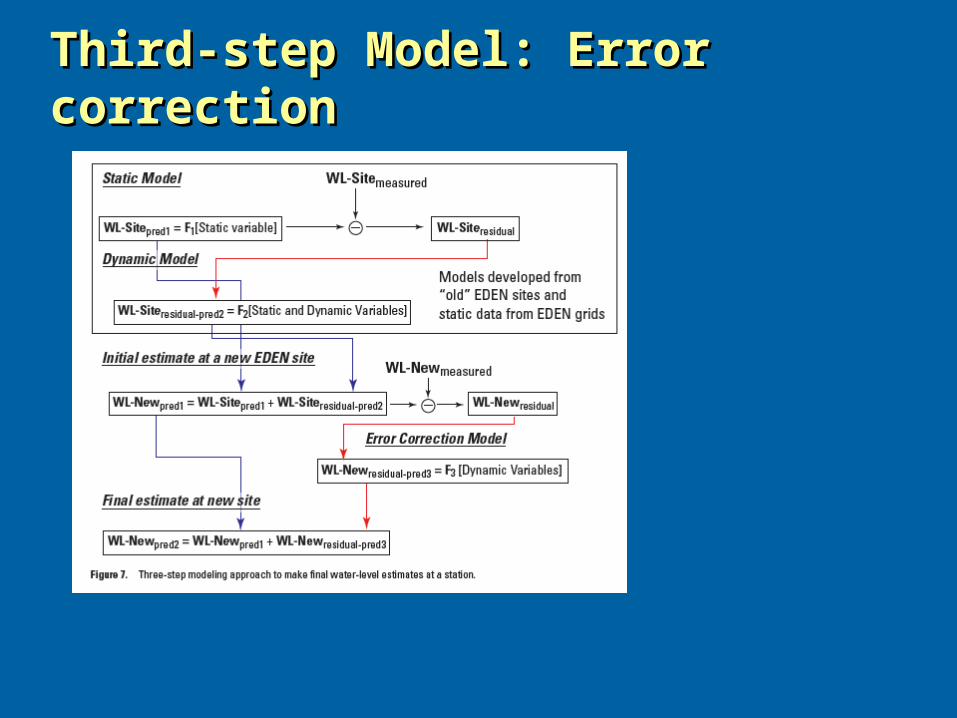
Third-step Model: Error correctionThird-step Model: Error correction
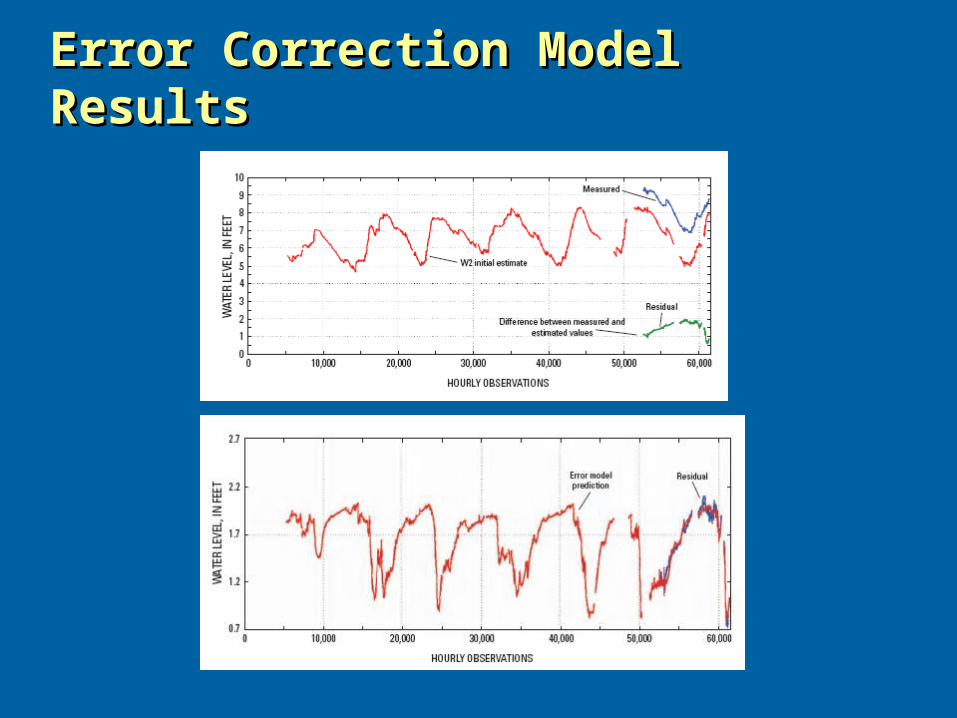
Error Correction Model ResultsError Correction Model Results
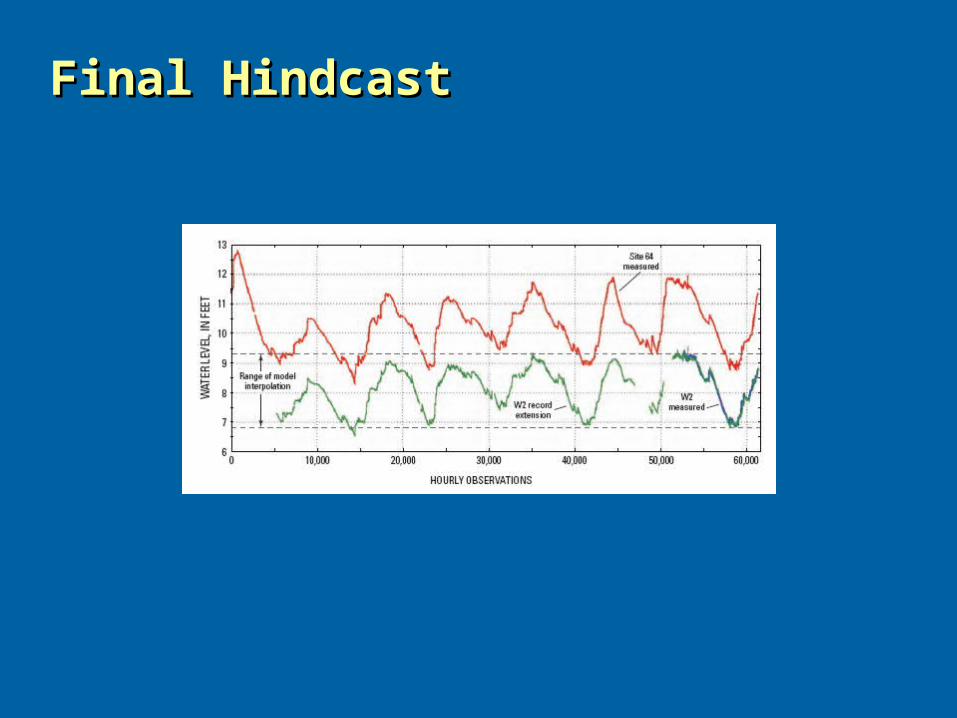
Final HindcastFinal Hindcast
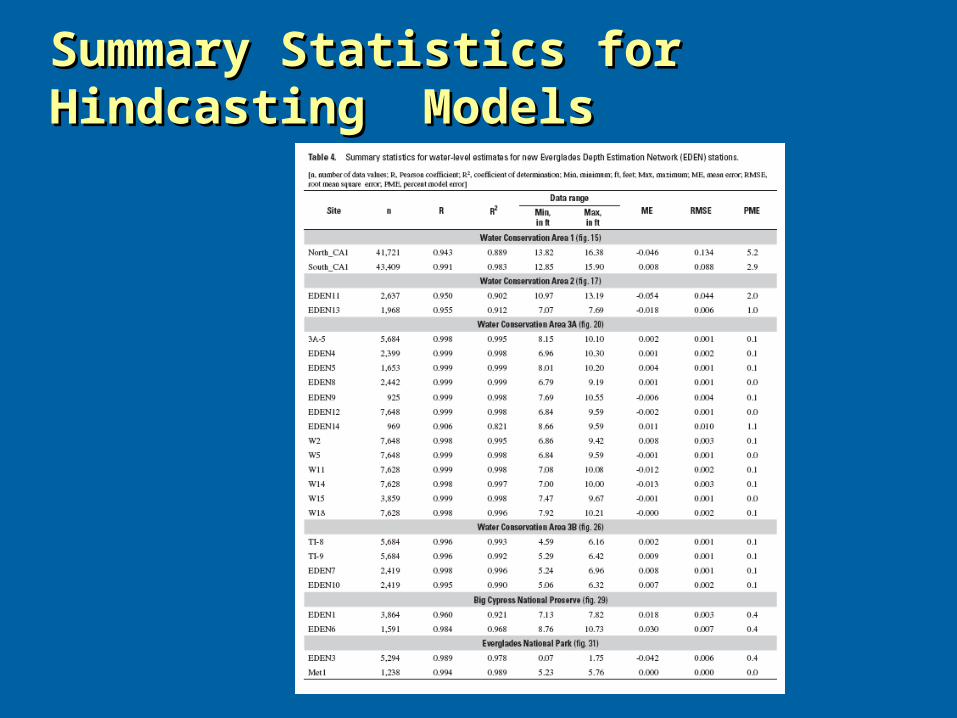
Summary Statistics for Hindcasting Summary Statistics for Hindcasting ModelsModels
SummarySummary
Estimation of water depth at ungaged sites ANNs able to accurately predict water depths at
ungaged sites Use of static and dynamic variable produce a
multi-variate “kreiging” of water depths Methodology will be used to hindcast “new”
network stations
QuestionsQuestions
Paul ConradsPaul Conrads
USGS-South Carolina USGS-South Carolina Water Science CenterWater Science Center
[email protected]@usgs.gov